0001104659-15-011941.txt : 20150219 0001104659-15-011941.hdr.sgml : 20150219 20150219110829 ACCESSION NUMBER: 0001104659-15-011941 CONFORMED SUBMISSION TYPE: 40-F PUBLIC DOCUMENT COUNT: 23 CONFORMED PERIOD OF REPORT: 20141231 FILED AS OF DATE: 20150219 DATE AS OF CHANGE: 20150219 FILER: COMPANY DATA: COMPANY CONFORMED NAME: TRANSALTA CORP CENTRAL INDEX KEY: 0001144800 STANDARD INDUSTRIAL CLASSIFICATION: ELECTRIC SERVICES [4911] IRS NUMBER: 000000000 FISCAL YEAR END: 1231 FILING VALUES: FORM TYPE: 40-F SEC ACT: 1934 Act SEC FILE NUMBER: 001-15214 FILM NUMBER: 15630659 BUSINESS ADDRESS: STREET 1: 110 12TH AVE SW BOX 1900 STATION M STREET 2: CALGARY ALBERTA T2P 2MI CITY: CALGARY STATE: A0 ZIP: T2P2M1 BUSINESS PHONE: 403-267-4724 MAIL ADDRESS: STREET 1: 110-12TH AVENUE SW CITY: CALGARY ALBERTA CANADA STATE: A0 ZIP: T2P2M1 40-F 1 a15-3974_140f.htm 40-F


UNITED STATES

SECURITIES AND EXCHANGE COMMISSION

Washington, D.C. 20549


FORM 40-F


[Check one]


o           REGISTRATION STATEMENT PURSUANT TO SECTION 12 OF THE SECURITIES EXCHANGE ACT OF 1934


OR


x       ANNUAL REPORT PURSUANT TO SECTION 13(a) OR 15(d) OF THE SECURITIES EXCHANGE ACT OF 1934


For the fiscal year ended    December 31, 2014

Commission file number    001-15214


TRANSALTA CORPORATION

(Exact name of Registrant as specified in its charter)


Not applicable

(Translation of Registrant’s name into English (if applicable))


Canada

(Province or other jurisdiction of incorporation or organization)


4911

(Primary Standard Industrial Classification Code Number (if applicable))


Not Applicable

(I.R.S Employer Identification Number (if applicable))


110-12th Avenue S.W., Box 1900, Station “M”,

Calgary, Alberta, Canada, T2P 2M1,

(403) 267-7110

(Address and telephone number of Registrant’s principal executive offices)


CT Corporation System, 111 8th Avenue, 13th Floor,

New York, New York, 10011, (212) 894-8400

(Name, address (including zip code) and telephone number (including area code)

of agent for service in the United States)


Securities registered or to be registered pursuant to Section 12(b) of the Act:


Title of each class


Name of each exchange


on which registered


Common Shares, no par value


New York Stock Exchange


Common Share Purchase Rights


New York Stock Exchange


Securities registered or to be registered pursuant to Section 12(g) of the Act:


None


Securities for which there is a reporting obligation pursuant to Section 15(d) of the Act:


Debt Securities


For annual reports, indicate by check mark the information filed with this form:


x     Annual information form

x     Audited annual financial statements


2


Indicate the number of outstanding shares of each of the issuer’s classes of capital or common stock as of the close of the period covered by the annual report:


At December 31, 2014, 275,070,262 common shares were issued and outstanding.


Indicate by check mark whether the Registrant (1) has filed all reports required to be filed by Section 13 or 15(d) of the Exchange Act during the preceding 12 months (or for such shorter period that the Registrant was required to file such reports) and (2) has been subject to such filing requirements for the past 90 days.


Yes  x

No  o


Indicate by check mark whether the registrant has submitted electronically and posted on its corporate Web site, if any, every Interactive Data File required to be submitted and posted pursuant to Rule 405 of Regulation S-T (§232.405 of this chapter) during the preceding 12 months (or for such shorter period that the Registrant was required to submit and post such files).


Yes  x

No  o


INCORPORATION BY REFERENCE


The documents, forming part of this Form 40-F, are incorporated by reference into the following registration statements under the Securities Act of 1933, as amended.


Form

Registration No.


S-8

333-72454


S-8

333-101470


F-10

333-200773


CONSOLIDATED AUDITED ANNUAL FINANCIAL STATEMENTS

AND MANAGEMENT’S DISCUSSION & ANALYSIS


A.                     Consolidated Audited Annual Financial Statements


For consolidated audited annual financial statements, including the report of independent chartered accountants with respect thereto, see Exhibit 13.3 incorporated by reference herein.


B.                      Management’s Discussion and Analysis


For management’s discussion and analysis, see Exhibit 13.2 incorporated by reference herein.


3


DISCLOSURE CONTROLS AND PROCEDURES


As required by Rule 13a-15 under the Securities Exchange Act of 1934 (“Exchange Act”), management has evaluated, with the participation of our Chief Executive Officer and Chief Financial Officer, the effectiveness of our disclosure controls and procedures as of the end of the period covered by this report. Disclosure controls and procedures refer to controls and other procedures designed to ensure that information required to be disclosed in the reports we file or submit under the Exchange Act are recorded, processed, summarized, and reported within the time periods specified in the rules and forms of the Securities and Exchange Commission.  Disclosure controls and procedures include, without limitation, controls and procedures designed to ensure that information required to be disclosed by us in our reports that we file or submit under the Exchange Act are accumulated and communicated to management, including our Chief Executive Officer and Chief Financial Officer, as appropriate, to allow timely decisions regarding our required disclosure. In designing and evaluating our disclosure controls and procedures, management recognizes that any controls and procedures, no matter how well designed and operated, can provide only reasonable assurance of achieving the desired control objectives, and management was required to apply its judgment in evaluating and implementing possible controls and procedures.


There has been no change in the internal control over financial reporting during the period covered by this report that has materially affected, or is reasonably likely to materially affect, our internal control over financial reporting. Based on the foregoing evaluation, our Chief Executive Officer and Chief Financial Officer have concluded that, as of December 31, 2014, the end of the period covered by this report, our disclosure controls and procedures were effective at a reasonable assurance level.


MANAGEMENT’S ANNUAL REPORT ON INTERNAL CONTROL

OVER FINANCIAL REPORTING


Management is responsible for establishing and maintaining adequate internal control over financial reporting.


Internal control over financial reporting refers to a process designed by, or under the supervision of, our Chief Executive Officer and Chief Financial Officer and effected by our board of directors, management and other personnel, to provide reasonable assurance regarding the reliability of financial reporting and the preparation of financial statements for external purposes in accordance with generally accepted accounting principles and includes those policies and procedures that:


·                 pertain to the maintenance of records that in reasonable detail accurately and fairly reflect the transactions and dispositions of our assets;


·                 provide reasonable assurance that transactions are recorded as necessary to permit preparation of financial statements in accordance with generally accepted accounting principles, and that our receipts and expenditures are being made only in accordance with authorizations of our management and members of our board of directors; and


·                 provide reasonable assurance regarding prevention or timely detection of unauthorized acquisition, use, or disposition of our assets that could have a material effect on our financial statements.


4


Management evaluated the effectiveness of our internal control over financial reporting as of December 31, 2014 using the Committee of Sponsoring Organizations of the Treadway Commission (COSO) 2013 framework.  Management concluded that our internal control over financial reporting was effective as of December 31, 2014.  Certain matters relating to the scope of management’s evaluation and limitations of management’s conclusions are described below.  See “Limitations and Scope of Management’s Report on Internal Control over Financial Reporting.”


Our independent registered public accounting firm, Ernst & Young LLP, has issued an attestation report on the effectiveness of our internal control over financial reporting as of December 31, 2014.  For Ernst & Young LLP’s report see page 86 of the Consolidated Audited Annual Financial Statements for the year ended December 31, 2014 filed as Exhibit 13.3 and incorporated by reference herein, under the heading “Report of Independent Registered Public Accounting Firm”.


There has been no change in the internal control over financial reporting during the year covered by this report that has materially affected, or is reasonably likely to materially affect, our internal control over financial reporting.


LIMITATIONS AND SCOPE OF MANAGEMENT’S

REPORT ON INTERNAL CONTROL OVER FINANCIAL REPORTING


Internal control over financial reporting cannot provide absolute assurance of achieving financial reporting objectives because of its inherent limitations.  Internal control over financial reporting is a process that involves human diligence and compliance and is subject to lapses in judgment and breakdowns resulting from human failures.  Internal control over financial reporting also can be circumvented by collusion or improper overrides.  Because of such limitations, there is a risk that material misstatements may not be prevented or detected on a timely basis by internal control over financial reporting.  However, these inherent limitations are known features of the financial reporting process, and it is possible to design safeguards into the process to reduce, though not eliminate, this risk.


TransAlta Corporation (“TransAlta”) proportionately consolidates the accounts of the Sheerness and Genesee 3 joint operations (the “Excluded Entities”), in accordance with International Financial Reporting Standards (“IFRS”).  Management does not have the contractual ability to assess the internal controls of these Excluded Entities.  Management’s conclusion regarding the effectiveness of internal controls does not extend to the internal controls at the transactional level of these Excluded Entities.  Accordingly, management’s evaluation of the Company’s internal control over financial reporting did not include an evaluation of the internal controls of any of the Excluded Entities, and management’s conclusion regarding the effectiveness of the Company’s internal control over financial reporting does not extend to the internal controls of any of the Excluded Entities.


The 2014 consolidated financial statements of TransAlta, in accordance with EITF 00-1, included CDN$678 million and CDN$643 million of total and net assets, respectively, as of December 31, 2014, and CDN$215 million and CDN$73 million of revenues and net earnings, respectively, for the year then ended related to Excluded Entities.  Once the financial information is obtained from these Excluded Entities it falls within the scope of TransAlta’s internal control framework.


5


AUDIT COMMITTEE FINANCIAL EXPERT


TransAlta’s board of directors has determined that it has two audit committee financial experts serving on its Audit and Risk Committee (the “ARC”).  Mrs. Karen Maidment and Mr. William D. Anderson have been determined to be audit committee financial experts, within the meaning of Section 407 of the United States Sarbanes-Oxley Act of 2002 (“Sarbanes-Oxley”), and are independent, as that term is defined by the New York Stock Exchange’s (“NYSE”) listing standards applicable to the Registrant.  Under Securities and Exchange Commission rules, the designation of persons as audit committee financial experts does not make them “experts” for any other purpose, impose any duties, obligations or liability on them that are greater than those imposed on members of their committee and the board of directors who do not carry this designation or affect the duties, obligations or liability of any other member of their committee.


CODE OF ETHICS


TransAlta has adopted a code of ethics as part of its “Corporate Code of Conduct” that applies to all employees and officers which has been filed with the Securities and Exchange Commission.  In addition, the Registrant has adopted a code of conduct applicable to all directors of the Company, a separate financial code of conduct which applies to all financial management employees and an Energy Trading code of conduct for our employees working within energy marketing.  Our codes of conduct are available on our Internet website at www.transalta.com.  There has been no waiver of the codes granted during the 2014 fiscal year.


PRINCIPAL ACCOUNTANT FEES AND SERVICES


For the years ended December 31, 2014 and December 31, 2013, Ernst & Young LLP and its affiliates were paid $3,587,987 and $3,384,692 respectively, as detailed below:


Ernst & Young LLP


Year Ended Dec. 31


2014


2013


Audit Fees


$

2,973,020


$

2,931,297


Audit-related fees


586,900


409,950


Tax fees


28,067


43,445


All other fees


0


0


Total


$

3,587,987


$

3,384,692


All amounts are in Canadian dollars unless otherwise stated.


No other audit firms provided audit services in 2014 or 2013.


The nature of each category of fees is described below:


Audit Fees


Audit fees were paid for professional services rendered by the auditors for the audit of our annual financial statements or services provided in connection with statutory and regulatory filings or engagements, including the translation from English to French of our financial statements and other documents.  Total audit fees for 2014 include payments related to 2013 in the amount of $1,369,460.


6


Audit-Related Fees


The audit-related fees in 2014 were primarily for work performed by Ernst & Young LLP in relation to compliance and regulatory reporting, debt issuances and miscellaneous accounting advice provided to the Corporation. The audit-related fees in 2013 were primarily for work performed by Ernst & Young LLP in relation to compliance and regulatory reporting, common share issuances, debt issuances and miscellaneous accounting advice provided to the Corporation.


Tax Fees


The tax fees for 2014 relate to various tax related matters in our domestic and foreign operations.


All Other Fees


Nil.


Pre-Approval Policies and Procedures


The ARC has considered whether the provision of services other than audit services is compatible with maintaining the auditors’ independence.  In May 2002, the ARC adopted a policy (the “Policy”) that prohibits TransAlta from engaging the auditors for “prohibited” categories of non-audit services and requires pre-approval of the ARC for other permissible categories of non-audit services, such categories being determined under Sarbanes-Oxley.  The Policy also provides that the Chair of the ARC may approve permissible non-audit services during the quarter and report such approval to the ARC at its next regularly scheduled meeting.


Percentage of Services Approved by the ARC


For the year ended December 31, 2014, none of the services described above were approved by the ARC pursuant to paragraph (c)(7)(i)(C) of Rule 2-01 of Regulation S-X.


OFF-BALANCE SHEET ARRANGEMENTS


See page 54 of Exhibit 13.2, incorporated by reference herein under the heading “Unconsolidated Structured Entities or Arrangements”.


TABULAR DISCLOSURE OF CONTRACTUAL OBLIGATIONS


See page 51 of Exhibit 13.2, incorporated by reference herein, under the heading “Liquidity and Capital Resources” and page 131 under the heading “Risk Management Activities” and page 152 under the Heading “Commitments” of Exhibit 13.3, all incorporated by reference herein.


7


IDENTIFICATION OF THE AUDIT COMMITTEE


We have a separately-designated standing ARC made up of independent directors.  The members of the ARC are:


Karen E. Maidment (Chair)

William D. Anderson

John P. Dielwart

Alan J. Fohrer

Yakout Mansour


MINE SAFETY


The information concerning mine safety violations or other regulatory matters required by Section 1503(a) of the Dodd-Frank Wall Street Reform and Consumer Protection Act is included in Exhibit 13.1, incorporated herein, under the heading “Business of TransAlta-Generation Business Segment-United States”.


FORWARD-LOOKING INFORMATION


This Form 40-F, the documents incorporated herein by reference, and other reports and filings made with the securities regulatory authorities, include forward-looking statements.  All forward-looking statements are based on TransAlta’s beliefs as well as assumptions based on information available at the time the assumption was made and on management’s experience and perception of historical trends, current conditions and expected future developments as well as other factors deemed appropriate in the circumstances.  Forward-looking statements are not facts, but only predictions and generally can be identified by the use of statements that include phrases such as “may”, “will”, “believe”, “expect”, “estimate”, “anticipate”, “intend”, “plan”, “foresee”, “potential”, “enable”, “continue” or other comparable terminology.  These statements are not guarantees of TransAlta’s future performance and are subject to risks, uncertainties and other important factors that could cause TransAlta’s actual performance to be materially different from that projected.


In particular, this Form 40-F and the documents incorporated herein by reference contain forward-looking statements pertaining to TransAlta’s business and anticipated future financial performance; our success in executing on our growth projects; the timing and the completion and commissioning of projects under development, including major projects such as the South Hedland Power Project, and their attendant costs; TransAlta’s estimated spend on growth and sustaining capital and productivity projects; expectations in terms of the cost of operations, capital spend, and maintenance, and the variability of those costs, including expectations about the cost savings anticipated from the major maintenance agreement entered into with Alstom Power Canada Inc.; the impact of certain hedges on future reporting earnings and cash flows; expectations related to future earnings and cash flow from operating and contracting activities, including estimates of 2015 comparable earnings before interest, taxes, depreciation, and amortization (“EBITDA”), comparable funds from operations (“FFO”) and comparable free cash flow; estimates of fuel supply and demand conditions and the costs of procuring fuel; expectations for demand for electricity in both the short-term and long-term, and the resulting impact on electricity prices; the impact of load growth, increased capacity, and natural gas costs on power prices; expectations in respect of generation availability, capacity and production; expectations regarding the role different energy sources will play in meeting future energy needs; expected financing of TransAlta’s capital expenditures; expected governmental regulatory regimes and legislation and their expected impact on TransAlta and the timing of the implementation of such regimes and regulations, as well as the cost of complying with resulting regulations and laws; the expected settlement of regulatory investigations and disputes; TransAlta’s trading strategy and the risks involved in these strategies; estimates of future tax rates, future tax expense, and the adequacy of tax provisions; accounting estimates; anticipated growth rates in TransAlta’s markets; TransAlta’s expectations relating to the outcome of existing or potential legal and contractual claims, regulatory investigations, and disputes; expectations regarding the renewal of collective bargaining agreements; expectations for the ability to access capital markets at reasonable terms; the estimated impact of changes in interest rates and the value of the Canadian dollar relative to the U.S. and other currencies in locations where TransAlta does business; the monitoring of our exposure to


8


liquidity risk; expectations in respect to the global economic environment and growing scrutiny by investors relating to sustainability performance; our credit practices; and the estimated contribution of Energy Marketing activities to gross margin.


Factors that may adversely impact TransAlta’s forward-looking statements include risks relating to: fluctuations in demand market prices and the availability of fuel supplies required to generate electricity; demand for electricity and TransAlta’s ability to contract its generation for prices that will provide expected returns; the regulatory and political environments in the jurisdictions in which TransAlta operate; environmental requirements and changes in, or liabilities under, these requirements; changes in general economic conditions including interest rates; operational risks involving TransAlta’s facilities, including unplanned outages at such facilities; disruptions in the transmission and distribution of electricity; the effects of weather; disruptions in the source of fuels, water or wind required to operate TransAlta’s facilities; natural and man-made disasters; the threat of domestic terrorism and cyberattacks; equipment failure and TransAlta’s ability to carry out or have completed the repairs in a cost-effective manner or timely manner; commodity risk management; industry risk and competition; fluctuations in the value of foreign currencies and foreign political risks; the need for additional financing; structural subordination of securities; counterparty credit risk; insurance coverage; TransAlta’s provision for income taxes; legal, regulatory, and contractual proceedings involving the Corporation; outcomes of investigations and disputes; reliance on key personnel; labour relations matters; and development projects and acquisitions, including delays in the permitting and construction of the South Hedland Power Project and the construction of the Australia Natural Gas Pipeline.   The foregoing risk factors, among others, are described in further detail under the heading “Risk Factors” in TransAlta’s 2015 Annual Information Form and in the Risk Management section of TransAlta’s Management’s Discussion and Analysis for the year ended December 31, 2014, each incorporated herein by reference.


Readers are urged to consider these factors carefully in evaluating the forward-looking statements and are cautioned not to place undue reliance on these forward-looking statements.  The forward-looking statements included in this document are made only as of the date hereof and TransAlta does not undertake to publicly update these forward-looking statements to reflect new information, future events or otherwise, except as required by applicable laws.  In light of these risks, uncertainties and assumptions, the forward-looking events might occur to a different extent or at a different time than TransAlta has described or might not occur.  TransAlta cannot assure you that projected results or events will be achieved.


9


DOCUMENTS FILED AS PART OF THIS REPORT AND EXHIBITS


The following items are specifically incorporated by reference in, and form an integral part of, this filing on Form 40-F:


13.1

TransAlta Corporation Annual Information Form for the year ended December 31, 2014.


13.2

Management’s Discussion and Analysis for the year ended December 31, 2014.


13.3

Consolidated Audited Annual Financial Statements for the year ended December 31, 2014.


13.4

Management’s Annual Report on Internal Control over Financial Reporting, (included on page 85 of Exhibit 13.3 filed herewith).


13.5

Independent Auditors’ Report of Registered Public Accounting Firm, (included on page 87 of Exhibit 13.3 filed herewith). 


23.1

Consent of Ernst & Young LLP Chartered Accountants.


31.1

Certification of President and Chief Executive Officer pursuant to Section 302 of the Sarbanes-Oxley Act of 2002.


31.2

Certification of Chief Financial Officer pursuant to Section 302 of the Sarbanes-Oxley Act of 2002.


32.1

Certification of President and Chief Executive Officer pursuant to Section 906 of the Sarbanes-Oxley Act of 2002.


32.2

Certification of Chief Financial Officer pursuant to Section 906 of the Sarbanes-Oxley Act of 2002.


10


UNDERTAKING


TransAlta undertakes to make available, in person or by telephone, representatives to respond to inquiries made by the Commission staff, and to furnish promptly, when requested to do so by the Commission staff, information relating to: the securities registered pursuant to Form 40-F; the securities in relation to which the obligation to file an annual report on Form 40-F arises; or transactions in said securities.


CONSENT TO SERVICES OF PROCESS


The registrant has previously filed a Form F-X in connection with the class of securities in relation to which the obligation to file this report arises.  Any change to the name or address of the agent for service of process of the registrant shall be communicated promptly to the Commission by an amendment to the Form F-X referencing the file number of the registrant.


SIGNATURES


Pursuant to the requirements of the Exchange Act, the Registrant certifies that it meets all of the requirements for filing on Form 40-F and has duly caused this annual report to be signed on its behalf by the undersigned, thereto duly authorized, in the City of Calgary, Province of Alberta, Canada.


TRANSALTA CORPORATION


/s/ Donald Tremblay


Donald Tremblay


Chief Financial Officer


Dated: February 19, 2015


11


EXHIBIT INDEX


13.1

TransAlta Corporation Annual Information Form for the year ended December 31, 2014.


13.2

Management’s Discussion and Analysis for the year ended December 31, 2014.


13.3

Consolidated Audited Annual Financial Statements for the year ended December 31, 2014.


13.4

Management’s Annual Report on Internal Control over Financial Reporting, (included on page 85 of Exhibit 13.3 filed herewith).


13.5

Independent Auditors’ Report of Registered Public Accounting Firm (included on page 87 of Exhibit 13.3 filed herewith).


23.1

Consent of Ernst and Young LLP Chartered Accountants.


31.1

Certification of President and Chief Executive Officer pursuant to Section 302 of the Sarbanes-Oxley Act of 2002.


31.2

Certification of Chief Financial Officer pursuant to Section 302 of the Sarbanes-Oxley Act of 2002.


32.1

Certification of President and Chief Executive Officer pursuant to Section 906 of the Sarbanes-Oxley Act of 2002.


32.2

Certification of Chief Financial Officer pursuant to Section 906 of the Sarbanes-Oxley Act of 2002.


12


EX-13.1 2 a15-3974_1ex13d1.htm EX-13.1 TRANSALTA CORPORATION ANNUAL INFORMATION FORM FOR THE YEAR ENDED DECEMBER 31, 2014.

Exhibit 13.1


TRANSALTA CORPORATION


2015 ANNUAL INFORMATION FORM


FOR THE YEAR ENDED DECEMBER 31, 2014


February 18, 2015


TABLE OF CONTENTS


PRESENTATION OF INFORMATION

1

SPECIAL NOTE REGARDING FORWARD-LOOKING STATEMENTS

1

DOCUMENTS INCORPORATED BY REFERENCE

2

CORPORATE STRUCTURE

2

OVERVIEW

3

GENERAL DEVELOPMENT OF THE BUSINESS

5

BUSINESS OF TRANSALTA

12

ENVIRONMENTAL RISK MANAGEMENT

31

RISK FACTORS

34

EMPLOYEES

46

CAPITAL STRUCTURE

46

CREDIT RATINGS

53

DIVIDENDS

55

COMMON SHARES

55

SERIES A SHARES

56

SERIES C SHARES

56

SERIES E SHARES

57

SERIES G SHARES

57

MARKET FOR SECURITIES

57

COMMON SHARES

57

SERIES A SHARES

58

SERIES C SHARES

58

SERIES E SHARES

59

SERIES G SHARES

59

DIRECTORS AND OFFICERS

60

INTERESTS OF MANAGEMENT AND OTHERS IN MATERIAL TRANSACTIONS

71

INDEBTEDNESS OF DIRECTORS, EXECUTIVE OFFICERS AND SENIOR OFFICERS

71

CORPORATE CEASE TRADE ORDERS, BANKRUPTCIES OR SANCTIONS

71

CONFLICTS OF INTEREST

72

LEGAL PROCEEDINGS AND REGULATORY ACTIONS

72

TRANSFER AGENT AND REGISTRAR

72

INTERESTS OF EXPERTS

72

ADDITIONAL INFORMATION

73

AUDIT AND RISK COMMITTEE

73

AUDIT AND RISK COMMITTEE CHARTER

A-1

GLOSSARY OF TERMS

B-1


-i-


PRESENTATION OF INFORMATION


Unless otherwise noted, the information contained in this annual information form (“Annual Information Form” or “AIF”) is given as at or for the year ended December 31, 2014.  All dollar amounts are in Canadian dollars unless otherwise noted.  Unless the context otherwise requires, all references to the “Corporation” and to “TransAlta”, “we”, “our” and “us” herein refer to TransAlta Corporation and its subsidiaries on a consolidated basis.  Reference to “TransAlta Corporation” herein refers to TransAlta Corporation, excluding its subsidiaries.  Capitalized terms not defined in the body of this AIF shall have their respective meanings set forth in Appendix “B” hereto.


SPECIAL NOTE REGARDING FORWARD-LOOKING STATEMENTS


This Annual Information Form, the documents incorporated herein by reference, and other reports and filings made with the securities regulatory authorities, include forward-looking statements.  All forward-looking statements are based on our beliefs as well as assumptions based on information available at the time the assumption was made and on management’s experience and perception of historical trends, current conditions and expected future developments, as well as other factors deemed appropriate in the circumstances.  Forward-looking statements are not facts, but only predictions and generally can be identified by the use of statements that include phrases such as “may”, “will”, “believe”, “expect”, “estimate”, “anticipate”, “intend”, “plan”, “foresee”, “potential”, “enable”, “continue” or other comparable terminology.  These statements are not guarantees of our future performance and are subject to risks, uncertainties and other important factors that could cause our actual performance to be materially different from that projected.


In particular, this Annual Information Form contains forward-looking statements pertaining to our business and anticipated future financial performance; our success in executing on our growth projects; the timing and the completion and commissioning of projects under development, including major projects such as the South Hedland Power Project, and their attendant costs; our estimated spend on growth and sustaining capital and productivity projects; expectations in terms of the cost of operations, capital spend, and maintenance, and the variability of those costs, including expectations about the cost savings anticipated from the major maintenance agreement entered into with Alstom; the impact of certain hedges on future reporting earnings and cash flows; expectations related to future earnings and cash flow from operating and contracting activities, including estimates of 2015 comparable earnings before interest, taxes, depreciation, and amortization (“EBITDA”), comparable funds from operations (“FFO”) and comparable free cash flow; estimates of fuel supply and demand conditions and the costs of procuring fuel; expectations for demand for electricity in both the short-term and long-term, and the resulting impact on electricity prices; the impact of load growth, increased capacity, and natural gas costs on power prices; expectations in respect of generation availability, capacity, and production; expectations regarding the role different energy sources will play in meeting future energy needs; expected financing of our capital expenditures; expected governmental regulatory regimes and legislation and their expected impact on us and the timing of the implementation of such regimes and regulations, as well as the cost of complying with resulting regulations and laws; the expected settlement of regulatory investigations and disputes; our trading strategy and the risks involved in these strategies; estimates of future tax rates, future tax expense, and the adequacy of tax provisions; accounting estimates; anticipated growth rates in our markets; our expectations relating to the outcome of existing or potential legal and contractual claims, regulatory investigations, and disputes; expectations regarding the renewal of collective bargaining agreements; expectations for the ability to access capital markets at reasonable terms; the estimated impact of changes in interest rates and the value of the Canadian dollar relative to the U.S. and other currencies in locations where we do business; the monitoring of our exposure to liquidity risk; expectations in respect to the global economic environment and growing scrutiny by investors relating to sustainability performance; our credit practices; and the estimated contribution of Energy Marketing activities to gross margin.


Factors that may adversely impact our forward-looking statements include risks relating to: fluctuations in demand market prices and the availability of fuel supplies required to generate electricity; demand for electricity and our ability to contract our generation for prices that will provide expected returns; the regulatory and political environments in the jurisdictions in which we operate; environmental requirements and changes in, or liabilities under, these requirements; changes in general economic conditions including interest rates; operational risks involving our facilities, including unplanned outages at such facilities; disruptions in the transmission and distribution of electricity; the effects of weather; disruptions in the source of fuels, water or wind required to operate our facilities; natural and man-made disasters; the threat of domestic terrorism and cyberattacks; equipment failure and our ability to carry out or have completed the repairs in a cost-effective manner or timely manner; commodity risk management; industry risk and competition; fluctuations in the value of foreign currencies and foreign political risks; the need for additional financing; structural subordination of securities; counterparty credit risk; insurance coverage; our provision for income taxes; legal, regulatory, and contractual proceedings involving the Corporation; outcomes of investigations and disputes; reliance on key personnel; labour relations matters; and development projects and acquisitions, including delays in the permitting and construction of the South Hedland Power Project and the construction of the Australia Natural Gas Pipeline.  The foregoing risk factors, among others, are described in further detail under the heading “Risk Factors” in this Annual Information Form and in the documents incorporated by reference in this Annual


- 1 -


Information Form, including our Management’s Discussion and Analysis for the year ended December 31, 2014 (the “Annual MD&A”).


Readers are urged to consider these factors carefully in evaluating the forward-looking statements and are cautioned not to place undue reliance on these forward-looking statements.  The forward-looking statements included in this document are made only as of the date hereof and we do not undertake to publicly update these forward-looking statements to reflect new information, future events or otherwise, except as required by applicable laws.  In light of these risks, uncertainties and assumptions, the forward-looking events might occur to a different extent or at a different time than we have described or might not occur.  We cannot assure that projected results or events will be achieved.


DOCUMENTS INCORPORATED BY REFERENCE


TransAlta’s audited consolidated financial statements for the year ended December 31, 2014 and related Annual MD&A are hereby specifically incorporated by reference in this AIF.  Copies of these documents are available on SEDAR at www.sedar.com and EDGAR at www.sec.gov.
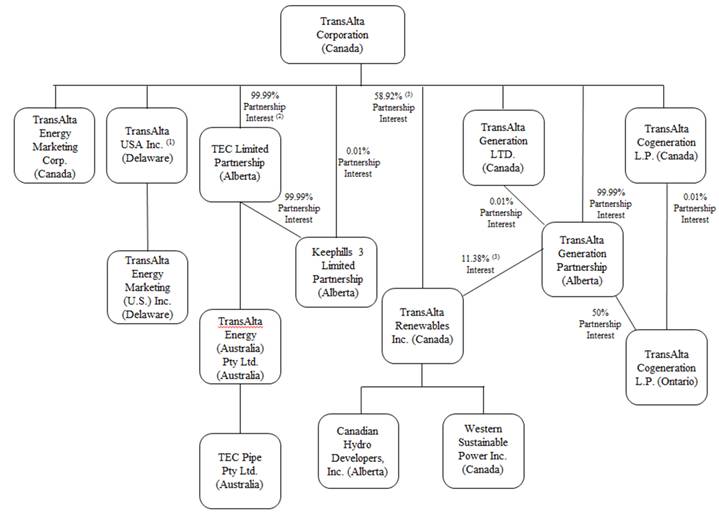
 

CORPORATE STRUCTURE


Name and Incorporation


TransAlta Corporation was formed by Certificate of Amalgamation issued under the Canada Business Corporations Act (the “CBCA”) on October 8, 1992.  On December 31, 1992, a Certificate of Amendment was issued in connection with a plan of arrangement involving TransAlta Corporation and TransAlta Utilities Corporation (“TransAlta Utilities” or “TAU”) under the CBCA.  The plan of arrangement, which was approved by shareholders on November 26, 1992, resulted in common shareholders of TransAlta Utilities exchanging their common shares for shares of TransAlta Corporation on a one for one basis.  Upon completion of the arrangement, TransAlta Utilities became a wholly owned subsidiary of TransAlta Corporation.


Effective January 1, 2009, TransAlta completed a reorganization, whereby the assets and business affairs of TAU and TransAlta Energy Corporation (“TransAlta Energy” or “TEC”) (with the exception of the wind business) were transferred to TransAlta Generation Partnership, a new Alberta general partnership, whose partners are TransAlta Corporation and TransAlta Generation Ltd., a wholly owned subsidiary of TransAlta Corporation.  TransAlta Generation Partnership is managed by TransAlta Corporation pursuant to the terms of the partnership agreement and a management services agreement.


Immediately following the transfer of assets by TAU and TEC to TransAlta Generation Partnership, TransAlta Corporation amalgamated with TAU, TEC, and Keephills 3 GP Ltd. pursuant to the CBCA.


On November 4, 2009, TransAlta completed its acquisition of Canadian Hydro Developers, Inc.


On December 7, 2010, TransAlta amended its articles to create its First Preferred Series A and B shares; again on November 23, 2011 to create the First Preferred Series C and D shares; again on August 3, 2012 to create the First Preferred Series E and F shares; and then again on August 13, 2014 to create the First Preferred Series G and H shares.


In August 2013, TransAlta Renewables Inc. (“TransAlta Renewables”) completed its initial public offering.  In connection with the offering, TransAlta Corporation transferred to TransAlta Renewables certain wind and hydro power generation assets previously held directly or indirectly by TransAlta Corporation.  TransAlta Corporation provides all management, administrative and operational services required for TransAlta Renewables to operate and administer its assets and to acquire additional assets.


The registered and head office of TransAlta is located at 110 - 12th Avenue S.W., Calgary, Alberta, Canada, T2R 0G7.


- 2 -


As of December 31, 2014, the principal subsidiaries of TransAlta Corporation and their respective jurisdictions of formation are set out below:


Notes:

(1)                                  TransAlta USA Inc. is an indirect wholly owned subsidiary of TransAlta Corporation.

(2)                                  The remaining 0.01 per cent interest in TEC Limited Partnership is owned by TransAlta (Ft. McMurray) Ltd., a wholly owned subsidiary of TransAlta Corporation.

(3)                                  We own, directly and indirectly, an aggregate interest of 70.3 per cent of TransAlta Renewables, which includes 58.92 per cent through direct ownership and 11.38 per cent through TransAlta Generation Partnership.  The remaining 29.7 per cent interest in TransAlta Renewables is publicly owned.
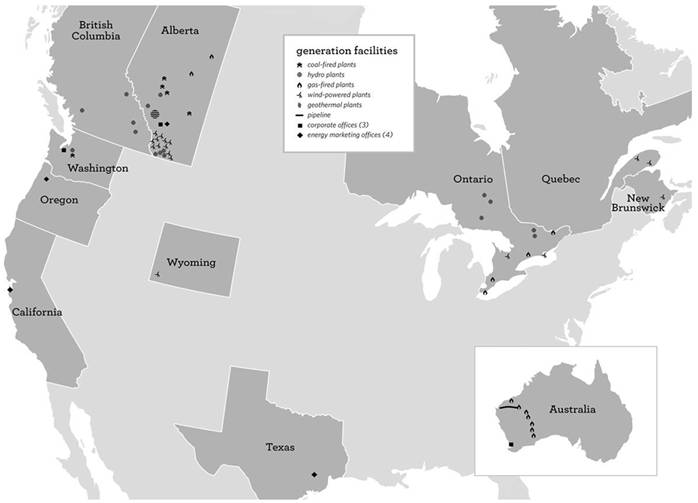


OVERVIEW


TransAlta and its predecessors have been engaged in the production and sale of electric energy since 1909.  We are among Canada’s largest non-regulated electricity generation and energy marketing companies with an aggregate net ownership interest of 8,184 megawatts (“MW”) of generating capacity.  We operate facilities having approximately 9,990 MW of aggregate generating capacity.  In addition, we are in the process of constructing a 150 MW combined cycle power station near South Hedland, Western Australia.  We are focused on generating and marketing electricity in Canada, the United States and Western Australia through our diversified portfolio of facilities fuelled by coal, natural gas, diesel, hydro and wind.


In Canada, we hold a net ownership interest of approximately 6,317 MW of electrical generating capacity in thermal, natural gas-fired, wind powered and hydroelectric facilities, comprised of 5,161 MW in Western Canada, 922 MW in Ontario, 147 MW in Québec and 88 MW in New Brunswick.


- 3 -


In the United States, our principal facilities include a 1,340 MW thermal facility and a 101 MW net interest in a wind farm located in Wyoming.  The economic interest in the Wyoming wind farm (the “Wyoming Wind Farm”) was transferred to TransAlta Renewables in which we maintain a 70.3 per cent direct and indirect ownership interest.


In Australia, we have 425 MW of net electrical generating capacity from natural gas and diesel-fired generation facilities that are located at customer mine sites.  We have also, together with our joint venture partner, DBP Development Group, contracted to design, build, own and operate the 270 km Fortescue River Gas Pipeline which will deliver natural gas to our Solomon Power Station.  The pipeline is expected to be completed in 2015.  In addition, we are in the process of constructing a 150 MW combined cycle power station near South Hedland, Western Australia.  Construction began in early 2015 and the plant is expected to be fully commissioned in 2017.


We regularly review our operations in order to optimize our generating assets and to evaluate appropriate growth opportunities to maximize value to the Corporation.  We have in the past, and may in the future, make changes and additions to our fleet of coal, natural gas, hydro, and wind fuelled facilities.


In August, 2013, TransAlta Renewables completed its initial public offering of its common shares.  TransAlta is the majority owner of TransAlta Renewables, with an approximate 70.3 per cent direct and indirect ownership interest.  TransAlta Renewables is the largest generator of wind power and among the largest publicly traded renewable power generation companies in Canada.


TransAlta’s Map of Operations


The following map outlines TransAlta’s operations as of December 31, 2014.


- 4 -


GENERAL DEVELOPMENT OF THE BUSINESS


TransAlta is organized into three business segments: Generation, Energy Marketing and Corporate.  The Generation segment is responsible for constructing, operating and maintaining our electricity generation, as well as the operation and maintenance of our related mining operations in Canada.  The Energy Marketing segment is responsible for marketing our production through short-term and long-term contracts, for securing cost effective and reliable fuel supply, and for maximizing margins by optimizing our assets as market conditions change.  In addition to serving our assets, our marketing team actively markets energy products and services to energy producers and customers.  This segment also encompasses the management of available generating capacity as well as the fuel and transmission needs of the Generation business.  Both segments are supported by a Corporate segment that provides finance, tax, treasury, legal, regulatory, environmental, health and safety, sustainable development, corporate communications, government and investor relations, procurement, information technology, risk management, human resources, internal audit, and other administrative services, including compliance and governance services.


The significant events and conditions affecting our business during the three most recently completed financial years are summarized below.  Certain of these events and conditions are discussed in greater detail under the heading “Business of TransAlta” in this AIF.


Recent Developments


2015


Issuance of Bonds

On February 11, 2015, the Corporation and its partner issued bonds secured by their jointly owned Pingston facility. Our share of gross proceeds was $45 million. The bonds bear interest at the annual fixed interest rate of 2.95 per cent, payable semi-annually with no principal repayments until maturity in May 2023. Proceeds were used to repay the $35 million secured debenture bearing interest at 5.28 per cent. Excess proceeds, net of transaction costs, are to be used for general corporate purposes.


Restructuring of Canadian Coal

On January 14, 2015, we initiated a significant cost reduction initiative at our Canadian coal operations to run a stronger and more competitive business.  The restructuring resulted in the elimination of positions, providing anticipated full year annual savings of approximately $12 million.  Costs associated with the initiative are expected to total $10 million.


Investment Grade Credit Rating from Fitch Ratings

On January 8, 2015, we announced that Fitch Ratings had assigned TransAlta a BBB- /Stable credit rating.


Generation and Business Development


2014

Sundance Unit 7

During 2014, TAMA Power (“TAMA Power”), TransAlta’s partnership with MidAmerican Energy Holdings Company (“MidAmerican”), continued to develop plans to build the Sundance Unit 7 facility, an 856 MW, highly efficient gas-fired power plant in an area adjacent to our Alberta coal operations.  On December 11, 2014, the Alberta Utilities Commission (“AUC”) announced a public hearing on the proposed Sundance Unit 7 facility, which is expected to commence in 2015.


Major Maintenance Agreement

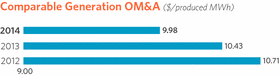
On November 14, 2014, we entered into an agreement with Alstom Power Canada Inc. (“Alstom”) to provide major maintenance at our Alberta coal facilities.  The agreement relates to ten major maintenance projects over the next three years at our Keephills and Sundance plants.  The new arrangement is expected to deliver on average 15 per cent cost reduction per turnaround and shorter turnaround times for major maintenance work, resulting in estimated direct cost savings of $34 million over the full term of the agreement.


South Hedland Power Project

On July 28, 2014, we announced that we had agreed to build, own, and operate a 150 MW combined cycle gas power station in South Hedland, Western Australia to supply power to Regional Power Corporation trading as Horizon Power (“Horizon Power”), a state owned utility, and to the Pilbara Infrastructure Pty Ltd., a wholly owned subsidiary of Fortescue Metals Group (“Fortescue”).  The project is estimated to cost


- 5 -


approximately AUD $570 million which includes the cost of acquiring existing equipment from Horizon Power.  The project will be built on an existing site at Boodarie Industrial Estate and is anticipated to be one of the most efficient power stations in the region.  The power station will supply Horizon Power’s customers in the Pilbara region as well as Fortescue’s port operations.  IHI Engineering Australia has been selected as the contractor to construct the power station.  Relevant work and environmental permits have been received and construction commenced in January 2015.  The power station is expected to be commissioned and delivering power to customers in the first half of 2017.


TransAlta and Province Reach Agreement on Ghost Reservoir

On June 4, 2014, we announced that we had reached an agreement with the Alberta Government regarding modifying the operations of the Ghost Reservoir to provide part of a solution for flood mitigation.  The revised operating pattern of the Ghost Reservoir involves holding the reservoir near its minimum low water level until July 31, 2014, approximately six weeks longer than the prior operating pattern.


California Claim

On May 30, 2014, we announced that our settlement with California utilities, the California Attorney General and certain other parties (the “California Parties”) to resolve claims related to the 2000 - 2001 power crisis in the State of California had been approved by the U.S. Federal Energy Regulatory Commission (“FERC”).  The settlement provides for the payment by us of U.S.$52 million in two equal payments and a credit of approximately U.S.$97 million for monies owed to us from accounts receivable.  The first payment of U.S.$26 million was paid in June 2014 and the second is expected to be made in 2015.


Proceedings before the Alberta Utilities Commission

On March 21, 2014, the Alberta Market Surveillance Administrator (the “MSA”) filed an application with the AUC alleging, among other things, that TransAlta manipulated the price of electricity in the Province of Alberta when it took outages at certain of its coal-fired generating units in late 2010 and early 2011.  TransAlta has denied the MSA’s allegations in their entirety.  An oral hearing before the AUC took place in December 2014.  The next phase of the hearing, the submission of written arguments by each of the parties, is currently under way and will be completed by the end of February 2015.  The AUC’s decision on this matter is expected within 90 days after the written arguments have been submitted.


CE Generation Sale

On February 20, 2014, we announced the sale of our 50 per cent interest in CE Generation, the Blackrock development project (“Blackrock”) and Wailuku Holding Company, LLC (“Wailuku”) to MidAmerican Renewables for proceeds of U.S.$193.5 million.  MidAmerican Renewables held the other 50 per cent interest in CE Generation, Blackrock and Wailuku.  The sale of our interest in CE Generation and Blackrock closed on June 12, 2014 and the sale of our 50 per cent interest in Wailuku closed on November 25, 2014.


Sundance Unit 6 Agreement

On August 18, 2011, the Sundance Unit 6 Generator Step-Up Transformer was damaged as a result of a fire.  We gave notice and claimed force majeure relief under the Alberta PPA.  During the third quarter of 2012, the Alberta PPA buyer informed us that they will be taking the matter to arbitration.  On February 19, 2014, we reached an agreement with the Alberta PPA buyer related to this Sundance Unit 6 dispute.


Keephills Unit 2

On January 31, 2014, an outage commenced at Unit 2 of our Keephills facility to perform a rewind of the generator stator which arose due to the generator event at Keephills Unit 1 facility in 2013.  We gave notice of a High Impact Low Probability (“HILP”) event and claimed force majeure relief under the Alberta PPA.


- 6 -


Fort McMurray Transmission Project

On January 17, 2014, we announced that our strategic partnership with MidAmerican Transmission, TAMA Transmission (“TAMA Transmission”), which was formed on May 9, 2013, successfully qualified to participate as a proponent in the Fort McMurray West 500 kilovolt Transmission Project.  The Alberta Electric System Operator (“AESO”) announced its selection of a short-list of companies, identifying that TAMA Transmission would be participating in the next stage of its competitive process for the project.  TAMA Transmission submitted its bid and in December 2014, after completing its review of all bid submissions, the AESO notified TAMA Transmission that the contract had been awarded to a competitor.


Australia Natural Gas Pipeline

On January 15, 2014, we announced that, through a wholly owned subsidiary, an unincorporated joint venture named Fortescue River Gas Pipeline was formed, of which we have a 43 per cent interest.  The first project of the new joint venture will be to build, own, and operate an AUD$178 million natural gas pipeline from the Dampier to Bunbury Natural Gas Pipeline to our Solomon power station.


2013


Eastern Canada Ice Storm

In late December 2013, extreme weather conditions impacted our operations in parts of Ontario and Atlantic Canada, causing icing on turbine blades and consequently requiring us to shut down some of the wind turbines.  The impact ranged from seven to 12 days of downtime at each of the affected facilities.  Operations at all impacted sites have returned to normal.


Western Australia Contract Extension

On October 30, 2013, we announced a long-term contract extension to supply power to the BHP Billiton Nickel West operations in Western Australia from our Southern Cross Energy facilities.  The extension was effective immediately and replaced the previous contract which was set to expire at the beginning of 2014.


Wyoming Wind Farm Acquisition

On December 20, 2013, we completed the acquisition, through one of our wholly owned subsidiaries, of a 144 MW wind farm in Wyoming for approximately U.S.$102.7 million from an affiliate of NextEra Energy Resources, LLC.  The wind farm is fully operational and contracted under a long-term power purchase agreement (“PPA”) until 2028 with an investment grade counterparty.  The economic interest in the wind farm was acquired by TransAlta Renewables in consideration for a payment equal to the original purchase price of the acquisition.  We have extended a U.S.$102 million loan to TransAlta Renewables to partially fund the acquisition.  The loan requires TransAlta Renewables to repay a minimum of U.S.$45 million of the loan over the first 36 months, (a payment of U.S.$15.0 million was made on March 31, 2014) with the remaining balance due on maturity on December 31, 2018.


Ontario Power Authority Contract

On August 30, 2013, we announced the execution of a new agreement for a 20-year power supply term with the Ontario Power Authority (“OPA”), for the Ottawa gas facility, which is effective January, 2014.  The Ottawa gas facility is owned by TransAlta Cogeneration, L.P. (“TA Cogen”), a subsidiary that is owned 50.01 per cent by TransAlta.


Under the new agreement the Ottawa gas facility has become dispatchable.  This should assist in reducing the instances of surplus baseload generation in the market, while maintaining the ability of the system to reliably produce energy when it is needed.


Update on Hydro Facilities Due to Southern Alberta Flooding

During the second quarter of 2013, certain of our hydro facilities were impacted by the extreme rainfall and flooding that occurred in Southern Alberta.  Though we continue to safely and efficiently resolve operational challenges related to our hydro systems, three of our facilities in the Bow River Basin continue


- 7 -


to be impacted by these events and are being repaired.  We have assessed any financial impact and continue to believe that we have sufficient insurance coverage for this damage, subject to a $5 million deductible.


Sundance Units 1 and 2 Return to Service

In December 2010, Units 1 and 2 of our Sundance facility were shut down due to conditions observed in the boilers at both units.  On July 20, 2012, an arbitration panel concluded that Unit 1 and Unit 2 were not economically destroyed under the terms of the Alberta PPA and we were required to restore the facility to service.


The cost to repair Sundance Units 1 and 2 was originally estimated at approximately $215 million.  The total spend increased by approximately $25 million due to additional scope of work for balance of plant systems and equipment as well as higher labour costs due to an increase in rates.  This work was performed concurrently with the boiler repairs to prevent the need for a later outage for this work.  Sundance Unit 1 returned to service on September 2, 2013 and Unit 2 returned to service on October 4, 2013.  We have issued notices to the Alberta PPA buyer regarding the cessation of the force majeure period for the two units.


Keephills Unit 1

On March 5, 2013, an outage occurred at Unit 1 of our Keephills facility due to a winding failure found in the generator.  Upon completion of the initial repair work, further condition testing and analysis identified greater winding degradation requiring a full rewind of the generator.  In response to the event, we gave notice of a HILP event and claimed force majeure relief under the Alberta PPA.  In the event of a force majeure, we are entitled to continue to receive our Alberta PPA capacity payment and are protected under the terms of the Alberta PPA from having to pay Availability penalties.  The Unit was returned to service on October 6, 2013.  Arbitration on the matter began during the third quarter of 2013.


New Richmond

On March 13, 2013, our 68 MW New Richmond wind farm began commercial operations.  The total cost of the project remains at approximately $212 million.  During 2013, we received a $13 million government grant as part of an agreement to use local resourcing.  On March 28, 2011, we announced that we had received approval from the Government of Québec to proceed with the construction of the New Richmond wind project located on the Gaspé Peninsula.  New Richmond is contracted under a 20-year electricity supply agreement with Hydro-Québec Distribution.


SunHills Mining Limited Partnership

Effective January 17, 2013, we assumed through our wholly owned subsidiary, SunHills Mining Limited Partnership (“SunHills”), operations and management control of the Highvale mine from Prairie Mines and Royalty Ltd. (“PMRL”).  PMRL employees working at the Highvale mine were offered employment by SunHills which agreed to assume responsibility for certain pension plan and pension funding obligations that we had previously funded through the payments made under the PMRL mining contracts.


2012


Sundance Unit 3

On June 7, 2010, an outage occurred at Unit 3 of our Sundance facility due to the mechanical failure of critical generator components, which resulted in the Unit operating at a reduced capacity level.  In response to the event, we gave notice of a HILP event and claimed force majeure relief under the Alberta PPA.  The claim was disputed by the Alberta PPA buyers.


The matter was heard before an arbitration panel during the third quarter of 2012.  On November 23, 2012, the arbitration panel concluded that a HILP event occurred and our claim for force majeure relief was affirmed.


During the fourth quarter of 2012, the uprate at Sundance Unit 3 was completed.  The total cost of the project was approximately $25 million and it is expected that a 15 MW efficiency uprate will be achieved for this unit.  Although we completed the uprate, the resulting increased capacity will not be realized until


- 8 -


we replace the generator stator.  It is expected that the generator stator will be replaced prior to the end of the second quarter of 2015.


Acquisition of Solomon Power Station

On September 28, 2012, we announced that we completed the acquisition from Fortescue of its 125 MW natural gas- and diesel-fired Solomon power station in Western Australia for U.S.$318 million.  The facility is expected to be commissioned in early 2015 and is fully contracted with Fortescue under a long-term PPA with an initial term of 16 years, which term commenced in October 2012, after which Fortescue will have the option either to extend the PPA by an additional five years under the same terms or to acquire the facility.


Centralia Thermal

On July 25, 2012, we announced that we entered into an 11-year agreement to provide electricity from the Centralia Thermal plant to Puget Sound Energy (“PSE”).  The contract began in 2014 and runs until 2025 when the plant is scheduled to be shut down under the bill that was signed on December 23, 2011.  Under the agreement, and starting in December 2014, PSE buys 180 MW of firm, base-load power starting in December 2014.  Commencing in December 2015, the contract increases to 280 MW and from December 2016 to December 2024, the contract is for 380 MW.  In 2025, the last year of the contract, the contracted volume is 300 MW.  The agreement was approved, with conditions, by the Washington Utilities and Transportation Commission (“WUTC”) on January 9, 2013.  On January 23, 2013, it was announced that PSE had filed a petition for reconsideration of certain conditions within the decision issued by the WUTC.  On June 25, 2013, regulatory approval was confirmed by the WUTC and as of July 5, 2013, the contract is in effect in accordance with the WUTC’s terms and conditions.


Keephills Units 1 and 2 Uprates

Testing of the Keephills Units 1 and 2 uprates has been completed and it was determined that the actual capability of the uprates was less than originally anticipated.  As a result, we have adjusted the uprates to 12 MW bringing the maximum capability of these units to 395 MW each.  The total cost of the uprate projects was approximately $51 million.


Project Pioneer

On April 26, 2012, Project Pioneer’s industry partners announced they would not proceed with the joint carbon capture and storage (“CCS”) project.  Project Pioneer was a joint effort by TransAlta, Capital Power Corporation (“Capital Power”), Enbridge Inc., and both the Canadian federal and provincial governments to demonstrate the commercial-scale viability of CCS technology.


The first step of the project was to prove the technical and economic feasibility of CCS through a front end engineering and design (“FEED”) study before making any major capital commitments.  Following the conclusion of the FEED study, industry partners determined that, although the technology worked and capital costs were in line with expectations, the revenue from carbon sales and the price of emissions reductions were insufficient to allow the project to proceed.


Corporate and Energy Marketing


2014


Board of Director Appointments

During the third quarter of 2014, we announced that Mr. P. Thomas Jenkins, OC, CD and Mr. John P. Dielwart had been appointed to our Board of Directors (“Board”), effective September 1, 2014 and October 1, 2014, respectively.  The appointments are the result of our ongoing process of evaluating the skills and composition of the Board, planning for succession and aligning the skills of the Board with the strategic direction of the Corporation.


- 9 -


Sale of Preferred Shares

On August 15, 2014, we completed a public offering of 6.6 million Series G 5.3 per cent Cumulative Redeemable Rate Reset First Preferred Shares, for aggregate gross proceeds of $165 million.  The proceeds from the offering were used for general corporate purposes in support of our business, including the funding of capital projects and the reduction of short-term indebtedness of the Corporation.


Senior Note Offering

On June 3, 2014, we completed an offering of U.S.$400 million aggregate principal amount of senior notes maturing in 2017 and bearing interest at 1.90 per cent.  The net proceeds from the offering were used to repay borrowings under existing credit facilities and for general corporate purposes.


Secondary Offering of TransAlta Renewables Common Shares

On April 29, 2014, we completed a secondary offering of an aggregate of 11,950,000 common shares which we held directly and indirectly in TransAlta Renewables at a price of $11.40 per Common Share, resulting in gross proceeds to the Corporation of $136.2 million.  The net proceeds from the offering were used for general corporate purposes, including the funding of capital projects and the reduction of indebtedness of the Corporation. Following completion of the transaction, our ownership interest in TransAlta Renewables was reduced to 70.3 per cent.


Executive Leadership Team Appointments

On March 18, 2014, we announced three senior leadership appointments that enhanced our objectives of operational excellence from the base business and growth. Brett Gellner was appointed to the role of Chief Investment Officer, responsible for leading all growth aspects of the Corporation. Donald Tremblay joined TransAlta as Chief Financial Officer, effective March 31, 2014, and on July 3, 2014, Wayne Collins joined TransAlta as Executive Vice President, Coal and Mining Operations.


Dividend

On February 20, 2014, we announced the resizing of our dividend to a quarterly dividend of $0.18 per common share (or $0.72 per common share on an annualized basis) to align with our growth and financial objectives.


2013


Medium Term Notes Offering

On November 25, 2013, we completed an offering of $400 million of senior unsecured medium-term notes maturing in 2020 and bearing interest of five per cent.  TransAlta used a portion of the net proceeds from the offering to repay indebtedness and intends to use the remainder to finance the Corporation’s long-term investment plan and growth projects and for general corporate purposes.


TransAlta Renewables

On May 28, 2013, we formed a new subsidiary, TransAlta Renewables, to provide investors with the opportunity to invest directly in a highly contracted portfolio of renewable power generation facilities.  At the time of the transaction, TransAlta held an approximate 81 per cent ownership interest in TransAlta Renewables.  TransAlta has since reduced its interest to 70.3 percent.  See “Corporate and Energy Marketing - 2014 - Secondary Offering of TransAlta Renewables Common Shares”.


Premium DividendTM Program

On May 8, 2013, we announced that as a result of the current low share price environment, we would suspend the Premium Dividend™ component of the Premium Dividend™, Dividend Reinvestment and Optional Common Share Purchase Plan (the “Plan”) following the payment of the quarterly dividend on July 1, 2013.  The Dividend Reinvestment and Optional Common Share Purchase components of the Plan remain effective in accordance with their current terms.


2012


Senior Notes Offering

On November 7, 2012, we completed an offering of U.S.$400 million senior notes maturing in 2022 and bearing  interest of 4.50 per cent.  The net proceeds from the offering were used to repay borrowings under existing credit facilities and for general corporate purposes.


- 10 -


Corporate Restructuring

On October 30, 2012, we announced a restructuring of our resources as part of our ongoing strategy to continuously improve operational excellence and accelerate growth.  As part of this restructuring, we incurred a one-time pre-tax charge of approximately $13 million.


Strategic Partnership

On October 25, 2012, TransAlta and MidAmerican entered into a new strategic partnership through which the two companies will work together to develop, build, and operate new natural gas-fired electricity generation projects in Canada.  The agreement also encompasses our proposed Sundance 7 project.  All development and construction, or acquisition, of approved projects will be funded equally by each partner and it is expected that TransAlta will be responsible for construction management, operations, and maintenance of projects that proceed.


Sale of Common Shares

On September 13, 2012, we completed a public offering of 19.2 million common shares and on September 20, 2012, the underwriters exercised, in part, their over-allotment option to purchase 2.0 million common shares, all at a price of $14.30 per common share, resulting in aggregate gross proceeds of $304 million.  The proceeds of the offering were used to partially fund the acquisition of the Solomon power station in Australia, to fund the construction of our 68 MW New Richmond wind project, to repay short-term debt, and for general corporate purposes.


MF Global Inc.

In 2011, MF Global Holdings Ltd. filed for bankruptcy protection in the United States.  MF Global Holdings Ltd. was the parent company of MF Global Inc., which we used as a broker-dealer for certain commodity transactions.  During 2011, a reserve of U.S.$18 million was taken on the collateral when the parent company of MF Global Inc. filed for bankruptcy protection.  During 2012, we sold our claim against MF Global Inc. for net proceeds of U.S.$33 million.


Sale of Preferred Shares

On August 10, 2012, we completed a public offering of 9.0 million Series E 5.0 per cent Cumulative Redeemable Rate Reset First Preferred Shares, resulting in gross proceeds of $225 million.  The proceeds from the offering were used for general corporate purposes, including the funding of capital projects and the reduction of short-term indebtedness of the Corporation.


Premium Dividend™, Dividend Reinvestment and Optional Common Share Purchase Plan

On February 21, 2012, TransAlta added a Premium DividendTM Component to its existing Dividend Reinvestment and Share Purchase Plan.  The amended and restated plan provides eligible shareholders with two options: (i) to reinvest dividends at a current three per cent discount (may be from zero to five per cent at the discretion of the Board) to the average market price towards the purchase of new shares of TransAlta (the “Dividend Reinvestment Component”) or (ii) to receive the equivalent to 102 per cent of the dividends payable in cash, the premium cash payment (the “Premium DividendTM Component”).


Eligible shareholders enrolled in either the Dividend Reinvestment Component or the Premium DividendTM Component will also be eligible to purchase new shares at a discount to the average market price under the Optional Cash Payment component (the “OCP Component”) of the plan by directly investing up to $5,000 per quarter.  The applicable discount under the OCP Component is also determined from time to time by the Board and is currently set at three per cent.


- 11 -


BUSINESS OF TRANSALTA


Generation Business Segment


Our Generation business segment is responsible for constructing, operating and maintaining our electricity generation facilities as well as the related mining operations in Canada.  The following table summarizes our generation facilities which are operating, under construction or under development, as at December 31, 2014.  Subsequent sections provide more detailed information on facilities by geographic location and fuel type.


Western Canada


Facility


Gross
Capacity
(MW) 
(1)


Ownership
(%)


Net
Capacity
Ownership
Interest 
(1)


Fuel


Revenue Source


Contract
Expiry Date
(2)


Genesee 3


466


50


233


Coal


Merchant


-


Keephills (3)


790


100


790


Coal


Alberta PPA/Merchant(3)


2020


Keephills 3


463


50


232


Coal


Merchant


-


Sheerness


780


25


195


Coal


Alberta PPA


2020


Sundance 1 & 2 units


560


100


560


Coal


Alberta PPA


2017


Sundance 3, 4, 5, 6 units (4)


1,581


100


1,581


Coal


Alberta PPA / Merchant


2020


Fort Saskatchewan


118


30


35


Natural gas


Long-term contract (“LTC”)


2019


Poplar Creek


356


100


356


Natural gas


LTC/Merchant


2023


Ardenville (5) (6)


69


70


49


Wind


Merchant


-


Blue Trail (5) (6)


66


70


46


Wind


Merchant


-


Castle River (5) (6) (7)


44


70


31


Wind


Merchant


-


Cowley North (5) (6)


20


70


14


Wind


Merchant


-


Cowley Ridge


16


100


16


Wind


Merchant


-


Macleod Flats (6)


3


70


2


Wind


Merchant


-


McBride Lake (5) (6)


75


35


26


Wind


LTC


2024


Sinnott (5) (6)


7


70


5


Wind


Merchant


-


Soderglen (5) (6)


71


35


25


Wind


Merchant


-


Summerview 1 (5) (6) 


70


70


49


Wind


Merchant


-


Summerview 2 (5) (6)


66


70


46


Wind


Merchant


-


Akolkolex (5) (6)


10


70


7


Hydro


LTC


2015


Barrier


13


100


13


Hydro


Alberta PPA


2020


Bearspaw


17


100


17


Hydro


Alberta PPA


2020


Belly River (5)


3


70


2


Hydro


Merchant


-


Big Horn


120


100


120


Hydro


Alberta PPA


2020


Bone Creek (5) (6)


19


70


13


Hydro


LTC


2031


Brazeau


355


100


355


Hydro


Alberta PPA


2020


Cascade


36


100


36


Hydro


Alberta PPA


2020


Ghost


51


100


51


Hydro


Alberta PPA


2020


Horseshoe


14


100


14


Hydro


Alberta PPA


2020


Interlakes


5


100


5


Hydro


Alberta PPA


2020


Kananaskis


19


100


19


Hydro


Alberta PPA


2020


Pingston (5) (6)


45


35


16


Hydro


LTC


2023


Pocaterra


15


100


15


Hydro


Merchant


-


Rundle


50


100


50


Hydro


Alberta PPA


2020


Spray


103


100


103


Hydro


Alberta PPA


2020


St. Mary (5) (6)


2


70


1


Hydro


Merchant


-


Taylor (5) (6)


13


70


9


Hydro


Merchant


-


Three Sisters


3


100


3


Hydro


Alberta PPA


2020


Upper Mamquam (5) (6)


25


70


18


Hydro


LTC


2025


Waterton (5) (6)


3


70


2


Hydro


Merchant


-


Total Western Canada


6,541


5,161


- 12 -


Eastern Canada 


Facility


Gross
Capacity
(MW) 
(1)


Ownership
(%)


Net
Capacity
Ownership
Interest 
(1)


Fuel


Revenue Source


Contract
Expiry Date
(2)


Mississauga


108


50


54


Natural gas


LTC


2018


Ottawa


74


50


37


Natural gas


LTC


2017-2033


Sarnia


506


100


506


Natural gas


LTC


2022-2025


Windsor


68


50


34


Natural gas


LTC/Merchant


2016


Kent Hills (5) (6)


150


58


88


Wind


LTC


2033-2035


Le Nordais


99


100


99


Wind


LTC


2033


Melancthon (5) (6) (8)


200


70


140


Wind


LTC


2026-2028


New Richmond (6)


68


70


48


Wind


LTC


2033


Wolfe Island (5) (6)


198


70


139


Wind


LTC


2029


Appleton (6)


1


70


1


Hydro


LTC


2030


Galetta (6)


2


70


1


Hydro


LTC


2030


Misema (6)


3


70


2


Hydro


LTC


2027


Moose Rapids (6)


1


70


1


Hydro


LTC


2030


Ragged Chute


7


100


7


Hydro


LTC


2029


Total Eastern Canada


1,484


1,157


US 


Facility


Gross
Capacity
(MW) 
(1)


Ownership
(%)


Net
Capacity
Ownership
Interest 
(1)


Fuel


Revenue
Source


Contract
Expiry
Date
(2)


Centralia Thermal(9)


1,340


100


1,340


Coal


LTC/Merchant


2025


Wyoming Wind (10)


144


70


101


Wind


LTC


2028


Skookumchuck (11)


1


100


1


Hydro


LTC


2020


Total US


1,485


1,442


Australia


Facility


Gross
Capacity
(MW) 
(1)


Ownership
(%)


Net
Capacity
Ownership
Interest 
(1)


Fuel


Revenue
Source


Contract
Expiry
Date
(2)


Parkeston


110


50


55


Natural gas


LTC


2016


Solomon


125


100


125


Natural
gas/Diesel


LTC


2028


Southern Cross(12)

South Hedland (13)


245

150


100

100


245

150


Natural
gas/Diesel

Natural gas


LTC

LTC


2023

2042


Total Australia


630


575


TOTAL


10,140


8,334


Notes:

(1)                                  MW are rounded to the nearest whole number.  Columns may not add due to rounding.  Capacity includes all generating assets (generation operations, finance lease, and equity investments).

(2)                                  Where no contract expiry date is indicated, the facility operates as merchant.

(3)                                  Merchant capacity includes a 12 MW uprate on units 1 and 2, which began operation in the second quarter of 2012.

(4)                                  Merchant capacity includes uprates of 15 MW (under development), 53 MW, 53 MW and 44 MW on Sundance units 3, 4, 5 and 6, respectively.

(5)                                  These facilities are EcoLogo® certified (“EcoLogo”).  EcoLogo certification is granted to products with environmental performance that meet or exceed all government, industrial safety and performance standards.

(6)                                  Facility owned indirectly by TransAlta Renewables.  Ownership (%) reflects the 70.3 per cent direct and indirect ownership interest of TransAlta in TransAlta Renewables.


- 13 -


(7)                                  Includes seven additional turbines at other locations.

(8)                                  Comprised of two facilities.

(9)                                  Please see “General Development of the Business -  Generation and Business Development  -  2012  -  Centralia Thermal” section in this AIF for information surrounding the contract with PSE.

(10)                            TransAlta Renewables owns the economic interest in this facility.  Ownership (%) reflects only the 70.3 per cent direct and indirect ownership interest of TransAlta in TransAlta Renewables.  Please see “General Development of the Business - Generation and Business Development  - 2013 -  Wyoming Wind Farm Acquisition”.

(11)                            This facility is used to provide a reliable water supply to Centralia Coal.

(12)                            Comprised of four facilities.

(13)                            Plant is under construction and expected to be fully commissioned in mid-2017.


Canada: Western Canada


Thermal Facilities


The following table summarizes our Western Canadian thermal generation facilities:


Location


Province


Plant


Gross

Capacity
(MW)


Ownership
(%)


Commissioning
Dates


Contract
Expiry
Date
(3)


Genesee


AB


Genesee 3


466


50


2005


-


Keephills


AB


Keephills Unit No. 1


395


100


1983


2020


AB


Keephills Unit No. 2


395


100


1984


2020


AB


Keephills Unit No. 3


463


50


2011


-


Sheerness


AB


Sheerness Unit No. 1


390


25


1986


2020


AB


Sheerness Unit No. 2


390


25


1990


2020


Sundance


AB


Sundance Unit No. 1(2)


280


100


1970


2017


AB


Sundance Unit No. 2(2)


280


100


1973


2017


AB


Sundance Unit No. 3(3)


368


100


1976


2020


AB


Sundance Unit No. 4


406


100


1977


2020


AB


Sundance Unit No. 5


406


100


1978


2020


AB


Sundance Unit No. 6


401


100


1980


2020


Total


4,640


Notes:

(1)                                  Where no contract expiry date is indicated, the facility operates as merchant.

(2)                                  Please see “General Development of the Business” in this AIF for information with respect to the event of force majeure that resulted in our Sundance 1 and 2 units being removed from service for the duration of 2012, and the arbitration panel’s decision that units 1 and 2 were not economically destroyed and were to be returned to service.  The units started generating cash flow in third and fourth quarters of 2013.

(3)                                  Includes the completed 15 MW uprate.  Although the uprate has been completed, the resulting increased capacity will not be realized until we replace the generator stator.


Our thermal plants are generally base load plants, meaning that they are expected to operate for long periods of time at or near their rated capacity.  The Genesee facility, located approximately 50 kilometres west of Edmonton, Alberta, is jointly owned with Capital Power.  Coal for the Genesee 3 facility is provided from the adjacent Genesee mine.  The coal reserves of the mine are owned, leased or controlled jointly by PMRL and Capital Power.  We have entered into coal supply agreements with PMRL, which operates the mine, to supply coal for the life of the facility.  On December 23, 2013, Westmoreland Coal Company (“Westmoreland Coal”) announced that it had entered into an agreement to acquire the Prairie and Mountain coal mining operations of Sherritt International Corporation.  The purchased operations include the coal reserves that supply the Genesee 3 facility.


Keephills 1 and 2 and the Sundance facilities are located approximately 70 kilometres southwest of Edmonton, Alberta, and are both owned by TransAlta.  Testing of the Keephills unit 1 and unit 2 uprates was completed in the first quarter of 2013 and based on the results, we have adjusted the uprates capacity to 12 MW, bringing the maximum capacity of these units to 395 MW each.  The Sheerness facility is located approximately 200 kilometres northeast of Calgary, Alberta and is jointly owned by TA Cogen and ATCO Power (2000) Ltd. (“ATCO Power”). See “TA Cogen” in this AIF.


- 14 -


On December 16, 2010 and December 19, 2010, unit 1 and unit 2 of our Sundance facility were shut down due to conditions observed in the boilers at both units.  On February 8, 2011, we issued a notice of termination for destruction based on the determination that the units could not be economically restored to service under the terms of the Alberta PPA.  Due to the uncertainty of the results of the arbitration ruling, we had been continuing to accrue the capacity payments, net of a provision, and to depreciate the asset.  The matter was heard before an arbitration panel during the second quarter of 2012.  On July 20, 2012, the arbitration panel concluded that units 1 and 2 were not economically destroyed and we were required to restore each unit to service.  The panel affirmed that the event met the criteria for force majeure beginning on November 20, 2011 until such time as the units were returned to service.  The rebuild of the units was completed in 2013 and the units started generating cash flow in the third and fourth quarters of 2013.


Fuel requirements for our Western Canadian thermal generation facilities are supplied by a surface strip coal mine located in close proximity to the facilities.  We own the Highvale mine that supplies coal to the Sundance and Keephills facilities and perform the mining, reclamation and associated work at the Highvale mine.  PMRL, under contract with TransAlta, operated the mine on our behalf until January 17, 2013.  On that date, we assumed through our wholly-owned subsidiary, SunHills, operating and management control of the Highvale mine.  The decision to directly operate our facility was made in line with our operating model for operational excellence and to provide us with greater control over our costs and operations.


We estimate that the recoverable coal reserves contained in this mine are sufficient to supply the anticipated requirements for the life of the facilities it serves, including those running post Alberta PPA expiry and potential plant expansion.  We also own the Whitewood mine, which formerly supplied coal to the now decommissioned Wabamun facility.  The Whitewood mine is no longer in operation and we have completed reclamation of the site.  Certification by the Alberta Energy Regulator is currently underway.


Construction on the Keephills 3 power project started on February 26, 2007.  Through Keephills 3 Limited Partnership, TransAlta and Capital Power are equal partners in the ownership of the facility.  Capital Power was responsible for the construction of the facility and TransAlta is responsible for managing the joint venture.  Keephills 3 began commercial operations on September 1, 2011.  The facility is jointly operated by Capital Power and TransAlta.  Each partner independently dispatches and markets its share of the unit’s electrical output.  We provide the coal fuel to the facility through our Highvale mine.


Coal for the Sheerness facility is provided from the adjacent Sheerness mine.  The coal reserves of the mine are owned, leased or controlled jointly by TA Cogen, ATCO Power and PMRL.  TA Cogen and ATCO Power have entered into coal supply agreements with PMRL, which operates the mine, to supply coal until 2026.  See “TA Cogen” in this AIF.  On December 23, 2013, Westmoreland Coal announced that it had entered into an agreement to acquire the Prairie and Mountain coal mining operations of Sherritt International Corporation.  The purchased operations include the coal reserves that supply the Sheerness facility.


Natural Gas-Fired Facilities


The following table summarizes our Western Canadian natural gas-fired generation facilities:


Location


Province


Plant


Gross
Capacity
(MW)


Ownership
(%)


Commissioning
Dates


Contract
Expiry
Date


Fort Saskatchewan


AB


Fort Saskatchewan


118


30


1999


2019


Fort McMurray


AB


Poplar Creek


356


100


2001


2023


Total


474


Our interest in the Fort Saskatchewan facility is held through TA Cogen.  See “TA Cogen” in this AIF.  The 118 MW natural gas-fired Combined-Cycle cogeneration Fort Saskatchewan plant is owned by TA Cogen and


- 15 -


Strongwater Energy Ltd.  The facility provides electricity and steam to Dow Chemical Canada Inc. under the terms of a long-term contract which expires in 2019.


Our Poplar Creek plant is located in Fort McMurray, Alberta.  We operate this 356 MW cogeneration plant which became fully operational in the first quarter of 2001 and delivers approximately 150 MW of electricity and steam to Suncor Energy Inc. (“Suncor”) under the terms of a long-term contract which expires at the end of 2023.  Any surplus power not used by Suncor is available to us to sell to other parties, in which case Suncor is entitled to share in the revenue, under certain conditions.


Hydroelectric Facilities


In connection with the formation of TransAlta Renewables, certain hydroelectric facilities in Eastern and Western Canada representing net capacity of approximately 105 MW were indirectly acquired by TransAlta Renewables from TransAlta.  TransAlta is the majority owner of TransAlta Renewables, with an approximate 70.3 per cent direct and indirect ownership interest.


As well as contracting for power, long-term and short-term contracts are entered into to sell the environmental attributes from the merchant hydro facilities.  These activities help to ensure earnings consistency from these assets.  For 2014, approximately 98 per cent of the environmental attributes from the hydro facilities had been sold.  For 2015, approximately 96 per cent of the environmental attributes from the hydro facilities have been sold to date.  Generally, for facilities under long-term contract, the benefit of the environmental attributes generated flow through to the contract holder.


The following table summarizes our Western Canadian hydroelectric facilities:


Location


Province


Plant


Gross
Capacity
(MW)
(1)


Ownership
(%)


Commissioning
Dates


Contract
Expiry
Date
(2)


Akolkolex River System


BC


Akolkolex(3)(4)


10


70


1995


2015


BC


Pingston(3) (4)


45


35


2003, 2004


2023

Mamquam River System


BC


Upper Mamquam(3) (4)


25


70


2005


2025

Thompson River System


BC


Bone Creek(3)(4)


19


70


2011


2031

Bow River System


AB


Barrier


13


100


1947


2020


AB


Bearspaw


17


100


1954


2020


AB


Cascade


36


100


1942, 1957


2020


AB


Ghost


51


100


1929, 1954


2020


AB


Horseshoe


14


100


1911


2020


AB


Interlakes


5


100


1955


2020


AB


Kananaskis


19


100


1913, 1951


2020


AB


Pocaterra


15


100


1955


-


AB


Rundle


50


100


1951, 1960


2020


AB


Spray


103


100


1951, 1960


2020


AB


Three Sisters


3


100


1951


2020

North Sask. River System


AB


Bighorn


120


100


1972


2020


AB


Brazeau


355


100


1965, 1967


2020

Oldman River System


AB


Belly River(3)(4)


3


70


1991


-


AB


St. Mary(3)(4)


2


70


1992


-


AB


Taylor(3)(4)


13


70


2000


-


AB


Waterton(3)(4)


3


70


1992


-


Total


921


Notes:

(1)                                  MW are rounded to the nearest whole number.

(2)                                  Where no contract expiry date is indicated, generation from the facility is sold by TransAlta on a merchant basis.

(3)                                  These facilities are EcoLogo® certified.

(4)                                  Facility owned indirectly by TransAlta Renewables.  Ownership (%) reflects the 70.3 per cent direct and indirect ownership interest of TransAlta in TransAlta Renewables.


- 16 -


Akolkolex River System


Akolkolex is a run-of-river hydroelectric facility with installed capacity of 10 MW located on the Akolkolex River, south of Revelstoke, British Columbia.  It has been operating since 1995.  The output from the facility is sold to British Columbia Hydro Power Authority (“BC Hydro”).  We own an approximate net 70 per cent interest in this facility through our interest in TransAlta Renewables.  Preliminary discussions with BC Hydro have begun on a new PPA for Akolkolex that would commence upon expiry of the existing PPA in 2015.


Pingston is a run-of-river hydroelectric facility with installed capacity of 45 MW located on Pingston Creek, southwest of Revelstoke, British Columbia and down river of the Akolkolex facility.  It has been operating since 2003.  We own an approximate net 40 per cent interest in this facility through our interest in TransAlta Renewables.  TransAlta Renewables owns the facility equally with Brookfield Renewable Power Inc.  The output from the facility is sold to BC Hydro.


Mamquam River System


Upper Mamquam is a run-of-river hydroelectric facility with installed capacity of 25 MW located on the Mamquam River, east of Squamish, British Columbia, and north of Vancouver.  It has been operating since 2005.  The output from the facility is sold to BC Hydro.  We own an approximate net 70 per cent interest in this facility through our interest in TransAlta Renewables.


Thompson River System


Bone Creek is a run-of-river hydroelectric facility with installed capacity of 19 MW located on Bone Creek, 90 kilometres south of the town of Valemount, British Columbia.  It has been operating since 2011.  The output from the facility is under contract with BC Hydro.  The facility also currently qualifies for payments of $10/MWh until 2020 from Natural Resources Canada (“NRCan”), a division of the federal government, through the ecoEnergy for Renewable Power (“eERP”) program.  We own an approximate net 70 per cent interest in this facility through our interest in TransAlta Renewables.


Bow River System


Barrier is a run-of-river hydroelectric facility with installed capacity of 13 MW located in Seebe, Alberta.  It has been operating since 1947.  We own 100 per cent of this facility.  The facility operates under an Alberta PPA.


Bearspaw is a hydroelectric facility with installed capacity of 17 MW located on the Bow River in Calgary, Alberta.  It has been operating since 1954.  We own 100 per cent of this facility.  The facility operates under an Alberta PPA.


Cascade is a hydroelectric facility with installed capacity of 36 MW located on the Cascade River in Banff National Park, Alberta.  We own 100 per cent of this facility, having purchased it from the Government of Canada in 1941.  The following year, we built a new dam and power plant to replace the original, and then, in 1957, added a second generating unit.  The facility operates under an Alberta PPA.


Ghost is a hydroelectric facility with installed capacity of 51 MW located on the Bow River in Cochrane, Alberta.  It has been operating since 1929.  We own 100 per cent of this facility.  The facility operates under an Alberta PPA.


Horseshoe is a run-of-river hydroelectric facility with installed capacity of 14 MW located in Seebe, Alberta.  It has been operating since 1911.  We own 100 per cent of this facility.  The facility operates under an Alberta PPA.


Interlakes is a hydroelectric facility with installed capacity of 5 MW located in Kananaskis, Alberta.  It has been operating since 1955.  We own 100 per cent of this facility.  The facility operates under an Alberta PPA.


Kananaskis is a run-of-river hydroelectric facility with installed capacity of 19 MW located in Seebe, Alberta.  It has been operating since 1913.  We own 100 per cent of this facility.  It was expanded in 1951 and modified in 1994.  The facility operates under an Alberta PPA.


- 17 -


Pocaterra is a hydroelectric facility with installed capacity of 15 MW located in Kananaskis, Alberta.  It has been operating since 1955.  We own 100 per cent of this facility.  Generation from the facility is sold in the Alberta spot market.


Rundle is a hydroelectric facility with installed capacity of 50 MW located in Canmore, Alberta on the Spray system.  The plant uses water from the Spray Lakes Storage Reservoir.  It has been operating since 1951.  We own 100 per cent of this facility.  The facility operates under an Alberta PPA.


Spray is a hydroelectric facility with installed capacity of 103 MW located in Canmore, Alberta on the Spray system.  The plant uses water from the Spray Lakes Storage Reservoir.  It has been operating since 1951.  We own 100 per cent of this facility.  The facility operates under an Alberta PPA.


Three Sisters is a hydroelectric facility with installed capacity of 3 MW located at the base of the Three Sisters Dam in Canmore, Alberta on the Spray system.  The plant uses water from the Spray Lakes Storage Reservoir.  It has been operating since 1951.  We own 100 per cent of this facility.  The facility operates under an Alberta PPA.


North Saskatchewan River System


Bighorn is a hydroelectric facility with installed capacity of 120 MW located in Nordegg, Alberta.  It has been operating since 1972.  We own 100 per cent of this facility.  The facility operates under an Alberta PPA.


Brazeau is a hydroelectric facility with installed capacity of 355 MW located in Drayton Valley, Alberta.  It has been operating since 1965.  We own 100 per cent of this facility.  The facility operates under an Alberta PPA.


Oldman River System


Belly River is a run-of-river hydroelectric facility with installed capacity of 3 MW located on the Waterton-St. Mary Headworks Irrigation Canal System, east of the Waterton Reservoir, approximately 75 kilometres southwest of Lethbridge in Southern Alberta.  Due to its location along the irrigation canal, Belly River operates from April to October when water is diverted through the canal as part of the St. Mary Irrigation District Water Management Plan.   It has been operating since 1991.  We own an approximate net 70 per cent interest in this facility through our interest in TransAlta Renewables.  We acquire the generation from the facility pursuant to a Renewables PPA (as defined below), and subsequently sell such generation in the Alberta spot market.


St. Mary is a run-of-river hydroelectric facility with installed capacity of 2 MW located at the base of the St. Mary Dam on the Waterton Reservoir, near Magrath, in Southern Alberta.  It has been operating since 1992.  We own an approximate net 70 per cent interest in this facility through our interest in TransAlta Renewables.  We acquire the generation from the facility pursuant to a Renewables PPA, and subsequently sell such generation in the Alberta spot market.


Taylor is a run-of-river hydroelectric facility with installed capacity of 13 MW and is located adjacent to the Taylor Coulee Chute on the Waterton-St. Mary Headworks Irrigation Canal System, which is owned by the Government of Alberta.  It has been operating since 2000.  We own an approximate net 81 per cent interest in this facility through our interest in TransAlta Renewables.  We acquire the generation from the facility pursuant to a Renewables PPA, and subsequently sell such generation in the Alberta spot market.


Waterton is a run-of-river hydroelectric facility with installed capacity of 3 MW located at the base of the Waterton Dam on the Waterton Reservoir, near Hillspring, southwest of Lethbridge, Alberta.  It has been operating since 1992.  We own an approximate net 70 per cent interest in this facility through our interest in TransAlta Renewables.  We acquire the generation from the facility pursuant to a Renewables PPA, and subsequently sell such generation in the Alberta spot market.


- 18 -


Wind Generation Facilities


In connection with the formation of TransAlta Renewables, certain wind generation facilities representing approximately 1,007 MW were indirectly acquired by TransAlta Renewables from TransAlta.  Together with TransAlta Renewables, we own approximately 1,049 MW of net wind generation capacity in 11 wind farms in Western Canada, three in Ontario, two in Québec, two in New Brunswick, and one in the state of Wyoming in the United States.


Wind is not generally a dispatchable fuel; therefore, in merchant markets, wind assets may not be able to secure the annual average pool price.  As such, we make different assumptions in forecast revenue received for generation from a wind asset compared to a base load asset.  If these price assumptions and generation production forecasts are not correct, the corresponding revenue received may be reduced.  Generation production forecasts are based on the long-term average production forecast for a site, reflecting historical climatic conditions.  Within any year there may be variations from this long-term average.  In order to forecast generation production, a number of factors have to be assumed based on historic on-site data and wind farm design including wake and array losses, wind shear and the electrical losses within the site.  If these assumptions are incorrect then actual production will be higher or lower than the long-term forecast for the site.


As well as contracting for power, long-term and short-term contracts are entered into to sell the environmental attributes from the merchant wind facilities.  These activities help to ensure earnings consistency from these assets.  For 2014, approximately 95 per cent of the environmental attributes from the wind facilities were sold.  For 2015, approximately 69 per cent of the environmental attributes from the wind facilities have been sold to date.  Generally, for facilities under long-term contract, the benefit of the environmental attributes generated flow through to the contract holder.


The following table summarizes our Western Canadian wind generation facilities:


Location


Province


Plant


Gross
Capacity
(MW)
(1)


Ownership
(%)


Commissioning
Dates


Contract
Expiry
Date
(2)


Fort Macleod


AB


Ardenville (3)(4)


69


70


2010


-

Fort Macleod


AB


Blue Trail (3)(4)


66


70


2009


-

Fort Macleod


AB


Macleod Flats (3)(4)


3


70


2004


-

Fort Macleod


AB


McBride Lake (3)(4)


75


35


2003


2024

Fort Macleod


AB


Soderglen (3)(4)


71


35


2006


-

Pincher Creek


AB


Castle River (3)(4)


44


70


1997-2001


-

Pincher Creek


AB


Cowley North (3)(4)


20


70


2001


-

Pincher Creek


AB


Cowley Ridge


16


100


1993


-

Pincher Creek


AB


Sinnott (3)(4)


7


70


2001


-

Pincher Creek


AB


Summerview 1 (3)(4)


70


70


2004


-

Pincher Creek


AB


Summerview 2 (3)(4)


66


70


2010


-


Total


506


Notes:

(1)                                  MW are rounded to the nearest whole number.  Column may not add up due to rounding.

(2)                                  Where no contract expiry date is indicated, the facility operates as merchant.

(3)                                  These facilities are EcoLogo® certified.

(4)                                  Facility owned indirectly by TransAlta Renewables.  Ownership (%) reflects the 70.3 per cent direct and indirect ownership interest of TransAlta in TransAlta Renewables.


- 19 -


Ardenville is a 69 MW wind farm located approximately eight kilometres south of Fort Macleod, Alberta adjacent to the Macleod Flats wind facility.  We constructed the project, which commenced commercial operations on November 10, 2010.  The Ardenville wind farm is entitled to receive payments of $10/MWh until 2020 from NRCan, through the eERP program.  We own an approximate net 70 per cent interest in this facility through our interest in TransAlta Renewables.  We acquire the generation from the facility pursuant to a Renewables PPA, and subsequently sell such generation in the Alberta spot market.


Blue Trail is a 66 MW wind farm located in southern Alberta which commenced commercial operations in November 2009.  The Blue Trail wind farm is entitled to receive payments of $10/MWh until 2019 from NRCan, through the eERP program.  We own an approximate net 70 per cent interest in this facility through our interest in TransAlta Renewables.  We acquire the generation from the facility pursuant to a Renewables PPA, and subsequently sell such generation in the Alberta spot market.


Macleod Flats consists of a single 3 MW turbine and is located near Fort Macleod.  It was commissioned in 2004 and was purchased by us in 2009.  We own an approximate net 70 per cent interest in this facility through our interest in TransAlta Renewables.  We acquire the generation from the facility pursuant to a Renewables PPA, and subsequently sell such generation in the Alberta spot market.


McBride Lake is a 75 MW wind farm located at Fort Macleod, Alberta.  We constructed the wind farm, which commenced commercial operations in the third quarter of 2003.  McBride Lake is operated by us.  We own an approximate net 35 per cent interest in this facility through our interest in TransAlta Renewables.  TransAlta Renewables owns the facility equally with ENMAX Green Power Inc.  The output from the facility is 100 per cent contracted in the form of a 20-year PPA with ENMAX Energy Corporation.  We also own an approximate net 70 per cent interest in the 0.7 MW McBride Lake East facility in the same vicinity through our ownership interest in TransAlta Renewables.


Soderglen is a 71 MW facility located in southern Alberta, southwest of Fort Macleod and 40 kilometres from our wind operations near Pincher Creek.  The facility began commercial operations in September 2006.  Soderglen is entitled to receive WPPI payments from the federal government at $10/MWh.  We own an approximate net 35 per cent interest in this facility through our interest in TransAlta Renewables.  TransAlta Renewables owns the facility equally with Nexen Energy ULC.  We acquire the generation from the facility pursuant to a Renewables PPA, and subsequently sell 50 per cent of such generation in the Alberta spot market (which excludes that portion of generation that is owned by Nexen Energy ULC).


Castle River is a 40 MW wind farm located in Pincher Creek, Alberta.  We also own and operate seven additional turbines totalling 4 MW located individually in the Cardston County and Hillspring areas of southwestern Alberta.  We own an approximate net 70 per cent interest in this facility through our interest in TransAlta Renewables.  We acquire the generation from the facility pursuant to a Renewables PPA, and subsequently sell such generation in the Alberta spot market.


Cowley North is a 20 MW wind farm, located adjacent to Cowley Ridge.  It commenced commercial operations in the fall of 2001.  We own an approximate net 70 per cent interest in this facility through our interest in TransAlta Renewables.  We acquire the generation from the facility pursuant to a Renewables PPA, and subsequently sell such generation in the Alberta spot market.


Cowley Ridge has total installed capacity of 16 MW and is located adjacent to Cowley North.  It is comprised of two parts: (i) Cowley Ridge, which became operational in 1993, and (ii) the Cowley Expansion, which became operational in 1994, both of which we own 100 per cent.  The output from this facility is sold in the Alberta spot market.


Sinnott has a total installed capacity of 7 MW and is located directly east of Cowley Ridge.  It commenced commercial operations in the fall of 2001.  We own an approximate net 70 per cent interest in this facility through our interest in TransAlta Renewables.  We acquire the generation from the facility pursuant to a Renewables PPA, and subsequently sell such generation in the Alberta spot market.


- 20 -


Summerview 1 is a 68 MW wind farm located approximately 15 kilometres northeast of Pincher Creek, Alberta.  We constructed Summerview and it commenced commercial operations in 2004.  The Summerview 1 facility, together with an existing 1.8 MW turbine in the area, brings the total wind generation capacity at that location to 70 MW.  We own an approximate net 70 per cent interest in this facility through our interest in TransAlta Renewables.  We acquire the generation from the facility pursuant to a Renewables PPA, and subsequently sell such generation in the Alberta spot market.


Summerview 2 is a 66 MW wind farm located northeast of Pincher Creek, Alberta.  We constructed the facility, which began commercial operations in February 2010.  The Summerview 2 wind farm expansion is entitled to receive payments of $10/MWh until 2020 from NRCan, through the eERP program.  We own an approximate net 70 per cent interest in this facility through our interest in TransAlta Renewables.  We acquire the generation from the facility pursuant to a Renewables PPA, and subsequently sell such generation in the Alberta spot market.


Canada: Eastern Canada


Natural Gas-Fired Facilities


Our Ontario natural gas-fired generating facilities are summarized in the following table:


Location


Province


Plant


Gross
Capacity
(MW)
(1)


Ownership
(%)


Commissioning
Dates


Contract
Expiry Date


Mississauga


ON


Mississauga (2)


108


50


1992


2018

Ottawa


ON


Ottawa (2)


74


50


1992


2017-2033

Sarnia


ON


Sarnia


506


100


2003


2022-2025

Windsor


ON


Windsor (2)


68


50


1996


2016


Total


756


Notes:

(1)                                  MW are rounded to the nearest whole number.  Column may not add up due  to rounding.

(2)                                  We have a 50 per cent interest in these three facilities through our ownership interest in TA Cogen.


The Mississauga plant is owned by TA Cogen.  See “TA Cogen” in this AIF.  It is a Combined-Cycle cogeneration facility designed to produce 108 MW of electrical energy.  The capacity is contracted under a long-term contract with the Ontario Electricity Financial Corporation (“OEFC”) which expires in 2018.  Prior to July 2005, the Mississauga plant also provided cogeneration services to Boeing Canada Inc. (“Boeing”).  Boeing exercised its right under the cogeneration services agreement to no longer take and pay for cogeneration services due to the closure of its manufacturing facility.  Boeing remains entitled to any steam credits which are based on the total plant electricity generation revenue.  On or prior to each of January 1, 2018 and 2023, Boeing may give notice of its intention to continue to purchase or discontinue cogeneration services.  In addition, on those same dates, Boeing has the option to require the removal of the Mississauga plant from the leased lands or purchase the Mississauga plant at its net salvage value.  Boeing is, however, incented to run the lease to term in 2028 by the annual steam credit payment it receives.


The Ottawa plant is owned by TA Cogen.  See “TA Cogen” in this AIF.  It is a Combined-Cycle cogeneration facility designed to produce 74 MW of electrical energy.  On August 30, 2013, the Corporation announced the re-contracting of the plant with the OPA for a 20-year term, effective January 2014.  Please see “General Development of the Business – Generation and Business Development – 2013 – Ontario Power Authority Contract” for more information.  The Ottawa plant also provides steam, hot water, and chilled water to the member hospitals and treatment centers of the Ottawa Health Sciences Centre and the National Defence Medical Centre.  The thermal energy contract with the Ottawa Health Sciences Centre expires in 2023 and the thermal energy contract with the National Defence Medical Centre expires on December 31, 2017.


The Sarnia plant is a 506 MW Combined-Cycle cogeneration facility that provides steam and electricity to nearby industrial facilities owned by LANXESS AG (formerly Bayer Inc.), Nova Chemicals (Canada) Ltd. (“NOVA”) (which in turn supplies Styrolution, a Styrene production facility formerly owned by NOVA) and Suncor Energy


- 21 -


Products Inc.  We own 100 per cent of this facility.  On February 15, 2006, we signed a five-year agreement with the OPA for generation from our Sarnia facility.  Subsequently, the Ontario Minister of Energy and Infrastructure directed the OPA to seek contracts with us and certain other “Early Movers” to obtain terms and conditions which were more in keeping with the contracts it was offering new facilities.  In September 2009, we signed a new contract with the OPA, effective as of July 1, 2009 and terminating on December 31, 2025, which provides more favourable terms than those previously held by the facility.  In addition, the new agreement brought the combined total term contracted with the OPA to 20 years and includes provisions for the parties to share in the impact and benefit of changes in customer steam load or loss of steam customer.


The Windsor plant is owned by TA Cogen.  See “TA Cogen” in this AIF.  It is a Combined-Cycle cogeneration facility designed to produce 68 MW of electrical energy.  Currently, 50 MW of the capacity is sold under a long-term contract to the OEFC.  This agreement expires in 2016.  The Windsor plant also provides thermal energy to Chrysler Canada Inc.’s minivan assembly facility in Windsor.  In 2010, a new agreement was reached with the OEFC to make the plant fully dispatchable in order to sell the remaining capacity and ancillary services to the Ontario power market when it is economical to do so.


Hydroelectric Facilities


Our Ontario hydroelectric facilities are summarized in the following table:


Location


Province


Plant


Gross
Capacity
(MW) 
(1)


Ownership

(%)


Commissioning
Dates


Contract
Expiry Date


Misema River System


ON


Misema(2)(3)


3


70


2003


2027

Mississippi River System


ON


Appleton(2)(3)


1


70


1994


2030

Mississippi River System


ON


Galetta(2)(3)(4)


2


70


1998


2030

Montréal River System


ON


Ragged Chute(2)


7


100


1991


2029

Wanapitei River System


ON


Moose Rapids(2)(3)


1


70


1997


2030


Total


14


Notes:

(1)                                  MW are rounded to the nearest whole number.

(2)                                  These facilities are EcoLogo® certified.

(3)                                  Facility owned indirectly by TransAlta Renewables.  Ownership (%) reflects the 70.3 per cent direct and indirect ownership interest of TransAlta in TransAlta Renewables.

(4)                                  Galetta was originally built in 1907, but was retrofitted in 1998.


Misema is a run-of-river hydroelectric facility with installed capacity of 3 MW located on the Misema River, close to Englehart, in northern Ontario.  This facility has been operating since 2003.  Generation from this facility is sold to the OPA under a contract that terminates May 3, 2027.  We own an approximate net 70 per cent interest in this facility through our interest in TransAlta Renewables.


Appleton is a run-of-river hydroelectric facility with installed capacity of 1 MW located on the Mississippi River, near Almonte, Ontario.  The facility has been operating since 1994.  Generation from this facility is sold to the OPA under a contract that terminates December 31, 2030.  We own an approximate net 70 per cent interest in this facility through our interest in TransAlta Renewables.


Galetta is a run-of-river hydroelectric facility with installed capacity of 2 MW located on the Mississippi River, near Galetta, Ontario.  This facility was originally built in 1907 and retrofitted in 1998.  Generation from this facility is sold to the OPA under a contract that terminates December 31, 2030.  We own an approximate net 70 per cent interest in this facility through our interest in TransAlta Renewables.


Ragged Chute is a run-of-river hydroelectric facility with installed capacity of 7 MW located on the Montréal River, south of New Liskeard, in northern Ontario.  We lease this facility from Ontario Power Generation Inc. and it has been operating since 1991.  Generation from this facility is sold to the OPA under a contract that terminates June 30, 2029.  We own a 100 per cent interest in this facility.


- 22 -


Moose Rapids is a run-of-river hydroelectric facility with installed capacity of 1 MW located on the Wanapitei River, near Sudbury, in northern Ontario.  This facility has been operating since 1997.  Generation from this facility is sold to the OPA under a contract that terminates December 31, 2030.  We own an approximate net 70 per cent interest in this facility through our interest in TransAlta Renewables.


Wind Generation Facilities


Our Ontario, Québec and New Brunswick wind generation facilities are summarized in the following table:


Location


Province


Plant


Gross

Capacity
(MW) 
(1)


Ownership
(%)


Commissioning
Dates


Contract

Expiry Date


Kingston


ON


Wolfe Island (2)


198


70


2009


2029

Melancthon Township


ON


Melancthon I (2)


68


70


2006


2026

Melancthon and Amaranth Townships


ON


Melancthon II (2)


132


70


2008


2028

Gaspé Peninsula


QC


Le Nordais


99


100


1999


2033


QC


New Richmond (2)


68


70


2012


2033

Kent Hills


NB


Kent Hills (2)


96


58


2008


2033


NB


Kent Hills Expn. (2)


54


58


2010


2035


Total


714


Notes:

(1)                                  MW are rounded to the nearest whole number.  Column may not add due to rounding.

(2)                                  Facility owned indirectly by TransAlta Renewables.  Ownership (%) reflects the 70.3 per cent direct and indirect ownership interest of TransAlta in TransAlta Renewables.


Wolfe Island is a 198 MW wind project located on Wolfe Island, near Kingston, Ontario.  This facility commenced commercial operations in 2009.  Generation from this facility is sold to the OPA.  We own an approximate net 70 per cent interest in this facility through our interest in TransAlta Renewables.


Melancthon I is a 68 MW wind project located in Melancthon Township near Shelburne, Ontario.  It commenced commercial operations on 2006.  Generation from this facility is sold to the OPA.  We own an approximate net 70 per cent interest in this facility through our interest in TransAlta Renewables.


Melancthon II is a 132 MW wind project located adjacent to Melancthon I, in Melancthon and Amaranth Townships.  It commenced commercial operations in 2008.  Generation from this facility is sold to the OPA.  We own an approximate net 70 per cent interest in this facility through our interest in TransAlta Renewables.


Le Nordais is located at two sites: Cap-Chat with 56.25 MW of installed capacity; and Matane with 42.75 MW of installed capacity.  Le Nordais is located on the Gaspé Peninsula of Québec.  It commenced commercial operations in 1999.  We own 100 per cent of this facility.  Generation from this facility is sold to Hydro-Québec.


New Richmond is a 68 MW wind project also located on the Gaspé Peninsula.  New Richmond is contracted under a 20-year Electricity Supply Agreement with Hydro-Québec Distribution.  It commenced commercial operations in 2013.  We own an approximate net 70 per cent interest in this facility through our interest in TransAlta Renewables.


Kent Hills is a 96 MW project located in Kent Hills, New Brunswick, and delivers power under a 25 year LTC with New Brunswick Power.  Natural Forces Technologies Inc., an Atlantic Canada-based wind developer, is our co-development partner in this project and exercised its option to purchase up to 17 per cent of the Kent Hills project in May 2009.  Kent Hills commenced commercial operations in 2008.  We own an approximate net 58 per cent interest in this facility through our interest in TransAlta Renewables.


The Kent Hills expansion is a 54 MW wind farm which also delivers power under a 25 year LTC with New Brunswick Power.  Natural Forces exercised their option to purchase a 17 per cent interest in the Kent Hills expansion project subsequent to the commencement of commercial operations.  The facility commenced commercial


- 23 -


operations in 2010.  We own an approximate net 58 per cent interest in this facility through our interest in TransAlta Renewables.


All of the electricity generated and sold by our wind division within Canada, with the exception of Macleod Flats and New Richmond, is from facilities that are EcoLogo certified.  The New Richmond facility currently has an application under review to become EcoLogo certified.  We are an EcoLogo certified distributor of Alternative Source Electricity through Environment Canada’s Environmental Choice program.


TA Cogen


We hold a 50.01 per cent limited partnership interest in TA Cogen, which is an Ontario limited partnership.  The remaining 49.99 per cent ownership is held by Canadian Power Holdings Inc., a subsidiary of Cheung Kong Infrastructure Holdings Limited.  Canadian Power Holdings Inc. was formed on December 31, 2011 by amalgamation of Stanley Energy Inc. into Stanley Power Inc. and which subsequently changed its name to Canadian Power Holdings Inc. effective December 31, 2013.


TA Cogen holds an interest in the 780 MW Sheerness thermal generation facility in Alberta, the 118 MW Fort Saskatchewan natural gas-fired cogeneration facility in Alberta and the 108 MW Mississauga, the 74 MW Ottawa and the 68 MW Windsor natural gas-fired cogeneration facilities located in Ontario.  Description of these facilities, ownership levels and contracted capacity is provided under the heading “Canada – Eastern Canada – Natural Gas-Fired Facilities”.


United States


Our generation facilities in the United States are summarized in the following table:


Location


State


Plant


Gross

Capacity
(MW)
(1)


Ownership
(%)


Commissioning

Dates


Contract
Expiry Date


Centralia


WA


Centralia Thermal No. 1(2)


670


100


1971


2020


Centralia Thermal No. 2(2)


670


100


1971


2025


Skookumchuck


1


100


1970


2020

Wyoming


WY


Wyoming Wind(3)


144


70


2003


2028


Total


1,485


Notes:

(1)                                  MW are rounded to the nearest whole number.

(2)                                  Please see “General Development of the Business – Generation and Business Development - 2012 - Centralia Thermal” in this AIF for information surrounding the contract with PSE.

(3)                                  TransAlta Renewables owns the economic interest in this facility.  Ownership (%) reflects only the 70.3 per cent direct and indirect ownership interest of TransAlta in TransAlta Renewables.  Please see “General Development of the Business - Generation and Business Development  -  2013  -  Wyoming Wind Farm Acquisition”.


Centralia


We own a two-unit 1,340 MW thermal facility in Centralia, Washington, located south of Seattle.  We have entered into a number of multiple year medium and short-term energy sales agreements from the Centralia Thermal plant.  In 2011, Washington State passed the TransAlta Energy Bill (chapter 180, Laws of 2011) (the “Bill’’) allowing the Centralia Thermal plant to comply with the State’s GHG emissions performance standards by shutting down one of its two boilers by the end of 2020 and the other by the end of 2025.  The Bill removed restrictions that had previously been imposed on the facility limiting the duration of new contracts from the facility, and limiting the technology that the facility would be required to implement for nitrogen oxides (“NOx”) controls.  On December 23, 2011, TransAlta and the State entered into the memorandum of agreement which confirmed some of these arrangements in contractual form with the provision that certain terms could terminate at our option if we do not secure at least 500 MW of long-term contract for the Centralia Thermal plant by the end of 2013.  On July 25, 2012, we announced that we entered into an 11-year agreement to provide electricity from our Centralia Thermal plant to PSE.  The contract begins in 2014 and runs until 2025 when the plant is scheduled to be shut down.  Under the


- 24 -


agreement, PSE will buy 180 MW of firm, base-load power starting in December 2014.  In December 2015 the contract increases to 280 MW and from December 2016 to December 2024 the contract is for 380 MW.  In the last year of the contract, the contracted volume is for 300 MW.


We sell electricity from the Centralia Thermal plant into the Western Electricity Coordinating Council (“WECC”) and, in particular, on the spot market in the U.S. Pacific Northwest energy market.  Our strategy is to balance contracted and non-contracted sales of electricity to manage production and price risk.


We also own a one MW hydroelectric generating facility on the Skookumchuck River near Centralia, and related assets which are used to provide water supply to our generation facilities in Centralia.  On December 10, 2010, we entered into an agreement with PSE for Skookumchuck to provide power until 2020.


We also own a coal mine adjacent to the Centralia facility; however, we stopped mining operations at our Centralia coal mine on November 27, 2006.  Although we estimate that certain coal reserves remain to be extracted, we have not yet received permits for, nor developed the new area from which this coal could be produced.  Coal to fuel the Centralia plant is sourced from the Powder River Basin in Montana and Wyoming.  TransAlta is currently party to coal contracts with three suppliers which expire between 2015 and 2025.  We expect to continue to source our future coal needs from the Powder River Basin.  In December 2014, we began fine coal recovery operations at our Centralia mine.  This operation recovers previously wasted coal as part of the mine reclamation process and is expected to provide roughly seven per cent of the fuel use by the Centralia plant.


Under the U.S. Federal Mine Safety and Health Act, TransAlta must report all “significant and substantial” citations at its Centralia mine.  During 2014, TransAlta had no reportable events relating to electric equipment and the examination, testing and maintenance thereof.  The mine is not in operation.  There were no injury incidents or fatalities at the mine during 2014.  The total dollar value of all Mine Safety and Health Administration (“MSHA”) assessments was not significant.  There are no pending legal actions before the Federal Mine Safety and Health Review Commission involving the Centralia mine and none were pending during 2014.


Reportable Events – Centralia Mine


Mine or
Operating

Name/MSHA

Identification

Number


Section

104

S&S

Citations

(#)


Total Dollar

Value of

MSHA

Assessments

Proposed

($)


Total

Number

of

Mining

Related

Fatalities

(#)


Received

Notice of

Pattern

Violations

Under

Section

104(e)

(yes/no)


Received

Notice of

Potential

to

Have

Pattern

Under

Section

104(e)

(yes/no)


Legal

Actions
Initiated
or

Pending

During
Period

(#)

4500416


0


$800


0


no


no


0


Wyoming Wind


The Wyoming Wind Farm is a 144 MW wind project located near Evanston, Wyoming.  The wind farm was acquired in December 2013, for approximately U.S.$102.7 million from an affiliate of NextEra Energy Resources, LLC.  The wind farm is fully operational and contracted under a long-term PPA until 2028 with an investment grade counterparty.  The economic interest in the wind farm was acquired by TransAlta Renewables from a subsidiary of the Corporation at the time of acquisition in consideration for a payment equal to the original purchase price.


- 25 -


Australia


Our natural gas and diesel fired generation facilities in Australia, including those under construction, are summarized in the following table:


Location


State


Plant


Gross

Capacity
(MW)


Ownership
(%)


Commissioning
Dates


Contract
Expiry Date


Kalgoorlie


WA


Parkeston


110


50


1996


2016

Eastern Goldfields Region


WA


Southern Cross(1)


245


100


1996


2023

Pilbara Region


WA


Solomon(2)


125


100


2014


2028

South Hedland


WA


South Hedland (3)


150


100


2017


2042


Total


630


Notes:

(1)                                  Comprised of four facilities.

(2)                                  This facility was acquired in September 2012 and was under construction for the remainder of 2012.  The plant is expected to be fully commissioned in early 2015.

(3)                                  Plant is under construction and expected to be fully commissioned in mid-2017.


The Parkeston plant is a 110 MW dual-fuel natural gas and diesel fired power station, which we own in partnership through a 50/50 joint venture with NP Kalgoorlie Pty Ltd., a subsidiary of Newmont Australia Limited.  The Parkeston facility primarily supplies energy to Kalgoorlie Consolidated Gold Mines and is contracted until 2016.  Any merchant capacity and energy are sold into Western Australia’s wholesale electricity market.


Southern Cross Energy is composed of four natural-gas and diesel-fired generation facilities with a combined capacity of 245 MW.  Southern Cross Energy sells its output pursuant to a contract with BHP Billiton which was renewed in October of 2013 for ten years.  See “General Development of the Business – Generation and Business Development - 2013 – Western Australia Contract Extension” for more details.


We acquired the 125 MW natural gas and diesel fired Solomon power station in September 2012 from Fortescue.  Under the terms of the sale and purchase agreement, Fortescue is required to complete the construction and commissioning of the facility.  The Solomon facility is fully contracted with Fortescue under a long-term contract that is intended to support their iron ore mining operations.


In 2014, we established the Fortescue River Gas Pipeline joint venture with DBP Development Group.  The joint venture was successfully awarded the contract to design, build, own and operate the 270 km Fortescue River Gas Pipeline which will deliver natural gas to TransAlta’s Solomon Power Station.  The pipeline is expected to be completed in the first quarter of 2015 and will operate under a take-or-pay gas transport agreement with a Fortescue Metals Group subsidiary for an initial term of 20 years.  The 16-inch diameter pipeline has an initial free-flow capacity of 64 terajoules (TJ) per day.


In 2014, TransAlta was selected as the successfully bidder to design, build, own and operate a 150 MW combined cycle power station near South Hedland, Western Australia.  Construction began in early 2015 and the plant is expected to be fully commissioned in 2017.  The plant is being constructed under an engineering, procurement and construction agreement with IHI Engineering Australia, a wholly owned subsidiary of IHI Corporation.  The plant is fully contracted with two customers for a 25-year term.  The majority of the plant’s capacity is contracted to Horizon Power, the state owned electricity supplier in the region.  The second customer is the port operations of Fortescue Metals Group.


- 26 -


Alberta PPAs


All of our Alberta thermal and hydroelectric facilities, other than the Keephills 3, Genesee 3, Belly River, Pocaterra, Waterton, St. Mary and Taylor facilities, and uprated capacity, operate under Alberta PPAs.  The Alberta PPAs establish committed capacity and electrical energy generation requirements and Availability targets to be achieved by each thermal plant, energy and ancillary services obligations for the hydroelectric plants, and the price at which electricity is to be supplied.  We bear the risk or retain the benefit of Availability under or above a targeted Availability (except for those arising from events considered to be force majeure, in the case of the PPA thermal plants) and any change in costs (unless due to a change in law) required to maintain and operate the facilities.


Our thermal facilities are operated by us, however, they are cycled or dispatched by the buyers under the Alberta PPA. Under the Alberta PPAs, we are exposed to electricity price risk if Availability declines below contracted levels (other than as a result of outages caused by an event of force majeure).  In those circumstances, we must pay a penalty on the difference between target Availability and actual Availability at a price equal to the 30-day rolling average of Alberta’s market electricity prices.  This rolling average provision attempts to mitigate price spikes that can occur as a result of sudden outages.  We attempt to further mitigate this exposure by maintaining contracted and uncontracted capacity in the market, through operation and maintenance practices, and hedging activities.


Our hydroelectric facilities, other than Belly River, Pocaterra, St. Mary, Taylor and Waterton, are aggregated through one Alberta PPA which provides for financial obligations for energy and ancillary services based on hourly targets.  We meet these targeted amounts through physical delivery or third party purchases.


Our compensation under the Alberta PPAs is founded on a pricing formula based on the previous cost of service regime that applied under utility regulation.  Key elements of the pricing formula are the amount of common equity deemed to form part of the capital structure, the amount of risk premium attributable to deemed common equity and a recovery of certain fixed and variable costs.  Common equity is deemed to be 45 per cent of total capital and the return on equity is set annually at a 4.5 per cent premium over the rate of a Government of Canada Bond with maturity of ten years.


The pricing formula includes a provision for site restoration costs for the thermal generating plants during the term of the Alberta PPAs.  If the costs recovered are insufficient, then we can apply to the Balancing Pool to recover the incremental portion.  The Alberta PPAs include, as part of the capacity payment for hydroelectric operations, an amount for decommissioning.


The expiry dates for our Alberta PPAs range from 2017 to 2020.  We are evaluating the economics of running assets post PPA expiry, taking into account published and expected provincial and federal greenhouse gas (“GHG”) and other environmental legislation, including the published federal regulations governing GHG emissions from coal-fired plants.  Upon the expiry of the Alberta PPAs, and subject to any legislative limitations, which are addressed below, and our ability to procure an extension to operating licenses, if required, we will then be in a position to sell our electricity to the Alberta Power Pool and to third party purchasers through direct sales agreements.


The Alberta PPAs (together with legislation which applies thereto) permit the Balancing Pool, directly or indirectly as successor to the power purchaser under the Alberta PPAs, to terminate the Alberta PPAs in certain circumstances.  If the Balancing Pool exercises its ability to terminate, we will, in those circumstances, be entitled to receive a lump-sum payment in connection with such termination.


In September of 2012, the Canadian federal Government published the final regulations governing GHG emissions from coal-fired power plants, which regulations become effective on July 1, 2015. Please see the section entitled “Environmental Risk Management - Ongoing and Recently Passed Environmental Legislation” below for more details on this legislation.


Renewables PPAs


Upon closing of the Renewables’ Offering, we entered into long-term power purchase agreements with certain subsidiaries of TransAlta Renewables (each a “Merchant Subsidiary”) providing for the purchase by TransAlta, for a fixed price, of all of the power produced at certain merchant facilities (the “Renewables PPAs”). The initial price


- 27 -


payable in 2013 by TransAlta for output under the Renewables PPAs was $30.00/MWh for wind facilities and $45.00/MWh for hydroelectric facilities, which amounts are adjusted annually for changes in the CPI. The CPI adjusted prices for 2015 are $30.86/MWh for wind facilities and $46.29/MWh for hydroelectric facilities.  Under the terms of each Renewables PPA, the Merchant Subsidiary is under no obligation to deliver any specified amount of energy and, in no event, shall any penalties or curtailment payments be payable under the Renewables PPA.  The Merchant Subsidiary will assume all operating and generating risk and TransAlta will only be required to purchase power that is actually produced.


Each Renewables PPA has a term of 20 years or end of asset life, where end of asset life is less than 20 years. Each Renewables PPA may be terminated by: (a) the mutual agreement of the parties; (b) the Merchant Subsidiary upon the occurrence of a material default by TransAlta; and (c) TransAlta (i) upon the occurrence of a material default by the Merchant Subsidiary; (ii) upon a change of control of TransAlta Renewables; or (iii) upon a change of control of the Merchant Subsidiary.


Energy Marketing Segment


Our Energy Marketing segment provides a number of strategic functions, including the following:


·                                          Gathering and analyzing market trends to enable more effective strategic planning and decision making.


·                                          Negotiating and entering into contractual agreements with customers for the sale of output from our generation assets, including electricity, steam or other energy-related commodities;


·             Negotiating and managing fuel supply arrangements with third parties for our generation assets.  This includes scheduling, billing and settlement of physical deliveries of natural gas and other fuels;


·                                          The development and execution of our corporate hedging strategy within Board approved parameters; and


·                                          The optimization of the asset fleet to maximize gross margin and mitigation of market risks.


The Energy Marketing segment also derives additional revenue by providing fee based asset management services to third parties, by earning margins on third party gas and power transactions, and by trading electricity and other energy commodities (i.e. fuels).  The origination and trading activities are focused on the existing asset and customer footprint of the Corporation.


The segment seeks to measure and manage a number of risks for the assets and for our trading books.  The key risk control activities of the Energy Marketing segment include the measurement and management of market, credit, operational, reputational, compliance, and legal risks.


The segment uses Value at Risk (“VaR”), Earnings at Risk (“EaR”), and tail risk measures to monitor and manage the risks within our asset and trading portfolios.  VaR and EaR measure the potential losses that could occur over a given time period due to changes in market risk factors.  Back tests are used to provide further sensitivities to the market risks with the portfolio.  Compliance, reputational, and legal risks are managed within our legal and compliance policies, and monitoring tools are used to flag compliance risks.  The Energy Marketing segment actively manages the risks within approved limits and our policies.


Competitive Environment


We are the largest generator of electricity in Alberta, measured by capacity, and also have a portfolio of generation assets in the Pacific Northwest and the western U.S. We also own and operate generating assets in British Columbia, Ontario, Québec, New Brunswick, the State of Wyoming, and Australia.


- 28 -


We expect electricity demand to grow as the economy improves.  In the long-term, most markets are expected to show growing demand for electricity; however, an increasing emphasis on efficiency may reduce future growth rates below historical levels.  In addition to increased demand, many of the markets in which we participate have established renewable portfolio targets or standards that require new renewable power investments.  As most forms of renewable generation also involve intermittent or uncertain levels and timing of production, higher levels of renewable generation may be accompanied by greater capacity requirements.  We believe that continued and growing demand for electricity, renewable portfolio standards, and the potential of increasing amounts of renewable generation to require additional capacity, may provide an opportunity to increase our generation capacity.


Alberta is Canada’s fourth largest province by population with approximately 4.1 million residents representing approximately 11.5 per cent of Canada’s total population.  Alberta consumed approximately 80,000 GWh of electricity in 2014, with a peak demand of 11,169 MW.  The AESO predicts load growth of approximately 3.7 per cent for 2015.  The aggregate installed capacity of grid-connected generating facilities in Alberta was approximately 16,150 MW as of December 31, 2014.


British Columbia is Canada’s third largest province by population with approximately 4.6 million residents, representing approximately 13 per cent of Canada’s total population.  In 2010, British Columbia passed the Clean Energy Act which seeks to develop realistic and achievable goals for conservation, energy efficiency and clean energy.  Under the Clean Energy Act, British Columbia is aiming to be self-sufficient by 2016 with at least 93 per cent of electricity generated from clean or renewable sources.  Currently, the majority of their electricity is obtained from their hydro system.  Due to new mining and oil and gas development, and liquefied natural gas terminals at coastal locations, British Columbia’s load profile is changing and is expected to require considerable new energy and capacity additions over the next 20 years.


Ontario is Canada’s largest province by population with approximately 13.7 million residents representing 38.5 per cent of Canada’s total population.  Ontario consumed 139,804 GWh of electricity in 2014.  The near term power demand outlook is expected to remain relatively unchanged from 2014 for Ontario, as the global economy continues to struggle combined with provincial conservation initiatives, downward pressure from embedded solar capacity growth, impacts from changing the Global Adjustment charge for large customers to be based on their peak demand, and time-of-use-rates.  The Ontario Independent Electricity System Operator shows 33,771 MW of grid-connected capacity in November 2014.


Québec is Canada’s second largest province by population with approximately 8.2 million residents, representing approximately 23.1 per cent of Canada’s total population. Quebec’s generation includes 35,829 MW of capacity owned by Hydro-Quebec, in addition to the Churchill Falls entitlement and independently owned facilities. Hydro-Quebec’s Sustainable Development Action plan from 2013 has goals including increasing hydro capacity by 910 MW by 2016 through the Romaine project, a 1,550 MW hydroelectric complex to be built on the Rivière Romaine, and achieving energy savings of 11 terrawatt hours by 2015.


New Brunswick is Canada’s eighth largest province by population with approximately 0.75 million residents, or 2.1 per cent of Canada’s total population. Peak demand was forecasted to be 3,100 MW in 2014 under the 2014 Integrated Resource Plan.  New Brunswick Power has an installed capacity of 3,513 MW, as well as 731 MW of wind and other resources through PPAs.  The government of New Brunswick has a renewable portfolio standard of 40 per cent by 2020 (including existing hydro). New Brunswick Power expects to add a small amount of renewable power (75 MW) by 2020 but does not forecast other generation additions in that time frame.


The WECC is the largest region geographically of the ten regions in the North American Electric Reliability Council and is divided into four sub regions. The sub region referred to as the Northwest Power Pool (“NWPP”) comprises British Columbia, Alberta, Washington, Oregon, Idaho, Montana, Utah, Western Wyoming and Northern Nevada. The NWPP forecasts peak demand reaching 68,500 MW in the winter of 2014/15, and a winter capacity of about 110,000 MW in the same time frame.


Wyoming is one of the smallest states by population, having a population of approximately 583,000. Average demand for electricity in 2012 was approximately 1,937 MW. The state is a significant power exporter, with direct connections to Utah and Idaho.  Wyoming has an excellent wind resource, and around 1,400 MW of wind has been developed, primarily to serve export markets as Wyoming does not currently have a renewable portfolio standard.


- 29 -


Australia has two separate electricity markets, the National Electricity Market and the Western Australia Electricity Market (“WAEM”), as well as two smaller vertically integrated utilities.  The WAEM, where our Australian assets are located, is comprised of the South West Interconnected System (“SWIS”) and the North West Interconnected System (“NWIS”), as well as 29 non-interconnected distribution systems. Overall, the installed capacity for public use in Western Australia is 6,453 MW. There are 917 MW of total renewables in the region, of which 469 are for public use and the remainder belongs to private generators. We own 300 MW of gas generation in the SWIS region and 125 MW of non-connected gas and diesel generation in the northern region.  In addition, we have a further 150 MW under development in the NWIS.


The Western Australia Department of Treasury expects that the state GDP growth will accelerate from 2.25 per cent in 2014/15 to 5 per cent by 2016/17.  Electricity demand growth is expected to be strong to support this growth, as the Chamber of Minerals and Energy of Western Australia estimate that the electricity growth rate will be 5.7 per cent per annum over the period to 2020. The majority of demand is expected to be met through self-generation (60 per cent or about 3,300 GWh annually), largely fuelled by natural gas.  Natural gas is also expected to displace diesel during this timeframe as infrastructure is developed.  We believe we have significant knowledge and expertise in the supply of gas-powered electricity to independent mining operations to compete in the market.


Competitive Strengths


We believe that we are well positioned to achieve our business strategy due to our competitive strengths, which include the following:


Operating strength – Our gas, wind and hydro fleet performance is above industry standards.  We have outperformed the average North American Energy Reliability Corporation Availability for gas-fired units for the time period 2007-2012. For wind farms greater than 50 MW in size, we have outperformed the benchmark over the period 2009-2013 based on the North American benchmark database of IHS Inc. The majority of our hydro operations have performed better than the 2013 Navigant Consulting benchmark average with some performing better than the first quartile for their respective size and age. We continue to strive to be leading performers in the operation of our facilities. In addition, Availability has been recognized at our Alberta coal facilities to be above NERC average for similar plants.


Stable cash flow base – Through the use of Alberta PPAs, long-term contracts, and other short-term physical and financial contracts, on average, approximately 70 per cent of our capacity is contracted over the next seven years.  The net revenue received under these contractual arrangements helps to minimize short-term revenue fluctuations due to the variable price of electricity.


Financial strength – We have investment grade ratings from Moody’s Investors Services, Inc. (“Moody’s”), Standard & Poor’s, a division of the McGraw Hill Companies, Inc. (“S&P”), Dominion Bond Rating Service Limited (“DBRS”) and Fitch Ratings Inc. (“Fitch”).


Fuel diversity – We have an interest in a diverse mix of fuels used for the generation of electricity, including coal, natural gas, hydro, and wind.  We believe that this mix reduces the impact on our performance in the event of external events affecting one fuel source.


Management team – Our management team has substantial industry, international, investment and market experience.


Energy Marketing expertise – We believe that our Energy Marketing segment has enhanced returns from our existing generation base and has allowed us to obtain more favourable pricing for uncommitted electricity, secure fuel supply on a cost-effective basis and fulfill electricity delivery obligations in the event of an outage.


Ownership or control of coal supply – We own, control or lease coal reserves in Alberta which provide a long-term and stable source of fuel for our thermal generation facilities in Alberta.  Our mines in Alberta contain some of the lowest sulphur coal in North America, averaging less than 0.25 per cent sulphur at the Highvale mine.  Coal with lower sulphur content emits less sulphur dioxide (“SO2”) when it is burned.


- 30 -


Wind Generation – Through our ownership interest in TransAlta Renewables, we are one of the largest owners and operators of wind generation in Canada.  Our management team has developed key relationships with customers, suppliers and policy makers that provide a competitive advantage in the development, operations and marketing of wind generation.


Environment – We are a recognized leader in sustainable development and we have taken early preventative action on a number of environmental fronts in advance of regulation.


Corporate Segment


Our Corporate Segment provides finance, tax, treasury, legal, regulatory, environmental, health and safety, sustainable development, corporate communications, government and investor relations, information technology, risk management, human resources, internal audit, and other administrative support.


For further information on TransAlta’s segment earnings and assets, please refer to Note 35 of our audited consolidated financial statements for the year ended December 31, 2014, which financial statements are incorporated by reference herein.  See “Documents Incorporated by Reference” herein.


ENVIRONMENTAL RISK MANAGEMENT


We are subject to federal, provincial, state and local environmental laws, regulations and guidelines concerning the generation and transmission of electrical and thermal energy and surface mining.  We are committed to complying with legislative and regulatory requirements and to minimizing the environmental impact of our operations.  We work with governments and the public to develop appropriate frameworks to protect the environment and to promote sustainable development.


Ongoing and Recently Passed Environmental Legislation


Changes in current environmental legislation do have, and will continue to have, an impact upon our operations and our business.


Alberta


The Specified Gas Emitters Regulation (“SGER”) regulating greenhouse gas (“GHG”) emissions in Alberta has been in effect since 2007. When first enacted, the SGER included a sunset clause whereby it would automatically expire on September 1, 2014. In July 2014, the Alberta Government extended the SGER for six months and then again extended it in December 2014 to now expire at the end of June 2015. Neither one of these extensions included any changes to the underlying regulation. It is anticipated that the Alberta Government will consult with stakeholders in early 2015 about potential changes to be made to the SGER.  TransAlta owns and operates facilities that are subject to the SGER and we anticipate being an active participant in Alberta Government’s consultations on potential changes to the SGER.


In Alberta there are requirements for coal-fired generation units to implement additional air emission controls for NOx and SO2, once they reach the end of their respective Alberta PPA, in most cases at 2020.  These regulatory requirements were developed by the province in 2004 as a result of multi-stakeholder discussions under Alberta’s Clean Air Strategic Alliance (“CASA”).  However, the release of the federal GHG regulations, which are discussed below, has created a misalignment between the CASA air pollutant requirements and schedules, and the GHG retirement schedules for older coal plants, which in themselves will result in significant reductions of NOx and SO2.  We are currently engaged unilaterally and with other stakeholders in reviewing these regulations to ensure coordination between GHG and air pollutant regulations, such that emission reduction objectives are achieved in the most effective manner while taking into consideration the reliability and cost of Alberta’s generation supply.


Ontario


On January 13, 2015, the Ontario Government announced its plan to put a price on carbon emissions in 2015, as part of its climate change program and stated objective of reducing greenhouse gas emissions by 15 per cent by 2020. 


- 31 -


No details are available yet.  Our contracts at gas facilities in the province generally include provisions protecting us from the adverse effects of changes in laws.


Canada


In September 2012, the Canadian federal government published the final regulations governing GHG emissions from coal-fired plants, which become effective on July 1, 2015.  The regulations provide for up to 50 years of life for coal units, at which point units must meet an emissions performance standard of approximately 420 tonnes per GWh.  There are some exceptions that require older units commissioned before 1975 to reach end of life by December 31, 2019, and units commissioned between 1975 and 1986 to reach end of life by December 31, 2029.  The regulations also provide flexibility for the substitution and deferral of emission reduction requirement between different units. The flexibility provisions are useful to TransAlta due to our large coal fleet.


United States


In June 2013, President Obama unveiled his “Climate Action Plan.”  The Plan directed the U.S. Environmental Protection Agency (“EPA”) to re-propose New Source Performance Standards (“NSPS”) for new power plants by September 2013 and also to propose limits for existing units by June 2014, finalizing them one year later.  The NSPS standards were subsequently proposed in September 2013 to require emissions performance similar to partial CCS controls.  The proposed standards received a significant amount of public comments and have not yet been finalized.  Further to the direction provided by President Obama, in June 2014 the U.S. EPA released the Clean Power Plan proposal which provides state specific guidelines for emission intensities to be achieved by existing power plants. The proposed rules are expected to be finalized by June 2015. Once finalized, the proposal required states to prepare state implementation plans by June 2016.  The Washington State EPA greenhouse gas standard for the electricity sector takes into consideration the planned shut-down of Centralia. We, therefore, do not expect the standard to materially impact our existing coal units at Centralia.


In December 2011, the EPA issued national standards for mercury emissions from power plants.  Existing sources will have up to four years to comply.  We have already voluntarily installed mercury capture technology at our Centralia Thermal plant, and began full capture operations in early 2012.  We have also installed additional technology to further reduce NOx, consistent with the Bill passed in 2011.


Effective January 2013, direct deliveries of power to the California Independent System Operator are subject to Cap and Trade Regulations established by the California Air Resource Board.  We continue to monitor our GHG inventory into California.


In addition to the Federal, Regional and State regulations that we must comply with, we also comply with the standards established by the North American Electric Reliability Corporation (“NERC”).  NERC is the electric reliability organization certified by FERC in the United States to establish and enforce reliability standards for the bulk-power system.  NERC develops and enforces reliability standards; assesses adequacy annually; monitors the bulk-power system; and educates, trains and certifies industry personnel.


Australia


In July, 2014, the Australian government repealed its national carbon tax regulating certain levels of CO2 emissions.


TransAlta Activities


Reducing the environmental impact of our activities has a benefit not only to our operations and financial results, but to the communities in which we operate.  We expect that increased scrutiny will be placed on environmental emissions and compliance.  We, therefore, take a proactive approach to minimizing risks to our results.  Our Board provides oversight to our environmental management programs and emission reduction initiatives in order to ensure continued compliance with environmental regulations.


- 32 -


Our environmental management programs encompass the following elements:


Renewable Power


We continue to invest in and build renewable power resources, primarily through TransAlta Renewables.  Our 68 MW New Richmond wind facility was commissioned in March 2013 and in December 2013 TransAlta acquired a 144 MW wind farm in Wyoming.  The Wyoming Wind Farm is fully operational and contracted under a long-term PPA until 2028 with an investment grade counterparty. The economic interest in the wind farm was subsequently acquired by TransAlta Renewables from a subsidiary of the Corporation in consideration for a payment equal to the original purchase price of the acquisition.  TransAlta believes that a larger renewable portfolio provides increased flexibility in generation and creates incremental environmental value through renewable energy certificates or through emission offsets. In addition, we have developed policies and procedures in order to comply with regulatory guidance and to lessen any environmental disruption caused by our renewable power resources, which includes monitoring noise and the avian impacts at our wind generation facilities.


Environmental Controls and Efficiency


We continue to make operational improvements and investments to our existing generating facilities to reduce the environmental impact of generating electricity.  We installed mercury control equipment at our Alberta thermal operations in 2010 in order to meet the Province’s 70 per cent reduction objectives. In 2013 and 2014, we tested the equipment to capture a certain amount of carbon at our Alberta coal operations. At our Centralia coal plant we have been achieving 70 per cent carbon capture since 2012 on a voluntary basis. Our new Keephills 3 plant began operation in September 2011 using supercritical combustion technology to maximize thermal efficiency, as well as SO2 capture and low NOx combustion technology, which is consistent with the technology that is currently in use at Genesee 3.  Uprate projects at our Keephills and Sundance plants are expected to improve the energy and emissions efficiency of those units.


The Alberta PPAs contain change-in-law provisions that allow us the opportunity to recover capital and operating compliance costs from our Alberta PPA buyers.


Policy Participation


We are active in policy discussions at a variety of levels of government.  These have allowed us to engage in proactive discussions with governments and industry participants to meet environmental requirements over the longer term.


Clean Combustion Technologies


We look to advance clean energy technologies through organizations such as the Canadian Clean Coal Power Coalition, which examines emerging new and retrofit clean combustion technologies such as gasification, oxygen combustion, biomass co-firing, and coal beneficiation.


Offsets Portfolio


TransAlta maintains a greenhouse gas emissions offset portfolio with a variety of instruments that can be used for compliance purposes or otherwise banked or sold.  We continue to examine additional emission offset opportunities that also allow us to meet emission targets at a competitive cost.  We ensure that any investments in offsets will meet certification criteria in the market in which they are to be used.


Environmental Regulations


Recent changes to environmental regulations may materially adversely affect us.  As indicated under “Risk Factors” in this AIF and within the Risk Management section of the Annual MD&A, many of our activities and properties are subject to environmental requirements, as well as changes in our liabilities under these requirements, which may have a material adverse effect upon our consolidated financial results.


- 33 -


RISK FACTORS


Readers should consider carefully the risk factors set forth below as well as the other information contained and incorporated by reference in this AIF.  For a further discussion of risk factors affecting TransAlta, please refer to “Risk Factors” in the Annual MD&A, which is incorporated by reference herein.


A reference herein to a material adverse effect on the Corporation means such an effect on the Corporation on its business, financial condition, results of operations, or its cash flows, as the context requires.


The operation and maintenance of our facilities involves risks that may materially and adversely affect our business.


The operation, maintenance, refurbishment, construction and expansion of power generation facilities involve risks, including breakdown or failure of equipment or processes, fuel interruption and performance below expected levels of output or efficiency.  Certain of our generation facilities, particularly in Alberta, were constructed many years ago and may require significant capital expenditures to maintain peak efficiency or to maintain operations.  There can be no assurance that our maintenance program will be able to detect potential failures in our facilities prior to occurrence or eliminate all adverse consequences in the event of failure.  In addition, weather related interference, work stoppages and other unforeseen problems may disrupt the operation and maintenance of our facilities and may materially adversely affect us.


We have entered into ongoing maintenance and service agreements with the manufacturers of certain critical equipment.  If a manufacturer is unable or unwilling to provide satisfactory maintenance or warranty support, we may have to enter into alternative arrangements with other providers if they cannot perform the maintenance themselves.  These arrangements could be more expensive to us than our current arrangements and this increased expense could have a material adverse effect on our business.  If we are unable to enter into satisfactory alternative arrangements, our inability to access technical expertise or parts could have a material adverse effect on us.


While we maintain an inventory of, or otherwise make arrangements to obtain, spare parts to replace critical equipment and maintain insurance for property damage to protect against certain operating risks, these protections may not be adequate to cover lost revenues or increased expenses and penalties which could result if we were unable to operate our generation facilities at a level necessary to comply with sales contracts (including the Alberta PPAs).


We may be subject to the risk that it is necessary to operate a plant at a capacity level beyond that which we have contracted for power in order to provide steam in fulfillment of such a contract.  In such circumstances, the costs to produce the steam being sold may exceed the revenues derived therefrom.


Equipment failure may cause us to suffer a material adverse effect.


There is a risk of equipment failure due to wear and tear, latent defect, design error or operator error, among other things, which could have a material adverse effect on our business.  Although our generation facilities have generally operated in accordance with expectations, there can be no assurance that they will continue to do so.  In addition, there can be no assurance that any applicable insurance coverage would be adequate to protect our business from material adverse effects.


We may fail to meet financial expectations.


Our quarterly revenue and results of operations are difficult to predict and fluctuate from quarter to quarter. Our quarterly results of operations are influenced by a number of factors, including the risks described in this AIF, many of which are outside of our control, which may cause such results to fall below market expectations.


Although we base our planned operating expenses in part on our expectations of future revenue, a significant portion of our expenses are relatively fixed in the short-term. If revenue for a particular quarter is lower than expected, we likely will be unable to proportionately reduce our operating expenses for that quarter, which will adversely affect our results of operations for that quarter.


- 34 -


We could be adversely affected by natural disasters or other catastrophic events.


Our generation facilities and their operations are exposed to potential damage and partial or complete loss, resulting from environmental disasters (e.g. floods, high winds, fires and earthquakes), equipment failures and other events beyond our control.  The occurrence of a significant event which disrupts the ability of the generation facilities to produce or sell power for an extended period, including events which preclude existing customers from purchasing electricity, could have a material adverse effect on us.  Our generation facilities could be exposed to effects of severe weather conditions, natural or man-made disasters and other potentially catastrophic events such as a major accident or incident at our sites.  In certain cases, there is the potential that some events may not excuse us from performing our obligations pursuant to agreements with third parties.  The fact that several of our generation facilities are located in remote areas may make access for repair of damage difficult.


Dam and dyke failures may result in lost generating capacity, increased maintenance and repair costs and other liabilities.


A natural or man-made disaster, and certain other events, including natural or induced seismic activity, could potentially cause dam failures at our hydroelectric facilities. The occurrence of dam or dyke failures at any of our hydroelectric or coal facilities could result in a loss of generating capacity, damage to the environment or damages and harm to third parties or the public, and such failures could require us to incur significant expenditures of capital and other resources or expose us to significant liabilities.  If such failures occur, we could be exposed to significant liability for damages.  There can be no assurance that our dam safety program will be able to detect potential dam failures prior to occurrence or eliminate all adverse consequences in the event of failure.  Other safety regulations could change from time to time, potentially impacting our costs and operations.  Reinforcing all dams or dykes to enable them to withstand more severe events could require us to incur significant expenditures of capital and other resources.  The consequences of dam failures could have a material adverse effect on us. 


We may be adversely affected if our supply of water is materially reduced.


Hydroelectric, natural gas and coal-fired plants require continuous water flow for their operation.  Shifts in weather or climate patterns, seasonable precipitation, the timing and rate of melting, run off, and other factors beyond our control, may reduce the water flow to our facilities.  Any material reduction in the water flow to our facilities would limit our ability to produce and market electricity from these facilities and could have a material adverse effect on us.  There is an increasing level of regulation respecting the use, treatment and discharge of water, and respecting the licensing of water rights in jurisdictions where we operate.  Any such change in regulations could have a material adverse effect on us.


Variation in wind levels may negatively impact the amount of electricity generated at our wind facilities.


Wind is naturally variable.  Therefore, the level of electricity produced from our wind facilities will also be variable.  In addition, the strength and consistency of the wind resource at our wind facilities may vary from what we anticipate due to a number of factors including: the extent to which our site-specific historic wind data and wind forecasts accurately reflects actual long-term wind speeds, strength and consistency; the potential impact of climatic factors; the accuracy of our assumptions relating to, among other things, weather, icing, degradation, site access, wake and wind shear line losses and wind shear; and the potential impact of topographical variations.


A reduced amount of wind at the location of one or more of our wind facilities over an extended period may reduce the production from such facilities, as well as any environmental attributes that accrue to us related to that production and reduce our revenues and profitability.


- 35 -


Changes in the price of electricity and availability of fuel supplies required to generate electricity may materially adversely affect our business.


A significant portion of our revenues are tied, either directly or indirectly, to the market price for electricity in the markets in which we operate.  Market electricity prices are impacted by a number of factors including: the strength of the economy, the available transmission capacity, the price of fuel that is used to generate electricity (and, accordingly, certain of the factors that affect the price of fuel described below); the management of generation and the amount of excess generating capacity relative to load in a particular market; the cost of controlling emissions of pollution, including potentially the cost of carbon; the structure of the particular market; and weather conditions that impact electrical load.  As a result, we cannot accurately predict future electricity prices and electricity price volatility could have a material adverse effect on us.


We buy natural gas and a portion of our coal to supply the fuel needed to generate electricity.  We could be materially adversely affected if the cost of fuel that we must buy to generate electricity increases to a greater degree than the price that we can obtain for the electricity that we sell.  Several factors affect the price of fuel, many of which are beyond our control, including:


·                                          prevailing market prices for fuel;


·                                          global demand for energy products;


·                                          the cost of carbon and other environmental concerns;


·                                          weather-related disruptions affecting the ability to deliver fuels or near-term demand for fuels;


·                                          increases in the supply of energy products in the wholesale power markets;


·                                          the extent of fuel transportation capacity or cost of fuel transportation service into our markets; and


·                                          the cost of mining that, in turn, depends on various factors such as labour market pressures, equipment replacement costs and permitting.


Changes in any of these factors may increase our cost of producing power or decrease the amount of revenue received from the sale of power, which could have a material adverse effect on us.


Disruption of fuel supply to certain of our thermal plants could have an adverse impact on our financial condition.


Certain of our thermal facilities depend on third parties to supply fuel, including natural gas and coal.  As a result, we face the risks of supply interruptions and fuel price volatility, as fuel deliveries may not exactly match those required for energy sales, due in part to our need to pre-purchase fuel inventories for reliability and dispatch requirements. Disruption of transportation services of fuel, whether because of weather-related problems, strikes, lock-outs, break-downs of locks and dams or other events could impair our ability to generate electricity and could adversely affect our results of operations.  Significantly, the coal used to fuel the Centralia Thermal facility is now sourced from the Powder River Basin in Montana and Wyoming and we have entered into contracts to purchase and transport such coal to our Centralia Thermal facility.  Our existing coal contracts for the Centralia Thermal plant expire between 2015 and 2025.  The loss of our suppliers or our inability to renew our existing coal contracts for Powder River Basin coal at favourable terms could also significantly affect our ability to serve our customers and have an adverse impact on our financial condition and results of operations.


Changes in general economic conditions may have a material adverse effect on us.


Adverse changes in general economic and market conditions and, more specifically, in the markets in which we operate could negatively impact demand for electricity, revenue, operating costs, timing and extent of capital expenditures, the net recoverable value of plant, property and


- 36 -


equipment, results of financing efforts, credit risk and counterparty risk, which could cause us to suffer a material adverse effect.  Changes in interest rates can impact our borrowing costs and the capacity revenues that we receive pursuant to the Alberta PPAs.


There are risks associated with our Alberta PPAs.


Under the government-mandated Alberta PPAs, pursuant to which we operate most of our thermal and hydroelectric facilities in Alberta, we are subject to certain risks, including the possibilities of penalties for unplanned outages and the burden of increased costs required to maintain and operate our generation facilities.


The Alberta PPAs establish committed capacity and Availability targets to be achieved by each coal-fired plant, energy and ancillary services obligations for the hydroelectric plants, and compensation for meeting the Alberta PPA obligations.  Under the Alberta PPAs applicable to coal-fired plants, in the event of an unplanned outage other than an outage determined to be caused by force majeure, we must pay a penalty for the lost production based upon a price equal to the 30 day trailing average of Alberta market electricity prices.  Consequently, an unplanned outage could have a material adverse effect on us.


We bear some of the impact of increases in our operating costs (other than increases arising as a result of a “change of law” as such term is defined in the Alberta PPAs) because the price which we are able to receive for our capacity under the Alberta PPAs is based on a schedule of forecast fixed costs.  Many of the forecast costs will be determined by indices, formulae or other means for the entire term of the Alberta PPAs.  Our actual results will vary from the forecasts on which the Alberta PPAs are based.  Operating costs could increase as a result of a number of factors which are beyond our control.  A significant increase in our operating costs could have a material adverse effect on our business. In addition, there can be no assurance that we will realize sufficient returns under the Alberta PPAs to cover the capital costs we are required to invest under such PPAs.


From time to time during the term of the Alberta PPAs, issues may arise regarding the intended operation of the Alberta PPAs which may require certain provisions of the Alberta PPAs to be interpreted, and the interpretations given may not be in our favour.  In such circumstances, we could be materially and adversely affected.


The market price for our common shares may be volatile.


The market price for our common shares may be volatile and subject to wide fluctuations in response to numerous factors, many of which are beyond our control, including the following: (a) actual or anticipated fluctuations in our results of operations; (b) recommendations by securities research analysts; (c) changes in the economic performance or market valuations of other companies that investors deem comparable; (d) the loss or resignation of executive officers and other key personnel; (e) sales or perceived sales of additional common shares; (f) significant acquisitions or business combinations, strategic partnerships, joint ventures or capital commitments by or involving our or our competitors which prove to be ill considered; and (g) trends, concerns, technological or competitive developments, regulatory changes and other related issues in the renewable power generation industry or our target markets.


Financial markets have experienced significant price and volume fluctuations in recent years that have particularly affected the market prices of equity securities of companies and such fluctuations have, in many cases, been unrelated to the operating performance, underlying asset values or prospects of such companies.  Accordingly, the market price of our common shares may decline even if our operating results, underlying asset values or prospects have not changed.  Additionally, these factors, as well as other related factors, may cause decreases in asset values which may result in impairment losses.  Certain institutional investors may base their investment decisions on consideration of our environmental, governance and social practices and performance against such institutions’ respective investment guidelines and criteria, and failure to meet such criteria may result in a limited or no investment in our common shares by those institutions, which could adversely affect the trading price of our common shares.


Our cash dividend payments are not guaranteed.


The payment of dividends under our dividend policy is not guaranteed and could fluctuate.  The Board has the discretion to determine the amount of dividends to be declared and paid to shareholders.  We may alter our dividend policy at any time and the payment of dividends will depend on, among other things, results of operations; financial


- 37 -


condition; current and expected future levels of earnings; operating cash flow; liquidity requirements; market opportunities; income taxes; maintenance and growth capital expenditures; debt repayments; legal, regulatory and contractual constraints; working capital requirements; tax laws and other relevant factors.  Our short and long-term borrowings may prohibit us from paying dividends at any time at which a default or event of default would exist under such debt, or if a default or event of default would exist as a result of paying the dividend.


Over time, our capital and other cash needs may change significantly from our current needs, which could affect whether we pay dividends and the amount of any dividends we may pay in the future.  If we continue to pay dividends at the current level, we may not retain a sufficient amount of cash to finance growth opportunities, meet any large unanticipated liquidity requirements or fund our operations in the event of a significant business downturn.  The Board, subject to the requirements of our bylaws and other governance documents, may amend, revoke or suspend our dividend policy at any time.  A decline in the market price or liquidity, or both, of our common shares could result if the Board establishes large reserves that reduce the amount of quarterly dividends paid or if we reduce or eliminate the payment of dividends.


We will be dependent on the operations of our facilities for our cash availability.  The actual amount of cash available for dividends to holders of our common shares will depend upon numerous factors relating to each of our generation facilities including: operating performance of our generation facilities, profitability, changes in revenues, fluctuations in working capital, capital expenditure levels, applicable laws, compliance with contracts and contractual restrictions contained in the instruments governing any indebtedness.  Any reduction in the amount of cash available for distribution from our generation facilities will reduce the amount of cash available to pay dividends to holders of our common shares.


We operate in a highly competitive environment and may not be able to compete successfully.


We operate in a number of Canadian provinces, as well as in the United States and Australia.  These areas of operation are affected by competition ranging from large utilities to small independent power producers, as well as private equity and international conglomerates.  Some competitors have significantly greater financial and other resources than we do.  Competitive harm could have a material adverse effect on our business.


We could suffer lost revenues or increased expenses and penalties if we are unable to operate our generation facilities at a level necessary to comply with our PPAs.


The ability of our facilities to generate the maximum amount of power which can be sold under PPAs is an important determinant of our revenues.  Under certain PPAs, if the facility is made available less than the required Availability in a given contract year, penalty payments may be payable to the relevant purchaser by us.  The payment of any such penalties could adversely affect our revenues and profitability.


Our revenues may be reduced upon expiration or termination of PPAs.


We sell power under PPAs that expire at various times.  In addition, these PPAs may be subject to termination in certain circumstances, including default by the facility or plant owner or operator.  When a PPA expires or is terminated, it is possible that the price received by the relevant facility or plant for power under subsequent selling arrangements may be reduced significantly.  It is also possible that PPAs negotiated after the initial PPAs have run their course may not be available at prices that permit the continued operation of the affected facility or plant on a profitable basis.  If this occurs, the affected facility or plant may be forced to permanently cease operations.


Variations in weather can affect demand for electricity and our ability to generate electricity.


Due to the nature of our business, our earnings are sensitive to weather variations from period to period.  Variations in winter weather affect the demand for electrical heating requirements.  Variations in summer weather affect the demand for electrical cooling requirements.  These variations in demand translate into spot market price volatility.  Variations in precipitation also affect water supplies, which in turn affect our hydroelectric assets.


- 38 -


Ice can accumulate on wind turbine blades in the winter months.  The accumulation of ice on wind turbine blades depends on a number of factors, including temperature, and ambient humidity.  The accumulation of ice on wind turbine blades can have a significant impact on energy yields, and could result in the wind turbine experiencing more down time. Extreme cold temperatures can also impact the ability of wind turbines to operate effectively and this could result in more downtime and reduced production.


We may be unsuccessful in the defence of legal actions.


We are occasionally named as a defendant in claims and legal actions and as a party in commercial disputes which are resolved by arbitration.  There can be no assurance that we will be successful in the defence of these claims and legal actions or that any claim or legal action that is decided adverse to us will not materially and adversely affect us.


The laws and regulations in the various markets in which we operate are subject to change, which may materially adversely affect us.


Certain of the markets in which we operate and intend to operate are subject to significant regulatory oversight and control.  We are not able to predict whether there will be any further changes in the regulatory environment, including potential regulation of the rates allowed to be charged and the capital structure of wholesale generating companies such as ours, changes in market structure or market design or what the ultimate effect of a changing regulatory environment will have on our business.  Existing market rules, regulations and reliability standards are often dynamic and may be revised or reinterpreted, and new laws and regulations may be adopted or become applicable to us or our facilities, which could have a material adverse effect on us.


We manage these risks systematically through a regulatory and compliance program designed to reduce any potential negative impact on us.  However, we cannot guarantee that we will be able to adapt our business in a timely manner in response to any changes in the regulatory regimes in which we operate, and such failure to adapt could have a material adverse effect on our business.


Regulatory authorities may also from time to time audit or investigate our activities in the markets in which we operate or pursue trading.  Such audits or investigations may result in sanctions or penalties which may materially affect our future activities, our reputation or our financial status.


Our facilities are also subject to various licensing and permitting requirements in the jurisdictions in which we operate.  Many of these licenses and permits need to be renewed from time to time.  If we are unsuccessful in renewing such licenses or permits, or the terms of such licenses or permits are changed in a manner that is adverse to our business, we could be materially adversely affected.


Any changes in the rules and regulations of provincial or state public utility commissions or other regulatory bodies in the other markets in which we compete or may compete in the future may materially adversely affect us.


Our business could be materially affected by greater regulation of over-the-counter derivatives, which could affect our ability to economically hedge our generation.


Title VII of the Dodd-Frank Act, as well as comparable Canadian rulemaking that is expected to be implemented in the near term, increases the regulation of transactions involving over-the-counter (“OTC”) derivative financial instruments, including the requirement for central clearing of many OTC derivatives transactions.  The effect of these derivative reforms on our business depends on pending rulemaking proceedings.  Regulatory change could adversely affect our ability to economically hedge our generation, by reducing liquidity in the energy markets and, if we are required to clear such transactions on exchanges or meet other requirements, by significantly increasing the collateral costs associated with these activities.  It is not known at this time whether, and, if so, to what extent, we will be required to provide collateral (for both our cleared and uncleared transactions) in excess of what we currently provide under our existing hedge relationships.  Other features of derivative regulation which will have an impact on our energy trading and treasury activities include trade reporting, position limits and new trade execution


- 39 -


requirements.  Rulemaking and implementation will take effect over several years, which makes it difficult to assess its full impact on us at this time.


Many of our activities and properties are subject to environmental requirements and changes in, or liabilities under these requirements, may materially adversely affect our business.


Our operations in three countries are subject to federal, provincial, state and local environmental laws, regulations and guidelines, relating to the generation and transmission of electrical and thermal energy and surface mining, pertaining to pollution and protection of the environment, health and safety and governing among other things, air emissions, water usage and discharges, storage, treatment and disposal of waste and other materials and remediation of sites and land use responsibility (collectively, “environmental regulation”).  These laws can impose liability for costs to investigate and remediate contamination without regard to fault and under certain circumstances liability may be joint and several, resulting in one responsible party being held responsible for the entire obligation.  Environmental regulation can also impose, among other things, restrictions, liabilities and obligations in connection with the generation, handling, use, storage, transport, treatment and disposal of hazardous substances and waste and can impose clean up, disclosure or other responsibilities with respect to spills, releases and emissions of various substances to the environment.  Environmental regulation can also require that facilities and other properties associated with our operations be operated, maintained, abandoned and reclaimed to the satisfaction of applicable regulatory authorities.  In addition, there is an increasing level of environmental regulation regarding the use, treatment and discharge of water and we anticipate the adoption of new or additional emission regulations at a national level in Canada, the United States and Australia, which may impose different compliance requirements standards on our business.  These various compliance standards may result in additional cost requirements for our business or may impact our ability to operate our facilities.


To comply with environmental regulations, we must incur material capital and operating expenditures relating to environmental monitoring, emissions and effluent control equipment and processes; emissions measurement, verification and reporting; emissions fees and other compliance activities or obligations.  We expect to continue to have environmental expenditures in the future.  Stricter standards, new or greater regulation, increased enforcement by regulatory authorities, more extensive permitting requirements, an increase in the number and types of assets operated by the Corporation subject to environmental regulation and the implementation of provincial, state and national GHG emissions, mercury emissions or other air emissions regulation which in themselves may not be aligned and may imposed varying obligations on us in the jurisdictions in which we operate and which could increase the amount of our expenditures.  To the extent these expenditures cannot be passed through to our customers under our power purchase agreements, including Alberta PPAs or otherwise, our costs could be material.  In addition, compliance with environmental regulation might result in restrictions on some of our operations.  If we do not comply with environmental regulation, regulatory agencies could seek to impose statutory, administrative and/or criminal liabilities on us or curtail our operations and significant expenditures on compliance, new equipment or technology, reporting obligations and research and development.


In addition to environmental regulation, we could also face civil liability in the event that private parties seek to impose liability on us for property damage, personal injury or other costs and losses.  We cannot guarantee that lawsuits or administrative or investigative actions will not be commenced against us and otherwise affect our operations and assets.  If an action is filed against us or which may otherwise affect our operations and assets, we could be required to make substantial expenditures to defend or evidence our activities or to bring our Corporation, our operations and assets into compliance, which could have a material adverse effect on our business.


A number of recent federal, provincial, state and local regulatory efforts continue to focus on potential climate change or GHG emissions regulation, and mandatory GHG reporting requirements have become effective in both Canada and the United States.  Mandatory GHG emissions reductions requirements are expected to impose increased costs on our business, as is expected to be the case generally for thermal power producers in North America.  We are subject to other air quality regulations including mercury regulations.  To the extent new or additional GHG, mercury or other air emission regulations may require us to incur costs that cannot be passed through to our customers under its power purchase agreements, including Alberta PPAs or otherwise, the costs could be material and have a material adverse effect on our business. In terms of TransAlta’s existing gas-fired facilities, we currently have change-in-law provisions allowing flow-through of carbon tax-related costs, and we expect that any new contracts will contain similar provisions.


- 40 -


Our surface mining operations are subject to laws and regulations establishing mining, environmental protection and reclamation standards for all aspects of surface mining.  As a mine owner or operator, we must obtain permits from the applicable regulatory body providing for the authorization of certain mining operations that result in a disturbance of the surface.  These requirements seek to limit the adverse impacts of coal mining and more restrictive requirements may be adopted from time to time.  As a mine owner or operator, we may also be required to submit a bond or otherwise secure payment of certain long-term obligations including mine closure or reclamations costs.  Surety bond costs have increased in recent years while the market terms of such bonds have generally become more unfavourable.  In addition, the number of companies willing to issue surety bonds has decreased.  We could be required to self-fund these obligations should we be unable to renew or secure the required surety bonds for our mining operations or because it is more economical to do so.


Changes in opinions of our Corporation from external parties may have a material adverse effect on us.


Reputation risk relates to the risk associated with our business because of changes in opinion from the general public, private stakeholders, governments, and other entities.  Our reputation is one of our most valued assets.  The potential for harming our reputation exists in every business decision and all risks can have an impact on reputation, which in turn can negatively impact our business and securities. Reputational risk cannot be managed in isolation from other forms of risk. Negative impacts from a compromised reputation could include revenue loss, reduction in customer base, and decreased value of our securities.


We depend on certain partners that may have interests or objectives which conflict with our objectives and such differences could have a negative impact on us.


We have entered into various types of arrangements with communities or joint venture partners for the operation of our facilities.  Certain of these partners may have or develop interests or objectives which are different from or even in conflict with our objectives.  Any such differences could have a negative impact on the success of our facilities.  We are sometimes required through the permitting and approval process to notify and consult with various stakeholder groups, including landowners, First Nations and municipalities.  Any unforeseen delays in this process may negatively impact our ability to complete any given facility on time or at all.


We are dependent on access to parts and equipment from certain key suppliers and we may be adversely affected if these relationships are not maintained.


Our ability to compete and expand will be dependent on having access, at a reasonable cost, to equipment, parts and components which are technologically and economically competitive with those utilized by our competitors.  Although we have individual framework agreements with various suppliers, there can be no assurance that these relationships with suppliers will be maintained.  If they are not maintained, our ability to compete may be impaired due to lack of access to these sources of equipment, parts or components.


Our information technology systems are vulnerable to damages from computer viruses, natural disasters, unauthorized access, cyber-attack and other similar disruptions, all of which could have a material adverse effect on our business.


We rely on technology, mainly on computer, telephone, satellite, cellular and related networks and infrastructure, to conduct our business and monitor the production of our generation facilities.  These systems and infrastructure could be vulnerable to unforeseen problems, including, but not limited to vandalism and theft.  We have put in place a number of systems, processes and practices designed to protect against intentional or unintentional misappropriation or corruption of our systems and information or disruption of our operations. Despite our implementation of security measures, our information technology systems are vulnerable to damages from computer viruses, natural disasters, unauthorized access, cyber-attack and other similar disruptions.


Any damage or failure that causes an interruption in operations could have an adverse effect on our customers.  Additionally, we protect our generation facility infrastructure against physical damage, security breaches and service disruption from any of a variety of causes.  Theft, vandalism, and other disruptions could jeopardize the security of information stored in and transmitted through our systems and network infrastructure, and could result in significant


- 41 -


set-backs, potential liabilities, and deter future customers.  While we have systems, policies, hardware, practices, and procedures designed to prevent or limit the effect of the failure, interruptions or security breaches of our generation facility and infrastructure, there can be no assurance that these measures will be sufficient and that such failures, interruptions or security breaches will not occur or, if they do occur, that they will be adequately addressed in a timely manner.  We closely monitor both preventive and detective measures to manage these risks.


Our facilities rely on national and regional transmission systems and related facilities that are owned and operated by third parties and have both regulatory and physical constraints that could impede access to electricity markets.


Our power generation facilities depend on electric transmission systems and related facilities owned and operated primarily by third parties to deliver the electricity that we generate to delivery points where ownership changes and we are paid.  These grids operate with both regulatory and physical constraints which in certain circumstances may impede access to electricity markets.  There may be instances in system emergencies in which our power generation facilities are physically disconnected from the power grid, or our production curtailed, for short periods of time.  Most of our electricity sales contracts do not provide for payments to be made if electricity is not delivered.


Our power generation facilities may also be subject to changes in regulations governing the cost and characteristics of use of the transmission and distribution systems to which our power generation facilities are connected.  Our power generation facilities in the future may not be able to secure access to this interconnection or transmission capacity at reasonable prices, in a timely fashion or at all, which could then cause delays and additional costs in attempting to negotiate or renegotiate PPAs or to construct new projects.  In addition, we may not benefit from preferential arrangements in the future.  Any such increased costs and delays could delay the commercial operation dates of any new projects and negatively impact our revenues and financial condition.


Trading risks may have a material adverse effect on our business.


Our trading and marketing business frequently involves the establishment of trading positions in the wholesale energy markets on both a medium-term and short-term basis.  To the extent that we have long positions in the energy markets, a downturn in market prices will result in losses from a decline in the value of such long positions.  Conversely, to the extent that we enter into forward sales contracts to deliver energy that we do not own, or take short positions in the energy markets, an upturn in market prices will expose us to losses as we attempt to cover any short positions by acquiring energy in a rising market.


In addition, from time to time, we may have a trading strategy consisting of simultaneously holding a long position and a short position, from which we expect to earn a profit based on changes in the relative value of the two positions.  If, however, the relative value of the two positions changes in a direction or manner that we did not anticipate, we would realize losses from such a paired position.


If the strategy that we use to hedge our exposures to these various risks is not effective, we could incur significant losses.  Our trading positions can be impacted by volatility in the energy markets that, in turn, depend on various factors, including weather in various geographical areas and short-term supply and demand imbalances, which cannot be predicted with any certainty.  A shift in the energy markets could adversely affect our positions which could also have a material adverse effect on our business.


We use a number of risk management controls conducted by our independent Risk Management group in order to limit our exposure to risks arising from our trading activities.  These controls include risk capital limits, VaR, EaR, tail risk scenarios, position limits, concentration limits, credit limits, and approved product controls.  We cannot guarantee that losses will not occur and such losses may be outside the parameters of our risk controls.


Because of our multinational operations, we are subject to currency rate risk and regulatory and political risk.


We have exposure to various currencies as a result of our investments and operations in foreign jurisdictions, the earnings from those operations, the acquisition of equipment and services from foreign suppliers, and our U.S. denominated debt.  Our exposures are primarily to the U.S. and Australian currencies.  Changes in the values


- 42 -


of these currencies relative to the Canadian dollar could negatively impact our earnings or the value of our foreign investments.  While we attempt to manage this risk through the use of hedging instruments, including cross-currency interest rate swaps, forward exchange contracts and matching revenues and expenses by currency at the Corporate level, there can be no assurance that these risk management efforts will be effective, and fluctuations in these exchange rates may have a material adverse effect on our business.


In addition to currency rate risk, our foreign operations may be subject to regulatory and political risk.  Any change to the regulations governing power generation or the political climate in the countries where we have operations could impose additional costs and have a material adverse effect on us.


We may have difficulty raising needed capital in the future, which could significantly harm our business.


To the extent that our sources of cash and cash flow from operations are insufficient to fund our activities, we may need to raise additional funds.  Additional financing may not be available when needed, and if such financing is available, it may not be available on terms that are favourable to our business.


Recovery of the capital investment in power projects generally occurs over a long period of time.  As a result, we must obtain funds from equity or debt financings, including tax equity transactions, or from government grants, to help finance the acquisition of projects and to help pay the general and administrative costs of operating our business.  Our ability to arrange financing, either at the corporate level or at the subsidiary level (including non-recourse project debt), and the costs of such capital are dependent on numerous factors, including: (a) general economic and capital market conditions; (b) credit availability from banks and other financial institutions; (c) investor confidence and the markets in which we conduct operations; (d) our financial performance; (e) our level of indebtedness and compliance with covenants in our debt agreements; and (f) our cash flow.


An increase in interest rates or a reduction in the availability of project debt financing could reduce the number of projects that we are able to finance.  If we are unable to raise additional funds when needed, we could be required to delay acquisition and construction of projects, reduce the scope of projects, abandon or sell some or all of our projects or generation facilities, or default on our contractual commitments in the future, any of which could adversely affect our business, financial condition and results of operations.


Our debt securities will be structurally subordinated to any debt of our subsidiaries that are currently outstanding or may be incurred in the future.


We operate our business through, and a majority of our assets are held by, our subsidiaries, including partnerships.  Our results of operations and ability to service indebtedness are dependent upon the results of operations of our subsidiaries and the payment of funds by these subsidiaries to TransAlta in the form of loans, dividends or otherwise.  Our subsidiaries will not have an obligation to pay amounts due, or make any funds available for payment of, debt securities issued by TransAlta, whether by dividends, interests, loans, advances or other payments.  In addition, the payment of dividends and the making of loans, advances and other payments to us by our subsidiaries may be subject to statutory or contractual restrictions.


In the event of the liquidation of any subsidiary, the assets of the subsidiary would be used first to repay the indebtedness of the subsidiary, including trade payables or obligations under any guarantees, prior to being used to pay TransAlta’s indebtedness, including any debt securities issued by TransAlta.  Such indebtedness and any other future indebtedness of such subsidiaries would be structurally senior for such subsidiary to any debt securities issued by TransAlta.


Our subsidiaries have financed some investments using non-recourse project financing.  Each non-recourse project loan is structured to be repaid out of cash flow provided by the investment.  In the event of a default under a financing agreement which is not cured, the lenders would generally have rights to the related assets.  In the event of foreclosure after a default, our subsidiary may lose its equity in the asset or may not be entitled to any cash that the asset may generate.  Although a default under a project loan will not cause a default with respect to any debt securities issued by TransAlta, it may materially affect our ability to service our outstanding indebtedness.


- 43 -


A downgrade of our credit ratings could materially and adversely affect us.


Rating agencies regularly evaluate us, basing their ratings of our long-term and short-term debt on a number of factors. There can be no assurance that one or more of our credit ratings and the corresponding outlook will not be changed.  Our borrowing costs and ability to raise funds are directly impacted by our credit ratings. Credit ratings may be important to suppliers or counterparties when they seek to engage in certain transactions with us. A credit rating downgrade could potentially impair our ability to enter into arrangements with suppliers or counterparties, to engage in certain transactions, and could limit our access to private and public credit markets and increase the costs of borrowing under our existing credit facilities.  A credit rating downgrade could require us to post a material amount of new collateral to our counterparties. For further information on posting collateral in the event of a credit downgrade, please see Note 14 section C. III of our audited consolidated financial statements for the year ended December 31, 2014, which financial statements are incorporated by reference herein.  Please also see “Documents Incorporated by Reference.


Changes in statutory or contractual restrictions that affect our corporate structure may have a material adverse effect on us.


We conduct a significant amount of business through subsidiaries and partnerships.  Our ability to meet and service debt obligations is dependent upon the results of operations of our subsidiaries and the payment of funds by our subsidiaries in the form of distributions, loans, dividends, or otherwise. In addition, our subsidiaries may be subject to statutory or contractual restrictions that limit their ability to distribute cash to us.


The power generation industry has certain inherent risks related to worker health and safety and the environment that could cause us to suffer unanticipated expenditures or to incur fines, penalties or other consequences material to its business and operations.


The ownership and operation of our power generation assets carry an inherent risk of liability related to worker health and safety and the environment, including the risk of government imposed orders to remedy unsafe conditions and/or to remediate or otherwise address environmental contamination, potential penalties for contravention of health, safety and environmental laws, licenses, permits and other approvals, and potential civil liability.  Compliance with health, safety and environmental laws (and any future changes) and the requirements of licenses, permits and other approvals are expected to remain material to our business.  The occurrence of any of these events or any changes, additions to or more rigorous enforcement of, health, safety and environmental laws, licenses, permits or other approvals could have a significant impact on our operations and/or result in additional material expenditures.  As a consequence, no assurances can be given that additional environmental and workers’ health and safety issues relating to presently known or unknown matters will not require unanticipated expenditures, or result in fines, penalties or other consequences (including changes to operations) material to our business and operations.


Certain of the contracts to which we are a party require that we provide collateral against our obligations.


We are exposed to risk under certain electricity and natural gas purchase and sale contracts entered into for the purposes of hedges and proprietary trading.  The terms and conditions of these contracts require us to provide collateral when the fair value of these contracts is in excess of any credit limits granted by our counterparties and the contract obliges that we provide the collateral.  The change in fair value of these contracts occurs due to changes in commodity prices.  These contracts include: (i) purchase agreements, when forward commodity prices are less than contracted prices; and (ii) sales agreements, when forward commodity prices exceed contracted prices.  Downgrades in our creditworthiness by certain credit rating agencies may decrease the credit limits granted by our counterparties and accordingly increase the amount of collateral that we may have to provide, which could materially adversely affect us.


If counterparties to our contracts are unable to meet their obligations, we may be materially and adversely affected.


If purchasers of our electricity and steam or other contractual counterparties default on their obligations, we may be materially and adversely affected.  While we have procedures and controls in place to manage our counterparty


- 44 -


credit risk prior to entering into contracts, all contracts inherently contain default risk.  Moreover, while we seek to monitor trading activities to ensure that the credit limits for counterparties are not exceeded, we cannot guarantee that a party will not default.  If counterparties to our contracts are unable to meet their obligations, we could suffer a reduction in revenue which could have a material adverse effect on our business.


We are not able to insure against all potential risks and may become subject to higher insurance premiums.


Our business is exposed to the risks inherent in the construction and operation of electricity generation facilities, such as breakdowns, manufacturing defects, natural disasters, theft, terrorist attacks and sabotage.  We are also exposed to environmental risks.  We maintain insurance policies, covering usual and customary risks associated with our business, with credit worthy insurance carriers.  Our insurance policies, however, do not cover losses as a result of force majeure, natural disasters, terrorist attacks or sabotage, among other things.  In addition, we generally do not maintain insurance for certain environmental risks, such as environmental contamination.  Our insurance policies are subject to annual review by the respective insurers and may not be renewed at all or on similar or favourable terms.  A significant uninsured loss or a loss significantly exceeding the limits of our insurance policies or the failure to renew such insurance policies on similar or favourable terms could have a material adverse effect on our business, financial condition and results of operations.


Our insurance coverage may not be available in the future on commercially reasonable terms or adequate insurance limits may not be available in the market.  In addition, the insurance proceeds received for any loss or damage to any of our generation facilities may not be sufficient to permit us to continue to make payments on our debt.


Provision for income taxes may not be sufficient.


Our operations are complex, and the computation of the provision for income taxes involves tax interpretations, regulations, and legislation that are continually changing.  In addition, our tax filings are subject to audit by taxation authorities.  While we believe that our tax filings have been made in material compliance with all applicable tax interpretations, regulations, and legislation, we cannot guarantee that we will not have disagreements with taxation authorities with respect to our tax filings that could have a material adverse effect on our business.


If we fail to attract and retain key personnel, we could be materially adversely affected.


The loss of any of our key personnel or our inability to attract, train, retain and motivate additional qualified management and other personnel could have a material adverse effect on our business.  Competition for these personnel is intense and there can be no assurance that we will be successful in this regard.


If we are unable to successfully negotiate new collective bargaining agreements with our unionized workforce, as required from time to time, we will be adversely affected.


While we believe we have a satisfactory relationship with our unionized employees, we cannot guarantee that we will be able to successfully negotiate or renegotiate our collective bargaining agreements on terms agreeable to TransAlta.  We expect to re-negotiate three collective bargaining agreements, involving 115 of our employees, in 2015 and seven collective bargaining agreements representing a total of 691 employees in 2016. Any problems in negotiating these collective bargaining agreements could lead to higher employee costs and a work stoppage or strike, which could have a material adverse effect on us.


Risks relating to TransAlta’s development projects and acquisitions may materially and adversely affect us.


Development projects and acquisitions that we undertake may be subject to execution and capital cost risks, including, but not limited to, risks relating to regulatory approvals, third party opposition, cost escalations, construction delays, shortages of raw materials or skilled labour and capital constraints.  The occurrences of these risks could have a material and adverse impact on us, our financial condition, results of operations and cash flows.


Expansion of our business through development projects and acquisitions may place increased demands on our management, operating systems, internal controls and financial and physical resources.  In addition, the process of


- 45 -


integrating acquired businesses or development projects may involve unforeseen difficulties.  Failure to successfully manage or integrate any acquired businesses or development projects could have a material adverse impact on us, our financial condition, results of operations and cash flows.  Further, we cannot make assurances that we will be successful in integrating any acquisition or that the commercial opportunities or operational synergies of any acquisition will be realized as expected.


We may pursue acquisitions in new markets that are subject to regulation by various foreign governments and regulatory authorities and to the application of foreign laws.  Such foreign laws or regulations may not provide for the same type of legal certainty and rights, in connection with our contractual relationships in such countries, as are afforded to us currently, which may adversely affect our ability to receive revenues or enforce our rights in connection with any such foreign operations.  In addition, the laws and regulations of some countries may limit our ability to hold a majority interest in some of the projects that we may acquire, thus limiting our ability to control the operation of such projects.  Any existing or new operations may also be subject to significant political, economic and financial risks, which vary by country, and may include: (a) changes in government policies or personnel; (b) changes in general economic conditions; (c) restrictions on currency transfer or convertibility; (d) changes in labour relations; (e) political instability and civil unrest; (f) regulatory or other changes in the local electricity market; and (g) breach or repudiation of important contractual undertakings by governmental entities and expropriation and confiscation of assets and facilities for less than fair market value.


With respect to acquisitions, we cannot make assurances that we will identify suitable transactions or that we will have access to sufficient resources, through our credit facilities, the capital markets or otherwise, to pursue and complete any identified acquisition opportunities on a timely basis and at a reasonable cost.  Any acquisition that we propose or complete would be subject to normal commercial risks that the transaction may not be completed on the terms negotiated, on time, or at all.  An unavoidable level of risk remains regarding potential undisclosed or unknown liabilities relating to any acquisition. The existence of such undisclosed liabilities may have a material adverse impact on our business, financial condition, results of operations and cash flows.


EMPLOYEES


As of December 31, 2014, we had 2,786 active employees, which figure includes full-time, part-time and temporary employees, of which 1,405 were employed in our Generation business, 77 were employed in our Energy Marketing business, 751 were employed at SunHills and the remaining 553 employees were employed in our Corporate segment.  Approximately 54 per cent of our employees are represented by labour unions.  We are currently a party to 12 different collective bargaining agreements.  In 2014, we renewed four of the collective bargaining agreements, one of which was set to expire in 2014 and three of which expired in 2013 but were then ratified in 2014.


CAPITAL STRUCTURE


General


Our authorized share capital consists of an unlimited number of common shares and an unlimited number of first preferred shares, issuable in series.  As at February 18, 2015, there were 276,990,304 common shares outstanding and 12,000,000 Series A, 11,000,000 Series C, 9,000,000 Series E and 6,600,000 Series G first preferred shares outstanding.


Common Shares


Each common share of TransAlta Corporation entitles the holder thereof to one vote for each common share held at all meetings of shareholders of the Corporation, except meetings at which only holders of another specified class or series of shares are entitled to vote, to receive dividends if, as and when declared by the Board, subject to prior satisfaction of preferential dividends applicable to any first preferred shares, and to participate rateably in any distribution of our assets upon a liquidation, dissolution or winding up and subject to prior rights and privileges attaching to first preferred shares.  The common shares are not convertible and are not entitled to any pre-emptive rights.  The common shares are not entitled to cumulative voting.


- 46 -


First Preferred Shares


We are authorized to issue an unlimited number of first preferred shares, issuable in series and, with respect to each series, the Board is authorized to fix the number of shares comprising the series and determine the designation, rights, privileges, restrictions and conditions attaching to such shares, subject to certain limitations.


The first preferred shares of all series rank senior to all other shares of TransAlta Corporation with respect to priority in payment of dividends and with respect to distribution of assets in the event of liquidation, dissolution or winding up of the Corporation, or a reduction of stated capital.  Holders of first preferred shares are entitled to receive cumulative quarterly dividends on the subscription price thereof as and when declared by the Board at the rate established by the Board at the time of issue of shares of a series.  No dividends may be declared or paid on any other shares of TransAlta Corporation unless all cumulative dividends accrued upon all outstanding first preferred shares have been paid or declared and set apart.  In the event of the liquidation, dissolution or winding up of the Corporation, or a reduction of stated capital, no sum shall be paid or assets distributed to holders of other shares of TransAlta Corporation until the holders of first preferred shares shall have been paid the subscription price of the shares, plus a sum equal to the premium payable on a redemption, plus a sum equal to the arrears of dividends accumulated on the first preferred shares to the date of such liquidation, dissolution, winding up, or reduction of stated capital, as applicable.  After payment of such amount, the holders of first preferred shares shall not be entitled to share further in the distribution of our assets.


The Board may include, in the share conditions attaching to a particular series of first preferred shares, certain voting rights effective upon our failing to make payment of six quarterly dividend payments, whether or not consecutive.  These voting rights continue for so long as any dividends remain in arrears.  These voting rights are the right to one vote for each $25.00 of subscription price on all matters in respect of which shareholders vote, and additionally, the right of all series of first preferred shares, voting as a combined class, to elect two directors of TransAlta if the Board then consists of less than 16 directors, or three directors if the Board consists of 16 or more directors.  Otherwise, except as required by law, the holders of first preferred shares shall not be entitled to vote or to receive notice of or attend any meeting of the shareholders of the Corporation.


Subject to the share conditions attaching to any particular series providing to the contrary, we may redeem the first preferred shares of a series, in whole or from time to time in part, at the redemption price applicable to each series and we have the right to acquire any of the first preferred shares of one or more series by purchase for cancellation in the open market or by invitation for tenders at a price not to exceed the redemption price applicable to the series.


Series A Shares


12.0 million Series A rate reset preferred shares were issued on December 10, 2010 with a coupon of 4.60 per cent (“Series A Shares”), for gross proceeds of $300 million.  Certain provisions of the Series A Shares are discussed below.


Dividends on Series A Shares


The holders of Series A Shares are entitled to receive, as and when declared by the Board out of moneys of TransAlta properly applicable to the payment of dividends, fixed cumulative preferential cash dividends payable quarterly on the last day of March, June, September and December in each year (less any tax that we are required to deduct and withhold).  If any such date is not a business day, the dividend will be paid on the next succeeding business day.


For each five-year period after the Initial Fixed Rate Period (each a “Subsequent Fixed Rate Period”), the holders of Series A Shares shall be entitled to receive, as and when declared by the Board, fixed cumulative preferential cash dividends, payable quarterly on the last day of March, June, September and December in each year, in the amount per share determined by multiplying one-quarter of the Annual Fixed Dividend Rate for such Subsequent Fixed Rate Period by $25.00 (less any tax that we are required to deduct and withhold).  The Annual Fixed Dividend Rate for the ensuing Subsequent Fixed Rate Period will be determined by TransAlta on the Fixed Rate Calculation Date (30th day prior to the first day of such Subsequent Fixed Rate Period) and will be equal to the sum of the Government of


- 47 -


Canada Yield (yield to maturity of a Government of Canada non-callable five year bond) on the Fixed Rate Calculation Date plus a spread of 2.03 per cent.  This spread will apply to both the Series A Shares and the Series B Shares described below, and will remain unchanged over the life of the Series A Shares.


Redemption of Series A Shares


The Series A Shares are redeemable by TransAlta, at its option, in whole or in part, on March 31, 2016, and on March 31 in every fifth year thereafter by the payment of an amount in cash for each share to be redeemed equal to $25.00 plus all accrued and unpaid dividends thereon to but excluding the date fixed for redemption (less any tax that we are required to deduct and withhold).


If we give notice to the holders of the Series A Shares of the redemption of all of the Series A Shares, the right of a holder of Series A Shares to convert such Series A Shares shall terminate and we shall not be required to give notice to the registered holders of the Series A Shares of an Annual Fixed Dividend Rate, a Floating Quarterly Dividend Rate or the conversion right of holders of Series A Shares.


Conversion of Series A Shares into Series B Shares


The holders of the Series A Shares have the right to convert all or any of their shares into cumulative redeemable floating rate first preferred shares, Series B of TransAlta (the “Series B Shares”), subject to certain conditions, on March 31, 2016 and on March 31 in every fifth year thereafter.  The holders of the Series B Shares will be entitled to receive, as and when declared by the Board, quarterly floating rate cumulative preferential cash dividends payable on the last day of March, June, September and December in each year (each such quarterly dividend period is referred to as a “Quarterly Floating Rate Period”), in the amount per share determined by multiplying the “Floating Quarterly Dividend Rate” (which means, for any Quarterly Floating Rate Period, the annual rate of interest, (expressed as a percentage and rounded to the nearest one hundred-thousandth of one per cent), equal to the sum of the T-Bill Rate (the “T-Bill Rate”) (which means, the average yield expressed as an annual rate on the 90 day Government of Canada treasury bill, as reported by the Bank of Canada, for the most recent treasury bills auction preceding the applicable Floating Rate Calculation Date) on the applicable date and 2.03 per cent) for such Quarterly Floating Rate Period by $25.00 and multiplying that product by a fraction, the numerator of which is the actual number of days in such Quarterly Floating Rate Period and the denominator of which is 365 or 366, depending upon the actual number of days in the applicable year (less any tax that we are required to deduct and withhold).  If any such date is not a business day, the dividend will be paid on the next succeeding business day.  The Floating Quarterly Dividend Rate will be the annual rate of interest equal to the sum of the T-Bill Rate on the applicable Floating Rate Calculation Date plus a spread of 2.03 per cent.


The Series A Shares and Series B Shares are series of shares in the same class.  The conversion right entitles holders to elect periodically which of the two series they wish to hold and does not entitle holders to receive a different class or type of securities.  Other than the different dividend rights and redemption rights attached thereto, the Series A Shares and Series B Shares are identical in all material respects.


Voting Rights


The holders of the Series A Shares are not entitled to any voting rights or to receive notice of or to attend shareholders’ meetings unless dividends on the Series A Shares are in arrears to the extent of six quarterly dividends, whether or not consecutive. Until all arrears of dividends have been paid, holders of Series A Shares will be entitled to receive notice of and to attend all shareholders’ meetings at which directors are to be elected (other than separate meetings of holders of another class or series of shares) and to one vote in respect of each Series A Share held on all matters in respect of which shareholders vote, and additionally, the right of all series of first preferred shares, voting as a combined class, to elect two directors of the Corporation if the Board then consists of less than 16 directors, or three directors if the Board consists of 16 or more directors. Otherwise, except as required by law, the holders of first preferred shares shall not be entitled to vote or to receive notice of or attend any meeting of the shareholders of the Corporation


- 48 -


Modification


The provisions attaching to the Series A Shares as a class may be amended with the written approval of all the holders of Series A Shares outstanding or by at least two-thirds of the votes cast at a meeting of the holders of such shares duly called for the purpose and at which a quorum is present.


Series C Shares


11.0 million Series C rate reset preferred shares were issued on November 30, 2011, with a coupon of 4.60 per cent (“Series C Shares”) for gross proceeds of $275 million as discussed in the section entitled “General Development of the Business”.  Certain provisions of the Series C Shares are discussed below.


Dividends on Series C Shares


The holders of Series C Shares are entitled to receive, as and when declared by the Board out of moneys of TransAlta properly applicable to the payment of dividends, fixed cumulative preferential cash dividends payable quarterly on the last day of March, June, September and December in each year (less any tax that we are required to deduct and withhold).  If any such date is not a business day, the dividend will be paid on the next succeeding business day.


For each five-year period after the Initial Fixed Rate Period (each a “Subsequent Fixed Rate Period”), the holders of Series C Shares shall be entitled to receive, as and when declared by the Board, fixed cumulative preferential cash dividends, payable quarterly on the last day of March, June, September and December in each year, in the amount per share determined by multiplying one-quarter of the Annual Fixed Dividend Rate for such Subsequent Fixed Rate Period by $25.00 (less any tax that we are required to deduct and withhold).  The Annual Fixed Dividend Rate for the ensuing Subsequent Fixed Rate Period will be determined by TransAlta on the Fixed Rate Calculation Date (30th day prior to the first day of such Subsequent Fixed Rate Period) and will be equal to the sum of the Government of Canada Yield (yield to maturity of a Government of Canada non-callable five-year bond) on the Fixed Rate Calculation Date plus a spread of 3.10 per cent.  This spread will apply to both the Series C Shares and the Series D Shares described below, and will remain unchanged over the life of the Series C Shares.


Redemption of Series C Shares


The Series C Shares are redeemable by TransAlta, at its option, in whole or in part, on June 30, 2017, and on June 30 in every fifth year thereafter by the payment of an amount in cash for each share to be redeemed equal to $25.00 plus all accrued and unpaid dividends thereon to but excluding the date fixed for redemption (less any tax that we are required to deduct and withhold).


If we give notice to the holders of the Series C Shares of the redemption of all of the Series C Shares, the right of a holder of Series C Shares to convert such Series C Shares shall terminate and we shall not be required to give notice to the registered holders of the Series C Shares of an Annual Fixed Dividend Rate, a Floating Quarterly Dividend Rate or the conversion right of holders of Series C Shares.


Conversion of Series C Shares into Series D Shares


The holders of the Series C Shares have the right to convert all or any of their shares into cumulative redeemable floating rate first preferred shares, Series D of TransAlta (the “Series D Shares”), subject to certain conditions, on June 30, 2017 and on June 30 in every fifth year thereafter.  The holders of the Series D Shares will be entitled to receive, as and when declared by the Board, quarterly floating rate cumulative preferential cash dividends payable on the last day of March, June, September, and December in each year (each such quarterly dividend period is referred to as a “Quarterly Floating Rate Period”), in the amount per share determined by multiplying the “Floating Quarterly Dividend Rate” (which means, for any Quarterly Floating Rate Period, the annual rate of interest, (expressed as a percentage and rounded to the nearest one hundred-thousandth of one per cent), equal to the sum of the T-Bill Rate on the applicable date and 3.10 per cent) for such Quarterly Floating Rate Period by $25.00 and multiplying that product by a fraction, the numerator of which is the actual number of days in such Quarterly


- 49 -


Floating Rate Period and the denominator of which is 365 or 366, depending upon the actual number of days in the applicable year (less any tax that we are required to deduct and withhold).  If any such date is not a business day, the dividend will be paid on the next succeeding business day.  The Floating Quarterly Dividend Rate will be the annual rate of interest equal to the sum of the T-Bill Rate on the applicable Floating Rate Calculation Date plus a spread of 3.10 per cent.


The Series C Shares and Series D Shares are series of shares in the same class.  The conversion right entitles holders to elect periodically which of the two series they wish to hold and does not entitle holders to receive a different class or type of securities.  Other than the different dividend rights and redemption rights attached thereto, the Series C Shares and Series D Shares are identical in all material respects.


Voting Rights


The holders of the Series C Shares are not entitled to any voting rights or to receive notice of or to attend shareholders’ meetings unless dividends on the Series C Shares are in arrears to the extent of six quarterly dividends, whether or not consecutive. Until all arrears of dividends have been paid, holders of Series C Shares will be entitled to receive notice of and to attend all shareholders’ meetings at which directors are to be elected (other than separate meetings of holders of another class or series of shares) and to one vote in respect of each Series C Share held on all matters in respect of which shareholders vote, and additionally, the right of all series of first preferred shares, voting as a combined class, to elect two directors of the Corporation if the Board then consists of less than 16 directors, or three directors if the Board consists of 16 or more directors. Otherwise, except as required by law, the holders of first preferred shares shall not be entitled to vote or to receive notice of or attend any meeting of the shareholders of the Corporation.


Modification


The provisions attaching to the Series C Shares as a class may be amended with the written approval of all the holders of Series C Shares outstanding or by at least two-thirds of the votes cast at a meeting of the holders of such shares duly called for the purpose and at which a quorum is present.


Series E Shares


9.0 million Series E rate reset preferred shares were issued on August 10, 2012 with a coupon of 5.00 per cent (“Series E Shares”) for gross proceeds of $225 million, as discussed in the section entitled “General Development of the Business”.  Certain provisions of the Series E Shares are discussed below.


Dividends on Series E Shares


The holders of Series E Shares are entitled to receive, as and when declared by the Board out of moneys of TransAlta properly applicable to the payment of dividends, fixed cumulative preferential cash dividends payable quarterly on the last day of March, June, September, and December in each year (less any tax that we are required to deduct and withhold).  If any such date is not a business day, the dividend will be paid on the next succeeding business day.


For each five-year period after the Initial Fixed Rate Period (each a “Subsequent Fixed Rate Period”), the holders of Series E Shares shall be entitled to receive, as and when declared by the Board, fixed cumulative preferential cash dividends, payable quarterly on the last day of March, June, September and December in each year, in the amount per share determined by multiplying one-quarter of the Annual Fixed Dividend Rate for such Subsequent Fixed Rate Period by $25.00 (less any tax that we are required to deduct and withhold).  The Annual Fixed Dividend Rate for the ensuing Subsequent Fixed Rate Period will be determined by TransAlta Corporation on the Fixed Rate Calculation Date (30th day prior to the first day of such Subsequent Fixed Rate Period) and will be equal to the sum of the Government of Canada Yield (yield to maturity of a Government of Canada non-callable five-year bond) on the Fixed Rate Calculation Date plus a spread of 3.65 per cent.  This spread will apply to both the Series E Shares and the Series F Shares described below, and will remain unchanged over the life of the Series E Shares.


- 50 -


Redemption of Series E Shares


The Series E Shares are redeemable by TransAlta Corporation, at its option, in whole or in part, on September 30, 2017, and on September 30 in every fifth year thereafter by the payment of an amount of $25.00 in cash for each share to be redeemed plus all accrued and unpaid dividends thereon to but excluding the date fixed for redemption (less any tax that we are required to deduct and withhold).


If we give notice to the holders of the Series E Shares of the redemption of all of the Series E Shares, the right of a holder of Series E Shares to convert such Series E Shares shall terminate and we shall not be required to give notice to the registered holders of the Series E Shares of an Annual Fixed Dividend Rate, a Floating Quarterly Dividend Rate or the conversion right of holders of Series E Shares.


Conversion of Series E Shares into Series F Shares


The holders of the Series E Shares have the right to convert all or any of their shares into cumulative redeemable floating rate first preferred shares, Series F of TransAlta (the “Series F Shares”), subject to certain conditions, on September 30, 2017 and on September 30 in every fifth year thereafter.  The holders of the Series F Shares will be entitled to receive, as and when declared by the Board, quarterly floating rate cumulative preferential cash dividends payable on the last day of March, June, September, and December in each year (each such quarterly dividend period is referred to as a “Quarterly Floating Rate Period”), in the amount per share determined by multiplying the “Floating Quarterly Dividend Rate” (which means, for any Quarterly Floating Rate Period, the annual rate of interest, (expressed as a percentage and rounded to the nearest one hundred-thousandth of one per cent), equal to the sum of the T-Bill Rate on the applicable date and 3.65 per cent) for such Quarterly Floating Rate Period by $25.00 and multiplying that product by a fraction, the numerator of which is the actual number of days in such Quarterly Floating Rate Period and the denominator of which is 365 or 366, depending upon the actual number of days in the applicable year (less any tax that we are required to deduct and withhold).  If any such date is not a business day, the dividend will be paid on the next succeeding business day.  The Floating Quarterly Dividend Rate will be the annual rate of interest equal to the sum of the T-Bill Rate on the applicable Floating Rate Calculation Date plus a spread of 3.65 per cent.


The Series E Shares and Series F Shares are series of shares in the same class.  The conversion right entitles holders to elect periodically which of the two series they wish to hold and does not entitle holders to receive a different class or type of securities.  Other than the different dividend rights and redemption rights attached thereto, the Series E Shares and Series F Shares are identical in all material respects.


Voting Rights


The holders of the Series E Shares are not entitled to any voting rights or to receive notice of or to attend shareholders’ meetings unless dividends on the Series E Shares are in arrears to the extent of six quarterly dividends, whether or not consecutive. Until all arrears of dividends have been paid, holders of Series E Shares will be entitled to receive notice of and to attend all shareholders’ meetings at which directors are to be elected (other than separate meetings of holders of another class or series of shares) and to one vote in respect of each Series E Share held on all matters in respect of which shareholders vote, and additionally, the right of all series of first preferred shares, voting as a combined class, to elect two directors of the Corporation if the Board then consists of less than 16 directors, or three directors if the Board consists of 16 or more directors. Otherwise, except as required by law, the holders of first preferred shares shall not be entitled to vote or to receive notice of or attend any meeting of the shareholders of the Corporation.


- 51 -


Modification


The provisions attaching to the Series E Shares as a class may be amended with the written approval of all the holders of Series E Shares outstanding or by at least two-thirds of the votes cast at a meeting of the holders of such shares duly called for the purpose and at which a quorum is present.


Series G Shares


6.6 million Series G rate reset preferred shares were issued on August 15, 2014 with a coupon of 5.30 per cent (“Series G Shares”) for gross proceeds of $165 million, as discussed in the section entitled “General Development of the Business”.  Certain provisions of the Series G Shares are discussed below.


Dividends on Series G Shares


The holders of Series G Shares are entitled to receive, as and when declared by the Board out of moneys of TransAlta properly applicable to the payment of dividends, fixed cumulative preferential cash dividends payable quarterly on the last day of March, June, September, and December in each year (less any tax that we are required to deduct and withhold).  If any such date is not a business day, the dividend will be paid on the next succeeding business day.


For each five-year period after the Initial Fixed Rate Period (each a “Subsequent Fixed Rate Period”), the holders of Series G Shares shall be entitled to receive, as and when declared by the Board, fixed cumulative preferential cash dividends, payable quarterly on the last day of March, June, September and December in each year, in the amount per share determined by multiplying one-quarter of the Annual Fixed Dividend Rate for such Subsequent Fixed Rate Period by $25.00 (less any tax that we are required to deduct and withhold).  The Annual Fixed Dividend Rate for the ensuing Subsequent Fixed Rate Period will be determined by TransAlta Corporation on the Fixed Rate Calculation Date (30th day prior to the first day of such Subsequent Fixed Rate Period) and will be equal to the sum of the Government of Canada Yield (yield to maturity of a Government of Canada non-callable five year bond) on the Fixed Rate Calculation Date plus a spread of 3.80 per cent.  This spread will apply to both the Series G Shares and the Series H Shares described below, and will remain unchanged over the life of the Series G Shares.


Redemption of Series G Shares


The Series G Shares are redeemable by TransAlta Corporation, at its option, in whole or in part, on September 30, 2019, and on September 30 in every fifth year thereafter by the payment of an amount of $25.00 in cash for each share to be redeemed plus all accrued and unpaid dividends thereon to but excluding the date fixed for redemption (less any tax that we are required to deduct and withhold).


If we give notice to the holders of the Series G Shares of the redemption of all of the Series G Shares, the right of a holder of Series G Shares to convert such Series G Shares shall terminate and we shall not be required to give notice to the registered holders of the Series G Shares of an Annual Fixed Dividend Rate, a Floating Quarterly Dividend Rate or the conversion right of holders of Series G Shares.


Conversion of Series G Shares into Series H Shares


The holders of the Series G Shares have the right to convert all or any of their shares into cumulative redeemable floating rate first preferred shares, Series H of TransAlta (the “Series H Shares”), subject to certain conditions, on September 30, 2019 and on September 30 in every fifth year thereafter.  The holders of the Series H Shares will be entitled to receive, as and when declared by the Board, quarterly floating rate cumulative preferential cash dividends payable on the last day of March, June, September, and December in each year (each such quarterly dividend period is referred to as a “Quarterly Floating Rate Period”), in the amount per share determined by multiplying the “Floating Quarterly Dividend Rate” (which means, for any Quarterly Floating Rate Period, the annual rate of interest, (expressed as a percentage and rounded to the nearest one hundred thousandth of one per cent), equal to the sum of the T-Bill Rate on the applicable date and 3.80 per cent) for such Quarterly Floating Rate Period by $25.00 and multiplying that product by a fraction, the numerator of which is the actual number of days in such Quarterly


- 52 -


Floating Rate Period and the denominator of which is 365 or 366, depending upon the actual number of days in the applicable year (less any tax that we are required to deduct and withhold).  If any such date is not a business day, the dividend will be paid on the next succeeding business day.  The Floating Quarterly Dividend Rate will be the annual rate of interest equal to the sum of the T-Bill Rate on the applicable Floating Rate Calculation Date plus a spread of 3.80 per cent.


The Series G Shares and Series H Shares are series of shares in the same class.  The conversion right entitles holders to elect periodically which of the two series they wish to hold and does not entitle holders to receive a different class or type of securities.  Other than the different dividend rights and redemption rights attached thereto, the Series G Shares and Series H Shares are identical in all material respects.


Voting Rights


The holders of Series G Shares are not entitled to any voting rights or to receive notice of or to attend shareholders’ meetings unless dividends on the Series G Shares are in arrears to the extent of six quarterly dividends, whether or not consecutive. Until all arrears of dividends have been paid, holders of Series G Shares will be entitled to receive notice of and to attend all shareholders’ meetings at which directors are to be elected (other than separate meetings of holders of another class or series of shares) and to one vote in respect of each Series G Share held on all matters in respect of which shareholders vote, and additionally, the right of all series of first preferred shares, voting as a combined class, to elect two directors of the Corporation if the Board then consists of less than 16 directors, or three directors if the Board consists of 16 or more directors. Otherwise, except as required by law, the holders of first preferred shares shall not be entitled to vote or to receive notice of or attend any meeting of the shareholders of the Corporation.


Modification


The provisions attaching to the Series G Shares as a class may be amended with the written approval of all the holders of Series G Shares outstanding or by at least two-thirds of the votes cast at a meeting of the holders of such shares duly called for the purpose and at which a quorum is present.


Premium Dividend™, Dividend Reinvestment and Optional Common Share Purchase Plan


On May 8, 2013, the Corporation announced the suspension of the Premium DividendTM Component of its Plan, following the payment of its quarterly dividend on July 1, 2013. The current Plan provides eligible shareholders of TransAlta with the option to reinvest dividends at a current three per cent discount (may be from zero to five per cent at the discretion of the Board) to the average market price towards the purchase of new shares of TransAlta.


Eligible shareholders enrolled in the Dividend Reinvestment Component are also eligible to purchase new shares at a discount to the average market price under the optional cash payment component (the “OCP Component”) of the Plan by directly investing up to $5,000.00 per quarter. The applicable discount under the OCP Component is also determined from time to time by the Board and is currently set at three per cent.


CREDIT RATINGS


Issuer Rating


The following information relating to our credit ratings is provided as it relates to our financing costs, liquidity and operations.  Specifically, credit ratings affect our ability to obtain short-term and long-term financing and the cost of such financing.  Additionally, our ability to engage in certain collateralized business activities on a cost effective basis depends on our credit ratings.  A reduction in the current rating on our debt by our rating agencies, particularly a downgrade below investment grade ratings, or a negative change in our ratings outlook could adversely affect our cost of financing and access to sources of liquidity and capital.  In addition, changes in credit ratings may affect our ability to, and the associated costs of, (i) entering into ordinary course derivative or hedging transactions and may require us to post additional collateral under certain of our contracts, and (ii) entering into and maintaining ordinary course contracts with customers and suppliers on acceptable terms.


- 53 -


As of December 31, 2014, our issuer rating was BBB- (stable) from S&P, BBB (stable) from DBRS and BBB- (stable) from Fitch.


Senior Unsecured Long-term Debt


As of December 31, 2014, our senior unsecured long-term debt is rated BBB (stable) by DBRS, BBB- (stable) by S&P, Baa3 (negative) by Moody’s and BBB- (stable) by Fitch.  The ratings for debt instruments range from a high of AAA to a low of D in the case of DBRS, S&P and Fitch and from a high of Aaa to a low of C in the case of Moody’s.


According to the DBRS rating system, debt securities rated BBB are of adequate credit quality.  The capacity for the payment of financial obligations is considered acceptable, but the entity may be vulnerable to future events.  “High” or “Low” subcategories indicate the relative standing within a rating category for all rating categories other than AAA and D.  DBRS also assigns rating trends of “positive,” “stable,” or “negative” to each of its ratings. The rating trend indicates the direction in which DBRS considers the rating is headed should present tendencies continue, or in some cases, unless challenges are addressed.


According to the S&P rating system, debt securities rated BBB exhibit adequate protection parameters.  However, adverse economic conditions or changing circumstances are more likely to lead to a weakened capacity of the obligor to meet its financial commitment on such obligations than on obligations in the higher rating categories.  The ratings from AA to CCC may be modified by the addition of a plus (+) or minus (–) sign to show relative standing within the major rating categories.  S&P also assigns a rating outlook to each of its ratings to give investors an understanding of S&P’s opinion regarding the potential direction for the long-term credit rating over the intermediate term.


The Moody’s rating system provides that debt securities rated Baa are subject to moderate credit risk.  They are considered medium grade and as such may possess certain speculative characteristics.  Numerical modifiers 1, 2 and 3 are applied to each generic rating classification from Aa through Caa, with 1 indicating that the obligation ranks in the higher end of the category, 2 indicating a mid-range ranking and 3 indicating a ranking in the lower end of the category. Moody’s may also assign a rating outlook of positive, negative, stable, or developing. A stable outlook indicates a low likelihood of a rating change over the medium term. A negative, positive, or developing outlook indicates a higher likelihood of a rating change over the medium term.


The Fitch rating system describes a BBB designation as a rating to indicate the current low expectations of default risk occurring. As well, negative changes in circumstances or economic conditions may be more likely to impair this capacity. The modifiers “+” or “-” may be added to Long-Term Issuer Default Ratings between AA and B.


We are focused on maintaining a strong financial position and cash flow coverage ratios to support stable investment grade credit ratings.  Our investment grade credit rating, available credit facilities, funds from operations, and our manageable debt maturity profile provide us with financial flexibility. As a result, we can be selective as to if and when we go to the capital markets for funding.


Preferred Shares


Each of the Series A, Series C, Series E and Series G preferred shares have been rated Pfd-3 (stable) by DBRS, and P-3 by S&P.  The ratings for preferred shares range from a high of Pfd-1 to a low of D for DBRS and from a high of P-1 to a low of D for S&P.


According to the DBRS rating system, securities rated Pfd-3 are of adequate credit quality. “High” or “low” grades are used to indicate the relative standing within a rating category.


According to the S&P rating system, securities rated P-3 are less vulnerable to nonpayment than other speculative issues. However, the obligor faces major ongoing uncertainties or exposure to adverse business, financial, or economic conditions which could lead to the obligor’s inadequate capacity to meet its financial commitment on the


- 54 -


obligation. This is the third highest of eight categories under S&P’s Canadian preferred share national rating scale. The ratings from P-1 to -5 may be modified by “high” or “low” grades which indicate relative standing within the major rating categories.


Note Regarding Credit Ratings


Credit ratings are intended to provide investors with an independent measure of credit quality of an issue of securities.  The credit ratings accorded to our outstanding securities by S&P, Moody’s, DBRS and Fitch, as applicable, are not recommendations to purchase, hold or sell such securities inasmuch as such ratings do not comment as to market price or suitability for a particular investor.  There is no assurance that the ratings will remain in effect for any given period or that a rating will not be revised or withdrawn entirely by S&P, Moody’s, DBRS or Fitch in the future if, in its judgement, circumstances so warrant.


We have paid fees for rating services to S&P, DBRS and Fitch, but have not paid fees for other rating agency services during the last two years.  We have also paid Moody’s rating services fees and fees for certain other services provided to the Corporation in 2014.


DIVIDENDS


Common Shares


Dividends on our common shares are at the discretion of the Board.  In determining the payment and level of future dividends, the Board considers our financial performance, our results of operations, cash flow and needs, with respect to financing our ongoing operations and growth, balanced against returning capital to shareholders.  The Board continues to focus on building sustainable earnings and cash flow growth.


TransAlta has declared and paid the following dividends per share on its outstanding common shares for the past three years:


Period


Dividend per Common
Share


2012


First Quarter


$0.29


Second Quarter


$0.29


Third Quarter


$0.29


Fourth Quarter


$0.29


2013


First Quarter


$0.29


Second Quarter


$0.29


Third Quarter


$0.29


Fourth Quarter


$0.29


2014


First Quarter


$0.29


Second Quarter


$0.18


Third Quarter


$0.18


Fourth Quarter


$0.18


On January 23, 2015, the Board declared a cash dividend of $0.18 per common share, payable on April 1, 2015 to shareholders of record on March 2, 2015. This dividend is in line with the resized dividend that was announced in February 2014 of $0.72 per common share on an annualized basis.


- 55 -


Series A Shares


Period


Dividend per Series A
Preferred Share


2012


First Quarter


$0.2875


Second Quarter


$0.2875


Third Quarter


$0.2875


Fourth Quarter


$0.2875


2013


First Quarter


$0.2875


Second Quarter


$0.2875


Third Quarter


$0.2875


Fourth Quarter


$0.2875


2014


First Quarter


$0.2875


Second Quarter


$0.2875


Third Quarter


$0.2875


Fourth Quarter


$0.2875


On January 23, 2015, the Board declared a cash dividend of $0.2875 per Series A Share, payable on March 31, 2015 to shareholders of record on March 2, 2015.


Series C Shares


Period


Dividend per Series C
Preferred Share


2012


First Quarter(1)


$0.3844


Second Quarter


$0.2875


Third Quarter


$0.2875


Fourth Quarter


$0.2875


2013


First Quarter


$0.2875


Second Quarter


$0.2875


Third Quarter


$0.2875


Fourth Quarter


$0.2875


2014


First Quarter


$0.2875


Second Quarter


$0.2875


Third Quarter


$0.2875


Fourth Quarter


$0.2875


Note:

(1)                                  On January 25, 2012 the Board approved an initial dividend of $0.3844 per Series C Share for the period from issuance on November 29, 2011 to March 31, 2012.


On January 23, 2015, the Board declared a cash dividend of $0.2875 per Series C Share, payable on March 31, 2015 to shareholders of record on March 2, 2015.


- 56 -


Series E Shares


Period


Dividend per Series E
Preferred Share


2012


Fourth Quarter(1)


$0.4897


2013


First Quarter


$0.3125


Second Quarter


$0.3125


Third Quarter


$0.3125


Fourth Quarter


$0.3125


2014


First Quarter


$0.3125


Second Quarter


$0.3125


Third Quarter


$0.3125


Fourth Quarter


$0.3125


Note:

(1)                                  On October 24, 2012, the Board approved an initial dividend of $0.4897 per Series E Share for the period from issuance on August 10, 2012 to December 31, 2012.


On January 23, 2015, the Board declared a cash dividend of $0.3125 per Series E Share, payable on March 31, 2015 to shareholders of record on March 2, 2015.


Series G Shares


Period


Dividend per Series G
Preferred Share


2014


Fourth Quarter(1)


$0.501


Note:

(1)                                  On October 29, 2014, the Board approved an initial dividend of $0.501 per Series G Share for the period from issuance on August 15, 2014 to December 31, 2014.


On January 23, 2015, the Board declared a cash dividend of $0.33125 per Series G Share, payable on March 31, 2015 to shareholders of record on March 2, 2015.


MARKET FOR SECURITIES


Common Shares


Our common shares are listed on the Toronto Stock Exchange (the “TSX”) under the symbol “TA” and the New York Stock Exchange (the “NYSE”) under the symbol “TAC”.  The following table sets forth the reported high and low trading prices and trading volumes of our common shares as reported by the TSX for the periods indicated:


Price ($)


Month


High


Low


Volume


2014


January


14.66


13.41


14,621,490


February


14.97


12.43


30,265,151


March


13.12


12.51


18,036,710


April


13.57


12.60


16,589,651


May


13.55


12.90


14,648,189


June


13.09


12.63


10,949,642


July


13.21


12.32


10,573,315


August


12.94


12.24


8,545,483


September


12.54


11.45


16,923,510


- 57 -


Price ($)


Month


High


Low


Volume


October


11.88


10.54


17,870,362


November


11.68


10.40


19,280,760


December


11.34


9.63


25,999,048


2015


January


11.26


10.46


14,756,657


February 1-18


11.40


10.74


7,467,706


Series A Shares


Our Series A Shares are listed on the TSX under the symbol “TA.PR.D”.


Date(s) of Issuance


Number of Securities


Issue Price per Security


Description of Transaction


December 10, 2010(1)


12,000,000 Series A Shares


$25.00


Public Offering


Note:

(1)          Series A Shares were issued pursuant to a public offering in a prospectus supplement dated December 3, 2010.


Price ($)


Month


High


Low


Volume


2014


January


17.92


16.75


351,742


February


17.30


16.42


234,210


March


16.87


16.25


306,388


April


18.62


16.74


432,693


May


19.92


18.68


385,453


June


19.24


18.65


168,442


July


19.25


18.77


229,648


August


19.00


18.38


159,954


September


18.70


16.79


209,136


October


17.19


15.87


507,516


November


15.90


15.40


451,063


December


15.69


14.26


748,336


2015


January


15.24


13.86


172,295


February 1-18


14.30


12.25


226,385


Series C Shares


Our Series C Shares are listed on the TSX under the symbol “TA.PR.F”.


Date(s) of Issuance


Number of Securities


Issue Price per Security


Description of Transaction


November 30, 2011(1)


11,000,000 Series C Shares


$25.00


Public Offering


Note:

(1)          Series C Shares were issued pursuant to a public offering in a prospectus supplement dated November 23, 2011.


Price ($)


Month


High


Low


Volume


2014


January


20.56


19.00


385,319


February


20.50


19.80


212,813


March


20.29


19.72


219,370


April


21.65


19.97


212,068


May


22.40


21.49


420,108


June


22.14


21.20


376,039


July


22.40


22.00


218,159


- 58 -


Price ($)


Month


High


Low


Volume


August


22.33


21.40


187,935


September


21.68


21.15


137,610


October


21.22


19.44


162,271


November


19.98


18.94


276,397


December


19.46


17.40


393,321


2015


January


19.25


17.45


152,810


February 1-18


17.99


17.05


88.292


Series E Shares


Our Series E Shares are listed on the TSX under the symbol “TA.PR.H”.


Date(s) of Issuance


Number of Securities


Issue Price per Security


Description of Transaction


August 10, 2012(1)


9,000,000 Series E Shares


$25.00


Public Offering


Note:

(1)          Series E Shares were issued pursuant to a public offering in a prospectus supplement dated August 3, 2012.


Price ($)


Month


High


Low


Volume


2014


January


23.19


22.10


127,288


February


22.95


22.20


147,505


March


22.73


22.32


121,986


April


23.25


22.40


134,548


May


24.35


22.88


251,097


June


24.12


23.64


244,358


July


24.39


23.82


155,720


August 


24.49


23.50


123,315


September


23.84


22.85


126,887


October


23.42


21.77


144,307


November


22.27


21.33


168,885


December


21.54


19.49


466,089


2015


January


21.60


19.30


144,409


February 1-18


19.94


18.85


134,319


Series G Shares


Our Series G Shares are listed on the TSX under the symbol “TA.PR.J”.


Date(s) of Issuance


Number of Securities


Issue Price per Security


Description of Transaction


August 15, 2014(1)


6,600,000 Series G Shares


$25.00


Public Offering


Note:

(1)                                  Series G Shares were issued pursuant to a public offering in a prospectus supplement dated August 8, 2014.


Price ($)


Month


High


Low


Volume


2014


August 


24.84


24.60


644,122

September


24.90


24.17


207,943

October


24.75


21.91


201,838


- 59 -


Price ($)


Month


High


Low


Volume

November


23.23


22.05


179,033

December


22.34


20.20


451,547


2015


January


22.34


20.10


164,710

February 1-18


21.90


20.33


103,280


DIRECTORS AND OFFICERS


The name, province or state and country of residence of each of our directors as at February 18, 2015, their respective position and office and their respective principal occupation during the five preceding years, are set out below.  The year in which each director was appointed to serve to the Board is also set out below.  Each director is appointed to serve until the next annual meeting of TransAlta or until his or her successor is elected or appointed.


Name, Province (State)
and Country of
Residence
(1)


Year first
became
Director


Principal Occupation


William D. Anderson
Ontario, Canada


2003


Mr. Anderson is a corporate director and has had a career as a business leader in Canada spanning over thirty years.  He was President of BCE Ventures (a subsidiary of BCE Inc.) from 2001 to 2005 (telecommunications) and prior to that, Chief Financial Officer (“CFO”) of BCE Inc., Bell Canada Inc. and of Bell Cablemedia plc (telecommunications).  As President of BCE Ventures, he was responsible for a number of significant operating companies as well as being CEO of Bell Canada International Inc.  In his CFO roles, Mr. Anderson was responsible for all financial operations of the respective companies and executed numerous debt and equity financings, corporate acquisition and disposition transactions as well as corporate and operational restructurings.  He was also in public practice for nearly twenty years with the accounting firm KPMG LLP, where he was a partner for eleven years.


Mr. Anderson is currently the Chair of the Board of Directors of Gildan Activewear Inc. and a director of Sun Life Financial Inc.  Mr. Anderson is a past director of BCE Emergis Inc., Bell Cablemedia plc, Bell Canada International Inc., CGI Group Inc., Four Seasons Hotels Inc., Sears Canada Inc., Videotron Holdings plc. and Nordion Inc. (formerly MDS Inc.).


Mr. Anderson holds a bachelor in business administration from the University of Western Ontario and is a Fellow of the Chartered Professional Accountants of Ontario and the Institute of Corporate Directors.


Member of the Audit and Risk Committee and the Governance and Environment Committee of the Board.


- 60 -


Name, Province (State)
and Country of
Residence
(1)


Year first
became
Director


Principal Occupation


John P. Dielwart
Alberta, Canada


2014


Mr. Dielwart was formerly Chief Executive Officer of ARC Resources Ltd. which owns and operates oil and gas properties in Western Canada. He oversaw the growth of ARC Resources Ltd. from start-up in 1996 to a corporation with a market capitalization of approximately $10 billion.


After his retirement from ARC Resources Ltd. on January 1, 2013, Mr. Dielwart re-joined ARC Financial Corp. as Vice-Chairman. ARC Financial Corp. is Canada’s leading energy focused private equity manager with $3.7 billion of capital under management. Mr. Dielwart provides leadership support for the executive team in the areas of internal governance and investment decision-making. With his extensive background in creating, building and leading one of Canada’s most successful oil and gas companies, mentorship of ARC Financial  Corp. employees as well as management of its investee companies is a primary responsibility. He is a member of ARC Financial Corp.’s Investment and Strategy committees, and currently represents ARC Financial Corp. on the board of Modern Resources Ltd. and Aspenleaf Energy Limited.


Prior to joining ARC Financial Corp. in 1994, Mr. Dielwart spent 12 years with a major Calgary based oil and natural gas engineering consulting firm, as senior vice-president and a director, where he gained extensive technical knowledge of oil and natural gas properties in western Canada. Mr. Dielwart also spent the first five years of his career with a multinational oil and gas company.


Mr. Dielwart is currently a director of ARC Resources Ltd., Denbury Resources Inc. and Tesco Corporation.


Mr. Dielwart has a Bachelor of Science with Distinction (Civil Engineering) degree from the University of Calgary.  He is a member of the Association of Professional Engineers and Geoscientists of Alberta (APEGA) and is a Past-Chairman of the Board of Governors of the Canadian Association of Petroleum Producers (CAPP).


Member of the Audit and Risk Committee and the Governance and Environment Committee of the Board.


- 61 -


Name, Province (State)
and Country of
Residence
(1)


Year first
became
Director


Principal Occupation


Timothy W. Faithfull
Oxford, U.K.


2003


Mr. Faithfull is a 36-year veteran of Royal Dutch/Shell plc (energy), where he held diverse international roles principally in oil products and LNG project development.  As President and CEO of Shell Canada Limited, he was responsible for bringing the $6 billion Athabasca Oil Sands Project on line in 2003, the first fully integrated oil sands venture in 25 years.  Mr. Faithfull has extensive experience with commodity exposure and risk management, the result of his time directing the global crude oil trading operations of Shell International Trading and Shipping Company from 1993 to 1996.  He was Chairman and CEO of Shell Eastern Petroleum in Singapore from 1996 to 1999, including Shell’s main refinery and oil products trading for Asia Pacific.


During his time in Singapore, he was a director of DBS Bank and the Port of Singapore Authority.  He was a trustee of the main Singapore Arts/Theatre complex.  In Calgary, he served on the board of the Calgary Health Trust and the Epcor Arts Centre.


In the U.K., Mr. Faithfull is a director of Shell Pension Trust Limited, where he chairs the Technical Committee.  He is Chairman of the trustees of Starehe UK, and a trustee of Canada UK Colloquium, all non-public entities.  He serves on the Committee to Review Donations of the University of Oxford. Mr. Faithfull is also a director of ICE Futures Europe and LIFFE Administration and Management as well as a director of Canadian Natural Resources Limited.  He is a past director of Enerflex Systems Income Fund, Canadian Pacific Railway, AMEC plc. and AMEC plc.


Mr. Faithfull holds a Master of Arts from the University of Oxford (Philosophy, Politics and Economics) and is a Distinguished Friend of the University of Oxford.
 
Chair of the Human Resources Committee of the Board.


- 62 -


Name, Province (State)
and Country of
Residence
(1)


Year first
became
Director


Principal Occupation


Dawn L. Farrell
Alberta, Canada


2012


Mrs. Farrell became President and CEO of TransAlta Corporation on January 2, 2012. Prior to her appointment, she served as Chief Operating Officer from 2009 to 2011 and as Executive Vice-President, Commercial Operations and Development from 2008 to 2009.


Mrs. Farrell has over 30 years of experience in the electric energy industry, holding roles at TransAlta and BC Hydro. She has served as Executive Vice-President, Commercial Operations and Development; Executive Vice-President, Corporate Development; Executive Vice-President, Independent Power Projects; and Vice-President, Energy Marketing and IPP Development at TransAlta Corporation.


From 2003 to 2006, Mrs. Farrell served as Executive Vice-President, Generation at BC Hydro. In 2006, she was appointed Executive Vice-President Engineering, Aboriginal Relations and Generation.


Mrs. Farrell sits on the board of directors of The Conference Board of Canada and the Canadian Council of Chief Executives.  Her past boards include the Calgary Stampede, the Mount Royal College Board of Governors, Fording Coal Income Fund, New Relationship Trust Fund, Mount Royal College Foundation and Vision Quest Windelectric.


Mrs. Farrell holds a Bachelor of Commerce with a major in Finance and a Master’s degree in Economics from the University of Calgary.  She has also attended the Advanced Management Program at Harvard University.


- 63 -


Name, Province (State)
and Country of
Residence
(1)


Year first
became
Director


Principal Occupation


Alan J. Fohrer
California, U.S.A.


2013


Mr. Fohrer is a corporate director.  Prior thereto, he was Chairman and CEO of Southern California Edison Company, a subsidiary of Edison International (“Edison”) and one of the largest electric utilities in the United States. He was elected CEO in 2002 and Chairman in 2007.  In 2000, Mr. Fohrer was elected as President and Chief Executive Officer of Edison Mission Energy (“EME”), a subsidiary of Edison that owns and operates independent power facilities.  During his tenure at EME, Mr. Fohrer restructured a number of the international projects, which enhanced the value of the assets sold in subsequent years. Mr. Fohrer also served as Executive Vice-President, Treasurer and Chief Financial Officer of both Edison and SCE from 1995 to 1999.  After 37 years with Edison, Mr. Fohrer retired in December 2010.


Mr. Fohrer currently sits on the boards of PNM Resources, Inc., a publicly held energy holding company, MWH Global, Inc., a privately held global engineering and construction company focused on water and waste water projects, Osmose Utilities Services, Inc., a privately held company providing services to utilities, Blue Shield of California, a non-profit health insurance provider, and Synagro, a waste management company.


Mr. Fohrer has served on boards of directors of the Institute of Nuclear Power Operations, the California Chamber of Commerce, and Duratek, Inc., a publicly held nuclear services company.  He is also a member of the Viterbi School of Engineering Board of Councilors for the University of Southern California and Chair of the California Science Centre Foundation.


Mr. Fohrer holds a Master of Science in Civil Engineering from the University of Southern California as well as a Master of Business Administration from California State University.


Member of the Audit and Risk Committee and the Governance and Environment Committee of the Board.


Amb. Gordon D. Giffin(2)
Georgia, U.S.A.


2002


Ambassador Giffin is Senior Partner of the law firm of McKenna Long & Aldridge, where he maintains offices in Washington, D.C. and Atlanta.  His practice focuses on international transactions related to trade, energy and public policy.  He has been engaged in the practice of law or government service for more than 40 years.  He served as the United States Ambassador to Canada with responsibility for managing Canada/U.S. bilateral relations, including energy and environmental policy from August 1997 to April 2001.  Prior to that, he served as Chief Counsel and Legislative Director to United States Senator Sam Nunn, with responsibility for the legal and legislative operations of the office.


Ambassador Giffin’s professional career has consisted of two distinct paths – law practice and public service. He has spent three decades as an attorney in the energy industry as an advisor, trying multiple energy regulatory cases before state and federal tribunals and courts, and handling transactions including mergers and acquisitions. During a decade in public service he was a senior attorney and advisor in the United States Senate where, among other matters, he worked on major energy public policy initiatives. During his four years as United States Ambassador to Canada, he was CEO of a large government enterprise with in excess of a thousand people across Canada. His substantive responsibilities included the entire array of policy matters in the Canada-U.S. context including energy policy. He has substantial experience in dealing with issues at the intersection of industry and public policy.


Since leaving public office, he resumed his continental law practice and remains actively engaged in public policy initiatives through the Council on Foreign Relations and the Tri-Lateral Commission.


Ambassador Giffin currently is a director of Canadian Imperial Bank of Commerce, Canadian National Railway Company, Canadian Natural Resources Limited, Just Energy Group Inc. and Element Financial Corporation.


Ambassador Giffin holds a Bachelor of Arts from Duke University and a juris doctorate from Emory University School of Law.


Chair of the Board.


- 64 -


Name, Province (State)
and Country of
Residence
(1)


Year first
became
Director


Principal Occupation


P. Thomas Jenkins
Alberta, Canada


2014


Mr. Jenkins has been active for more than 30 years in innovation and economic development in both the private and public sectors. He is currently the Chairman of the Board of Open Text Corporation, a multinational enterprise software firm. He was recently appointed Chancellor of the University of Waterloo. He has served as a director of Open Text Corporation since 1994 and its Chairman since 1998. From 1994 to 2005, Mr. Jenkins was President and Chief Executive Officer, and then from 2005 to 2013, Executive Chairman and Chief Strategy Officer of Open Text Corporation. Prior thereto, he was employed in technical and managerial capacities at a variety of technology companies.


Mr. Jenkins is currently a director of Thomson Reuters Corporation and Manulife Financial Corporation. He is also a director of the C.D. Howe Institute, and a director of the Canadian Council of Chief Executives. Mr. Jenkins was also a member of the board of BMC Software, Inc., a software corporation based in Houston, Texas.


Mr. Jenkins received an M.B.A. from Schulich School of Business at York University, an M.A.Sc. from the University of Toronto and a B.Eng. & Mgt. from McMaster University. Mr. Jenkins received an honorary doctorate of laws from the University of Waterloo and an honorary doctorate of Military Science from the Royal Military College of Canada. He is a recipient of the 2009 Ontario Entrepreneur of the Year, the 2010 McMaster Engineering L.W. Shemilt Distinguished Alumni Award and the Schulich School of Business 2012 Outstanding Executive Leadership award. He is a Fellow of the Canadian Academy of Engineering. Mr. Jenkins was awarded the Canadian Forces Decoration and the Queen’s Diamond Jubilee Medal. Mr. Jenkins is an Officer of the Order of Canada.


Member of the Audit and Risk Committee of the Board.


C. Kent Jespersen(3)
Alberta, Canada


2004


Mr. Jespersen is a corporate director and has had a career and held executive positions in the oil and gas industry for over thirty years. He held senior executive positions with NOVA Corporation of Alberta, Foothills Pipe Lines Ltd. and Husky Oil Limited before assuming the presidency of Foothills Pipe Lines Ltd. and later, NOVA Gas International Ltd. (“NOVA”). At NOVA, he led the non-regulated energy services business (including energy trading and marketing) and all international activities.


Mr. Jespersen is also the Chair and CEO of La Jolla Resources International Ltd. (advisory and investments).


Mr. Jespersen holds a Bachelor of Science in Education and a Master of Science in Education from the University of Oregon.


Member of the Human Resources Committee of the Board.


- 65 -


Name, Province (State)
and Country of
Residence
(1)


Year first
became
Director


Principal Occupation


Michael M. Kanovsky
Alberta, Canada


2004


Mr. Kanovsky is a professional engineer. He co-founded Northstar Energy Corporation (“Northstar”) with initial capital of $400,000 and helped build this entity into an oil and gas producer that was sold to Devon Energy Corporation for approximately $600 million in 1998. During this period, Mr. Kanovsky was responsible for strategy and finance as well as merger and acquisition activity. He initiated Northstar’s entry into electrical cogeneration through its wholly-owned power subsidiary, Powerlink Corporation (“Powerlink”). Powerlink developed one of the first independent power producer (IPP) gas-fired co-generation plants in Ontario and also internationally. In 1997, he founded Bonavista Energy Corporation (previously Bonavista Energy Trust), which has grown to a present day market capitalization of approximately $4.5 billion.


Mr. Kanovsky holds a Bachelor of Science in Mechanical Engineering from Queen’s University as well as a Master of Business Administration from Richard Ivey School of Business at Western University.


Chair of the Governance and Environment Committee.


Karen E. Maidment
Ontario, Canada


2010


Ms. Maidment is a seasoned senior executive and is a corporate director. She was Chief Financial and Administrative Officer (“CFAO”) of BMO Financial Group (“BMO”) from 2007 to 2009. Prior to that, she was Senior Executive Vice-President and CFO from 2003 to 2007 and Executive Vice-President and CFO of BMO from 2000 to 2003. As CFO of BMO, she was responsible for all global finance operations, risk management, legal and compliance, mergers and acquisitions as well as communications. Prior to that, Ms. Maidment held several executive positions with Clarica Life Insurance Company from 1988 to 2000, including CFO. She also led the insurance industry group, working with government, to develop regulations and framework to convert Canada’s major insurers from mutual to public companies.


Ms. Maidment is a past director of Harris Bank, BMO Nesbitt Burns, where she was also Chair of the Audit Committee, Bank of Montreal Pension Fund, Mutual Trustco, MCAP Financial and The Mutual Group (U.S.). She is a member of the Princess Margaret Hospital Foundation Board.


Ms. Maidment holds a Bachelor of Commerce from McMaster University. She is a Chartered Professional Accountant, a Chartered Accountant and is a Fellow of the Chartered Professioanl Accountants of Ontario.


Chair of the Audit and Risk Committee


- 66 -


Name, Province (State)
and Country of
Residence
(1)


Year first
became
Director


Principal Occupation


Yakout Mansour
California, U.S.A.


2011


Mr. Mansour is a corporate director and has over 40 years of experience as both a professional engineer and executive in the electric utility business in Canada, the United States, and abroad. He retired as President and CEO of the California Independent System Operator Corporation (“CAISO”) in 2011, a position he had held since 2005. CAISO is responsible for operating and controlling 80 per cent of the California electric grid, designing and operating the California electricity market, and for settlements of over $8 billion annually. Under Mr. Mansour’s leadership, CAISO established the market and technical foundation to accommodate one of the most aggressive renewable portfolio standards in the world. Prior to that, Mr. Mansour served in senior executive roles at BC Hydro and British Columbia Transmission Corporation where he was responsible for Operation, Asset Management, and Inter-Utility Affairs of the electric grid.


A Professional Engineer and a Fellow of the Institute of Electrical and Electronics Engineers, Mr. Mansour has authored and co-authored numerous publications. He is recognized internationally in the field of Power Engineering and received several distinguished awards for his contributions to the industry.


In 2009, Mr. Mansour was named to the US Department of Energy Electricity Advisory Committee as a vice chair. He also served on the various committees of the North American Electric Reliability Corporation and its predecessor organization, CEGRE, the Transmission Council of the Canadian Electric Association, and the Board of Directors of the Electric Power Research Institute.


Mr. Mansour holds a Bachelor of Science in Electrical Engineering from the University of Alexandria and a Master of Science from the University of Calgary.


Member of the Audit and Risk Committee of the Board.


- 67 -


Name, Province (State)
and Country of
Residence
(1)


Year first
became
Director


Principal Occupation


Georgia Nelson(4)
Illinois, U.S.A.


2014


Ms. Nelson is President and CEO of PTI Resources, LLC, an independent consulting firm established in 2005. Ms. Nelson has had a 35-year career in the power generation industry, serving in various senior executive capacities for Edison International and its subsidiaries between 1971 and 2005. She was President of Midwest Generation Edison Mission Energy from 1999 to her retirement in 2005 and General Manager of EME Americas from 2002 to 2005. Her business responsibilities included management of regulated and unregulated power operations and a large energy trading subsidiary as well as the construction and operation of power generation projects in the United States, Puerto Rico, the United Kingdom, Turkey, Thailand, Indonesia, Australia and Italy. Ms. Nelson has extensive experience in international business negotiations, environmental policy matters and human resources.


Ms. Nelson is currently a director of Cummins Inc., Ball Corporation, and Sims Metal Management Ltd. She is also a director of CH2MHILL Corporation, a privately held company. Ms. Nelson is a past director of Nicor, Inc.


Ms. Nelson is a member of the Executive Committee of the National Coal Council since 2000 and served as Chair from 2006-2008. She serves on the advisory committee of the Center for Executive Women at Northwestern University and is a frequent lecturer at Northwestern University’s Kellogg School of Management on topics related to leadership and governance. Ms. Nelson was named to the 2012 National Association of Corporate Directors (“NACO”) Directorship 100. She is an NACO Board Fellow.


Ms. Nelson holds a Bachelor of Science form Pepperdine University and a Master of Business Administration from the University of Southern California.


Member of the Human Resources Committee of the Board.


- 68 -


Name, Province (State)
and Country of
Residence
(1)


Year first
became
Director


Principal Occupation


Dr. Martha C. Piper
British Columbia, Canada


2006


Dr. Piper is a corporate director and was President and Vice-Chancellor of the University of British Columbia (“UBC”) from 1997 to 2006 (education). Prior to her appointment at UBC, she served as Vice-President, Research at the University of Alberta. She served on the boards of the Alberta Research Council, the Conference Board of Canada and the Centre of Frontier Engineering Research. Dr. Piper was also appointed by the Prime Minister of Canada to the Advisory Council on Science and Technology and served as Chair of the Board of the National Institute for Nanotechnology.


Dr. Piper sits on the boards of the Dalai Lama Centre for Peace & Education, CARE Canada and the Canadian Stem Cell Foundation, all non-public entities.


Dr. Piper holds a Bachelor of Science in Physical Therapy from the University of Michigan, a Master of Arts in Child Development from the University of Connecticut and a Doctorate of Philosophy in Epidemiology and Biostatistics from McGill University. Dr. Piper is an Officer of the Order of Canada and a recipient of the Order of British Columbia.


Member of the Governance and Environment Committee and the Human Resources Committee of the Board.


Notes:

(1)           The following directors are Canadian residents:  William D. Anderson, John P. Dielwart, Dawn L. Farrell, P. Thomas Jenkins, C. Kent Jespersen, Michael M. Kanovsky, Karen E. Maidment and Martha C. Piper.


(2)           Mr. Giffin was a director of AbitibiBowater Inc. (“Abitibi”) from October 29, 2007 until his resignation on January 22, 2009.  In April 2009, Abitibi and certain of its U.S. and Canadian subsidiaries filed voluntary petitions in the United States Bankruptcy Court for the District of Delaware for relief under the provisions of Chapter 11 and Chapter 15 of the United States Bankruptcy Code, as amended, and sought creditor protection under the Companies’ Creditors Arrangement Act (Canada) (the “CCAA”) with the Superior Court of Québec in Canada.  On September 14, 2010, Abitibi announced that it had received approval for its plan of reorganization from unsecured creditors under the CCAA in Canada.  On September 21, 2010, Abitibi announced it had received the necessary creditor approval for its plan of reorganization under Chapter 11 of the U.S. Bankruptcy Code.  On December 9, 2010, Abitibi announced that it had successfully completed its reorganization and emerged from creditor protection under the CCAA in Canada and Chapter 11 of the U.S. Bankruptcy Code.


(3)           Mr. Jespersen resigned from the Board of Directors of CCR Technologies Ltd. (“CCR”) in February 2010.  CCR filed with the Court of Queen’s Bench of Alberta a proposal dated December 1, 2010 pursuant to provisions of Part III Division I of the Bankruptcy and Insolvency Act to restructure and reorganize the financial affairs of CCR, to compromise the claims of the unsecured creditors, restructure the shares of CCR, and to allow it to conduct a restructuring and “rightsizing” of its operations on a going concern basis.  This proposal was approved by the unsecured creditors on December 22, 2010 and by the Court on January 13, 2011.  The Alberta Securities Commission issued a variation order dated February 14, 2011 to partially revoke its cease trade order to permit the implementation of the proposal which was subsequently implemented.


(4)           Ms. Nelson was a director of Tower International (“Tower”) from 2000 to 2007.  In February 2005, Tower began a voluntarily reorganization under Chapter 11 of the United States Bankruptcy Code.  In July 2007, Tower completed the sale of substantially all of its assets to Tower Automotive, LLC, an affiliate of Cerberus Capital Management, L.P., and emerged from bankruptcy court protection.


- 69 -


Officers


The name, province or state and country of residence of each of our officers as at February 18, 2015, their respective position and office and their respective principal occupation during the five preceding years, are set out below.


Name


Principal Occupation


Residence


Dawn L. Farrell


President and Chief Executive Officer


Alberta, Canada

Wayne Collins


Executive Vice-President, Coal and Mining Operations


Alberta, Canada

Dawn E. de Lima


Chief Human Resources and Communications Officer


Alberta, Canada

Brett M. Gellner


Chief Investment Officer


Alberta, Canada

Cynthia Johnston


Executive Vice-President, Corporate Services


Alberta, Canada

David J. Koch


Vice-President, Controller


Alberta, Canada

John H. Kousinioris


Chief Legal and Compliance Officer


Alberta, Canada

Maryse C.C. St.-Laurent


Vice-President Legal and Corporate Secretary


Alberta, Canada

Robert I. Schaefer


Executive Vice-President, Trading and Marketing


Alberta, Canada

Todd J. Stack


Vice-President and Treasurer


Alberta, Canada

Donald Tremblay


Chief Financial Officer


Alberta, Canada


All of the officers of TransAlta have held their present principal occupation or position for the past five years, except for the following:


·              Prior to January 2012, Mrs. Farrell served as Chief Operations Officer from 2009 to 2011.


·              Prior to May 2014, Mr. Collins was Chief Operating Officer of Stanwell Corporation Limited (electric corporation) in Australia.  Prior to July 2011, Mr. Collins was Acting Chief Executive Officer of Stanwell Corporation.


·              Prior to August 2013, Mr. Gellner was Chief Financial Officer of the Corporation.  Prior to June 2010, Mr. Gellner was Vice-President, Commercial Operations of the Corporation.


·              Prior to September 2011, Ms. Johnston was Vice-President, Renewable Operations.


·              Prior to May 2011, Mr. Koch was Vice-President, Operations Finance.  Prior to November 2010, he was Vice-President, Financial Operations.


·              Prior to December 2012, Mr. Kousinioris was a Partner and co-head of the Corporate Commercial Group at Bennett Jones LLP, Barristers and Solicitors (law firm).


·              Prior to April 2012, Ms. de Lima was Chief Human Resources Officer and Executive Vice-President, Communications.  Prior to September 2011, Ms. de Lima was Chief Human Resources Officer.  Prior to March 2011, she was Vice-President Supply Chain Management.


·              Prior to April 2013, Mr. Schaefer was Executive Vice-President, Corporate Development.  Prior to October 2011, Mr. Schaefer was Vice-President, Commercial Operations and Development.  Prior to June 2010, he was Vice-President, Development.


·              Prior to November 2012, Mr. Stack was Treasurer.  Prior to May 2011, Mr. Stack was Assistant Treasurer.  Prior to October 2010, he was Director, Treasury Operations.


- 70 -


·              Prior to March 2014, Mr. Tremblay was Executive Vice President at Brookfield Renewable Energy LP (utilities).  Prior to February 2011, Mr. Tremblay was Executive Vice President and Chief Financial Officer of Brookfield Renewable Power Inc., manager of Brookfield Renewable Power Fund.


As of February 18, 2015, the directors and executive officers of TransAlta, as a group, beneficially owned, directly or indirectly, or exercised control or direction over an aggregate of 1,235,755 of our common shares.  This constitutes less than one per cent of our outstanding common shares.


INTERESTS OF MANAGEMENT AND OTHERS IN MATERIAL TRANSACTIONS


No director or executive officer of TransAlta, no person or company that is the direct or indirect beneficial owner of, or who exercises control or direction over more than ten per cent of  our common shares, and no associate or affiliate of any of them, has or has had any material interest, direct or indirect, in any transaction involving TransAlta within the three most recently completed financial years or to date in 2015 or in any proposed transactions that has materially affected or will materially affect us.


INDEBTEDNESS OF DIRECTORS, EXECUTIVE OFFICERS AND SENIOR OFFICERS


Since January 1, 2014, there has been no indebtedness outstanding to TransAlta from any of our directors, executive officers, senior officers or associates of any such directors, nominees or senior officers.


CORPORATE CEASE TRADE ORDERS, BANKRUPTCIES OR SANCTIONS


Corporate Cease Trade Orders


Except as otherwise disclosed herein, no director, executive officer or controlling security holder of TransAlta Corporation is, as at the date of this Annual Information Form, or has been, within the past ten years before the date hereof, a director or executive officer of any other issuer that, while that person was acting in that capacity:


(i)           was the subject of a cease trade or similar order or an order that denied the relevant company access to any exemption under securities legislation for a period of more than 30 consecutive days; or


(ii)          was subject to an event that resulted, after the person ceased to be a director or executive officer, in the company being the subject of a cease trade or similar order or an order that denied the relevant company access to any exemption under securities legislation for a period of more than 30 consecutive days; or


(iii)         within a year of that person ceasing to act in that capacity, became bankrupt, made a proposal under any legislation relating to bankruptcy or insolvency or was subject to or instituted any proceedings, arrangement or compromise with creditors or had a receiver, receiver manager or trustee appointed to hold its assets.


Personal Bankruptcies


No director, executive officer or controlling security holder of TransAlta Corporation has, within the ten years before the date hereof, become bankrupt, made a proposal under any legislation relating to bankruptcy or insolvency, or became subject to or instituted any proceedings, arrangement or compromise with creditors, or had a receiver, receiver manager or trustee appointed to hold such person’s assets.


- 71 -


Penalties or Sanctions


No director, executive officer or controlling security holder of TransAlta Corporation has:


(i)           been subject to any penalties or sanctions imposed by a court relating to securities legislation or by a securities regulatory authority or has entered into a settlement agreement with a securities regulatory authority, other than penalties for late filing of insider reports; or


(ii)           been subject to any other penalties or sanctions imposed by a court or regulatory body that would likely be considered important to a reasonable investor in making an investment decision.


CONFLICTS OF INTEREST


Circumstances may arise where members of the Board serve as directors or officers of corporations which are in competition to the interests of TransAlta.  No assurances can be given that opportunities identified by such member of the Board will be provided to us.  However, our policies provide that each director and executive officer must comply with the disclosure requirements of the CBCA regarding any material interest. If a declaration of material interest is made, the declaring director shall not vote on the matter if put to a vote of the Board. In addition, the declaring director and executive officer may be requested to recuse himself or herself from the meeting when such matter is being discussed.


LEGAL PROCEEDINGS AND REGULATORY ACTIONS


TransAlta is occasionally named as a party in claims and legal proceedings which arise during the normal course of its business.  We review each of these claims, including the nature of the claim, the amount in dispute or claimed and the availability of insurance coverage.  There can be no assurance that any particular claim will be resolved in our favour or that such claim may not have a material adverse effect on TransAlta.  For further information, please refer to Note 34 of our audited consolidated financial statements for the year ended December 31, 2014 which financial statements are incorporated by reference herein.  See “Documents Incorporated by Reference”.


TRANSFER AGENT AND REGISTRAR


The transfer agent and registrar for our common shares and Series A, Series C, Series E and Series G First Preferred Shares is CST Trust Company.  CST Trust Company succeeded CIBC Mellon Trust Company as our transfer agent.  On November 1, 2010, CIBC Mellon Trust Company sold its issuer services business to Canadian Stock Transfer Company Inc. which operated the business on their behalf until August 30, 2013, at which time CST Trust Company, an affiliate of Canadian Stock Transfer Company Inc., received federal approval to commence business.  Common shares are transferable in Vancouver, Calgary, Toronto, Montréal, and Halifax. Series A, Series C, Series E and Series G First Preferred Shares are transferable in Calgary and Toronto. The transfer agent and registrar for our common shares in the United States is Computershare at its principal office in Jersey City, New Jersey.


INTERESTS OF EXPERTS


Ernst & Young LLP, Chartered Accountants, 1000, 440 – 2nd Avenue, S.W., Calgary, Alberta, T2P 5E9 are the auditors of TransAlta.


Our auditors, Ernst & Young LLP, are independent in accordance with the Rules of Professional Conduct of the Institute of Chartered Accountants of Alberta and have complied with the SEC’s rules on auditor independence.


- 72 -


ADDITIONAL INFORMATION


Additional information in relation to TransAlta may be found under TransAlta’s profile on SEDAR at www.sedar.com and EDGAR at www.sec.gov.


Additional information including directors’ and officers’ remuneration and indebtedness, principal holders of our securities and securities authorized for issuance under equity compensation plans (all where applicable), is contained in our Management Proxy Circular for the most recent annual meeting of shareholders that involved the election of directors and can be obtained upon request from our Investor Relations department, or as filed on SEDAR at www.sedar.com and EDGAR at www.sec.gov.


Additional financial information is provided in our audited consolidated financial statements as at and for the year ended December 31, 2014 and in the related Annual MD&A, each of which is incorporated by reference in this AIF.  See “Documents Incorporated by Reference”.


AUDIT AND RISK COMMITTEE


General


The members of TransAlta’s Audit and Risk Committee (“ARC”) satisfy the requirements for independence under the provisions of Canadian Securities Regulators, National Instrument 52-110 Audit Committees, Section 303A of the NYSE Rules and Rule 10A-3 under the U.S. Securities and Exchange Act of 1934.  The ARC’s Charter requires that it be comprised of a minimum of three independent directors.  The ARC is comprised of five independent members, Karen E. Maidment (Chair), William D. Anderson, John P. Dielwart, Alan J. Fohrer, and Yakout Mansour.


All members of the committee are financially literate pursuant to both Canadian and U.S. securities requirements and each of Ms. Karen E. Maidment and Mr. William D. Anderson have been determined by the Board to be an “audit committee financial expert”, within the meaning of Section 407 of the United States Sarbanes Oxley Act of 2002 (“Sarbanes Oxley Act”).


Mandate of the Audit and Risk Committee


The ARC provides assistance to the Board in fulfilling its oversight responsibilities with respect to i) the integrity of the Corporation’s financial statements and financial reporting process, ii) the systems of internal financial controls and disclosure controls established by management of TransAlta (“Management”), iii) the risk identification and assessment process conducted by Management including the programs established by Management to respond to such risks, iv) the internal audit function, v) compliance with financial, legal and regulatory requirements and vi) the external auditors’ qualifications, independence and performance.  In so doing, it is the ARC’s responsibility to maintain an open avenue of communication between it and the external auditors, the internal auditors and the Management.


The function of the ARC is oversight.  Management is responsible for the preparation, presentation and integrity of the interim and annual financial statements and related disclosure documents. Management is also responsible for maintaining appropriate accounting and financial reporting policies and systems of internal controls and disclosure controls and procedures to comply with accounting standards, applicable laws and regulations which provide reasonable assurance that the assets of the Corporation are safeguarded and transactions are authorized, executed, recorded and properly reported.


While the ARC has the responsibilities and powers set forth herein, it is not the duty of the ARC to plan or conduct audits or to determine that the Corporation’s financial statements are complete and accurate and in accordance with generally accepted accounting principles.  This is the responsibility of Management and the external auditors.


The designation of a member or members as an “audit committee financial expert” is based on that individual’s education and experience, which the individual will bring to bear in carrying out his or her duties on the ARC.  


- 73 -


Designation as an “audit committee financial expert” does not impose on such person any duties, obligations and liability that are greater than the duties, obligations and liability imposed on another member of the Committee and Board in the absence of such designation.


Management is also responsible for the identification and management of the Corporation’s risks and the development and implementation of policies and procedures to mitigate such risks.  The ARC’s role is to provide oversight in order to ensure that the Corporation’s assets are protected and safeguarded within reasonable business limits.  The ARC reports to the Board on its risk oversight responsibilities.


Audit and Risk Committee Charter


The Charter of the ARC is attached as Appendix “A”.


Relevant Education and Experience of Audit and Risk Committee Members


The following is a brief summary of the education or experience of each member of the ARC that is relevant to the performance of their responsibilities as a member of the ARC, including any education or experience that has provided the member with an understanding of the accounting principles that we use to prepare our annual and interim financial statements.


Name of ARC Member


Relevant Education and Experience


W. D. Anderson


Mr. Anderson is a Chartered Accountant, with 17 years experience with a major Chartered Accountant firm in Canada. Mr. Anderson has served as CEO of a public company and as CFO of several public companies. In such capacities, Mr. Anderson actively supervised persons engaged in preparing, auditing, analyzing or evaluating financial statements. Mr. Anderson has also served as a principal financial officer and accounting officer and as a director and audit committee chair and member of several public companies. He has served on the board and audit committee of a public company that reports under U.S. GAAP.


J. P. Dielwart


Mr. Dielwart is currently the Vice-Chairman of ARC Financial Corp., an energy focused private equity manager. Mr. Dielwart served as the chief executive officer of a Canadian publicly listed company for sixteen years during which time he had extensive experience actively supervising the finance and accounting functions and public accountants. Mr. Dielwart also serves on the audit committee of Tesco Corporation, a public company.


A. J. Fohrer


Prior to his retirement in December 2010, Mr. Fohrer was Chairman and CEO of SCE, a subsidiary of Edison and the largest electric utilities in the United States. Prior to that, Mr. Fohrer served as Executive Vice-President, Treasurer and Chief Financial Officer of both Edison and SCE. Mr. Fohrer also serves on the audit committee of PNM Resources Inc., a public company.


K. E. Maidment


Ms. Maidment is a Chartered Accountant. Ms. Maidment has served as a CFO with financial oversight responsibilities for TSX and NYSE listed public companies for over 15 years. She has also held positions where she was responsible for global finance operations, risk management, legal and compliance, communications and mergers and acquisitions. In addition, Ms. Maidment has worked with government bodies in order to develop regulations and frameworks for the conversion of major insurers from mutual to public companies. Ms. Maidment holds a bachelor of commerce from McMaster University, and in 2000 was named a Fellow of the Chartered Professional Accountants of Ontario.


- 74 -


Name of ARC Member


Relevant Education and Experience


Y. Mansour


Mr. Mansour has over 40 years of experience as an executive in the electric utility business. He served as President and CEO of the California Independent System Operation Corporation and was a senior executive at BC Hydro and the British Columbia Transmission Corporation. Mr. Mansour has supervised and dealt with financial reporting and internal control.


Other Board Committees


In addition to the ARC, TransAlta has two other standing committees: the Governance and Environment Committee and the Human Resources Committee.  The members of these committees as of February 18, 2015 are:


Governance and Environment Committee


Human Resources Committee


Chair: Michael M. Kanovsky


Chair: Timothy W. Faithfull

William D. Anderson


P. Thomas Jenkins

John P. Dielwart


C. Kent Jespersen

Alan J. Fohrer


Georgia Nelson

Martha C. Piper


Martha C. Piper


The Charters of the Governance and Environment Committee and the Human Resources Committee may be found on our website under Governance Board Committees at www.transalta.com.  Further information about the Board and our corporate governance may also be found on our website or in our Management Proxy Circular which is filed on SEDAR at www.sedar.com and EDGAR at www.sec.gov.


For the years ended December 31, 2014 and December 31, 2013, Ernst & Young LLP and its affiliates were paid $3,587,987 and $3,384,692 respectively, as detailed below:


Ernst & Young LLP


Year Ended Dec. 31


2014


2013


Audit Fees


$

2,973,020


$

2,931,297


Audit-related fees


586,900


409,950


Tax fees


28,067


43,445


All other fees


0


0


Total


$

3,587,987


$

3,384,692


No other audit firms provided audit services in 2014 or 2013.


The nature of each category of fees is described below:


Audit Fees


Audit fees were paid for professional services rendered by the auditors for the audit of our annual financial statements or services provided in connection with statutory and regulatory filings or engagements, including the translation from English to French of our financial statements and other documents.  Total audit fees for 2014 include payments related to 2013 in the amount of $1,369,460.


- 75 -


Audit-Related Fees


The audit-related fees in 2014 were primarily for work performed by Ernst & Young LLP in relation to compliance and regulatory reporting, debt issuances and miscellaneous accounting advice provided to the Corporation. The audit-related fees in 2013 were primarily for work performed by Ernst & Young LLP in relation to compliance and regulatory reporting, common share issuances, debt issuances and miscellaneous accounting advice provided to the Corporation.


Tax Fees


The tax fees for 2014 and 2013 relate to various tax related matters in our domestic and foreign operations.


All Other Fees


Nil


Pre-Approval Policies and Procedures


The ARC has considered whether the provision of services other than audit services is compatible with maintaining the auditors’ independence.  In May 2002, the ARC adopted a policy (the “Policy”) that prohibits TransAlta from engaging the auditors for “prohibited” categories of non-audit services and requires pre-approval of the ARC for other permissible categories of non-audit services, such categories being determined under the Sarbanes-Oxley Act.  The Policy also provides that the Chair of the ARC may approve permissible non-audit services during the quarter and report such approval to the ARC at its next regularly scheduled meeting.


- 76 -


APPENDIX “A”


AUDIT AND RISK COMMITTEE CHARTER


TRANSALTA CORPORATION

(the “Corporation”)


A.                                    Establishment of Committee and Procedures


1.                                      Composition of Committee


The Audit and Risk Committee (the “Committee”) of the Board of Directors (the “Board”) of TransAlta Corporation (the “Corporation”) shall consist of not less than three Directors.  All members of the Committee shall be determined by the Board to be independent as required under the provisions of Canadian Securities Regulators’ Multilateral Instrument 52-110 Audit Committees, Section 303A of the New York Stock Exchange rules and Rule 10A-3 of the U.S. Securities and Exchange Act of 1934, as such rules apply to audit committee members.  All members of the Committee must be financially literate pursuant to both Canadian and U.S. securities requirements and at least one member must be determined by the Board to be an “audit committee financial expert” within the meaning of Section 407 of the United States Sarbanes-Oxley Act of 2002 (the “Sarbanes-Oxley Act’).  Determinations as to whether a particular director satisfies the requirements for membership on the Committee shall be made by the Board at the recommendation of the Governance and Environment Committee.


2.                                      Appointment of Committee Members


Members of the Committee shall be appointed from time to time by the Board, on the recommendation of the Governance and Environment Committee, and shall hold office until the next annual meeting of shareholders, or until their successors are earlier appointed, or until they cease to be Directors of the Corporation.


3.                                      Vacancies


Where a vacancy occurs at any time in the membership of the Committee, it may be filled by the Board and on the recommendation of the Governance and Environment Committee.  The Board shall fill any vacancy if the membership of the Committee is less than three directors.


4.                                      Committee Chair


The Board shall appoint a Chair for the Committee on the recommendation of the Governance and Environment Committee.


5.                                      Absence of Committee Chair


If the Chair of the Committee is not present at any meeting of the Committee, one of the members of the Committee who is present at the meeting shall be chosen by the Committee to preside at the meeting.


6.                                      Secretary of Committee


The Committee shall appoint a Secretary who need not be a director of the Corporation.


A-1


7.                                      Meetings


The Chair of the Committee may call a regular meeting of the Committee.  The Committee shall meet at least quarterly and at such other time during each year as it deems appropriate to fulfill its responsibilities.  In addition, the Chair of the Committee or any two members may call a special meeting of the Committee at any time.


The Committee shall also meet in separate executive session.


8.                                      Quorum


A majority of the members of the Committee, present in person or by telephone or other telecommunication device that permits all persons participating in the meeting to speak to each other shall constitute a quorum.


9.                                      Notice of Meetings


Notice of the time and place of every meeting shall be given in writing (including by way of written facsimile communication or email) to each member of the Committee at least 48 hours prior to the time fixed for such meeting, provided, however, that a member may in any manner waive notice of a meeting; and attendance of a member at a meeting constitutes a waiver of notice of the meeting, except where a member attends for the express purpose of objecting to the transaction of any business on the ground that the meeting is not lawfully called.  Notice of every meeting shall also be provided to the external and internal auditors.


10.                               Attendance at Meetings


At the invitation of the Chair of the Committee, other Board members the President and Chief Executive Officer (“CEO”), other officers or employees of the Corporation, the external auditors, and other experts or consultants may attend a meeting of the Committee.


11.                               Procedure, Records and Reporting


Subject to any statute or the articles and by-laws of the Corporation, the Committee shall fix its own procedures at meetings, keep records of its proceedings and report to the Board generally not later than the next scheduled meeting of the Board.


12.                               Review of Charter and Evaluation of Committee


The Committee shall evaluate its performance and review and assess the adequacy of its Charter at least annually or otherwise, as it deems appropriate.  All changes proposed by the Committee are reviewed and approved by the Governance and Environment Committee and the Board.


13.                               Outside Experts and Advisors


The Committee Chair, on behalf of the Committee, or any of its members is authorized, at the expense of the Corporation, when deemed necessary or desirable, to retain independent counsel, outside experts and other advisors to advise the Committee independently on any matter. The retention of such counsel, expert or advisor in no way requires the Committee to act in accordance with the recommendations of such counsel, expert or advisor.


B.                                    Duties and Responsibilities of the Chair


The fundamental responsibility of the Chair of the Committee is to effectively manage the duties of the Committee.


A-2


The Chair is responsible for:


1.              Chairing meetings of the Committee and ensuring that the Committee is properly organized so that it functions effectively and meets its obligations and responsibilities.


2.              Establishing the frequency of Committee meetings, duly convening the same and confirming that quorum is present when required.


3.              Working with the CEO, the Chief Financial Officer (the “CFO”) and the Vice President Legal and Corporate Secretary on the development of agendas and related materials for the meetings.


4.              Providing leadership to the Committee and assisting the Committee in ensuring the proper and timely discharge of its responsibilities.


5.              Reporting to the Board on the recommendations and decisions of the Committee.


C.                                    Mandate of the Committee


The Committee provides assistance to the Board in fulfilling its oversight responsibilities with respect to i) the integrity of the Corporation’s financial statements and financial reporting process, ii) the systems of internal financial controls and disclosure controls established by Management, iii) the risk identification and assessment process conducted by Management including the programs established by Management to respond to such risks, iv) the internal audit function, v) compliance with financial, legal and regulatory requirements and vi) the external auditors’ qualifications, independence and performance.  In so doing, it is the Committee’s responsibility to maintain an open avenue of communication between it and the external auditors, the internal auditors and the Management of the Corporation.


The function of the Committee is oversight.  Management is responsible for the preparation, presentation and integrity of the interim and annual financial statements and related disclosure documents.  Management of the Corporation is also responsible for maintaining appropriate accounting and financial reporting policies and systems of internal controls and disclosure controls and procedures to comply with accounting standards, applicable laws and regulations which provide reasonable assurance that the assets of the Corporation are safeguarded and transactions are authorized, executed, recorded and properly reported.


While the Committee has the responsibilities and powers set forth herein, it is not the duty of the Committee to plan or conduct audits or to determine that the Corporation’s financial statements are complete and accurate and in accordance with generally accepted accounting principles.  This is the responsibility of Management and the external auditors.


The Committee must also designate at least one member as an “audit committee financial expert”.  The designation of a member or members as an “audit committee financial expert” is based on that individual’s education and experience, which the individual will bring to bear in carrying out his or her duties on the Committee.  Designation as an “audit committee financial expert” does not impose on such person any duties, obligations and liability that are greater than the duties, obligations and liability imposed on another member of the Committee and Board in the absence of such designation.


Management is also responsible for the identification and management of the Corporation’s risks and the development and implementation of policies and procedures to mitigate such risks.  The Committee’s role is to provide oversight in order to ensure that the Corporation’s assets are protected and safeguarded within reasonable business limits.  The Committee reports to the Board on its risk oversight responsibilities.


A-3


D.                                    Duties and Responsibilities of the Committee


1.                                      Financial Reporting, External Auditors and Financial Planning


A)            Duties and Responsibilities Related to Financial Reporting and the Audit Process


(a)           Review with Management and the external auditors the Corporation’s financial reporting process, the work to be conducted in conjunction with the annual audit and the preparation of the financial statements, including, without limitation, the annual audit plan of the external auditors, the judgment of the external auditors as to the quality, not just the acceptability, of and the appropriateness of the Corporation’s accounting principles as applied in its financial reporting and the degree of aggressiveness or conservatism of the Corporation’s accounting principles and underlying estimates;


(b)           Review with Management and the external auditors the Corporation’s audited annual financial statements, including the notes thereto, “Management’s Discussion and Analysis”, the related earnings release, and recommend their approval to the Board for release to the public;


(c)           Review with Management and the external auditors the Corporation’s interim financial statements, including the notes thereto, “Management’s Discussion and Analysis”, the related earnings release, and approve their release to the public as required;


(d)           In reviewing the financial statements and related financial disclosure, the Committee shall review and discuss with Management and the external auditors:


(i)            any changes in accounting principles, practices or policies considering their applicability to the business and financial impact;


(ii)           Management’s processes for formulating sensitive accounting estimates and the reasonableness of the estimates;


(iii)          the use of “pro forma” or “non-comparable” information and the applicable reconciliation;


(iv)          alternative treatments of financial information within generally accepted accounting principles that have been discussed between Management and the auditors, ramifications of the use of such alternative disclosures and treatments and the treatment preferred by the external auditors; and


(v)           disclosures made to the Committee by the CEO and CFO during their certification process for the relevant periodic/annual report filed with securities regulators to ensure that information required to be disclosed is recorded, processed, summarized and reported within the time periods specified for the reporting period.  Obtain assurances from the CEO and CFO as to the adequacy and effectiveness of the Corporation’s disclosure controls and procedures and systems of internal control over financial reporting and that any fraud involving Management or other employees who have a significant role in the Corporation’s internal controls is reported to the Committee.


(e)           In reviewing the financial statements and related financial disclosure, the Committee shall also, with the external auditors:


(i)            discuss the cooperation they received from Management during the course of their review and their access to all records, data and information requested; and


A-4


(ii)           satisfy itself that there are no unresolved issues between Management and the external auditors that could reasonably be expected to materially affect the financial statements.


(f)            Review quarterly with senior Management, the Chief Legal and Compliance Officer (as necessary outside legal advisors), and the Corporation’s internal and external auditors, the effectiveness of the Corporation’s internal controls to ensure the Corporation is in compliance with legal and regulatory requirements and the Corporation’s policies;


(g)           Review with Management and the external auditors the processes relating to the assessment of potential fraud, programs and controls to mitigate the risk of fraud, and the processes put in place for monitoring the risks within the targeted areas; and


(h)           Discuss with Management and the external auditors any correspondence from or with regulators or governmental agencies, any employee complaints or any published reports that raise material issues regarding the Corporation’s financial statements or accounting policies.


B)            Duties and Responsibilities Related to the External Auditors


(a)           The Committee shall have direct responsibility for the compensation and oversight of the external auditors including nominating the external auditors to the Board for appointment by the shareholders at the Corporation’s general annual meeting.  In performing its function, the Committee shall:


(i)            review and approve annually the external auditors audit plan;


(ii)           review and approve the basis and amount of the external auditors’ fees and ensure the Corporation has provided appropriate funding for payment of compensation to the external auditors;


(iii)          subject to the delegation granted to the Chair of the Committee, pre-approve all audit related services including all non-prohibited non-audit services provided by the external auditors; the Chair of the Committee is authorized to approve all audit related services including non-prohibited non-audit services provided by the external auditors, and shall report all such approvals to the Committee at its next scheduled meeting;


(iv)          review and discuss annually with the external auditors all relationships that the external auditors and their affiliates have with the Corporation and its affiliates in order to determine the external auditors’ independence, including, without limitation, (a) requesting, receiving and reviewing, at least annually, a formal written statement from the external auditors delineating all relationships that may reasonably be thought to bear on their independence with the Corporation; (b) discussing with the external auditors any relationships or services that the external auditors believe may affect their objectivity and professional skepticism; (c) reviewing with the external auditors the experience and qualifications of the senior personnel who are providing audit services to the Corporation; (d) reviewing the quality control procedures of the external auditors, including obtaining confirmation that the external auditors are in compliance with Canadian and U.S. regulatory registration requirements; and (e) evaluating the communication and interaction with the external auditor including quality of service considerations;


A-5


(v)           perform, every five years, and in the year preceding the change of audit partner, (a) comprehensive review of the external auditor which takes into consideration the impact of the tenure of the audit firm on audit quality, trends in the audit firm’s performance and expertise in the industry, incidences of independence threats and the effectiveness of safeguards to mitigate those threats, (b) the responsiveness of the audit firm to changes in the entity’s business and suggestions for improvement from regulators, the audit committee and/or management, (c) the consistency and rigour of the professional skepticism applied by the external auditor, and the quality of the engagement team and its communications, review of CPAB inspection findings since the previous comprehensive review and how the audit firm responded to these findings, and (d) following this comprehensive review, an evaluation on whether the audit firm should be retained as the Corporation’s external auditor;


(vi)          inform the external auditors and Management that the external auditors shall have direct access to the Committee at all times, as well as the Committee to the external auditors;


(vii)       instruct the external auditors that they are ultimately accountable to the Committee as representatives of the shareholders of the Corporation; and


(viii)        at least annually, obtain and review the external auditors’ report with respect to the auditing firm’s internal quality-control procedures, any material issues raised by the most recent internal quality-control review or peer review of the auditing firm, any inquiry or investigation by governmental or professional authorities within the preceding five years undertaken respecting one or more independent audits carried out by the external auditors, and any steps taken to deal with any such issues.


C)            Duties and Responsibilities Related to Financial Planning


(a)           Review and recommend to the Board for approval the Corporation’s issuance and redemption of securities (including the review of all public filings to effect any of the issuances or redemptions), financial commitments and limits, and any material changes underlying any of these commitments;


(b)           Review annually the Corporation’s annual tax plan;


(c)           Receive regular updates with respect to the Corporation’s financial obligations, loans, credit facilities, credit position and financial liquidity;


(d)           Review annually with Management the Corporation’s overall financing plan in support of the Corporation’s capital expenditure plan and overall budget/medium range forecast; and


(e)           Review with Management at least annually the approach and nature of earnings guidance and financial information to be disclosed to analysts and rating agencies.


2.             Internal Audit


(a)           Review and consider, as appropriate, any significant reports and recommendations made by internal audit relating to internal audit issues, together with Management’s response thereto;


(b)           Review annually the internal audit department’s charter, the scope and plans for the work of the internal audit group, the adequacy of the group’s resources, the internal auditors’ access to the Corporation’s records, property and personnel;


A-6


(c)           Recognize and advise senior Management that the internal auditors shall have unfettered access to the Committee, as well as the Committee to the internal auditors;


(d)           Meet separately with Management, the external auditors and internal auditors to review issues and matters of concern respecting audits and financial reporting;


(e)           Review with the Corporation’s senior financial Management and the Director, Internal Audit the adequacy of the Corporation’s systems of internal control and procedures; and


(e)           Recommend to the Human Resources Committee the appointment, termination or transfer of the Director, Internal Audit.


3.             Risk Management


The Board is responsible for ensuring that the Corporation has adopted processes and key policies for the identification, assessment and management of its principal risks.  The Board has delegated to the Committee the responsibility for the oversight of Management’s identification, and evaluation, of the Corporation’s principal risks, and the implementation of appropriate policies, processes and systems to manage or mitigate the risks within the Corporation’s risk appetite.  The Committee reports to the Board thereon.


The Committee shall:


(a)           Review, at least quarterly, Management’s assessment of the Corporation’s principal risks; discuss with Management the processes for the identification of these risks and the efficacy of the policies and procedures for mitigating and/or addressing these risks;


(b)           Receive and review Managements’ quarterly risk update including an update on residual risks;


(c)           Review the Corporation’s enterprise risk management framework and reporting methodology;


(d)           Review annually the Corporation’s Financial and Commodity Exposure Management Policies and approve changes to such policies;


(e)           Review and approve the Corporation’s strategic hedging program, guidelines and risk tolerance;


(f)            Review and monitor quarterly results of financial and commodity exposure management activities, including foreign currency and interest rate risk strategies, counterparty credit exposure and the use of derivative instruments;


(g)           Review the Corporation’s annual insurance program, including the risk retention philosophy, potential exposure and corporate liability protection programs;


(h)           Periodically consider the respective roles and responsibilities of the external auditor, the internal audit department, internal and external counsel concerning risk management and review their performance in relation to such roles and responsibilities; and


(i)            Annually, together with Management, report and review with the Board:


(i)         the Corporation’s principal risks and overall risk appetite/profile;


(ii)        the Corporation’s strategies in addressing its risk profile;


A-7


(iii)     the processes, policies, procedures and controls in place to manage or mitigate the principal risks; and


(iv)     the overall effectiveness of the enterprise risk management process and program.


4.           Governance


A)            Public Disclosure, Legal and Regulatory Reporting


(a)           On behalf of the Committee, the Chair shall review all public disclosure inclusive of material financial information extracted or derived from the Corporation’s financial statements prior to dissemination to the public;


(b)           Review quarterly with the Chief Legal and Compliance Officer, and, if necessary, outside legal advisors, significant legal, compliance or regulatory matters that may have a material effect on the Corporation’s financial statements;


(c)           Discuss with the external auditors their perception of the Corporation’s financial and accounting personnel, any recommendations which the external auditors may have, including those contained in the Management letter, with respect to improving internal financial controls, choice of accounting principles or management reporting systems, and review all Management letters from the external auditors together with Management’s written responses thereto;


(d)           Review with Management, the external auditors and internal legal counsel (external counsel if necessary), any litigation, claim or contingency, including tax assessments, that could have a material effect upon the financial position of the Corporation, and the manner in which these may be or have been disclosed in the financial statements;


(e)           Review annually the Insider Trading Policy and approve changes as required; and


(f)            Review annually the Corporation’s Disclosure Policy and Social Media Policy to ensure continued applicability with the law and the Corporation’s disclosure principles.


B)            Pension Plan Governance


(a)           Review annually the Annual Pension Report and financial statements of the Corporation’s pension plans including the actuarial valuation, asset/liability forecast, asset allocation, manager performance and plan operating costs and reporting thereon to the Board annually; and


(b)           Together with the Human Resources Committee of the Board, review annually, and as required, the overall governance of the Corporation’s Pension Plans, approving the broad objectives of the plans, the statement of investment policy, the appointment of investment managers, and reporting thereon to the Board annually.


C)            Information Technology – Cyber Security


(a)           Receive bi-annually a system status update with respect to the Corporation’s core IT operating systems; and


(b)           Review annually the Corporation’s cyber security programs and their effectiveness.  Receive an update on the Corporation’s compliance program for cyber threats and security.


A-8


D)            Administrative Responsibilities


(a)           Review the annual audit of expense accounts and perquisites of the Directors, the CEO and her direct reports and their use of Corporate assets;


(b)           Establish procedures for the receipt, retention and treatment of complaints received by the Corporation regarding accounting, internal and disclosure controls or auditing matters and the confidential, anonymous submission by employees, contractors, shareholders and other stakeholders of concerns regarding accounting, auditing, ethical or legal violations;


(c)           Review all incidents, complaints or information reported through the Ethics Help Line and/or Management;


(d)           Initiate investigations of complaints or allegations as necessary, report to the Board thereon and ensure that appropriate action is taken as necessary to address the matter;


(e)           Review and approve the Corporation’s hiring policies for employees or former employees of the external auditors and monitor the Corporation’s adherence to the policy; and


(f)            Report annually to shareholders on the work of the Committee during the year.


E.            Compliance and Powers of the Committee


(a)           The responsibilities of the Committee comply with applicable Canadian laws and regulations, such as the rules of the Canadian Securities Administrators, and with the disclosure and listing requirements of the Toronto Stock Exchange, as they exist on the date hereof.  In addition, this Charter complies with applicable U.S. laws, such as the Sarbanes-Oxley Act and the rules and regulations adopted thereunder, and with the New York Stock Exchanges’ corporate governance standards, as they exist on the date hereof.


(b)           The Committee may, at the request of the Board or on its own initiative, investigate such other matters as are considered necessary or appropriate in carrying out its mandate.


A-9


APPENDIX “B”


GLOSSARY OF TERMS


This Annual Information Form includes the following defined terms:


Air Emissions – Substances released to the atmosphere through industrial operations. For the fossil-fuel-fired power sector, the most common air emissions are sulphur dioxide, oxides of nitrogen, mercury, and greenhouse gases.


Power Purchase Arrangement (PPA) – A long-term arrangement established by regulation for the sale of electric energy from formerly regulated generating units to PPA Buyers.


Availability – A measure of time, expressed as a percentage of continuous operation 24 hours a day, 365 days a year, that a generating unit is capable of generating electricity, regardless of whether or not it is actually generating electricity.


Boiler – A device for generating steam for power, processing or heating purposes, or for producing hot water for heating purposes or hot water supply. Heat from an external combustion source is transmitted to a fluid contained within the tubes of the boiler shell.


Capacity – The rated continuous load-carrying ability, expressed in megawatts, of generation equipment.


Carbon Capture and Storage (CCS) – An approach to mitigating the contribution of greenhouse gas emissions to global warming, which is based on capturing carbon dioxide emissions from industrial operations and permanently storing them in deep underground formations.


Cogeneration – A generating facility that produces electricity and another form of useful thermal energy (such as heat or steam) used for industrial, commercial, heating, or cooling purposes.


Combined-Cycle – An electric generating technology in which electricity is produced from otherwise lost waste heat exiting from one or more gas (combustion) turbines. The exiting heat is routed to a conventional boiler or to a heat recovery steam generator for use by a steam turbine in the production of electricity. This process increases the efficiency of the electric generating unit.


Dividend – Refers to a cash dividend declared payable by TransAlta on the outstanding Shares.


eERP – ecoEnergy for Renewable Power program, a program established by the Federal Government.


Force Majeure – Literally means “greater force”. These clauses excuse a party from liability if some unforeseen event beyond the control of that party prevents it from performing its obligations under the contract.


Geothermal Facility – A plant in which the prime mover is a steam turbine. The turbine is driven either by steam produced from hot water or by natural steam that derives its energy from heat found in rocks or fluids at various depths beneath the surface of the earth. The energy is extracted by drilling and/or pumping.


Gigawatt – A measure of electric power equal to 1,000 megawatts.


Gigawatt hour (GWh) – A measure of electricity consumption equivalent to the use of 1,000 megawatts of power over a period of one hour.


Global Adjustment - is the difference between the total payments made to certain contracted or regulated generators/demand management projects, and market revenues and is calculated each month. The adjustment is determined by the Ontario Independent Electricity System Operator


Greenhouse Gas (GHG) – Gases having potential to retain heat in the atmosphere, including water vapour, carbon dioxide, methane, nitrous oxide, hydrofluorocarbons, and perfluorocarbons.


B-1


Megawatt (MW) – A measure of electric power equal to 1,000,000 watts.


Megawatt hour (MWh) – A measure of electricity consumption equivalent to the use of 1,000,000 watts of power over a period of one hour.


Net Capacity – The maximum capacity or effective rating, modified for ambient limitations, that a generating unit or power plant can sustain over a specific period, less the capacity used to supply the demand of station service or auxiliary needs.


Supercritical Technology – The most advanced coal-combustion technology in Canada employing a supercritical boiler, high-efficiency multi-stage turbine, flue gas desulphurization unit (scrubber), bag house, and low nitrogen oxide burners.


Terajoule (TJ) – A measurement of work or energy equal to 1,000,000,000,000 joules or 1,000 gigajoules.


Uprate – To increase the rated electrical capability of a power generating facility or unit.


WPPI – Wind Power Production Incentive payments from the Federal Government.


B-2


EX-13.2 3 a15-3974_1ex13d2.htm EX-13.2 MANAGEMENT'S DISCUSSION AND ANALYSIS FOR THE YEAR ENDED DECEMBER 31, 2014.

Exhibit 13.2


Management’s Discussion and Analysis


Table of Contents


Non-IFRS Measures

16

Liquidity and Capital Resources

49

Forward-Looking Statements

16

Unconsolidated Structured Entities or Arrangements

54

Highlights

18

Climate Change and the Environment

54

Business Environment

25

2015 Financial Outlook

57

Strategy and Capability to Deliver Results

28

Risk Management

60

Significant 2014 Events and Subsequent Events

30

Critical Accounting Policies and Estimates

70

Discussion of Segmented Comparable Results

32

Current Accounting Changes

75

Asset Impairment Charges and Reversals

40

Future Accounting Changes

76

Other Consolidated Results

41

Fourth Quarter

77

Additional IFRS Measures

43

Selected Quarterly Information

82

Earnings and Other Measures on a Comparable Basis

43

Disclosure Controls and Procedures

83

Financial Instruments

47


This Management’s Discussion and Analysis (“MD&A”) should be read in conjunction with our audited annual 2014 consolidated financial statements and our 2015 Annual Information Form for the year ended Dec. 31, 2014. Our consolidated financial statements have been prepared in accordance with International Financial Reporting Standards (“IFRS”) for Canadian publicly accountable enterprises as issued by the International Accounting Standards Boards (“IASB”) and in effect at Dec. 31, 2014. All dollar amounts in the following discussion, including the tables, are in millions of Canadian dollars unless otherwise noted. This MD&A is dated Feb. 18, 2015. Additional information respecting TransAlta Corporation (“TransAlta”, “we”, “our”, “us”, or the “Corporation”), including our Annual Information Form, is available on SEDAR at www.sedar.com, on EDGAR at www.sec.gov, and on our website at www.transalta.com.


TransAlta Corporation   |   2014 Annual Report

15


Management’s Discussion and Analysis


Non-IFRS Measures


We evaluate our performance and the performance of our business segments using a variety of measures. Certain of the financial measures discussed in this MD&A are not defined under IFRS and, therefore, should not be considered in isolation or as an alternative to or to be more meaningful than net earnings attributable to common shareholders or cash flow from operating activities, as determined in accordance with IFRS, when assessing our financial performance or liquidity. These measures may not be comparable to similar measures presented by other issuers and should not be considered in isolation or as a substitute for measures prepared in accordance with IFRS. See the Comparable Funds from Operations and Comparable Free Cash Flow, and Earnings and Other Measures on a Comparable Basis sections of this MD&A for additional information.


Forward-Looking Statements


This MD&A, the documents incorporated herein by reference, and other reports and filings made with securities regulatory authorities include forward-looking statements or information (collectively referred to herein as “forward-looking statements”) within the meaning of applicable securities legislation. All forward-looking statements are based on our beliefs as well as assumptions based on information available at the time the assumptions were made and on management’s experience and perception of historical trends, current conditions, and expected future developments, as well as other factors deemed appropriate in the circumstances. Forward-looking statements are not facts, but only predictions and generally can be identified by the use of statements that include phrases such as “may”, “will”, “believe”, “expect”, “anticipate”, “intend”, “plan”, “project”, “foresee”, “potential”, “enable”, “continue”, or other comparable terminology. These statements are not guarantees of our future performance and are subject to risks, uncertainties, and other important factors that could cause our actual performance to be materially different from that projected.


In particular, this MD&A contains forward-looking statements pertaining to our business and anticipated future financial performance; our success in executing on our growth projects; the timing and the completion and commissioning of projects under development, including major projects such as the South Hedland Power Project, and their attendant costs; expectations regarding the Alberta Electric System Operator’s (“AESO”) plans for resolving regional constraints on Alberta’s transmission system; spending on growth and sustaining capital and productivity projects; expectations in terms of the cost of operations, capital spend, and maintenance, and the variability of those costs, including expectations about the cost savings anticipated from the major maintenance agreement entered into with Alstom; the impact of certain hedges on future reported earnings and cash flows; expectations related to future earnings and cash flow from operating and contracting activities (including estimates of 2015 comparable earnings before interest, taxes, depreciation, and amortization (“EBITDA”), comparable funds from operations (“FFO”), and comparable free cash flow); estimates of fuel supply and demand conditions and the costs of procuring fuel; expectations for demand for electricity in both the short term and long term, and the resulting impact on electricity prices; the impact of load growth, increased capacity, and natural gas costs on power prices; expectations in respect of generation availability, capacity, and production; expectations regarding the role different energy sources will play in meeting future energy needs; expected financing of our capital expenditures; expected governmental regulatory regimes and legislation and their expected impact on us and the timing of the implementation of such regimes and regulations, as well as the cost of complying with resulting regulations and laws; our trading strategies and the risk involved in these strategies; estimates of future tax rates, future tax expense, and the adequacy of tax provisions; accounting estimates; anticipated growth rates in our markets; our expectations regarding proceedings before the Alberta Utilities Commission (the “AUC”) as well as those relating to the outcome of existing or potential legal and contractual claims, regulatory investigations, and disputes; expectations regarding the renewal of collective bargaining agreements; expectations for the ability to access capital markets at reasonable terms; the estimated impact of changes in interest rates and the value of the Canadian dollar relative to the U.S. dollar and other currencies in locations where we do business; the monitoring of our exposure to liquidity risk; expectations in respect of the global economic environment and growing scrutiny by investors relating to sustainability performance; our credit practices; the estimated contribution of Energy Marketing activities to gross margin; and expectations relating to the performance of TransAlta Renewables Inc.’s (“TransAlta Renewables”) assets and plans for the sale of contracted assets to TransAlta Renewables.


16


TransAlta Corporation   |   2014 Annual Report


Management’s Discussion and Analysis


Factors that may adversely impact our forward-looking statements include risks relating to: fluctuations in market prices and the availability of fuel supplies required to generate electricity; our ability to contract our generation for prices that will provide expected returns; the regulatory and political environments in the jurisdictions in which we operate; environmental requirements and changes in, or liabilities under, these requirements; changes in general economic conditions including interest rates; operational risks involving our facilities, including unplanned outages at such facilities; disruptions in the transmission and distribution of electricity; the effects of weather; disruptions in the source of fuels, water, or wind required to operate our facilities; natural or man-made disasters; the threat of domestic terrorism and cyberattacks; equipment failure and our ability to carry out or have completed the repairs in a cost-effective manner or timely manner; commodity risk management; industry risk and competition; fluctuations in the value of foreign currencies and foreign political risks; the need for additional financing; structural subordination of securities; counterparty credit risk; insurance coverage; our provision for income taxes; legal, regulatory, and contractual proceedings involving the Corporation; outcomes of investigations and disputes; reliance on key personnel; labour relations matters; development projects and acquisitions, including delays in the permitting and construction of the South Hedland Power Project and the construction of the Australia Natural Gas Pipeline; failure to proceed with plans for the sale of contracted assets to TransAlta Renewables as a result of failure to agree to commercial terms with the independent directors of TransAlta Renewables, adverse market conditions or failure to obtain any required regulatory, shareholder or other third party approvals; and the satisfactory receipt of applicable regulatory approvals for existing and proposed operations and growth initiatives.


The foregoing risk factors, among others, are described in further detail in the Risk Management section of this MD&A and under the heading “Risk Factors” in our 2015 Annual Information Form.


Readers are urged to consider these factors carefully in evaluating the forward-looking statements and are cautioned not to place undue reliance on these forward-looking statements. The forward-looking statements included in this document are made only as of the date hereof and we do not undertake to publicly update these forward-looking statements to reflect new information, future events or otherwise, except as required by applicable laws. In light of these risks, uncertainties, and assumptions, the forward-looking events might occur to a different extent or at a different time than we have described, or might not occur. We cannot assure that projected results or events will be achieved.


TransAlta Corporation   |   2014 Annual Report

17


Management’s Discussion and Analysis


Highlights


Consolidated Highlights


Year ended Dec. 31


2014


2013


2012


Revenues


2,623


2,292


2,210


Comparable EBITDA1


1,036


1,023


1,015


Net earnings (loss) attributable to common shareholders


141


(71

)

(615

)

Comparable net earnings attributable to common shareholders1


68


81


117


Comparable funds from operations1


762


729


788


Cash flow from operating activities


796


765


520


Comparable free cash flow1


295


295


258


Net earnings (loss) per share attributable to common shareholders, basic and diluted


0.52


(0.27

)

(2.62

)

Comparable net earnings per share1


0.25


0.31


0.50


Comparable funds from operations per share1


2.79


2.76


3.35


Comparable free cash flow per share1


1.08


1.12


1.10


Dividends paid per common share


0.83


1.16


1.16


As at Dec. 31


2014


20132


Total assets


9,833


9,624


Total long-term liabilities


4,504


5,337


Financial Highlights


§         Comparable EBITDA totalled $1,036 million in 2014 compared to $1,023 million in 2013. Strong availability throughout our generation portfolio, improved operational performance at Canadian Coal, higher than planned margins delivered by our Energy Marketing Segment, and a robust hedging strategy offset the impact of much lower power prices in Alberta. Prices in Alberta averaged $49 per megawatt hour (“MWh”) in 2014, compared to $80 per MWh in 2013. Our strategy of having a highly contracted portfolio limited the impact of price fluctuations.

§         Comparable FFO for 2014 increased $33 million to $762 million as the FFO for 2013 excluded higher amounts of unrealized mark-to-market gains included in EBITDA.

§         Comparable net earnings attributable to common shareholders was $68 million ($0.25 per share) in 2014 compared to $81 million ($0.31 per share) in 2013. The decrease in 2014 was primarily due to lower net ownership interest in TransAlta Renewables following the public offerings of TransAlta Renewables common shares.

§         Reported net earnings attributable to common shareholders was $141 million ($0.52 net earnings per share) in 2014, compared to a net loss of $71 million ($0.27 net loss per share) for 2013, and a net loss of $615 million ($2.62 net loss per share) in 2012. The increase in 2014 is attributable primarily to the change in value of certain de-designated and economic hedges in place at U.S. Coal, driven by decreases in future power prices at the end of the year, and the loss on assumption of pension obligations in 2013. The net earnings for 2013 also include a $56 million settlement of a claim relating to power trading activities in California in 2000 to 2001. Higher losses were recorded in 2012 due to the Sundance Units 1 and 2 return to service decision, as well as impairment at U.S. Coal.


1           These items are not defined under IFRS. Presenting these items from period to period provides management and investors with the ability to evaluate earnings and cash flow trends more readily in comparison with prior periods’ results. Refer to the Comparable Funds from Operations and Comparable Free Cash Flow, and Earnings and Other Measures on a Comparable Basis sections of this MD&A for further discussion of these items, including, where applicable, reconciliations to measures calculated in accordance with IFRS.

2           After giving effect to the reclassification described in the Current Accounting Changes section of this MD&A.


18


TransAlta Corporation   |   2014 Annual Report


Management’s Discussion and Analysis


Strategic Initiative Highlights


During the year we continued to make significant progress to grow our portfolio of highly contracted assets, improve our operating performance, and strengthen our financial condition through initiatives such as:


§         Permitted and commenced construction in January 2015 on a 150 megawatt (“MW”) combined cycle gas power station in South Hedland, Western Australia, which we will own and operate. The project is estimated to cost approximately AUD$570 million to build. The fully contracted power station is expected to be commissioned and delivering power to customers in the first half of 2017.

§         Significantly advanced construction with a joint venture partner of an AUD$178 million natural gas pipeline to our Solomon power station. We hold a 43 per cent interest in the joint venture. The project is on schedule and within budget, with expected commencement of commercial operations in the first quarter of 2015.

§         Strengthened our financial position by reducing our debt by approximately $500 million, before the effects of changes in foreign exchange rates, through the sale of non-strategic investments for proceeds of $205 million, an issuance of preferred shares for $165 million, and completion of a secondary offering of common shares of TransAlta Renewables for $136 million. We have also refinanced over $400 million of credit facilities and maturing long-term debt by way of a senior notes offering, due in 2017.

§         Entered into an agreement with Alstom to provide major maintenance for 10 major maintenance projects over the next three years at our Keephills and Sundance plants. The new arrangement is expected to deliver an average 15 per cent cost reduction per turnaround and shorter turnaround times for major maintenance work, resulting in estimated direct cost savings of $34 million over the full term of the agreement.

§         Resized the annualized common share dividend to $0.72 from $1.18 to align with our growth and financial objectives.

§         Continued execution of our hydro life extension plan, sustaining our advantage as the first hydro power producer in Alberta.


Safety


Safety is our top priority with all of our staff, contractors, and visitors. Our objective is to maintain our Injury Frequency Rate (“IFR”), which includes employees and contractors, at less than 1.00 for 2014. Our ultimate goal is to achieve zero injury incidents. We achieved our best results ever for safety performance in 2014.


Year ended Dec. 31

2014

2013

2012

IFR

0.86

0.93

0.89


TransAlta Corporation   |   2014 Annual Report

19


Management’s Discussion and Analysis


Operational Results


Year ended Dec. 31

2014

2013

2012

Availability (%)1

89.7

85.5

88.4

Adjusted availability (%)1,2

90.5

87.8

90.0

Production (GWh)1

45,002

42,482

38,750

Comparable EBITDA


Generation Segment


Canadian Coal

386

309

373

U.S. Coal

62

66

148

Gas

309

327

312

Wind

177

180

151

Hydro

85

147

127

Total Generation Segment

1,019

1,029

1,111

Energy Marketing Segment3

76

61

(13)

Corporate Segment

(59)

(67)

(83)

Total comparable EBITDA

1,036

1,023

1,015


§         Canadian Coal: Comparable EBITDA increased by $77 million to $386 million in 2014 compared to $309 million in 2013 and $373 million in 2012. The improvement is primarily driven by increased availability, from 80.9 per cent in 2013 to 88.6 per cent in 2014 and the reduction of coal costs. After assuming operations of the Highvale mine in 2013, we have reduced our annual coal costs by over $30 million year-over-year in 2014 through greater efficiency and productivity, and a reduction in the transition costs. Our contract profile in Alberta and our hedging strategy significantly mitigated the impact of lower prices in Alberta. Sundance Units 1 and 2, which returned to service in the second half of 2013, have been performing well with availability in excess of 90 per cent.

§         U.S. Coal: Comparable EBITDA decreased by $4 million to $62 million in 2014 as 2013 comparable EBITDA included favourable adjustments related to prior period costs and provisions. Margins otherwise increased as we further optimized real-time operations against the spot market, estimated marginal costs, and fixed-price contracts. The 2012 results included larger volumes of higher-priced hedges.

§         Gas: Comparable EBITDA decreased by $18 million to $309 million in 2014 compared to $327 million in 2013 and $312 million in 2012, primarily due to lower Alberta prices impacting our Poplar Creek facility and the effects of the new contract in Ottawa. Compared to 2012, 2013 benefitted from a full year of income from the Solomon power station that was acquired in August 2012.

§         Wind: Comparable EBITDA was $177 million in 2014 compared to $180 million in 2013 and $151 million in 2012. Increased production from our Wyoming wind facility acquired in December 2013 has mostly offset the effects of lower Alberta prices. In addition to higher prices, 2013 results also include incremental contribution from the New Richmond facility, which was commissioned in March 2013.

§         Hydro: Comparable EBITDA decreased by $62 million to $85 million in 2014 compared to 2013 due to the reduced potential to use the flexibility of our portfolio during periods of lower volatility. Comparable EBITDA in 2013 was $20 million higher than 2012 due to high prices and market volatility in Alberta.

§         Energy Marketing Segment: Comparable EBITDA in 2014 was $76 million, up $15 million from $61 million in 2013 due to our ability to capture arbitrage opportunities and optimize our energy marketing assets during extraordinarily volatile market conditions in the first and fourth quarters of 2014. The business has shifted its focus toward lower-risk revenue generation activities such as asset optimization, customer fee and margin-based growth, and arbitrage trading.

§         Corporate Segment: Corporate overhead costs decreased by $8 million in 2014 compared to 2013 due to a change in the way allocations are made within the organization. Reductions in corporate costs from a restructuring in 2012 have been sustained.


1    Availability includes assets under generation operations and finance leases and excludes Hydro assets and Equity Investments. Production includes all generating assets, irrespective of investment vehicle and fuel type.

2    Adjusted for economic dispatching at U.S. Coal.

3    The Segment changed its name from “Energy Trading” in 2014 following a shift in focus toward lower-risk revenue generation activities such as asset optimization, customer fee and margin-based growth, and arbitrage trading.


20


TransAlta Corporation   |   2014 Annual Report


Management’s Discussion and Analysis


Availability and Production


Our availability in 2014, after adjusting for economic dispatching at U.S. Coal, was 90.5 per cent (2013 - 87.8 per cent; 2012 - 90.0 per cent), which is higher than our long-term target of 88 to 90 per cent. Improvement in our availability for the year ended Dec. 31, 2014 was due to lower unplanned outages at Canadian Coal.


Availability in 2013 was impacted by the Keephills Unit 1 force majeure outage, which was partially offset by lower planned outages at the Alberta coal Power Purchase Arrangement (“PPA”) facilities.


Production for the year ended Dec. 31, 2014 increased 2,520 gigawatt hours (“GWh”) compared to 2013, primarily due to a full year of contribution from Sundance Units 1 and 2, which returned to service in the second half of 2013, as well as the return to service of Keephills Unit 1, which was unavailable for seven months in 2013.

GRAPHIC


GRAPHIC


For the year ended Dec. 31, 2013, production increased 3,732 GWh compared to 2012, primarily due to lower economic dispatching at U.S. Coal, Sundance Units 1 and 2 returning to service in the second half of 2013, lower planned outages at the Alberta coal PPA facilities, and higher PPA customer demand, partially offset by higher unplanned outages at the Alberta coal PPA facilities, primarily driven by the Keephills Unit 1 force majeure outage.


Comparable Funds from Operations and Comparable Free Cash Flow


Comparable funds from operations and comparable free cash flow provide investors with a proxy for the amount of cash generated from operating activities before changes in working capital, and provide the ability to evaluate cash flow trends more readily in comparison with results from prior periods. Comparable FFO per share and comparable free cash flow per share are calculated using the weighted average number of common shares outstanding during the year.


Year ended Dec. 31


2014


2013


2012


Cash flow from operating activities


796


765


520


Change in non-cash operating working capital balances


(73

)

(74

)

56


Cash flow from operations before changes in working capital


723


691


576


Settlement of 2000 to 2001 California claim


33


27


Impacts to working capital associated with Sundance Units 1 and 2 arbitration


204


TAMA Transmission bid costs


5


Other non-comparable items


1


11


8


Comparable FFO


762


729


788


Deduct:


Sustaining capital


(342

)

(341

)

(439

)

Dividends paid on preferred shares


(41

)

(38

)

(32

)

Distributions paid to subsidiaries’ non-controlling interests


(84

)

(55

)

(59

)

Comparable free cash flow


295


295


258


Weighted average number of common shares outstanding in the year


273


264


235


Comparable FFO per share


2.79


2.76


3.35


Comparable free cash flow per share


1.08


1.12


1.10


TransAlta Corporation   |   2014 Annual Report

21


Management’s Discussion and Analysis


A reconciliation of comparable EBITDA to comparable FFO is as follows:


Year ended Dec. 31


2014


2013


2012


Comparable EBITDA


1,036


1,023


1,015


Unrealized losses (gains) from risk management activities


4


(27

)

27


Interest expense


(236

)

(238

)

(225

)

Provisions


11


11


Current income tax expense


(33

)

(39

)

(13

)

Realized foreign exchange gain (loss)


11


(4

)

Decommissioning and restoration costs settled


(16

)

(24

)

(34

)

Restructuring charges paid (incurred)


8


(8

)

Impacts to revenue associated with Sundance Units 1 and 2


20


Impacts to working capital associated with Sundance Units 1 and 2 arbitration


204


Sundance Units 1 and 2 return to service


(211

)

Gain on sale of collateral


15


Flood-related maintenance costs


5


Other non-cash items


(4

)

10


(9

)

Comparable FFO


762


729


788


For the year ended Dec. 31, 2014, comparable FFO increased $33 million to $762 million compared to 2013. The increase in FFO outpaced the increase in EBITDA, as last year’s EBITDA included $27 million of unrealized risk management gains. The current year’s FFO also includes $11 million in realized foreign exchange gains.


Comparable FFO for the year ended Dec. 31, 2013 decreased $59 million to $729 million compared to 2012, primarily due to higher cash interest and cash taxes as well as differences in timing of cash proceeds associated with power hedges.


Comparable free cash flow for 2014 was $295 million, which was the same as 2013, as the increase in comparable FFO was offset by distributions paid to TransAlta Renewables’ public shareholders and improved performance at TransAlta Cogeneration L.P. (“TA Cogen”).


For the year ended Dec. 31, 2013, comparable free cash flow increased $37 million compared to 2012, to $295 million, due to lower sustaining capital, partially offset by lower comparable FFO.


22


TransAlta Corporation   |   2014 Annual Report


Management’s Discussion and Analysis


Sustaining Capital


We are in a long-cycle, capital-intensive business that requires significant capital expenditures. Our goal is to undertake sustaining capital that ensures our facilities operate reliably and safely over a long period of time. Our sustaining capital is comprised of: (i) routine capital, (ii) mine capital, (iii) planned major maintenance, and (iv) finance lease. Sustaining capital also includes capital required following the 2013 flood in Alberta, most of which is recoverable from third parties.


Lost production as a result of planned major maintenance is as follows:

GRAPHIC


Year ended Dec. 31


2014


2013


2012


GWh lost1


1,519


1,154


2,387


In 2014, routine capital decreased compared to 2013 as a result of fewer unplanned outages during the year. The decrease in mine capital was primarily due to fewer mine support equipment purchases as mining intensity stabilized. Planned major maintenance costs increased primarily due to having five planned outages at Sundance Unit 5, Sundance Unit 6, Keephills Unit 2, U.S. Coal, and Genesee Unit 3 in 2014 compared to four in 2013 at Sundance Unit 4, Keephills Unit 3, U.S. Coal, and Sheerness.


The increase in routine capital in 2013 compared to 2012 was primarily due to the stator replacement at Keephills Unit 1. Mine capital and finance leases increased as a result of the purchase of pre-stripping trucks and other equipment in 2013 in anticipation of production increases associated with the return to service of Sundance Units 1 and 2. Planned major maintenance decreased, as we carried an unusually large number of outages in 2012 in order to sustain greater efficiency in the following years.


Financial Position


We seek to maintain financial flexibility by using multiple sources of capital to finance our business plans, while maintaining a sufficient level of available liquidity to support contracting and trading activities. We are focused on strengthening our financial position and cash flow coverage ratios to support stable investment grade credit ratings. Strengthening our financial position allows our commercial team to contract our portfolio with a variety of counterparties on terms and prices that are favourable to our financial results, and provides us with better access to capital markets through commodity and credit cycles.


During 2014, we took several steps to strengthen our financial position and reduce debt, raising over $900 million from divestitures, sale of non-controlling interests, sale of preferred shares, and debt refinancing.


The methodologies and ratios used by rating agencies to assess our credit rating are not publicly disclosed. We have developed our own definitions of ratios and targets to manage our capital. These metrics and ratios are not defined under IFRS, and may not be comparable to those used by other entities or by rating agencies. During the year, we revised the way in which we calculate our ratios in order to align more closely with how we understand some credit rating agencies calculate them. The prior year figures have been restated to conform with the current year’s presentation.


Comparable Funds from Operations before Interest to Adjusted Interest Coverage


Year ended Dec. 31


2014


2013


2012


Comparable FFO


762


729


788


Add: Interest on debt net of interest income and capitalized interest


236


238


221


Comparable FFO before interest


998


967


1,009


Interest on debt net of interest income


239


240


225


Add: 50 per cent of dividends paid on preferred shares


21


19


16


Adjusted interest


260


259


241


Comparable FFO before interest to adjusted interest coverage (times)


3.8


3.7


4.2


1           Lost production excludes periods of planned major maintenance at U.S. Coal, which occur during periods of economic dispatching.


TransAlta Corporation   |   2014 Annual Report

23


Management’s Discussion and Analysis


Comparable FFO before interest to adjusted interest coverage improved slightly compared to 2013 due to higher comparable FFO and lower debt levels. In 2013, comparable FFO before interest to adjusted interest coverage decreased compared to 2012, primarily due to lower comparable FFO and higher interest on debt. Our goal is to maintain this ratio in a range of four to five times.


Adjusted Comparable Funds from Operations to Adjusted Net Debt


Year ended Dec. 31


2014


2013


2012


Comparable FFO


762


729


788


Less: 50 per cent of dividends paid on preferred shares


(21

)

(19

)

(16

)

Adjusted comparable FFO


741


710


772


Period-end long-term debt, including finance lease obligations


4,056


4,347


4,217


Add: 50 per cent of issued preferred shares


471


391


391


Less: Cash and cash equivalents (excluding restricted cash)


(43

)

(42

)

(25

)

Fair value (asset) liability of hedging instruments on debt1


(96

)

(16

)

50


Adjusted net debt


4,388


4,680


4,633


Adjusted comparable FFO to adjusted net debt (%)


16.9


15.2


16.7


Adjusted comparable FFO to adjusted net debt increased in 2014 compared to 2013, due to lower debt levels in 2014 and an increase in comparable FFO. In 2013, adjusted comparable FFO to adjusted net debt decreased compared to 2012, due to higher debt levels in 2013 and a decrease in comparable FFO. Our goal is to maintain this ratio in a range of 20 to 25 per cent.


Adjusted Net Debt to Comparable EBITDA


Year ended Dec. 31


2014


2013


2012


Period-end long-term debt, including finance lease obligations


4,056


4,347


4,217


Less: cash and cash equivalents


(43

)

(42

)

(25

)

Add: 50 per cent of issued preferred shares


471


391


391


Fair value (asset) liability of hedging instruments on debt1


(96

)

(16

)

50


Adjusted net debt


4,388


4,680


4,633


Comparable EBITDA


1,036


1,023


1,015


Adjusted net debt to comparable EBITDA (times)


4.2


4.6


4.6


Adjusted net debt to comparable EBITDA in 2014 improved compared to 2013, primarily due to a decrease in long-term debt. In 2013, adjusted net debt to comparable EBITDA was consistent with 2012. Our goal is to maintain this ratio in a range of three to four times.


1    Refer to Note 14 of our 2014 Notes to the Annual Financial Statements.


24


TransAlta Corporation   |   2014 Annual Report


Management’s Discussion and Analysis


Business Environment


Overview of our Business


We are one of Canada’s largest publicly traded power generators with over 100 years of operating experience. We own, operate, and manage a highly contracted and geographically diversified portfolio of assets and use a broad range of generation fuels comprised of coal, natural gas, water, and wind. Our energy marketing operations maximize margins by securing and optimizing high value products and markets for ourselves and our customers in dynamic market conditions.


The Generation Segment includes our power generation facilities and related mining operations in Canada, the U.S., and Australia. The full capacity of the facilities in which we have an ownership share is 9,898 MW1. At Dec. 31, 2014, our generating assets had 8,846 MW1 of gross generating capacity in operation. Generation revenues and overall profitability are derived from the availability and production of electricity and steam as well as ancillary services such as system support. Our renewable energy facilities can also derive income from the sale of environmental attributes.


The majority of our capacity is located in Alberta and 66 per cent of it is subject to legislated Alberta PPAs, which were put in place in 2001 to facilitate the transition from regulated generation to the current energy market in the province. Alberta PPAs expire at the end of 2017 (Sundance Units 1 and 2) and the end of 2020 (Keephills Units 1 and 2, Sundance Units 3 to 6, Sheerness, and Hydro). We also provide power generation on a contract basis to regional utility and industrial customers in Ontario, Québec, New Brunswick, British Columbia, Alberta, Washington State, Wyoming State, and Western Australia.


Some of our capacity in Alberta and the U.S. Pacific Northwest is not contracted and we sell power into merchant electricity markets. Further, our Alberta PPA coal plants pay penalties or receive payments for production below or above, respectively, targeted availability based upon a rolling 30-day average of spot prices. We can also retain proceeds from the sale of energy and ancillary services in excess of obligations on our Hydro Alberta PPAs. Our contractual arrangements also provide a limited degree of participation in Ontario’s electricity market.


Our results are seasonal due to the nature of the electricity market and related fuel costs. Higher maintenance costs are usually incurred in the spring and fall when electricity prices are expected to be lower, as electricity prices generally increase in the peak winter and summer months in our main markets due to increased heating and cooling loads. Margins are also typically impacted in the second quarter due to the volume of hydro production resulting from spring runoff and rainfall in the Pacific Northwest market, which impacts production at U.S. Coal. Typically, hydro facilities generate most of their electricity and revenues during the spring months when melting snow starts feeding watersheds and rivers. Inversely, wind speeds are historically greater during the cold winter months and lower in the warm summer months.


The Energy Marketing Segment derives revenue and earnings from the marketing and trading of electricity and other energy-related commodities and derivatives. Our energy marketing operations maximize margins by securing and optimizing high value products and markets for ourselves and our customers in dynamic market conditions.


Energy Marketing sells our production through short-term and long-term contracts, ensures cost-effective and reliable fuel supply, and seeks to improve margins by optimizing our portfolio as market conditions change throughout the year. In addition to serving our assets, our marketing team actively markets energy products and services to energy producers and consumers.


Our marketing commitments are backed by our own supply and through the acquisition of third-party supply and proprietary marketing assets, such as transmission, transportation, and storage rights. In the course of managing our portfolio, we actively seek to apply our knowledge of physical power and fuel markets to capture incremental arbitrage margins. All activities are managed within our core markets following strict compliance practices and we impose tight limits on our capital at risk and maintain strict position limits to ensure that our trading strategies meet our low risk tolerances.


Our marketing activities use a variety of instruments to manage risk, earn margins, and gain market information. Our marketing strategies employ shorter-term physical and financial derivative instruments including forwards, swaps, futures, and options in various commodities in regions where we have assets and the markets that directly or indirectly interconnect with those regions. These contracts meet the definition of trading activities and have been accounted for at fair value under IFRS. Changes in the fair value of the portfolio are recognized in earnings in the period they occur.


1           We measure capacity as net maximum capacity (see Glossary of Key Terms for definition of this and other key terms), which is consistent with industry standards. Capacity figures represent capacity owned and in operation unless otherwise stated and reflects the basis of consolidation of underlying assets.


TransAlta Corporation   |   2014 Annual Report

25


Management’s Discussion and Analysis


While our strategy is generally consistent between periods, positions held and resulting earnings impacts may vary due to current and forecasted external market conditions. Positions for each region are established based on the market conditions and the risk/ reward ratio established for each trade at the time it is transacted. Results may therefore vary regionally or by strategy from one reported period to the next.


Direct marketing of our own generation is reported in the Generation Segment results. All activities indirectly related to our assets and all other marketing activities are reported in the Energy Marketing Segment.


Electricity Prices


Spot electricity prices in our markets are driven by customer demand, generator supply, natural gas prices, weather, renewable resource availability, and other business environment dynamics. We monitor these trends in prices, and schedule planned maintenance of our generation portfolio, where possible, during times of lower prices.

GRAPHIC


Demand and supply balances are the fundamental drivers of prices for electricity. Underlying economic growth is the main driver of longer-term changes in the demand for electricity. Historically, demand for electricity in Alberta, the Pacific Northwest, and Ontario has grown at an average rate of one to three per cent per year. New supply will impact prices in the short term. We expect surplus supply in the Alberta market over the next three to five years to dampen prices.


Renewable generation growth has been strong in all regions for the past several years. New supply in the near term and intermediate term is expected to come primarily from investment in renewable energy and natural gas-fired generation across most North American markets. This expectation is driven by the relatively low prices in the natural gas market combined with a continued expectation that greenhouse gas (“GHG”) legislation of some form is still expected in Canada and the U.S. While there are many new developments that will likely impact the future supply of electricity, the low cost of our baseload operations means that we expect that our plants will continue to be supported in the market.


Alberta


Alberta has seen annual average demand growth of about three per cent over the past three years. Investment in oil sands development is a key driver of electricity demand growth in the province. Recent weakness in oil prices is not expected to significantly reduce growth in the near term since many projects are already committed and under construction and will be increasing production despite lower market prices. Weaker oil prices may impact long-term growth prospects as many companies are reducing their capital programs.


During 2014, reserve margins3 increased primarily as a result of coal capacity returning to service and increased capacity being commissioned. In 2014, Alberta added about 350 MW of wind capacity. Average spot prices decreased significantly compared to 2013, due to increased reserve margin. Electricity prices in 2013 were higher than 2012 due to tighter supply and demand conditions.


In Alberta we expect to see higher reserve margins in 2015 based on additional capacity that is coming online during the year. Combined cycle and cogeneration projects at large oil sands developments are expected to be key sources of new generation supply within Alberta. We believe that continued and growing demand for electricity, including demand for renewable energy, and the potential of increasing amounts of intermittent renewable generation to require additional capacity, may provide an opportunity to increase our generation capacity.


There are currently 1,434 MW of wind generation facilities in operation and projects totalling approximately 1,100 MW of capacity have received regulatory approval. In total, approximately 2,350 MW of wind generation is in the AESO interconnection queue. However, not all announced generation is expected to be built and some projects cannot be developed prior to transmission expansions.


3           Reserve margins measure available capacity in a market over and above the capacity needed to meet normal peak demand levels. Falling reserve margins indicate that generation capacity is becoming relatively scarce and results in increased power prices.


26


TransAlta Corporation   |   2014 Annual Report


Management’s Discussion and Analysis


U.S. Pacific Northwest


As a result of economic conditions, demand growth has been weak in recent years and in 2014 demand growth was relatively flat. Electricity demand is expected to increase by approximately one per cent per year, with potentially stronger growth being partially offset by a large emphasis on energy efficiency across the region.


During 2014, reserve margins were relatively flat. The Pacific Northwest did not see large-scale wind additions in 2014. Average spot prices in 2014 were similar to 2013.


Capacity additions are expected in 2015 as developers seek to take advantage of the wind production tax credit before it expires. The wind production credit expiration is expected to drive stronger wind builds in 2015 and 2016 than was seen in 2014, which is expected to constrain price growth in the market.


Ontario


In recent years, demand growth has been weak due to economic conditions. In 2014, demand growth was relatively flat and is expected to remain weak at below one per cent.


During 2014, reserve margins were relatively flat, even though the increase in renewable capacity has increased supply in much of the year. Ontario added almost 1,500 MW of renewable capacity, including hydro and distributed solar.


Average spot prices for the year ended Dec. 31, 2014 increased compared to 2013 primarily due to extreme cold weather across the entire northeast during the first quarter, which led to higher natural gas prices and increased demand. Prices in 2013 were higher than in 2012 due to higher natural gas prices, partially offset by an increase in supply as a result of nuclear generating plants returning to service.


The reserve margin in the province is not expected to change materially until anticipated nuclear refurbishments take capacity offline around 2016. Ontario is expected to add renewable capacity in the next several years. There is currently 104 MW of wind in the commissioning stages and 479 MW of wind under construction. In addition, 1,651 MW of contracted wind is set to come online during the mid-2015 time frame, of which approximately 18 per cent has received notice to proceed approval from the Independent Electricity System Operator.


Transmission


Transmission refers to the bulk delivery system of power and energy between generating units and consumers. In the North American market, we believe investment in transmission capacity has not kept pace with the growth in demand for electricity. Lead times in new transmission infrastructure projects are significant, subject to extensive consultation processes with landowners, and subject to regulatory requirements that can change frequently. As a result, existing generation or additions of generating capacity may not have access to markets until key bulk transmission upgrades and additions are completed.


Transmission costs in Alberta are forecast to double between 2011 and 2020, and transmission and distribution costs are expected to outweigh energy costs for residential consumers by 2020. This is driving large consumers towards behind-the-fence supply to avoid paying transmission costs and this may constrain growth in the Alberta market. We continue to monitor risks and opportunities associated with transmission on an ongoing basis.


Environmental Legislation and Technologies


All energy sources used to generate electricity have some impact on the environment. While we are pursuing a business strategy that includes investing in low-impact renewable energy resources such as wind and hydro, we also believe that coal and natural gas as fuels will continue to play an important role in meeting future energy needs. Regardless of the fuel type, we place significant importance on environmental compliance and continued environmental impact mitigation, while seeking to deliver low-cost electricity.


In the jurisdictions in which we operate, legislators have proposed and enacted regulations to discontinue over time the use of the technologies that our coal-fueled plants currently utilize. Our thermal facilities can also incur costs in relation to their carbon emissions, depending on the jurisdiction in which the facility is located. Our contracted facilities can generally recover those costs from the customer. Conversely, our renewable generation facilities are generally able to realize value from their environmental attributes. We continue to closely monitor the progress and risks associated with environmental legislation changes on our future operations.


Refer to the Climate Change and the Environment section of this MD&A for additional information on these matters.


TransAlta Corporation   |   2014 Annual Report

27


Management’s Discussion and Analysis


Strategy and Capability to Deliver Results


Our goals are to deliver shareholder value by delivering solid returns through a combination of dividend yield and disciplined growth in cash flow per share, while striving for a low to moderate risk profile over the long term, balancing capital allocation, and maintaining financial strength to allow for financial flexibility. Our comparable cash flow growth is driven by optimizing our existing assets and further expanding our overall portfolio and operations in Canada, the U.S., and Australia. We are focusing on these geographic areas as our expertise, scale, and diversified fuel mix allows us to create expansion opportunities in our core markets. Our strategy to achieve these goals has the following key elements:


Growth Strategy


Our growth strategy is to continue to diversify our asset base in our core markets with a focus on renewables and natural gas-fired generation. Our sponsored, majority-owned subsidiary, TransAlta Renewables, provides us with access to lower cost of capital for contracted asset opportunities. We believe that our significant U.S. tax attributes provide us with an advantage for acquisition opportunities in that country. Furthermore, we are focused on pursuing options for extending the life of our coal assets that are scheduled to retire in Alberta, investing in the Alberta power market, and ensuring that we replace our coal assets in the Pacific Northwest on their retirement. We maintain significant optionality within legislation to optimize cash flows across Canadian Coal units, convert coal units to gas fuel, or integrate newest carbon capture and storage technology in order to achieve these goals.


We continue to selectively grow our diversified generating fleet to increase production and meet future demand requirements, with growth projects that have the ability to meet or exceed our targeted rate of return. During 2014, construction began on an AUD$178 million natural gas pipeline to our Solomon power station and we entered into agreements to build and operate a 150 MW combined cycle gas power station in South Hedland, Western Australia. The project is estimated to cost approximately AUD$570 million. During 2013, commercial operations began at our 68 MW New Richmond wind farm and we also completed the acquisition of a 144 MW wind farm in Wyoming.


Partnerships are part of our growth strategy. We have developed a partnership, TAMA Power, with Berkshire Hathaway Energy to develop new gas-fired generation in Canada. In prior years, we have joined Capital Power Corporation in the development of Keephills Unit 3 and Genesee Unit 3, and we maintain a significant partnership with Cheung Kong Infrastructure for our subsidiary, TA Cogen.


Financial Strategy


We are focused on strengthening our financial position and maintaining our investment grade credit ratings to provide a solid foundation for our long-cycle, capital-intensive, and commodity-sensitive business. Strengthening our financial position and maintaining our investment grade credit ratings improve our competitiveness by providing greater access to capital markets, lowering our cost of capital, and enabling us to contract our assets with customers on more favourable commercial terms. We value financial flexibility, which allows us to selectively access the capital markets in either Canada or the U.S. when conditions are favourable.


We manage our financial position and cash flows to maintain financial strength and flexibility throughout all economic cycles. This financial discipline will continue to be important during 2015. We continue to maintain $2.1 billion in committed credit facilities, and as of Dec. 31, 2014, $1.6 billion was available to us.


Our financial strategy is focused on providing competitively priced capital to support growth while simultaneously strengthening our financial position in anticipation of the increased commodity exposure of the post-PPA period. In 2014, we took advantage of favourable capital markets by completing a secondary offering of TransAlta Renewables shares for gross proceeds of approximately $136 million, as well as an offering of U.S.$400 million of senior notes, due in June 2017, and an offering of preferred shares for gross proceeds of $165 million. We have also sold our investments in CE Generation LLC (“CE Gen”), Wailuku Holding Company, LLC (“Wailuku”), the Blackrock Development Project (“Blackrock”), and CalEnergy, LLC (“CalEnergy”) for total net proceeds of U.S.$193.5 million to better allocate this capital within our business. Looking forward, we expect continued capital market support for projects that meet our return requirements and risk profile. We also plan to continue to execute our strategy through the sale of contracted assets to our majority-owned subsidiary, TransAlta Renewables, to access a lower cost source of equity, and by issuing additional preferred shares.


Our senior unsecured debt is rated as investment grade: BBB (stable), BBB- (stable), Baa3 (negative), and BBB- (stable); by DBRS, Standard and Poor’s (“S&P”), Moody’s Investors Services (“Moody’s”), and Fitch Ratings (“Fitch”), respectively. Our preferred shares are rated P-3 and Pfd-3 with S&P and DBRS, respectively.1


1           Credit ratings are intended to provide investors with an independent measure of credit quality of an issue of securities. The credit ratings accorded to our outstanding securities by DBRS, S&P, Moody’s, and Fitch, as applicable, are not recommendations to purchase, hold, or sell such securities inasmuch as such ratings do not comment as to market price or suitability for a particular investor. There is no assurance that the ratings will remain in effect for any given period or that a rating will not be revised or withdrawn entirely by DBRS, S&P, Moody’s or Fitch in the future if, in its judgment, circumstances so warrant.


28


TransAlta Corporation   |   2014 Annual Report


Management’s Discussion and Analysis


Marketing Strategy


On an aggregated portfolio basis, depending on market conditions, we target contracting up to 90 per cent of our expected production for the upcoming year through a combination of Alberta PPAs, long-term contracts with regulated utilities or power authorities, and short- and long-term contracts with small commercial to large industrial customers, supplemented with financial contracts where necessary. This strategy helps protect our cash flow and our financial position through economic cycles. In addition, we are focused on re-contracting our Ontario and Australia facilities where some contracts are set to expire in the 2016 to 2019 period. During 2013, we re-contracted approximately 835 MW of our facilities and investments, in some cases extending the lives of the assets. Currently, approximately 88 per cent of 2015 and approximately 81 per cent of 2016 expected capacity across our fleet has been contracted.


In addition, we have started to leverage our marketing capability by offering products and services to third parties. We anticipate this activity can support sustainable gross margin growth for our Energy Marketing Segment in the coming years.


Operational Strategy


We manage our facilities to achieve stable and predictable operations that are comparatively low cost and balanced with our fleet availability target.


We strive to optimize the availability of our plants throughout the year to meet demand. Our operations and marketing teams work together, in compliance with regional market rules, to optimize production in response to market conditions. However, the ability to meet demand is limited by the requirement to shut down for planned maintenance and by unplanned outages, as well as by reduced production from derates. Our goal is to minimize these events through regular assessments of our equipment and an ongoing review of our maintenance plans in order to balance our maintenance costs with optimal availability targets.


Our long-term target is to increase productivity and maintain availability at 88 to 90 per cent. In 2014, our adjusted availability was 90.5 per cent, up from 87.8 in 2013 due to lower unplanned outages at Canadian Coal. Over the last three years, our average adjusted availability has been 89.4 per cent, which is in line with our corporate target.


Our operations, maintenance, and administration (“OM&A”) costs reflect the cost of operating our facilities. These costs can fluctuate due to the timing and nature of planned and unplanned maintenance activities. The remainder of OM&A costs reflects the cost of day-to-day operations. Our target is to offset the impact of inflation in our recurring operating costs as much as possible through cost control and targeted productivity initiatives. In our Wind fleet, at some of our Gas facilities, and at the Canadian Coal plants we operate, we have established long-term service agreements with third-party suppliers to reduce these costs, as well as maintenance-related sustaining capital costs. We measure our ability to maintain productivity based on the Generation Segment’s comparable OM&A costs per produced MWh.


Comparable generation OM&A costs per produced MWh have decreased by three per cent per year over the last three years due to greater efficiency following the return to service of Sundance Units 1 and 2. Further improvements were achieved as a result of reduced maintenance costs associated with lower unplanned outages and the implementation of initiatives to reduce contract labour, staff overtime work, and material usage.


GRAPHIC


People


Our experienced leadership team has a broad mix of skills in the electricity sector, including in relation to finance, law, government, regulation, engineering, operations, construction, risk management, and corporate governance. The leadership team’s experience and expertise, our employees’ knowledge and dedication to operational excellence, and our entire organization’s knowledge of the energy business, in our opinion, has resulted in a long-term proven track record of financial stability.


TransAlta Corporation   |   2014 Annual Report

29


Management’s Discussion and Analysis


Significant 2014 Events and Subsequent Events


South Hedland Power Project


On July 28, 2014, we agreed to build, own, and operate a 150 MW combined cycle gas power station in South Hedland, Western Australia. The project is estimated to cost approximately AUD$570 million to build, including the cost of acquiring existing equipment from Horizon Power. The development has been fully contracted under 25-year Power Purchase Agreements with Horizon Power, a state-owned utility company, and The Pilbara Infrastructure Pty Ltd., a wholly owned subsidiary of Fortescue Metals Group (“FMG”), a mining company. The project may be expanded to accommodate additional customers at later dates. The power station will supply Horizon Power’s customers in the Pilbara region as well as FMG’s port operations. IHI Engineering Australia has been selected as the contractor to construct the power station. Relevant work and environmental permits have been received and construction commenced in January 2015. The power station is expected to be commissioned and delivering power to customers in the first half of 2017.


Australia Natural Gas Pipeline


On Jan. 15, 2014, we formed the Fortescue River Gas Pipeline Joint Venture to build, own, and operate an AUD$178 million, 270-kilometre natural gas pipeline from the Dampier to Bunbury Natural Gas Pipeline to our Solomon power station. Usage of the pipeline has been contracted to FMG to supply gas for the Solomon gas-fired facilities under a 20-year agreement. We hold a 43 per cent interest in the joint venture through a wholly owned subsidiary. The project is on schedule and within budget. Construction is being finalized and commercial operations are expected to begin in March 2015. In addition to our portion of the pipeline cost, AUD$14 million in plant retrofitting costs were incurred to allow the Solomon power station to burn gas instead of diesel, which will provide a return over time through increased lease payments. Full commissioning of the Solomon plant is expected to align with the start of the pipeline operations.


Sundance Unit 7


During 2014, TAMA Power continued to develop plans to build an 856 MW, highly efficient gas-fired power plant, Sundance Unit 7, in an area adjacent to our Canadian Coal operations. TAMA Power has secured a contract for primary equipment and is in the final stage of negotiations for other equipment. TAMA Power is also finalizing an arrangement with an engineering, procurement, and construction contractor. On Dec. 11, 2014, the AUC announced a public hearing, to proceed in 2015, on the proposed facility. TAMA Power expects to receive approval from the AUC in the first half of 2015.


Sale of Preferred Shares


On Aug. 15, 2014, we completed a public offering of 6.6 million Series G 5.3 per cent Cumulative Redeemable Rate Reset First Preferred Shares, resulting in gross proceeds of $165 million. The net proceeds from the offering were used for general corporate purposes, including repaying borrowings under existing credit facilities and funding 2015 debt maturities.


Sale of CE Gen, Blackrock, CalEnergy, and Wailuku


We completed the sale of our 50 per cent interest in CE Gen, Blackrock, and CalEnergy on June 12, 2014, and the sale of our 50 per cent interest in the Wailuku facility on Nov. 25, 2014, for total gross proceeds of U.S.$205.5 million. The net proceeds were U.S.$193.5 million, after consideration of an equity contribution that we made to CE Gen in May 2014. No significant gains or losses resulted from the sales. Proceeds have been used to repay amounts outstanding on our credit facilities.


Secondary Offering of TransAlta Renewables Shares


On April 29, 2014, we completed a secondary offering of 11,950,000 common shares of TransAlta Renewables at a price of $11.40 per common share. As a result of the offering, we received gross proceeds of approximately $136 million (net proceeds of approximately $129 million after issuance costs). The net proceeds from the offering were used to reduce indebtedness. Following completion of the offering, we own approximately 70.3 per cent of the common shares of TransAlta Renewables.


Senior Notes Offering


On June 3, 2014, we completed an offering of U.S.$400 million of senior notes, due in June 2017, that carry a coupon rate of 1.90 per cent, payable semi-annually, at an issue price equal to 99.887 per cent of the principal amount of the notes. The net proceeds from the offering were used for general corporate purposes, including repaying borrowings under existing credit facilities and funding 2015 debt maturities.


30


TransAlta Corporation   |   2014 Annual Report


Management’s Discussion and Analysis


Issuance of Bonds


On Feb. 11, 2015, the Corporation and its partner issued bonds secured by their jointly owned Pingston facility. Our share of gross proceeds was $45 million. The bonds bear interest at the annual fixed interest rate of 2.95 per cent, payable semi-annually with no principal repayments until maturity in May 2023. Proceeds were used to repay the $35 million secured debenture bearing interest at 5.28 per cent. Excess proceeds, net of transaction costs, are to be used for general corporate purposes.


Major Maintenance Agreement


On Nov. 14, 2014, we entered into an agreement with Alstom to provide major maintenance for our Canadian Coal facilities. The agreement relates to 10 major maintenance projects over the next three years at our Keephills and Sundance plants. It also expands Alstom’s current scope of work to service critical power assets, including boilers, steam turbines, generators, and other plant equipment. Alstom will be accountable for providing its services on budget and on time with a guarantee on performance.


The new arrangement is expected to deliver an average 15 per cent cost reduction per turnaround and shorter turnaround times for major maintenance work, resulting in estimated direct cost savings of $34 million over the full term of the agreement.


Restructuring of Canadian Coal


On Jan. 14, 2015, we initiated a significant cost reduction initiative at our Canadian Coal operations to run a stronger and more competitive business. The restructuring results in the elimination of positions, providing anticipated full year annual savings of approximately $12 million. Costs associated with the initiative are expected to total $10 million.


Board of Directors Appointments


During the third quarter of 2014, we announced that Mr. P. Thomas Jenkins, OC, CD and Mr. John. P. Dielwart had been appointed to our Board of Directors (the “Board”), effective Sept. 1 and Oct. 1, 2014, respectively. The appointments are the result of our ongoing process of evaluating the skills and composition of the Board, planning for succession, and aligning the skills of the Board with the strategic direction of the Corporation.


Executive Leadership Team Appointments


On March 18, 2014, we announced three senior leadership appointments that will enhance our objectives of operational excellence from the base business and growth. Brett Gellner was appointed to the role of Chief Investment Officer, responsible for leading all growth aspects of the Corporation. Donald Tremblay joined TransAlta as Chief Financial Officer, effective March 31, 2014, and on July 3, 2014, Wayne Collins joined TransAlta as Executive Vice President, Coal and Mining Operations.


California Claim


On May 30, 2014, we announced that our settlement with California utilities, the California Attorney General, and certain other parties (the “California Parties”) to resolve claims related to the 2000-2001 power crisis in the State of California had been approved by the U.S. Federal Energy Regulatory Commission. The settlement provides for the payment by us of U.S.$52 million in two equal payments and a credit of approximately U.S.$97 million for monies owed to us from accounts receivable. The first payment of U.S.$26 million was paid in June 2014 and the second is expected to be made in 2015. During the fourth quarter of 2013, the Corporation accrued for the then expected settlement of these disputes with the California Parties, which resulted in a pre-tax charge to earnings of approximately $56 million. An additional pre-tax charge to 2014 second quarter earnings of $5 million arose as a result of the final settlement.


Proceedings before the Alberta Utilities Commission


On March 21, 2014, the Alberta Market Surveillance Administrator (the “MSA”) filed an application with the AUC alleging, among other things, that TransAlta manipulated the price of electricity in the Province of Alberta when it took outages at certain of its coal-fired generating units in late 2010 and early 2011. TransAlta has denied the MSA’s allegations in their entirety. An oral hearing before the AUC took place in December 2014. The next phase of the hearing, consisting of a written argument, is currently under way and will be completed by the end of February 2015. The AUC’s decision on this matter is expected within 90 days after the argument has completed. Presently, the outcome is not determinable.


Fort McMurray Transmission Project


During 2014, our strategic partnership with MidAmerican Transmission, TAMA Transmission LP (“TAMA Transmission”), qualified to bid to design, build, and operate the Fort McMurray West 500 kilovolt transmission project. In December 2014, after completing its review of all bid submissions, the AESO notified TAMA Transmission that the contract had been awarded to a competitor.


TransAlta Corporation   |   2014 Annual Report

31


Management’s Discussion and Analysis


Discussion of Segmented Comparable Results


We have three business segments: Generation, Energy Marketing, and Corporate. Comparable figures are not defined under IFRS. Refer to the Earnings and Other Measures on a Comparable Basis section of this MD&A for further discussion of these items, including, where applicable, reconciliations to net earnings attributable to common shareholders.


Generation


For this MD&A, we have further split what is reported as our Generation business segment into the various fuel types to provide additional information to our readers.


Coal: TransAlta owns and operates coal-fired facilities and related mining operations in Canada and the U.S. Coal revenues and overall profitability are derived from the plant availability and production of electricity. Electricity sales generated by our commercial and industrial group in Alberta are assumed to be sourced from our Canadian Coal production within the Generation Segment.


Canadian Coal


Year ended Dec. 31


2014


2013


2012


Availability (%)


88.6


80.9


85.7


Contract production (GWh)


21,748


17,789


16,924


Merchant production (GWh)


3,806


3,779


3,341


Total production (GWh)


25,554


21,568


20,265


Gross installed capacity (MW)


3,771


3,771


3,211


Revenues


1,023


916


913


Fuel and purchased power


436


393


342


Comparable gross margin


587


523


571


Operations, maintenance, and administration


199


205


198


Taxes, other than income taxes


12


11


10


Gain on sale of assets


(1)


(2)


(10)


Net other operating income


(9)


Comparable EBITDA


386


309


373


Depreciation and amortization


292


292


268


Other1


(20)


Comparable operating income


94


17


125


Sustaining capital:


Routine capital


56


69


59


Mining capital


45


65


38


Finance leases


10


9


Planned major maintenance


100


94


219


Total


211


237


316


1      Impacts to revenue associated with Sundance Units 1 and 2.


32


TransAlta Corporation   |   2014 Annual Report


Management’s Discussion and Analysis


2014


Production for the year ended Dec. 31, 2014 increased 3,986 GWh compared to 2013. Production for 2013 was impacted by a seven-month outage at our Keephills Unit 1 facility and the return to service of Sundance Units 1 and 2 in September and October, respectively.


For the year ended Dec. 31, 2014, comparable gross margin increased by $64 million compared to 2013, primarily as a result of lower unplanned outages, lower unit coal costs, and contract price escalations. Lower prices in Alberta in 2014 compared to 2013 decreased incentive payments received for generation in excess of PPA targets, offsetting some of the gain in reliability. We were able to achieve the reduction in coal costs after we took over operations at the Highvale mine in 2013.


OM&A for the year ended Dec. 31, 2014 decreased despite much higher operating capacity with Sundance Units 1 and 2 returning to service. We achieved a reduction in OM&A as a result of reduced maintenance costs associated with lower unplanned outages and the implementation of initiatives to reduce contract labour, staff overtime work, and material usage.


Other operating income resulted from the settlement of a dispute with a supplier in relation to an equipment failure in prior years.


Depreciation and amortization for the year ended Dec. 31, 2014 was consistent compared to 2013. The increase in depreciation and amortization that resulted from an increased asset base, primarily related to Sundance Units 1 and 2 returning to service, was offset by fewer asset retirements during the year and the life extension of certain components.


For the year ended Dec. 31, 2014, sustaining capital returned to a more normal level and decreased $26 million compared to 2013. Sustaining capital in 2013 was higher as a result of the Keephills Unit 1 force majeure and investments to increase mining intensity.


2013


Production for the year ended Dec. 31, 2013 increased 1,303 GWh compared to 2012 due to Sundance Units 1 and 2 returning to service, lower planned outages at the Alberta coal PPA facilities, lower market curtailments, and higher PPA customer demand, partially offset by higher unplanned outages at the Alberta coal PPA facilities, primarily driven by the Keephills Unit 1 force majeure outage.


For the year ended Dec. 31, 2013, comparable EBITDA decreased by $64 million compared to 2012 due to lower realized prices, higher penalties, higher coal costs, and higher unplanned outages at the Alberta coal PPA facilities, partially offset by lower planned outages at the Alberta coal PPA facilities and lower market curtailments. Coal costs increased as a result of an increased asset base from the mine transition and the normal advancement of the mine.


Depreciation and amortization for the year ended Dec. 31, 2013 increased by $24 million compared to 2012 due to an increased asset base and an increase in mine depreciation, partially offset by a decrease in asset retirements and the effect of the change of the economic useful lives of certain plants during 2012.


For the year ended Dec. 31, 2013, the decrease in sustaining capital compared to 2012 is mainly due to the lower number of planned outages, offset by higher mining equipment purchases.


TransAlta Corporation   |   2014 Annual Report

33


Management’s Discussion and Analysis


U.S. Coal


Year ended Dec. 31


2014


2013


2012


Availability (%)


82.8


78.3


81.8


Adjusted availability (%)1


87.7


91.9


90.8


Production (GWh)


6,684


6,711


3,736


Gross installed capacity (MW)


1,340


1,340


1,340


Revenues


368


346


368


Fuel and purchased power


251


227


169


Comparable gross margin


117


119


199


Operations, maintenance, and administration


52


49


46


Taxes, other than income taxes


3


4


6


Gain on sale of assets


(1)


Comparable EBITDA


62


66


148


Depreciation and amortization


54


56


66


Comparable operating income


8


10


82


Sustaining capital:


Routine capital


2


6


10


Planned major maintenance


10


10


22


Total


12


16


32


2014


Production was stable in 2014 compared to 2013, as higher unplanned outages at U.S. Coal were offset by lower economic dispatching as certain months during the period had higher prices which made production more economic. In periods of low market prices, such as during spring runoff, it can be more economic for us to not produce power at U.S. Coal and purchase power in the market to satisfy our contractual obligations.


Comparable EBITDA decreased $4 million in 2014, as 2013 comparable EBITDA included the favourable effects of adjustments to commercial arrangements recognized in prior periods. The effect of prior year adjustments was partially offset by increased optimization margins earned, as we were able to capitalize on high market volatility early in the year. Our marketing and operations teams took advantage of this volatility by generating more power during periods of higher prices or reducing production and supplying from cheaper sources during periods of low prices to satisfy contracted sales.


In December 2014, we started supplying 280 MW under a long-term contract with Puget Sound Energy. The contract volumes escalate to 380 MW in December 2016. Hedge accounting was applied to this contract, with changes in value recorded in other comprehensive income (“OCI”). Hedge accounting could not be applied to certain other contracts, and accordingly, the mark-to-market on these contracts impacted reported earnings. The impacts of these mark-to-market fluctuations have been removed from revenues to arrive at comparable results, which reflect the economic nature of these contracts.


For the year ended Dec. 31, 2014, sustaining capital decreased by $4 million compared to 2013 primarily due to general equipment repair and replacement.


2013


Production for the year ended Dec. 31, 2013 increased 2,975 GWh compared to 2012 due to lower economic dispatching at U.S. Coal, driven by improving market conditions, partially offset by higher planned outages at U.S. Coal.


For the year ended Dec. 31, 2013, comparable EBITDA decreased by $82 million compared to 2012 due to contracts expiring and lower spot prices, partially offset by favourable coal pricing.


Depreciation and amortization for the year ended Dec. 31, 2013 decreased by $10 million compared to 2012 due to the impact of a lower asset base as a result of asset impairments.


For the year ended Dec. 31, 2013, the decrease in sustaining capital compared to 2012 is mainly due to the lower expenditures on planned outages.


1      Adjusted for economic dispatching.


34


TransAlta Corporation   |   2014 Annual Report


Management’s Discussion and Analysis


Gas: TransAlta owns and operates natural gas-fired facilities in Canada and Australia. Gas revenues and overall profitability are derived from the availability and production of electricity and steam. Comparable results, availability, production, and capacity include assets under finance leases.


Year ended Dec. 31


2014


2013


2012


Availability (%)


94.0


94.5


93.6


Production (GWh)


7,390


7,854


8,230


Gross installed capacity (MW)


1,531


1,779


1,731


Revenues


744


683


626


Fuel and purchased power


326


252


226


Comparable gross margin


418


431


400


Operations, maintenance, and administration


105


102


87


Taxes, other than income taxes


4


3


4


Gain on sale of assets


(3)


Net other operating income


(1)


Comparable EBITDA


309


327


312


Depreciation and amortization


114


108


112


Comparable operating income


195


219


200


Sustaining capital:


Routine capital


24


17


13


Planned major maintenance


39


41


36


Total


63


58


49


2014


Production for the year ended Dec. 31, 2014 decreased 464 GWh compared to 2013 due to the reduced requirement to run our Ottawa facility under the terms of its new capacity-based contract. The new contract is consistent with our contracting strategy and its 20-year duration supports continued investment in the facility.


Comparable EBITDA for the year ended Dec. 31, 2014 decreased by $18 million compared to 2013, primarily due to the impact of lower Alberta prices on our merchant capacity in the province and the reduced contribution from our Ottawa facility under the terms of the new contract. These decreases in comparable EBITDA were partially offset by the benefits achieved through resale of higher priced excess gas during unplanned outages in 2014. The current year results include an $8 million unrealized loss on forward purchase and physical gas volumes in Ontario, which is offset by unrealized gains of the same amount in the Energy Marketing Segment.


For the year ended Dec. 31, 2014, sustaining capital increased by $5 million compared to 2013 mainly due to compressor repairs at Mississauga.


2013


Production for the year ended Dec. 31, 2013 decreased 376 GWh compared to 2012 due to higher contract and market curtailments at our Ottawa and Sarnia facilities, partially offset by lower unplanned outages at our Sarnia facility.


For the year ended Dec. 31, 2013, comparable EBITDA increased by $15 million compared to 2012 due to a full year of income from the Solomon power station that was acquired in August 2012, partially offset by higher OM&A costs resulting from higher routine maintenance.


Depreciation and amortization for the year ended Dec. 31, 2013 decreased by $4 million compared to 2012 due to a decrease in asset retirements and favourable changes in foreign exchange rates.


TransAlta Corporation   |   2014 Annual Report

35


Management’s Discussion and Analysis


Renewables: TransAlta owns and operates hydro and wind facilities in Canada and the U.S. Renewables revenues and overall profitability are derived from the availability of water and wind resources and the production of electricity, sale of environmental attributes, as well as ancillary services such as system support.


Wind


Year ended Dec. 31


2014


2013


2012


Availability (%)


94.6


93.8


95.6


Production (GWh)


3,175


2,709


2,583


Gross installed capacity (MW)


1,291


1,289


1,145


Revenues


247


237


207


Fuel and purchased power


14


13


12


Comparable gross margin


233


224


195


Operations, maintenance, and administration


50


39


39


Taxes, other than income taxes


6


5


5


Comparable EBITDA


177


180


151


Depreciation and amortization


88


79


72


Comparable operating income


89


101


79


Sustaining capital:


Routine capital


2


3


2


Planned major maintenance


10


6


2


Total


12


9


4


2014


Production for the year ended Dec. 31, 2014 increased 466 GWh compared to 2013, primarily due to the contribution from a full year of operations at Wyoming wind and New Richmond and higher wind volumes in Eastern Canada.


For the year ended Dec. 31, 2014, comparable EBITDA decreased by $3 million compared to 2013. Lower prices in Alberta in 2014 compared to 2013 more than offset the contribution of new wind projects commissioned or acquired in 2013.


Depreciation and amortization for the year ended Dec. 31, 2014 increased by $9 million compared to 2013, primarily due to the higher asset base associated with recently added facilities.


For the year ended Dec. 31, 2014, sustaining capital increased by $3 million compared to 2013 mainly due to an increase in planned major maintenance activities as a result of an outage at Le Nordais. All units at Le Nordais are now in operation.


2013


Production for the year ended Dec. 31, 2013 increased 126 GWh compared to 2012 due to the commencement of commercial operations at New Richmond.


For the year ended Dec. 31, 2013, comparable EBITDA increased by $29 million compared to 2012 due to the commencement of commercial operations at New Richmond and higher Alberta merchant prices.


Depreciation and amortization for the year ended Dec. 31, 2013 increased by $7 million compared to 2012 due to the commencement of operations at New Richmond.


36


TransAlta Corporation   |   2014 Annual Report


Management’s Discussion and Analysis


Hydro


Year ended Dec. 31


2014


2013


2012


Production (GWh)


1,885


2,085


2,356


Gross installed capacity (MW)


913


913


913


Revenues


131


181


164


Fuel and purchased power


9


5


7


Comparable gross margin


122


176


157


Operations, maintenance, and administration


40


32


28


Taxes, other than income taxes


3


3


2


Net other operating income


(6)


(6)


Comparable EBITDA


85


147


127


Depreciation and amortization


24


25


29


Comparable operating income


61


122


98


Sustaining capital:


Routine capital


9


8


7


Planned major maintenance


3


5


7


Total before flood-recovery capital


12


13


14


Flood-recovery capital


9


1


Total


21


14


14


2014


Production for the year ended Dec. 31, 2014 decreased 200 GWh compared to 2013 due to lower water resource in Western Canada and optimization of storage capacity to capture highest prices.


Comparable EBITDA decreased by $62 million in 2014 compared to 2013, primarily as a result of lower prices and low price volatility in Alberta, which limited our ability to take advantage of our flexibility to produce electricity during higher priced hours.


Net other operating income relates to business interruption insurance proceeds paid in respect of prior period events.


For the year ended Dec. 31, 2014, sustaining capital increased by $7 million compared to 2013, mainly due to flood-recovery capital. These expenditures were mostly recovered through insurance proceeds recognized in net earnings in 2014, as non-comparable items.


2013


Production for the year ended Dec. 31, 2013 decreased 271 GWh compared to 2012 due to lower water resource.


For the year ended Dec. 31, 2013, comparable EBITDA increased by $20 million compared to 2012 due to favourable prices, partially offset by lower water resource.


Depreciation and amortization for the year ended Dec. 31, 2013 decreased by $4 million compared to 2012 due to a change in the useful lives of the Hydro assets during 2013.


TransAlta Corporation   |   2014 Annual Report

37


Management’s Discussion and Analysis


Equity Investments


As outlined in the Significant 2014 Events and Subsequent Events section of this MD&A, we completed the sale of our interests in CE Gen and CalEnergy in June 2014 and Wailuku in November 2014.


The equity method was used to account for the results of the CE Gen, CalEnergy, and Wailuku joint ventures for the months of January and February 2014, but ceased effective March 1, 2014 with classification of these investments as assets held for sale in compliance with IFRS requirements. There were no earnings from Equity Investments during the two-month period (2013 annual – loss of $10 million, 2012 annual – loss of $15 million).


The table below summarizes key operational information adjusted to reflect our interest in these investments:


Two months ended


Year ended


Year ended


Feb. 28, 2014


Dec. 31, 2013


Dec. 31, 2012


Availability (%)


97.1


91.2


94.2


Production (GWh):


Gas


127


385


380


Renewables


187


1,170


1,200


Total production


314


1,555


1,580


Energy Marketing


The results of the Energy Marketing Segment, with all trading results presented on a net revenue basis, are as follows:


Year ended Dec. 31


2014


2013


2012


Revenues and comparable gross margin


108


79


3


Operations, maintenance, and administration


32


18


16


Comparable EBITDA


76


61


(13)


Depreciation and amortization


1


Comparable operating income (loss)


76


60


(13)


2014


For the year ended Dec. 31, 2014, Energy Marketing comparable EBITDA increased by $15 million compared to 2013 due to extreme weather events that caused unprecedented gas and power commodity price volatility in eastern markets during the first and fourth quarters of 2014, which positively impacted our ability to optimize our portfolio of generation, transportation, transmission, and storage assets. We also capitalized on low risk arbitrage opportunities brought about by the extreme market volatility. As noted in the Gas subsection earlier, an offsetting gain has also been recorded in this segment against Gas generation losses. The increase was partially offset by higher corporate cost allocations and higher performance-based compensation costs driven by the strong results.


2013


For the year ended Dec. 31, 2013, Energy Marketing comparable EBITDA increased by $74 million compared to 2012 due to strong trading performance across all markets and prudent management of risk. The increase is attributable to successful trading strategies involving regional power demand and price differentials across all markets.


38


TransAlta Corporation   |   2014 Annual Report


Management’s Discussion and Analysis


Corporate


Our Generation and Energy Marketing segments are supported by a Corporate group that provides finance, tax, treasury, legal, regulatory, environmental, procurement, health and safety, sustainable development, corporate communications, government and investor relations, information technology, risk management, human resources, aboriginal relations, internal audit, and other administrative support.


The expenses incurred by the Corporate Segment are as follows:


Year ended Dec. 31


2014


2013


2012


Operations, maintenance, and administration and taxes other than income taxes


(59)


(67)


(83)


Depreciation and amortization


26


23


20


Comparable operating loss


(85)


(90)


(103)


Sustaining capital:


Routine capital


23


22


24


2014


For the year ended Dec. 31, 2014, OM&A expense decreased by $8 million compared to 2013, primarily due to a change in the way in which certain overhead cost allocations are made within the organization, partially offset by higher incentive compensation.


2013


For the year ended Dec. 31, 2013, OM&A expense decreased by $16 million compared to 2012, primarily due to lower compensation costs as a result of restructuring in the fourth quarter of 2012, a continued focus on managing costs, and lower costs as a result of the way in which certain overhead cost allocations are made within the organization. These changes in methodologies primarily arose as a result of our 2012 realignment of resources and more clear focus between base operations and growth.


TransAlta Corporation   |   2014 Annual Report

39


Management’s Discussion and Analysis


Other Consolidated Results


Asset Impairment Charges and Reversals


All impairment charges and reversals are reported in the Generation Segment. Impairment charges can be reversed in future periods if the forecasted cash flows of the impacted plants improve.


2014


U.S. Coal


As at Nov. 30, 2014, we identified the decrease in projected growth in Mid-Columbia power prices as an indicator that the U.S. Coal cash-generating unit (“CGU”) could be impaired. The U.S. Coal CGU’s carrying amount at that date, net of associated long-term liabilities, was $372 million. We estimated the fair value less costs of disposal of the CGU, utilizing our long-range forecast, and the following key assumptions:


Mid-Columbia annual average power prices


U.S.$31.00 to 52.00 per MWh


On-highway diesel fuel on coal shipments


U.S.$3.06 to 3.37 per gallon


Discount rates


5.1 to 6.2 per cent


The valuation is subject to measurement uncertainty based on those assumptions, and on inputs to our long-range forecast, including changes to fuel costs, operating costs, capital expenses and the level of contractedness under the Memorandum of Agreement (“MoA”) for coal transition established with the State of Washington. The valuation period extended to the assumed decommissioning of the asset, after its projected cessation of operation in its current form in 2025.


Fair value less costs of disposal of the CGU was estimated to approximate its carrying amount, and accordingly, no impairment charge was recorded. Any adverse change in assumptions, in isolation, would have resulted in an impairment charge being recorded. We continue to manage risks associated with the CGU through optimization of our operating activities and capital plan.


Centralia Gas


During 2014, we sold to external counterparties and transferred to other owned facilities for productive use, assets of the Centralia gas facility, which had been fully impaired and had remained idled since 2010. As a result of the transactions, we recognized impairment reversals of $5 million, and the plant’s generating capacity has been removed from total TransAlta owned capacity.


2013


Alberta Merchant


As part of the annual impairment review and assessment process in 2013, the Corporation’s Alberta plants with significant merchant capacity were considered one cash-generating unit (the “Alberta Merchant CGU”). While no impairment losses were recognized in 2013 for the Alberta Merchant CGU, total pre-tax impairment losses of $23 million that were recognized previously on renewables plants that became part of the Alberta Merchant CGU were reversed. Please refer to Note 6 of our audited consolidated financial statements within this Annual Report for additional information.


Renewables


We recognized a total pre-tax impairment charge of $4 million related to three contracted Hydro assets. The assets were impaired primarily due to an increase in future capital and operating expenses that resulted from the completion of condition assessments.


40


TransAlta Corporation   |   2014 Annual Report


Management’s Discussion and Analysis


Net Interest Expense


The components of net interest expense are shown below:


Year ended Dec. 31


2014


2013


2012


Interest on debt


238


240


227


Interest income


(2)


Capitalized interest


(3)


(2)


(4)


Ineffectiveness on hedges


4


Interest on finance lease obligations


1


Accretion of provisions


18


18


17


Net interest expense


254


256


242


For the year ended Dec. 31, 2014, net interest expense decreased compared to 2013, primarily due to the approximate $500 million reduction in debt during the year and lower interest rates on debt that was refinanced. Higher interest expense due to strengthening of the U.S. dollar has partially offset these decreases.


In 2013, net interest expense increased compared to 2012, primarily due to higher debt levels, unfavourable changes in foreign exchange rates, and higher interest rates, partially offset by lower ineffectiveness on hedges.


Income Taxes


Our income tax rates and tax expense are based on the earnings generated in each jurisdiction in which we operate and any permanent differences between how pre-tax income is calculated for accounting and tax purposes. If there is a timing difference between when an expense or revenue item is recognized for accounting and tax purposes, these differences result in deferred income tax assets or liabilities and are measured using the income tax rate expected to be in effect when these temporary differences reverse. The impact of any changes in future income tax rates on deferred income tax assets or liabilities is recognized in earnings in the period the new rates are enacted.


TransAlta Corporation   |   2014 Annual Report

41


Management’s Discussion and Analysis


A reconciliation of income taxes and effective tax rates on earnings, excluding non-comparable items, is presented below:


Year ended Dec. 31


2014


2013


2012


Earnings (loss) before income taxes


239


(12)


(445)


Income attributable to non-controlling interests


(49)


(29)


(37)


Equity loss


10


15


Impacts associated with certain de-designated and economic hedges


(54)


103


72


Asset impairment charges (reversals)


(6)


(18)


324


Restructuring provision (reversal)


(3)


13


Gain on sale of assets


(2)


(12)


(3)


Gain on sale of collateral


(15)


Foreign exchange loss on California claim


4


Flood-related maintenance costs, net of insurance recovery


1


7


3


TAMA Transmission bid costs


5


Net other operating losses


1


109


254


Comparable earnings attributable to TransAlta shareholders subject to tax


139


155


181


Comparable income tax expense adjustments:


Income tax (expense) recovery related to impacts associated with certain de-designated and economic hedges


(19)


36


25


Income tax expense related to asset impairment charges and reversals


(1)


(5)


(5)


Income tax (expense) recovery related to restructuring provision


(1)


3


Income tax (expense) recovery related to gain on sale of assets


1


(2)


(1)


Income tax recovery related to divestiture of investment


35


Income tax expense related to (gain on sale of) reserve on collateral


(4)


Income tax (expense) recovery related to writedown of deferred income tax assets


5


(28)


(169)


Income tax recovery related to the resolution of certain outstanding tax matters


9


Income tax (expense) recovery related to changes in corporate income tax rates


5


(8)


Income tax recovery related to foreign exchange loss on California claim


1


Income tax recovery related to flood-related maintenance costs, net of insurance recovery


2


1


Income tax recovery related to TAMA Transmission bid costs


1


Income tax recovery related to net other operating losses


27


65


Total comparable income tax expense adjustments


23


34


(84)


Income tax expense (recovery)


7


(8)


102


Comparable income tax expense


30


26


18


Comparable effective tax rate on earnings attributable to TransAlta shareholders (%)


22


22


(46)


The comparable income tax expense increased for the year ended Dec. 31, 2014 compared to 2013 due to changes in the amount of earnings between the jurisdictions in which pre-tax income is earned, offset by lower comparable earnings.


In 2013, the comparable income tax expense increased compared to 2012 due to the positive resolution of certain tax contingency matters in the prior period and changes in the amount of earnings between the jurisdictions in which pre-tax income is earned.


The comparable effective tax rate on earnings attributable to TransAlta shareholders increased for the year ended Dec. 31, 2014 compared to 2013 due to changes in the amount of earnings between the jurisdictions in which pre-tax income is earned and the effect of certain deductions that do not fluctuate with earnings.


In 2013, the comparable effective tax rate on earnings attributable to TransAlta shareholders increased compared to 2012 due to changes in the amount of earnings between the jurisdictions in which pre-tax income is earned, the effect of certain deductions that do not fluctuate with earnings, and the positive resolution of certain tax contingency matters in the prior period.


42


TransAlta Corporation   |   2014 Annual Report


Management’s Discussion and Analysis


During the year ended Dec. 31, 2014, we reversed a previous writedown of deferred income tax assets of $5 million. The reversal was based on changes to taxable and deductible temporary differences during 2014 that impact the net U.S. deferred income tax assets and our assessment of recognition.


During the year ended Dec. 31, 2013, we recognized a writedown of deferred income tax assets of $28 million (2012 – $169 million). The deferred income tax assets related mainly to the tax benefits of losses associated with our directly owned U.S. operations. We wrote these assets off as it was no longer considered probable that sufficient future taxable income would be available from our directly owned U.S. operations to utilize the underlying tax losses, due to reduced price growth expectations.


Non-Controlling Interests


We own 50.01 per cent of TA Cogen, which owns, operates, or has an interest in four natural gas-fired facilities and one coal-fired generating facility. Canadian Power Holdings Inc. owns the minority interest in TA Cogen. We also own 70.3 per cent (80.6 per cent in 2013) of TransAlta Renewables. TransAlta Renewables is a publicly traded company listed on the Toronto Stock Exchange under the symbol “RNW”. It has interests in 1,283 MW of renewable assets. Since we own a controlling interest in TA Cogen and TransAlta Renewables we consolidate the entire earnings, assets, and liabilities in relation to our ownership of those assets.


Non-controlling interests on the Consolidated Statements of Earnings (Loss) and Consolidated Statements of Financial Position relate to the earnings and net assets attributable to TA Cogen and TransAlta Renewables that we do not own. On the Consolidated Statements of Cash Flows, cash paid to the minority shareholders of TA Cogen and TransAlta Renewables is shown in the financing section as distributions paid to subsidiaries’ non-controlling interests.


Earnings attributable to non-controlling interests for the year ended Dec. 31, 2014 increased $20 million to $49 million compared to 2013, primarily due to the formation of TransAlta Renewables and increased public ownership.


In 2013, earnings attributable to non-controlling interests decreased $8 million compared to 2012, due to lower earnings at TA Cogen.


Additional IFRS Measures


An additional IFRS measure is a line item, heading, or subtotal that is relevant to an understanding of the financial statements but is not a minimum line item mandated under IFRS, or the presentation of a financial measure that is relevant to an understanding of the financial statements but is not presented elsewhere in the financial statements. We have included line items entitled gross margin and operating income (loss) in our Consolidated Statements of Earnings (Loss) for the years ended Dec. 31, 2014, 2013, and 2012. Presenting these line items provides management and investors with a measurement of ongoing operating performance that is readily comparable from period to period.


Earnings and Other Measures on a Comparable Basis


We evaluate our performance and the performance of our business segments using a variety of measures. Those discussed below, and elsewhere in this MD&A, are not defined under IFRS and, therefore, should not be considered in isolation or as an alternative to or to be more meaningful than net earnings attributable to common shareholders or cash flow from operating activities, as determined in accordance with IFRS, when assessing our financial performance or liquidity. These measures are not necessarily comparable to a similarly titled measure of another company.


Each business unit assumes responsibility for its operating results measured to gross margin and operating income. Operating income and gross margin provides management and investors with a measurement of operating performance that is readily comparable from period to period.


In calculating these items, we exclude certain items as management believes these transactions are not representative of our business operations. Earnings on a comparable basis per share are calculated using the weighted average common shares outstanding during the period.


During 2014, prior period restatements were made to 2013 and 2012. Refer to the Current Accounting Changes section of this MD&A for a description of these items.


TransAlta Corporation   |   2014 Annual Report

43


Management’s Discussion and Analysis


The adjustments made to calculate comparable earnings for the year ended Dec. 31, 2014, 2013, and 2012 are as follows. References are to reconciliations presented on the following pages.


Year ended Dec. 31


2014


2013


2012


Reference


Segment and


number


Adjustment


fuel type


Reclassifications:


1


Finance lease income used as a proxy for operating revenue


Generation (Gas)


49


46


16


2


Decrease in finance lease receivable used as a proxy for operating revenue and depreciation


Generation (Gas)


3


1


3


3


Reclassification of mine depreciation from fuel and purchased power


Generation (Canadian Coal)


56


58


41


4


Reclassification of comparable gain on sale of property, plant, and equipment that is included in depreciation


Generation (Canadian Coal)


1


2


10


Generation (U.S. Coal)


1


Generation (Gas)


3


5


Impacts to revenue associated with Sundance Units 1 and 2


Generation (Canadian Coal)


20


Adjustments (increasing (decreasing) earnings to arrive at comparable results):


6


Impacts to revenue associated with certain de-designated and economic hedges


Generation (U.S. Coal)


(54)


103


72


7


Flood-related maintenance costs, net of insurance recoveries


Generation (Hydro)


1


7


8


Writeoff of Project Pioneer costs


Generation (Canadian Coal)


3


9


Costs related to TAMA Transmission bid


Corporate


5


10


Asset impairment charges (reversals)


Generation (Canadian Coal)


(41)


Generation (U.S. Coal)


347


Generation (Gas)


(6)


1


Generation (Wind)


(23)


16


Generation (Hydro)


4


2


11


Restructuring charges


Generation (Canadian Coal)


(2)


4


Generation (Gas)


1


Corporate


(1)


8


12


California claim


Energy Marketing


5


56


13


Non-comparable portion of insurance recovery received


Generation (Hydro)


(4)


(1)


14


Sundance Units 1 and 2 return to service


Generation (Canadian Coal)


25


254


15


Loss on assumption of pension obligation


Generation (Canadian Coal)


29


16


Foreign exchange on California claim


Unassigned


4


17


Non-comparable gain on sale of assets


Generation (Equity Investments)


(2)


Corporate


(12)


Generation (Wind)


(3)


18


Gain on sale of collateral


Energy Marketing


(15)


19


Writedown (reversal of writedown) of deferred income tax assets


Unassigned


(5)


28


169


20


Net tax effect of other comparable adjustments


Unassigned


(18)


(62)


(85)


21


Non-comparable item attributable to non-controlling interest


Unassigned


1


44


TransAlta Corporation   |   2014 Annual Report


Management’s Discussion and Analysis


A reconciliation of comparable results to reported results for the year ended Dec. 31, 2014 and 2013 is as follows:


Year ended Dec. 31


 2014


  2013


Comparable


Comparable


Comparable


Comparable


Comparable


Comparable


Reported


reclassifications


adjustments


total


Reported


reclassifications


adjustments


total


Revenues


2,623


52

1,2

(54)

6

2,621


2,292


47

1,2

103

6

2,442


Fuel and purchased power


1,092


(56)

3


1,036


948


(58)

3


890


Gross margin


1,531


108


(54)


1,585


1,344


105


103


1,552


Operations, maintenance, and administration


542


(6)

7,9

536


516


(5)

7

511


Asset impairment charges


(6

)


6

10


(18

)


18

10


Restructuring provision


(3

)


3

11


Taxes, other than income taxes


29


29


27


27


Gain on sale of assets


(1)

4


(1

)


(2)

4


(2

)

Net other operating (income) losses


(14

)


(1)

12,13

(15

)

102


(109)

12,13,14,15

(7

)

Earnings before interest, taxes, depreciation, and amortization


980


109


(53)


1,036


720


107


196


1,023


Depreciation and amortization


538


60

2,3,4


598


525


61

2,3,4

(2)

7

584


Operating income


442


49


(53)


438


195


46


198


439


Finance lease income


49


(49)

1


46


(46)

1


Equity loss


(10

)


(10

)

Foreign exchange gain (loss)


4

16

4


1


1


Gain on sale of assets


2


(2)

17


12


(12)

17


Other income


Earnings (loss) before interest and taxes


493


(51)


442


244


186


430


Net interest expense


254


254


256


256


Income tax expense (recovery)


7


23

19,20

30


(8

)


34

19,20

26


Net earnings (loss)


232


(74)


158


(4

)


152


148


Non-controlling interests


50


(1)

21

49


29


29


Net earnings (loss) attributable to TransAlta shareholders


182


(73)


109


(33

)


152


119


Preferred share dividends


41


41


38


38


Net earnings (loss) attributable to common shareholders


141


(73)


68


(71

)


152


81


Weighted average number of common shares outstanding in the year


273


273


264


264


Net earnings (loss) per share attributable to common shareholders


0.52


0.25


(0.27

)


0.31


TransAlta Corporation   |   2014 Annual Report

45


Management’s Discussion and Analysis


A reconciliation of comparable results to reported results for the year ended Dec. 31, 2012 is as follows:


Year ended Dec. 31


2012


Comparable


Comparable


Comparable


Reported


reclassifications


adjustments


total


Revenues


2,210


(1)

1,2,5

72

6

2,281


Fuel and purchased power


797


(41)

3


756


Gross margin


1,413


40


72


1,525


Operations, maintenance, and administration


499


(3)

8

496


Asset impairment charges


324


(324)

10


Restructuring provision


13


(13)

11


Taxes, other than income taxes


28


28


Gain on sale of assets


(14)

4


(14

)

Net other operating (income) losses


254


(254)

14


Earnings before interest, taxes, depreciation, and amortization


295


54


666


1,015


Depreciation and amortization


509


58

2,3,4


567


Other


(20)

5


(20

)

Operating income


(214

)

16


666


468


Finance lease income


16


(16)

1


Equity loss


(15

)


(15

)

Foreign exchange loss


(9

)


(9

)

Gain on sale of assets


3


(3)

17


Gain on sale of collateral


15


(15)

18


Other income


1


1


Earnings before interest and taxes


(203

)


648


445


Net interest expense


242


242


Income tax expense


102


(84)

19,20

18


Net earnings


(547

)


732


185


Non-controlling interests


37


37


Net earnings attributable to TransAlta shareholders


(584

)


732


148


Preferred share dividends


31


31


Net earnings attributable to common shareholders


(615

)


732


117


Weighted average number of common shares outstanding in the year


235


235


Net earnings per share attributable to common shareholders


(2.62

)


0.50


46


TransAlta Corporation   |   2014 Annual Report


Management’s Discussion and Analysis


Financial Instruments


Financial instruments are used to manage our exposure to interest rates, commodity prices, and currency fluctuations, as well as other market risks. We currently use physical and financial swaps, forward sale and purchase contracts, futures contracts, foreign exchange contracts, interest rate swaps, and options to achieve our risk management objectives. Financial instruments are accounted for using the fair value method of accounting. The initial recognition of fair value and subsequent changes in fair value can affect reported earnings in the period the change occurs if hedge accounting is not elected. Otherwise, changes in fair value will generally not affect earnings until the financial instrument is settled.


We have two types of financial instruments: (i) those that are used in the Generation and Energy Marketing segments in relation to commodity risk management activities, commodity hedging activities, and other contracting activities and (ii) those used in the hedging of interest rate and foreign currency exposures on debt, foreign currency exposures on projects and other expenditures, and our net investment in foreign operations.


Some of our financial instruments and physical commodity contracts are recorded under own use accounting or qualify for, and are recorded under, hedge accounting rules. The accounting for those contracts for which we have elected to apply hedge accounting depends on the type of hedge. Our financial instruments are categorized as fair value hedges, cash flow hedges, net investment hedges, or non-hedges. These categories and their associated accounting treatments are explained in further detail below.


For all types of hedges, we test for effectiveness at the end of each reporting period to determine if the instruments are performing as intended and hedge accounting can still be applied. The financial instruments we enter into are designed to ensure that future cash inflows and outflows are predictable. In a hedging relationship, the effective portion of the change in the fair value of the hedging derivative does not impact net earnings, while any ineffective portion is recognized in net earnings.


As well, there are certain contracts in our portfolio that at their inception do not qualify for, or we have chosen not to elect to apply, hedge accounting. For these contracts, we recognize in net earnings mark-to-market gains and losses resulting from changes in forward prices compared to the price at which these contracts were transacted. These changes in price alter the timing of earnings recognition, but do not affect the final settlement amount received. The fair value of future contracts will continue to fluctuate as market prices change.


The fair value of derivatives traded by the Corporation that are not traded on an active exchange, or extend beyond the time period for which exchange-based quotes are available, are determined using valuation techniques or models.


Fair Value Hedges

Fair value hedges are used to offset the impact of changes in the fair value of fixed rate long-term debt caused by variations in market interest rates. We use interest rate swaps in our fair value hedges.


In a fair value hedge, changes in the fair value of the hedging instrument (an interest rate swap, for example) are recognized in risk management assets or liabilities, and the related gains or losses are recognized in net earnings. The carrying amount of long-term debt subject to the hedge is adjusted for losses or gains associated with the hedged risk, with the corresponding amounts recognized in net earnings. As a result, only the net ineffectiveness is recognized in net earnings.


Cash Flow Hedges

Cash flow hedges are categorized as project, foreign exchange, interest rate, or commodity hedges and are used to offset foreign exchange, interest rate, and commodity price exposures resulting from market fluctuations.


Project Hedges

Foreign currency forward contracts are used to hedge foreign exchange exposures resulting from anticipated contracts and firm commitments denominated in foreign currencies, primarily related to capital expenditures.


TransAlta Corporation   |   2014 Annual Report

47


Management’s Discussion and Analysis


Foreign Exchange, Interest Rate, and Commodity Hedges

Physical and financial swaps, forward sale and purchase contracts, futures contracts, and options are used primarily to offset the variability in future cash flows caused by fluctuations in electricity and natural gas prices. Foreign exchange forward contracts and cross-currency swaps are used to offset the exposures resulting from foreign-denominated long-term debt. Forward start interest rate swaps are used to offset the variability in cash flows related to interest expense resulting from anticipated issuances of long-term debt.


In a cash flow hedge, changes in the fair value of the hedging instrument (a forward contract or financial swap, for example) are recognized in risk management assets or liabilities, and the related gains or losses are recognized in OCI. These gains or losses are subsequently reclassified from OCI to net earnings in the same period as the hedged forecast cash flows impact net earnings, and offset the losses or gains arising from the forecast transactions. For project hedges, the gains and losses reclassified from OCI are included in the carrying amount of the related property, plant, and equipment (“PP&E”).


When we do not elect hedge accounting, or when the hedge is no longer effective and does not qualify for hedge accounting, the gains or losses as a result of changes in prices, interest, or exchange rates related to these financial instruments are recorded in net earnings in the period in which they arise.


Net Investment Hedges

Foreign currency forward contracts and foreign-denominated long-term debt are used to hedge exposure to changes in the carrying values of our net investments in foreign operations that have a functional currency other than the Canadian dollar. Gains or losses on these instruments are recognized and deferred in OCI and reclassified to net earnings on the disposal of the foreign operation. We attempt to manage our foreign exchange translation exposure by matching foreign-denominated expenses with revenues, such as offsetting revenues from our U.S. operations with interest payments on our U.S. dollar debt.


Following the divestiture of CE Gen, Blackrock, and CalEnergy, and the repatriation of proceeds into Canadian funds, we de-designated approximately U.S.$180 million of debt from hedging U.S. net investments. During the third quarter of 2014, we de-designated an additional U.S.$90 million of U.S.-denominated debt hedging other U.S. operations. Prospectively, these tranches of U.S.-denominated debt are being hedged with foreign currency derivative instruments.


Non-Hedges

Financial instruments not designated as hedges are used to reduce commodity price, foreign exchange, and interest rate risks. Changes in the fair value of financial instruments not designated as hedges are recognized in risk management assets or liabilities, and the related gains or losses are recognized in net earnings in the period in which the change occurs.


Fair Values

The majority of fair values for our project, foreign exchange, interest rate, commodity hedges, and non-hedge derivatives are calculated using adjusted quoted prices from an active market or inputs validated by broker quotes. We may enter into commodity transactions involving non-standard features for which market-observable data is not available. These transactions are defined under IFRS as Level III instruments. Level III instruments incorporate inputs that are not observable from the market, and fair value is therefore determined using valuation techniques. Fair values are validated by using reasonably possible alternative assumptions as inputs to valuation techniques, and any material differences are disclosed in the notes to the financial statements. At Dec. 31, 2014, Level III instruments had a net asset carrying value of $217 million. Refer to the Critical Accounting Policies and Estimates section of this MD&A for further details regarding valuation techniques. Our risk management profile and practices have not changed materially from Dec. 31, 2013.


48


TransAlta Corporation   |   2014 Annual Report


Management’s Discussion and Analysis


Liquidity and Capital Resources


Liquidity risk arises from our ability to meet general funding needs, engage in trading and hedging activities, and manage the assets, liabilities, and capital structure of the Corporation. Liquidity risk is managed by maintaining sufficient liquid financial resources to fund obligations as they come due in the most cost-effective manner. Liquidity risk related to commodity risk management activities is managed by maintaining sufficient reserves and monitoring our counterparties and the markets in which we transact.


Our liquidity needs are met through a variety of sources, including cash generated from operations, availability under our long-term credit facilities, and long-term debt or equity issued under our Canadian and U.S. shelf registrations. Our primary uses of funds are operational expenses, capital expenditures, dividends, distributions to non-controlling interests, and interest and principal payments on debt securities.


On Dec. 17, 2014, we filed a U.S. base shelf prospectus that allows for the issuance of up to U.S.$2.0 billion aggregate principal amount (or its equivalent in other currencies) of common shares, first preferred shares, warrants, subscription receipts, or debt securities from time to time. The specific terms of any offering of securities is to be determined at the date of issue.


Debt

Long-term debt totalled $4.0 billion as at Dec. 31, 2014 compared to $4.3 billion as at Dec. 31, 2013. Long-term debt decreased from Dec. 31, 2013 primarily due to the use of proceeds from the sale of CE Gen, Blackrock, and CalEnergy, the secondary offering of TransAlta Renewables common shares, and the issuance of preferred shares to pay down our credit facility borrowings. In May we repaid a $200 million maturing debenture by issuing a U.S.$400 million senior note. Excess proceeds were used to further reduce borrowings under our credit facilities.


During the year, strengthening of the U.S. dollar increased our long-term debt balances by $174 million. Almost all of our U.S.-denominated debt is hedged either through financial contracts or net investments in our U.S. operations. For 2014, the changes in our U.S.-denominated debt were offset as follows:


For the year ended Dec. 31


2014


Effects of foreign exchange on carrying amounts of U.S. operations (net investment hedge)


55


Foreign currency cash flow hedges on debt


79


Effects of foreign exchange on value of U.S.-denominated Solomon finance lease


29


Other economic hedges


11


Total


174


Credit Facilities

At Dec. 31, 2014, we had a total of $2.1 billion (2013 – $2.1 billion) of committed credit facilities, of which $1.6 billion (2013 – $0.9 billion) was not drawn and is available, subject to customary borrowing conditions. At Dec. 31, 2014, the $0.5 billion (2013 – $1.2 billion) of credit utilized under these facilities was comprised of actual drawings of $0.1 billion (2013 – $0.8 billion) and letters of credit of $0.4 billion (2013 – $0.4 billion). These facilities are comprised of a $1.5 billion committed syndicated bank facility that matures in 2018, with the remainder comprised of bilateral credit facilities, of which $0.3 billion matures in 2017 and $0.2 billion matures in the fourth quarter of 2016. We anticipate renewing these facilities, based on reasonable commercial terms, prior to their maturities.


In addition to the $1.6 billion available under the credit facilities, we have $43 million of available cash.


TransAlta Corporation   |   2014 Annual Report

49


Management’s Discussion and Analysis


Share Capital

On Feb. 18, 2015, we had 277.0 million common shares outstanding, 12.0 million Series A, 11.0 million Series C, 9.0 million Series E, and 6.6 million Series G preferred shares outstanding. At Dec. 31, 2014, we had 275.0 million (2013 – 268.2 million) common shares issued and outstanding. At Dec. 31, 2014, we had 38.6 million (2013 – 32.0 million) first preferred shares issued and outstanding.


During the year ended Dec. 31, 2014, 6.8 million (2013 – 13.5 million) common shares were issued to shareholders that elected dividend reinvestment, for a total of $85 million (2013 – $186 million).


As noted in the Significant 2014 Events and Subsequent Events section of this MD&A, on Aug. 15, 2014, we completed a public offering of 6.6 million Series G Cumulative Redeemable Rate Reset First Preferred Shares for gross proceeds of $165 million. The holders of the preferred shares are entitled to receive fixed cumulative cash dividends at an annual rate of $1.325 per share as approved by the Board, payable quarterly, yielding 5.30 per cent per annum, for the initial period ending Sept. 30, 2019. The dividend rate will reset on Sept. 30, 2019 and every five years thereafter to a yield per annum equal to the sum of the then five-year Government of Canada bond yield plus 3.80 per cent. The preferred shares are redeemable at the option of TransAlta on or after Sept. 30, 2019 and on Sept. 30 of every fifth year thereafter at a price of $25.00 per share plus all accrued and unpaid dividends.


The Series G preferred shareholders have the right at their option to convert their shares into Series H Cumulative Redeemable Rate Reset First Preferred Shares on Sept. 30, 2019 and on Sept. 30 of every fifth year thereafter. The holders of Series H preferred shares will be entitled to receive quarterly floating rate cumulative dividends as approved by the Board at a yield per annum equal to the sum of the then three-month Government of Canada Treasury Bill yield plus 3.80 per cent.


On Jan. 23, 2015, we declared a quarterly dividend of $0.18 per share on common shares, payable on April 1, 2015. This dividend is in line with the resized dividend that was announced in February 2014 of $0.72 per common share on an annualized basis. Declaration of dividends is at the discretion of the Board.


On Jan. 23, 2015, we declared a quarterly dividend of $0.2875 per share on the Series A and Series C preferred shares, $0.3125 per share on the Series E preferred shares, and $0.33125 per share on the Series G preferred shares, all payable on March 31, 2015.


Guarantee Contracts

We have obligations to issue letters of credit and cash collateral to secure potential liabilities to certain parties, including those related to potential environmental obligations, commodity risk management and hedging activities, construction projects, and purchase obligations. At Dec. 31, 2014, we provided letters of credit totalling $396 million (2013 – $370 million) and cash collateral of $25 million (2013 – $21 million). These letters of credit and cash collateral secure certain amounts included on our Consolidated Statements of Financial Position under risk management liabilities and decommissioning and other provisions.


50


TransAlta Corporation   |   2014 Annual Report


Management’s Discussion and Analysis


Working Capital

As at Dec. 31, 2014, the excess of current liabilities over current assets was $597 million (2013 – $116 million). The excess of current liabilities over current assets increased $481 million compared to 2013, primarily due to a U.S.$500 million senior note due in January 2015. The note was repaid using liquidity.


Capital Structure

Our capital structure consisted of the following components as shown below:


2014


2013


As at Dec. 31


Amount


%


Amount


%


Net debt1


3,917


50


4,289


55


Non-controlling interests


594


8


517


7


Equity attributable to shareholders


3,284


42


2,906


38


Total capital


7,795


100


7,712


100


Commitments

Contractual commitments are as follows:


Natural gas,


Transmission


Non-


transportation,


and power


cancellable


Coal supply


Long-term


Interest on


and other purchase


purchase


operating


and mining


service


Long-term


long-term


contracts


agreements


leases


agreements


agreements


debt2


debt3


Growth


Total


2015

43


12


11


159


119


738


178


207


1,467


2016

29


9


10


137


120


29


171


50


555


2017

13


3


8


44


105


466


166


175


980


2018

12


4


8


45


33


878


129


8


1,117


2019

7


2


8


46


31


402


104


600


2020 and thereafter

101


6


54


605


172


1,472


723


3,133


Total

205


36


99


1,036


580


3,985


1,471


440


7,852


In November 2014, we entered into an agreement with Alstom to provide major maintenance for our operated Canadian Coal facilities. Please refer to the Significant 2014 Events and Subsequent Events section of this MD&A for more information.


As part of the TransAlta Energy Bill signed into law in the State of Washington and the subsequent MoA, we have committed to fund U.S.$55 million over the remaining life of the U.S. Coal plant to support economic and community development, promote energy efficiency, and develop energy technologies related to the improvement of the environment. The MoA contains certain provisions for termination and in the event of the termination and certain circumstances, this funding or part thereof would no longer be required.


1              Total debt and finance lease obligations net of cash and cash equivalents and fair value of related hedging instruments. Refer to Note 14 of our 2014 Notes to the Annual Financial Statements.

2              Repayments of long-term debt include amounts related to our credit facilities that are currently scheduled to mature in 2016, 2017, and 2018.

3              Interest on long-term debt is based on debt currently in place with no assumption as to re-financing an instrument on maturity.


TransAlta Corporation   |   2014 Annual Report

51


Management’s Discussion and Analysis


Financial Position

The following chart outlines significant changes in the Consolidated Statements of Financial Position from Dec. 31, 2013 to Dec. 31, 2014:


Increase/


(decrease)


Primary factors explaining change

Trade and other receivables


(54)


Timing of customer receipts

Investments


(192)


Sale of CE Gen

Finance lease receivables (long-term)


26


Favourable changes in foreign exchange rates

Property, plant, and equipment, net


45


Additions and favourable changes in foreign exchange rates, partially offset by depreciation for the period

Deferred income tax assets


(73)


Changes in temporary differences

Risk management assets (current and long-term)1


446


Gains on long-term power sale contract and U.S. foreign currency hedges

Accounts payable and accrued liabilities


34


Higher capital accruals, partially offset by timing of payments and accruals

Dividends payable


(30)


Reduction of quarterly dividend

Long-term debt and finance lease obligations (including current portion)


(291)


Reduction of borrowings under credit facility and payout on maturity of medium-term notes, partially offset by the issuance of senior notes

Decommissioning and other provisions (current and long-term)


24


Fluctuations in period-end discount rates

Deferred income tax liabilities


(25)


Changes in temporary differences

Risk management liabilities (current and long-term)1


34


Price movements and changes in underlying positions and settlements

Equity attributable to shareholders


378


Net earnings for the period, gains on cash flow hedges recognized in other comprehensive income, and preferred shares issued, partially offset by declared dividends

Non-controlling interests


77


Sale of additional non-controlling interest in TransAlta Renewables, partially offset by non-controlling interests’ portion of net earnings net of distributions


Statements of Cash Flows

The following charts highlight significant changes in the Consolidated Statements of Cash Flows for the years ended Dec. 31, 2014 and 2013:


Year ended Dec. 31


2014


2013


Explanation of change

Cash and cash equivalents, beginning of year


42


27


Provided by (used in):


Operating activities


796


765


Increase in cash earnings of $32 million. Refer to our discussion of funds from operations


Investing activities


(292)


(703)


Increase in proceeds on sale of investments of $224 million, a decrease in cash paid on the acquisition of Wyoming wind of $109 million, a decrease in additions to PP&E and intangibles of $72 million, and a decrease in investing non-cash working capital balances of $31 million, partially offset by a decrease in realized gains on financial instruments of $16 million and a decrease in proceeds on disposal of PP&E of $8 million


Financing activities


(503)


(47)


An increase in repayments of borrowings under credit facilities and in repayments (net of issuances) of long-term debt of $504 million, a decrease in proceeds on sale of non-controlling interest in subsidiary of $78 million, an increase in distributions paid to subsidiaries’ non- controlling interests of $29 million, and an increase in common share cash dividends of $24 million, partially offset by an increase in proceeds on issuance of preferred shares of $161 million and an increase in realized gains on financial instruments of $20 million

Cash and cash equivalents, end of year


43


42


1              After giving effect to the reclassification described in the Current Accounting Changes section of this MD&A.


52


TransAlta Corporation   |   2014 Annual Report


Management’s Discussion and Analysis


Year ended Dec. 31


2013


2012


Explanation of change

Cash and cash equivalents, beginning of year


27


49


Provided by (used in):


Operating activities


765


520


Favourable changes in working capital of $307 million, net of a $27 million impact associated with the California claim in 2013 and a $204 million impact associated with the Sundance Units 1 and 2 arbitration in 2012, partially offset by lower cash earnings of $62 million


Investing activities


(703)


(1,048)


Decrease in acquisition of finance lease of $312 million, a decrease in additions to PP&E and intangibles of $149 million, an increase in realized gains on financial instruments of $26 million, and an increase in proceeds on sale of PP&E of $11 million, partially offset by the acquisition of the Wyoming wind farm for $109 million, an increase in equity investments of $17 million, a net negative impact of $12 million related to changes in collateral received from or paid to counterparties, and a decrease in investing non-cash working capital balances of $27 million


Financing activities


(47)


504


Decrease in proceeds on issuance of common shares of $293 million, a decrease in borrowings under credit facilities of $271 million partially due to the use of net proceeds received from the sale of the non-controlling interest in TransAlta Renewables to pay down borrowings on our credit facility, a decrease in proceeds on issuance of preferred shares of $217 million, an increase in common share cash dividends of $12 million, partially offset by an increase in proceeds on sale of non-controlling interest in subsidiary of $207 million, an increase in realized gains on financial instruments of $46 million, a decrease in long-term debt payments of $14 million, and an increase in proceeds on the issuance of long-term debt of $10 million


Translation of foreign currency cash


2


Cash and cash equivalents, end of year


42


27


Employee Future Benefits

We have registered pension plans in Canada and the U.S. covering substantially all employees of the Corporation, its domestic subsidiaries, and specific named employees working internationally. These plans have defined benefit and defined contribution options, and in Canada there is an additional supplemental defined benefit plan for members whose annual earnings exceed the Canadian income tax limit. Except for the Highvale pension plans acquired in 2013, the Canadian and U.S. defined benefit pension plans are closed to new entrants. The U.S. defined benefit pension plan was frozen effective Dec. 31, 2010, resulting in no future benefits being earned. The most recent actuarial valuation for accounting purposes of the registered and supplemental pension plans was conducted as at Dec. 31, 2014 for the Canadian pension plan, Jan. 1, 2014 for the U.S. pension plan, and Dec. 31, 2013 for the Highvale plan.


We provide other health and dental benefits for disabled members and retired members, typically up to the age of 65 (other post-employment benefits). The most recent actuarial valuation of these plans for accounting purposes was conducted as at Dec. 31, 2013 for the Canadian plan and Jan. 1, 2014 for the U.S. plan.


The supplemental pension plan is an obligation of the Corporation. We are not obligated to fund the supplemental plan but are obligated to pay benefits under the terms of the plan as they come due. We have posted a letter of credit in the amount of $64 million to secure the obligations under the supplemental plan.


TransAlta Corporation   |   2014 Annual Report

53


Management’s Discussion and Analysis


Unconsolidated Structured Entities or Arrangements


Disclosure is required of all unconsolidated structured entities or arrangements such as transactions, agreements, or contractual arrangements with unconsolidated entities, structured finance entities, special purpose entities, or variable interest entities that are reasonably likely to materially affect liquidity or the availability of, or requirements for, capital resources. We currently have no such unconsolidated structured entities or arrangements.


Climate Change and the Environment


Environmental issues and related legislation have, and will continue to have, an impact upon our business. We are committed to complying with legislative and regulatory requirements and to minimizing the environmental impact of our operations. We work with governments and the public to develop appropriate frameworks to protect the environment and to promote sustainable development.


Recent changes to environmental regulations may materially adversely affect us. As indicated under “Risk Factors” in our Annual Information Form and within the Risk Management section of this MD&A, many of our activities and properties are subject to environmental requirements, as well as changes in our liabilities under these requirements, which may have a material adverse effect upon our consolidated financial results.


Ongoing and Recently Passed Environmental Legislation

Changes in current environmental legislation do have, and will continue to have, an impact upon our operations and our business.


Canadian Coal

In Alberta there are requirements for coal-fired generation units to implement additional air emission controls for oxides of nitrogen (“NOx”) and sulphur dioxide (“SO2”) once they reach the end of their respective PPAs, in most cases at 2020. These regulatory requirements were developed by the province in 2004 as a result of multi-stakeholder discussions under Alberta’s Clean Air Strategic Alliance (“CASA”).


On Sept. 11, 2012, the Canadian federal government published the final regulations governing GHG emissions from coal-fired power plants, to become effective on July 1, 2015. The regulations provide for up to 50 years of life for coal units, at which point units must meet an emissions performance standard of approximately 420 tonnes per GWh. There are some exceptions that require older units commissioned before 1975 to reach end of life by Dec. 31, 2019, and units commissioned between 1975 and 1986 to reach end of life by Dec. 31, 2029. We believe the regulations provide additional operating time and increased flexibility for our Canadian Coal units, allowing those units to comply in a more cost-effective manner.


The release of the federal regulations creates a potential misalignment between the CASA air pollutant requirements and schedules, and the GHG retirement schedules for older coal plants, which in themselves will result in significant reductions of NOx, SO2, and particulates. We are in discussions with the provincial government in an effort to ensure coordination between GHG and air pollutant regulations, such that emission reduction objectives are achieved in the most effective manner while taking into consideration the reliability and cost of Alberta’s generation supply.


54


TransAlta Corporation   |   2014 Annual Report


Management’s Discussion and Analysis


Other Canadian Developments

Since 2007, we have incurred costs as a result of GHG legislation in Alberta. On Dec. 19, 2014, the Alberta Government announced it was extending its current climate change legislation (the Specified Gas Emitters Regulation) until June 2015, with the stated intention of re-instituting a new program at that time. Our exposure to increased costs as a result of environmental legislation in Alberta is mitigated to some extent through change-in-law provisions in our PPAs that allow us the opportunity to recover capital and operating compliance costs from our PPA customers. The value realized from our environmental attributes generated in the province may also be impacted by the program’s terms.


On Jan. 13, 2015, the Ontario Government announced its plan to put a price on carbon emissions in 2015, as part of its climate change program and stated objective of reducing GHG emissions by 15 per cent by 2020. No details are available yet. Our contracts at Gas facilities in the province generally include provisions protecting us from the adverse effects of changes in laws.


U.S. Coal

On June 2, 2014, the U.S. Environmental Protection Agency (“EPA”) released draft regulations for managing GHG emissions from the power sector. These draft regulations target GHG emissions from all existing fossil-fired generation in the U.S.: coal, natural gas, and other hydrocarbon fuels. The draft regulations are designed to achieve a 30 per cent reduction from 2005 emission levels by 2030, for that sector. The proposed framework would establish 2030 emission rate goals, measured in pounds of carbon dioxide per MWh, for each state’s electricity sector.


The draft regulations require interim goals to be achieved between 2020 and 2030 and a final goal to be achieved by 2030, and maintained beyond. The goals are state-specific depending on circumstances. States are to be given broad freedom to achieve the goals in a variety of ways, ranging from single- or multi-state cap and trade programs, heat rate improvements, and fuel switching initiatives, to more prescriptive approaches, such as, renewable energy and conservation programs. States will develop their individual approaches or State Implementation Plans, which will subsequently have to be reviewed and approved by the EPA. The draft regulations are expected to be finalized by the EPA by June 2015, with State Implementation Plans submitted by June 2016.


On Dec. 17, 2014, Washington State Governor Jay Inslee released a carbon-emissions reduction program for the State, where our U.S. Coal plant is located. Included in this program are a cap-and-trade plan and a low-carbon fuels standard. The proposed emissions cap will become more stringent over time, providing emitters time to transition their operations.


The recently proposed EPA GHG regulations for existing power plants are not expected to significantly affect our U.S. operations. TransAlta has agreed with Washington State to retire units in 2020 and 2025. This agreement is formally part of the State’s climate change program. We believe that there will be no additional GHG regulatory burden on U.S. Coal given these commitments. The related TransAlta Energy Bill was signed into law in 2011 and provides a framework to transition from coal to other forms of generation.


Other U.S. Developments

Effective January 2013, direct deliveries of power to the California Independent System Operator are subject to Cap and Trade Regulations established by the California Air Resources Board. We continue to monitor our GHG inventory into California.


Australia

In Australia, the Government repealed the nation’s carbon tax on July 17, 2014. This will eliminate the previous emission charges on our Australian gas-fired generation, although the impact is expected to be minimal as these emission charges were generally passed through to contracted customers. The Liberal Government has not yet implemented an alternative climate change program.


TransAlta Corporation   |   2014 Annual Report

55


Management’s Discussion and Analysis


TransAlta Activities

Reducing the environmental impact of our activities has a benefit not only to our operations and financial results, but also to the communities in which we operate. We expect that increased scrutiny will be placed on environmental emissions and compliance, and we therefore have a proactive approach to minimizing risks to our results. Our Board provides oversight to our environmental management programs and emission reduction initiatives to ensure continued compliance with environmental regulations.


In 2014, we estimate that 35.1 million tonnes of GHGs with an intensity of 0.91 tonnes per MWh (2013 – 27.5 million tonnes of GHGs with an intensity of 0.801 tonnes per MWh) were emitted as a result of normal operating activities.1 The increased volume and intensity of GHG emissions in 2014 compared to 2013 is primarily due to higher Canadian Coal production, driven by reduced outages and Sundance Units 1 and 2 returning to service in the second half of 2013.


Our environmental management programs encompass the following elements:


Renewable Power

We continue to invest in and build renewable power resources. Commercial operations began at our 68 MW New Richmond wind facility during the first quarter of 2013 and on Dec. 20, 2013 we completed the acquisition of a 144 MW wind farm in Wyoming. A larger renewable portfolio provides increased flexibility in generation and creates incremental environmental value through renewable energy certificates or through offsets.


Environmental Controls and Efficiency

We continue to make operational improvements and investments to our existing generating facilities to reduce the environmental impact of generating electricity. We installed mercury control equipment at our Canadian Coal operations in 2010 in order to meet Alberta’s 70 per cent reduction objectives, and voluntarily at our U.S. coal-fired plant in 2012. Our Keephills Unit 3 plant began operations in September 2011 using supercritical combustion technology to maximize thermal efficiency, as well as SO2 capture and low NOx combustion technology, which is consistent with the technology that is currently in use at Genesee Unit 3. Uprate projects completed at our Keephills and Sundance plants have improved the energy and emissions efficiency of those units.


Policy Participation

We are active in policy discussions at a variety of levels of government. These discussions have allowed us to engage in proactive discussions with governments and industry participants to meet environmental requirements over the longer term.


Clean Combustion Technologies

We look to advance clean energy technologies through organizations such as the Canadian Clean Power Coalition, which examines emerging clean combustion technologies such as gasification, oxygen combustion, biomass co-firing, and coal beneficiation.


Offsets Portfolio

TransAlta maintains an emissions offsets portfolio with a variety of instruments that can be used for compliance purposes or otherwise banked or sold. We continue to examine additional emissions offset opportunities that will allow us to meet emission targets at a competitive cost. Any investments in offsets will meet certification criteria in the market in which they are to be used.


1           2014 data are estimates based on best available data at the time of report production. GHGs include water vapour, carbon dioxide (“CO2”), methane, nitrous oxide, sulphur hexafluoride, hydrofluorocarbons, and perfluorocarbons. The majority of our estimated GHG emissions are comprised of CO2 emissions from stationary combustion.


56


TransAlta Corporation   |   2014 Annual Report


Management’s Discussion and Analysis


2015 Financial Outlook


We expect comparable EBITDA for 2015 to be in the range of $1,000 million and $1,040 million based on the current outlook for power prices in Alberta and the Pacific Northwest. Comparable FFO is anticipated to be in the range of $720 to $770 million. Comparable free cash flow, excluding the effects of flood-recovery capital, is expected to be in the range of $265 million and $270 million, or $0.95 and $0.96 per share, based on sustaining capital, excluding the effects of flood-recovery capital, of approximately $310 million to $340 million. We anticipate that lower cash interest will be offset by higher distributions to non-controlling interest and preferred share dividends. Our expected dividend is 75 per cent to 76 per cent of comparable free cash flow.


Market

Power Prices

For 2015, power prices in Alberta are expected to be lower than 2014 as a result of increased supply, lower natural gas prices, and a risk to demand growth. However, prices can vary based on supply and weather conditions. In the Pacific Northwest and Ontario, we expect prices to settle lower than in 2014 due to lower natural gas prices.


Economic Environment

We expect growth to decelerate in Western Canada in 2015. The slowdown in the oil and gas sector is expected to reduce economic growth as a result of investment slowdown and lower consumer spending. After several years of weak growth, economic growth in the Pacific Northwest is expected to accelerate as the overall economic recovery in the U.S. gains strength. Growth in Ontario is expected to improve to moderate rates in 2015, driven largely by exports supported by U.S. recovery and the strengthening U.S. dollar.


We had no material counterparty losses in 2014. We continue to monitor counterparty credit risk and have established risk management policies to mitigate counterparty risk. We do not anticipate any material change to our existing credit practices and continue to deal primarily with investment grade counterparties.


Operations

Capacity, Production, and Availability

Excluding the effects of economic dispatching, production is expected to increase in 2015 primarily due to lower planned and unplanned outages. Overall adjusted availability is expected to be in the range of 89 to 91 per cent in 2015, which is at the higher end of our long-term target availability.


We also expect to commission our gas pipeline to supply our Solomon facility in the first quarter of 2015.


Contracted Cash Flows

As a result of Alberta PPAs, long-term contracts, and other short-term physical and financial contracts, on average, approximately 70 per cent of our capacity is contracted over the next seven years. On an aggregated portfolio basis, depending on market conditions, we target being up to 90 per cent contracted for the upcoming calendar year. As at the end of 2014, approximately 88 per cent of our 2015 capacity was contracted. The average prices of our short-term physical and financial contracts for 2015 are approximately $55 per MWh in Alberta and approximately U.S.$40 per MWh in the Pacific Northwest.


Fuel Costs

Mining coal in Alberta is subject to cost increases due to greater overburden removal, inflation, capital investments, and commodity prices. Seasonal variations in coal costs at our Alberta mine are minimized through the application of standard costing. Coal costs for 2015, on a standard cost per tonne basis, are expected to be similar to 2014 unit costs.


In the Pacific Northwest, our Centralia coal mine, adjacent to our power plant, is in the reclamation stage. Fuel at U.S. Coal is purchased primarily from external suppliers in the Powder River Basin and delivered by rail. The delivered cost of fuel per MWh for 2015 is expected to increase by approximately one to two per cent as a result of inflation.


The value of coal inventories is assessed for impairment at the end of each reporting period. If the inventory is impaired, further charges are recognized in net earnings.


TransAlta Corporation   |   2014 Annual Report

57


Management’s Discussion and Analysis


We purchase natural gas from outside companies coincident with production or have it supplied by our customers, thereby minimizing our risk to changes in prices. The continued success of unconventional gas production in North America could reduce the year-to-year volatility of prices in the near term.


We closely monitor the risks associated with changes in electricity and input fuel prices on our future operations and, where we consider it appropriate, use various physical and financial instruments to hedge our assets and operations from such price risks.


Energy Marketing

Earnings from our Energy Marketing Segment are affected by prices and volatility in the market, overall strategies adopted, and changes in legislation. We continuously monitor both the market and our exposure to maximize earnings while still maintaining an acceptable risk profile. Our 2015 objective for Energy Marketing is to contribute between $50 million to $70 million in gross margin for the year.


Exposure to Fluctuations in Foreign Currencies

Our strategy is to minimize the impact of fluctuations in the Canadian dollar against the U.S. dollar, euro, and Australian dollar by offsetting foreign-denominated assets with foreign-denominated liabilities and by entering into foreign exchange contracts. We also have foreign-denominated expenses, including interest charges, which largely offset our foreign-denominated revenues.


Net Interest Expense

Net interest expense for 2015 is expected to be lower than in 2014 due to lower debt levels and higher capitalized interest. However, changes in interest rates and in the value of the Canadian dollar relative to the U.S. dollar can affect the amount of net interest expense incurred.


Liquidity and Capital Resources

We expect to maintain adequate available liquidity under our committed credit facilities.


Income Taxes

The effective tax rate on earnings, excluding non-comparable items for 2015, is expected to be approximately 17 to 22 per cent, which is lower than the statutory tax rate of 25 per cent, due to changes in the amount of earnings between the jurisdictions in which pre-tax income is earned and the effect of certain deductions that do not fluctuate with earnings.


Capital

Our major projects are focused on sustaining our current operations and supporting our growth strategy.


Growth and Major Project Capital

A summary of the significant growth and major projects that are in progress is outlined below:


Total Project


2015


Target


Estimated


Spent to


Estimated


completion


spend


date1


spend


date


Details


Project


South Hedland Power Station2


562


69


183


Q2 2017


150 MW combined cycle power plant


Australia natural gas pipeline3


100


77


23


Q1 2015


270 kilometre pipeline to supply natural gas to our Solomon power station in Western Australia


Transmission


13


2


11


Q2 2015


Regulated transmission that receives a return on investment


Hydro life extension


19


19


Q4 2014


Generator replacement and turbine runner improvements to extend the life of selected plants


Total


694


167


217


Based on an assessment of the nature of prospective hydro life extension projects, beginning in 2015, the costs incurred for the hydro life extension are classified as sustaining capital.


1           Represents amounts spent as of Dec. 31, 2014.

2           Estimated project spend is AUD$570 million. Total estimated project spend is stated in CAD$ and includes estimated capitalized interest costs. The total estimated project spend may change due to fluctuations in foreign exchange rates.

3           Includes certain natural gas conversion costs at the Solomon power station that will be recognized as a finance lease receivable. The total estimated project spend may change due to fluctuations in foreign exchange rates.


58


TransAlta Corporation   |   2014 Annual Report


Management’s Discussion and Analysis


Sustaining and Productivity Capital

A significant portion of our sustaining and productivity capital is planned major maintenance, which includes inspection, repair and maintenance of existing components, and the replacement of existing components. Planned major maintenance costs are capitalized as part of PP&E and are amortized on a straight-line basis over the term until the next major maintenance event. It excludes amounts for day-to-day routine maintenance, unplanned maintenance activities, and minor inspections and overhauls, which are expensed as incurred.


Our estimate for total sustaining and productivity capital is allocated among the following:


Spent


Expected spend


Category


Description


in 2014


in 2015


Routine capital1


Capital required to maintain our existing generating capacity


116


100-110


Planned major maintenance


Regularly scheduled major maintenance


162


180-190


Mining capital


Capital related to mining equipment and land purchases


45


20-25


Finance leases


Payments related to mining equipment under finance leases


10


10-15


Total sustaining capital excluding flood-recovery capital


333


310-340


Flood-recovery capital


Capital arising from the 2013 Alberta flood


9


25-30


Total sustaining capital


342


335-370


Productivity capital


Projects to improve power production efficiency and corporate improvement initiatives


14


5-10


Total sustaining and productivity capital


356


340-380


We continue to anticipate that most flood-recovery capital expenditures will be recovered from third parties.


Lost production as a result of planned major maintenance, excluding U.S. Coal planned major maintenance which is scheduled during a period of economic dispatching, is estimated as follows for 2015:


Gas and


Coal


Renewables


Total


GWh lost


1,094-1,104


220-230


1,314-1,334


Financing

Financing for these capital expenditures is expected to be provided by cash flow from operating activities, existing borrowing capacity, dividends reinvested, asset sales to TransAlta Renewables, and capital markets. The funds required for committed growth, sustaining capital, and productivity projects are not expected to be significantly impacted by the current economic environment due to the highly contracted nature of our cash flows, our financial position, and the amount of capital available to us under existing committed credit facilities.


1           Does not include hydro life extension costs of $19 million in 2014. In 2015, includes estimated hydro life extension costs of $17 million.


TransAlta Corporation   |   2014 Annual Report

59


Management’s Discussion and Analysis


Risk Management


Our business activities expose us to a variety of risks including, but not limited to, increased regulatory changes, rapidly changing market dynamics, and increased volatility in our key commodity markets. Our goal is to manage these risks so that we are reasonably protected from an unacceptable level of risk or financial exposure while still enabling business development. We use a multilevel risk management oversight structure to manage the risks arising from our business activities, the markets in which we operate, and the political environments and structures with which we interface.


The responsibilities of various stakeholders of our risk management oversight structure are described below:


The Board of Directors provides stewardship of the Corporation; ensures that the Corporation establishes policies and procedures for the identification, assessment, and management of principal risks and risk appetite; and receives an annual comprehensive Enterprise Risk Management (“ERM”) review. The ERM review consists of a holistic view of the Corporation’s inherent risks, how we mitigate these risks, and residual risks. It defines our risks, discusses who is responsible to manage each risk, examines how the risks are interrelated with each other, and identifies the applicable risk metrics.


The Audit and Risk Committee (“ARC”), established by the Board of Directors, provides assistance to the Board of Directors in fulfilling its oversight responsibility relating to the integrity of our financial statements and the financial reporting process; the systems of internal accounting and financial controls; the internal audit function; the external auditors’ qualifications and terms and conditions of appointment, including remuneration; independence; performance and reports; and the legal and risk compliance programs as established by management and the Board of Directors. The ARC approves our Commodity and Financial Exposure Management policies and reviews quarterly ERM reporting.


The Chief Executive Officer and the Executive Vice-Presidents review key risks at least quarterly. Weekly or monthly specific Trading Risk Management meetings are held by the Vice-President Risk, Vice-President Trading, Executive Vice-President Energy Marketing, and Chief Financial Officer.


The Technical Risk and Commercial Team (“TRACT”) is a committee chaired by the Vice-President, Engineering, Environment, and Construction Services, and is comprised of our financial and operations directors. It reviews major projects and commercial agreements at various stages through development, prior to submission for approval by the Investment Committee and the Board of Directors.


The Investment Committee is chaired by our Chief Financial Officer and is comprised of the Chief Executive Officer, Chief Financial Officer, Chief Legal and Compliance Officer, Chief Investment Officer, and Executive Vice-President Corporate Services. It reviews and approves all major capital expenditures including growth, productivity, life extensions, and major coal outages. Projects that are approved by the committee will then be put forward for approval by the Board of Directors.


60


TransAlta Corporation   |   2014 Annual Report


Management’s Discussion and Analysis


Risk Controls

Our risk controls have several key components:


Enterprise Tone


We strive to foster beliefs and actions that are true to and respectful of our many stakeholders. We do this by investing in communities where we live and work, operating and growing sustainably, putting safety first, and being responsible to the many groups and individuals with whom we work.


Policies


We maintain a comprehensive set of enterprise-wide policies. These policies establish delegated authorities and limits for business transactions, as well as allow for an exception approval process. Periodic reviews and audits are performed to ensure compliance with these policies. All employees and directors are required to sign a corporate code of conduct on an annual basis.


Reporting


On a regular basis, residual risk exposures are reported to key decision makers including the Board of Directors, senior management, and the Risk Management Committee (“RMC”). Reporting to the RMC includes analysis of new risks, monitoring of status to risk limits, review of events that can affect these risks, and discussion and status of actions to minimize risks. This quarterly reporting provides for effective and timely risk management and oversight.


Whistleblower System


We have a system in place where employees, shareholders, or other stakeholders may anonymously report any potential ethical concerns. These concerns can be submitted anonymously, either directly to the ARC or to the Director, Internal Audit, who engages Corporate Security, Legal, and Human Resources in determining the appropriate course of action. These concerns and any actions taken are discussed with the chair of the ARC.


Value at Risk and Trading Positions


Value at risk (“VaR”) is one of the primary measures used to manage our exposure to market risk resulting from commodity risk management activities. VaR is calculated and reported on a daily basis. This metric describes the potential change in the value of our trading portfolio over a three-day period within a 95 per cent confidence level, resulting from normal market fluctuations.


VaR is a commonly used metric that is employed by industry to track the risk in commodity risk management positions and portfolios. Two common methodologies for estimating VaR are the historical variance/covariance and Monte Carlo approaches. We estimate VaR using the historical variance/covariance approach. An inherent limitation of historical variance/covariance VaR is that historical information used in the estimate may not be indicative of future market risk. Stress tests are performed periodically to measure the financial impact to the trading portfolio resulting from potential market events, including fluctuations in market prices, volatilities of those prices, and the relationships between those prices. We also employ additional risk mitigation measures. VaR at Dec. 31, 2014 associated with our proprietary commodity risk management activities was $5 million (2013 – $2 million). The increase is attributable to higher volatility levels around Dec. 31, 2014 than Dec. 31, 2013. Refer to the Commodity Price Risk section of this MD&A for further discussion.


TransAlta Corporation    2014 Annual Report

61


Management’s Discussion and Analysis


Risk Factors


Risk is an inherent factor of doing business. The following section addresses some, but not all, risk factors that could affect our future results and our activities in mitigating those risks. These risks do not occur in isolation, but must be considered in conjunction with each other.


For some risk factors we show the after-tax effect on net earnings of changes in certain key variables. The analysis is based on business conditions and production volumes in 2014. Each item in the sensitivity analysis assumes all other potential variables are held constant. While these sensitivities are applicable to the period and the magnitude of changes on which they are based, they may not be applicable in other periods, under other economic circumstances, or for a greater magnitude of changes. The changes in rates should also not be assumed to be proportionate to earnings in all instances.


Volume Risk


Volume risk relates to the variances from our expected production. For example, the financial performance of our Hydro and Wind operations are partially dependent upon the availability of their input resources in a given year. Where we are unable to produce sufficient quantities of output in relation to contractually specified volumes, we may be required to pay penalties or purchase replacement power in the market.


We manage volume risk by:

§  actively managing our assets and their condition through the Generation Segment and Capital and Asset Reporting group in order to be proactive in plant maintenance so that our plants are available to produce when required,

§  monitoring water resources throughout Alberta to the best of our ability and optimizing this resource against real-time electricity market opportunities,

§  placing our wind facilities in locations that we believe to have adequate resources to generate electricity to meet the requirements of our contracts. However, we cannot guarantee that these resources will be available when we need them or in the quantities that we require, and

§  diversifying our fuels and geography as one way of mitigating regional or fuel-specific events.


The sensitivities of volumes to our net earnings are shown below:


Approximate impact


Factor


Increase or decrease (%)


on net earnings


Availability/production


1


22


Generation Equipment and Technology Risk


There is a risk of equipment failure due to wear and tear, latent defect, design error or operator error, among other things, which could have a material adverse effect on the Corporation. Although our generation facilities have generally operated in accordance with expectations, there can be no assurance that they will continue to do so. Our plants are exposed to operational risks such as failures due to cyclic, thermal, and corrosion damage in boilers, generators, and turbines, and other issues that can lead to outages and increased volume risk. If plants do not meet availability or production targets specified in their PPA or other long-term contracts, we may be required to compensate the purchaser for the loss in the availability of production or record reduced energy or capacity payments. For merchant facilities, an outage can result in lost merchant opportunities. Therefore, an extended outage could have a material adverse effect on our business, financial condition, results of operations, or our cash flows.


As well, we are exposed to procurement risk for specialized parts that may have long lead times. If we are unable to procure these parts when they are needed for maintenance activities, we could face an extended period where our equipment is unavailable to produce electricity.


During 2013, the original equipment manufacturer for the generators at Sundance Units 3 to 6 revised the operating criteria for the units such that they would no longer be able to produce the same amount of leading reactive power (“MVAR”) at current active power output levels. Reactive power refers to the voltage support that is required to make electrical systems like the Alberta Interconnected Electric System function and deliver power through transmission lines. More recently, equipment studies have been completed which have led to the original equipment manufacturer revising the capability curves, such that the constraint for operations at high leading power factors has been relaxed. We are in the process of adjusting our plant settings to reflect the revised curves. We are also assessing compliance of uprated units with the AESO’s proposed new MVAR standards.


62


TransAlta Corporation    2014 Annual Report


Management’s Discussion and Analysis


We manage our generation equipment and technology risk by:

§  operating our generating facilities within defined and proven operating standards that are designed to maximize the availability of our generating facilities for the longest period of time,

§  performing preventative maintenance on a regular basis,

§  adhering to a comprehensive plant maintenance program and regular turnaround schedules,

§  adjusting maintenance plans by facility to reflect the equipment type and age,

§  having sufficient business interruption coverage in place in the event of an extended outage,

§  having force majeure clauses in our thermal and other PPAs and other long-term contracts,

§  using technology in our generating facilities that is selected and maintained with the goal of maximizing the return on those assets,

§  monitoring technological advances and evaluating their impact upon our existing generating fleet and related maintenance programs,

§  negotiating strategic supply agreements with selected vendors to ensure key components are available in the event of a significant outage,

§  entering into long-term arrangements with our strategic supply partners to ensure availability of critical spare parts, and

§  developing a long-term asset management strategy with the objective of maximizing the life cycles of our existing facilities and/or replacement of selected generating assets.


Commodity Price Risk


We have exposure to movements in certain commodity prices, including the market price of electricity and fuels used to produce electricity in both our electricity generation and proprietary trading businesses.


We manage the financial exposure associated with fluctuations in electricity price risk by:


§  entering into long-term contracts that specify the price at which electricity, steam, and other services are provided,

§  maintaining a portfolio of short-, medium-, and long-term contracts to mitigate our exposure to short-term fluctuations in commodity prices,

§  purchasing natural gas coincident with production for merchant plants so spot market spark spreads are adequate to produce and sell electricity at a profit, and

§  ensuring limits and controls are in place for our proprietary trading activities.


In 2014, we had approximately 90 per cent (2013 – 90 per cent) of production under short-term and long-term contracts and hedges. In the event of a planned or unplanned plant outage or other similar event, however, we are exposed to changes in electricity prices on purchases of electricity from the market to fulfill our supply obligations under these short- and long-term contracts.


We manage the financial exposure to fluctuations in the costs of fuels used in production by:


§  entering into long-term contracts that specify the price at which fuel is to be supplied to our plants,

§  hedging emissions costs by entering into various emission trading arrangements, and

§  selectively using hedges, where available, to set prices for fuel.


In 2014, 68 per cent (2013 – 64 per cent) of our cost of gas used in generating electricity was contractually fixed or passed through to our customers and 100 per cent (2013 – 100 per cent) of our purchased coal costs were contractually fixed.


The sensitivities of price changes to our net earnings, assuming production consistent with 2014 and applying the contractual profile in place at Dec. 31, 2014 for 2015, are shown below:


Approximate impact on net


Factor


Increase or decrease


earnings and cash flow


Electricity price – Canada


$1.00/MWh


3


Electricity price – U.S.


U.S.$1.00/MWh


2


Natural gas price


$0.10/GJ


1


Actual variations in net earnings can vary from calculated sensitivities and may not be linear due to optimization opportunities, co-dependencies and cost mitigations, production, availability, and other factors.


TransAlta Corporation    2014 Annual Report

63


Management’s Discussion and Analysis


Fuel Supply Risk


We buy natural gas and some of our coal to supply the fuel needed to operate our facilities. Having sufficient fuel available when required for generation is essential to maintaining our ability to produce electricity under contracts and for merchant sale opportunities.


At our coal-fired plants, input costs, such as diesel, tires, the price and availability of mining equipment, the volume of overburden removed to access coal reserves, rail rates, and the location of mining operations relative to the power plants are some of the exposures in our mining operations. Additionally, the ability of the mines to deliver coal to the power plants can be impacted by weather conditions and labour relations. At U.S. Coal, interruptions at our suppliers’ mines and the availability of trains to deliver coal could affect our ability to generate electricity.


We manage coal supply risk by:


§  ensuring that the majority of the coal used in electrical generation is from reserves permitted through coal rights we have purchased or for which have long-term supply contracts, thereby limiting our exposure to fluctuations in the supply of coal from third parties. All of the coal used in generating activities in Alberta is from reserves permitted through coal rights we have purchased. The coal used in generating activities in U.S. Coal is secured through long-term supply contracts,

§  using longer-term mining plans to ensure the optimal supply of coal from our mines,

§  sourcing the majority of the coal used at U.S. Coal under a mix of short-, medium-, and long-term contracts and from multiple mine sources to ensure sufficient coal is available at a competitive cost,

§  contracting sufficient trains to deliver the coal requirements at U.S. Coal,

§  ensuring coal inventories on hand at Canadian Coal and U.S. Coal are at appropriate levels for usage requirements,

§  ensuring efficient coal handling and storage facilities are in place so that the coal being delivered can be processed in a timely and efficient manner,

§  monitoring and maintaining coal specifications, carefully matching the specifications mined with the requirements of our plants, and

§  hedging diesel exposure in mining and transportation costs.


We believe adequate supplies of natural gas at reasonable prices will be available for plants when existing supply contracts expire.


Environmental Risk


Environmental risks are risks to our business associated with existing and/or changes in environmental regulations. New emission reduction objectives for the power sector are being established by governments in Canada and the U.S. We anticipate continued and growing scrutiny by investors relating to sustainability performance. These changes to regulations may affect our earnings by imposing additional costs on the generation of electricity, such as emission caps, requiring additional capital investments in emission capture technology, or requiring us to invest in offset credits. It is anticipated that these compliance costs will increase due to increased political and public attention to environmental concerns.


We manage environmental risk by:


§  seeking continuous improvement in numerous performance metrics such as emissions, safety, land and water impacts, and environmental incidents,

§  having an International Organization for Standardization and Occupational Health and Safety Assessment Series-based environmental health and safety management system in place that is designed to continuously improve performance,

§  committing significant experienced resources to work with regulators in Canada and the U.S. to advocate that regulatory changes are well designed and cost effective,

§  developing compliance plans that address how to meet or exceed emission standards for GHGs, mercury, SO2, and NOx, which will be adjusted as regulations are finalized,

§  purchasing emission reduction offsets,

§  investing in renewable energy projects, such as wind and hydro generation,

§  investing in clean coal technology development, which potentially provides long-term promise for large emission reductions from fossil-fuel-fired generation, and

§  incorporating change in law provisions in contracts that allow recovery of certain compliance costs from our customers.


We strive to be in compliance with all environmental regulations relating to operations and facilities. Compliance with both regulatory requirements and management system standards is regularly audited through our performance assurance policy and results are reported quarterly to the Governance and Environment Committee.


We are a founder of the Canadian Clean Power Coalition dedicated to developing clean combustion technologies, which in turn will mitigate the environmental and financial risks associated with continued fossil fuel use for power generation.


64


TransAlta Corporation   |   2014 Annual Report


Management’s Discussion and Analysis


Credit Risk


Credit risk is the risk to our business associated with changes in the creditworthiness of entities with which we have commercial exposures. This risk results from the ability of a counterparty to either fulfill its financial or performance obligations to us or where we have made a payment in advance of the delivery of a product or service. The inability to collect cash due to us or to receive products or services may have an adverse impact upon our net earnings and cash flows.


We manage our exposure to credit risk by:


§  establishing and adhering to policies that define credit limits based on the creditworthiness of counterparties, contract term limits, and the credit concentration with any specific counterparty,

§  requiring formal sign-off on contracts that include commercial, financial, legal, and operational reviews,

§  requiring security instruments, such as parental guarantees, letters of credit, and cash collateral that can be collected if a counterparty fails to fulfill its obligation or goes over its limits, and

§  reporting our exposure using a variety of methods that allow key decision makers to assess credit exposure by counterparty. This reporting allows us to assess credit limits for counterparties and the mix of counterparties based on their credit ratings.


If established credit exposure limits are exceeded, we take steps to reduce this exposure, such as requesting collateral, if applicable, or by halting commercial activities with the affected counterparty. However, there can be no assurances that we will be successful in avoiding losses as a result of a contract counterparty not meeting its obligations.


Our credit risk management profile and practices have not changed materially from Dec. 31, 2013. We had no material counterparty losses in 2014, and we are exposed to minimal credit risk for Alberta PPAs because under the terms of these arrangements, receivables are substantially all secured by letters of credit. We continue to keep a close watch on changes and trends in the market and the impact these changes could have on our commodity risk management and hedging activities, and will take appropriate actions as required, although no assurance can be given that we will always be successful.


A summary of our credit exposure for our commodity risk management and hedging activities at Dec. 31, 2014 is provided below:


Counterparty credit rating


Net exposure amount


Investment grade


718


Non-investment grade


2


No external rating, internally rated as investment grade


23


No external rating, internally rated as non-investment grade


4


The maximum credit exposure to any one customer for commodity trading operations, including the fair value of open trading positions, is $29 million (2013 – $23 million).


TransAlta Corporation    2014 Annual Report

65


Management’s Discussion and Analysis


Currency Rate Risk


We have exposure to various currencies as a result of our investments and operations in foreign jurisdictions, the earnings from those operations, the acquisition of equipment and services and foreign-denominated commodities from foreign suppliers, and our U.S.-denominated debt. Our exposures are primarily to the U.S. and Australian currencies. Changes in the values of these currencies in relation to the Canadian dollar may affect our earnings or the value of our foreign investments to the extent that these positions or cash flows are not hedged or the hedges are ineffective.


We manage our currency rate risk by establishing and adhering to policies that include:


§  hedging our net investments in foreign operations using a combination of foreign-denominated debt and financial instruments. Our strategy is to offset 90 to 100 per cent of all such foreign currency exposures. At Dec. 31, 2014, we have hedged approximately 95 per cent (2013 – 99 per cent) of our foreign currency net investment exposure, which we define to exclude net U.S. risk management assets,

§  offsetting earnings from our foreign operations as much as possible by using expenditures denominated in the same foreign currencies and financial instruments to hedge the balance of this exposure, and

§  entering into forward foreign exchange contracts to hedge future foreign-denominated receipts and expenditures, and all U.S.-denominated debt outside of our net investment portfolio.


The sensitivity of our net earnings to changes in foreign exchange rates has been prepared using management’s assessment that an average four cent increase or decrease in the U.S. or Australian currencies relative to the Canadian dollar is a reasonable potential change over the next quarter, and is shown below:


Factor


Increase or decrease


Approximate impact
on net earnings


Exchange rate


$0.04


2


Creditworthiness and Liquidity Risk


Liquidity risk relates to our ability to access capital to be used for commodity risk management activities, commodity hedging, capital projects, debt refinancing, and general corporate purposes. Investment grade credit ratings support these activities and provide a more reliable and cost-effective means to access capital markets through commodity and credit cycles. We are focused on strengthening our financial position and maintaining stable investment grade credit ratings as our ability to efficiently access capital markets funding on a cost-effective basis is partially dependent upon the maintenance of satisfactory credit ratings. There can be no assurance that TransAlta’s credit ratings and the corresponding outlook will not be changed, potentially resulting in adverse consequences for funding capacity, liquidity and access to capital markets. Changes in credit ratings may also affect the ability and/or the cost of establishing normal course derivative or hedging transactions undertaken by our Energy Marketing Segment. Credit ratings do not consider market price or address the suitability of any financial instrument for a particular investor and are not recommendations to purchase, sell or hold securities. Credit ratings are subject to revision or withdrawal at any time by the rating organization. Credit ratings issued for TransAlta, as well as the corresponding rating agency outlook, are set out in the Strategy and Capability to Deliver Results – Financial Strategy section of this MD&A.


Counterparties enter into certain electricity and natural gas purchase and sale contracts for the purposes of asset-backed sales and proprietary trading. The terms and conditions of these contracts require the counterparties to provide collateral when the fair value of the obligation pursuant to these contracts is in excess of any credit limits granted. Downgrades in creditworthiness by certain credit rating agencies may decrease the credit limits granted and accordingly increase the amount of collateral that may have to be provided.


We manage liquidity risk by:

§  monitoring liquidity on trading positions,

§  preparing and revising longer-term financing plans to reflect changes in business plans and the market availability of capital,

§  reporting liquidity risk exposure for commodity risk management activities on a regular basis to the RMC, senior management, and the ARC,

§  maintaining investment grade credit ratings, and

§  maintaining sufficient undrawn committed credit lines to support potential liquidity requirements.


66


TransAlta Corporation    2014 Annual Report


Management’s Discussion and Analysis


Interest Rate Risk


Changes in interest rates can impact our borrowing costs while the opposite impact will be seen on the capacity revenues we receive from our Alberta PPA plants. Changes in our cost of capital may also affect the feasibility of new growth initiatives.


We manage interest rate risk by establishing and adhering to policies that include:


§  employing a combination of fixed and floating rate debt instruments, and

§  monitoring the mixture of floating and fixed rate debt and adjusting where necessary to ensure a continued efficient mixture of these types of debt.


At Dec. 31, 2014, approximately four per cent (2013 – 21 per cent) of our total debt portfolio was subject to changes in floating interest rates through a combination of floating rate debt and interest rate swaps.


The sensitivity of changes in interest rates upon our net earnings is shown below:


Approximate impact


Factor


Increase or decrease (%)


on net earnings1


Interest rate


0.25


Project Management Risk


On capital projects, we face risks associated with cost overruns, delays, and performance.


We manage project risks by:


§  ensuring all projects are vetted by the TRACT Committee so that projects have been highly scrutinized to see that established processes and policies are followed, risks have been properly identified and quantified, input assumptions are reasonable, and returns are realistically forecasted prior to senior management and Board of Directors approvals,

§  using consistent and disciplined project management methodology and processes,

§  performing detailed analysis of project economics prior to construction or acquisition and by determining our asset contracting strategy to ensure the right mix of contracted and merchant capacity prior to commencement of construction,

§  partnering with those who have previously been able to deliver projects economically and on budget,

§  developing and following through with comprehensive plans that include critical paths identified, key delivery points, and backup plans,

§  managing project closeouts so that any learnings from the project are incorporated into the next significant project,

§  fixing the price and availability of the equipment, foreign currency rates, warranties, and source agreements as much as is economically feasible prior to proceeding with the project, and

§  entering into labour agreements to provide security around cost and productivity.


1           A 0.25 per cent change in interest rates applied to our variable rate debt would not result in a material impact on net earnings. Based on our variable rate debt at Dec. 31, 2014, a 0.75 per cent change in interest rates would be required to have a $1 million impact on net earnings.


TransAlta Corporation    2014 Annual Report

67


Management’s Discussion and Analysis


Human Resource Risk


Human resource risk relates to the potential impact upon our business as a result of changes in the workplace. Human resource risk can occur in several ways:


§  potential disruption as a result of labour action at our generating facilities,

§  reduced productivity due to turnover in positions,

§  inability to complete critical work due to vacant positions,

§  failure to maintain fair compensation with respect to market rate changes, and

§  reduced competencies due to insufficient training, failure to transfer knowledge from existing employees, or insufficient expertise within current employees.


We manage this risk by:

§  monitoring industry compensation and aligning salaries with those benchmarks,

§  using incentive pay to align employee goals with corporate goals,

§  monitoring and managing target levels of employee turnover, and

§  ensuring new employees have the appropriate training and qualifications to perform their jobs.


In 2014, 54 per cent (2013 – 54 per cent) of our labour force was covered by 12 (2013 – 12) collective bargaining agreements. In 2014, four (2013 – five) agreements were renegotiated. We anticipate the successful negotiation of three collective agreements in 2015.


Regulatory and Political Risk


Regulatory and political risk describes the risk to our business associated with potential changes to the existing regulatory structures and the political influence upon those structures. This risk can come from market re-regulation, increased oversight and control, structural or design changes in markets, or other unforeseen influences. Market rules are often dynamic and we are not able to predict whether there will be any material changes in the regulatory environment or the ultimate effect of changes in the regulatory environment on our business.


We manage these risks systematically through our Legal and Regulatory Compliance programs, which are reviewed periodically to ensure its effectiveness, as well as through our Government Relations team. We work with governments, regulators, electric system operators, and other stakeholders to resolve issues as they arise. We are actively monitoring changes to market rules and market design, and we engage in market-sponsored stakeholder engagement processes. Through these and other avenues, we engage in advocacy and policy discussions at a variety of levels. These stakeholder negotiations have allowed us to engage in proactive discussions with governments over the longer term.


International investments are subject to unique risks and uncertainties relating to the political, social, and economic structures of the respective country and such country’s regulatory regime. We mitigate this risk through the use of non-recourse financing and insurance.


Transmission Risk


Access to transmission lines and transmission capacity for existing and new generation are key in our ability to deliver energy produced at our power plants to our customers. The risks associated with the aging existing transmission infrastructure in Alberta, Ontario, and the Pacific Northwest continue to increase because new connections to the power system are consuming transmission capacity quicker than it is being added by new transmission developments.


68


TransAlta Corporation    2014 Annual Report


Management’s Discussion and Analysis


Reputation Risk


Our reputation is one of our most valued assets. Reputation risk relates to the risk associated with our business because of changes in opinion from the general public, private stakeholders, governments, and other entities.


We manage reputation risk by:


§  striving as a neighbour and business partner in the regions where we operate to build viable relationships based on mutual understanding leading to workable solutions with our neighbours and other community stakeholders,

§  clearly communicating our business objectives and priorities to a variety of stakeholders on a routine basis,

§  maintaining positive relationships with various levels of government,

§  pursuing sustainable development as a longer-term corporate strategy,

§  ensuring that each business decision is made with integrity and in line with our corporate values,

§  communicating the impact and rationale of business decisions to stakeholders in a timely manner, and

§  maintaining strong corporate values that support reputation risk management initiatives.


Corporate Structure Risk


We conduct a significant amount of business through subsidiaries and partnerships. Our ability to meet and service debt obligations is dependent upon the results of operations of our subsidiaries and the payment of funds by our subsidiaries in the form of distributions, loans, dividends, or otherwise. In addition, our subsidiaries may be subject to statutory or contractual restrictions that limit their ability to distribute cash to us.


General Economic Conditions


Changes in general economic conditions impact product demand, revenue, operating costs, the timing and extent of capital expenditures, the net recoverable value of PP&E, financing costs, credit and liquidity risk, and counterparty risk.


Income Taxes


Our operations are complex and located in several countries. The computation of the provision for income taxes involves tax interpretations, regulations, and legislation that are continually changing. Our tax filings are subject to audit by taxation authorities. Management believes that it has adequately provided for income taxes as required by IFRS, based on all information currently available.


The sensitivity of changes in income tax rates upon our net earnings is shown below:


Approximate impact


Factor


Increase or decrease (%)


on net earnings


Tax rate


1


2


The effective tax rate on comparable earnings before income taxes, equity income, and other items for 2014 was 21 per cent. The effective income tax rate can change depending on the mix of earnings from various countries and certain deductions that do not fluctuate with earnings.


Legal Contingencies


We are occasionally named as a party in various claims and legal proceedings that arise during the normal course of our business. We review each of these claims, including the nature of the claim, the amount in dispute or claimed, and the availability of insurance coverage. There can be no assurance that any particular claim will be resolved in our favour or that such claims may not have a material adverse effect on us.


Other Contingencies


We maintain a level of insurance coverage deemed appropriate by management. There were no significant changes to our insurance coverage during renewal of the insurance policies on December 31. Our insurance coverage may not be available in the future on commercially reasonable terms. There can be no assurance that our insurance coverage will be fully adequate to compensate for potential losses incurred. In the event of a significant economic event, the insurers may not be capable of fully paying all claims.


TransAlta Corporation   |   2014 Annual Report

69


Management’s Discussion and Analysis


Critical Accounting Policies and Estimates


The selection and application of accounting policies is an important process that has developed as our business activities have evolved and as accounting rules and guidance have changed. Accounting rules generally do not involve a selection among alternatives, but involve an implementation and interpretation of existing rules and the use of judgment relative to the circumstances existing in the business. Every effort is made to comply with all applicable rules on or before the effective date, and we believe the proper implementation and consistent application of accounting rules is critical.


However, not all situations are specifically addressed in the accounting literature. In these cases, our best judgment is used to adopt a policy for accounting for these situations. We draw analogies to similar situations and the accounting guidelines governing them, consider foreign accounting standards, and consult with our independent auditors about the appropriate interpretation and application of these policies. Each of the critical accounting policies involves complex situations and a high degree of judgment either in the application and interpretation of existing literature or in the development of estimates that impact our consolidated financial statements.


Our significant accounting policies are described in Note 2 to our audited consolidated financial statements within this Annual Report. The most critical of these policies are those related to revenue recognition, financial instruments, valuation of PP&E and associated contracts, project development costs, useful life of PP&E, valuation of goodwill, leases, income taxes, employee future benefits, decommissioning and restoration provisions, and other provisions. Each policy involves a number of estimates and assumptions to be made about matters that are uncertain at the time the estimate is made. Different estimates, with respect to key variables used for the calculations, or changes to estimates, could potentially have a material impact on our financial position or results of operations.


We have discussed the development and selection of these critical accounting estimates with our ARC and our independent auditors. The ARC has reviewed and approved our disclosure relating to critical accounting estimates in this MD&A.


These critical accounting estimates are described as follows:


Revenue Recognition


The majority of our revenues are derived from the sale of physical power, leasing of power facilities, and from commodity risk management activities.


Revenues under long-term electricity and thermal sales contracts generally include one or more of the following components: fixed capacity payments for availability, energy payments for generation of electricity, incentives or penalties for exceeding or not meeting availability targets, excess energy payments for power generation above committed capacity, and ancillary services. Each of these components is recognized upon output, delivery, or satisfaction of contractually specific targets. Revenues from non-contracted capacity are comprised of energy payments, at market prices, for each MWh produced and are recognized upon delivery.


In certain situations, a long-term electricity or thermal sales contract may contain, or be considered, a lease. Where the terms and conditions of the contract result in the customer assuming the principal risks and rewards of ownership of the underlying asset, the contractual arrangement is considered a finance lease, which results in the recognition of finance lease income. Where we retain the principal risks and rewards, the contractual arrangement is an operating lease. Rental income, including contingent rents where applicable, is recognized over the term of the contract. Revenues associated with non-lease elements are recognized as goods or services revenues as outlined above.


Commodity risk management activities involve the use of derivatives such as physical and financial swaps, forward sales contracts, and futures contracts and options, to earn trading revenues and to gain market information. These derivatives are accounted for using fair value accounting when hedge accounting is not applied. The initial recognition of fair value and subsequent changes in fair value affect reported earnings in the period the change occurs. The fair values of instruments that remain open at the end of a reporting period represent unrealized gains or losses and are presented on the Consolidated Statements of Financial Position as risk management assets or liabilities.


The determination of the fair value of commodity risk management contracts and derivative instruments is complex and relies on judgments concerning future prices, volatility, and liquidity, among other factors. Some of our derivatives are not traded on an active exchange or extend beyond the time period for which exchange-based quotes are available, requiring us to use internal valuation techniques or models.


70


TransAlta Corporation    2014 Annual Report


Management’s Discussion and Analysis


Financial Instruments


The fair value of a financial instrument is the price that would be received to sell an asset or paid to transfer a liability in an orderly transaction between market participants at the measurement date. Fair values can be determined by reference to prices for instruments in active markets to which we have access. In the absence of an active market, we determine fair values based on valuation models or by reference to other similar products in active markets.


Fair values determined using valuation models require the use of assumptions. In determining those assumptions, we look primarily to external readily observable market inputs. However, if not available, we use inputs that are not based on observable market data.


Level Determinations and Classifications


The Level I, II, and III classifications in the fair value hierarchy utilized by the Corporation are defined below. The fair value measurement of a financial instrument is included in only one of the three levels, the determination of which is based on the lowest level input that is significant to the derivation of the fair value.


Level I


Fair values are determined using inputs that are quoted prices (unadjusted) in active markets for identical assets or liabilities that we have the ability to access. In determining Level I fair values, we use quoted prices for identically traded commodities obtained from active exchanges such as the New York Mercantile Exchange.


Level II


Fair values are determined, directly or indirectly, using inputs that are observable for the asset or liability.


Fair values falling within the Level II category are determined through the use of quoted prices in active markets, which in some cases are adjusted for factors specific to the asset or liability, such as basis, credit valuation, and location differentials. Our commodity risk management Level II financial instruments include over-the-counter derivatives with values based on observable commodity futures curves and derivatives with inputs validated by broker quotes or other publicly available market data providers. Level II fair values are also determined using valuation techniques, such as option pricing models and regression or extrapolation formulas, where the inputs are readily observable, including commodity prices for similar assets or liabilities in active markets, and implied volatilities for options.


In determining Level II fair values of other risk management assets and liabilities, we use observable inputs other than unadjusted quoted prices that are observable for the asset or liability, such as interest rate yield curves and currency rates. For certain financial instruments where insufficient trading volume or lack of recent trades exists, we rely on similar interest or currency rate inputs and other third-party information such as credit spreads.


Level III


Fair values are determined using inputs for the asset or liability that are not readily observable.


We may enter into commodity transactions for which market-observable data is not available. In these cases, Level III fair values are determined using valuation techniques such as the Black-Scholes, mark-to-forecast, and historical bootstrap models with inputs that are based on historical data such as unit availability, transmission congestion, demand profiles for individual non-standard deals and structured products, and/or volatilities and correlations between products derived from historical prices. We also have various contracts with terms that extend beyond a liquid trading period. As forward market prices are not available for the full period of these contracts, the value of these contracts is derived by reference to a forecast that is based on a combination of external and internal fundamental modelling, including discounting. As a result, these contracts are classified in Level III.


We have a Commodity Exposure Management Policy (the “Policy”), which governs both the commodity transactions undertaken in our proprietary trading business and those undertaken to manage commodity price exposures in our generation business. The Policy defines and specifies the controls and management responsibilities associated with commodity trading activities, as well as the nature and frequency of required reporting of such activities.


Methodologies and procedures regarding commodity risk management Level III fair value measurements are determined by our risk management department. Level III fair values are calculated within our energy trading risk management system based on underlying contractual data as well as observable and non-observable inputs. Development of non-observable inputs requires the use of judgment. To ensure reasonability, system-generated Level III fair value measurements are reviewed and validated by the risk management and finance departments. Review occurs formally on a quarterly basis or more frequently if daily review and monitoring procedures identify unexpected changes to fair value or changes to key parameters.


TransAlta Corporation    2014 Annual Report

71


Management’s Discussion and Analysis


The effect of using reasonably possible alternative assumptions as inputs to valuation techniques from which the Level III commodity risk management fair values are determined at Dec. 31, 2014 is estimated to be a +/- $120 million (2013 +/- $105 million) impact to the carrying value of the financial instruments. Fair values are stressed for volumes and prices. An amount of +/- $92 million (2013 +/- $87 million) in the stress value stems from a long-dated power sale contract that is designated as a cash flow hedge, while the remaining +/- $28 million (2013 +/- $18 million) accounts for the rest of the portfolio. The variable volumes are stressed up and down one standard deviation from historically available production data. Prices are stressed for longer-term deals where there are no liquid market quotes using various internal and external forecasting sources to establish a high and a low price range.


Valuation of PP&E and Associated Contracts


As at Dec. 31, 2014, PP&E makes up 74 per cent of our assets, of which 99 per cent relates to the Generation Segment. At the end of each reporting period, we assess whether there is any indication that a PP&E asset is impaired. Impairment exists when the carrying amount of the asset or CGU to which it belongs exceeds its recoverable amount, which is the higher of fair value less costs of disposal and value in use.


Factors that could indicate that an impairment exists include: significant underperformance relative to historical or projected operating results; significant changes in the manner in which an asset is used or in our overall business strategy; or significant negative industry or economic trends. In some cases, these events are clear. However, in many cases, a clearly identifiable event indicating possible impairment does not occur. Instead, a series of individually insignificant events occur over a period of time leading to an indication that an asset may be impaired. This can be further complicated in situations where we are not the operator of the facility. Events can occur in these situations that may not be known until a date subsequent to their occurrence.


Our operations, the market, and business environment are routinely monitored, and judgments and assessments are made to determine whether an event has occurred that indicates a possible impairment. If such an event has occurred, an estimate is made of the recoverable amount of the PP&E or CGU to which it belongs. Recoverable amount is the higher of an asset’s fair value less costs of disposal and its value in use. Fair value is the price that would be received to sell an asset in an orderly transaction between market participants at the measurement date. In determining fair value less costs of disposal, information about third-party transactions for similar assets is used and if none is available, other valuation techniques, such as discounted cash flows, are used. Value in use is computed using the present value of management’s best estimates of future cash flows based on the current use and present condition of the asset. In estimating either fair value less costs of disposal or value in use using discounted cash flow methods, estimates and assumptions must be made about sales prices, cost of sales, production, fuel consumed, retirement costs, and other related cash inflows and outflows over the life of the facilities, which can range from 30 to 60 years. In developing these assumptions, management uses estimates of contracted and future market prices based on expected market supply and demand in the region in which the plant operates, anticipated production levels, planned and unplanned outages, and transmission capacity or constraints for the remaining life of the facilities. Appropriate discount rates reflecting the risks specific to the asset under review are used in the assessments. These estimates and assumptions are susceptible to change from period to period and actual results can, and often do, differ from the estimates, and can have either a positive or negative impact on the estimate of the impairment charge, and may be material.


As a result of our review in 2014 and other specific events, net pre-tax asset impairment reversals of $6 million (2013 – reversals of $18 million) were recorded related to certain facilities. Also, an impairment indicator was identified at our U.S. Coal CGU, but the estimated recoverable amount approximated its carrying amount. Refer to the Asset Impairment Charges and Reversals section of this MD&A for further details.


Impairment charges can be reversed in future periods if circumstances improve. No assurances can be given if any reversal will occur or the amount or timing of any such reversal.


Project Development Costs


Deferred project development costs include external, direct, and incremental costs that are necessary for completing an acquisition or construction project. These costs are recognized in operating expenses until construction of a plant or acquisition of an investment is likely to occur, there is reason to believe that future costs are recoverable, and that efforts will result in future value to us, at which time the costs incurred subsequently are included in PP&E or investments. The appropriateness of capitalization of these costs is evaluated each reporting period, and amounts capitalized for projects no longer probable of occurring are charged to net earnings.


72


TransAlta Corporation   |   2014 Annual Report


Management’s Discussion and Analysis


Useful Life of PP&E


Each significant component of an item of PP&E is depreciated over its estimated useful life. A component is a tangible asset that can be separately identified as an asset and is expected to provide a benefit of greater than one year. Estimated useful lives are determined based on current facts and past experience, and take into consideration the anticipated physical life of the asset, existing long-term sales agreements and contracts, current and forecasted demand, the potential for technological obsolescence, and regulations. The useful lives of PP&E and depreciation rates used are reviewed at least annually to ensure they continue to be appropriate.


In 2014, depreciation and amortization expense per the Consolidated Statements of Cash Flows was $595 million (2013 – $585 million), of which $56 million (2013 – $58 million) relates to mining equipment and is included in fuel and purchased power.


Valuation of Goodwill


We evaluate goodwill for impairment at least annually, or more frequently if indicators of impairment exist. If the carrying amount of a CGU or group of CGUs, including goodwill, exceeds the unit’s fair value, the excess represents a goodwill impairment loss. A CGU is the smallest identifiable group of assets that generates cash inflows that are largely independent of the cash inflows from other assets or groups of assets.


Goodwill arose on the acquisitions of the Wyoming wind farm, Canadian Hydro Developers, Inc., Merchant Energy Group of the Americas, Inc., and Vision Quest Windelectric Inc. As at Dec. 31, 2014, this goodwill had a total carrying amount of $462 million (2013 – $460 million).


We reviewed the carrying amount of goodwill prior to year-end and determined that the fair values of the related CGUs or groups of CGUs to which goodwill relates, based on estimates of future cash flows, exceeded their carrying amounts, and no goodwill impairments existed.


Determining the fair value of the CGUs or group of CGUs is susceptible to changes from period to period as management is required to make assumptions about future cash flows, production and trading volumes, margins, and fuel and operating costs. Had assumptions been made that resulted in fair values of the CGUs or groups of CGUs declining by ten per cent from current levels, there would not have been any impairment of goodwill.


Leases


In determining whether the Corporation’s PPAs and other long-term electricity and thermal sales contracts contain, or are, leases, management must use judgment in assessing whether the fulfillment of the arrangement is dependent on the use of a specific asset and the arrangement conveys the right to use the asset. For those agreements considered to contain, or be, leases, further judgment is required to determine whether substantially all of the significant risks and rewards of ownership are transferred to the customer or remain with TransAlta, to appropriately account for the agreement as either a finance or operating lease. These judgments can be significant to how we classify amounts related to the arrangement as either PP&E or as a finance lease receivable on the Consolidated Statements of Financial Position, and therefore the value of certain items of revenue and expense is dependent upon such classifications.


Income Taxes


In accordance with IFRS, we use the liability method of accounting for income taxes. Under the liability method, deferred income tax assets and liabilities are recognized on the differences between the carrying amounts of assets and liabilities and their respective income tax basis.


Preparation of the consolidated financial statements involves determining an estimate of, or provision for, income taxes in each of the jurisdictions in which we operate. The process also involves making an estimate of taxes currently payable and taxes expected to be payable or recoverable in future periods, referred to as deferred income taxes. Deferred income taxes result from the effects of temporary differences due to items that are treated differently for tax and accounting purposes. The tax effects of these differences are reflected in the Consolidated Statements of Financial Position as deferred income tax assets and liabilities. An assessment must also be made to determine the likelihood that our future taxable income will be sufficient to permit the recovery of deferred income tax assets. To the extent that such recovery is not probable, deferred income tax assets must be reduced. The reduction of the deferred income tax asset can be reversed if the estimated future taxable income improves. No assurances can be given if any reversal will occur or the amount or timing of any such reversal. Management must exercise judgment in its assessment of continually changing tax interpretations, regulations, and legislation to ensure deferred income tax assets and liabilities are complete and fairly presented. Differing assessments and applications than our estimates could materially impact


TransAlta Corporation    2014 Annual Report

73


Management’s Discussion and Analysis


the amount recognized for deferred income tax assets and liabilities. Our tax filings are subject to audit by taxation authorities. The outcome of some audits may change our tax liability, although we believe that we have adequately provided for income taxes in accordance with IFRS based on all information currently available. The outcome of pending audits is not known nor is the potential impact on the consolidated financial statements determinable.


Deferred income tax assets of $45 million (2013 – $118 million) have been recorded on the Consolidated Statements of Financial Position as at Dec. 31, 2014. These assets primarily relate to net operating loss carryforwards. We believe there will be sufficient taxable income that will permit the use of these loss carryforwards in the tax jurisdictions where they exist.


Deferred income tax liabilities of $434 million (2013 – $459 million) have been recorded on the Consolidated Statements of Financial Position as at Dec. 31, 2014. These liabilities are comprised primarily of taxes on unrealized gains from risk management transactions and income tax deductions in excess of related depreciation of PP&E.


Employee Future Benefits


We provide selected pension and post-employment benefits to employees. The cost of providing these benefits is dependent upon many factors that result from actual plan experience and assumptions of future experience.


The liabilities for future benefits and associated pension costs included in annual compensation expenses are impacted by employee demographics, including age, compensation levels, employment periods, the level of contributions made to the plans, and earnings on plan assets.


Changes to the provisions of the plans may also affect current and future pension costs. Pension costs may also be significantly impacted by changes in key actuarial assumptions, including, for example, the discount rates used in determining the defined benefit obligation and the net interest cost on the net defined benefit liability. The discount rate used to estimate our obligation reflects high-quality corporate fixed income securities currently available and expected to be available during the period to maturity of the pension benefits.


The plan assets are comprised primarily of equity and fixed income investments. Fluctuations in the return on plan assets as a result of actual equity market returns and changes in interest rates may result in increased or decreased pension costs in future periods.


Decommissioning and Restoration Provisions


We recognize decommissioning and restoration provisions for PP&E in the period in which they are incurred if there is a legal or constructive obligation to reclaim the plant or site. The amount recognized as a provision is the best estimate of the expenditures required to settle the provision. Expected values are probability weighted to deal with the risks and uncertainties inherent in the timing and amount of settlement of many decommissioning and restoration provisions. Expected values are discounted at the risk-free interest rate adjusted to reflect the market’s evaluation of our credit standing.


As at Dec. 31, 2014, the decommissioning and restoration provisions recorded on the Consolidated Statements of Financial Position were $305 million (2013 – $270 million). We estimate the undiscounted amount of cash flow required to settle the decommissioning and restoration provisions is approximately $1.0 billion, which will be incurred between 2015 and 2072. The majority of these costs will be incurred between 2020 and 2050. Some of the facilities that are co-located with mining operations do not currently have any decommissioning obligations recorded as the obligations associated with the facilities are indeterminate at this time.


Sensitivities for the major assumptions are as follows:


Approximate impact


Factor


Increase or decrease (%)


on net earnings


Discount rate


1


3


Undiscounted decommissioning and restoration provision


10


2


Other Provisions


Where necessary, we recognize provisions arising from ongoing business activities, such as interpretation and application of contract terms and force majeure claims. These provisions, and subsequent changes thereto, are determined using our best estimate of the outcome of the underlying event and can also be impacted by determinations made by third parties, in compliance with contractual requirements. The actual amount of the provisions that may be required could differ materially from the amount recognized.


74


TransAlta Corporation    2014 Annual Report


Management’s Discussion and Analysis


Current Accounting Changes


Inception Gains and Losses


We restated the Consolidated Statement of Financial Position as at Dec. 31, 2013 to reclassify the inception gains or losses arising from differences between the fair value of a financial instrument at initial recognition (the transaction price) and the amount calculated through a valuation model. These amounts were previously reported as gross contra-risk management assets or liabilities. The adjustment reclassifies them as direct offsets to the value of the derivative contract to which they relate. As a result of the adjustment, long-term risk management assets and long-term risk management liabilities were reduced by $160 million at Dec. 31, 2013. Corresponding adjustments to the Dec. 31, 2012 Consolidated Statement of Financial Position were immaterial. Refer to Note 13(C) in our audited consolidated financial statements as at and for the year ended Dec. 31, 2014 for further information on inception gains and losses.


Inventory Writedown


During the third quarter of 2014, we restated the Consolidated Statements of Earnings (Loss) for the years ended Dec. 31, 2013 and 2012 to reclassify inventory writedown as a component of fuel and purchased power. These amounts were previously reported as stand-alone components of operating income. The adjustment is intended to better capture within gross margin the generally offsetting effects that changes in future power prices have on mark-to-market gains or losses from economic forward power sale hedges, included in revenue, and on inventory writedown or reversals. As a result of the adjustment, fuel and purchased power for the years ended Dec. 31, 2013 and 2012 increased by $22 million and $44 million, respectively. The inventory writedown for the year ended Dec. 31, 2014 was $19 million.


Other Net Operating Income and Losses


We restated the Consolidated Statements of Earnings (Loss) for the years ended Dec. 31, 2013 and 2012 to reclassify the losses associated with the California claim, the Sundance Units 1 and 2 return to service, and the assumption of pension obligations, as well as gains from insurance recoveries, as a net other operating income and losses group within operating income. Previously, each item was presented in earnings outside of operating income. We initiated the change as part of our ongoing monitoring of additional IFRS measures. As a result of the change, operating income (loss) for the years ended Dec. 31, 2013 and 2012 decreased by $102 million and $254 million, respectively.


Energy Marketing Intersegment Cost Allocation


A portion of OM&A costs incurred in the Energy Marketing Segment and the Corporate Segment are allocated to other segments based on an estimate of operating expenses and a percentage of resources dedicated to providing support and services. Segment OM&A costs are comprised of expenses net of intersegment allocations. In prior years, the Energy Marketing intersegment charge and recovery was presented as a distinct line item as a component of operating income (loss). Comparative figures have been reclassified to conform to the current year’s presentation.


IAS 32 Financial Instruments: Presentation


On Jan. 1, 2014, we adopted the amendments to IAS 32 Financial Instruments: Presentation regarding offsetting financial assets and financial liabilities. There was no impact of adopting the IAS 32 amendments on the audited consolidated financial statements.


IAS 36 Impairment of Assets


On Jan. 1, 2014, we adopted the amended disclosure requirements of IAS 36 Impairment of Assets. The amended disclosure requirements did not have an impact on the audited consolidated financial statements.


Comparative Figures


Certain comparative figures have been reclassified to conform to current period’s presentation. These reclassifications did not impact previously reported net earnings.


TransAlta Corporation    2014 Annual Report

75


Management’s Discussion and Analysis


Future Accounting Changes


Accounting standards that have been previously issued by the IASB but are not yet effective, and have not been applied by the Corporation include:


IFRS 9 Financial Instruments


In July 2014, on completion of the impairment phase of the project to reform accounting for financial instruments and replace IAS 39 Financial Instruments: Recognition and Measurement, the IASB issued the final version of IFRS 9 Financial Instruments. IFRS 9 includes guidance on the classification and measurement of financial assets and financial liabilities, impairment of financial assets (i.e. recognition of credit losses), and a new hedge accounting model.


Under the classification and measurement requirements for financial assets, financials assets must be classified and measured at either amortized cost or at fair value through profit or loss or through OCI, depending on the basis of the entity’s business model for managing the financial asset and the contractual cash flow characteristics of the financial asset.


The classification requirements for financial liabilities are unchanged from IAS 39. IFRS 9 requirements address the problem of volatility in net earnings arising from an issuer choosing to measure certain liabilities at fair value and require that the portion of the change in fair value due to changes in the entity’s own credit risk be presented in OCI, rather than within net earnings.


The new general hedge accounting model is intended to be simpler and more closely focus on how an entity manages its risks, replaces the IAS 39 effectiveness testing requirements with the principle of an economic relationship, and eliminates the requirement for retrospective assessment of hedge effectiveness.


The new requirements for impairment of financial assets introduce an expected loss impairment model that requires more timely recognition of expected credit losses. IAS 39 impairment requirements are based on an incurred loss model where credit losses are not recognized until there is evidence of a trigger event.


IFRS 9 is effective for annual periods beginning on or after Jan. 1, 2018 with early application permitted. We are assessing the impact of adopting this standard on our consolidated financial statements.


IFRS 15 Revenue from Contracts with Customers


In May 2014, the IASB issued IFRS 15 Revenue from Contracts with Customers, which replaces existing revenue recognition guidance with a single comprehensive accounting model. The model specifies that an entity recognizes revenue when it transfers promised goods or services to customers in an amount that reflects the consideration to which it expects to be entitled in exchange for those goods or services. IFRS 15 is effective for annual reporting periods beginning on or after Jan. 1, 2017 with early application permitted. We are assessing the impact of adopting this standard on our consolidated financial statements.


76


TransAlta Corporation    2014 Annual Report


Management’s Discussion and Analysis


Fourth Quarter


Consolidated Highlights


Three months ended Dec. 31

2014

2013

Revenues

718

587

Comparable EBITDA1

301

242

Net earnings (loss) attributable to common shareholders

148

(66)

Comparable net earnings attributable to common shareholders1

46

1

Comparable funds from operations1

225

179

Cash flow from operating activities

250

165

Comparable free cash flow1

104

61

Net earnings (loss) per share attributable to common shareholders, basic and diluted

0.54

(0.25)

Comparable net earnings per share1

0.17

0.00

Comparable funds from operations per share1

0.82

0.67

Comparable free cash flow per share1

0.38

0.23

Dividends paid per common share

0.18

0.29


Financial Highlights

§  Comparable EBITDA for the fourth quarter of 2014 increased by $59 million to $301 million compared to the same period in 2013, primarily due to strong availability throughout our generation portfolio, continued improved operational performance at Canadian Coal, lower coal cost at Canadian Coal, and improved year-over-year margins. Lower prices in Alberta negatively impacted revenue from generation in excess of targets at coal PPA facilities as well as revenue from our Wind portfolio in the province. Prices in Alberta averaged $30 per MWh during the fourth quarter of 2014, compared to $49 per MWh in the same period in 2013. Our strategy of being highly contracted and high availability in Canadian Coal generally limited the impacts of lower prices in Alberta.

§  Higher comparable EBITDA translated into higher comparable FFO for the three months ended Dec. 31, 2014 of $225 million, exceeding comparable FFO for the same period last year by $46 million.

§  Fourth quarter comparable net earnings attributable to common shareholders was $46 million ($0.17 net earnings per share), up from comparable net earnings of $1 million (nil net earnings per share), due to the increase in comparable EBITDA, partially offset by higher income tax expense.

§  Reported net earnings attributable to common shareholders was $148 million for the fourth quarter ($0.54 net earnings per share) compared to a net loss of $66 million ($0.25 net loss per share) for the same period in 2013. The differences between comparable and reported net earnings are mainly due to increases in the fair value of de-designated and economic hedges at U.S. Coal and the effects of the California claim in 2013.


1         These items are not defined under IFRS. Presenting these items from period to period provides management and investors with the ability to evaluate earnings trends more readily in comparison with prior periods’ results. Refer to the Comparable Funds from Operations and Comparable Free Cash Flow and Earnings and Other Measures on a Comparable Basis sections of this MD&A for further discussion of these items, including, where applicable, reconciliations to measures calculated in accordance with IFRS.


TransAlta Corporation    2014 Annual Report

77


Management’s Discussion and Analysis


Operational Results


Three months ended Dec. 31


2014


2013


Availability (%)1


93.2


91.8


Adjusted availability (%)1


93.2


91.8


Production (GWh)1


12,207


12,640


Comparable EBITDA


Generation Segment


Canadian Coal


118


68


U.S. Coal


19


14


Gas


81


82


Wind


56


58


Hydro


20


21


Total Generation Segment


294


243


Energy Marketing Segment


26


20


Corporate Segment


(19

)

(21

)

Total comparable EBITDA


301


242


§         Canadian Coal: Comparable EBITDA increased $50 million to $118 million in the fourth quarter of 2014 compared to the same period in 2013, primarily as a result of lower coal costs following integration of the Highvale mine in 2013 and continued improved operational performance. Lower market-based incentive rates in connection with lower prices have offset some of the improvement. The 2014 comparable EBITDA also includes a gain on settlement of a dispute with a supplier in relation to an equipment failure in prior years.

§         U.S. Coal: Comparable EBITDA was $19 million in the fourth quarter compared to $14 million for the same period in 2013. The increase in comparable EBITDA is primarily due to increased margins as we further optimized real-time operations against the spot market and fixed-price contracts. We have also started delivering power to Puget Sound Energy under a long-term fixed price contract in December 2014.

§         Gas: Comparable EBITDA was consistent in the fourth quarter with the same period in 2013, despite lower Alberta prices, as gains from lower outages and contract adjustments were offset by a mark-to-market loss on gas.

§         Wind: Comparable EBITDA decreased slightly in the fourth quarter to $56 million compared to $58 million for the same period in 2013. Production from our Wyoming facility has offset the effects of lower Alberta prices.

§         Hydro: Comparable EBITDA was consistent in the fourth quarter with the same period in 2013, as most production was contract-based in both periods, and both periods included an insurance recovery for prior business interruption claims in similar amounts.

§         Energy Marketing Segment: Energy Marketing generated income of $26 million in the fourth quarter, up $6 million compared to the fourth quarter of 2013 due to customer margin growth, our ability to capture arbitrage opportunities stemming from high volatility, particularly in Eastern markets, and offsetting intersegment gains to the Gas generation positions. The increase was partially offset by higher corporate cost allocations and higher performance-based compensation costs driven by the strong trading results.

§         Corporate Segment: Our Corporate Segment incurred similar costs in the fourth quarter of 2014 of $19 million compared to $21 million in 2013. The lower costs resulted from reductions to external costs partially offset by higher incentive-based compensation and increased development costs.


1         Availability includes assets under generation operations and finance leases and excludes Hydro assets and Equity Investments. Production includes all generating assets, irrespective of investment vehicle and fuel type.


78


TransAlta Corporation   |   2014 Annual Report


Management’s Discussion and Analysis


Availability and Production

Availability for the three months ended Dec. 31, 2014 increased compared to the same period in 2013, primarily due to lower unplanned outages at Canadian Coal.


Lower production for the three months ended Dec. 31, 2014 compared to the same period in 2013 is primarily due to market curtailments at Centralia, partially offset by lower unplanned outages at Canadian Coal.


Comparable Funds from Operations and Comparable Free Cash Flow

Comparable FFO per share and comparable free cash flow per share are calculated as follows using the weighted average number of common shares outstanding during the period.


Three months ended Dec. 31


2014


2013


Cash flow from operating activities


250


165


Change in non-cash operating working capital balances


(23

)

(13

)

Cash flow from operations before changes in working capital


227


152


Impacts associated with California claim


27


TAMA Transmission bid costs


5


Other non-comparable items


(7

)


Comparable FFO


225


179


Deduct:


Sustaining capital


(87

)

(96

)

Dividends paid on preferred shares


(13

)

(10

)

Distributions paid to subsidiaries’ non-controlling interests


(21

)

(12

)

Comparable free cash flow


104


61


Weighted average number of common shares outstanding in the period


275


268


Comparable FFO per share


0.82


0.67


Comparable free cash flow per share


0.38


0.23


A reconciliation of comparable EBITDA to comparable FFO is as follows:


Three months ended Dec. 31


2014


2013


Comparable EBITDA


301


242


Unrealized (losses) gains from risk management activities


(12

)

(11

)

Interest expense


(58

)

(61

)

Provisions


1


Current income tax expense


(9

)

(3

)

Realized foreign exchange gain (loss)


14


(3

)

Decommissioning and restoration costs settled


(5

)

(5

)

Gain on sale of assets


2


Other non-cash items


(6)


17


Comparable FFO


225


179


Comparable FFO for the three months ended Dec. 31, 2014 increased $46 million to $225 million, compared to the same period in 2013, primarily due to higher comparable EBITDA.


Comparable free cash flow for the three months ended Dec. 31, 2014 increased $43 million to $104 million compared to the same period in 2013, primarily due to the increase in comparable FFO and a decrease in sustaining capital, partially offset by higher distributions paid to our subsidiaries’ non-controlling interests as a result of the reduction of our interest in TransAlta Renewables and improved performance at TA Cogen.


TransAlta Corporation   |   2014 Annual Report

79


Management’s Discussion and Analysis


Earnings on a Comparable Basis

During 2014, prior period restatements were made to 2013. Refer to the Current Accounting Changes section of this MD&A for a description of these items.


The adjustments made to calculate comparable earnings for the three months ended Dec. 31, 2014 and 2013 are as follows. References are to the subsequent reconciliation table.


Three months ended Dec. 31


2014 


2013

Reference


Segment and


number


Adjustment


fuel type


Reclassifications:


1


Finance lease income used as a proxy for operating revenue


Generation (Gas)


13 


12

2


Decrease in finance lease receivable used as a proxy for operating revenue and depreciation


Generation (Gas)


3


Reclassification of mine depreciation from fuel and purchased power


Generation (Canadian Coal)


15 


16

4


Reclassification of comparable gain on sale of property, plant, and equipment that is included in depreciation


Generation (Canadian Coal)


1

Adjustments (increasing (decreasing) earnings to arrive at comparable results):


5


Impacts to revenue associated with certain de-designated and economic hedges


Generation (U.S. Coal)


(47)


43

6


Flood-related maintenance costs, net of insurance recoveries


Generation (Hydro)


(5)


2

7


Costs related to TAMA Transmission bid


Corporate


8


Asset impairment charges (reversals)


Generation (Gas)


(5)


9


Non-comparable portion of insurance recovery received


Generation (Hydro)


(3)


(1)

10


California claim


Energy Marketing


56

11


Sundance Units 1 and 2 return to service


Generation (Canadian Coal)


10

12


Foreign exchange on California claim


Unassigned


13


Non-comparable gain on sale of assets


Generation (Equity Investments)


(1)


Corporate


(2)

14


Writedown (reversal) of deferred income tax assets


Unassigned


(68)


(12)

15


Net tax effect of all comparable adjustments


Unassigned


20 


(29)


80


TransAlta Corporation   |   2014 Annual Report


Management’s Discussion and Analysis


A reconciliation of comparable results to reported results for the three months ended Dec. 31, 2014 and 2013 is as follows:


Three months ended Dec. 31, 2014


Three months ended Dec. 31, 2013


Comparable


Comparable


Comparable


Comparable


Comparable


Comparable


Reported


reclassifications


adjustments


total


Reported


reclassifications


adjustments


total


Revenues


718


14

1,2

(47)

5

685


587


12

1

43

5

642


Fuel and purchased power


268


(15)

3


253


279


(16)

3


263


Gross margin


450


29


(47)


432


308


28


43


379


Operations, maintenance, and administration


138


6,7

138


140


140


Asset impairment charges (reversals)


(5

)


5

8


Taxes, other than income taxes


8


8


5


5


Gain on sale of assets


(1)

4


(1

)


(1)

4


(1

)

Net other operating (income) losses


(17

)


3

9

(14

)

58


(65)

9,10,11

(7

)

EBITDA


326


30


(55)


301


105


29


108


242


Depreciation and amortization


136


17

2,34


153


143


17

3,4

(2)

6

158


Operating income


190


13


(55)


148


(38

)

12


110


84


Finance lease income


13


(13)

1


12


(12)

1


Equity income


(5

)


(5

)

Foreign exchange gain (loss)


7


2

12

9


3


3


Gain on sale of assets


1


(1)

13


2


(2)

13


Earnings before interest and taxes


211


(54)


157


(26

)


108


82


Net interest expense


62


62


66


66


Income tax expense (recovery)


(26

)


48

14,15

22


(49

)


41

14,15

(8

)

Net earnings (loss)


175


(102)


73


(43

)


67


24


Non-controlling interests


14


14


13


13


Net earnings (loss) attributable to TransAlta shareholders


161


(102)


59


(56

)


67


11


Preferred share dividends


13


13


10


10


Net earnings (loss) attributable to common shareholders


148


(102)


46


(66

)


67


1


Weighted average number of common shares outstanding in the period


275


275


268


268


Net earnings (loss) per share attributable to common shareholders


0.54


0.17


(0.25

)


0.00


TransAlta Corporation   |   2014 Annual Report

81


Management’s Discussion and Analysis


Selected Quarterly Information


Q1 2014


Q2 2014


Q3 2014


Q4 2014


Revenue


775


491


639


718


Comparable EBITDA


310


213


212


301


Comparable FFO


238


154


145


225


Comparable net earnings (loss) attributable to common shareholders


47


(12

)

(13

)

46


Net earnings (loss) attributable to common shareholders


49


(50

)

(6

)

148


Net earnings (loss) per share attributable to common shareholders, basic and diluted


0.18


(0.18

)

(0.03

)

0.54


Comparable net earnings (loss) per share, basic and diluted


0.17


(0.04

)

(0.05

)

0.17


Q1 2013


Q2 2013


Q3 2013


Q4 2013


Revenue


540


542


623


587


Comparable EBITDA


268


247


266


242


Comparable FFO


193


184


174


179


Comparable net earnings attributable to common shareholders


32


9


39


1


Net earnings (loss) attributable to common shareholders


(11

)

15


(9

)

(66

)

Net earnings (loss) per share attributable to common shareholders, basic and diluted


(0.04

)

0.06


(0.03

)

(0.25

)

Comparable net earnings per share, basic and diluted


0.12


0.03


0.15


0.00


Basic and diluted earnings per share attributable to common shareholders and comparable earnings per share are calculated each period using the weighted average common shares outstanding during the period. As a result, the sum of the earnings per share for the four quarters making up the calendar year may sometimes differ from the annual earnings per share.


Comparable net earnings is generally higher in the first and fourth quarters due to higher demand associated with winter cold in the markets in which we operate. The second and third quarters of 2013 benefitted from high Alberta prices, offsetting some of the impacts of unplanned outages at Canadian Coal during the periods. In 2014, Canadian Coal improved its operational performance, with the third and fourth quarters also including reductions in coal costs. Some of these gains compared to the same periods in the previous year were offset by a downward trend in Alberta prices, starting from the second quarter of 2013. Market volatility can also impact quarterly contributions from our Energy Marketing Segment, as the first quarter of 2014 benefitted from exceptional weather conditions in northeastern North America, with the subsequent two quarters seeing muted volatility and reduced contribution from the Segment. Following public offerings of TransAlta Renewables common shares in the third quarter of 2013 and the second quarter of 2014, an increasing portion of earnings is attributable to non-controlling interests.


Revenue is impacted by market and operational factors listed above, and by changes in future power prices in the Pacific Northwest, which cause de-designated and economic hedges in the region to fluctuate in value. These hedges significantly depreciated in the first and fourth quarters of 2013, as well as the second quarter of 2014 and significantly increased in value over the second half of 2014.


Net earnings attributable to common shareholders have also been impacted by the following events:


§    loss on assumption of pension obligation, in the first quarter of 2013;

§    writedown of deferred tax assets, in the third quarter of 2013;

§    loss associated with the California claim, in the fourth quarter of 2013.


Amounts per share reflect these fluctuations, with limited increases in the number of shares outstanding over the last eight quarters.


82


TransAlta Corporation   |   2014 Annual Report


Management’s Discussion and Analysis


Disclosure Controls and Procedures


Management has evaluated, with the participation of our Chief Executive Officer and Chief Financial Officer, the effectiveness of our disclosure controls and procedures as of the end of the period covered by this report. Disclosure controls and procedures refer to controls and other procedures designed to ensure that information required to be disclosed in the reports we file or submit under the Securities Exchange Act of 1934, as amended (“Exchange Act”) are recorded, processed, summarized, and reported within the time periods specified in the rules and forms of the Securities and Exchange Commission. Disclosure controls and procedures include, without limitation, controls and procedures designed to ensure that information required to be disclosed by us in our reports that we file or submit under the Exchange Act is accumulated and communicated to management, including our Chief Executive Officer and Chief Financial Officer, as appropriate to allow timely decisions regarding our required disclosure. In designing and evaluating our disclosure controls and procedures, management recognizes that any controls and procedures, no matter how well designed and operated, can provide only reasonable assurance of achieving the desired control objectives, and management is required to apply its judgment in evaluating and implementing possible controls and procedures.


There has been no change in the internal control over financial reporting during the period covered by this report that has materially affected, or is reasonably likely to materially affect, our internal control over financial reporting. Based on the foregoing evaluation, our Chief Executive Officer and Chief Financial Officer have concluded that, as of Dec. 31, 2014, the end of the period covered by this report, our disclosure controls and procedures were effective at a reasonable assurance level.


TransAlta Corporation   |   2014 Annual Report

83


EX-13.3 4 a15-3974_1ex13d3.htm EX-13.3 CONSOLIDATED AUDITED ANNUAL FINANCIAL STATEMENTS FOR THE YEAR ENDED DECEMBER 31, 2014.

Exhibit 13.3


Consolidated Financial Statements


Management’s Report


To the Shareholders of TransAlta Corporation

The consolidated financial statements and other financial information included in this annual report have been prepared by management. It is management’s responsibility to ensure that sound judgment, appropriate accounting principles and methods, and reasonable estimates have been used to prepare this information. They also ensure that all information presented is consistent.


Management is also responsible for establishing and maintaining internal controls and procedures over the financial reporting process. The internal control system includes an internal audit function and an established business conduct policy that applies to all employees. In addition, TransAlta Corporation has a code of conduct that applies to all employees and is signed annually. The code of conduct can be viewed on TransAlta’s website (www.transalta.com). Management believes the system of internal controls, review procedures, and established policies provide reasonable assurance as to the reliability and relevance of financial reports. Management also believes that TransAlta’s operations are conducted in conformity with the law and with a high standard of business conduct.


The Board of Directors (the “Board”) is responsible for ensuring that management fulfills its responsibilities for financial reporting and internal control. The Board carries out its responsibilities principally through its Audit and Risk Committee (the “Committee”). The Committee, which consists solely of independent directors, reviews the financial statements and annual report and recommends them to the Board for approval. The Committee meets with management, internal auditors, and external auditors to discuss internal controls, auditing matters, and financial reporting issues. Internal and external auditors have full and unrestricted access to the Committee. The Committee also recommends the firm of external auditors to be appointed by the shareholders.


GRAPHIC

GRAPHIC


Dawn L. Farrell

Donald Tremblay

President and Chief Executive Officer

Chief Financial Officer


February 18, 2015


84


TransAlta Corporation   |   2014 Annual Report


Consolidated Financial Statements


Management’s Annual Report on Internal Control over Financial Reporting


To the Shareholders of TransAlta Corporation

The following report is provided by management in respect of TransAlta Corporation’s internal control over financial reporting (as defined in Rules 13a-15f and 15d-15f under the United States Securities Exchange Act of 1934).


TransAlta’s management is responsible for establishing and maintaining adequate internal control over financial reporting for TransAlta Corporation.


Management has used the Committee of Sponsoring Organizations of the Treadway Commission (“COSO”) 2013 framework to evaluate the effectiveness of TransAlta Corporation’s internal control over financial reporting. Management believes that the COSO 2013 framework is a suitable framework for its evaluation of TransAlta Corporation’s internal control over financial reporting because it is free from bias, permits reasonably consistent qualitative and quantitative measurements of TransAlta Corporation’s internal controls, is sufficiently complete so that those relevant factors that would alter a conclusion about the effectiveness of TransAlta Corporation’s internal controls are not omitted, and is relevant to an evaluation of internal control over financial reporting.


Internal control over financial reporting cannot provide absolute assurance of achieving financial reporting objectives because of its inherent limitations. Internal control over financial reporting is a process that involves human diligence and compliance and is subject to lapses in judgment and breakdowns resulting from human failures. Internal control over financial reporting also can be circumvented by collusion or improper overrides. Because of such limitations, there is a risk that material misstatements may not be prevented or detected on a timely basis by internal control over financial reporting. However, these inherent limitations are known features of the financial reporting process, and it is possible to design safeguards into the process to reduce, though not eliminate, this risk.


TransAlta Corporation proportionately consolidates the accounts of the Sheerness and Genesee Unit 3 joint operations in accordance with International Financial Reporting Standards (“IFRS”). Management does not have the contractual ability to assess the internal controls of these joint arrangements. Once the financial information is obtained from these joint arrangements it falls within the scope of TransAlta Corporation’s internal controls framework. Management’s conclusion regarding the effectiveness of internal controls does not extend to the internal controls at the transactional level of these joint arrangements. The 2014 consolidated financial statements of TransAlta Corporation included $678 million and $643 million of total and net assets, respectively, as of December 31, 2014, and $215 million and $73 million of revenues and net earnings, respectively, for the year then ended related to these joint arrangements.


Management has assessed the effectiveness of TransAlta Corporation’s internal control over financial reporting, as at December 31, 2014, and has concluded that such internal control over financial reporting is effective.


Ernst & Young LLP, who has audited the consolidated financial statements of TransAlta Corporation for the year ended December 31, 2014, has also issued a report on internal control over financial reporting under Auditing Standard No. 5 of the Public Company Accounting Oversight Board (United States). This report is located on the following page of this Annual Report.


GRAPHIC

GRAPHIC


Dawn L. Farrell

Donald Tremblay

President and Chief Executive Officer

Chief Financial Officer


February 18, 2015


TransAlta Corporation   |   2014 Annual Report

85


Consolidated Financial Statements


Report of Independent Registered Public Accounting Firm


To the Shareholders of TransAlta Corporation

We have audited TransAlta Corporation’s internal control over financial reporting as of December 31, 2014, based on criteria established in Internal Control—Integrated Framework issued by the Committee of Sponsoring Organizations of the Treadway Commission (2013 framework), (the COSO criteria). TransAlta Corporation’s management is responsible for maintaining effective internal control over financial reporting, and for its assessment of the effectiveness of internal control over financial reporting included in the accompanying Management’s Annual Report on Internal Control over Financial Reporting. Our responsibility is to express an opinion on the corporation’s internal control over financial reporting based on our audit.


We conducted our audit in accordance with the standards of the Public Company Accounting Oversight Board (United States). Those standards require that we plan and perform the audit to obtain reasonable assurance about whether effective internal control over financial reporting was maintained in all material respects. Our audit included obtaining an understanding of internal control over financial reporting, assessing the risk that a material weakness exists, testing and evaluating the design and operating effectiveness of internal control based on the assessed risk, and performing such other procedures as we considered necessary in the circumstances. We believe that our audit provides a reasonable basis for our opinion.


A corporation’s internal control over financial reporting is a process designed to provide reasonable assurance regarding the reliability of financial reporting and the preparation of financial statements for external purposes in accordance with generally accepted accounting principles. A corporation’s internal control over financial reporting includes those policies and procedures that (1) pertain to the maintenance of records that, in reasonable detail, accurately and fairly reflect the transactions and dispositions of the assets of the corporation; (2) provide reasonable assurance that transactions are recorded as necessary to permit preparation of financial statements in accordance with generally accepted accounting principles, and that receipts and expenditures of the corporation are being made only in accordance with authorizations of management and directors of the corporation; and (3) provide reasonable assurance regarding prevention or timely detection of unauthorized acquisition, use, or disposition of the corporation’s assets that could have a material effect on the financial statements.


Because of its inherent limitations, internal control over financial reporting may not prevent or detect misstatements. Also, projections of any evaluation of effectiveness to future periods are subject to the risk that controls may become inadequate because of changes in conditions, or that the degree of compliance with the policies or procedures may deteriorate.


As indicated in the accompanying Management’s Annual Report on Internal Control over Financial Reporting, management’s assessment of and conclusion on the effectiveness of internal control over financial reporting did not include the internal controls of the Sheerness and Genesee Unit 3 joint arrangements, which are included in the 2014 consolidated financial statements of the Corporation and constituted $678 million and $643 million of total and net assets, respectively, as of December 31, 2014, and $215 million and $73 million of revenues and net earnings, respectively, for the year then ended. Our audit of internal control over financial reporting of the Corporation did not include an evaluation of the internal control over financial reporting of the Sheerness and Genesee Unit 3 joint arrangements.


In our opinion, TransAlta Corporation maintained, in all material respects, effective internal control over financial reporting as of December 31, 2014, based on the COSO criteria.


We also have audited, in accordance with the standards of the Public Company Accounting Oversight Board (United States), the consolidated statements of financial position as at December 31, 2014 and 2013, and the related consolidated statements of earnings (loss), comprehensive income (loss), changes in equity and cash flows for each of the three years in the period ended December 31, 2014 of TransAlta Corporation and our report dated February 18, 2015 expressed an unqualified opinion thereon.


GRAPHIC


Chartered Accountants


Calgary, Canada


February 18, 2015


86


TransAlta Corporation   |   2014 Annual Report


Consolidated Financial Statements


Independent Auditors’ Report of Registered Public Accounting Firm


To the Shareholders of TransAlta Corporation

We have audited the accompanying consolidated financial statements of TransAlta Corporation, which comprise the consolidated statements of financial position as at December 31, 2014 and 2013, and the consolidated statements of earnings (loss), comprehensive income (loss), changes in equity and cash flows for each of the years in the three-year period ended December 31, 2014, and a summary of significant accounting policies and other explanatory information.


Management’s Responsibility for the Consolidated Financial Statements

Management is responsible for the preparation and fair presentation of these consolidated financial statements in accordance with International Financial Reporting Standards as issued by the International Accounting Standards Board, and for such internal control as management determines is necessary to enable the preparation of consolidated financial statements that are free from material misstatement, whether due to fraud or error.


Auditors’ Responsibility

Our responsibility is to express an opinion on these consolidated financial statements based on our audits. We conducted our audits in accordance with Canadian generally accepted auditing standards and the standards of the Public Company Accounting Oversight Board (United States). Those standards require that we comply with ethical requirements and plan and perform the audit to obtain reasonable assurance about whether the consolidated financial statements are free from material misstatement.


An audit involves performing procedures to obtain audit evidence about the amounts and disclosures in the consolidated financial statements. The procedures selected depend on the auditors’ judgment, including the assessment of the risks of material misstatement of the consolidated financial statements, whether due to fraud or error. In making those risk assessments, the auditors consider internal control relevant to the entity’s preparation and fair presentation of the consolidated financial statements in order to design audit procedures that are appropriate in the circumstances. An audit also includes examining, on a test basis, evidence supporting the amounts and disclosures in the consolidated financial statements, evaluating the appropriateness of accounting policies used and the reasonableness of accounting estimates made by management, as well as evaluating the overall presentation of the consolidated financial statements.


We believe that the audit evidence we have obtained in our audits is sufficient and appropriate to provide a basis for our audit opinion.


Opinion

In our opinion, the consolidated financial statements present fairly, in all material respects, the financial position of TransAlta Corporation as at December 31, 2014 and 2013, and its financial performance and its cash flows for each of the years in the three-year period ended December 31, 2014 in accordance with International Financial Reporting Standards as issued by the International Accounting Standards Board.


Other Matter

We have also audited, in accordance with the standards of the Public Company Accounting Oversight Board (United States), TransAlta Corporation’s internal control over financial reporting as of December 31, 2014, based on the criteria established in Internal Control — Integrated Framework issued by the Committee of Sponsoring Organizations of the Treadway Commission (2013 framework) and our report dated February 18, 2015 expressed an unqualified opinion on TransAlta Corporation’s internal control over financial reporting.


GRAPHIC


Chartered Accountants


Calgary, Canada


February 18, 2015


TransAlta Corporation   |   2014 Annual Report

87


Consolidated Financial Statements


Consolidated Statements of Earnings (Loss)


2014


2013


2012


Year ended Dec. 31 (in millions of Canadian dollars except where noted)


(Restated)*


(Restated)*


Revenues (Note 35)


2,623


2,292


2,210


Fuel and purchased power (Note 5)


1,092


948


797


Gross margin


1,531


1,344


1,413


Operations, maintenance, and administration (Note 5)


542


516


499


Depreciation and amortization


538


525


509


Asset impairment charges (reversals) (Note 6)


(6

)

(18

)

324


Restructuring provision (Note 21)


(3

)

13


Taxes, other than income taxes


29


27


28


Net other operating (income) losses (Note 8)


(14

)

102


254


Operating income (loss)


442


195


(214

)

Finance lease income (Note 7)


49


46


16


Equity loss (Note 16)


(10

)

(15

)

Net interest expense (Note 9)


(254

)

(256

)

(242

)

Foreign exchange gain (loss)


1


(9

)

Gain on sale of assets (Note 4)


2


12


3


Gain on sale of collateral (Note 14)


15


Other income


1


Earnings (loss) before income taxes


239


(12

)

(445

)

Income tax expense (recovery) (Note 10)


7


(8

)

102


Net earnings (loss)


232


(4

)

(547

)

Net earnings (loss) attributable to:


TransAlta shareholders


182


(33

)

(584

)

Non-controlling interests (Note 11)


50


29


37


232


(4

)

(547

)

Net earnings (loss) attributable to TransAlta shareholders


182


(33

)

(584

)

Preferred share dividends (Note 25)


41


38


31


Net earnings (loss) attributable to common shareholders


141


(71

)

(615

)

Weighted average number of common shares outstanding in the year (millions)


273


264


235


Net earnings (loss) per share attributable to common shareholders, basic and diluted (Note 24)


0.52


(0.27

)

(2.62

)


*     See Note 3(B) for prior period restatements.


See accompanying notes.


88


TransAlta Corporation    2014 Annual Report


Consolidated Financial Statements


Consolidated Statements of Comprehensive Income (Loss)


Year ended Dec. 31 (in millions of Canadian dollars)


2014


2013


2012


Net earnings (loss)


232


(4

)

(547

)

Other comprehensive income (loss)


Net actuarial gains (losses) on defined benefit plans, net of tax1


(20

)

31


(23

)

Losses on derivatives designated as cash flow hedges, net of tax2


(1

)


(2

)

Reclassification of (gains) losses on derivatives designated as cash flow hedges to non-financial assets, net of tax3


1


5


Total items that will not be reclassified subsequently to net earnings


(21

)

32


(20

)

Gains (losses) on translating net assets of foreign operations


75


37


(23

)

Reclassification of translation gains on net assets of divested foreign operations (Note 4)


(7

)


Gains (losses) on financial instruments designated as hedges of foreign operations, net of tax4


(58

)

(35

)

13


Reclassification of losses on financial instruments designated as hedges of divested foreign operations, net of tax5 (Note 4)


7


Gains (losses) on derivatives designated as cash flow hedges, net of tax6


215


76


(12

)

Reclassification of gains on derivatives designated as cash flow hedges to net earnings, net of tax7


(45

)

(24

)

(6

)

Total items that will be reclassified subsequently to net earnings


187


54


(28

)

Other comprehensive income (loss)


166


86


(48

)

Total comprehensive income (loss)


398


82


(595

)

Total comprehensive income (loss) attributable to:


TransAlta shareholders


348


41


(626

)

Non-controlling interests


50


41


31


398


82


(595

)


1   Net of income tax recovery of 7 for the year ended Dec. 31, 2014 (2013 - 11 expense, 2012 - 8 recovery).

2   Net of income tax of nil for the year ended Dec. 31, 2014 (2013 - nil, 2012 - 1 recovery).

3   Net of income tax of nil for the year ended Dec. 31, 2014 (2013 - 1 recovery, 2012 - 2 recovery).

4   Net of income tax recovery of 7 for the year ended Dec. 31, 2014 (2013 - 5 recovery, 2012 - 2 expense).

5   Net of income tax recovery of 1 for the year ended Dec. 31, 2014 (2013 - nil, 2012 - nil).

6   Net of income tax expense of 91 for the year ended Dec. 31, 2014 (2013 - 12 expense, 2012 - 4 expense).

7   Net of income tax expense of 3 for the year ended Dec. 31, 2014 (2013 - 1 expense, 2012 - 20 expense).


See accompanying notes.


TransAlta Corporation    2014 Annual Report

89


Consolidated Financial Statements


Consolidated Statements of Financial Position


2014


2013


As at Dec. 31 (in millions of Canadian dollars)


(Restated)*


Cash and cash equivalents


43


42


Trade and other receivables (Note 12)


450


504


Prepaid expenses


17


12


Risk management assets (Notes 13 and 14)


273


113


Inventory (Note 15)


71


77


854


748


Investments (Note 16)


192


Long-term portion of finance lease receivables (Note 7)


403


377


Property, plant, and equipment (Notes 17 and 35)


Cost


12,532


12,024


Accumulated depreciation


(5,294

)

(4,831

)


7,238


7,193


Goodwill (Notes 18 and 35)


462


460


Intangible assets (Notes 19 and 35)


331


323


Deferred income tax assets (Note 10)


45


118


Risk management assets (Notes 13 and 14)


402


116


Other assets (Notes 20 and 35)


98


97


Total assets


9,833


9,624


Accounts payable and accrued liabilities


481


447


Current portion of decommissioning and other provisions (Note 21)


34


27


Risk management liabilities (Notes 13 and 14)


128


85


Income taxes payable


2


3


Dividends payable (Note 24)


55


85


Current portion of long-term debt and finance lease obligations (Note 22)


751


217


1,451


864


Long-term debt and finance lease obligations (Note 22)


3,305


4,130


Decommissioning and other provisions (Note 21)


322


305


Deferred income tax liabilities (Note 10)


434


459


Risk management liabilities (Notes 13 and 14)


94


103


Defined benefit obligation and other long-term liabilities (Notes 23 and 28)


349


340


Equity


Common shares (Note 24)


2,999


2,913


Preferred shares (Note 25)


942


781


Contributed surplus


9


9


Deficit


(770

)

(735

)

Accumulated other comprehensive income (loss) (Note 26)


104


(62

)

Equity attributable to shareholders


3,284


2,906


Non-controlling interests (Note 11)


594


517


Total equity


3,878


3,423


Total liabilities and equity


9,833


9,624


* See Note 3(B) for prior period restatements.

Commitments (Note 33)

Contingencies (Note 34)

Subsequent events (Note 36)


See accompanying notes.


GRAPHIC

GRAPHIC


On behalf of the Board:

Gordon D. Giffin

Karen E. Maidment


Director

Director


90


TransAlta Corporation    2014 Annual Report


Consolidated Financial Statements


Consolidated Statements of Changes in Equity


(in millions of Canadian dollars)


Accumulated


other


Attributable to


Common


Preferred


Contributed


comprehensive


Attributable to


non-controlling


shares


shares


surplus


Deficit


income (loss)1


shareholders


interests


Total


Balance, Dec. 31, 2012


2,726


781


9


(362

)

(136

)

3,018


330


3,348


Net earnings (loss)


(33

)


(33

)

29


(4

)

Other comprehensive income:


Net gains on translating net assets of foreign operations, net of hedges and of tax


2


2


2


Net gains on derivatives designated as cash flow hedges, net of tax


41


41


12


53


Net actuarial gains on defined benefits plans, net of tax


31


31


31


Total comprehensive income


(33

)

74


41


41


82


Common share dividends


(306

)


(306

)


(306

)

Preferred share dividends


(38

)


(38

)


(38

)

Formation of TransAlta Renewables Inc. (Note 11)


4


4


206


210


Distributions paid, and payable, to non-controlling interests


(60

)

(60

)

Common shares issued


187


187


187


Balance, Dec. 31, 2013


2,913


781


9


(735

)

(62

)

2,906


517


3,423


Net earnings


182


182


50


232


Other comprehensive income (loss):


Net gains on translating net assets of foreign operations, net of hedges and of tax


17


17


17


Net gains on derivatives designated as cash flow hedges, net of tax


169


169


169


Net actuarial losses on defined benefits plans, net of tax


(20

)

(20

)


(20

)

Total comprehensive income


182


166


348


50


398


Common share dividends


(196

)


(196

)


(196

)

Preferred share dividends


(41

)


(41

)


(41

)

Secondary offering of TransAlta Renewables Inc. shares (Note 11)


20


20


109


129


Distributions paid, and payable, to non-controlling interests


(82

)

(82

)

Common shares issued


86


86


86


Preferred shares issued


161


161


161


Balance, Dec. 31, 2014


2,999


942


9


(770

)

104


3,284


594


3,878


1     Refer to Note 26 for details on components of, and changes in, Accumulated other comprehensive income (loss).


See accompanying notes.


TransAlta Corporation    2014 Annual Report

91


Consolidated Financial Statements


Consolidated Statements of Cash Flows


Year ended Dec. 31 (in millions of Canadian dollars)


2014


2013


2012


Operating activities


Net earnings (loss)


232


(4

)

(547

)

Depreciation and amortization (Note 35)


595


585


564


Gain on sale of assets (Note 4)


(2

)

(12

)

(3

)

California claim (Note 8)


(28

)

28


-


Accretion of provisions (Note 21)


18


18


17


Decommissioning and restoration costs settled (Note 21)


(16

)

(24

)

(34

)

Deferred income tax expense (recovery) (Note 10)


(26

)

(47

)

89


Unrealized (gain) loss from risk management activities


(50

)

76


99


Unrealized foreign exchange (gain) loss


11


(1

)

5


Provisions


-


11


11


Asset impairment charges (reversals) (Note 6)


(6

)

(18

)

324


Sundance Units 1 and 2 return to service (Note 8)


-


25


43


Equity loss, net of distributions received (Note 16)


-


10


14


Other non-cash items


(5

)

44


(6

)

Cash flow from operations before changes in working capital


723


691


576


Change in non-cash operating working capital balances (Note 30)


73


74


(56

)

Cash flow from operating activities


796


765


520


Investing activities


Additions to property, plant, and equipment (Notes 17 and 35)


(487

)

(561

)

(703

)

Additions to intangibles (Notes 19 and 35)


(34

)

(32

)

(39

)

Acquisition of finance lease (Note 4)


-


-


(312

)

Addition to assets held for sale


(13

)

(17

)

-


Proceeds on sale of property, plant, and equipment


6


14


3


Proceeds on sale of investments and development projects (Note 4)


224


-


3


Resolution of certain outstanding tax matters (Note 10)


-


2


9


Realized gains (losses) on financial instruments


(2

)

14


(13

)

Net decrease in collateral received from counterparties


(1

)

(1

)

(13

)

Net (increase) decrease in collateral paid to counterparties


(3

)

-


24


Decrease in finance lease receivable


3


1


3


Acquisition of Wyoming wind farm (Note 4)


-


(109

)

-


Other


13


15


(8

)

Change in non-cash investing working capital balances


2


(29

)

(2

)

Cash flow used in investing activities


(292

)

(703

)

(1,048

)

Financing activities


Net increase (decrease) in borrowings under credit facilities (Note 22)


(436

)

(119

)

152


Repayment of long-term debt (Note 22)


(551

)

(328

)

(314

)

Issuance of long-term debt (Note 22)


434


398


388


Dividends paid on common shares (Note 24)


(140

)

(116

)

(104

)

Dividends paid on preferred shares (Note 25)


(41

)

(38

)

(32

)

Net proceeds on issuance of common shares (Note 24)


-


-


293


Net proceeds on issuance of preferred shares (Note 25)


161


-


217


Net proceeds on sale of non-controlling interest in subsidiary (Note 11)


129


207


-


Realized gains (losses) on financial instruments


35


15


(31

)

Distributions paid to subsidiaries’ non-controlling interests (Note 11)


(84

)

(55

)

(59

)

Decrease in finance lease obligations (Note 22)


(10

)

(9

)

-


Other


-


(2

)

(6

)

Cash flow from (used in) financing activities


(503

)

(47

)

504


Cash flow from (used in) operating, investing, and financing activities


1


15


(24

)

Effect of translation on foreign currency cash


-


-


2


Increase (decrease) in cash and cash equivalents


1


15


(22

)

Cash and cash equivalents, beginning of year


42


27


49


Cash and cash equivalents, end of year


43


42


27


Cash income taxes paid


31


46


30


Cash interest paid


230


240


234


See accompanying notes.


92


TransAlta Corporation    2014 Annual Report


Notes to Consolidated Financial Statements

(Tabular amounts in millions of Canadian dollars, except as otherwise noted)


1.   Corporate Information


A.    Description of the Business

TransAlta Corporation (“TransAlta” or the “Corporation”) was incorporated under the Canada Business Corporations Act in March 1985. The Corporation became a public company in December 1992. Its head office is located in Calgary, Alberta.


The three reportable segments of the Corporation are as follows:


I.                       Generation

The Generation Segment owns and operates hydro, wind, natural gas- and coal-fired facilities, and related mining operations in Canada, the United States (“U.S.”), and Australia. Generation’s revenues are derived from the availability and production of electricity and steam as well as ancillary services such as system support. Starting in 2013, electricity sales made by the Corporation’s commercial and industrial group are assumed to be sourced from the Corporation’s production and have been included in the Generation Segment.


II.                    Energy Marketing

The Segment changed its name from “Energy Trading” in 2014 following a shift in focus toward lower risk revenue generation activities such as asset optimization, customer fee and margin-based growth, and arbitrage trading.


The Energy Marketing Segment derives revenue and earnings from the wholesale trading of electricity and other energy-related commodities and derivatives.


Energy Marketing manages available generating capacity as well as the fuel and transmission needs of the Generation Segment by utilizing contracts of various durations for the forward sales of electricity and for the purchase of natural gas and transmission capacity. Energy Marketing is also responsible for recommending portfolio optimization decisions. The results of these other activities are included in the Generation Segment.


III.                 Corporate

The Corporate Segment provides finance, tax, treasury, legal, regulatory, environmental, health and safety, sustainable development, corporate communications, government and investor relations, information technology, risk management, human resources, aboriginal relations, internal audit, and other administrative support to the Generation and Energy Marketing segments. Charges directly or reasonably attributable to other segments are allocated thereto.


B.    Basis of Preparation

These consolidated financial statements have been prepared by management in compliance with IFRS as issued by the International Accounting Standards Board (“IASB”).


The consolidated financial statements have been prepared on a historical cost basis except for financial instruments that are measured at fair value, as explained in the following accounting policies.


These consolidated financial statements were authorized for issue by the Board on Feb. 18, 2015.


C.    Basis of Consolidation

The consolidated financial statements include the accounts of the Corporation and the subsidiaries that it controls. Control exists when the Corporation is exposed, or has rights, to variable returns from its involvement with the subsidiary and has the ability to affect the returns through its power over the subsidiary. The financial statements of the subsidiaries are prepared for the same reporting period and apply consistent accounting policies as the parent company.


TransAlta Corporation    2014 Annual Report

93


Notes to Consolidated Financial Statements


2.   Significant Accounting Policies


A.    Revenue Recognition

The majority of the Corporation’s revenues are derived from the sale of physical power, leasing of power facilities, and from energy marketing and trading activities.


Revenues are measured at the fair value of the consideration received or receivable.


Revenues under long-term electricity and thermal sales contracts generally include one or more of the following components: fixed capacity payments for availability, energy payments for generation of electricity, incentives or penalties for exceeding or not meeting availability targets, excess energy payments for power generation above committed capacity, and ancillary services. Each component is recognized when: i) output, delivery, or satisfaction of specific targets is achieved, all as governed by contractual terms; ii) the amount of revenue can be measured reliably; iii) it is probable that the economic benefits will flow to the Corporation; and iv) the costs incurred or to be incurred in respect of the transaction can be measured reliably. Revenue from the rendering of services is recognized when criteria ii), iii), and iv) above are met and when the stage of completion of the transaction at the end of the reporting period can be measured reliably.


Revenues from non-contracted capacity are comprised of energy payments, at market prices, for each megawatt hour (“MWh”) produced, and are recognized upon delivery.


In certain situations, a long-term electricity or thermal sales contract may contain, or be considered, a lease. Revenues associated with non-lease elements are recognized as goods or services revenues as outlined above. Revenues associated with leases are recognized as outlined in Note 2(R).


Commodity risk management activities involve the use of derivatives such as physical and financial swaps, forward sales contracts, futures contracts, and options, which are used to earn revenues and to gain market information. These derivatives are accounted for using fair value accounting. The initial recognition and subsequent changes in fair value affect reported net earnings in the period the change occurs and are presented on a net basis in revenue. The fair values of instruments that remain open at the end of the reporting period represent unrealized gains or losses and are presented on the Consolidated Statements of Financial Position as risk management assets or liabilities. Some of the derivatives used by the Corporation in trading activities are not traded on an active exchange or have terms that extend beyond the time period for which exchange-based quotes are available. The fair values of these derivatives are determined using internal valuation techniques or models.


B.    Foreign Currency Translation

The Corporation, its subsidiary companies, and joint arrangements each determine their functional currency based on the currency of the primary economic environment in which they operate. The Corporation’s functional currency is the Canadian dollar while the functional currencies of the subsidiary companies and joint arrangements are either the Canadian, U.S., or Australian dollar. Transactions denominated in a currency other than the functional currency of an entity are translated at the exchange rate in effect on the transaction date. The resulting exchange gains and losses are included in each entity’s net earnings in the period in which they arise.


The Corporation’s foreign operations are translated to the Corporation’s presentation currency, which is the Canadian dollar, for inclusion in the consolidated financial statements. Foreign-denominated monetary and non-monetary assets and liabilities of foreign operations are translated at exchange rates in effect at the end of the reporting period and revenue and expenses are translated at exchange rates in effect on the transaction date. The resulting translation gains and losses are included in Other Comprehensive Income (Loss) (“OCI”) with the cumulative gain or loss reported in Accumulated Other Comprehensive Income (Loss) (“AOCI”). Amounts previously recognized in AOCI are recognized in net earnings when there is a reduction in a foreign net investment as a result of a disposal, partial disposal, or loss of control.


94


TransAlta Corporation    2014 Annual Report


Notes to Consolidated Financial Statements


C.    Financial Instruments and Hedges

I.                       Financial Instruments

Financial assets and financial liabilities, including derivatives and certain non-financial derivatives, are recognized on the Consolidated Statements of Financial Position when the Corporation becomes a party to the contract. All financial instruments, except for certain non-financial derivative contracts that meet the Corporation’s own use requirements, are measured at fair value upon initial recognition. Measurement in subsequent periods depends on whether the financial instrument has been classified as: at fair value through profit or loss, available-for-sale, held-to-maturity, loans and receivables, or other financial liabilities. Classification of the financial instrument is determined at inception depending on the nature and purpose of the financial instrument.


Financial assets and financial liabilities classified or designated as at fair value through profit or loss are measured at fair value with changes in fair values recognized in net earnings. Financial assets classified as either held-to-maturity or as loans and receivables, and other financial liabilities, are measured at amortized cost using the effective interest method of amortization.


Financial assets are assessed for impairment on an ongoing basis and at reporting dates. An impairment may exist if an incurred loss event has arisen that has an impact on the recoverability of the financial asset. Factors that may indicate an incurred loss event and related impairment may exist include, for example: a debtor is experiencing significant financial difficulty, or a debtor has or it is probable that they will enter bankruptcy or other financial reorganization. The carrying amount of financial assets, such as receivables, is reduced for impairment losses through the use of an allowance account, and the loss is recognized in net earnings.


Financial assets are derecognized when the contractual rights to receive cash flows expire. Financial liabilities are derecognized when the obligation is discharged, cancelled, or expired.


Financial assets and financial liabilities are offset and the net amount is reported in the Consolidated Statements of Financial Position if there is a currently enforceable legal right to offset the recognized amounts and there is an intention to settle on a net basis or to realize the assets and settle the liabilities simultaneously.


Derivative instruments that are embedded in financial or non-financial contracts that are not already required to be recognized at fair value are treated and recognized as separate derivatives if their risks and characteristics are not closely related to their host contracts and the contract is not measured at fair value. Changes in the fair values of these and other derivative instruments are recognized in net earnings with the exception of the effective portion of i) derivatives designated as cash flow hedges and ii) hedges of foreign currency exposure of a net investment in a foreign operation, each of which is recognized in OCI. Derivatives used in commodity risk management activities are described in more detail in Note 2(A).


Transaction costs are expensed as incurred for financial instruments classified or designated as at fair value through profit or loss. For other financial instruments, such as debt instruments, transaction costs are recognized as part of the carrying amount of the financial instrument. The Corporation uses the effective interest method of amortization for any transaction costs or fees, premiums, or discounts earned or incurred for financial instruments measured at amortized cost.


II.                    Hedges

Where hedge accounting can be applied and the Corporation chooses to seek hedge accounting treatment, a hedge relationship is designated as a fair value hedge, a cash flow hedge, or a hedge of foreign currency exposures of a net investment in a foreign operation. A hedging relationship qualifies for hedge accounting if, at inception, it is formally designated and documented as a hedge, and the hedge is expected to be highly effective at inception and on an ongoing basis. The documentation includes identification of the hedging instrument and hedged item or transaction, the nature of the risk being hedged, the Corporation’s risk management objectives and strategy for undertaking the hedge, and how hedge effectiveness will be assessed. The process of hedge accounting includes linking derivatives to specific recognized assets and liabilities or to specific firm commitments or highly probable anticipated transactions.


The Corporation formally assesses, both at the hedge’s inception and on an ongoing basis, whether the derivatives used are highly effective in offsetting changes in fair values or cash flows of hedged items. If hedge criteria are not met or the Corporation does not apply hedge accounting, the derivative is accounted for on the Consolidated Statements of Financial Position at fair value, with subsequent changes in fair value recorded in net earnings in the period of change.


TransAlta Corporation    2014 Annual Report

95


Notes to Consolidated Financial Statements


a.                   Fair Value Hedges

In a fair value hedging relationship, the carrying amount of the hedged item is adjusted for changes in fair value attributable to the hedged risk, with the changes being recognized in net earnings. Changes in the fair value of the hedged item, to the extent that the hedging relationship is effective, are offset by changes in the fair value of the hedging derivative, which is also recorded in net earnings. Hedge effectiveness for fair value hedges is achieved if changes in the fair value of the derivative are highly effective at offsetting changes in the fair value of the item hedged. If hedge accounting is discontinued, the carrying amount of the hedged item is no longer adjusted and the cumulative fair value adjustments to the carrying amount of the hedged item are amortized to net earnings over the remaining term of the original hedging relationship.


The Corporation primarily uses interest rate swaps as fair value hedges to manage the ratio of floating rate versus fixed rate debt. Interest rate swaps require the periodic exchange of payments without the exchange of the notional principal amount on which the payments are based. Interest expense on the debt is adjusted to include the payments made or received under the interest rate swaps.


b.                   Cash Flow Hedges

In a cash flow hedging relationship, the effective portion of the change in the fair value of the hedging derivative is recognized in OCI while any ineffective portion is recognized in net earnings. Hedge effectiveness is achieved if the derivative’s cash flows are highly effective at offsetting the cash flows of the hedged item and the timing of the cash flows is similar. All components of each derivative’s change in fair value are included in the assessment of cash flow hedge effectiveness. If hedge accounting is discontinued, the amounts previously recognized in AOCI are reclassified to net earnings during the periods when the variability in the cash flows of the hedged item affects net earnings. Gains and losses on derivatives are reclassified to net earnings from AOCI immediately when the forecasted transaction is no longer expected to occur within the time period specified in the hedge documentation.


The Corporation primarily uses physical and financial swaps, forward sales contracts, futures contracts, and options as cash flow hedges to hedge the Corporation’s exposure to fluctuations in electricity and natural gas prices. If hedging criteria are met, the fair values of the hedges are recorded in risk management assets or liabilities with changes in value being reported in OCI. Gains and losses on these derivatives are recognized, on settlement, in net earnings in the same period and financial statement caption as the hedged exposure.


The Corporation also uses foreign currency forward contracts as cash flow hedges to hedge the foreign exchange exposures resulting from highly probable forecasted project-related transactions denominated in foreign currencies. If the hedging criteria are met, changes in fair value are reported in OCI with the fair value being reported in risk management assets or liabilities, as appropriate. Upon settlement of the derivative, any gain or loss on the forward contracts is included in the cost of the asset acquired or liability incurred.


The Corporation uses forward starting interest rate swaps as cash flow hedges to hedge exposures to anticipated changes in interest rates for forecasted issuances of debt. If the hedging criteria are met, changes in fair value are reported in OCI with the fair value being reported in risk management assets or liabilities, as appropriate. When the swaps are closed out on issuance of the debt, the resulting gains or losses recorded in AOCI are amortized to net earnings over the term of the swap. If no debt is issued, the gains or losses are recognized in net earnings immediately.


c.                   Hedges of Foreign Currency Exposures of a Net Investment in a Foreign Operation

In hedging a foreign currency exposure of a net investment in a foreign operation, the effective portion of foreign exchange gains and losses on the hedging instrument is recognized in OCI and the ineffective portion is recognized in net earnings. The related fair values are recorded in risk management assets or liabilities, as appropriate. The amounts previously recognized in AOCI are recognized in net earnings when there is a reduction in the hedged net investment as a result of a disposal, partial disposal, or loss of control. The Corporation primarily uses foreign currency forward contracts and foreign-denominated debt to hedge exposure to changes in the carrying values of the Corporation’s net investments in foreign operations that result from changes in foreign exchange rates.


96


TransAlta Corporation    2014 Annual Report


Notes to Consolidated Financial Statements


D.    Cash and Cash Equivalents

Cash and cash equivalents are comprised of cash and highly liquid investments with original maturities of three months or less.


E.    Collateral Paid and Received

The terms and conditions of certain contracts may require the Corporation or its counterparties to provide collateral when the fair value of the obligation pursuant to these contracts is in excess of any credit limits granted. Downgrades in creditworthiness by certain credit rating agencies may decrease the credit limits granted and accordingly increase the amount of collateral that may have to be provided.


F.    Inventory

I.                       Fuel

The Corporation’s inventory balance is comprised of coal and natural gas used as fuel, which is measured at the lower of weighted average cost and net realizable value.


The cost of internally produced coal inventory is determined using absorption costing, which is defined as the sum of all applicable expenditures and charges directly incurred in bringing inventory to its existing condition and location. Available coal inventory tends to increase during the second and third quarters as a result of favourable weather conditions and lower electricity production as maintenance is performed. Due to the limited number of processing steps incurred in mining coal and preparing it for consumption and the relatively low value on a per-unit basis, management does not distinguish between work in process and coal available for consumption. The cost of natural gas and purchased coal inventory includes all applicable expenditures and charges incurred in bringing the inventory to its existing condition and location.


II.                    Energy Marketing

Commodity inventories held in the Energy Marketing Segment for trading purposes are measured at fair value less costs to sell. Changes in fair value less costs to sell are recognized in net earnings in the period of change.


G.   Property, Plant, and Equipment

The Corporation’s investment in property, plant, and equipment (“PP&E”) is initially measured at the original cost of each component at the time of construction, purchase, or acquisition. A component is a tangible portion of an asset that can be separately identified and depreciated over its own expected useful life, and is expected to provide a benefit for a period in excess of one year. Original cost includes items such as materials, labour, borrowing costs, and other directly attributable costs, including the initial estimate of the cost of decommissioning and restoration. Costs are recognized as PP&E assets if it is probable that future economic benefits will be realized and the cost of the item can be measured reliably.


The cost of major spare parts is capitalized and classified as PP&E, as these items can only be used in connection with an item of PP&E.


Planned maintenance is performed at regular intervals. Planned major maintenance includes inspection, repair, and maintenance of existing components, and the replacement of existing components. Costs incurred for planned major maintenance activities are capitalized in the period maintenance activities occur and are amortized on a straight-line basis over the term until the next major maintenance event. Expenditures incurred for the replacement of components during major maintenance are capitalized and amortized over the estimated useful life of such components.


The cost of routine repairs and maintenance and the replacement of minor parts are charged to net earnings as incurred.


Subsequent to initial recognition and measurement at cost, all classes of PP&E continue to be measured using the cost model and are reported at cost less accumulated depreciation and impairment losses, if any.


An item of PP&E or a component is derecognized upon disposal or when no future economic benefits are expected from its use or disposal. Any gain or loss arising on derecognition is included in net earnings when the asset is derecognized.


TransAlta Corporation    2014 Annual Report

97


Notes to Consolidated Financial Statements


The estimate of the useful lives of each component of PP&E is based on current facts and past experience, and takes into consideration existing long-term sales agreements and contracts, current and forecasted demand, and the potential for technological obsolescence. The useful life is used to estimate the rate at which the component of PP&E is depreciated. PP&E assets are subject to depreciation when the asset is considered to be available for use, which is typically upon commencement of commercial operations. Each significant component of an item of PP&E is depreciated to its residual value over its estimated useful life, using straight-line or unit-of-production methods. Estimated useful lives, residual values, and depreciation methods are reviewed annually and are subject to revision based on new or additional information. The effect of a change in useful life, residual value, or depreciation method is accounted for prospectively.


Estimated useful lives of the components of depreciable assets, categorized by asset class, are as follows:


Coal generation

3-50 years

Gas generation

2-30 years

Renewable generation

3-60 years

Mining property and equipment

4-50 years

Capital spares and other

2-50 years


TransAlta capitalizes borrowing costs on capital invested in projects under construction (see Note 2(S)). Upon commencement of commercial operations, capitalized borrowing costs, as a portion of the total cost of the asset, are depreciated over the estimated useful life of the related asset.


H.   Intangible Assets

Intangible assets acquired in a business combination are recognized separately from goodwill at their fair value at the date of acquisition. Intangible assets acquired separately are recognized at cost. Internally generated intangible assets arising from development projects are recognized when certain criteria related to the feasibility of internal use or sale, and probable future economic benefits of the intangible asset, are demonstrated. Intangible assets are initially recognized at cost, which is comprised of all directly attributable costs necessary to create, produce, and prepare the intangible asset to be capable of operating in the manner intended by management.


Subsequent to initial recognition, intangible assets continue to be measured using the cost model, and are reported at cost less accumulated amortization and impairment losses, if any. Amortization is included in depreciation and amortization and fuel and purchased power in the Consolidated Statements of Earnings (Loss).


Amortization commences when the intangible asset is available for use, and is computed on a straight-line basis over the intangible asset’s estimated useful life, except for coal rights, which are amortized using a unit-of-production basis, based on the estimated mine reserves. Estimated useful lives of intangible assets may be determined, for example, with reference to the term of the related contract or licence agreement. The estimated useful lives and amortization methods are reviewed annually with the effect of any changes being accounted for prospectively.


Intangible assets consist of power sale contracts with fixed prices higher than market prices at the date of acquisition, coal rights, software, and intangibles under development. Estimated useful lives of intangible assets are as follows:


Software

 2-7 years

Power contracts

1-30 years


I.     Impairment of Tangible and Intangible Assets Excluding Goodwill

At the end of each reporting period, the Corporation assesses whether there is any indication that PP&E and finite life intangible assets are impaired.


Factors that could indicate that an impairment exists include: significant underperformance relative to historical or projected operating results; significant changes in the manner in which an asset is used, or in the Corporation’s overall business strategy; or significant negative industry or economic trends. In some cases, these events are clear. However, in many cases, a clearly identifiable event indicating possible impairment does not occur. Instead, a series of individually insignificant events occurs over a period of time leading to an indication that an asset may be impaired. This can be further complicated in situations where the Corporation is not the operator of the facility. Events can occur in these situations that may not be known until a date subsequent to their occurrence.


98


TransAlta Corporation    2014 Annual Report


Notes to Consolidated Financial Statements


The Corporation’s operations, the market, and business environment are routinely monitored, and judgments and assessments are made to determine whether an event has occurred that indicates a possible impairment. If such an event has occurred, an estimate is made of the recoverable amount of the asset or cash-generating unit (“CGU”) to which the asset belongs. Recoverable amount is the higher of an asset’s fair value less costs of disposal and its value in use. Fair value is the price that would be received to sell an asset in an orderly transaction between market participants at the measurement date. In determining fair value, recent market transactions are taken into account. If no such transactions can be identified an appropriate valuation model such as discounted cash flows is used. Value in use is the present value of the estimated future cash flows expected to be derived from the asset from its continued use and ultimate disposal by the Corporation. If the recoverable amount is less than the carrying amount of the asset or CGU, an asset impairment loss is recognized in net earnings, and the asset’s carrying amount is reduced to its recoverable amount.


At each reporting date, an assessment is made whether there is any indication that an impairment loss previously recognized may no longer exist or may have decreased. If such indication exists, the recoverable amount of the asset or CGU to which the asset belongs is estimated and the impairment loss previously recognized is reversed if there has been an increase in the recoverable amount. Where an impairment loss is subsequently reversed, the carrying amount of the asset is increased to the lesser of the revised estimate of its recoverable amount or the carrying amount that would have been determined (net of depreciation) had no impairment loss been recognized previously. A reversal of an impairment loss is recognized in net earnings.


J.    Goodwill

Goodwill arising in a business combination is recognized as an asset at the date control is acquired. Goodwill is measured as the cost of an acquisition plus the amount of any non-controlling interest in the acquiree (if applicable) less the fair value of the related identifiable assets acquired and liabilities assumed.


Goodwill is not subject to amortization, but is tested for impairment at least annually, or more frequently, if an analysis of events and circumstances indicate that a possible impairment may exist. These events could include a significant change in financial position of the CGUs or groups of CGUs to which the goodwill relates or significant negative industry or economic trends. For impairment purposes, goodwill is allocated to each of the Corporation’s CGUs or groups of CGUs that are expected to benefit from the synergies of the business combination in which the goodwill arose. To test for impairment, the recoverable amount of the CGUs or groups of CGUs to which the goodwill relates is compared to its carrying amount. If the recoverable amount is less than the carrying amount, an impairment loss is recognized in net earnings immediately, by first reducing the carrying amount of the goodwill, and then by reducing the carrying amount of the other assets in the unit. An impairment loss recognized for goodwill is not reversed in subsequent periods.


K.   Project Development Costs

Project development costs include external, direct, and incremental costs that are necessary for completing an acquisition or construction project. These costs are recognized as operating expenses until construction of a plant or acquisition of an investment is likely to occur, there is reason to believe that future costs are recoverable, and that efforts will result in future value to the Corporation, at which time the costs incurred subsequently are included in other assets. The appropriateness of capitalization of these costs is evaluated each reporting period, and amounts capitalized for projects no longer probable of occurring are charged to net earnings.


L.               Income Taxes

The Corporation uses the liability method of accounting for income taxes. Under the liability method, deferred income tax assets and liabilities are recognized on the differences between the carrying amounts of assets and liabilities and their respective income tax basis (temporary differences). A deferred income tax asset may also be recognized for the benefit expected from unused tax credits and losses available for carryforward, to the extent that it is probable that future taxable earnings will be available against which the tax credits and losses can be applied. Deferred income tax assets and liabilities are measured based on income tax rates and tax laws that are enacted or substantively enacted by the end of the reporting period and that are expected to apply in the years in which temporary differences are expected to be realized or settled. Deferred income tax is charged or credited to net earnings, except when related to items charged or credited to either OCI or directly to equity. The carrying amount of deferred income tax assets is evaluated at the end of each reporting period and is reduced to the extent that it is no longer probable that sufficient taxable income will be available to allow all or part of the asset to be realized.


Deferred income tax liabilities are recognized for taxable temporary differences arising on investments in subsidiaries, except where the Corporation is able to control the reversal of the temporary difference and it is probable that the temporary difference will not reverse in the foreseeable future.


TransAlta Corporation    2014 Annual Report

99


Notes to Consolidated Financial Statements


M.   Employee Future Benefits

The Corporation has defined benefit pension and other post-employment benefit plans. The current service cost of providing benefits under the defined benefit plans is determined using the projected unit credit method pro-rated based on service. The net interest cost is determined by applying the discount rate to the net defined benefit liability. The discount rate used to determine the present value of the defined benefit obligation, and the net interest cost, is determined by reference to market yields at the end of the reporting period on high-quality corporate bonds with terms and currencies that match the estimated terms and currencies of the benefit obligations. Re-measurements, which include actuarial gains and losses and the return on plan assets (excluding net interest), are recognized through OCI in the period in which they occur. Actuarial gains and losses arise from experience adjustments and changes in actuarial assumptions. Re-measurements are not reclassified to profit or loss, from OCI, in subsequent periods.


Gains or losses arising from either a curtailment or settlement of a defined benefit plan are recognized when the curtailment or settlement occurs. When the restructuring of a benefit plan gives rise to a curtailment and a settlement of obligations, the curtailment is accounted for prior to the settlement.


In determining whether statutory minimum funding requirements of the Corporation’s defined benefit pension plans give rise to recording an additional liability, letters of credit provided by the Corporation as security are considered to alleviate the funding requirements. No additional liability results in these circumstances.


Contributions payable under defined contribution pension plans are recognized as a liability and an expense in the period in which the services are rendered.


N.    Provisions

Provisions are recognized when the Corporation has a present obligation (legal or constructive) as a result of a past event, it is probable that the Corporation will be required to settle the obligation, and a reliable estimate can be made of the amount of the obligation. A legal obligation can arise through a contract, legislation, or other operation of law. A constructive obligation arises from an entity’s actions whereby through an established pattern of past practice, published policies, or a sufficiently specific current statement, the entity has indicated it will accept certain responsibilities and has thus created a valid expectation that it will discharge those responsibilities. The amount recognized as a provision is the best estimate, remeasured at each period-end, of the expenditures required to settle the present obligation, considering the risks and uncertainties associated with the obligation. Where expenditures are expected to be incurred in the future, the obligation is measured at its present value using a current market-based, risk-adjusted interest rate.


The Corporation records a decommissioning and restoration provision for all generating facilities and mine sites for which it is legally or constructively required to remove the facilities at the end of their useful lives and restore the plant or mine sites. For some hydro facilities, the Corporation is required to remove the generating equipment, but is not required to remove the structures. Initial decommissioning provisions are recognized at their present value when incurred. Each reporting date, the Corporation determines the present value of the provision using the current discount rates that reflect the time value of money and associated risks. The Corporation recognizes the initial decommissioning and restoration provisions, as well as changes resulting from revisions to cost estimates and period-end revisions to the market-based, risk-adjusted discount rate, as a cost of the related PP&E (see Note 2(G)). The accretion of the net present value discount is charged to net earnings each period and is included in net interest expense. Where the Corporation expects to receive reimbursement from a third party for a portion of future decommissioning costs, the reimbursement is recognized as a separate asset when it is virtually certain that the reimbursement will be received. Decommissioning and restoration obligations for coal mines are incurred over time, as new areas are mined, and a portion of the provision is settled over time as areas are reclaimed prior to final pit reclamation. Reclamation costs for mining assets are recognized on a unit-of-production basis.


Changes in other provisions resulting from revisions to estimates of expenditures required to settle the obligation or period-end revisions to the market-based, risk-adjusted discount rate are recognized in net earnings. The accretion of the net present value discount is charged to net earnings each period and is included in net interest expense.


100


TransAlta Corporation    2014 Annual Report


Notes to Consolidated Financial Statements


O.   Share-Based Payments

The Corporation measures share-based awards compensation expense at grant date fair value and recognizes the expense over the vesting period based on the Corporation’s estimate of the number of units that will eventually vest. Any award that vests in instalments is accounted for as a separate award with its own distinct fair value measurement.


Compensation expense associated with equity-settled and cash-settled awards are recognized within equity and liability, respectively. The liability associated with cash-settled awards is remeasured to fair value at each reporting date up to, and including, the settlement date, with changes in fair value recognized within compensation expense.


P.    Emission Credits and Allowances

Emission credits and allowances are recorded as inventory at cost. Those purchased for use by the Corporation are recorded at cost and are carried at the lower of weighted average cost and net realizable value. Credits granted to, or internally generated by, TransAlta are recorded at nil. Emission liabilities are recorded using the best estimate of the amount required by the Corporation to settle its obligation in excess of government-established caps and targets. To the extent compliance costs are recoverable under the terms of contracts with third parties the amounts are recognized as revenue in the period of recovery.


Emission credits and allowances that are held for trading and that meet the definition of a derivative are accounted for using the fair value method of accounting. Allowances that do not satisfy the criteria of a derivative are accounted for using the accrual method.


Q.   Assets Held for Sale

Assets are classified as held for sale if their carrying amount will be recovered primarily through a sale as opposed to continued use by the Corporation. Assets classified as held for sale are measured at the lower of their carrying amount and fair value less costs of disposal. Any impairment is recognized in net earnings. Depreciation and equity accounting ceases when an asset or equity investment, respectively, is classified as held for sale. Assets classified as held for sale are reported as current assets in the Consolidated Statements of Financial Position.


R.    Leases

A lease is an arrangement whereby the lessor conveys to the lessee, in return for a payment or series of payments, the right to use an asset for an agreed period of time.


Power purchase arrangements (“PPA”) and other long-term contracts may contain, or may be considered, leases where the fulfillment of the arrangement is dependent on the use of a specific asset (e.g. a generating unit) and the arrangement conveys to the customer the right to use that asset.


Where the Corporation determines that the contractual provisions of a contract contain, or are, a lease and result in the customer assuming the principal risks and rewards of ownership of the asset, the arrangement is a finance lease. Assets subject to finance leases are not reflected as PP&E and the net investment in the lease, represented by the present value of the amounts due from the lessee, is recorded in the Consolidated Statements of Financial Position as a financial asset, classified as a finance lease receivable. The payments considered to be part of the leasing arrangement are apportioned between a reduction in the lease receivable and finance lease income. The finance lease income element of the payments is recognized using a method that results in a constant rate of return on the net investment in each period and is reflected in finance lease income on the Consolidated Statements of Earnings (Loss).


Where the Corporation determines that the contractual provisions of a contract contain, or are, a lease and result in the Corporation retaining the principal risks and rewards of ownership of the asset, the arrangement is an operating lease. For operating leases, the asset is, or continues to be, capitalized as PP&E and depreciated over its useful life. Rental income, including contingent rent, from operating leases is recognized over the term of the arrangement and is reflected in revenue on the Consolidated Statements of Earnings (Loss). Contingent rent may arise when payments due under the contract are not fixed in amount but vary based on a future factor such as the amount of use or production.


Leasing or other contractual arrangements that transfer substantially all of the risks and rewards of ownership to the Corporation are considered finance leases. A leased asset and lease obligation are recognized at the lower of the fair value or the present value of the minimum lease payments. Lease payments are apportioned between interest expense and a reduction of the lease liability. Contingent rents are charged as expenses in the periods incurred. The leased asset is depreciated over the shorter of the estimated useful life of the asset and the lease term.


TransAlta Corporation    2014 Annual Report

101


Notes to Consolidated Financial Statements


S.    Borrowing Costs

TransAlta capitalizes borrowing costs that are directly attributable to, or relate to general borrowings used for, the construction of qualifying assets. Qualifying assets are assets that take a substantial period of time to prepare for their intended use and typically include generating facilities or other assets that are constructed over periods of time exceeding 12 months. Borrowing costs are considered to be directly attributable if they could have been avoided if the expenditure on the qualifying asset had not been made. Borrowing costs that are capitalized are included in the cost of the related PP&E component. Capitalization of borrowing costs ceases when substantially all the activities necessary to prepare the asset for its intended use are complete.


All other borrowing costs are expensed in the period in which they are incurred.


T.               Non-Controlling Interests

Non-controlling interests arise from business combinations in which the Corporation acquires less than a 100 per cent interest. Non-controlling interests are initially measured at either fair value or at the non-controlling interest’s proportionate share of the acquiree’s identifiable net assets. The Corporation determines on a transaction by transaction basis which measurement method is used.


Non-controlling interests also arise from other contractual arrangements between the Corporation and other parties, whereby the other party has acquired an interest in a specified asset or operation, and the Corporation retains control.


Subsequent to acquisition, the carrying amount of non-controlling interests is increased or decreased by the non-controlling interest’s share of subsequent changes in equity and payments to the non-controlling interest. Total comprehensive income is attributed to the non-controlling interests even if this results in the non-controlling interests having a negative balance.


U.              Joint Arrangements

A joint arrangement is a contractual arrangement that establishes the terms by which two or more parties agree to undertake and jointly control an economic activity. TransAlta’s joint arrangements are generally classified as two types: joint operations and joint ventures.


A joint operation arises when the parties that have joint control have rights to the assets, and obligations for the liabilities, relating to the arrangement. Generally, each party takes a share of the output from the asset and each bears an agreed upon share of the costs incurred in respect of the joint operation. The Corporation reports its interests in joint operations in its consolidated financial statements using the proportionate consolidation method by recognizing its share of the assets, liabilities, revenues, and expenses in respect of its interest in the joint operation.


In a joint venture, the venturers do not have rights to individual assets or obligations of the venture. Rather, each venturer has rights to the net assets of the arrangement. The Corporation reports its interests in joint ventures using the equity method. Under the equity method, the investment is initially recognized at cost and the carrying amount is increased or decreased to recognize the Corporation’s share of the joint venture’s net earnings or loss after the date of acquisition. The impact of transactions between the Corporation and joint ventures is eliminated based on the Corporation’s ownership interest. Distributions received from joint ventures reduce the carrying amount of the investment. Any excess of the cost of an acquisition less the fair value of the recognized identifiable assets, liabilities, and contingent liabilities of an acquired joint venture is recognized as goodwill and is included in the carrying amount of the investment and is assessed for impairment as part of the investment.


Investments in joint ventures are evaluated for impairment at each reporting date by first assessing whether there is objective evidence that the investment is impaired. If such objective evidence is present, an impairment loss is recognized if the investment’s recoverable amount is less than its carrying amount. The investment’s recoverable amount is determined as the higher of value in use and fair value less costs of disposal.


V.              Government Incentives

Government incentives are recognized when the Corporation has reasonable assurance that it will comply with the conditions associated with the incentive and that the incentive will be received. When the incentive relates to an expense item, it is recognized in net earnings over the same period in which the related costs or revenues are recognized. When the incentive relates to an asset, it is recognized as a reduction of the carrying amount of PP&E and released to earnings as a reduction in depreciation over the expected useful life of the related asset.


102


TransAlta Corporation    2014 Annual Report


Notes to Consolidated Financial Statements


W.          Earnings per Share

Basic earnings per share is calculated by dividing net earnings attributable to common shareholders by the weighted average number of common shares outstanding in the year.


Diluted earnings per share is calculated by dividing net earnings attributable to common shareholders, adjusted for the aftertax effects of dividends, interest or other changes in net earnings that would result from potential dilutive instruments, by the weighted average number of common shares outstanding in the year, adjusted for additional common shares that would have been issued on the conversion of all potential dilutive instruments.


X.              Business Combinations

Transactions in which the acquisition constitutes a business are accounted for using the acquisition method. Identifiable assets acquired and liabilities assumed are measured at their acquisition-date fair values. Goodwill is measured as the excess of the fair value of consideration transferred less the fair value of the identifiable assets acquired and liabilities assumed.


Acquisition-related costs to effect the business combination, with the exception of costs to issue debt or equity securities, are recognized in net earnings as incurred.


Y.              Stripping Costs

A mine stripping activity asset is recognized when all of the following are met: i) it is probable that the future benefit associated with improved access to the coal reserves associated with the stripping activity will be realized; ii) the component of the coal reserve to which access has been improved can be identified; and iii) the costs related to the stripping activity associated with that component can be measured reliably. Costs include those directly incurred to perform the stripping activity as well as an allocation of directly attributable overheads. The resulting stripping activity asset is amortized on a unit-of-production basis over the expected useful life of the identified component that it relates to. The amortization is recognized as a component of the standard cost of coal inventory.


Z.               Significant Accounting Judgments and Key Sources of Estimation Uncertainty

The preparation of financial statements requires management to make judgments, estimates and assumptions that could affect the reported amounts of assets, liabilities, revenues, expenses, and disclosures of contingent assets and liabilities during the period. These estimates are subject to uncertainty. Actual results could differ from those estimates due to factors such as fluctuations in interest rates, foreign exchange rates, inflation and commodity prices, and changes in economic conditions, legislation, and regulations.


In the process of applying the Corporation’s accounting policies, management has to make judgments and estimates about matters that are highly uncertain at the time the estimate is made and that could significantly affect the amounts recognized in the consolidated financial statements. Different estimates with respect to key variables used in the calculations, or changes to estimates, could potentially have a material impact on the Corporation’s financial position or performance. The key judgments and sources of estimation uncertainty are described below:


I.       Impairment of PP&E and Goodwill

Impairment exists when the carrying amount of an asset, CGU or group of CGUs to which goodwill relates exceeds its recoverable amount, which is the higher of its fair value less costs of disposal and its value in use. An assessment is made at each reporting date as to whether there is any indication that an impairment loss may exist or that a previously recognized impairment loss may no longer exist or may have decreased. In determining fair value less costs of disposal, information about third-party transactions for similar assets is used and if none is available, other valuation techniques, such as discounted cash flows, are used. Value in use is computed using the present value of management’s best estimates of future cash flows based on the current use and present condition of the asset. In estimating either fair value less costs of disposal or value in use using discounted cash flow methods, estimates and assumptions must be made about sales prices, cost of sales, production, fuel consumed, capital expenditures, retirement costs, and other related cash inflows and outflows over the life of the facilities, which can range from 30 to 60 years. In developing these assumptions, management uses estimates of contracted and future market prices based on expected market supply and demand in the region in which the plant operates, anticipated production levels, planned and unplanned outages, changes to regulations, and transmission capacity or constraints for the remaining life of the facilities. Discount rates are determined by employing a weighted average cost of capital methodology that is based on


TransAlta Corporation   |   2014 Annual Report


103


Notes to Consolidated Financial Statements


capital structure, cost of equity, and cost of debt assumptions based on comparable companies with similar risk characteristics and market data as the asset, CGU or group of CGUs subject to the test. These estimates and assumptions are susceptible to change from period to period and actual results can, and often do, differ from the estimates, and can have either a positive or negative impact on the estimate of the impairment charge, and may be material. Information regarding determinations of CGUs for asset and goodwill impairment testing can be found in Notes 6 and 18. Key assumptions used in determining the 2014 and 2012 recoverable amount of the Centralia coal plant and the 2012 recoverable amount of Sundance Units 1 and 2 are further explained in Note 6.


II.      Leases

In determining whether the Corporation’s PPAs and other long-term electricity and thermal contracts contain, or are, leases, management must use judgment in assessing whether the fulfillment of the arrangement is dependent on the use of a specific asset and the arrangement conveys the right to use the asset. For those agreements considered to contain, or be, leases, further judgment is required to determine whether substantially all of the significant risks and rewards of ownership are transferred to the customer or remain with the Corporation, to appropriately account for the agreement as either a finance or operating lease. These judgments can be significant and impact how the Corporation classifies amounts related to the arrangement as either PP&E or as a finance lease receivable on the Consolidated Statements of Financial Position, and therefore the amount of certain items of revenue and expense is dependent upon such classifications.


III.     Income Taxes

Preparation of the consolidated financial statements involves determining an estimate of, or provision for, income taxes in each of the jurisdictions in which the Corporation operates. The process also involves making an estimate of income taxes currently payable and income taxes expected to be payable or recoverable in future periods, referred to as deferred income taxes. Deferred income taxes result from the effects of temporary differences due to items that are treated differently for tax and accounting purposes. The tax effects of these differences are reflected in the Consolidated Statements of Financial Position as deferred income tax assets and liabilities. An assessment must also be made to determine the likelihood that the Corporation’s future taxable income will be sufficient to permit the recovery of deferred income tax assets. To the extent that such recovery is not probable, deferred income tax assets must be reduced. Management uses the Corporation’s long-range forecasts as a basis for evaluation of recovery of deferred income tax assets. Management must exercise judgment in its assessment of continually changing tax interpretations, regulations, and legislation to ensure deferred income tax assets and liabilities are complete and fairly presented. Differing assessments and applications than the Corporation’s estimates could materially impact the amounts recognized for deferred income tax assets and liabilities.


IV.    Financial Instruments and Derivatives

The Corporation’s financial instruments and derivatives are accounted for at fair value, with the initial and subsequent changes in fair value affecting earnings in the period the change occurs. The fair values of financial instruments and derivatives are classified within three levels, with Level III fair values determined using inputs for the asset or liability that are not readily observable. These fair value levels are outlined and discussed in more detail in Note 13. Some of the Corporation’s fair values are included in Level III because they are not traded on an active exchange or have terms that extend beyond the time period for which exchange-based quotes are available and require the use of internal valuation techniques or models to determine fair value. The determination of the fair value of these contracts and derivative instruments can be complex and relies on judgments and estimates concerning future prices, volatility, and liquidity, among other factors. These fair value estimates may not necessarily be indicative of the amounts that could be realized or settled, and changes in these assumptions could affect the reported fair value of financial instruments. Fair values can fluctuate significantly and can be favourable or unfavourable depending on current market conditions. Judgment is also used in determining whether a highly probable forecasted transaction designated in a cash flow hedge is expected to occur based on the Corporation’s estimates of pricing and production to allow the future transaction to be fulfilled.


V.     Joint Control

In January 2014, the Corporation, through a wholly owned subsidiary, formed an unincorporated joint venture named Fortescue River Gas Pipeline, of which it has a 43 per cent interest. Management, using judgment, assessed whether the Corporation’s sole partner had control over the joint venture, or whether joint control existed. The contractual terms of the joint venture agreement and the management agreement were reviewed and management concluded that joint control exists as decisions regarding the relevant activities of the joint venture require a special majority vote (at least 70 per cent in favour). Accordingly, the business is accounted for as a joint operation.


104


TransAlta Corporation   |   2014 Annual Report


Notes to Consolidated Financial Statements


VI.    Project Development Costs

Project development costs are capitalized in accordance with the accounting policy in Note 2(K). Management is required to use judgment to determine if there is reason to believe that future costs are recoverable, and that efforts will result in future value to the Corporation, in determining the amount to be capitalized.


VII.   Provisions for Decommissioning and Restoration Activities

TransAlta recognizes provisions for decommissioning and restoration obligations as outlined in Note 2(N) and Note 21. Initial decommissioning provisions, and subsequent changes thereto, are determined using the Corporation’s best estimate of the required cash expenditures, adjusted to reflect the risks and uncertainties inherent in the timing and amount of settlement. The estimated cash expenditures are present valued using a current, risk-adjusted, market-based, pre-tax discount rate. A change in estimated cash flows, market interest rates, or timing could have a material impact on the carrying amount of the provision.


VIII.  Useful Life of PP&E

Each significant component of an item of PP&E is depreciated over its estimated useful life. Estimated useful lives are determined based on current facts and past experience, and take into consideration the anticipated physical life of the asset, existing long-term sales agreements and contracts, current and forecasted demand, the potential for technological obsolescence, and regulations. The useful lives of PP&E are reviewed at least annually to ensure they continue to be appropriate.


IX.    Employee Future Benefits

The Corporation provides pension and other post-employment benefits, such as health and dental benefits, to employees. The cost of providing these benefits is dependent upon many factors, including actual plan experience and estimates and assumptions about future experience.


The liability for pension and post-employment benefits and associated costs included in annual compensation expenses are impacted by estimates related to:

§        employee demographics, including age, compensation levels, employment periods, the level of contributions made to the plans, and earnings on plan assets;

§        the effects of changes to the provisions of the plans; and

§        changes in key actuarial assumptions, including rates of compensation and health-care cost increases, and discount rates.


Due to the complexity of the valuation of pension and post-employment benefits, a change in the estimate of any one of these factors could have a material effect on the carrying amount of the liability for pension and other post-employment benefits or the related expense. These assumptions are reviewed annually to ensure they continue to be appropriate.


X.     Other Provisions

Where necessary, TransAlta recognizes provisions arising from ongoing business activities, such as interpretation and application of contract terms, ongoing litigation, and force majeure claims. These provisions, and subsequent changes thereto, are determined using the Corporation’s best estimate of the outcome of the underlying event and can also be impacted by determinations made by third parties, in compliance with contractual requirements. The actual amount of the provisions that may be required could differ materially from the amount recognized.


TransAlta Corporation   |   2014 Annual Report

105


Notes to Consolidated Financial Statements


3.              Accounting Changes


A.              Adoption of New or Amended IFRS

On Jan. 1, 2014, the Corporation adopted the following new or amended accounting standards and interpretations that were previously issued by the IASB. There was no impact of adopting these on the consolidated financial statements.


I.       Offsetting Financial Assets and Financial Liabilities – IAS 32 Financial Instruments: Presentation

The amendments clarify the existing guidance on offsetting financial assets and financial liabilities due to the diversity in application of the requirements.


II.      Recoverable Amount Disclosures for Non-Financial Assets – IAS 36 Impairment of Assets

The amendments remove the unintended consequences that IFRS 13 Fair Value Measurement had on the disclosures required under IAS 36 and require disclosure of the recoverable amounts for assets or CGUs for which a significant impairment loss has been recognized or reversed. The amendment was evaluated for application retrospectively from the date of initial application of IFRS 13 Fair Value Measurement, Jan. 1, 2013.


B.               Other Current Accounting Changes

I.       Inception Gains and Losses

The Corporation restated the Consolidated Statement of Financial Position as at Dec. 31, 2013 to reclassify the inception gains or losses arising from differences between the fair value of a financial instrument at initial recognition (the transaction price) and the amount calculated through a valuation model. These amounts were previously reported as gross contra-risk management assets or liabilities. The adjustment reclassifies them as direct offsets to the value of the derivative contract to which they relate. As a result of the adjustment, long-term risk management assets and long-term risk management liabilities were each reduced by $160 million at Dec. 31, 2013. Corresponding adjustments to the Dec. 31, 2012 Consolidated Statement of Financial Position were immaterial. Refer to Note 13(C) for further information on inception gains and losses.


II.      Inventory Writedown

The Corporation restated the Consolidated Statements of Earnings (Loss) for the years ended Dec. 31, 2013 and 2012 to reclassify inventory writedown as a component of fuel and purchased power. These amounts were previously reported as standalone components of operating income. The adjustment is intended to better capture within gross margin the generally offsetting effects that changes in future power prices have on mark-to-market gains or losses from economic forward power sale hedges, included in revenue, and on inventory writedown or reversals. As a result of the adjustment, fuel and purchased power for the years ended Dec. 31, 2013 and 2012 increased by $22 million and $44 million, respectively. The inventory writedown for the year ended Dec. 31, 2014 was $19 million.


III.     Net Other Operating Income and Losses

The Corporation restated the Consolidated Statements of Earnings (Loss) for the years ended Dec. 31, 2013 and 2012 to reclassify the losses associated with the California claim, the Sundance Units 1 and 2 return to service, and the assumption of pension obligations, as well as gains from insurance recoveries, as a net other operating income and losses group within operating income. Previously, each item was presented in earnings outside of operating income. The Corporation initiated the change as part of its ongoing monitoring of practices concerning additional IFRS measures. As a result of the change, operating income (loss) for the years ended Dec. 31, 2013 and 2012 decreased by $102 million and $254 million, respectively.


106


TransAlta Corporation   |   2014 Annual Report


Notes to Consolidated Financial Statements


C.              Comparative Figures

Certain comparative figures have been reclassified to conform to the current period’s presentation. These reclassifications did not impact previously reported net earnings.


D.              Future Accounting Changes

Accounting standards that have been previously issued by the IASB, but are not yet effective and have not been applied by the Corporation, include:


I.       IFRS 9 Financial Instruments

In July 2014, on completion of the impairment phase of the project to reform accounting for financial instruments and replace IAS 39 Financial Instruments: Recognition and Measurement, the IASB issued the final version of IFRS 9 Financial Instruments. IFRS 9 includes guidance on the classification and measurement of financial assets and financial liabilities, impairment of financial assets (i.e. recognition of credit losses), and a new hedge accounting model.


Under the classification and measurement requirements for financial assets, financial assets must be classified and measured at either amortized cost or at fair value through profit or loss or through OCI, depending on the basis of the entity’s business model for managing the financial asset and the contractual cash flow characteristics of the financial asset.


The classification requirements for financial liabilities are unchanged from IAS 39. IFRS 9 requirements address the problem of volatility in net earnings arising from an issuer choosing to measure certain liabilities at fair value and require that the portion of the change in fair value due to changes in the entity’s own credit risk be presented in OCI, rather than within net earnings.


The new general hedge accounting model is intended to be simpler and more closely focus on how an entity manages its risks, replaces the IAS 39 effectiveness testing requirements with the principle of an economic relationship, and eliminates the requirement for retrospective assessment of hedge effectiveness.


The new requirements for impairment of financial assets introduce an expected loss impairment model that requires more timely recognition of expected credit losses. IAS 39 impairment requirements are based on an incurred loss model where credit losses are not recognized until there is evidence of a trigger event.


IFRS 9 is effective for annual periods beginning on or after Jan. 1, 2018 with early application permitted. The Corporation is assessing the impact of adopting this standard on its consolidated financial statements.


II.      IFRS 15 Revenue from Contracts with Customers

In May 2014, the IASB issued IFRS 15 Revenue from Contracts with Customers, which replaces existing revenue recognition guidance with a single comprehensive accounting model. The model specifies that an entity recognizes revenue when it transfers promised goods or services to customers in an amount that reflects the consideration to which it expects to be entitled in exchange for those goods or services. IFRS 15 is effective for annual reporting periods beginning on or after Jan. 1, 2017 with early application permitted. The Corporation is assessing the impact of adopting this standard on its consolidated financial statements.


TransAlta Corporation   |   2014 Annual Report

107


Notes to Consolidated Financial Statements


4.              Acquisitions and Disposals


During 2012, 2013, and 2014, the following acquisitions and disposals took place in the Generation Segment:


A.              Acquisitions

I.       2013

On Dec. 20, 2013, the Corporation completed the acquisition of a 144 megawatt (“MW”) wind farm in Wyoming (“Wyoming wind farm”) from an affiliate of NextEra Energy Resources, LLC. The total cash consideration transferred was U.S.$102 million ($109 million). The acquisition was TransAlta’s first wind project in the U.S.


At the acquisition date, the fair value of assets acquired and liabilities assumed was as follows:


Assets:


Property, plant, and equipment


79


Intangible assets


20


Goodwill


13


Total assets acquired


112


Liabilities:


Decommissioning and restoration provision


3


Total consideration transferred


109


Goodwill arose in the acquisition primarily as a result of the expectation by the Corporation of future market growth and development opportunities in the region. These benefits are not recognized separately from goodwill as they do not meet the recognition criteria for identifiable intangible assets. All of the goodwill is expected to be deductible for tax purposes.


II.      2012

On Sept. 28, 2012, the Corporation acquired the 125 MW Solomon power station located in Western Australia from Fortescue Metals Group Ltd. (“Fortescue”) for U.S.$318 million. The facility is fully contracted with Fortescue under a long-term Power Purchase Agreement (“Agreement”) with an initial term of 16 years commencing in October 2012, after which Fortescue will have the option to either extend the Agreement for an additional five years under the same terms or to acquire the facility. The Corporation has accounted for the facility and associated Agreement as a finance lease with TransAlta being the lessor (see Note 7).


B.               Disposals

I.       2014

On June 12, 2014, the Corporation closed the sale of its 50 per cent ownership of CE Generation, LLC (“CE Gen”), CalEnergy LLC, and the Blackrock development project to MidAmerican Renewables for gross proceeds of U.S.$200.5 million. The original consideration of U.S.$188.5 million was increased as a result of a U.S.$12 million contribution made by the Corporation in May 2014. As a result of the sale, the Corporation recognized a pre-tax gain of $1 million ($2 million after-tax) as part of gain on sale of assets.


On Nov. 25, 2014, the Corporation closed the sale of its 50 per cent ownership of Wailuku Holding Company, LLC for gross proceeds of U.S.$5 million. A pre-tax gain of $1 million ($1 million after-tax) was recognized as part of gain on sale of assets.


The gains include reclassified cumulative translation gains of $7 million on the divested net assets, offset by related cumulative after-tax losses of $7 million from the related net investment hedge.


II.      2013

During 2013, the Corporation realized a pre-tax gain of $10 million relating to the sale of land and a pre-tax gain of $2 million relating to the sale of British Columbia water rights.


108


TransAlta Corporation   |   2014 Annual Report


Notes to Consolidated Financial Statements


5.              Expenses by Nature


Expenses classified by nature are as follows:


Year ended Dec. 31


2014


2013


2012


(Restated)*


(Restated)*


Operations,


Operations,


Operations,


Fuel and


maintenance,


Fuel and


maintenance,


Fuel and


maintenance,


purchased


and


purchased


and


purchased


and


power


administration


power


administration


power


administration


Fuel


937


778


645


Coal inventory writedown


19


22


44


Purchased power


75


85


63


Mine depreciation


56


58


41


Salaries and benefits


5


280


5


251


4


261


Other operating expenses


262


265


238


Total


1,092


542


948


516


797


499


*               See Note 3(B) for prior period restatements.


6.              Asset Impairment Charges and Reversals


All impairment charges and reversals are reported in the Generation Segment.


A.              2014

I.                     Centralia Coal

As at Nov. 30, 2014, the Corporation identified the decrease in projected growth in Mid-Columbia power prices as an indicator that the Centralia coal CGU could be impaired. The Centralia coal CGU’s carrying amount at that date, net of associated long-term liabilities, was $372 million. The Corporation estimated the fair value less costs of disposal of the CGU, a Level III fair value measurement, utilizing the Corporation’s long-range forecast and the following key assumptions:


Mid-Columbia annual average power prices

U.S.$31.00 to 52.00 per MWh

On-highway diesel fuel on coal shipments

U.S.$3.06 to 3.37 per gallon

Discount rates

5.1 to 6.2 per cent


The valuation is subject to measurement uncertainty based on those assumptions, and on inputs to the Corporation’s long-range forecast, including changes to fuel costs, operating costs, capital expenses, and the level of contractedness under the Memorandum of Agreement for coal transition established with the State of Washington. The valuation period extended to the assumed decommissioning of the asset, after its projected cessation of operation in its current form in 2025.


Fair value less costs of disposal of the CGU was estimated to approximate its carrying amount, and accordingly, no impairment charge was recorded. Any adverse change in assumptions, in isolation, would have resulted in an impairment charge being recorded. The Corporation continues to manage risks associated with the CGU through optimization of its operating activities and capital plan.


II.                  Centralia Gas

During 2014, the Corporation sold to external counterparties and transferred to other owned facilities for productive use, assets of the Centralia gas facility, which had been fully impaired and had remained idled since 2010. As a result of the transactions, the Corporation recognized pre-tax impairment reversals of $5 million.


TransAlta Corporation   |   2014 Annual Report

109


Notes to Consolidated Financial Statements


B.               2013

I.                     Alberta Merchant

As part of the annual impairment review and assessment process in 2013, it was determined that the Corporation’s Alberta plants that have significant merchant capacity should be considered one cash-generating unit (the “Alberta Merchant CGU”). Previously, each plant was assessed for impairment individually. The reasons for this change include consideration of the final regulations published by the Canadian federal government in September 2012 governing greenhouse gas emissions and the 50-year total life for Canadian coal-fired power plants; and the Corporation’s refinement of its risk management approach and practices regarding its Alberta wholesale market price exposure. The final regulations confirmed additional operating time and increased flexibility for the Corporation’s Alberta coal plants and led, in part, to the Corporation broadening its view on the management of its Alberta wholesale market price exposure.


The Corporation reversed previous pre-tax impairment losses of $23 million on various renewables plants that became part of the Alberta Merchant CGU. The Alberta Merchant CGU’s recoverable amount was based on an estimate of fair value less costs of disposal using a discounted cash flow methodology, based on the Corporation’s long-range forecasts and prices evidenced in the marketplace. Due to a substantial excess of fair value over net book value at other plants included within the Alberta Merchant CGU, valuation assumptions and methodologies were not a significant driver of the impairment reversals.


II.                  Renewables

During 2013, the Corporation recognized a total pre-tax impairment charge of $4 million related to three contracted hydro assets. The assets were impaired primarily due to an increase in future capital and operating expenses that resulted from the completion of condition assessments. The annual impairment assessments were based on estimates of fair value less costs of disposal derived from long-range forecasts.


C.              2012

I.                     Sundance Units 1 and 2

During 2012, the Corporation reversed $41 million of the $43 million impairment losses previously taken on Sundance Units 1 and 2. The reversal arose as a result of the additional years of merchant operations expected to be realized at Units 1 and 2 due to amendments to Canadian federal regulations requiring that coal-fired plants be shut down after a maximum of 50 years of operation. The previous draft regulations proposed shutdown after 45 years. The impairment assessment was based on an estimate of fair value less costs of disposal, derived from the cash flows expected to result over the revised useful life of the Units, taking into consideration the provisions of the PPA and prices evidenced in the marketplace.


II.                  Centralia Coal

The TransAlta Energy Bill and a Memorandum of Agreement was signed on Dec. 23, 2011 that provided a framework for the orderly transition from coal-fired energy produced at the Centralia coal plant and the shutdown of the units in 2020 and 2025. On July 25, 2012, the Corporation announced that it entered into a long-term power agreement to provide electricity from the Centralia coal plant from December 2014 until the facility is fully retired in 2025. As a result of these agreements, the Corporation recognized a pre-tax impairment charge of $347 million during 2012. The impairment assessment was based on whether the carrying amount of the Centralia coal plant was recoverable based on an estimate of fair value less costs of disposal.


III.               Renewables

During 2012, the Corporation recognized a pre-tax impairment charge of $18 million related to five assets. The impairments resulted from the completion of the annual impairment assessment based on estimates of fair value less costs of disposal, derived from the long-range forecasts and prices evidenced in the marketplace. The assets were impaired primarily due to expectations regarding lower market prices.


110


TransAlta Corporation   |   2014 Annual Report


Notes to Consolidated Financial Statements


7.              Finance Lease Receivables


Amounts receivable under the Corporation’s finance leases, comprised of the Fort Saskatchewan cogeneration facility and the Solomon power station finance leases, are as follows:


As at Dec. 31


2014


2013


Present value of


Present value of


Minimum lease


minimum lease


Minimum lease


minimum lease


payments


payments


payments


payments


Within one year


55


51


50


46


Second to fifth years inclusive


229


157


209


143


More than five years


479


162


494


160


763


370


753


349


Less: unearned finance lease income


546


548


Add: unguaranteed residual value


191


38


175


31


Total finance lease receivables


408


408


380


380


Current portion of finance lease receivables (Note 12)


5


3


Long-term portion of finance lease receivables


403


377


408


380


8.              Net Other Operating (Income) Losses


Net other operating (income) losses are comprised of the following:


Year ended Dec. 31


2014


2013


2012


California claim


5


56


Insurance recoveries


(10

)

(8

)


Supplier settlement


(9

)


Sundance Units 1 and 2 return to service


25


254


Loss on assumption of pension obligations


29


Net other operating (income) losses


(14

)

102


254


A.              California Claim

On May 30, 2014, the Corporation announced that its settlement with California utilities, the California Attorney General and certain other parties (the “California Parties”) to resolve claims related to the 2000-2001 power crisis in the State of California had been approved by the Federal Energy Regulatory Commission. The settlement provides for the payment by the Corporation of U.S.$52 million in two equal payments and a credit of approximately U.S.$97 million for monies owed to the Corporation from accounts receivable. The first payment of U.S.$26 million was paid in June 2014 and the second is due in 2015. In 2013, the Corporation accrued for the then expected settlement of these disputes with the California Parties, which resulted in a pre-tax charge to 2013 earnings of approximately U.S.$52 million. The finalization of the settlement in May 2014 resulted in an additional pre-tax charge to 2014 earnings of U.S.$5 million.


TransAlta Corporation   |   2014 Annual Report

111


Notes to Consolidated Financial Statements


B.               Insurance Recoveries

During 2014, the Corporation received $28 million (2013 – $15 million) in insurance proceeds, of which $18 million (2013 – $7 million) was related to claims for repair costs on certain hydro facilities as a result of flooding in Southern Alberta in June 2013 and was accounted for as a reduction to period operations, maintenance, and administration. The balance, in the amount of $10 million (2013 – $8 million) related to purchases of replacement equipment and business interruption insurance for various prior years’ claims.


C.              Supplier Settlement

During 2014, the Corporation settled a dispute with a supplier in relation to an equipment failure in prior years.


D.              Sundance Units 1 and 2 Return to Service

In December 2010, Units 1 and 2 of the Corporation’s Sundance facility were shut down due to conditions observed in the boilers at both units. On July 20, 2012, an arbitration panel concluded that Unit 1 and Unit 2 were not economically destroyed under the terms of the PPA and the Corporation was required to restore the units to service. For the year ended Dec. 31, 2012, a $254 million pre-tax impact of the ruling has been recognized. During 2013, $25 million of components were retired as a result of the work completed on the units to return them to service. Sundance Unit 1 returned to service on Sept. 2, 2013 and Unit 2 returned to service on Oct. 4, 2013.


E.               Loss on Assumptions of Pension Obligations

Effective Jan. 17, 2013, the Corporation assumed, through its wholly owned subsidiary, SunHills Mining Limited Partnership (“SunHills”), operations and management control of the Highvale mine from Prairie Mines and Royalty Ltd. (“PMRL”). PMRL employees working at the Highvale mine were offered employment by SunHills, which agreed to assume responsibility for certain pension plan and pension funding obligations, which the Corporation previously funded through the payments made under the PMRL mining contracts. As a result, a pre-tax loss of $29 million was recognized in 2013, along with the corresponding liabilities.


9.              Net Interest Expense


The components of net interest expense, which excludes finance lease income, are as follows:


Year ended Dec. 31


2014


2013


2012


Interest on debt


238


240


227


Interest income


(2

)

Capitalized interest (Note 17)


(3

)

(2

)

(4

)

Ineffectiveness on hedges


4


Interest on finance lease obligations


1


Accretion of provisions (Note 21)


18


18


17


Net interest expense


254


256


242


112


TransAlta Corporation   |   2014 Annual Report


Notes to Consolidated Financial Statements


10.    Income Taxes


A.              Consolidated Statements of Earnings (Loss)


I.                       Rate Reconciliations


Year ended Dec. 31

2014

2013

2012

Earnings (loss) before income taxes

239

(12)

(445)

Equity loss

10

15

Net earnings attributable to non-controlling interests

(37)

(29)

(37)

Adjusted earnings (loss) before income taxes

202

(31)

(467)

Statutory Canadian federal and provincial income tax rate (%)

25.0

25.0

25.0

Expected income tax expense (recovery)

51

(8)

(117)

Increase (decrease) in income taxes resulting from:


Lower effective foreign tax rates

(3)

(21)

(49)

Resolution of uncertain tax matters

(1)

(1)

(27)

Divestiture of investment

(38)

Statutory and other rate differences

(5)

7

Writedown (reversal of writedown) of deferred income tax assets

(5)

28

289

Other

3

(1)

(1)

Income tax expense (recovery)

7

(8)

102

Effective tax rate (%)

3

26

(22)


II.                    Components of Income Tax Expense


The components of income tax expense (recovery) are as follows:


Year ended Dec. 31

2014

2013

2012

Current income tax expense

33

38

27

Adjustments in respect of current income tax of previous years

1

(3)

Adjustments in respect of deferred income tax of previous years

2

(1)

1

Deferred income tax expense (recovery) related to the origination and reversal of temporary differences

12

(68)

(71)

Deferred income tax expense (recovery) resulting from changes in tax rates or laws

(5)

7

Benefit arising from previously unrecognized tax loss, tax credit, or temporary difference of a prior period used to reduce current income tax expense

(11)

Benefit arising from previously unrecognized tax loss, tax credit, or temporary difference of a prior period used to reduce deferred income tax expense

(35)

(1)

(16)

Deferred income tax expense (recovery) arising from the writedown (reversal of writedown) of deferred income tax assets

(5)

28

168

Income tax expense (recovery)

7

(8)

102


Year ended Dec. 31

2014

2013

2012

Current income tax expense

33

39

13

Deferred income tax expense (recovery)

(26)

(47)

89

Income tax expense (recovery)

7

(8)

102


For the year ended Dec. 31, 2013, the Corporation wrote off deferred income tax assets of $28 million (2012 – $289 million) related to approximately $80 million (2012 – $826 million) of deductible temporary differences of its U.S. operations. The deferred income tax assets related mainly to the tax benefits of losses associated with the Corporation’s directly owned U.S. operations. The deferred tax assets were written off as it was no longer considered probable that sufficient taxable income would be available from the Corporation’s directly owned U.S. operations to utilize the underlying tax losses, due to reduced price growth expectations. For the year ended Dec. 31, 2014, $5 million of previously written off deferred income tax assets was reversed based on changes to taxable and deductible temporary differences that impact the net U.S. deferred income tax assets. Net operating losses expire between 2021 and 2034.


TransAlta Corporation   |   2014 Annual Report

113


Notes to Consolidated Financial Statements


B.               Consolidated Statements of Changes in Equity


The aggregate current and deferred income tax related to items charged or credited to equity are as follows:


Year ended Dec. 31

2014

2013

2012

Income tax expense (recovery) related to:


Net impact related to cash flow hedges

88

12

(15)

Net impact related to net investment hedges

(8)

(5)

2

Net actuarial gains (losses)

(7)

11

(8)

Common and preferred share issuance costs

(1)

(5)

Income tax expense (recovery) reported in equity

72

18

(26)


C.              Consolidated Statements of Financial Position


Significant components of the Corporation’s deferred income tax assets (liabilities) are as follows:


As at Dec. 31

2014

2013

Net operating loss carryforwards

716

665

Future decommissioning and restoration costs

101

91

Property, plant, and equipment

(916)

(923)

Risk management assets and liabilities, net

(144)

(24)

Employee future benefits and compensation plans

68

60

Interest deductible in future periods

81

63

Allowance for doubtful accounts

18

Foreign exchange differences on U.S.-denominated debt

48

6

Deferred coal rights revenue

14

13

Other deductible temporary differences

2

7

Net deferred income tax liability, before writedown of deferred income tax assets

(30)

(24)

Writedown of deferred income tax assets

(359)

(317)

Net deferred income tax liability, after writedown of deferred income tax assets

(389)

(341)


The net deferred income tax liability is presented in the Consolidated Statements of Financial Position as follows:


As at Dec. 31

2014

2013

Deferred income tax assets1

45

118

Deferred income tax liabilities

(434)

(459)

Net deferred income tax liability

(389)

(341)


1           The deferred income tax assets presented on the Consolidated Statements of Financial Position are recoverable based on estimated future earnings and tax planning strategies. The assumptions used in the estimate of future earnings are based on the Corporation’s long-range forecasts.


D.              Contingencies


As of Dec. 31, 2014, the Corporation had recognized a net liability of $7 million (2013 – $8 million) related to uncertain tax positions. The change in the liability for uncertain tax positions is as follows:


Balance, Dec. 31, 2012

(9)

Increase as a result of tax positions taken during a prior period

(3)

Decrease as a result of settlements with taxation authorities

4

Balance, Dec. 31, 2013

(8)

Decrease as a result of settlements with taxation authorities

1

Balance, Dec. 31, 2014

(7)


114


TransAlta Corporation   |   2014 Annual Report


Notes to Consolidated Financial Statements


11.    Non-Controlling Interests


The Corporation’s subsidiaries and operations that have non-controlling interests are as follows:


Subsidiary/Operation

Non-controlling interest owned by

TransAlta Cogeneration L.P.

49.99% – Canadian Power Holdings Inc.

TransAlta Renewables

29.70% – Public shareholders1

Kent Hills wind farm2

17% – Natural Forces Technologies Inc.


1              As at Dec. 31, 2013, the non-controlling interest was 19.3%.


2              Owned by TransAlta Renewables.


TransAlta Cogeneration, L.P. operates a portfolio of cogeneration facilities in Canada and owns 50 per cent of a coal facility. TransAlta Renewables owns and operates a portfolio of 28 renewable power generation facilities in Canada and owns an economic interest in a wind facility in the U.S.


Summarized financial information relating to subsidiaries with significant non-controlling interests is as follows:


A.              TransAlta Cogeneration L.P.


Year ended Dec. 31

2014

2013

2012

Revenues

305

295

306

Net earnings

71

48

69

Total comprehensive income

72

71

57

Amounts attributable to the non-controlling interest:


Net earnings

35

24

34

Total comprehensive income

35

36

28

Distributions paid to Canadian Power Holdings Inc.

56

46

55


As at Dec. 31


2014

2013

Current assets


58

56

Long-term assets


588

632

Current liabilities


(64)

(56)

Long-term liabilities


(59)

(68)

Total equity


(523)

(564)

Equity attributable to Canadian Power Holdings Inc.


(260)

(280)


B.               TransAlta Renewables

On May 28, 2013, the Corporation formed a new subsidiary, TransAlta Renewables, to provide investors with the opportunity to invest directly in a highly contracted portfolio of renewable power generation facilities. The Corporation retains control over TransAlta Renewables, and therefore consolidates TransAlta Renewables.


On Aug. 9, 2013, the Corporation transferred 28 indirectly owned wind and hydroelectric generating assets to TransAlta Renewables through the sale of all the issued and outstanding shares of two subsidiaries: Canadian Hydro Developers, Inc. (“CHD”) and Western Sustainable Power Inc. On Aug. 29, 2013, TransAlta Renewables completed an Initial Public Offering and issued 22.1 million common shares for gross proceeds of $221 million. After completion of these transactions and at Dec. 31, 2013, the Corporation owned 92.6 million common shares of TransAlta Renewables, representing an 80.7 per cent ownership interest. In total, the Corporation received $207 million in cash consideration net of commissions and expenses. The excess of consideration received over the net book value of the Corporation’s divested interest was $4 million and was recognized in retained earnings (deficit).


TransAlta Corporation   |   2014 Annual Report

115


Notes to Consolidated Financial Statements


On April 29, 2014, the Corporation completed a secondary offering of 11,950,000 common shares of TransAlta Renewables at a price of $11.40 per common share. The offering resulted in gross proceeds to the Corporation of approximately $136 million. Following completion of the offering and at Dec. 31, 2014, TransAlta owns approximately 70.3 per cent of the common shares of TransAlta Renewables. As a result of the transaction, the carrying amount of the non-controlling interests was increased by $109 million to reflect the approximate 10.4 per cent increase in their relative interest in TransAlta Renewables and a $20 million gain, net of tax and issuance costs, attributable to common shareholders, was recognized directly in retained earnings (deficit).


Non-controlling interest in TransAlta Renewables arose on formation of the subsidiary in August 2013, and 2012 comparative information is, therefore, not provided. The net earnings, distributions, and equity attributable to non-controlling interests includes the 17 per cent non-controlling interest in the 150 MW Kent Hills wind farm, located in New Brunswick.


Year ended Dec. 31

2014

2013

Revenues

233

245

Net earnings

52

53

Total comprehensive income

52

54

Amounts attributable to the non-controlling interests:


Net earnings and total comprehensive income

15

5

Distributions paid to non-controlling interests

28

9


As at Dec. 31

2014

2013

Current assets

61

59

Long-term assets

1,903

1,954

Current liabilities

(241)

(100)

Long-term liabilities

(682)

(846)

Total equity

(1,041)

(1,067)

Equity attributable to non-controlling interests

(334)

(237)


12.    Trade and Other Receivables


As at Dec. 31

2014

2013

Gross trade accounts receivable

415

522

Allowance for doubtful accounts

(49)

Net trade receivables

415

473

Income taxes receivable

5

8

Current portion of finance lease receivables (Note 7)

5

3

Collateral paid (Note 14)

25

20

Trade and other receivables

450

504


The change in the allowance for doubtful accounts is as follows:


Balance, Dec. 31, 2012


46

Change in foreign exchange rates


3

Balance, Dec. 31, 2013


49

Change in foreign exchange rates


7

Settlement of California claim (Note 8)


(56)

Balance, Dec. 31, 2014


116


TransAlta Corporation   |   2014 Annual Report


Notes to Consolidated Financial Statements


13.    Financial Instruments


A.              Financial Assets and Liabilities – Classification and Measurement

Financial assets and financial liabilities are measured on an ongoing basis at cost, fair value, or amortized cost (see Note 2(C)). The following table outlines the carrying amounts and classifications of the financial assets and liabilities:


Carrying value as at Dec. 31, 2014


Derivatives


Derivatives

classified as


Other


used for

held for

Loans and

financial


hedging

trading

receivables

liabilities

Total

Financial assets


Cash and cash equivalents

43

43

Trade and other receivables

450

450

Long-term portion of finance lease receivables

403

403

Risk management assets


Current

93

180

273

Long-term

393

9

402

Financial liabilities


Accounts payable and accrued liabilities

481

481

Dividends payable

55

55

Risk management liabilities


Current

39

89

128

Long-term

75

19

94

Long-term debt and finance lease obligations1

4,056

4,056


Carrying value as at Dec. 31, 2013 (Restated – see Note 3(B))


Derivatives


Derivatives

classified as


Other


used for

held for

Loans and

financial


hedging

trading

receivables

liabilities

Total

Financial assets


Cash and cash equivalents

42

42

Trade and other receivables

504

504

Long-term portion of finance


lease receivables

377

377

Risk management assets


Current

17

96

113

Long-term

90

26

116

Financial liabilities


Accounts payable and accrued liabilities

447

447

Dividends payable

85

85

Risk management liabilities


Current

20

65

85

Long-term

72

31

103

Long-term debt and finance lease obligations1

4,347

4,347

1            Includes current portion.


TransAlta Corporation   |   2014 Annual Report

117


Notes to Consolidated Financial Statements


B.               Fair Value of Financial Instruments

The fair value of a financial instrument is the price that would be received to sell an asset or paid to transfer a liability in an orderly transaction between market participants at the measurement date. Fair values can be determined by reference to prices for that instrument in active markets to which the Corporation has access. In the absence of an active market, the Corporation determines fair values based on valuation models or by reference to other similar products in active markets.


Fair values determined using valuation models require the use of assumptions. In determining those assumptions, the Corporation looks primarily to external readily observable market inputs. However, if not available, the Corporation uses inputs that are not based on observable market data.


I.       Levels I, II, and III Fair Value Measurements and Transfers between Fair Value Levels

The Level I, II, and III classifications in the fair value hierarchy utilized by the Corporation are defined below. The fair value measurement of a financial instrument is included in only one of the three levels, the determination of which is based on the lowest level input that is significant to the derivation of the fair value.


a.                   Level I

Fair values are determined using inputs that are quoted prices (unadjusted) in active markets for identical assets or liabilities that the Corporation has the ability to access at the measurement date. In determining Level I fair values, the Corporation uses quoted prices for identically traded commodities obtained from active exchanges such as the New York Mercantile Exchange.


b.                   Level II

Fair values are determined, directly or indirectly, using inputs that are observable for the asset or liability.


Fair values falling within the Level II category are determined through the use of quoted prices in active markets, which in some cases are adjusted for factors specific to the asset or liability, such as basis, credit valuation, and location differentials. The Corporation’s commodity risk management Level II financial instruments include over-the-counter derivatives with values based on observable commodity futures curves and derivatives with inputs validated by broker quotes or other publicly available market data providers. Level II fair values are also determined using valuation techniques, such as option pricing models and regression or extrapolation formulas, where the inputs are readily observable, including commodity prices for similar assets or liabilities in active markets, and implied volatilities for options.


In determining Level II fair values of other risk management assets and liabilities and long-term debt measured and carried at fair value, the Corporation uses observable inputs other than unadjusted quoted prices that are observable for the asset or liability, such as interest rate yield curves and currency rates. For certain financial instruments where insufficient trading volume or lack of recent trades exists, the Corporation relies on similar interest or currency rate inputs and other third-party information such as credit spreads.


118


TransAlta Corporation   |   2014 Annual Report


Notes to Consolidated Financial Statements


c.                   Level III


Fair values are determined using inputs for the asset or liability that are not readily observable.


The Corporation may enter into commodity transactions for which market-observable data is not available. In these cases, Level III fair values are determined using valuation techniques such as the Black-Scholes, mark-to-forecast, and historical bootstrap models with inputs that are based on historical data such as unit availability, transmission congestion, demand profiles for individual non-standard deals and structured products, and/or volatilities and correlations between products derived from historical prices.


The Corporation also has various contracts with terms that extend beyond a liquid trading period. As forward market prices are not available for the full period of these contracts, the value of these contracts is derived by reference to a forecast that is based on a combination of external and internal fundamental modelling, including discounting. As a result, these contracts are classified in Level III.


The Corporation has a Commodity Exposure Management Policy (the “Policy”), which governs both the commodity transactions undertaken in its proprietary trading business and those undertaken to manage commodity price exposures in its generation business. The Policy defines and specifies the controls and management responsibilities associated with commodity trading activities, as well as the nature and frequency of required reporting of such activities.


Methodologies and procedures regarding commodity risk management Level III fair value measurements are determined by the Corporation’s risk management department. Level III fair values are calculated within the Corporation’s energy trading risk management system based on underlying contractual data as well as observable and non-observable inputs. Development of non-observable inputs requires the use of judgment. To ensure reasonability, system-generated Level III fair value measurements are reviewed and validated by the risk management and finance departments. Review occurs formally on a quarterly basis or more frequently if daily review and monitoring procedures identify unexpected changes to fair value or changes to key parameters.


The effect of using reasonably possible alternative assumptions as inputs to valuation techniques from which the Level III commodity risk management financial instruments fair values are determined at Dec. 31, 2014 is estimated to be a +/- $120 million (2013 +/- $105 million) impact to the carrying value of the financial instruments. Fair values are stressed for volumes and prices. An amount of +/- $92 million (2013 +/- $87 million) in the stress value stems from a long-dated power sale contract that is designated as a cash flow hedge, while the remaining +/-$28 million (2013 +/- $18 million) accounts for the rest of the portfolio. The variable volumes are stressed up and down one standard deviation from historically available production data. Prices are stressed for longer-term deals where there are no liquid market quotes using various internal and external forecasting sources to establish a high and a low price range.


TransAlta Corporation   |   2014 Annual Report

119


Notes to Consolidated Financial Statements


Information about the significant unobservable inputs used in determining Level III fair values is as follows:


Effects on fair


value as at


Valuation


Unobservable


Description


Dec. 31, 2014


technique


input


Range


Unit contingent power purchases


(53

)

Historical


Price discount


0.3-1.5 per cent


bootstrap


Volumetric discount1


0-10 per cent


Long-term power sale – Alberta


(13

)

Long-term


Illiquid future power


price forecast


prices (per MWh)


$91-$99


Long-term power sale – U.S.


511


Long-term


Illiquid future power


price forecast


prices (per MWh)


U.S.$41-U.S.$50


Coal supply revenue sharing


(1

)

Black-Scholes and


Volumes (MWh)


17-25 per cent of


exotic valuation


available generation


techniques


Illiquid commodity forward


price volatilities


13-36 per cent


Illiquid future power


prices (per MWh)


U.S.$22-U.S.$62


Illiquid future coal


prices (per ton)


U.S.$14-U.S.$16


Unit contingent power sales


(3

)

Black-Scholes


Illiquid commodity forward


price volatilities


32-67 per cent


Transmission and financial


(1

)

Historical


Illiquid forward power price


U.S.$(12)-U.S.$13


transmission rights


bootstrap


spreads (per MWh)


and $0-$6


Structured products in


3


Option valuation


Implied volatilities


26-86 per cent


Eastern markets


techniques and


Correlations


53-82 per cent


historical bootstrap


Non-standard shape factors


69-103 per cent


1         A change in the volumetric discount, could, depending on other market dynamics, result in a directionally similar change in the price discount.


Effects on fair


value as at


Valuation


Unobservable


Description


Dec. 31, 2013


technique


input


Range


Unit contingent power purchases


43


Historical


Price discount


0-2 per cent


bootstrap


Volumetric discount1


0-14 per cent


Long-term power sale – Alberta


(9

)

Long-term


Illiquid future power


price forecast


prices (per MWh)


$52-$91


Long-term power sale – U.S.


234


Long-term


Illiquid future power


price forecast


prices (per MWh)


U.S.$32-U.S.$79


Coal supply revenue sharing


(12

)

Black-Scholes


Volumes (MWh)


18-25 per cent of


available generation


Illiquid future implied


volatilities in MidC power


35 per cent


Unit contingent power sales


(5

)

Black-Scholes


Illiquid commodity forward


price volatilities


55 per cent


1         A change in the volumetric discount, could, depending on other market dynamics, result in a directionally similar change in the price discount.


The effects on fair values of significant unobservable inputs exclude the effects of observable inputs such as liquidity and credit discounts.


120


TransAlta Corporation   |   2014 Annual Report


Notes to Consolidated Financial Statements


d.      Transfers between Fair Value Levels


Fair value Level transfers can occur where the availability of inputs that are used to determine fair values have changed. A transfer from Level III to Level II occurs where inputs that were not readily observable have become observable during the period. The Corporation’s policy is for Level transfers to occur at the end of each period. During 2014, there were no (2013 – $28 million) fair value transfers from Level III net commodity risk management assets to Level II net commodity risk management assets. During 2013, the contract terms were determined to be within a liquid trading period where observable prices were available. Previously, the trade terms of these contracts were beyond a liquid trading period where forward price forecasts were not available for the full period of the contract.


II.      Commodity Risk Management Assets and Liabilities


Commodity risk management assets and liabilities include risk management assets and liabilities that are used in the Energy Marketing and Generation segments in relation to trading activities and certain contracting activities. To the extent applicable, changes in net risk management assets and liabilities for non-hedge positions are reflected within earnings of the Energy Marketing and Generation business segments.


The following table summarizes the key factors impacting the fair value of the commodity risk management assets and liabilities by classification level during the years ended Dec. 31, 2014 and 2013, respectively:


Hedges


Non-Hedges


Total


Level I


Level II


Level III


Level I


Level II


Level III


Level I


Level II


Level III


Net risk management assets (liabilities) at Dec. 31, 2013


(66

)

55


14


11


(52

)

66


Changes attributable to:


Market price changes on existing contracts


(13

)

260


6


20


(7

)

280


Market price changes on new contracts


3


131


(80

)


134


(80

)

Contracts settled


17


(1

)


29


(48

)


46


(49

)

Net risk management assets (liabilities) at Dec. 31, 2014


(59

)

314


180


(97

)


121


217


Additional Level III information:


Gains recognized in OCI


260


260


Total gains (losses) included in earnings before income taxes


1


(60

)


(59

)

Unrealized losses included in earnings before income taxes relating to net liabilities held at Dec. 31, 2014


(108

)


(108

)


Hedges


Non-Hedges


Total


Level I


Level II


Level III


Level I


Level II


Level III


Level I


Level II


Level III


Net risk management assets (liabilities) at Dec. 31, 2012


(63

)

3


(1

)

79


28


(1

)

16


31


Changes attributable to:


Market price changes on existing contracts


(18

)

(6

)


(21

)

26


(39

)

20


Market price changes on new contracts


5


58


(21

)

(1

)


(16

)

57


Contracts settled


10


1


(51

)

(14

)

1


(41

)

(14

)

Transfers out of Level III


28


(28

)


28


(28

)

Net risk management assets (liabilities) at Dec. 31, 2013


(66

)

55


14


11


(52

)

66


Additional Level III information:


Gains recognized in OCI


52


52


Total gains included in earnings before income taxes


25


25


Unrealized gains included in earnings before income taxes relating to net assets held at Dec. 31, 2013


11


11


TransAlta Corporation   |   2014 Annual Report

121


Notes to Consolidated Financial Statements


III.     Other Risk Management Assets and Liabilities


Other risk management assets and liabilities primarily include risk management assets and liabilities that are used in hedging non-energy marketing transactions, such as interest rates, the net investment in foreign operations, and other foreign currency risks. Changes in other risk management assets and liabilities related to hedge positions are reflected within net earnings when such transactions have settled during the period or when ineffectiveness exists in the hedging relationship.


Other risk management assets and liabilities, with total net value of $115 million as at Dec. 31, 2014 (2013 – $27 million), are classified as Level II fair value measurements.


IV.    Other Financial Assets and Liabilities

The fair value of financial liabilities measured at other than fair value is as follows:


Fair value


Total


Level I


Level II


Level III


Total


carrying value


Long-term debt1 – Dec. 31, 2014


4,091


4,091


3,918


Long-term debt1 – Dec. 31, 2013


4,367


4,367


4,262


1     Includes current portion and excludes $64 million (Dec. 31, 2013 – $60 million) of debt measured and carried at fair value.


The fair values of the Corporation’s debentures and senior notes are determined using prices observed in secondary markets. Non-recourse and other long-term debt fair values are determined by calculating an implied price based on a current assessment of the yield to maturity.


The carrying amount of other short-term financial assets and liabilities (cash and cash equivalents, trade accounts receivable, collateral paid, accounts payable and accrued liabilities, collateral received, and dividends payable) approximates fair value due to the liquid nature of the asset or liability.


C.    Inception Gains and Losses


The majority of derivatives traded by the Corporation are based on adjusted quoted prices on an active exchange or extend beyond the time period for which exchange-based quotes are available. The fair values of these derivatives are determined using inputs that are not readily observable. Refer to Note 13(B) for fair value Level III valuation techniques used. In some instances, a difference may arise between the fair value of a financial instrument at initial recognition (the “transaction price”) and the amount calculated through a valuation model. This unrealized gain or loss at inception is recognized in net earnings (loss) only if the fair value of the instrument is evidenced by a quoted market price in an active market, observable current market transactions that are substantially the same, or a valuation technique that uses observable market inputs. Where these criteria are not met, the difference is deferred on the Consolidated Statements of Financial Position in risk management assets or liabilities, and is recognized in net earnings (loss) over the term of the related contract. The difference between the transaction price and the fair value determined using a valuation model, yet to be recognized in net earnings (loss), and a reconciliation of changes is as follows:


As at Dec. 31


2014


2013


2012


Unamortized net gain at beginning of year


160


5


4


New inception gains


23


156


3


Amortization recorded in net earnings during the year


5


(1

)

(2

)


Unamortized net gain at end of year


188


160


5


During 2013, the Corporation finalized a contract to sell power in the U.S. Pacific Northwest region. The contract was designated as an all-in-one cash flow hedge. As a result, the contract was recognized as a risk management asset at fair value. The fair value was classified as Level III, which resulted in the recognition of an inception gain. The inception gain was deferred and recorded as an offset to the risk management asset.


122


TransAlta Corporation   |   2014 Annual Report


Notes to Consolidated Financial Statements


14. Risk Management Activities


A.    Net Risk Management Assets and Liabilities


Aggregate net risk management assets and liabilities are as follows:


As at Dec. 31, 2014


Net


Not


investment


Cash flow


Fair value


designated


hedges


hedges


hedges


as a hedge


Total


Commodity risk management


Current


(2

)


93


91


Long-term


257


(10

)

247


Net commodity risk management assets


255


83


338


Other


Current


56


(2

)

54


Long-term


55


6


61


Net other risk management assets (liabilities)


111


6


(2

)

115


Total net risk management assets


366


6


81


453


As at Dec. 31, 2013 (Restated – see Note 3(B))


Net


Not


investment


Cash flow


Fair value


designated


hedges


hedges


hedges


as a hedge


Total


Commodity risk management


Current


(15

)


30


15


Long-term


4


(5

)

(1

)

Net commodity risk management assets (liabilities)


(11

)


25


14


Other


Current


1


11


1


13


Long-term


7


7


14


Net other risk management assets


1


18


7


1


27


Total net risk management assets


1


7


7


26


41


Additional information on derivative instruments has been presented on a net basis below.


I.       Netting Arrangements


Information about the Corporation’s financial assets and liabilities that are subject to enforceable master netting arrangements or similar agreements is as follows:


As at Dec. 31


2014


2013


Current


Long-term


Current


Long-term


Current


Long-term


Current


Long-term


financial


financial


financial


financial


financial


financial


financial


financial


assets


assets


liabilities


liabilities


assets


assets


liabilities


liabilities


Gross amounts recognized


578


608


(380

)

(98

)

385


285


(342

)

(69

)

Gross amounts set-off


(204

)

(10

)

204


10


(157

)


156


1


Net amounts as presented in the Consolidated Statements of Financial Position


374


598


(176

)

(88

)

228


285


(186

)

(68

)


TransAlta Corporation   |   2014 Annual Report

123


Notes to Consolidated Financial Statements


II.      Hedges

a.      Net Investment Hedges

i.       Hedges of Foreign Operations

The Corporation’s hedges of its net investment in foreign operations are comprised of U.S.-dollar-denominated long-term debt with a face value of U.S.$580 million (2013 – U.S.$850 million) and the following foreign currency forward contracts:


As at Dec. 31


2014


2013


Notional


Fair


Notional


Notional


Fair


Notional


amount


value


amount


amount


value


amount sold


purchased


asset


Maturity


sold


purchased


asset


Maturity


Foreign Currency Forward Contracts


AUD235


CAD221


2015


AUD200


CAD188


1


2014


USD10


CAD11


2014


During 2014, following the divestiture of CE Gen (see Note 4), the Corporation de-designated U.S.$180 million of U.S.-denominated debt from its net investment hedge of U.S. operations. Reclassification from AOCI of the cumulative translation adjustment of the disposed foreign operation and the related cumulative net investment hedge amounts have been included in the gain on disposition. In 2014, the Corporation also de-designated an additional U.S.$90 million of U.S.-denominated debt from its net investment hedge of other U.S. operations. This change did not impact earnings or AOCI in the period. Prospectively, the de-designated tranches of U.S.-denominated debt are being hedged with foreign currency derivative instruments.


During 2013, the Corporation de-designated $20 million of U.S.-dollar denominated debentures from its net investment hedges.


b.      Cash Flow Hedges

i.       Commodity Risk Management

The Corporation’s outstanding commodity derivative instruments designated as hedging instruments are as follows:


As at Dec. 31


2014


2013


Notional


Notional


Notional


Notional


amount


amount


amount


amount


Type (thousands)


sold


purchased


sold


purchased


Electricity (MWh)


4,977


5,977


Natural gas (GJ)


963


32,113


963


35,775


Oil (gallons)


6,720


4,116


During 2014, unrealized pre-tax gains of $3 million (2013 – $1 million, 2012 – nil) were released from AOCI and recognized in earnings due to hedge ineffectiveness for accounting purposes. All designated hedging relationships were effective as of Dec. 31, 2014.


During 2014, unrealized pre-tax gains of $2 million (2013 – nil, 2012 – $90 million gain) related to certain power hedging relationships that were previously de-designated and deemed ineffective for accounting purposes were released from AOCI and recognized in net earnings. The cash flow hedges were in respect of future power production expected to occur between 2012 and 2017. In the first quarter of 2011, the production was assessed as highly probable not to occur based on then forecast prices. These unrealized gains were calculated using then current forward prices that changed between then and the time the contracts settled. Had these hedges not been deemed ineffective for accounting purposes, the revenues associated with these contracts would have been recorded in net earnings when settled, the majority of which occurred during 2012; however, the expected cash flows from these contracts would not change.


As at Dec. 31, 2014, cumulative gains of $3 million related to certain cash flow hedges that were previously de-designated and no longer meet the criteria for hedge accounting continue to be deferred in AOCI and will be reclassified to net earnings as the forecasted transactions occur or immediately if the forecasted transactions are no longer expected to occur.


124


TransAlta Corporation   |   2014 Annual Report


Notes to Consolidated Financial Statements


ii.       Foreign Currency Rate Risk Management


The Corporation uses foreign exchange forward contracts to hedge a portion of its future foreign-denominated receipts and expenditures, and both foreign exchange forward contracts and cross-currency swaps to manage foreign exchange exposure on foreign-denominated debt not designated as a net investment hedge.


As at Dec. 31


2014


2013


Notional


Notional


Fair value


Notional


Notional


Fair value


amount


amount


asset


amount


amount


asset


sold


purchased


(liability)


Maturity


sold


purchased


(liability)


Maturity


Foreign Exchange Forward Contracts - foreign-denominated receipts/expenditures


CAD194


USD180


16


2015-2018


CAD220


USD205


2


2014-2018


AUD49


JPY4,522


(1

)

2015-2017


USD4


CAD4


2015


USD4


CAD4


2014


CAD2


EUR2


2015


CAD3


EUR2


2014


Foreign Exchange Forward Contracts - foreign-denominated debt


CAD59


USD50


2015


CAD52


USD50


2


2014


CAD106


USD100


1


2014


CAD310


USD300


9


2014


USD100


CAD107


2014


CAD22


USD20


2014


Cross-Currency Swaps - foreign-denominated debt


CAD530


USD500


50


2015


CAD530


USD500


4


2015


CAD434


USD400


28


2017


CAD192


USD180


18


2018


iii.      Effect of Cash Flow Hedges


The following tables summarize the pre-tax amounts recognized in and reclassified out of OCI related to cash flow hedges:


Year ended Dec. 31, 2014


Effective portion


Ineffective portion


Pre-tax gain


Location of (gain)


Pre-tax (gain)


Location of (gain)


Pre-tax (gain)


Derivatives in cash flow


(loss) recognized


loss reclassified


loss reclassified


loss reclassified


loss recognized


hedging relationships


in OCI


from OCI


from OCI


from OCI


in earnings


Revenue


24


Revenue


(3

)


Fuel and


Fuel and


Commodity contracts


212


purchased power


14


purchased power


Foreign exchange forwards on


commodity contracts


14


Revenue


(1

)

Revenue


Foreign exchange forwards


Property, plant,


Foreign exchange


on project hedges


(1

)

and equipment


(gain) loss


Foreign exchange forwards


Foreign exchange


Foreign exchange


on U.S. debt


(9

)

(gain) loss


6


(gain) loss


Foreign exchange


Foreign exchange


Cross-currency swaps


89


(gain) loss


(94

)

(gain) loss


Forward starting interest


rate swaps


Interest expense


6


Interest expense


OCI impact


305


OCI impact


(45

)

Net earnings impact


(3

)


TransAlta Corporation   |   2014 Annual Report


125


Notes to Consolidated Financial Statements


Year ended Dec. 31, 2013


Effective portion


Ineffective portion


Pre-tax gain


Location of (gain)


Pre-tax (gain)


Location of (gain)


Pre-tax (gain)


Derivatives in cash flow


(loss) recognized


loss reclassified


loss reclassified


loss reclassified


loss recognized


hedging relationships


in OCI


from OCI


from OCI


from OCI


in earnings


Revenue


17


Revenue


(2

)


Fuel and


Fuel and


Commodity contracts


11


purchased power


19


purchased power


Foreign exchange forwards


on commodity contracts


11


Revenue


2


Revenue


Foreign exchange forwards


Property, plant,


Foreign exchange


on project hedges


and equipment


2


(gain) loss


Foreign exchange forwards


Foreign exchange


Foreign exchange


on U.S. debt


33


(gain) loss


(38

)

(gain) loss


Foreign exchange


Foreign exchange


Cross-currency swaps


33


(gain) loss


(29

)

(gain) loss


Forward starting interest


rate swaps


Interest expense


6


Interest expense


OCI impact


88


OCI impact


(21

)

Net earnings impact


(2

)


Year ended Dec. 31, 2012


Effective portion


Ineffective portion


Pre-tax gain


Location of (gain)


Pre-tax (gain)


Location of (gain)


Pre-tax (gain)


Derivatives in cash flow


(loss) recognized


loss reclassified


loss reclassified


loss reclassified


loss recognized


hedging relationships


in OCI


from OCI


from OCI


from OCI


in earnings


Revenue


13


Revenue


(90

)


Fuel and


Fuel and


Commodity contracts


36


purchased power


2


purchased power


Foreign exchange forwards


on commodity contracts


(3

)

Revenue


1


Revenue


Foreign exchange forwards


Property, plant,


Foreign exchange


on project hedges


(3

)

and equipment


7


(gain) loss


Foreign exchange forwards


Foreign exchange


Foreign exchange


on U.S. debt


(20

)

(gain) loss


30


(gain) loss


Foreign exchange


Foreign exchange


Cross-currency swaps


(6

)

(gain) loss


13


(gain) loss


Forward starting interest


rate swaps


(15

)

Interest expense


2


Interest expense


3


OCI impact


(11

)

OCI impact


68


Net earnings impact


(87

)


Over the next 12 months, the Corporation estimates that $7 million of after-tax gains will be reclassified from AOCI to net earnings. These estimates assume constant natural gas and power prices, interest rates, and exchange rates over time; however, the actual amounts that will be reclassified may vary based on changes in these factors.


126


TransAlta Corporation   |   2014 Annual Report


Notes to Consolidated Financial Statements


c.      Fair Value Hedges


i.       Interest Rate Risk Management


The Corporation has converted a portion of its fixed interest rate debt with a rate of 6.65 per cent (2013 - 6.65 per cent) to a floating interest rate based on the U.S. LIBOR rate using interest rate swaps as outlined below:


As at Dec. 31


2014


2013


Notional


Fair value


Notional


Fair value


amount


asset


Maturity


amount


asset


Maturity


USD50


6


2018


USD50


7


2018


Including the interest rate swaps above, 4 per cent of the Corporation’s debt as at Dec. 31, 2014 is subject to floating interest rates (2013 - 21 per cent).


ii.      Effects of Fair Value Hedges


The following table summarizes the pre-tax impact on the Consolidated Statements of Earnings (Loss) of fair value hedges, including any ineffective portion:


Year ended Dec. 31


2014


2013


2012


Derivatives in fair value


Location of gain (loss)


hedging relationships


recognized in earnings


Interest rate contracts


Net interest expense


(1

)

(2

)

(16

)

Long-term debt


Net interest expense


1


2


15


Earnings (loss) impact


(1

)


III.     Non-Hedges


The Corporation enters into various derivative transactions as well as other contracting activities that do not qualify for hedge accounting or where a choice was made not to apply hedge accounting. As a result, the related assets and liabilities are classified as held for trading. The net realized and unrealized gains or losses from changes in the fair value of these derivatives are reported in earnings in the period the change occurs.


a.      Commodity Risk Management


As at Dec. 31


      2014


      2013


Notional


Notional


Notional


Notional


amount


amount


amount


amount


Type (thousands)


sold


purchased


sold


purchased


Electricity (MWh)


30,821


23,685


34,741


24,456


Natural gas (GJ)


156,898


198,969


215,730


224,661


Emissions (tonnes)


50


75


70


70


Heating oil (gallons)


9,576


b.      Other Non-Hedge Derivatives


As at Dec. 31


 2014


 2013


Notional


Notional


Fair value


Notional


Notional


Fair


amount


amount


asset


amount


amount


value


sold


purchased


(liability)


Maturity


sold


purchased


asset


Maturity


Foreign Exchange Forward Contracts


CAD264


USD227


1


2015


CAD91


USD85


1


2014


AUD63


CAD61


1


2015


AUD47


USD40


3


2015-2016


AUD10


EUR7


2015


Derivatives embedded in supplier contracts1


USD40


AUD47


(7

)

2015-2016


EUR7


AUD10


2015


1    Result from payments that are not denominated in the functional currency of either party under a contract with a supplier.


TransAlta Corporation   |   2014 Annual Report


127


Notes to Consolidated Financial Statements


c.      Total Return Swaps


The Corporation has certain compensation and deferred and restricted share unit programs, the values of which depend on the common share price of the Corporation. The Corporation has fixed a portion of the settlement cost of these programs by entering into a total return swap for which hedge accounting has not been applied. The total return swap is cash settled every quarter based upon the difference between the fixed price and the market price of the Corporation’s common shares at the end of each quarter.


d.      Effect of Non-Hedges


For the year ended Dec. 31, 2014, the Corporation recognized a net unrealized gain of $46 million (2013 - loss of $40 million, 2012 - loss of $123 million) related to commodity derivatives.


For the year ended Dec. 31, 2014, a gain of $10 million (2013 - gain of $8 million, 2012 - loss of $4 million) related to foreign exchange and other derivatives was recognized and is comprised of a net unrealized gain of $2 million (2013 - loss of $1 million, 2012 - gain of $1 million) and a net realized gain of $8 million (2013 - gain of $9 million, 2012 - loss of $5 million).


B.    Nature and Extent of Risks Arising from Financial Instruments


The following discussion is limited to the nature and extent of risks arising from financial instruments.


I.        Market Risk


a.      Commodity Price Risk


The Corporation has exposure to movements in certain commodity prices in both its electricity generation and proprietary trading businesses, including the market price of electricity and fuels used to produce electricity. Most of the Corporation’s electricity generation and related fuel supply contracts are considered to be contracts for delivery or receipt of a non-financial item in accordance with the Corporation’s expected own use requirements and are not considered to be financial instruments. As such, the discussion related to commodity price risk is limited to the Corporation’s proprietary trading business and commodity derivatives used in hedging relationships associated with the Corporation’s electricity generating activities.


i.        Commodity Price Risk - Proprietary Trading


The Corporation’s Energy Marketing Segment conducts proprietary trading activities and uses a variety of instruments to manage risk, earn trading revenue, and gain market information.


In compliance with the Policy, proprietary trading activities are subject to limits and controls, including Value at Risk (“VaR”) limits. The Board approves the limit for total VaR from proprietary trading activities. VaR is the most commonly used metric employed to track and manage the market risk associated with trading positions. A VaR measure gives, for a specific confidence level, an estimated maximum pre-tax loss that could be incurred over a specified period of time. VaR is used to determine the potential change in value of the Corporation’s proprietary trading portfolio, over a three-day period within a 95 per cent confidence level, resulting from normal market fluctuations. VaR is estimated using the historical variance/covariance approach.


VaR is a measure that has certain inherent limitations. The use of historical information in the estimate assumes that price movements in the past will be indicative of future market risk. As such, it may only be meaningful under normal market conditions. Extreme market events are not addressed by this risk measure. In addition, the use of a three-day measurement period implies that positions can be unwound or hedged within three days, although this may not be possible if the market becomes illiquid.


The Corporation recognizes the limitations of VaR and actively uses other controls, including restrictions on authorized instruments, volumetric and term limits, stress-testing of individual portfolios and of the total proprietary trading portfolio, and management reviews when loss limits are triggered.


Changes in market prices associated with proprietary trading activities affect net earnings in the period that the price changes occur. VaR at Dec. 31, 2014 associated with the Corporation’s proprietary trading activities was $5 million (2013 - $2 million, 2012 - $2 million).


128


TransAlta Corporation   |   2014 Annual Report


Notes to Consolidated Financial Statements


ii.       Commodity Price Risk - Generation


The Generation Segment utilizes various commodity contracts to manage the commodity price risk associated with electricity generation, fuel purchases, emissions, and byproducts, as considered appropriate. A Commodity Exposure Management Policy is prepared and approved annually, which outlines the intended hedging strategies associated with the Corporation’s generation assets and related commodity price risks. Controls also include restrictions on authorized instruments, management reviews on individual portfolios, and approval of asset transactions that could add potential volatility to the Corporation’s reported net earnings.


TransAlta has entered into various contracts with other parties whereby the other parties have agreed to pay a fixed price for electricity to TransAlta. While not all of the contracts create an obligation for the physical delivery of electricity to other parties, the Corporation has the intention and believes it has sufficient electrical generation available to satisfy these contracts and, where able, has designated these as cash flow hedges for accounting purposes.


As a result, changes in market prices associated with these cash flow hedges do not affect net earnings in the period in which the price change occurs. Instead, changes in fair value are deferred until settlement through AOCI, at which time the net gain or loss resulting from the combination of the hedging instrument and hedged item affects net earnings.


VaR at Dec. 31, 2014 associated with the Corporation’s commodity derivative instruments used in generation hedging activities was $27 million (2013 - $42 million, 2012 - $5 million).


On asset-backed physical transactions, the Corporation’s policy is to seek own use contract status or hedge accounting treatment. For positions and economic hedges that do not meet hedge accounting requirements or for short-term optimization transactions such as buybacks entered into to offset existing hedge positions, these transactions are marked to the market value with changes in market prices associated with these transactions affecting net earnings in the period in which the price change occurs. VaR at Dec. 31, 2014 associated with these transactions was $7 million (2013 - $11 million, 2012 - $9 million).


b.      Interest Rate Risk

Interest rate risk arises as the fair value or future cash flows of a financial instrument can fluctuate because of changes in market interest rates. Changes in interest rates can impact the Corporation’s borrowing costs and the capacity payments received under the PPAs. Changes in the cost of capital may also affect the feasibility of new growth initiatives.


The possible effect on net earnings and OCI, due to changes in market interest rates affecting the Corporation’s floating rate debt, interest-bearing assets, financial instruments measured at fair value through profit or loss, and hedging interest rate derivatives, is outlined below. The sensitivity analysis has been prepared using management’s assessment that a 15 basis point (2013 - 25 basis point, 2012 - 50 basis point) increase or decrease is a reasonable potential change over the next quarter in market interest rates.


Year ended Dec. 31


2014


2013


2012


Net earnings


Net earnings


Net earnings


increase1


OCI loss1


increase1


OCI loss1


increase1


OCI loss1


Basis point change


2


4


1     This calculation assumes a decrease in market interest rates. An increase would have the opposite effect.


c.     Currency Rate Risk

The Corporation has exposure to various currencies, such as the euro, the U.S. dollar, the Japanese yen, and the Australian dollar, as a result of investments and operations in foreign jurisdictions, the net earnings from those operations, and the acquisition of equipment and services from foreign suppliers.


The foreign currency risk sensitivities outlined below are limited to the risks that arise on financial instruments denominated in currencies other than the functional currency.


TransAlta Corporation   |   2014 Annual Report

129


Notes to Consolidated Financial Statements


The possible effect on net earnings and OCI, due to changes in foreign exchange rates associated with financial instruments denominated in currencies other than the Corporation’s functional currency, is outlined below. The sensitivity analysis has been prepared using management’s assessment that an average four cent (2013 - five cent, 2012 - five cent) increase or decrease in these currencies relative to the Canadian dollar is a reasonable potential change over the next quarter.


Year ended Dec. 31


2014


2013


2012


Net earnings


increase


Net earnings


Net earnings


Currency


(decrease)1


OCI gain1,2


increase1


OCI gain1,2


decrease1


OCI gain1,2


USD


4


5


2


8


(2

)

11


EUR


1


AUD


(2

)


Total


2


5


2


8


(2

)

12


1   These calculations assume an increase in the value of these currencies relative to the Canadian dollar. A decrease would have the opposite effect.

2   The foreign exchange impact related to financial instruments designated as hedging instruments in net investment hedges has been excluded.


II.       Credit Risk

Credit risk is the risk that customers or counterparties will cause a financial loss for the Corporation by failing to discharge their obligations, and the risk to the Corporation associated with changes in creditworthiness of entities with which commercial exposures exist. The Corporation actively manages its exposure to credit risk by assessing the ability of counterparties to fulfill their obligations under the related contracts prior to entering into such contracts. The Corporation makes detailed assessments of the credit quality of all counterparties and, where appropriate, obtains corporate guarantees, cash collateral, and/or letters of credit to support the ultimate collection of these receivables. For commodity trading and origination, the Corporation sets strict credit limits for each counterparty and monitors exposures on a daily basis. TransAlta uses standard agreements that allow for the netting of exposures and often include margining provisions. If credit limits are exceeded, TransAlta will request collateral from the counterparty or halt trading activities with the counterparty. TransAlta is exposed to minimal credit risk for Alberta Coal PPAs as receivables are substantially all secured by letters of credit.


The Corporation uses external credit ratings, as well as internal ratings in circumstances where external ratings are not available, to establish credit limits for counterparties. The following table outlines the distribution, by credit rating, of financial assets as at Dec. 31, 2014:


Investment


Non-investment


(Per cent)


grade


grade


Total


Accounts receivable


89


11


100


Risk management assets


100


100


The Corporation’s maximum exposure to credit risk at Dec. 31, 2014, without taking into account collateral held or right of set-off, is represented by the current carrying amounts of accounts receivable and risk management assets as per the Consolidated Statements of Financial Position. Letters of credit and cash are the primary types of collateral held as security related to these amounts. The maximum credit exposure to any one customer for commodity trading operations and hedging, including the fair value of open trading, net of any collateral held, at Dec. 31, 2014 was $29 million (2013 – $23 million).


The Corporation utilizes an allowance for doubtful accounts to record potential credit losses associated with trade receivables. A reconciliation of the account for the year is presented in Note 12.


III.      Liquidity Risk

Liquidity risk relates to the Corporation’s ability to access capital to be used for proprietary trading activities, commodity hedging, capital projects, debt refinancing, and general corporate purposes. Investment grade ratings support these activities and provide better access to capital markets through commodity and credit cycles. TransAlta is focused on strengthening its financial position and maintaining stable investment grade credit ratings.


Counterparties enter into certain electricity and natural gas purchase and sale contracts for the purposes of asset-backed sales and proprietary trading. The terms and conditions of these contracts may require the counterparties to provide collateral when the fair value of the obligation pursuant to these contracts is in excess of any credit limits granted. Downgrades in creditworthiness by certain credit rating agencies may decrease the credit limits granted and accordingly increase the amount of collateral that may have to be provided.


130


TransAlta Corporation   |   2014 Annual Report


Notes to Consolidated Financial Statements


TransAlta manages liquidity risk by monitoring liquidity on trading positions; preparing and revising longer-term financing plans to reflect changes in business plans and the market availability of capital; reporting liquidity risk exposure for proprietary trading activities on a regular basis to the Risk Management Committee, senior management, and the Board; and maintaining investment grade credit ratings.


A maturity analysis of the Corporation’s net financial liabilities, as at Dec. 31, 2014, is as follows:


2020 and


2015


2016


2017


2018


2019


thereafter


Total


Accounts payable and accrued liabilities


481


481


Long-term debt1


738


29


466


878


402


1,472


3,985


Commodity risk management (assets) liabilities


(74

)

(17

)

(16

)

(24

)

(23

)

(184

)

(338

)

Other risk management (assets) liabilities


(53

)

(6

)

(30

)

(26

)


(115

)

Interest on long-term debt2


178


171


166


129


104


723


1,471


Dividends payable


55


55


Total


1,325


177


586


957


483


2,011


5,539


1   Excludes impact of hedge accounting and includes drawn credit facilities that are currently scheduled to mature between 2016 and 2018.

2   Not recognized as a financial liability on the Consolidated Statements of Financial Position.


C.     Collateral

I.        Financial Assets Provided as Collateral

At Dec. 31, 2014, the Corporation provided $25 million (2013 - $20 million) in cash as collateral to regulated clearing agents as security for commodity trading activities. These funds are held in segregated accounts by the clearing agents.


II.       Financial Assets Held as Collateral

At Dec. 31, 2014, the Corporation received nil (2013 - nil) in cash collateral associated with counterparty obligations. Under the terms of the contracts, the Corporation may be obligated to pay interest on the outstanding balances and to return the principal when the counterparties have met their contractual obligations, or when the amount of the obligation declines as a result of changes in market value. Interest payable to the counterparties on the collateral received is calculated in accordance with each contract.


III.     Contingent Features in Derivative Instruments

Collateral is posted in the normal course of business based on the Corporation’s senior unsecured credit rating as determined by certain major credit rating agencies. Certain of the Corporation’s derivative instruments contain financial assurance provisions that require collateral to be posted only if a material adverse credit-related event occurs. If a material adverse event resulted in the Corporation’s senior unsecured debt falling below investment grade, the counterparties to such derivative instruments could request ongoing full collateralization.


As at Dec. 31, 2014, the Corporation had posted collateral of $73 million (2013 $94 million) in the form of letters of credit on derivative instruments primarily in a net liability position. Certain derivative agreements contain credit-risk-contingent features, including a credit rating downgrade to below investment grade, which if triggered would result in the Corporation having to post an additional $86 million (2013 - $88 million) of collateral to its counterparties based upon the value of the derivatives at Dec. 31, 2014.


IV.     Gain on Sale of Collateral

During September 2012, the Corporation sold, for net proceeds of U.S.$33 million, its claim against MF Global Inc. pertaining to the return of U.S.$36 million of collateral that had been previously posted by the Corporation. As a result, a pre-tax gain of $15 million ($11 million after-tax) was realized in 2012.


In October 2011, MF Global Holdings Ltd. filed for bankruptcy protection in the United States. MF Global Holdings Ltd. is the parent company of MF Global Inc., which was used by TransAlta as a broker-dealer for certain commodity transactions. MF Global Inc. had not filed for bankruptcy in 2011 but, under the U.S. Securities Investor Protection Act of 1970, the Securities Investor Protection Corp. was overseeing a liquidation of the broker-dealer to return assets to customers. The Corporation’s claim, filed during the first quarter of 2012, related primarily to the Corporation’s collateral on foreign futures transactions.


TransAlta Corporation   |   2014 Annual Report

131


Notes to Consolidated Financial Statements


15. Inventory


Inventory held in the normal course of business, which includes coal, emission credits, and natural gas, is valued at the lower of cost and net realizable value. Inventory held for Energy Marketing, which includes natural gas and emission credits and allowances, is valued at fair value less costs to sell.


The components of inventory are as follows:


As at Dec. 31


2014


2013


Coal


39


53


Deferred stripping costs


15


13


Natural gas


12


5


Purchased emission credits


5


6


Total


71


77


The change in inventory is as follows:


Balance, Dec. 31, 2012


93


Net additions


7


Writedowns


(22

)

Change in foreign exchange rates


(1

)

Balance, Dec. 31, 2013


77


Net additions


14


Writedowns


(19

)

Change in foreign exchange rates


(1

)

Balance, Dec. 31, 2014


71


No inventory is pledged as security for liabilities.


16. Investments


Until February 2014, the Corporation’s investments in joint ventures included investments in CE Gen, Wailuku, and CalEnergy LLC. See Note 4 for further details regarding the divestitures.


The change in investments is as follows:


Balance, Dec. 31, 2012


172


Equity loss


(10

)

Equity contribution


17


Change in foreign exchange rates


13


Balance, Dec. 31, 2013


192


Change in foreign exchange rates


4


Divestitures (Note 4)


(196

)

Balance, Dec. 31, 2014


132


TransAlta Corporation   |   2014 Annual Report


Notes to Consolidated Financial Statements


17.    Property, Plant, and Equipment


A reconciliation of the changes in the carrying amount of property, plant, and equipment is as follows:


Mining


property


Assets


Capital


Coal


Gas


Renewable


and


under


spares and


Land


generation


generation


generation


equipment


construction


other1


Total


Cost


As at Dec. 31, 2012


75


5,384


1,870


2,536


959


342


315


11,481


Additions


534


27


561


Additions – finance lease


33


33


Acquisition of Wyoming wind farm
(Note 4)


78


1


79


Disposals


(1

)


(3

)


(4

)

Impairment (charges) reversals (Note 6)


(1

)

21


20


Revisions and additions to decommissioning and restoration costs


(3

)

(7

)


15


5


Retirement of assets


(159

)

(13

)

(13

)

(17

)


(202

)

Change in foreign exchange rates


1


65


(26

)


4


1


45


Transfers


2


357


35


235


75


(723

)

25


6


As at Dec. 31, 2013


77


5,644


1,858


2,857


1,066


153


369


12,024


Additions


3


466


18


487


Additions – finance lease


58


58


Disposals


(34

)

(1

)


1


(34

)

Impairment charges (Note 6)


(2

)


(2

)

Impairment reversals (Note 6)


9


2


11


Revisions and additions to decommissioning and restoration costs


11


4


(1

)

10


24


Retirement of assets


(96

)

(20

)

(4

)

(4

)


(124

)

Change in foreign exchange rates


2


92


4


7


4


(6

)

3


106


Transfers


3


149


48


24


25


(273

)

6


(18

)

As at Dec. 31, 2014


82


5,803


1,869


2,882


1,159


341


396


12,532


Accumulated depreciation


As at Dec. 31, 2012


2,510


874


532


442


79


4,437


Depreciation


263


99


91


57


13


523


Retirement of assets


(121

)

(10

)

(10

)

(10

)


(151

)

Disposals


(3

)


(3

)

Change in foreign exchange rates


40


(12

)


2


(2

)

28


Impairment reversals (Note 6)


2


2


Transfers


(5

)


(5

)

As at Dec. 31, 2013


2,692


946


615


488


90


4,831


Depreciation


272


103


98


55


13


541


Retirement of assets


(84

)

(19

)

(1

)

(2

)


(106

)

Disposals


(29

)


(29

)

Change in foreign exchange rates


61


4


1


3


69


Impairment reversals (Note 6)


3


3


Transfers


(15

)


(15

)

As at Dec. 31, 2014


2,941


993


713


544


103


5,294


Carrying amount


As at Dec. 31, 2012


75


2,874


996


2,004


517


342


236


7,044


As at Dec. 31, 2013


77


2,952


912


2,242


578


153


279


7,193


As at Dec. 31, 2014


82


2,862


876


2,169


615


341


293


7,238


1         Includes major spare parts and stand-by equipment available, but not in service, and spare parts used for routine, preventative, or planned maintenance.


TransAlta Corporation   |   2014 Annual Report

133


Notes to Consolidated Financial Statements


The Corporation capitalized $3 million of interest to PP&E in 2014 (2013 – $2 million) at a weighted average rate of 5.75 per cent (2013 – 5.46 per cent).


In 2014, operations began at a processing facility that the Corporation contracted a third party to construct and operate. The facility recovers fine coal out of pond slurry at the Corporation’s Centralia mine as part of restoration activities. Recovered coal fines can be used as fuel at the coal plant. As a result of certain contractual provisions, the Corporation recognized a finance lease asset and an obligation in the amount of estimated minimum lease payments of U.S.$34 million, corresponding at inception to the penalties payable by the Corporation if it elects to terminate the agreement. Coal volume and slurry processing payments, net of the amortization and accretion of the financial lease obligation, are deemed to constitute contingent rents under the arrangement. Other finance lease additions are for mining equipment at the Highvale mine.


The carrying amount of total assets under finance leases as at Dec. 31, 2014 was $78 million (2013 – $29 million).


18.    Goodwill


Goodwill acquired through business combinations has been allocated to CGUs that are expected to benefit from the synergies of the acquisitions, as follows:


As at Dec. 31


2014


2013


Canadian Renewables and Alberta Merchant


417


417


Energy Marketing


30


30


U.S. Operations


15


13


Total goodwill


462


460


For purposes of the 2014 and 2013 annual goodwill impairment review, the Corporation determined the recoverable amount of the Canadian Renewables and Alberta Merchant group of CGUs by calculating the fair value less costs of disposal using discounted cash flow projections based on the Corporation’s long-range forecasts for the period extending to the last planned asset retirement in 2073. The resulting fair value measurement is categorized within Level III of the fair value hierarchy.


The key assumptions impacting the determination of fair value for the Canadian Renewables and Alberta Merchant group of CGUs are electricity production and sales prices. Forecasts of electricity production for each facility are determined taking into consideration contracts for the sale of electricity, historical production, regional supply-demand balances, and capital maintenance and expansion plans. Forecasted sales prices for each facility are determined by taking into consideration contract prices for facilities subject to long- or short-term contracts, forward price curves for merchant plants, and regional supply-demand balances. Where forward price curves are not available for the duration of the facility’s useful life, prices are determined by extrapolation techniques using historical industry and company-specific data. Alberta Merchant electricity prices used in the 2014 models ranged between $31 to $276 per MWh during the forecast period (2013 – $41 to $263 per MWh). Discount rates used for the goodwill impairment calculation in 2014 ranged from 5.4 per cent to 6.9 per cent (2013 – 4.9 per cent to 7.1 per cent). No reasonably possible change in the assumptions would have resulted in an impairment of goodwill.


No impairment of goodwill arose in 2014 or 2013.


134


TransAlta Corporation   |   2014 Annual Report


Notes to Consolidated Financial Statements


19. Intangible Assets


A reconciliation of the changes in the carrying amount of intangible assets is as follows:


Intangibles


Coal


Software


Power


under


rights


and other


contracts


development


Total


Cost


As at Dec. 31, 2012


158


133


173


40


504


Additions


20


29


49


Acquisition of Wyoming wind farm (Note 4)


7


13


20


Retirements


(10

)


(10

)

Transfers


50


(47

)

3


As at Dec. 31, 2013


178


180


186


22


566


Additions


8


26


34


Retirements


(3

)


(3

)

Change in foreign exchange rates


3


3


Transfers


18


(14

)

4


As at Dec. 31, 2014


178


206


186


34


604


Accumulated amortization


As at Dec. 31, 2012


100


93


27


220


Amortization


4


21


8


33


Retirements


(10

)


(10

)

As at Dec. 31, 2013


104


104


35


243


Amortization


2


21


8


31


Retirements


(3

)


(3

)

Change in foreign exchange rates


2


2


As at Dec. 31, 2014


106


124


43


273


Carrying amount


As at Dec. 31, 2012


58


40


146


40


284


As at Dec. 31, 2013


74


76


151


22


323


As at Dec. 31, 2014


72


82


143


34


331


20. Other Assets


The components of other assets are as follows:


As at Dec. 31


2014


2013


Deferred licence fees


16


18


Project development costs


29


36


Deferred service costs


18


19


Long-term prepaids, receivables, and other


29


18


Keephills Unit 3 transmission deposit


6


6


Total other assets


98


97


Deferred licence fees consist primarily of licences to lease the land on which certain generating assets are located, and are amortized on a straight-line basis over the useful life of the generating assets to which the licences relate.


Deferred service costs are TransAlta’s contracted payments for shared capital projects required at the Genesee Unit 3 and Keephills Unit 3 sites. These costs are amortized over the life of these projects.


The Keephills Unit 3 transmission deposit is TransAlta’s proportionate share of a provincially required deposit. The full amount of the deposit is anticipated to be reimbursed over the next seven years to 2021, as long as certain performance criteria are met.


TransAlta Corporation   |   2014 Annual Report

135


Notes to Consolidated Financial Statements


21.    Decommissioning and Other Provisions


The change in decommissioning and other provision balances is as follows:


Decommissioning


and restoration


Restructuring


Other


Total


Balance, Dec. 31, 2012


262


8


42


312


Liabilities incurred


4


29


33


Liabilities settled


(24

)

(5

)

(2

)

(31

)

Accretion


17


1


18


Revisions in estimated cash flows


16


2


18


Revisions in discount rates


(12

)


(12

)

Reversals1


(3

)

(11

)

(14

)

Acquisition of Wyoming wind farm (Note 4)


3


3


Change in foreign exchange rates


4


1


5


Balance, Dec. 31, 2013


270


62


332


Liabilities incurred


3


19


22


Liabilities settled


(16

)


(31

)

(47

)

Accretion


18


18


Revisions in estimated cash flows


3


3


Revisions in discount rates


24


24


Reversals


(2

)

(2

)

Change in foreign exchange rates


6


6


Balance, Dec. 31, 2014


305


51


356


1            The reversal of other provisions includes Sundance Units 1 and 2 and Sundance Unit 3 provisions that were reversed as a result of the conclusions of the respective arbitration decisions in 2012.


Decommissioning


and restoration


Restructuring


Other


Total


Balance, Dec. 31, 2013


270


62


332


Current portion


22


5


27


Non-current portion


248


57


305


Balance, Dec. 31, 2014


305


51


356


Current portion


28


6


34


Non-current portion


277


45


322


A.              Decommissioning and Restoration

A provision has been recognized for all generating facilities and mines for which TransAlta is legally, or constructively, required to remove the facilities at the end of their useful lives and restore the sites to their original condition. TransAlta estimates that the undiscounted amount of cash flow required to settle these obligations is approximately $1.0 billion, which will be incurred between 2015 and 2072. The majority of the costs will be incurred between 2020 and 2050. At Dec. 31, 2014, the Corporation had provided a surety bond in the amount of U.S.$140 million (2013 – U.S.$136 million) in support of future decommissioning obligations at the Centralia coal mine. At Dec. 31, 2014, the Corporation had provided letters of credit in the amount of $115 million (2013 – $115 million) in support of future decommissioning obligations at the Alberta mine. Some of the facilities that are co-located with mining operations do not currently have any decommissioning obligations recorded as the obligations associated with the facilities are indeterminate at this time.


B.               Restructuring Provisions

On Oct. 30, 2012, the Corporation announced a restructuring of resources as part of its ongoing strategy to continuously improve operational excellence and accelerate the growth of the company. Approximately 165 positions were eliminated. In 2012, a provision and a related pre-tax restructuring expense of $13 million were recognized. On completion of the restructuring in 2013, the balance of the provision in the amount of $3 million was reversed.


136


TransAlta Corporation   |   2014 Annual Report


Notes to Consolidated Financial Statements


C.              Other Provisions

Other provisions include an amount related to a portion of the Corporation’s fixed price commitments under several natural gas transportation contracts for firm transportation that is not expected to be used. Accordingly, the unavoidable costs of meeting these obligations exceed the economic benefits expected to be received. The contracts extend to 2018 and 2020.


Other provisions also include provisions arising from ongoing business activities and include amounts related to commercial disputes between the Corporation and customers or suppliers. Information about the expected timing of settlement and uncertainties that could impact the amount or timing of settlement has not been provided as this may impact the Corporation’s ability to settle the provisions in the most favourable manner.


22. Long-Term Debt and Finance Lease Obligations


A.              Amounts Outstanding

The amounts outstanding are as follows:


As at Dec. 31


2014


2013


Carrying


Face


Carrying


Face


value


value


Interest1


value


value


Interest1


Credit facilities2


96


96


2.8%


852


852


2.6%


Debentures


1,043


1,051


6.1%


1,269


1,251


6.1%


Senior notes3


2,444


2,436


4.9%


1,797


1,809


5.6%


Non-recourse4


380


383


5.9%


376


380


5.9%


Other


19


19


5.9%


28


28


6.3%


3,982


3,985


4,322


4,320


Finance lease obligations


74


25


4,056


4,347


Less: current portion of long-term debt


(738

)


(209

)


Less: current portion of finance lease obligations


(13

)


(8

)


Total current long-term debt and finance lease obligations


(751

)


(217

)


Total long-term debt and finance lease obligations


3,305


4,130


1         Interest is an average rate weighted by principal amounts outstanding before the effect of hedging.

2   Composed of bankers’ acceptances and other commercial borrowings under long-term committed credit facilities. Foreign-denominated amounts included in the balance are nil at Dec. 31, 2014 and U.S.$300 million at Dec. 31, 2013.

3         U.S. face value at Dec. 31, 2014 – U.S.$2.1 billion (Dec. 31, 2013 – U.S.$1.7 billion).

4         Includes U.S.$20 million at Dec. 31, 2014 (Dec. 31, 2013 – U.S.$20 million).


Credit facilities are drawn on the Corporation’s $1.5 billion committed syndicated bank credit facility and on the Corporation’s U.S.$300 million committed bilateral facility. The $1.5 billion committed syndicated bank facility is the primary source for short-term liquidity after the cash flow generated from the Corporation’s business. The Corporation’s four-year revolving $1.5 billion committed syndicated credit facility, last renewed in June 2014, matures in 2018. The U.S.$300 million bilateral credit facility has a four-year term to 2017. Interest rates on the credit facilities vary depending on the option selected – Canadian prime, bankers’ acceptances, U.S. LIBOR, or U.S. base rate – in accordance with a pricing grid that is standard for such facilities. The Corporation also has $240 million available in committed bilateral credit facilities, which mature in 2016.


Of the $2.1 billion (2013 – $2.1 billion) of committed credit facilities, $1.6 billion (2013 – $0.9 billion) is not drawn, and is available as of Dec. 31, 2014, subject to customary borrowing conditions. In addition to the $1.6 billion available under the credit facilities, TransAlta also has $43 million of available cash and cash equivalents.


Debentures bear interest at fixed rates ranging from 5.0 per cent to 7.3 per cent and have maturity dates ranging from 2019 to 2030. During the second quarter of 2014, the Corporation’s $200 million 6.45 per cent medium-term notes matured and were paid out. During 2013, the Corporation issued $400 million of senior unsecured medium-term notes that carry a coupon rate of 5.00 per cent, payable semi-annually, at an issue price equal to 99.516 per cent of the principal amount of the notes.


TransAlta Corporation   |   2014 Annual Report

137


Notes to Consolidated Financial Statements


Senior notes bear interest at rates ranging from 1.90 per cent to 6.65 per cent and have maturity dates ranging from 2015 to 2040. In June 2014, the Corporation issued U.S.$400 million of senior notes due in 2017 that carry a coupon rate of 1.90 per cent, payable semi-annually, at an issue price equal to 99.887 per cent of the principal amount of the notes. A total of U.S.$580 million of the senior notes has been designated as a hedge of the Corporation’s net investment in U.S. foreign operations. During 2013, the Corporation’s U.S.$300 million 5.75 per cent senior notes matured and were paid out.


Non-recourse debt consists of debentures that have maturity dates ranging from 2015 to 2018 and bear interest at rates ranging from 5.3 per cent to 7.3 per cent.


Other consists of an unsecured commercial loan obligation that bears interest at 5.9 per cent and matures in 2023, requiring annual payments of interest and principal. Notes payable for the Windsor plant matured and were paid out in November 2014.


TransAlta’s debt has terms and conditions, including financial covenants, that are considered normal and customary. As at Dec. 31, 2014, the Corporation was in compliance with all debt covenants.


B.    Restrictions


Debentures of $344 million issued by the Corporation’s CHD subsidiary include restrictive covenants requiring the proceeds received from the sale of assets to be reinvested into similar renewables assets.


C.              Principal Repayments


2020 and


2015


2016


2017


2018


2019


thereafter


Total


Principal repayments1


738


29


466


878


402


1,472


3,985


1         Excludes impact of derivatives and includes drawn credit facilities that are currently scheduled to mature in 2015 and 2017.


D.              Finance Lease Obligations


Amounts payable for mining assets and other finance leases are as follows:


As at Dec. 31


2014


2013


Minimum


Present value


Minimum


Present value


lease


of minimum


lease


of minimum


payments


lease payments


payments


lease payments


Within one year


16


16


9


9


Second to fifth years inclusive


43


37


18


16


More than five years


30


21


89


74


27


25


Less: interest costs


15


2


Total finance lease obligations


74


74


25


25


Current portion of finance lease obligations


13


8


Long-term portion of finance lease obligations


61


17


74


25


E.    Letters of Credit


Letters of credit are issued to counterparties under various contractual arrangements with the Corporation and certain subsidiaries of the Corporation. If the Corporation or its subsidiary does not perform under such contracts, the counterparty may present its claim for payment to the financial institution through which the letter of credit was issued. Any amounts owed by the Corporation or its subsidiaries under these contracts are reflected in the Consolidated Statements of Financial Position. All letters of credit expire within one year and are expected to be renewed, as needed, in the normal course of business. The total outstanding letters of credit as at Dec. 31, 2014 was $396 million (2013 – $370 million) with no (2013 – nil) amounts exercised by third parties under these arrangements.


138


TransAlta Corporation   |   2014 Annual Report


Notes to Consolidated Financial Statements


23. Defined Benefit Obligation and Other Long-Term Liabilities


The components of defined benefit obligation and other long-term liabilities are as follows:


As at Dec. 31


2014


2013


Defined benefit obligation (Note 28)


226


200


Deferred coal revenues


58


52


Long-term incentive accruals (Note 27)


13


16


Other


52


72


Total


349


340


Deferred coal revenues consist of amounts received from the Corporation’s Keephills Unit 3 joint operation partner for future coal deliveries. These amounts are being amortized into revenue over the life of the coal supply agreement, since commercial operations of Keephills Unit 3 began on Sept. 1, 2011.


Other includes $12 million (2013 – $13 million) relating to a reimbursement received for costs of the New Richmond terminal station, which is being amortized into revenue over the term of the related PPA, and nil (2013 – $28 million) relating to the California claim (see Note 8).


24. Common Shares


A.    Issued and Outstanding


TransAlta is authorized to issue an unlimited number of voting common shares without nominal or par value. Changes in the common shares issued are as follows:


As at Dec. 31


2014


2013


Common


Common


shares


shares


(millions)


Amount


(millions)


Amount


Issued and outstanding, beginning of year


268.2


2,916


254.7


2,730


Issued under the dividend reinvestment and share purchase plan


6.8


85


13.5


186


275.0


3,001


268.2


2,916


Amounts receivable under Employee Share Purchase Plan


(2

)


(3

)

Issued and outstanding, end of year


275.0


2,999


268.2


2,913


B.    Shareholder Rights Plan


The primary objective of the Shareholder Rights Plan is to provide the Board sufficient time to explore and develop alternatives for maximizing shareholder value if a takeover bid is made for the Corporation and to provide every shareholder with an equal opportunity to participate in such a bid. The Shareholder Rights Plan was originally approved in 1992, and has been revised since that time to ensure conformity with current practices. As required, the Shareholder Rights Plan must be put before the Corporation’s shareholders every three years for approval, and was last approved on April 23, 2013.


When an acquiring shareholder commences a bid to acquire 20 per cent or more of the Corporation’s common shares, other than by way of a Permitted Bid, where the offer is made to all shareholders by way of a takeover bid circular, the rights granted under the Shareholder Rights Plan become exercisable by all shareholders except those held by the acquiring shareholder. Each right will entitle a shareholder, other than the acquiring shareholder, to acquire an additional $200 worth of common shares for $100.


TransAlta Corporation   |   2014 Annual Report

139


Notes to Consolidated Financial Statements


C.              Premium DividendTM, Dividend Reinvestment, and Optional Common Share Purchase Plan (the “Plan”)


On Feb. 21, 2012, the Corporation added a Premium DividendTM Component to its existing dividend reinvestment plan. The amended and restated plan provided eligible shareholders with two options: i) to reinvest dividends at a current three per cent discount to the average market price towards the purchase of new common shares of the Corporation (the Dividend Reinvestment Component) or; ii) to receive a premium cash payment equivalent to 102 per cent of the reinvested dividends (the Premium DividendTM Component).


The Corporation suspended the Premium DividendTM Component of the Plan following the payment of the quarterly dividend on July 1, 2013. The Corporation’s Dividend Reinvestment and Optional Common Share Purchase Plan, separate components of the Plan, remain effective in accordance with their current terms.


On Jan. 1, 2015, 1.9 million common shares were issued for dividends reinvested.


There have been no other transactions involving common shares between the reporting date and the date of completion of these consolidated financial statements.


D.    Earnings per Share


Year ended Dec. 31


2014


2013


2012


Net earnings (loss) attributable to common shareholders


141


(71

)

(615

)

Basic and diluted weighted average number of common shares outstanding


273


264


235


Net earnings (loss) per share attributable to common shareholders, basic and diluted


0.52


(0.27

)

(2.62

)


E.    Dividends


On Jan. 23, 2015, the Corporation declared a quarterly dividend of $0.18 per common share, payable on April 1, 2015.


Dividends per common share declared in 2014 were $0.72 (2013 and 2012 – $1.16).


25. Preferred Shares


A.    Issued and Outstanding

All preferred shares issued and outstanding are non-voting cumulative redeemable fixed rate first preferred shares.


As at Dec. 31


2014


2013


Number of


Number of


shares


shares


Series


(millions)


Amount


(millions)


Amount


Series A


12.0


293


12.0


293


Series C


11.0


269


11.0


269


Series E


9.0


219


9.0


219


Series G


6.6


161


Issued and outstanding, end of year


38.6


942


32.0


781


The holders are entitled to receive cumulative fixed quarterly cash dividends at a specified rate, as approved by the Board. After an initial period of approximately five years from issuance and every five years thereafter (“Rate Reset Date”), the fixed rate resets to the sum of the then five-year Government of Canada bond yield (the fixed rate “Benchmark”) plus a specified spread. Upon each Rate Reset Date, they are also:


§         Redeemable at the option of the Corporation, in whole or in part, for $25.00 per share, plus all declared and unpaid dividends at the time of redemption.


§         Convertible at the holder’s option into a specified series of non-voting cumulative redeemable floating rate first preferred shares that pay cumulative floating rate quarterly cash dividends, as approved by the Board, based on the sum of the then Government of Canada three-month Treasury Bill rate (the floating rate “Benchmark”) plus a specified spread. The cumulative floating rate first preferred shares are also redeemable at the option of the Corporation and convertible back into each original cumulative fixed rate first preferred share series, at each subsequent Rate Reset Date, on the same terms as noted above.


140


TransAlta Corporation   |   2014 Annual Report


Notes to Consolidated Financial Statements


Characteristics specific to each first preferred share series as at Dec. 31, 2014, are as follows:


Rate spread


Annual dividend


First Rate


over Benchmark


Convertible


Series


Rate during term


rate per share ($)


Reset Date


(per cent)


to Series


A


Fixed


1.15


March 31, 2016


2.03


B


B


Floating


2.03


A


C


Fixed


1.15


June 30, 2017


3.10


D


D


Floating


3.10


C


E


Fixed


1.25


Sept. 30, 2017


3.65


F


F


Floating


3.65


E


G1


Fixed


1.325


Sept. 30, 2019


3.80


H


H


Floating


3.80


G


1         On Aug. 15, 2014, the Corporation completed a public offering of 6.6 million Series G preferred shares for gross proceeds of $165 million (net proceeds of $161 million after issue costs, net of tax effects).


B.    Dividends


The following table summarizes the preferred share dividends declared in 2014, 2013, and 2012:


Series


2014


2013


2012


A


14


14


14


C1


13


13


14


E


11


11


4


G2


3


Total for the year


41


38


32


1   2012 includes dividends of $0.0969 per share ($1 million in total) for the period from Nov. 29, 2011 to Dec. 31, 2011.

2   2014 includes dividends for the period from issuance on Aug. 15, 2014 to Dec. 31, 2014.


On Jan. 23, 2015, the Corporation declared a quarterly dividend of $0.2875 per share on the Series A and Series C preferred shares, $0.3125 per share on the Series E preferred shares, and $0.33125 per share on the Series G preferred shares, all payable March 31, 2015.


TransAlta Corporation   |   2014 Annual Report

141


Notes to Consolidated Financial Statements


26. Accumulated Other Comprehensive Income (Loss)


The components of, and changes in, accumulated other comprehensive income (loss) are as follows:


2014


2013


Currency translation adjustment


Opening balance, Jan. 1


(36

)

(38

)

Gains on translating net assets of foreign operations, net of reclassifications to net earnings


68


37


Losses on financial instruments designated as hedges of foreign operations, net of reclassifications to net earnings, net of tax1


(51

)

(35

)

Balance, Dec. 31


(19

)

(36

)


Cash flow hedges


Opening balance, Jan. 1


4


(37

)

Gains on derivatives designated as cash flow hedges, net of reclassifications to net earnings and to non-financial assets, net of tax2


169


41


Balance, Dec. 31


173


4


Employee future benefits


Opening balance, Jan. 1


(30

)

(61

)

Net actuarial gains (losses) on defined benefit plans, net of tax3


(20

)

31


Balance, Dec. 31


(50

)

(30

)

Accumulated other comprehensive income (loss)


104


(62

)


1     Net of income tax recovery of 9 for the year ended Dec. 31, 2014 (2013 - 5 recovery).

2     Net of income tax expense of 94 for the year ended Dec. 31, 2014 (2013 - 12 expense).

3     Net of income tax recovery of 7 for the year ended Dec. 31, 2014 (2013 - 11 expense).


27. Share-Based Payment Plans


The Corporation has the following share-based payment plans:


A.    Performance Share Unit (“PSU”) and Restricted Share Unit (“RSU”) Plan


Under the PSU and RSU Plan, grants may be made annually, but are measured and assessed over a three-year performance period. Grants are determined as a percentage of participants’ base pay and are converted to PSUs or RSUs on the basis of the Corporation’s common share price at the time of grant. Vesting of PSUs is subject to achievement over a three-year period of three performance measures: growth in funds from operation per share, growth in free cash flow per share, and growth in the Corporation’s total shareholder return relative to the S&P/TSX Composite Index. RSUs are subject to a three-year cliff-vesting requirement. RSUs and PSUs track the Corporation’s share price over the three-year period and accrue dividends as additional units at the same rate as dividends paid on the Corporation’s common shares. The Human Resources Committee of the Board has the discretion to determine whether payments on settlement are made through purchase of shares on the open market or in cash. The expense related to this plan is recognized during the period earned, with the corresponding payable recorded in liabilities. The liability is valued at the end of each reporting period using the closing price of the Corporation’s common shares on the Toronto Stock Exchange (“TSX”).


The pre-tax compensation expense related to PSUs and RSUs was $8 million (2013 - $6 million, 2012 - $1 million), which is included in operations, maintenance, and administration expense in the Consolidated Statements of Earnings (Loss).


142


TransAlta Corporation    2014 Annual Report


Notes to Consolidated Financial Statements


B.     Deferred Share Unit (“DSU”) Plan

Under the DSU plan, members of the Board and executives may, at their option, purchase DSUs using certain components of their fees or pay. A DSU is a notional share that has the same value as one common share of the Corporation and fluctuates based on the changes in the value of the Corporation’s common shares in the marketplace. DSUs accrue dividends as additional DSUs at the same rate as dividends are paid on the Corporation’s common shares.


DSUs are redeemable in cash and may not be redeemed until the termination or retirement of the Director or executive from the Corporation.


The Corporation accrues a liability and expense for the appreciation in the common share value in excess of the DSU’s purchase price and for dividend equivalents earned. The pre-tax compensation expense related to the DSUs was less than $1 million in each of the years ended Dec. 31 2014, 2013, and 2012.


C.     Stock Option Plans

The Corporation is authorized to grant employees options to purchase up to an aggregate of 13.0 million common shares at prices based on the market price of the shares on the TSX as determined on the grant date. The Corporation has reserved 13.0 million common shares for issue.


Options granted under the stock option plan may not be exercised until one year after grant and thereafter at an amount not exceeding 25 per cent of the grant per year on a cumulative basis until the fifth year, after which the entire grant may be exercised until the tenth year, which is the expiry date. In Canada, this plan is offered to all full-time and part-time employees below the level of manager. In the U.S., this plan is offered to all full-time and part-time employees. In Australia, options under this plan are not physically granted; rather, employees receive the equivalent value of shares in cash when exercised. This plan is offered to all full-time and part-time employees in Australia below the level of manager.


The total options outstanding and exercisable under these stock option plans at Dec. 31, 2014 are outlined below:


Options outstanding

Options exercisable


Weighted


Number

average

Weighted

Number

Weighted


outstanding at

remaining

average

exercisable at

average


Dec. 31, 2014

contractual life

exercise price

Dec. 31, 2014

exercise price

Range of exercise prices ($ per share)

(millions)

(years)

($ per share)

(millions)

($ per share)

16.80-24.07

0.8

3.8

21.37

0.8

21.37

31.97-40.12

0.6

3.1

33.03

0.6

33.03

16.80-40.12

1.4

4.5

26.20

1.4

26.20


No stock options were granted in 2014, 2013, or 2012. The pre-tax expense recognized arising from equity-settled share-based payment transactions was nil (2013 – nil, 2012 – $1 million).


D.     Performance Share Ownership Plan (“PSOP”)

Under the terms of the PSOP, participants received grants that, after three years, made them eligible to receive a set number of common shares, including the value of reinvested dividends over the period, or cash equivalent up to the maximum of the grant amount plus any accrued dividends thereon.


The granting of PSOP units was discontinued following the 2012-2014 grant and the plan was terminated on Dec. 31, 2014.


In 2014, pre-tax PSOP compensation expense recovery was $7 million (2013 – $6 million recovery, 2012 – $3 million expense), which is included in operations, maintenance, and administration expense. In 2014, no common shares (2013 – nil, 2012 – 55,418 common shares at $15.12 per share) were issued.


E.     Employee Share Purchase Plan

Under the terms of the employee share purchase plan, the Corporation will extend an interest-free loan (up to 30 per cent of an employee’s base salary) to employees below executive level and allow for payroll deductions over a three-year period to repay the loan. Executives are not eligible for this program in accordance with the Sarbanes-Oxley legislation. An agent purchases these common shares on the open market on behalf of employees at prices based on the market price of the shares as determined on the date of purchase. Employee sales of these shares are handled in the same manner. At Dec. 31, 2014, amounts receivable from employees under the plan totalled $2 million (2013 – $3 million).


TransAlta Corporation   |   2014 Annual Report

143


Notes to Consolidated Financial Statements


28. Employee Future Benefits


A.     Description

The Corporation sponsors registered pension plans in Canada and the U.S. covering substantially all employees of the Corporation in these countries and specific named employees working internationally. These plans have defined benefit and defined contribution options, and in Canada there is an additional supplemental defined benefit plan for certain employees whose annual earnings exceed the Canadian income tax limit. Except for the Highvale pension plans acquired in 2013, the Canadian and U.S. defined benefit pension plans are closed to new entrants. The U.S. defined benefit pension plan was frozen effective Dec. 31, 2010, resulting in no future benefits being earned.


The latest actuarial valuations for accounting purposes of the Canadian and U.S. pension plans was at Dec. 31, 2014 and Jan. 1, 2014, respectively. The latest actuarial valuation for accounting purposes of the Highvale pension plan was at Dec. 31, 2013. The measurement date used for all plans to determine the fair value of plan assets and the present value of the defined benefit obligation was Dec. 31, 2014.


Funding of the registered pension plans complies with applicable regulations that require actuarial valuations of the pension funds at least once every three years in Canada, or more, depending on funding status, and every year in the United States. The last actuarial valuations for funding purposes of the Canadian registered plans were completed in early 2014 with an effective date of Dec. 31, 2013. The last actuarial valuation for funding purposes of the U.S. pension plan was Jan. 1, 2014.


The supplemental pension plan is solely the obligation of the Corporation. The Corporation is not obligated to fund the supplemental plan but is obligated to pay benefits under the terms of the plan as they come due. The Corporation has posted a letter of credit in the amount of $64 million to secure the obligations under the supplemental plan.


The Corporation provides other health and dental benefits to the age of 65 for both disabled members and retired members through its other post-employment benefits plans. The latest actuarial valuation for accounting purposes of the Canadian and U.S. plans was as at Dec. 31, 2013 and Jan. 1, 2014, respectively. The measurement date used to determine the present value of the defined benefit obligation for both plans was Dec. 31, 2014.


B.     Costs Recognized

The costs recognized in net earnings during the year on the defined benefit, defined contribution, and other post-employment benefits plans are as follows:


Year ended Dec. 31, 2014

Registered

Supplemental

Other

Total

Current service cost

6

2

2

10

Administration expenses

2

2

Interest cost on defined benefit obligation

23

4

1

28

Interest on plan assets

(18)

(18)

Defined benefit expense

13

6

3

22

Defined contribution expense

18

18

Net expense

31

6

3

40


Year ended Dec. 31, 2013

Registered

Supplemental

Other

Total

Current service cost

6

3

2

11

Administration expenses

2

2

Interest cost on defined benefit obligation

21

3

1

25

Interest on plan assets

(15)

(15)

Defined benefit expense

14

6

3

23

Defined contribution expense

18

18

Net expense

32

6

3

41


144


TransAlta Corporation   |   2014 Annual Report


Notes to Consolidated Financial Statements


Year ended Dec. 31, 2012

Registered

Supplemental

Other

Total

Current service cost

2

2

1

5

Administration expenses

2

2

Interest cost on defined benefit obligation

18

3

2

23

Interest on plan assets

(13)

(13)

Defined benefit expense

9

5

3

17

Defined contribution expense

20

20

Net expense

29

5

3

37


C.     Status of Plans

The status of the defined benefit pension and other post-employment benefit plans is as follows:


As at Dec. 31, 2014

Registered

Supplemental

Other

Total

Fair value of plan assets

427

8

435

Present value of defined benefit obligation

(565)

(86)

(30)

(681)

Funded status – plan deficit

(138)

(78)

(30)

(246)

Amount recognized in the consolidated financial statements:


Accrued current liabilities

(14)

(5)

(1)

(20)

Other long-term liabilities

(124)

(73)

(29)

(226)

Total amount recognized

(138)

(78)

(30)

(246)


As at Dec. 31, 2013

Registered

Supplemental

Other

Total

Fair value of plan assets

394

7

401

Present value of defined benefit obligation

(517)

(74)

(27)

(618)

Funded status – plan deficit

(123)

(67)

(27)

(217)

Amount recognized in the consolidated financial statements:


Accrued current liabilities

(12)

(4)

(1)

(17)

Other long-term liabilities

(111)

(63)

(26)

(200)

Total amount recognized

(123)

(67)

(27)

(217)


D.              Plan Assets

The fair value of the plan assets of the defined benefit pension and other post-employment benefit plans is as follows:


Registered

Supplemental

Other

Total

Fair value of plan assets as at Dec. 31, 2012

294

5

299

Acquisition of Highvale pension plan

72

72

Interest on plan assets

15

15

Net return on plan assets

29

29

Contributions

18

7

3

28

Benefits paid

(33)

(5)

(3)

(41)

Administration expenses

(2)

(2)

Effect of translation on U.S. plans

1

1

Fair value of plan assets as at Dec. 31, 2013

394

7

401

Interest on plan assets

18

18

Net return on plan assets

33

33

Contributions

14

5

1

20

Benefits paid

(33)

(4)

(1)

(38)

Administration expenses

(2)

(2)

Effect of translation on U.S. plans

3

3

Fair value of plan assets as at Dec. 31, 2014

427

8

435


TransAlta Corporation   |   2014 Annual Report

145


Notes to Consolidated Financial Statements


The fair value of the Corporation’s defined benefit plan assets by major category is as follows:


Year ended Dec. 31, 2014

Level I

Level II

Level III

Total

Equity securities


Canadian

102

102

U.S.

49

49

International

70

70

Private

5

5

Bonds


AAA

57

57

AA

1

54

55

A

1

64

65

BBB

16

16

Below BBB

1

1

Money market and cash and cash equivalents

4

11

15

Total

6

424

5

435


Year ended Dec. 31, 2013

Level I

Level II

Level III

Total

Equity securities


Canadian

99

99

U.S.

47

47

International

70

70

Private

6

6

Bonds


AAA

46

46

AA

1

58

59

A

1

45

46

BBB

13

13

Below BBB

2

2

Money market and cash and cash equivalents

3

10

13

Total

5

390

6

401


Plan assets do not include any common shares of the Corporation at Dec. 31, 2014 and Dec. 31, 2013. The Corporation charged the registered plan $0.1 million for administrative services provided for the year ended Dec. 31, 2014 (2013 – $0.1 million).


146


TransAlta Corporation   |   2014 Annual Report


Notes to Consolidated Financial Statements


E.               Defined Benefit Obligation

The present value of the obligation for the defined benefit pension and other post-employment benefit plans is as follows:


Registered


Supplemental


Other


Total


Present value of defined benefit obligation as at Dec. 31, 2012


424


77


34


535


Acquisition of Highvale pension plan


99


99


Current service cost


6


3


2


11


Interest cost


21


3


1


25


Benefits paid


(33

)

(5

)

(3

)

(41

)

Actuarial loss arising from demographic assumptions


20


3


23


Actuarial gain arising from financial assumptions


(28

)

(5

)

(3

)

(36

)

Actuarial (gain) loss arising from experience adjustments


6


(2

)

(5

)

(1

)

Effect of translation on U.S. plans


2


1


3


Present value of defined benefit obligation as at Dec. 31, 2013


517


74


27


618


Current service cost


6


2


2


10


Interest cost


23


4


1


28


Benefits paid


(33

)

(4

)

(1

)

(38

)

Actuarial (gain) loss arising from demographic assumptions


4


(2

)

2


Actuarial loss arising from financial assumptions


50


8


3


61


Actuarial (gain) loss arising from experience adjustments


(5

)

2


(1

)

(4

)

Effect of translation on U.S. plans


3


1


4


Present value of defined benefit obligation as at Dec. 31, 2014


565


86


30


681


The weighted average duration of the defined benefit plan obligation as at Dec. 31, 2014 is 13.7 years.


F.                Contributions

The expected employer contributions for 2015 for the defined benefit pension and other post-employment benefit plans are as follows:


Registered


Supplemental


Other


Total


Expected employer contributions


14


5


2


21


TransAlta Corporation   |   2014 Annual Report

147


Notes to Consolidated Financial Statements


G.             Assumptions

The significant actuarial assumptions used in measuring the Corporation’s defined benefit obligation for the defined benefit pension and other post-employment benefit plans are as follows:


As at Dec. 31, 2014


As at Dec. 31, 2013


(per cent)


Registered


Supplemental


Other


Registered


Supplemental


Other


Accrued benefit obligation


Discount rate


3.8


3.8


3.8


4.6


4.5


4.5


Rate of compensation increase


3.0


3.0


3.0


3.0


Assumed health care cost trend rate


Health care cost escalation


7.6

1


7.7

3

Dental care cost escalation


4.0


4.0


Provincial health care premium escalation


5.0


5.0


Benefit cost for the year


Discount rate


4.6


4.5


4.5


4.1


4.0


3.9


Rate of compensation increase


3.0


3.0


3.0


3.0


Assumed health care cost trend rate


Health care cost escalation


7.8

2


7.4

4

Dental care cost escalation


4.0


4.0


Provincial health care premium escalation


5.0


3.5


1             Post- and pre-65 rates; decreasing gradually to 5 per cent by 2019-2020 and remaining at that level thereafter for the U.S. and decreasing gradually by 0.35 per cent per year to 5 per cent in 2024 for Canada.

2             Post- and pre-65 rates; decreasing gradually to 5 per cent by 2016-2019 and remaining at that level thereafter for the U.S. and decreasing gradually by 0.35 per cent per year to 5 per cent in 2024 for Canada.

3             Post- and pre-65 rates; decreasing gradually to 5 per cent by 2016-2019 and remaining at that level thereafter for the U.S. and decreasing gradually by 0.35 per cent per year to 5 per cent in 2024 for Canada.

4             Post- and pre-65 rates; decreasing gradually to 5 per cent by 2016-2019 and remaining at that level thereafter for the U.S. and decreasing gradually by 0.5 per cent per year to 5 per cent in 2018 for Canada.


H.             Sensitivity Analysis

The following table outlines the estimated increase in the net defined benefit obligation assuming certain changes in key assumptions:


Canadian plans


U.S. plans


Year ended Dec. 31, 2014


Registered


Supplemental


Other


Pension


Other


1% decrease in the discount rate


73


13


2


4


1


1% increase in the salary scale


8


11


1% increase in the health care cost trend rate


2


1


10% improvement in mortality rates


17


2


1


148


TransAlta Corporation   |   2014 Annual Report


Notes to Consolidated Financial Statements


29.    Joint Arrangements


Joint arrangements at Dec. 31, 2014 included the following:


Ownership


Joint operations


Fuel type


(per cent)


Description

Sheerness


Coal


50


Coal-fired plant in Alberta, of which TA Cogen has a 50 per cent interest, operated by ATCO Power

Genesee Unit 3


Coal


50


Coal-fired plant in Alberta operated by Capital Power Corporation

Keephills Unit 3


Coal


50


Coal-fired plant in Alberta operated by TransAlta

TransAlta MidAmerican Partnership


Gas


50


Strategic partnership to develop, build, and operate new natural gas-fuelled electricity generation projects in Canada

Goldfields Power


Gas


50


Gas-fired plant in Australia operated by TransAlta

Fort Saskatchewan


Gas


60


Cogeneration plant in Alberta, of which TA Cogen has a 60 per cent interest, operated by TransAlta

Fortescue River Gas Pipeline


Gas


43


Joint venture to build and operate natural gas pipeline in Western Australia to transport natural gas to the Corporation’s Solomon power station

McBride Lake


Renewables


50


Wind generation facilities in Alberta operated by TransAlta

Soderglen


Renewables


50


Wind generation facilities in Alberta operated by TransAlta

Pingston


Renewables


50


Hydro facility in British Columbia operated by TransAlta


Business


Ownership


Joint ventures


activity


(per cent)


Description

TAMA Transmission LP


Transmission


50


Strategic partnership to develop and operate transmission projects in Alberta


30.    Change in Non-Cash Operating Working Capital


Year ended Dec. 31


2014


2013


2012


(Use) source:


Accounts receivable


59


125


(22

)

Prepaid expenses


(1

)

(7

)

3


Income taxes receivable


1


(14

)

(10

)

Inventory


7


15


(3

)

Accounts payable, accrued liabilities, and provisions


8


(51

)

(8

)

Income taxes payable


(1

)

6


(16

)

Change in non-cash operating working capital


73


74


(56

)


TransAlta Corporation   |   2014 Annual Report

149


Notes to Consolidated Financial Statements


31.    Capital


TransAlta’s capital is comprised of the following:


Increase/


As at Dec. 31


2014


2013


(decrease)


Long-term debt1


4,056


4,347


(291

)

Equity


Common shares


2,999


2,913


86


Preferred shares


942


781


161


Contributed surplus


9


9


Deficit


(770

)

(735

)

(35

)

Accumulated other comprehensive income (loss)


104


(62

)

166


Non-controlling interests


594


517


77


Less: available cash and cash equivalents2


(43

)

(42

)

(1

)

Less: fair value assets of hedging instruments on long-term debt3


(96

)

(16

)

(80

)

Total capital


7,795


7,712


83


1              Includes finance lease obligations, amounts under credit facilities, and current portion of long-term debt.

2            The Corporation includes available cash and cash equivalents as a reduction in the calculation of capital as capital is managed internally and evaluated by management using a net debt position. In this regard, these funds may be available, and used to facilitate repayment of debt.

3            The Corporation includes the fair value of hedging instruments on debt in an asset, or liability, position as a reduction, or increase, in the calculation of capital, as the carrying value of the related debt has either increased, or decreased, due to changes in foreign exchange rates.


TransAlta’s overall capital management strategy and its objectives in managing capital have remained unchanged from Dec. 31, 2013 and are as follows:


A.              Maintain an Investment Grade Credit Rating

The Corporation operates in a long-cycle and capital-intensive commodity business, and it is therefore a priority to maintain an investment grade credit rating as it allows the Corporation to access capital markets at reasonable interest rates. Key rating agencies assess TransAlta’s credit rating using a variety of methodologies, including financial ratios. These methodologies and ratios are not publicly disclosed. TransAlta’s management has developed its own definitions of metrics, ratios, and targets to manage the Corporation’s capital. These metrics and ratios are not defined under IFRS, and may not be comparable to those used by other entities or by rating agencies.


As at Dec. 31


2014


20131


Target


Adjusted comparable funds from operations to adjusted interest coverage (times)


3.8


3.7


4 to 5


Adjusted comparable funds from operations to adjusted net debt (%)


16.9


15.2


20 to 25


Adjusted net debt to comparable earnings before interest, taxes, depreciation, and amortization (times)


4.2


4.6


3 to 4


1              Prior year figures have been restated to conform to the current year’s presentation. To align more closely to credit rating agencies’ calculation of key ratios, the Corporation now uses debt balances at period-end, includes finance lease obligations as debt and finance lease interest in interest, and treats 50 per cent of dividends paid on preferred shares as interest and 50 per cent of issued preferred shares as debt. In prior periods, the Corporation used average debt and did not treat preferred shares as debt or preferred dividends as interest.


Adjusted comparable funds from operations (“FFO”) to interest coverage is calculated as comparable FFO plus interest on debt (net of interest income and capitalized interest) divided by interest on debt plus 50 per cent of dividends paid on preferred shares less interest income. Comparable FFO is calculated as cash flow from operating activities before changes in working capital and is adjusted for transactions and amounts that the Corporation believes are not representative of ongoing cash flows from operations. Adjusted comparable FFO to interest coverage increased compared to 2013. The Corporation’s goal is to maintain this ratio in a range of four to five times.


Adjusted comparable FFO to net debt is calculated as cash flow from operating activities before changes in working capital less 50 per cent of dividends paid on preferred shares divided by total debt plus 50 per cent of issued preferred shares less cash and cash equivalents. Adjusted comparable FFO to net debt increased in 2014 compared to 2013 due to lower debt levels in 2014. The Corporation’s goal is to maintain this ratio in a range of 20 to 25 per cent.


150


TransAlta Corporation   |   2014 Annual Report


Notes to Consolidated Financial Statements


Adjusted net debt to comparable earnings before interest, taxes, depreciation, and amortization (“EBITDA”) is calculated as net debt (current and long-term debt plus 50 per cent of outstanding preferred shares less available cash and cash equivalents) divided by comparable EBITDA. Comparable EBITDA is calculated as earnings before interest, taxes, depreciation, and amortization and is adjusted for transactions and amounts that the Corporation believes are not representative of ongoing business operations. Adjusted net debt to comparable EBITDA in 2014 increased compared to 2013. The Corporation’s goal is to maintain this ratio in a range of three to four times.


At times, the credit ratios may be outside of the specified target ranges while the Corporation realigns its capital structure. During 2014, the Corporation took several steps to strengthen its financial position and reduce debt, using the proceeds from the sale of CE Gen, Blackrock, CalEnergy, and Wailuku (see Note 4), the secondary offering of TransAlta Renewables common shares (see Note 11), and the offering of preferred shares (see Note 25) to pay down credit facility borrowings, repay the scheduled maturity of a debenture, and increase liquidity. During 2013, the Corporation also used the approximate $221 million in gross proceeds from the initial public offering of TransAlta Renewables common shares (see Note 11) to pay down debt. The Corporation utilizes the proceeds from dividends reinvested under the Dividend Reinvestment and Share Purchase Plan as a continued source of equity.


Management routinely monitors forecasted net earnings, cash flows, capital expenditures, and scheduled repayment of debt with a goal of meeting the above ratio targets and to meet dividend and property, plant, and equipment expenditure requirements.


B.               Ensure Sufficient Cash and Credit is Available to Fund Operations, Pay Dividends, Distribute Payments to Subsidiaries’ Non-Controlling Interests, and Invest in Property, Plant, and Equipment


For the year ended Dec. 31, 2014 and 2013, net cash outflows, after cash dividends paid on common shares, property, plant, and equipment additions, and business acquisitions, are summarized below:


Increase


Year ended Dec. 31


2014


2013


(decrease)


Cash flow from operating activities


796


765


31


Dividends paid on common shares


(140

)

(116

)

(24

)

Dividends paid on preferred shares


(41

)

(38

)

(3

)

Distributions paid to subsidiaries’ non-controlling interests


(84

)

(55

)

(29

)

Property, plant, and equipment expenditures


(487

)

(561

)

74


Acquisition of Wyoming wind farm


(109

)

109


Inflow (outflow)


44


(114

)

158


TransAlta maintains sufficient cash balances and committed credit facilities to fund periodic net cash outflows related to its business. At Dec. 31, 2014, $1.6 billion (2013 – $0.9 billion) of the Corporation’s available credit facilities were not drawn.


Periodically, TransAlta accesses capital markets, as required, to help fund some of these periodic net cash outflows, to maintain its available liquidity, and to maintain its capital structure and credit metrics within targeted ranges.


During 2014, the Corporation completed a secondary offering of the common shares of TransAlta Renewables for gross proceeds to the Corporation of approximately $136 million; issued 6.6 million Series G preferred shares for gross proceeds of $165 million; issued U.S.$400 million of senior notes; and repaid $200 million of medium-term notes that matured.


During 2013, the Corporation issued $400 million of senior unsecured medium-term notes, received $221 million in gross proceeds from the initial public offering of TransAlta Renewables, and repaid U.S.$300 senior notes on maturity.


Dividends on the Corporation’s common shares are at the discretion of the Board. In determining the payment and level of future dividends, the Board considers the Corporation’s financial performance, its results of operations, cash flow and needs with respect to financing ongoing operations and growth, balanced against returning capital to shareholders.


TransAlta Corporation   |   2014 Annual Report

151


Notes to Consolidated Financial Statements


32.    Related Party Transactions


Details of the Corporation’s principal operating subsidiaries are as follows:


Ownership


Subsidiary


Country


(per cent)


Principal activity


TransAlta Generation Partnership


Canada


100


Generation and sale of electricity


TransAlta Cogeneration, L.P.


Canada


50.01


Generation and sale of electricity


TransAlta Centralia Generation, LLC


U.S.


100


Generation and sale of electricity


TransAlta Energy Marketing Corp.


Canada


100


Energy marketing


TransAlta Energy Marketing (U.S.), Inc.


U.S.


100


Energy marketing


TransAlta Energy (Australia), Pty Ltd.


Australia


100


Generation and sale of electricity


TransAlta Renewables Inc.


Canada


70.3


Generation and sale of electricity


Transactions between the Corporation and its subsidiaries have been eliminated on consolidation and are not disclosed.


Transactions with Key Management Personnel

TransAlta’s key management personnel include the President and CEO, the Chief Officers, the Executive Vice Presidents, and the Vice President, Gas and Renewables, all who report directly to the President and CEO, and the members of the Board.


Key management personnel compensation is as follows:


Year ended Dec. 31


2014


2013


2012


Total compensation


13


15


12


Comprised of:


Short-term employee benefits


8


7


8


Post-employment benefits


2


2


1


Other long-term benefits


1


1


Termination benefits


2


Share-based payments


3


3


2


33. Commitments


In addition to commitments disclosed elsewhere in the financial statements, the Corporation has entered into a number of fixed purchase and transportation contracts, transmission and electricity purchase agreements, coal supply and mining agreements, long-term service agreements, and agreements related to growth and major projects either directly or through its interests in joint ventures. Approximate future payments under these agreements are as follows:


Natural gas,


Transmission


transportation, and


and power


Coal supply


Long-term


other purchase


purchase


and mining


service


Non-cancellable


contracts


agreements


agreements


agreements


operating leases


Growth


Total


2015


43


12


159


119


11


207


551


2016


29


9


137


120


10


50


355


2017


13


3


44


105


8


175


348


2018


12


4


45


33


8


8


110


2019


7


2


46


31


8


94


2020 and thereafter


101


6


605


172


54


938


Total


205


36


1,036


580


99


440


2,396


152


TransAlta Corporation   |   2014 Annual Report


Notes to Consolidated Financial Statements


A.              Natural Gas, Transportation, and Other Purchase Contracts

Several of the Corporation’s plants have fixed price natural gas purchase and related transportation contracts in place. Other fixed price purchase contracts relate to commitments for services at certain facilities.


B.               Transmission and Power Purchase Agreements

TransAlta has several agreements to purchase 400 MW of Pacific Northwest transmission network capacity. Provided certain conditions for delivering the service are met, the Corporation is committed to the transmission at the supplier’s tariff rate whether it is awarded immediately or delivered in the future after additional facilities are constructed.


C.              Coal Supply and Mining Agreements

Various coal supply and associated rail transport contracts are in place to provide coal for use in production at the Centralia coal plant. The coal supply agreements allow TransAlta to take delivery of coal at fixed volumes and prices, with dates extending to 2024.


Commitments related to mining agreements include the Corporation’s share of commitments for mining agreements related to its Sheerness and Genesee Unit 3 joint operations, and certain other mining royalty agreements.


D.              Long-Term Service Agreements

TransAlta has various service agreements in place, primarily for inspections and repairs and maintenance that may be required on natural gas facilities, coal facilities, and turbines at various wind facilities.


E.               Operating Leases

TransAlta has operating leases in place for buildings, vehicles, and various types of equipment.


During the year ended Dec. 31, 2014, $10 million (2013 – $10 million, 2012 – $13 million) was recognized as an expense in respect of these operating leases. No sublease payments were received or made, nor were any contingent rental payments made in respect of these operating leases.


F.                Growth

Commitments for growth relate to the South Hedland power station, the Australian natural gas pipeline to the Solomon power station, and transmission upgrades.


G.             TransAlta Energy Bill Commitments

As part of the Bill and Memorandum of Agreement (“MoA”) signed into law in the State of Washington, the Corporation has committed to fund U.S.$55 million over the life of the Centralia coal plant to support economic and community development, promote energy efficiency, and develop energy technologies related to the improvement of the environment. The MoA contains certain provisions for termination and in certain circumstances this funding or part thereof would no longer be required.


H.             Other

A significant portion of the Corporation’s electricity and thermal production are subject to PPAs and long-term contracts. The majority of these contracts include terms and conditions customary to the industry in which the Corporation operates. The nature of commitments related to these contracts includes: electricity and thermal capacity, availability, and production targets; reliability and other plant-specific performance measures; specified payments for deliveries during peak and off-peak time periods; specified prices per MWh; risk sharing of fuel costs; and retention of heat rate risk.


34.    Contingencies


TransAlta is occasionally named as a party in various claims and legal proceedings that arise during the normal course of its business. TransAlta reviews each of these claims, including the nature of the claim, the amount in dispute or claimed, and the availability of insurance coverage. There can be no assurance that any particular claim will be resolved in the Corporation’s favour or that such claims may not have a material adverse effect on TransAlta. Inquiries from regulatory bodies may also arise in the normal course of business, to which the Corporation responds as required.


TransAlta Corporation   |   2014 Annual Report

153


Notes to Consolidated Financial Statements


35. Segment Disclosures


A.              Description of Reportable Segments

The Corporation has three reportable segments as described in Note 1.


A portion of operations, maintenance, and administration costs incurred in the Energy Marketing Segment and the Corporate Segment are allocated to other segments based on an estimate of operating expenses and a percentage of resources dedicated to providing support and services. Segment operations, maintenance, and administration costs are comprised of expenses net of intersegment allocations. In prior years, the Energy Marketing intersegment charge and recovery was presented as a distinct line item as a component of operating income (loss). Comparative figures have been reclassified to conform to the current year’s presentation.


B.               Reported Segment Earnings and Segment Assets


I.                     Earnings Information


Year ended Dec. 31, 2014


Generation


Energy Marketing


Corporate


Total


Revenues


2,515


108


2,623


Fuel and purchased power


1,092


1,092


Gross margin


1,423


108


1,531


Operations, maintenance, and administration


447


32


63


542


Depreciation and amortization


512


26


538


Asset impairment reversals


(6

)


(6

)

Taxes, other than income taxes


28


1


29


Net other operating (income) losses


(19

)

5


(14

)

Net operating income (loss)


461


71


(90

)

442


Finance lease income


49


49


Gain on sale of assets


2


2


Net interest expense


(254

)

Earnings before income taxes


239


Year ended Dec. 31, 2013 (Restated – see Note 3(B))


Generation


Energy Marketing


Corporate


Total


Revenues


2,213


79


2,292


Fuel and purchased power


948


948


Gross margin


1,265


79


1,344


Operations, maintenance, and administration


432


18


66


516


Depreciation and amortization


501


1


23


525


Asset impairment charges (reversals)


(18

)


(18

)

Restructuring provision


(2

)


(1

)

(3

)

Taxes, other than income taxes


26


1


27


Net other operating losses


46


56


102


Operating income (loss)


280


4


(89

)

195


Finance lease income


46


46


Equity loss


(10

)


(10

)

Gain on sale of assets


12


12


Net interest expense


(256

)

Foreign exchange gain


1


Loss before income taxes


(12

)


154


TransAlta Corporation   |   2014 Annual Report


Notes to Consolidated Financial Statements


Year ended Dec. 31, 2012 (Restated see Note 3(B))


Generation


Energy Marketing


Corporate


Total


Revenues


2,207


3


2,210


Fuel and purchased power


797


797


Gross margin


1,410


3


1,413


Operations, maintenance, and administration


401


16


82


499


Depreciation and amortization


489


20


509


Asset impairment charges


324


324


Restructuring provision


5


8


13


Taxes, other than income taxes


27


1


28


Net other operating losses


254


254


Operating losses


(90

)

(13

)

(111

)

(214

)

Finance lease income


16


16


Equity loss


(15

)


(15

)

Gain on sale of assets


3


3


Gain on sale of collateral


15


15


Net interest expense


(242

)

Other income


1


Foreign exchange loss


(9

)

Loss before income taxes


(445

)


Included in the Generation Segment revenue is $21 million (2013 – $22 million, 2012 – $23 million) of incentives received under a Government of Canada program in respect of power generation from qualifying wind and hydro projects.


Total rental income, including contingent rent, related to certain PPAs and other long-term contracts that meet the criteria of operating leases, is included in the Generation Segment revenues, and was $219 million for the year ended Dec. 31, 2014 (2013 – $208 million, 2012 – $188 million).


II.                    Selected Consolidated Statements of Financial Position Information


As at Dec. 31, 2014


Generation


Energy Marketing


Corporate


Total


Goodwill


432


30


462


Total segment assets


9,274


246


313


9,833


As at Dec. 31, 2013


Generation1


Energy Marketing


Corporate


Total


Goodwill


430


30


460


Total segment assets (Restated see Note 3(B))


9,093


244


287


9,624


1              Total Generation Segment assets include $192 million related to investments in joint arrangements accounted for using the equity method.


TransAlta Corporation   |   2014 Annual Report

155


Notes to Consolidated Financial Statements


III.                 Selected Consolidated Statements of Cash Flows Information


Year ended Dec. 31, 2014


Generation


Energy Marketing


Corporate


Total


Additions to non-current assets:


Property, plant, and equipment


481


1


5


487


Intangible assets


9


8


17


34


Year ended Dec. 31, 2013


Generation


Energy Marketing


Corporate


Total


Additions to non-current assets:


Property, plant, and equipment


554


7


561


Intangible assets


5


6


21


32


Year ended Dec. 31, 2012


Generation


Energy Marketing


Corporate


Total


Additions to non-current assets:


Property, plant, and equipment


684


19


703


Intangible assets


7


1


31


39


IV.               Depreciation and Amortization on the Consolidated Statements of Cash Flows

The reconciliation between depreciation and amortization reported on the Consolidated Statements of Earnings (Loss) and the Consolidated Statements of Cash Flows is presented below:


Year ended Dec. 31


2014


2013


2012


Depreciation and amortization expense on the Consolidated Statements of Earnings


538


525


509


Depreciation included in fuel and purchased power (Note 5)


56


58


41


Gain on disposal of property, plant, and equipment


1


2


14


Depreciation and amortization on the Consolidated Statements of Cash Flows


595


585


564


C.                Geographic Information

I.                         Revenues


Year ended Dec. 31


2014


2013


2012


Canada


1,989


1,898


1,789


U.S.


516


287


300


Australia


118


107


121


Total revenue


2,623


2,292


2,210


II.                     Non-Current Assets


Property, plant, and


equipment


Intangible assets


Other assets


Goodwill


As at Dec. 31


2014


2013


2014


2013


2014


2013


2014


2013


Canada


6,422


6,538


296


295


66


57


417


417


U.S.


552


517


25


24


14


21


45


43


Australia


264


138


10


4


18


19


Total


7,238


7,193


331


323


98


97


462


460


D.              Significant Customer

During the year ended Dec. 31, 2014, sales to one customer in the Generation Segment represented 12 per cent of the Corporations’s total revenue.


156


TransAlta Corporation   |   2014 Annual Report


Notes to Consolidated Financial Statements


36. Subsequent Events


A.              Restructuring

On Jan. 14, 2015, the Corporation initiated a significant cost-reduction initiative at the Corporation’s Canadian Coal operations, resulting in the elimination of positions. Costs associated with the initiative are expected to total $10 million.


B.               Bond Issuance

On Feb. 11, 2015, the Corporation and its partner issued bonds secured by their jointly owned Pingston facility. The Corporation’s share of gross proceeds was $45 million. The bonds bear interest at the annual fixed interest rate of 2.95 per cent, payable semi-annually with no principal repayments until maturity in May 2023. Proceeds were used to repay the $35 million secured debenture bearing interest at 5.28 per cent. Excess proceeds, net of transaction costs, are to be used for general corporate purposes.


TransAlta Corporation   |   2014 Annual Report

157


EX-23.1 5 a15-3974_1ex23d1.htm EX-23.1 CONSENT OF ERNST & YOUNG LLP CHARTERED ACCOUNTANTS.

Exhibit 23.1


Ernst & Young LLP

1000, 440 2nd Ave SW

Calgary, AB T2P 5E9

Tel: +1 403 206 5000

Fax: +1 403 290 4265

ey.com/ca


CONSENT OF INDEPENDENT REGISTERED PUBLIC ACCOUNTING FIRM


We consent to the use of our reports dated February 18, 2015 with respect to the consolidated financial statements of TransAlta Corporation as at December 31, 2014 and 2013 and for each of the years in the three year period ended December 31, 2014, and internal control over financial reporting as of December 31, 2014 of TransAlta Corporation, included as an exhibit to or incorporated by reference in the Annual Report (Form 40-F) for 2014.


We also consent to the incorporation by reference in the following Registration Statements:


(1)      Registration Statement (Form S-8 No. 333-72454 and No. 333-101470) pertaining to TransAlta Corporation’s Share Option Plan


(2)      Registration Statement (Form F-10 No. 333-200773) pertaining to the registration of Debt and Equity Securities of TransAlta Corporation


of our reports dated February 18, 2015, with respect to the consolidated financial statements of TransAlta Corporation as at December 31, 2014 and 2013 and for each of the years in the three year period ended December 31, 2014, and internal control over financial reporting as of December 31, 2014 of TransAlta Corporation, included as an exhibit to or incorporated by reference in the Annual Report (Form 40-F) of TransAlta Corporation for the year ended December 31, 2014.


signed “Ernst & Young LLP”


Calgary, Alberta

Chartered Accountants

February 18, 2015


A member firm of Ernst & Young Global Limited


EX-31.1 6 a15-3974_1ex31d1.htm EX-31.1 CERTIFICATION OF PRESIDENT AND CEO PURSUANT TO SECTION 302 OF THE SARBANES-OXLEY ACT OF 2002

Exhibit 31.1


I, Dawn L. Farrell, certify that:


1.

I have reviewed this annual report on Form 40-F of TransAlta Corporation;


2.

Based on my knowledge, this report does not contain any untrue statement of a material fact or omit to state a material fact necessary to make the statements made, in light of the circumstances under which such statements were made, not misleading with respect to the period covered by this report;


3.

Based on my knowledge, the financial statements, and other financial information included in this report, fairly present in all material respects the financial condition, results of operations and cash flows of the issuer as of, and for, the periods presented in this report;


4.

The issuer’s other certifying officer(s) and I are responsible for establishing and maintaining disclosure controls and procedures (as defined in Exchange Act Rules 13a-15(e) and 15d-15(e)) and internal control over financial reporting (as defined in Exchange Act Rules 13a-15(f) and 15d-15(f)) for the issuer and have:


a)

Designed such disclosure controls and procedures, or caused such disclosure controls and procedures to be designed under our supervision, to ensure that material information relating to the issuer, including its consolidated subsidiaries, is made known to us by others within those entities, particularly during the period in which this report is being prepared;


b)

Designed such internal control over financial reporting, or caused such internal control over financial reporting to be designed under our supervision, to provide reasonable assurance regarding the reliability of financial reporting and the preparation of financial statements for external purposes in accordance with generally accepted accounting principles;


c)

Evaluated the effectiveness of the issuer’s disclosure controls and procedures and presented in this report our conclusions about the effectiveness of the disclosure controls and procedures, as of the end of the period covered by this report based on such evaluation; and


d)

Disclosed in this report any change in the issuer’s internal control over financial reporting that occurred during the period covered by the annual report that has materially affected, or is reasonably likely to materially affect, the issuer’s internal control over financial reporting; and


5.

The issuer’s other certifying officer(s) and I have disclosed, based on our most recent evaluation of internal control over financial reporting, to the issuer’s auditors and the audit committee of the issuer’s board of directors (or persons performing the equivalent functions):


a)

All significant deficiencies and material weaknesses in the design or operation of internal control over financial reporting which are reasonably likely to adversely affect the issuer’s ability to record, process, summarize and report financial information; and


b)

Any fraud, whether or not material, that involves management or other employees who have a significant role in the issuer’s internal control over financial reporting.


February 19, 2015

/s/ Dawn L. Farrell


Dawn L. Farrell


President and Chief Executive Officer


EX-31.2 7 a15-3974_1ex31d2.htm EX-31.2 CERTIFICATION OF CFO PURSUANT TO SECTION 302 OF THE SARBANES-OXLEY ACT OF 2002.

Exhibit 31.2


Certifications


I, Donald Tremblay, certify that:


1.

I have reviewed this annual report on Form 40-F of TransAlta Corporation;


2.

Based on my knowledge, this report does not contain any untrue statement of a material fact or omit to state a material fact necessary to make the statements made, in light of the circumstances under which such statements were made, not misleading with respect to the period covered by this report;


3.

Based on my knowledge, the financial statements, and other financial information included in this report, fairly present in all material respects the financial condition, results of operations and cash flows of the issuer as of, and for, the periods presented in this report;


4.

The issuer’s other certifying officer(s) and I are responsible for establishing and maintaining disclosure controls and procedures (as defined in Exchange Act Rules 13a-15(e) and 15d-15(e)) and internal control over financial reporting (as defined in Exchange Act Rules 13a-15(f) and 15d-15(f)) for the issuer and have:


a)     

Designed such disclosure controls and procedures, or caused such disclosure controls and procedures to be designed under our supervision, to ensure that material information relating to the issuer, including its consolidated subsidiaries, is made known to us by others within those entities, particularly during the period in which this report is being prepared;


b)     

Designed such internal control over financial reporting, or caused such internal control over financial reporting to be designed under our supervision, to provide reasonable assurance regarding the reliability of financial reporting and the preparation of financial statements for external purposes in accordance with generally accepted accounting principles;


c)     

Evaluated the effectiveness of the issuer’s disclosure controls and procedures and presented in this report our conclusions about the effectiveness of the disclosure controls and procedures, as of the end of the period covered by this report based on such evaluation; and


d)     

Disclosed in this report any change in the issuer’s internal control over financial reporting that occurred during the period covered by the annual report that has materially affected, or is reasonably likely to materially affect, the issuer’s internal control over financial reporting; and


5.

The issuer’s other certifying officer(s) and I have disclosed, based on our most recent evaluation of internal control over financial reporting, to the issuer’s auditors and the audit committee of the issuer’s board of directors (or persons performing the equivalent functions):


a)     

All significant deficiencies and material weaknesses in the design or operation of internal control over financial reporting which are reasonably likely to adversely affect the issuer’s ability to record, process, summarize and report financial information; and


b)     

Any fraud, whether or not material, that involves management or other employees who have a significant role in the issuer’s internal control over financial reporting.


February 19, 2015

/s/ Donald Tremblay


Donald Tremblay


Chief Financial Officer


EX-32.1 8 a15-3974_1ex32d1.htm EX-32.1 CERTIFICATION OF PRESIDENT AND CEO PURSUANT TO SECTION 906 OF THE SARBANES-OXLEY ACT OF 2002

Exhibit 32.1


CERTIFICATION PURSUANT TO

18 U.S.C. SECTION 1350,

AS ADOPTED PURSUANT TO

SECTION 906 OF THE SARBANES-OXLEY ACT OF 2002


In connection with the Annual Report of TransAlta Corporation (the “Company”) on Form 40-F for the year ended December 31, 2014 as filed with the Securities and Exchange Commission on the date hereof (the “Report”), I, Dawn L. Farrell, President and Chief Executive Officer of the Company, certify, pursuant to 18 U.S.C. Section 1350, as adopted pursuant to Section 906 of the Sarbanes-Oxley Act of 2002, that to the best of my knowledge:


1.    The Report fully complies with the requirements of Section 13(a) or 15(d), as applicable, of the Securities Exchange Act of 1934, as amended; and


2.    The information contained in the Report fairly presents, in all materials respects, the financial condition and result of operations of the Company.


/s/ Dawn L. Farrell


Dawn L. Farrell


President and Chief Executive Officer


Dated: February 19, 2015


The foregoing certification is being furnished solely to accompany the Report pursuant to 18 U.S.C § 1350, and is not being filed for purposes of Section 18 of the Securities Exchange Act of 1934, as amended, and is not to be incorporated by reference into any filing of the Company, whether made before or after the date hereof, regardless of any general incorporation language in such filing.


EX-32.2 9 a15-3974_1ex32d2.htm EX-32.2 CERTIFICATION OF CFO PURSUANT TO SECTION 906 OF THE SARBANES-OXLEY ACT OF 2002.

Exhibit 32.2


CERTIFICATION PURSUANT TO

18 U.S.C. SECTION 1350,

AS ADOPTED PURSUANT TO

SECTION 906 OF THE SARBANES-OXLEY ACT OF 2002


In connection with the Annual Report of TransAlta Corporation (the “Company”) on Form 40-F for the year ended December 31, 2014 as filed with the Securities and Exchange Commission on the date hereof (the “Report”), I, Donald Tremblay, Chief Financial Officer of the Company, certify, pursuant to 18 U.S.C. Section 1350, as adopted pursuant to Section 906 of the Sarbanes-Oxley Act of 2002, that to the best of my knowledge:


1.    The Report fully complies with the requirements of Section 13(a) or 15(d), as applicable of the Securities Exchange Act of 1934, as amended; and


2.    The information contained in the Report fairly presents, in all materials respects, the financial condition and result of operations of the Company.


/s/ Donald Tremblay


Donald Tremblay


Chief Financial Officer


Dated: February 19, 2015


The foregoing certification is being furnished solely to accompany the Report pursuant to 18 U.S.C § 1350, and is not being filed for purposes of Section 18 of the Securities Exchange Act of 1934, as amended, and is not to be incorporated by reference into any filing of the Company, whether made before or after the date hereof, regardless of any general incorporation language in such filing.


GRAPHIC 10 g39741kmi001.jpg GRAPHIC begin 644 g39741kmi001.jpg M_]C_X``02D9)1@`!`0$`8`!@``#_VP!#``H'!P@'!@H("`@+"@H+#A@0#@T- M#AT5%A$8(Q\E)"(?(B$F*S7J#A(6&AXB)BI*3E)66EYB9FJ*CI*6FIZBIJK*SM+6VM[BYNL+#Q,7& MQ\C)RM+3U-76U]C9VN'BX^3EYN?HZ>KQ\O/T]?;W^/GZ_\0`'P$``P$!`0$! M`0$!`0````````$"`P0%!@<("0H+_\0`M1$``@$"!`0#!`<%!`0``0)W``$" M`Q$$!2$Q!A)!40=A<1,B,H$(%$*1H;'!"2,S4O`58G+1"A8D-.$E\1<8&1HF M)R@I*C4V-S@Y.D-$149'2$E*4U155E=865IC9&5F9VAI:G-T=79W>'EZ@H.$ MA8:'B(F*DI.4E9:7F)F:HJ.DI::GJ*FJLK.TM;:WN+FZPL/$Q<;'R,G*TM/4 MU=;7V-G:XN/DY>;GZ.GJ\O/T]?;W^/GZ_]H`#`,!``(1`Q$`/P#V:BBB@`HH MHH`****`"BBB@`HJ*6YAA^_(`?3J:I2ZKVAC_%O\*X,3F.%PW\2:OVW9I&E. M6R-&J\M];Q<%]Q]%YK)EN9IOOR$CT[5%7SF)XED]*$+>;_R_X)TQPO\`,SH8 MI!+$L@&`PSBBF6G_`!Z1?[HHKZRA)SI1D]VE^1R25FT34445L2%%(2%&20!Z MFJLNI01\*3(?]GI^=<]?$T<.KU9)%1A*6R+=,>5(AEW"CW-94NI3R<)B,>W6 MH!%/,V=CN3W(->#6X@@WRX:#D_Z^?Y'1'#O>3L:$NJ1KQ$I<^IX%4I;ZXEX+ M[1Z+Q3DTZY;J@7ZFITTEOXY0/H,UYE5YSC=.5I=OA7XZFJ]C`SZ2M=-+@7[S M.WXXJ9;*V3I"I^O/\ZBGPYBY:S:7XC>)@MC#`+'`!)]JE2TN'^["WXC%;H4* M,*`/H*6O1I\,TU_$J-^BM_F9/%/HB*W1H[>-&&&"X(HJ6BOJ*<%""@NFARMW M=Q"2!P"?85"_VE^%V1CU/S&IZ*52GSZ7:]-/^""=BD=/\PYFG=S^52)I]LG_ M`"SS]3FK-%VGEA8S8)C?]_P!O\:W[[4+W5/#\6IV=Y/%/:_N[J.*5E!]&P#_G/M6O]O\`"']RP_\` M`8?_`!-:6G+H]W:RMIT-N89,QR>5$%#<=#P,\']:`//;3Q!J=M=Q3-?7,JHP M+1O,Q##N"":]%NM5M[?1VU,,&B\O>G^UGH/SKS?6]+?2-3DMCDI]Z-CW4]/\ M*B?4[F32XM.9_P!Q$Y<#Z]OY_G0`]]UO(= M+6>^N)YII\/B60ML7L.>GK_^JN,\+:/_`&KJBF1D0Q#!DD'F M2,.['_#I6I4-I_QYP_\`7-?Y5-0`4444`%%%%`!1110!2U/2K75H$ANU9D1M MPVMCG&/ZUF_\(5HO_/*7_OX:L>(+VZLXK46LC1M--L8K#YIQM)X7OTJMHVOR MW"QP78WS/),H8+L("`'YE[$YZ4`+_P`(5HO_`#RE_P"_AI5\&:,CAA%+D'(_ M>&LA?%-]/X@1(Y=EI*8<1LBDJ&*9YQGN?SJQJ7B:\>UEFLXWMH_LWFQ.ZJ2_ M[U%SW[$\'UH`Z>[MHKVUDMI@3'(NU@#CBL;_`(0K1?\`GE+_`-_#4O\`PDL* MW,LK!AG'52:IP>)Q#`6O[>1?\`7,DB@;9- MC$8`SZ8'-`'0T5S^LW5C M.T<84J,X)R.O;`S[F@#I:*Q[#Q#'J-VL%M:3,I17:3C"`CO^/%;%`!1110!G MZK;6=V(([JY>!E^X#]* MNZ]I4FK6*PPR".17#!B<<$$,/R)K,A\,7-H!)#)!++'<%HTF+%#'MVJ#QU`- M`#?[(\/6=TMT+UGD1$=(O.4[@H!7`QSG;ZU#=V6D):P1QO.XNWBMFC^TGK59;'P[Y M3S/?++"Q>/Y[@%$+\G'H3C]*JVO@^X3_`%]VI+0.CE23\Y!53TZ!34T?ANZ> M:*6X%F`LT):.,':5C5AGD\F1+>Y!2=[GEVV@_*<],&I[ M31]/U*S%Y&;F(7#^>H$I!C8YSCTSGFH;CP_=F\>Y@-JW[YV2*7.S:R!>0!U& M*U])M)+'2[>UE*EXD"L5/%`"VFG064TLL._=*J*VYMW"@@=?K5NBB@`HHHH` >****`"BBB@`HHHH`****`"BBB@`HHHH`****`/_9 ` end GRAPHIC 11 g39741fii001.gif GRAPHIC begin 644 g39741fii001.gif M1TE&.#EAU``W`/0```````L+"Q04%!L;&R0D)"PL+#,S,SP\/$-#0TQ,3%14 M5%M;6V1D9&MK:W1T='Q\?(.#@XR,C).3DYN;FZ2DI*NKJ[2TM+R\O,/#P\O+ MR]/3T]O;V^/CX^SL[/3T]/[^_B'Y!```````(?XU($EM86=E(&=E;F5R871E M9"!B>2!!1E!,($=H;W-T.9&F>:%IZ']9T:BS/=&W?>*[O/'<`&IYP2"P:C\B1AP"0))_0 MJ)`E%5X`"&IUR[5Q*HY-E^OQ-``%V'C--G4*`,+DYHE8UMJ8`K!0M_]M'180 M3C43`P$#>8`B+!T)``$PBXR51I0U+!-Q$@*84!P9*AX_`7>6J$\:#8T?GRL? M%@`,&@<#:W`8*!L_``JNJ<$R'0T.P"8L&3^OK24=!A`?9Q1C&@$!0514&`$& M`P`7PIEES$\>%`5P?LB(NC<;!L826,=52P"L2BT&^!PP[,*G0;D:$;C'G1QGP#..(!ECN;\NUPY$Y*!"86 M@HS8@&5=%`P*!A!8M$&!````YL20$,#BAPT"!(B1%:%>E0QQ_4B`\X#*GI4\ M((5+PL)"10AB],4"QX5D(6(*^*$%4,&NB3-H1'3X0>U#@0-C6'#&^#```84> M.#JQF4(#'`*)DW`X>PI%`@-0YGA@`.`.ZR$9 MT'I#JT`-E0,"O.8H!?C(&YJ6E2P`\#P'BXH2%B!P0&'P!V\S-HQ7N`?TAX8' MM$/YB"```@,'(.`>,!$X=!-:=97^1\,&!M6$`@L+!*`@#A<(%02`I@TP&P1P`#,8 M]!:'1A7TIA$':)CX8!$L!%DC)@@,T%T.>R0@Q0#9Q<""`@A$P8)3-9+PW8#( ME`*`*#T*H!4DL7'!S8#5P`(D!0$$!`1]T2E2`AH1]L&?(U!0&P_WB)0"H#>!\3^\,&:!75-)4T3,7"DXPQ::&%-C%4(8$RWY";!!*E72'5"!TP`@*>@ M'8D0Y`)LS!.FKF=8&JY$VF60@0?\P(DC`3+TJ^'$S`1`*=70#)`^,A8/%PBNW`7+`HU3%@0,%#(!`!`?$Z]]9 M&(RG``5[)N"'!@8LX."[$"_]G8/_CJ+*V(,5F(. MX3)8``+,XU0?,)0T!-`6&,`.`@9I@`$L%(D^6`-?K`D2H'06+\=M:U)%L$`W MH%:"_FBD`WN0H`C&`X`#:*0H`\#^P,H4`A9ZM*`!*00/"2XP"2808(,DR``# M%D!'!K2%`(Z3P%6.\Q$*X.Q+`+B04P0`@1)&H&,#F$`%#("G#CC@'QA```\M M`B/)08`#OBL``R20&`(0H%@G*$H63!"*!TP@.M$PX`I*V$4J`L,?$\`D/VCA M"@YPD0$LZ$0#]B*`SG``,Z=R`1H0UYP/5.""H!,!7CB5.04<(`$%\0\"&."4 MWXD`1N?Z@*6BPS,,)%(#D#B4G'P!KWE)A@($6$!#K"2!@BD3+6U:D>U&08H! MY"D%!D"8=RHR@'G8YU\>$(OOT/+/#_2-9QXX"T1.HTS>X,8GG<':!YP22+:, MCUH2^`_^(P]P``-(0`U%8%(`\:#TVVM304=J$@!S@J,,SR07GUAD`'\$8#N7`$T M'.E2!19```-,(`'^F&E#>BF",XP2&#""8@P*)*]XW),$1<)9$3)@$&K(AZ`* M8``#$J">7A3``D41G0AFX[>@G@4!&)@$<^!0@`U@@``,C$`$JU(OO$DDAS^( M:0HX@(A)!+0ZGZ()1-S#@@)EX0T(HT#:9C&`"B0@`(X;0`+^LC$/X(X`1CB< M00?VU,4'P(A0&10``AXK!`H@`C`0,.'B)M.9/67+!UU,C"P`$('.:=,I,0FD M`1CP0`@(P).=R=L!K!DG0'(K!KP]0!!*"`,-(&(64-O34!MR@894H!06:`@! MH@3'LI6`(TB4`7^ZN!(%2$),S)E;KP1GM]OZ[@("RX`&N,&*58D$$@"X(NP" MZ9D*P*4)#WB),UMA`?6$$1@=6(``]M4SM%0E!2RPXP8XDA3,=$H+$AY!`@BP M)PJLR$`^*8!(S!`'/T09`:Y$@=#3D@1[PQ1I#X(8`*>("9XP7&:SO^:KM-\.P$IL3(&0R@-%(V@8<:F2_G2K"G MF++`9@AZ"QHT4I%LDID`@')%`;0X`^8H0,4"L,]WW,4#G?%!Q>]TC@=DD=0" MB2(#W[@#!+CDELCY)PA]RZ8K&B+F>ORY;5N1`(XA`$H4_``!A<@``FPWSL.* MNB1]5,/K6N&!*9J``O:E`0-T:X(!U`6^%QU"=3D8QYEJ)@!98H$#!(`1'@** M&R')8)Y>9.]6<',2`%,!!^9(RQOP5K*PR&`#E-2!A-2I"API0)00).<1C%E7 MT5$(<]220ZF:6%Z:D:2;WU5G$CQ`(P94T(JBQ9(*_A"@.[S6.7`*$%]Z";;<*:W?(`-/ M#@V(?N24*45.M\GX+\*]3B#*$(#);%^Z)A:`)&6[-`XD(&W+XYZ2!10(UW%? M^@*XYT)M;&J#FCA>X#LX4P,(9_%LIU5O^J*/3;`:`__M.!D^L`DFA!WR-2^2 MXDL0).$X0@`#@#;;AP='T&N]0`V`FE!$.P*WNKX1`KR]UED`@53I0Q;>UF9O MR*O[XH?^`HLPR`-]I<;B:][X6[A7"39! GRAPHIC 12 g39741fii002.gif GRAPHIC begin 644 g39741fii002.gif M1TE&.#EAR``D`/?Q``````$!`0("`@,#`P0$!`4%!08&!@<'!P@("`D)"0H* M"@L+"PP,#`T-#0X.#@\/#Q`0$!$1$1(2$A,3$Q04%!45%186%A<7%Q@8&!D9 M&1H:&AL;&QP<'!T='1X>'A\?'R`@("$A(2(B(B,C(R0D)"8F)B7E]?7V!@8&%A86)B8F-C8V1D9&5E969F9F=G9VAH:&EI M:6IJ:FMK:VQL;&UM;6YN;F]O;W!P<'%Q<7)R'EY>7IZ>GQ\?(&!@8*"@H.#@X2$A(:&AH>'AXB(B(F)B8J*BHN+BXR,C(V- MC8Z.CH^/CY"0D)&1D9*2DI.3DY24E)65E9:6EIF9F9J:FIN;FYR MGI^?GZ"@H*&AH:*BHJ.CHZ2DI*6EI::FIJ>GIZBHJ*FIJ:JJJJNKJZRLK*VM MK:ZNKJ^OK["PL+&QL;*RLK.SL[2TM+6UM;:VMK>WM[BXN+FYN;JZNKN[N[R\ MO+V]O;Z^OK^_O\#`P,'!P<+"PL/#P\3$Q,7%Q<;&QL?'Q\C(R,G)RWM_?W^#@X.'AX>+BXN/CX^3DY.7EY>;FYN?GY^CHZ.GIZ>KJ MZNOKZ^SL[.WM[>[N[N_O[_#P\/'Q\?+R\O/S\_3T]/7U]?;V]O?W]_CX^/GY M^?KZ^OO[^_S\_/W]_?[^_O___P`````````````````````````````````` M`````````````````````"'Y!```````(?XU($EM86=E(&=E;F5R871E9"!B M>2!!1E!,($=H;W-T&\<*$T3@K M@"20'S$FO!+@6W@6O#3^'R-`(("G@=?=$@R; MI'A4A`._/7@0G2U5T`GS6][F2=$OM^E%Y(=<4@DDW!4,8==30@,N$`!^`JWS MS3;?X%0.(`&T,)N"'2641!,#B?/``M5I-9LG`70#,L,%N$`KTRP0.,:);0,0X&$``%D2#4WIAH94?AA]XM6-4UVWQH%#BF")'`,J! MA*&2J.T:IJ9`"K0;:&JM!9:GW"DDWZ@!U#"%)*'$*:V8KP2`I;-ZL#K!%LO@ MI-=L1D:0%N%T"&(2!HU/C/($`:E9)&:S"[4(&4A4G3>O0+Z6 M]QM$XLSU1``@=@><)++%DZ4XH^!1PP(4`!(--A,0(`D*2MJQG$)O+2P12Z4) MG%>HH>Z0!)[QU,"G6P8/](Q[0/(B7`!Z9)GGT1''@T8`HRR5T#>C_.CDC4"& M5<(VCGR)D7!N:#QP3B7P()1"Y9@U'\TB>%*=F%\/I,ABZGF4T+"EJ9?8$YC4 MM\[^;%2I&`\V>J`L0F;:!;""S(E=$0HF$_!PV#*&TKP`T#Z+,/EQ:XH%$LG0 MBK.`*=DEL9='T0"ZA2G8\%).CL>TPA*V$$*TC-H@U;:`CB^58WF)/*-WE7P4 M;+,-!@\D\02@(R?I54*[(2C03U0+)$S7"$^`PA--@#J!WO%$\X&28R$:CQ$4 M_(BA:YLM@"=PY1!00TK>.88MFSPHBJBB35`N4+!AH!Q`"9:*QPZ@0Y!T<<0B MOO+#CBR3$`SQ8`8MJ`Z*\.`&-R5%(-B(TH;B(2*EI&==`D&154)(G3PMK3PB MJ$$)$F(6]`G'-6%!0Y_(%@\4(0;9(@"=\3WT"^48`;J.7%AB*#.L)CWJ6\3T/5M%B$9D! M!H#TC`_PX$?/H$`+"#>S('A%/K<#B5G\IA&,)0%E"NO(%L_2)Q0%(`CQ6-4" MCC.7E<`(GB@:&N>1$H)2I'"\05CXE!2$0+6$=;WAI4!,;(8`*A(TP:"Y<-Q3E`[`( M$E.>9)L!B`=5'N"(&PUM!1O^DV5Q7NBLS"5K)?^36`"H!\5XCD*,^NEEJ`B` M3&SX:IT/H")$1A&]C)"1=PF96"B$DQF<-+$ZN\D45[X7@">VK"!-A"5+[$*P MB[PNE#4$2F>6!C6:.0X#+3BH7>)"G)A.X15D6$`89B$Z2XV&E/$03M/28Z5X M\.)!:5Q3>4[R#3PL"1?;D*5$NQ,/)6YD-[?14Y)X@I/:$$">25#4;<+"IJ[A M9!FAB$Y"?O&!&6RC;"SUU0SBRD'<*<012BH6PA`:C]W,0%$/",,W=F,7X0@C M'J9@TXV>(0(V192-01A%*$!%@>J(CG=A08C[\F0E;#U@!IYHDE:STXK1&6=` MSP3^R<0HEJ?$H&9B#@K*S,C#3F>QB@*,L,@W0/>,![AQ(-&H%P$4M3.6Q6,T M#MJI)K%HD=(&P!'=H\`,!%(.E#E($78(@`PU%@I6+68VS]@ES<:+E.8*)"RI MJ5=]PL*J&HR"!T9X+)">XU?U\.(S&\%&\?I26OPDY!E)FH"#>,$(Q;2BLFQ2 MV&PFY@E%S0`0F9$$JP!YM&:W.&B#FQTT"2$"N)`"K&(6-L M?>:@%0ZD"10(`Z`"X+AU)(9-Y7DD2,*5J6:R"4Y2@KA%'Y)9$M6BLS2#8P("5%;*,)O(@@!8E*%?U MPIMU-&$"+L%%#2HUD')D352NN8XAO@>A,X(=1<&_@\H0JO`_NEBD3 MZN)8RB+B GRAPHIC 13 g39741bgi001.gif GRAPHIC begin 644 g39741bgi001.gif M1TE&.#EA&P%,`/8``"LK*T5%14Q,3%145%U=761D9&UM;7-SP"-O@"0 MOP"5PP&;Q@^=QP^?R`^AR1"AR1FERR:JSBNKSRRLT#"MT#BQTD*UU%[`VV+! MW&G$W?],%O]/&?]2'?]6(_]9)O]=*_]@+_]C,_]G./]K/?]N0?]Q1O]U2O]X M3_]\4_]_6/^!6_^&8?^)9?^.:_^4<_^;?(6%A8>'B(N+BY.3DYN;FZ.CHZNK MJ[2TM+R\O(3/XY/5YZ/;ZJK=[+KD[[SE\/^?@?^AA/^FB_^HC?^ME/^PE_^R MF_^WH/^YH_^^JO_!KO_$LO_(M__+N\/#P\S,S-/3T]SOW^N_X^__GX/_IX__N MZ?_Q[?3T]/7Z^__U\O_Y]_[^_@`````````````````````````````````` M`````````````````````````````````````````````````"'Y!``````` M+``````;`4P```?^@&J"@X2%AH>(B8J+C(V.CY"1DI.4E9:7BVEHAVE::9B% M95J&FI-B8H>GB%J;GZ"OL+&RLY@O(DV$GTT@95D?66JNI&IE262#PH*?,"F& M0"!,R,/*)S!J)4/!A25"VFI'(F5;'UQ<(+A*P-ZT[.WN[X]B(R`OAE<@9&)! MJ(M8'67K##$K1*8$B!:/B"RY1N10B8:#L@3I1*Y,$"YJ0!QA9,:+&H^"S*@Q MTP6>R9,H&1$Y(43$,4%;E@P1,:;,%35DF'S"@B58DR6>B(PP@C'-$IW*?K)0 M4<@("B$@,&X!@DH,KC%-E(Q2DV4,0S58@0K"A@4IFIM:0'BZDN;*B!?^6K0$ MV625D)<;77#<>*(FBA,U9VZ`3$FX,#R693YL5*,$!`H2(\YR.-L!XXH5:EZ< M8,&BS`H1)8Z@6=&"=)HT*T:D"(&94(HA9#P44-4"0E>D\%9; M(:`"`PDPO/!"%C`PI480"WXRQ`=%'GE3$B0H0<(Q2+!`A`H(_=:A&G$2L0(+ MU\R6Q@A)^))B5%Q\P**+@A1A@INMJ($#2$]X=R->'_D8Y*68(I)&"2\PP802 M(70SPD10T7>6H6)PFL8Q6W1PH@>C%"'")VB@001-9(`XR`DM>+J$"-:08<); M:FC104^D?56"$6(UV1S!:PH-EB.6BU"Q$4)(U@SB&"#0.%=%'ZI\41Y MF::;J1()00*O(V`F0C8B$,$PQYBEX#!_$O]C73D=C.*" M!]Z^X$%/KC@!A2!1Y&`N#H_>)9*Z0`>I!2[!I#&&.EA<@08N6"!(VQ)E<-&3 M&$Q`+<@88K6UA+ME+,&%&#?!A,MI:HB1Q2=4NR*&$J?TU`1&;Y>M1#DWC7&% M5H+DI(E.:#`!4-\]J3%$"87TZ%$79PCR1!=W#1;TXY!K44()_D%^21DN@&!A M(3L>TKGEH&>JMA!;!61Z+H4D(TTCR:BN*2>(H#$$T:R';OOMN.>N^^Z\L^-Z M[\`'+_SPQ!=O_/'()Z_\\LPW[_SST$]"M[.<6;X63`T.))"?&$'(`RA"$=(PA*: M\(0H3*$*5\C"%KKPA3",H0QG6$(>Q&\P9W!<(9Y0@`$8P",V(``!;*"&&P@@ M!NA#P`!`DC@?+.")4&0`%*TYWPC".0`./@(`6)@@Y^=P9`TT*8: M$#`#-214#080S!*]$4YY6O2B&,VH1C?*T8Z.TYZ"\$(-9C"`*/@3HCK;9A=D M<$TUQ``!@LC!``0Q@(#2``&`/,`!`H``]TV!EQ=UY3I/*52/HC*H2#6E46U9 MU'0VU0$@%004$.#^(P30P`D$Z$(-NI`C!-"Q!@!`0$3/($<#&`"?U-P1%`)) MB!^D\:UPC:M($&,8B"%V+0A9O:('$WT@M?TH"C M043A9H-`ER"J<('*6O:RF,VL9BV@V#:UH1SM:T)+VM*A-K6I7R]K4 M6O"USW/%=M*7B&1$$+:XS:UN=\O;WOKVM\`-KG!SI[K;#A<6%#QNZI3+7'=X MP0DY$!\4'H6SFW$UF86H0@6V2X'M>I<"W>6N>+\;WN]6(+SH]>YYRUM>]7*7 MO>-]KWN["]_XVA>\YE4O?=L;W@GH8!"$-,,9NL`X^N5`LL?E&0ZNZ03^&N2` ML%V804-Y=@,:Z"^<6_REAJO83C5N,HH>5N,O03Q)*HIQQ"7^\!7;*I@`P<<@8YD`$49#"#`D1!#3.X00V(V%Q!T$"D(H$"$9&XVM2PON2K M7UE)6*;ZDY6LLI%M\."[$-$&A<5R0YD;@QG^#'G`,Z!!#43BA5_3P,&%<"M> MI]W%&5.[BPFX0&1SX)$HB.0)'CFP<7V[(P(/0M3X*W`AP,"#'KB[W>Z.M[SG M_>YYPYO>\;XWOO?-[WK+6]_X!GB__9WO?5.AR`@G3'(3#@H"MN_AY--?_1Y^ M0/\=\`P1I]_$#2C`\,W6X@)\'_L@SO"2F_SD*$^YRK?7NI7_=N$H"8/,9T[S MFMO\YC,'`\YWSO.>^_SG0`^ZT(=.]*(;G>:$B4(-:,"7/```=T7>M;#[O8'P!VLHN]`0UX0-K'/O:REUWM:5_[UAU`][![ MG>QUI[O>ZV[WK\_^?>^`[SK;!X]WO/.][WO_^]L-7WC&BUWOBC<\X,$.><5/ M_NM>YWOE\0Z!!EC`L>!2`Q2R/`@SX*#IEA!7A,WPA"-CV0PYF($7'BO2Q0HB MT3*N)2M+K.'>;[B6OY?Q[H7O^X\"?Y>VY+WNB0],$=L:^;!L/CES?_Q5TK.> MU(_J5*?)>@38``$B,0-!B?F*90/;R"*IP6!P(%G<,_K]\(]__!X'Q:S?@ M93HD"4I&@*)&`^EW.,N&0&UV40KH@"9X@D95?SBC9H/U8S6P?]=$5AS^)`E/ M(`,[PGHTD!=$=F11$&I>P$$CB()".(1#"(&*!F-A6(8I-H8QID5?*(9@"&)DR&)F M^(9H*(=R:(9I6(=WR(9LV(8=5H9T&(=1)7KH%@4X(!)_<0:G]R-AX`.,V(B. MR(@_`(D_,(F46(F6>(F7Z`.8N(F^(F@&(JB.(J;^(BD>(J!X8-SZSB$"'`$'K8XNZF$`4%S^WA8L0](N^B`C!2(SK(XRT:(R, M@(L%Q$#'J(RO&(W)4UA;I08Y<`-5MV.')8UI*X<`4/`$A(4`!Q92!J!T1,:- M*"=D-V`S,>`$XN,$9P93Z)B.,6``.=`C-G``'H$#1.0%\CB/)><%:64`KL!' L?0%33M!0L0B0OW4#$N9,+W4#?Z8&W_=H#&ERZO8Y/^,%XW:1'OF1U1,(`#L_ ` end GRAPHIC 14 g39741bgi002.gif GRAPHIC begin 644 g39741bgi002.gif M1TE&.#EA&0%-`/8``"PL+#H.#@XN+BY24E)N; MFZ2DI*RLK+2TM+N[NX[3Y9/4YYK7Z)O8Z:+:ZKGC[_^?@O^AA/^EBO^ICO^M ME/^PE_^TG?^WH?^YI/_`K?_#L?_(M__+N\/#P\O+R]34U-SOW^N_X^__GX/_J MY/_NZ?_Q[?3T]/'Y_/_U\O_Y]_[^_@`````````````````````````````` M`````````````````````````````````````````````````"'Y!``````` M+``````9`4T```?^@&N"@X2%AH>(B8J+C(V.CY"1DI.4E9:7F))JF9R=GI^@ MH:*09F9IDEMFD9NCK:ZOL+&99BHF)BE-@JRZA9M;(5MKK+O"@F5*96M)),G% M@\.RT=+3U)9J)C%;+B-DCELB7(Q7(&-K6D:GD5Z;7UYG:U*#[\)G7ZSMU?GZ M^Y!I)41KL(#(0@:+&2W"L"SI)D@+$R,CNI#)M<9)N#5;E&A14X3$D3)FKFQ* MTZ2)*C5.S&!Q0FR-CB@N=>C8L0;'NR@V!#V!H@.-H#,YYO$;2I1?&A-#ULP( M809)B10LUL`PH8+$E35(1+!`(8(,$A*;2!198T0$"A1;6I`X@>7*!U/^*DZ@ M2&&FS-H4(,8.V@'%9=]!.;ZXM+DFL(XO@M=`>5*TL6-I9E"0,$%"R1HE(``V M`29UA1D21M9D"7',A+`324@3O M\!)E\9&#/.M06!OOSGXVX)]>7$#30,6MLE.$R;^J:0C:8B0%"M'@"7(#"2@`-X: M0X1@`@LA=/$-"=N$*((M8Y1Q0@A.C&.&&BW8XJ%JEKVP@CP][I"#%#CT]44" M[YRA@&`Z>%&8CTL6:J@A:F31!2%C8$'(%E>HTM!&!JW!!19J;+'H&ETXH5X9 M3I"ATB:)8BH(%LEL@5`Q.\`$3Y&"""I(8NNHT4Y0A^:J:W1GR!K)%S[M*NRP MO"#Z2$L0'DOLLLPVZ^RST$8K[;345FOMM=AFJ^VVW';K[;?@ABONN.26:^ZY MZ*:K[KKLMNLN(L$.$N\:\](K+[R$U!MOO?<:,N^_@@!L;[\"]QMP(?OB:_#! M#/N+L,,$Y]OPP`7^3\POO],@^^[&E^RB!L:':#S)%!MTP$$'*'-P,LHLKYPR MRS##['++,L=L\\POFXSSS3:;W//..O-,<\]#UUPTT3N[K#+1.<<,]--)&\WS MTB;SX(D4"AA@PY$((-#7$PCPMDD-"MS;PP(,I*WVVFRW[?;;<,=B\P`2%2Y"2D#<\)@D,"6]>40(!1*$"#<#A$0V$`` M#8+H($`!A?C`@`,-D-[`Z:B?;KKJJ;..^NJOIPZ[Z[3'WOKLI;=>N^VWZ\Y[ M[KW_7CONL!,O^^ZX`Q_\\KH7W_SR%0`Q0'^:""@ MPQ,ZT%#V(`;HD`,"@ASP&PV<>Y'^`:$SX/O]^.>O__[\]^___P`,H``'2,#_ M14\0-\@!GW"`@!TDA@8!VH$";(`#->@@`0CDG"!H8(`UD$T0"`B0X]:0@!U( M`72$$%T!5\C"%KKPA3",(0$9<,`=&$`*!X""%W;`P'?0@#<2K`%O+I@]`\SC M!@AX1PXZN(8"T(0&-HA"`&J0``($:!`_&-WSCL=%X,84>/!A$$#&C@FQK(`#C'2<"#^JQW<`"869`P4<("#Q`P""`V`P`/&2M:RFO4!#C!K6L>: MUK6J]:QD=2MY\A6M>Z6K7?_Z@`;X`'""@@+A\@4% MGU@5)HK%GH1:!05FYH"J-/!"YB(H!<46(HNGLU_K1&M)U)%6M*0-K>Y.FUK5 MNK:TKSVM[RHYVMF:MK6X7>UM=>O:W-8VM*V%+6P9T`-[G:$`O+GJVN'J\@0(0\`4IU(`5 M#<:!`7)0`YH@0`HNAFA1H'`#FJ[AD#_N2X<%]05F$J('XS6QDI?<0@<@6">\ M4>15K;F)^$+AAS;X@I3CH>-]0'&]:]!O#0KWA>?DP`8VB$<*D\SD-KOY?T\. M\QG4((4H=':;]G`03-"`XRAX-4)=3@0:JF`%*U3AT%0X-*$/76A%&YK1CX;T MHPL=:4)'FM**MO2E(>WH3'NZTICNM*,;+6I)9QK4DR8UHT^=:E"SVM2EUK2A MHZJ(F,KTUBT%Z<,B*E)!6_37'Y4HKH=-[&+^&QO7&+-UL'2ML%U;-&''CI"M ML?70B"8KVHXX@U!Z@RQM&R(,4PBWN,=-[G*;^]SH3K>ZUUUN*F`[&D^PP9B% M$4UKZI=SBJ5@_=[,1@9(X,$WJ`%D;U`X-%SO">W8@0,+D^9W.P)8'K3@;YYP M`S5DKE?ON*HP?*)"?I/QWZ^20@)$?H9Y`T4'XEOO86@Y#':MY@D1>N@'C8X+HO7P0.&&.#(R9S'C(9&,[9K'," M1B!843"D&LAV8U8%B#D*@*Z@AG3MI!-B?`B$R89__([K20P(5*]Z`/U=""CF M1([V*CISU\L8O9O^'1$X*#IC7*S8ZS)3!PHHSK9SCEK3`K>WJAUE;!\_W,A7 M'O*-KWSF0WMU'<&OJQ`4>!T#%V9Y*T"S"E#`A_]^"/+)1#!24/`@8&(YF6S[ M!PZ(@.YWS_O>0Z#WP`^^\(=/_.(3'P(7^.XZPBP%;0>HH?R!`D`!;YQ`QID`WUA)S=/$(/1 M!"BKAX+K\@X1&#`L5A@!4@/D$R#6A8!K,(`XR"XT)GBI9T)"2`/,A`8U`$7P AX#CA=83KX@ZS(AQ]82O/X"OU8(7OTA(:0RI@*"Z!```[ ` end GRAPHIC 15 g39741bgi003.gif GRAPHIC begin 644 g39741bgi003.gif M1TE&.#EA%P&!`/<``#(R,CP\/$M+2U-/5U5555106%=85EA95UU=75U985QZ M0V!<8V-C8VQL;'-SI+FBG+6RK-6^L.F*P-F6Q.F^R M-6BR/'&M/'"R-W*T.F*#1F6#2VB#4'&.5W2P0G.X3'VR3'Z[2P".O@"5P@&; MQ@ZR`ZAR1:CRAFDRR6ISBJKSSBPTD2UU4BWUE&TTU6\V&"[U\5Y+/]. M%_].&/]3'O]6(O]7*O]9)OY=*_]>,_]@+_YE-OYG./YH.O]N0?]O2/]Q1OYT M2?]X3_][4_]_6*Z1/:^30;"30;><493%&# M:...=?^&8?^*9?^-:_^0;_Z2X.#@XR,C).3DYRUN+N[NZ>XPZR\QKG&K[[;IXO&W9+'W97)WYG*WH[+Y(O/ MZHW2Y93-Y9#/Z9G+X)/4YY/1ZIS5ZY[9Z;K'SZ+/XJ/2Y*;6Z:3;ZJK3Y;?8 MY[7:Z;'>\+3A[KGC[\*?F,6DG=6^N?^>@?^BA?^EB?^IC_^LDO^PE_^RF_^W MH?ZZI?^^J]#DO^;%I/_!KO[%L__(M__+NL3$Q,O+R]34U-O;V]/FP]?HR-[E MV,#F\<7H\LWG\,OJ\]_EZ-+G\-+H\=KL]-SQ]N75TO_/P?_2Q/_6RO_9S?_= MT^'NU^_HU^+PU_[@UO_DV^/CX^SL[.?R]^+S^.KU^>[X^_'O[OSGX/_JY/_N MZ?+W[?_Q[?3T]/#W^O7Z\O'X^_[U\O_X]O[^_@`````````````````````` M```````````````````````````````````````````````````````````` M```````````````````````````````````````````````````````````` M```````````````````````````````````````````````````````````` M`````````````````````"'Y!```````+``````7`8$```C^`(\)'$BPH,&# M"!,J7,BPH<.'$"-*G$BQHL6+!(VUPO3*V,56O0[Z:C6QU:57#DK(ZQHM70"!>$LX`=+#:+H4]C M0XS0,L:*)$-@*%GI"&G0%Q!,!8EI,E;K#)B,Q`AN,C9YDRU.QS(?]&A+4]O3 MJ%&SX@&)8*-(QUIM,5:L$18NOBP!*;+HF*4M6!P5.];H[")+CK*0S-0;TR), M61IYQ*0EBR(LC"_E,#SP$O!%>H_^+]I"LI6B8EF`)('<*$L6G8XA0S53BA,? M-&BB$N14RTPP,\9LTM`9G:1FX($R-<*#$)%X9$06QTBB@S%<#.'<+*T$D01L MCC@"20^.'!/$447TP$411ASC2`_'0)+#%%OD<$DKCS4BXT"-`*$709!X",1= M0IB(!!#&7*(#,(O\P$4KP"@B"1T`%QUA%'&8-%%K0DP:@1C#3:&R224MKB M$`(5T1H21TPA'Z(YM`85%EO,DL44QPC16GRL:O2J7$9$0F,FQCPF5"UH"/7L M&0()>PP9;W*"[)F=\+%)&L?8<@:!QYBQ"\IT8ISMRR]#9XDD2G9[!"M#`F-) M*\4(<1<2@M&2@R6T_&AJ;T/T]@B@D#`M:<$A)J$%*[T\M84.7#SIR"PY8-++ M$*46H04MBO103"8]&..*#I`8LX40Q4BXBC$\5%FR&4*A28;^0,5N?,PF;99R MQG\F8%DD@80MM4`!QP##`[X@C>_$`#3',,!"!!(9@QQ@G:Z\YWPC*<\YTG/ M>:;`#6_^R"<^\\G/-^SS#7'()QSF<(@<_*`'"$VH0A?*T(8Z]*$0C>A"?[`# M&T1``A*8@`(,0``!>*%D7G"`,(%DG6@`WH(14CJA\Z,$\8)I.,$`C)7!`0Y(Z3$>`!I;.*`!79C(+LI$`%LP MH$`,F`P#2'94D0Z$G2@(JPK"BH*QEE4%)Q`K6<^J5K*:M:UP->M;P\J".]CU MKGC-*U[CD`=$_"`(@`VL8`=+V,(:]K"(3:QAHX`!$5C``B!8``,(\(5CE`(, M!*@,`?A@"P,\;B!G>$`%$9#.3C"@%!\<""<:X!&B?K0+#_#^R)F"(0#0>$03 MWCS&2?=6U4X@0(_'2(-HOUG9!IAFC@=YP!>,<0`8)O48QK7%2E_ZU;2N];K8 M):MUL[M=['87!=\]P0H`&@>]FM>N<>`K(JH"A""TU[WP;>][@4!?^,8WOO)U M;WWSBU_[ZA>P].5O?N5+8"!$P;$6R``($C!9H.[B`-,R;AD0X`4P\"08#1"D M0+J`6\L6H`L8X\D#^!`:XAK#HUTHT-]^.Q`'F"8S7B"#:7>"`!5#%S3'*$,# MP"`6MRP":` M=0P$D'ACE?7(&0A@!@(,;A=6%=`><^L1,'S!%K]UZ3%,:^,S1'4@,:Y%.H.! M@%H(Q`Q`W8D9OB``3T=S M#H@PJ$3^1T[RDIN\!SRHZ$4GH-$!',"CV;1PXU+&X0TO^59[JX6['U>&2_>. M#SBML#$XL>^5?C/4?"-9+2ILS2]<9GOF-%`JZ$#UJEO]ZEC/NM:WKG4\C.+K M8#_%*,0^]K*'?>R<@,3,),'VMKO][7"/N]SG3O>ZP[T2;\?&.X3QZD0+%2.?1"QRD9F7-TCF(^-%S%_$C%OQ M7^B'@A8QBIZ-IT<*Z%&O>G6:WO&PC[WL9T_[VMO^]KB7?1=WSWDK]MZ+4BQC M&E^_QC:&,8OZVW\6]+]__?-___SS_Q7T%X#\ MIW\"B'_]IW_X%X`)B'^Q``NP``J@`&XBU#VI\1]@0&*V0`9@`!J&18(JN((RT`?I95[#MF4V"%!V4`4]D&8\V(,^ M^(-`2&8^L`1PQ@$>$`;4<@95BVF MD08@:`S"Y0426`K'Q`E/T`4")Q#M,VEKB!&V4"!@\!^=8`Q@L`N;\`7$``KB M`&(@G,`-^4(,TN%?^-A@'.>AE!19F;-9F\_6(C5AF!/9?839F M0>`#3*`!%M`!1T@G7B!::6`,70`F7M`)["8^6+@&7Z`*G;`+H.%B`]$)0-4) MRK54'C,,`J*!!!$LH>$`9](%U^>%?),`>@@3QL`Q6'@E&P-#F@`&X-9D@3B- MU.AD:#4#Q(9>V:B(5?!7E@B)7]9?E5A?WSB)^U6.X>B(\K6)G>@!8R`0M#@0 M*<8'#Y`&OS`0MM`%-'0&0K4FM1!OSE1O26%DYV0&*G8&OB(4=YA-#M`]#E!3 MU-(%:^(1IQ@3T!(,6-@W:\@)&_A5U?B1(+E6,]`'V;B-W,B(Z3B):Q:$CKB2 M:>:28J;^B=+FB>^H6T`%!I=!+&8P7-\$A9;%!CMY#+N`!EU@3<\(%4>9<`Y0 M('OV9\<@;T*Q!EW0!=[D$6204BD&$VCP.&0@2'5X#&,0#!ZQ"7BS3GY85B$) MDG.E72-9DMN(!]T86.3(7W*Y9H3U7O[E7^,X6'@)8(@%!)NX`30)CU'%BT/1 MD#9)$#"T"PZP"S!4<\3P``*W1Y7UF)I`#,20")ZT@N"%@B98@N`UF[(9FRR(@K?)F[59F[,YB'T` M4!EG5QMGG,A)G,9I!U3``_3U`T``G0$FG3LHG='YG-.)9M#^*9W6:9W7Z9W? MF9W7>9T^H`074`%&B(23!HT4)IF:\``C!CT5.1#"]0";L`NA^'1EH%2:P#VP MM3=D,)6"%`PA($U+%W6^V(L:AA'$L`L1-`S4%$,$(0HKT`(L<*$8>J$M8*$9 MR@(@=^,*,NJ@=6 M(`1'L#S+\SDH$J0_^CE&$*1`:J1'6J1%BJ1*2J1(ZJ1+FJ116J1-,`(D4`(A M<'/91%,,AX6*R1/$`$AQF!#.))9\,QD)40M>&CFZT*9MF@MN&J=Q"J=RJ@MT M.J=W6J=ZNJ>8>468&1I^FAF""JC^V50,AGJHB)JHBKJHC-JHCKJHP\"HP3`, MP_`+D_IX$%%]KC<:S]>IT.>I#.I$^8-K MK4IYL_I%$W%]IB=&NCI&NSH6N]IZNLP4JLJ%>LQ@JLPPI$I;JJS:Q&KNQ'-NQ)/<#.5$R9&`:5"@^7\`]M[(& M`F(+H8C^-TLG5`6QADOW`!B3!L`RD66`A69"AQL#A[M`C*"!!GS(3BO0:T:+ MEF[55G*EM'"%M&@Y5L$&!^>E97=5!VN0;,V6M5J[M5S;M5O[`V=AB]#X`)>Q M4G,XBT^0&6\(7;OP!6F`801!C)/&"<2PE"_%BU\P!D]A"]RS-\:`!G/HI099 M8M*8EK(XN>GHE^`H8'9YN?A%B>=X7RV9 MDI\[8`4F6+;B@9>1!F10MV:@"@1Q@0/QLG]#MO43F1)8"Z)%!N[VAD4U.+T# M!K5`#'Z[!O9&!K>54H9@N,K+7<+FEN@%N:5;9I8(D^-XCM;^BV;B")/9^Y)[ MR8.8>+V=^XAVV0-G$5RI>QEMLI0#MRL7E@;Z^#U?L"L"L9^*Z2S'X'3VR0=+ MZ6AJB&-DX&EQN`MA\'!:VF1C=[5^Z;46?,$8 MG,&%)00_(!]I4%F6$4W'$`*/,Y_4,BWV*9G0Y6F@6;^F40LOM0DI)EKOR2;& MA#>V``9AL!F[H`:[\`1D,`8VQD[S%)R_.7%&K)NX29OQM`)N<`=P(+7#-FP! M!5#Y]+@7NX,]\`-_,5@O,5@/,9D?%!E',9G_,5BG,9S*L_S*M@S+LHS+MUS+L5S+M/S*O7S+N?S+PVS+OFS,NDS,PHS, MLGPSDM=&T*AY4"$::GH0CHQ\SIK-!D*MVMS-WOS-X!S.XCS.Y%S.YGS.Z)S. MZKS.XFRK[/S.:\'-\'S.=(`']FS/=)`*\[S/$!%/)C`(M\(^HZ@0P3`MQE)B M_9-\"3TXP4!-N,+/=80"12M6)U`(%82&8*!4!=$)>],)HVD1IE$&+'4KUP;1 M<.1=%IW^&=6\"7\\!J;AT;K%MPU0"](2#&E@!BZ#QP+W'UTY4D+,)N+F:?:V MR,&@I@`2#$]GTE'D7800NV0;A[2H%,26MU$^4M&C5U"H-@I5E!B]MUR1FD+5@+6?`'WMC MD*-V!ARS$Z$6#"*S*V,J8Y#CU\H`GT`R<)%PSO6%G]X;Y>:&KEO1.9#;Q9 M\C=*Z-$XG`A[AN59KD1W58,-#EK^?&!3487';?N4=*+8)4-#!!M-IGD,72`X M)+.!!*+9%RA=W_31=UY$.5[@P84QYR/@.(PQH!8&:R*4\<993A>':$"V>`,G MBLX)G>!T>U-NE9Y$;2H,PJ`+M-X692`@\1WKX.P1$1'U@QM5`@?/`%?:Z3'D$, M:9"S1@;^:QK(E`$R:K6`84<`.\8R<#FDMG,NTSGXY6"UOU*W2B"FBH+)SP M!6V+BE>533MF!@X`]73BOD_)4U/^45X@(-2-TYO0F*II69OP!,;P`&MPE/5& MMV?PY;5=[)SM)H$ENMG<.*;@L?I)J4 M\>\"$03)]FQ#KY"?I0GU$6/6XK(`D288FF.UTAPSXX5,,%M?P)"I=>Q8FHAG MB!D[$PS,QEV;S!PKX^4CITW'C!T+=N98)TW'SMCBI/!C1C2[,![;Y"58)R]? M.G%JJ:D33S)D7!*SI9*30UL-OQR4&%7J5*I5K5[%FE7K5JY=O7ZUZDNL6&"^ M3H)%BW4,P;1MW;Z%&U?N7+INS]:=&DR@2;QI[_8%'%CP8,*%#1]&G%@QU;M_ M%TMU_%CR9,J5+5_&G%ESUD^=/WG^^OQK\VC2I2U/0$U!P@4(GOAV/O8%^F_JU0\'Q][!.-\T M4'=Q"F:&3!B49;YH,L;GS)>2I<",J86QC*VH8([9,J/KV^47::?=K:KIIKH6*V-N MR_99;P_LMJVSMK7JHF_/13====>]RES(V(4WWKK"E;?>9S?!%U^@J&RK6GO_ M39``@04V0``W5XJME#)XB\K?D]!@U3FN_+5-6VQQ.X88HVKID3=;C`(88`9& M1F!D`DK:#0TSC-G)J&MO9!BQVIK+$>,)0P88`9UU9H``5D_^ZJY5HZ[<\QA- MOEAY(C`W;G6C4BX$@U7Q M=[YY"+Y<`",3J(^IHM2-`D#-F/(2,-P,#:Q!>)C M&D`CF!$1WR2,74"QQ0M;TC"##32,^6)"&3DIHXMC$I4\14YJB<]5+XYQ8"C- M&V5U%QE?M<_N>AG8>60#2@)ZS)7,N-F8,8!S5!.C M!/VXR4Z>2&.^,YJ;GH]$+LH\JE+2V.1+,$[R>XS3(])D$^0UBEEW=7=&X``$ M#,[8I3S=WU'Z8',Z/J0O<,W*V.NRB*$Y6^R"#U]BG4[28!\R.(`8I>@",2)B M)2]UH6/'\,+J!+4JTWGA.X5Z'7L`=0PPL$%0]I/7R$;6@`8@H&FI.$D2_$;0JJ&DV/Q<&'%.)KE-`&J`DG%/;DBBA$?L)%: M$,-J*9E5)V`%0WA=Y"+!0".]`A.,;?TE2$8Z9H5B%9M*M6KS%XK5 5IH]2Z<3!&N888\"Q?QBKH[P"`@`[ ` end GRAPHIC 16 g39741bgi004.gif GRAPHIC begin 644 g39741bgi004.gif M1TE&.#EA)0&8`/<``"DI*3(R,CT]/41$1$M+2U-34UQ<7&1D9&MK:W-SH+VBG+F6J,6JJ-&^M.F6Q.G"M.W2O0'2P07VU M37>\4W^V40".OP"2OP"7PP"7R@&;Q0">S0J?R`2@S@^AR1&AR5:ZUUN^VF+! MW*IW9JIX9[=X8[QY8\Y]-L]]./]1'/]:%OY6(O]8)?Y=+/]?,O]@'O]D)/]B M+O]J+/YE-OQF./]N,OYH.O]Q-O]U//]X/\IQ5[6XB[78V^8[Z,0*J`9[(>Z#)?=2`/\:>7/^<<_Z9>?^B?(.#@XJ'AXR,C(^1D92-BY24E)N;FZ6>G*.C MHZNKJZZOL+>QK[2TM+ZWM;N[NZO/C+[:IH3.XY'3YI#5Z:7=[:O6XK?C[[GC M[[SE\/^F@O^GC/^IA?^MB_ZLDO^PC_^SD_ZRF/^YG?^^HOZ^JO_!IO_$K/_' ML/_)L__.N?_1O<3$Q,C&QLO+R\[0T-34U-?8U]O6U-ST>'NUO_AU?_EV__H MW^3DY.CGY^SL[.STY>[UZ>+T^.GV^N_X^_/MZ_[KY/[OZ?7PY?'W[?[R[?3T M]/?Z]?3Z_/[V\OWY]O[^_@`````````````````````````````````````` M```````````````````````````````````````````````````````````` M```````````````````````````````````````````````````````````` M```````````````````````````````````````````````````````````` M`````````````````````"'Y!```````+``````E`9@```C^`(<)'$BPH,&# M"!,2%*:PX4*'$"-"9"BQHL6+&#-JW,BQH\>/($.*'$FRI,F!J\A(.GE0E9HR MBGI%[*6+X"HT:,J,F=0+C"J'PEX9%*9FDD%4:H(-RT41(:J<:(P6;*2(I=6K M6!NJ@=$EZS!5.[R4Z8&J(<4PA@0RG&0C3!DQJ%[9^-FT($-(1.H."]:E:MU' M/GJ]ZK%*X2(8:L;8>#2L*9HP7B-+-JF+"!JR`E>Y:AR,8F>U#"D*4SI06"]A MJRC*)'C(!\//2H75E3VPBQJUPU#=^"G0%0[>HPN29A2X<=/5N!O+1(4CU3!7 MA?>2'M9H1ZYA8;I.#YY<[?2]>B?^BQ_?>!BD'J^(W!X&!O(K'ZF"D>GB924: M-2^#A2GR`XW20UT$&$8PJ'CAQ1A""<06&IL-TXMM7?@`26-J$$%$58;LT`,9 M`U%B`R.34/+<;\,\XD47A*P5H1BK$.$#?)"`H8@7[%6U"A@^%-$+)%WTXH4/ M/4"B2`\,A7%(>8W@(-.!KQ31"!&K,$)C+VJ\R$B)`1XYS"%%%+$>>6"*!P8: M6_8@4W7"`#;,?,$D2:4-8$PB3"JO2&(#*JHH^4ISP>"@B#!AB$$0)$7@4$8P MO?0`1BIJX!",(CN@8J`%&6,0I@:-`JEBR"$[0(N# M)(ST$,PD.(PQAH'?"8-OBCNLY)LJ8ZPW1AG#>/'E,!Z6)1.HKCRR`[H_*'+> M=(`IA6N"?>6RVT"-^#`BML-T<<@C70W$R*F'%+;G2L,8TM6%Y3$R\1@5KZE> M=-KVS-(B/4#EPQ@"C0%&$87YH"5#97"8&PZK!-/#2F2$H<5GE9E\?M*X^869XD.R1(G0\:YR507[W88!3^0XW\,,PJ.#2X M"'U5@6S=0*/R=@B-MB'9PW6T#?,*(8_[;'E)_0VD2`V%20(#&`)!JD@C8;Q" M!NCF?:@&N,/\8.0C,M'WR"%DAMY#&6'8((DP/EA-!&3XOK3#3V/L<*6";:$Q M!B2OP*"*U,NC<:6%A(31"UMDY)(D13^D148/:I2>I.1AE>4*D)O1QH@-0C'D M2@UE,>MW(S:@088BP?A`!B1E2$*P)(9PV^4&^)%7E($NSS'$9GJ!!I@-0Q)E M*$,CAL&(1:A%$668A"%4(0DU,$(-]''0(A%&83B"C60X1#^FWG%"!G!$$:,816,HH@:5M(+1OPP-VI8 MR_($$@:B$602:$`.`QL$"2V-"PT_Z6$+7]$+19`!C`1,XP!]<+9U2<144E&C M0+07,#G:T8[A*0U$4J&3,1@".0IAB(_*DD<]5J20Y8E(4QB"BB(<3R.%1.0= M)WE'25+RDIC,I"8WRO*3H`RE*$=)RE)J4C:H3"5N5`F:5-*&E<9QI2QA MJ<=9QG*1L\RE+H=RR](@TI*F#*9$]!(Y7GXD-,!$2#(A*9D&&(* M$8!`!/;^Q.<][XE/?>J3!/L<`4#[V<]]#A0$`O6G0O/)SWTNE)\$!8%#\TG1 MBCZTH`RUJ$8]X(=$MB$.PX@#`A+`"7AN1!B_&$9*>U8*B;K4`RZ-*4Q!,-,. MC,"E'9"I1&MZ4XEV8*8QI6E07SI4G0JUJ$8!#`D([!SA88B!Q MJ(1`--%<35CBK7&0Q1P0@`G+,M>\<+A#=6-!&]3&5J(];>U[=TK8I\ZWKR.( MJFSN0(JWJ$QLLL)A#'EIFM0TBQO(P$$P'NLY!&'2`0Q[N M(-X!@Y03E:7Q"$(PZ)L..@2$/C2B%\WH18]`T8UN]*,//6E"6WK1"$UTHA]M MZ4I'FM.;-C2H*UUH1VN:T8]&*`@ZBDHM6\3#`HG#)2I1"5FT`<]YT,2??Q&' MM>;!K&VX1"P4L-+00G@8G$B`9V$AC#K0(19PML2?AP&'`=\:T"@=!BY8P.UN M>_O;X`ZWN,=-[G*;^]SH%O<*NIV"+[A;#.XV0KS=3>]ZV_O>^,ZWOO>];R,4 M8B"^8*]`9#'@CB"X/)RXA";D6MTZ<-8-<_B%B^?.=*87G>A'!_K2H9[TIR,=Z#F(@1D$`@LVN`&D M7%:`=NV88([D0@ZVUT'.[B[WO>^=A[DH.YS MYSO=_?[WOA=>[6_WNPX4G_;!'W[QAE_\WQL?=\7W?09I8,@[)++6O21(6XVY%+2C/0>PA_WK93_YV-=^]I/'?>UMSWO=QQ[WNG^] MZWG?>^(7/_=KM_WP=Z#\WS??^+0??NY_#_S9#U_XT2^^]7_^/X.MSSD!":## M<07"AK`24)X0.3OM9>][W.<=^KO/P?N;GWSY$]_W]&\^\XN_?^?7__[MYWSQ M!W_8)X#99X"WAX#2MW[3AW_=)Q!T,`>5\'$;-@Q891*A-PP96!"Q4'#*-'`` M5A`;2!"Q4%)SY'IL5WAMIX*`-W>!5X"QMP,\$'A#X',I:'>PEWA\-P341W>91"9$%8,,5ESP`8=-V>:=1"P<&$,H7XY0`.PYW-TJ`,VZ'-Q*(=X M.`-T2`-V>(=R&(>"*(AUV(=_^'K^>HB'?OB'?0B(A=B(KAVC0B(?YB' MF,B'?@B(F+B'D1B(-MB)?ZATI%B*IGB*J)B*2O<"3B,+<=`&UR4+<`!K)9$) M"-!<6Y4`N#!GL$!5O\!9VC5@OQ""=$`'M`%H5V96OS!@;M:!`R>,VL40N,`% M2E"-U`@%V)B-VKB-2@`%U[B-VMB-UMB-X%B.V%B-2L`%YFB.XJB.Y8B.[KB. M\IB-W?B-\EB/XTB.Y/B.7+`(_H@(_QB0BP"0_CB0!%F0!VF0!8F0#A09SV56 MXC4')54'<0!2<[`&LU8)>R9B=^!P;:``Y@<+<%!6E:!AQ&56=P`'O19FY^59 MLC$+$E#^`140DS)9DS9YDSB9DSJYDSQ)DSR9DSZIDT'YDT19E$!9E`T@!>Q$ M588D>EA1!XX%"V-U!Y<@#+*@"1O6!MI5"0C@698`DB!):\81"PD@9B2';&=6 M82G5!F"X!BE7'K-``7(IEQ8PEQ9PEWB9EW@YEQ2@EW=)EWMIEWXYF'79EX5I MF(29EQ1P`8H)F(X)F(D9F8(9F8?9F'_)EX89`4]0'K*P!E:64FP0C:%A2*+! M3HM$>EF14G3`"8!V9U0)"W4VDG.P5I6P!A>6!QP75G<@FF%V5KNI9G0`"VO( M!I?`"6G($+1`EYC)EX>YG,[YG-`9G=(YG=19G9D.VJ#,2:$/>J'1V9A].0&; MZ5P(4)%HF0=U\$DA^&$IQVRTQ@G"P`DI!0MK)5=M6)6698*VD(;.Z`LEY0O& M=65WD(8"00N429B(*:%#*IF#"9E!JI>+>9W;N:2+F:1)6J1&>J1!RJ$,00J81L*8/<*9O&JB":J?^=IJG@1H!:O_VI2MU"PP&`+M@`,P%"P M#-NP#ONP$!NQ$CNQ%/NP3#FPY&H*)4`"',NQ(D`"']NQ(CNR)%NR)GNR*)NR M(EL"((#^`J"Z!I[G!LJ&L9'%$"UU8U`%53>V4SOV5$VV5T'V4DS%9$2ELTMF M`HUQ62+%"71P"0/@HS3K3#5V7U1;M??D`4C+$,`P!R#E"Y=PJE'K5:BU8U9; MMH,%9"XK&W10`'=F"0?056%K4F-KMCM+MW_E`2`"0CP MH8*+5L/4KQ?1JO)4"XY&:9'6NHT&`JY;:I?6::[;NK([`B*`:I;F`1R0M=KF M9@0WNO"$"RJ0`L9[O,9;O,FKO,I[O"K0O"G0O,^+O,@[O=3^:[W5"[W4N[TJ M``A_``KT*KP&<0EM1597-A"RD*#?B9^8@$R@:GZ;)1`GIU+D.Q250)6JAXOA M(7&X*#DYP',W\+\`3',_EW,%C'-#0!J^(`NA$0NP&K6^4`#EE7(%4%(9YU85 M5AH#6@EUID?K*;`#,9("X0L79A##=@EZ!G!WP*J657"O@(-ZQX)*N'=J)\,N MJ'=SEP-#L`MJM@9KX`:V``=KT`8/C+&P@%L"<0=K`*,:R,$9S!!W4,(#@:!K M194+C&Q6J0EYP`E:[&>7E5)K%:,#T9O^"0N78`L,_`L:.6`(^DZP`+]P^'R\ M]W[7)\?`UW_:)X#XUX"\QP,WD,#^VL;`"H`)`[8&8S>ZF,!?L/`+!+I@WQ_`RC'+.A\0[`: M6DC+5JD`'BBX&ID)=X`)4_D+O*R&(15>$DD0<+!6(S968AD'P)!FX>6*(?5. M(YE#>` M0RA_,PAY>(>$BX>$#AUX,CB#.DP:OP!M#!R>H\L0G45M1(P)XI=<<'9LV8;" M>GN>(;7^9IG0T6[YF]7V5M36MQ46!\=&!V,WSX=E5O$9"QD<4LT5S7,DB3X7 MP'_GB$,=>T;]<[*WB4-]`YL8AZHH`S,@U:4HU51-BE59\-09;X`4GGV4>R4DG!%5Q2&DID@87'@EGG07,DE7B$UB\TUF[BE M`+C8FRG%M+%F611FG+@5:`.Q"R[0V"W0`D"@!8_=V)1-V9$]V95MV9+=`H[= M`EH`!)Y-V9QM!FF0!F9PVJA=VJ6=VJ:]VJ>]VJM-"$HADA@Y;$(9CKK=M:.`=WP'$(,%KX_:]QN=\44`$6:@$5P)UTN=X4L5PE M-@Q4>.`(7I?E#9E]B:1[J>&3Z9<=3@%+0!&_YM5Q8`#PB^'N&J83\.(P'N,4 M(.,Q7N,S7N,X7N,0D`$:5V&^4`<]S>+N2@L;P`1&;N0:<.1(;N0;H`%-H`$; ML`%/'N5+4.5+<.1)KN1+SN13,.%WQK6V(.3_BDK`H$IEWFJZQ!"Z/55H+AMG M3N;9IA;O)-9B7N?=>DAVOM$7`=[^>1ZU?&X1EO3G?6Y2Q&1ZBM24]`T:AHZ: M@C[HFY3FD,Y*D3[ID7Y+;2ZOCMY,]QTY[BNPHXGI^'JOR9'HJYKI!`8,@Y#J MJK[JK-[JJBX(@@`*L#[KM"X(KG[KN)[KJ1X(NUX*RM3HICX9A&NY2Y:SC%OL M/TM3.GMDRD[L1?:SELNS3?8!C"OM-,4'G.EFH1[LES2UL%M4(1!4X2Y8XVZW M0[6XV$YMG9MAG7O(W$Y)WBY;YGZV2X;MP!!6H_S&=V``[XY)\3[O`"]3?.#F M=*#BC2'$_=[M`6^VR;Y7V"X,P/"U+8T`=)[P/F.S9+NS&7^W3@:YS/Y>'O#P M>0`+,HO^"0)P!RIJ\=\J:.'>\BU_4^%N:-_>\M\.NS1_\XBF:CF?:@@%\S,? M\QW?[#&%[HU!!PK`!K+`56O`!A7_K@'7]`=!YQE(Y\[H$'2U@1YXFEX[$+@0 M!%[_]6`?]F(_]F$/!&0O]F9_]D!P":(`"J1`"J<0"J%P"J=`"J(@]W(/"K7@ M2TT9MYF`6\'V$)FPR@J;5H?\>6<8N&E=Z!HX!V[V"@(L M!)WN6)WQZ1P.H7P%? M'0O5Y5EU765P77+EX5C))6)-6U4`,:<-,$L*\N2I5&G.L$IWYLB:8KV%Y+BDJW^B$GIY6"8Z M(1%?Q9U;]V[>O37YK1PK8=NQ6N]8XN37+7&WPNA8HHC05YPYL2[=P>@QT_!* M:Q;"6@,KDR]8"Y7"\DN1T\*VR6^WJ<0)%M/.GUOGV.'R/L[3^G?ZI.F^FUC* MCX8A?&(-/]82A&V82]C@ZI>*$KBM-PLOQ#!#JHRZA+IAL@K+ETO6\`4.A]88 MIHV4W!@+CDK:X&H8D\)"\1(Z,F$CDP0X06B8.A):*(Z#.%%LOHK\DM"]L(2) M@XX\8*GDJ+*$RH4&&GZZD@::K-2RI2Z]S%*F+UWB4LR?P,R2RS-EF&&&&&#[ MY8`UVKC^;HTU3MI,0SWWY%.W3.Y`*I98AN&$JTI@\070^1"MB*M,\DB)(EA2 M@F4^63AQ,(]"!1V&TTPR0RBE2Y#Z!5.*9#$RKE]"=?`.4X7")0DD9J5UUB1N MQ;5676_5U59EEJD\J\4VJEDJ MX+9;;[_U=@)POQ5W7'`E&%>"*H0")M)FLX4WWCTI@TK"IS:CERI[H[+W6JGV M]9>B62B@P`*#"R[8X(,M2)AA@A%^6.&'$T9888L/)MA@"*Z@*),U%*@#/`78 MD[=DDT]&N:J!,W9XXI8SGCAFF%U^66:9+7B`XXID^24!1'W^22#&E(`*=*7IQ&$P.(-EHK;?FFC=:'+YXX;#''IMELBUNV&`) M.)90$P6X$B:6\+JFNVZ[G9KE@0(*+$8G'8LLKA"]=-579[UUUT6W8@^* M[I@S#D[@8.,DSW?GO7???P<^^*DH(Q[?XILJWOCDCU\JW^6=VE=XZ:>GOGKK MK\<^>^VWY[Y[[[\'/WSQQR>_?///)S]@]-=G/[=\*7H_?O6K>K]"Q.9O/_]I M:RG%%%-*`6`I\`>_"N&+@$P)QBO^_LR' M`@^(P(,>!$$H*`*,A@QJ*\<9X:$V1$!JA(#!OFL)BP+"9HE2A`&X3A'<`P M18@3F-@1A2*+C_FL*PE(@%_N8`"M%!(I4]P@%K,XR2W&0BD$N,0<$%`13&K. M+[)```+4V+QA%&(&/`@-#V;0(&$\41,)B`4"N.(AM"SK0VRP)47^:#$)(/%4 MF**#&X;^<8#Y)*`2LFC#0B9R"0I!,I*3I"0!\T"`820`#HAAY#`0<,TUT*$. MCW&**4&SRJ0(HPTXQ"5#4)0'7,9"C$82RBX5ULNFF`@3*/*1,.>P$`D%TYG/ MA&8([V>)`K`E`<(41@%.@H`Y7&(`FF`#`DS(%'&FDISPBP.*+(%/=G8E+>2) MPS7S!(P-3,`"%2B8(`EX!PK5TJ-M84\E$!"M?XJ/@R,(J"@H8PD"5$(I=RC` MJ@B0$@3$X3)L,``!`M.4BMJ'G/U<`V5\@0!.",,@76FG@YJ9E"%:+`*^I!H; M)`2+30[##708QCYGHP":UC1\'+QB%J^X1000H*YL:8,!#*#^.SI*:`[X9*H, MO#2#'+Q14@10`!TKD0`%7),A<,!%8A,0ER!FX`$3P.P$'N`$H6A"`-31"APX MDH"44$<6`Y"C5B#H5NN-(A"#@&ULGRB,9C%Q,[X0&F[C*<6EN`(5J$B%*E+Q MVV`HA5FR@-:IHO4+"?DBBD[Y1">DVPE/=.(30H'%0>B00TOLD%#0.@@*65N^ MU:YVO.?E&O'N9][>L'=/$G)>P(210?36U[[WQ6]^];M?_O;7O_\%<(`%/.#] MSJ^\R'.A>PF\8-PHF,$/[MA$*2*B0]U&$_"4E$)RRT18T*M2#IJPJ9HE'PCW M]W9LV0Q&,I$)%'<%PYI(B$9N@YW^/,2!7FS0RD-FDY:N/$K")@@ROA\J$.Y^$.M1!&';JB"2`"V;Y*J4-*$A,8>FGB M#IC`C@*NPY9@Q@@6@9%%0CI\G(D@1Q-Y`F3IP11.8X`27.=%#JWUE&%Q>='F&88E'^AF]&%F*1^*YD(1P`CIW MF$\E$G464UD"41D1QI,Z!0=-"$,6<&"+I8GL:?MFERF9((I6\E`'N&@"4T2^ M@Y!8W.(\S'(^D#*+C1'3$0?%!=6ZX_5YZ4L>,6LFEQ+:SB]B,:5E*64S`(/? M$[]-VVS^0]@7B:%ON^4];WI/ZUWZNE>]W>J+/!"%*9>(%"=,%0M%ORJ38KE- M)F0!8UM6`A._6"J+>1CGMNI;?^21T:O2:B]74<0PS*((IR]154D%Y@Z._<4: MH,.>.9`YRHNVN%MW/>&E?BA2=#"A4OX$G0DWNBMAWG0=,*5E+FOE$BNWJ_?@```.S\_ ` end GRAPHIC 17 g39741bgi005.gif GRAPHIC begin 644 g39741bgi005.gif M1TE&.#EA&`%,`/8``#0T-#\_/T5%14Q,3%145%Q<7&-C8VMK:W1T='U]?0"- MO@"4P@&;Q@B>QP^AR1*BRB&GS2*HS2^MT#:PTD*UU$FWUD^ZUU2\V&;!W&O% MWG3(X'S+X?]'#_]+$_]/&O]3'O]6(O]9)O]=*_]@+_]C,_]G./]J//]N0?]Q M1?]U2_]X3O]\5/]_6/^"7/^&8?^)9?^-:O^0;O^4=/^7>/^:>X2$A(R,C).3 MDYN;FZ2DI*NKJ[2TM+N[NY'4YIW8Z:G=[+/A[KKC[[SE\/^>@/^BA?^FBO^I MC_^ME/^PE_^SG/^WH/^ZI/^^J?_!KO_%L__(M__+N\3$Q,S,S-34U-O;V\;I M\LKJ\]'M]=CP]O_/P/_2Q/_6R?_9SO_=T__@U__DW.3DY.SL[.#S^._X^__G MX/_JY/_NZ?_Q[?/S\_;W^/;[_/_V\__X]O[^_@`````````````````````` M`````````````````````````````````````````````````"'Y!``````` M+``````8`4P```?^@&V"@X2%AH>(B8J+C(V.CX9L@Y*0E9:7F)F:EVN;EV=> MA5YGC&R=GJ68;)2"IJRNA&NLDZ>HMK>XE4LI)"='DXJ4K\&$JVTR+6V49B1/ MBF=#)B0H2\"%L\J1V9-,76U=(EF'V(1;+24E-&:"2B(T@TSN@F8O)":_K#(B M4+G]_O]MD'R@`>7(.X"&8"0;5&;?MFLL2"B!,H1(OS,AG+0A0^3+PT7@6#Q9 M0H)%)R(@3I01Y`*$"T%#2&A94FW0EQ(B9!Q*`Z8-&BE3"*%Q%&9H(S1A!AD5 M-!0,I32#TH1)ZK,G0D;,#A(JXX2+I#):SD#9PJ;+$U)%O3B!"4M()@5`;IH'HU4980B25) MTE*"U[LG(%;@9(%"1#(8(E20*.&Q!0L5)9#!S`LA2'9""R3H1(,(*-A#QAD. M(0-#"G'I9L(J6FCAU1DL*/1"&T^$L,()("C1!A$I[*81"2Z$P,06!Y8``QOU MF*#$&1XXT\()*91`UC0JA/!2*R:\HUZ1;;3^((,+'R;10C22<`$"#&VS0$P_9@1D&#U-!-04/Y2D2XA:%J$!E%B!TL44(="781A(DM$'#"6:<48)% MX9*R`X1!8BK+.%"%VPD0(+A%"QG!0V1`=5%&/BH`,. M5$S!L!0YN$E%#@O^#]J&G3SD$$48.NR`Z`XZU*"&(#SL$%T4'K<1Q11@($P% M&,G9$'%0:/"9*")>B(#$-FN0(%O/3NQ+BL]MD'3,D"Y0200,F)(J@C-M;.%" M$324<#1+,K`1PA:BTB"##+()\FM<(+J[J=('O.BW0L"_:1GA:TQ7$B'X2GF5E067)`UE@,!/&V980^!8`K#/ M7,M%>@,6258"@Q58ST1+N)\DEO"!])D!02LQ01+:X`+[M,$)(2@#$4I`"B)P MP")K,`$,M`"%>%A$$I]K0QJ&EQS3M4%,JT->=Q`E!1T@:@I1``J8(,(4A M#;L3F'0^YB<@M@$,&KMA#I)#NHL%Y5#+0X096D2"$`",/>X!$0C6$8(-)B$$ MFA(!"TR@`LV4I$5,6,,'!-.L%^BG#4/P8@G`9080.$,&)-C1+[(!A1.0X)`N M8`.]3.`"$W`A"Q]8R0H^!)P6J,`%$#+1B43^X((5D"`N+0!!$N3HC#7VB%$B M,&,(9F$$$7#.!.+`B&R4P(%?/*$#72!#"4R0@A142PE/\(`W6.,:05118*@C MG54F-H4P[:Y-S81F#1"6L1N``0=30(/'LJF#*.!.$$%D0P[XI$,T((`J"`A/ MZ@*5@Z5DT1!F097>NC*/QE3&(V3XXPJ@T)EO.,$,6XC+$PISAB=PH0S\6$.P MM*">@2IC,^XKQ!JT\(1ARB4+3O!(&>RYA8@^;R^5(5MELB`629BAHB!:"5[. MH@PHQ(4,_R-$/K5P"C:PI4H.+>@ZQ'+3M'3A?Y+X0K_$`P8UX&`'8HJ.)&XG M!32PP2I@(-03HP#^AB-2-2G&"0,;$)8F.U%E356]85+2$!Y!%.^&3>&8<]YY M"Q<`C*UPC2LBYO1$&4YA9"0CCUP+<::]7H,8?V5"V!)!CH\,(Q5_741A$;'8 M7!SV*HWUJV0G2]G**M:RF,5%9#/+VX_X#*)+(+7L_.0KS6**\_Q%`%*[BW M"NU]KQ7:&U_XNO>^]<6O?.G[WOCJ=[[_Y6]^[[O?_?(7P/;-;X(-C&#^`,_7 MO_)]<'\;#&#UHB(,-T"`S?!4@_!,06:@JP%41I:!!3#@Q"@V,8I7S.(6KUC% M+HYQBV$<8QK+^,8XSK&.8QP!O/(@`3:[&)!]@H,$1,?"AN!!#78P@!VD80`1 M(T`8;"``!!A3``(8"HEM_.(:I_C&7#XQC,/\Y1V;^-,&4R"`.Y%,"`/D@`<%$(2?VY!A&1H`!P8@3XG1S.A&.UK&:Y[Q MHW4<`:CLP,HY2$"?,%VP!.R`.WP&1@X&0&@KMP$!URFT#=RD9QFV8=&3CK6L M61QI6L_:QFMN\\C,:0,"X."&J"9`#NJ,``3^H#?4?2I`3W)@`$'SR09Y`H`- MJ/QK092X`;/.MK:WK6TWRW`'<*9"&M(`[C1HN`T%&!.R+P:`&^0.#;X>=5)L M@``U\`!0`4C.ELLLYGYWF=\JIO&8_4WP@/\[S01/\\`+#O"&'US@98:XOQ<` M`;Q>&@SP'E0Z5U=L&QR;SYE.P`'X-(4$U"`H??JU)-!@@Z5H@`$/:(`#'A!S M!]C\YC.7^\[SG.]4$,:QD#VLIN][&,W>]K/KG:VGWWM;A\#W-T^][C; M_>YXK_O;\7Y9L._^I!`?][O@!T_XPAO^\(A/O.(7S_C#-W=DW(W\JJ M`?*33R[F,W]=RVM>NYNGO'(Q'WK/F_[RF2<]YTM_>M6+WO/99?UT&T][PD]% M*4=$DWAOGUP?5.`"P`^^\(=/_.(;__C(3[[RE\_\YCO_^="//O$M<`5#K&DG M9[W9#G"`G"?:X`:_WLYU='"#[@\"`PI8@/K7S_[VN__]\(^__.=/__K;__[X MS[_^]__^(,@0!S>@,@F0`.HF"1%#:#60)S=#%1Z'37U"1;]F%#6@9:^V``V` M;0R`@2NF@1O(8AJ(;1QX8B'H@3$V@B*(8B.(@2"(@BVV@BQX@B>8@BW^^((9 M2(,NV($D"(,U*(,[2(,O"((+(`0^<6FGAA3&9DP'$,V0`74T08GYQ,W\&$W5`-'>#-IP#!0*`EM M,H6"(`4W8#/[UH5XF(=ZN(=G]H5@4`-_*`B`2(8W$`4'D!10:(7ED0,H)SJK MPR=QZ&J.>(4WJ(,Q2((QA$% MQ_8#&)`![-B.[OB.\!B/\CB/]%B/]GB/^)B/^KB/_-B/\(@!6-`(35A[!'E; M(V,,BJ`&Y+!YJ=>0H<>0KT=>LD=0IV>1$GF1JM=Y#EE=HL=ZL+=ZWC61 M&YF1E5>0*)F2*KF2+-F2K55PGF>U'F95Y?Y;I?IEY MF8M)?YOIF?(GF0R@`!M01`60!E(`9"*F,C5@`W2&`&-("2UG.V`H"(%B:6," M%=?FB3C(@RIX8[[YB3`8G+PY@SFHBJ^H@[\9BL/9BIUHBI[H@B;H@\U9G)=H MG,M9@BBX`*6I!FB0`"P7'3:0FZL3@`237%3P:X&"'4FQGFAP`Q0(:WPXG_19 MG_:I;=PY"`DP'0%`,J"/#)GLK@@(,@G_?9H`[ZH!":9MU) MAN'9!N-I3&,8H%!(%3M`10&(H,-6"+OYB3=8BJ)XG<5IHAV(G"2*B=3^J:+" M:9TR2HHN1J/&J9TK^J(G"HHPVJ++F9]0@0`_H9IA\&SJAB<&"F39T88W8$VV M"28:A@,]06+I%XU6>J58FJ5:NJ7X1YJ#,`7C.!1C(FY,@7)(`0;9EWVN=J9J M"@0:L`%P&J=R.J=T6J=V>J=XFJ=ZNJ=\VJ=^^J=\V@.`.JB$>J<:\(51:5M* MV5I/:0EI@'F/&I*K)WD4V5TE2:FH)ZF9&I&8ZEP5^:D=":JB&JH.>5R=:JG& M=:J:JJJ)VJJ>53/3Y"5+)@@AHVZNVJJ2L"=@@`!!L0,3.$VV.(ME=:NM:F2$ MMCL%4YXX$!T40ZRN.@4:9@#1`:!-VJM\TJ@USDI[VN1QM0,F.J`#?%(#2I6M E41DQ;.`P:0!M$X@&-9``U4:N46D4:2)#N4>O\'JO^-IX@0``.S\_ ` end GRAPHIC 18 g39741fei001.gif GRAPHIC begin 644 g39741fei001.gif M1TE&.#EA?0`K`/?^``````$!`0("`@,#`P0$!`4%!08&!@<'!P@("`D)"0H* M"@L+"PP,#`T-#0X.#@\/#Q`0$!$1$1(2$A,3$Q04%!45%186%A<7%Q@8&!D9 M&1H:&AL;&QP<'!T='1X>'A\?'R`@("$A(2(B(B,C(R0D)"4E)28F)B7IZ>GM[>WQ\?'U]?7Y^?G]_?X"`@(&!@8*" M@H.#@X2$A(6%A8:&AH>'AXB(B(F)B8J*BHN+BXR,C(V-C8Z.CH^/CY"0D)&1 MD9*2DI.3DY24E)65E9:6EI>7EYB8F)F9F9J:FIN;FYRGI^?GZ"@ MH*&AH:*BHJ.CHZ2DI*6EI::FIJ>GIZBHJ*FIJ:JJJJNKJZRLK*VMK:ZNKJ^O MK["PL+&QL;*RLK.SL[2TM+6UM;:VMK>WM[BXN+FYN;JZNKN[N[R\O+V]O;Z^ MOK^_O\#`P,'!P<+"PL/#P\3$Q,7%Q<;&QL?'Q\C(R,G)RWM_?W^#@X.'AX>+BXN3DY.7EY>;FYN?GY^CHZ.GIZ>KJZNOKZ^SL M[.WM[>[N[N_O[_#P\/'Q\?+R\O/S\_3T]/7U]?;V]O?W]_CX^/GY^?KZ^OO[ M^_S\_/W]_?[^_O___P```"'Y!```````(?XU($EM86=E(&=E;F5R871E9"!B M>2!!1E!,($=H;W-T'&DE,"$$T.*'$D2 M),F#)D^*!)DR)3D\-@"$.#+D"90C#0!LX491I<^>)Q.*VP%J9OX$*!TR(-N<#"S#.#YZ``T"'NI\^4/B_E/"(Q M9;Q::%0`V%M@QQ`=?"Y%&AQ),.%+5'0,"=$@0H(C5#C5BC>PU@X`*B*=.Q@1 MY"4`3]SZQ,-)9<+/(0#0)6AR7JDC``K8.'*IU#G*;N>Q(W;IDAD6$38\V<(" MP)!KG.%"C--/>?A/A`0`H:`!0W40)U2(3._YL`<`T%9$` M0"(F?46B2;_`%D$C77TT4#R@Z```%#R9]PN-U[1'(XE"FIB(/T^H.-(S`%P@ MC3_Q-!`"2(08QY.04.;("FPOE();2R8E$],67274RT8"Z86<6/BUL(!,>19$:HHT#$@`%`!%N,%R!]O[Q0P"7^/+,!`&;4"8"DT"5T MWQ%Q)C!$2`GUMXH_73GJX&?^H4UJ74'2K+)%AY'!F.BL]H6P04XL5&0B`1")%V\]SRJJUL)K;(7`!OL0$@R:\I*[C4)O'!+3ICZ M(^*,!HOD:"\4J04@GC*R0A$+!>`VW9C[<2..."T16VP#3\QSQ`6.8HKEJ:'Z M0P!D4U!D4I@T%)SX0-VADC1*C9MB@@H.GT9S0-.V=FN/JU4X4)J;I M.5HW9Y]Y!!'4@`"5$"B_`JFZD/>)+I$T0P"`QGA=85EH2K#USJI`U\P10=[Z MQ6-J0>P4`,7G*DB_]]8KDA=)`3\"^'K,GS5,T32P[5`W2,#!#:ND\8L++`L. M.C##)8@A#C"T9R^%$])G*&:2(U2.//XP&AZB!(!&&(P;>-"(#FH1I/N=34@I M(@9%Q+&G(X!L(.*XSP;F,(>Q&)`O+T##)9PP4C^\8I'"0<2@C\1)'/K MPY.1DN0/F^V@)`(AQR5L4(`&;&$.Z$*52%X`,7^00T81F,,T6-$&.,#A"!%@ MS%Y"$#HXM($0TTC-'`@"BIP40".KF@<+UD<0+,4*(BD"D4%F]L2/="M^Y!)( M#-&X@0YHZQ+2D,8TI&$_%K$#- M]G*!-E0+:BI(R:$\,KBCU<=?D=.3TZ1&GX&PXQ9MX$((4K.7"*C@F"QX@0U( M0((B@J%*#^34,Z3QC+\19&8Z&,@YIDF,&U(A$;>2"14T4[/Q=0HD\S"@Y5@5 M@@(@DB`VJHZ+-GC"NBCG'L_^R"M&+9_0'#-R8QC1X(AT`=``.[\P4(0@! MA0ZP0"]I[$`(./DO@\*G9ZQ)"&P`RPYF/ MIE(A(2"!T'@6FL=Q]'FLZ24G)AJ!QLPE4;VH$@G`P`EI4&8>*G"G0;90`)Z! M@6>%RNJ<]A(O@G#B1!!Y0@,J>3F>+8T+`*`@5M]B(PQ]I`V@$>1`+@,\A'2E M:=*`C;]>()'MC"^;G$'L>`"+KY"XB!V':EL]59<2$R7/ERQ(`,70UB\^<::E M:!#^ATY@,[R$D&,#)&@I\(1T*$R%:4HC&=`N1XO5A"@K!)1)"#L@%Y&!-.D" M%QL(.2X0@7L`MC_T%!([;.0=`+RP=J#`TCE#TA47V7*P/XE'3`K7-`^6S%&" MTV9Q:L&.GK%@`^:164P\$@'W$419)$C`2#'(*K7L%KU!8>S^:&:0_K@7(NQ0 M00(<9(8(2`=IZ+Q/!YZS'IO`\DE"HE4((%",+GF<9D[/AE@M;#!!0R"Y0L\N0`7\-9EJ\>"#,8F-C90K")S M@H=5$,)&+]"8VQQ#A6?$XQ[L.,!2(- M`\:Y)TOM@``==824AFD'0?KQ+VK1ABV``0Q;F`^)B2&+,7T%).>0!1J@`(95 M&/9R1NKHM`]2O0U>KA0&#$%D2C&-4JQ3&C$![IB-(VTHAFI'4`!"FB^!2MTYI`:4E$$/2>L)\I)$G$`X(&FTY['V8KCZ5\0 M@P_-J6A%27#O?9LF4QTH0")@[G,,*@O*MY`%')KS!%#4@A6RB'I"BZX2=J0H M`1.G^D2>D?/I;,%[E].Z:,Z!!D1S87ABA]8\YB%$UI8G[8K:VRK@`(4@!00` !.S\_ ` end GRAPHIC 19 g39741fei002.gif GRAPHIC begin 644 g39741fei002.gif M1TE&.#EA>P!/`/?Z``````$!`0("`@,#`P0$!`4%!08&!@<'!P@("`D)"0H* M"@L+"PP,#`T-#0X.#@\/#Q`0$!$1$1(2$A,3$Q04%!45%186%A<7%Q@8&!D9 M&1H:&AL;&QP<'!T='1X>'A\?'R`@("$A(2(B(B,C(R0D)"4E)28F)B7IZ>GM[>WQ\?'Y^?G]_?X"`@(&!@8*"@H.#@X2$ MA(6%A8:&AH>'AXB(B(F)B8J*BHN+BXR,C(V-C8Z.CH^/CY"0D)&1D9*2DI.3 MDY24E)65E9:6EI>7EYB8F)F9F9N;FYRGI^?GZ"@H*&AH:*BHJ.C MHZ2DI*:FIJ>GIZBHJ*FIJ:JJJJNKJZRLK*VMK:ZNKJ^OK["PL+&QL;*RLK.S ML[2TM+6UM;:VMK>WM[BXN+FYN;JZNKN[N[R\O+V]O;Z^OK^_O\#`P,'!P<+" MPL/#P\3$Q,7%Q<;&QL?'Q\C(R,G)RWM_?W^#@ MX.'AX>+BXN/CX^3DY.7EY>;FYN?GY^CHZ.GIZ>OKZ^SL[.WM[>[N[N_O[_#P M\/'Q\?+R\O/S\_3T]/7U]?;V]O?W]_CX^/GY^?KZ^OO[^_S\_/W]_?[^_O__ M_P```````````````````"'Y!```````(?XU($EM86=E(&=E;F5R871E9"!B M>2!!1E!,($=H;W-T82/';N!^.1AW,BQH\>/($.*'`E2 MWBHN$1JJ!,"@902&*QE$8$#&F#N2.'/JW(DS6RDB#1D<@;.J5*E5Y2RRRQ8J M52DN4DH`2!!4RM%R/+-JW?KQ24,>NF[B=,Y M<]:+GF.!:/CAD5C/J%.'U.ANDU0`&V*IGDV[HSP^#!,0>ER[=^I>3U(RX>:[ MN.I5#`G@X&V\.5QA0!H>^6;8N?6W>JAN@':]N]ML+@#^@%AUVKOYG-^B`V!T MOKU.-`W7,'=/GR-\`!3KZ_R$]X'6#&X M'S<;`*"'A`%VXA^&;Z73RWQ;P3:9G4*:8 M)T=THB8'`'[\"6B1J%$"P!6&TA7C7)XY`X`+C6*D8R6H2:IFI02--J-GT$S* M*4$QDME9J)2.&BBHHJJZYZG^0(Z:T:N1AB8^BA8)89JZ194D(KK1" M!E2OG#)9)V10LN=KETP"X5DV5.&)X;,=N5/LG#P9TY"U^V&[D3O9E&O-33%. M$.%`[I!(TF-^#5J"N.9]4\HCX0!PXD`=I49T$"3`!`/QG(.GH!!E<8+V5)$!O(/R@R[1$P0\G/&-NNC%47HA1RG$S(5K@(8P=#$+/K[1C6<4!B5PL('D`.`#J4B& M+BKC%XTXDB"0-(PUK@""E!"@<(_X!KVJ<[?9<$,.$T@=#Z1PHY+@8PU::L@$ M(,45;J0"#3%2"1=Z82GWR,,8B0!!!`&``B)L8G'PDL=-RF$#(/%`)2Y@7"1Y MXHY>$`(%%;PD$Y)Q(&C,0@ZCJ6$"@,"(5'PCC>4(3P1P.16&,(`0O2C')D4B MCU"H!P!`H`27>M-)`#GR,>[^,`8AN%!!DI6`"Y7H1#&Y()!DQ))D`#A")TI' MEZQLX@K]!,$L.K-.DI2#$DV4("&^\4U\0(,09(C92DK0S8YRY1MR@,D3A`<8 M>93CI?;JA$QGR@0R,,*7C#@"$W:J4TIT8A.;.$HJ8E&*3L3(A>4$@1Y6P=18 M)F`"KU$)8Q9JNI'X11A'8(C]_B*/_<'!!GI+)16EB+*Q-B0!,9"##1(0@1B( M%``D/1>W0A(*5?)M*_I+Q3NU-(&UO>X+9"##%_Q`"-SI@1%$<8C_I>`)UCW+ GRAPHIC 20 g39741fei003.gif GRAPHIC begin 644 g39741fei003.gif M1TE&.#EAW0`Y`/?]``````$!`0("`@,#`P0$!`4%!08&!@<'!P@("`D)"0H* M"@L+"PP,#`T-#0X.#@\/#Q`0$!$1$1(2$A,3$Q04%!45%186%A<7%Q@8&!D9 M&1H:&AL;&QP<'!T='1X>'A\?'R`@("$A(2(B(B,C(R0D)"4E)28F)B7IZ>GM[>WQ\?'U]?7Y^?G]_?X"`@(&!@8*" M@H.#@X2$A(6%A8:&AH>'AXB(B(F)B8N+BXR,C(V-C8Z.CH^/CY"0D)&1D9*2 MDI.3DY24E)65E9:6EI>7EYB8F)F9F9J:FIN;FYRGI^?GZ"@H*&A MH:*BHJ.CHZ2DI*6EI::FIJ>GIZBHJ*FIJ:JJJJNKJZRLK*VMK:ZNKJ^OK["P ML+&QL;*RLK2TM+6UM;:VMK>WM[BXN+FYN;JZNKN[N[R\O+V]O;Z^OK^_O\#` MP,'!P<+"PL/#P\3$Q,7%Q<;&QL?'Q\C(R,G)R MWM_?W^#@X.'AX>+BXN/CX^3DY.7EY>;FYN?GY^CHZ.GIZ>KJZNOKZ^SL[.WM M[>[N[N_O[_#P\/'Q\?+R\O/S\_3T]/7U]?;V]O?W]_CX^/GY^?KZ^OO[^_S\ M_/W]_?[^_O___P```````"'Y!```````(?XU($EM86=E(&=E;F5R871E9"!B M>2!!1E!,($=H;W-T+!BSN6.'-2=/?LGLZ?0`?>@Z0AIA=A]^Z1NQFT MJ6EQ(DN/6U[,5U9+(6\6:VKV M[D-1,"L8L\NWX"TOE!JN\Q'23]_#`B&)[,4M&R]*8*)-M[<@"$F(KS6?.0X"/^D"TX:[47RLJM"G3G MSOK#;)!NA#3QYA:YTXA[Q=7S])(,$S>001@`7EAWCW$:<)=>0=3<@EY!]/!2 MCD'>O+'$$C[X4`08K##5$#EZA!#2#J"PM2`]2VBG8$[KE$.7*P1$T(M!SU0` MP!L+&E2.#PF(TE"-.!8$"'A$$D#%A!"*(A\`)AB"68[]Z$=@1O3,@M]$]SP! M`!8-91?!7E`.-`M,IS0D"@`^/"B0'@!H\(0::@SA04B`%&0,%EDU29)&Z\R& MTSW_62C0DC^1613TCI@A"#,2:+1`\D2'D00`4Q$`E"!"2WP M,E$V)C``)D5>,,FJ0.MH6<%4]SSCRI54)271/:H*9Q`W(AKBT"DP44H%`![L MZ<+I2-G&"L6Q#$QMFT"U946J0OA50 MTP\DJY&!'EX`#,%H.9=@&`$##*@P!!679.->/Q<#P"]!Y>BA@2,'O7'K0,^H MJIVLEZB@PA-+``M`"TA!Y,TICES"#%W4A$!`F>7(+!$H`"A+D#N4Q)7@S*N! M!PK^0<*8L,.[K:HQGE#9///@,X[,:-`]E(@8D@I^-D0:`8,3-&0$D1.T3@LY MKT/):A5,W4^S`)39#S5V<'Z<"BVTH`)L&MCQ<3_TV)$W`.+RO4-L>]VCR)Q8 M=,6+B#+L;A@]#-_#2]X5&`M1-C*$)T,1G$<`B!PJ7"K1&]HQ2BNP:KCC*``$ MD"%?$3?1XTKT*C#*C6T5KZ>'!PQ`W<\ST=\P>S]HW4Y^<@[)3@A$UH][I&@' M$1N(,&S4`BR`SG0"85=R9B$B`BQ!%,)P$<.,\;N0:$\@G6```6Z0%0\HKA]] M$U9<#.$./0"+#`)YWZIXD8`;>,@=I`/`$HY&D!H9+%C^2R"@0=RQ.Q]TA59$ M&D(47G@5\F'!$$7(6Y!:91L&G-`=;P!6"[R!/^=`:B#N&%*P=K"_@92#\T)!3.`X\-P#@0/0%`#THPD9#<`7`!$(-+!S'=+R(2ZQ>=2.!I-`'PE"# M7)8('AA6S5#N$`8!9,`4 M0,!3A(0`!$B`'LI8D%YDA4O,B)X&9N1'`NQ-%"#Q@:QR2(`W<&X(CG@C`RAA M!P!0P2?/&%!SE@81>CC"!)W^)``8F,%#@V1C3A%0`QCB0H`BV(A(>NG'&=OT M,V`-@3*Q5!H?=V>"2U`"."V0PVJ"R0SC+/,-6=E!PP9""9C@QB"*B<"*!D*. M`3TA;!3*I3O[N1Y%$H`2G2">L=Q!&#"4`Q"KP0);F#$G\OF!'JT,B0P&%$WD MT`,4((F`(T"1``:L5&RSL$-1M!/*B$`E6"&XQ"U`-U!2KL-W6GD&,Y@A"AO! MT!6J(Y^Q6/$J*LA*&+"1P3,V=U->V*&H/NB%(GYYTH9DR5!@>E"S&-`)]`Q' MD7)[2"V9Y""'W,,8S9KD$K)2`<4)HV:.N.9I6BE-RMS"1A5X`SDZ0:0$[("$ M7R/^BR15`#AC`$*(`UG'DDS0U8B4`PP,2$`+_$"2=B8`%.O0IF`)H`$Y&+.>(:'CO("H55Y3(@>0)5E M/PP1$@\0@`'U'0ASR)>5!,A!$3V&"1A$XP@/^L0=MGDF>#I)!3#.PA!4",$- MR'$F6Q*)2[SHI`AUV)5F>OL?^9UH`"`^IYIER\)`S M-0`)3`VGK<>)P`T$)QJ\`L`/@R+,#MSV$#^&I,DE$=]JD",0M>V-'L_H!23>\-H;R&`(=NB$,#Y,NV?LCQYZN,$.&DL0 M;SCBJ@WI!2!<<38=[2Z:Y%,#;LU(R`A\42,=!=83/.0-0XB"&NYAA08T(`>W MW<,.!/"`(Z[D0WH2Y!ZL&,(.#$&-M#4MZ3S@JN+\':GD,.C M&CB%TIL"HQZQG2_E2%$%#$$/2E",+X]\M5W6@85\8_OO5,'A<1A"1`#(L2V. M7O+EV^*.3JB!T)#_"B1@\H:;D"9==?DJ>#3PK-"[7B7"F)--!)*==];EHCKT M8PNR_OK>7X0;TDCE?T4Y?9DRT MY8`:6(``H'^T(VA4UQ3>P#F*,!"L%7,:V("*80+/DER%U!9CHE+00A@YEH+\ MURR@0A#&1`";YQ5LDB8",28^,%(VZ'S>("(J0U+HTGI5@2*?`B_-XH%%Z'W, M,"G_9AQ%L'=`P5?CD0T:H&)3R'Y5F`#6YX*9]!4UPH,",21J$(;[-X;6MX,] M6!4--H"N4`$J\'5NZ'S&=!L$87@RV!9>"`!D0%3>M(>,[5>%`'!_:_(U9M<4 M]%!%A!$%1(B(KO=/:((>]*`EMN<6KO8X>FB)O<(G?0B`9N$.D/`$9'`R MHOA\BO&$_6!X5O6*M@@4Y/`JG=4/[>1UM_B+.<$]P>$-1:2%P'B,%N$-JC)) H63%%R/B,)<$-5G,<-`0$`.S\_ ` end GRAPHIC 21 g39741kg01i001.jpg GRAPHIC begin 644 g39741kg01i001.jpg M_]C_X``02D9)1@`!`0$`8`!@``#_VP!#``H'!P@'!@H("`@+"@H+#A@0#@T- M#AT5%A$8(Q\E)"(?(B$F*S7J#A(6&AXB)BI*3E)66EYB9FJ*CI*6FIZBIJK*SM+6VM[BYNL+#Q,7& MQ\C)RM+3U-76U]C9VN'BX^3EYN?HZ>KQ\O/T]?;W^/GZ_\0`'P$``P$!`0$! M`0$!`0````````$"`P0%!@<("0H+_\0`M1$``@$"!`0#!`<%!`0``0)W``$" M`Q$$!2$Q!A)!40=A<1,B,H$(%$*1H;'!"2,S4O`58G+1"A8D-.$E\1<8&1HF M)R@I*C4V-S@Y.D-$149'2$E*4U155E=865IC9&5F9VAI:G-T=79W>'EZ@H.$ MA8:'B(F*DI.4E9:7F)F:HJ.DI::GJ*FJLK.TM;:WN+FZPL/$Q<;'R,G*TM/4 MU=;7V-G:XN/DY>;GZ.GJ\O/T]?;W^/GZ_]H`#`,!``(1`Q$`/P#V6C-G?&*YNYU7Q%9L%NKJ]@9AD"3*DC\:[Z6"=2*:D MM3RJ^9QHS<7!Z=>AZEFC->86^H>)KN,R6TU_,@."T89AGTXKN_#;7AT2`ZAY MOVC+;_-!#?>.,Y]L5G7PKHQNY)FN%QZQ$N51:TO=FK129%&17(>@+129%%`" MT4F11D4`+1249H`6BDS03Q0`9%&:\Y\1>)+YM:G2SO)(H8CY8"-@$CJ?SS6U MX)UN>^^T6MY.TLJXD1G.21T(_#C\Z[9X.I"E[1GF4\RI5*_L4OF=5+*D$+S2 M-M2-2S'&<`>9+)G:OEN,X&>I'M5G5O\`D$7G_7O)_P"@ MFO.?"/\`R,]G]6_]`:C#X>-2E.;Z!B\7.C7ITXI6E_F>HYHKCO&>NZCIU_': M6D_DH\(&)Y)_#MI+-(TDC!BS.]93P\H4E4>S.BGBX5 M*\J*6J-:BDR*,BN5MH)QG!/--AN8;@_NGW?*'Z$<'./Y&GN@D4 M`]B#^1S5>RT^&QW^3N^8`'<<],_XFJ7+;S(?/S*VQ;HHHJ2Q*X/XA?\`(0M/ M^N1_G7>UP7Q"_P"0A:?]7FW^Z2^7YFKX`_P"0%+_U\M_Z"M8G MB_4;ZV\0RQP7EQ$@1,*DK*.GH#6WX`_Y`4O_`%\M_P"@K7-^-O\`D99O]Q/_ M`$&NJBD\9._G^AY^(DXY;3:?;]1R:CK.O7<$<'VAH(-BL(R>G`+,>Y/7FMS7 MM*U_4M6D6SN'CL]JXS+M7..>!R:UO"MNEOX=M-B@&1-['U)YKF->\3ZA=:F^ MGZGIMZ:E#5-% MU?P\D=T]W\K-M#P2MD'KST]#77>$=9EU;3G6X.Z>W(5F_O`]#]>#^57D"[-S-@X)SD_2M;X=_=U#ZQ_P#LU:8A1J89S;3:ZKU,L&Y4 ML:J:3BFMF[]#!GUK4+;6Y7^V7+QQ7)/E>0@ MJ5DVJH/3Y0>!6?=`-KLP(R#=-D?\"KT/Q<`/"UW@=D_]#6M:LXTYTTHK70PH M4Y5J=9RF[1U_/_(S/!.MW5^)[.[D:4Q*&1V.3CH03W[5A>(=6UAF>. M%)/*2-6V@D'&3]35SX??\A.Z_P"N(_F*L^(O!MQ-=S7VGE6$AWM">#GOBLE[ M&EBI^TFY$-T\DUOG:\F/2MKQ]J.VU@L$/,I\Q M\?W1T_7^595J-6=>,9VUZKL=&'Q-"EA)RI7371]WL MW&!^I%-T.Z?2M?@=P5V2>7(/8\'\OZ5U'P_L2EK]_\`+\OQ/0=6 M_P"01>?]>\G_`*":\Y\(_P#(SV?U;_T!J[2SU#^T_!TMP3E_LSI)_O!2#^?7 M\:XOPC_R,]G]6_\`0&KEPL7&C5B^E_R9WXZ:J8BA..SM^:+_`,0/^0Y!_P!> MP_\`0FJ'1]-\1S06T]I).+,MD!;G:,!N?ES]:F^('_(<@_Z]A_Z$U=3X2_Y% M>S^C?^AFKG5=+"0:2?K\S.%"-?'U(R;5M=/D5?$]CK5]-;Q:9,\<15O-(DV` M=,9[US.H^&=:TNU:]>Y1U3EC%*VY??D"M7Q7XJN;:[DTZP/E%,"27ODC.!Z5 MGWOA[5TT>34+_46P$#&)W9B<]C[\TL/STX1YFDGY:L,9[*K4GR*4FMW>R1K> M"]?N+YI-/NW,KQIOCD8Y)&<$$]^HKKZ\X\"?\C`W_7!OYBO1ZX\=",*S43TL MKJRJ89.3O;0****XCTPKCO&NDW^HWML]G:O,J1D,5QPIWVO2SVUG)+$54!AC' M`KO:*UABI0JNJEJS"I@85*$:#;LC/T."6VT6TAF0I(D05E/8UPVK^'-6LM7E MN+2VEE0RF2)XAN(YR.!SQ7I-%%+$RI3=WFE^*-9M#- M?)(PCQY<1"J6).#P,8X]:V?!.F7VFB]%Y;/#YFS;NQSC=G^8KJZ*J>+E.FZ= MDEY$4LNA3JJMS-M=SS2?P[J[:Q),MA(8S<%@W'3=G/6NU\2VL]YX>N;>WC,D MK[=JCJ<,#6M14U,5.D:AIU_<27=J\*M%A2V.3 MD53N[WQA;74RQI=&,NVW$`?C/'.#7?TE5];;FYRBG%=4U&_$]_"\,3/OE:7AGYR<#KDU/XFTK5]1UF:XCL93`@"(W&-H'7KZYKT& MLKQ'>_8]'FPOZ9HGF,X-U6EH@IY/3G%44WJU=E;2=3TC3=+M[1;R M/]V@#8!Y;J3T]$Q>(E4]JTO\SV\?@,)"BZ";>GEI^! MRGAW3]6L].U*QN;.5$FA8QYQC?C&/QX_*J7AO0=5L]?M;BXLI(XD+;F.,#Y2 M*]"HKU7C)^]HO>/#66TUR>\_O4UC MZ5!XJM_*MH8KJ*W5QE64*`"BT4H8R4:?LVDUYCJ9="=9U5)IO>QP'B MGPUJ+ZI-?6L#3Q388B/EE.,'CK^5,-AXJUJS:*[\U8(E)"R*$+D#@8ZD_6O0 MJ*I8V:BE9-K9DRRRFYRDI-*6ZN<+X1T74M/UKSKJSDBC,3+N..O%=U117/7K M2K3YI'7A<-'#4^2+N@HHHK$Z0HHHH`****`"BBB@`HHHH`****`"BBB@`K%U M32I-8U*-)7V6D"Y(!Y=CV_+'YUM45$X*:M+8TIU)4WS1W(X((K:%8H8PB*,! A1VJ2BBK2L9MWU84444`%%%%`!1110`4444`%%%%`'__9 ` end GRAPHIC 22 g39741kg01i002.jpg GRAPHIC begin 644 g39741kg01i002.jpg M_]C_X``02D9)1@`!`0$`8`!@``#_VP!#``H'!P@'!@H("`@+"@H+#A@0#@T- M#AT5%A$8(Q\E)"(?(B$F*S7J#A(6&AXB)BI*3E)66EYB9FJ*CI*6FIZBIJK*SM+6VM[BYNL+#Q,7& MQ\C)RM+3U-76U]C9VN'BX^3EYN?HZ>KQ\O/T]?;W^/GZ_\0`'P$``P$!`0$! M`0$!`0````````$"`P0%!@<("0H+_\0`M1$``@$"!`0#!`<%!`0``0)W``$" M`Q$$!2$Q!A)!40=A<1,B,H$(%$*1H;'!"2,S4O`58G+1"A8D-.$E\1<8&1HF M)R@I*C4V-S@Y.D-$149'2$E*4U155E=865IC9&5F9VAI:G-T=79W>'EZ@H.$ MA8:'B(F*DI.4E9:7F)F:HJ.DI::GJ*FJLK.TM;:WN+FZPL/$Q<;'R,G*TM/4 MU=;7V-G:XN/DY>;GZ.GJ\O/T]?;W^/GZ_]H`#`,!``(1`Q$`/P#V:BBB@`HH MHH`****`"BBB@`HHHH`****`"BBB@`HHHH`****`"BBB@`HHHH`****`"BBB M@`HHHH`****`"BBB@`HHHH`*JWVI6VGJIG=B[G"1HI=W/LHY-6JR=!`NX7U: M3YI;MB5)_@C!(51^`R?B@#(_MRX_P"@!J?_ M`'S%_P#%T?VYB@#(_MRX_P"@!J?_`'S%_P#% MTO\`;VP;KG2M1MXQU=H0P'N=A)K6HH`CAFBN84FAD62-QE64Y!%25D1XT_Q$ M+:/B"^B:4(.BR*1N(],AA^(K7H`****`"BBB@`HHHH`****`"BBB@`HHHH`* M***`"BBB@`HHHH`****`"BBB@`HHHH`****`"BBB@`HHHH`****`"BBB@`HH MHH`****`"BBB@`HHHH`****`"BBB@`HHHH`****`"BBB@`HHHH`****`"BBB M@`HHHH`****`"BBB@`HHHH`****`"BBB@`HHHH`*R/"O_(L:?_UR'\ZUZR/" MG_(KZ?\`]>XE2*)!EG,%9MSY!'0*0`.G%++XKO[>VTZ>5+`M=I'*\".Y94=@`/:MRT31-3>:\M8[.XDE3RYI%12S*1]UN^,=C4DNB:3,D22Z9:.L*[8PT*D( M/0<<"A`]3FX/%^JS0,WV&U,KQR/%'%*7(V2[&STW<%5NIOLD3,C@'E&SRH(W'GTKH3H&C%=ITJSQ@KCR%Z$Y(Z>O-3)IEA&)0EE; MJ)U"RXC`WJ!@`^HQ1T'U.1DU:YB\8L^G7<$EM?-;[_.D9E"^6[?)SA<[:VO# MFORZQ<7D,HMR(0CQR6Y;;(K`]-W)QCKT-61IFA6UQ%;IIMHCR\H$MQCY.>H& M!C/%6K32]/L)'DL[&WMW<89HH@I;ZXH0F6Z***`"BBB@#(O?^1ITO_KWN/\` MVG6O61>_\C3I?_7O@`HHHH`****`"BBB@`HHHH`****`"BBB@`HH MHH`****`"BBB@`HHHH`****`"BBB@`HHHH`****`"BBB@`HHHH`****`"BBB M@`HHHH`****`"BBB@`HHHH`****`"BBB@`HHHH`****`"BBB@`HHHH`****` M"BBB@`HHHH`****`"BBB@`HHHH`****`"BBB@`K(\*?\BOI__7(?SK7K(\*? M\BOI_P#UR'\Z`->BBB@`K#\465STTR\@@DD(N%BQ'<.=I"-P&T5?-*\L9'P$11W)R/S%,EU! M3$6\0:5':PQ[9%>1UF3=G``XSN^@_&@9@_9/$@-NC?;P0BFVD60'RAO;>LO/ MS-LV@9SS[U!<6^N0^'M.$-MK$E\R&261IR620$<,H8`Y& M*!-2MVEE"E$#Y)#?=^F<=Z3_`(2/26MKB>.^B9+<@.L[JX&G0:DIDDN78/+F-@Q4I@D\-MW`>AI+FTU]?,DA76C$MO(UI#YO*-O7 M8'YR6QNZD\=:Z72/%-IJ5A9-++!!>WL>^.#<2,\XYQWQ^-:>FWPO[9G*&.2- MVBEC)SM=3@C/>BUOD.Y9C8M&K$%20"0>HIU%%`@HHHH`R+W_`)&G2_\`KWN/ M_:=:]9%[_P`C3I?_`%[W'_M.M>@`HHHH`****`"BBB@`HHHH`****`"BBB@` MHHHH`****`"BBB@`HHHH`****`"BBB@`HHHH`****`"BBB@`HHHH`****`"B MBB@`HHHH`****`"BBB@`HHHH`****`"BBB@`HHHH`****`"BBB@`HHHH`*** M*`"BBB@`HHHH`****`"BBB@`HHHH`****`"BBB@`K(\*\>&+`'J(L'\S6O6, MDO\`8$DL0,+>_V2K,A&Z&9,8.#]%/X$5+/I6LW5BT4NM(LVY6\(C75(!A85!%KSB.0N/XN.1)&MR1#_`,\D_P"^14E%`$?D0_\`/)/^^11Y M$/\`SR3_`+Y%244`1^1#_P`\D_[Y%'D0_P#/)/\`OD5)10!'Y$/_`#R3_OD4 M>1#_`,\D_P"^14E%`$?D0_\`/)/^^163X7AB.@0$Q)]^7^$?\]&K:K(\+?\` M(OP?]=)?_1C4`:?D0_\`/)/^^11Y$/\`SR3_`+Y%244`1^1#_P`\D_[Y%*L4 M:'*QJI]0*?10`4444`%%%%`!1110`4444`%%%%`!1110`4444`%%%%`!1110 M`4444`%%%%`!1110`4444`%%%%`!1110`4444`%%%%`!1110`4444`%%%%`! M1110`4444`%%%%`%+5=0;3+"2\%K)DO_H)J[;?\>L7^XO\J`,W^UM4_P"A=N_^_P## M_P#%4?VMJG_0NW?_`'_A_P#BJUZ*`,C^UM4_Z%V[_P"_\/\`\51_:VJ?]"[= M_P#?^'_XJM>B@#(_M;5/^A=N_P#O_#_\51_:VJ?]"[=_]_X?_BJUZ*`,C^UM M4_Z%V[_[_P`/_P`51_:VJ?\`0NW?_?\`A_\`BJUZ*`,C^UM4_P"A=N_^_P## M_P#%4?VMJG_0NW?_`'_A_P#BJUZ*`,)/$%[)`VQJ M;^UM4_Z%V[_[_P`/_P`518?\C/J__7.W_D]:]`&1_:VJ?]"[=_\`?^'_`.*H M_M;5/^A=N_\`O_#_`/%5KT4`9']K:I_T+MW_`-_X?_BJ/[6U3_H7;O\`[_P_ M_%5KT4`9']K:I_T+MW_W_A_^*H_M;5/^A=N_^_\`#_\`%5KT4`9']K:I_P!" M[=_]_P"'_P"*H_M;5/\`H7;O_O\`P_\`Q5:]%`&1_:VJ?]"[=_\`?^'_`.*I MKZSJ4:,[>'KL*H))\^'I_P!]5LU!>_\`'A.XA\/W;1 M2H'1O.AY!&0?O5)_:VJ?]"[=_P#?^'_XJIO#_P#R+FF_]>D7_H`JKK6O_P!D MWL$&R(AE#OO?:S+N"X0?Q-SG%`$G]K:I_P!"[=_]_P"'_P"*H_M;5/\`H7;O M_O\`P_\`Q55;+Q2+BQO[EXX6^RQB4"&3=\IS@-Q\K#'(JJGC%]\<;):.ROME M\N?(ERVT>4)"M]:"SF=F!21L'_9P#SDC)QZ#-;-`&1_:VJ?]"[=_P#?^'_XJC^UM4_Z M%V[_`._\/_Q5:]%`&1_:VJ?]"[=_]_X?_BJ/[6U3_H7;O_O_``__`!5:]%`& M1_:VJ?\`0NW?_?\`A_\`BJ1M8U)%+-X=NP%&3^_A_P#BJV*BNO\`CUF_W&_E M0!D6^O7]W;17,'A^[:*5`Z-YT/((R#]ZI?[6U3_H7;O_`+_P_P#Q52^'/^1: MTS_KTB_]!%:5`&1_:VI_]"[=_P#?^'_XJL_0[O5['28K>3P[=[E9R?W\/=V/ M][WKIZ*`,C^UM4_Z%V[_`._\/_Q5']K:I_T+MW_W_A_^*K3GE\B"278S[%+; M4&2<=@/6L2W\4">73XOL9#7H)XE!V#=CI@$D=QV[T`6/[6U3_H7;O_O_``__ M`!5']K:I_P!"[=_]_P"'_P"*I)=>*ZE)90V;2E28T?S`-TH7=M(Z@8/6J]OX MJ6:[BMWTZXB+PL[D\A&5BI7WY&`?<4`6?[6U3_H7;O\`[_P__%4?VMJG_0NW M?_?^'_XJKEU>-;PPGRQYDS!0K-PIQDY/L`:KZ3JKWZH)8T5VBWYC;V5L]S<:!=I$F-S>="<9./[WO4W]K:I_T+MW_W_A_^ M*I/%G_(M7?T3_P!#%;%`&1_:VJ?]"[=_]_X?_BJ/[6U3_H7;O_O_``__`!5: M]%`&1_:VJ?\`0NW?_?\`A_\`BJ/[6U3_`*%V[_[_`,/_`,56O10!D?VMJG_0 MNW?_`'_A_P#BJ/[6U3_H7;O_`+_P_P#Q5:]%`&1_:VJ?]"[=_P#?^'_XJC^U MM4_Z%V[_`._\/_Q5:]%`&'!_WU4O\`:VJ?]"[= M_P#?^'_XJG>)_P#D7+W_`*Y_U%:@Z4`9/]K:I_T+MW_W_A_^*H_M;5/^A=N_ M^_\`#_\`%5KT4`9']K:I_P!"[=_]_P"'_P"*H_M;5/\`H7;O_O\`P_\`Q5:] M%`&1_:VJ?]"[=_\`?^'_`.*H_M;5/^A=N_\`O_#_`/%5KT4`9']K:I_T+MW_ M`-_X?_BJ/[6U3_H7;O\`[_P__%5KT4`8D^NW]K;R7$_A^[6*)"[MYT1PH&2< M;O2MF-UEC61?NN`1]#5'Q!_R+NI?]>DO_H!JS9_\>,'_`%S7^5`$]%%%`!11 M10`4444`%%%%`!16;<:I(;A[73K4WL7^XO\JQ-1L_$U]IMS:>;I0\^)H\[).,C'K4TM7?S6MC!;1_P`)NW.\_P#`5Z?B:;M\3?\`/32O^_)@>7THCTV2#^M`&O164NJ75HX75K188R<"YA??'G_:R`5_'CWK4H`6B MBB@`HHHH`*@O?^/"X_ZY-_(U/4%[_P`>%Q_UR;^1H`RM-U;3M,\/:2M]>P6Q MDM(]@E<+NP@SC-:%SIUM?W%M&189YU>9F>68,-\A(QDG';M]*;%X?L(6M=J-LM,M'&2-N\_QGU;KS M7.PZ7XAM6MTMS>JL*@8:Z4H6\QMS$$Y(VD<46^E>)!$ZW%WJ3$6S[")D&)"W MH&YXSC)_*@&C=N-,TJXN%GEGW26$IE<^9]UC@X;],?05K@Y&17$'2_$233W$ M4%U%-/&JN8;E`&81`9.3R=P`R:N>&&U"[OY+DW%U)!'-/'*\TZNCX;Y0JCH5 M]>/QIVZ`^YUE%%%(`HHHH`*BNO\`CUF_W&_E4M177_'K-_N-_*@"EX<_Y%K3 M/^O2+_T$5I5F^'/^1:TS_KTB_P#016E0`4444`07DBQVSYNDM68865L?*?7G M@UE'PY%-/977VV1S;DR9"KB1R<[AQ\N2><=1Q1XKMFN]/MXH[U8%Q%K^A2C3=*-Z]K%#@2);+(NXL"2H[=6&,\<<4EN!T,OAU9;V6_^ MUE+YH?*CN%A0-'Q@GIR3[]*L)I#&PCM;B\EFV(R[P`A)(P#QW%<[?UZ4^&;Q1)J"K//<1PO.^1':#]VH4E1N/49QT M]<9I]!]3H-/TFVL-+ATUW,ZP_,"^`>N#_P!&I6O61XG_`.0&_P#UW@_]&I6O2`** M**`"BBB@`HJ"[O;:QA,UU.D*=,L>I]!ZFL\^(K<\Q66HS*>C1V;D']*`->BL MC_A(H_\`H%ZK_P"`3T?\)%'_`-`O5?\`P">@!/%G_(M7?T3_`-#%;%BLC_A(H_P#H%ZK_ M`.`3T?\`"11_]`O5?_`)Z`->BL@>([8H0*.KR6C@#]*T;6[M[V`36TR2 MQG^)3G\*`)J***`"BBB@#*\3_P#(N7O_`%S_`*BM0=*R_$W_`"+MX/5`/U%: M@Z4`+1110`4444`%%5KV_AL(U:7FE?\`?N3_`!H`L>(/^1=U+_KT ME_\`0#5FS_X\8/\`KFO\JR+VS\27UA<6CS:6JSQ-&6$)8H4 MC$NE$(H4'RY.WXT`;5%8^WQ-_P`]-*_[]R?XT;?$W_/32O\`OW)_C0!L45D` M>)0@60?KDU+;ZI*LZ6VHVIM)G.(V#[XY#Z!N.?8@?C0!I4444`%4-: MNY;/3)'@($\A6*(GLS$*#^&]E_V$+?_P!&"@#0LK2*QM([:$?* M@QD]6/BB@#G9M8UN+5WM6L[(0I$9R3,V[RPV/3&<<1VD1CYC4A^00Q7IN&.#0M@9>3Q;HDGG;+S<(=^YO+;!*D*P!QR02 M.!ZT:KX@6PTJ+4(;9YD9@SHX,;)&#\[D$9X'.*I?\(?(6#-JSR',Y(DMXV5O M-(+9!'(XJ2/P=:-`+:\E%[;I"8X8YXE(B)ZD'KSZ=``!1T&)>^*#IWB$65S% MOM9XX?L[01L[EG9A\V.`.*U;'6++4;B:"VD-DR"2`1D#(R#R*Q8?! MLL;V\DFM3S26R1)&S1)G$;$KGCGJ15S1O#;:3J<]\VHRW33IL;S47)^8D$MU M)&2/I0A,W*R=7_T*[M-3CX(E6"?_`&T)_^0-_V\V__`*-2 M@#7K)4?;_$4N_F+3E4(O8RL,EOP7`'U-:U9&D_\`(8UO_KY3_P!%)0!KT45! M=WMK80>?>7$=O%G&^1@HS]30!/156RU*QU)&>QNX;E4.&,3A@/RJU0`4456F MU"SMX;B:6YB5+4;ISN'[L8S\WIQS0!9HJ.">.Y@CGA'P';RVTY@F2PC9)`H;:0@['BJ[^*KA?-ACTZ1Y(G$:R2R*HE8.BL<#I]\ M&DTS6?#ESX7L;.]U"QDC:TB62*212#A1P14@N/!8+$2Z7\P(;YEYSC/\A^5" M`/\`A,-UTT*:5=$"9HUE8A48*"68$_[IX&:8GC$RVZ2?V7<0F1)&7SCM!*C* MCGU'-3"_\("X^T"YTSS0YD#[ESNQC/UQ2P3^$2\8@FTS='N"`,O&[K^=`R2\ MN[VXT^VD\J>,SV[.T=JXWE]H(4,>!WY]JMZ0TY2590^U2N#(H#;MHW`XX.#W MJY;1P0V\<=LJ+"J@(J?=`]JEH$%%%%`!1110`5%=?\>LW^XW\JEJ*Z_X]9O] MQOY4`4O#G_(M:9_UZ1?^@BM*LWPY_P`BUIG_`%Z1?^@BM*@`HHHH`*R=9U.; M3+FVEW+]D"2O.HB+N0J[OEP?Z&M:J.H:19:FR-=QNY165<2,HPPP>A'44`9Q M\76JYD>TNHX4BDDD=T`*;2!@C/4[ABHV\<:6MNUP8+WREV`L8,?,PR%&3R<9 MZ>E7U\.:4H8"W;Y@P.97/WL9[^P^F*7_`(1[3=L@\F3,A0LWG/NRHP#G.0]4UT'3DG,X@;S3(LF[S&R"N0,<\#D\=.:T:`,CQ/\`\@-_^N\'_HU*UZR/ M$_\`R`W_`.N\'_HU*UZ`"BBB@`J.>9+:"2>4X2-2S'T`&34E9/BABOAC4".O MDF@!=+M3=!-5O4#7,PW1JW(@0]%'H<=3ZUJTB@*H`X`&!2T`%%<[<:CK\>M? M9%&GB(Q/.`4HK!>FTD/$OV<@!?[QST&3]:`-Z MBL$>,M)W3Y-PJP>8&=H6524QN`)ZGD4:OXC-CHB:C;VX+-\YBN&"'RU.7/N0 MO0=^*`-ZBN8U#Q1-I^O11^4UU8W-O$85MX\N&=]N22>F*UK+6K:^OY[)(YXI MH5#XFC*;ER1N'MD4`:-9.J0?V>'U>S3;)'\UPBCB9!UR/[P'(/MBM:H+WFQG M!_YY-_*@"5'62-9$.58`@CN*=6?H!)\.Z:2N_]T?\`H0K5H`****`"BBB@#)TK_3;Z[U*3G;*U MO`/[J*<''N6SGZ"M:LCPS_R"&_Z^KC_T<]:]`!15#5]2ETNT-Q'8RW>T,SK& MRKM4#))).*@L=?@GCC-Z@T^67!BBGE0F12!@C!YZT`:U%4!KND&$S#5+3RPQ M0MYRXW`9(Z]<5-'J-C+E`%FBL.?Q/$-/U:YMK266 M72R=T+$(9!C(93_=/.#[&IK;Q/HMS;^<-2ME`D\IMTH`#XR5YH`UJAN[6*]M M9+:89208/J/0CW%2TM`&?H=U+=:8AN#NGB9H93ZLA*D_CC-:%9'AS_CUO/\` MK_N/_1AK7H`*R/$7_'O9?]A"W_\`1@K7K(\1?\>]E_V$+?\`]&"@#7HHHH`: MX#(RDD`C&0<$5P>GW][IFC7&K.\MR\*3&'S]3++<;7(P5(^7"CKSTKM+>^LM M0$Z6]Q%.(7,4RJP.QNX([5GZ?I7AJ\MC<:?8:?+#(&0O%$I5AGD=*`,F;Q?J MBRBR@TZWN+_S67:LX5-JHK]6QSA_T)IS>+-3&G3WCVEG"J79MES*T@0C/S-M M'(Z#`]?2M:2T\/I?QZ9)9VGVFX!N%B\D?-MP-W3J,@4:CX< MWEQ(5=L8)92"#]:`*5CKNKR7EO9WMK:PW%S''-$JESE/^6F?=>/S%=+65I-E M:V\KI!/)*+4>2J.F!%P"<<#.>/;L*U:8D%9'B?\`Y`W_`&\V_P#Z-2M>LCQ/ M_P`@;_MYM_\`T:E(9KUD:3_R&-;_`.OE/_125KUD:3_R&-;_`.OE/_124`:] M5=11&L96:$RE$8JJIN;.".!ZU:K%37;E[;4I1I;;K&;R@AG7][C!)![<$=:3 M&C'L[6\8>'$6+4;2+[.5O$CC\OYE4;1(>HYSCFLY)-?FN]FS7;:"2YA9EP68 M+EA("Q'`QM/R\>E=39>(?MNIRV4=E)^YD\J5PZGRWVY.YM0W-GR<2BU@Y6\>&5K>54O!;OY8(9=R`CN>Y/ MX4[W%YFW6/IO_(R:U_VP_P#0#6Q6/IO_`",FM?\`;#_T`T@-?I6/#"OB`?:K MK)L-Q$$&<"4`XWMZ@]ATQSWJYK4C0Z'?RH<,EM(P/N%-2::_E3Z*`&>5'_SS7\J##$1@QH0?]D4^ MB@"-8(44*L2*H&``HP!2^5'_`,\U_*GT4`,\J/\`YYK^5->V@E4K)!&ZGJ&0 M$5+10!C7-H-#1[[3T*VZ?-<6J_=*]V4?PD=>.#6NCK+&LB,&1P"I'0@T,JNA M5@"K#!![BLSPN[/X9L&8Y/D@4`:M%%%`!1110`5%=?\`'K-_N-_*I:BNO^/6 M;_<;^5`%+PY_R+6F?]>D7_H(K2K-\.?\BUIG_7I%_P"@BM*@`HHHH`****`" MBBB@`HHHH`R/$_\`R`W_`.N\'_HU*UZR/$__`"`W_P"N\'_HU*UZ`"BBB@`K M(\5_\BOJ'_7$UKUD>*_^17U#_KB:`-8=*6D'2FREUA]]>^5:HZ*=RDL&.>05Q MD=CC(K&TG58X[;3;W?=7FIW/F?:XUNMI615)*-$>@&"!@=A2P>+]GV\8B?=<0K&42&=$9$).2RC;P3[<>U<^?'&J3I)<6D&G"&&T65Q//M+$Q M[]RCJ1GC\#S5NZ\57MI+IL;W=@\ERL3RHL9&U9#@-N+8P/Q)]J+=`+L/@JUB M$`.I7\AMT1(B[H2@1MR_P\X/'TJUI7AFWTG4I;^*[NI9)5*L)64Y!;=R<9." M>,GI7+6/BF]22&2[EL);J6!4^U`$>3NF*G>N[&T8'IU[5;@\9ZDUROV@:?%" MC0*P#$O)YDC(2.>!QN'7BA`UN=Q4-Y_QY3_]%:M97B;_D`7'U3_P!#%:M`!1110`4444`9'AC_`)!#?]?5Q_Z.>M>LCPQ_ MR"&_Z^KC_P!'/2^(]3GTO3HVM@OGW-Q';QNXRJ%VQN/TH`MZK;37FE75K;M& MLLT31JT@)49&,G%94>@WGV_3[N1[,O:V#VKMY1)+'&",]OEZ'U-237=[H@5; MFZ_M)[AUBMHMBQNS\DY(XQ@>G:JJ^-89;FVC@L972959V=U0Q@@D_*>6`VG) M'&:`,^V\&ZJE[%=7-QI\[QS+*2T3$DB-DX[*.0<#@8JQ8>&-8TY8WM[NT2:. MV$+,!)MF(&`67/&!T(P>U20^-VN!"8=!U`_:9`D#.H1'!4L#EL=A[TI\*/(C)3>%)Z=.^>]`R*Y\(7L;3C3;R-4N[(VUP+IY)3G^$KSP M!D\>]1W?A'5IM.FLHKVS5)I)'?,;`G>!QD<@`CH.HZUH2>*WACL))],DB2^* M!,S)N&\@+QG)Z\^E4;3Q?)--'+=6-Q!-)&5A@65&BE8R[%&>H;(ZGC%'470Z MNW1X[:))"I=4`8KTSCM4MMY_U_W'_HPUKT`%9'B+_CWLO^PA;_\` MHP5KUD>(O^/>R_["%O\`^C!0!KT444`<@;6^_MRZN[2RN$ANV>"\WJ%)4#*2 M*,_-QN7\165$FL6UCI$5MINJV_V94#B/.`N\[EV`XSMYRV?85Z)65>ZS)%J: MZ98V9N[H1>=(ID"+&F<`DG/)(.![=J78.YR#6>N);:1.+;5)YQ%-]M:5B9=I M*C:K9&UB!QBI+_2];OO[42235<-$WV>!3MC>/@H-V<[QSD=Q/61XG_`.0-_P!O-O\` M^C4K7K(\3_\`(&_[>;?_`-&I0!KUD:3_`,AC6_\`KY3_`-%)6O61I/\`R&-; M_P"OE/\`T4E`&O6&^BWZW=V+>]B6SO91+*CQ$R*<`$*H M0_;KZ34+2XM))F1HE$L3(`(/#5YK5Y-(EU:I#):B`)+`7(^A]*C?QLXLH[E-*++)%(ZC[0!N9'VNJ\< MX'S>XJS>^*S90QW#62/;RR;5=;EFK86JR1R"%=\?(;OG&,GU..YK!E\8S1VHF&BW+22W$D$$"N&>0H M6W'`!P/E]ZO6&H3/JXMY5E6.ZM1DO_H!JS8_\>%O_`-(?LD=],\"V@D?S]5DB,>7/(QUX]?2NLU);#[$\FI1PO;1#>W MG(&5<=\$50M)/#7B"1Y;>*PO9$5=Q,*LP7^'J,X]*$#,JTFCU.\U1[[5[BTD MMI_+MTCG\O9%M!5]O\6[).2#[5HZN\XN%C1+F2X8Y7;(V=HXX*GI^=4[CQ=?7=O:^9!IXDE$-Q$1,W[LLKXR M`?F.4^F#79_V/I9=7.FVFY`%5O(7*CT'%598-!M=1L[1[&T2ZG#?9P+89P@R M<''&*72Q1@6?B[5F:UB-M:W(2UBGNY%E"%@ZDY12_:IK> MPLK21I+:T@A=_O-'&%+=^2!5"+%9'A3_`)%?3_\`KD/YUKUD>%/^17T__KD/ MYT@->BBB@`HHHH`*BNO^/6;_`'&_E4M177_'K-_N-_*@"EX<_P"1:TS_`*]( MO_0145YJ\UOJRVZ1QFW0QK,3G=F0D+M[8&.?K570]]CCN6M(<1 MMD=5&.>G-:ESI=I<7B7DH821+@$.0/8D="1DX/;-`&=-KEVEU=)'!"T:"5(0 MQ()D10QW'^Z<_I2?VWJ*W49>Q06DEHLHF+8'F$9QG/3K^`S5TZ%8M)++^]WS M1&-F\T]Q@L/1B`,GKQ4G]DVAM$M7#R1I"85#N2=N,=?7WI`6;>9+BWCFCD25 M'4$/& M)_\`D!O_`-=X/_1J5KUD>)_^0&__`%W@_P#1J5KT`%%%%`!61XK_`.17U#_K MB:UZR/%?_(KZA_UQ-`&L.E+2#I2T`0BTMEN#<+;Q"8]9`@W'\>M4FET=-333 M&BA%W(K3+'Y'4="V<8_6M.L'4I+^W\1074&E7%W#':NA:)T'S,RD##,/[M'4 M!;K6?#=I=_8[CREFC4Q[1:LP"]P"%QCGGZTU==\,7-Q%"7@+K)Y,1EMRJJW] MT,RX!]LTZ9+Z77=*F;3G$:PR_:&5U*QLX7@\Y/3L*R+JRU?4=*U#1UTB6+[? M=NPN)Y$V1(6!W8!))&.!CKBA`=9]AL\N?LD&9`0_[L?,#USZTK6-HYRUK"QX M&3&.W3\J=`[,A5HW38VT%\?,!WX]:EH`*AO/^/*?_KFW\JFJ&\_X\I_^N;?R MH`J>'_\`D7--_P"O2+_T$5HUG>'_`/D7--_Z](O_`$$5HT`%%%%`&5XF_P"0 M! MKM[;V5_`]A>+'*DRX:)CR1_/\:I>&/\`D$-_U]7'_HYZS]7O-,L/&%CQ' MCM)093"6(R5P,@?7]:`+\N@Z0EF8+C>59PXDEN&,@9>F')R,>QJF/#(;6(KZ MWN(DM41518]VX(!]W[VT@]\CO5;Q=?6%[H=NQCC>3[3;NB7$#,%RP.6`!(&W M.?:M+P[I_P#8ELUI-<1M)=SR3I%"I6.,'!VH#T`Z_4F@`7PYHD12%0Z?9CYL M:?:7_=`@C@9X7!/'2B'PMH8@"P0L(FA\D[+A\.F"!G!YP"<$\BL*]$LELEQ= MQL]NFK/_`&FJ*6)C&0F0.2@^0D>E/UG4[73-,-QX?,MK]H=B&AM_W]'0?4W9O"ND3FW9X9P[F>=PL8W;R1SA<-SD=*YV+Q1J0F>>74)7B::1%CBL?NIY(<,!C)(;CDX-4 M[W7;_4M!N[*YNIC`_GIY_P!F#L_R`QQMA<-E1EC M7<+AP"%;>?F.<]R:VZXG3=:>[UN+399I)+"2W:.2*:#:JX12,'&<8SR3S MZ<5TGAQYW\/V37!)?R^IZD=B?PQ3L(C\._\`'K>?]?\`'?^/6 M\_Z_[C_T8:UZ0PK(\1?\>]E_V$+?_P!&"M>LGQ(-NFQS_P`-M1[5G2^&[]K[3]-R/LT>F&UN;L0 M###+V6[N+1 MK)#*K(D&RX#*[,^P!FQA3GKC./KQ0,Z&!)40K*R-ACMVJ1A>P//6I:XO2?$= M[9:?907T1N))[EXI7:XS(I,S(,`#D#CD[1Z5T&C7,KR7UG,[2&SG\M9&ZLI4 M,,^XSC\*!;:&I61XG_Y`W_;S;_\`HU*UZR?$?[RP@MQ]^>[A5!ZX<,?T4T`: MU9&D_P#(8UO_`*^4_P#125KUDZ MU0R>$]#EC1);'>(U*+NE&M(%BMD+ M3]RLIF4>8VY7/5@V<@\GH>]3VFFI;7O/)-7:*`"L?3 M?^1DUK_MA_Z`:V*R-*'F:UK%PO,;2QQ@_P"TJ<_SH`GU_P#Y%[4O^O27_P!` M-6;'_CPM_P#KDO\`(56U_P#Y%[4O^O27_P!`-6;'_CPM_P#KDO\`(4`,U(N- M,N?+A>9S$P6-,;F)'09KDH-#O(-!34)8;V[U!K:&U,!986AC5LD?(1D9YZY( M'45V]4KV]>"YMK2!5>>X)(#'`5%QN8_F/Q-`7.'BT36=2TV]@OH-3,BZ>$@$ MMQM0R!FZ`-U*E>I-31V&O13R-80:I&[S.L)N9PR11F'"\;CQO^IKJQK(;6Y= M+%NP98?,AE9L+*P.&4?3*Y^M9/A_QC_:-Q]GU-+>SED2-H51RV\MNR,D955'PN.%.2,@XZU7;2M6D6!);._DCCFF MD$HDV2MF(@;AO./FQ]T@'T%=3_PEN@9*_P!J0%M^P("2S-C/`QD\`]*9;^+] M$N+=9Q=E$>5HE,D;+DJ<$].!DCD\4;BV.*`UIKZ&UO/[8^TW,'P&^Z'W?X&O3(%D6WC69@T@0!V'.[OITN+:);RS8+O`!.QAD$'J M,^GM6C0`5D>%/^17T_\`ZY#^=:]9'A3_`)%?3_\`KD/YT`:]%%%`!1110`5% M=?\`'K-_N-_*I:BNO^/6;_<;^5`')Z9HTNIP:?)<1R?8UTVWV!9\)+(OS`,H M&<`XJK;^'->GCN(+\3>6T4WEK]N.T.VW;P.>SD7_`*"* MQ8?$5QI]PULX:^5[B3,TDR+Y:"14V@`[MB;4PH!X!R&Y]Z;=23B:$Q-)>9!0*,@@8&,]<+>TTACO,!1N#_T:E:]9'B?_D!O_P!=X/\`T:E:]`!1110`5D>*_P#D M5]0_ZXFM>LGQ0I?PSJ"KU\DT`:HZ4M-5@R!@<@C(IU`&1JFNIILLY8#R;*#S M[INK`'(55'J2#20:KJ$,7VG5+"*WMC'YF^*4R,G3"E<9+'/;-)?Z(EY?7!EB M66TU"W$%RN[#+MSM8?F1^5-.AZ@^G26DNO7+'8$BE2-491D/"VR@*&<.<<^HJ1O!4DMW+=2ZS.\KX*.8EW*P<. MISW`(QCIB@"?2?%UM=644E^RP2S3R1H$B?:`'*+N)'RYP.N.:U=.OGNS<03H MJ7%K)Y<@4\'@$,/8@BL&7P5<2J@?6Y6"S&;:8%V[R^_[D#L@.=H`"J,]^!^M`&A4-Y_QY3_]D7_H(K1K/T`%?#VF@C!%K%G_OD5H4`%%%%`&5XF_Y`4W^_'_Z M&M:M97B;_D!3?[\?_H:UJT`%%%%`!1110!D>&/\`D$-_U]7'_HYZUZR?#H\N MTN;8_?@O)@P_WG+C]&%:U`!1110!$MO"EP]PD8660`.P_BQTS4M%%`!1110! M'/!%=0M#,@>-^&4]#3P```!@#H!2TE`&3X=_X];S_K_N/_1AK7K)\-C=ITLX M^Y<74TJ'U5G)%:U`!3)(TFB>*10R.I5E/0@]13Z*`,=+BXT1!;W$,US9IQ%< M1*79%[!U'/']X9]\4O\`PE6A@X-^O_?#?X5KT4`<`C';)_,U523P3':26J^3Y,N-R%9#T.1C/3!`Z5UM%`''"/P(%90L.' M&&SYAR-V[^?-*%\"KYF$@Q*I5AMDQC.[@=N>>.]=A10!QWE>!!M*K"&4Y!Q) MUSNY]>>?K6A8Z]H-E$X_M,222N9)9#&P+L>_3CH!^%=#10!D#Q/IA8^W05I44`%4-0LI9)8KVT*K M=P`A=WW9%/5#[<=>QJ_10!D'Q'9P#;J"36,HZK-&2#]&&0?PI/\`A*]#_P"? M]?\`OAO\*V**`,?_`(2O0_\`G_7_`+X;_"C_`(2O0_\`G_7_`+X;_"MBB@#& M'BW02Q4:C&67J-K9'Z4O_"5Z'_S_`*_]\-_A3K(_\5+JG_7*W_\`9ZUJ`,?_ M`(2O0_\`G_7_`+X;_"C_`(2O0_\`G_7_`+X;_"MBB@#(.K2ZB/*TF&1MW!NI M8RL:#U&>6/L./4U?LK.*PM$MXLD+DEFY+$G))]RDO M_H!JS8_\>%O_`-)@?[KXY'J00#COS6G10!S1\(LD]I?07J1:E!(SRW/DDB8,"& M&PMA0>.GH*CLO!1M@DB("`3CN22<=JTJ**`"LCPI_P`BOI__ M`%R'\ZUJR?"HQX8L,_\`/(?SH`UZ***`"BBB@`J*Z_X]9O\`<;^52U%=?\>L MW^XW\J`*7AS_`)%K3/\`KTB_]!%2_P!CZ7DG^SK7)))_WKS47AS_D6 MM,_Z](O_`$$5I4`5&TO3WQOL;9L;NL2G[WWNW?OZTKZ7I\N[S+&W;<@1LQ*< MJ.@Z=!5JB@"..WAA=WBA1&?&XJH!;`P,_A4E%%`!1110`4444`9'B?\`Y`;_ M`/7>#_T:E:]9'B?_`)`;_P#7>#_T:E:]`!1110`4R:))X7AE7\A,-S"DT;=5=BLC_A&--];S_P-F_\`BJ/^$8TWUO/_``-F_P#B MJ`->BLC_`(1C3<=;S_P-F_\`BJSHM#LK*Y6TOGO&20X@N3>S?/\`[+?-PW\_ MK0!U%%9'_",:;ZWG_@;-_P#%4?\`",:;ZWG_`(&S?_%4`:]9&HSC51)I5F^[ M?\MU*O*Q)W7/]XCC';.:!X8TO/S+)(+V[BACMY523Y#*Q M&$DQG81G.<9YZ4`;-%83^)XQ*T4=E*[NQ6V&Y0+@@E6QD_+@@]:6R\4VU_=2 MV\-M/E$1E)`^8M_#[$?T-"U`M7=K<6UVVHV""1W4+/`3CS0.A![,/U'%1'Q/ MIA_P#/^O\`WPW^%'_"5Z'_`,_Z_P#?#?X5L44`9'_"5Z'_`,_Z_P#? M#?X4CW-QK2&WM89K>U<8DN95*,R]PBGGG^\>G;-;%%`#(8HX(4AB4)'&H55' M0`=!3Z**`"BBB@`HHHH`****`"BBB@`HHHH`****`"BBB@`HHHH`****`,FS MX\3ZG[PP'_T.M:LFTX\4:B/6"$C_`,?K6H`****`"BBB@!KHLB,CC*L""#W% M9>DS?8`FD73[981M@9NDT8Z8/J!P1[9K6J"[L[:^A,-U"LJ'G##H?4>A]Z`) MZ*R#X=B!PFI:G&O9%NVP/IFD_P"$>7_H+:K_`.!9H`V**Q_^$>7_`*"VJ_\` M@6:CN=!$5K+(NK:KN1&8?Z6>H%`&Y17%:?INIQZ7:7EQJ6JW\,\"2.T5SMEC M+*"?E`PP^G/UK6M-+M+^'S;77-3E3.#B[.0?0CJ#[&@#?HK'_P"$>7_H+:K_ M`.!9I1X>3/S:IJC#N#=M@T`2:K=LZ-IUFP:\G7:,?\LE/!=O3';U-5-?!TOP M_#';NZ0PE$=8YA'(Z`8PK?WLX^M7)H[?P_I-S<65FK>4AD9`^#)CU8_UJGIO MBK3[]2MVT-K*LNQ5:971SM#95QP>#^!I;Z`9NDWNIKK<27\LF4A#7),ZF.-" MHVAE_ADW=^_-49K_`%-1>L\UR\$_2I7UW18U!?4+55V+*,N!PQX(^N:8&']HU'2(KB]U*^F ME5HXGEA3K#[9)P"3]!@&NKAE6>".9`0LBA@&&#@C/-9-WXFTJW>$--&\$LAB MDFW#9$0I8!OKBISXATJ.0QSZA:QOYA15\X$G!QGVYXIA8TZBNO\`CUF_W&_E M4M177_'K-_N-_*D!2\.?\BUIG_7I%_Z"*TJS?#G_`"+6F?\`7I%_Z"*TJ`"B MBB@`HHHH`****`"BBB@#(\3_`/(#?_KO!_Z-2M>LCQ/_`,@-_P#KO!_Z-2M> M@`HHHH`****`"BBB@`JF=4M5U(6!9O.(Z[3M!QD+GIG'./2KE8T^D73:JUU% M+%Y)<3A7!W>:%V@9'\/?UH`FE\0:=#]J,DCA;09D;RV(.#@[?[V#P<=*;/JV MEW4]UIDQ+M%&&D0H<$'&,'N.1+<,&X\QMS;L>G08 MJU?://<12/;O!;W30A1*BX)<=RW7`'3TS2`DAN)=-E2TO7,D#G;!R.?Y'OW MYZL$:E%%%`!1110`4444`9/B;_D"O_UVA_\`1BUJ,RH-S,%'J3BLOQ-_R!_^ MWB#_`-&K3?%40G\-W<7D-.64!46(R$G(Q\HZTF[($6M4L(]8TU[7S$"2X^8H M'&,]L]_?M5&#PO:6M\EW;E8W@@$-OB,?N^,;B?XC]?4U@W":SX<\F#2_.D2? MS)I/*LLQ*S`X"H,E<$#C(ZFII)_$,)W+=WC//Y!+&Q#!%*,6P`,`[L`YZ4PW M-.?PA:SF]=WC\V]<;W$`^50:[>GYBVT"BBBD`5E6'_`",6K?2'_P!!-:M9 M5A_R,6K?2'_T$T`:M<_XENI[>:W"7$D`V,T6PX\V8$;4/KD$\=_PI;WQ2-/U ML:?/:`1EXU\T3KN^?.#LZX&.3VJQ-XHT*.W$[ZC;NN"X"MN.`<9QUZTM]0*- MS?RMX@A6.Z8$F-8HD?Y'0[O-..AVX'/;'O5>S>]N;32[VWUAY5B>5&0G<;@[ MB!G'!P!SQQCBMO\`MS1@9?\`3[;-NN9,.,H,X.?QH37-'\SR8[ZV9]P4*C@_ M,>0..],!-!U*+5-.$L1E(CUB_P#0 MFK6H`****`"BBB@`HHHH`****`"H+W_CPN/^N3?R-3U!>_\`'AM("N?"P\FWB%\X$"0KS"A MW&)B5.,<=<<573P3;H0PN\R#RSYIMT+95@>N.AP!BJ=K+XBFD@^U/?G;.CM_ MHRQCJXV_[OW"?KFF0S^+F0^9-/O$,KJ!:!5W@C"DGKP6QC&<"G<;[&I/X26> M::07\D?FRO)M6)=H+*5/'K\QY[U4'A2Z75]GV@_8Y8'6>41Q@ON8$IC&0.,Y M'K5>23Q++:O#))>/NM%;S(K<1E6##D`]6([?I79I_JUZ]!]X<_C1L*XJJ%4* M.@&!4=U_QZS?[C?RJ6HKK_CUF_W&_E0!2\.?\BUIG_7I%_Z"*TJS?#G_`"+6 MF?\`7I%_Z"*TJ`"BBB@`HHHH`****`"BBB@#(\3_`/(#?_KO!_Z-2M>LCQ/_ M`,@-_P#KO!_Z-2M>@`HHHH`****`"BBB@#S^"\O=-MKW6[2\1[>.26%4DN)) MA*V_Y=P/"8''![U=@\5:E>I'=(]C%;BX\ME^8EOW6\`MVR>.G;O78E0%("@^ MWK6-9^);&2.-+UH+2ZD+8M_,WG`)`/0==II+16'U,6'QEJDJ6X6WL'>1U+D2 MLJA2BMM!/);D]NW2HK[Q-J%QI&)9;>$W5B9TDM68,C9X&3R!QC..?:NB7Q/H M9MXIWOX8EDB\Y?,^4[>F>:D'B#1B6'VZ'85+;?R[]^M=/ID[:MHZ27L,9\T,KJH.QQDC(!YP1SSZU&O]F^( M(\H7=;.Z_A)3$B']1^E:=+H!EQRR:/(MORN?3T;\#6K39(T MEC:.1`Z,,,K#((K,61]%<13L7L&.(Y6.3!Z*W^SZ'MT-`&K156]U.ST]%:ZG M5-_W%ZLWT`Y-4CXBA_AT[4W'JMF^*`->BLC_`(2*/_H%ZK_X!/1_PD4?_0+U M7_P">@!?$W_('_[>(/\`T:M:UJ_P#@$]`%C6;JZL].:>T\KS0Z#]ZI*X+`'H1ZU17Q992N$@M[J5O/ M6'_4E0I!SU]Z`-"*VMVG^W"W5+B6,*SEA]:D'A.-(?*CNS&HNA<+LA12F`!A2!QTZUG-)XC5P;=[E/-N]\AEM]X" ME5PH`Z+USSP:2&;Q41;,T]P`]L[2[[,9$G(Q@?=Q@$#O[TQ;D]WX/D2QD$%V MUQ(L3".)HHU#G#\$XX^^?RK8T/2Y-/MO,N9FENI402,55<;1@*`O''K5+0&U M.2^,VH?:UWVD>$D4!`P+9/`&&/''I70T!>X4444`%%%%`!1110`4444`%%%% M`!1110`4444`%%%%`!1110!DP\>*[KWM(S_X\U:U9,7_`"-EQ_UYQ_\`H;5K M4`%%%%`!1110`4444`%%%%`!4%[_`,>%Q_UR;^1J>H+W_CPN/^N3?R-`%7P_ M_P`BYIO_`%Z1?^@"M&L[P_\`\BYIO_7I%_Z`*T:`"BBB@"&ZM+>]@,-S"LL9 M[,.GN/0^]9WE:EI7_'N6U"U'_+*1OWR#_98\-]#S[UKT4`5;+4;74$8V\F60 MX>-AM=#Z,IY%6JI7NEV]ZZS'=#<)]RXB.UU_'N/8Y%5/[3N=,D%OJ6VX+#]S M)`N7E/IY8[^XX^E`&Q160=6U%N8M`NF4]"\L2'\BU']JZM_T+MQ_X$Q?_%4` M:]177_'K-_N-_*LW^U=6_P"A=N/_``)B_P#BJ9-J6K20R(/#UQEE(_X^8O3_ M`'J`+'AS_D6M,_Z](O\`T$5I5SNDW>L66CV=I)X>G+PP)&V+F+J`!_>JW_:N MK?\`0NW'_@3%_P#%4`:]%9']JZM_T+MQ_P"!,7_Q5`U74QR_A^Y"^HGB8_EN MH`UZ*I66JV]\[1*)(9U&6@G0HX'KCN/<5=H`****`"BBB@#(\3_\@-_^N\'_ M`*-2M>LCQ/\`\@-_^N\'_HU*UZ`"BBB@`HHHH`****`$/((!P?6N?C\)HCH[ M:E<.5VYRB#<`Y?'W?5C70T4`..*DN/"5 MI/)=.)WC:YD$C,L:;@*]# MGMVN(;]98QMY1&;=NSC:`,MT/3/2GZAKD=A-8CR'DANI%5Y@<"$-PI8'U;`H M`U:*YY/%<4&OW6E:@@A99MENT:LP9?+#EF.,+UK6T_5++5(WDLYO,$;;6!4J M5.,\@@'H?.UU#IZ'[L:1B5Q]6/&?H/QI/[+U?_H8IO\` MP%B_^)H`UZ*R/[+U?_H8IO\`P%B_^)H_LO5_^ABF_P#`6+_XF@!4_P"1NE_Z M\4_]#:M:L$:!J0OVO/\`A(9_-:(1'_1HN@)/I[U,=,U902?$4P`Y)-M%_A0! ML45CC3=690R^(YB#R"+:+G]*7^R]7_Z&&;_P%B_PH`UZ*R3_`&U8?O'DCU*$ M?>58_+E`]1@X;Z<5HVUS%=VZ7$#AXW&0:`):***`"BBB@`J"]_X\+C_KDW\C M4]07O_'A:0X2-2S'T`YK.T2%GMAJ5RN;J\&]B?X$/*H/8#' MXY-3:Y_R`=0_Z]9?_034NG?\@RU_ZXI_Z"*`+--WI_?7TZTO:O.='NM,M-0F M;4;>`Z:VI3?9)D4E8YL_QC'&1]UNE'6P/:YZ/17"OXCU\'5)EDM?W&Y5M/*< MR0@.`)#\O*[?F[Y[>E1'Q#K<=S;P2:M9W#20>9"L%N2+D^;MVY/^R>2`.E"U M`[K[5;^3YWGQ^5G&_>-NHJ&9XC9.\Y*1&/+EOEP,A%/TZ\&H:=;W8&WSHPQ M'H>X_.K58_A3_D6+'_%YIY$BC099W.`H]S0!)142W,#3 MB!9D,I3S-@8;MO3./2J\FKZ;%]H\R^@7[+CS\N/W>>F:`+M%54U.QDDDC2[A M9XT#N`XRJGH?H:==WMO91>9.^U<$C`))P,G`'M0!8HJ&WNH+M"T+[@,9X((R M,C@^QJ:@`HHHH`*Q_$7W--_[",/\ZM7FK06LHMT5[FZ896WA&6^I[*/@+4JW7AZXN7U@G40$U.$1!?(!\K`(SG/S<$U#?^&+N]N;24:PR+ M:B,K&T`9=Z?Q`9&,]\YJG)K/_"/J9'O+[4@]G]H!8(8W)8#(?C')''3!I)/% M^K6YVW6A+;LD#3RE[D?=5PIP`">0V1FC^ON"]_Z]!Z^"91;K`VJ)(BVR0`/: MCC:Q8,,,,'YNHZ5/=^#8]0M9X[R\,\Y14MKAT.^`+T)^;#'/.3WJK+XSO\W$ MMOH9EM4F\B.9YU0%O,"'(Y/4YI^J>*K^PGFM5M[-Y4@D8%)F8)(J;\-\N`#V M&<]\4=+CW9.OA6\^WM?OK3&X9LEUMU7K'Y9P,]>`?K5SP_H,VBM=--?F\:Y9 M79FCVG037"/9(;YPK%6N28F580[%>/E)!Z?B:O:7XKN=0 MU**&33EM[>:9H48S;G)$8D!(`P.#ZT^MA=#IJR/%?_(LWW^X/YBM>LCQ7_R+ M-]_N#^8I`:]%%%`!1110`5E:=_R']7^L/_H%:M96G?\`(?U?ZP_^@4`:M%%% M`!1110`4444`%%%%`!1110`4444`%%%%`!1110`4444`%9)_TOQ3L?E+&V#J MO^VY(S^2D?C6M61:?\C7J7_7M;_SDH`UZS];M+.[TN7[<%,,2F0AFPN0#@FM M"D(!&"`0>QI-70T<-HTRV,G`)Y!J!/&>H3W M7D0:G9%)+B%5DEAVD(Y8-A0V1C`^]S[)(BC`Y[@C(JF[NXMCD]-\7S37%E+>7MN+1X6\T MQA20RE@6<9RJ\`@C([&JDNH^5<:BFJH8K36[&22+SIU=7=5(PN#\H*%?Q%=[ MY47/R)TP>!04B.`50XZ9`J6KCOJ>%$(8#)(`! MYY/IQS7?Z9=_;]+M;O*GSX5<[>F2,G%3F.-A@HI'T%.``&`,#VJKDBUDV/\` MHOB&_LU_U:*:&.*-WN=N-I8DE=O3YO7M7,OX)U)I[]O[-M3YI/DL;ILC,V_/3Y3MR..: M%N!W5QJ,%M*@EPL+KGSRRA`<@!E<#-X-U&:\DD.EV7 MDK(SQHT^05\Y9`H&W"\!A^-66\(:@);^98HWN)9"RRO=-MGC+AO*9,?+P-N> M?UH0'5Z7J<.KVKW$*.BI*\1$@`.58@GZ<5=K&\+Z=/I>FRV\]K%:AKF62.*% M]RJK-N`Z#IG%;-`!6/X4_P"18L?]P_\`H1K8K'\*?\BQ8_[A_P#0C0!L4444 M`%%%%`&1XG_Y`;_]=X/_`$:E:]9'B?\`Y`;_`/7>#_T:E:]`!1110`51UF"2 MYT:[@B@$\DD3*L9(&XD>_%7J*35P,6*WNXM6@NOL!*K8>6S!TSOR#LZ_7GI5 M#4]+U.]>_GBMY4W>6(D,D8=2K9WQGH/7#=35K6-5N-+U7S5,L\(MP?LJ;!EC M(JALGG^+UJLWBZ=(Y)O[+>11''LBCD#.TC,P*\#I\O6G?J%K`="NK>T^T6EG M"NH"V0,=V5=QC``)P,8SZ$X]*U6L+F]M;9[J7R;E8BLICP?O#YL9R/YUF#Q@ MY9,:-=%7G,0PP+`+C2?K5# MQ%]S3?\`L(P_SK8K'\1?V5C"'OKF&WC8[=TSA03Z6:4W$13R[2;3K2R>&Y0H[1!61 MUSRO'&,]JL0 M?5RTD$+7,LD)+H=[!]@XYV[>!S5VVAUK9J0FU+5W,5M$+:5[8J&)!W$(O)/3 MOD=>M`&W#I/AE[F?3HK*S::'RY9H@@)7@A"?PS^%6+32]$N7CU*UL[=F,AE2 M94P=Y^4M]<#%<@PUB.Y-\MMJL$ZP6R?ND:7S/WC;R21EL( MI?\`7K;_`,Y*UZR+3_D:]2_Z];?^ZT^"*XFC8'RI"1 MO7/(!'?TH`I^*+&[OVL%@L'NXHIS)*$N?)8#:0,'(/4^O:L2]T#5KF\%ZFE; M9$MX8X0U[N\LI+G//&=G?OFMNX\2%[S24L4C>WOD:665\DH@3<``.K'!_*G+ MXOTUY$@5;H7,DAB2!K9]^X+NY&.!@YHV`YS_`(1#4-^^>TEN9C>(\TAOL)/& M'))V<=CC!^G2H6L=+N_$6H17T:?9E$L8DW#?""`/F'4*,?+QQGOFM_2_%T`T M1;K5I%69%)FDB0^6&WE0@/\`>/''6F3>.--G&+62:)&6-Q=-:L\9W/MV\M>LB/\`Y'&?_L'Q_P#HQZ0&O1110`4444`%07O_`!X7'_7)OY&IZ@O?^/"X M_P"N3?R-`%7P_P#\BYIO_7I%_P"@"M&L[P__`,BYIO\`UZ1?^@"M&@`HHHH` M****`*.N?\@#4?\`KUE_]!-2Z=_R#+7_`*XI_P"@BHM<_P"0!J/_`%ZR_P#H M)J73O^09:_\`7%/_`$$4`6:Y";Q1J5KXA?3V-G<;;U(!;11N)C&RAM^ZR,"%.,?+@#'``_"CJ'0H/XPT^.4P26U\L M_FK$L)MSN8L"5..P.T]<57C\=6676?3]0A<-*`A@R2L>-YR#@8STS3K7P38V MMS'/%J%^3'(DF#(A#%2<;CMR?O'JU,^9X@1'QD M;AG.2!]*F;PA:&TN+1;Z^C@N0-\:2C&[C+#CJ<#/;VJ34O"]IJLK275S1VZ>U#V!;E";QM80/"T[W4/EJQGA-FS,QPN.1T^^#]#VK>T MW4H=3@>6%9(S'(8Y(Y5VNC#L1^7YUSFM>"FN(+J:POKE[R88"S3*(QD*">%S MG"#\171Z9I\>G6QC5Y)'D8R2R2-N9W/4D@#^5,70N5C^%/\`D6+'_,'W84`2T5#]JMO\`GXB_[[%'VJV_ MY^(O^^Q0!G>)_P#D!O\`]=X/_1J5KUB>)KFW;1'`GC)\^#^,?\]4K5^U6_\` MS\1?]]B@":BH?M5M_P`_$7_?8H^U6W_/Q%_WV*`)J*8DT4GW)$;_`'6!I]`% M.YTG3KR;SKFR@FDVA=[H"<`Y`_/FF_V+I?EM'_9]OL9=I7RQ@C.['Y\U>JK> MZC:Z>BF>3#.<)&HW.Y]%44S=2S=%S^?M4ODZCJO-PS:?:G_`)91M^^N)=8E$^#E;9,B%/J/XS[G\JU``H````X M`':EHH`****`"L?Q%]S3?^PC#_.MBLCQ"/W-BYX6._A9CZ#=C^M`&O1110!4 M^W;]3-E%'N$2;YI"V`F?NCW)P?PK+F\4H-(U&^MK.21["7RWAD8(6&1AQ_LD M'(]:==V%_'J%^;'8O]HQI^]D!*QLHP00"#RO0^M9UWX.NT>[33+U(X+VV6*9 M;HR3-N4_*P);@`<8H&:ND>)+34K:9YGBM9[=G$L)E#%%5BNX_7%2S^)M#MK? MSY=5M0FS?Q("2OKCKVK$E\$S7-O/!/=P!>O>@%N;,>NZ?=;([.[MYKB6+S8H?,`9QC( MIVEBQN5;4[6U2*:YXF;:`Y*\88]\$$5B'P_JT6I6>H37<$T=EM8011,"<1[" M!S@D^ISCI6WHMD]C8;91B661YG4'(4LQ./PSBGI<1H5D>*_^19OO]P?S%:]9 M'BH;O#=XHZLJJ!ZDL,"D!KT444`%%%%`!63IO_(=UC_KI%_Z+%:U9.F_\AW6 M/^ND7_HL4`:U%%%`!1110`4444`%%%%`!1110`4444`%%%%`!1110`4444`% M9%I_R->I?]>MO_.2M>LBT_Y&O4O^O6W_`)R4`:]5-1LGOH$B2ZDMBLBOOC"D MG!SCD'BK=8^IG[3K5EITH;[/)')*V&(WLNT`9'IG/X"@"#_A$;6.2(VMY=6R M1RRRA(V7K(""`2,@#)QCI4.G>#(M.O8KJ/4[MS$_F;66/#-LV9.%R3COW-5= M)^RW&AZ=;->S27(NSN4W3^:2';(;G.`!T/%'BF\D@U"*Z2\,EK'!^\AM[GRY MH\L?WJ#I)T(*GTXYH0;EBV\#6EK:R6\=_=A'82G&P8E#;A)]W[W;T(ZU/>>% M%O&\QM4NTE9(UD=0GS['WJ<;<#!].*GUF?R?L5[;.6E2YCA95/WU<@%2/QS[ M8K'\4ZB^DZZ;VVE1IH=.DE$$URR1L0Z@$J#UP3VH_K\![A?^#)8[%$L[JXNB ML:0LDCHA*!B^0=OWLFNDT>VGL]*@M[@J9(UQ\H`P.PXP./6N>B\4W\]W)IRR MZ;%=12.#+(6\EPH0[1SD-\_Z=*ZN.19%RK*V.#M.<>%U'UD1_\CC/_`-@^ M/_T8]:]9$?\`R.,__8/C_P#1CT@->BBB@`HHHH`*@O?^/"X_ZY-_(U/4%[_Q MX7'_`%R;^1H`J^'_`/D7--_Z](O_`$`5HUG>'_\`D7--_P"O2+_T`5HT`%%% M%`!1110!1US_`)`&H_\`7K+_`.@FI=._Y!EK_P!<4_\`014L\*7%O)`_W)4* M-]",51T.=C8+9SD"ZLP(95^G`8>Q&"*`-*LWQ#=36>A74\!(D50`PZJ"0"?P M!S6E3)8DFB>*5`Z."K*>A![4`8\$@GDD+1J##)R1GV`QQS7H-O8V]M!Y*1@KMVDL, MEAV!/?TYI196@4J+6':<9'EC!H`XN3QEK3-(\<.G6ZP6HEDCNI2K.3'NW*.I M&>/SY%2?\)#J=O<&>\U>QC@DTZ.X11;DJ&=\E(UM;LH5H(R`NT`H.!Z?2@#E]+U>?4!I.HY0W$US):7`B(VNJ[N2`2` M1M!ZGKUKK:JQZ=:Q70N$B"LJ[44#"IGK@>I]:M4`%8GAN>.V\(VL\SA(XXF9 MF/8`FM#4[W[#9/(HW3-\L,8ZNYZ`5DWUG]@\/:=IC'<'N((9<=#E@6_#-`%F M.QEUE%N-1:2.W?F.S1BH"]BY')/MT%3#P[H@'.DV9]VA4G]16E10!F_\([HG M_0(LO_`=?\*/^$=T3_H$67_@.O\`A6E10!F_\([HG_0'L?\`P'3_``H_X1W1 M/^@19?\`@.O^%:5%`&;_`,([HG_0(LO_``'7_"C_`(1W1/\`H$67_@.O^%:5 M%`&8_AO1F'RZ?#">S0KY9'XKBF+<2:-,D%]_`.#^!K M6K(\4X'AR[DP"T*B53IU_W$[_4X'UJS9:7 M;V3&4;IKAQA[B4[G;\>P]A@5Q'N#@U8HH`R[755@9;+5'6"Z'`9N$F_VE/3GTZBM+>G]X?G39[>&YB, M4\22QGJKJ"*S?^$7T'_H$VO_`'[%`&IO7^\/SHWK_>'YUE_\(MH/_0)M?^_8 MH_X1;0?^@3:_]^Q0!J;U_O#\Z-Z_WA^=9?\`PBV@_P#0)M?^_8H_X1;0?^@3 M:_\`?L4`:F]?[P_.C>O]X?G67_PBV@_]`FU_[]BC_A%M!_Z!-K_W[%`&C-B1-N M32K4$C'^J%)I+O:2R:1.Q9K<;H&/5XCT_%?NG\/6@#4HHHH`****`"LG3.=< MUG_KI$/_`"&*UJR=+_Y#>L_]=HO_`$6M`&M1110`4444`%%%%`!1110`4444 M`%%%%`!1110`4444`%%%%`!61:?\C7J7_7K;_P`Y*UZR;C_0?$$5V_$%W$(' M;LK@Y3/URP^N*`-:LK6;O2[8Q27\YA:#]\LB@YC`X).!P#TYZUJURVKQW*SZ MY`L,D\U[:H+5$P"P`(8`D@<$Y//0T`:>FW^A:C?2R6#6SW@4&0B/;+M/0G(! M(XZU)*^D#5+?3)+>$W7EM/"AA!"@$9(.,`Y-<_J%EK6L7*7=E8R:=+964L4< MDSH))7<`!1@G`&,Y/?'%4O[*U2V2`Q:?J=V@@F!6XN$5T+,GRY5L@?*3P>?4 M9HZ@CM7T^W>ZCG*8,;%P@X4N?XB.Y]Z6?3K&YD\RXL[>5R-NZ2)6./3)%<9! MX>UB\TV!9%N(92)K>3S;AE*)NWQ.`&/3`7!.<&I=8T_6OLMHT&G7!NW_`'\K MP71(ADRN5`+`=`>>1[08EQN]>G7WI;::U>:XA@"K)& M^95"[3D]SZY]:XQ]&U>71U.S5$:2]D-TOVA6G:++>7MRVW`R.,BMW3(9#KB, M))'%M8K!.\A#,TF<@,1P6`R3CUH!F_61'_R.,_\`V#X__1CUK5E:9_IFJ7FJ M#_4N%@@;^\JDDM]"Q./I0!K56O=0MM/C#W,FW<<(H!+.?0`O/^_T/_P`76O61J'B%=/O4M?[-OKAG;:KPQJ59MI;`)8=@:`#^ MU]1_Z%Z\_P"_T/\`\74=QJ>I36TL0\/7@+H5&9H>X_WZT5U*S,(E>XCB&T,R MR.%*9_O#/%2_:K?S%C\^+>_W5WC+<9X'TH`P]+O=4LM*M+23P_=EX($C8K-# M@D*`O/^_T/_P`75NXU2SM]/GOO.$L-NI+^2=YX[`#O[52N M?$]C:G3Y),K:W\;2"Y9@J1@+N^;)ZD4`._M?4?\`H7KS_O\`0_\`Q=+_`&Q> MKS+H-\J^JM&Y_(-5^*\M9W"17,3NR!PJN"2IZ''I4]`%2QU*VU`-Y#D.G#Q2 M*5=/JIY%6ZSM6M&>$WEJ`M[;*6B8?Q=RA]0>GZU:L[J.]LX;J+[DR!QGMD4` M3U2O=,BO'68226]P@PD\)PP'H>Q'L.VZR!/_H5'V#7? M^@[#_P"`(_\`BJUZ*`,C[!KO_0=A_P#`$?\`Q5'V#7?^@[#_`.`(_P#BJUZ* M`,C[!KO_`$'8?_`$?_%4?8-=_P"@[#_X`C_XJM>B@#(^P:[_`-!V'_P!'_Q5 M'V#7>^NQ?A8C_P"*K7HH`H6>EI;S?:9YY;NYQCS92/E'HH'"CZ57\1?ZO3O^ MPA!_Z%6O61XB_P!7IW_80@_]"H`UZ0G"DXS@=*6B@#G8_$E['=W"7^F0VEM: M!7N)VNP?+5@2"1M'3'/-7E\2:,SPH+^+,_,><@'\<<9P<>M5KK0+JZEU@M?1 M"/4H!"J^1GRL`C.<_-U/I5?4/#%]>RV;#555+58L1-!E=Z'.X`,.O3!SCM0# M+\?BC0YK=[B'4H9(T"DLF6SG(&,=>AZ>E.O]=AL9+']T\L5W(JF5>%B#?=9O M8G`_&L5/!5PMND+:A!(J6ZP`-:D8PY<,,."#SVJQ>>#_`.T+2>*]O3/-Y:QV MT[*P:+;T+`-ASGG)H`F7Q7!!K]SI.H!;=Q*$MRN6\Q=F\LQQA:U=/U2RU2)Y M+&X694;:V,C!Z]#[5B)X7U#^T3J$NKH;@L"66VP/]7Y9.-W7H:M^'M"N=&>[ M>XOQ=M7;32&&?R0J[=SD#+$#.0``3SC/;-/LO$MEJ%S<06Z2LT+J@.!A]PSD?3GKB MH[C0KFY>2X:]1+MG^25(<*$P1@C/)PQYSZ4M[X>^TV#6L%VUOA$2-E'*@8SG M!!).!Z=*`-JL[5[65XX[RU7-W:'?&/[X_B3\1^N*O1(8XD0N7*J`6;J?L_]=HO_1:T`:U%%%`!1110`4444`%%%%`! M1110`4444`%%%%`!1110`4444`%1SP17,+PS1K)&XPRL,@BI**`,C^S]5M/E ML-21XOX8[R,R;![,""?QS2&'Q&2";C2R1T_T>3C_`,?K8HH`R/+\2?\`/UIG M_@/)_P#%T>7XD_Y^M,_\!Y/_`(NM>B@#(\OQ)_S]:9_X#R?_`!='E^)/^?K3 M/_`>3_XNM>B@#(\OQ)_S]:9_X#R?_%T@A\1KG%QI8RQXT^W'_3)?Y"J^O_\`(O:E_P!>DO\`Z`:LV/\`QX6__7)?Y"@">L#6 MYF;5--,4D`6TG,DPE9@V"I7C`//S<>N,5OTF`>PI:]"HN/VCA7T]$L[^.`:: M)+K4&N-SJ3F,CGDJ=K#UP0,U1L]$DMC')_Q+O.4VV7#2;B(@0PSLSD@CCTK? MCU+5'\1W=DUP3#!,``FGEE*%0Q!DW8!ZC\JD3QQICV9NVM;N)2BO$LD0#2[F M*#`SUR".<4K.WW&EZ=]G]_\`P#-L+62WMTL6OHH+,S&0F"4F6,`?*`VSYP3W M//;)JA-H]Q-IT>E-=V36EN\X@>5W9MCJ0NX;,94GD]JZ2#QGI\\M#4A*5-=' M]Z_R,JSM9_\`A*+2_+:?'%&2NR$,K89`N#\GS-D9&2..U=O3$.]%G?]A"#_T*M>LCQ%_J]._["$'_`*%0!KUR MOC.ZO+*6SFMIK_RRLOFPV;(&(5<[OF!SCT':NI)`&3TK/%MI&KW<.H)Y%W-: M$K'-')N\L]QP:`,9?$E_9P:99K:G6;R:V6:::U(5&0D#<,_GV%,'C>9+9IKC M2&C+JWD1K,'9V$HCP<#`Y(/>ME/#6BQB,)IT*B)S)'@8VD]<>Q].E0R^'_#M MI$7FL+=(RK1?,."';)&/=N?K1U`SKCQ=J-K"CW&B"W=XC(LG.><#WK2AAT6)X["/[+YEN#M MA+!G3<,'@\\@T7?AW1[[ROM.GQ/Y*"./C&U0.V1TH`Y`:MJ0TB*TEFN%; M[87BNA/N>55N0C*XQP,''OCM6M%XPO+BRN+R+0KC[.I!AE9LJZ[B"2%!(QC) MP#UK8;PWHS^;NT^$^ M6.+S]BS263%MH5N_W?O`Q%%_?/;O';6T8FNYL^6A.`H'5F/8#]>E44\. MO)<275UJEX9Y@!(+9_)3CI@#G\2:0&W161_PCL/_`$$=4_\``Z3_`!H_X1V' M_H(ZI_X'2?XT`:]9.E_\AO6?^NT7_HM:3_A'8?\`H(ZI_P"!TG^-,3PM:1R2 M2)>ZFKRD&1A>R98@8&>?2@#:HK(_X1V'_H(ZI_X'2?XT?\([#_T$=4_\#I/\ M:`->BL@>'80VR7$#;HW&1Q@CU!]#4U`!1110`4444`%%%%`!1110`4444`%%%%`! M1110`4444`%%%%`!1110`4444`%%%%`&?K__`"+VI?\`7I+_`.@&K-C_`,>% MO_UR7^0JMK__`"+VI?\`7I+_`.@&K-C_`,>%O_UR7^0H`GI-R[MNX;L9QGG% M+7++J`AL[V60`ZC=WDEM''Y@5VP<*JD],+S^-`&@?#-N;R:Y^W:@#/*)9(Q< M$(Q&,<>G`X]J@3P7I:*J^;>'RXQ'&QG.8\/O#`]B"3S6'IVO7&FV$.FR7(MY M=/OA;7"SD2LL#`F-F8'&1D#/KQ4(\4ZO=:<&2^C$DEA(ZFWB5F$BAN64G*C@ M8/(I=/Z[#1TMWX;'V:^-I?I67:^)+TV%_/+K=LT5J\4,25>4!E`/!&`>,]>.M/9BW1Z?N`8*2,GH* M6N$M=>GU72[Z8W,=Q<6,\+VLJ($8A\<%03C.2,'GUKNJ`%K(\*?\BOI__7(? MSK7K(\*?\BOI_P#UR'\Z`->BBB@`HHHH`****`"BBB@`HHHH`*R/$7^KT[_L M(0?^A5KUD>(?]7I__80@_P#0J`-8D`$GI7G"RZG!%+]A_M.UC'VV;RH;,J'D M\P&,DE<\@GCTKTBBCK<=SF=(O;I[V:YU%]1CE0,6M_()@*9&QE^7KCL#G./J:R_%?_(K MZA_UQ-,1K#I2T@Z4M(84444`%%%%`!1110`4444`%%%%`!1110`5F:CH5MJ= MSY\T]RI\OR]L&[('(DN,^<9L^:WC7(>*P8K<>6"Q1AC(P._(J[%*DR!T8$']*`'T444`9.F' MR=:U6T3_`%8:.<#T+@[OU7/XFM:LBQ_Y&C5O^N-O_P"SUKT`%%%%`!1110`4 M444`%%%%`!1110`4444`%%%%`!1110`4444`%%%%`!1110`4444`9^O_`/(O M:E_UZ2_^@&K-C_QX6_\`UR7^0JMK_P#R+VI?]>DO_H!JS8_\>%O_`-ZI86-I#=E?-BEE2)&A4-R MS;0?IGO6;:QZQ'>W\3Z1&;>]NMQE>X4@1[0I)7J3P>/>L!/">J06EE`-*MY! M;"'R\3A?(9)=SL..=XQ[\8-)=/E_P0[G=265O++%(\8)B;<@Z#=ZX[FK%1P/ M))$&EB\I\G*;@V.?45)0`5D>%/\`D5]/_P"N0_G6O61X4_Y%?3_^N0_G0!KT M444`%%%%`!1110`4444`%%%%`!5#6K26\TUU@QY\;++%GNRG('XXQ^-7Z*`* M]E>17UHEQ$>&'*GJI[@^A!XJQ6=(_^@AIW_@(__P`70!KT M5D>1XC_Z"&G?^`C_`/Q='D>(_P#H(:=_X"/_`/%T`:]9.N?Z:L>D1_,]RP,N M/X(@!TC12`22,=3P*PO[,O9]1TJ:6RN1'#I[ M+(GV@*BS#;MR`>3P>>>HK5&JW-E%))K-M';(NW8\$AE$A.?E"X#9'TH;Q/HX MGMX1=[VN0IC,:,R_,,C)`P,@$\^E`'(VVBZU)<1K<:9>Q6QN%E>&.\`4#RV# M`_.2WS;>>,]<"KNFVFO65Q#>R:;<3S)9B.1))4)#!<#8=^#SU##W!K:'C3PZ M3M74HV??L5%5F9C@G@`9.0#@U)/XMT&V>-9M3A3S(A*I.<;2-P^A(YQUH`Y^ MXT?7++^T(HK=K]-3L"KF)4B\N8`@9!;DD'D^PJG/X?U6WTF>VL]&F$LEQ+*L MBW/*$@;"!O`)ZC)Z>AKKU\3Z2P@87#[;C'EMY+X.3@'..`3TSUJI9^,-.O9# M)'<*D"1,[121.)L[]H(&.03D8ZYH`W+M>D`4444`%%%%`!1110`4444`%%%%`!1110`4444`%%%%`!1110`4 M444`%%%%`!1110!2UB)I]%OH4&6DMI%`'4)HR)"W+(X.'DEF:W\016R27"7,<4,T*I#(HQE1CN.N( M(Y8X87A3=<1!@&SGY@`3U/'3VHZ`:UMXLL;I)3%;7S/`%\U%MF)5B`0O3DX( MK/\`^$L\W6X8TN8X[*ZCB>W_`-'=G8EG#JWH?EX_K2+8Z,+*ZMF\5;C=21R, M_P!IB!!0``8`P00H!!ZU4BT'08GA*>*RHA`"JMQ`HX+$=!Q@NW2A[@MC:?Q+ M&]N]W;I(L=K,L=W#/$4=5;&&&?J#],UO5Q=OINCV4,MK%X@MYX+MXVN6FN(L MX3IC`&2V!DFNE.NZ.!_R%;+CTG7_`!H`NR.L4;2.=JJ"23V`K,\,1M%X:L%< M8/D@_GS4-E=9(I4^]$ MZG*L/<&JOA__`%FK?]A&3_T%:;J^\:YHVV[GB5Y7#QI)M60!"1N'?D"@!+C0 M+J\@C-SJTCW<$JRP3K$JJA&1]SH<@D&LA?#-U;:W$EO`WV2-%3S"5V.,$,S# M((?YFP<'&:U?%-SGPM>7-I>21O$-RR6\@5L@XQG]*/#4>J1F]^W?:%M6E!M$ MNY%>8+M^;<03QGISF@.A7M_"#6L5I'#J.T6HDF2W$,CO;(S$A=H8$_=XQD>U1ZQJEW&M]=13-`8KV*Q#G[L$;%=TF. MF?FZGIQ45]J]]X=U=K*R=]4@:&-V%U/S"[R!!\^.A!SCVHW^8?U^)?O/"DUV M+!3J\JK9)$H0Q`JS(00^.Q.,?2HCX)S(K#591Y()M_W2YC;S/,!SWP>/<5!% MXJU)[RX$BZ?%#;P-NWR,!Y@E,>F2ZAHMK9!8_P#(T:M_UQM__9ZUZR+'_D:-6_ZXV_\`[/6O0`4444`%%%%`!1110`44 M44`%%%%`!1110`4444`%%%%`!1110`4444`%%%%`!1110`4444`5WL+-V+/: M0,QZDQ@DTG]FV'_/E;_]^E_PJS10!6_LVP_Y\K?_`+]+_A4%YIUB+&_\`'AN/2JNG?Z'K6H M6;\?:'%U$?[P("M^1'ZBM:@"A)H>DRVPM9-.MG@"A!&8P5V@Y`Q]>:L_9+?; M"ODIB#!B&/N<8X_"IJ*`*9TV`W^.*8FA:2EJ;5=.M MA`7#F/RQ@L.A^HJ_10!G?\(_HVTK_9=K@[LCRASN.3^9YI(O#NBP>9Y6EVJ> M8AC?;$!N4]0?4&M*B@#/;1;%0YMH([69XQ$9H4`<(.,`X].*N001VT"00H$C MC4*JCL!4E%`&18_\C1JW_7&W_P#9ZUZR=(_TG4-1U%?]5,ZQ1G^\L8()^FXM M^5:U`!1110`4444`%%%%`!1110`4444`%%%%`!1110`4444`%%%%`!1110`4 M444`%%%%`!1110`4444`%07O_'AGA?M,P5G^XB@L[?11R:IGQ!S\NCZHX]1;@?S-`&O16/_P`)`W_0%U7_ M`+\#_P"*H_X2!O\`H"ZK_P!^!_\`%4`;%9/AG_D!1?\`727_`-&-3?\`A(&_ MZ`NJ_P#?@?\`Q54=%U2>PTQ+>;1-4WJ\A.(%/!=B/XO0T`=-16/_`,)`W_0% MU7_OP/\`XJC_`(2!O^@+JO\`WX'_`,50!L45DCQ%;IS=6=]:)_?FMSM'U(SB MM.*6.>)98G62-QE64Y!'UH`?1110`4444`%%%%`!167+X@LUD:.W2XO70X86 ML1<`_P"]T_6H_P#A(&_Z`NJ_]^!_\50!L45C_P#"0-_T!=5_[\#_`.*H_P"$ M@;_H"ZK_`-^!_P#%4`+;?\C;??\`7G!_Z%)6O7,0ZI.FO75Z=$U3RI;>*-?W M"YRID7_H`K1K/\ M/_\`(N:;_P!>D7_H`K0H`****`"BBB@`HHHH`*JZE>KIVGS7;*6\M?E4?Q-T M`_$XJU63XC/^@VX[->VX/T\Q:`+&G:?]F4W%P1+>RC,TI]?[H]%'85>HHH`* M*Y^WU/5M5N+V331:);V=PUN$G5BTS+C<<@_*.>.#G%+=^,-/L9IX;FWO$>': M<>027!?8"H'.,GJ<4`;]%8;>*[)(X9'MKM4DF,+,T0`B?=MPW/7/IGUK+N_% MKG7!!%+-#8O&JQRBUWAY/."$@Y^[U&3C'7F@#L**Y^3QE813-!):WRS"5(A% MY&6)?.TX!X!P>N*U]/OH=2L8KR#<(Y1D!Q@CL01ZYH`L5D3*NC:A#+"-MG=R M^7+&/NI(?NN!VR>#]0:V*R/$_&C9'7[3!_Z-2@#7HHHH`****`"LJ^9M0U)= M*5BL*Q^;=%3@LI.%3/O@Y]A[UJUD:<2?$>LY[>0!_P!\4`:D44<,:Q1(L:*, M*JC``I]%%`!17G^IQ3Z1JUP$^URK97*ZD/WTAW6Y^61,9P<,,@5>N=4O]&N; M2RL(H-UZ&NY&O;@@$%AE%+'@@'H/RH7]?U_6P,[*BN*G\2:H]\MN+JUML:A' M&W[K>OE,6_C#8).!UP0>U10^,-:N/+<)ID$5S=I!&))B9(LL5(9`>HP.N*%J M!W5%2WT^400Q-LENBNXENZH#QD=R:N:E<-::7=W*_>AA>0?4* M34>CVZVNCVD*\XB4DGN2,D_B230!6/AVW?F:]U"5N[&[=<_@I`I/^$:L?^>] M_P#^!TO_`,56O10!D?\`"-6/_/>__P#`Z7_XJD;PQ8,I5IK\@C!!OI>1_P!] M5L44`8T?A;3H8DBBDODC0!55;V4!0.@'S4[_`(1JQ_Y[W_\`X'2__%5KT4`9 M'_"-6/\`SWO_`/P.E_\`BJ4>'+5.8KO4(V_O"\D./S)%:U%`&2)KO2'47L_V MJS8A1<,H#Q$\#?C@CWX]ZUJANK>.[M);:4925"C?0C%5/#]R]WH%E/(27:%< MD]R.,_I0!HT444`%9'B/_CRM?^OZW_\`1JUKUD>(_P#CRM?^OZW_`/1JT`:] M%%%`&4?#]L+^6ZAN+J`3L'G@BDQ'*WJ1C@GC.",XJA)X(T^2XEF^V7ZF5BS` M2CNX?&=N<;@.IKHG"F-@^-N#NR>U><6A3^S]*+W-B;!M69487,AD)W-P23@C M@<>F*%N!TLO@BPFE,C7M_N,C2']ZOWBX.]OTC5LK&DXV MJ-X?:.,XW#/6J0F1P<\\`8![\4+8;.B@\$6%O,LL=]?Y5T<`RKR M5)*Y^7)Y8]:V-*TV+2-/2R@DEDCC)(:5MS;?\`]&I0 M!KT444`%%%%`!6/IO_(QZU]8/_0*V*Q]-_Y&/6OK!_Z!0!L51O-9T[3YU@NK MI8I&&X`@\#.`2>@R>!GK5ZN8\0Z;?3:I'=Z;;2I+"HN4\ MV&X4[E=U:,!6;D#D4"20.O3)-<%;Z M'K[W-BMU9ZFT,?EK,!>J%*JSY&T/T*LO%6+?3?$)N-,:33)T:`*DDIN0Q*88 M$'Y\`#*]`2?PHZ#.G34]&']FW"1*K:FW^BL(,$DKNR3CY>!WK8KSZU\/ZW;V MMG%;6DT#1,@.^=7"R+&ZF7J<#++P.>.E=#X1TVYTVRE6Z%XLDC`NMS,D@#XP MQ7;V)Y]_:CN)G05CG_DDO_H!JS8_\>%O_`-LC4/$,>GWJVIT^_G9VVJT,0*LVTM@$D]9@T745\0W6H_P!G6+--.ICN M3<-OCC"A3\NW!.,]^]6M#T[5M'MXM*`MFLK=B([C>?,9,Y`*8QNYQG/X4`2Z MGXGMM)O)+>XL[UA##Y\DL<09%CS@MUSQWXJ];ZC%,&=BL2%PL3M(N)00"".? M?H>:R=2\/R:OXD$UY`CZ:+7R2%N71G.[=\RC`*]L$US-UX9F7Q,]FFG6F+Q; MADD^%/\`D5]/_P"N0_G6O61X4_Y%?3_^ MN0_G0!KT444`%9'B/_CRM?\`K^M__1JUKUD>(_\`CRM?^OZW_P#1JT`:]4-1 MUJRTN:&&Y,V^?/EK'`\F[')^Z#5^L76EOQJ>FW%IITEVENSM)LE1,94J!\Q& M>M`%_3]1L]6M/M-E,LT1)4\$$$<$$'D'V-2_9;?:%\B+:#D#8.#ZUQ5YX:U> M\$EU/#(BWMXTUQ96EPJ.B[`B'<1M+#&3]>.E77\+WT8OH[5UC62/S[:1I29( M[DIL.6].,Y]2>*`-I)K&QOH=&]D> M.]N+F2=3YB7RQQRQ^8&^[P00HQ@_A6J+*XT;Q!-J$%@[68C6/!96;^$`1X.< M>H8>X-"`ZJLCQ/\`\@;_`+>;?_T:E:PY%9/B?_D#?]O-O_Z-2@#7HHHH`*** M*`"L?3?^1CUKZP?^@5L5CZ;_`,C'K7U@_P#0*`-BN;\0>)+S1;UXUM[-X$M6 MN=TUR8V<*0"H&W&>>.:Z2LFYT(7?B"'5)YTDCBB,:VSP*P&2#N#'D'(%`#3X MITJ.,--,\3>1YS(T;$J-NXKP/O`')4E0KX:@&KR7K7#M"\IG^S%1M$I386SUP5[4RU\)V-LCIYUQ(LEJ;9P[YW* MOO3+'PLUE<6$HU#<+(MA5MD3S`5V_-COCO2ZOX9EU:^ MFN/[3>%)84A\M85.`KA\Y/N*.J`M'Q-I(BCE^T-MDU+_KTE_P#0#5FQ_P"/"W_ZY+_(4`3U0UN> MYM=$O+FT=$GAA:1#(FY>!G!&1Z5?JKJ-E%JEC/822R1I,FQS$^U@#[]LTF-; MG*V/C&^641R6K:G#)+#'%=6T7E+N<$LI#GDC'4'O70Z;K<6J[/)M[B/_I2Z7IWV/[3.\44=Q M>2^9-Y))7.,#D^PJA%&PU:]CT*_O[[;=/:R3`)!'LW*A(QR3SQ5.7Q3/C MQ6D$T`GGC6[W1JRIO0L$+9X/0\`_A5Z#PI:0[E:]OYH7,C-#+/E"7SN)&/9(#+(6_AC4@''N20*KV&BS:;$\%OJ:!$`UV235;W3T@1&C@,MK(SY68CAL@=,- M@?C67X>\7&\D*:QY$,K)&8WBC;9\T>\@L>`>N![5;/@^W22TN;6Z-M>0!A+< MQPINN-PP=_&.>O'>FVG@JVMT6&6]GGM]BAXF"@.RH4#$@9^Z>GKS0/0EB\;Z M!<,L<%V\TK,52**%F=B!G@`=,G7TES);?_ M`-&I4^FV4D,MU=W`59[MPS*IR%51A1GOQS^-0>)1NTI8Q]Y[J`*/4^:I_D#0 M!KT444`%%%%`!6/IO_(QZU]8/_0*V*R-/&SQ)JX;@NL#J/4;2/YB@#7K/UV] MDT[1;J[A&9(T^7V).,_AG-:%1SPQW,#P3('CD4JRGN#0!S$22W.O7>E2ZG>*KG3;C[+"MOJ"QP-B3S2&9UCWY6Z7C6XQ').@9@/K^5%QH&CW<[3W&F6LLK#!=X@2>,?RXH8 M(Y^;QE>Q6,KM;6:W,>UQ%YK-O5H_,PH"Y+=<]AUJ"[\0SW>M6-W$T4-I:R2H MZO<%=S^1O^<=-O/!Z]ZZ1_#>B2`A])M&!QG,*\X&!^G%.;P_HSNKMI=HS*H0 M$PKPH&`/RXH`Q(=>N;RT74"HCGM+Y+9UB+;)DU=?5>&QM[>626*,*TK;V]-W0PSP M+/:W8D`IP..^34=SXIU:XL9FCU"&%C:Q3(T$:R!`=F_=SE#R>HQ MCH:[[R8N?W:^$^GQFZ1;B5BAD:.3[/RR@'IG((_"O2_)BV;/*3; MUQM&*!!"#D1)G_=%`''V&LSZE:6]Z98YKNVU,6P>/`,D;8R&"DCH<]>U=I5< MV-L;F.X\L;X@0@'`7/4X]?>K%`!61X4_Y%?3_P#KD/YUKUD>%/\`D5]/_P"N M0_G0!KT444`%0W=K%>VDMM,NZ.52K#V-344`9-OJ8T_99:M((I%^6.X?B.<= MCGH&]0?PK0^U6W_/Q%_WV*DDC25"DB*ZGJK#(-4#X>T0G)TBQ_\``=/\*`+G MVJW_`.?B+_OL4?:K?_GXB_[[%4_^$=T3_H#V/_@.G^%'_".Z)_T!['_P'3_" M@"Y]JM_^?B+_`+[%'VJW_P"?B+_OL53_`.$=T3_H#V/_`(#I_A1_PCNB?]`> MQ_\``=/\*`+GVJW_`.?B+_OL4?:K?_GXB_[[%4_^$=T3_H#V/_@.G^%'_".Z M)_T!['_P'3_"@">?4K&VB,L]Y!&@[M(*IQ!]8O8;MHWCLK<[X5=<-*^,;R#T M`!.,^N:LP:-I=K)YEOIMI$X_B2%0?S`J[0`4444`%%%%`!6=J%M-'=1:E9IO MFB4I)%G'FQGG`]P>1^([UHT4`4K76+"[!\NY0.OWXY#M=#Z%3R*L?:K?_GXB M_P"^Q4=UIMC?$&[LK>X(Z&6(-C\ZK_\`".Z)_P!`>Q_\!T_PH`N?:K?_`)^( MO^^Q1]JM_P#GXB_[[%4_^$=T3_H#V/\`X#I_A1_PCNB?]`>Q_P#`=/\`"@"Y M]JM_^?B+_OL4?:K?_GXB_P"^Q5/_`(1W1/\`H#V/_@.G^%'_``CNB?\`0'L? M_`=/\*`+GVJW_P"?B+_OL4?:K?\`Y^(O^^Q5/_A'=$_Z`]C_`.`Z?X4?\([H MG_0'L?\`P'3_``H`==:S96S"(2B>X;[D$)WNWX#H/<\4:99RPF:ZNMINKI@T M@4Y"`<*@]@/U)JQ:V-I9*5M+6&W4]1%&%_E4]`!1110`4444`%%%%`!1110` M4444`%%%%`!1110`4444`%%%%`!1110`4444`%%%%`!1110`4444`%%%%`!1 M110`4444`%%%%`!1110`4444`%%%%`!1110`4444`%%%%`$-Y;B[LI[9C@31 MLA/U&*JZ'<&XTJ%9!MFA'DS)_==>#_C]"*T*S[O3I3.;RPG%OBLC[;K MW_0%MO\`P._^PH^VZ]_T!;;_`,#O_L*`->BLC[;KW_0%MO\`P._^PH^VZ]_T M!;;_`,#O_L*`->BLC[;KW_0%MO\`P._^PI?MFOMP-'M5S_$;W('X;*`+FI7@ ML-/FN2,LJ_(O=F/"@?4XIFD69T_2+6T;[T405L>O?]:BMM/N)+A;O4YTFF3F M..-2(XCZ@'DGW-:5`!1110`4444`%%%%`!1110`4444`%%%%`!1110`4444` M%%%%`!1110`4444`%%%%`!1110`4444`%%%%`!1110`4444`%%%%`!1110`4 B444`%%%%`!1110`4444`%%%%`!1110`4444`%%%%`'__V3\_ ` end GRAPHIC 23 g39741kg01i003.jpg GRAPHIC begin 644 g39741kg01i003.jpg M_]C_X``02D9)1@`!`0$`8`!@``#_VP!#``H'!P@'!@H("`@+"@H+#A@0#@T- M#AT5%A$8(Q\E)"(?(B$F*S7J#A(6&AXB)BI*3E)66EYB9FJ*CI*6FIZBI MJK*SM+6VM[BYNL+#Q,7&Q\C)RM+3U-76U]C9VN'BX^3EYN?HZ>KQ\O/T]?;W M^/GZ_]H`"`$!```_`/9J***:[A`">YQ4;W,<T^0X,I3_?4BK`OH67,TS_A(K#UE_P"^*/\`A(K# MUE_[XH_X2*P]9?\`OBC_`(2*P]9?^^*/^$BL/67_`+XH_P"$BL/67_OBC_A( M]/\`63_OBK5GJ4%^6$*R87J67`JW1115&+6+*:8Q(YW@D`;>N/2I5OX6.%#D M^RU.K*XRIR/44ZBBBBBBBBBBBBBBFL@?&?X3D5"(";II7"D8PHQ3;A`1MDE` M5G!P?3TK/N'16EE)+(@))]?:N>FE>>5I9#EF_3VIE%%%%%%%%%3S?N84M^C' MYY/J>@_`?SJ"BBBBBBBBK&GQF2]C`)4`[F(..!S6R2223W.:**.*7BCBCBDH MI:****0FKVGPD9E/0C`J]2T4444444444445DZY;JEA)+#$HKB:I.F/W5N<#"YB'R_2I8-9OQG M6N,LVA2[5YI&5%R0R]<]JV([R&?8^4M[_2K=O*T)&'41YY!/?OBK M\,JS)O7.,XY%244444444444454OY"D056(+'M1;W0,(,C8YP"W5JM56O7M( ME5KIE`)PN37-ZK?BZE\J%`D,9(&#]_WK/H.<'"ECC@#O6;8:Y;WQCW03VHFC M:2)I]H5U4X/()Q@^N*LRZC:0EC)*JQI&TCR[@40`X.3GK3EO('D95<%%C$AE MW#9@^^:B.I0C4%M2T81X/-2;S1M;YMN*N4445-;*N\RN,I$-Q'J>P_$U$S,[ M%V.68Y)I*********T])BVQ2S$?>.Q?YG^E7J********,T9I:*0FBMJ)%CC M"J,`#I3Z**************1AD$@`JI111113 MX$D>=%B^^6&WG'-=5I\TT%HQO_W15CEY'Y8^OTJ>TU"VO2X@?=L/.1C\:M5B MZKJMD ML68D]34\=T8F`08C`^[ZGWJ]!=)/PN0P'(-3T444444444451OW"LA4'>O(. M.*?;VQ)$TYW/V!Z+5F1MD;-@M@9P.]8/B(Q2I"QF"RJN1$1R0?Y5@T4'(SMQ MOQD`_P">EP(SSSS23Z)<7#.6^Q('M4@*(C`95]V1CH/3TJN?#\MS;O&+F MQF(MI+8,8\^6[/NSQW'3L>]=$H9457QO"@-CIG%+114\W[J%(/XC\\GU/0?@ M/YU!7/ZWK<]CJ\,45RD<$2H]TK0[R0SXX/8@9)SVIU]>WEMJ\R1RS2(EY;(L M*!3N5T;>>PSFB\\0I;0W3Q6%W. M;5PCD(`N25QSGN&!JS_:T"ZE'8/'-'+)@#>HQNV[MO7/0=>GO5ZBBBMZ&+R+ M:*+NJY/U/)I]%%%%%%%%%%%%%/A7?,B^K"MJBBBBBBBBBBBBBBBFN0J$E@H` MZGM7'WU[J@;O?-4Z*****D@E\B42>6DF.@<9'UJ:^U"?4&0S M8&P8`7IGUI-/G>WOX70D$N%..X)Z5KSZVZ6US&I43QR;%/J/[U8!)+$DDDG) M)ZFDI02#D$@^H-:EEJ0EDCAN(PQ;Y?,#8)/;-7/K4L5P\6-@`YYXZUHVUS]H MW?(5V^]3T444444444E4G$TUR0I81J<$BKM1RR-&\>/NLV#7-:Z`7MWQR48$ M_1JRZ4=:YNPBT_,"7T4PUE9MTC!7\QGR?X@,>61CVQ5>]U*[N]'O([@B4/:L MTT0MRIMI-PVIG^+//Y9Z5?;5[A-22V:4;3>!#_HY_P!0T>5;/LW&>]4!KNJ_ M8A/]JC+_`&620;;B^!,'V<_ZLQKND#>@ M_IBJD>N7=KIEF8`!MCW/'Y!P_P"]*G&>1\O.!ZUUIQG@Y'8T5-;(ID,CC,<0 MW,/7T'XFHG9I'9V.68Y)I*J-I5DRWBF%BM]_Q\CS&_><8]>...*C.AZ<=W[F M3+%"3YSY!084@YX(%+_8NG[8P(64QYPZ2,&.3DY;.3D\G-.;2;-HKN)D=DO& MWS`R-R>.1Z=!T]!3?[&L1=+=;)3,L@E#&5N7`V[CSR<<'UJ]114]C#Y]Y&A' MR@[F^@YK:)W$D]SFBBBBBEAADNKIHEE\L*@;[N<\U8_LF;_G\_\`(8H_LF;_ M`)_/_(8H_LF;_G\_\ABC^R9O^?S_`,ABE_LJ;_G\_P#(8H_LJ;_G\_\`(8H_ MLJ;_`)_/_(8H_LJ;_G\_\ABE33+A'#K>8(Z?NA4WV>^_Y_A_WY%'V>^_Y_A_ MWY%'V>^_Y_A_WY%'V>^_Y_A_WY%'V>^_Y_A_WY%'V>^_Y_A_WY%17!O;41NU MV'#2*I7RP.IK1HHHHHHHI*Y37);G^T9(Y)&\O^!1P,?UK-HHHHHHHHJS#-': MQ^8@W7!'!/2+W'J?Y56//)Y-%%%*CF-UD7&Y3D9]JZ%SN(?IO`;\Q2QH&/)` M4=23BM"Q*`,L;%ESG)&.:MT444444444E0P$[YE(X5^*GIK(&QGL;U[H/7\:Y^BER<8R<4;CZGBC598F^ZZ'(/;K4F:IRZK:0ZG#IK.QN9D+J MBH6PH[L0,*.,#/6KF:I7.LV%I*L4MP-YF2`JH+%7?[H;'3/O5F&Y@N5+02I* MJL4)0YPP."/J#1!MI&GM$F;:&/R_+R#C^7TI].1VC;^ M>*M444M%%%%)2!0"2!R>33J9+O\`+.S[W:N.U0YU2Y^;=\]5:********EMT M5Y,O_JT&]_<#M^/2F2.TLC2-]YCDTVBBBBBBBHA=V[7C68F0W"()&BS\P4]# MBI:WH(O)M8HNX7Z\PBY#0?*C>4/+'*@$KG('/KFI+:Q\3?8HQ-+JH8'?F)VPXW#9QR?J*MR66O;=8FSJ;R M>R`'J"&('!P<"HK#3=8;4=*NM0@U)A;2W,1Q..$)!C+#=R, M9'.3P,U$EIXF.E6J21:FLB6SI"L4Z*R3^8VUI3G#+MV^HX.1DU96V\11:S]I M(U)PNI1C:)E,)@,8$A"D_=WY(!Y'&*EUG3]3_P"$FU"_L;:^8MIBPQ21SA$+ M[SD`9Z@'(XZYJI';>)#;>18PYXY'3\J9!I6J/J>FW5Q;:B([:_N@0)P#Y;G,; M$!N1V]:K?8_%AL+",?;H%C253M*M(DOF$H[`,`PV8ZDCKD5M:1!K1M"J"01U[`COFNHJEJ?^HB_Z[I_.KM%%%%%%%%%(:Y#5[+[' M?,`,1R?,G]15&BBBBBBBBBBBBK%K>S6F_P`O:0XP5;D5L13)=('AP0``R@EHI5.U@0!QZU(+B0R*S2,=I_2G1W,U/2T444445D>(+9'LS.S!?+[!>6)XZUS%%%%%%%%%3R?N;9(OXI?G?Z?P MC^M04444444451CT:SBU-M15#]H9V+:N^)&02$8 M^ZN<9/IW_*EFU*R@@DG>ZB\N,98AP<<9'YTLVH6L*$O*NX!24'+XI6 MU"R6,N;N'`SD^8.W7\J?;W4%TF^&9)!@'Y6SP1D?I4N*****6J6I_P"HB_Z[ MI_.KM%%%%%%%%%%9NMV9NK!BB[I(SN7^OZ5R=%%%%%%%%%%%%%3V2/+=QHDI MC+'[P/XUML=S$XQD]*2BBBK,4(B_>S':%Z+C/-1S3F8\E@/6:4*(W$$3;=QZ,]8U%%%%%%%2VT0FN4C/0GGW`Y(ILLIF ME:1NK'./3VIE%%%%%(S*BEF8*JC)8G``I:**TM)BXEF([!%_'D_I5^BBBBBB MI]-_Y",O_7(?SK5-(HV;[<\KNYVC!##&`.V/4>4Y.6'R@,W//3C.3P.*?-X?MIYY6< ME8W`"JG;ALYSUSN-1-X7L7>3;*Z%W+,%"YPW5>G3T]*DD\/PW-S<37$SL97W M*$PNP8`QGJ?NBF_\(O9&)E>21F88+X4$?3`X[?D*NV.F1V,D[I(S&8@D8``P M,<`5=HHHHHJEJ?\`J(O^NZ?SJ[11111111112'I7*:CI3VZS7"YV+,1MQT4] M#^N*S:*********NV]@EW:F2*4B5#AE8<'TP:K2V\T.?,B=`#@DCC\Z2*&2= MML2,[=<`59&EW8VG]WGN-XR*UY#F1B.>>M-HHJ>TA\Z0_,5V\Y%+=RJSB)!\ MJ=_4U7J_IG23ZBKU%%%%)45S<+;6SSN"509('6N8U;4A?,$3=L0Y!/&?J/4> MM9U%%%%%%%6+.80S$E@A*$*Y7.T]C4,J-%*\;$%E.#@TVBBLI_$$,?B--$-M M.9&4'S@/D!(SC\O_`-5:M%5-4TZ/5;+[)*Q$32*TB@\2*#DJ<=C4EA;-96$% MJTS3&%`GF-U;%3T5N6D?DV<2$8)&]OJ?_K8J6BBBBBBI]-_Y",O_`%R'\ZU3 MTKF[30-1@\6S:K)?!K9P<)DY8'HI'3`J_J]C=74T,\$S1?9T8CRS\Q)(SQWX M!_$UGR:7KEV(&FN@K`"0XDQY;X(P!CGJ#D^AJPUIJ\-O=[)WE=\)#^]Y^]][ M)'R_+QWZ9J'^R-927>EVN6*EF$A!XZ9X^;C(_6B32=6!++>/)((RL;F.AP>G3/%=$@(10>H'-.HHHHHHJEJ?^HB_Z[I_.KM%%%%%%%,=BH^52Q/&* MK^8SW0V$[0GS`=#5B+?Y:[_O8YIUJL,@_A06)&,\> M@XI****?'*\0.S`SWQFIH;PHCAL%B/EP,56HJ_IG23\*O44445%<()(2&?8O M4FJL912;65EDBE!VGV]*H7'AI"H-M,5('(?G-8+H8W9&ZJ2#3:*******MN[ M7-BSNH+Q./F`P2".2?7M52B@=:R=(UVRUJZNX8;62-[5QN:6,#<>@(/K_2M: MBBBBI+>+S[B.+^^P!^G>MYCN8D=.WTI*******GTW_D(R_\`7(?SK5/2N4LO M$&KS^,YK&6P"Z6SR6\3C/F*\:AB[?[#;L#Z#UK5UC5IM/GMX88!(TQX!!^;D M#:,=#C)R>.*@M-8U"XG1#8@APQ7"LN<`$^.E01:EJWF32QP&X1G]0KKFIRQQ726I$ M)R0RQL5.<8R,9.,]NM2_VKK#M"39I`C,NXLCG`[@^F>?I6OI=S+>:?%/-&8Y M''S+M(QS[]JMT44445G:X[1Z=O4X974@^].LM6M;F!&>:-)=N74G&*NJZNH9 M2&!Z$=#3J*****:Z[D*@XR,9]*9%`L6=O<`?E4M5=2N1:V$LFX!MN%SW-<71 M111111112JQ1@Z]5.171.[/M9P0Q4$J3G:3VIM%%%%%%%%%7],Z2?A5ZBBBB MF2Q^;&4W%<]2*R)8VADV$@X]#5J*\E:/8NPR#IN.`UV\UO<'SH6BWDL`3 MG]:KT4444450U?55TF".1H6E\QMH`.,>M;%C&]Q;S-$C$O&H"GCJ0>?RJL00 M<$8HJ*ZN8[.UDN9<[(QDXZUC76IW+Z)%>>'].CDN9'\H1LH&P#)(R.,?IS6Q M9RRSV,$T\8CEDC#.@!^4]QSS4U%%%7])CS+)*>B+@?4__6S6E11111114^F_ M\A&7_KD/YUJUDQ:]9W6N_P!EVLB2.D+22.&^Z00-H'<^OIQZU8U#4;'3GC:[ M(5FSL;;G'(!Y_'\JJ_\`"1V:2%9/-`W8!"$@>F?0D@C%+#KUO]E:1X9$(D95 MB1(K43)&B2'EZ\TL@@N_OL0$=1U^M;+31+]Z1!]6%"W$+ M#*RH?HPIHNK=I/+6>,MC.`PZ5+2T45#<7,5K"TTK[57]:Y/4=2EU"7+?+&I^ M1/3_`.O5.BBBBBBBBBBM.QOPR&*ZD4;1E';K]#5XC@,#E6&01T-%%*@#.`>A MZU'!,+F$R*FPJQ5ESG&._P!*?112A21D#@=3V%5Y;ZUAXWF5O2/I^=7="NVN MOM!**@4K@#GUZFM>BBBBBJ5[;AD\Q%^?.3CO6?6JD:S6:JV#E.I&<>]<==1Q MPW,D<+,Z(<;F[^M1444444A4,,,H(ZX(S3XW"2*S+N`()7UJ:[521.LID$S, M8!W[#/K4$T.E>6[RK;;6#,Q..<9W'\,FHEBTB[ MACB40F&TD!6,'"AB..._WJE:UTE-X:.U&YBS!MO)P0?T)_.AHM,CN0/+A\V1 MPF`,G=M/4=OE!J-8M(M[B(JENKQHVQQCY`.#SV^]^M(++1;6!;4I;!&8*`Q! M+,>?KDX_2K*6&GO$OEV\)0F?Z5^:OQPFYTMX"V-ZD`YZ M5S]UI$MC9B:=UWE]H1?YUGUGZ7K$>JM.L<+QF$X^;N/Z'VK0HHHHHJU;".>+ M[,[LKE]R8&1TK$&D`:V=4^T/]W'EGITQC/I[5+;ZK975RUM#*QD7UC8`_0D8 M-7***0NBLJLZJS\*"0"Q]O6EIR(9)%C7JY`'XUT#`+\J_=4!1]!244444445 M/IO_`"$9?^N0_G6K63#H$%OXEN-;65C)/$(S&>@/'(/X=*-6TA]3N;=C*$B3 MB0$9)&0?E]#P.:K#PI:^4$\]@-FTX0%K!P`V20,`E5SG#9/3K\Q-.MO#T5G(TT<[M*`P0L!@9!`SCKU/ M-0)X4@%LB&Y82!0K,J+M/&/NXQ_^K-2CPQ:(RNCG<.N]%8-][K_WU^E:5A:" MQLHK82-((EVAFZFK-%%%%9FO_P#(+;_>%?F^7\N:WJ6BN M%MI(P6%W!@1\W&>/6HK>[@NB1&2KC^%\`GZ>M5[Z:6TU".X6 M-2/+`7IJ%55,[55MS2NLEL!Y87ID-G)]?2M/>L^*SU]E&V=X$\S:RAESM!X*C&`/;O M3TTO6XPWDW:1'.X8(PS$YYXY'+<>]:VDQ74-BJWDKRS9)8L02/;(J[111111 M1169K_\`R"V_WA7*444445H:'+Y>JQ#.`X*GWXKK:6BJ6KP&XTR9%&6"[A^' M-<=11111111111110#CD'!HSP!V'0>E*K%'#+PRG(/H:FNKI[N0.X`PN,#I[ MG\:@HHHI\,33SQPK]YV`%=+H5E+9I<>:I&Y\#/<#O6M11111156]MS*H9%!8 M?RK-`)8#WK9D021,C+N##!'K7&WR6\&%(3EEY]>H]?3FM(G).*L29DL8WR6:-BK'^Z#T'\ZS-6DO8M(NI M--C\R\6,F%,9RV>F*Y_S_&=SX2:188X=7\X@HR!6\OC!4=,_7M736GVG['#] MM\O[3L'F^5G9N[XS4M%%:VF1[+,R'K*W'T'_`->K=%%%%%%%%3Z;_P`A&7_K MD/YUJGI7$OXZOT^(Z^%AHY-L6"_;-S?W-W3&/;K72:GJ4ME*B16_F9C:0DY^ M;'\(QW[_`$%4'\07BHI^Q1C>P1&);$A.XY48SC"_K2_V]>Y<#/;MQ5>?4;M"@COFDS:LS,D8/[P@%`!CN3QR<]/>NBA+F%#*H5 MRHW`=CWI]%%%9FO_`/(+;_>%E<1>6YM;N6$X^1N,>G:H:**************** M*.^*N6^D7US@I`57^\_RU;_X1R[\U%+Q[3]Y@?N_XUN6>G6UBN(8QN[N>6/X MU:I:*****2N;U'5+FVUEBI.V+"B,GAAWK0A:VU)A+;2A6ZNAZJ:TV8(I9C@` M9)-74(N&%H2\!.2DHW+GV]!4/^C2="T#>A^9?\1^M->WE1=^T.G]]#N%1 M44454U,7IL'&GD"?(P>^.^,]ZELQ<"SB^UE3/M_>%>F:O6DF)1"RJT/.`/?((_"G7&OV5M=-!()LH<, MXC)5>F>?;<*K7/B2Q6!V,,C&,C*R1X"Y(`.??=QWIY\16BD1PPS,JEE+>7M5 M`H))^@(QQ3AXCLL89)MPQD",],X+#V!XS2WNN0VS-##"\LRN$4!?E)R`W/\` MLYYJ*U\2PR6YEN(GC*KO<*"?+4C(W>YR!QGFK`UZU:&>0),/(B$C*R;2<]`, M^_X5`^NE;E[54C:XB@>64>:,(R@'9ZGKR>U:]O,+BVBF"E1(@8`]1D9J2LS7 M_P#D%M_O"N4HHHHHI02"""01T([5T6EZXLY2VNAB0\!^S?6M5;:)9/,5=K>Q MJ:BL;6M+2=6NHRL$0.%\V.4D9)C.0/;-1T444444444444 M4=\=ZNP:/?7&W;`44_Q/Q6Q!X;MD`,TCRGN`<"KT&FV5LP>*W16'1NI%6LBB MEHHHHHHHI#7'ZQ()=5G(Z`A?R%58O,,JB+=YA/R[>N:ZV&>XATUIK\*LB*20 M/3MGWKC^O/K13DD>-MT;%#ZJ<5+YZ2?Z^%6/]Y/E;_`T>3%)_J9AG^Y)\I_/ MH:CDBDA.)$9/J.M,HHJ2!FCF6587F,?SE$(!('/4G%<_')>:E;VE[*8O)61C M]7;#4([ M\W'EC;Y$OE[6!#=`'0K&&X,ZQL7,WG'<`#RF#`+P"1R,^O-.GTFRGD:1H0'8[F9>"QP1S^=._LNQ*@&UC.$V< MCJ/?UZ4O]FV6V1?LZ8E3RW_VE]*633[290LD"/\`*%R1R1UP3W'`JQT%+69K M_P#R"V_WA7*4444445\1WC$K9B,JN=Q8]&^E85%%%%%%%%%%%%%6+*SDOK@0QG'&2QZ**ZRT MT^VLT"Q1*&P,L1DDU9J.>`3J%+,N/0U4DL'528Y"Q_NGO54QRJ>4<8]C4\;7 MK8"[\>XK13=L&\`-CG%.HHHHHHI&("DDX`[FN'N=GVJ79)YB[B0_][WJGJ7B M5?">B76J"T-Q*I54PP&W)Q5:R\3R:KX;.MO'*%F4LT.[<3M)`Y]*ETR_&I6* M70B,>XD%3SR/0]Q5NBBBI([B6(81SM[J>0?PK0ALH;FT265?+=\D&+@8['!J M&72IEYA=)1Z?=/ZU4DBDA.)8V0_[0Q3XM[VMU%&P1WC!5MN<8/7'?CM7/2:9 M<'2IX;N_$;+,95F#<$;MP+KW/'TZ5'2((2S$.R]R#SD]^:?16GI,>(YICWQ&/YG^E7J*********ET]U34 M)2[!?W0ZG'>M3SX?^>J?]]"CSX?^>J?]]"CSX?\`GJG_`'T*//A_YZI_WT*/ M/A_YZI_WT*//A_YZI_WT*//A_P">J?\`?0H\^'_GJG_?0H\^'_GJG_?0H\^' M_GJG_?0H\^'_`)ZI_P!]"CSX?^>J?]]"CSX?^>J?]]"CSX?^>J?]]"CSX?\` MGJG_`'T*SM=DC?3&"NK'<.`:Y:BBBBBBBBNKT:X/]GPI<.%=LB,,>644W7)Y MHK8>4S1D8?>IQT/3]:S+K5DN](6&4!KDG!.WH,]?QK)HHHHHHHHHHHHHK=\, M*-UPV.?E&?SKH:K7%_:VG^OG52>V.?2D*AAA@"/0C-5[^.X;3 M9XK`K%<,A$1``"GU]*AT2WO[33%M]2N%N)XV(\U0`&7M_D\U?HHHI\,333)$ MO5R`*WS@?*OW5&U?H*2EW'&WJ/0\BHA:V_FK*L7ENISF,XS^'2NF!VK./AC4M/U.+R=\5@$P[HV'/<\COGO1HH!XSU.:UZ*W;6/R;*%.Y&\_4__6Q4E%%%%%%%%%-:.-SE MD5C[BD\B'_GDG_?-'D0_\\D_[YH\B'_GDG_?-'D0_P#/)/\`OFCR(?\`GDG_ M`'S1Y$/_`#R3_OFD\B'_`)Y)_P!\UFZD`EZRH`H"KP/I57)]:,GUHR?6C)]: M,GUHR?6C)]:3)]:********52%<%E#`')4]Z?-/)<2F60Y;MC@*/0>E3P7$T MR-;/*S1F-MJGG!QG^E5**************TM+TAK_`#)(S1Q#@$#[Q]JZ"WM+ M72X'*'8G5W=JYC6_&`2\@L;=S$)Y1'O((X()SG&.<8`Z\U4.2>>OO170>&I) MFCFC(S"I!4^A/6MVEHHHHHHHHK`U;6)[:^\F#;M0?,&&0Q-9-X8YC]JA38KG M#I_=;V]C5:J=U?26M_9VY@5HKIV0S&3'ED`MC&.<@&JD?B&&Y-I):QA[>X\T MO+(^PPK']YB".G(_,5<.JZ>+<7!O(A$6*AB>XY(QUX'-16NKPRZAK;<-^8YJO)IEL_W&DC/_ M`'T*@_LB7>H62-U)&><$#\:TV(+''3M].U)1111111111111111161J1SJ$W ML0/T%5:*****************FM&VWD1/3=@_CQ41&UBOH<4E%%%%%%%%%%%2 MVUN]UBBBBBBBBJU_=K96CSGDCA1ZGM7&R.\TK2.K6#6DLCQ@LK!T^\I![ M?AD?C4#Z'`;B]GAE>!KN`0@(!B+'4J/&MT4B&^.9)3+GRONDH%.T M[LC@#O\`7(J==&D68RK?G/VJ.Y^:$$Y1=H!.?05''H#QQQI]O)\N&>+/D#D2 MG)/7M4!TB^@NXH8&+6HF@FED;8`QC`!./O`X4<#(]Q736GAZ>S@MF@U$Q3P2 M2RQ,T"L$$O+*PS\W;!XQ4#>$5%K-;0ZB\<4MK%;#="K%0CE\YSW)/'0?A719 M)Y/)[T4444444444444444444444444#DBL2];=?3GUD/\ZAHHHHHHHHHHHH M)`!)(``R23@"H;>\M;L,;6YAG"?>\MPV/KBIJ*0NH95+*&;[H)Y/TI:56VL& M]#FI;Q0MY*!TWD_GS4-%%!.`23@#DD]J@MKVTO-WV6ZAGV?>\MPV/RJ>HOM, M)NS:;_WXC\S9@_=SC.>G6I:****V?#L`\Z6[?A(UP&/3/>JNJ:FVH2@*"L2' MY1GK[FJL=M/*NY(F(/0XX-.2V(0R3YB0#(!X9OH#4\.K36B[+2..)>^1N9O< MFKK>(Y#8[1'BYZ;OX<>M3^'[VYN9)DGE:0*H(SVK;I:*******Y77;XW-V8% M/[J$X^K=ZY'Q-I^LZA:0)HVH"S=)0TF>-PSUS[=<=ZV8C)&B;I-TJJ`TBC;N M/<@=JF%U<`Y\YR?]HY!_`TYGM';<8Y4)ZA",#Z4GD1=KN/';*L#^6*7[*3PD MT+GT#X_G3)+>6(;G0[?[PY'YBHZGLH/M%W'&?NYRWT')K;8[F)]:2BBBBBBB MBBBBBBBBBBBBBBBBBBBE3[ZY]16%=))'Z^9XW_OQ*?TQ_2H***I:Q:RWNE3V\(!=P#L)P'` M8$J3[@8K*NKE;_5X(;>"73KF&"4#S5$3ON7"HF,@@$9ST&/>FM+KLL,IBAO( MR8[?(D`!XR)MF#P3P?S(ICV^JAXKAO[0>46LL<;PJ%8.7R@<'MCN>O>I@/$1 MU"3=(5<`^7A28&&SCV!W]^OX5HZ0)Q%(9WO23M^6\4`JV/FVD=03^'I6A11V M-;FJ73PZ3:VZJJ&9`7"C''_UZQ48)(K,H90P)![BI;QI/M3AVSL.U>V!VQ4+ M,SG+,6/3).:2BM72=3AL5$?E%GEAIMO.5F(CQL9<'DC\ M#5ZBBBBBBBBBBBBBBBBBBBBBBBBBBBBJ.JQ9BCG'\/R-_,?UK,HHHHHHHJQ+ MI]Y"@>2VD"D9R!D?I5?@4444444445-+\UK;MZ!E_(Y_K4-%%%&:******L6 M-H][=+"O`ZL3T`JU.XU;5-H)6%`0N.RC_&I/[,6-_,A8.?X5E.`ON?7Z5(UA M;/&%8$OWE'!8]SBLNZMS:S>66##`(8#J*AHHK>TK7%2,07C$;1\LGMZ&KD=S MIM_,8XG8R-SPI'XU973XE#`DG(X)[5):P>0K`/NR?RJ>BBFNZQH7=@JCJ2<` M5R&K7K7E\Y#!HT.V/'3'K5(#)`'>LEM7NFMIK^"Q22P@9@S&7$KJI(9E7&,# M!X)R<59&M:86=!>)F-=S\'Y1@'GCT(QZYI&UK34B61KH`,6&-K;AM^]E<9&. M,Y]:<-7T]I(HQ=+NE"E.#CYONY..,]@>M%MJUA>3^1;W*R28;Y=I'W3ANHZ@ M]15RBBKFF),;M7CX1?\`6$]-OI^-:IHHHHHHHHHHHHHHHHHHHHHHHHHHHHHX M*E2H93U##(-0RV=M,N#$(SV:,8_3H:C_`+,M-H!,I/KN'/X8JI=:<\(WQ;I8 M^^!ROU']:IT44Z.-YI%CC4L['``K8M-&D_TE'QGB)7(X&>21_*NB5=JAEJ8?-8'_8E'ZC_`.M4-%%%%%%%%%%: M[%=*THQ@C[7Y MM@OSLJ8)*'KN`.<=\5AR>)H_L"W-Q=&_:2YN%MS&BIF",CGW//3J2::_B6SB M9UECEC8HP<'U':M](5L08(G/RDY?H6I?WC*2-Y M`ZGM5W3>DGU%7J**YKQ%>M)H'J:=-HL-Q%?0RS2&*\='V``>45`"[?I@=:I76A7,,>=/<>?)') M%-*"L6Y6`ZC!!&1UZU:&AQE0C7,GE.(3<0J!ME:,`* M4WLLGD/*X5D4!C(M<[)X:G\X^5-'Y>>-VI:;_9WE`S>8SY)PN`*HT44`X.:SM.T=-. MN[FX6=Y#.>C=N<_B:T:GA&;:Y'8*K?D?_KU!111111111102222ZB$JP;6<[22, M@@..]5KIO"\^G/C8@$ M\GEB))$D$S#>V`,-\PY/8CFLN:30;HW#3")R$6*4LIR50>8`.YP/FXJ=-9M7 M,\AE40Q^65;#;FWC(&W&>>V,YJ!]>MX[Z)O/C-C+;&175&+;PX3&!SWQC&01 M7?Z)IXMK3SG!$LRYR1RH["G(UM#*4=?,]7//-0S3-(Q`^5.RC@"K>F=)/PJ] M12$X&?2N&N)FN+F29NKL34=%%%%%%%%;=GY7V&/R2"/X^.=_?-3444444444 M44444444444444444444444445/;VKSG/W4]?7Z5H0VTS$XSDL<\<53'A*(6T MEO\`VI>>6]K]D`VI\D6[<`..H/?O4MYX:COCH$2QM,91#'"?GPV%_C!_O$?*3W%2MX)NKNZ>[%V8FD:-DVE3Y#1@ MA2..>"00?6KQ\`VSSP7,U_.US;Q%8Y41%*.6#>8O'!R.G3&?6N@NIGAA2+>6 M*T>>,NI`],UIQ1B.,*``>^!QFGT5#=RB&TEE/\"$_I7&_P"C MRCG,#_\`?2'^H_6FR6\L:[BN4_OJ];Z1+!$L" MG(CXSZGN:6BBBBBB@E5`+.J@G`W-C)I2C`9QQZCD4E%%%%%%%%%%%%%%%%%% M%%%%%%7;:RR!)-P.H7_&KDN*?4,MU%$#E@Q]!UJ@SM=S@.VQ?T` MK0@:!0(HG4X[9J:DHZ5'(([F!X]P96!4X-<=?6HL[Q[<.7VXY(Q5>D==Z,N2 M-P(R.HJCI&E#2H)(_/:;>^[D8`J_114T4B-&8)20A.5;&=C?X'O2FSFS\OEM M[K(O/ZTAM+@`GR6./3G^50T4444444^**29PD2%V/85LVMN;6U5&P)&.Y\'/ MTJ6BBBM"TCN(T484(6R0>N*M2%@A*]<<9K&9B[$LQ8^II*U[6+RH%7N>3]:F MHHK(\07BPV7V<U:M%%%%%%%9V MK2?/%".BKN/U/_UJHQRR0G,4C(?]DXJU'JEROWRDH_VUY_,5.FK1'_60,ONC M9_0U82]M).DX4^CJ14ZC>,HRN/56!I"".HQ]:*******************56*L M&'4'(J26YEF&'?CT'%)#]DEX3*+^IJN68]68_C4D-Q)`"$Q@\D$4DEM'J4&IU&89T<^C#%0+X?U`H6*Q@CHI;DU&VB:BIQY&[W#"HWTN^C?8;9 MV.,_*,U!+;S08\Z)X\]-RXJ.BC`]*SM3UA=(EMQY,CF5NJ'&WZ>I]JV?M*LX M,UO&^<;FP0Q_7K0;*4N?+P\?429`7'N>U5K&2WO[;[7# M58_]]A_*M*WB^S6RPA@3R6*C`)I]%%2_9I2BLJ[@PSQVJY9V@0"2098]`1TJ MW01FLF>UDA9CMR@/!I]G;^164!FF)"]`!U)]*Y"^O&O MKIIV&T'A5ST%5Z***LP2RSR)`X68,0`)!DC\>M6YM*C8DV\Q7T63_$51FL[B MW&9(B%_O#D?F*AHK7TV/R[/>>LK9_`<#^M6J******51N8+ZG%8=Y+YUY+(# MD%L#Z#@5#1110.#D<'VJ>.]NH^%N'QZ$Y'ZU.FK3C[\<3_AM/Z5,NK0G_60. MO^ZP/\ZFCO;65@JRE6)P`Z$9M&_;TSWIL\*7%O+;R9V2H4;!P<$8-0:?IMMIDTL#<)YCL47^'`Y-7FLK=MH*':@PJ[N!ZGZU(D,4>"D2*1 MWVU(79NK$^V:2BBBG1QM*X11R>]:L,)C"Y;)`QT_2IJ**0@$8(R#2(BQC"*% M'H*=1169X@B\S2W;',9##\ZY2BBBBM#28LO).>B#:OU/_P!:M&E#%?NDBH9; M6VFY>$!O[T?RG_"JDFDD_P"IG4^S_*?\*T"%4!$^Z@"CZ"BBBBBBBFR2>3!+ M+_<0D?7H/YU@4444444459T]-]_".P;L(0!YSXR>$S5[:,YQR>]%9U[<1RX10M5`2IR"01W%6X;Z0,JR?,"<9 M[UI455OI9;=%G0CRT(\U<9^7N1]*L(ZR*&1@RGH0XC#'L M>U4Y!J*BBBKFGV;3N99$_A/-:T<219V+C-/HHHHHHHHJEJ[QIID_F'AEVCW/:N.HHHHK/Q)Q6E1111111111111111111114D,8EDP3A0,L?05>AVSSB1,^7&-JY]:M M$XK+DO':<./NJ?E'K4#$LQ8]2&PW(QW%3W7B=;@-8&W`EDB+'G(5JR9NEC_`.>:`?B>35"17>)TBD\N1@0K ME<[3V..][ M(BQC55$ADX^49Z*<@_2GOXAMTMS<-:W/E&)YH7PO[]$^\5YXP.<'&13X];1[ MM+=[&ZB)F2$LX7`9UW(#@]Q^7>H8]=*6L+/:W$\DB3/^[15P(V(8$;N,#\ZD M?7H0`\5K<3Q;XHVD0*`KR`%5Y.>C#/IFM0\'%%:NE)BVE?\`O.!^0_\`KU_M6GY\%N%BWCCC'7%3#I6'XF:010*/]66.?KV_K7/5573;5-0%]&GES;2 MK;.`^>N?6K0!)P`23T`K9M?#33QYO2%1AS$!DGZUM6>FV=BFVVMT3N3CDFK+ M*KJ5900>Q%5K*QL])M/(M(E@A!+;1TR>IJM=W2W&%52`IZGO5:BBBBBBM'3Y M2T9C(^YT-7**********Q_$<'F623`9,3<_0_P"17,T445IZ5'MBEF/\1V+_ M`#/]*O444444444444J@,P!Z=_I6!<3>;-),QQO8G)]^E,JJ^EV+Q31-:H4G MF$\JX^_(""&/OP*1['S=6COYI%)/?IQZ9-1G0M-*2H;;Y)4* M,OF-@*3DA1GY03UQBE_L:P,GF>4^_P`Q)<^<_P!Y1A3U["D70].15587`59% M`\Y^`_WQU[U6D\.PM>0R1R"."%HF$84EOW?3YL\]N2"<=#6P>M%;5BNRPA'= MLL?Q/_UJGHHHHHHHHHHHHHHHHHHHHHH]JVT&U%`["H+XXM6]\"LNBBI[:Y%N MKC9ECT-0DDDD]SS6G8R%[?!/*G%4/$FW[!'GKY@Q^1KF:*T]$^R1W)GN9T1D MX16]?6MXZG;-N6"19649(4]!59[V=SPP4?[-(+N=01YA.?6HWEDD^^[-]33: M*******L6MT8#M(&PGD]Q6F7&S>.1C/%*K!@".A&:6BBBBBBBJNI8_LZXRI< M>6>!7'>3)Y/G;&,><;\<9IE%%;T"JEK"J$%=@.1W)Y-/HHHHHHHHHHHJ.YD\ MJTFDST7:#[GBN4U"RN+IK=[>YV>3*LGENH*-C/7C/Z^]7CC/%%%%%%%%'8UT M(7RT2/\`N(J_I11111111111111111111114MHH>Y0'IUK7ILL8EC9#T(K&9 M2CE3U!Q24445(E[]B@EE*[U`!VYQSG%@)[ M$X./7%39'K3X(9+F98H5WNW0"MRW\-#`-Q<'/]U!T_$U.=*L[!EEC,ADY`!? M@Y]:BHHHHHHHHHHJPME(^PC&UADGTJ>*%`K$W+&(=LXJXFW8-OW<U":>('C$KQ3+]X*PZ@CL:P"3YD M^G;N*V:*Q9B#,Y'0L:91113]2L?^)4[>9M8 M`,<]#CM7.VFAQZC?++]FR=Z%Y<<#;G:3[C)Q]:[.VT^UM4VQ0J/4D9)_&I5A MB1MR1HK'@D*`:BGO(X@0I#/TP*S9':1R[G)--HHHHHHHH`)X`R:G2RG8_,H0 M>I-6HK"-3EVW^W05;P,8P,>E&!C&!BBEHHHHHHHIDL?FQ/&690ZE%%\-7NHLM_<7`N)CA)&X`!ZL.[^];E%%203-!,DJ=5.<>OM6[E6`=# ME&&Y3[4444444444444444H9EZ,1^-,>.*7_`%D,;_5>?S%0/IUH_17C/^RV M1^M0OI(_Y9W`^CKC^50MI=VOW520?[#BJ[VT\7^LAD7ZJ:GTM=U^A_N`M^0K M6HHHHHHHHHHHHHHHHHHHHHHI4;8ZM_=(-;8((!'0U%=2^3`S=SP/K611114D M$;R2A4Z\\^GO7-ZIIFOVVLV45M$+FR4JUQ@',NY]I53T4J/G)-=S##'!$(HD M"(O0"DFN(X5^8\]@.IK/EOI9,A?D4^G6J]%%%%%%%%*B-(X51DFK4;0PMB)3 M-)Z]OPJ=4NI6!E*QI_='6K"1K&NU1Q_.GT44444444445S/B..!+B)HP!(P) M?'?T)K'HHHK4TN??&ULQ^9A%03W#SM\W`'0#M M45%%%/BF>$Y0XSUXZU:74?[T7Y&F/J$I/R!5'YU69F9BS$DGN:2BBBBBBBBB MK-GY+;TD8AGX';BM"*)(EVHN*DHHHHHHHHHHHHHK@O$=Q)I^J&$1&XN;J4^2 MF[:&&,DD]@!6>NJ+#&QU.-;%EDV#<^Y9.,[E..1ZY`Q36U0QWEQ!(L15)84B M8/MW"0=R>,CVZU';:[;R27DD]Q;Q6T$Y@3EM[,.I/'?V].:M-JNG)(L;7L.] ME#@;LY4C((QVP#35U^SAB:\M+J&`"N<\=.,#\ZZ>BBBBBBBBBBBBBBBBBBBBBBBBBBBBB MBBBBBBBBBBBBBBBBBBBBBBBBBBBBBBBBBG"-RY3:=P[=Z;5S3XLR&4C@<`^] M:%+1111111111111574;=+JQEC?(&,@@9((KBZ****56*L&4X93D$=C6]%,+ MF%9P,;N&`[-WIU%%%%%%%%%%%%%%%%%%%%%%%%%%%%%%%%%%%%%%%%%%%%%% M%%%%%%%%%%%%%%6+.%96+,?NH?-?S?,S\V[8H?'/L:GAB$4 M2H.PJ2BBBBBBBBBBBBBBFNP52QZ`9KAII!+,\BJ%#L2%':F44445M5I=OFML&%SP*DM"PNDV]^#]*UJ6BB MBBBBBBBBBBBBFR()(V1NC`@URVH:)-9#?#F:+..!\R_6LRBBBBBMFQN/M-M\ MQS)'PWN.QJQ1111111111111111111111111111111111111111111111111 M1111111113TD"C:RAAG.#4T;P*ZO'(\;#LW(JU-:Q2QLR*`YY!'>J^GH?/8X M^Z,5HTM%%%%%%%%%%%%%%%)6#KNE=;NVC.?^6JC^=8%%%%%36MP;:X64#(Z, M/4=Q6WP0"IRK#*GU%%%%%%%%%%%%%%%%%%%%%%%%%%%%%%%%%%%%%%%%%%%% M%%%%%3VEJ+GS"TCKM(`"X]*L?V8G_/:7\Q_A1_9B?\]I?S'^%']F1_\`/:7] M/\*/[,C_`.>TOZ?X4?V9'_SVE_3_``H_LQ/^>TOYC_"C^S(_^>TOZ?X4?V9' M_P`]I?T_PH_LR/\`Y[2_I_A1_9D?_/:7]/\`"C^S(_\`GK+^G^%2BU81^6+B M7;C&./\`"DBLS"NV.>0`_3_"G^1)_P`_,GY#_"CR)/\`GYD_(?X4>1)_S\R? MD/\`"CR)/^?F3\A_A1Y$G_/S)^0_PH\B3_GYD_(?X4>1)_S\R?D/\*/(D_Y^ M9/R'^%'D2?\`/S)^0_PI;5VDMD9SEB.3ZU-111111128K!\06,,5O'/#$$8- MAMB\8]ZP*****UM+D+VCH3GRWX]@?_KU;HHHHHHHHHHHHHHHHHHHHHHHHHHH MHHHHHHHHHHHHHHHHHHHHJ]I?2;_?'\JOT4444444444444A(!&2.:6BBBBBB MH++_`(](_I4]%%%%%%%%(1D8/2N4UNP6RN@T0Q%+R!Z'N*S:***N:9-Y=V(\ M$B;Y3CMZ&M7I11111111111111110!G.2``,DGH!0I5_N21O_NN#2E''5"/P MI****************************O:7TF_WQ_*K]%%%%%%%)67<>(+*%V0! MY&4X^4<$_6LY/$ETLK%HD="O;%;4;K(BNIRK#(/J*?111114%E_QZ1_2IZ** M*******HZO;+TOI- M_OC^57Z*****9++'#&9)'"(.I/:L?_A)(?M>PQ,(>A?OGUQZ5:U&_1=+DFMI M48D84ANF:Y*BMSPTB>;,_F#?@+L]O6NBI*Y7Q!G^U6Y_@6KNE:S;16L%M,6# M@[HHHHHJ"R_X](_I4]%%%%%%%%%5=12233YTBQO9,#)Q7)26-U$, MO`V/5>1^E0=#@]:*T-)C1GED9%9D`*YYP<]<5HGKS111111111111111115; M46VZ>P_ONH_F:QZ***U-)&+>9O5U'Z&KM%%%%%%%%%%%%%%%%%%%%%%%%7M+ MZ3?[X_E5^BBBBF-(BLJE@&;[H]:YW6[_`,UPD4LB%25EB/%8U%%%*C-&X=&* ML.A!P16Q8^(9HB$NQYJ?WP/F'^-=!#<17$`FB<,A&=U]6*****@LO^/2/Z5/1111111113)5WQ,OJ#6* M"5/!(/M0X608E1)/]Y0:KOI]H_2-HSZHW]#2V]E#:R"5'D9P".<`'-3T4444 M44444444444452U9L00IZLS?R%9=%%%;&FC;8`_WI&/\A5FBBBBBBBBBBBBB MBBBBBBBBBBBKVE])O]\?RJ_11117-Z_=%=0A\F4B2%>')*YY%:U+1114%E_P`> MD?TJ>BBBBBBBBBDK'N/^/B3C'S5'111111111111111111116;J[9GB3^['G M\S5"BBBMRS4K80<=03^9-2T444444444444444444444445>TOI-_OC^57Z* M*J:EJECI%E)>ZA^A=)B#+'CD=QZUJ4445!9?\>D?T MJ>BBBBBBBBBDK,U!`MQD?Q#)JM3X$\R9$]3S4]Y:^4=Z#Y#V]*JT44444444 M444444445D:FV=0D']T!?R%5:***L6M[):D@?/&>J,>/J/2M*VOHKE3D)"RD M`*7^]^=6"C#J",^W6DHHHHHHHHHHHHHHHHHHHHHHJ]I?2;_>'\JOTA(`R>!7 M.^)O%=AHJ&WGOH+65USNDD"X'L.I-<%?^)O#6HHD=S?/*D M1XUE1GC(#J&&5)YP:>""0H923T&1S52PU&._ABD6*2,RJS889"[6VD$CC.15 ML$$`@@@]PA!R#111111111111111115[2 M^DW^\/Y5?IDF#&V1D;3D>ME2@D#'0>E026E MM,ZO);Q,ZG*OL&X<8Z]>A-9^MKJ5O90KHYB@2$,[DJ,!4&53'8-T)[5IP3)< MV\5Q&RLDJ!U9#D$$=CWI]4]6@NKK2Y[:S:-)9EV;I"0`I^]T[XK+D\/W*B\@ MMYE-O<0Q;?M$A=UEC(VGITP`/7BFW.@WUS%1Z M]33:+<+JL-U:):PQ02Q/& M@RI55SN3IW)/?'M4$>A:BD"QYLPXMIH"V6.2[[AQCH.GXUH:+I]QIT=S',8@ MDDOF1K&<[!M`(Z`=1G@=ZTJ**UM$U-K:5;63F*1N#_=)_I74445!9?\`'I'] M*GHHHHHHHHHHJM?`?96)`R.E9=3V2[KI/;)K5I:RKX@W38[`57HHHHHHHHH` M).`"3[4$$'!!'UHHHHI5.UMW]T$_D*YW.>3WHHHHHHHHHR1T.**?--+.P::1 MI".!N.<4RK%M>RVH*KAD)R4;I^'I6E!?6]P\*P**************LZ<,ZC!_O9_2MBBBBBBBB MBBBBBBBBKVE])O\`?'\JOT5D:]8-FS(SZUN444444444448)X`R3P*[N)2L2*>H4`T^BH++_CTC M^E3T444444444456NX%EB+8^=1P:RZT[*?S8]C'YU]>XJR"&&0"5HI!AE_7WIE%&*7)QC)QZ9I** M************M:9_R$(O;)_0UKT444444444444445>TOI-_OC^57Z*2N.U6 MV-KJ,J;<*QW+]#5.BLK6(=7EN;9],E2-(OG<$#]ZVX#8WHNTL?J!6U%;37+D M6\3R8_NCI6E:^'KF4YN"(4]!RQJ\?#5IMP)9<^N15*;PW=("8I4DQVZ$UC]. M*>8G$*RE?D9BH/N*911116GH%NLVH[G7<(EW#TSVKJZ**@LO^/2/Z5/11111 M11111125EWL'E2[A]U^?H:CMVV7$9S@9YK3B^1VC_A^\OXT72&2W95ZGI[UD M44444444445%0X7D$^F1C-;)!!P:***************O:7TF_WQ_*K]%%A0S^'K07-VD_SKL#8CP7=M$#,F,8;N,5IV^G7= MVF^&$LA_BR`*NV_A^\,R&9$6/<-WSY.*Z2**.%`D2*BCLHQ4E%%85_H1N-05 MX<1Q2#,A`^Z?;ZU%K5OY-A'#"@\F!@-Q.22:PZ***FM+9[NY2!`3CH.YK MKK&PAL(BD(/S'+,W4U:HHJ"R_P"/2/Z5/1111111111115>^"FU;/;D?6LJM M'3Y"T3(6R5/'TJ2YADE>,H1M5LD5GW,9BN&7L3D5%11111111116=JZ_O(7] M4*_D?_KUGT44444456N+&.YN;:X:69'M6+QA'P"2,LO*$2O.L2L62,.-J9&&`&,`'^?-/AT.TAGMI@ M\[M:JHC#OG&!M';/3MT/I6C111116[;2_:+2.7&#C8V/45)1111111111111 M15[2^DW^^/Y5?HHJEJ&FQ:@@#LR,N=K*>GU'>L^W\-*DP:>?S$'\`7&?K6U' M&D2!$4*JC``'`I]%%%%%0W%K#=1>5,@9,YQTYKD-0MTM;^6%#E5/%5J**ZG0 MK!;:U6X89EF7)/H.PK5HHHJ"R_X](_I4]%%%%%%%%%%)5.:6XM3D'S$/=NU5 MI[IYU"G@=P.AJ"IK0D74>/7%:]5;RV,R[EX=?U%9E%%%%%%%%%%5M1A,MH&4 MM8]%%%%%%%%%%%%%%%%%:NE*5M96(.'I_GZUE#P MU.)PK3(8>[#AL?2J\VB77VUH88CY>;"R`XR.M9,L30R%&Z^U,IR M.8W#KU4YK8BD$L8=>A%/K.NK)_,+Q#*GDCN*ID$'!�@X.167? M6'EYF@&8NK*.J?\`UJHUKV%K]GB$LBCS7Y&1]P?XU9=(Y#F2*-SZLHS41LK- MNMNJY[H2"*R;FW>UF,;\]U8=&'K45%%%%%%%%%%%;T&/LD`'3RQ3Z***!R<# MJ>E6&L9U7.`?8'FFK:SMG$1&/7BI1ITI7)90?2G1V$BRJS,I4')Q4U/&GP@<[F/J3526SFCR=NX>J\U!15[2^DW^\/Y5?HH MHHHHHHHHHHHHI,4M%%%%%067_'I']*GHHHHHHHHHHHHJ&X@6>,@\-V/I6<]K M+&K,X`"_K4-7]/E7:8B?FSD#VJ]25CSDM<2$C!W&HZ*********`2IR#S47V M2U,HD,`#*42%8'*,>Q_P`#6&Z-&[(PPRG! M'O2444444$9!`."1P1V]ZY[PUH&J:/?:A/?:N]Y'<2;D0_Q?[9ST/;`KH:T+ MW2)K7RO+#S;UY*KT;TJ6VT"[D=&G0)&3\PW?-BM7[#.>R*.@&>`/2HY+::+E MD./4@Z&K] M%%%%)5>YLQ-ADPK#J?6HTTY`D7_?!_P`:-MU_STB_[X/^-&VZ_P">D7_?!_QHVW7_ M`#TB_P"^#_C1MNO^>D7_`'P?\:-MU_STB_[X/^-&VZ_YZ1?]\'_&C%U_STB_ M[X/^-/@C,,*QDY*CK4E%%%%%%%%%%%%%,D02(R'H1BL>2-HG*.,$?K3H)#%* M''8&M2"7SHE?H>_UJ6J=W9^9F2/ANX]:SJ***************R]5CVW(E`XE M7)^HX-4J*******DMH6N+F.%!EG8"NY'2EHI*38N<[1GUQ2D9&YL27W0@ M`'JO2JPM+@_\LCZ5-!8L^[S04`&!]:>LDEB`DJ[D[,.U7E8,H8=",TM%%%%% M%%%1RP1S##KG'0]Q67/$(9F0$D#D9J.DZU2-O M?::HT44444444444445'/;K=Q>43ALY1O0_X&L-E*L588(."/>DHHHH`)X') M/2MS3M$BN;4FY2:*4$CG@>Q%2OX;C9W,1NI M_P`*NT44444444A`/4`T4M%%%%%%%%%9=^15/^S5_P">I_*IK>V%N&`8MGU%3T4E M4VTY68D2$9/0#I2?V:O_`#U;\J/[-7_GJWY4?V:O_/5ORH_LU?\`GJWY4?V: MO_/5ORH_LU?^>K?E1_9J_P#/5ORH_LU?^>K?E1_9J_\`/5ORH_LU?^>K?E1_ M9J_\]6_*C^S5_P">K?E1_9J_\]6_*C^S5_YZM^5']FK_`,]6_*JMSX>BN)C* M)W0M]X!0K?E1_9J_P#/5ORJW%&8HPA; 6=CH33Z********************__V3\_ ` end