UNITED STATES
SECURITIES AND EXCHANGE COMMISSION
Washington, D.C. 20549
SECURITIES AND EXCHANGE COMMISSION
Washington, D.C. 20549
FORM N-CSR
CERTIFIED SHAREHOLDER REPORT OF REGISTERED
MANAGEMENT INVESTMENT COMPANIES
Investment Company Act file number: 811-10401
Trust for Professional Managers
(Exact name of registrant as specified in charter)
(Exact name of registrant as specified in charter)
615 East Michigan Street
Milwaukee, WI 53202
(Address of principal executive offices) (Zip code)
(Address of principal executive offices) (Zip code)
Jay S. Fitton
U.S. Bancorp Fund Services, LLC
615 East Michigan Street
Milwaukee, WI 53202
(Name and address of agent for service)
(Name and address of agent for service)
(513) 629-8104
Registrant's telephone number, including area code
Date of fiscal year end: November 30, 2020
Date of reporting period: May 31, 2021
Item 1. Reports to Stockholders.
|
(a)
|
|
Semi-Annual Report
Convergence Long/Short Equity Fund
May 31, 2021
Investment Adviser
Convergence Investment Partners, LLC
3801 PGA Boulevard
Suite 1001
Palm Beach Gardens, Florida 33410
Phone: 877-677-9414
Table of Contents
|
LETTER TO SHAREHOLDERS
|
3
|
|
EXPENSE EXAMPLES
|
7
|
|
INVESTMENT HIGHLIGHTS
|
9
|
|
SCHEDULE OF INVESTMENTS
|
11
|
|
SCHEDULE OF SECURITIES SOLD SHORT
|
18
|
|
STATEMENT OF ASSETS AND LIABILITIES
|
26
|
|
STATEMENT OF OPERATIONS
|
27
|
|
STATEMENTS OF CHANGES IN NET ASSETS
|
28
|
|
STATEMENT OF CASH FLOWS
|
29
|
|
FINANCIAL HIGHLIGHTS
|
30
|
|
NOTES TO FINANCIAL STATEMENTS
|
32
|
|
STATEMENT REGARDING LIQUIDITY RULE MANAGEMENT PROGRAM
|
41
|
|
NOTICE OF PRIVACY POLICY & PRACTICES
|
42
|
|
ADDITIONAL INFORMATION
|
43
|
Convergence Investment Partners, LLC (“Convergence”)
2021 Semi-Annual Shareholder Report
Convergence Long/Short Equity Fund (MARNX)
Shareholder Letter (Unaudited)
Dear Shareholder:
We are pleased to provide to you the semi-annual report of the Convergence Long/Short Equity Fund (the “Fund”) for the six-month ended May 31, 2021. We have been managing our Fund, incepted December
29, 2009, for over eleven years. Our Fund employs the Convergence systematic long/short investment approach which seeks to benefit from fundamentally strong companies outperforming their weaker fundamental counterparts. Over the long term, our Fund
strives for strong total returns with the potential for downside risk mitigation through an active short. We manage our Fund with the philosophy that over the long term, strong fundamentals outperform weak fundamentals. Moreover, our Fund utilizes
the Convergence proprietary stock ranking process which analyzes the domestic investment universe and helps to identify, quantify, and rank strong and weak fundamentals.
Our long-term investors know that we utilize numerous factors grouped into factor composites like Traditional Value and Accelerating Sales. We monitor the performance of these composites to learn what
the market is rewarding or punishing. Over the six months ended May 31, 2021, we see that much of the positive spread or differentiation in stocks has been a combination of reasonable valuation, higher levels of leverage and high levels of sales,
earnings and cash flow. Conversely, there was negative contribution from fundamental tilts to companies with strong price momentum, and robust historical earnings and sales growth. As we have stated before, this demonstrates the benefit of the
fundamental factor diversification that we employ at Convergence. While it is unlikely for all fundamental tilts to generate a positive spread in short time periods, we believe these fundamental spreads, based on sound economic principles, can help
produce real wealth for investors over time as they provide complimentary attributes. We remain steadfast to our philosophy that strong fundamentals win in the long run.
Digging a bit deeper into the performance of the past six months ended May 31, 2021, our Fund handsomely outperformed its benchmark, the Russell 3000 Total Return Index (the “Russell 3000 Index”). It
is important to remember that our Fund maintains approximately 40% of capital invested in short positions, while our long-only benchmark maintains 0%. The outperformance of our Fund was consistent throughout the entire six months. After months of
wild speculation, it seems investors repositioned their portfolios more prudently for the coming recovery and economic boom as the world emerged from their COVID induced bubbles. This prudent rebalance from growth to value was spurred by looming
legislation that cooled the tech frenzy, infrastructure deals fueling value names in capital goods, higher interest rates pushing up financials, inflation worries and clogged supply chains pushing up material prices. Additionally, when buying into
these stocks, investors were assessing tangible fundamentals like valuation, earnings momentum, and quality. These are all metrics that we at Convergence expect to outperform over the long term. As we have stated before, periods of inverted
fundamentals (like 2019-2020) are challenging but historically they reverse and “snapback” powerfully, like a rubber band. Given the “snapback” environment of the last six months, we were unsurprised that our Fund had a positive long-short spread
for the period. Over the trailing six months, the long positions handsomely outperformed the Russell 3000 Index while the short positions slightly outperformed the Russell 3000 Index, which is not good for short positions.
3
At Convergence, we understand that our long (short) positions will not outperform (underperform) in every consecutive month, quarter, or year. We do, however, firmly believe that investment decisions
based on a sound and logical philosophy, paired with a long-term approach, can deliver superior results. Buying reasonably valued stocks with strong earnings and sales growth, while shorting unprofitable stocks with wild valuations, has been our
recipe for success at Convergence.
Convergence Long/Short Equity Fund Performance:
The investment objective of the Convergence Long/Short Equity Fund is to seek long-term capital growth. The Fund seeks to realize its investment objective by establishing long and short positions in
equity securities of larger cap domestic companies with medium and large market capitalizations. The Fund will hold long (purchase) securities that Convergence believes will outperform the market, and it will sell short securities expected to
underperform the market. Convergence constructs the portfolio as an actively managed equity strategy that adapts to ever changing market dynamics through a market cycle. The Fund intends to maintain a net long exposure (the market value of long
positions minus the market value of short positions) of approximately 50% to 100% of the fund’s total assets. Under normal market conditions, the long positions may range from 90% to 150% of the fund’s total assets. Its short positions may range from
20% to 70% of total assets. In making investment decisions for the Fund, Convergence utilizes a bottom-up approach that focuses on the individual strengths of the underlying companies and the relative and absolute attractiveness of the companies
within each industry group.
In the six months ended May 31, 2021, the Convergence Long/Short Equity Fund returned 24.18%, versus the Russell 3000 Index at 17.39%.
Average Annual Total Returns (net of fees)
|
Since
|
||||||||
|
Through
|
One
|
One
|
Three
|
Five
|
Ten
|
Inception
|
||
|
May 31, 2021
|
Month
|
Quarter
|
YTD
|
Year
|
Year
|
Year
|
Year
|
Annualized
|
|
Convergence Long/
|
||||||||
|
Short Equity
|
||||||||
|
Institutional
|
||||||||
|
Class (MARNX)
|
2.90%
|
13.23%
|
24.18%
|
30.61%
|
6.79%
|
11.25%
|
10.52%
|
12.16%
|
|
Russell 3000®
|
||||||||
|
Total Return
|
||||||||
|
Index
|
0.46%
|
9.42%
|
17.39%
|
43.91%
|
18.03%
|
17.36%
|
14.21%
|
14.59%
|
Fund inception = 12/29/2009
Performance data quoted represents past performance and does not guarantee future results. The investment return and principal value of an investment will fluctuate so that an
investor’s shares, when redeemed, may be worth more or less than their original cost. Current performance of the Fund may be lower or higher than the performance quoted. Performance data current to the most recent month-end may be obtained by calling
1-877-677-9414.
As of the most recent prospectus dated March 30, 2021, Gross Expense Ratio on the Fund is 2.58%. Net Expense Ratio on the Fund applicable to investors is 2.39%. Excluding Dividends and Interest on Short
Positions, Total Annual Fund Operating Expenses After Fee Waiver and / or Expense Reimbursement are 1.50%. Please see the Financial Highlights in this report for the most recent expense ratio. Pursuant to an
4
operating expense limitation agreement between the Adviser and the Trust, on behalf of the Fund, the Adviser has agreed to waive its management fees and/or reimburse expenses of the Fund to ensure that
Total Annual Fund Operating Expenses (excluding any front-end or contingent deferred loads, Rule 12b-1 plan fees, shareholder servicing plan fees, taxes, leverage expenses (i.e., any expenses incurred in connection with borrowings made by the Fund),
interest (including interest incurred in connection with bank and custody overdrafts), brokerage commissions and other transactional expenses, acquired fund fees and expenses, dividends or interest expenses on short positions, expenses incurred in
connection with any merger or reorganization, or extraordinary expenses such as litigation, (collectively, “Excluded Expenses”) do not exceed 1.50% of the Fund’s average daily net assets, through at least March 30, 2022.
Periods less than 12 months are not annualized.
The Convergence fundamental stock picking methodology is geared toward long holdings with strong cash flow, earnings, profits and other desirable financial characteristics. We strive to achieve these
favorable portfolio statistics while never overpaying in terms of valuation. Our research has shown that over time, companies with these characteristics have rewarded investors, as the portfolio statistics are signs of healthy and growing companies
with competitively strong business models. The Convergence process separately seeks to identify companies with weak or declining fundamentals, and our research has shown this to be effective in sourcing alpha from shorting.
In closing, as we always say, stay fundamental.
Thank you for your support.
|
David J. Abitz, CFA
|
Justin Neuberg, CFA
|
|
President & Chief Investment Officer
|
Co-Portfolio Manager
|
|
Convergence Investment Partners, LLC
|
Convergence Investment Partners, LLC
|
Disclosures
Past performance is not indicative of future results.
This commentary is for informational purposes only and should not be viewed as a recommendation to buy or sell any security. Investors should seek financial advice regarding the appropriateness of
investing in any securities or investment strategies discussed in this documentation and should understand that statements regarding future prospects may not be realized. Investors should note that income from such securities may fluctuate and that
each security’s price or value may rise or fall. Accordingly, investors may receive back less than originally invested. There is no guarantee that the views expressed will come to pass.
Mutual fund investing involves risk. Principal loss is possible. Investments in midcap companies involve additional risks such as limited liquidity and greater volatility than larger
capitalization companies. The Fund regularly makes short sales of securities, which involves unlimited risk including the possibility that losses may exceed the original amount invested. However, a mutual fund investor’s risk is limited to one’s
amount of investment in a mutual fund. The Fund may have a relatively high turnover rate compared to many mutual funds and has the potential to result in increased brokerage transaction costs which may lower the Fund’s returns.
5
Must be preceded or accompanied by a prospectus.
Diversification does not assure a profit nor protect against loss in a declining market.
Quasar Distributors, LLC, distributor.
Alpha – The excess return of an investment relative to the return of a benchmark index is the investment’s alpha.
The Russell 3000 Total Return Index measures the performance of the largest 3000 Total Return U.S. companies representing approximately 98% of the investable U.S. equity market. You cannot invest
directly in an index. The volatility of an index may be materially different from that of the strategy due to varying degrees of diversification and other factors. Index returns do not reflect the deduction of any fees.
6
CONVERGENCE LONG/SHORT EQUITY FUND
Expense Examples
(Unaudited)
As a shareholder of the Fund, you incur two types of costs: (1) transaction costs, and (2) ongoing costs, including management fees and other fund expenses. This Example is intended to help you
understand your ongoing costs (in dollars) of investing in the Fund, and to compare these costs with the ongoing costs of investing in other mutual funds. The Example is based on an investment of $1,000 invested at the beginning of the period and
held for the entire period (12/1/20 – 5/31/21).
Actual Expenses
The first line of the following table provides information about actual account values and actual expenses. In addition, you will be assessed fees for outgoing wire transfers, returned checks and stop
payment orders at prevailing rates charged by U.S. Bancorp Fund Services, LLC, the Fund’s transfer agent. If you request that a redemption be made by wire transfer, currently a $15.00 fee is charged by the Fund’s transfer agent. IRA accounts will be
charged a $15.00 annual maintenance fee. To the extent the Fund invests in shares of exchange-traded funds or other investment companies as part of its investment strategy, you will indirectly bear your proportionate share of any fees and expenses
charged by the underlying funds in which the Fund invests in addition to the expenses of the Fund. Actual expenses of the underlying funds are expected to vary among the various underlying funds. These expenses are not included in the example. The
example includes, but is not limited to, management fees, fund administration and accounting, custody and transfer agent fees. You may use the information in this line, together with the amount you invested, to estimate the expenses that you paid
over the period. Simply divide your account value by $1,000 (for example, an $8,600 account value divided by $1,000 = 8.6), then multiply the result by the number in the first line under the heading titled “Expenses Paid During Period” to estimate
the expenses you paid on your account during this period.
Hypothetical Example for Comparison Purposes
The second line of the following table provides information about hypothetical account values and hypothetical expenses based on the Fund’s actual expense ratios and an assumed rate of return of 5% per
year before expenses, which is not the Fund’s actual return. The hypothetical account values and expenses may not be used to estimate the actual ending account balance or expenses you paid for the period. You may use this information to compare the
ongoing costs of investing in the Fund and other funds. To do so, compare this 5% hypothetical example with the 5% hypothetical examples that appear in the shareholder reports of other funds. Please note that the expenses shown in the table are meant
to highlight your ongoing costs only and do not reflect any transactional costs, such as redemption fees. Therefore, the second line of the table is useful in comparing ongoing costs only, and will not help you determine the relative total costs of
owning different funds.
7
CONVERGENCE LONG/SHORT EQUITY FUND
Expense Examples (Continued)
(Unaudited)
|
Institutional Class
|
|||
|
Beginning
|
Ending
|
Expenses Paid
|
|
|
Account Value
|
Account Value
|
During Period
|
|
|
12/1/20
|
5/31/21
|
12/1/20 – 5/31/21*
|
|
|
Actual**
|
$1,000.00
|
$1,241.80
|
$12.07
|
|
Hypothetical (5% return
|
|||
|
before expenses)***
|
$1,000.00
|
$1,014.16
|
$10.85
|
|
*
|
Expenses are equal to the Fund’s annualized expense ratio of 2.16%, multiplied by the average account value over the period, multiplied by 182/365 (to reflect the one-half year period).
Excluding dividends on short positions, interest and broker expenses, the Fund’s annualized expense ratio would be 1.50%.
|
|
|
**
|
Excluding dividends on short positions, interest and broker expenses, your actual cost of investing in the Fund would be $8.38.
|
|
|
***
|
Excluding dividends on short positions, interest and broker expenses, your hypothetical cost of investing in the Fund would be $7.53.
|
8
CONVERGENCE LONG/SHORT EQUITY FUND
Investment Highlights
(Unaudited)
The investment objective of the Fund is to seek long-term capital growth. The Fund seeks to achieve its investment objective by investing, under normal market conditions, at least 80% of its net assets
(plus any borrowings for investment purposes) in long and short positions in equity securities of domestic companies. The Fund focuses primarily on companies with medium and large market capitalizations, although the Fund may establish long and short
positions in companies of any market capitalization. The Fund generally considers companies with medium and large market capitalizations to be those companies that comprise the upper half of the Russell 3000® Total Return Index. As of December 31, 2020, the market capitalization range of the upper half of the Russell 3000® Total
Return Index was between $2.03 billion and $2,255.97 billion. The Fund will hold long (purchase) securities that the Adviser believes will outperform the market, and will sell short securities expected to underperform the market.
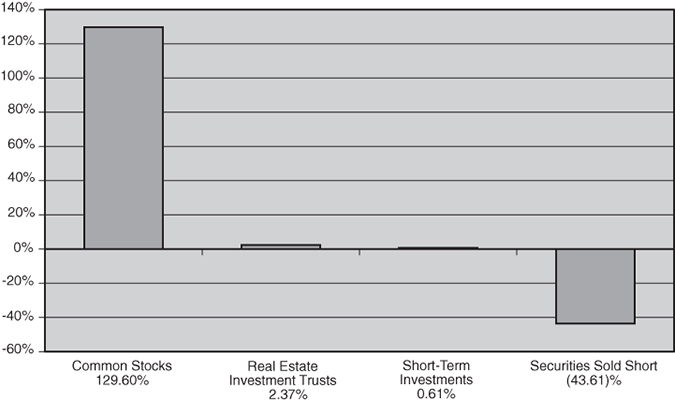
Allocation of Portfolio Holdings
(as a percentage of net assets)
Continued
9
CONVERGENCE LONG/SHORT EQUITY FUND
Investment Highlights (Continued)
(Unaudited)
Average Annual Total Returns as of May 31, 2021
|
Russell 3000®
|
||
|
Institutional
|
Total Return
|
|
|
Class Shares
|
Index
|
|
|
One Year
|
30.61%
|
43.91%
|
|
Three Year
|
6.79%
|
18.03%
|
|
Five Year
|
11.25%
|
17.36%
|
|
Ten Year
|
10.52%
|
14.21%
|
Performance data quoted represents past performance and does not guarantee future results. The investment return and principal value of an investment will fluctuate so that an
investor’s shares, when redeemed, may be worth more or less than their original cost. Current performance of the Fund may be lower or higher than the performance quoted. Performance data current to the most recent month- end may be obtained by
calling 877-677-9414.
Investment performance reflects fee waivers in effect. In the absence of such waivers, total returns would be reduced.
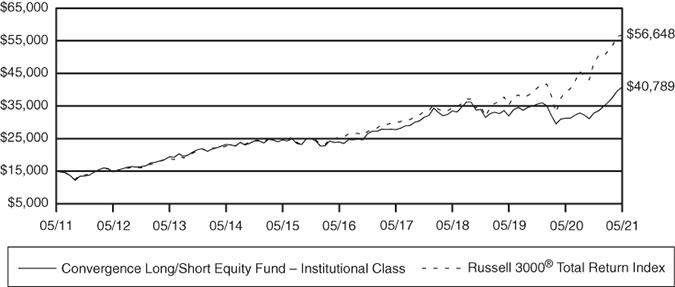
The returns shown assume reinvestment of Fund distributions and do not reflect the deduction of taxes that a shareholder would pay on Fund distributions or the redemption of Fund shares. The following
graph illustrates performance of a hypothetical investment made in the Fund and a broad-based securities index over the last 10 year time period, 5/31/2011 to 5/31/2021, for Institutional Class shares. The graph does not imply any future performance.
The Russell 3000® Total Return Index measures the performance of the largest 3,000 U.S. companies representing
approximately 98% of the investable U.S. equity market.
One cannot invest directly in an index.
Growth of $15,000 Investment
10
CONVERGENCE LONG/SHORT EQUITY FUND
|
Schedule of Investments
|
May 31, 2021 (Unaudited)
|
Shares
|
Value
|
|||||||
|
COMMON STOCKS* – 129.60%
|
||||||||
|
Accommodation – 1.92%
|
||||||||
|
Boyd Gaming Corp. (a)
|
2,922
|
$
|
188,147
|
|||||
|
Red Rock Resorts, Inc. – Class A (a)
|
4,287
|
191,843
|
||||||
|
Travel + Leisure Co.
|
2,951
|
192,258
|
||||||
|
572,248
|
||||||||
|
Administrative and Support Services – 6.15%
|
||||||||
|
ABM Industries, Inc.
|
2,347
|
117,092
|
||||||
|
Accenture PLC – Class A (c)
|
1,514
|
427,191
|
||||||
|
Alliance Data Systems Corp.
|
2,515
|
304,441
|
||||||
|
Baker Hughes Co.
|
8,336
|
203,398
|
||||||
|
MasTec, Inc. (a)
|
1,787
|
207,882
|
||||||
|
Robert Half International, Inc.
|
1,324
|
117,558
|
||||||
|
TTEC Holdings, Inc.
|
4,215
|
456,948
|
||||||
|
1,834,510
|
||||||||
|
Ambulatory Health Care Services – 1.86%
|
||||||||
|
Molina Healthcare, Inc. (a)(b)
|
1,071
|
269,206
|
||||||
|
Select Medical Holdings Corp.
|
7,158
|
286,821
|
||||||
|
556,027
|
||||||||
|
Amusement, Gambling, and Recreation Industries – 0.59%
|
||||||||
|
SeaWorld Entertainment, Inc. (a)
|
3,232
|
175,918
|
||||||
|
Beverage and Tobacco Product Manufacturing – 0.77%
|
||||||||
|
Philip Morris International, Inc.
|
2,393
|
230,757
|
||||||
|
Broadcasting (except Internet) – 1.70%
|
||||||||
|
Comcast Corp. – Class A
|
8,851
|
507,516
|
||||||
|
Building Material and Garden Equipment
|
||||||||
|
and Supplies Dealers – 2.48%
|
||||||||
|
Home Depot, Inc.
|
2,318
|
739,233
|
||||||
|
Chemical Manufacturing – 6.73%
|
||||||||
|
AbbVie, Inc.
|
1,773
|
200,704
|
||||||
|
Alkermes, PLC (a)(c)
|
8,598
|
194,917
|
||||||
|
Johnson & Johnson
|
1,659
|
280,785
|
||||||
|
Moderna, Inc. (a)
|
1,724
|
318,956
|
||||||
|
Mosaic Co.
|
6,184
|
223,490
|
||||||
|
Nu Skin Enterprises, Inc. – Class A
|
2,249
|
135,300
|
||||||
|
Olin Corp.
|
4,499
|
219,956
|
||||||
|
Pfizer, Inc.
|
6,935
|
268,593
|
||||||
The accompanying notes are an integral part of these financial statements.
11
CONVERGENCE LONG/SHORT EQUITY FUND
|
Schedule of Investments (Continued)
|
May 31, 2021 (Unaudited)
|
Shares
|
Value
|
|||||||
|
Chemical Manufacturing – 6.73% (Continued)
|
||||||||
|
Trinseo SA (b)(c)
|
2,542
|
$
|
165,077
|
|||||
|
2,007,778
|
||||||||
|
Clothing and Clothing Accessories Stores – 0.90%
|
||||||||
|
Urban Outfitters, Inc. (a)
|
6,849
|
268,207
|
||||||
|
Computer and Electronic Product Manufacturing – 19.47%
|
||||||||
|
Alphabet, Inc. – Class A (a)
|
283
|
666,989
|
||||||
|
Alphabet, Inc. – Class C (a)
|
281
|
677,648
|
||||||
|
Amkor Technology, Inc.
|
22,724
|
479,476
|
||||||
|
Apple, Inc. (b)
|
2,898
|
361,120
|
||||||
|
Broadcom, Inc.
|
885
|
418,012
|
||||||
|
Bruker Corp.
|
3,921
|
272,274
|
||||||
|
HP, Inc.
|
10,214
|
298,555
|
||||||
|
IDEXX Laboratories, Inc. (a)
|
492
|
274,590
|
||||||
|
Jabil, Inc.
|
3,565
|
201,244
|
||||||
|
NetApp, Inc.
|
3,731
|
288,667
|
||||||
|
PerkinElmer, Inc.
|
1,976
|
286,658
|
||||||
|
QUALCOMM, Inc.
|
2,319
|
311,998
|
||||||
|
Sanmina Corp. (a)
|
7,772
|
327,279
|
||||||
|
Sonos, Inc. (a)
|
4,774
|
176,638
|
||||||
|
Teradata Corp. (a)
|
10,747
|
514,459
|
||||||
|
Waters Corp. (a)
|
775
|
249,744
|
||||||
|
5,805,351
|
||||||||
|
Construction of Buildings – 2.04%
|
||||||||
|
Avantor, Inc. (a)
|
8,087
|
259,997
|
||||||
|
Lennar Corp. – Class A
|
1,817
|
179,901
|
||||||
|
Toll Brothers, Inc.
|
2,588
|
168,841
|
||||||
|
608,739
|
||||||||
|
Couriers and Messengers – 1.25%
|
||||||||
|
FedEx Corp.
|
624
|
196,441
|
||||||
|
United Parcel Service, Inc. – Class B
|
816
|
175,114
|
||||||
|
371,555
|
||||||||
|
Credit Intermediation and Related Activities – 8.91%
|
||||||||
|
Bank of America Corp.
|
4,055
|
171,891
|
||||||
|
Citigroup, Inc.
|
5,474
|
430,858
|
||||||
|
Discover Financial Services
|
2,813
|
329,852
|
||||||
|
First Horizon National Corp.
|
7,439
|
141,862
|
||||||
|
Hilltop Holdings, Inc.
|
4,701
|
174,642
|
||||||
|
JPMorgan Chase & Co.
|
1,735
|
284,956
|
||||||
|
OneMain Holdings, Inc.
|
5,556
|
321,359
|
||||||
The accompanying notes are an integral part of these financial statements.
12
CONVERGENCE LONG/SHORT EQUITY FUND
|
Schedule of Investments (Continued)
|
May 31, 2021 (Unaudited)
|
Shares
|
Value
|
|||||||
|
Credit Intermediation and Related Activities – 8.91% (Continued)
|
||||||||
|
PacWest Bancorp
|
3,204
|
$
|
144,725
|
|||||
|
Synchrony Financial
|
7,917
|
375,345
|
||||||
|
Wells Fargo & Co.
|
6,012
|
280,881
|
||||||
|
2,656,371
|
||||||||
|
Data Processing, Hosting and Related Services – 0.45%
|
||||||||
|
Upwork, Inc. (a)
|
2,868
|
134,997
|
||||||
|
Electrical Equipment, Appliance,
|
||||||||
|
and Component Manufacturing – 0.64%
|
||||||||
|
Whirlpool Corp.
|
807
|
191,332
|
||||||
|
Fabricated Metal Product Manufacturing – 1.99%
|
||||||||
|
Atkore, Inc. (a)
|
2,654
|
204,889
|
||||||
|
Crane Co.
|
2,068
|
197,474
|
||||||
|
Emerson Electric Co.
|
2,006
|
191,954
|
||||||
|
594,317
|
||||||||
|
Food and Beverage Stores – 0.38%
|
||||||||
|
Kroger Co.
|
3,071
|
113,566
|
||||||
|
Food Manufacturing – 1.70%
|
||||||||
|
Medifast, Inc.
|
871
|
289,390
|
||||||
|
Pilgrim’s Pride Corp. (a)
|
9,083
|
218,355
|
||||||
|
507,745
|
||||||||
|
Food Services and Drinking Places – 1.94%
|
||||||||
|
Bloomin’ Brands, Inc. (a)
|
5,296
|
156,497
|
||||||
|
Manhattan Associates, Inc. (a)
|
3,094
|
420,722
|
||||||
|
577,219
|
||||||||
|
Funds, Trusts, and Other Financial Vehicles – 1.09%
|
||||||||
|
Carlyle Group, Inc.
|
7,426
|
324,071
|
||||||
|
General Merchandise Stores – 4.26%
|
||||||||
|
Kohl’s Corp.
|
5,415
|
300,478
|
||||||
|
Macy’s, Inc. (a)
|
16,461
|
300,907
|
||||||
|
Target Corp.
|
1,134
|
257,327
|
||||||
|
Wal-Mart, Inc.
|
2,894
|
411,035
|
||||||
|
1,269,747
|
||||||||
|
Heavy and Civil Engineering Construction – 0.63%
|
||||||||
|
Century Communities, Inc. (a)
|
2,326
|
189,290
|
||||||
The accompanying notes are an integral part of these financial statements.
13
CONVERGENCE LONG/SHORT EQUITY FUND
|
Schedule of Investments (Continued)
|
May 31, 2021 (Unaudited)
|
Shares
|
Value
|
|||||||
|
Hospitals – 2.02%
|
||||||||
|
HCA Healthcare, Inc.
|
1,347
|
$
|
289,322
|
|||||
|
Tenet Healthcare Corp. (a)
|
4,667
|
312,269
|
||||||
|
601,591
|
||||||||
|
Insurance Carriers and Related Activities – 4.18%
|
||||||||
|
Allstate Corp.
|
1,226
|
167,484
|
||||||
|
Arch Capital Group Ltd. (a)(c)
|
3,820
|
152,380
|
||||||
|
Chubb Ltd. (c)
|
1,005
|
170,840
|
||||||
|
Cigna Corp.
|
1,015
|
262,732
|
||||||
|
Old Republican International Corp.
|
6,819
|
179,067
|
||||||
|
Radian Group, Inc.
|
6,616
|
154,484
|
||||||
|
Travelers Companies, Inc.
|
997
|
159,221
|
||||||
|
1,246,208
|
||||||||
|
Leather and Allied Product Manufacturing – 0.62%
|
||||||||
|
Tapestry, Inc. (a)
|
4,088
|
183,510
|
||||||
|
Machinery Manufacturing – 5.43%
|
||||||||
|
AGCO Corp.
|
1,509
|
208,801
|
||||||
|
Applied Materials, Inc.
|
3,050
|
421,297
|
||||||
|
Brunswick Corp.
|
1,750
|
178,903
|
||||||
|
Cummins, Inc.
|
775
|
199,392
|
||||||
|
Deere & Co.
|
574
|
207,271
|
||||||
|
Parker-Hannifin Corp.
|
621
|
191,361
|
||||||
|
Terex Corp.
|
4,056
|
212,413
|
||||||
|
1,619,438
|
||||||||
|
Management of Companies and Enterprises – 1.22%
|
||||||||
|
Capital One Financial Corp.
|
2,269
|
364,810
|
||||||
|
Merchant Wholesalers, Durable Goods – 5.07%
|
||||||||
|
Arrow Electronics, Inc. (a)
|
2,990
|
359,787
|
||||||
|
Avnet, Inc.
|
6,627
|
291,986
|
||||||
|
Beacon Roofing Supply, Inc. (a)
|
3,432
|
194,388
|
||||||
|
Owens & Minor, Inc.
|
6,283
|
280,913
|
||||||
|
Synnex Corp.
|
3,063
|
387,776
|
||||||
|
1,514,850
|
||||||||
|
Merchant Wholesalers, Nondurable Goods – 0.92%
|
||||||||
|
McKesson Corp.
|
1,429
|
274,925
|
||||||
|
Mining (except Oil and Gas) – 1.29%
|
||||||||
|
Freeport-McMoRan, Inc. – Class B
|
4,970
|
212,319
|
||||||
|
Southern Copper Corp.
|
2,488
|
173,513
|
||||||
|
385,832
|
||||||||
The accompanying notes are an integral part of these financial statements.
14
CONVERGENCE LONG/SHORT EQUITY FUND
|
Schedule of Investments (Continued)
|
May 31, 2021 (Unaudited)
|
Shares
|
Value
|
|||||||
|
Miscellaneous Manufacturing – 0.66%
|
||||||||
|
Envista Holdings Corp. (a)
|
4,518
|
$
|
197,166
|
|||||
|
Motor Vehicle and Parts Dealers – 1.02%
|
||||||||
|
AutoNation, Inc. (a)
|
2,977
|
304,041
|
||||||
|
Nonmetallic Mineral Product Manufacturing – 1.42%
|
||||||||
|
Eagle Materials, Inc. (a)
|
1,452
|
213,096
|
||||||
|
Owens Corning
|
1,997
|
212,980
|
||||||
|
426,076
|
||||||||
|
Nonstore Retailers – 2.14%
|
||||||||
|
Amazon.com, Inc. (a)
|
130
|
418,999
|
||||||
|
Overstock.com, Inc. (a)
|
2,571
|
219,641
|
||||||
|
638,640
|
||||||||
|
Oil and Gas Extraction – 2.73%
|
||||||||
|
APA Corp.
|
9,838
|
204,630
|
||||||
|
EOG Resources, Inc.
|
2,531
|
203,341
|
||||||
|
Ovintiv, Inc.
|
7,443
|
198,207
|
||||||
|
PDC Energy, Inc. (a)
|
4,872
|
205,695
|
||||||
|
811,873
|
||||||||
|
Other Information Services – 4.03%
|
||||||||
|
Facebook, Inc. – Class A (a)
|
2,050
|
673,896
|
||||||
|
Pinterest, Inc. – Class A (a)
|
8,089
|
528,212
|
||||||
|
1,202,108
|
||||||||
|
Paper Manufacturing – 0.67%
|
||||||||
|
Boise Cascade Co.
|
3,046
|
201,006
|
||||||
|
Primary Metal Manufacturing – 0.73%
|
||||||||
|
Alcoa Corp. (a)
|
5,517
|
218,859
|
||||||
|
Professional, Scientific, and Technical Services – 5.57%
|
||||||||
|
Digital Turbine, Inc. (a)
|
5,211
|
344,812
|
||||||
|
Gartner, Inc. (a)
|
1,945
|
450,929
|
||||||
|
IQVIA Holdings, Inc. (a)
|
1,287
|
309,086
|
||||||
|
Jacobs Engineering Group, Inc.
|
918
|
130,429
|
||||||
|
VMware, Inc. – Class A (a)(b)
|
2,692
|
425,040
|
||||||
|
1,660,296
|
||||||||
The accompanying notes are an integral part of these financial statements.
15
CONVERGENCE LONG/SHORT EQUITY FUND
|
Schedule of Investments (Continued)
|
May 31, 2021 (Unaudited)
|
Shares
|
Value
|
|||||||
|
Publishing Industries (except Internet) – 5.62%
|
||||||||
|
CommVault Systems, Inc. (a)
|
5,438
|
$
|
414,212
|
|||||
|
Microsoft Corp. (b)
|
1,766
|
440,935
|
||||||
|
Oracle Corp.
|
5,612
|
441,889
|
||||||
|
SPS Commerce, Inc. (a)
|
4,037
|
378,913
|
||||||
|
1,675,949
|
||||||||
|
Real Estate – 0.94%
|
||||||||
|
CBRE Group, Inc. – Class A (a)
|
1,564
|
137,288
|
||||||
|
Jones Lang LaSalle, Inc. (a)
|
710
|
143,598
|
||||||
|
280,886
|
||||||||
|
Rental and Leasing Services – 1.50%
|
||||||||
|
Herc Holdings, Inc. (a)
|
2,034
|
233,950
|
||||||
|
Ryder System, Inc.
|
2,604
|
212,981
|
||||||
|
446,931
|
||||||||
|
Securities, Commodity Contracts, and Other Financial
|
||||||||
|
Investments and Related Activities – 2.39%
|
||||||||
|
Evercore, Inc. – Class A
|
2,510
|
366,109
|
||||||
|
Goldman Sachs Group, Inc.
|
928
|
345,235
|
||||||
|
711,344
|
||||||||
|
Telecommunications – 3.05%
|
||||||||
|
AT&T, Inc.
|
16,899
|
497,338
|
||||||
|
J2 Global, Inc. (a)
|
3,315
|
412,817
|
||||||
|
910,155
|
||||||||
|
Transportation Equipment Manufacturing – 4.24%
|
||||||||
|
Adient PLC (a)(c)
|
5,166
|
258,610
|
||||||
|
General Motors Co. (a)
|
6,782
|
402,240
|
||||||
|
Harley-Davidson, Inc.
|
4,258
|
206,385
|
||||||
|
Oshkosh Corp.
|
1,527
|
200,709
|
||||||
|
Textron, Inc.
|
2,867
|
196,303
|
||||||
|
1,264,247
|
||||||||
|
Truck Transportation – 0.71%
|
||||||||
|
Landstar System, Inc.
|
1,242
|
211,761
|
||||||
|
Utilities – 2.06%
|
||||||||
|
FirstEnergy Corp.
|
4,915
|
186,328
|
||||||
|
MDU Resources Group, Inc.
|
6,853
|
230,671
|
||||||
|
UGI Corp.
|
4,315
|
198,706
|
||||||
|
615,705
|
||||||||
The accompanying notes are an integral part of these financial statements.
16
CONVERGENCE LONG/SHORT EQUITY FUND
|
Schedule of Investments (Continued)
|
May 31, 2021 (Unaudited)
|
Shares
|
Value
|
|||||||
|
Waste Management and Remediation Services – 0.76%
|
||||||||
|
Darling Ingredients, Inc. (a)
|
3,292
|
$
|
225,370
|
|||||
|
Wood Product Manufacturing – 0.76%
|
||||||||
|
Louisiana-Pacific Corp.
|
3,380
|
227,170
|
||||||
|
TOTAL COMMON STOCKS (Cost $30,995,219)
|
38,657,241
|
|||||||
|
REAL ESTATE INVESTMENT TRUSTS – 2.37%
|
||||||||
|
Forestry and Logging – 0.49%
|
||||||||
|
Weyerhaeuser Co.
|
3,873
|
147,019
|
||||||
|
Real Estate – 1.88%
|
||||||||
|
Highwoods Properties, Inc.
|
2,980
|
136,127
|
||||||
|
PotlatchDeltic Corp.
|
2,417
|
145,503
|
||||||
|
Simon Property Group, Inc.
|
1,101
|
141,467
|
||||||
|
VICI Properties, Inc.
|
4,387
|
136,568
|
||||||
|
559,665
|
||||||||
|
TOTAL REAL ESTATE INVESTMENT TRUSTS
|
||||||||
|
(Cost $592,477)
|
706,684
|
|||||||
|
SHORT-TERM INVESTMENTS – 0.61%
|
||||||||
|
First American Government Obligations Fund –
|
||||||||
|
Class X, 0.026% (b)(d)
|
182,471
|
182,471
|
||||||
|
TOTAL SHORT-TERM INVESTMENTS (Cost $182,471)
|
182,471
|
|||||||
|
Total Investments (Cost $31,770,167) – 132.58%
|
39,546,396
|
|||||||
|
Liabilities in Excess of Other Assets – (32.58)%
|
(9,717,995
|
)
|
||||||
|
TOTAL NET ASSETS – 100.00%
|
$
|
29,828,401
|
||||||
Percentages are stated as a percent of net assets.
|
*
|
Unless otherwise noted, all of a portion of these securities, totaling $37,215,028 are pledged as collateral for securities sold short.
|
|
(a)
|
Non-income producing security.
|
|
(b)
|
This security is not pledged as collateral for securities sold short.
|
|
(c)
|
Foreign issued security.
|
|
(d)
|
Seven day yield as of May 31, 2021.
|
Abbreviations:
|
Ltd.
|
Limited Liability Company.
|
|
PLC
|
Public Limited Company.
|
|
SA
|
Generally designates a type of corporation in various countries, mostly those employing a civil law legal system.
|
The accompanying notes are an integral part of these financial statements.
17
CONVERGENCE LONG/SHORT EQUITY FUND
|
Schedule of Securities Sold Short
|
May 31, 2021 (Unaudited)
|
Shares
|
Value
|
|||||||
|
SECURITIES SOLD SHORT – (43.61)%
|
||||||||
|
COMMON STOCKS (41.85)%
|
||||||||
|
Accommodation – (0.15)%
|
||||||||
|
Caesars Entertainment, Inc.
|
(400
|
)
|
$
|
(42,980
|
)
|
|||
|
Administrative and Support Services – (2.02)%
|
||||||||
|
Booking Holdings, Inc.
|
(19
|
)
|
(44,869
|
)
|
||||
|
Cardlytics, Inc.
|
(1,092
|
)
|
(116,353
|
)
|
||||
|
Cloudflare, Inc. – Class A
|
(1,508
|
)
|
(123,746
|
)
|
||||
|
Dun & Bradstreet Holdings, Inc.
|
(1,760
|
)
|
(37,787
|
)
|
||||
|
IHS Markit Ltd. (a)
|
(392
|
)
|
(41,282
|
)
|
||||
|
Live Nation Entertainment, Inc.
|
(1,272
|
)
|
(114,620
|
)
|
||||
|
Pactiv Evergreen, Inc.
|
(2,933
|
)
|
(43,526
|
)
|
||||
|
R1 RCM, Inc.
|
(3,526
|
)
|
(81,627
|
)
|
||||
|
(603,810
|
)
|
|||||||
|
Air Transportation – (0.76)%
|
||||||||
|
CryoPort, Inc.
|
(1,529
|
)
|
(85,502
|
)
|
||||
|
JetBlue Airways Corp.
|
(3,255
|
)
|
(65,426
|
)
|
||||
|
United Continental Holdings, Inc.
|
(1,272
|
)
|
(74,221
|
)
|
||||
|
(225,149
|
)
|
|||||||
|
Ambulatory Health Care Services – (0.81)%
|
||||||||
|
ALX Oncology Holdings, Inc.
|
(776
|
)
|
(43,891
|
)
|
||||
|
Axsome Therapeutics, Inc.
|
(607
|
)
|
(36,851
|
)
|
||||
|
Oak Street Health, Inc.
|
(1,288
|
)
|
(77,782
|
)
|
||||
|
Teladoc Health, Inc.
|
(554
|
)
|
(83,421
|
)
|
||||
|
(241,945
|
)
|
|||||||
|
Apparel Manufacturing – (0.12)%
|
||||||||
|
Lululemon Athletica, Inc.
|
(114
|
)
|
(36,837
|
)
|
||||
|
Beverage and Tobacco Product Manufacturing – (0.50)%
|
||||||||
|
Brown-Forman Corp. – Class B
|
(893
|
)
|
(71,761
|
)
|
||||
|
Primo Water Corp. (a)
|
(4,482
|
)
|
(77,584
|
)
|
||||
|
(149,345
|
)
|
|||||||
|
Broadcasting (except Internet) – (1.36)%
|
||||||||
|
Cable One, Inc.
|
(59
|
)
|
(107,118
|
)
|
||||
|
Liberty Latin America Ltd. – Class C (a)
|
(5,439
|
)
|
(78,213
|
)
|
||||
|
Spotify Technology SA (a)
|
(445
|
)
|
(107,499
|
)
|
||||
|
ViacomCBS, Inc. – Class B
|
(2,693
|
)
|
(114,237
|
)
|
||||
|
(407,067
|
)
|
|||||||
The accompanying notes are an integral part of these financial statements.
18
CONVERGENCE LONG/SHORT EQUITY FUND
|
Schedule of Securities Sold Short (Continued)
|
May 31, 2021 (Unaudited)
|
Shares
|
Value
|
|||||||
|
Chemical Manufacturing – (3.02)%
|
||||||||
|
10X Genomics, Inc. – Class A
|
(407
|
)
|
$
|
(73,260
|
)
|
|||
|
Acceleron Pharma, Inc.
|
(379
|
)
|
(49,607
|
)
|
||||
|
Albemarle Corp.
|
(268
|
)
|
(44,777
|
)
|
||||
|
Amyris, Inc.
|
(3,737
|
)
|
(53,178
|
)
|
||||
|
Arena Pharmaceuticals, Inc.
|
(491
|
)
|
(30,005
|
)
|
||||
|
Bridgebio Pharma, Inc.
|
(1,388
|
)
|
(82,169
|
)
|
||||
|
Church & Dwight Co., Inc.
|
(1,062
|
)
|
(91,045
|
)
|
||||
|
Dicerna Pharmaceuticals, Inc.
|
(1,575
|
)
|
(51,345
|
)
|
||||
|
Ecolab, Inc.
|
(195
|
)
|
(41,941
|
)
|
||||
|
Edgewell Personal Care Co.
|
(2,044
|
)
|
(92,757
|
)
|
||||
|
Global Blood Therapeutics, Inc.
|
(858
|
)
|
(32,973
|
)
|
||||
|
Intra-Cellular Therapies, Inc.
|
(1,544
|
)
|
(60,849
|
)
|
||||
|
Iovance Biotherapeutics, Inc.
|
(1,421
|
)
|
(26,388
|
)
|
||||
|
Karuna Therapeutics, Inc.
|
(368
|
)
|
(41,150
|
)
|
||||
|
Mirati Therapeutics, Inc.
|
(478
|
)
|
(75,596
|
)
|
||||
|
TG Therapeutics, Inc.
|
(772
|
)
|
(26,920
|
)
|
||||
|
Turning Point Therapeutics, Inc.
|
(406
|
)
|
(26,869
|
)
|
||||
|
(900,829
|
)
|
|||||||
|
Clothing and Clothing Accessories Stores – (0.44)%
|
||||||||
|
Nordstrom, Inc.
|
(3,924
|
)
|
(131,611
|
)
|
||||
|
Computer and Electronic Product Manufacturing – (5.08)%
|
||||||||
|
Arista Networks, Inc.
|
(506
|
)
|
(171,726
|
)
|
||||
|
Array Technologies, Inc.
|
(1,724
|
)
|
(28,101
|
)
|
||||
|
Bloom Energy Corp. – Class A
|
(2,632
|
)
|
(63,615
|
)
|
||||
|
Cree, Inc.
|
(1,225
|
)
|
(122,512
|
)
|
||||
|
Enphase Energy, Inc.
|
(864
|
)
|
(123,595
|
)
|
||||
|
Itron, Inc.
|
(1,101
|
)
|
(104,980
|
)
|
||||
|
L3Harris Technologies, Inc.
|
(261
|
)
|
(56,914
|
)
|
||||
|
MaxLinear, Inc.
|
(3,322
|
)
|
(126,303
|
)
|
||||
|
Mercury Systems, Inc.
|
(834
|
)
|
(54,585
|
)
|
||||
|
NVIDIA Corp.
|
(199
|
)
|
(129,307
|
)
|
||||
|
Pure Storage, Inc. – Class A
|
(8,837
|
)
|
(168,345
|
)
|
||||
|
Roper Technologies, Inc.
|
(124
|
)
|
(55,801
|
)
|
||||
|
SolarEdge Technologies, Inc.
|
(477
|
)
|
(123,071
|
)
|
||||
|
Vicor Corp.
|
(659
|
)
|
(59,363
|
)
|
||||
|
Xperi Holding Corp.
|
(5,785
|
)
|
(123,915
|
)
|
||||
|
(1,512,133
|
)
|
|||||||
The accompanying notes are an integral part of these financial statements.
19
CONVERGENCE LONG/SHORT EQUITY FUND
|
Schedule of Securities Sold Short (Continued)
|
May 31, 2021 (Unaudited)
|
Shares
|
Value
|
|||||||
|
Credit Intermediation and Related Activities – (1.66)%
|
||||||||
|
Community Bank System, Inc.
|
(876
|
)
|
$
|
(71,061
|
)
|
|||
|
First Financial Bankshares, Inc.
|
(1,428
|
)
|
(71,900
|
)
|
||||
|
Live Oak Bancshares, Inc.
|
(1,194
|
)
|
(72,333
|
)
|
||||
|
Mr. Cooper Group, Inc.
|
(2,089
|
)
|
(72,259
|
)
|
||||
|
Pacific Premier Bancorp, Inc.
|
(1,560
|
)
|
(71,713
|
)
|
||||
|
PennyMac Financial Services, Inc.
|
(1,083
|
)
|
(67,807
|
)
|
||||
|
Rocket Cos, Inc. – Class A
|
(4,029
|
)
|
(71,353
|
)
|
||||
|
(498,426
|
)
|
|||||||
|
Data Processing Hosting and Related Services – (0.39)%
|
||||||||
|
Zynga, Inc. – Class A
|
(10,791
|
)
|
(116,974
|
)
|
||||
|
Educational Services – (0.12)%
|
||||||||
|
Strategic Education, Inc.
|
(521
|
)
|
(36,908
|
)
|
||||
|
Electrical Equipment, Appliance, and
|
||||||||
|
Component Manufacturing – (0.84)%
|
||||||||
|
Helen of Troy Ltd. (a)
|
(142
|
)
|
(29,888
|
)
|
||||
|
IPG Photonics Corp.
|
(777
|
)
|
(162,595
|
)
|
||||
|
Plug Power, Inc.
|
(1,859
|
)
|
(57,071
|
)
|
||||
|
(249,554
|
)
|
|||||||
|
Fabricated Metal Product Manufacturing – (0.34)%
|
||||||||
|
Axon Enterprise, Inc.
|
(398
|
)
|
(55,955
|
)
|
||||
|
BWX Technologies, Inc.
|
(701
|
)
|
(43,841
|
)
|
||||
|
(99,796
|
)
|
|||||||
|
Food Manufacturing – (0.76)%
|
||||||||
|
Freshpet, Inc.
|
(430
|
)
|
(76,033
|
)
|
||||
|
J&J Snack Foods Corp.
|
(439
|
)
|
(77,080
|
)
|
||||
|
McCormick & Company, Inc.
|
(849
|
)
|
(75,612
|
)
|
||||
|
(228,725
|
)
|
|||||||
|
Food Services and Drinking Places – (0.30)%
|
||||||||
|
Chipotle Mexican Grill, Inc.
|
(29
|
)
|
(39,787
|
)
|
||||
|
Yum China Holdings, Inc.
|
(747
|
)
|
(50,527
|
)
|
||||
|
(90,314
|
)
|
|||||||
|
Funds, Trusts, and Other Financial Vehicles – (0.11)%
|
||||||||
|
Garmin Ltd. (a)
|
(233
|
)
|
(33,142
|
)
|
||||
The accompanying notes are an integral part of these financial statements.
20
CONVERGENCE LONG/SHORT EQUITY FUND
|
Schedule of Securities Sold Short (Continued)
|
May 31, 2021 (Unaudited)
|
Shares
|
Value
|
|||||||
|
Furniture and Home Furnishings Stores – (0.53)%
|
||||||||
|
Floor & Decor Holdings, Inc. – Class A
|
(1,607
|
)
|
$
|
(157,984
|
)
|
|||
|
Furniture and Related Product Manufacturing – (0.11)%
|
||||||||
|
Purple Innovation, Inc.
|
(1,198
|
)
|
(34,167
|
)
|
||||
|
General Merchandise Stores – (0.72)%
|
||||||||
|
Burlington Stores, Inc.
|
(413
|
)
|
(133,552
|
)
|
||||
|
PriceSmart, Inc.
|
(900
|
)
|
(79,470
|
)
|
||||
|
(213,022
|
)
|
|||||||
|
Insurance Carriers and Related Activities – (1.09)%
|
||||||||
|
eHealth, Inc.
|
(695
|
)
|
(45,348
|
)
|
||||
|
Equitable Holdings, Inc.
|
(2,862
|
)
|
(90,869
|
)
|
||||
|
Goosehead Insurance, Inc. – Class A
|
(480
|
)
|
(43,138
|
)
|
||||
|
Kinsale Capital Group, Inc.
|
(283
|
)
|
(47,108
|
)
|
||||
|
Palomar Holdings, Inc.
|
(699
|
)
|
(51,027
|
)
|
||||
|
Selectquote, Inc.
|
(2,241
|
)
|
(45,537
|
)
|
||||
|
(323,027
|
)
|
|||||||
|
Machinery Manufacturing – (0.95)%
|
||||||||
|
II-VI, Inc.
|
(1,535
|
)
|
(103,413
|
)
|
||||
|
Ingersoll Rand, Inc.
|
(1,122
|
)
|
(55,696
|
)
|
||||
|
Range Resources Corp.
|
(5,005
|
)
|
(67,868
|
)
|
||||
|
Xylem, Inc.
|
(468
|
)
|
(55,280
|
)
|
||||
|
(282,257
|
)
|
|||||||
|
Management of Companies and Enterprises – (0.48)%
|
||||||||
|
Cullen/Frost Bankers, Inc.
|
(566
|
)
|
(68,322
|
)
|
||||
|
South State Corp.
|
(829
|
)
|
(73,623
|
)
|
||||
|
(141,945
|
)
|
|||||||
|
Merchant Wholesalers, Durable Goods – (0.81)%
|
||||||||
|
Copart, Inc.
|
(288
|
)
|
(37,155
|
)
|
||||
|
New Relic, Inc.
|
(1,979
|
)
|
(124,044
|
)
|
||||
|
Silk Road Medical, Inc.
|
(1,679
|
)
|
(81,566
|
)
|
||||
|
(242,765
|
)
|
|||||||
|
Merchant Wholesalers, Nondurable Goods – (1.10)%
|
||||||||
|
Allakos, Inc.
|
(498
|
)
|
(50,517
|
)
|
||||
|
GrowGeneration Corp.
|
(3,207
|
)
|
(142,423
|
)
|
||||
|
Univar Solutions, Inc.
|
(2,105
|
)
|
(57,024
|
)
|
||||
|
US Foods Holding Corp.
|
(2,005
|
)
|
(78,075
|
)
|
||||
|
(328,039
|
)
|
|||||||
The accompanying notes are an integral part of these financial statements.
21
CONVERGENCE LONG/SHORT EQUITY FUND
|
Schedule of Securities Sold Short (Continued)
|
May 31, 2021 (Unaudited)
|
Shares
|
Value
|
|||||||
|
Mining (except Oil and Gas) – (0.52)%
|
||||||||
|
Coeur Mining, Inc.
|
(4,770
|
)
|
$
|
(49,608
|
)
|
|||
|
Novagold Resources, Inc. (a)
|
(5,330
|
)
|
(54,686
|
)
|
||||
|
Royal Gold, Inc.
|
(413
|
)
|
(51,117
|
)
|
||||
|
(155,411
|
)
|
|||||||
|
Miscellaneous Manufacturing – (1.06)%
|
||||||||
|
Callaway Golf Co.
|
(881
|
)
|
(32,527
|
)
|
||||
|
DexCom, Inc.
|
(226
|
)
|
(83,482
|
)
|
||||
|
Inari Medical, Inc.
|
(919
|
)
|
(79,907
|
)
|
||||
|
Peloton Interactive, Inc. – Class A
|
(299
|
)
|
(32,982
|
)
|
||||
|
Tandem Diabetes Care, Inc.
|
(1,011
|
)
|
(86,329
|
)
|
||||
|
(315,227
|
)
|
|||||||
|
Miscellaneous Store Retailers – (0.31)%
|
||||||||
|
KKR & Co, Inc.
|
(1,657
|
)
|
(92,278
|
)
|
||||
|
Motion Picture and Sound Recording Industries – (0.43)%
|
||||||||
|
Cinemark Holdings, Inc.
|
(5,687
|
)
|
(128,868
|
)
|
||||
|
Motor Vehicle and Parts Dealers – (0.45)%
|
||||||||
|
Vroom, Inc.
|
(3,044
|
)
|
(134,575
|
)
|
||||
|
Nonstore Retailers – (0.24)%
|
||||||||
|
Etsy, Inc.
|
(434
|
)
|
(71,493
|
)
|
||||
|
Oil and Gas Extraction – (0.39)%
|
||||||||
|
ONE Gas, Inc.
|
(713
|
)
|
(52,990
|
)
|
||||
|
Southwestern Energy Co.
|
(12,412
|
)
|
(64,170
|
)
|
||||
|
(117,160
|
)
|
|||||||
|
Other Information Services – (0.67)%
|
||||||||
|
Chegg, Inc.
|
(490
|
)
|
(37,686
|
)
|
||||
|
CoStar Group, Inc.
|
(49
|
)
|
(41,846
|
)
|
||||
|
Sabre Corp.
|
(8,624
|
)
|
(119,442
|
)
|
||||
|
(198,974
|
)
|
|||||||
|
Performing Arts, Spectator Sports, and Related Industries – (0.39)%
|
||||||||
|
Madison Square Garden Entertainment Corp.
|
(1,304
|
)
|
(116,356
|
)
|
||||
The accompanying notes are an integral part of these financial statements.
22
CONVERGENCE LONG/SHORT EQUITY FUND
|
Schedule of Securities Sold Short (Continued)
|
May 31, 2021 (Unaudited)
|
Shares
|
Value
|
|||||||
|
Professional, Scientific, and Technical Services – (2.50)%
|
||||||||
|
Adaptive Biotechnologies Corp.
|
(1,197
|
)
|
$
|
(45,259
|
)
|
|||
|
Allogene Therapeutics, Inc.
|
(1,316
|
)
|
(33,821
|
)
|
||||
|
Arvinas, Inc.
|
(449
|
)
|
(32,660
|
)
|
||||
|
Axonics, Inc.
|
(1,482
|
)
|
(85,497
|
)
|
||||
|
Biohaven Pharmaceutical Holding Co. Ltd. (a)
|
(703
|
)
|
(61,161
|
)
|
||||
|
Elastic NV (a)
|
(1,021
|
)
|
(120,692
|
)
|
||||
|
Health Catalyst, Inc.
|
(1,469
|
)
|
(78,871
|
)
|
||||
|
Magnite, Inc.
|
(3,940
|
)
|
(117,018
|
)
|
||||
|
Vir Biotechnology, Inc.
|
(1,209
|
)
|
(50,669
|
)
|
||||
|
Zscaler, Inc.
|
(620
|
)
|
(120,404
|
)
|
||||
|
(746,052
|
)
|
|||||||
|
Rental and Leasing Services – (0.37)%
|
||||||||
|
Netflix, Inc.
|
(220
|
)
|
(110,618
|
)
|
||||
|
Publishing Industries (except Internet) – (3.22)%
|
||||||||
|
3D Systems Corp.
|
(4,512
|
)
|
(132,698
|
)
|
||||
|
Bill.com Holdings, Inc.
|
(806
|
)
|
(120,030
|
)
|
||||
|
Cornerstone OnDemand, Inc.
|
(2,926
|
)
|
(128,655
|
)
|
||||
|
Datadog, Inc. – Class A
|
(1,318
|
)
|
(120,004
|
)
|
||||
|
Fastly, Inc. – Class A
|
(2,548
|
)
|
(120,240
|
)
|
||||
|
Medallia, Inc.
|
(4,649
|
)
|
(119,340
|
)
|
||||
|
MongoDB, Inc.
|
(418
|
)
|
(122,031
|
)
|
||||
|
Okta, Inc. – Class A
|
(438
|
)
|
(97,429
|
)
|
||||
|
(960,427
|
)
|
|||||||
|
Securities, Commodity Contracts, and Other Financial
|
||||||||
|
Investments and Related Activities – (1.65)%
|
||||||||
|
Apollo Global Management, Inc.
|
(1,618
|
)
|
(92,776
|
)
|
||||
|
Ares Management Corp. – Class A
|
(1,722
|
)
|
(95,020
|
)
|
||||
|
Charles Schwab Corp.
|
(1,345
|
)
|
(99,328
|
)
|
||||
|
Morgan Stanley
|
(1,121
|
)
|
(101,955
|
)
|
||||
|
Trupanion, Inc.
|
(518
|
)
|
(46,708
|
)
|
||||
|
WillScot Mobile Mini Holdings Corp.
|
(1,915
|
)
|
(55,535
|
)
|
||||
|
(491,322
|
)
|
|||||||
|
Support Activities for Mining – (0.89)%
|
||||||||
|
ConocoPhillips
|
(1,238
|
)
|
(69,006
|
)
|
||||
|
Hecla Mining Co.
|
(5,981
|
)
|
(53,829
|
)
|
||||
|
Helmerich & Payne, Inc.
|
(2,440
|
)
|
(68,930
|
)
|
||||
|
Liberty Oilfield Services, Inc. – Class A
|
(4,977
|
)
|
(74,456
|
)
|
||||
|
(266,221
|
)
|
|||||||
The accompanying notes are an integral part of these financial statements.
23
CONVERGENCE LONG/SHORT EQUITY FUND
|
Schedule of Securities Sold Short (Continued)
|
May 31, 2021 (Unaudited)
|
Shares
|
Value
|
|||||||
|
Telecommunications – (1.39)%
|
||||||||
|
Bandwidth, Inc.
|
(758
|
)
|
$
|
(89,664
|
)
|
|||
|
Shenandoah Telecommunications Co.
|
(1,639
|
)
|
(81,770
|
)
|
||||
|
Twilio, Inc. – Class A
|
(362
|
)
|
(121,632
|
)
|
||||
|
Zoom Video Communications, Inc. – Class A
|
(369
|
)
|
(122,334
|
)
|
||||
|
(415,400
|
)
|
|||||||
|
Transit and Ground Passenger Transportation – (0.25)%
|
||||||||
|
Lyft, Inc. – Class A
|
(1,319
|
)
|
(75,302
|
)
|
||||
|
Transportation Equipment Manufacturing – (1.11)%
|
||||||||
|
Aptiv PLC (a)
|
(496
|
)
|
(74,608
|
)
|
||||
|
Boeing Co.
|
(197
|
)
|
(48,663
|
)
|
||||
|
BorgWarner, Inc.
|
(1,533
|
)
|
(78,628
|
)
|
||||
|
Raytheon Technologies Corp.
|
(557
|
)
|
(49,411
|
)
|
||||
|
Visteon Corp.
|
(638
|
)
|
(78,129
|
)
|
||||
|
(329,439
|
)
|
|||||||
|
Utilities – (0.90)%
|
||||||||
|
Ameren Corp.
|
(637
|
)
|
(53,635
|
)
|
||||
|
Brookfield Renewable Corp. – Class A (a)
|
(1,225
|
)
|
(52,332
|
)
|
||||
|
Essential Utilities, Inc.
|
(1,136
|
)
|
(54,301
|
)
|
||||
|
PG&E Corp.
|
(5,325
|
)
|
(53,995
|
)
|
||||
|
Sunnova Energy International, Inc.
|
(1,848
|
)
|
(53,962
|
)
|
||||
|
(268,225
|
)
|
|||||||
|
Water Transportation – (0.39)%
|
||||||||
|
Kirby Corp.
|
(1,080
|
)
|
(70,556
|
)
|
||||
|
Royal Caribbean Cruises Ltd. (a)
|
(494
|
)
|
(46,074
|
)
|
||||
|
(116,630
|
)
|
|||||||
|
Wood Product Manufacturing – (0.15)%
|
||||||||
|
Trex Company, Inc.
|
(463
|
)
|
(45,101
|
)
|
||||
|
TOTAL COMMON STOCKS (Proceeds $12,425,602)
|
(12,483,830
|
)
|
||||||
|
REAL ESTATE INVESTMENT TRUSTS (1.76)%
|
||||||||
|
Accommodation – (0.12)%
|
||||||||
|
Park Hotels & Resorts, Inc.
|
(1,679
|
)
|
(34,906
|
)
|
||||
|
Credit Intermediation and Related Activities – (0.31)%
|
||||||||
|
Hannon Armstrong Sustainable Infrastructure Capital, Inc.
|
(1,865
|
)
|
(91,777
|
)
|
||||
The accompanying notes are an integral part of these financial statements.
24
CONVERGENCE LONG/SHORT EQUITY FUND
|
Schedule of Securities Sold Short (Continued)
|
May 31, 2021 (Unaudited)
|
Shares
|
Value
|
|||||||
|
Data Processing, Hosting and Related Services – (0.13)%
|
||||||||
|
CyrusOne, Inc.
|
(544
|
)
|
$
|
(40,120
|
)
|
|||
|
Real Estate – (1.07)%
|
||||||||
|
Crown Castle International Corp.
|
(216
|
)
|
(40,932
|
)
|
||||
|
Equinix, Inc.
|
(53
|
)
|
(39,046
|
)
|
||||
|
Healthpeak Properties, Inc.
|
(1,117
|
)
|
(37,285
|
)
|
||||
|
PS Business Parks, Inc.
|
(275
|
)
|
(42,615
|
)
|
||||
|
Rexford Industrial Realty, Inc.
|
(681
|
)
|
(37,612
|
)
|
||||
|
Ryman Hospitality Properties, Inc.
|
(519
|
)
|
(38,878
|
)
|
||||
|
Sun Communities, Inc.
|
(257
|
)
|
(43,027
|
)
|
||||
|
UDR, Inc.
|
(826
|
)
|
(39,342
|
)
|
||||
|
(318,737
|
)
|
|||||||
|
Securities, Commodity Contracts, and Other Financial
|
||||||||
|
Investments and Related Activities – (0.13)%
|
||||||||
|
Americold Realty Trust
|
(1,019
|
)
|
(38,742
|
)
|
||||
|
TOTAL REAL ESTATE INVESTMENT TRUSTS
|
||||||||
|
(Proceeds $510,764)
|
(524,282
|
)
|
||||||
|
Total Securities Sold Short (Proceeds $12,936,366)
|
$
|
(13,008,112
|
)
|
|||||
|
(a)
|
Foreign issued security.
|
Abbreviations:
|
Ltd.
|
Limited Liability Company.
|
|
NV
|
Naamloze vennootschap is a Dutch term for publicly traded companies.
|
|
PLC
|
Public Limited Company.
|
|
SA
|
Generally designates a type of corporation in various countries, mostly those employing a civil law legal system.
|
The accompanying notes are an integral part of these financial statements.
25
CONVERGENCE LONG/SHORT EQUITY FUND
|
Statement of Assets and Liabilities
|
May 31, 2021 (Unaudited)
|
Assets
|
||||
|
Investments, at value (cost $31,770,167)
|
$
|
39,546,396
|
||
|
Receivable for investments sold
|
7,062,289
|
|||
|
Deposit for short sales at broker
|
3,426,213
|
|||
|
Dividends and interest receivable
|
34,982
|
|||
|
Other assets
|
18,768
|
|||
|
Total Assets
|
50,088,648
|
|||
|
Liabilities
|
||||
|
Securities sold short, at value (proceeds $12,936,366)
|
13,008,112
|
|||
|
Payable for Fund shares redeemed
|
17
|
|||
|
Payable for investments purchased
|
7,166,543
|
|||
|
Dividends payable on short positions
|
6,309
|
|||
|
Payable to broker for interest expense
|
2,275
|
|||
|
Payable to Adviser
|
14,378
|
|||
|
Payable to affiliates
|
48,698
|
|||
|
Accrued expenses and other liabilities
|
13,915
|
|||
|
Total Liabilities
|
20,260,247
|
|||
|
Net Assets
|
$
|
29,828,401
|
||
|
Net Assets Consist Of:
|
||||
|
Paid-in capital
|
16,461,268
|
|||
|
Total Distributable Earnings
|
13,367,133
|
|||
|
Net Assets
|
$
|
29,828,401
|
||
|
Institutional Class Shares
|
||||
|
Net Assets
|
$
|
29,828,401
|
||
|
Shares of beneficial interest outstanding (unlimited number of
|
||||
|
shares authorized, $0.001 par value)
|
1,716,847
|
|||
|
Net asset value, redemption price and offering price per share
|
$
|
17.37
|
||
The accompanying notes are an integral part of these financial statements.
26
CONVERGENCE LONG/SHORT EQUITY FUND
|
Statement of Operations
|
For the Six Months Ended May 31, 2021 (Unaudited)
|
Investment Income
|
||||
|
Dividend income
|
$
|
242,150
|
||
|
Interest income
|
40
|
|||
|
Total Investment Income
|
242,190
|
|||
|
Expenses
|
||||
|
Management fees
|
132,044
|
|||
|
Administration fees
|
56,339
|
|||
|
Interest and broker expenses
|
46,554
|
|||
|
Dividends on short positions
|
40,830
|
|||
|
Transfer agent fees and expenses
|
20,074
|
|||
|
Federal and state registration fees
|
11,324
|
|||
|
Legal fees
|
10,390
|
|||
|
Audit and tax fees
|
9,818
|
|||
|
Custody fees
|
9,332
|
|||
|
Chief Compliance Officer fees
|
6,370
|
|||
|
Trustees’ fees
|
5,728
|
|||
|
Fund accounting fees
|
4,808
|
|||
|
Reports to shareholders
|
2,988
|
|||
|
Insurance fees
|
642
|
|||
|
Other expenses
|
1,958
|
|||
|
Total Expenses
|
359,199
|
|||
|
Expense reimbursement due from Adviser (Note 4)
|
(73,429
|
)
|
||
|
Net Expenses
|
285,770
|
|||
|
Net Investment Loss
|
(43,580
|
)
|
||
|
Realized and Unrealized Gain (Loss) on Investments
|
||||
|
Net realized gain (loss) from:
|
||||
|
Investments
|
7,703,628
|
|||
|
Short transactions
|
(1,640,538
|
)
|
||
|
Change in net unrealized appreciation (depreciation) on:
|
||||
|
Investments
|
15,798
|
|||
|
Short transactions
|
(275,470
|
)
|
||
|
Realized and Unrealized Gain on Investments
|
5,803,418
|
|||
|
Net Increase in Net Assets from Operations
|
$
|
5,759,838
|
||
The accompanying notes are an integral part of these financial statements.
27
CONVERGENCE LONG/SHORT EQUITY FUND
|
Statements of Changes in Net Assets
|
|
Six Months Ended
|
Year Ended
|
|||||||
|
May 31, 2021
|
November 30,
|
|||||||
|
(Unaudited)
|
2020
|
|||||||
|
From Operations
|
||||||||
|
Net investment income (loss)
|
$
|
(43,580
|
)
|
$
|
20,920
|
|||
|
Net realized gain (loss) from:
|
||||||||
|
Investments
|
7,703,628
|
5,918,578
|
||||||
|
Short transactions
|
(1,640,538
|
)
|
(4,756,954
|
)
|
||||
|
Change in net unrealized
|
||||||||
|
appreciation (depreciation) on:
|
||||||||
|
Investments
|
15,798
|
(6,139,469
|
)
|
|||||
|
Short transactions
|
(275,470
|
)
|
26,610
|
|||||
|
Net increase (decrease) in
|
||||||||
|
net assets from operations
|
5,759,838
|
(4,930,315
|
)
|
|||||
|
From Distributions
|
||||||||
|
Net dividend and distributions
|
(62,000
|
)
|
(15,480,309
|
)
|
||||
|
Net decrease in net assets resulting
|
||||||||
|
from distributions paid
|
(62,000
|
)
|
(15,480,309
|
)
|
||||
|
From Capital Share Transactions
|
||||||||
|
Proceeds from shares sold – Institutional Class
|
9,222,249
|
2,181,815
|
||||||
|
Net asset value of shares issued in
|
||||||||
|
reinvestment of distributions to shareholders –
|
||||||||
|
Institutional Class
|
28,272
|
10,315,411
|
||||||
|
Payments for shares redeemed –
|
||||||||
|
Institutional Class
|
(7,656,820
|
)
|
(37,290,525
|
)
|
||||
|
Net decrease in net assets from capital
|
||||||||
|
share transactions
|
1,593,701
|
(24,793,299
|
)
|
|||||
|
Total Increase (Decrease) In Net Assets
|
7,291,539
|
(45,203,923
|
)
|
|||||
|
Net Assets
|
||||||||
|
Beginning of period
|
22,536,862
|
67,740,785
|
||||||
|
End of period
|
$
|
29,828,401
|
$
|
22,536,862
|
||||
The accompanying notes are an integral part of these financial statements.
28
CONVERGENCE LONG/SHORT EQUITY FUND
|
Statement of Cash Flows
|
For the Six Months Ended May 31, 2021 (Unaudited)
|
CASH FLOWS FROM OPERATING ACTIVITIES:
|
||||
|
Net increase (decrease) in net assets resulting from operations
|
$
|
5,759,838
|
||
|
Adjustments to reconcile net increase in net assets from
|
||||
|
operations to net cash used in operating activities:
|
||||
|
Purchases of investments
|
(61,667,240
|
)
|
||
|
Purchases of short-term investments, net
|
(65,193
|
)
|
||
|
Proceeds from sales of long-term investments
|
62,549,049
|
|||
|
Return of capital distributions received from underlying investments
|
6,975
|
|||
|
Increase in dividends and interest receivable
|
(2,239
|
)
|
||
|
Increase in receivable for investment securities sold
|
(7,062,289
|
)
|
||
|
Increase in other assets
|
(5,655
|
)
|
||
|
Proceeds from securities sold short
|
26,977,933
|
|||
|
Purchases to cover securities sold short
|
(26,274,733
|
)
|
||
|
Increase in payable for investment securities purchased
|
7,166,543
|
|||
|
Decrease in dividends payable on short positions
|
(558
|
)
|
||
|
Decrease in payable to broker for interest expense
|
(339
|
)
|
||
|
Increase in payable to Adviser
|
5,322
|
|||
|
Increase in accrued expenses and other liabilities
|
6,804
|
|||
|
Unrealized depreciation on investments
|
(15,798
|
)
|
||
|
Unrealized appreciation on short transactions
|
275,470
|
|||
|
Net realized loss on investments
|
(7,703,628
|
)
|
||
|
Net realized loss on short transactions
|
1,640,538
|
|||
|
Net cash provided in operating activities
|
1,590,800
|
|||
|
CASH FLOWS FROM FINANCING ACTIVITIES:
|
||||
|
Proceeds from shares sold
|
9,223,289
|
|||
|
Payment on shares redeemed
|
(7,857,405
|
)
|
||
|
Cash distributions paid to shareholders
|
(33,728
|
)
|
||
|
Net cash used by financing activities
|
1,332,156
|
|||
|
Net change in cash
|
$
|
2,922,956
|
||
|
CASH:
|
||||
|
Beginning Balance
|
503,257
|
|||
|
Ending Balance
|
$
|
3,426,213
|
||
|
SUPPLEMENTAL DISCLOSURES:
|
||||
|
Cash paid for interest
|
46,893
|
|||
|
Non-cash financing activities – distributions reinvested
|
28,272
|
|||
|
Non-cash financing activities – (increase)/decrease in
|
||||
|
receivable for Fund shares sold
|
(1,040
|
)
|
||
|
Non-cash financing activities – decrease in payable for Fund shares redeemed
|
200,585
|
|||
|
RECONCILIATION OF RESTRICTED AND UNRESTRICTED CASH AT THE
|
||||
|
BEGINNING OF YEAR TO THE STATEMENT OF ASSETS AND LIABILITIES
|
||||
|
Cash
|
—
|
|||
|
Deposit with brokers short sale proceeds
|
503,257
|
|||
|
RECONCILIATION OF RESTRICTED AND UNRESTRICTED CASH AT THE
|
||||
|
END OF YEAR TO THE STATEMENT OF ASSETS AND LIABILITIES
|
||||
|
Cash
|
—
|
|||
|
Deposit with brokers short sale proceeds
|
3,426,213
|
|||
The accompanying notes are an integral part of these financial statements.
29
CONVERGENCE LONG/SHORT EQUITY FUND
|
Financial Highlights – Institutional Class
|
|
Six Months Ended
|
||||
|
May 31, 2021
|
||||
|
(Unaudited)
|
||||
|
Net Asset Value, Beginning of Period
|
$
|
14.03
|
||
|
Income from investment operations:
|
||||
|
Net investment income (loss)(1)
|
(0.03
|
)
|
||
|
Net realized and unrealized gain on investments
|
3.41
|
|||
|
Total from Investment Operations
|
3.38
|
|||
|
Less distributions paid:
|
||||
|
From net investment income
|
(0.04
|
)
|
||
|
From net realized gains
|
—
|
|||
|
Total distributions paid
|
(0.04
|
)
|
||
|
Net Asset Value, End of Period
|
$
|
17.37
|
||
|
Total Return(2)
|
24.18
|
%
|
||
|
Supplemental Data and Ratios:
|
||||
|
Net assets at end of period (000’s)
|
$
|
29,828
|
||
|
Ratio of expenses to average net assets:
|
||||
|
Before waiver and expense reimbursement(3)
|
2.72
|
%
|
||
|
After waiver and expense reimbursement(3)
|
2.16
|
%
|
||
|
Ratio of net investment income to average net assets:
|
||||
|
Before waiver and expense reimbursement
|
(0.89
|
)%
|
||
|
After waiver and expense reimbursement
|
(0.33
|
)%
|
||
|
Portfolio turnover rate
|
176.88
|
%
|
||
|
(1)
|
Per share net investment income was calculated using the daily average shares outstanding method.
|
|
(2)
|
Total return in the table represents the rate that the investor would have earned or lost on an investment in the Fund, assuming reinvestment of dividends.
|
|
(3)
|
The ratio of expenses to average net assets includes dividends on short positions, interest and broker expenses. The annualized before waiver and expense reimbursement and after waiver and
expense reimbursement ratios excluding dividends on short positions, interest and broker expenses were 2.16% and 1.50%, 1.69% and 1.50%, 1.32% and 1.32%, 1.27% and 1.27%, 1.28% and 1.28%, 1.31% and 1.31% for the periods ended May 31, 2021,
November 30, 2020, November 30, 2019, November 30, 2018, November 30, 2017, November 30, 2016, respectively.
|
The accompanying notes are an integral part of these financial statements.
30
Per Share Data for a Share Outstanding Throughout Each Period
|
Year Ended November 30,
|
||||||||||||||||||
|
2020
|
2019
|
2018
|
2017
|
2016
|
||||||||||||||
|
$
|
19.76
|
$
|
19.83
|
$
|
21.03
|
$
|
18.47
|
$
|
18.63
|
|||||||||
|
0.01
|
0.14
|
0.01
|
0.04
|
0.11
|
||||||||||||||
|
(1.11
|
)
|
0.65
|
1.47
|
3.32
|
0.93
|
|||||||||||||
|
(1.10
|
)
|
0.79
|
1.48
|
3.36
|
1.04
|
|||||||||||||
|
(0.13
|
)
|
(0.07
|
)
|
(0.04
|
)
|
(0.18
|
)
|
(0.07
|
)
|
|||||||||
|
(4.50
|
)
|
(0.79
|
)
|
(2.64
|
)
|
(0.62
|
)
|
(1.13
|
)
|
|||||||||
|
(4.63
|
)
|
(0.86
|
)
|
(2.68
|
)
|
(0.80
|
)
|
(1.20
|
)
|
|||||||||
|
$
|
14.03
|
19.76
|
$
|
19.83
|
$
|
21.03
|
$
|
18.47
|
||||||||||
|
-7.68
|
%
|
4.72
|
%
|
7.69
|
%
|
18.81
|
%
|
6.04
|
%
|
|||||||||
|
$
|
22,537
|
$
|
67,741
|
$
|
112,861
|
$
|
128,565
|
$
|
125,815
|
|||||||||
|
2.58
|
%
|
2.18
|
%
|
2.20
|
%
|
2.11
|
%
|
2.21
|
%
|
|||||||||
|
2.39
|
%
|
2.18
|
%
|
2.20
|
%
|
2.11
|
%
|
2.21
|
%
|
|||||||||
|
(0.13
|
)%
|
0.76
|
%
|
0.03
|
%
|
0.20
|
%
|
0.65
|
%
|
|||||||||
|
0.06
|
%
|
0.76
|
%
|
0.03
|
%
|
0.20
|
%
|
0.65
|
%
|
|||||||||
|
251.72
|
%
|
239.08
|
%
|
193.55
|
%
|
214.61
|
%
|
260.81
|
%
|
|||||||||
The accompanying notes are an integral part of these financial statements.
31
CONVERGENCE LONG/SHORT EQUITY FUND
Notes to Financial Statements
May 31, 2021 (Unaudited)
|
(1)
|
Organization
|
|
Trust for Professional Managers (the “Trust”) was organized as a Delaware statutory trust under a Declaration of Trust dated May 29, 2001. The Trust is registered under the Investment Company
Act of 1940, as amended (the “1940 Act”), as an open-end management investment company. The Convergence Long/Short Equity Fund (the “Fund”) (formerly known as the Convergence Core Plus Fund) represents a distinct diversified series with its
own investment objectives and policies within the Trust. The investment objective of the Fund is to seek long-term capital growth. The Trust may issue an unlimited number of shares of beneficial interest at $0.001 par value. The Fund became
effective on December 29, 2009 and commenced operations on December 29, 2009 for Institutional Class shares. Costs incurred by the Fund in connection with the organization, registration and the initial public offering of shares were paid by
Convergence Investment Partners, LLC (the “Adviser”), the Fund’s investment adviser.
|
|
|
The Fund is an investment company and accordingly follows the investment company accounting and reporting guidance of the Financial Accounting Standards Board (“FASB”) Accounting Standard
Codification Topic 946 “Financial Services–Investment Companies.”
|
|
|
(2)
|
Significant Accounting Policies
|
|
The following is a summary of significant accounting policies consistently followed by the Fund in the preparation of the financial statements. These policies are in conformity with generally
accepted accounting principles in the United States of America (“GAAP”).
|
|
|
(a) Investment Valuation
|
|
|
Each security owned by the Fund, including long and short positions of common stock and real estate investment trusts, that is listed on a securities exchange, except those listed on the NASDAQ
Stock Market LLC (“NASDAQ”), is valued at its last sale price on that exchange on the date as of which assets are valued. When the security is listed on more than one exchange, the Fund will use the price of the exchange that the Fund
generally consider to be the principal exchange on which the stock is traded.
|
|
|
Fund securities listed on NASDAQ will be valued at the NASDAQ Official Closing Price, which may not necessarily represent the last sale price. If there has been no sale on such exchange or on
NASDAQ on such day, the security shall be valued at, (i) the mean between the most recent quoted bid and asked prices at the close of the exchange on such day or (ii) the last sales price on the Composite Market for the day such security is
being valued. “Composite Market” means a consolidation of the trade information provided by national securities and foreign exchanges and over-the-counter markets, as published by an approved independent pricing service (“Pricing Service”).
|
|
|
Debt securities, including short-term debt instruments having a maturity of 60 days or less, are valued at the mean in accordance with prices supplied by a Pricing Service. Pricing Services may
use various valuation methodologies such as the mean between the bid and the asked prices, matrix pricing and other analytical pricing models as well as market transactions and dealer quotations. If a price is not available from a Pricing
Service, the most recent quotation obtained from one or more
|
32
CONVERGENCE LONG/SHORT EQUITY FUND
Notes to Financial Statements (Continued)
May 31, 2021 (Unaudited)
|
broker-dealers known to follow the issue will be obtained. Quotations will be valued at the mean between the bid and the offer. In the absence of available quotations, the securities will be
priced at fair value, as described below. Any discount or premium is accreted or amortized using the constant yield method until maturity.
|
|
|
Redeemable securities issued by open-end, registered investment companies are valued at the net asset value (“NAV”) of such companies for purchase and/or redemption orders placed on that day.
If, on a particular day, a share of an investment company is not listed on NASDAQ, such security’s fair value will be determined as described below. Money market mutual funds are valued at cost. If cost does not represent current market value
the securities will be priced at fair value.
|
|
|
When market quotations are not readily available, any security or other asset is valued at its fair value as determined under procedures approved by the Trust’s Board of Trustees. These fair
value procedures will also be used to price a security when corporate events, events in the securities market or world events cause the Adviser to believe that a security’s last sale price may not reflect its actual fair market value. The
intended effect of using fair value pricing procedures is to ensure that the Fund is accurately priced.
|
|
|
FASB Accounting Standards Codification, “Fair Value Measurements and Disclosures” Topic 820 (“ASC 820”), establishes an authoritative definition of fair value and sets out a hierarchy for
measuring fair value. ASC 820 requires an entity to evaluate certain factors to determine whether there has been a significant decrease in volume and level of activity for the security such that recent transactions and quoted prices may not
be determinative of fair value and further analysis and adjustment may be necessary to estimate fair value. ASC 820 also requires enhanced disclosures regarding the inputs and valuation techniques used to measure fair value in those
instances as well as expanded disclosure of valuation levels for each class of investments. These inputs are summarized in the three broad levels listed below:
|
|
Level 1—
|
Quoted prices in active markets for identical securities.
|
|
|
Level 2—
|
Other significant observable inputs (including quoted prices for similar securities, interest rates, prepayment speeds, credit risk, etc.).
|
|
|
Level 3—
|
Significant unobservable inputs (including a Fund’s own assumptions in determining the fair value of investments).
|
33
CONVERGENCE LONG/SHORT EQUITY FUND
Notes to Financial Statements (Continued)
May 31, 2021 (Unaudited)
|
The inputs or methodology used for valuing securities are not necessarily an indication of the risk associated with investing in those securities. The following is a summary of the inputs used
to value the Fund’s investments carried at fair value as of May 31, 2021:
|
|
Level 1
|
Level 2
|
Level 3
|
Total
|
||||||||||||||
|
Assets(1):
|
|||||||||||||||||
|
Common Stock
|
$
|
38,657,241
|
$
|
—
|
$
|
—
|
$
|
38,657,241
|
|||||||||
|
Real Estate Investment Trusts
|
706,684
|
—
|
—
|
706,684
|
|||||||||||||
|
Short-Term Investments
|
182,471
|
—
|
—
|
182,471
|
|||||||||||||
|
Total Assets
|
$
|
39,546,396
|
$
|
—
|
$
|
—
|
$
|
39,546,396
|
|||||||||
|
Liabilities:
|
|||||||||||||||||
|
Securities Sold Short
|
|||||||||||||||||
|
Common Stocks
|
$
|
(12,483,830
|
)
|
$
|
—
|
$
|
—
|
$
|
(12,483,830
|
)
|
|||||||
|
Real Estate Investment Trusts
|
(524,282
|
)
|
—
|
—
|
(524,282
|
)
|
|||||||||||
|
Total Securities Sold Short
|
$
|
(13,008,112
|
)
|
$
|
—
|
$
|
—
|
$
|
(13,008,112
|
)
|
|||||||
|
Total Liabilities
|
$
|
(13,008,112
|
)
|
$
|
—
|
$
|
—
|
$
|
(13,008,112
|
)
|
|||||||
|
(1) See the Schedule of Investments for industry classifications.
|
|
|
The Fund measures Level 3 activity as of the end of the period. For the six months ended May 31, 2021, the Fund did not have any significant unobservable inputs (Level 3 securities) used in
determining fair value. Therefore, a reconciliation of assets in which significant unobservable inputs (Level 3) were used in determining fair value is not applicable.
|
|
|
The Fund did not invest in derivative securities or engage in hedging activities during the six months ended May 31, 2021.
|
|
|
(b) Short Positions
|
|
|
The Fund may sell a security it does not own in anticipation of a decline in the fair value of that security. When a fund sells a security short, it must borrow the security sold short and
deliver it to the broker-dealer through which it made the short sale. A gain, limited to the price at which a fund sold the security short, or a loss, unlimited in size, will be recognized upon the termination of a short sale. For financial
statement purposes, an amount equal to the settlement amount is included in the Statement of Assets and Liabilities as a liability. The amount of the liability is subsequently marked-to-market to reflect the current value of the short
positions. Subsequent fluctuations in the market prices of the securities sold, but not yet purchased, may require purchasing the securities at prices which could differ from the amount reflected in the Statement of Assets and Liabilities.
The Fund is liable for any dividends or interest payable on securities while those securities are in a short position. Such amounts are recorded on the ex-dividend date as a dividend expense, and interest expense is accrued daily. As
collateral for its short positions, the Fund is required under the 1940 Act to maintain segregated assets consisting of cash, cash equivalents or liquid securities. The segregated assets are valued consistent with Note 2a above. The amount of
|
34
CONVERGENCE LONG/SHORT EQUITY FUND
Notes to Financial Statements (Continued)
May 31, 2021 (Unaudited)
|
segregated assets is required to be adjusted daily to the extent additional collateral is required based on the change in fair value of the securities sold short. The Fund’s securities sold
short and deposits for short sales are held with one major securities broker-dealer. The Fund does not require this broker-dealer to maintain collateral in support of the receivable for proceeds on securities sold short.
|
|
|
(c) Federal Income Taxes
|
|
|
The Fund complies with the requirements of Subchapter M of the Internal Revenue Code, as amended, necessary to qualify as a regulated investment company and make the requisite distributions of
income and capital gains to their shareholders sufficient to relieve them from all or substantially all federal income taxes. Therefore, no federal income tax provision has been provided.
|
|
|
As of and during the six months ended May 31, 2021, the Fund did not have a liability for any unrecognized tax benefits. The Fund recognizes interest and penalties, if any, related to
unrecognized tax benefits as income tax expense in the Statement of Operations. During the six months ended May 31, 2021, the Fund did not incur any interest or penalties. The Fund is not subject to examination by U.S. taxing authorities for
the tax periods prior to the year ended November 30, 2017.
|
|
|
(d) Distributions to Shareholders
|
|
|
The Fund will distribute any net investment income and any net capital gains at least annually. Distributions from net realized gains for book purposes may include short-term capital gains. All
short-term capital gains are included in ordinary income for tax purposes. Distributions to shareholders are recorded on the ex-dividend date. The Fund may also pay a special distribution at the end of the calendar year to comply with federal
tax requirements.
|
|
|
(e) Use of Estimates
|
|
|
The preparation of financial statements in conformity with GAAP requires management to make estimates and assumptions that affect the reported amounts of assets and liabilities and disclosure of
contingent assets and liabilities at the date of the financial statements and the reported amounts of revenues and expenses during the reporting period. Actual results could differ from those estimates.
|
|
|
(f) Share Valuation
|
|
|
The NAV per share of the Fund is calculated by dividing the sum of the fair value of the securities held by the Fund, plus cash or other assets, minus all liabilities (including estimated
accrued expenses) by the total number of shares outstanding for the Fund, rounded to the nearest cent. The Fund’s shares will not be priced on the days on which the New York Stock Exchange is closed for trading. The Fund does not charge a
redemption fee, and therefore the offering and redemption price per share are equal to a Fund’s NAV per share.
|
35
CONVERGENCE LONG/SHORT EQUITY FUND
Notes to Financial Statements (Continued)
May 31, 2021 (Unaudited)
|
(g) Allocation of Income, Expenses and Gains/Losses
|
|
|
Expenses associated with a specific fund in the Trust are charged to that Fund. Common Trust expenses are typically allocated evenly between the funds of the Trust, or by other equitable means.
|
|
|
(h) Other
|
|
|
Investment transactions are recorded on the trade date. The Fund determines the gain or loss from investment transactions on the identified cost basis by comparing original cost of the security
lot sold with the net sale proceeds. Dividend income and expense is recognized on the ex-dividend date and interest income and expense is recognized on an accrual basis. Dividend income from real estate investment trusts (“REITs”) is
recognized on the ex-date and included in dividend income. The calendar year-end classification of distributions received from REITs during the fiscal year are reported subsequent to year end; accordingly, the Fund estimates the character of
REIT distributions based on the most recent information available and adjusts for actual classifications in the calendar year the information is reported.
|
|
|
Withholding taxes on foreign dividends, net of any reclaims, have been provided for in accordance with the Fund’s understanding of the applicable country’s tax rules and rates.
|
|
|
(3)
|
Federal Tax Matters
|
|
The tax character of distributions paid by the Fund during the fiscal years ended November 30, 2020 and November 30, 2019 was as follows:
|
|
November 30, 2020
|
November 30, 2019
|
||
|
Ordinary Income
|
$8,367,012
|
$ 392,874
|
|
|
Long-Term Capital Gain
|
$7,113,297
|
$4,322,284
|
|
The Fund designated as long-term capital gain dividend, pursuant to Internal Revenue Code Section 852(b)(3), the amount necessary to reduce the earnings and profits of the Fund related to net
capital gain to zero for the tax year ended November 30, 2020. The Fund utilized earnings and profits distributed to shareholders on redemption of shares as part of the dividend paid deduction. The amounts designated as gain for the fiscal
years ended November 30, 2020 and 2019 were as follows:
|
|
November 30, 2020
|
November 30, 2019
|
||
|
Long-term
|
$1,075,752
|
$8,405,679
|
36
CONVERGENCE LONG/SHORT EQUITY FUND
Notes to Financial Statements (Continued)
May 31, 2021 (Unaudited)
|
As of November 30, 2020, the components of distributable earnings on a tax basis were as follows:
|
|
Cost basis of investments for federal income tax purposes(1)
|
$
|
14,631,731
|
|||
|
Gross tax unrealized appreciation
|
$
|
8,523,078
|
|||
|
Gross tax unrealized depreciation
|
(875,152
|
)
|
|||
|
Net tax unrealized appreciation
|
7,647,926
|
||||
|
Undistributed ordinary income
|
24,835
|
||||
|
Undistributed long-term capital gain
|
—
|
||||
|
Total distributable earnings
|
24,835
|
||||
|
Other accumulated losses
|
(3,466
|
)
|
|||
|
Total distributable earnings
|
$
|
7,669,295
|
|
(1) Includes securities sold short.
|
|
|
The tax basis of distributable earnings for tax and financial reporting purposes differs principally due to the deferral of losses on wash sales.
|
|
|
Income and capital gains distributions may differ from GAAP, primarily due to timing differences in the recognition of income, gains and losses, and equalization by the Fund. To the extent that
these differences are attributable to permanent book and tax accounting differences, the components of net assets have been adjusted.
|
|
|
Additionally, GAAP requires that certain components of net assets relating to permanent differences be reclassified between financial and tax reporting. These reclassifications are due to
equalization and have no effect on net assets or NAV per share. For the year ended November 30, 2020, the following table shows the reclassifications made:
|
|
Paid-in capital
|
|
$ 1,075,752
|
|||
|
Total distributable earnings
|
|
$(1,075,752
|
)
|
|
(4)
|
Investment Adviser
|
|
The Trust has an Investment Advisory Agreement (the “Agreement”) with the Adviser to furnish investment advisory services to the Fund. Under the terms of the Agreement, the Fund compensates the
Adviser for its management services at the annual rate of 1.00% of the Fund’s average daily net assets.
|
|
|
The Adviser has contractually agreed to waive its management fee and/or reimburse the Fund’s other expenses at least through the expiration dates listed below, at the discretion of the Adviser
and the Board of Trustees, to the extent necessary to ensure that the Fund’s operating expenses (exclusive of front-end or contingent deferred loads, Rule 12b-1 plan fees, shareholder servicing plan fees, taxes, leverage (i.e., any expenses
incurred in connection with borrowings made by the Fund), interest (including interest incurred in connection with bank and custody overdrafts), brokerage commissions and other transactional expenses, expenses incurred in connection with any
merger or reorganization, dividends or interest on short positions, acquired fund
|
37
CONVERGENCE LONG/SHORT EQUITY FUND
Notes to Financial Statements (Continued)
May 31, 2021 (Unaudited)
|
fees and expenses or extraordinary expenses such as litigation) do not exceed the expense limitation cap listed below of the Fund’s average daily net assets (the “Expense Limitation Cap”).
|
|
Expiration Date
|
Expense Limitation Cap
|
||
|
Institutional Class
|
March 30, 2022
|
1.50%
|
|
Any such waiver or reimbursement is subject to later adjustment to allow the Adviser to recoup amounts waived or reimbursed to the extent actual fees and expenses for a fiscal period do not
exceed the lesser of: (1) the Expense Limitation Cap in place at the time of the waiver or reimbursement; or (2) the Expense Limitation Cap in place at the time of the recoupment; provided, however, that the Adviser shall only be entitled to
recoup such amounts over the following three year period from the date of the waiver or reimbursement.
|
|
|
The following table shows the remaining waived or reimbursed expenses subject to potential recovery expiring during the fiscal period ending:
|
|
November 30, 2021
|
$
|
—
|
|||
|
November 30, 2022
|
—
|
||||
|
November 30, 2023
|
71,496
|
||||
|
May 31, 2024
|
73,429
|
|
(5)
|
Related Party Transactions
|
|
U.S. Bancorp Fund Services, LLC, doing business as U.S. Bank Global Fund Services (“Fund Services” or the “Administrator”), acts as the Fund’s administrator under an Administration Agreement.
The Administrator prepares various federal and state regulatory filings, reports and returns for the Fund; prepares reports and materials to be supplied to the Trustees; monitors the activities of the Fund’s custodian, transfer agent and
accountants; coordinates the preparation and payment of the Fund’s expenses and reviews the Fund’s expense accruals. Fees incurred for the six months ended May 31, 2021, and owed as of May 31, 2021 were as follows:
|
|
Incurred
|
Owed
|
||
|
$56,339
|
$32,369
|
|
Fund Services also serves as the fund accountant and transfer agent to the Fund. U.S. Bank National Association (“U.S. Bank”), an affiliate of Fund Services, serves as the Fund’s custodian. The
Trust’s Chief Compliance Officer is also an employee of Fund Services. Fees incurred for the six months ended May 31, 2021, and owed as of May 31, 2021 were as follows:
|
|
Incurred
|
Owed
|
||||||||
|
Fund Accounting
|
$
|
4,808
|
$
|
2,500
|
|||||
|
Transfer Agency
|
$
|
20,074
|
$
|
7,002
|
|||||
|
Custody
|
$
|
9,332
|
$
|
4,342
|
|||||
|
Chief Compliance Officer
|
$
|
6,370
|
$
|
2,485
|
|||||
|
The Fund has a line of credit with U.S. Bank (see Note 9).
|
38
CONVERGENCE LONG/SHORT EQUITY FUND
Notes to Financial Statements (Continued)
May 31, 2021 (Unaudited)
|
Quasar Distributors, LLC (“Quasar”), a wholly owned broker-dealer subsidiary of Foreside Financial Group, LLC, acts as the Fund’s principal underwriter in a continuous public offering of Fund
shares.
|
|
|
Certain officers of the Fund are also employees of Fund Services. A Trustee of the Trust is affiliated with Fund Services and U.S. Bank.
|
|
|
(6)
|
Capital Share Transactions
|
|
Transactions in Institutional Class shares of the Fund was as follows:
|
|
Six Months Ended
|
Year Ended
|
||||||||
|
May 31, 2021
|
November 30, 2020
|
||||||||
|
Shares sold
|
623,942
|
162,978
|
|||||||
|
Shares reinvested
|
1,964
|
668,963
|
|||||||
|
Shares redeemed
|
(515,358
|
)
|
(2,653,782
|
)
|
|||||
|
Net increase (decrease)
|
110,548
|
(1,821,841
|
)
|
||||||
|
(7)
|
Investment Transactions
|
|
The aggregate purchases and sales of securities, excluding short-term investments and securities sold short, for the Fund for the six months ended May 31, 2021 is summarized below. There were no
purchases or sales of U.S. government securities for the Fund.
|
|
Purchases
|
$61,667,240
|
||
|
Sales
|
$62,549,049
|
|
(8)
|
Beneficial Ownership
|
|
The beneficial ownership, either directly or indirectly, of more than 25% of the voting securities of a fund creates a presumption of control of the fund, under Section 2(a)(9) of the 1940 Act.
At May 31, 2021, Charles Schwab & Co., Inc., and Exclusive Company Corp., for the benefit of others, held 39.16% and 31.29%, respectively, of the Convergence Long/Short Equity Fund’s outstanding Institutional Class shares.
|
|
|
(9)
|
Line of Credit
|
|
At May 31, 2021, the Convergence Long/Short Equity Fund had a line of credit in the amount of the lesser of 33.33% of the fair value of unencumbered assets of the Fund or $4,000,000 which
matures August 7, 2021. Prior to August 8, 2020, the Fund had a line of credit in the amount of the lesser of 33.33% of the fair value of unencumbered assets of the Fund or $13,000,000. The unsecured line of credit is intended to provide
short-term financing, if necessary, subject to certain restrictions, in connection with shareholder redemptions. The credit facility is with the Fund’s custodian, U.S. Bank. Interest was accrued at the prime rate of 3.25%. There were no loans
outstanding for the Fund as of May 31, 2021. The following table provides information regarding usage of the line of credit for the six months ended May 31, 2021.
|
39
CONVERGENCE LONG/SHORT EQUITY FUND
Notes to Financial Statements (Continued)
May 31, 2021 (Unaudited)
|
Average
|
Maximum
|
Maximum
|
||
|
Days
|
Amount of
|
Interest
|
Amount of
|
Borrowing
|
|
Utilized
|
Borrowing
|
Expense*
|
Borrowing
|
Dates
|
|
12/22/2020 &
|
||||
|
4
|
$140,500
|
$51
|
$235,000
|
12/23/2020
|
|
* Interest expense is included within other expenses on the Statement of Operations.
|
|
|
(10)
|
Recent Market Events
|
|
U.S. and international markets have experienced significant periods of volatility in recent years due to a number of economic, political and global macro factors including the impact of the
novel coronavirus (COVID-19) as a global pandemic, which has resulted in related public health issues, growth concerns in the U.S. and overseas, temporary and permanent layoffs in the private sector and rising unemployment claims and reduced
consumer spending. The recovery from the lasting effects of COVID-19 is uncertain and may last for an extended period of time. These developments as well as other events could result in further market volatility and negatively affect
financial asset prices, the liquidity of certain securities and the normal operations of securities exchanges and other markets. As a result, the risk environment remains elevated. The Adviser will monitor developments and seek to manage the
Fund in a manner consistent with achieving the Fund’s investment objective, but there can be no assurance that it will be successful in doing so.
|
|
|
(11)
|
Subsequent Events
|
|
On June 30, 2021, Foreside Financial Group, LLC (“Foreside”), the ultimate parent company of Quasar, the Fund’s distributor, and Lovell Minnick Partners, LLC (“LMP”) announced they had entered
into a definitive purchase and sale agreement with Genstar Capital (“Genstar”), a private equity firm specializing in financial and related business services companies. Genstar will acquire a majority stake in Foreside, and LMP will exit its
investment in Foreside. The transaction is anticipated to close, subject to any necessary governmental and regulatory approvals, in the third quarter of 2021. Quasar will remain the Fund’s distributor at the close of the transaction, subject
to Board approval.
|
40
CONVERGENCE LONG/SHORT EQUITY FUND
Statement Regarding Liquidity Risk Management Program
(Unaudited)
In accordance with Rule 22e-4 under the Investment Company Act of 1940, as amended, Trust for Professional Managers (the “Trust”) has adopted and implemented a liquidity risk management program (the
“Trust Program”). As required under the Trust Program, Convergence Investment Partners, LLC (“Convergence”), the investment adviser to the Convergence Long/Short Equity Fund (the “Fund”), a series of the Trust, has adopted and implemented a liquidity
risk management program tailored specifically to the Fund (the “Adviser Program”). The Adviser Program seeks to promote effective liquidity risk management for the Fund and to protect Fund shareholders from dilution of their interests. The Board of
Trustees (the “Board”) of the Trust has approved Convergence as the administrator for the Adviser Program (the “Program Administrator”). The Program Administrator has further delegated administration of the Adviser Program to its Liquidity Risk
Management Committee, as may be constituted from time to time and which will be comprised of at least one Portfolio Manager, the Director of Operations and the Chief Compliance Officer. The Program Administrator is required to provide a written
annual report to the Board and the Trust’s chief compliance officer regarding the adequacy and effectiveness of the Adviser Program, including the operation of the Fund’s highly liquid investment minimum, if applicable, and any material changes to
the Adviser Program.
On April 15, 2021, the Board reviewed the Program Administrator’s written annual report for the period July 1, 2020 through December 31, 2020 (the “Report”). The Report provided an assessment of the
Fund’s liquidity risk: the risk that the Fund could not meet requests to redeem shares issued by the Fund without significant dilution of the remaining investors’ interests in the Fund. The Adviser Program assesses liquidity risk under both normal
and reasonably foreseeable stressed market conditions. The Program Administrator provides portfolio investment classification services, and the Report noted that the Fund primarily held investments that were classified as highly liquid during the
review period. The Report noted that the Fund’s portfolios are expected to continue to primarily hold highly liquid investments and the determination that the Fund be designated as a “primarily highly liquid fund” (as defined in Rule 22e-4) remains
appropriate and the Fund can therefore continue to rely on the exclusion in Rule 22e-4 from the requirements to determine and review a highly liquid investment minimum for the Fund and to adopt policies and procedures for responding to a highly
liquid investment minimum shortfall. The Report noted that there were no breaches of the Fund’s restriction on holding illiquid investments exceeding 15% of its net assets during the review period. The Report confirmed that the Fund’s investment
strategy was appropriate for an open-end management investment company. The Report also indicated that no material changes had been made to the Adviser Program during the review period.
The Program Administrator determined that the Fund is reasonably likely to be able to meet redemption requests without adversely affecting non-redeeming Fund shareholders through significant dilution.
The Program Administrator concluded that the Adviser Program was adequately designed and effectively implemented during the review period.
41
CONVERGENCE LONG/SHORT EQUITY FUND
Notice of Privacy Policy & Practices
(Unaudited)
We collect non-public personal information about you from the following sources:
• information we receive about you on
applications or other forms;
• information you give us orally; and
• information about your transactions
with us or others.
We do not disclose any non-public personal information about our shareholders or former shareholders without the shareholder’s authorization, except as permitted by law or in response to inquiries from
governmental authorities. We may share information with affiliated parties and unaffiliated third parties with whom we have contracts for servicing the Fund. We will provide unaffiliated third parties with only the information necessary to carry
out their assigned responsibility. All shareholder records will be disposed of in accordance with applicable law. We maintain physical, electronic and procedural safeguards to protect your non-public personal information and require third parties
to treat your non-public personal information with the same high degree of confidentiality.
In the event that you hold shares of the Fund through a financial intermediary, including, but not limited to, a broker-dealer, bank or trust company, the privacy policy of your financial intermediary
would govern how your non-public personal information would be shared with unaffiliated third parties.
42
CONVERGENCE LONG/SHORT EQUITY FUND
Additional Information
(Unaudited)
Tax Information
For the year ended November 30, 2020, the Fund designated 27.97% of its ordinary income distribution as qualified dividend income under the Jobs and Growth Tax Relief Reconciliation Act of 2003.
For the year ended November 30, 2020, 28.42% of dividends paid from net ordinary income for the Fund qualified for the dividends received deduction available to corporate shareholders.
For the fiscal year ended November 30, 2020, the Fund designated 94.67% of its taxable ordinary income distributions as short-term capital gain distributions under Internal Revenue Code Section
871(k)(2)(c).
Indemnifications
Under the Trust’s organizational documents, its officers and Trustees are indemnified against certain liabilities arising out of the performance of their duties to the Fund. In addition, in the normal
course of business, the Fund enters into contracts that provide general indemnifications to other parties. The Fund’s maximum exposure under these arrangements is unknown as this would involve future claims that may be made against the Fund that
have not yet occurred. However, the Fund has not had prior claims or losses pursuant to these contracts and expect the risk of loss to be remote.
43
CONVERGENCE LONG/SHORT EQUITY FUND
Additional Information (Continued)
(Unaudited)
Information about Trustees
The business and affairs of the Trust are managed under the direction of the Board of Trustees. Information pertaining to the Trustees of the Trust is set forth below. The Statement of Additional
Information includes additional information about the Trustees and is available, without charge, upon request by calling 877-677-9414.
|
Other
|
|||||
|
Directorships
|
|||||
|
Term of
|
Number of
|
Principal
|
Held by
|
||
|
Office and
|
Portfolios
|
Occupation(s)
|
Trustee
|
||
|
Position(s)
|
Length
|
in Trust
|
During the
|
During the
|
|
|
Name, Address
|
Held with
|
of Time
|
Overseen
|
Past Five
|
Past Five
|
|
and Year of Birth
|
the Trust
|
Served
|
by Trustee
|
Years
|
Years
|
|
Independent Trustees
|
|||||
|
Michael D. Akers, Ph.D.
|
Trustee
|
Indefinite
|
22
|
Professor Emeritus,
|
Independent
|
|
615 E. Michigan St.
|
Term; Since
|
Department
|
Trustee, USA
|
||
|
Milwaukee, WI 53202
|
August 22,
|
of Accounting,
|
MUTUALS
|
||
|
Year of Birth: 1955
|
2001
|
(June 2019–
|
(an open-end
|
||
|
present), Professor,
|
investment
|
||||
|
Department
|
company)
|
||||
|
of Accounting,
|
(2001-2021).
|
||||
|
(2004–May 2019),
|
|||||
|
Chair, Department
|
|||||
|
of Accounting
|
|||||
|
(2004–2017),
|
|||||
|
Marquette University.
|
|||||
|
Gary A. Drska
|
Trustee
|
Indefinite
|
22
|
Pilot,
|
Independent
|
|
615 E. Michigan St.
|
Term; Since
|
Frontier/Midwest
|
Trustee, USA
|
||
|
Milwaukee, WI 53202
|
August 22,
|
Airlines, Inc.
|
MUTUALS
|
||
|
Year of Birth: 1956
|
2001
|
(airline company)
|
(an open-end
|
||
|
(1986–present).
|
investment
|
||||
|
company)
|
|||||
|
(2001-2021).
|
44
CONVERGENCE LONG/SHORT EQUITY FUND
Additional Information (Continued)
(Unaudited)
|
Other
|
|||||
|
Directorships
|
|||||
|
Term of
|
Number of
|
Principal
|
Held by
|
||
|
Office and
|
Portfolios
|
Occupation(s)
|
Trustee
|
||
|
Position(s)
|
Length
|
in Trust
|
During the
|
During the
|
|
|
Name, Address
|
Held with
|
of Time
|
Overseen
|
Past Five
|
Past Five
|
|
and Year of Birth
|
the Trust
|
Served
|
by Trustee
|
Years
|
Years
|
|
Interested Trustee and Officers
|
|||||
|
Joseph C. Neuberger*
|
Chairperson
|
Indefinite
|
22
|
President
|
Trustee, Buffalo
|
|
615 E. Michigan St.
|
and
|
Term; Since
|
(2017–present),
|
Funds (an
|
|
|
Milwaukee, WI 53202
|
Trustee
|
August 22,
|
Chief Operating
|
open-end
|
|
|
Year of Birth: 1962
|
2001
|
Officer (2016–
|
investment
|
||
|
2020), Executive
|
company)
|
||||
|
Vice President
|
(2003–2017);
|
||||
|
(1994–2017), U.S.
|
Trustee, USA
|
||||
|
Bancorp Fund
|
MUTUALS
|
||||
|
Services, LLC.
|
(an open-end
|
||||
|
investment
|
|||||
|
company)
|
|||||
|
(2001–2018).
|
|||||
|
John P. Buckel
|
President
|
Indefinite
|
N/A
|
Vice President,
|
N/A
|
|
615 E. Michigan St.
|
and
|
Term; Since
|
U.S. Bancorp Fund
|
||
|
Milwaukee, WI 53202
|
Principal
|
January 24,
|
Services, LLC
|
||
|
Year of Birth: 1957
|
Executive
|
2013
|
(2004–present).
|
||
|
Officer
|
|||||
|
Jennifer A. Lima
|
Vice
|
Indefinite
|
N/A
|
Vice President,
|
N/A
|
|
615 E. Michigan St.
|
President,
|
Term; Since
|
U.S. Bancorp Fund
|
||
|
Milwaukee, WI 53202
|
Treasurer
|
January 24,
|
Services, LLC
|
||
|
Year of Birth: 1974
|
and
|
2013
|
(2002–present).
|
||
|
Principal
|
|||||
|
Financial
|
|||||
|
and
|
|||||
|
Accounting
|
|||||
|
Officer
|
45
CONVERGENCE LONG/SHORT EQUITY FUND
Additional Information (Continued)
(Unaudited)
|
Other
|
|||||
|
Directorships
|
|||||
|
Term of
|
Number of
|
Principal
|
Held by
|
||
|
Office and
|
Portfolios
|
Occupation(s)
|
Trustee
|
||
|
Position(s)
|
Length
|
in Trust
|
During the
|
During the
|
|
|
Name, Address
|
Held with
|
of Time
|
Overseen
|
Past Five
|
Past Five
|
|
and Year of Birth
|
the Trust
|
Served
|
by Trustee
|
Years
|
Years
|
|
Elizabeth B. Scalf
|
Chief
|
Indefinite
|
N/A
|
Senior Vice
|
N/A
|
|
615 E. Michigan St.
|
Compliance
|
Term; Since
|
President,
|
||
|
Milwaukee, WI 53202
|
Officer,
|
July 1,
|
U.S. Bancorp Fund
|
||
|
Year of Birth: 1985
|
Vice
|
2017
|
Services,
|
||
|
President
|
LLC (February
|
||||
|
and
|
2017–present);
|
||||
|
Anti-Money
|
Vice President and
|
||||
|
Laundering
|
Assistant CCO,
|
||||
|
Officer
|
Heartland Advisors,
|
||||
|
Inc. (December 2016–
|
|||||
|
January 2017);
|
|||||
|
Vice President and
|
|||||
|
CCO, Heartland
|
|||||
|
Group, Inc. (May
|
|||||
|
2016–November
|
|||||
|
2016); Vice
|
|||||
|
President, CCO and
|
|||||
|
Senior Legal Counsel
|
|||||
|
(May 2016–November
|
|||||
|
2016), Heartland
|
|||||
|
Advisors, Inc.
|
|||||
|
Jay S. Fitton
|
Secretary
|
Indefinite
|
N/A
|
Assistant Vice
|
N/A
|
|
615 E. Michigan St.
|
Term; Since
|
President, U.S.
|
|||
|
Milwaukee, WI 53202
|
July 22, 2019
|
Bancorp Fund
|
|||
|
Year of Birth: 1970
|
Services, LLC
|
||||
|
(2019–present);
|
|||||
|
Partner, Practus, LLP
|
|||||
|
(2018–2019);
|
|||||
|
Counsel, Drinker
|
|||||
|
Biddle & Reath, LLP
|
|||||
|
(2016–2018).
|
46
CONVERGENCE LONG/SHORT EQUITY FUND
Additional Information (Continued)
(Unaudited)
|
Other
|
|||||
|
Directorships
|
|||||
|
Term of
|
Number of
|
Principal
|
Held by
|
||
|
Office and
|
Portfolios
|
Occupation(s)
|
Trustee
|
||
|
Position(s)
|
Length
|
in Trust
|
During the
|
During the
|
|
|
Name, Address
|
Held with
|
of Time
|
Overseen
|
Past Five
|
Past Five
|
|
and Year of Birth
|
the Trust
|
Served
|
by Trustee
|
Years
|
Years
|
|
Kelly A. Burns
|
Assistant
|
Indefinite
|
N/A
|
Assistant Vice
|
N/A
|
|
615 E. Michigan St.
|
Treasurer
|
Term; Since
|
President, U.S.
|
||
|
Milwaukee, WI 53202
|
April 23,
|
Bancorp Fund
|
|||
|
Year of Birth: 1987
|
2015
|
Services, LLC
|
|||
|
(2011–present).
|
|||||
|
Melissa Aguinaga
|
Assistant
|
Indefinite
|
N/A
|
Assistant Vice
|
N/A
|
|
615 E. Michigan St.
|
Treasurer
|
Term; Since
|
President, U.S.
|
||
|
Milwaukee, WI 53202
|
July 1,
|
Bancorp Fund
|
|||
|
Year of Birth: 1987
|
2015
|
Services, LLC
|
|||
|
(2010–present).
|
|||||
|
Laura A. Carroll
|
Assistant
|
Indefinite
|
N/A
|
Assistant Vice
|
N/A
|
|
615 E. Michigan St.
|
Treasurer
|
Term; Since
|
President, U.S.
|
||
|
Milwaukee, WI 53202
|
August 20,
|
Bancorp Fund
|
|||
|
Year of Birth: 1985
|
2018
|
Services, LLC
|
|||
|
(2007–present).
|
|
*
|
Mr. Neuberger is deemed to be an “interested person” of the Trust as defined by the 1940 Act due to his position and material business relationship with the Trust.
|
47
A NOTE ON FORWARD LOOKING STATEMENTS (Unaudited)
Except for historical information contained in this report for the Fund, the matters discussed in this report may constitute forward-looking statements made pursuant to the safe-harbor provisions of the
Private Securities Litigation Reform Act of 1995. These include any adviser or portfolio manager predictions, assessments, analyses or outlooks for individual securities, industries, market sectors and/or markets. These statements involve risks and
uncertainties. In addition to the general risks described for the Fund in the current Prospectus, other factors bearing on this report include the accuracy of the Adviser’s or portfolio managers’ forecasts and predictions, and the appropriateness of
the investment programs designed by the Adviser or portfolio managers to implement their strategies efficiently and effectively. Any one or more of these factors, as well as other risks affecting the securities markets and investment instruments
generally, could cause the actual results of the Fund to differ materially as compared to benchmarks associated with the Fund.
ADDITIONAL INFORMATION (Unaudited)
The Fund has adopted proxy voting policies and procedures that delegate to the Adviser the authority to vote proxies. A description of the Fund’s proxy voting policies and procedures is available
without charge, upon request, by calling the Fund toll free at 1-877-677-9414. A description of these policies and procedures is also included in the Fund’s Statement of Additional Information, which is available on the SEC’s website at http://www.sec.gov.
The Fund’s proxy voting record for the most recent 12-month period ended June 30 is available without charge, upon request, by calling, toll free, 1-877-677-9414, or by accessing the SEC’s website at http://www.sec.gov.
The Fund files its complete schedules of portfolio holdings with the SEC for the first and third quarters of each fiscal year on Part F of Form N-PORT. Shareholders may view the Fund’s Form N-PORT
reports on the SEC’s website at www.sec.gov.
HOUSEHOLDING (Unaudited)
In an effort to decrease costs, the Fund intends to reduce the number of duplicate prospectuses, supplements and certain other shareholder documents you receive by sending only one copy of each to those
addresses shared by two or more accounts and to shareholders the Fund reasonably believes are from the same family or household. Once implemented, if you would like to discontinue householding for your accounts, please call the Fund toll-free at
1-877-677-9414 to request individual copies of these documents. Once the Fund receives notice to stop householding, the Fund will begin sending individual copies 30 days after receiving your request. This policy does not apply to account statements.
(This Page Intentionally Left Blank.)
CONVERGENCE LONG/SHORT EQUITY FUND
|
Investment Adviser
|
Convergence Investment Partners, LLC
|
|
3801 PGA Boulevard
|
|
|
Suite 1001
|
|
|
Palm Beach Gardens, Florida 33410
|
|
|
Legal Counsel
|
Godfrey & Kahn, S.C.
|
|
833 East Michigan Street
|
|
|
Suite 1800
|
|
|
Milwaukee, Wisconsin 53202
|
|
|
Independent Registered Public
|
Cohen & Company, Ltd.
|
|
Accounting Firm
|
1350 Euclid Avenue
|
|
Suite 800
|
|
|
Cleveland, Ohio 44115
|
|
|
Transfer Agent, Fund Accountant and
|
U.S. Bancorp Fund Services, LLC
|
|
Fund Administrator
|
615 East Michigan Street
|
|
Milwaukee, Wisconsin 53202
|
|
|
Custodian
|
U.S. Bank National Association
|
|
Custody Operations
|
|
|
1555 North River Center Drive
|
|
|
Milwaukee, Wisconsin 53212
|
|
|
Distributor
|
Quasar Distributors, LLC
|
|
111 East Kilbourn Avenue
|
|
|
Suite 2200
|
|
|
Milwaukee, Wisconsin 53202
|
This report is intended for shareholders of the Fund and may not be used as sales literature unless preceded or accompanied by a current prospectus.
MN-SEMI
|
(b)
|
Not applicable.
|
Item 2. Code of Ethics.
Not applicable for semi-annual reports.
Item 3. Audit Committee Financial Expert.
Not applicable for semi-annual reports.
Item 4. Principal Accountant Fees and Services.
Not applicable for semi-annual reports.
Item 5. Audit Committee of Listed Registrants.
Not applicable to registrants who are not listed issuers (as defined in Rule 10A-3 under the Securities Exchange Act of 1934).
Item 6. Investments.
|
(a)
|
Schedule of Investments is included as part of the report to shareholders filed under Item 1 of this Form.
|
|
(b)
|
Not Applicable.
|
Item 7. Disclosure of Proxy Voting Policies and Procedures for Closed-End Management Investment Companies.
Not applicable to open-end investment companies.
Item 8. Portfolio Managers of Closed-End Management Investment Companies.
Not applicable to open-end investment companies.
Item 9. Purchases of Equity Securities by Closed‑End Management Investment Company and Affiliated Purchasers.
Not applicable to open-end investment companies.
Item 10. Submission of Matters to a Vote of Security Holders.
There have been no material changes to the procedures by which shareholders may recommend nominees to the registrant’s board of trustees.
Item 11. Controls and Procedures.
|
(a)
|
The Registrant’s President and Treasurer have reviewed the Registrant's disclosure controls and procedures (as defined in Rule 30a-3(c) under the Investment Company Act of 1940 (the “Act”)) as of a date within 90 days of the filing of
this report, as required by Rule 30a-3(b) under the Act and Rules 13a-15(b) or 15d‑15(b) under the Securities Exchange Act of 1934. Based on their review, such officers have concluded that the disclosure controls and procedures are
effective in ensuring that information required to be disclosed in this report is appropriately recorded, processed, summarized and reported and made known to them by others within the Registrant and by the Registrant’s service provider.
|
|
(b)
|
There were no changes in the Registrant's internal control over financial reporting (as defined in Rule 30a-3(d) under the Act) that occurred during the period covered by this report that have materially affected, or are reasonably
likely to materially affect, the Registrant's internal control over financial reporting.
|
Item 12. Disclosure of Securities Lending Activities for Closed-End Management Investment Companies
Not applicable to open-end investment companies.
Item 13. Exhibits.
|
(a)
|
(1) Any code of ethics or amendment thereto, that is the subject of the disclosure required by Item 2, to the extent that the registrant intends to satisfy Item 2 requirements through filing an
exhibit. Not Applicable.
|
(3) Any written solicitation to purchase securities under Rule 23c‑1 under the Act sent or given during the period covered by the report by or on behalf of the registrant to 10 or
more persons. Not applicable to open-end investment companies.
(4) Change in the registrant’s independent public accountant. There was no change in the registrant’s independent public accountant for the period covered by this report.
SIGNATURES
Pursuant to the requirements of the Securities Exchange Act of 1934 and the Investment Company Act of 1940, the registrant has duly caused this report to be signed on its behalf by the undersigned, thereunto duly
authorized.
(Registrant) Trust for Professional Managers
By (Signature and Title)* /s/John Buckel
John Buckel, President
Date August 6, 2021
Pursuant to the requirements of the Securities Exchange Act of 1934 and the Investment Company Act of 1940, this report has been signed below by the following persons on behalf of the registrant and in the capacities
and on the dates indicated.
By (Signature and Title)* /s/John Buckel
John Buckel, President
Date August 6, 2021
By (Signature and Title)* /s/Jennifer Lima
Jennifer Lima, Treasurer
Date August 6, 2021
* Print the name and title of each signing officer under his or her signature.