UNITED STATES
SECURITIES AND EXCHANGE COMMISSION
Washington, D.C. 20549
SECURITIES AND EXCHANGE COMMISSION
Washington, D.C. 20549
FORM N-CSR
CERTIFIED SHAREHOLDER REPORT OF REGISTERED
MANAGEMENT INVESTMENT COMPANIES
Investment Company Act file number 811-10401
Trust for Professional Managers
(Exact name of registrant as specified in charter)
(Exact name of registrant as specified in charter)
615 East Michigan Street
Milwaukee, WI 53202
(Address of principal executive offices) (Zip code)
(Address of principal executive offices) (Zip code)
Adam W. Smith
U.S. Bancorp Fund Services, LLC
615 East Michigan Street
Milwaukee, WI 53202
(Name and address of agent for service)
(Name and address of agent for service)
(414) 765-6115
Registrant's telephone number, including area code
Date of fiscal year end: November 30, 2017
Date of reporting period: November 30, 2017
Item 1. Reports to Stockholders.
Annual Report
Convergence Core Plus Fund
Convergence Opportunities Fund
Convergence Market Neutral Fund
November 30, 2017
Investment Adviser
Convergence Investment Partners, LLC
1245 Cheyenne Avenue
Suite 102
Grafton, Wisconsin 53024
Phone: 877-677-9414
Table of Contents
|
LETTER TO SHAREHOLDERS
|
3
|
||
|
EXPENSE EXAMPLES
|
9
|
||
|
CONVERGENCE CORE PLUS FUND
|
|||
|
SCHEDULE OF INVESTMENTS
|
18
|
||
|
SCHEDULE OF SECURITIES SOLD SHORT
|
25
|
||
|
CONVERGENCE OPPORTUNITIES FUND
|
|||
|
SCHEDULE OF INVESTMENTS
|
33
|
||
|
SCHEDULE OF SECURITIES SOLD SHORT
|
40
|
||
|
CONVERGENCE MARKET NEUTRAL FUND
|
|||
|
SCHEDULE OF INVESTMENTS
|
47
|
||
|
SCHEDULE OF SECURITIES SOLD SHORT
|
54
|
||
|
STATEMENTS OF ASSETS AND LIABILITIES
|
61
|
||
|
STATEMENTS OF OPERATIONS
|
62
|
||
|
STATEMENTS OF CHANGES IN NET ASSETS
|
|||
|
CONVERGENCE CORE PLUS FUND
|
63
|
||
|
CONVERGENCE OPPORTUNITIES FUND
|
64
|
||
|
CONVERGENCE MARKET NEUTRAL FUND
|
65
|
||
|
STATEMENTS OF CASH FLOWS
|
66
|
||
|
FINANCIAL HIGHLIGHTS
|
|||
|
CONVERGENCE CORE PLUS FUND
|
68
|
||
|
CONVERGENCE OPPORTUNITIES FUND
|
70
|
||
|
CONVERGENCE MARKET NEUTRAL FUND
|
72
|
||
|
NOTES TO FINANCIAL STATEMENTS
|
73
|
||
|
REPORT OF INDEPENDENT REGISTERED
|
|||
|
PUBLIC ACCOUNTING FIRM
|
87
|
||
|
BASIS FOR TRUSTEES’ APPROVAL OF INVESTMENT
|
|||
|
ADVISORY AGREEMENT
|
88
|
||
|
NOTICE OF PRIVACY POLICY & PRACTICES
|
92
|
||
|
ADDITIONAL INFORMATION
|
93
|
Dear Shareholder:
We are pleased to provide to you the annual report of the Convergence Core Plus Fund, the Convergence Opportunities Fund and the Convergence Market Neutral Fund for the fiscal year ended November 30, 2017. We have been successfully managing our U.S. larger cap Convergence Core Plus Fund, incepted December 29, 2009, for nearly 8 years. Additionally, our smaller cap focused Convergence Opportunities Fund has reached its 4 year anniversary. Finally, our youngest fund, the Convergence Market Neutral Fund, has now been up and running for almost 2 years. All of our funds employ the Convergence systematic long/short investment approach which seeks to benefit from fundamentally strong companies outperforming their weak fundamental counterparts. Over the long term, our funds strive for strong total returns with the potential for downside risk mitigation through an active short.
We manage all of our mutual funds with the philosophy that over the long term, strong “fundamentals” outperform weak “fundamentals.” Moreover, our funds all utilize the Convergence proprietary stock ranking process which analyzes the domestic investment universe and helps to identify, quantify and rank strong and weak fundamentals. Much like 2016, where we started slow and finished strong, 2017 has yet again delivered strong returns as we moved closer to the holiday season. As we reflect on the year that has transpired, we are reminded of the varied predictions by “experts.” Opinions from a year ago ranged widely, from an armageddon 50% drop in equities, to others who were convinced that interest rates would skyrocket because the growth rate of the economy would be stupendous!
Fortunately, at Convergence we do not have to guess or speculate on bold predictions. Instead, we focus our efforts on probable outcomes based on the stock fundamentals emphasized within each industry group. We are like “fundamental farmers” who are constantly “planting” our long and short positions into favorably ranked companies within each industry group. We are pleased to report that over the past year our strategies have delivered strong returns, falling just shy of their respective benchmarks. We are even more pleased that the markets have again shifted to a more fundamental focus in recent months. It’s no surprise that this shift has benefited our strategies.
Looking at a shorter period of time, such as the twelve months ended November 30, 2017, we see that much of the positive spread or differentiation in stocks has been a combination of growth (both top and bottom line growth), price momentum and profitability. Separately, there has not been much production or benefit from fundamental tilts in valuation, accruals or risk measures in the past year. This demonstrates the benefit of the fundamental factor diversification that we employ at Convergence and our long term supporters are well aware that these factor exposures (and the returns they generate) are the main thrust behind everything we do at Convergence. While it is unlikely for all fundamental tilts to generate a positive spread in short time periods, we believe these fundamental spreads, based on our research of sound economic principles, produce real wealth for investors over time. We remain steadfast to our philosophy that strong fundamentals win in the long run. In terms of our long and short positions, in our larger cap portfolios (Core Plus Fund and Market Neutral Fund) our long positions slightly trailed the Russell 3000® Index over the twelve months ended November 30, 2017, while the short positions more notably lagged the index, generating a positive long/short spread. Conversely, in our smaller cap Opportunities Fund, the long positions slightly outpaced the Russell 2000® Index and the short positions trailed the benchmark. The returns of our long/short products improved as our fiscal year drew to a close and we remain steadfast to our philosophy that strong fundamentals win in the long run.
3
Convergence Core Plus Fund Performance
The objective of the Convergence Core Plus Fund is to achieve long-term growth. The Fund seeks to realize its investment objective by establishing long and short positions in equity securities of larger cap domestic and foreign companies with medium and large market capitalizations, although the Fund may establish large and short positions in companies of any market capitalization. The Fund will hold long (purchase) securities that Convergence believes will outperform the market, and it will sell short securities expected to underperform the market. Convergence constructs the portfolio as an actively managed equity strategy that adapts to ever changing market dynamics through a market cycle. The Fund intends to maintain a net long exposure (the market value of long positions minus the market value of short positions) of approximately 100% of the Fund’s total assets. Under normal market conditions, the Fund’s long positions may range from 120% to 150% of the Fund’s total assets and its short positions may range from 20% to 50% of the Fund’s total assets. In making investment decisions for the Fund, Convergence utilizes a bottom-up approach that focuses on the individual strengths of the underlying companies and the relative and absolute attractiveness of the companies within each industry group.
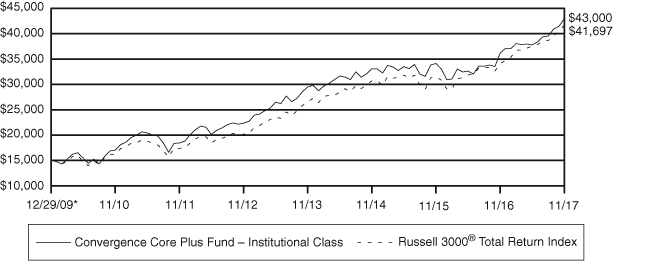
The Convergence Core Plus Fund’s Institutional Class has advanced cumulatively 186.67% net of fees from December 29, 2009 (its inception) through November 30, 2017, versus the Russell 3000® Total Return Index at 177.98%. Ten thousand dollars invested in the Convergence Core Plus Fund (MARNX) at its inception would be worth $28,667 as of November 30, 2017*.
Average Annual Total Returns (net of fees)
|
Since
|
||||||
|
One
|
One
|
Three
|
Five
|
Inception
|
||
|
Through November 30, 2017
|
Month
|
YTD
|
Year
|
Year
|
Year
|
Annualized
|
|
Convergence Core Plus
|
||||||
|
Institutional Class (MARNX)
|
3.65%
|
15.80%
|
18.81%
|
9.12%
|
13.97%
|
14.22%
|
|
Russell 3000® Total Return
|
3.04%
|
19.93%
|
22.27%
|
10.75%
|
15.63%
|
13.78%
|
|
Since
|
||||||
|
One
|
Three
|
Five
|
Inception
|
|||
|
Through September 30, 2017
|
Quarter**
|
YTD
|
Year
|
Year
|
Year
|
Annualized
|
|
Convergence Core Plus
|
||||||
|
Institutional Class (MARNX)
|
6.61%
|
10.19%
|
20.97%
|
9.20%
|
12.81%
|
13.82%
|
|
Russell 3000® Total Return
|
4.57%
|
13.91%
|
18.71%
|
10.74%
|
14.23%
|
13.34%
|
Fund inception (Institutional Class) = 12/29/2009
Performance data quoted represents past performance and does not guarantee future results. The investment return and principal value of an investment will fluctuate so that an investor’s shares, when redeemed, may be worth more or less than their original cost. Current performance of the Fund may be lower or higher than the performance quoted. Performance data current to the most recent month-end may be obtained by calling 1-877-677-9414.
The Gross Expense Ratio of the Fund is 2.21%, the Expense Ratio net of dividends on short positions is 1.31%. Pursuant to an operating expense limitation agreement between the Adviser and the Fund, the Adviser has agreed to contractually waive its management fees and/or reimburse Fund expenses to ensure that total annual fund operating expenses (exclusive of dividends or interest expenses on short positions, acquired fund fees and expenses, leverage expenses (i.e., any expenses incurred in connection with borrowings
4
made by the Fund), tax expenses, brokerage commissions, and extraordinary expenses) do not exceed 1.50% of the average net assets for the Institutional Class of the Core Plus Fund through March 30, 2019.
|
*
|
This illustrates the performance of a hypothetical $10,000 investment made in the Fund from 12/29/2009 – 11/30/2017 and assumes reinvestment of dividends and capital gains, but does not reflect the effect of any applicable sales charge or redemption fees. This does not imply any future performance.
|
Periods less than 12 months are not annualized.
**6/30/17 – 9/30/17
Convergence Opportunities Fund Performance
The objective of the Convergence Opportunities Fund is to achieve long-term growth. The Fund seeks to realize its investment objective by establishing long and short positions in equity securities of domestic and foreign companies with small and medium market capitalizations, although the Fund may establish long and short positions in companies of any capitalization. The Fund will hold long (purchase) securities that Convergence believes will outperform the market, and it will sell short securities expected to underperform the market. Convergence constructs the portfolio as an actively managed equity strategy that adapts to ever changing market dynamics through a market cycle. The Fund intends to maintain a net long exposure (the market value of long positions minus the market value of short positions) of approximately 100% of the Fund’s total assets. Under normal market conditions, the Fund’s long positions may range from 120% to 150% of the Fund’s total assets and its short positions may range from 20% to 50% of the Fund’s total assets. In making investment decisions for the Fund, Convergence utilizes a bottom-up approach that focuses on the individual strengths of the underlying companies and the relative and absolute attractiveness of the companies within each industry group.
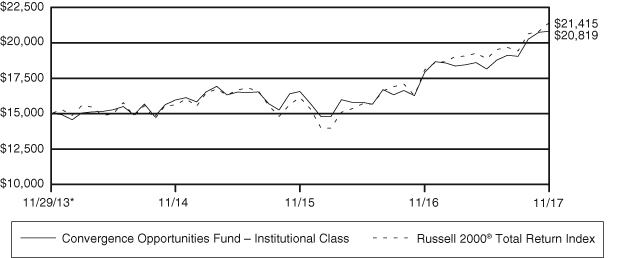
The Convergence Opportunities Fund completed its first 4 years, from November 29, 2013 through November 30, 2017, up cumulatively 38.79% net of fees, while the Russell 2000® Total Return Index was up 42.76% cumulative over the same period.
Average Annual Total Returns (net of fees)
|
Since
|
|||||
|
One
|
One
|
Three
|
Inception
|
||
|
Through November 30, 2017
|
Month
|
YTD
|
Year
|
Year
|
Annualized
|
|
Convergence Opportunities
|
|||||
|
Institutional Class (CIPOX)
|
0.37%
|
11.53%
|
16.24%
|
9.25%
|
8.53%
|
|
Russell 2000® Total Return
|
2.88%
|
15.11%
|
18.34%
|
11.14%
|
9.30%
|
|
Since
|
|||||
|
One
|
Three
|
Inception
|
|||
|
Through September 30, 2017
|
Quarter**
|
YTD
|
Year
|
Year
|
Annualized
|
|
Convergence Opportunities
|
|||||
|
Institutional Class (CIPOX)
|
7.82%
|
8.52%
|
21.77%
|
11.04%
|
8.15%
|
|
Russell 2000® Total Return
|
5.67%
|
10.94%
|
20.74%
|
12.18%
|
8.68%
|
|
Fund inception = 11/29/2013
|
Performance data quoted represents past performance and does not guarantee future results. The investment return and principal value of an investment will fluctuate so that an investor’s shares, when redeemed, may be worth more or less than their original cost. Current performance of the Fund may be lower or higher than the performance quoted. Performance data current to the most recent month-end may be obtained by calling 1-877-677-9414.
5
The Gross Expense Ratio of the Fund is 2.57%, the Expense Ratio net of dividends on short positions is 1.36%. Pursuant to an operating expense limitation agreement between the Adviser and the Fund, the Adviser has agreed to contractually waive its management fees and/or reimburse Fund expenses to ensure that total annual fund operating expenses (exclusive of dividends or interest expenses on short positions, acquired fund fees and expenses, leverage expenses (i.e., any expenses incurred in connection with borrowings made by the Fund), tax expenses, brokerage commissions, and extraordinary expenses) do not exceed 1.50% of the average net assets for the Institutional Class of the Opportunities Fund through March 30, 2019.
Periods less than 12 months are not annualized.
**6/30/17 – 9/30/17
Convergence Market Neutral Fund Performance
The Convergence Market Neutral Fund’s objective is to seek positive absolute returns. The Market Neutral Fund is intended to produce returns uncorrelated to the stock market, aiding diversification while striving to improve risk adjusted returns. The Fund seeks to achieve its investment objective by establishing long and short positions in equity securities of domestic and foreign companies that are deemed to be attractive (and likely to increase in price), or unattractive (and likely to decrease in price). The Fund is designed to be “market neutral,” targeting a portfolio designed to generate positive absolute returns with low correlation to the U.S. equity market over a normal business cycle. The Fund focuses primarily on companies with medium and large market capitalizations, although the Fund may establish long and short positions in companies of any market capitalization. Convergence constructs the portfolio as an actively managed equity strategy that adapts to ever changing market dynamics through a market cycle. The Fund intends to maintain a net long exposure (the market value of long positions minus the market value of short positions) of approximately 0 to 20% of the Fund’s total assets. Under normal market conditions, the Fund’s long positions may range from 70% to 125% of the Fund’s total assets and its short positions may range from 60% to 100% of the Fund’s total assets. In making investment decisions for the Fund, Convergence utilizes a bottom-up approach that focuses on the individual strengths of the underlying companies and the relative and absolute attractiveness (and unattractiveness) of the companies within each industry group.
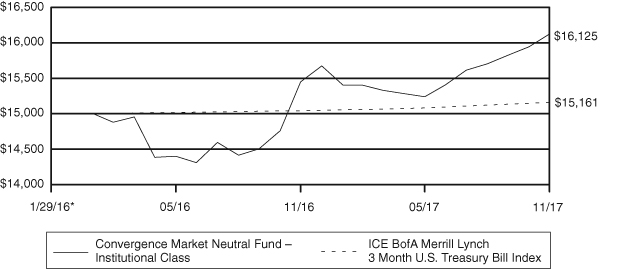
The Convergence Market Neutral Fund was up cumulatively 7.50% net of fees from its January 29, 2016, inception through November 30, 2017, while the ICE BofA Merrill Lynch 3 Month U.S. Treasury Bill Index was up 1.07% and the S&P 500 TR Index was up 41.95% cumulative over the same period.
Average Annual Total Returns (net of fees)
|
Since
|
||||
|
One
|
One
|
Inception
|
||
|
Through November 30, 2017
|
Month
|
YTD
|
Year
|
Annualized
|
|
Convergence Market Neutral
|
||||
|
Institutional Class (CPMNX)
|
1.13%
|
2.87%
|
4.37%
|
4.01%
|
|
ICE BofA Merrill Lynch 3 Month U.S. Treasury Bill
|
0.08%
|
0.74%
|
0.79%
|
0.58%
|
|
Russell 3000® Total Return
|
3.04%
|
19.93%
|
22.27%
|
21.61%
|
|
S&P 500 TR
|
3.07%
|
20.49%
|
22.87%
|
20.99%
|
6
|
Since
|
||||
|
One
|
Inception
|
|||
|
Through September 30, 2017
|
Quarter**
|
YTD
|
Year
|
Annualized
|
|
Convergence Market Neutral
|
||||
|
Institutional Class (CPMNX)
|
2.73%
|
0.96%
|
9.10%
|
3.26%
|
|
ICE BofA Merrill Lynch 3 Month U.S. Treasury Bill
|
0.26%
|
0.57%
|
0.66%
|
0.54%
|
|
S&P 500 TR
|
4.48%
|
14.24%
|
18.61%
|
19.45%
|
Fund inception = 1/29/2016
Performance data quoted represents past performance and does not guarantee future results. The investment return and principal value of an investment will fluctuate so that an investor’s shares, when redeemed, may be worth more or less than their original cost. Current performance of the Fund may be lower or higher than the performance quoted. Performance data current to the most recent month-end may be obtained by calling 1-877-677-9414.
The Gross Expense Ratio of the Fund is 4.29%, the Net Expense Ratio applicable to investors is 3.28% and the Net Expense Ratio excluding short dividends is 1.50%. Pursuant to an operating expense limitation agreement between the Adviser and the Fund, the Adviser has contractually agreed to waive its management fees and/or reimburse Fund expenses to ensure that total annual fund operating expenses (exclusive of dividends or interest expenses on short positions, acquired fund fees and expenses, leverage expenses (i.e., any expenses incurred in connection with borrowings made by the Fund), tax expenses, brokerage commissions, and extraordinary expenses) for the Fund does not exceed 1.50% of the Fund’s average net assets through March 30, 2019. Periods less than 12 months are not annualized.
**6/30/17 – 9/30/17
The Convergence fundamental stock picking methodology leads us toward holding companies in the long portfolios with strong cash flow, earnings, profits and other desirable financial characteristics. In addition, these favorable portfolio statistics are achieved without overpaying in terms of valuation. Our research has shown that, over time, companies with these ingredients have rewarded investors handsomely as these are signs of healthy and growing companies with competitively strong business models. Separately, the Convergence process also identifies companies with weak or declining fundamentals, and our research has shown this to be effective in sourcing alpha from shorting.
In closing, as we always say, “stick to fundamentals!” Thank you for your support.
|
David J. Abitz, CFA
|
Justin Neuberg, CFA
|
|
President & Chief Investment Officer
|
Co-Portfolio Manager
|
|
Convergence Investment Partners, LLC
|
Convergence Investment Partners, LLC
|
Disclosures
Past performance is not indicative of future results.
Diversification does not assure a profit nor protect against loss in a declining market.
This commentary is for informational purposes only and should not be viewed as a recommendation to buy or sell any security. Investors should seek financial advice regarding the appropriateness of investing in any securities or investment strategies
7
discussed in this documentation and should understand that statements regarding future prospects may not be realized. Investors should note that income from such securities may fluctuate and that each security’s price or value may rise or fall. Accordingly, investors may receive back less than originally invested. There is no guarantee that the views expressed will come to pass.
Mutual fund investing involves risk. Principal loss is possible. Investments in small, micro and midcap companies involve additional risks such as limited liquidity and greater volatility than larger capitalization companies. The Funds invest in foreign securities which involve greater volatility and political, economic and currency risks and differences in accounting methods. The Funds regularly make short sales of securities, which involves unlimited risk including the possibility that losses may exceed the original amount invested. However, a mutual fund investor’s risk is limited to one’s amount of investment in a mutual fund.
Must be preceded or accompanied by a prospectus.
The Funds are distributed by Quasar Distributors, LLC.
Alpha – The excess return of an investment relative to the return of a benchmark index is the investment’s alpha.
Correlation – A statistical measure that quantifies the degree to which two securities move in relation to each other. Correlations are used in advanced portfolio management and have a value that must fall between -1 and 1.
The Russell 2000® Total Return Index measures the performance of the small-cap segment of the U.S. equity universe. The Russell 2000® Total Return Index is a subset of the Russell 3000 Total Return Index.
The Russell 3000® Total Return Index measures the performance of the largest 3000 U.S. companies representing approximately 98% of the investable U.S. equity market.
The ICE BofA Merrill Lynch 3-Month U.S. Treasury Bill Index is an unmanaged market index of U.S. Treasury securities maturing in 90 days that assumes reinvestment of all income.
The S&P 500 Total Return Index is an American stock market index based on the market capitalizations of 500 large companies having common stock listed on the NYSE or NASDAQ and assumes that any cash distributions, such as dividends, are reinvested back into the index.
The volatility of an index may be materially different from that of the strategy due to varying degrees of diversification and other factors. Index returns do not reflect the deduction of any fees. You cannot invest directly in an index.
8
CONVERGENCE FUNDS
Expense Examples
(Unaudited)
As a shareholder of the Funds, you incur two types of costs: (1) transaction costs, and (2) ongoing costs, including management fees and other fund expenses. This Example is intended to help you understand your ongoing costs (in dollars) of investing in the Funds, and to compare these costs with the ongoing costs of investing in other mutual funds. The Examples are based on an investment of $1,000 invested at the beginning of the period and held for the entire period (6/1/17 – 11/30/17).
Actual Expenses
The first lines of the following tables provide information about actual account values and actual expenses. In addition, you will be assessed fees for outgoing wire transfers, returned checks and stop payment orders at prevailing rates charged by U.S. Bancorp Fund Services, LLC, the Funds’ transfer agent. If you request that a redemption be made by wire transfer, currently a $15.00 fee is charged by the Funds’ transfer agent. IRA accounts will be charged a $15.00 annual maintenance fee. To the extent the Funds invest in shares of exchange-traded funds or other investment companies as part of its investment strategy, you will indirectly bear your proportionate share of any fees and expenses charged by the underlying funds in which the Funds invest in addition to the expenses of the Funds. Actual expenses of the underlying funds are expected to vary among the various underlying funds. These expenses are not included in the example. The example includes, but is not limited to, management fees, fund administration and accounting, custody and transfer agent fees. You may use the information in this line, together with the amount you invested, to estimate the expenses that you paid over the period. Simply divide your account value by $1,000 (for example, an $8,600 account value divided by $1,000 = 8.6), then multiply the result by the number in the first line under the heading titled “Expenses Paid During Period” to estimate the expenses you paid on your account during this period.
Hypothetical Example for Comparison Purposes
The second lines of the following tables provide information about hypothetical account values and hypothetical expenses based on the Funds’ actual expense ratios and an assumed rate of return of 5% per year before expenses, which is not the Funds’ actual return. The hypothetical account values and expenses may not be used to estimate the actual ending account balance or expenses you paid for the period. You may use this information to compare the ongoing costs of investing in the Funds and other funds. To do so, compare this 5% hypothetical example with the 5% hypothetical examples that appear in the shareholder reports of other funds. Please note that the expenses shown in the table are meant to highlight your ongoing costs only and do not reflect any transactional costs, such as sales charges (loads), redemption fees or exchange fees. Therefore, the second line of the table is useful in comparing ongoing costs only, and will not help you determine the relative total costs of owning different funds.
9
CONVERGENCE FUNDS
Expense Examples (Continued)
(Unaudited)
|
Convergence Core Plus Fund –
|
|||
|
Institutional Class
|
|||
|
Beginning
|
Ending
|
Expenses Paid
|
|
|
Account Value
|
Account Value
|
During Period
|
|
|
6/1/17
|
11/30/17
|
6/1/17 – 11/30/17*
|
|
|
Actual**
|
$1,000.00
|
$1,137.40
|
$11.57
|
|
Hypothetical (5% return
|
|||
|
before expenses)***
|
$1,000.00
|
$1,014.24
|
$10.91
|
|
*
|
Expenses are equal to the Fund’s annualized expense ratio of 2.16%, multiplied by the average account value over the period, multiplied by 183/365 (to reflect the one-half year period). Excluding dividends on short positions, interest and broker expenses, the Fund’s annualized expense ratio would be 1.25%.
|
|
|
**
|
Excluding dividends on short positions, interest and broker expenses, your actual cost of investing in the Fund would be $6.70.
|
|
|
***
|
Excluding dividends on short positions, interest and broker expenses, your hypothetical cost of investing in the Fund would be $6.33.
|
|
Convergence Opportunities Fund –
|
|||
|
Institutional Class
|
|||
|
Beginning
|
Ending
|
Expenses Paid
|
|
|
Account Value
|
Account Value
|
During Period
|
|
|
6/1/17
|
11/30/17
|
6/1/17 – 11/30/17*
|
|
|
Actual**
|
$1,000.00
|
$1,146.90
|
$12.92
|
|
Hypothetical (5% return
|
|||
|
before expenses)***
|
$1,000.00
|
$1,013.04
|
$12.11
|
|
*
|
Expenses are equal to the Fund’s annualized expense ratio of 2.40%, multiplied by the average account value over the period, multiplied by 183/365 (to reflect the one-half year period). Excluding dividends on short positions, interest and broker expenses, the Fund’s annualized expense ratio would be 1.35%.
|
|
|
**
|
Excluding dividends on short positions, interest and broker expenses, your actual cost of investing in the Fund would be $7.27.
|
|
|
***
|
Excluding dividends on short positions, interest and broker expenses, your hypothetical cost of investing in the Fund would be $6.83.
|
10
CONVERGENCE FUNDS
Expense Examples (Continued)
(Unaudited)
|
Convergence Market Neutral Fund –
|
|||
|
Institutional Class
|
|||
|
Beginning
|
Ending
|
Expenses Paid
|
|
|
Account Value
|
Account Value
|
During Period
|
|
|
6/1/17
|
11/30/17
|
6/1/17 – 11/30/17*
|
|
|
Actual**
|
$1,000.00
|
$1,058.10
|
$12.18
|
|
Hypothetical (5% return
|
|||
|
before expenses)***
|
$1,000.00
|
$1,013.24
|
$11.91
|
|
*
|
Expenses are equal to the Fund’s annualized expense ratio of 2.36%, multiplied by the average account value over the period, multiplied by 183/365 (to reflect the one-half year period). Excluding dividends on short positions, interest and broker expenses, the Fund’s annualized expense ratio would be 1.50%.
|
|
|
**
|
Excluding dividends on short positions, interest and broker expenses, your actual cost of investing in the Fund would be $7.74.
|
|
|
***
|
Excluding dividends on short positions, interest and broker expenses, your hypothetical cost of investing in the Fund would be $7.59.
|
11
CONVERGENCE CORE PLUS FUND
Investment Highlights
(Unaudited)
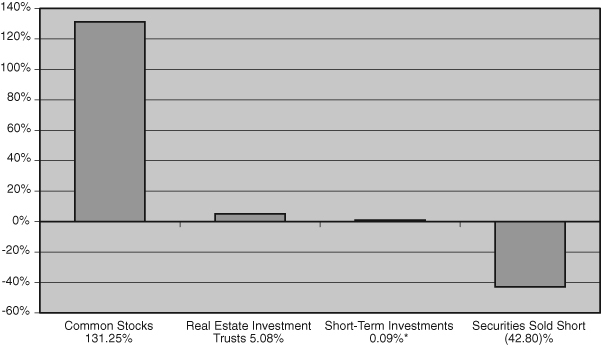
The Fund’s investment objective is to seek long-term capital growth. The Fund seeks to achieve this objective by establishing long and short positions in equity securities of domestic and foreign companies. The Fund focuses primarily on companies with medium and large market capitalizations, although the Fund may establish long and short positions in companies of any market capitalization. The Core Plus Fund generally considers companies with medium and large market capitalizations to be those that comprise the upper half of the Russell 3000® Total Return Index. The Fund will hold long (purchase) securities that the Adviser believes will outperform the market, and will sell short securities expected to underperform the market.
Allocation of Portfolio Holdings
(as a percentage of net assets)
|
*
|
Excludes securities lending collateral.
|
Continued
12
CONVERGENCE CORE PLUS FUND
Investment Highlights (Continued)
(Unaudited)
Average Annual Total Returns as of November 30, 2017
|
Russell
|
||||||||
|
Institutional
|
3000® Total
|
|||||||
|
Class Shares
|
Return Index
|
|||||||
|
One Year
|
18.81
|
%
|
22.27
|
%
|
||||
|
Three Year
|
9.12
|
%
|
10.75
|
%
|
||||
|
Five Year
|
13.97
|
%
|
15.63
|
%
|
||||
|
Since Inception (12/29/09)
|
14.22
|
%
|
13.78
|
%
|
||||
Performance data quoted represents past performance and does not guarantee future results. The investment return and principal value of an investment will fluctuate so that an investor’s shares, when redeemed, may be worth more or less than their original cost. Current performance of the Fund may be lower or higher than the performance quoted. Performance data current to the most recent month- end may be obtained by calling 877-677-9414.
Investment performance reflects fee waivers in effect. In the absence of such waivers, total returns would be reduced.
The returns shown assume reinvestment of Fund distributions and do not reflect the deduction of taxes that a shareholder would pay on Fund distributions or the redemption of Fund shares. The following graph illustrates performance of a hypothetical investment made in the Fund and a broad-based securities index on the Fund’s inception date for Institutional Class shares. The graph does not reflect any future performance.
The Russell 3000® Total Return Index measures the performance of the largest 3,000 U.S. companies representing approximately 98% of the investable U.S. equity market.
One cannot invest directly in an index.
|
|
|
Growth of $15,000 Investment
|
|
|
 |
|
|
|
*
|
Inception Date
|
13
CONVERGENCE OPPORTUNITIES FUND
Investment Highlights
(Unaudited)
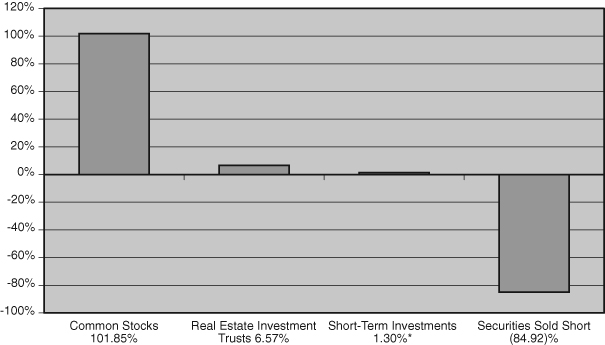
The Fund’s investment objective is to seek long-term capital growth. The Fund seeks to achieve this objective by establishing long and short positions in equity securities of domestic and foreign companies. The Fund focuses primarily on companies with small to medium market capitalizations, although the Fund may establish long and short positions in companies of any market capitalization. The Fund generally considers companies with small and medium market capitalizations to be those companies that comprise the lower 2,500 stocks by market capitalization of the Russell 3000® Total Return Index. The Fund will hold long (purchase) securities that the Adviser believes will outperform the market, and will sell short securities expected to underperform the market.
Allocation of Portfolio Holdings
(as a percentage of net assets)

|
*
|
Excludes securities lending collateral.
|
Continued
14
CONVERGENCE OPPORTUNITIES FUND
Investment Highlights (Continued)
(Unaudited)
Average Annual Total Returns as of November 30, 2017
|
Russell
|
||||||||
|
Institutional
|
2000® Total
|
|||||||
|
Class Shares
|
Return Index
|
|||||||
|
One Year
|
16.24
|
%
|
18.34
|
%
|
||||
|
Three Year
|
9.25
|
%
|
11.14
|
%
|
||||
|
Since Inception (11/29/13)
|
8.53
|
%
|
9.30
|
%
|
||||
Performance data quoted represents past performance and does not guarantee future results. The investment return and principal value of an investment will fluctuate so that an investor’s shares, when redeemed, may be worth more or less than their original cost. Current performance of the Fund may be lower or higher than the performance quoted. Performance data current to the most recent month- end may be obtained by calling 877-677-9414.
Investment performance reflects fee waivers in effect. In the absence of such waivers, total returns would be reduced.
The returns shown assume reinvestment of Fund distributions and do not reflect the deduction of taxes that a shareholder would pay on Fund distributions or the redemption of Fund shares. The following graph illustrates performance of a hypothetical investment made in the Fund and a broad-based securities index on the Fund’s inception date for Institutional Class shares. The graph does not reflect any future performance.
The Russell 2000® Total Return Index measures the performance of the small-cap segment of the U.S. equity universe. The Russell 2000® Total Return Index is a subset of the Russell 3000® Total Return Index.
One cannot invest directly in an index.
|
|
|
Growth of $15,000 Investment
|
|
|
 |
|
|
|
*
|
Inception Date
|
15
CONVERGENCE MARKET NEUTRAL FUND
Investment Highlights
(Unaudited)
The Fund’s investment objective is to seek positive absolute returns. The Fund seeks to achieve its investment objective by establishing long and short positions in equity securities of domestic and foreign companies that are deemed to be attractive (and likely to increase in price), or unattractive (and likely to decrease in price). The Fund is designed to be “market neutral,” targeting a portfolio designed to generate positive absolute returns with low correlation to the U.S. equity market over a normal business cycle. The Fund focuses primarily on companies with medium and large market capitalizations, although the Fund may establish long and short positions in companies of any market capitalization. The Fund will hold long (purchase) securities that the Adviser believes will outperform the market, and will sell short securities it expects to underperform the market.
Allocation of Portfolio Holdings
(as a percentage of net assets)
|
*
|
Excludes securities lending collateral.
|
Continued
16
CONVERGENCE MARKET NEUTRAL FUND
Investment Highlights (Continued)
(Unaudited)
Average Annual Returns as of November 30, 2017
|
ICE BofA
|
||||||||
|
Merrill Lynch
|
||||||||
|
3 Month
|
||||||||
|
Institutional
|
U.S. Treasury
|
|||||||
|
Class Shares
|
Bill Index
|
|||||||
|
One Year
|
4.37
|
%
|
0.79
|
%
|
||||
|
Since Inception (1/29/16)
|
4.01
|
%
|
0.58
|
%
|
||||
Performance data quoted represents past performance and does not guarantee future results. The investment return and principal value of an investment will fluctuate so that an investor’s shares, when redeemed, may be worth more or less than their original cost. Current performance of the Fund may be lower or higher than the performance quoted. Performance data current to the most recent month- end may be obtained by calling 877-677-9414.
Investment performance reflects fee waivers in effect. In the absence of such waivers, total returns would be reduced.
The returns shown assume reinvestment of Fund distributions and do not reflect the deduction of taxes that a shareholder would pay on Fund distributions or the redemption of Fund shares. The following graph illustrates performance of a hypothetical investment made in the Fund and a broad-based securities index on the Fund’s inception date for Institutional Class shares. The graph does not reflect any future performance.
The ICE BofA Merrill Lynch 3 Month U.S. Treasury Bill Index is a unmanaged market index of U.S. Treasury securities maturing in 90 days that assumes reinvestment of all income.
One cannot invest directly in an index.
|
|
|
Growth of $15,000 Investment
|
|
|
 |
|
|
|
*
|
Inception Date
|
17
CONVERGENCE CORE PLUS FUND
|
Schedule of Investments
|
November 30, 2017
|
Shares
|
Value
|
|||||||
|
COMMON STOCKS* 131.25%
|
||||||||
|
Accommodation 0.75%
|
||||||||
|
Penn National Gaming, Inc. (a)
|
33,697
|
$
|
969,125
|
|||||
|
Administrative and Support Services 2.76%
|
||||||||
|
Alliance Data Systems Corp.
|
8,666
|
2,073,513
|
||||||
|
ManpowerGroup, Inc.
|
3,845
|
495,621
|
||||||
|
Rollins, Inc.
|
8,830
|
409,271
|
||||||
|
TriNet Group, Inc. (a)
|
12,841
|
574,763
|
||||||
|
3,553,168
|
||||||||
|
Air Transportation 0.96%
|
||||||||
|
Copa Holdings SA – Class A (b)
|
9,203
|
1,234,951
|
||||||
|
Amusement, Gambling, and Recreation Industries 0.54%
|
||||||||
|
Las Vegas Sands Corp.
|
9,974
|
691,098
|
||||||
|
Apparel Manufacturing 0.22%
|
||||||||
|
Michael Kors Holdings Ltd. (a)(b)
|
4,873
|
284,778
|
||||||
|
Broadcasting (except Internet) 2.29%
|
||||||||
|
Comcast Corp. – Class A
|
42,325
|
1,588,881
|
||||||
|
Sinclair Broadcast Group, Inc. – Class A
|
39,476
|
1,344,158
|
||||||
|
2,933,039
|
||||||||
|
Building Material and Garden Equipment 2.85%
|
||||||||
|
Home Depot, Inc.
|
10,378
|
1,866,172
|
||||||
|
Lowe’s Companies, Inc.
|
21,601
|
1,800,875
|
||||||
|
3,667,047
|
||||||||
|
Chemical Manufacturing 10.36%
|
||||||||
|
AbbVie, Inc.
|
38,556
|
3,736,847
|
||||||
|
Bioverativ, Inc. (a)
|
5,096
|
254,902
|
||||||
|
Bristol-Myers Squibb Co.
|
43,849
|
2,770,818
|
||||||
|
Chemours Co.
|
16,110
|
828,054
|
||||||
|
Emergent BioSolutions, Inc. (a)
|
9,149
|
401,916
|
||||||
|
Gilead Sciences, Inc.
|
28,680
|
2,144,690
|
||||||
|
Huntsman Corp.
|
26,060
|
832,878
|
||||||
|
IDEXX Laboratories, Inc. (a)
|
8,508
|
1,330,736
|
||||||
|
Vertex Pharmaceuticals, Inc. (a)
|
6,995
|
1,009,309
|
||||||
|
13,310,150
|
||||||||
The accompanying notes are an integral part of these financial statements.
18
CONVERGENCE CORE PLUS FUND
|
Schedule of Investments (Continued)
|
November 30, 2017
|
Shares
|
Value
|
|||||||
|
Computer and Electronic Product Manufacturing 13.77%
|
||||||||
|
Apple, Inc.
|
18,116
|
$
|
3,113,234
|
|||||
|
Applied Materials, Inc.
|
32,039
|
1,690,697
|
||||||
|
ARRIS International PLC (a)(b)
|
36,637
|
1,098,011
|
||||||
|
Cisco Systems, Inc.
|
23,069
|
860,474
|
||||||
|
Jabil, Inc.
|
36,515
|
1,053,458
|
||||||
|
Lam Research Corp.
|
8,763
|
1,685,388
|
||||||
|
NetApp, Inc.
|
32,559
|
1,839,909
|
||||||
|
ON Semiconductor Corp. (a)
|
83,586
|
1,678,407
|
||||||
|
Skyworks Solutions, Inc.
|
13,770
|
1,442,270
|
||||||
|
Teradata Corp. (a)
|
56,078
|
2,131,525
|
||||||
|
Vishay Intertechnology, Inc.
|
50,601
|
1,108,162
|
||||||
|
17,701,535
|
||||||||
|
Construction of Buildings 1.24%
|
||||||||
|
KB Home
|
18,289
|
573,543
|
||||||
|
PulteGroup, Inc.
|
16,375
|
558,879
|
||||||
|
Toll Brothers, Inc.
|
9,251
|
465,603
|
||||||
|
1,598,025
|
||||||||
|
Credit Intermediation and Related Activities 10.74%
|
||||||||
|
Bank of America Corp.
|
125,490
|
3,535,053
|
||||||
|
Capital One Financial Corp.
|
18,195
|
1,673,940
|
||||||
|
CIT Group, Inc.
|
7,290
|
363,334
|
||||||
|
Citigroup, Inc.
|
46,684
|
3,524,642
|
||||||
|
Fifth Third Bancorp.
|
11,620
|
354,526
|
||||||
|
JPMorgan Chase & Co.
|
34,709
|
3,627,784
|
||||||
|
Nationstar Mortgage Holdings, Inc. (a)(c)
|
19,836
|
358,437
|
||||||
|
Regions Financial Corp.
|
21,936
|
363,918
|
||||||
|
13,801,634
|
||||||||
|
Electrical Equipment, Appliance, and
|
||||||||
|
Component Manufacturing 0.32%
|
||||||||
|
Generac Holdings, Inc. (a)
|
8,296
|
407,914
|
||||||
|
Fabricated Metal Product Manufacturing 0.64%
|
||||||||
|
Mueller Industries, Inc.
|
11,918
|
433,815
|
||||||
|
Rexnord Corp. (a)
|
15,774
|
393,088
|
||||||
|
|
826,903
|
|||||||
|
Food Manufacturing 5.68%
|
||||||||
|
General Mills, Inc.
|
27,365
|
1,547,764
|
||||||
|
Pilgrim’s Pride Corp. (a)
|
56,318
|
2,065,181
|
||||||
The accompanying notes are an integral part of these financial statements.
19
CONVERGENCE CORE PLUS FUND
|
Schedule of Investments (Continued)
|
November 30, 2017
|
Shares
|
Value
|
|||||||
|
Food Manufacturing 5.68% (Continued)
|
||||||||
|
Sanderson Farms, Inc.
|
11,229
|
$
|
1,905,449
|
|||||
|
Tyson Foods, Inc. – Class A
|
21,733
|
1,787,539
|
||||||
|
7,305,933
|
||||||||
|
Food Services and Drinking Places 0.72%
|
||||||||
|
Hyatt Hotels Corp. – Class A (a)
|
12,760
|
923,314
|
||||||
|
General Merchandise Stores 3.03%
|
||||||||
|
Target Corp.
|
25,757
|
1,542,844
|
||||||
|
Wal-Mart Stores, Inc.
|
24,213
|
2,354,231
|
||||||
|
3,897,075
|
||||||||
|
Health and Personal Care Stores 2.61%
|
||||||||
|
Express Scripts Holding Co. (a)
|
20,553
|
1,339,645
|
||||||
|
McKesson Corp.
|
9,523
|
1,406,928
|
||||||
|
Walgreens Boots Alliance, Inc.
|
8,299
|
603,835
|
||||||
|
3,350,408
|
||||||||
|
Insurance Carriers and Related Activities 8.66%
|
||||||||
|
Centene Corp. (a)
|
13,772
|
1,405,983
|
||||||
|
CNO Financial Group, Inc.
|
38,145
|
961,635
|
||||||
|
First American Financial Corp.
|
17,454
|
970,268
|
||||||
|
Humana, Inc.
|
5,339
|
1,392,732
|
||||||
|
Lincoln National Corp.
|
12,209
|
934,599
|
||||||
|
MGIC Investment Corp. (a)
|
25,679
|
375,427
|
||||||
|
Torchmark Corp.
|
11,195
|
994,676
|
||||||
|
UnitedHealth Group, Inc.
|
6,632
|
1,513,223
|
||||||
|
Unum Group
|
18,750
|
1,061,625
|
||||||
|
WellCare Health Plans, Inc. (a)
|
7,180
|
1,529,268
|
||||||
|
11,139,436
|
||||||||
|
Leather and Allied Product Manufacturing 0.43%
|
||||||||
|
Deckers Outdoor Corp. (a)
|
7,438
|
555,842
|
||||||
|
Machinery Manufacturing 3.26%
|
||||||||
|
Caterpillar, Inc.
|
19,318
|
2,726,736
|
||||||
|
Cummins, Inc.
|
5,378
|
900,277
|
||||||
|
SPX FLOW, Inc. (a)
|
12,512
|
560,162
|
||||||
|
4,187,175
|
||||||||
|
Management of Companies and Enterprises 0.80%
|
||||||||
|
AES Corp.
|
97,366
|
1,030,132
|
||||||
The accompanying notes are an integral part of these financial statements.
20
CONVERGENCE CORE PLUS FUND
|
Schedule of Investments (Continued)
|
November 30, 2017
|
Shares
|
Value
|
|||||||
|
Merchant Wholesalers, Durable Goods 1.63%
|
||||||||
|
Builders FirstSource, Inc. (a)
|
25,086
|
$
|
511,754
|
|||||
|
Honeywell International, Inc.
|
10,171
|
1,586,269
|
||||||
|
2,098,023
|
||||||||
|
Merchant Wholesalers, Nondurable Goods 2.02%
|
||||||||
|
Ingevity Corp. (a)
|
12,540
|
998,059
|
||||||
|
Nu Skin Enterprises, Inc. – Class A
|
23,538
|
1,598,466
|
||||||
|
2,596,525
|
||||||||
|
Mining (except Oil and Gas) 0.63%
|
||||||||
|
Freeport-McMoRan, Inc. – Class B (a)
|
58,053
|
808,098
|
||||||
|
Miscellaneous Manufacturing 1.11%
|
||||||||
|
Estee Lauder Companies, Inc. – Class A
|
9,500
|
1,185,885
|
||||||
|
MSA Safety, Inc.
|
2,761
|
237,446
|
||||||
|
1,423,331
|
||||||||
|
Motion Picture and Sound Recording Industries 1.27%
|
||||||||
|
Netflix, Inc. (a)
|
8,674
|
1,627,069
|
||||||
|
Nonmetallic Mineral Product Manufacturing 0.60%
|
||||||||
|
Owens-Illinois, Inc. (a)
|
32,036
|
775,912
|
||||||
|
Nonstore Retailers 1.53%
|
||||||||
|
Amazon.com, Inc. (a)
|
1,671
|
1,966,349
|
||||||
|
Other Information Services 2.95%
|
||||||||
|
Alphabet, Inc. – Class C (a)
|
1,943
|
1,984,600
|
||||||
|
Facebook, Inc. – Class A (a)
|
10,229
|
1,812,374
|
||||||
|
3,796,974
|
||||||||
|
Performing Arts, Spectator Sports, and Related Industries 1.18%
|
||||||||
|
Live Nation Entertainment, Inc. (a)
|
33,496
|
1,520,049
|
||||||
|
Personal and Laundry Services 0.56%
|
||||||||
|
Weight Watchers International, Inc. (a)(c)
|
16,380
|
721,867
|
||||||
|
Petroleum and Coal Products Manufacturing 7.75%
|
||||||||
|
Chevron Corp.
|
9,808
|
1,167,054
|
||||||
|
CVR Energy, Inc. (c)(d)
|
57,942
|
1,891,806
|
||||||
|
Exxon Mobil Corp. (c)
|
15,440
|
1,285,998
|
||||||
|
HollyFrontier Corp.
|
38,179
|
1,698,202
|
||||||
The accompanying notes are an integral part of these financial statements.
21
CONVERGENCE CORE PLUS FUND
|
Schedule of Investments (Continued)
|
November 30, 2017
|
Shares
|
Value
|
|||||||
|
Petroleum and Coal Products Manufacturing 7.75% (Continued)
|
||||||||
|
Marathon Petroleum Corp.
|
20,437
|
$
|
1,279,969
|
|||||
|
PBF Energy, Inc. – Class A (c)(d)
|
28,236
|
913,999
|
||||||
|
Valero Energy Corp.
|
20,077
|
1,718,993
|
||||||
|
9,956,021
|
||||||||
|
Primary Metal Manufacturing 0.61%
|
||||||||
|
Alcoa Corp. (a)
|
18,880
|
783,709
|
||||||
|
Professional, Scientific, and Technical Services 8.31%
|
||||||||
|
Amgen, Inc.
|
19,325
|
3,394,630
|
||||||
|
Aspen Technology, Inc. (a)
|
29,104
|
1,947,640
|
||||||
|
eBay, Inc. (a)
|
51,616
|
1,789,527
|
||||||
|
F5 Networks, Inc. (a)
|
9,345
|
1,254,099
|
||||||
|
VMware, Inc. – Class A (a)(c)
|
19,142
|
2,299,145
|
||||||
|
10,685,041
|
||||||||
|
Publishing Industries (except Internet) 6.21%
|
||||||||
|
Citrix Systems, Inc. (a)
|
23,297
|
2,041,516
|
||||||
|
Fortinet, Inc. (a)
|
47,700
|
2,006,262
|
||||||
|
Microsoft Corp.
|
24,707
|
2,079,587
|
||||||
|
Oracle Corp.
|
38,070
|
1,867,714
|
||||||
|
7,995,079
|
||||||||
|
Rail Transportation 0.75%
|
||||||||
|
Union Pacific Corp.
|
7,597
|
961,021
|
||||||
|
Real Estate 0.94%
|
||||||||
|
CBRE Group, Inc. – Class A (a)
|
15,160
|
657,338
|
||||||
|
Realogy Holdings Corp.
|
19,924
|
556,079
|
||||||
|
1,213,417
|
||||||||
|
Rental and Leasing Services 0.44%
|
||||||||
|
Triton International Ltd. – Class A (b)
|
14,148
|
559,836
|
||||||
|
Securities, Commodity Contracts, and Other Financial
|
||||||||
|
Investments and Related Activities 6.37%
|
||||||||
|
BGC Partners, Inc. – Class A
|
96,750
|
1,579,928
|
||||||
|
Legg Mason, Inc.
|
39,712
|
1,586,892
|
||||||
|
Morgan Stanley
|
32,326
|
1,668,344
|
||||||
|
Stifel Financial Corp.
|
28,191
|
1,585,462
|
||||||
|
Travelport Worldwide Ltd. (b)
|
132,036
|
1,767,962
|
||||||
|
8,188,588
|
||||||||
The accompanying notes are an integral part of these financial statements.
22
CONVERGENCE CORE PLUS FUND
|
Schedule of Investments (Continued)
|
November 30, 2017
|
Shares
|
Value
|
|||||||
|
Support Activities for Mining 0.85%
|
||||||||
|
MDU Resources Group, Inc.
|
39,305
|
$
|
1,098,575
|
|||||
|
Support Activities for Transportation 1.07%
|
||||||||
|
XPO Logistics, Inc. (a)
|
17,477
|
1,381,207
|
||||||
|
Telecommunications 2.44%
|
||||||||
|
AT&T, Inc.
|
86,192
|
3,135,665
|
||||||
|
Transportation Equipment Manufacturing 5.55%
|
||||||||
|
Allison Transmission Holdings, Inc.
|
12,490
|
512,590
|
||||||
|
Boeing Co.
|
13,924
|
3,854,163
|
||||||
|
Dana, Inc.
|
29,826
|
985,451
|
||||||
|
Lear Corp.
|
4,817
|
871,347
|
||||||
|
Meritor, Inc. (a)
|
20,402
|
509,642
|
||||||
|
Moog, Inc. – Class A (a)
|
4,792
|
403,055
|
||||||
|
7,136,248
|
||||||||
|
Truck Transportation 0.21%
|
||||||||
|
Schneider National, Inc. – Class B
|
10,357
|
271,664
|
||||||
|
Utilities 2.38%
|
||||||||
|
CenterPoint Energy, Inc.
|
32,870
|
986,428
|
||||||
|
Exelon Corp.
|
22,749
|
948,861
|
||||||
|
National Fuel Gas Co.
|
19,018
|
1,118,259
|
||||||
|
3,053,548
|
||||||||
|
Water Transportation 0.61%
|
||||||||
|
Royal Caribbean Cruises Ltd. (b)
|
6,289
|
779,081
|
||||||
|
Wood Product Manufacturing 0.65%
|
||||||||
|
Louisiana-Pacific Corp. (a)
|
30,496
|
841,995
|
||||||
|
TOTAL COMMON STOCKS (Cost $136,604,471)
|
168,743,574
|
|||||||
|
REAL ESTATE INVESTMENT TRUSTS* 5.08%
|
||||||||
|
American Tower Corp.
|
3,329
|
479,143
|
||||||
|
First Industrial Realty Trust, Inc.
|
16,118
|
524,641
|
||||||
|
Invesco Mortgage Capital, Inc.
|
55,915
|
987,459
|
||||||
|
LaSalle Hotel Properties
|
22,225
|
632,079
|
||||||
|
Mack-Cali Realty Corp.
|
16,875
|
373,444
|
||||||
|
Park Hotels & Resorts, Inc.
|
22,901
|
668,709
|
||||||
|
Piedmont Office Realty Trust, Inc. – Class A
|
19,753
|
393,875
|
||||||
|
Potlatch Corp.
|
12,221
|
630,604
|
||||||
The accompanying notes are an integral part of these financial statements.
23
CONVERGENCE CORE PLUS FUND
|
Schedule of Investments (Continued)
|
November 30, 2017
|
Shares
|
Value
|
|||||||
|
REAL ESTATE INVESTMENT TRUSTS* 5.08% (Continued)
|
||||||||
|
Prologis, Inc.
|
8,502
|
$
|
563,087
|
|||||
|
PS Business Parks, Inc.
|
4,522
|
599,436
|
||||||
|
Xenia Hotels & Resorts, Inc.
|
31,139
|
684,747
|
||||||
|
TOTAL REAL ESTATE INVESTMENT TRUSTS (Cost $6,101,404)
|
6,537,224 | |||||||
|
INVESTMENTS PURCHASED WITH PROCEEDS
|
||||||||
|
FROM SECURITIES LENDING 1.90%
|
||||||||
|
Money Market Fund 1.90%
|
||||||||
|
First American Government Obligations
|
||||||||
|
Fund, Class Y, 0.670% (c)(e)
|
2,438,410
|
2,438,410
|
||||||
|
TOTAL INVESTMENTS PURCHASED WITH PROCEEDS
|
||||||||
|
FROM SECURITIES LENDING (Cost $2,438,410)
|
2,438,410
|
|||||||
|
SHORT-TERM INVESTMENTS 0.09%
|
||||||||
|
Fidelity Institutional Money Market Funds –
|
||||||||
|
Government Portfolio – Class I, 0.970% (c)(e)
|
113,003
|
113,003
|
||||||
|
TOTAL SHORT-TERM INVESTMENTS (Cost $113,003)
|
113,003
|
|||||||
|
Total Investments (Cost $145,257,288) 138.32%
|
177,832,211
|
|||||||
|
Liabilities in Excess of Other Assets (38.32)%
|
(49,266,937
|
)
|
||||||
|
TOTAL NET ASSETS 100.00%
|
$
|
128,565,274
|
||||||
Percentages are stated as a percent of net assets.
|
*
|
Unless otherwise noted, all or a portion of these securities, totaling $167,619,034, are pledged as collateral for securities sold short.
|
|
(a)
|
Non-income producing security.
|
|
(b)
|
Foreign issued security.
|
|
(c)
|
This security is not pledged as collateral for securities sold short.
|
|
(d)
|
All or a portion of this security is out on loan.
|
|
(e)
|
Seven day yield as of November 30, 2017.
|
|
Abbreviations:
|
|
|
Ltd.
|
Limited Liability Company.
|
|
PLC
|
Public Limited Company.
|
|
SA
|
Generally designates a type of corporation in various countries, mostly those employing a civil law legal system.
|
The accompanying notes are an integral part of these financial statements.
24
CONVERGENCE CORE PLUS FUND
|
Schedule of Securities Sold Short
|
November 30, 2017
|
Shares
|
Value
|
|||||||
|
SECURITIES SOLD SHORT (42.80)%
|
||||||||
|
COMMON STOCKS (40.74)%
|
||||||||
|
Accommodation (0.19)%
|
||||||||
|
Red Rock Resorts, Inc. – Class A
|
(7,810
|
)
|
$
|
(240,939
|
)
|
|||
|
Administrative and Support Services (0.86)%
|
||||||||
|
Gartner, Inc.
|
(3,873
|
)
|
(468,207
|
)
|
||||
|
TripAdvisor, Inc.
|
(15,048
|
)
|
(520,962
|
)
|
||||
|
WageWorks, Inc.
|
(1,878
|
)
|
(120,474
|
)
|
||||
|
(1,109,643
|
)
|
|||||||
|
Air Transportation (0.43)%
|
||||||||
|
Allegiant Travel Co.
|
(1,920
|
)
|
(291,840
|
)
|
||||
|
Spirit Airlines, Inc.
|
(6,167
|
)
|
(262,899
|
)
|
||||
|
(554,739
|
)
|
|||||||
|
Ambulatory Health Care Services (0.72)%
|
||||||||
|
Envision Healthcare Corp.
|
(11,180
|
)
|
(356,976
|
)
|
||||
|
Loxo Oncology, Inc.
|
(3,010
|
)
|
(231,018
|
)
|
||||
|
MEDNAX, Inc.
|
(6,750
|
)
|
(336,083
|
)
|
||||
|
(924,077
|
)
|
|||||||
|
Amusement, Gambling, and Recreation Industries (0.37)%
|
||||||||
|
Global Payments, Inc.
|
(4,758
|
)
|
(478,464
|
)
|
||||
|
Apparel Manufacturing (0.29)%
|
||||||||
|
Lululemon Athletica, Inc.
|
(1,502
|
)
|
(100,574
|
)
|
||||
|
Under Armour, Inc. – Class C
|
(11,890
|
)
|
(141,848
|
)
|
||||
|
UniFirst Corp.
|
(790
|
)
|
(129,165
|
)
|
||||
|
(371,587
|
)
|
|||||||
|
Broadcasting (except Internet) (0.67)%
|
||||||||
|
Charter Communications, Inc. – Class A
|
(2,130
|
)
|
(694,828
|
)
|
||||
|
Liberty Broadband Corp. – Class A
|
(1,954
|
)
|
(167,477
|
)
|
||||
|
(862,305
|
)
|
|||||||
|
Building Material and Garden Equipment (0.24)%
|
||||||||
|
MSC Industrial Direct Company, Inc. – Class A
|
(3,370
|
)
|
(303,536
|
)
|
||||
|
Chemical Manufacturing (3.44)%
|
||||||||
|
ACADIA Pharmaceuticals, Inc.
|
(11,738
|
)
|
(355,075
|
)
|
||||
|
Agios Pharmaceuticals, Inc.
|
(5,135
|
)
|
(316,059
|
)
|
||||
|
Air Products & Chemicals, Inc.
|
(1,540
|
)
|
(251,082
|
)
|
||||
The accompanying notes are an integral part of these financial statements.
25
CONVERGENCE CORE PLUS FUND
|
Schedule of Securities Sold Short (Continued)
|
November 30, 2017
|
Shares
|
Value
|
|||||||
|
Chemical Manufacturing (3.44)% (Continued)
|
||||||||
|
Ashland Global Holdings, Inc.
|
(2,950
|
)
|
$
|
(218,241
|
)
|
|||
|
Avexis, Inc.
|
(3,140
|
)
|
(297,703
|
)
|
||||
|
Bluebird Bio, Inc.
|
(4,480
|
)
|
(774,144
|
)
|
||||
|
Clovis Oncology, Inc.
|
(4,690
|
)
|
(294,860
|
)
|
||||
|
Coty, Inc. – Class A
|
(26,172
|
)
|
(450,944
|
)
|
||||
|
Incyte Corp.
|
(3,360
|
)
|
(332,606
|
)
|
||||
|
Medicines Co.
|
(6,340
|
)
|
(183,860
|
)
|
||||
|
Seattle Genetics, Inc.
|
(4,205
|
)
|
(256,211
|
)
|
||||
|
TESARO, Inc.
|
(5,194
|
)
|
(439,413
|
)
|
||||
|
Ultragenyx Pharmaceutical, Inc.
|
(4,850
|
)
|
(244,877
|
)
|
||||
|
(4,415,075
|
)
|
|||||||
|
Clothing and Clothing Accessories Stores (0.47)%
|
||||||||
|
Foot Locker, Inc.
|
(13,985
|
)
|
(599,117
|
)
|
||||
|
Computer and Electronic Product Manufacturing (2.93)%
|
||||||||
|
Analog Devices, Inc.
|
(4,430
|
)
|
(381,467
|
)
|
||||
|
Cavium, Inc.
|
(5,197
|
)
|
(444,241
|
)
|
||||
|
DexCom, Inc.
|
(6,860
|
)
|
(400,829
|
)
|
||||
|
Hologic, Inc.
|
(8,155
|
)
|
(340,227
|
)
|
||||
|
Infinera Corp.
|
(55,031
|
)
|
(398,424
|
)
|
||||
|
Inphi Corp.
|
(9,862
|
)
|
(405,032
|
)
|
||||
|
MACOM Technology Solutions Holdings, Inc.
|
(13,230
|
)
|
(431,166
|
)
|
||||
|
MaxLinear, Inc.
|
(16,510
|
)
|
(436,029
|
)
|
||||
|
ViaSat, Inc.
|
(7,058
|
)
|
(523,986
|
)
|
||||
|
(3,761,401
|
)
|
|||||||
|
Construction of Buildings (0.52)%
|
||||||||
|
Dycom Industries, Inc.
|
(3,220
|
)
|
(345,731
|
)
|
||||
|
Taylor Morrison Home Corp. – Class A
|
(5,680
|
)
|
(137,229
|
)
|
||||
|
TRI Pointe Group, Inc.
|
(10,300
|
)
|
(186,636
|
)
|
||||
|
(669,596
|
)
|
|||||||
|
Credit Intermediation and Related Activities (3.04)%
|
||||||||
|
Flagstar Bancorp, Inc.
|
(4,940
|
)
|
(187,769
|
)
|
||||
|
FNB Corp.
|
(25,920
|
)
|
(367,805
|
)
|
||||
|
LendingClub Corp.
|
(84,155
|
)
|
(367,757
|
)
|
||||
|
Old National Bancorp.
|
(11,850
|
)
|
(216,263
|
)
|
||||
|
Pinnacle Financial Partners, Inc.
|
(6,540
|
)
|
(448,971
|
)
|
||||
|
Signature Bank
|
(4,841
|
)
|
(664,572
|
)
|
||||
|
SLM Corp.
|
(38,649
|
)
|
(447,169
|
)
|
||||
|
Sterling Bancorp.
|
(19,660
|
)
|
(498,381
|
)
|
||||
The accompanying notes are an integral part of these financial statements.
26
CONVERGENCE CORE PLUS FUND
|
Schedule of Securities Sold Short (Continued)
|
November 30, 2017
|
Shares
|
Value
|
|||||||
|
Credit Intermediation and Related Activities (3.04)% (Continued)
|
||||||||
|
SVB Financial Group
|
(955
|
)
|
$
|
(217,396
|
)
|
|||
|
TCF Financial Corp.
|
(15,040
|
)
|
(305,462
|
)
|
||||
|
TFS Financial Corp.
|
(11,814
|
)
|
(179,927
|
)
|
||||
|
(3,901,472
|
)
|
|||||||
|
Electrical Equipment, Appliance, and
|
||||||||
|
Component Manufacturing (0.34)%
|
||||||||
|
Spectrum Brands Holdings, Inc.
|
(3,766
|
)
|
(432,638
|
)
|
||||
|
Fabricated Metal Product Manufacturing (0.54)%
|
||||||||
|
Axalta Coating Systems Ltd. (a)
|
(6,640
|
)
|
(210,222
|
)
|
||||
|
Ball Corp.
|
(4,744
|
)
|
(189,333
|
)
|
||||
|
Simpson Manufacturing Company, Inc.
|
(5,010
|
)
|
(300,450
|
)
|
||||
|
(700,005
|
)
|
|||||||
|
Food and Beverage Stores (0.78)%
|
||||||||
|
GrubHub, Inc.
|
(8,230
|
)
|
(556,019
|
)
|
||||
|
Sprouts Farmers Market, Inc.
|
(19,860
|
)
|
(464,326
|
)
|
||||
|
(1,020,345
|
)
|
|||||||
|
Food Manufacturing (1.79)%
|
||||||||
|
B&G Foods, Inc.
|
(13,727
|
)
|
(531,235
|
)
|
||||
|
J.M. Smucker Co.
|
(3,880
|
)
|
(452,680
|
)
|
||||
|
Kraft Heinz Co.
|
(5,444
|
)
|
(442,978
|
)
|
||||
|
McCormick & Company, Inc.
|
(4,012
|
)
|
(409,946
|
)
|
||||
|
TreeHouse Foods, Inc.
|
(10,320
|
)
|
(474,926
|
)
|
||||
|
(2,311,765
|
)
|
|||||||
|
Food Services and Drinking Places (1.17)%
|
||||||||
|
Casey’s General Stores, Inc.
|
(3,522
|
)
|
(425,281
|
)
|
||||
|
Cheesecake Factory, Inc.
|
(4,300
|
)
|
(210,872
|
)
|
||||
|
Dunkin’ Brands Group, Inc.
|
(3,260
|
)
|
(194,622
|
)
|
||||
|
Jack in the Box, Inc.
|
(1,840
|
)
|
(190,458
|
)
|
||||
|
McDonald’s Corp.
|
(1,138
|
)
|
(195,702
|
)
|
||||
|
Yum! Brands, Inc.
|
(3,446
|
)
|
(287,637
|
)
|
||||
|
(1,504,572
|
)
|
|||||||
|
Furniture and Home Furnishings Stores (0.37)%
|
||||||||
|
Bed Bath & Beyond, Inc.
|
(21,150
|
)
|
(473,549
|
)
|
||||
|
General Merchandise Stores (0.42)%
|
||||||||
|
Macy’s, Inc.
|
(22,430
|
)
|
(533,834
|
)
|
||||
The accompanying notes are an integral part of these financial statements.
27
CONVERGENCE CORE PLUS FUND
|
Schedule of Securities Sold Short (Continued)
|
November 30, 2017
|
Shares
|
Value
|
|||||||
|
Insurance Carriers and Related Activities (1.17)%
|
||||||||
|
American International Group, Inc.
|
(3,886
|
)
|
$
|
(233,005
|
)
|
|||
|
AmTrust Financial Services, Inc.
|
(16,890
|
)
|
(162,820
|
)
|
||||
|
Aspen Insurance Holdings Ltd. (a)
|
(4,950
|
)
|
(202,950
|
)
|
||||
|
Navigators Group, Inc.
|
(3,349
|
)
|
(172,474
|
)
|
||||
|
RLI Corp.
|
(2,406
|
)
|
(143,710
|
)
|
||||
|
Third Point Reinsurance Ltd. (a)
|
(12,296
|
)
|
(208,417
|
)
|
||||
|
White Mountains Insurance Group Ltd. (a)
|
(274
|
)
|
(244,131
|
)
|
||||
|
Willis Towers Watson PLC (a)
|
(916
|
)
|
(147,293
|
)
|
||||
|
(1,514,800
|
)
|
|||||||
|
Machinery Manufacturing (1.39)%
|
||||||||
|
AAON, Inc.
|
(5,627
|
)
|
(205,104
|
)
|
||||
|
Flowserve Corp.
|
(6,340
|
)
|
(269,957
|
)
|
||||
|
II-VI, Inc.
|
(10,317
|
)
|
(489,026
|
)
|
||||
|
IMAX Corp. (a)
|
(8,160
|
)
|
(207,264
|
)
|
||||
|
Middleby Corp.
|
(2,520
|
)
|
(321,350
|
)
|
||||
|
Nordson Corp.
|
(2,280
|
)
|
(292,661
|
)
|
||||
|
(1,785,362
|
)
|
|||||||
|
Management of Companies and Enterprises (0.46)%
|
||||||||
|
Ameris Bancorp.
|
(4,053
|
)
|
(201,029
|
)
|
||||
|
ServisFirst Bancshares, Inc.
|
(5,163
|
)
|
(216,794
|
)
|
||||
|
Simmons First National Corp. – Class A
|
(2,903
|
)
|
(168,084
|
)
|
||||
|
(585,907
|
)
|
|||||||
|
Merchant Wholesalers, Durable Goods (0.37)%
|
||||||||
|
American Axle & Manufacturing Holdings, Inc.
|
(14,156
|
)
|
(254,100
|
)
|
||||
|
Mohawk Industries, Inc.
|
(771
|
)
|
(217,892
|
)
|
||||
|
(471,992
|
)
|
|||||||
|
Merchant Wholesalers, Nondurable Goods (0.13)%
|
||||||||
|
Global Blood Therapeutics, Inc.
|
(4,150
|
)
|
(163,718
|
)
|
||||
|
Mining (except Oil and Gas) (0.47)%
|
||||||||
|
Hecla Mining Co.
|
(52,181
|
)
|
(195,157
|
)
|
||||
|
Martin Marietta Materials, Inc.
|
(1,084
|
)
|
(225,894
|
)
|
||||
|
Vulcan Materials Co.
|
(1,507
|
)
|
(189,355
|
)
|
||||
|
(610,406
|
)
|
|||||||
|
Miscellaneous Manufacturing (1.36)%
|
||||||||
|
DENTSPLY SIRONA, Inc.
|
(5,350
|
)
|
(358,503
|
)
|
||||
|
Mattel, Inc.
|
(8,090
|
)
|
(147,643
|
)
|
||||
The accompanying notes are an integral part of these financial statements.
28
CONVERGENCE CORE PLUS FUND
|
Schedule of Securities Sold Short (Continued)
|
November 30, 2017
|
Shares
|
Value
|
|||||||
|
Miscellaneous Manufacturing (1.36)% (Continued)
|
||||||||
|
Nevro Corp.
|
(4,146
|
)
|
$
|
(310,204
|
)
|
|||
|
NuVasive, Inc.
|
(5,440
|
)
|
(313,834
|
)
|
||||
|
Stryker Corp.
|
(1,971
|
)
|
(307,476
|
)
|
||||
|
Wright Medical Group NV (a)
|
(12,981
|
)
|
(315,568
|
)
|
||||
|
(1,753,228
|
)
|
|||||||
|
Motion Picture and Sound Recording Industries (0.24)%
|
||||||||
|
Regal Entertainment Group – Class A
|
(15,374
|
)
|
(310,709
|
)
|
||||
|
Motor Vehicle and Parts Dealers (0.42)%
|
||||||||
|
Advance Auto Parts, Inc.
|
(5,289
|
)
|
(534,189
|
)
|
||||
|
Nonmetallic Mineral Product Manufacturing (0.25)%
|
||||||||
|
USG Corp.
|
(8,309
|
)
|
(315,825
|
)
|
||||
|
Nonstore Retailers (0.24)%
|
||||||||
|
WW Grainger, Inc.
|
(1,418
|
)
|
(313,818
|
)
|
||||
|
Oil and Gas Extraction (1.75)%
|
||||||||
|
Callon Petroleum Co.
|
(31,130
|
)
|
(343,675
|
)
|
||||
|
Diamondback Energy, Inc.
|
(3,147
|
)
|
(343,999
|
)
|
||||
|
Extraction Oil & Gas, Inc.
|
(15,938
|
)
|
(240,026
|
)
|
||||
|
Jagged Peak Energy, Inc.
|
(25,180
|
)
|
(382,233
|
)
|
||||
|
MRC Global, Inc.
|
(16,280
|
)
|
(255,759
|
)
|
||||
|
Parsley Energy, Inc. – Class A
|
(12,876
|
)
|
(345,849
|
)
|
||||
|
RSP Permian, Inc.
|
(9,040
|
)
|
(332,039
|
)
|
||||
|
(2,243,580
|
)
|
|||||||
|
Other Information Services (0.78)%
|
||||||||
|
Box, Inc. – Class A
|
(24,360
|
)
|
(512,290
|
)
|
||||
|
Twitter, Inc.
|
(23,853
|
)
|
(490,895
|
)
|
||||
|
(1,003,185
|
)
|
|||||||
|
Pipeline Transportation (0.56)%
|
||||||||
|
South Jersey Industries, Inc.
|
(7,338
|
)
|
(248,465
|
)
|
||||
|
Targa Resources Corp.
|
(10,604
|
)
|
(460,213
|
)
|
||||
|
(708,678
|
)
|
|||||||
|
Plastics and Rubber Products Manufacturing (0.50)%
|
||||||||
|
Cooper Tire & Rubber Co.
|
(7,169
|
)
|
(263,461
|
)
|
||||
|
Newell Brands, Inc.
|
(2,720
|
)
|
(84,238
|
)
|
||||
|
Sealed Air Corp.
|
(6,380
|
)
|
(306,559
|
)
|
||||
|
(654,258
|
)
|
|||||||
The accompanying notes are an integral part of these financial statements.
29
CONVERGENCE CORE PLUS FUND
|
Schedule of Securities Sold Short (Continued)
|
November 30, 2017
|
Shares
|
Value
|
|||||||
|
Primary Metal Manufacturing (0.38)%
|
||||||||
|
Finisar Corp.
|
(24,366
|
)
|
$
|
(487,564
|
)
|
|||
|
Printing and Related Support Activities (0.27)%
|
||||||||
|
Centennial Resource Development, Inc. – Class A
|
(16,980
|
)
|
(344,524
|
)
|
||||
|
Professional, Scientific, and Technical Services (2.54)%
|
||||||||
|
Diebold Nixdorf, Inc.
|
(26,375
|
)
|
(506,401
|
)
|
||||
|
Factset Research Systems, Inc.
|
(2,155
|
)
|
(430,741
|
)
|
||||
|
Henry Jack & Associates, Inc.
|
(4,558
|
)
|
(525,629
|
)
|
||||
|
Macquarie Infrastructure Corp.
|
(4,239
|
)
|
(283,080
|
)
|
||||
|
MuleSoft, Inc. – Class A
|
(24,946
|
)
|
(572,511
|
)
|
||||
|
Nutanix, Inc. – Class A
|
(17,460
|
)
|
(572,688
|
)
|
||||
|
Trade Desk, Inc. – Class A
|
(7,650
|
)
|
(375,921
|
)
|
||||
|
(3,266,971
|
)
|
|||||||
|
Publishing Industries (except Internet) (2.51)%
|
||||||||
|
Akamai Technologies, Inc.
|
(9,608
|
)
|
(535,934
|
)
|
||||
|
Autodesk, Inc.
|
(4,020
|
)
|
(440,994
|
)
|
||||
|
Cornerstone OnDemand, Inc.
|
(11,943
|
)
|
(441,533
|
)
|
||||
|
Palo Alto Networks, Inc.
|
(2,685
|
)
|
(391,339
|
)
|
||||
|
PTC, Inc.
|
(7,385
|
)
|
(470,276
|
)
|
||||
|
Splunk, Inc.
|
(6,642
|
)
|
(531,957
|
)
|
||||
|
Twilio, Inc. – Class A
|
(15,930
|
)
|
(424,694
|
)
|
||||
|
(3,236,727
|
)
|
|||||||
|
Rental and Leasing Services (0.15)%
|
||||||||
|
Hertz Global Holdings, Inc.
|
(10,510
|
)
|
(199,165
|
)
|
||||
|
Securities, Commodity Contracts, and Other Financial Investments
|
||||||||
|
and Related Activities (1.32)%
|
||||||||
|
Charles Schwab Corp.
|
(8,573
|
)
|
(418,277
|
)
|
||||
|
CommScope Holding Company, Inc.
|
(13,562
|
)
|
(488,096
|
)
|
||||
|
Financial Engines, Inc.
|
(14,275
|
)
|
(398,273
|
)
|
||||
|
MarketAxess Holdings, Inc.
|
(2,019
|
)
|
(394,250
|
)
|
||||
|
(1,698,896
|
)
|
|||||||
|
Specialty Trade Contractors (0.21)%
|
||||||||
|
Comfort Systems USA, Inc.
|
(6,300
|
)
|
(270,585
|
)
|
||||
|
Support Activities for Mining (0.26)%
|
||||||||
|
Patterson-UTI Energy, Inc.
|
(15,215
|
)
|
(328,492
|
)
|
||||
The accompanying notes are an integral part of these financial statements.
30
CONVERGENCE CORE PLUS FUND
|
Schedule of Securities Sold Short (Continued)
|
November 30, 2017
|
Shares
|
Value
|
|||||||
|
Telecommunications (0.70)%
|
||||||||
|
CenturyLink, Inc.
|
(31,692
|
)
|
$
|
(462,386
|
)
|
|||
|
Zayo Group Holdings, Inc.
|
(12,440
|
)
|
(439,630
|
)
|
||||
|
(902,016
|
)
|
|||||||
|
Textile Mills (0.25)%
|
||||||||
|
Albany International Corp. – Class A
|
(4,950
|
)
|
(320,265
|
)
|
||||
|
Transportation Equipment Manufacturing (0.45)%
|
||||||||
|
REV Group, Inc.
|
(11,109
|
)
|
(303,387
|
)
|
||||
|
Wabtec Corp.
|
(3,446
|
)
|
(264,997
|
)
|
||||
|
(568,384
|
)
|
|||||||
|
Truck Transportation (0.14)%
|
||||||||
|
Heartland Express, Inc.
|
(8,044
|
)
|
(183,725
|
)
|
||||
|
Utilities (1.12)%
|
||||||||
|
Alliant Energy Corp.
|
(6,282
|
)
|
(283,381
|
)
|
||||
|
Dominion Energy, Inc.
|
(3,513
|
)
|
(295,549
|
)
|
||||
|
Duke Energy Corp.
|
(3,060
|
)
|
(272,891
|
)
|
||||
|
Entergy Corp.
|
(3,140
|
)
|
(271,547
|
)
|
||||
|
Sempra Energy
|
(2,567
|
)
|
(310,581
|
)
|
||||
|
(1,433,949
|
)
|
|||||||
|
Waste Management and Remediation Services (0.20)%
|
||||||||
|
Covanta Holding Corp.
|
(8,056
|
)
|
(122,451
|
)
|
||||
|
Stericycle, Inc.
|
(1,996
|
)
|
(132,355
|
)
|
||||
|
(254,806
|
)
|
|||||||
|
Wholesale Electronic Markets and Agents and Brokers (0.34)%
|
||||||||
|
Genuine Parts Co.
|
(4,769
|
)
|
(443,374
|
)
|
||||
|
Wood Product Manufacturing (0.23)%
|
||||||||
|
Masonite International Corp. (a)
|
(4,000
|
)
|
(294,600
|
)
|
||||
|
TOTAL COMMON STOCKS (Proceeds $52,244,588)
|
(52,372,357
|
)
|
||||||
|
REAL ESTATE INVESTMENT TRUSTS (2.06)%
|
||||||||
|
Acadia Realty Trust
|
(5,375
|
)
|
(150,661
|
)
|
||||
|
American Campus Communities, Inc.
|
(3,236
|
)
|
(137,142
|
)
|
||||
|
Boston Properties, Inc.
|
(1,290
|
)
|
(161,740
|
)
|
||||
The accompanying notes are an integral part of these financial statements.
31
CONVERGENCE CORE PLUS FUND
|
Schedule of Securities Sold Short (Continued)
|
November 30, 2017
|
Shares
|
Value
|
|||||||
|
REAL ESTATE INVESTMENT TRUSTS (2.06)% (Continued)
|
||||||||
|
Colony NorthStar, Inc. – Class A
|
(12,190
|
)
|
$
|
(148,596
|
)
|
|||
|
Crown Castle International Corp.
|
(1,558
|
)
|
(176,054
|
)
|
||||
|
Education Realty Trust, Inc.
|
(3,986
|
)
|
(145,768
|
)
|
||||
|
EPR Properties
|
(2,211
|
)
|
(149,950
|
)
|
||||
|
GGP, Inc
|
(8,578
|
)
|
(201,582
|
)
|
||||
|
HCP, Inc.
|
(5,224
|
)
|
(138,123
|
)
|
||||
|
Macerich Co.
|
(3,149
|
)
|
(203,898
|
)
|
||||
|
Paramount Group, Inc.
|
(9,101
|
)
|
(147,163
|
)
|
||||
|
Regency Centers Corp.
|
(2,474
|
)
|
(167,762
|
)
|
||||
|
Sabra Health Care REIT, Inc.
|
(8,625
|
)
|
(165,945
|
)
|
||||
|
Starwood Property Trust, Inc.
|
(18,416
|
)
|
(399,259
|
)
|
||||
|
Uniti Group, Inc.
|
(9,986
|
)
|
(160,775
|
)
|
||||
|
TOTAL REAL ESTATE INVESTMENT TRUSTS
|
||||||||
|
(Proceeds $2,688,993)
|
(2,654,418
|
)
|
||||||
|
TOTAL SECURITIES SOLD SHORT (Proceeds $54,933,581)
|
$
|
(55,026,775
|
)
|
|||||
|
(a)
|
Foreign issued security.
|
|
Abbreviations:
|
|
|
Ltd.
|
Limited Liability Company.
|
|
NV
|
Naamloze Vennootschap is a Dutch term for publicly traded companies.
|
|
PLC
|
Public Limited Company.
|
The accompanying notes are an integral part of these financial statements.
32
CONVERGENCE OPPORTUNITIES FUND
|
Schedule of Investments
|
November 30, 2017
|
Shares
|
Value
|
|||||||
|
COMMON STOCKS* 128.72%
|
||||||||
|
Accommodation 1.05%
|
||||||||
|
Penn National Gaming, Inc. (a)
|
25,096
|
$
|
721,761
|
|||||
|
Administrative and Support Services 3.75%
|
||||||||
|
Kelly Services, Inc. – Class A
|
26,338
|
767,753
|
||||||
|
TriNet Group, Inc. (a)
|
20,584
|
921,340
|
||||||
|
TrueBlue, Inc. (a)
|
31,328
|
891,281
|
||||||
|
2,580,374
|
||||||||
|
Air Transportation 1.16%
|
||||||||
|
Copa Holdings SA – Class A (b)
|
5,978
|
802,188
|
||||||
|
Ambulatory Health Care Services 2.68%
|
||||||||
|
Genomic Health, Inc. (a)
|
15,193
|
460,196
|
||||||
|
LHC Group, Inc. (a)
|
11,230
|
738,597
|
||||||
|
Medpace Holdings, Inc. (a)(c)
|
19,479
|
648,846
|
||||||
|
1,847,639
|
||||||||
|
Beverage and Tobacco Product Manufacturing 1.68%
|
||||||||
|
Boston Beer Company, Inc. – Class A (a)
|
3,535
|
635,770
|
||||||
|
National Beverage Corp.
|
4,757
|
519,084
|
||||||
|
1,154,854
|
||||||||
|
Broadcasting (except Internet) 1.45%
|
||||||||
|
Gray Television, Inc. (a)
|
33,452
|
481,709
|
||||||
|
Sinclair Broadcast Group, Inc. – Class A
|
15,284
|
520,420
|
||||||
|
1,002,129
|
||||||||
|
Chemical Manufacturing 10.87%
|
||||||||
|
Acorda Therapeutics, Inc. (a)
|
9,786
|
198,656
|
||||||
|
Corcept Therapeutics, Inc. (a)
|
46,433
|
833,008
|
||||||
|
Emergent BioSolutions, Inc. (a)
|
21,800
|
957,673
|
||||||
|
Innoviva, Inc. (a)
|
63,513
|
833,291
|
||||||
|
Lannett Company, Inc. (a)(c)(d)
|
24,410
|
645,645
|
||||||
|
Lantheus Holdings, Inc. (a)
|
40,107
|
898,397
|
||||||
|
Ligand Pharmaceuticals, Inc. (a)
|
6,581
|
867,705
|
||||||
|
Myers Industries, Inc.
|
17,150
|
366,153
|
||||||
|
Myriad Genetics, Inc. (a)
|
28,405
|
983,664
|
||||||
|
Supernus Pharmaceuticals, Inc. (a)
|
24,090
|
910,602
|
||||||
|
7,494,794
|
||||||||
|
Clothing and Clothing Accessories Stores 0.82%
|
||||||||
|
Tailored Brands, Inc.
|
33,462
|
564,169
|
||||||
The accompanying notes are an integral part of these financial statements.
33
CONVERGENCE OPPORTUNITIES FUND
|
Schedule of Investments (Continued)
|
November 30, 2017
|
Shares
|
Value
|
|||||||
|
Computer and Electronic Product Manufacturing 13.60%
|
||||||||
|
Amkor Technology, Inc. (a)
|
98,514
|
$
|
1,041,292
|
|||||
|
Dolby Laboratories, Inc. – Class A
|
15,454
|
960,930
|
||||||
|
Ichor Holdings Ltd. (a)(b)
|
34,711
|
986,140
|
||||||
|
Jabil, Inc.
|
13,232
|
381,743
|
||||||
|
Masimo Corp. (a)
|
8,682
|
771,309
|
||||||
|
NETGEAR, Inc. (a)
|
15,730
|
810,095
|
||||||
|
Tech Data Corp. (a)
|
7,381
|
713,743
|
||||||
|
Teradata Corp. (a)
|
25,405
|
965,644
|
||||||
|
TTM Technologies, Inc. (a)
|
46,264
|
755,491
|
||||||
|
Ultra Clean Holdings, Inc. (a)
|
44,431
|
932,162
|
||||||
|
Vishay Intertechnology, Inc.
|
48,534
|
1,062,894
|
||||||
|
9,381,443
|
||||||||
|
Construction of Buildings 1.97%
|
||||||||
|
KB Home
|
24,105
|
755,932
|
||||||
|
MDC Holdings, Inc.
|
16,775
|
600,881
|
||||||
|
1,356,813
|
||||||||
|
Credit Intermediation and Related Activities 13.82%
|
||||||||
|
BancorpSouth Bank
|
30,382
|
1,010,202
|
||||||
|
Banner Corp.
|
10,450
|
601,816
|
||||||
|
CIT Group, Inc.
|
24,354
|
1,213,803
|
||||||
|
Comerica, Inc.
|
13,073
|
1,089,112
|
||||||
|
East West Bancorp, Inc.
|
16,996
|
1,045,934
|
||||||
|
Encore Capital Group, Inc. (a)(c)
|
6,057
|
277,411
|
||||||
|
Houlihan Lokey, Inc. – Class A
|
5,471
|
244,225
|
||||||
|
Nationstar Mortgage Holdings, Inc. (a)(c)
|
45,768
|
827,028
|
||||||
|
Opus Bank (a)
|
17,150
|
478,485
|
||||||
|
Synovus Financial Corp.
|
15,073
|
748,073
|
||||||
|
Walker & Dunlop, Inc. (a)
|
15,137
|
745,951
|
||||||
|
Zions Bancorporation
|
25,109
|
1,244,150
|
||||||
|
9,526,190
|
||||||||
|
Educational Services 1.07%
|
||||||||
|
Adtalem Global Education, Inc.
|
17,706
|
733,914
|
||||||
|
Electrical Equipment, Appliance, and
|
||||||||
|
Component Manufacturing 2.07%
|
||||||||
|
Generac Holdings, Inc. (a)
|
14,389
|
707,507
|
||||||
|
Integer Holdings Corp. (a)
|
14,813
|
717,690
|
||||||
|
1,425,197
|
||||||||
The accompanying notes are an integral part of these financial statements.
34
CONVERGENCE OPPORTUNITIES FUND
|
Schedule of Investments (Continued)
|
November 30, 2017
|
Shares
|
Value
|
|||||||
|
Electronics and Appliance Stores 0.75%
|
||||||||
|
Conn’s, Inc. (a)(c)(d)
|
16,800
|
$
|
519,120
|
|||||
|
Fabricated Metal Product Manufacturing 2.95%
|
||||||||
|
Harsco Corp. (a)
|
33,372
|
602,365
|
||||||
|
Mueller Industries, Inc.
|
19,140
|
696,696
|
||||||
|
Rexnord Corp. (a)
|
29,430
|
733,396
|
||||||
|
2,032,457
|
||||||||
|
Food and Beverage Stores 0.71%
|
||||||||
|
SpartanNash Co.
|
8,728
|
221,255
|
||||||
|
United Natural Foods, Inc. (a)
|
5,595
|
268,672
|
||||||
|
489,927
|
||||||||
|
Food Manufacturing 0.98%
|
||||||||
|
Sanderson Farms, Inc.
|
3,975
|
674,518
|
||||||
|
Food Services and Drinking Places 1.87%
|
||||||||
|
Bloomin’ Brands, Inc.
|
26,817
|
575,761
|
||||||
|
Hyatt Hotels Corp. – Class A (a)
|
9,882
|
715,061
|
||||||
|
1,290,822
|
||||||||
|
Furniture and Home Furnishings Stores 0.99%
|
||||||||
|
Restoration Hardware Outlet (a)(c)(d)
|
6,693
|
678,603
|
||||||
|
General Merchandise Stores 0.74%
|
||||||||
|
Big Lots, Inc.
|
8,656
|
511,570
|
||||||
|
Insurance Carriers and Related Activities 7.65%
|
||||||||
|
CNO Financial Group, Inc.
|
33,178
|
836,417
|
||||||
|
Essent Group Ltd. (a)(b)
|
26,614
|
1,177,670
|
||||||
|
MGIC Investment Corp. (a)
|
85,617
|
1,251,720
|
||||||
|
Primerica, Inc.
|
9,105
|
946,920
|
||||||
|
Radian Group, Inc.
|
41,845
|
857,404
|
||||||
|
Trupanion, Inc. (a)(c)(d)
|
6,735
|
200,568
|
||||||
|
5,270,699
|
||||||||
|
Leather and Allied Product Manufacturing 0.84%
|
||||||||
|
Deckers Outdoor Corp. (a)
|
7,763
|
580,129
|
||||||
|
Machinery Manufacturing 2.88%
|
||||||||
|
Alamo Group, Inc.
|
6,845
|
807,367
|
||||||
|
Hyster-Yale Materials Handling, Inc. – Class A
|
8,975
|
761,349
|
||||||
The accompanying notes are an integral part of these financial statements.
35
CONVERGENCE OPPORTUNITIES FUND
|
Schedule of Investments (Continued)
|
November 30, 2017
|
Shares
|
Value
|
|||||||
|
Machinery Manufacturing 2.88% (Continued)
|
||||||||
|
Newpark Resources, Inc. (a)
|
46,196
|
$
|
408,835
|
|||||
|
1,977,551
|
||||||||
|
Management of Companies and Enterprises 0.80%
|
||||||||
|
American Equity Investment Life Holding Co.
|
17,263
|
547,755
|
||||||
|
Merchant Wholesalers, Durable Goods 1.80%
|
||||||||
|
Schnitzer Steel Industries, Inc. – Class A
|
13,575
|
396,390
|
||||||
|
Varonis Systems, Inc. (a)
|
16,690
|
839,507
|
||||||
|
1,235,897
|
||||||||
|
Merchant Wholesalers, Nondurable Goods 2.59%
|
||||||||
|
Ingevity Corp. (a)
|
12,616
|
1,004,108
|
||||||
|
Nu Skin Enterprises, Inc. – Class A
|
5,987
|
406,577
|
||||||
|
Phibro Animal Health Corp. – Class A (c)
|
10,962
|
380,381
|
||||||
|
1,791,066
|
||||||||
|
Miscellaneous Manufacturing 3.40%
|
||||||||
|
AngioDynamics, Inc. (a)
|
42,242
|
725,718
|
||||||
|
Haemonetics Corp. (a)
|
17,185
|
993,293
|
||||||
|
Johnson Outdoors, Inc. – Class A
|
8,490
|
620,959
|
||||||
|
2,339,970
|
||||||||
|
Motor Vehicle and Parts Dealers 0.98%
|
||||||||
|
Rush Enterprises, Inc. – Class A (a)
|
13,870
|
675,608
|
||||||
|
Nonmetallic Mineral Product Manufacturing 1.24%
|
||||||||
|
Owens-Illinois, Inc. (a)
|
35,364
|
856,516
|
||||||
|
Oil and Gas Extraction 0.63%
|
||||||||
|
Kosmos Energy Ltd. (a)(b)
|
54,698
|
436,490
|
||||||
|
Other Information Services 1.15%
|
||||||||
|
NIC, Inc.
|
47,855
|
794,393
|
||||||
|
Paper Manufacturing 1.02%
|
||||||||
|
Boise Cascade Co.
|
18,165
|
699,353
|
||||||
|
Performing Arts, Spectator Sports, and Related Industries 1.36%
|
||||||||
|
Pinnacle Entertainment, Inc. (a)
|
30,478
|
935,065
|
||||||
The accompanying notes are an integral part of these financial statements.
36
CONVERGENCE OPPORTUNITIES FUND
|
Schedule of Investments (Continued)
|
November 30, 2017
|
Shares
|
Value
|
|||||||
|
Personal and Laundry Services 1.79%
|
||||||||
|
SP Plus Corp. (a)
|
17,692
|
$
|
693,526
|
|||||
|
Weight Watchers International, Inc. (a)(c)
|
12,195
|
537,434
|
||||||
|
1,230,960
|
||||||||
|
Petroleum and Coal Products Manufacturing 2.59%
|
||||||||
|
CVR Energy, Inc. (c)(d)
|
20,945
|
683,855
|
||||||
|
Murphy Oil Corp.
|
18,080
|
505,336
|
||||||
|
PBF Energy, Inc. – Class A (c)
|
18,401
|
595,640
|
||||||
|
1,784,831
|
||||||||
|
Plastics and Rubber Products Manufacturing 1.22%
|
||||||||
|
Proto Labs, Inc. (a)
|
8,720
|
838,864
|
||||||
|
Professional, Scientific, and Technical Services 9.17%
|
||||||||
|
Aspen Technology, Inc. (a)
|
12,758
|
853,766
|
||||||
|
Convergys Corp.
|
31,897
|
787,218
|
||||||
|
Magellan Health, Inc. (a)
|
7,225
|
610,513
|
||||||
|
MAXIMUS, Inc.
|
13,084
|
903,842
|
||||||
|
MDC Partners, Inc. – Class A (a)(b)
|
26,438
|
306,681
|
||||||
|
Providence Service Corp. (a)
|
9,661
|
584,877
|
||||||
|
Sykes Enterprises, Inc. (a)
|
28,480
|
906,233
|
||||||
|
Verint Systems, Inc. (a)
|
15,805
|
691,469
|
||||||
|
VSE Corp.
|
14,065
|
671,885
|
||||||
|
6,316,484
|
||||||||
|
Publishing Industries (except Internet) 2.56%
|
||||||||
|
Cogent Communications Holdings, Inc.
|
8,500
|
398,225
|
||||||
|
Shutterfly, Inc. (a)
|
12,580
|
555,784
|
||||||
|
Web.com Group, Inc. (a)
|
35,022
|
805,506
|
||||||
|
1,759,515
|
||||||||
|
Rental and Leasing Services 3.77%
|
||||||||
|
CAI International, Inc. (a)
|
19,070
|
653,148
|
||||||
|
Exterran Corp. (a)
|
12,338
|
378,036
|
||||||
|
Textainer Group Holdings Ltd. (a)(b)
|
31,045
|
712,483
|
||||||
|
Triton International Ltd. – Class A (b)
|
21,505
|
850,952
|
||||||
|
2,594,619
|
||||||||
|
Securities, Commodity Contracts, and Other
|
||||||||
|
Financial Investments and Related Activities 3.43%
|
||||||||
|
Legg Mason, Inc.
|
17,884
|
714,645
|
||||||
|
Moelis & Co. – Class A
|
4,492
|
215,167
|
||||||
The accompanying notes are an integral part of these financial statements.
37
CONVERGENCE OPPORTUNITIES FUND
|
Schedule of Investments (Continued)
|
November 30, 2017
|
Shares
|
Value
|
|||||||
|
Securities, Commodity Contracts, and Other
|
||||||||
|
Financial Investments and Related Activities 3.43% (Continued)
|
||||||||
|
Stifel Financial Corp.
|
12,796
|
$
|
719,647
|
|||||
|
Travelport Worldwide Ltd. (b)
|
53,293
|
713,593
|
||||||
|
2,363,052
|
||||||||
|
Support Activities for Mining 0.74%
|
||||||||
|
Transocean Ltd. (a)(b)
|
49,720
|
504,161
|
||||||
|
Support Activities for Transportation 0.61%
|
||||||||
|
Forward Air Corp.
|
7,351
|
418,272
|
||||||
|
Telecommunications 0.55%
|
||||||||
|
United States Cellular Corp. (a)
|
9,937
|
376,016
|
||||||
|
Transportation Equipment Manufacturing 3.81%
|
||||||||
|
Dana, Inc.
|
22,486
|
742,937
|
||||||
|
Meritor, Inc. (a)
|
26,086
|
651,628
|
||||||
|
Tower International, Inc.
|
20,091
|
646,930
|
||||||
|
Wabash National Corp.
|
28,959
|
583,524
|
||||||
|
2,625,019
|
||||||||
|
Truck Transportation 0.62%
|
||||||||
|
ArcBest Corp.
|
11,301
|
427,743
|
||||||
|
Utilities 5.10%
|
||||||||
|
Dynegy, Inc. (a)
|
100,179
|
1,215,171
|
||||||
|
National Fuel Gas Co.
|
19,812
|
1,164,946
|
||||||
|
PNM Resources, Inc.
|
24,890
|
1,132,495
|
||||||
|
3,512,612
|
||||||||
|
Wood Product Manufacturing 1.44%
|
||||||||
|
Louisiana-Pacific Corp. (a)
|
36,044
|
995,175
|
||||||
|
TOTAL COMMON STOCKS (Cost $74,262,585)
|
88,676,297
|
|||||||
|
REAL ESTATE INVESTMENT TRUSTS* 10.25%
|
||||||||
|
Brandywine Realty Trust
|
36,948
|
636,614
|
||||||
|
First Industrial Realty Trust, Inc.
|
23,942
|
779,312
|
||||||
|
Invesco Mortgage Capital, Inc.
|
34,788
|
614,356
|
||||||
|
LaSalle Hotel Properties
|
27,451
|
780,707
|
||||||
|
National Storage Affiliates Trust
|
28,577
|
761,291
|
||||||
|
Pebblebrook Hotel Trust
|
17,015
|
654,567
|
||||||
The accompanying notes are an integral part of these financial statements.
38
CONVERGENCE OPPORTUNITIES FUND
|
Schedule of Investments (Continued)
|
November 30, 2017
|
Shares
|
Value
|
|||||||
|
REAL ESTATE INVESTMENT TRUSTS* 10.25% (Continued)
|
||||||||
|
Potlatch Corp.
|
14,402
|
$
|
743,143
|
|||||
|
PS Business Parks, Inc.
|
5,461
|
723,910
|
||||||
|
Washington Prime Group, Inc.
|
75,852
|
539,308
|
||||||
|
Xenia Hotels & Resorts, Inc.
|
37,520
|
825,065
|
||||||
|
TOTAL REAL ESTATE INVESTMENT TRUSTS (Cost $6,743,304)
|
7,058,273
|
|||||||
|
INVESTMENTS PURCHASED WITH PROCEEDS
|
||||||||
|
FROM SECURITIES LENDING – 3.92%
|
||||||||
|
Money Market Fund 3.92%
|
||||||||
|
First American Government Obligations Fund, Class Y, 0.670% (c)(e)
|
2,703,559
|
2,703,559
|
||||||
|
TOTAL INVESTMENTS PURCHASED WITH PROCEEDS
|
||||||||
|
FROM SECURITIES LENDING (Cost $2,703,559)
|
2,703,559
|
|||||||
|
SHORT-TERM INVESTMENTS 0.12%
|
||||||||
|
Fidelity Institutional Money Market Funds –
|
||||||||
|
Government Portfolio – Class I, 0.970% (c)(e)
|
79,887
|
79,887
|
||||||
|
TOTAL SHORT-TERM INVESTMENTS (Cost $79,887)
|
79,887
|
|||||||
|
Total Investments (Cost $83,789,335) 143.01%
|
98,518,016
|
|||||||
|
Liabilities in Excess of Other Assets (43.01)%
|
(29,629,631
|
)
|
||||||
|
TOTAL NET ASSETS 100.00%
|
$
|
68,888,385
|
||||||
Percentages are stated as a percent of net assets.
|
*
|
Unless otherwise noted, all or a portion of these securities, totaling $89,740,040, are pledged as collateral for securities sold short.
|
|
(a)
|
Non-income producing security.
|
|
(b)
|
Foreign issued security.
|
|
(c)
|
This security is not pledged as collateral for securities sold short.
|
|
(d)
|
All or a portion of security is out on loan.
|
|
(e)
|
Seven day yield as of November 30, 2017.
|
Abbreviations:
|
Ltd.
|
Limited Liability Company.
|
|
SA
|
Generally designates a type of corporation in various countries, mostly those employing a civil law legal system.
|
The accompanying notes are an integral part of these financial statements.
39
CONVERGENCE OPPORTUNITIES FUND
|
Schedule of Securities Sold Short
|
November 30, 2017
|
Shares
|
Value
|
|||||||
|
SECURITIES SOLD SHORT (42.34)%
|
||||||||
|
COMMON STOCKS (39.39)%
|
||||||||
|
Accommodation (0.34)%
|
||||||||
|
Red Rock Resorts, Inc. – Class A
|
(7,690
|
)
|
$
|
(237,237
|
)
|
|||
|
Administrative and Support Services (0.55)%
|
||||||||
|
Hostess Brands, Inc. – Class A
|
(13,924
|
)
|
(195,771
|
)
|
||||
|
PRA Group, Inc.
|
(5,276
|
)
|
(183,605
|
)
|
||||
|
(379,376
|
)
|
|||||||
|
Air Transportation (0.27)%
|
||||||||
|
Spirit Airlines, Inc.
|
(4,361
|
)
|
(185,909
|
)
|
||||
|
Ambulatory Health Care Services (0.45)%
|
||||||||
|
Spark Therapeutics, Inc.
|
(1,195
|
)
|
(87,510
|
)
|
||||
|
US Physical Therapy, Inc.
|
(3,016
|
)
|
(220,319
|
)
|
||||
|
(307,829
|
)
|
|||||||
|
Apparel Manufacturing (0.44)%
|
||||||||
|
Under Armour, Inc. – Class C
|
(10,310
|
)
|
(122,998
|
)
|
||||
|
UniFirst Corp.
|
(1,105
|
)
|
(180,668
|
)
|
||||
|
(303,666
|
)
|
|||||||
|
Chemical Manufacturing (3.53)%
|
||||||||
|
ACADIA Pharmaceuticals, Inc.
|
(3,319
|
)
|
(100,400
|
)
|
||||
|
Achaogen, Inc.
|
(7,505
|
)
|
(89,760
|
)
|
||||
|
Aduro Biotech, Inc.
|
(12,320
|
)
|
(117,040
|
)
|
||||
|
Aerie Pharmaceuticals, Inc.
|
(1,627
|
)
|
(104,535
|
)
|
||||
|
Alder Biopharmaceuticals, Inc.
|
(8,815
|
)
|
(96,965
|
)
|
||||
|
Ashland Global Holdings, Inc.
|
(2,700
|
)
|
(199,746
|
)
|
||||
|
Avexis, Inc.
|
(1,060
|
)
|
(100,499
|
)
|
||||
|
Clovis Oncology, Inc.
|
(1,370
|
)
|
(86,132
|
)
|
||||
|
Coherus Biosciences, Inc.
|
(7,713
|
)
|
(69,031
|
)
|
||||
|
Coty, Inc. – Class A
|
(2,422
|
)
|
(41,731
|
)
|
||||
|
Dermira, Inc.
|
(4,140
|
)
|
(105,984
|
)
|
||||
|
G1 Therapeutics, Inc.
|
(4,360
|
)
|
(89,598
|
)
|
||||
|
Heron Therapeutics, Inc.
|
(6,770
|
)
|
(119,151
|
)
|
||||
|
Intercept Pharmaceuticals, Inc.
|
(1,940
|
)
|
(119,135
|
)
|
||||
|
Kraton Corp.
|
(3,815
|
)
|
(179,496
|
)
|
||||
|
La Jolla Pharmaceutical Co.
|
(2,980
|
)
|
(99,383
|
)
|
||||
|
MacroGenics, Inc.
|
(5,420
|
)
|
(104,714
|
)
|
||||
|
Quaker Chemical Corp.
|
(1,181
|
)
|
(194,605
|
)
|
||||
|
Radius Health, Inc.
|
(3,000
|
)
|
(84,930
|
)
|
||||
The accompanying notes are an integral part of these financial statements.
40
CONVERGENCE OPPORTUNITIES FUND
|
Schedule of Securities Sold Short (Continued)
|
November 30, 2017
|
Shares
|
Value
|
|||||||
|
Chemical Manufacturing (3.53)% (Continued)
|
||||||||
|
Sage Therapeutics, Inc.
|
(1,100
|
)
|
$
|
(101,651
|
)
|
|||
|
Ultragenyx Pharmaceutical, Inc.
|
(1,820
|
)
|
(91,892
|
)
|
||||
|
WD-40 Co.
|
(317
|
)
|
(37,850
|
)
|
||||
|
Xencor, Inc.
|
(4,525
|
)
|
(98,238
|
)
|
||||
|
(2,432,466
|
)
|
|||||||
|
Clothing and Clothing Accessories Stores (0.47)%
|
||||||||
|
Foot Locker, Inc.
|
(3,909
|
)
|
(167,462
|
)
|
||||
|
Genesco, Inc.
|
(4,933
|
)
|
(153,416
|
)
|
||||
|
(320,878
|
)
|
|||||||
|
Computer and Electronic Product Manufacturing (4.47)%
|
||||||||
|
Cray, Inc.
|
(11,251
|
)
|
(255,961
|
)
|
||||
|
Cubic Corp.
|
(3,515
|
)
|
(217,754
|
)
|
||||
|
DexCom, Inc.
|
(4,605
|
)
|
(269,070
|
)
|
||||
|
FARO Technologies, Inc.
|
(4,520
|
)
|
(236,396
|
)
|
||||
|
Infinera Corp.
|
(24,841
|
)
|
(179,849
|
)
|
||||
|
Inphi Corp.
|
(5,519
|
)
|
(226,665
|
)
|
||||
|
LivaNova PLC (a)
|
(3,100
|
)
|
(270,257
|
)
|
||||
|
MACOM Technology Solutions Holdings, Inc.
|
(7,568
|
)
|
(246,641
|
)
|
||||
|
MaxLinear, Inc.
|
(9,615
|
)
|
(253,933
|
)
|
||||
|
Natus Medical, Inc.
|
(5,515
|
)
|
(220,876
|
)
|
||||
|
Super Micro Computer, Inc.
|
(11,049
|
)
|
(243,630
|
)
|
||||
|
ViaSat, Inc.
|
(3,260
|
)
|
(242,022
|
)
|
||||
|
Xperi Corp.
|
(11,040
|
)
|
(213,072
|
)
|
||||
|
(3,076,126
|
)
|
|||||||
|
Construction of Buildings (0.28)%
|
||||||||
|
TRI Pointe Group, Inc.
|
(10,809
|
)
|
(195,859
|
)
|
||||
|
Credit Intermediation and Related Activities (4.65)%
|
||||||||
|
BankUnited, Inc.
|
(7,707
|
)
|
(286,931
|
)
|
||||
|
Bridge Bancorp, Inc.
|
(5,380
|
)
|
(193,411
|
)
|
||||
|
ConnectOne Bancorp, Inc.
|
(8,090
|
)
|
(219,644
|
)
|
||||
|
First of Long Island Corp.
|
(6,845
|
)
|
(206,377
|
)
|
||||
|
FNB Corp.
|
(13,810
|
)
|
(195,964
|
)
|
||||
|
Independent Bank Group, Inc.
|
(3,395
|
)
|
(233,915
|
)
|
||||
|
Investors Bancorp, Inc.
|
(15,595
|
)
|
(222,541
|
)
|
||||
|
LendingClub Corp.
|
(22,095
|
)
|
(96,555
|
)
|
||||
|
Live Oak Bancshares, Inc.
|
(9,007
|
)
|
(231,929
|
)
|
||||
|
New York Community Bancorp, Inc.
|
(17,064
|
)
|
(227,634
|
)
|
||||
|
OceanFirst Financial Corp.
|
(7,530
|
)
|
(208,958
|
)
|
||||
The accompanying notes are an integral part of these financial statements.
41
CONVERGENCE OPPORTUNITIES FUND
|
Schedule of Securities Sold Short (Continued)
|
November 30, 2017
|
Shares
|
Value
|
|||||||
|
Credit Intermediation and Related Activities (4.65)% (Continued)
|
||||||||
|
Pinnacle Financial Partners, Inc.
|
(3,190
|
)
|
$
|
(218,994
|
)
|
|||
|
Signature Bank
|
(1,566
|
)
|
(214,980
|
)
|
||||
|
Sterling Bancorp
|
(8,598
|
)
|
(217,959
|
)
|
||||
|
SVB Financial Group
|
(1,010
|
)
|
(229,916
|
)
|
||||
|
(3,205,708
|
)
|
|||||||
|
Data Processing, Hosting and Related Services (0.33)%
|
||||||||
|
WEX, Inc.
|
(1,756
|
)
|
(226,032
|
)
|
||||
|
Educational Services (0.31)%
|
||||||||
|
Career Education Corp.
|
(15,920
|
)
|
(211,258
|
)
|
||||
|
Electrical Equipment, Appliance, and
|
||||||||
|
Component Manufacturing (0.56)%
|
||||||||
|
Axon Enterprise, Inc.
|
(7,925
|
)
|
(197,174
|
)
|
||||
|
AZZ, Inc.
|
(3,900
|
)
|
(187,590
|
)
|
||||
|
(384,764
|
)
|
|||||||
|
Fabricated Metal Product Manufacturing (0.44)%
|
||||||||
|
ACCO Brands Corp.
|
(13,635
|
)
|
(179,301
|
)
|
||||
|
American Outdoor Brands Corp.
|
(8,975
|
)
|
(125,919
|
)
|
||||
|
(305,220
|
)
|
|||||||
|
Food and Beverage Stores (0.13)%
|
||||||||
|
Smart & Final Stores, Inc.
|
(9,723
|
)
|
(88,966
|
)
|
||||
|
Food Manufacturing (0.52)%
|
||||||||
|
B&G Foods, Inc.
|
(4,894
|
)
|
(189,398
|
)
|
||||
|
Snyder’s-Lance, Inc.
|
(4,488
|
)
|
(173,596
|
)
|
||||
|
(362,994
|
)
|
|||||||
|
Food Services and Drinking Places (1.10)%
|
||||||||
|
BJ’s Restaurants, Inc.
|
(6,042
|
)
|
(216,002
|
)
|
||||
|
Buffalo Wild Wings, Inc.
|
(1,490
|
)
|
(232,365
|
)
|
||||
|
Casey’s General Stores, Inc.
|
(735
|
)
|
(88,751
|
)
|
||||
|
DineEquity, Inc.
|
(4,759
|
)
|
(218,295
|
)
|
||||
|
(755,413
|
)
|
|||||||
|
Furniture and Home Furnishings Stores (0.19)%
|
||||||||
|
Bed Bath & Beyond, Inc.
|
(5,895
|
)
|
(131,989
|
)
|
||||
|
Furniture and Related Product Manufacturing (0.26)%
|
||||||||
|
Knoll, Inc.
|
(8,090
|
)
|
(176,119
|
)
|
||||
The accompanying notes are an integral part of these financial statements.
42
CONVERGENCE OPPORTUNITIES FUND
|
Schedule of Securities Sold Short (Continued)
|
November 30, 2017
|
Shares
|
Value
|
|||||||
|
Health and Personal Care Stores (0.19)%
|
||||||||
|
Sally Beauty Holdings, Inc.
|
(7,763
|
)
|
$
|
(132,359
|
)
|
|||
|
Heavy and Civil Engineering Construction (0.25)%
|
||||||||
|
Century Communities, Inc.
|
(5,430
|
)
|
(170,231
|
)
|
||||
|
Insurance Carriers and Related Activities (0.98)%
|
||||||||
|
AMERISAFE, Inc.
|
(2,250
|
)
|
(147,712
|
)
|
||||
|
AmTrust Financial Services, Inc.
|
(11,320
|
)
|
(109,125
|
)
|
||||
|
Aspen Insurance Holdings Ltd. (a)
|
(3,360
|
)
|
(137,760
|
)
|
||||
|
National Western Life Group, Inc. – Class A
|
(395
|
)
|
(139,629
|
)
|
||||
|
ProAssurance Corp.
|
(2,222
|
)
|
(137,431
|
)
|
||||
|
(671,657
|
)
|
|||||||
|
Machinery Manufacturing (1.13)%
|
||||||||
|
Dril-Quip, Inc.
|
(2,878
|
)
|
(138,000
|
)
|
||||
|
Glaukos Corp.
|
(5,830
|
)
|
(156,069
|
)
|
||||
|
IMAX Corp. (a)
|
(3,850
|
)
|
(97,790
|
)
|
||||
|
John Bean Technologies Corp.
|
(1,685
|
)
|
(201,779
|
)
|
||||
|
Tennant Co.
|
(2,775
|
)
|
(182,595
|
)
|
||||
|
(776,233
|
)
|
|||||||
|
Management of Companies and Enterprises (0.98)%
|
||||||||
|
Ameris Bancorp.
|
(4,473
|
)
|
(221,861
|
)
|
||||
|
ServisFirst Bancshares, Inc.
|
(5,590
|
)
|
(234,723
|
)
|
||||
|
Simmons First National Corp. – Class A
|
(3,795
|
)
|
(219,731
|
)
|
||||
|
(676,315
|
)
|
|||||||
|
Merchant Wholesalers, Durable Goods (1.79)%
|
||||||||
|
Beacon Roofing Supply, Inc.
|
(3,460
|
)
|
(221,717
|
)
|
||||
|
Fitbit, Inc. – Class A
|
(33,519
|
)
|
(229,939
|
)
|
||||
|
GCP Applied Technologies, Inc.
|
(5,809
|
)
|
(190,245
|
)
|
||||
|
Gentherm, Inc.
|
(4,965
|
)
|
(178,740
|
)
|
||||
|
Sunrun, Inc.
|
(33,356
|
)
|
(186,794
|
)
|
||||
|
Titan International, Inc.
|
(18,935
|
)
|
(226,652
|
)
|
||||
|
(1,234,087
|
)
|
|||||||
|
Merchant Wholesalers, Nondurable Goods (0.56)%
|
||||||||
|
Adamas Pharmaceuticals, Inc.
|
(3,185
|
)
|
(118,323
|
)
|
||||
|
Aimmune Therapeutics, Inc.
|
(3,045
|
)
|
(116,319
|
)
|
||||
|
Global Blood Therapeutics, Inc.
|
(3,880
|
)
|
(153,066
|
)
|
||||
|
(387,708
|
)
|
|||||||
|
Mining (except Oil and Gas) (0.50)%
|
||||||||
|
Hecla Mining Co.
|
(38,870
|
)
|
(145,374
|
)
|
||||
The accompanying notes are an integral part of these financial statements.
43
CONVERGENCE OPPORTUNITIES FUND
|
Schedule of Securities Sold Short (Continued)
|
November 30, 2017
|
Shares
|
Value
|
|||||||
|
Mining (except Oil and Gas) (0.50)% (Continued)
|
||||||||
|
Summit Materials, Inc. – Class A
|
(6,482
|
)
|
$
|
(199,386
|
)
|
|||
|
(344,760
|
)
|
|||||||
|
Miscellaneous Manufacturing (1.43)%
|
||||||||
|
Acushnet Holdings Corp.
|
(7,828
|
)
|
(155,542
|
)
|
||||
|
GenMark Diagnostics, Inc.
|
(27,077
|
)
|
(120,492
|
)
|
||||
|
Mattel, Inc.
|
(10,605
|
)
|
(193,542
|
)
|
||||
|
Nevro Corp.
|
(1,950
|
)
|
(145,899
|
)
|
||||
|
NuVasive, Inc.
|
(3,510
|
)
|
(202,492
|
)
|
||||
|
WR Grace & Co.
|
(2,302
|
)
|
(168,760
|
)
|
||||
|
(986,727
|
)
|
|||||||
|
Miscellaneous Store Retailers (0.23)%
|
||||||||
|
Party City Holdco, Inc.
|
(11,350
|
)
|
(157,765
|
)
|
||||
|
Motion Picture and Sound Recording Industries (0.16)%
|
||||||||
|
Cinemark Holdings, Inc.
|
(3,008
|
)
|
(108,619
|
)
|
||||
|
Oil and Gas Extraction (1.05)%
|
||||||||
|
Bonanza Creek Energy, Inc.
|
(3,915
|
)
|
(108,720
|
)
|
||||
|
Extraction Oil & Gas, Inc.
|
(9,937
|
)
|
(149,651
|
)
|
||||
|
Jagged Peak Energy, Inc.
|
(8,893
|
)
|
(134,996
|
)
|
||||
|
MRC Global, Inc.
|
(12,030
|
)
|
(188,991
|
)
|
||||
|
NOW, Inc.
|
(13,525
|
)
|
(139,578
|
)
|
||||
|
(721,936
|
)
|
|||||||
|
Other Information Services (0.23)%
|
||||||||
|
Box, Inc. – Class A
|
(7,557
|
)
|
(158,924
|
)
|
||||
|
Pipeline Transportation (0.76)%
|
||||||||
|
New Jersey Resources Corp.
|
(6,287
|
)
|
(280,400
|
)
|
||||
|
South Jersey Industries, Inc.
|
(7,125
|
)
|
(241,253
|
)
|
||||
|
(521,653
|
)
|
|||||||
|
Primary Metal Manufacturing (0.27)%
|
||||||||
|
Insteel Industries, Inc.
|
(6,770
|
)
|
(186,514
|
)
|
||||
|
Printing and Related Support Activities (0.19)%
|
||||||||
|
Centennial Resource Development, Inc. – Class A
|
(6,365
|
)
|
(129,146
|
)
|
||||
|
Professional, Scientific, and Technical Services (2.76)%
|
||||||||
|
Biohaven Pharmaceutical Holding Co. Ltd. (a)
|
(2,905
|
)
|
(67,193
|
)
|
||||
|
Diebold Nixdorf, Inc.
|
(9,788
|
)
|
(187,930
|
)
|
||||
|
Huron Consulting Group, Inc.
|
(4,760
|
)
|
(194,684
|
)
|
||||
|
Instructure, Inc.
|
(6,341
|
)
|
(220,350
|
)
|
||||
The accompanying notes are an integral part of these financial statements.
44
CONVERGENCE OPPORTUNITIES FUND
|
Schedule of Securities Sold Short (Continued)
|
November 30, 2017
|
Shares
|
Value
|
|||||||
|
Professional, Scientific, and Technical Services (2.76)% (Continued)
|
||||||||
|
Intra-Cellular Therapies, Inc.
|
(4,401
|
)
|
$
|
(68,216
|
)
|
|||
|
Liberty Media Corp-Liberty Formula One – Class A
|
(2,516
|
)
|
(87,532
|
)
|
||||
|
Monotype Imaging Holdings, Inc.
|
(9,125
|
)
|
(229,950
|
)
|
||||
|
MuleSoft, Inc. – Class A
|
(7,028
|
)
|
(161,293
|
)
|
||||
|
Nutanix, Inc. – Class A
|
(8,495
|
)
|
(278,635
|
)
|
||||
|
Shake Shack, Inc. – Class A
|
(4,860
|
)
|
(199,745
|
)
|
||||
|
VASCO Data Security International, Inc.
|
(15,395
|
)
|
(206,293
|
)
|
||||
|
(1,901,821
|
)
|
|||||||
|
Publishing Industries (except Internet) (1.46)%
|
||||||||
|
Cornerstone OnDemand, Inc.
|
(4,972
|
)
|
(183,815
|
)
|
||||
|
Evolent Health, Inc. – Class A
|
(11,200
|
)
|
(143,920
|
)
|
||||
|
MicroStrategy, Inc. – Class A
|
(1,470
|
)
|
(201,037
|
)
|
||||
|
PROS Holdings, Inc.
|
(7,845
|
)
|
(196,831
|
)
|
||||
|
Scholastic Corp.
|
(2,403
|
)
|
(98,811
|
)
|
||||
|
Twilio, Inc. – Class A
|
(6,799
|
)
|
(181,261
|
)
|
||||
|
(1,005,675
|
)
|
|||||||
|
Real Estate (0.26)%
|
||||||||
|
St. Joe Co.
|
(9,520
|
)
|
(178,976
|
)
|
||||
|
Rental and Leasing Services (0.18)%
|
||||||||
|
Hertz Global Holdings, Inc.
|
(6,706
|
)
|
(127,079
|
)
|
||||
|
Securities, Commodity Contracts, and Other
|
||||||||
|
Financial Investments and Related Activities (1.08)%
|
||||||||
|
Camping World Holdings, Inc. – Class A
|
(3,166
|
)
|
(146,776
|
)
|
||||
|
Financial Engines, Inc.
|
(3,843
|
)
|
(107,220
|
)
|
||||
|
Nexeo Solutions, Inc.
|
(22,125
|
)
|
(175,451
|
)
|
||||
|
PJT Partners, Inc. – Class A
|
(3,593
|
)
|
(152,810
|
)
|
||||
|
WisdomTree Investments, Inc.
|
(14,245
|
)
|
(163,818
|
)
|
||||
|
(746,075
|
)
|
|||||||
|
Support Activities for Mining (0.41)%
|
||||||||
|
C&J Energy Services, Inc.
|
(4,400
|
)
|
(137,544
|
)
|
||||
|
Patterson-UTI Energy, Inc.
|
(6,815
|
)
|
(147,136
|
)
|
||||
|
(284,680
|
)
|
|||||||
|
Telecommunications (0.63)%
|
||||||||
|
8x8, Inc.
|
(16,158
|
)
|
(227,828
|
)
|
||||
|
Consolidated Communications Holdings, Inc.
|
(6,065
|
)
|
(85,759
|
)
|
||||
|
ORBCOMM, Inc.
|
(11,280
|
)
|
(121,373
|
)
|
||||
|
(434,960
|
)
|
|||||||
The accompanying notes are an integral part of these financial statements.
45
CONVERGENCE OPPORTUNITIES FUND
|
Schedule of Securities Sold Short (Continued)
|
November 30, 2017
|
Shares
|
Value
|
|||||||
|
Transportation Equipment Manufacturing (1.00)%
|
||||||||
|
American Railcar Industries, Inc.
|
(4,537
|
)
|
$
|
(183,839
|
)
|
|||
|
Astec Industries, Inc.
|
(3,500
|
)
|
(193,795
|
)
|
||||
|
Standard Motor Products, Inc.
|
(3,715
|
)
|
(167,955
|
)
|
||||
|
Wesco Aircraft Holdings, Inc.
|
(19,335
|
)
|
(143,079
|
)
|
||||
|
(688,668
|
)
|
|||||||
|
Utilities (0.80)%
|
||||||||
|
Chesapeake Utilities Corp.
|
(3,152
|
)
|
(269,654
|
)
|
||||
|
Connecticut Water Service, Inc.
|
(4,451
|
)
|
(281,792
|
)
|
||||
|
(551,446
|
)
|
|||||||
|
Waste Management and Remediation Services (0.49)%
|
||||||||
|
Covanta Holding Corp.
|
(11,806
|
)
|
(179,451
|
)
|
||||
|
US Ecology, Inc.
|
(3,015
|
)
|
(155,122
|
)
|
||||
|
(334,573
|
)
|
|||||||
|
Water Transportation (0.33)%
|
||||||||
|
International Seaways, Inc. (a)
|
(6,205
|
)
|
(105,423
|
)
|
||||
|
Scorpio Bulkers, Inc. (a)
|
(16,545
|
)
|
(119,124
|
)
|
||||
|
(224,547
|
)
|
|||||||
|
TOTAL COMMON STOCKS (Proceeds $26,445,026)
|
(27,130,943
|
)
|
||||||
|
REAL ESTATE INVESTMENT TRUSTS (2.95)%
|
||||||||
|
Acadia Realty Trust
|
(6,352
|
)
|
(178,047
|
)
|
||||
|
Education Realty Trust, Inc.
|
(4,756
|
)
|
(173,927
|
)
|
||||
|
Government Properties Income Trust
|
(9,896
|
)
|
(184,560
|
)
|
||||
|
Independence Realty Trust, Inc.
|
(17,769
|
)
|
(183,554
|
)
|
||||
|
Ladder Capital Corp. – Class A
|
(9,488
|
)
|
(129,511
|
)
|
||||
|
Life Storage, Inc.
|
(2,439
|
)
|
(219,047
|
)
|
||||
|
Physicians Realty Trust
|
(10,585
|
)
|
(189,154
|
)
|
||||
|
Sabra Health Care REIT, Inc.
|
(8,672
|
)
|
(166,849
|
)
|
||||
|
Uniti Group, Inc.
|
(13,330
|
)
|
(214,613
|
)
|
||||
|
Washington Real Estate Investment Trust
|
(6,456
|
)
|
(208,658
|
)
|
||||
|
Weingarten Realty Investors
|
(5,691
|
)
|
(187,518
|
)
|
||||
|
TOTAL REAL ESTATE INVESTMENT TRUSTS
|
||||||||
|
(Proceeds $2,199,253)
|
(2,035,438
|
)
|
||||||
|
TOTAL SECURITIES SOLD SHORT (Proceeds $28,644,279)
|
$
|
(29,166,381
|
)
|
|||||
|
(a)
|
Foreign issued security.
|
|
Abbreviations:
|
|
|
Ltd.
|
Limited Liability Company.
|
|
PLC
|
Publicly Traded Company.
|
The accompanying notes are an integral part of these financial statements.
46
CONVERGENCE MARKET NEUTRAL FUND
|
Schedule of Investments
|
November 30, 2017
|
Shares
|
Value
|
|||||||
|
COMMON STOCKS* 101.85%
|
||||||||
|
Accommodation 0.89%
|
||||||||
|
Penn National Gaming, Inc. (a)
|
6,994
|
$
|
201,147
|
|||||
|
Administrative and Support Services 2.50%
|
||||||||
|
Alliance Data Systems Corp.
|
788
|
188,545
|
||||||
|
ManpowerGroup, Inc.
|
1,495
|
192,706
|
||||||
|
TriNet Group, Inc. (a)
|
4,107
|
183,829
|
||||||
|
565,080
|
||||||||
|
Air Transportation 0.87%
|
||||||||
|
Copa Holdings SA – Class A (b)
|
1,459
|
195,783
|
||||||
|
Amusement, Gambling, and Recreation Industries 0.84%
|
||||||||
|
Las Vegas Sands Corp.
|
2,766
|
191,656
|
||||||
|
Beverage and Tobacco Product Manufacturing 0.86%
|
||||||||
|
National Beverage Corp.
|
1,791
|
195,434
|
||||||
|
Broadcasting (except Internet) 2.65%
|
||||||||
|
AMC Networks, Inc. – Class A (a)
|
3,190
|
164,413
|
||||||
|
Comcast Corp. – Class A
|
4,275
|
160,483
|
||||||
|
Liberty Interactive Corp. – Class A (a)
|
5,082
|
124,001
|
||||||
|
Sinclair Broadcast Group, Inc. – Class A
|
4,383
|
149,241
|
||||||
|
598,138
|
||||||||
|
Building Material and Garden Equipment 1.83%
|
||||||||
|
Home Depot, Inc.
|
1,200
|
215,784
|
||||||
|
Lowe’s Companies, Inc.
|
2,391
|
199,338
|
||||||
|
415,122
|
||||||||
|
Chemical Manufacturing 6.97%
|
||||||||
|
AbbVie, Inc.
|
2,319
|
224,758
|
||||||
|
Bioverativ, Inc. (a)
|
3,770
|
188,575
|
||||||
|
Emergent BioSolutions, Inc. (a)
|
4,811
|
211,347
|
||||||
|
Gilead Sciences, Inc.
|
2,593
|
193,905
|
||||||
|
Huntsman Corp.
|
5,926
|
189,395
|
||||||
|
Myriad Genetics, Inc. (a)
|
5,310
|
183,885
|
||||||
|
Vertex Pharmaceuticals, Inc. (a)
|
1,356
|
195,657
|
||||||
|
Westlake Chemical Corp.
|
1,903
|
186,361
|
||||||
|
1,573,883
|
||||||||
The accompanying notes are an integral part of these financial statements.
47
CONVERGENCE MARKET NEUTRAL FUND
|
Schedule of Investments (Continued)
|
November 30, 2017
|
Shares
|
Value
|
|||||||
|
Computer and Electronic Product Manufacturing 6.47%
|
||||||||
|
Apple, Inc.
|
1,156
|
$
|
198,659
|
|||||
|
Applied Materials, Inc.
|
3,559
|
187,808
|
||||||
|
Cisco Systems, Inc.
|
5,173
|
192,953
|
||||||
|
Jabil, Inc.
|
6,822
|
196,815
|
||||||
|
Lam Research Corp.
|
841
|
161,750
|
||||||
|
Micron Technology, Inc. (a)
|
4,426
|
187,618
|
||||||
|
NetApp, Inc.
|
3,479
|
196,598
|
||||||
|
ON Semiconductor Corp. (a)
|
7,074
|
142,046
|
||||||
|
1,464,247
|
||||||||
|
Construction of Buildings 2.43%
|
||||||||
|
KB Home
|
6,128
|
192,175
|
||||||
|
PulteGroup, Inc.
|
5,042
|
172,083
|
||||||
|
Toll Brothers, Inc.
|
3,685
|
185,466
|
||||||
|
549,724
|
||||||||
|
Credit Intermediation and Related Activities 9.34%
|
||||||||
|
Ameriprise Financial, Inc.
|
1,021
|
166,658
|
||||||
|
Bank of America Corp.
|
7,020
|
197,753
|
||||||
|
Capital One Financial Corp.
|
2,049
|
188,508
|
||||||
|
CIT Group, Inc.
|
3,815
|
190,140
|
||||||
|
Citigroup, Inc.
|
2,704
|
204,152
|
||||||
|
Fifth Third Bancorp.
|
6,600
|
201,366
|
||||||
|
JPMorgan Chase & Co.
|
1,963
|
205,172
|
||||||
|
Nationstar Mortgage Holdings, Inc. (a)(c)
|
10,576
|
191,108
|
||||||
|
Regions Financial Corp.
|
11,679
|
193,755
|
||||||
|
Santander Consumer USA Holdings, Inc.
|
10,478
|
180,641
|
||||||
|
Wells Fargo & Co.
|
3,429
|
193,636
|
||||||
|
2,112,889
|
||||||||
|
Electrical Equipment, Appliance, and
|
||||||||
|
Component Manufacturing 0.85%
|
||||||||
|
Generac Holdings, Inc. (a)
|
3,915
|
192,501
|
||||||
|
Fabricated Metal Product Manufacturing 1.68%
|
||||||||
|
Mueller Industries, Inc.
|
5,189
|
188,880
|
||||||
|
Rexnord Corp. (a)
|
7,690
|
191,634
|
||||||
|
380,514
|
||||||||
|
Food Manufacturing 2.25%
|
||||||||
|
Archer-Daniels-Midland Co.
|
3,814
|
152,102
|
||||||
|
Pilgrim’s Pride Corp. (a)
|
5,208
|
190,978
|
||||||
The accompanying notes are an integral part of these financial statements.
48
CONVERGENCE MARKET NEUTRAL FUND
|
Schedule of Investments (Continued)
|
November 30, 2017
|
Shares
|
Value
|
|||||||
|
Food Manufacturing 2.25% (Continued)
|
||||||||
|
Sanderson Farms, Inc.
|
980
|
$
|
166,296
|
|||||
|
509,376
|
||||||||
|
Food Services and Drinking Places 0.84%
|
||||||||
|
Hyatt Hotels Corp. – Class A (a)
|
2,635
|
190,669
|
||||||
|
General Merchandise Stores 0.48%
|
||||||||
|
Wal-Mart Stores, Inc.
|
1,112
|
108,120
|
||||||
|
Health and Personal Care Stores 2.34%
|
||||||||
|
CVS Health Corp.
|
1,246
|
95,444
|
||||||
|
Express Scripts Holding Co. (a)
|
3,264
|
212,748
|
||||||
|
McKesson Corp.
|
1,487
|
219,688
|
||||||
|
527,880
|
||||||||
|
Heavy and Civil Engineering Construction 0.84%
|
||||||||
|
KBR, Inc.
|
10,100
|
189,375
|
||||||
|
Insurance Carriers and Related Activities 8.36%
|
||||||||
|
Athene Holding, Ltd. – Class A (a)(b)
|
3,639
|
174,927
|
||||||
|
Centene Corp. (a)
|
1,852
|
189,071
|
||||||
|
CNO Financial Group, Inc.
|
8,339
|
210,226
|
||||||
|
Humana, Inc.
|
781
|
203,732
|
||||||
|
Lincoln National Corp.
|
2,487
|
190,380
|
||||||
|
MGIC Investment Corp. (a)
|
13,150
|
192,253
|
||||||
|
Molina Healthcare, Inc. (a)
|
1,202
|
94,044
|
||||||
|
Torchmark Corp.
|
2,080
|
184,808
|
||||||
|
UnitedHealth Group, Inc.
|
935
|
213,339
|
||||||
|
WellCare Health Plans, Inc. (a)
|
1,123
|
239,187
|
||||||
|
1,891,967
|
||||||||
|
Leather and Allied Product Manufacturing 0.80%
|
||||||||
|
Deckers Outdoor Corp. (a)
|
2,420
|
180,847
|
||||||
|
Machinery Manufacturing 1.70%
|
||||||||
|
Caterpillar, Inc.
|
1,380
|
194,787
|
||||||
|
Cummins, Inc.
|
1,129
|
188,995
|
||||||
|
383,782
|
||||||||
|
Management of Companies and Enterprises 0.91%
|
||||||||
|
American Equity Investment Life Holding Co.
|
6,503
|
206,340
|
||||||
The accompanying notes are an integral part of these financial statements.
49
CONVERGENCE MARKET NEUTRAL FUND
|
Schedule of Investments (Continued)
|
November 30, 2017
|
Shares
|
Value
|
|||||||
|
Merchant Wholesalers, Durable Goods 0.87%
|
||||||||
|
Builders FirstSource, Inc. (a)
|
9,691
|
$
|
197,696
|
|||||
|
Merchant Wholesalers, Nondurable Goods 1.36%
|
||||||||
|
Ingevity Corp. (a)
|
2,330
|
185,445
|
||||||
|
Nu Skin Enterprises, Inc. – Class A
|
1,802
|
122,374
|
||||||
|
307,819
|
||||||||
|
Mining (except Oil and Gas) 0.76%
|
||||||||
|
Freeport-McMoRan, Inc. – Class B (a)
|
12,320
|
171,494
|
||||||
|
Miscellaneous Manufacturing 0.54%
|
||||||||
|
Estee Lauder Companies, Inc. – Class A
|
980
|
122,333
|
||||||
|
Motion Picture and Sound Recording Industries 0.75%
|
||||||||
|
Netflix, Inc. (a)
|
899
|
168,634
|
||||||
|
Nonmetallic Mineral Product Manufacturing 0.82%
|
||||||||
|
Owens-Illinois, Inc. (a)
|
7,653
|
185,356
|
||||||
|
Nonstore Retailers 1.04%
|
||||||||
|
Amazon.com, Inc. (a)
|
200
|
235,350
|
||||||
|
Oil and Gas Extraction 0.89%
|
||||||||
|
Pattern Energy Group, Inc. – Class A
|
8,951
|
201,756
|
||||||
|
Other Information Services 1.58%
|
||||||||
|
Alphabet, Inc. – Class C (a)
|
168
|
171,597
|
||||||
|
Facebook, Inc. – Class A (a)
|
1,050
|
186,039
|
||||||
|
357,636
|
||||||||
|
Performing Arts, Spectator Sports, and Related Industries 0.83%
|
||||||||
|
Live Nation Entertainment, Inc. (a)
|
4,127
|
187,283
|
||||||
|
Personal and Laundry Services 0.65%
|
||||||||
|
Weight Watchers International, Inc. (a)(c)
|
3,321
|
146,356
|
||||||
|
Petroleum and Coal Products Manufacturing 6.01%
|
||||||||
|
Chevron Corp.
|
1,596
|
189,908
|
||||||
|
CVR Energy, Inc. (c)
|
6,442
|
210,331
|
||||||
|
Exxon Mobil Corp. (c)
|
2,341
|
194,982
|
||||||
|
HollyFrontier Corp.
|
3,975
|
176,808
|
||||||
|
Marathon Petroleum Corp.
|
3,150
|
197,285
|
||||||
|
PBF Energy, Inc. – Class A (c)
|
5,614
|
181,725
|
||||||
The accompanying notes are an integral part of these financial statements.
50
CONVERGENCE MARKET NEUTRAL FUND
|
Schedule of Investments (Continued)
|
November 30, 2017
|
Shares
|
Value
|
|||||||
|
Petroleum and Coal Products Manufacturing 6.01% (Continued)
|
||||||||
|
Valero Energy Corp.
|
2,410
|
$
|
206,344
|
|||||
|
1,357,383
|
||||||||
|
Primary Metal Manufacturing 0.81%
|
||||||||
|
Alcoa Corp. (a)
|
4,430
|
183,889
|
||||||
|
Professional, Scientific, and Technical Services 6.03%
|
||||||||
|
Amgen, Inc.
|
1,243
|
218,345
|
||||||
|
Aspen Technology, Inc. (a)
|
2,630
|
176,000
|
||||||
|
Cadence Design System, Inc. (a)
|
4,260
|
187,057
|
||||||
|
F5 Networks, Inc. (a)
|
1,420
|
190,564
|
||||||
|
Insperity, Inc.
|
1,660
|
195,714
|
||||||
|
MAXIMUS, Inc.
|
2,990
|
206,549
|
||||||
|
VMware, Inc. – Class A (a)(c)
|
1,587
|
190,615
|
||||||
|
1,364,844
|
||||||||
|
Publishing Industries (except Internet) 3.64%
|
||||||||
|
Citrix Systems, Inc. (a)
|
2,016
|
176,662
|
||||||
|
Cogent Communications Holdings, Inc.
|
2,132
|
99,884
|
||||||
|
Fortinet, Inc. (a)
|
4,690
|
197,261
|
||||||
|
Microsoft Corp.
|
2,074
|
174,569
|
||||||
|
Oracle Corp.
|
3,640
|
178,578
|
||||||
|
826,954
|
||||||||
|
Rail Transportation 0.82%
|
||||||||
|
Union Pacific Corp.
|
1,475
|
186,588
|
||||||
|
Real Estate 2.49%
|
||||||||
|
CBRE Group, Inc. – Class A (a)
|
4,860
|
210,730
|
||||||
|
Jones Lang LaSalle, Inc.
|
1,225
|
186,800
|
||||||
|
Realogy Holdings Corp.
|
5,945
|
165,925
|
||||||
|
563,455
|
||||||||
|
Rental and Leasing Services 1.63%
|
||||||||
|
Synchrony Financial
|
4,724
|
169,544
|
||||||
|
Triton International Ltd. – Class A (b)
|
5,030
|
199,037
|
||||||
|
368,581
|
||||||||
|
Securities, Commodity Contracts, and Other
|
||||||||
|
Financial Investments and Related Activities 2.32%
|
||||||||
|
Legg Mason, Inc.
|
4,109
|
164,196
|
||||||
|
Morgan Stanley
|
3,435
|
177,280
|
||||||
The accompanying notes are an integral part of these financial statements.
51
CONVERGENCE MARKET NEUTRAL FUND
|
Schedule of Investments (Continued)
|
November 30, 2017
|
Shares
|
Value
|
|||||||
|
Securities, Commodity Contracts, and Other
|
||||||||
|
Financial Investments and Related Activities 2.32% (Continued)
|
||||||||
|
Travelport Worldwide Ltd. (b)
|
13,712
|
$
|
183,604
|
|||||
|
525,080
|
||||||||
|
Support Activities for Mining 0.95%
|
||||||||
|
MDU Resources Group, Inc.
|
7,713
|
215,578
|
||||||
|
Support Activities for Transportation 0.90%
|
||||||||
|
XPO Logistics, Inc. (a)
|
2,553
|
201,763
|
||||||
|
Telecommunications 0.42%
|
||||||||
|
AT&T, Inc.
|
2,594
|
94,370
|
||||||
|
Transportation Equipment Manufacturing 4.79%
|
||||||||
|
Allison Transmission Holdings, Inc.
|
4,700
|
192,888
|
||||||
|
Boeing Co.
|
722
|
199,850
|
||||||
|
Dana, Inc.
|
4,909
|
162,193
|
||||||
|
Lear Corp.
|
889
|
160,811
|
||||||
|
Meritor, Inc. (a)
|
6,970
|
174,111
|
||||||
|
Oshkosh Corp.
|
2,157
|
194,216
|
||||||
|
1,084,069
|
||||||||
|
Utilities 2.66%
|
||||||||
|
CenterPoint Energy, Inc.
|
7,020
|
210,670
|
||||||
|
National Fuel Gas Co.
|
3,303
|
194,216
|
||||||
|
PNM Resources, Inc.
|
4,331
|
197,061
|
||||||
|
601,947
|
||||||||
|
Water Transportation 0.79%
|
||||||||
|
Royal Caribbean Cruises Ltd. (b)
|
1,450
|
179,626
|
||||||
|
Wood Product Manufacturing 0.80%
|
||||||||
|
Louisiana-Pacific Corp. (a)
|
6,587
|
181,867
|
||||||
|
TOTAL COMMON STOCKS (Cost $19,984,092)
|
23,042,181
|
|||||||
|
REAL ESTATE INVESTMENT TRUSTS* 6.57%
|
||||||||
|
American Tower Corp.
|
1,271
|
182,935
|
||||||
|
First Industrial Realty Trust, Inc.
|
5,970
|
194,323
|
||||||
|
Granite Point Mortgage Trust, Inc.
|
1
|
11
|
||||||
|
Mack-Cali Realty Corp.
|
6,659
|
147,363
|
||||||
|
Park Hotels & Resorts, Inc.
|
6,340
|
185,128
|
||||||
|
Potlatch Corp.
|
3,706
|
191,230
|
||||||
The accompanying notes are an integral part of these financial statements.
52
CONVERGENCE MARKET NEUTRAL FUND
|
Schedule of Investments (Continued)
|
November 30, 2017
|
Shares
|
Value
|
|||||||
|
REAL ESTATE INVESTMENT TRUSTS* 6.57% (Continued)
|
||||||||
|
Prologis, Inc.
|
2,935
|
$
|
194,385
|
|||||
|
PS Business Parks, Inc.
|
1,359
|
180,149
|
||||||
|
Xenia Hotels & Resorts, Inc.
|
9,549
|
209,983
|
||||||
|
TOTAL REAL ESTATE INVESTMENT TRUSTS (Cost $1,423,694)
|
1,485,507
|
|||||||
|
SHORT-TERM INVESTMENTS 1.30%
|
||||||||
|
Fidelity Institutional Money Market Funds –
|
||||||||
|
Government Portfolio – Class I, 0.970% (c)(d)
|
294,823
|
294,823
|
||||||
|
TOTAL SHORT-TERM INVESTMENTS (Cost $294,823)
|
294,823
|
|||||||
|
Total Investments (Cost $21,702,609) 109.72%
|
24,822,511
|
|||||||
|
Liabilities in Excess of Other Assets (9.72)%
|
(2,198,217
|
)
|
||||||
|
TOTAL NET ASSETS 100.00%
|
$
|
22,624,294
|
||||||
Percentages are stated as a percent of net assets.
|
*
|
Unless otherwise noted, all or a portion of these securities, totaling $22,349,678, are pledged as collateral for securities sold short.
|
|
(a)
|
Non-income producing security.
|
|
(b)
|
Foreign issued security.
|
|
(c)
|
This security is not pledged as collateral for securities sold short.
|
|
(d)
|
Seven day yield as of November 30, 2017.
|
|
Abbreviations:
|
|
|
Ltd.
|
Limited Liability Company.
|
|
SA
|
Generally designates a type of corporation in various countries, mostly those employing a civil law legal system.
|
The accompanying notes are an integral part of these financial statements.
53
CONVERGENCE MARKET NEUTRAL FUND
|
Schedule of Securities Sold Short
|
November 30, 2017
|
Shares
|
Value
|
|||||||
|
SECURITIES SOLD SHORT (84.92)%
|
||||||||
|
COMMON STOCKS (77.72)%
|
||||||||
|
Accommodation (0.49)%
|
||||||||
|
Red Rock Resorts, Inc. – Class A
|
(3,560
|
)
|
$
|
(109,826
|
)
|
|||
|
Administrative and Support Services (2.54)%
|
||||||||
|
Equifax, Inc.
|
(1,020
|
)
|
(116,402
|
)
|
||||
|
Gartner, Inc.
|
(956
|
)
|
(115,571
|
)
|
||||
|
IHS Markit Ltd. (a)
|
(2,601
|
)
|
(116,057
|
)
|
||||
|
TripAdvisor, Inc.
|
(3,173
|
)
|
(109,849
|
)
|
||||
|
WageWorks, Inc.
|
(1,848
|
)
|
(118,549
|
)
|
||||
|
(576,428
|
)
|
|||||||
|
Air Transportation (0.44)%
|
||||||||
|
Spirit Airlines, Inc.
|
(2,326
|
)
|
(99,157
|
)
|
||||
|
Ambulatory Health Care Services (1.62)%
|
||||||||
|
Envision Healthcare Corp.
|
(4,017
|
)
|
(128,262
|
)
|
||||
|
Loxo Oncology, Inc.
|
(930
|
)
|
(71,378
|
)
|
||||
|
MEDNAX, Inc.
|
(2,050
|
)
|
(102,070
|
)
|
||||
|
Spark Therapeutics, Inc.
|
(878
|
)
|
(64,296
|
)
|
||||
|
(366,006
|
)
|
|||||||
|
Apparel Manufacturing (0.46)%
|
||||||||
|
Under Armour, Inc. – Class C
|
(8,800
|
)
|
(104,984
|
)
|
||||
|
Broadcasting (except Internet) (1.08)%
|
||||||||
|
Charter Communications, Inc. – Class A
|
(357
|
)
|
(116,457
|
)
|
||||
|
DISH Network Corp. – Class A
|
(2,535
|
)
|
(128,398
|
)
|
||||
|
(244,855
|
)
|
|||||||
|
Building Material and Garden Equipment (0.63)%
|
||||||||
|
MSC Industrial Direct Company, Inc. – Class A
|
(1,572
|
)
|
(141,590
|
)
|
||||
|
Chemical Manufacturing (4.87)%
|
||||||||
|
ACADIA Pharmaceuticals, Inc.
|
(2,359
|
)
|
(71,360
|
)
|
||||
|
Aerie Pharmaceuticals, Inc.
|
(1,380
|
)
|
(88,664
|
)
|
||||
|
Ashland Global Holdings, Inc.
|
(1,980
|
)
|
(146,480
|
)
|
||||
|
Avexis, Inc.
|
(680
|
)
|
(64,471
|
)
|
||||
|
Blueprint Medicines Corp.
|
(890
|
)
|
(66,803
|
)
|
||||
|
Clovis Oncology, Inc.
|
(900
|
)
|
(56,583
|
)
|
||||
|
Coty, Inc. – Class A
|
(5,546
|
)
|
(95,558
|
)
|
||||
|
Medicines Co.
|
(2,340
|
)
|
(67,860
|
)
|
||||
The accompanying notes are an integral part of these financial statements.
54
CONVERGENCE MARKET NEUTRAL FUND
|
Schedule of Securities Sold Short (Continued)
|
November 30, 2017
|
Shares
|
Value
|
|||||||
|
Chemical Manufacturing (4.87)% (Continued)
|
||||||||
|
Prothena Corp. PLC (a)
|
(1,530
|
)
|
$
|
(71,130
|
)
|
|||
|
Sage Therapeutics, Inc.
|
(670
|
)
|
(61,915
|
)
|
||||
|
Sarepta Therapeutics, Inc.
|
(1,698
|
)
|
(94,527
|
)
|
||||
|
Seattle Genetics, Inc.
|
(1,060
|
)
|
(64,586
|
)
|
||||
|
TESARO, Inc.
|
(896
|
)
|
(75,802
|
)
|
||||
|
Ultragenyx Pharmaceutical, Inc.
|
(1,470
|
)
|
(74,220
|
)
|
||||
|
(1,099,959
|
)
|
|||||||
|
Clothing and Clothing Accessories Stores (0.50)%
|
||||||||
|
Foot Locker, Inc.
|
(2,648
|
)
|
(113,440
|
)
|
||||
|
Computer and Electronic Product Manufacturing (6.48)%
|
||||||||
|
Advanced Micro Devices, Inc.
|
(10,028
|
)
|
(109,205
|
)
|
||||
|
Analog Devices, Inc.
|
(1,150
|
)
|
(99,027
|
)
|
||||
|
Ciena Corp.
|
(4,971
|
)
|
(108,119
|
)
|
||||
|
Cubic Corp.
|
(2,084
|
)
|
(129,104
|
)
|
||||
|
DexCom, Inc.
|
(1,950
|
)
|
(113,939
|
)
|
||||
|
Hologic, Inc.
|
(3,145
|
)
|
(131,209
|
)
|
||||
|
Infinera Corp.
|
(15,173
|
)
|
(109,853
|
)
|
||||
|
Inphi Corp.
|
(2,330
|
)
|
(95,693
|
)
|
||||
|
Johnson Controls International PLC (a)
|
(3,017
|
)
|
(113,560
|
)
|
||||
|
LivaNova PLC (a)
|
(1,280
|
)
|
(111,590
|
)
|
||||
|
Lumentum Holdings, Inc.
|
(2,040
|
)
|
(110,262
|
)
|
||||
|
MACOM Technology Solutions Holdings, Inc.
|
(3,440
|
)
|
(112,110
|
)
|
||||
|
MaxLinear, Inc.
|
(4,580
|
)
|
(120,957
|
)
|
||||
|
(1,464,628
|
)
|
|||||||
|
Construction of Buildings (0.97)%
|
||||||||
|
Dycom Industries, Inc.
|
(1,060
|
)
|
(113,812
|
)
|
||||
|
Taylor Morrison Home Corp. – Class A
|
(4,370
|
)
|
(105,579
|
)
|
||||
|
(219,391
|
)
|
|||||||
|
Credit Intermediation and Related Activities (5.93)%
|
||||||||
|
Flagstar Bancorp, Inc.
|
(3,240
|
)
|
(123,152
|
)
|
||||
|
FNB Corp.
|
(9,250
|
)
|
(131,257
|
)
|
||||
|
Home BancShares, Inc.
|
(5,240
|
)
|
(124,712
|
)
|
||||
|
IBERIABANK Corp.
|
(1,610
|
)
|
(125,178
|
)
|
||||
|
Independent Bank Group, Inc.
|
(1,890
|
)
|
(130,220
|
)
|
||||
|
LendingClub Corp.
|
(25,459
|
)
|
(111,256
|
)
|
||||
|
Pinnacle Financial Partners, Inc.
|
(1,610
|
)
|
(110,527
|
)
|
||||
|
Signature Bank
|
(910
|
)
|
(124,925
|
)
|
||||
|
SLM Corp.
|
(9,536
|
)
|
(110,332
|
)
|
||||
The accompanying notes are an integral part of these financial statements.
55
CONVERGENCE MARKET NEUTRAL FUND
|
Schedule of Securities Sold Short (Continued)
|
November 30, 2017
|
Shares
|
Value
|
|||||||
|
Credit Intermediation and Related Activities (5.93)% (Continued)
|
||||||||
|
Sterling Bancorp
|
(4,860
|
)
|
$
|
(123,201
|
)
|
|||
|
Texas Capital Bancshares, Inc.
|
(1,393
|
)
|
(125,857
|
)
|
||||
|
(1,340,617
|
)
|
|||||||
|
Data Processing, Hosting and Related Services (1.13)%
|
||||||||
|
Acxiom Corp.
|
(4,560
|
)
|
(124,260
|
)
|
||||
|
WEX, Inc.
|
(1,012
|
)
|
(130,264
|
)
|
||||
|
(254,524
|
)
|
|||||||
|
Electrical Equipment, Appliance, and
|
||||||||
|
Component Manufacturing (0.41)%
|
||||||||
|
Spectrum Brands Holdings, Inc.
|
(798
|
)
|
(91,674
|
)
|
||||
|
Fabricated Metal Product Manufacturing (1.10)%
|
||||||||
|
Axalta Coating Systems Ltd. (a)
|
(3,867
|
)
|
(122,429
|
)
|
||||
|
Mueller Water Products, Inc. – Class A
|
(10,230
|
)
|
(127,773
|
)
|
||||
|
(250,202
|
)
|
|||||||
|
Food Manufacturing (2.44)%
|
||||||||
|
B&G Foods, Inc.
|
(2,724
|
)
|
(105,419
|
)
|
||||
|
Blue Buffalo Pet Products, Inc.
|
(3,577
|
)
|
(109,850
|
)
|
||||
|
Kraft Heinz Co.
|
(1,519
|
)
|
(123,601
|
)
|
||||
|
Pinnacle Foods, Inc.
|
(1,750
|
)
|
(101,903
|
)
|
||||
|
TreeHouse Foods, Inc.
|
(2,400
|
)
|
(110,447
|
)
|
||||
|
(551,220
|
)
|
|||||||
|
Food Services and Drinking Places (3.01)%
|
||||||||
|
Casey’s General Stores, Inc.
|
(627
|
)
|
(75,710
|
)
|
||||
|
Cheesecake Factory, Inc.
|
(2,550
|
)
|
(125,053
|
)
|
||||
|
Chipotle Mexican Grill, Inc.
|
(390
|
)
|
(118,712
|
)
|
||||
|
Domino’s Pizza, Inc.
|
(670
|
)
|
(124,727
|
)
|
||||
|
Dunkin’ Brands Group, Inc.
|
(1,950
|
)
|
(116,415
|
)
|
||||
|
Yum! Brands, Inc.
|
(1,473
|
)
|
(122,951
|
)
|
||||
|
(683,568
|
)
|
|||||||
|
Furniture and Home Furnishings Stores (0.60)%
|
||||||||
|
Bed Bath & Beyond, Inc.
|
(6,080
|
)
|
(136,131
|
)
|
||||
|
General Merchandise Stores (0.85)%
|
||||||||
|
Macy’s, Inc.
|
(4,830
|
)
|
(114,954
|
)
|
||||
|
PriceSmart, Inc.
|
(890
|
)
|
(76,095
|
)
|
||||
|
(191,049
|
)
|
|||||||
The accompanying notes are an integral part of these financial statements.
56
CONVERGENCE MARKET NEUTRAL FUND
|
Schedule of Securities Sold Short (Continued)
|
November 30, 2017
|
Shares
|
Value
|
|||||||
|
Health and Personal Care Stores (0.55)%
|
||||||||
|
Ulta Beauty, Inc.
|
(563
|
)
|
$
|
(124,823
|
)
|
|||
|
Insurance Carriers and Related Activities (3.32)%
|
||||||||
|
American International Group, Inc.
|
(1,920
|
)
|
(115,123
|
)
|
||||
|
AmTrust Financial Services, Inc.
|
(13,101
|
)
|
(126,294
|
)
|
||||
|
Brighthouse Financial, Inc.
|
(2,150
|
)
|
(126,399
|
)
|
||||
|
Chubb Ltd. (a)
|
(840
|
)
|
(127,772
|
)
|
||||
|
RLI Corp.
|
(2,120
|
)
|
(126,628
|
)
|
||||
|
Willis Towers Watson PLC (a)
|
(800
|
)
|
(128,640
|
)
|
||||
|
(750,856
|
)
|
|||||||
|
Machinery Manufacturing (2.28)%
|
||||||||
|
Flowserve Corp.
|
(3,080
|
)
|
(131,146
|
)
|
||||
|
General Electric Co.
|
(6,910
|
)
|
(126,384
|
)
|
||||
|
IMAX Corp. (a)
|
(5,045
|
)
|
(128,143
|
)
|
||||
|
Middleby Corp.
|
(1,020
|
)
|
(130,070
|
)
|
||||
|
(515,743
|
)
|
|||||||
|
Management of Companies and Enterprises (1.06)%
|
||||||||
|
ServisFirst Bancshares, Inc.
|
(2,980
|
)
|
(125,130
|
)
|
||||
|
Simmons First National Corp. – Class A
|
(2,000
|
)
|
(115,800
|
)
|
||||
|
(240,930
|
)
|
|||||||
|
Merchant Wholesalers, Durable Goods (2.25)%
|
||||||||
|
Avnet, Inc.
|
(2,645
|
)
|
(109,529
|
)
|
||||
|
GCP Applied Technologies, Inc.
|
(3,890
|
)
|
(127,398
|
)
|
||||
|
WESCO International, Inc.
|
(2,080
|
)
|
(136,344
|
)
|
||||
|
Zendesk, Inc.
|
(4,063
|
)
|
(136,557
|
)
|
||||
|
(509,828
|
)
|
|||||||
|
Merchant Wholesalers, Nondurable Goods (0.30)%
|
||||||||
|
Global Blood Therapeutics, Inc.
|
(1,720
|
)
|
(67,854
|
)
|
||||
|
Mining (except Oil and Gas) (1.60)%
|
||||||||
|
Martin Marietta Materials, Inc.
|
(580
|
)
|
(120,866
|
)
|
||||
|
Summit Materials, Inc. – Class A
|
(3,580
|
)
|
(110,121
|
)
|
||||
|
Vulcan Materials Co.
|
(1,039
|
)
|
(130,550
|
)
|
||||
|
(361,537
|
)
|
|||||||
|
Miscellaneous Manufacturing (2.56)%
|
||||||||
|
DENTSPLY SIRONA, Inc.
|
(2,020
|
)
|
(135,360
|
)
|
||||
|
Mattel, Inc.
|
(5,900
|
)
|
(107,675
|
)
|
||||
The accompanying notes are an integral part of these financial statements.
57
CONVERGENCE MARKET NEUTRAL FUND
|
Schedule of Securities Sold Short (Continued)
|
November 30, 2017
|
Shares
|
Value
|
|||||||
|
Miscellaneous Manufacturing (2.56)% (Continued)
|
||||||||
|
Nevro Corp.
|
(1,170
|
)
|
$
|
(87,539
|
)
|
|||
|
NuVasive, Inc.
|
(2,050
|
)
|
(118,265
|
)
|
||||
|
Penumbra, Inc.
|
(1,236
|
)
|
(130,151
|
)
|
||||
|
(578,990
|
)
|
|||||||
|
Motion Picture and Sound Recording Industries (0.66)%
|
||||||||
|
Regal Entertainment Group – Class A
|
(7,390
|
)
|
(149,352
|
)
|
||||
|
Motor Vehicle and Parts Dealers (0.65)%
|
||||||||
|
Advance Auto Parts, Inc.
|
(1,473
|
)
|
(148,773
|
)
|
||||
|
Nonmetallic Mineral Product Manufacturing (0.61)%
|
||||||||
|
USG Corp.
|
(3,659
|
)
|
(139,079
|
)
|
||||
|
Nonstore Retailers (0.61)%
|
||||||||
|
WW Grainger, Inc.
|
(619
|
)
|
(136,991
|
)
|
||||
|
Oil and Gas Extraction (2.81)%
|
||||||||
|
Callon Petroleum Co.
|
(10,672
|
)
|
(117,819
|
)
|
||||
|
Extraction Oil & Gas, Inc.
|
(7,939
|
)
|
(119,561
|
)
|
||||
|
Jagged Peak Energy, Inc.
|
(9,110
|
)
|
(138,291
|
)
|
||||
|
Parsley Energy, Inc. – Class A
|
(4,727
|
)
|
(126,967
|
)
|
||||
|
RSP Permian, Inc.
|
(3,680
|
)
|
(135,167
|
)
|
||||
|
(637,805
|
)
|
|||||||
|
Petroleum and Coal Products Manufacturing (0.56)%
|
||||||||
|
Valvoline, Inc.
|
(5,175
|
)
|
(127,616
|
)
|
||||
|
Pipeline Transportation (0.51)%
|
||||||||
|
South Jersey Industries, Inc.
|
(3,430
|
)
|
(116,140
|
)
|
||||
|
Plastics and Rubber Products Manufacturing (1.60)%
|
||||||||
|
Cooper Tire & Rubber Co.
|
(3,385
|
)
|
(124,399
|
)
|
||||
|
Newell Brands, Inc.
|
(3,515
|
)
|
(108,860
|
)
|
||||
|
Sealed Air Corp.
|
(2,679
|
)
|
(128,726
|
)
|
||||
|
(361,985
|
)
|
|||||||
|
Primary Metal Manufacturing (0.44)%
|
||||||||
|
Finisar Corp.
|
(4,942
|
)
|
(98,889
|
)
|
||||
|
Printing and Related Support Activities (0.46)%
|
||||||||
|
Centennial Resource Development, Inc. – Class A
|
(5,100
|
)
|
(103,479
|
)
|
||||
The accompanying notes are an integral part of these financial statements.
58
CONVERGENCE MARKET NEUTRAL FUND
|
Schedule of Securities Sold Short (Continued)
|
November 30, 2017
|
Shares
|
Value
|
|||||||
|
Professional, Scientific, and Technical Services (2.69)%
|
||||||||
|
2U, Inc.
|
(1,940
|
)
|
$
|
(124,354
|
)
|
|||
|
Diebold Nixdorf, Inc.
|
(5,537
|
)
|
(106,310
|
)
|
||||
|
Macquarie Infrastructure Corp.
|
(1,911
|
)
|
(127,617
|
)
|
||||
|
MuleSoft, Inc. – Class A
|
(5,490
|
)
|
(125,995
|
)
|
||||
|
Nutanix, Inc. – Class A
|
(3,810
|
)
|
(124,968
|
)
|
||||
|
(609,244
|
)
|
|||||||
|
Publishing Industries (except Internet) (3.33)%
|
||||||||
|
Akamai Technologies, Inc.
|
(2,325
|
)
|
(129,689
|
)
|
||||
|
Coupa Software, Inc.
|
(3,580
|
)
|
(126,839
|
)
|
||||
|
Manhattan Associates, Inc.
|
(2,744
|
)
|
(121,696
|
)
|
||||
|
TiVo Corp.
|
(6,760
|
)
|
(120,328
|
)
|
||||
|
Twilio, Inc. – Class A
|
(4,730
|
)
|
(126,102
|
)
|
||||
|
Ultimate Software Group, Inc.
|
(602
|
)
|
(127,040
|
)
|
||||
|
(751,694
|
)
|
|||||||
|
Rental and Leasing Services (0.47)%
|
||||||||
|
AMERCO
|
(287
|
)
|
(106,382
|
)
|
||||
|
Securities, Commodity Contracts, and Other
|
||||||||
|
Financial Investments and Related Activities (3.88)%
|
||||||||
|
Charles Schwab Corp.
|
(2,494
|
)
|
(121,682
|
)
|
||||
|
CommScope Holding Company, Inc.
|
(3,000
|
)
|
(107,970
|
)
|
||||
|
Financial Engines, Inc.
|
(4,141
|
)
|
(115,534
|
)
|
||||
|
INC Research Holdings, Inc. – Class A
|
(1,860
|
)
|
(71,238
|
)
|
||||
|
Interactive Brokers Group, Inc. – Class A
|
(1,692
|
)
|
(96,546
|
)
|
||||
|
MarketAxess Holdings, Inc.
|
(589
|
)
|
(115,014
|
)
|
||||
|
TD Ameritrade Holding Corp.
|
(2,448
|
)
|
(125,264
|
)
|
||||
|
Vantiv, Inc. – Class A
|
(1,640
|
)
|
(123,000
|
)
|
||||
|
(876,248
|
)
|
|||||||
|
Support Activities for Mining (1.09)%
|
||||||||
|
Patterson-UTI Energy, Inc.
|
(5,011
|
)
|
(108,187
|
)
|
||||
|
SemGroup Corp. – Class A
|
(5,707
|
)
|
(136,968
|
)
|
||||
|
(245,155
|
)
|
|||||||
|
Telecommunications (0.68)%
|
||||||||
|
CenturyLink, Inc.
|
(5,423
|
)
|
(79,122
|
)
|
||||
|
Zayo Group Holdings, Inc.
|
(2,097
|
)
|
(74,108
|
)
|
||||
|
(153,230
|
)
|
|||||||
|
Transportation Equipment Manufacturing (2.16)%
|
||||||||
|
Brunswick Corp.
|
(1,928
|
)
|
(106,715
|
)
|
||||
|
Tesla, Inc.
|
(420
|
)
|
(129,717
|
)
|
||||
|
TransDigm Group, Inc.
|
(467
|
)
|
(132,530
|
)
|
||||
The accompanying notes are an integral part of these financial statements.
59
CONVERGENCE MARKET NEUTRAL FUND
|
Schedule of Securities Sold Short (Continued)
|
November 30, 2017
|
Shares
|
Value
|
|||||||
|
Transportation Equipment Manufacturing (2.16)% (Continued)
|
||||||||
|
Wabtec Corp.
|
(1,570
|
)
|
$
|
(120,733
|
)
|
|||
|
(489,695
|
)
|
|||||||
|
Truck Transportation (0.50)%
|
||||||||
|
Knight-Swift Transportation Holdings, Inc. – Class A
|
(2,670
|
)
|
(113,956
|
)
|
||||
|
Utilities (3.48)%
|
||||||||
|
Aqua America, Inc.
|
(3,595
|
)
|
(136,574
|
)
|
||||
|
Cheniere Energy, Inc.
|
(2,395
|
)
|
(115,726
|
)
|
||||
|
Dominion Energy, Inc.
|
(1,550
|
)
|
(130,402
|
)
|
||||
|
Duke Energy Corp.
|
(1,520
|
)
|
(135,554
|
)
|
||||
|
Entergy Corp.
|
(1,570
|
)
|
(135,773
|
)
|
||||
|
Public Service Enterprise Group, Inc.
|
(2,526
|
)
|
(134,030
|
)
|
||||
|
(788,059
|
)
|
|||||||
|
Waste Management and Remediation Services (0.48)%
|
||||||||
|
Stericycle, Inc.
|
(1,640
|
)
|
(108,748
|
)
|
||||
|
Wood Product Manufacturing (0.58)%
|
||||||||
|
Masonite International Corp. (a)
|
(1,770
|
)
|
(130,361
|
)
|
||||
|
TOTAL COMMON STOCKS (Proceeds $17,199,682)
|
(17,582,691
|
)
|
||||||
|
REAL ESTATE INVESTMENT TRUSTS (7.20)%
|
||||||||
|
Acadia Realty Trust
|
(4,151
|
)
|
(116,353
|
)
|
||||
|
American Campus Communities, Inc.
|
(2,452
|
)
|
(103,916
|
)
|
||||
|
Boston Properties, Inc.
|
(964
|
)
|
(120,866
|
)
|
||||
|
Colony NorthStar, Inc. – Class A
|
(9,641
|
)
|
(117,524
|
)
|
||||
|
Crown Castle International Corp.
|
(1,082
|
)
|
(122,266
|
)
|
||||
|
Government Properties Income Trust
|
(7,447
|
)
|
(138,887
|
)
|
||||
|
HCP, Inc.
|
(3,601
|
)
|
(95,210
|
)
|
||||
|
Healthcare Trust of America, Inc. – Class A
|
(1,577
|
)
|
(48,240
|
)
|
||||
|
Kilroy Realty Corp.
|
(1,906
|
)
|
(143,674
|
)
|
||||
|
Macerich Co.
|
(2,223
|
)
|
(143,939
|
)
|
||||
|
Regency Centers Corp.
|
(2,092
|
)
|
(141,859
|
)
|
||||
|
Sabra Health Care REIT, Inc.
|
(5,408
|
)
|
(104,050
|
)
|
||||
|
Taubman Centers, Inc.
|
(1,683
|
)
|
(98,775
|
)
|
||||
|
Uniti Group, Inc.
|
(8,300
|
)
|
(133,630
|
)
|
||||
|
TOTAL REAL ESTATE INVESTMENT TRUSTS
|
||||||||
|
(Proceeds $1,675,234)
|
(1,629,189
|
)
|
||||||
|
TOTAL SECURITIES SOLD SHORT (Proceeds $18,874,916)
|
$
|
(19,211,880
|
)
|
|||||
Abbreviations:
| Ltd. | Limited Liability Company. |
|
PLC
|
Public Limited Company.
|
The accompanying notes are an integral part of these financial statements.
60
CONVERGENCE FUNDS
|
Statements of Assets and Liabilities
|
November 30, 2017
|
Core Plus
|
Opportunities
|
Market
|
||||||||||
|
Fund
|
Fund
|
Neutral Fund
|
||||||||||
|
Assets
|
||||||||||||
|
Investments, at value (cost $145,257,288,
|
||||||||||||
|
$83,789,335 and $21,702,609, respectively)(1)
|
$
|
177,832,211
|
$
|
98,518,016
|
$
|
24,822,511
|
||||||
|
Receivable for investments sold
|
—
|
706,972
|
10,356,047
|
|||||||||
|
Deposit for short sales at broker
|
8,192,843
|
1,615,866
|
16,456,578
|
|||||||||
|
Dividends and interest receivable
|
302,653
|
70,474
|
37,385
|
|||||||||
|
Receivable for Fund shares sold
|
—
|
5,000
|
—
|
|||||||||
|
Receivable for securities lending
|
2,036
|
10,098
|
151
|
|||||||||
|
Receivable from Broker
|
—
|
—
|
981
|
|||||||||
|
Other assets
|
14,600
|
14,261
|
6,520
|
|||||||||
|
Total Assets
|
186,344,343
|
100,940,687
|
51,680,173
|
|||||||||
|
Liabilities
|
||||||||||||
|
Securities sold short, at value
|
||||||||||||
|
(proceeds $54,933,581, $28,644,279 and
|
||||||||||||
|
$18,874,916, respectively)
|
55,026,775
|
29,166,381
|
19,211,880
|
|||||||||
|
Payable for Fund shares redeemed
|
48,505
|
46,106
|
861
|
|||||||||
|
Payable for investments purchased
|
—
|
—
|
9,755,205
|
|||||||||
|
Dividends payable on short positions
|
72,753
|
13,818
|
24,802
|
|||||||||
|
Payable to broker for interest expense
|
17,148
|
10,214
|
—
|
|||||||||
|
Payable for collateral on
|
||||||||||||
|
securities loaned (Note 11)
|
2,438,410
|
2,703,559
|
—
|
|||||||||
|
Payable to Adviser
|
103,240
|
56,041
|
11,822
|
|||||||||
|
Payable to affiliates
|
42,757
|
27,097
|
27,699
|
|||||||||
|
Accrued expenses and other liabilities
|
29,481
|
29,086
|
23,610
|
|||||||||
|
Total Liabilities
|
57,779,069
|
32,052,302
|
29,055,879
|
|||||||||
|
Net Assets
|
$
|
128,565,274
|
$
|
68,888,385
|
$
|
22,624,294
|
||||||
|
Net Assets Consist Of:
|
||||||||||||
|
Paid-in capital
|
$
|
80,013,267
|
$
|
47,017,687
|
$
|
20,864,885
|
||||||
|
Accumulated undistributed
|
||||||||||||
|
net investment income
|
219,039
|
—
|
—
|
|||||||||
|
Accumulated net realized gain (loss)
|
15,851,239
|
7,664,119
|
(1,023,529
|
)
|
||||||||
|
Net unrealized appreciation (depreciation) on
|
||||||||||||
|
Investments
|
32,574,923
|
14,728,681
|
3,119,902
|
|||||||||
|
Securities sold short
|
(93,194
|
)
|
(522,102
|
)
|
(336,964
|
)
|
||||||
|
Net Assets
|
$
|
128,565,274
|
$
|
68,888,385
|
$
|
22,624,294
|
||||||
|
(1) Includes loaned securities of
|
$
|
2,444,718
|
$
|
2,673,711
|
$
|
0
|
||||||
|
Institutional Class Shares
|
||||||||||||
|
Net Assets
|
$
|
128,565,274
|
$
|
68,888,385
|
$
|
22,624,294
|
||||||
|
Shares of beneficial interest outstanding
|
||||||||||||
|
(unlimited number of shares authorized,
|
||||||||||||
|
$0.001 par value)
|
6,112,553
|
5,012,351
|
2,105,574
|
|||||||||
|
Net asset value, redemption price
|
||||||||||||
|
and offering price per share
|
$
|
21.03
|
$
|
13.74
|
$
|
10.74
|
||||||
The accompanying notes are an integral part of these financial statements.
61
CONVERGENCE FUNDS
|
Statements of Operations
|
For the Year Ended November 30, 2017
|
Core Plus
|
Opportunities
|
Market
|
||||||||||
|
Fund
|
Fund
|
Neutral Fund
|
||||||||||
|
Investment Income
|
||||||||||||
|
Dividend income(1)
|
$
|
2,898,310
|
$
|
1,167,827
|
$
|
380,223
|
||||||
|
Interest income
|
13,279
|
4,624
|
19,050
|
|||||||||
|
Securities lending income
|
38,449
|
56,556
|
4,334
|
|||||||||
|
Total Investment Income
|
2,950,038
|
1,229,007
|
403,607
|
|||||||||
|
Expenses
|
||||||||||||
|
Management fees
|
1,276,160
|
715,828
|
210,913
|
|||||||||
|
Interest and broker expenses
|
529,412
|
400,732
|
—
|
|||||||||
|
Dividends on short positions
|
521,384
|
321,643
|
205,115
|
|||||||||
|
Administration fees
|
159,384
|
93,403
|
82,095
|
|||||||||
|
Transfer agent fees and expenses
|
59,154
|
33,741
|
14,112
|
|||||||||
|
Federal and state registration fees
|
30,992
|
12,762
|
18,782
|
|||||||||
|
Custody fees
|
19,992
|
20,359
|
11,709
|
|||||||||
|
Audit and tax fees
|
19,501
|
19,501
|
19,495
|
|||||||||
|
Legal fees
|
17,490
|
14,836
|
10,169
|
|||||||||
|
Fund accounting fees
|
15,066
|
13,070
|
12,118
|
|||||||||
|
Reports to shareholders
|
11,948
|
10,272
|
1,416
|
|||||||||
|
Chief Compliance Officer fees
|
9,967
|
9,800
|
9,800
|
|||||||||
|
Trustees’ fees
|
6,684
|
6,670
|
6,291
|
|||||||||
|
Distribution and service fees –
|
||||||||||||
|
Investment Class(2)
|
3,273
|
—
|
—
|
|||||||||
|
Other expenses
|
10,079
|
8,405
|
4,923
|
|||||||||
|
Total Expenses
|
2,690,486
|
1,681,022
|
606,938
|
|||||||||
|
Expense waiver by Adviser (Note 4)
|
—
|
—
|
(85,383
|
)
|
||||||||
|
Net Expenses
|
2,690,486
|
1,681,022
|
521,555
|
|||||||||
|
Net Investment Income (Loss)
|
259,552
|
(452,015
|
)
|
(117,948
|
)
|
|||||||
|
Realized and Unrealized
|
||||||||||||
|
Gain (Loss) on Investments
|
||||||||||||
|
Net realized gain (loss) from:
|
||||||||||||
|
Investments
|
26,250,576
|
17,615,411
|
3,044,937
|
|||||||||
|
Short transactions
|
(5,198,534
|
)
|
(4,479,068
|
)
|
(3,506,777
|
)
|
||||||
|
Change in net unrealized
|
||||||||||||
|
appreciation (depreciation) on:
|
||||||||||||
|
Investments
|
2,548,707
|
(2,023,861
|
)
|
907,635
|
||||||||
|
Short transactions
|
(1,960,431
|
)
|
(110,460
|
)
|
595,967
|
|||||||
|
Realized and Unrealized
|
||||||||||||
|
Gain on Investments
|
21,640,318
|
11,002,022
|
1,041,762
|
|||||||||
|
Net Increase in Net Assets from Operations
|
$
|
21,899,870
|
$
|
10,550,007
|
$
|
923,814
|
||||||
|
(1)
|
Net of $366, $1,045, and $52 in dividend withholding tax for the Core Plus Fund, Opportunities Fund and Market Neutral Fund, respectively.
|
|
(2)
|
The Investment Class of the Core Plus Fund converted to Institutional Class shares on March 27, 2017. See Note 1 to the financial statements.
|
The accompanying notes are an integral part of these financial statements.
62
CONVERGENCE CORE PLUS FUND
|
Statements of Changes in Net Assets
|
|
Year Ended
|
Year Ended
|
|||||||
|
November 30, 2017
|
November 30, 2016
|
|||||||
|
From Operations
|
||||||||
|
Net investment income
|
$
|
259,552
|
$
|
1,043,403
|
||||
|
Net realized gain (loss) from:
|
||||||||
|
Investments
|
26,250,576
|
5,128,110
|
||||||
|
Short transactions
|
(5,198,534
|
)
|
9,162,554
|
|||||
|
Change in net unrealized
|
||||||||
|
appreciation (depreciation) on:
|
||||||||
|
Investments
|
2,548,707
|
(5,321,490
|
)
|
|||||
|
Short transactions
|
(1,960,431
|
)
|
(7,812,963
|
)
|
||||
|
Net increase in net assets from operations
|
21,899,870
|
2,199,614
|
||||||
|
From Distributions
|
||||||||
|
Net investment income – Institutional Class
|
(1,185,521
|
)
|
(825,056
|
)
|
||||
|
Net investment income – Investment Class(1)
|
(24,153
|
)
|
(13,170
|
)
|
||||
|
Net realized gain on investments –
|
||||||||
|
Institutional Class
|
(4,226,829
|
)
|
(13,520,585
|
)
|
||||
|
Net realized gain on investments –
|
||||||||
|
Investment Class(1)
|
(139,053
|
)
|
(598,326
|
)
|
||||
|
Net decrease in net assets resulting
|
||||||||
|
from distributions paid
|
(5,575,556
|
)
|
(14,957,137
|
)
|
||||
|
From Capital Share Transactions
|
||||||||
|
Proceeds from shares sold – Institutional Class
|
14,370,696
|
20,865,722
|
||||||
|
Proceeds from shares sold – Investment Class(1)
|
91,813
|
1,123,654
|
||||||
|
Proceeds from exchange of Investment Class(1)
|
3,788,824
|
—
|
||||||
|
Net asset value of shares issued in reinvestment of
|
||||||||
|
distributions to shareholders – Institutional Class
|
4,037,834
|
11,864,999
|
||||||
|
Net asset value of shares issued in reinvestment of
|
||||||||
|
distributions to shareholders – Investment Class(1)
|
154,592
|
608,921
|
||||||
|
Payments for shares redeemed – Institutional Class
|
(35,807,761
|
)
|
(120,637,738
|
)
|
||||
|
Payments for shares redeemed –
|
||||||||
|
Investment Class(1)
|
(660,570
|
)
|
(6,701,237
|
)
|
||||
|
Payments for exchange to Institutional Class
|
(3,788,824
|
)
|
—‚
|
|||||
|
Net decrease in net assets from capital
|
||||||||
|
share transactions
|
(17,813,396
|
)
|
(92,875,679
|
)
|
||||
|
Total Decrease In Net Assets
|
(1,489,082
|
)
|
(105,633,202
|
)
|
||||
|
Net Assets
|
||||||||
|
Beginning of year
|
130,054,356
|
235,687,558
|
||||||
|
End of year
|
$
|
128,565,274
|
$
|
130,054,356
|
||||
|
Accumulated Undistributed
|
||||||||
|
Net Investment Income
|
$
|
219,039
|
$
|
1,083,095
|
||||
|
(1)
|
The Investment Class shares converted to Institutional Class shares on March 27, 2017. See Note 1 to the financial statements.
|
The accompanying notes are an integral part of these financial statements.
63
CONVERGENCE OPPORTUNITIES FUND
|
Statements of Changes in Net Assets
|
|
Year Ended
|
Year Ended
|
|||||||
|
November 30, 2017
|
November 30, 2016
|
|||||||
|
From Operations
|
||||||||
|
Net investment income (loss)
|
$
|
(452,015
|
)
|
$
|
88,714
|
|||
|
Net realized gain (loss) from:
|
||||||||
|
Investments
|
17,615,411
|
(488,537
|
)
|
|||||
|
Short transactions
|
(4,479,068
|
)
|
(804,338
|
)
|
||||
|
Change in net unrealized
|
||||||||
|
appreciation (depreciation) on:
|
||||||||
|
Investments
|
(2,023,861
|
)
|
9,496,090
|
|||||
|
Short transactions
|
(110,460
|
)
|
(2,582,696
|
)
|
||||
|
Net increase in net assets from operations
|
10,550,007
|
5,709,233
|
||||||
|
From Distributions
|
||||||||
|
Net realized gain on investments –
|
||||||||
|
Institutional Class
|
—
|
(785,835
|
)
|
|||||
|
Net decrease in net assets resulting
|
||||||||
|
from distributions paid
|
—
|
(785,835
|
)
|
|||||
|
From Capital Share Transactions
|
||||||||
|
Proceeds from shares sold – Institutional Class
|
7,409,537
|
11,656,066
|
||||||
|
Net asset value of shares issued in reinvestment of
|
||||||||
|
distributions to shareholders – Institutional Class
|
—
|
760,541
|
||||||
|
Payments for shares redeemed –
|
||||||||
|
Institutional Class
|
(27,061,203
|
)
|
(24,885,662
|
)
|
||||
|
Net decrease in net assets from capital
|
||||||||
|
share transactions
|
(19,651,666
|
)
|
(12,469,055
|
)
|
||||
|
Total Decrease In Net Assets
|
(9,101,659
|
)
|
(7,545,657
|
)
|
||||
|
Net Assets
|
||||||||
|
Beginning of year
|
77,990,044
|
85,535,701
|
||||||
|
End of year
|
$
|
68,888,385
|
$
|
77,990,044
|
||||
|
Accumulated Undistributed Net Investment Loss
|
$
|
—
|
$
|
—
|
||||
The accompanying notes are an integral part of these financial statements.
64
CONVERGENCE MARKET NEUTRAL FUND
|
Statements of Changes in Net Assets
|
|
Year Ended
|
Period Ended
|
|||||||
|
November 30, 2017
|
November 30, 2016(1)
|
|||||||
|
From Operations
|
||||||||
|
Net investment loss
|
$
|
(117,948
|
)
|
$
|
(100,682
|
)
|
||
|
Net realized gain (loss) from:
|
||||||||
|
Investments
|
3,044,937
|
1,135,708
|
||||||
|
Short transactions
|
(3,506,777
|
)
|
(1,652,937
|
)
|
||||
|
Change in net unrealized
|
||||||||
|
appreciation (depreciation) on:
|
||||||||
|
Investments
|
907,635
|
2,212,267
|
||||||
|
Short transactions
|
595,967
|
(932,931
|
)
|
|||||
|
Net increase in net assets from operations
|
923,814
|
661,425
|
||||||
|
From Capital Share Transactions
|
||||||||
|
Proceeds from shares sold – Institutional Class
|
7,506,103
|
14,646,195
|
||||||
|
Proceeds from shares issued from
|
||||||||
|
transfers in-kind – Institutional Class(2)
|
—
|
2,495,039
|
||||||
|
Payments for shares redeemed –
|
||||||||
|
Institutional Class
|
(2,677,366
|
)
|
(930,916
|
)
|
||||
|
Net increase in net assets from capital
|
||||||||
|
share transactions
|
4,828,737
|
16,210,318
|
||||||
|
Total Increase In Net Assets
|
5,752,551
|
16,871,743
|
||||||
|
Net Assets
|
||||||||
|
Beginning of year
|
16,871,743
|
—
|
||||||
|
End of year
|
$
|
22,624,294
|
$
|
16,871,743
|
||||
|
Accumulated Undistributed Net Investment Loss
|
$
|
—
|
$
|
—
|
||||
|
(1)
|
The Fund commenced operations on January 29, 2016.
|
|
(2)
|
See Note 8 to the Financial Statements.
|
The accompanying notes are an integral part of these financial statements.
65
CONVERGENCE FUNDS
|
Statements of Cash Flows
|
For the Year Ended November 30, 2017
|
Core Plus
|
Opportunities
|
Market
|
||||||||||
|
Fund
|
Fund
|
Neutral Fund
|
||||||||||
|
CASH FLOWS FROM OPERATING ACTIVITIES:
|
||||||||||||
|
Net increase in net
|
||||||||||||
|
assets resulting from operations
|
$
|
21,899,870
|
$
|
10,550,007
|
$
|
923,814
|
||||||
|
Adjustments to reconcile net increase in net
|
||||||||||||
|
assets from operations to net cash used in
|
||||||||||||
|
operating activities:
|
||||||||||||
|
Purchases of investments
|
(359,117,984
|
)
|
(255,787,494
|
)
|
(59,200,659
|
)
|
||||||
|
Investments purchased with
|
||||||||||||
|
proceeds from securities lending, net
|
506,959
|
(2,172,701
|
)
|
412,474
|
||||||||
|
Purchases of short-term investments, net
|
3,132,221
|
(5,357
|
)
|
1,536,393
|
||||||||
|
Proceeds from sales of
|
||||||||||||
|
long-term investments
|
381,251,412
|
281,474,466
|
56,484,547
|
|||||||||
|
Return of capital distributions received
|
||||||||||||
|
from underlying investments
|
233,280
|
102,745
|
(110,600
|
)
|
||||||||
|
Decrease in payable for distribution fees(1)
|
(9,976
|
)
|
—
|
—
|
||||||||
|
(Increase)/Decrease in dividends
|
||||||||||||
|
and interest receivable
|
2,227
|
72,375
|
(5,083
|
)
|
||||||||
|
Increase in deposits at broker for short sales
|
(8,165,646
|
)
|
(837,968
|
)
|
(5,698,286
|
)
|
||||||
|
(Increase)/Decrease in receivable
|
||||||||||||
|
for investment securities sold
|
2,344,776
|
(706,972
|
)
|
(10,356,047
|
)
|
|||||||
|
(Increase)/Decrease in receivable
|
||||||||||||
|
for securities lending
|
1,482
|
(8,841
|
)
|
194
|
||||||||
|
Increase in receivable from broker
|
—
|
—
|
(981
|
)
|
||||||||
|
(Increase)/Decrease in prepaid expenses
|
||||||||||||
|
and other assets
|
4,560
|
(6,816
|
)
|
(3,161
|
)
|
|||||||
|
Proceeds from securities sold short
|
171,821,599
|
107,777,763
|
67,993,862
|
|||||||||
|
Purchases to cover securities sold short
|
(165,666,990
|
)
|
(111,928,665
|
)
|
(65,097,226
|
)
|
||||||
|
Increase/(Decrease) in payable
|
||||||||||||
|
for investment securities purchased
|
(2,482,194
|
)
|
—
|
9,755,205
|
||||||||
|
Increase/(Decrease) in payable for collateral
|
||||||||||||
|
on securities loaned
|
(506,959
|
)
|
2,172,701
|
(412,474
|
)
|
|||||||
|
Increase/(Decrease) in dividends payable
|
||||||||||||
|
on short positions
|
31,953
|
(1,501
|
)
|
14,109
|
||||||||
|
Increase/(Decrease) in payable to broker
|
1,026
|
323
|
(2,142
|
)
|
||||||||
|
Increase/(Decrease) in payable to Adviser
|
2,316
|
(5,310
|
)
|
1,681
|
||||||||
|
Decrease in accrued expenses and other
|
||||||||||||
|
liabilities and expenses payable
|
(23,656
|
)
|
(3,108
|
)
|
(4,151
|
)
|
||||||
|
Unrealized depreciation/(appreciation)
|
||||||||||||
|
on investments
|
(2,548,707
|
)
|
2,023,861
|
(907,635
|
)
|
|||||||
|
Unrealized depreciation/(appreciation)
|
||||||||||||
|
on short transactions
|
1,960,431
|
110,460
|
(595,967
|
)
|
||||||||
|
Net realized gain on investments
|
(26,250,576
|
)
|
(17,615,411
|
)
|
(3,044,937
|
)
|
||||||
|
Net realized loss on short transactions
|
5,198,534
|
4,479,068
|
3,506,777
|
|||||||||
|
Net cash provided/(used)
|
||||||||||||
|
in operating activities
|
23,619,958
|
19,683,625
|
(4,810,293
|
)
|
||||||||
The accompanying notes are an integral part of these financial statements.
66
CONVERGENCE FUNDS
|
Statements of Cash Flows (Continued)
|
For the Year Ended November 30, 2017
|
Core Plus
|
Opportunities
|
Market
|
||||||||||
|
Fund
|
Fund
|
Neutral Fund
|
||||||||||
|
CASH FLOWS FROM FINANCING ACTIVITIES:
|
||||||||||||
|
Proceeds from shares sold
|
$
|
14,489,166
|
$
|
7,425,663
|
$
|
7,506,103
|
||||||
|
Proceeds from exchange of Investment Class
|
3,788,824
|
—
|
—
|
|||||||||
|
Payment on shares redeemed
|
(36,725,994
|
)
|
(27,109,288
|
)
|
(2,695,810
|
)
|
||||||
|
Payment for exchange to Institutional Class
|
(3,788,824
|
)
|
—
|
—
|
||||||||
|
Cash distributions paid to shareholders
|
(1,383,130
|
)
|
—
|
—
|
||||||||
|
Net cash provided/(used) by
|
||||||||||||
|
financing activities
|
(23,619,958
|
)
|
(19,683,625
|
)
|
4,810,293
|
|||||||
|
Net change in cash
|
$
|
—
|
$
|
—
|
$
|
—
|
||||||
|
CASH:
|
||||||||||||
|
Beginning Balance
|
—
|
—
|
—
|
|||||||||
|
Ending Balance
|
$
|
—
|
$
|
—
|
$
|
—
|
||||||
|
SUPPLEMENTAL DISCLOSURES:
|
||||||||||||
|
Cash paid for interest
|
528,386
|
400,409
|
2,142
|
|||||||||
|
Non-cash financing activities –
|
||||||||||||
|
distributions reinvested
|
4,192,426
|
—
|
—
|
|||||||||
|
Non-cash financing activities –
|
||||||||||||
|
decrease in receivable for
|
||||||||||||
|
Fund shares sold
|
(26,657
|
)
|
(16,126
|
)
|
—
|
|||||||
|
Non-cash financing activities –
|
||||||||||||
|
decrease in payable for
|
||||||||||||
|
Fund shares redeemed
|
257,663
|
48,085
|
18,444
|
|||||||||
|
(1)
|
The Investment Class shares converted to Institutional Class shares on March 27, 2017. See Note 1 to the Financial Statements.
|
The accompanying notes are an integral part of these financial statements.
67
CONVERGENCE CORE PLUS FUND
|
Financial Highlights – Institutional Class
|
Net Asset Value, Beginning of Year
Income from investment operations:
Net investment income(1)
Net realized and unrealized gain on investments
Total from investment operations
Less distributions paid:
From net investment income
From net realized gains
Total distributions paid
Net Asset Value, End of Year
Total Return(2)
Supplemental Data and Ratios:
Net assets at end of year (000’s)
Ratio of expenses to average net assets:
Before waiver, expense reimbursement and recoupments(3)
After waiver, expense reimbursement and recoupments(3)
Ratio of net investment income to average net assets:
Before waiver, expense reimbursement and recoupments
After waiver, expense reimbursement and recoupments
Portfolio turnover rate
|
(1)
|
Per share net investment income was calculated using the daily average shares outstanding method.
|
|
(2)
|
Total return in the table represents the rate that the investor would have earned or lost on an investment in the Fund, assuming reinvestment of dividends.
|
|
(3)
|
The ratio of expenses to average net assets includes dividends on short positions, interest and broker expenses. The annualized before waiver, expense reimbursement and recoupments and after waiver, expense reimbursement and recoupments ratios excluding dividends on short positions, interest and broker expenses were 1.28% and 1.28%, 1.31% and 1.31%, 1.26% and 1.26%, 1.24% and 1.24% and 1.28% and 1.31% for the years ended November 30, 2017, November 30, 2016, November 30, 2015, November 30, 2014, and November 30, 2013, respectively.
|
|
(4)
|
Securities redeemed-in-kind were excluded from the computation of the ratio.
|
The accompanying notes are an integral part of these financial statements.
68
Per Share Data for a Share Outstanding Throughout Each Year
|
Year Ended November 30,
|
||||||||||||||||||
|
2017
|
2016
|
2015
|
2014
|
2013
|
||||||||||||||
|
$
|
18.47
|
$
|
18.63
|
$
|
18.11
|
$
|
17.65
|
$
|
13.97
|
|||||||||
|
0.04
|
0.11
|
0.04
|
0.02
|
0.11
|
||||||||||||||
|
3.32
|
0.93
|
0.53
|
2.02
|
4.18
|
||||||||||||||
|
3.36
|
1.04
|
0.57
|
2.04
|
4.29
|
||||||||||||||
|
(0.18
|
)
|
(0.07
|
)
|
(0.05
|
)
|
(0.09
|
)
|
(0.07
|
)
|
|||||||||
|
(0.62
|
)
|
(1.13
|
)
|
—
|
(1.49
|
)
|
(0.54
|
)
|
||||||||||
|
(0.80
|
)
|
(1.20
|
)
|
(0.05
|
)
|
(1.58
|
)
|
(0.61
|
)
|
|||||||||
|
$
|
21.03
|
$
|
18.47
|
$
|
18.63
|
$
|
18.11
|
$
|
17.65
|
|||||||||
|
18.81
|
%
|
6.04
|
%
|
3.15
|
%
|
12.18
|
%
|
31.90
|
%
|
|||||||||
|
$
|
128,565
|
$
|
125,815
|
$
|
225,867
|
$
|
316,621
|
$
|
276,054
|
|||||||||
|
2.11
|
%
|
2.21
|
%
|
2.24
|
%
|
2.24
|
%
|
2.21
|
%
|
|||||||||
|
2.11
|
%
|
2.21
|
%
|
2.24
|
%
|
2.24
|
%
|
2.23
|
%
|
|||||||||
|
0.20
|
%
|
0.65
|
%
|
0.24
|
%
|
0.15
|
%
|
0.70
|
%
|
|||||||||
|
0.20
|
%
|
0.65
|
%
|
0.24
|
%
|
0.15
|
%
|
0.68
|
%
|
|||||||||
|
214.61
|
%
|
260.81
|
%
|
251.00
|
%
|
267.84
|
%
|
247.67
|
%(4)
|
|||||||||
The accompanying notes are an integral part of these financial statements.
69
CONVERGENCE OPPORTUNITIES FUND
|
Financial Highlights – Institutional Class
|
Net Asset Value, Beginning of Period
Income (loss) from investment operations:
Net investment income (loss)(2)
Net realized and unrealized gain on investments
Total from investment operations
Less distributions paid:
From net investment income
From net realized gains
Total distributions paid
Net Asset Value, End of Period
Total Return(4)(5)
Supplemental Data and Ratios:
Net assets at end of period (000’s)
Ratio of expenses to average net assets:
Before waiver and expense reimbursement(6)(7)
After waiver and expense reimbursement(6)(7)
Ratio of net investment income (loss) to average net assets:
Before waiver and expense reimbursement(7)
After waiver and expense reimbursement(7)
Portfolio turnover rate(5)
|
(1)
|
The Fund commenced operations on November 29, 2013.
|
|
(2)
|
Per share net investment income was calculated using average shares outstanding.
|
|
(3)
|
Amount is less than 0.5 cent per share.
|
|
(4)
|
Total return in the table represents the rate that the investor would have earned or lost on an investment in the Fund, assuming reinvestment of dividends.
|
|
(5)
|
Not annualized for periods less than a full year.
|
|
(6)
|
The ratio of expenses to average net assets includes dividends on short positions, interest and broker expenses. The annualized before waiver and expense reimbursement and after waiver and expense reimbursement ratios excluding dividends on short positions, interest and broker expenses were 1.34% and 1.34%, 1.36% and 1.36%, 1.34% and 1.34%, and 1.50% and 1.50% for the years ended November 30, 2017, November 30, 2016, November 30, 2015 and November 30, 2014, respectively.
|
|
(7)
|
Annualized for periods less than one year.
|
The accompanying notes are an integral part of these financial statements.
70
Per Share Data for a Share Outstanding Throughout Each Period
|
Year Ended November 30,
|
||||||||||||||
|
2017
|
2016
|
2015
|
2014(1)
|
|||||||||||
|
$
|
11.82
|
$
|
11.04
|
$
|
10.63
|
$
|
10.00
|
|||||||
|
(0.08
|
)
|
0.01
|
(0.11
|
)
|
(0.10
|
)
|
||||||||
|
2.00
|
0.87
|
0.52
|
0.73
|
|||||||||||
|
1.92
|
0.88
|
0.41
|
0.63
|
|||||||||||
|
—
|
—
|
—
|
(0.00
|
)(3)
|
||||||||||
|
—
|
(0.10
|
)
|
—
|
0.00
|
||||||||||
|
—
|
(0.10
|
)
|
—
|
—
|
||||||||||
|
$
|
13.74
|
$
|
11.82
|
$
|
11.04
|
$
|
10.63
|
|||||||
|
16.24
|
%
|
8.11
|
%
|
3.76
|
%
|
6.34
|
%
|
|||||||
|
$
|
68,888
|
$
|
77,990
|
$
|
85,536
|
$
|
69,026
|
|||||||
|
2.35
|
%
|
2.57
|
%
|
2.63
|
%
|
2.69
|
%
|
|||||||
|
2.35
|
%
|
2.57
|
%
|
2.63
|
%
|
2.69
|
%
|
|||||||
|
(0.63
|
)%
|
0.12
|
%
|
(0.99
|
)%
|
(1.02
|
)%
|
|||||||
|
(0.63
|
)%
|
0.12
|
%
|
(0.99
|
)%
|
(1.02
|
)%
|
|||||||
|
262.18
|
%
|
316.15
|
%
|
319.97
|
%
|
281.92
|
%
|
|||||||
The accompanying notes are an integral part of these financial statements.
71
CONVERGENCE MARKET NEUTRAL FUND
|
Financial Highlights – Institutional Class
|
Per Share Data for a Share Outstanding Throughout Each Period
|
Year Ended
|
Period Ended
|
|||||||
|
November 30,
|
November 30,
|
|||||||
|
2017
|
2016(1)
|
|||||||
|
Net Asset Value, Beginning of Period
|
$
|
10.30
|
$
|
10.00
|
||||
|
Income from investment operations:
|
||||||||
|
Net investment loss(2)
|
(0.06
|
)
|
(0.07
|
)
|
||||
|
Net realized and unrealized gain on investments
|
0.50
|
0.37
|
||||||
|
Total from investment operations
|
0.44
|
0.30
|
||||||
|
Net Asset Value, End of Period
|
$
|
10.74
|
$
|
10.30
|
||||
|
Total Return(3)(4)
|
4.37
|
%
|
3.00
|
%
|
||||
|
Supplemental Data and Ratios:
|
||||||||
|
Net assets at end of period (000’s)
|
$
|
22,624
|
$
|
16,872
|
||||
|
Ratio of expenses to average net assets:
|
||||||||
|
Before waiver and expense reimbursement(5)(6)
|
2.88
|
%
|
4.27
|
%
|
||||
|
After waiver and expense reimbursement(5)(6)
|
2.47
|
%
|
3.26
|
%
|
||||
|
Ratio of net investment loss to average net assets:
|
||||||||
|
Before waiver and expense reimbursement(6)
|
(0.96
|
)%
|
(1.92
|
)%
|
||||
|
After waiver and expense reimbursement(6)
|
(0.55
|
)%
|
(0.91
|
)%
|
||||
|
Portfolio turnover rate(4)
|
262.19
|
%
|
218.04
|
%
|
||||
|
(1)
|
The Fund commenced operations on January 29, 2016.
|
|
(2
|
)Per share net investment income was calculated using average shares outstanding.
|
|
(3)
|
Total return in the table represents the rate that the investor would have earned or lost on an investment in the Fund, assuming reinvestment of dividends.
|
|
(4)
|
Not annualized for periods less than a full year.
|
|
(5)
|
The ratio of expenses to average net assets includes dividends on short positions, interest and broker expenses. The annualized before waiver and expense reimbursement and after waiver and expense reimbursement ratios excluding dividends on short positions, interest and broker expenses were 1.91% and 1.50%, and 2.51% and 1.50% for the periods ended November 30, 2017 and November 30, 2016, respectively.
|
|
(6)
|
Annualized for periods less than one year.
|
The accompanying notes are an integral part of these financial statements.
72
CONVERGENCE FUNDS
Notes to Financial Statements
November 30, 2017
|
(1)
|
Organization
|
|
Trust for Professional Managers (the “Trust”) was organized as a Delaware statutory trust under a Declaration of Trust dated May 29, 2001. The Trust is registered under the Investment Company Act of 1940, as amended (the “1940 Act”), as an open-end management investment company. The Convergence Core Plus Fund, Convergence Opportunities Fund and Convergence Market Neutral Fund (each, a “Fund” and together the “Funds”) represent distinct diversified series with their own investment objectives and policies within the Trust. The investment objective of the Convergence Core Plus Fund and Convergence Opportunities Fund is long-term capital growth. The investment objective of the Convergence Market Neutral Fund is positive absolute returns. The Trust may issue an unlimited number of shares of beneficial interest at $0.001 par value. The assets of the Funds are segregated, and a shareholder’s interest is limited to the Fund in which shares are held. The Convergence Core Plus Fund became effective on December 29, 2009 and commenced operations on December 29, 2009 and January 31, 2013 for the Institutional Class and Investment Class shares, respectively. Effective February 27, 2017 the Convergence Core Plus Fund ceased offering its Investment Class shares. The remaining Investment Class shares converted to Institutional Class shares on March 27, 2017. The Convergence Opportunities Fund became effective November 29, 2013 and commenced operations on November 29, 2013 for the Institutional Class shares. As of the date of this report, the Investment Class shares of the Convergence Opportunities Fund have not commenced operations. The Convergence Market Neutral Fund became effective January 29, 2016 and commenced operations on January 29, 2016 for the Institutional Class shares. Each class of shares has identical rights and privileges except with respect to the distribution fees, and voting rights on matters affecting a single class of shares. Costs incurred by the Funds in connection with the organization, registration and the initial public offering of shares were paid by Convergence Investment Partners, LLC (the “Adviser”), the Funds’ investment adviser.
|
|
|
The Funds are investment companies and accordingly follow the investment company accounting and reporting guidance of the Financial Accounting Standards Board (“FASB”) Accounting Standard Codification Topic 946 “Financial Services–Investment Companies.”
|
|
|
(2)
|
Significant Accounting Policies
|
|
The following is a summary of significant accounting policies consistently followed by the Funds in the preparation of the financial statements. These policies are in conformity with generally accepted accounting principles in the United States of America (“GAAP”).
|
|
|
(a) Investment Valuation
|
|
|
Each security owned by the Funds, including long and short positions of common stock and real estate investment trusts, that is listed on a securities exchange is valued at its last sale price on that exchange on the date as of which assets are valued. When the security is listed on more than one exchange, the Funds will use the price of the exchange that the Funds generally consider to be the principal exchange on which the stock is traded.
|
73
CONVERGENCE FUNDS
Notes to Financial Statements (Continued)
November 30, 2017
|
Fund securities listed on the NASDAQ Stock Market, Inc. (“NASDAQ”) will be valued at the NASDAQ Official Closing Price (“NOCP”), which may not necessarily represent the last sale price. If there has been no sale on such exchange or on NASDAQ on such day, the security shall be valued at, (i) the mean between the most recent quoted bid and asked prices on such day or (ii) the last sales price on the Composite Market. “Composite Market” means a consolidation of the trade information provided by national securities and foreign exchanges and over-the-counter markets, as published by a pricing service (“Pricing Service”).
|
|
|
Debt securities, including short-term debt instruments having a maturity of 60 days or less, are valued at the mean in accordance with prices supplied by a Pricing Service. Pricing Services may use various valuation methodologies such as the mean between the bid and the asked prices, matrix pricing and other analytical pricing models as well as market transactions and dealer quotations. If a price is not available from a Pricing Service, the most recent quotation obtained from one or more broker-dealers known to follow the issue will be obtained. Quotations will be valued at the mean between the bid and the offer. Any discount or premium is accreted or amortized using the constant yield 2 method until maturity. In the absence of available quotations, the securities will be priced at fair value.
|
|
|
Redeemable securities issued by open-end, registered investment companies, including money market funds, are valued at the net asset value (“NAV”) of such companies for purchase and/or redemption orders placed on that day.
|
|
|
When market quotations are not readily available, any security or other asset is valued at its fair value as determined under procedures approved by the Trust’s Board of Trustees. These fair value procedures will also be used to price a security when corporate events, events in the securities market or world events cause the Adviser to believe that a security’s last sale price may not reflect its actual fair market value. The intended effect of using fair value pricing procedures is to ensure that the Funds are accurately priced.
|
|
|
FASB Accounting Standards Codification, “Fair Value Measurements and Disclosures” Topic 820 (“ASC 820”), establishes an authoritative definition of fair value and sets out a hierarchy for measuring fair value. ASC 820 requires an entity to evaluate certain factors to determine whether there has been a significant decrease in volume and level of activity for the security such that recent transactions and quoted prices may not be determinative of fair value and further analysis and adjustment may be necessary to estimate fair value. ASC 820 also requires enhanced disclosures regarding the inputs and valuation techniques used to measure fair value in those instances as well as expanded disclosure of valuation levels for each class of investments. These inputs are summarized in the three broad levels listed below:
|
|
Level 1—
|
Quoted prices in active markets for identical securities.
|
||
|
Level 2—
|
Other significant observable inputs (including quoted prices for similar securities, interest rates, prepayment speeds, credit risk, etc.).
|
||
|
Level 3—
|
Significant unobservable inputs (including a Fund’s own assumptions in determining the fair value of investments).
|
74
CONVERGENCE FUNDS
Notes to Financial Statements (Continued)
November 30, 2017
|
The inputs or methodology used for valuing securities are not necessarily an indication of the risk associated with investing in those securities. The following is a summary of the inputs used to value the Funds’ investments carried at fair value as of November 30, 2017:
|
|
Core Plus Fund
|
|||||||||||||||||
|
Level 1
|
Level 2
|
Level 3
|
Total
|
||||||||||||||
|
Assets(1):
|
|||||||||||||||||
|
Common Stocks
|
$
|
168,743,574
|
$
|
—
|
$
|
—
|
$
|
168,743,574
|
|||||||||
|
Real Estate
|
|||||||||||||||||
|
Investment Trusts
|
6,537,224
|
—
|
—
|
6,537,224
|
|||||||||||||
|
Investments Purchased
|
|||||||||||||||||
|
with Proceeds from
|
|||||||||||||||||
|
Securities Lending
|
2,438,410
|
—
|
—
|
2,438,410
|
|||||||||||||
|
Short-Term Investments
|
113,003
|
—
|
—
|
113,003
|
|||||||||||||
|
Total Assets
|
$
|
177,832,211
|
$
|
—
|
$
|
—
|
$
|
177,832,211
|
|||||||||
|
Liabilities:
|
|||||||||||||||||
|
Securities Sold Short
|
|||||||||||||||||
|
Common Stocks
|
$
|
(52,372,357
|
)
|
$
|
—
|
$
|
—
|
$
|
(52,372,357
|
)
|
|||||||
|
Real Estate
|
|||||||||||||||||
|
Investment Trusts
|
(2,654,418
|
)
|
—
|
—
|
(2,654,418
|
)
|
|||||||||||
|
Total Securities
|
|||||||||||||||||
|
Sold Short
|
$
|
(55,026,775
|
)
|
$
|
—
|
$
|
—
|
$
|
(55,026,775
|
)
|
|||||||
|
Total Liabilities
|
$
|
(55,026,775
|
)
|
$
|
—
|
$
|
—
|
$
|
(55,026,775
|
)
|
|||||||
|
Opportunities Fund
|
|||||||||||||||||
|
Level 1
|
Level 2
|
Level 3
|
Total
|
||||||||||||||
|
Assets(1):
|
|||||||||||||||||
|
Common Stocks
|
$
|
88,676,297
|
$
|
—
|
$
|
—
|
$
|
88,676,297
|
|||||||||
|
Real Estate
|
|||||||||||||||||
|
Investment Trusts
|
7,058,273
|
—
|
—
|
7,058,273
|
|||||||||||||
|
Investments Purchased
|
|||||||||||||||||
|
with Proceeds from
|
|||||||||||||||||
|
Securities Lending
|
2,703,559
|
—
|
—
|
2,703,559
|
|||||||||||||
|
Short-Term Investments
|
79,887
|
—
|
—
|
79,887
|
|||||||||||||
|
Total Assets
|
$
|
98,518,016
|
$
|
—
|
$
|
—
|
$
|
98,518,016
|
|||||||||
|
Liabilities:
|
|||||||||||||||||
|
Securities Sold Short
|
|||||||||||||||||
|
Common Stocks
|
$
|
(27,130,943
|
)
|
$
|
—
|
$
|
—
|
$
|
(27,130,943
|
)
|
|||||||
|
Real Estate
|
|||||||||||||||||
|
Investment Trusts
|
(2,035,438
|
)
|
—
|
—
|
(2,035,438
|
)
|
|||||||||||
|
Total Securities
|
|||||||||||||||||
|
Sold Short
|
$
|
(29,166,381
|
)
|
$
|
—
|
$
|
—
|
$
|
(29,166,381
|
)
|
|||||||
|
Total Liabilities
|
$
|
(29,166,381
|
)
|
$
|
—
|
$
|
—
|
$
|
(29,166,381
|
)
|
|||||||
75
CONVERGENCE FUNDS
Notes to Financial Statements (Continued)
November 30, 2017
|
Market Neutral Fund
|
|||||||||||||||||
|
Level 1
|
Level 2
|
Level 3
|
Total
|
||||||||||||||
|
Assets(1):
|
|||||||||||||||||
|
Common Stocks
|
$
|
23,042,181
|
$
|
—
|
$
|
—
|
$
|
23,042,181
|
|||||||||
|
Real Estate
|
|||||||||||||||||
|
Investment Trusts
|
1,485,507
|
—
|
—
|
1,485,507
|
|||||||||||||
|
Short-Term Investments
|
294,823
|
—
|
—
|
294,823
|
|||||||||||||
|
Total Assets
|
$
|
24,822,511
|
$
|
—
|
$
|
—
|
$
|
24,822,511
|
|||||||||
|
Liabilities:
|
|||||||||||||||||
|
Securities Sold Short
|
|||||||||||||||||
|
Common Stocks
|
$
|
(17,582,691
|
)
|
$
|
—
|
$
|
—
|
$
|
(17,582,691
|
)
|
|||||||
|
Real Estate
|
|||||||||||||||||
|
Investment Trusts
|
(1,629,189
|
)
|
—
|
—
|
(1,629,189
|
)
|
|||||||||||
|
Total Securities
|
|||||||||||||||||
|
Sold Short
|
$
|
(19,211,880
|
)
|
$
|
—
|
$
|
—
|
$
|
(19,211,880
|
)
|
|||||||
|
Total Liabilities
|
$
|
(19,211,880
|
)
|
$
|
—
|
$
|
—
|
$
|
(19,211,880
|
)
|
|||||||
|
(1)
|
See the Schedule of Investments for industry classifications.
|
|
|
The Funds did not hold any investments during the year ended November 30, 2017 with significant unobservable inputs which would be classified as Level 3. During the year ended November 30, 2017, there were no transfers between levels for the Funds. It is the Funds’ policy to record transfers between levels as of the end of the reporting period. The Funds did not hold financial derivative instruments during the reporting period.
|
|
|
|
|
|
(b) Short Positions
|
| The Funds may sell a security they do not own in anticipation of a decline in the fair value of that security. When a fund sells a security short, it must borrow the security sold short and deliver it to the broker-dealer through which it made the short sale. A gain, limited to the price at which a fund sold the security short, or a loss, unlimited in size, will be recognized upon the termination of a short sale. For financial statement purposes, an amount equal to the settlement amount is included in the Statements of Assets and Liabilities as a liability. The amount of the liability is subsequently marked-to-market to reflect the current value of the short positions. Subsequent fluctuations in the market prices of the securities sold, but not yet purchased, may require purchasing the securities at prices which could differ from the amount reflected in the Statements of Assets and Liabilities. The Funds are liable for any dividends or interest payable on securities while those securities are in a short position. Such amounts are recorded on the ex-dividend date as a dividend expense, and interest expense is accrued daily. As collateral for its short positions, the Funds are required under the 1940 Act to maintain segregated assets consisting of cash, cash equivalents or liquid securities. The segregated assets are valued consistent with Note 2a above. The amount of segregated assets are required to be adjusted daily to the extent additional collateral is required based on the change in fair value of |
76
CONVERGENCE FUNDS
Notes to Financial Statements (Continued)
November 30, 2017
|
the securities sold short. The Funds’ securities sold short and deposits for short sales are held with one major securities broker-dealer. The Funds do not require this broker-dealer to maintain collateral in support of the receivable for proceeds on securities sold short.
|
|
|
(c) Security Loans
|
|
|
When the Funds loan securities held in their portfolios, the Funds receive compensation in the form of fees, or retain a portion of the interest on the investment of any cash received as collateral. The Funds also continue to receive dividends on the securities loaned. The loans are secured by collateral at least equal to: (i) 105% of the market value of the loaned securities that are foreign securities, or 102% of the market value of any other loaned securities, at the time the securities are loaned; and (ii) 100% of the market value of the loaned securities at all times. Gain or loss in the value of securities loaned that may occur during the term of the loan will be for the account of the Funds. The Funds have the right under the lending agreement to recover the securities from the borrower on demand.
|
|
|
(d) Federal Income Taxes
|
|
|
The Funds comply with the requirements of Subchapter M of the Internal Revenue Code, as amended, necessary to qualify as a regulated investment company and make the requisite distributions of income and capital gains to their shareholders sufficient to relieve them from all or substantially all federal income taxes. Therefore, no federal income tax provision has been provided.
|
|
|
As of and during the year ended November 30, 2017, the Funds did not have a liability for any unrecognized tax benefits. The Funds recognize interest and penalties, if any, related to unrecognized tax benefits as income tax expense in the Statements of Operations. During the year ended November 30, 2017, the Funds did not incur any interest or penalties.
|
|
|
(e) Distributions to Shareholders
|
|
|
The Funds will distribute any net investment income and any net capital gains at least annually. Distributions from net realized gains for book purposes may include short-term capital gains. All short-term capital gains are included in ordinary income for tax purposes. Distributions to shareholders are recorded on the ex-dividend date. The Funds may also pay a special distribution at the end of the calendar year to comply with federal tax requirements.
|
|
|
(f) Use of Estimates
|
|
|
The preparation of financial statements in conformity with GAAP requires management to make estimates and assumptions that affect the reported amounts of assets and liabilities and disclosure of contingent assets and liabilities at the date of the financial statements and the reported amounts of revenues and expenses during the reporting period. Actual results could differ from those estimates.
|
77
CONVERGENCE FUNDS
Notes to Financial Statements (Continued)
November 30, 2017
|
(g) Share Valuation
|
|
|
The NAV per share of each Fund is calculated by dividing the sum of the fair value of the securities held by the Fund, plus cash or other assets, minus all liabilities (including estimated accrued expenses) by the total number of shares outstanding for the Fund, rounded to the nearest cent. The Funds’ shares will not be priced on the days on which the New York Stock Exchange is closed for trading. The Funds do not charge a redemption fee, and therefore the offering and redemption price per share are equal to a Fund’s net asset value per share.
|
|
|
(h) Allocation of Income, Expenses and Gains/Losses
|
|
|
Income, expenses (other than those deemed attributable to a specific share class), and gains and losses of the Funds are allocated daily to each class of shares based upon the ratio of net assets represented by each class as a percentage of the net assets of the applicable Fund. Expenses deemed directly attributable to a class of shares are recorded by the specific class. Most expenses are allocated by class based on relative net assets. Distribution and service (12b-1) fees are expensed at 0.25% of average daily net assets of the Investment Class shares of the Convergence Core Plus Fund and the Convergence Opportunities Fund. Expenses associated with a specific fund in the Trust are charged to that fund. Common Trust expenses are typically allocated evenly between the funds of the Trust, or by other equitable means.
|
|
|
(i) Other
|
|
|
Investment transactions are recorded on the trade date. The Funds determine the gain or loss from investment transactions on the identified cost basis by comparing original cost of the security lot sold with the net sale proceeds. Dividend income and expense is recognized on the ex-dividend date and interest income and expense is recognized on an accrual basis. Dividend income from real estate investment trusts (REITs) is recognized on the ex-date and included in dividend income. The calendar year-end classification of distributions received from REITs during the fiscal year are reported subsequent to year end; accordingly, the Funds estimate the character of REIT distributions based on the most recent information available and adjust for actual classifications in the calendar year the information is reported.
|
|
(3)
|
Federal Tax Matters
|
|
The tax character of distributions paid during the fiscal years ended November 30, 2017 and November 30, 2016 was as follows:
|
|
|
Convergence Core Plus Fund
|
|
|
November 30, 2017
|
November 30, 2016
|
|||||||
|
Ordinary Income
|
$ |
5,240,678
|
$
|
838,226
|
|||||
|
Long-Term Capital Gain
|
$
|
334,878
|
$
|
14,118,911
|
|||||
|
|
|||||||||
|
Convergence Opportunities Fund
|
|||||||||
|
|
November 30, 2017
|
November 30, 2016
|
|||||||
|
Long-Term Capital Gain
|
$
|
—
|
$
|
785,835
|
|||||
78
CONVERGENCE FUNDS
Notes to Financial Statements (Continued)
November 30, 2017
|
The Convergence Core Plus Fund and Convergence Opportunities Fund designated as short-term and long-term capital gain dividend, pursuant to Internal Revenue Code Section 852(b)(3), the amount necessary to reduce the earnings and profits of the Fund related to net capital gain to zero for the tax year ended November 30, 2017. The Convergence Core Plus Fund and Convergence Opportunities Fund utilized earnings and profits distributed to shareholders on redemption of shares as part of the dividend paid deduction. The amounts designated as gain for the fiscal years ended November 30, 2017 and 2016 were as follows:
|
|
|
Convergence Core Plus Fund
|
|
November 30, 2017
|
November 30, 2016
|
||
|
Long-term
|
$4,521,695
|
$8,494,488
|
| Convergence Opportunities Fund | |||
|
November 30, 2017
|
November 30, 2016
|
||
|
Long-term
|
$2,808,716
|
$—
|
|
As of November 30, 2017, the components of accumulated earnings on a tax basis were as follows:
|
|
Convergence
|
Convergence
|
Convergence
|
||||||||||||
|
Core Plus
|
Opportunities
|
Market
|
||||||||||||
|
Fund
|
Fund
|
Neutral Fund
|
||||||||||||
|
Cost basis of investments for
|
||||||||||||||
|
federal income tax purposes(1)
|
$
|
145,460,209
|
$
|
83,858,231
|
$
|
21,731,787
|
||||||||
|
Gross tax unrealized appreciation
|
$
|
36,330,254
|
$
|
16,849,712
|
$
|
4,045,372
|
||||||||
|
Gross tax unrealized depreciation
|
(4,130,754
|
)
|
(2,794,583
|
)
|
(1,315,071
|
)
|
||||||||
|
Net tax unrealized appreciation
|
32,199,500
|
14,055,129
|
2,730,301
|
|||||||||||
|
Undistributed ordinary income
|
8,735,788
|
6,149,021
|
—
|
|||||||||||
|
Undistributed long-term capital gain
|
7,618,545
|
1,670,938
|
—
|
|||||||||||
|
Total distributable earnings
|
16,354,333
|
7,819,959
|
—
|
|||||||||||
|
Other accumulated gains/losses
|
(1,826
|
)
|
(4,390
|
)
|
(970,892
|
)
|
||||||||
|
Total accumulated gains
|
$
|
48,552,007
|
$
|
21,870,698
|
$
|
1,759,409
|
||||||||
|
(1) Excludes securities sold short.
|
|
|
The tax basis of distributable earnings for tax and financial reporting purposes differs principally due to the deferral of losses on wash sales, transfers in-kind, and straddle adjustments for the Funds.
|
|
|
At November 30, 2017, the Convergence Market Neutral Fund had the following capital losses remaining, which will be carried forward indefinitely to offset future realized capital gains. To the extent the Convergence Market Neutral Fund realizes future net capital gains, taxable distributions to its shareholders will be first offset by any unused capital loss carryovers from the year ended November 30, 2017.
|
|
Short-Term
|
|||
|
Convergence Market Neutral Fund
|
$970,892
|
79
CONVERGENCE FUNDS
Notes to Financial Statements (Continued)
November 30, 2017
|
During the year ended November 30, 2017, the Convergence Opportunities Fund utilized short-term capital loss carryovers of $1,567,262.
|
|
|
Income and capital gains distributions may differ from GAAP, primarily due to timing differences in the recognition of income, gains and losses and equalization by the Funds. To the extent that these differences are attributable to permanent book and tax accounting differences, the components of net assets have been adjusted.
|
|
|
On the Statements of Assets and Liabilities, the following adjustments were made for permanent tax adjustments:
|
|
Convergence
|
Convergence
|
Convergence
|
|||||||||||
|
Core Plus
|
Opportunities
|
Market
|
|||||||||||
|
Fund
|
Fund
|
Neutral Fund
|
|||||||||||
|
Accumulated Undistributed Net
|
|||||||||||||
|
Investment Income/(Loss)
|
$
|
86,066
|
$
|
452,015
|
$
|
117,948
|
|||||||
|
Accumulated Undistributed Net
|
|||||||||||||
|
Realized Gain/(Loss)
|
$
|
(4,608,757
|
)
|
$
|
(3,257,176
|
)
|
$
|
(21,306
|
)
|
||||
|
Paid-In Capital
|
$
|
4,522,691
|
$
|
2,805,161
|
$
|
(96,642
|
)
|
||||||
|
Such adjustments were attributed to the reclassification of net investment loss, distribution adjustments and the usage of equalization for tax purposes.
|
|
(4)
|
Investment Adviser
|
|
The Trust has an Investment Advisory Agreement (the “Agreement”) with the Adviser to furnish investment advisory services to the Funds. Under the terms of the Agreement, each Fund compensates the Adviser for its management services at the annual rate of 1.00% of the Fund’s average daily net assets.
|
|
|
The Adviser has contractually agreed to waive its management fee and/or reimburse each Fund’s other expenses at least through the expiration dates listed below, at the discretion of the Adviser and the Board of Trustees, to the extent necessary to ensure that the Fund’s operating expenses (excluding any taxes, leverage, interest, brokerage commissions, expenses incurred in connection with any merger or reorganization, dividends on short positions and interest and broker expenses, acquired fund fees and expenses or extraordinary expenses) do not exceed the expense limitation caps listed below of each Fund’s average daily net assets.
|
|
Expiration Date
|
Expense Limitation Cap
|
||
|
Convergence Core Plus Fund
|
|||
|
Institutional Class
|
March 30, 2019
|
1.50%
|
|
|
Convergence Opportunities Fund
|
|||
|
Institutional Class
|
March 30, 2019
|
1.50%
|
|
|
Convergence Market Neutral Fund
|
|||
|
Institutional Class
|
March 30, 2019
|
1.50%
|
|
Any such waiver or reimbursement is subject to later adjustment to allow the Adviser to recoup amounts waived or reimbursed to the extent actual fees and expenses for a fiscal period do not exceed the lesser of: (1) the Expense Limitation Cap in place at
|
80
CONVERGENCE FUNDS
Notes to Financial Statements (Continued)
November 30, 2017
|
the time of the waiver or reimbursement; or (2) the Expense Limitation Cap in place at the time of the recoupment; provided, however, that the Adviser shall only be entitled to recoup such amounts over the following three year period from the date of the waiver or reimbursement. During the year ended November 30, 2017, there were no expense recoupments by the Adviser from the Funds. As of the date of this report, there were no prior waivers or reimbursements subject to recoupment from the Convergence Core Plus Fund and Convergence Opportunities Fund. The following table details the remaining waived or reimbursed expenses for the Convergence Market Neutral Fund subject to potential recovery expiring by:
|
|
November 30, 2019
|
111,707
|
||
|
November 30, 2020
|
85,383
|
|
(5)
|
Distribution Plan
|
|
The Trust adopted a plan pursuant to Rule 12b-1 (the “12b-1 Plan”), on behalf of the Convergence Core Plus Fund, which authorizes it to pay Quasar Distributors, LLC (the “Distributor”) a distribution and service (Rule 12b-1) fee of 0.25% of the Convergence Core Plus Fund’s average daily net assets of Investment Class shares for services to prospective shareholders and distribution of shares. During the period ended November 30, 2017, the Convergence Core Plus Fund accrued expenses of $3,273 pursuant to the 12b-1 Plan. As of November 30, 2017, the Distributor was owed fees of $0 pursuant to the 12b-1 Plan.
|
|
|
(6)
|
Related Party Transactions
|
|
U.S. Bancorp Fund Services, LLC (“USBFS” or the “Administrator”) acts as the Funds’ administrator under an Administration Agreement. The Administrator prepares various federal and state regulatory filings, reports and returns for the Funds; prepares reports and materials to be supplied to the Trustees; monitors the activities of the Funds’ custodian, transfer agent and accountants; coordinates the preparation and payment of the Funds’ expenses and reviews the Funds’ expense accruals. Fees incurred for the year ended November 30, 2017, and owed as of November 30, 2017 are as follows:
|
|
Incurred
|
Owed
|
||||||||
|
Convergence Core Plus Fund
|
$
|
159,384
|
$
|
26,149
|
|||||
|
Convergence Opportunities Fund
|
$
|
93,403
|
$
|
15,133
|
|||||
|
Convergence Market Neutral Fund
|
$
|
82,095
|
$
|
14,336
|
|||||
|
USBFS also serves as the fund accountant and transfer agent to the Funds. U.S. Bank, N.A. (“US Bank”), an affiliate of USBFS, serves as each Fund’s custodian. Fees incurred for the year ended November 30, 2017, and owed as of November 30, 2017 are as follows:
|
|
Fund Accounting
|
Incurred
|
Owed
|
|||||||
|
Convergence Core Plus Fund
|
$
|
15,066
|
$
|
1,619
|
|||||
|
Convergence Opportunities Fund
|
$
|
13,070
|
$
|
1,729
|
|||||
|
Convergence Market Neutral Fund
|
$
|
12,118
|
$
|
1,617
|
|||||
81
CONVERGENCE FUNDS
Notes to Financial Statements (Continued)
November 30, 2017
|
Transfer Agency
|
Incurred
|
Owed
|
|||||||
|
Convergence Core Plus Fund
|
$
|
59,154
|
$
|
9,536
|
|||||
|
Convergence Opportunities Fund
|
$
|
33,646
|
(1)
|
$
|
5,363
|
||||
|
Convergence Market Neutral Fund
|
$
|
14,112
|
$
|
8,041
|
|||||
|
(1)
|
This amount does not include sub-transfer agency fees, therefore it does not agree to the amount on the Statements of Operations.
|
|
Custody
|
Incurred
|
Owed
|
|||||||
|
Convergence Core Plus Fund
|
$
|
19,992
|
$
|
3,781
|
|||||
|
Convergence Opportunities Fund
|
$
|
20,359
|
$
|
3,203
|
|||||
|
Convergence Market Neutral Fund
|
$
|
11,709
|
$
|
2,036
|
|||||
|
Certain Funds have a line of credit with US Bank (see Note 10).
|
|
|
The Funds have entered into a securities lending agreement with US Bank (see Note 11).
|
|
|
The Distributor acts as the Funds’ principal underwriter in a continuous public offering of the Funds’ shares. The Distributor is an affiliate of USBFS and US Bank.
|
|
|
Certain officers of the Funds are also employees of USBFS. A Trustee of the Trust is affiliated with USBFS and US Bank. This same Trustee is a board member and an interested person of the Distributor.
|
|
|
The Trust’s Chief Compliance Officer is also an employee of USBFS. Each Funds’ allocation of the Trust’s Chief Compliance Officer fee incurred for the period ended November 30, 2017, and owed as of November 30, 2017 are as follows:
|
|
Incurred
|
Owed
|
||||||||
|
Convergence Core Plus Fund
|
$
|
9,967
|
$
|
1,672
|
|||||
|
Convergence Opportunities Fund
|
$
|
9,800
|
$
|
1,669
|
|||||
|
Convergence Market Neutral Fund
|
$
|
9,800
|
$
|
1,669
|
|||||
|
(7)
|
Capital Share Transactions
|
|
Transactions in shares of the Funds were as follows:
|
|
|
Convergence Core Plus – Institutional Class
|
|
Year Ended
|
Year Ended
|
||||||||
|
November 30, 2017
|
November 30, 2016
|
||||||||
|
Shares sold
|
762,420
|
1,259,411
|
|||||||
|
Shares reinvested
|
219,686
|
688,624
|
|||||||
|
Shares exchanged from Investment Class
|
207,990
|
(1)
|
—
|
||||||
|
Shares redeemed
|
(1,891,195
|
)
|
(7,260,138
|
)
|
|||||
|
Net decrease
|
(701,099
|
)
|
(5,312,103
|
)
|
|||||
82
CONVERGENCE FUNDS
Notes to Financial Statements (Continued)
November 30, 2017
|
Convergence Core Plus Fund – Investment Class
|
|||||||||
|
Year Ended
|
Year Ended
|
||||||||
|
November 30, 2017
|
November 30, 2016
|
||||||||
|
Shares sold
|
4,921
|
67,882
|
|||||||
|
Shares reinvested
|
8,425
|
35,423
|
|||||||
|
Shares exchanged to Institutional Class
|
(208,407
|
)(1)
|
—
|
||||||
|
Shares redeemed
|
(35,575
|
)
|
(402,227
|
)
|
|||||
|
Net decrease
|
(230,636
|
)
|
(298,922
|
)
|
|||||
|
(1)
|
The Investment Class shares converted to Institutional Class shares on March 27, 2017.
|
|
Convergence Opportunities Fund – Institutional Class
|
|||||||||
|
Year Ended
|
Year Ended
|
||||||||
|
November 30, 2017
|
November 30, 2016
|
||||||||
|
Shares sold
|
599,029
|
1,128,075
|
|||||||
|
Shares reinvested
|
—
|
72,501
|
|||||||
|
Shares redeemed
|
(2,184,554
|
)
|
(2,351,949
|
)
|
|||||
|
Net decrease
|
(1,585,525
|
)
|
(1,151,373
|
)
|
|||||
|
Convergence Market Neutral Fund – Institutional Class
|
|||||||||
|
Year Ended
|
Period Ended
|
||||||||
|
November 30, 2017
|
November 30, 2016
|
||||||||
|
Shares sold
|
724,872
|
1,484,384
|
|||||||
|
Shares issued from
|
|||||||||
|
transfer in-kind (See Note 8)
|
—
|
249,504
|
|||||||
|
Shares reinvested
|
—
|
—
|
|||||||
|
Shares redeemed
|
(257,316
|
)
|
(95,870
|
)
|
|||||
|
Net increase
|
467,556
|
1,638,018
|
|||||||
|
(8)
|
Investment Transactions
|
|
The aggregate purchases and sales of securities, excluding short-term investments, securities transferred in-kind disclosed below, and securities sold short, for the Funds for the year ended November 30, 2017 are summarized below. There were no purchases or sales of U.S. government securities for the Funds.
|
|
Convergence Core
|
Convergence
|
Convergence Market
|
|||||||||||||
|
Plus Fund
|
Opportunities Fund
|
Neutral Fund
|
|||||||||||||
|
Purchases
|
$
|
359,117,984
|
$
|
255,787,494
|
$
|
59,200,659
|
|||||||||
|
Sales
|
$
|
381,251,412
|
$
|
281,474,466
|
$
|
56,484,547
|
|||||||||
|
Convergence Market Neutral Fund
|
|
|
On January 29, 2016, the Convergence Market Neutral Fund accepted, in accordance with the Rule 17a-7 of the 1940 Act procedures adopted by the Trust, securities eligible for investment by the Fund as consideration for Fund shares issued at fair value of $2,495,039.
|
83
CONVERGENCE FUNDS
Notes to Financial Statements (Continued)
November 30, 2017
|
(9)
|
Beneficial Ownership
|
| The beneficial ownership, either directly or indirectly, of more than 25% of the voting securities of a fund creates a presumption of control of the fund, under Section 2(a)(9) of the 1940 Act. At November 30, 2017, National Financial Services, LLC, for the benefit of others, held 58.38% of the Convergence Core Plus Fund’s outstanding Institutional Class shares. At November 30, 2017, National Financial Services, LLC, for the benefit of others, held 87.34% of the Convergence Opportunities Fund’s outstanding Institutional Class shares. At November 30, 2017, Charles Schwab & Co., Inc. and National Financial Services, LLC, for the benefit of others, held 55.89% and 42.13%, respectively, of the Convergence Market Neutral Fund’s outstanding Institutional Class shares. | |
|
(10)
|
Line of Credit
|
| The Convergence Core Plus Fund and Convergence Opportunities Fund each have a line of credit in the amount of the lessor of $13,000,000 and $5,000,000, respectively, or 33.33% of the fair value of unencumbered assets of the Convergence Core Plus Fund and Convergence Opportunities Fund, which both mature on August 10, 2018. These unsecured lines of credit are intended to provide short-term financing, if necessary and subject to certain restrictions, in connection with shareholder redemptions. Interest was accrued at the prime rate of 3.50% from December 1, 2016 through December 14, 2016, 3.75% from December 15, 2016 through March 15, 2017, 4.00% from March 16, 2017 through June 14, 2017, and 4.25% thereafter. The credit facility is with the Funds’ custodian, US Bank. The following table provides information regarding usage of the lines of credit for the year ended November 30, 2017. There were no outstanding balances on the lines of credit as of November 30, 2017. |
|
Average
|
Maximum
|
Date of
|
||||||||||||||||
|
Days
|
Amount of
|
Interest
|
Amount of
|
Maximum
|
||||||||||||||
|
Utilized
|
Borrowing
|
Expense*
|
Borrowing
|
Borrowing
|
||||||||||||||
|
Convergence
|
||||||||||||||||||
|
Core Plus Fund
|
23
|
$
|
232,826
|
$
|
617
|
$
|
894,000
|
6/6/2017
|
||||||||||
|
Convergence
|
||||||||||||||||||
|
Opportunities Fund
|
38
|
$
|
158,526
|
$
|
677
|
$
|
462,000
|
7/31/2017
|
||||||||||
| * Interest expense is included within interest and broker expenses on the Statements of Operations. | ||||||||||||||||||
|
The Convergence Market Neutral Fund does not have a line of credit.
|
|
|
(11)
|
Securities Lending
|
|
Following terms of a securities lending agreement with the Funds’ custodian US Bank, a Fund may lend securities from its portfolio to brokers, dealers and financial institutions in order to increase the return on its portfolio, primarily through the receipt of borrowing fees and earnings on invested collateral. Any such loan must be continuously secured by collateral in cash or cash equivalents maintained on a current basis in an amount at least equal to the market value of the securities loaned
|
84
CONVERGENCE FUNDS
Notes to Financial Statements (Continued)
November 30, 2017
|
by a Fund. During the time securities are on loan, the borrower will pay the applicable Fund any accrued income on those securities, and the Fund may invest the cash collateral and earn income or receive an agreed-upon fee from a borrower that has delivered cash-equivalent collateral. In determining whether or not to lend a security to a particular broker, dealer or financial institution, the Adviser considers all relevant facts and circumstances, including the size, creditworthiness and reputation of the broker, dealer or financial institution.
|
|
|
Securities lending involves the risk of a default or insolvency of the borrower. In either of these cases, a Fund could experience delays in recovering securities or collateral or could lose all or part of the value of the loaned securities. A Fund also could lose money in the event of a decline in the value of the collateral provided for loaned securities. Additionally, the loaned portfolio securities may not be available to a Fund on a timely basis and that Fund may therefore lose the opportunity to sell the securities at a desirable price. Any decline in the value of a security that occurs while the security is out on loan would continue to be borne by the applicable Fund.
|
|
|
As of November 30, 2017, the market value of the securities on loan and value of collateral received for securities lending were as follows:
|
|
Market Value of
|
Value of
|
||||||||
|
Securities on Loan
|
Collateral
|
||||||||
|
Convergence Core Plus Fund
|
$
|
2,444,718
|
$
|
2,438,410
|
|||||
|
Convergence Opportunities Fund
|
2,673,711
|
2,703,559
|
|||||||
|
Convergence Market Neutral Fund
|
—
|
—
|
|||||||
|
The Funds receive cash as collateral in return for securities lent as part of the securities lending program. The collateral is invested in the First American Government Obligations Fund – Class Y (a money market fund subject to Rule 2a-7 under the 1940 Act). The Schedules of Investments for the Funds include the particular cash collateral holding as of November 30, 2017. The remaining contractual maturity of all securities lending transactions is overnight and continuous.
|
|
|
The Funds are not subject to a master netting agreement with respect to securities lending; therefore no additional disclosures are required.
|
|
|
The fee and interest income earned by the Funds on investments of cash collateral received from borrowers for the securities loaned to them are reflected in the Funds’ Statements of Operations.
|
85
CONVERGENCE FUNDS
Notes to Financial Statements (Continued)
November 30, 2017
|
(12)
|
Subsequent Event
|
|
On December 28, 2017, the Funds declared and paid distributions from ordinary income and long-term realized gain to shareholders of record as of December 27, 2017, as follows:
|
|
Ordinary
|
Short-Term
|
Long-Term
|
|||||||||||
|
Income
|
Realized Gains
|
Realized Gains
|
|||||||||||
|
Convergence Core Plus Fund
|
|||||||||||||
|
Institutional Class
|
$
|
219,038
|
$
|
8,514,983
|
$
|
7,618,781
|
|||||||
|
Convergence Opportunities Fund
|
|||||||||||||
|
Institutional Class
|
$
|
—
|
$
|
6,144,138
|
$
|
1,671,517
|
|||||||
|
On January 23, 2018, the Board of Trustees approved the removal of the Investment Class shares of the Convergence Core Plus Fund and the Convergence Opportunities Fund, from each Funds prospectus offering effective January 25, 2018.
|
86
CONVERGENCE FUNDS
Report of Independent Registered Public Accounting Firm
To the Shareholders of Convergence Funds and
Board of Trustees of Trust for Professional Managers
We have audited the accompanying statements of assets and liabilities, including the schedules of investments and securities sold short of Convergence Core Plus Fund, Convergence Opportunities Fund, and Convergence Market Neutral Fund (“Convergence Funds” or “Funds”), each a series of the Trust of Professional Managers, as of November 30, 2017, and the related statements of operations and cash flows for the year then ended, the statements of changes in net assets for each of the two periods in the period then ended, and the financial highlights for each of the periods presented in the period then ended. These financial statements and financial highlights are the responsibility of the Funds’ management. Our responsibility is to express an opinion on these financial statements and financial highlights based on our audits.
We conducted our audits in accordance with the standards of the Public Company Accounting Oversight Board (United States). Those standards require that we plan and perform the audit to obtain reasonable assurance about whether the financial statements and financial highlights are free of material misstatement. An audit includes examining, on a test basis, evidence supporting the amounts and disclosures in the financial statements. Our procedures included confirmation of securities owned as of November 30, 2017, by correspondence with the custodian and brokers. An audit also includes assessing the accounting principles used and significant estimates made by management, as well as evaluating the overall financial statement presentation. We believe that our audits provide a reasonable basis for our opinion.
In our opinion, the financial statements and financial highlights referred to above present fairly, in all material respects, the financial position of each of the Funds constituting Convergence Funds as of November 30, 2017, the results of their operations and cash flows, the changes in net assets for each of the two periods in the period then ended, and the financial highlights for each of the periods presented in the period then ended, in conformity with accounting principles generally accepted in the United States of America.
COHEN & COMPANY, LTD.
Cleveland, Ohio
January 26, 2018
87
CONVERGENCE FUNDS
Basis for Trustees’ Approval of Investment Advisory Agreement
(Unaudited)
The Board of Trustees (the “Trustees”) of Trust for Professional Managers (the “Trust”) met on August 17-18, 2017 to consider the renewal of the Investment Advisory Agreement (the “Agreement”) between the Trust, on behalf of the Convergence Core Plus Fund, the Convergence Opportunities Fund and the Convergence Market Neutral Fund (each, a “Fund,” and together, the “Funds”), each a series of the Trust, and Convergence Investment Partners, LLC, the Funds’ investment adviser (the “Adviser”). The Trustees also met at a prior meeting held on June 14, 2017 (the “June 14, 2017 Meeting”) to review materials related to the renewal of the Agreement. Prior to these meetings, the Trustees requested and received materials to assist them in considering the renewal of the Agreement. The materials provided contained information with respect to the factors enumerated below, including a copy of the Agreement, a memorandum prepared by the Trust’s outside legal counsel discussing in detail the Trustees’ fiduciary obligations and the factors they should assess in considering the renewal of the Agreement, detailed comparative information relating to the Funds’ performance, as well as the management fees and other expenses of each Fund, due diligence materials relating to the Adviser (including a due diligence questionnaire completed on behalf of the Funds by the Adviser, the Adviser’s Form ADV, select financial statements of the Adviser, bibliographic information of the Adviser’s key management and compliance personnel, comparative fee information for the Funds and a summary detailing key provisions of the Adviser’s written compliance program, including its code of ethics) and other pertinent information. The Trustees also received information periodically throughout the year that was relevant to the Agreement renewal process, including performance, management fee and other expense information. Based on their evaluation of the information provided by the Adviser, in conjunction with the Funds’ other service providers, the Trustees, by a unanimous vote (including a separate vote of the Trustees who are not “interested persons,” as that term is defined in the Investment Company Act of 1940, as amended (the “Independent Trustees”)), approved the continuation of the Agreement for an additional one-year term ending August 31, 2018.
DISCUSSION OF FACTORS CONSIDERED
In considering the renewal of the Agreement and reaching their conclusions, the Trustees reviewed and analyzed various factors that they determined were relevant, including the factors enumerated below.
|
1.
|
NATURE, EXTENT AND QUALITY OF SERVICES PROVIDED TO THE FUNDS
|
The Trustees considered the nature, extent and quality of services provided by the Adviser to the Funds and the amount of time devoted by the Adviser’s staff to the Funds’ operations. The Trustees considered the Adviser’s specific responsibilities in all aspects of day-to-day management of the Funds, as well as the qualifications, experience and responsibilities of David J. Abitz and Justin Neuberg, the Funds’ portfolio managers, and other key personnel at the Adviser involved in the day-to-day activities of the Funds. The Trustees noted that the Adviser does not manage any other accounts that utilize strategies similar to those employed by the Funds. The Trustees reviewed information provided by the Adviser in a due diligence summary, including the structure of the Adviser’s compliance program and discussed the Adviser’s marketing activities and its continuing commitment to the Funds. The Trustees noted that during the course of the prior year
88
CONVERGENCE FUNDS
Basis for Trustees’ Approval of Investment Advisory Agreement
(Unaudited) (Continued)
they had met with the Adviser in person to discuss various performance, marketing and compliance issues. The Trustees also noted any services that extended beyond portfolio management, and they considered the brokerage practices of the Adviser. The Trustees discussed in detail the Adviser’s handling of compliance matters, including the reports of the Trust’s chief compliance officer to the Trustees on the effectiveness of the Adviser’s compliance program. The Trustees concluded that the Adviser had sufficient quality and depth of personnel, resources, investment methods and compliance policies and procedures essential to performing its duties under the Agreement and that the nature, overall quality and extent of the management services provided to the Funds, as well as the Adviser’s compliance program, were satisfactory and reliable.
|
2.
|
INVESTMENT PERFORMANCE OF THE FUNDS AND THE ADVISER
|
The Trustees discussed the performance of the Institutional Class shares of the Core Plus Fund for the year-to-date, one-year, three-year and five-year periods ended April 30, 2017. The Trustees also discussed the performance of the Institutional Class shares of the Opportunities Fund for the year-to-date, one-year and three-year periods ended April 30, 2017. The Trustees further discussed the performance of the Market Neutral Fund for the year-to-date and one-year periods ended April 30, 2017. In assessing the quality of the portfolio management services provided by the Adviser, the Trustees also compared the short-term and longer-term performance of the Funds on both an absolute basis and in comparison to a benchmark index (the Russell 3000 Total Return Index for the Core Plus Fund, the Russell 2000 Total Return Index for the Opportunities Fund and the BofA Merrill Lynch 3 Month U.S. Treasury Bill Index and the S&P 500 Total Return Index for the Market Neutral Fund), and in comparison to a peer group of funds as constructed by data presented by Morningstar Direct (a peer group of U.S. open-end large blend funds and a peer group of U.S. open-end long-short equity funds for the Core Plus Fund, a peer group of U.S. open-end small blend funds for the Opportunities Fund and a peer group of U.S. open-end market neutral funds for the Market Neutral Fund) (each a “Morningstar Peer Group”).
The Trustees noted that for each of the one-year and five-year periods ended April 30, 2017, the Core Plus Fund’s performance was above the Morningstar Peer Group medians for both large blend funds and long-short equity funds. The Trustees then noted that for each of the year-to-date and three-year periods ended April 30, 2017, the Core Plus Fund’s performance was below the Morningstar Peer Group medians for both large blend funds and long-short equity funds. The Trustees also noted that for the since inception period ended March 31, 2017, the Core Plus Fund had outperformed the Russell 3000 Total Return Index. The Trustees noted the Core Plus Fund had underperformed the Russell 3000 Total Return Index for the quarter, one-year, three-year and five-year periods ended March 31, 2017.
The Trustees noted that for the year-to-date, one-year and three-year periods ended April 30, 2017, the Opportunities Fund’s performance was below the Morningstar Peer Group median, and that the Opportunities Fund’s absolute performance was negative for the year-to-date period ended April 30, 2017. The Trustees also noted that for the quarter, one-year, three-year and since inception periods ended March 31, 2017, the Opportunities Fund had underperformed the Russell 2000 Total Return Index.
89
CONVERGENCE FUNDS
Basis for Trustees’ Approval of Investment Advisory Agreement
(Unaudited) (Continued)
The Trustees noted that for the one-year period ended April 30, 2017, the Market Neutral Fund’s performance was above the Morningstar Peer Group median. The Trustees also noted that for the year-to-date period ended April 30, 2017, the Market Neutral Fund’s absolute performance was negative, below the Morningstar Peer Group median, and ranked in the worst percentile among the funds in the Morningstar Peer Group. The Trustees noted the Market Neutral Fund’s absolute performance was negative and underperformed the BofA Merrill Lynch 3 Month U.S. Treasury Bill Index for the quarter ended March 31, 2017, but outperformed the Index for the one-year and since inception periods ended March 31, 2017. The Trustees also noted that for the quarter, one-year and since inception periods ended March 31, 2017, the Market Neutral Fund had underperformed the S&P 500 Total Return Index.
|
3.
|
COSTS OF SERVICES PROVIDED AND PROFITS REALIZED BY THE ADVISER
|
The Trustees considered the cost of services and the structure of the Adviser’s fees, including a review of the expense analyses and other pertinent material with respect to the Fund. The Trustees reviewed the related statistical information and other materials provided, including the comparative expenses, expense components and peer group selection. The Trustees also considered the cost structure of the Funds relative to the Morningstar Peer Groups.
The Trustees also considered the overall profitability of the Adviser, reviewing the Adviser’s financial information and noted that the Adviser was providing subsidies for the Market Neutral Fund’s operations in the form of management fee waivers. The Trustees also examined the level of profits realized by the Adviser from the fees payable under the Agreement and the expense subsidization undertaken by the Adviser with respect to the Market Neutral Fund, as well as the Funds’ brokerage commissions and use of soft dollars by the Adviser. These considerations were based on materials requested by the Trustees and the Funds’ administrator specifically for the June 14, 2017 meeting and the August 17-18, 2017 meeting at which the Agreement was formally considered, as well as the reports made by the Adviser over the course of the year.
The Trustees noted that the Core Plus Fund’s contractual management fee of 1.00% was above the Morningstar Peer Group average of 0.69% for large blend funds and 0.74% for long-short equity funds. The Trustees noted that the Core Plus Fund was operating below its expense cap of 1.50% for Institutional Class shares. The Trustees noted that the Core Plus Fund’s total expense ratio of 1.31% for Institutional Class shares (which excludes dividends and interest on short positions) was above the Morningstar Peer Group average (which excludes Rule 12b-1 fees) of 0.91% for large blend funds and ranked in the worst percentile among the funds in the Morningstar Peer Group and 0.99% for long-short equity funds.
The Trustees noted that the Opportunities Fund’s contractual management fee of 1.00% fell above its Morningstar Peer Group average of 0.88%. The Trustees noted that the Opportunities Fund was operating below its expense cap of 1.50% for Institutional Class shares. The Trustees noted that the Opportunities Fund’s total expense ratio of 1.33% for Institutional Class shares was above the Morningstar Peer Group average (which excludes Rule 12b-1 fees) of 1.16%.
90
CONVERGENCE FUNDS
Basis for Trustees’ Approval of Investment Advisory Agreement
(Unaudited) (Continued)
The Trustees noted that the Market Neutral Fund’s contractual management fee of 1.00% fell below its Morningstar Peer Group average of 1.11%. The Trustees noted that the Market Neutral Fund’s total expense ratio of 1.50% for Institutional Class shares was above the Morningstar Peer Group average (which excludes Rule 12b-1 fees) of 1.43%.
The Trustees concluded that the Funds’ expenses and the management fees paid to the Adviser were fair and reasonable in light of the comparative performance, expense and management fee information. The Trustees noted, based on a profitability analysis prepared by the Adviser, that while the Adviser was not realizing profits in connection with its management of the Market Neutral Fund, the Adviser’s profit from sponsoring the Core Plus Fund and Opportunities Fund had not been, and currently was not, excessive and the Adviser maintained adequate profit levels to support its services to the Funds from the revenues of its overall investment advisory business.
|
4.
|
EXTENT OF ECONOMIES OF SCALE AS THE FUNDS GROW
|
The Trustees compared each Fund’s expenses relative to its peer group and discussed realized and potential economies of scale. The Trustees also reviewed the structure of each Fund’s management fee and whether each Fund was large enough to generate economies of scale for shareholders or whether economies of scale would be expected to be realized as Fund assets grow (and if so, how those economies of scale were being or would be shared with shareholders). The Trustees noted that the Funds’ management fee structure did not contain any breakpoint reductions as the Funds’ assets grow in size, but that the feasibility of incorporating breakpoints would continue to be reviewed on a regular basis. With respect to the Adviser’s fee structure, the Trustees concluded that the current fee structure was reasonable and reflected a sharing of economies of scale between the Adviser and the Funds at the Funds’ current asset levels.
|
5.
|
BENEFITS DERIVED FROM THE RELATIONSHIP WITH THE FUNDS
|
The Trustees considered the direct and indirect benefits that could be realized by the Adviser from its association with the Funds. The Trustees examined the brokerage and commissions of the Adviser with respect to the Funds. The Trustees concluded that the benefits the Adviser may receive, such as greater name recognition and increased ability to obtain research or brokerage services, appear to be reasonable, and in many cases may benefit the Funds.
CONCLUSIONS
The Trustees considered all of the foregoing factors. In considering the renewal of the Advisory Agreement, the Trustees did not identify any one factor as all-important, but rather considered these factors collectively in light of each Fund’s surrounding circumstances. Based on this review, the Trustees, including a majority of the Independent Trustees, approved the continuation of the Advisory Agreement for an additional term ending August 31, 2018 as being in the best interests of the Funds and their shareholders.
91
CONVERGENCE FUNDS
Notice of Privacy Policy & Practices
(Unaudited)
We collect non-public personal information about you from the following sources:
|
•
|
information we receive about you on applications or other forms;
|
|
•
|
information you give us orally; and
|
|
•
|
information about your transactions with us or others.
|
We do not disclose any non-public personal information about our shareholders or former shareholders without the shareholder’s authorization, except as permitted by law or in response to inquiries from governmental authorities. We may share information with affiliated parties and unaffiliated third parties with whom we have contracts for servicing the Funds. We will provide unaffiliated third parties with only the information necessary to carry out their assigned responsibility. All shareholder records will be disposed of in accordance with applicable law. We maintain physical, electronic and procedural safeguards to protect your non-public personal information and require third parties to treat your non-public personal information with the same high degree of confidentiality.
In the event that you hold shares of the Funds through a financial intermediary, including, but not limited to, a broker-dealer, bank or trust company, the privacy policy of your financial intermediary would govern how your non-public personal information would be shared with unaffiliated third parties.
92
CONVERGENCE FUNDS
Additional Information
(Unaudited)
Tax Information
For the year ended November 30, 2017, the Convergence Core Plus Fund, the Convergence Opportunities Fund and the Convergence Market Neutral Fund designated 68.71%, 0.00% and 0.00%, respectively, of its ordinary income distribution as qualified dividend income under the Jobs and Growth Tax Relief Reconciliation Act of 2003.
For the year ended November 30, 2017, 71.19%, 0.00% and 0.00% of dividends paid from net ordinary income for the Convergence Core Plus Fund, the Convergence Opportunities Fund and the Convergence Market Neutral Fund, respectively, qualified for the dividends received deduction available to corporate shareholders.
For the fiscal year ended November 30, 2017, taxable ordinary income distributions are designated as short-term capital gain distributions under Internal Revenue Code Section 871(k)(2)(c) for the Funds as follows:
|
Convergence Core Plus Fund
|
77.38%
|
|
|
Convergence Opportunities Fund
|
0.00%
|
|
|
Convergence Market Neutral Fund
|
0.00%
|
Indemnifications
Under the Trust’s organizational documents, its officers and Trustees are indemnified against certain liabilities arising out of the performance of their duties to the Funds. In addition, in the normal course of business, the Funds enter into contracts that provide general indemnifications to other parties. The Funds’ maximum exposure under these arrangements is unknown as this would involve future claims that may be made against the Funds that have not yet occurred. However, the Funds have not had prior claims or losses pursuant to these contracts and expect the risk of loss to be remote.
Information about Trustees
The business and affairs of the Trust are managed under the direction of the Board of Trustees. Information pertaining to the Trustees of the Trust is set forth below. The Statement of Additional Information includes additional information about the Trustees and is available, without charge, upon request by calling 877-677-9414.
93
CONVERGENCE FUNDS
Additional Information (Continued)
(Unaudited)
|
Other
|
|||||
|
Directorships
|
|||||
|
Term of
|
Number of
|
Principal
|
Held by
|
||
|
Office and
|
Portfolios
|
Occupation(s)
|
Trustee
|
||
|
Position(s)
|
Length
|
in Trust
|
During the
|
During the
|
|
|
Name, Address
|
Held with
|
of Time
|
Overseen
|
Past Five
|
Past Five
|
|
and Year of Birth
|
the Trust
|
Served
|
by Trustee
|
Years
|
Years
|
|
Independent Trustees
|
|||||
|
Michael D. Akers, Ph.D.
|
Trustee
|
Indefinite
|
31
|
Professor,
|
Independent
|
|
615 E. Michigan St.
|
Term; Since
|
Department of
|
Trustee, USA
|
||
|
Milwaukee, WI 53202
|
August 22,
|
Accounting,
|
MUTUALS
|
||
|
Year of Birth: 1955
|
2001
|
Marquette
|
(an open-end
|
||
|
University
|
investment
|
||||
|
(2004–present);
|
company with
|
||||
|
Chair, Department
|
three
|
||||
|
of Accounting,
|
portfolios).
|
||||
|
Marquette
|
|||||
|
University
|
|||||
|
(2004–2017).
|
|||||
|
Gary A. Drska
|
Trustee
|
Indefinite
|
31
|
Pilot,
|
Independent
|
|
615 E. Michigan St.
|
Term; Since
|
Frontier/Midwest
|
Trustee, USA
|
||
|
Milwaukee, WI 53202
|
August 22,
|
Airlines, Inc.
|
MUTUALS
|
||
|
Year of Birth: 1956
|
2001
|
(airline company)
|
(an open-end
|
||
|
(1986–present).
|
investment
|
||||
|
company with
|
|||||
|
three
|
|||||
|
portfolios).
|
94
CONVERGENCE FUNDS
Additional Information (Continued)
(Unaudited)
|
Other
|
|||||
|
Directorships
|
|||||
|
Term of
|
Number of
|
Principal
|
Held by
|
||
|
Office and
|
Portfolios
|
Occupation(s)
|
Trustee
|
||
|
Position(s)
|
Length
|
in Trust
|
During the
|
During the
|
|
|
Name, Address
|
Held with
|
of Time
|
Overseen
|
Past Five
|
Past Five
|
|
and Year of Birth
|
the Trust
|
Served
|
by Trustee
|
Years
|
Years
|
|
Jonas B. Siegel
|
Trustee
|
Indefinite
|
31
|
Retired
|
Independent
|
|
615 E. Michigan St.
|
Term; Since
|
(2011–present);
|
Trustee,
|
||
|
Milwaukee, WI 53202
|
October 23,
|
Managing Director,
|
Gottex Trust
|
||
|
Year of Birth: 1943
|
2009
|
Chief Administrative
|
(an open-end
|
||
|
Officer (“CAO”) and
|
investment
|
||||
|
Chief Compliance
|
company with
|
||||
|
Officer (“CCO”),
|
one portfolio)
|
||||
|
Granite Capital
|
(2010–2016);
|
||||
|
International Group,
|
Independent
|
||||
|
L.P. (an investment
|
Manager,
|
||||
|
management firm)
|
Ramius IDF
|
||||
|
(1994–2011).
|
fund complex
|
||||
|
(two closed-
|
|||||
|
end investment
|
|||||
|
companies)
|
|||||
|
(2010–2015);
|
|||||
|
Independent
|
|||||
|
Trustee, Gottex
|
|||||
|
Multi-Asset
|
|||||
|
Endowment
|
|||||
|
fund complex
|
|||||
|
(three closed-
|
|||||
|
end investment
|
|||||
|
companies)
|
|||||
|
(2010–2015);
|
|||||
|
Independent
|
|||||
|
Trustee,
|
|||||
|
Gottex Multi-
|
|||||
|
Alternatives
|
|||||
|
fund complex
|
|||||
|
(three closed-
|
|||||
|
end investment
|
|||||
|
companies)
|
|||||
|
(2010–2015).
|
95
CONVERGENCE FUNDS
Additional Information (Continued)
(Unaudited)
|
Other
|
|||||
|
Directorships
|
|||||
|
Term of
|
Number of
|
Principal
|
Held by
|
||
|
Office and
|
Portfolios
|
Occupation(s)
|
Trustee
|
||
|
Position(s)
|
Length
|
in Trust
|
During the
|
During the
|
|
|
Name, Address
|
Held with
|
of Time
|
Overseen
|
Past Five
|
Past Five
|
|
and Year of Birth
|
the Trust
|
Served
|
by Trustee
|
Years
|
Years
|
|
Interested Trustee and Officers
|
|||||
|
Joseph C. Neuberger*
|
Chairperson
|
Indefinite
|
31
|
President
|
Trustee,
|
|
615 E. Michigan St.
|
and
|
Term; Since
|
(2017–present);
|
Buffalo Funds
|
|
|
Milwaukee, WI 53202
|
Trustee
|
August 22,
|
Chief Operating
|
(an open-end
|
|
|
Year of Birth: 1962
|
2001
|
Officer (2016–
|
investment
|
||
|
present); Executive
|
company with
|
||||
|
Vice President,
|
ten portfolios);
|
||||
|
U.S. Bancorp
|
Trustee, USA
|
||||
|
Fund Services,
|
MUTUALS
|
||||
|
LLC (1994–2017).
|
(an open-end
|
||||
|
investment
|
|||||
|
company with
|
|||||
|
three
|
|||||
|
portfolios).
|
|||||
|
John P. Buckel
|
President
|
Indefinite
|
N/A
|
Vice President,
|
N/A
|
|
615 E. Michigan St.
|
and
|
Term; Since
|
U.S. Bancorp Fund
|
||
|
Milwaukee, WI 53202
|
Principal
|
January 24,
|
Services, LLC
|
||
|
Year of Birth: 1957
|
Executive
|
2013
|
(2004–present).
|
||
|
Officer
|
|||||
|
Jennifer A. Lima
|
Vice
|
Indefinite
|
N/A
|
Vice President,
|
N/A
|
|
615 E. Michigan St.
|
President,
|
Term; Since
|
U.S. Bancorp Fund
|
||
|
Milwaukee, WI 53202
|
Treasurer
|
January 24,
|
Services, LLC
|
||
|
Year of Birth: 1974
|
and
|
2013
|
(2002–present).
|
||
|
Principal
|
|||||
|
Financial
|
|||||
|
and
|
|||||
|
Accounting
|
|||||
|
Officer
|
96
CONVERGENCE FUNDS
Additional Information (Continued)
(Unaudited)
|
Other
|
|||||
|
Directorships
|
|||||
|
Term of
|
Number of
|
Principal
|
Held by
|
||
|
Office and
|
Portfolios
|
Occupation(s)
|
Trustee
|
||
|
Position(s)
|
Length
|
in Trust
|
During the
|
During the
|
|
|
Name, Address
|
Held with
|
of Time
|
Overseen
|
Past Five
|
Past Five
|
|
and Year of Birth
|
the Trust
|
Served
|
by Trustee
|
Years
|
Years
|
|
Elizabeth B. Scalf
|
Chief
|
Indefinite
|
N/A
|
Vice President,
|
N/A
|
|
615 E. Michigan St.
|
Compliance
|
Term; Effective
|
U.S. Bancorp
|
||
|
Milwaukee, WI 53202
|
Officer,
|
July 1,
|
Fund Services,
|
||
|
Year of Birth: 1985
|
Vice
|
2017
|
LLC (February
|
||
|
President
|
2017–present);
|
||||
|
and
|
Vice President and
|
||||
|
Anti-Money
|
Assistant CCO,
|
||||
|
Laundering
|
Heartland Advisors,
|
||||
|
Officer
|
Inc. (December
|
||||
|
2016–January
|
|||||
|
2017); Vice
|
|||||
|
President and
|
|||||
|
CCO, Heartland
|
|||||
|
Group, Inc.
|
|||||
|
(May 2016–
|
|||||
|
November 2016);
|
|||||
|
Vice President,
|
|||||
|
CCO and Senior
|
|||||
|
Legal Counsel
|
|||||
|
(May 2016–
|
|||||
|
November 2016),
|
|||||
|
Assistant CCO
|
|||||
|
and Senior Legal
|
|||||
|
Counsel (January
|
|||||
|
2016–April 2016),
|
|||||
|
Senior Legal and
|
|||||
|
Compliance
|
|||||
|
Counsel (2013–
|
|||||
|
2015), Legal and
|
|||||
|
Compliance Counsel
|
|||||
|
(2011–2013),
|
|||||
|
Heartland
|
|||||
|
Advisors, Inc.
|
|||||
|
Adam W. Smith
|
Secretary
|
Indefinite
|
N/A
|
Assistant Vice
|
N/A
|
|
615 E. Michigan St.
|
Term; Since
|
President, U.S.
|
|||
|
Milwaukee, WI 53202
|
May 29,
|
Bancorp Fund
|
|||
|
Year of Birth: 1981
|
2015
|
Services, LLC
|
|||
|
(2012–present).
|
97
CONVERGENCE FUNDS
Additional Information (Continued)
(Unaudited)
|
Other
|
|||||
|
Directorships
|
|||||
|
Term of
|
Number of
|
Principal
|
Held by
|
||
|
Office and
|
Portfolios
|
Occupation(s)
|
Trustee
|
||
|
Position(s)
|
Length
|
in Trust
|
During the
|
During the
|
|
|
Name, Address
|
Held with
|
of Time
|
Overseen
|
Past Five
|
Past Five
|
|
and Year of Birth
|
the Trust
|
Served
|
by Trustee
|
Years
|
Years
|
|
Cullen O. Small
|
Assistant
|
Indefinite
|
N/A
|
Assistant Vice
|
N/A
|
|
615 E. Michigan St.
|
Treasurer
|
Term; Since
|
President, U.S.
|
||
|
Milwaukee, WI 53202
|
January 22,
|
Bancorp Fund
|
|||
|
Year of Birth: 1987
|
2015
|
Services, LLC
|
|||
|
(2010–present).
|
|||||
|
Kelly A. Burns
|
Assistant
|
Indefinite
|
N/A
|
Assistant Vice
|
N/A
|
|
615 E. Michigan St.
|
Treasurer
|
Term; Since
|
President, U.S.
|
||
|
Milwaukee, WI 53202
|
April 23,
|
Bancorp Fund
|
|||
|
Year of Birth: 1987
|
2015
|
Services, LLC
|
|||
|
(2011–present);
|
|||||
|
Melissa Aguinaga
|
Assistant
|
Indefinite
|
N/A
|
Assistant Vice
|
N/A
|
|
615 E. Michigan St.
|
Treasurer
|
Term; Since
|
President, U.S.
|
||
|
Milwaukee, WI 53202
|
July 1,
|
Bancorp Fund
|
|||
|
Year of Birth: 1987
|
2015
|
Services, LLC
|
|||
|
(2010–present).
|
|
*
|
Mr. Neuberger is an “interested person” of the Trust as defined by the 1940 Act by virtue of the fact that he is a board member and an interested person of Quasar Distributors, LLC (the “Distributor”), the Funds’ principal underwriter.
|
98
A NOTE ON FORWARD LOOKING STATEMENTS (Unaudited)
Except for historical information contained in this report for the Funds, the matters discussed in this report may constitute forward-looking statements made pursuant to the safe-harbor provisions of the Private Securities Litigation Reform Act of 1995. These include any adviser or portfolio manager predictions, assessments, analyses or outlooks for individual securities, industries, market sectors and/or markets. These statements involve risks and uncertainties. In addition to the general risks described for the Funds in the current Prospectus, other factors bearing on this report include the accuracy of the Adviser’s or portfolio managers’ forecasts and predictions, and the appropriateness of the investment programs designed by the Adviser or portfolio managers to implement their strategies efficiently and effectively. Any one or more of these factors, as well as other risks affecting the securities markets and investment instruments generally, could cause the actual results of the Funds to differ materially as compared to benchmarks associated with the Funds.
ADDITIONAL INFORMATION (Unaudited)
The Funds have adopted proxy voting policies and procedures that delegate to the Adviser the authority to vote proxies. A description of the Funds’ proxy voting policies and procedures is available without charge, upon request, by calling the Funds toll free at 1-877-677-9414. A description of these policies and procedures is also included in the Funds’ Statement of Additional Information, which is available on the SEC’s website at http://www.sec.gov.
The Funds’ proxy voting record for the most recent 12-month period ended June 30 is available without charge, upon request, by calling, toll free, 1-877-677-9414, or by accessing the SEC’s website at http://www.sec.gov.
The Funds file their complete schedule of portfolio holdings with the SEC four times each fiscal year at quarter-ends. The Funds file the schedule of portfolio holdings with the SEC on Form N-CSR (second and fourth quarters) and on Form N-Q (first and third quarters). Shareholders may view the Funds’ Forms N-CSR and N-Q on the SEC’s website at www.sec.gov. Forms N-CSR and N-Q may also be reviewed and copied at the SEC’s Public Reference Room in Washington, D.C. Information on the SEC’s Public Reference Room may be obtained by calling 1-202-551-8090 (direct) or 1-800-SEC-0330 (general SEC number).
HOUSEHOLDING (Unaudited)
In an effort to decrease costs, the Funds intend to reduce the number of duplicate prospectuses and annual and semi-annual reports you receive by sending only one copy of each to those addresses shared by two or more accounts and to shareholders the Funds reasonably believe are from the same family or household. Once implemented, if you would like to discontinue householding for your accounts, please call toll-free at 1-877-677-9414 to request individual copies of these documents. Once the Funds receive notice to stop householding, the Funds will begin sending individual copies 30 days after receiving your request. This policy does not apply to account statements.
CONVERGENCE FUNDS
|
Investment Adviser
|
Convergence Investment Partners, LLC
|
|
1245 Cheyenne Avenue
|
|
|
Suite 102
|
|
|
Grafton, Wisconsin 53024
|
|
|
Legal Counsel
|
Godfrey & Kahn, S.C.
|
|
833 East Michigan Street
|
|
|
Suite 1800
|
|
|
Milwaukee, Wisconsin 53202
|
|
|
Independent Registered Public
|
Cohen & Company, Ltd.
|
|
Accounting Firm
|
1350 Euclid Avenue
|
|
Suite 800
|
|
|
Cleveland, Ohio 44115
|
|
|
Transfer Agent, Fund Accountant and
|
U.S. Bancorp Fund Services, LLC
|
|
Fund Administrator
|
615 East Michigan Street
|
|
Milwaukee, Wisconsin 53202
|
|
|
Custodian
|
U.S. Bank, N.A.
|
|
Custody Operations
|
|
|
1555 North River Center Drive
|
|
|
Milwaukee, Wisconsin 53212
|
|
|
Distributor
|
Quasar Distributors, LLC
|
|
777 East Wisconsin Avenue
|
|
|
Milwaukee, Wisconsin 53202
|
This report is intended for shareholders of the Funds and may not be used as sales literature unless preceded or accompanied by a current prospectus.
MN-ANNUAL
Item 2. Code of Ethics.
The registrant has adopted a code of ethics that applies to the registrant’s principal executive officer and principal financial officer. The registrant has not made any substantive amendments to its code of ethics during the period covered by this report. The registrant has not granted any waivers from any provisions of the code of ethics during the period covered by this report. Incorporated by reference to the registrant’s Form N-CSR filed on February 3, 2017.
Item 3. Audit Committee Financial Expert.
The registrant’s board of trustees has determined that there is at least one audit committee financial expert serving on its audit committee. Dr. Michael Akers is the “audit committee financial expert” and is considered to be “independent” as each term is defined in Item 3 of Form N‑CSR. Dr. Akers holds a Ph.D. in accountancy and is a professor of accounting at Marquette University in Milwaukee, Wisconsin.
Item 4. Principal Accountant Fees and Services.
The registrant has engaged its principal accountant to perform audit services, audit-related services, tax services and other services during the past two fiscal years. “Audit services” refer to performing an audit of the registrant's annual financial statements or services that are normally provided by the accountant in connection with statutory and regulatory filings or engagements for those fiscal years. “Audit-related services” refer to the assurance and related services by the principal accountant that are reasonably related to the performance of the audit. “Tax services” refer to professional services rendered by the principal accountant for tax compliance, tax advice, and tax planning. The following table details the aggregate fees billed or expected to be billed for each of the last two fiscal years for audit fees, audit-related fees, tax fees and other fees by the principal accountant.
|
FYE 11/30/2017
|
FYE 11/30/2016
|
|
|
Audit Fees
|
$49,500
|
$46,500
|
|
Audit-Related Fees
|
0
|
0
|
|
Tax Fees
|
$9,000
|
$9,000
|
|
All Other Fees
|
0
|
0
|
The audit committee has adopted pre-approval policies and procedures that require the audit committee to pre‑approve all audit and non‑audit services of the registrant, including services provided to any entity affiliated with the registrant.
The percentage of fees billed by Cohen & Company, Ltd. applicable to non-audit services pursuant to waiver of pre-approval requirement were as follows:
|
FYE 11/30/2017
|
FYE 11/30/2016
|
|
|
Audit-Related Fees
|
0%
|
0%
|
|
Tax Fees
|
0%
|
0%
|
|
All Other Fees
|
0%
|
0%
|
All of the principal accountant’s hours spent on auditing the registrant’s financial statements were attributed to work performed by full‑time permanent employees of the principal accountant.
The following table indicates the non-audit fees billed or expected to be billed by the registrant’s accountant for services to the registrant and to the registrant’s investment adviser (and any other controlling entity, etc.—not sub-adviser) for the last two years. The audit committee of the board of trustees/directors has considered whether the provision of non-audit services that were rendered to the registrant's investment adviser is compatible with maintaining the principal accountant's independence and has concluded that the provision of such non-audit services by the accountant has not compromised the accountant’s independence.
|
Non-Audit Related Fees
|
FYE 11/30/2017
|
FYE 11/30/2016
|
|
Registrant
|
$ 0
|
$ 0
|
|
Registrant’s Investment Adviser
|
$ 0
|
$ 0
|
Item 5. Audit Committee of Listed Registrants.
Not applicable to registrants who are not listed issuers (as defined in Rule 10A-3 under the Securities Exchange Act of 1934).
Item 6. Investments.
|
(a)
|
Schedule of Investments is included as part of the report to shareholders filed under Item 1 of this Form.
|
|
(b)
|
Not Applicable.
|
Item 7. Disclosure of Proxy Voting Policies and Procedures for Closed-End Management Investment Companies.
Not applicable to open-end investment companies.
Item 8. Portfolio Managers of Closed-End Management Investment Companies.
Not applicable to open-end investment companies.
Item 9. Purchases of Equity Securities by Closed‑End Management Investment Company and Affiliated Purchasers.
Not applicable to open-end investment companies.
Item 10. Submission of Matters to a Vote of Security Holders.
There have been no material changes to the procedures by which shareholders may recommend nominees to the registrant’s board of trustees.
Item 11. Controls and Procedures.
|
(a)
|
The Registrant’s President and Treasurer have reviewed the Registrant's disclosure controls and procedures (as defined in Rule 30a-3(c) under the Investment Company Act of 1940 (the “Act”)) as of a date within 90 days of the filing of this report, as required by Rule 30a-3(b) under the Act and Rules 13a-15(b) or 15d‑15(b) under the Securities Exchange Act of 1934. Based on their review, such officers have concluded that the disclosure controls and procedures are effective in ensuring that information required to be disclosed in this report is appropriately recorded, processed, summarized and reported and made known to them by others within the Registrant and by the Registrant’s service provider.
|
|
(b)
|
There were no changes in the Registrant's internal control over financial reporting (as defined in Rule 30a-3(d) under the Act) that occurred during the second fiscal quarter of the period covered by this report that have materially affected, or are reasonably likely to materially affect, the Registrant's internal control over financial reporting.
|
Item 12. Disclosure of Securities Lending Activities for Closed-End Management Investment Companies
Not applicable to open-end investment companies.
Item 13. Exhibits.
|
(a)
|
(1) Any code of ethics or amendment thereto, that is the subject of the disclosure required by Item 2, to the extent that the registrant intends to satisfy Item 2 requirements through filing an exhibit. Incorporated by reference to the registrant’s Form N-CSR filed on February 3, 2017.
|
(2) A separate certification for each principal executive officer and principal financial officer pursuant to Section 302 of the Sarbanes-Oxley Act of 2002. Filed herewith.
(3) Any written solicitation to purchase securities under Rule 23c‑1 under the Act sent or given during the period covered by the report by or on behalf of the registrant to 10 or more persons. Not applicable to open-end investment companies.
(4) Change in the registrant’s independent public accountant. There was no change in the registrant’s independent public accountant for the period covered by this report.
|
(b)
|
Certifications pursuant to Section 906 of the Sarbanes‑Oxley Act of 2002. Furnished herewith.
|
SIGNATURES
Pursuant to the requirements of the Securities Exchange Act of 1934 and the Investment Company Act of 1940, the registrant has duly caused this report to be signed on its behalf by the undersigned, thereunto duly authorized.
(Registrant) Trust for Professional Managers
By (Signature and Title)* /s/John Buckel
John Buckel, President
Date February 1, 2018
Pursuant to the requirements of the Securities Exchange Act of 1934 and the Investment Company Act of 1940, this report has been signed below by the following persons on behalf of the registrant and in the capacities and on the dates indicated.
By (Signature and Title)* /s/John Buckel
John Buckel, President
Date February 1, 2018
By (Signature and Title)* /s/Jennifer Lima
Jennifer Lima, Treasurer
Date February 1, 2018
* Print the name and title of each signing officer under his or her signature.