
UNITED STATES
SECURITIES AND EXCHANGE COMMISSION
Washington, D.C. 20549
FORM
(Mark one)
For the fiscal year ended
or
Commission File Number:
WILLIS TOWERS WATSON PUBLIC LIMITED COMPANY
(Exact name of registrant as specified in its charter)
(Jurisdiction of incorporation or organization) |
|
(I.R.S. Employer Identification No.) |
|
|
|
(Address of principal executive offices) |
|
( (Registrant’s telephone number, including area code) |
Securities registered pursuant to Section 12(b) of the Act:
Title of each class |
|
Trading Symbol(s) |
|
Name of each exchange on which registered |
|
|
|
Securities registered pursuant to Section 12(g) of the Act: None
Indicate by check mark if the registrant is a well-known seasoned issuer, as defined in Rule 405 of the Securities Act.
Indicate by check mark if the registrant is not required to file reports pursuant to Section 13 or Section 15(d) of the Act. Yes ☐
Indicate by check mark whether the Registrant (1) has filed all reports required to be filed by Section 13 or 15(d) of the Securities Exchange Act of 1934 during the preceding 12 months (or for such shorter period that the Registrant was required to file such reports), and (2) has been subject to such filing requirements for the past 90 days.
Indicate by check mark whether the Registrant has submitted electronically every Interactive Data File required to be submitted pursuant to Rule 405 of Regulation S-T (§ 232.405 of this chapter) during the preceding 12 months (or for such shorter period that the Registrant was required to submit and post such files).
Indicate by check mark whether the registrant is a large accelerated filer, an accelerated filer, a non-accelerated filer or a smaller reporting company. See the definitions of ‘large accelerated filer’, ‘accelerated filer’ and ‘smaller reporting company’ in Rule 12b-2 of the Exchange Act.
Accelerated filer ☐ |
Non-accelerated filer ☐ |
Smaller reporting company |
|
|
|
|
|
Emerging growth company |
|
|
|
If an emerging growth company, indicate by check mark if the registrant has elected not to use the extended transition period for complying with any new or revised financial accounting standards provided pursuant to Section 13(a) of the Exchange Act. ☐
Indicate by check mark whether the registrant has filed a report on and attestation to its management’s assessment of the effectiveness of its internal control over financial reporting under Section 404(b) of the Sarbanes-Oxley Act (15 U.S.C. 7262(b)) by the registered public accounting firm that prepared or issued its audit report.
If securities are registered pursuant to Section 12(b) of the Act, indicate by check mark whether the financial statements of the registrant included in the filing reflect the correction of an error to previously issued financial statements.
Indicate by check mark whether any of those error corrections are restatements that required a recovery analysis of incentive-based compensation received by any of the registrant’s executive officers during the relevant recovery period pursuant to §240.10D-1(b). ☐
Indicate by check mark whether the registrant is a shell company (as defined in Rule 12b-2 of the Act). Yes
The aggregate market value of the voting common equity held by non-affiliates of the Registrant, computed by reference to the last reported price at which the Registrant’s common equity was sold on June 30, 2023 (the last day of the Registrant’s most recently completed second quarter) was $
As of February 16, 2024, there were outstanding
DOCUMENTS INCORPORATED BY REFERENCE
Portions of Part III will be incorporated by reference in accordance with Instruction G(3) to Form 10-K no later than 120 days after the end of the Company’s fiscal year.
WILLIS TOWERS WATSON PUBLIC LIMITED COMPANY
INDEX TO FORM 10-K
For the year ended December 31, 2023
|
|
Page |
||
|
1 |
|||
|
|
|
|
|
|
2 |
|||
|
|
|
|
|
|
|
|
|
|
Item 1 |
|
|
3 |
|
|
|
|
|
|
Item 1A |
|
|
16 |
|
|
|
|
|
|
Item 1B |
|
|
40 |
|
|
|
|
|
|
Item 1C |
|
|
40 |
|
|
|
|
|
|
Item 2 |
|
|
41 |
|
|
|
|
|
|
Item 3 |
|
|
41 |
|
|
|
|
|
|
Item 4 |
|
|
41 |
|
|
|
|
|
|
|
|
|
|
|
Item 5 |
|
|
42 |
|
|
|
|
|
|
Item 6 |
|
|
45 |
|
|
|
|
|
|
Item 7 |
|
Management’s Discussion and Analysis of Financial Condition and Results of Operations |
|
46 |
|
|
|
|
|
Item 7A |
|
|
67 |
|
|
|
|
|
|
Item 8 |
|
|
70 |
|
|
|
|
|
|
Item 9 |
|
Changes in and Disagreements with Accountants on Accounting and Financial Disclosure |
|
123 |
|
|
|
|
|
Item 9A |
|
|
123 |
|
|
|
|
|
|
Item 9B |
|
|
125 |
|
|
|
|
|
|
Item 9C |
|
Disclosure Regarding Foreign Jurisdictions that Prevent Inspections |
|
126 |
|
|
|
|
|
|
|
|
|
|
Item 10 |
|
|
127 |
|
|
|
|
|
|
Item 11 |
|
|
127 |
|
|
|
|
|
|
Item 12 |
|
Security Ownership of Certain Beneficial Owners and Management and Related Stockholder Matters |
|
127 |
|
|
|
|
|
Item 13 |
|
Certain Relationships and Related Transactions, and Director Independence |
|
127 |
|
|
|
|
|
Item 14 |
|
|
127 |
|
|
|
|
|
|
|
|
|
|
|
Item 15 |
|
|
128 |
|
|
|
|
|
|
Item 16 |
|
|
134 |
|
|
|
|
|
|
|
135 |
|||
Certain Definitions
The following definitions apply throughout this Annual Report on Form 10-K unless the context requires otherwise:
‘We’, ‘Us’, ‘Company’, ‘WTW’, ‘Willis Towers Watson’, ‘Our’, or ‘Willis Towers Watson plc’ |
|
Willis Towers Watson Public Limited Company, a company organized under the laws of Ireland, and its subsidiaries |
|
|
|
‘shares’ |
|
The ordinary shares of Willis Towers Watson Public Limited Company, nominal value $0.000304635 per share |
|
|
|
‘Legacy Willis’ or ‘Willis’ |
|
Willis Group Holdings Public Limited Company and its subsidiaries, predecessor to WTW, prior to the Merger |
|
|
|
‘Legacy Towers Watson’ or ‘Towers Watson’ |
|
Towers Watson & Co. and its subsidiaries |
|
|
|
‘Merger’ |
|
Merger of Willis Group Holdings Public Limited Company and Towers Watson & Co. pursuant to the Agreement and Plan of Merger, dated June 29, 2015, as amended on November 19, 2015, and completed on January 4, 2016 |
|
|
|
‘Miller’ |
|
Miller Insurance Services LLP and its subsidiaries |
|
|
|
‘TRANZACT’ |
|
CD&R TZ Holdings, Inc. and its subsidiaries, doing business as TRANZACT
|
‘U.S.’ |
|
United States |
|
|
|
‘U.K.’ |
|
United Kingdom |
|
|
|
‘Brexit’ |
|
The United Kingdom’s exit from the European Union, which occurred on January 31, 2020. |
|
|
|
‘E.U.’ |
|
European Union or European Union 27 (the number of member countries following the United Kingdom’s exit) |
|
|
|
‘U.S. GAAP’ |
|
United States Generally Accepted Accounting Principles |
|
|
|
‘FASB’ |
|
Financial Accounting Standards Board |
|
|
|
‘ASC’ |
|
Accounting Standards Codification |
|
|
|
‘ASU’ |
|
Accounting Standards Update |
|
|
|
‘SEC’ |
|
United States Securities and Exchange Commission |
|
|
|
‘EBITDA’ |
|
Earnings before Interest, Taxes, Depreciation and Amortization |
1
Disclaimer Regarding Forward-looking Statements
We have included in this document ‘forward-looking statements’ within the meaning of Section 27A of the Securities Act of 1933, and Section 21E of the Securities Exchange Act of 1934, which are intended to be covered by the safe harbors created by those laws. These forward-looking statements include information about possible or assumed future results of our operations. All statements, other than statements of historical facts, that address activities, events or developments that we expect or anticipate may occur in the future, including such things as: our outlook; the potential impact of natural or man-made disasters like health pandemics and other world health crises; future capital expenditures; ongoing working capital efforts; future share repurchases; financial results (including our revenue, costs or margins) and the impact of changes to tax laws on our financial results; existing and evolving business strategies and acquisitions and dispositions, including our completed sale of Willis Re to Arthur J. Gallagher & Co. (‘Gallagher’) and transitional arrangements related thereto; demand for our services and competitive strengths; strategic goals; the benefits of new initiatives; growth of our business and operations; the sustained health of our product, service, transaction, client, and talent assessment and management pipelines; our ability to successfully manage ongoing leadership, organizational and technology changes, including investments in improving systems and processes; our ability to implement and realize anticipated benefits of any cost-savings initiatives including the multi-year operational Transformation program; our recognition of future impairment charges; and plans and references to future successes, including our future financial and operating results, short-term and long-term financial goals, plans, objectives, expectations and intentions, including with respect to free cash flow generation, adjusted net revenue, adjusted operating margin and adjusted earnings per share, are forward-looking statements. Also, when we use words such as ‘may’, ‘will’, ‘would’, ‘anticipate’, ‘believe’, ‘estimate’, ‘expect’, ‘intend’, ‘plan’, ‘continues’, ‘seek’, ‘target’, ‘goal’, ‘focus’, ‘probably’, or similar expressions, we are making forward-looking statements. Such statements are based upon the current beliefs and expectations of the Company’s management and are subject to significant risks and uncertainties. Actual results may differ from those set forth in the forward-looking statements. All forward-looking disclosure is speculative by its nature.
A number of risks and uncertainties that could cause actual results to differ materially from the results reflected in these forward-looking statements are identified under ‘Risk Factors’ in Item 1A of this Annual Report on Form 10-K. These statements are based on assumptions that may not come true and are subject to significant risks and uncertainties.
Although we believe that the assumptions underlying our forward-looking statements are reasonable, any of these assumptions, and therefore also the forward-looking statements based on these assumptions, could themselves prove to be inaccurate. Given the significant uncertainties inherent in the forward-looking statements included in this Annual Report on Form 10-K, our inclusion of this information is not a representation or guarantee by us that our objectives and plans will be achieved.
Our forward-looking statements speak only as of the date made and we will not update these forward-looking statements unless the securities laws require us to do so. With regard to these risks, uncertainties and assumptions, the forward-looking events discussed in this document may not occur, and we caution you against unduly relying on these forward-looking statements.
2
PART I.
ITEM 1. BUSINESS
The Company
WTW is a leading global advisory, broking and solutions company that provides data-driven, insight-led solutions in the areas of people, risk and capital. Utilizing the global view and local expertise of our 48,000 colleagues serving more than 140 countries and markets, we help organizations sharpen strategies, enhance resilience, motivate workforces and maximize performance. We design and deliver solutions that manage risk, optimize benefits, cultivate talent and expand the power of capital to protect and strengthen institutions and individuals. Working closely with our clients, we uncover opportunities for sustainable success.
Our clients operate on a global and local scale in a multitude of businesses and industries throughout the world and generally range in size from large, major multinational corporations to middle-market domestic and international companies. Our clients include many of the world’s leading corporations, including approximately 95% of the FTSE 100, 89% of the Fortune 1000, and 91% of the Fortune Global 500 companies. We also advise the majority of the world’s leading insurance companies. We work with major corporations, emerging growth companies, governmental agencies and not-for-profit institutions in a wide variety of industries, with many of our client relationships spanning decades. None of the Company’s customers individually represented more than 10% of its consolidated revenue for each of the years ended December 31, 2023, 2022 and 2021. We place insurance with more than 2,500 insurance carriers, none of which individually accounted for a significant concentration of the total premiums we placed on behalf of our clients in 2023, 2022 or 2021.
Available Information
The Company files annual, quarterly and current reports, proxy statements and other information with the SEC. The SEC maintains a website that contains annual, quarterly and current reports, proxy statements and other information that issuers (including WTW) file electronically with the SEC. The SEC’s website is www.sec.gov.
The Company makes available, free of charge through our website, www.wtwco.com, our Annual Report on Form 10-K, our quarterly reports on Form 10-Q, our proxy statement, current reports on Form 8-K and Forms 3, 4, and 5 filed on behalf of directors and Section 16 officers, as well as any amendments to those reports filed or furnished pursuant to the Securities Exchange Act of 1934 (the ‘Exchange Act’) as soon as reasonably practicable after such material is electronically filed with, or furnished to, the SEC. Unless specifically incorporated by reference, information on our website is not a part of this Form 10-K.
The Company’s Memorandum and Articles of Association, Corporate Governance Guidelines, Audit and Risk Committee Charter, Operational Transformation Committee Charter, Human Capital and Compensation Committee Charter, and Corporate Governance and Nominating Committee Charter are available on our website, www.wtwco.com, in the Investor Relations section, or upon request. Requests for copies of these documents should be directed in writing to the Company Secretary c/o Office of General Counsel, Willis Towers Watson Public Limited Company, Brookfield Place, 200 Liberty Street, New York, NY 10281.
General Information
WTW offers its clients a broad range of services and solutions to help them to identify and control their risks, and to enhance business performance by improving their ability to attract, retain and engage a talented workforce. Our risk control services range from strategic risk consulting (including providing actuarial analysis) to a variety of due diligence services, to the provision of practical on-site risk control services (such as health and safety or property loss control consulting), as well as analytical and advisory services (such as hazard modeling and climate risk quantification). We assist clients in planning how to manage incidents or crises when they occur. These services include contingency planning, security audits and product tampering plans. We help our clients enhance their business performance by delivering consulting services, technology and solutions that help them anticipate, identify and capitalize on emerging opportunities in human capital management, as well as offer investment advice to help them develop disciplined and efficient strategies to meet their investment goals.
As an insurance broker, we act as an intermediary between our clients and insurance carriers by advising our clients on their risk management requirements, helping them to determine the best means of managing risk and negotiating and placing insurance with insurance carriers through our global distribution network.
We operate a private Medicare marketplace in the U.S. through which, along with our active employee marketplace, we help our clients move to a more sustainable economic model by capping and controlling the costs associated with healthcare benefits. We also provide direct-to-consumer sales of Medicare coverage.
3
We are not an insurance company, and therefore we do not underwrite insurable risks for our own account. We help sharpen strategies, enhance organizational resilience, motivate workforces and maximize performance to uncover opportunities for sustainable success.
We derive the majority of our revenue from either commissions or fees for brokerage or consulting services. We do not determine the insurance premiums on which our commissions are generally based. Commission levels generally follow the same trend as premium levels as they are derived from a percentage of the premiums paid by the insureds. Fluctuations in these premiums charged by the insurance carriers can therefore have a direct and potentially material impact on our results of operations. Our fees for consulting services are spread across a variety of complementary businesses that generally remain steady during times of uncertainty. We have some businesses, such as our health and benefits and administration businesses, which can be counter cyclical during the early period of a significant economic change.
Business Strategy
We believe that a unified and integrated approach to advisory, broking and solutions can be a path to growth for organizations around the world. We harness our collective power as ‘One WTW’ to make smart connections to serve and support our clients.
We operate in attractive markets – both growing and mature – with a diversified platform across industries, segments and businesses globally.
Our vision is to be the best advisory, broking and solutions company for the benefit of all our stakeholders – creating a competitive advantage and delivering sustainable, profitable growth.
We believe we can achieve this through executing on our three strategic priorities – grow, simplify and transform:
Through these strategies we aim to grow revenue, improve margins and increase cash flow, EBITDA and earnings.
We care as much about how we work as we do about the impact that we make. This means commitment to a shared purpose and values, a framework that guides how we run our business and serve clients. Our values of client focus, teamwork, integrity, respect and excellence underlie all that we do, and how we behave and interact with each other, our clients and our partners.
For more information about risks to our strategic plans, see Part I, Item 1A Risk Factors of this Form 10-K.
Principal Services
We manage our business across two integrated reportable operating segments: Health, Wealth & Career and Risk & Broking. Below are the percentages of revenue generated by each segment for each of the years ended December 31, 2023, 2022 and 2021. These percentages exclude revenue that has been classified as discontinued operations in our consolidated statements of comprehensive income.
|
|
Year ended December 31, |
|
|||||||||
|
|
2023 |
|
|
2022 |
|
|
2021 |
|
|||
Health, Wealth & Career |
|
|
60 |
% |
|
|
60 |
% |
|
|
60 |
% |
Risk & Broking |
|
|
40 |
% |
|
|
40 |
% |
|
|
40 |
% |
4
The following presents descriptions of our segments:
Health, Wealth & Career
The Health, Wealth & Career (‘HWC’) segment provides an array of advice, broking, solutions and technology for employee benefit plans, institutional investors, compensation and career programs, and the employee experience overall. Our portfolio of services support the interrelated challenges that the management teams of our clients face across human resources (‘HR’) and finance.
HWC is the larger of the two segments of the Company. Addressing four key areas, Health, Wealth, Career and Benefits Delivery & Outsourcing, the segment is focused on addressing our clients’ people and risk needs to help them succeed in a global marketplace.
Health
The Health & Benefits (‘H&B’) business provides strategy and design consulting, plan management service and support, broking and administration across the full spectrum of health, wellbeing and other group benefit programs, including medical, dental, disability, life, voluntary benefits and other coverage. Our reach extends from small/mid-market clients to large-market and multinational clients, across the full geographic footprint of the Company, and to most industries. We can address our clients’ needs in more than 140 countries.
Our consultants help clients make strategic decisions on topics such as optimizing program spend; evaluating emerging vendors, point solutions and coverage options (including publicly-subsidized health insurance exchanges and private exchanges in the U.S.); and dealing with above-inflation-rate increases in healthcare costs. We also assist clients in selecting the appropriate insurance carriers to cover benefit risks and administer the programs. In addition to our consulting and broking services, we manage a number of collective purchasing initiatives, such as pharmacy and stop-loss, that allow employers to realize greater value from third-party service providers than they can achieve on their own.
With Global Benefits Management, our suite of global services supporting medical, dental and risk (e.g., life, disability) programs, we have a tailored offering for multinationals. This offering includes a flexible set of ready-made solutions, proven technology and an integrated approach to service delivery that translates to a globally consistent, high-quality experience for our clients.
A meaningful portion of revenue in this business is from recurring work, though contracts may be annual or multi-year. Given the balance of revenue across consulting, broking and solutions, our revenue is somewhat weighted to the first half of the year.
Wealth
Our wealth-related businesses include Retirement and Investments.
Retirement — Our Retirement business provides actuarial support, plan design, and administrative services for all forms of pension and retirement savings plans. Our colleagues help our clients assess the costs and risks of retirement plans on cash flow, earnings and the balance sheet, the effects of changing workforce demographics on their retirement plans, and retiree benefit adequacy and security. We offer clients a full range of integrated retirement consulting services and solutions to meet the needs of all types of employers. We help multinationals coordinate plan design and actuarial services across their complex global plans. We bring in-depth data analysis and perspective to their decision-making process as we have tracked the retirement designs and financing strategies of companies around the world over many decades.
For clients that want to outsource some or all of their pension plan management, we offer broking services, as well as integrated solutions that can combine investment discretionary management, pension administration, core actuarial services, and communication and change management assistance.
Retirement relationships are generally long-term in nature, and client retention rates for this business are high. A significant portion of the revenue in this business is from recurring work, with multi-year contracts that are driven by the heavily regulated nature of pension plans and our clients’ annual needs for these services.
Investments — Our Investments business provides advice and discretionary investment management solutions to defined benefit and defined contribution pension plans as well as to a range of other client types including insurers, endowments and foundations, and private wealth investors. We provide a solution to a significant business problem faced by our clients, namely sustaining the resources and skills required to deliver a financial services product in highly competitive capital markets. We offer a flexible approach that adapts to a wide range of client needs and circumstances, with the objective of higher returns, lower risk and lower costs within each client’s unique situation.
Our solutions range from single asset class activity, through complete management of entire pension plan assets including sophisticated liability hedging programs.
5
We bring together a broad array of specialist investment knowledge and skills across all asset classes, a high-quality execution platform, a cost advantage through our scale, and expert advisors with experience across all client types from the largest plans in the world to small corporate pension plans.
We have long-term relationships with our Investments clients, with the majority of our revenue driven by retainer contracts.
Career
Our career-related offerings include advice, data, software and products to address clients’ total rewards and talent issues across the globe delivered through our Work & Rewards and Employee Experience businesses.
Work & Rewards — Within our Work & Rewards business, we help clients determine the best ways to get work done, the skills needed for jobs, and how to reward employees. We address executive compensation and broad-based rewards. We advise our clients’ management and boards of directors on all aspects of executive pay programs, including base pay, annual bonuses, long-term incentives, perquisites and other benefits. Our focus is on aligning pay plans with an organization’s business strategy and driving desired performance. Our solutions incorporate proprietary market benchmarking data and software to support compensation administration.
Employee Experience — Our Employee Experience business focuses on the provision of solutions including employee insight and listening tools, a technology platform that connects users across our HWC segment, communication and change management services.
Revenue for our career-related businesses is partly seasonal in nature, with heightened activity in the second half of the calendar year during the annual compensation, benefits and survey cycles. While these businesses enjoy long-term relationships with many clients, work in several practices is often project-based and can be sensitive to economic changes. The businesses benefit from regulatory changes affecting our clients that require strategic advice, program changes and communication, the redefinition of jobs, work location and career paths as technology disaggregates work, and the recalibration of pay and the employee experience amidst shifting labor markets.
Benefits Delivery & Outsourcing
Our Benefits Delivery & Outsourcing businesses include Benefits Delivery & Administration (‘BDA’) and Global Outsourcing.
Benefits Delivery & Administration — The BDA business includes Individual Marketplace and Benefits Accounts.
Individual Marketplace — Individual Marketplace offers decision support processes and tools to connect consumers with insurance carriers in private individual and Medicare markets. Individual Marketplace serves both employer-based and direct-to-consumer populations through its end-to-end consumer acquisition and engagement platforms, which tightly integrate call routing technology, an efficient quoting and enrollment engine, a customer relations management system and deep links with insurance carriers. By leveraging its multiple distribution channels and diverse product portfolio, Individual Marketplace offers solutions to a broad consumer base, helping individuals compare, purchase and use health insurance products, tools and information for life.
Benefits Accounts — Benefits Accounts provides employees and retirees with tax-advantaged medical spending and savings accounts including health savings accounts (‘HSA’), health care flexible spending accounts (‘HCFSA’), dependent care flexible spending accounts (‘DCFSA’), limited purpose flexible spending accounts (‘LPFSA’) and health reimbursement arrangements (‘HRA’). Benefits Accounts is an important component of our holistic solutions suite, allowing employers to choose among an array of funding accounts when offering employees and retirees account-based health plans.
Global Outsourcing — Global Outsourcing administers the health, welfare and retirement plans of clients using our proprietary technology, including tools to enable benefit modeling, decision support, enrollment and benefit choice, records management and self-service functions. Drawing on expertise in H&B and Retirement to create high-performing benefit plan designs, we believe we are well-positioned to help clients of all sizes simplify their benefits delivery, while lowering the total costs of benefits and related administration. Our technology also provides trustees and HR teams with timely management information to monitor activity and service levels and reduce administration costs.
With ongoing servicing requirements and multi-year contracts in place, we have high client retention rates. We are the leading administrator among the 200 largest pension plans in the U.K., as well as a leader in Germany.
A significant portion of the revenue in Benefits Delivery & Outsourcing is recurring in nature, driven by either the commissions from the policies we sell, or from long-term service contracts with our clients that typically range from three to five years. Revenue across this business is seasonal and is generally higher in the fourth quarter as it is driven when typical annual enrollment activity occurs.
6
Risk & Broking
The Risk & Broking (‘R&B’) segment provides a broad range of risk advice, insurance brokerage and consulting services to clients globally, ranging from small businesses to multinational corporations.
The segment comprises two primary businesses: our Corporate Risk & Broking and our Insurance Consulting and Technology businesses.
Corporate Risk & Broking (‘CRB’)
The CRB business places more than $30 billion of premiums into the insurance markets on an annual basis and delivers integrated global solutions tailored to client needs. This is underpinned by data and analytics through a balanced matrix of global lines of business and local Property and Casualty businesses, across three geographical areas: North America, Europe and International. Globally, and across the businesses, our specialized and data-driven approach is underpinned by our risk analytics and climate analytics propositions.
Across all businesses, our experts take an industry-focused approach to risk management and assessment, delivering broader perspectives and data-informed decision making to our clients. Our lines of business include Property and Casualty, Affinity, Risk & Analytics and our specialty global lines of business.
Property and Casualty — Property and Casualty, in each of our geographical areas, provides property and liability insurance brokerage services across a wide range of industries and segments including real estate, healthcare and retail.
Affinity — Through Affinity, we arrange insurance products and services for our affinity client partners to offer to their customers, employees, or members alongside, or in addition to, their principal business offerings.
Risk & Analytics (‘R&A’) — Our R&A offering includes deep expertise on specific client needs. Through the use of holistic analysis, R&A brings value through risk quantification and development of a robust portfolio risk strategy, ultimately delivering a sound financial approach to all clients.
Our specialty global lines of business include:
Aerospace — Aerospace provides specialist expertise to the aerospace and space industries. Our aerospace business provides insurance broking, risk management services, contractual and technical advisory expertise to aerospace clients globally, including the world’s leading airlines, aircraft manufacturers, air cargo handlers and other airport and general aviation companies. The specialist InSpace team is also prominent in providing insurance and risk management services to the space industry.
Construction — Our Construction business provides services that include insurance broking, claims, loss control and specialized risk advice for a wide range of construction projects and activities. Clients include contractors, project owners, public entities, project managers, consultants and financiers, among others.
Global Markets Direct & Facultative — Operating in the major wholesale reinsurance hubs across the globe, including London, Bermuda, Singapore, Hong Kong and Shanghai, solutions are delivered both directly to clients for the most complex property and casualty risks and as facultative reinsurance placements where we serve as an intermediary for insurance companies. Facultative solutions are provided across various classes of risk for our insurer clients, some of which may also be direct clients of WTW. The aim is to deliver optimum results for our clients by getting the right risk to the right market by the right broker, be it local, wholesale or facultative every time.
Financial, Executive and Professional Risks (‘FINEX’) — FINEX encompasses all financial and executive risks, delivering client solutions that range from management and professional liability, employment practices liability, crime, cyber and M&A-related insurances to risk consulting and advisory services. Specialist teams provide risk consulting and risk transfer solutions to a broad spectrum of clients across a multitude of industries, as well as the financial and professional service sectors.
Financial Solutions — Financial Solutions provides insurance broking services and specialized risk advice related to credit and political risk and crisis management, including terrorism, kidnap and ransom and contingency risk. Clients include international banks, leasing companies, commodity traders, export credit agencies and multinational corporations.
Crisis Management — Our global practice delivers crisis management and contingency risk management to multinational clients, providing comprehensive solutions around terrorism, political violence, accident and health, special crime and active assailant.
7
Surety — The Global Surety team provides expertise in placing bonds across all industries and around the globe. A surety bond is a financial instrument that guarantees contractual performance, statutory compliance, and financial assurance for domestic and international companies.
Marine — Marine provides specialist expertise to the maritime and logistics industries. Our Marine business provides insurance broking services related to hull and machinery, cargo, protection and indemnity, fine art and general marine liabilities, among others. Our Marine clients include, but are not limited to, ship owners and operators, shipbuilders, logistics operations, port authorities, traders, shippers, exhibitors and secure transport companies.
Natural Resources — Our Natural Resources practice encompasses the oil, gas and chemicals, mining and metals, power and utilities and renewable energy sectors. It provides sector-specific risk transfer solutions and insights, which include insurance broking, risk engineering, contractual reviews, wording analysis and claims management.
Insurance Consulting and Technology (‘ICT’)
ICT is a global business that provides advice and technology solutions to the insurance industry. We leverage our industry experience, strategic perspective and analytical skills to help clients measure and manage risk and capital, improve business performance and create a sustainable competitive advantage. Our services include software and technology, risk and capital management, products and product pricing, financial and regulatory reporting, financial and capital modeling, M&A, outsourcing and business management.
Human Capital
Colleague experience – Our colleague experience is an important differentiating factor for WTW and a key enabler of our grow, simplify and transform strategy. It is designed to provide colleagues with a strong sense of purpose and belonging where everyone is heard and valued, the opportunity to build great connections with people and leaders, meaningful and interesting work, and opportunities to grow and thrive with recognition and reward in return. This means we strive to foster an inclusive environment where everyone can be their authentic self, where we encourage curiosity, innovation and a continuous improvement mindset and an environment where we are bold in our thinking and care about the impact we have.
Our values, vision, purpose, and Colleague Value Proposition (‘CVP’) — we’re Authentic, Curious and Bold, sets the tone for what to expect at WTW. In addition, our ‘grow, simplify and transform’ strategic priorities enhance our focus on how to continually support and improve our colleague experience. We continually build on our CVP through execution of a colleague experience roadmap and a robust portfolio of colleague listening activities to attract, engage and retain the most accomplished and aspiring talent.
Colleagues – Our success depends on our ability to bring to our clients the most accomplished and aspiring talent in the industry. We provide our colleagues with meaningful long-term careers across our base of full-time (the majority), part-time and seasonal/temporary colleagues to meet the specific needs of our various businesses.
The number of employees by segment as of the year ended December 31, 2023 is approximated below:
|
|
December 31, 2023 |
|
|
Health, Wealth & Career |
|
|
24,100 |
|
Risk & Broking |
|
|
14,300 |
|
Corporate and Other |
|
|
9,600 |
|
Total Employees |
|
|
48,000 |
|
The number of employees by geography as of the year ended December 31, 2023 is approximated below:
|
|
December 31, 2023 |
|
|
North America |
|
|
15,500 |
|
Europe |
|
|
15,000 |
|
International |
|
|
17,500 |
|
Total Employees |
|
|
48,000 |
|
Voluntary turnover excluding TRANZACT employees (rolling 12-month attrition) has continued on a consistent downward trend throughout 2023 (10.8% compared to 15.2% in 2022). This percentage excludes individuals who are hired, but do not commence employment with the Company.
8
Hiring – Hiring in 2023 stabilized with the favorable reduction in attrition, resulting in a decrease year over year.
Hiring and internal movement statistics, summarized below, consistent with prior years excludes colleagues in TRANZACT as the volumes are material and fluctuate significantly in light of the nature of hiring in that business, which is materially dependent on seasonal colleagues:
Inclusion and Diversity (‘I&D’) – We believe that when our individual talents are combined, we unlock our collective potential. We further believe that we are better together because each of us is different. We are taking action that we expect will have the effect of increasing representation and overall diversity throughout our talent pipeline, as reflected in the three focus areas of our ongoing multiyear I&D strategy:
At December 31, 2023, we had the following global female representation, and in the U.S. where we have the most complete data, we had the following ethnic and racial diversity representation:
Colleague Group |
All Colleagues |
|
Senior Leadership (ii) |
Female (global) |
55.0% |
|
32.5% (iii) |
Ethnic and racial diversity (U.S. only) |
|
|
|
Asian |
6.7% |
|
5.6% |
Black |
15.2% |
|
1.6% |
Hispanic |
9.1% |
|
2.8% |
Other non-white (i) |
3.2% |
|
1.5% |
Total |
34.2% |
|
11.5% (iv) |
Our commitment to diversity is also demonstrated by the range of diversity represented on our board, which reflects diversity of gender, ethnicity and nationality, and varied backgrounds and skill sets. As of December 31, 2023, 40% of directors identify as female, 10% as LGBT+ and 10% as Black. In addition, 75% of our board committee chairs are female and 50% identify as Black or LGBT+. Further, 60% of our directors have non-US citizenship.
Additionally, I&D aspirational priorities are included in our executive officers’ overall individual performance objectives and individual efforts are considered as one factor in the determination of their short-term incentive awards. Each year our leaders cascade
9
I&D aspirational priorities throughout the organization, and we continue to reinforce objective and fair processes that aim to mitigate bias in our talent programs and hiring practices. Examples of key activities include:
Total rewards – We invest significant resources in our most important asset, our colleagues, and having the right total rewards programs to support our colleague experience is an important part of our commitment to being the best company we can be. We offer market competitive arrangements in aggregate, aligned to a pay-for-performance culture that delivers optimized value to WTW for the benefit of all our stakeholders, and alongside our colleague experience, positions WTW as a magnet for the most accomplished and aspiring talent in the industry.
Our total rewards comprise a wide array of programs, including pay, benefits, wellbeing, time off, career development opportunities and other aspects of the work environment. At its core, our total rewards programs are designed to:
At WTW, we continually assess our total rewards strategy, seeking to understand colleague preferences to ensure we are investing in rewards that provide the greatest return. Insights gathered from colleague listening inform focus areas and adjustments that align with our grow, simplify, and transform strategic priorities and colleague experience — ensuring we are offering the right mix of meaningful and competitive programs now and in the future to deliver our growth strategy.
Work Styles – We have a flexible and adaptable approach to where colleagues work, aligned to the distinct needs of our businesses and leveraging three distinct working solutions: office-based, hybrid and remote. This framework has flexibility at its core and is based on the principle that the work itself drives where and how the work gets done. In-office interactions are encouraged for all colleagues, with some moving to more frequent and regular in-person collaboration, including minimum in-office requirements in some areas of our business. As we continue to grow, simplify, and transform, WTW Work Styles continues to be a key differentiator for us in the market and is an important part of our ongoing strategy to attract, engage and retain top talent.
The failure to successfully attract and retain qualified personnel could materially adversely affect our results of operations and prospects. For more information see Part I, Item 1A Risk Factors of this Annual Report on Form 10-K.
Competition
We face competition in all fields in which we operate, based on factors including global capability, product breadth, innovation, quality of service and price. We compete with companies such as Aon plc, Arthur J. Gallagher & Co., Brown & Brown Inc., Cognizant Technology Solutions Corporation, Marsh & McLennan Companies, Inc. (‘Marsh & McLennan’) and Robert Half International Inc., as well as with numerous specialty, regional and local firms.
Competition on premium rates has also exacerbated the pressures caused by a continuing reduction in demand in some classes of business. For example, rather than purchase additional insurance through brokers, some insureds have been retaining a greater proportion of their risk portfolios than previously. Industrial and commercial companies increasingly rely upon their own subsidiary insurance companies, known as captive insurance companies, self-insurance pools, risk retention groups, mutual insurance companies and other mechanisms for funding their risks, rather than buy insurance. Additional competitive pressures have arisen and are expected to continue to arise from the entry and expansion of new market participants, such as banks, accounting firms, new brokers and insurance carriers themselves, offering risk management or transfer services.
10
The human capital and risk management consulting industries are highly competitive. We believe we have developed competitive advantages in providing HR consulting and risk management consulting services. We face strong competition from numerous sources, including from large consulting firms, accounting firms and specialized firms focused on these services as further identified below. See Part I, Item 1A Risk Factors – ‘Demand for our services could decrease for various reasons, including a general economic downturn, increased competition, or a decline in a client’s or an industry’s financial condition or prospects, all of which could substantially and negatively affect us’, for a description of competition-related risks that may affect demand for the Company’s services.
Our largest competitors in the pension consulting industry are Mercer HR Consulting (a Marsh & McLennan company) and Aon plc. In addition, we face vigorous competition from numerous other companies in the global HR consulting industry.
Our major competitors in the insurance consulting and software industry include Milliman, Oliver Wyman (a Marsh & McLennan company), the big four accounting firms (Deloitte LLP, Ernst & Young, PricewaterhouseCoopers, and KPMG), and SunGard. Aon plc, Buck Consultants (an HIG Capital Company), Connextions (a United Healthcare company), Mercer (a Marsh & McLennan company), Automatic Data Processing and Fidelity are among our largest competitors in the insurance exchange industry. With the implementation of the Patient Protection and Affordable Care Act, we also compete with the public exchanges currently run by the U.S. federal, and state governments. We also compete with providers of account-based health plans and consumer-directed benefits such as WageWorks and HealthEquity.
The market for our services is subject to change as a result of economic, regulatory and legislative changes, technological developments, and increased competition from established and new competitors. Regulatory and legislative actions, along with continuously evolving technological developments, will likely have the greatest impact on the overall market for our exchange products. See Part I, Item 1A Risk Factors – ‘Our business will be negatively affected if we are not able to anticipate and keep pace with rapid changes in government laws or regulations, or if government laws or regulations decrease the need for our services, increase our costs or limit our compensation’ and related risk factors for a description of legal, non-financial/-regulatory and compliance risks to the Company.
We believe the primary factors in selecting an HR consulting or risk management services firm include reputation; the ability to provide measurable increases to shareholder value and return on investment; geographic scope; quality of service; and the ability to tailor services to clients’ unique needs.
With regard to the marketplace for individuals and active employee exchanges, we believe that clients base their decisions on a variety of factors that include the ability of the provider to deliver measurable cost savings, a strong reputation for efficient execution, a provider’s capability in delivering a broad number of configurations to serve various population segments, and an innovative service delivery model and platform.
For our traditional consulting and risk management services and the rapidly evolving exchange products, we believe we compete favorably with respect to these factors.
Regulation
Our business activities are subject to legal requirements and governmental and quasi-governmental regulatory supervision in all countries in which we operate. Also, such regulations may require individual or company licensing to conduct our business activities. While these requirements may vary from location to location, they are generally designed to protect our clients by establishing minimum standards of conduct and practice, particularly regarding the provision of advice and product information, as well as financial criteria. We are also subject to data privacy regulations that apply to health, medical, financial and other types of personal information belonging to our employees, clients and their employees and other third parties across most jurisdictions, including, among others, the E.U. and U.K. General Data Protection Regulations, the Personal Information Protection Law (‘PIPL’) in China and privacy legislation in certain U.S. states, including the California Privacy Rights Act (‘CPRA’). Sustainable investing and environmental, social and governance initiatives continue to be the focus of increased regulatory scrutiny across jurisdictions, with emerging regulation of greenhouse gas emissions and disclosures of their impact on the climate, including in the state of California, proposed rules of the U.S. Securities and Exchange Commission, the Corporate Sustainability Reporting Directive and other regulations across the E.U. Across many jurisdictions we are subject to various financial crime laws and regulations through our activities, activities of associated persons, the products and services we provide and our business and client relationships. Such laws and regulations relate to, among other areas, sanctions and export control, anti-bribery, anti-corruption, anti-money-laundering and counter-terrorist financing. Similarly, we are subject in many jurisdictions to antitrust laws, which are designed to promote robust competition in the markets in which we participate.
11
Our most significant regulatory regions are further described below:
United States
Our activities in connection with insurance brokerage services within the U.S. are subject to regulation and supervision by state authorities. Although the scope of regulation and form of supervision may vary from state to state, insurance laws in the United States are often complex and generally grant broad discretion to supervisory authorities in adopting regulations and supervising regulated activities. That supervision generally includes the licensing of insurance brokers and agents and the regulation of the handling and investment of client funds held in a fiduciary capacity. Our continuing ability to provide insurance brokerage in the states in which we currently operate is dependent upon our compliance with the rules and regulations promulgated by the regulatory authorities in each of these states. Additionally, some of our private exchange activities, including our TRANZACT business which focuses on direct-to-consumer Medicare policy sales, are overseen by the Centers for Medicare & Medicaid Services (‘CMS’), which is part of the U.S. Department of Health and Human Services. See Part I, Item 1A Risk Factors under the heading ‘Our business will be negatively affected if we are not able to anticipate and keep pace with rapid changes in government laws or regulations, or if government laws or regulations decrease the need for our services, increase our costs or limit our compensation’ for a description of the risks related to our private exchange activities.
Furthermore, certain of our activities are subject to regulation under the Health Insurance Portability and Accountability Act (‘HIPAA’), which is enforced by the Office for Civil Rights within the Department of Health and Human Services. As we implement and expand our direct-to-consumer sales and marketing solutions through our Benefits Delivery & Administration business, we are subject to various federal and state laws and regulations that prescribe when and how we may market to consumers (including, without limitation, the Telephone Consumer Protection Act and other telemarketing laws and the Medicare Communications and Marketing Guidelines issued by the Center for Medicare Services).
Certain of our activities are governed by other regulatory bodies, such as investment and securities licensing authorities. Our activities in connection with investment services within the United States are subject to regulation and supervision at both the federal and state levels. At the federal level, certain of our operating subsidiaries are regulated by the SEC through the Investment Company Act of 1940 and the Investment Advisers’ Act of 1940 and by the Department of Labor through the Employee Retirement Income Security Act, or ERISA. In connection with the SEC regulations, we are required to file certain reports, and are subject to various marketing restrictions, among other requirements. In connection with ERISA regulations, we are limited in the actions we can take for plans for which we serve as fiduciaries, among other matters. Our U.S. investment activities are also subject to certain state regulatory schemes, and some activities also are subject to regulation by the Commodities and Futures Trading Commission under the Commodities Exchange Act.
Our activities in connection with Third Party Administrator (‘TPA’) services in the United States are also subject to regulation and supervision by many state authorities. Licensing requirements and supervision vary from state to state. As with insurance brokerage services, our continuing ability to provide these services in states that regulate our activities is dependent upon our compliance with the rules and regulations promulgated from time to time by the regulatory authorities in each of these states.
United Kingdom
In the U.K., our business is regulated by the Financial Conduct Authority (‘FCA’).
The FCA has a sole strategic objective: to ensure that the relevant markets function well. Its operational objectives are to secure an appropriate degree of protection for consumers, to protect and enhance the integrity of the U.K. financial system, and to promote effective competition in the interests of consumers. The FCA has a wide range of rule-making, investigatory and enforcement powers (including the power to censure and fine) and conducts monitoring visits to assess our compliance with regulatory requirements. In addition, the FCA extended the Senior Managers and Certification Regime (‘SMCR’) which became effective on December 9, 2019 in relation to our U.K. FCA-regulated businesses. The SMCR is designed to drive improvements in culture and governance within financial services firms and to deter misconduct by increasing individual accountability to the FCA.
New regulations and modifications to existing regulations that are specific to the U.K. have and will continue to result in differences from the regulatory requirements of the E.U. See Part I, Item 1A Risk Factors, for a description of Brexit-related risks to the Company.
Furthermore, as a result of Brexit, the WTW Brexit broking solution (the U.K. branch of Willis Towers Watson SA/NV) was required to seek authorization from the FCA as a third country branch. Full authorization was granted by the FCA on September 29, 2023 following completion of the application process. As a result of full FCA authorization, the branch is no longer operating under the FCA’s Temporary Permissions Regime. The branch is therefore subject to requirements in key areas such as SMCR and continues to be subject, in addition, to the supervisory oversight of the Belgian Financial Services & Markets Authority.
12
European Union
In 2005, the European Union Insurance Mediation Directive introduced rules to enable insurance and reinsurance intermediaries to operate and provide services within each member state of the E.U. on a basis consistent with the E.U. single market and customer protection aims. Each E.U. member state in which we operate is required to ensure that the insurance and reinsurance intermediaries resident in their country are registered with a statutory body in that country and that each intermediary meets professional requirements in relation to their competence, good repute, professional indemnity cover and financial capacity. The E.U. issued an additional Insurance Distribution Directive that expands the 2005 directive, and all E.U. member states in which we operate were required to enact the directive and adopt local country laws by October 1, 2018.
Certain of our entities that undertake pension scheme management are subject to MiFID (Markets in Financial Instruments Directive) and MiFIR (the Markets in Financial Instruments Regulation). In addition, revisions to MiFID (‘MiFID II’) took effect in January 2018. These revisions are aimed at strengthening investor protection and improving the function of financial markets. MiFID II imposes a variety of requirements that include, among others, rules relating to product governance and independent investment advice, responsibility of management bodies, inducements, information and reporting to clients, cross-selling, remuneration of staff, and best execution of trades for clients. Further, some of our entities are also authorized and regulated by certain financial services authorities in countries such as Sweden, Ireland, the Netherlands and the U.K.
Other
All companies carrying on similar activities discussed above in a given jurisdiction are subject to regulations which are not dissimilar to the requirements for our operations in the U.S. and U.K. We do not consider these regulatory requirements as adversely affecting our competitive position.
Our failure, or that of our employees, to satisfy the regulatory compliance requirements or the legal requirements governing our activities, can result in disciplinary action, fines, reputational damage and financial harm.
See Part I, Item 1A Risk Factors, for an analysis of how actions by regulatory authorities or changes in legislation and regulation as well as compliance with evolving laws, including with respect to data privacy and cybersecurity, in the jurisdictions in which we operate may have an adverse effect on our business.
Information about Executive Officers of the Registrant
The executive officers of the Company as of February 22, 2024 were as follows:
Kristy D. Banas (age 52) - Ms. Banas has served as Chief Human Resources Officer since August 16, 2021, and also oversees marketing and communication functions. She served as the Senior Director, Global Talent Advisor for Human Capital & Benefits from March 2019 to August 2021 and as Senior Director and Head of Global Total Rewards, HR Integration and the HR Business Office from November 2016 to March 2019. From January 2016 to November 2016, Ms. Banas served as Senior Director and Global HR Leader, WTW Operations and Technology. From July 2011 to January 2016, Ms. Banas served as Senior Vice President, Global HR Director for WTW Corporate Functions, and was the Executive HR Sponsor for Global Operations Improvement. Ms. Banas was Vice President and Global HR Partner with XL Capital / XL Global Services / XL Insurance from November 2001 to June 2011. Ms. Banas has a BS in Business Management from Fairfield University and a partial MS in Human Resource Management from the University of Connecticut.
Alexis Faber (age 46) - Ms. Faber has served as Chief Operating Officer at WTW since August 30, 2021. Previously, she served as Chief Operating Officer for Corporate Risk & Broking from March 2018 to August 2021. Prior to that, Ms. Faber served as Global Head of Financial Lines since January 2016, Head of FINEX for North America since April 2014, Risk Control and Claim Advocacy Practice Leader for North America since July 2012, Chief Operating Officer for Willis North America since August 2009 and as Chief Operating Officer for the Executive Risks practice since September 2006. Prior to that, Ms. Faber served as Regional Finance Officer for North America since July 2004, and as Financial and Operations Controller for Global Specialties, North America since August 2003. Before joining WTW, Ms. Faber worked in investment banking at Schroder Salomon Smith Barney and at Citigroup. Ms. Faber holds a bachelor’s degree in economics from Williams College and an M.B.A from Columbia Business School.
Matthew S. Furman (age 54) - Mr. Furman has served as General Counsel at WTW since January 4, 2016. Previously, Mr. Furman served as Executive Vice President and Group General Counsel at Willis Group Holdings, where he was a member of the Operating Committee since April 2015. From 2007 until March 2015, Mr. Furman was Senior Vice President, Group General Counsel-Corporate and Governance, and Corporate Secretary for The Travelers Companies, Inc. From 2000 until 2007, Mr. Furman was an attorney at Goldman, Sachs & Co. in New York, where he was Vice President and Associate General Counsel in the finance and corporate legal group. Prior to that, he was in private practice, with almost six years’ experience at Simpson Thacher & Bartlett in New York. Mr. Furman also serves as a Trustee of the Jewish Theological Seminary and a Director of the Legal Aid Society. He previously served as a member of the U.S. Securities and Exchange Commission’s Investor Advisory Committee, where he served on the Executive
13
Committee and chaired the Market Structure Subcommittee. He holds a bachelor’s degree magna cum laude from Brown University and a law degree magna cum laude from Harvard Law School.
Adam L. Garrard (age 58) - Mr. Garrard has served as Head of Risk and Broking since January 1, 2022. In the third quarter of 2024, Mr. Garrard will assume the role of chairman, Risk and Broking. Previously, Mr. Garrard served as Head of Corporate Risk and Broking, and International since August 14, 2019 and, prior to that, as Head of International at WTW since January 4, 2016. Previously, Mr. Garrard served as Chief Executive Officer for Willis Group Holdings in Asia since September 2012. Prior to that, Mr. Garrard served as Chief Executive Officer for Willis in Europe since January 2009, Chief Executive Officer for Willis in Australasia since May 2005 and Chief Executive Officer for Asia since January 2002. Mr. Garrard has resided in Singapore, Shanghai, Sydney and London while undertaking his Chief Executive Officer roles. Prior to joining WTW in 1994, Mr. Garrard started his insurance career at SBJ Stephenson Insurance Brokers in 1992 as a graduate trainee. He holds a bachelor’s degree in business administration from De Montfort University.
Julie J. Gebauer (age 62) - Ms. Gebauer has served as Head of Health, Wealth and Career at WTW since January 1, 2022. Previously, Ms. Gebauer served as Head of Human Capital & Benefits at WTW since January 4, 2016 and, prior to that, as Managing Director of Towers Watson’s Talent and Rewards business segment since January 1, 2010. Beginning in 2002, Ms. Gebauer served as a Managing Director of Towers Perrin and led Towers Perrin’s global Workforce Effectiveness practice and the global Towers Perrin-International Survey Research Corporation line of business. Ms. Gebauer was a member of Towers Perrin’s board of directors from 2003 through 2006. She joined Towers Perrin in 1986 as a consultant and held several leadership positions at Towers Perrin, serving as the Managing Principal for the New York office from 1999 to 2001 and the U.S. East Region Leader for the Human Capital Group from 2002 to 2006. Ms. Gebauer is a Fellow of the Society of Actuaries. Ms. Gebauer graduated Phi Beta Kappa and with high distinction from the University of Nebraska-Lincoln with a bachelor’s degree in mathematics and was designated a Chancellor’s Scholar.
Carl A. Hess (age 62) - Mr. Hess has served as Chief Executive Officer at WTW since January 1, 2022 and, prior to that, served as President since August 16, 2021. Mr. Hess was formerly Head of Investment, Risk and Reinsurance from October 27, 2016 to August 16, 2021. Previously, Mr. Hess served as the Co-Head of North America at WTW since January 4, 2016. Prior to that, Mr. Hess served as Managing Director, The Americas of Towers Watson since February 1, 2014, and before that, he served as the Managing Director of Towers Watson’s Investment business since January 1, 2010. Before his service at Towers Watson, Mr. Hess worked in a variety of roles for over 20 years at Watson Wyatt, lastly as Global Practice Director of Watson Wyatt’s Investment business. Mr. Hess is a Fellow of the Society of Actuaries and the Conference of Consulting Actuaries and a Chartered Enterprise Risk Analyst. He has a bachelor’s degree cum laude in logic and language from Yale University.
Andrew J. Krasner (age 48) - Mr. Krasner has served as Chief Financial Officer at WTW since September 7, 2021. From February 2021 to August 2021, Mr. Krasner served as Chief Financial Officer for Assured Partners. From June 2018 to January 2021, Mr. Krasner was Global Treasurer and Head of M&A of WTW, and from 2012 to June 2018, was Head of M&A, responsible for the M&A, joint venture, divestiture, and strategic investment activity. Mr. Krasner started with Legacy Willis in June 2009 as Senior Vice President, working on the client side with Willis Capital Markets & Advisory between June 2009 to June 2012. Prior to joining WTW, Mr. Krasner was a Principal with Banc of America Securities from October 2003 to June 2009, an Associate with Deutsche Bank from July 2002 to October 2003 and a Senior Associate with PricewaterhouseCoopers from August 1997 to August 2000. Mr. Krasner has a B.S. degree in applied economics and business management and an M.B.A. with distinction from Cornell University. He is also a Certified Public Accountant.
Anne Pullum (age 41) - Ms. Pullum has served as Head of Europe at WTW since August 30, 2021 and, prior to that, as Head of Western Europe from May 31, 2019 to August 30, 2021. Previously, she served as the Chief Administrative Officer and Head of Strategy and Innovation since October 27, 2016. Beginning on January 4, 2016, Ms. Pullum served as WTW’s Head of Strategy, where she has played a key role in determining the Company’s strategy and worked across all business segments and functional areas. Previously, Ms. Pullum served as the Head of Strategy for Willis Group since May 2014. Before joining Willis, Ms. Pullum worked at McKinsey & Company, where she served financial services and natural resource clients since October 2010. Prior to that, Ms. Pullum conducted economic research at Greenspan Associates in Washington, D.C. and served as an analyst in the Goldman Sachs Equities Division in London. Ms. Pullum holds an M.B.A. from INSEAD and a bachelor’s degree in international economics from Georgetown University’s School of Foreign Service.
Imran Qureshi (age 53) - Mr. Qureshi has served as Head of North America at WTW since August 30, 2021. Prior to that, he served as the Co-Leader, U.S. from February 2017 to August 30, 2021. He also chaired the North American Inclusion & Diversity Council during this time. He served as Region Leader, U.S. Midwest from February 2017 to October 2019, and was Market Leader, Greater Chicago and Wisconsin from February 2016 to February 2017. Mr. Qureshi was Managing Consultant of the Chicago office from January 2013 to January 2016, and has been with WTW in other roles since March 1999. Mr. Qureshi is currently a board director at Smithbucklin and The Executives' Club of Chicago. Previously, he was the board chair of the Human Resources Management Association of Chicago, and he served on the M&A Faculty of WorldatWork where he taught M&A and taught the International
14
Benefits Course for the International Foundation of Employee Benefit Plans. In 2004, Mr. Qureshi was honored by Business Insurance magazine as one of “40 Under 40 People to Watch” in the commercial insurance and risk/benefits management services industries. He also has lectured on governance and globalization at The Kellogg School of Management at Northwestern University and The University of Chicago Booth School of Business. Mr. Qureshi holds a bachelor’s degree in pure mathematics and statistics with honors from the University of Manchester in the U.K. and has an actuarial background.
Pamela Thomson-Hall (age 55) - Ms. Thomson-Hall has served as the Head of International at WTW since August 30, 2021. Previously, she served as Head of CEEMEA since July 2018, Managing Director of International since January 2017 and Chief of Staff of International since January 2016. Prior to that, Ms. Thomson-Hall served as Program Director for business integration since September 2014 and before that, as General Counsel of International since April 1999. Prior to joining WTW, Ms. Thomson-Hall worked as a solicitor for Clyde & Co and DLA Piper. Ms. Thomson-Hall holds an LLB from the University College London and completed her LPC at the College of Law.
Board of Directors
A list of the members of the board of directors of the Company as of this date of this Annual Report on Form 10-K and their principal occupations are provided below:
Carl Hess |
|
Dame Inga Beale |
|
Fumbi Chima |
Chief Executive Officer |
|
Former Chief Executive Officer of Lloyd’s of London |
|
Former Executive Vice President and Chief Information Officer of Boeing Employees’ Credit Union |
|
|
|
|
|
Stephen Chipman |
|
Michael Hammond |
|
Jacqueline Hunt |
Former Chief Executive Officer of Grant Thornton LLP |
|
Former Chief Executive Officer and Chair, Lockton International Holdings Ltd. |
|
Former Chief Executive Officer of Prudential UK, Europe and Africa |
|
|
|
|
|
Paul Reilly |
|
Michelle Swanback |
|
Paul Thomas |
Chief Executive Officer and Chair of Raymond James Financial |
|
Chief Executive Officer, TTEC Engage, and President of TTEC Holdings, Inc. |
|
Former Chief Executive Officer of Reynolds Packaging Group |
|
|
|
|
|
Fredric Tomczyk |
|
|||
Chief Executive Officer of Cboe Global Markets, Inc. |
|
|||
15
ITEM 1A. RISK FACTORS
Executive Summary of Risk Factors
The following contains a summary of each of our risk factors. For the complete disclosure of each risk factor contained herein, please click on the respective summary.
Strategic and Operational Transformation Risks
Business Environment Risks
Human Capital Risks
Intellectual Property, Technology, Cybersecurity and Data Protection Risks
16
Legal, Non-Financial/Regulatory and Compliance Risks
Financial and Related Regulatory Risks
Tax Risks
Risks Related to Being an Irish-Incorporated Company
17
RISK FACTORS
Our financial performance, including our business results, financial condition, result of operations, cash flows and price of our ordinary shares, is subject to various risks and uncertainties, including as described in this Item 1A of Part I of our Annual Report on Form 10-K. In addition to the factors discussed elsewhere in this Annual Report on Form 10-K, the following are some of the important factors that could cause our actual results to differ materially from those projected in any forward-looking statements. These risk factors should be carefully considered in evaluating our business. The descriptions below are not the only risks and uncertainties that we face. Additional risks and uncertainties that are presently unknown to us could also impair our business operations, financial condition or results. If any of the risks and uncertainties below or other risks were to occur, our business operations, financial condition or results of operations could be materially and adversely impacted. Risks in this section are grouped into categories; the headings of these categories are inserted for convenience of reference only and are not intended to be a part of or to affect the meaning or interpretation of any of the risk factors described herein. Many risks affect more than one category, and the risks are not in order of significance or probability of occurrence solely because they have been grouped by categories. With respect to the tax-related consequences of acquisition, ownership, and disposal of ordinary shares, you should consult with your own tax advisors.
Strategic and Operational Transformation Risks
Our success largely depends on our ability to achieve our global business strategy as it evolves, and our results of operations and financial condition could suffer if the Company were unable to successfully establish and execute on its strategy and generate anticipated revenue growth and cost savings and efficiencies.
Our future growth, profitability, and cash flows largely depend upon our ability to successfully establish and execute our global business strategy. As discussed under Item 1, ‘Business - Business Strategy’, we seek to be an advisory, broking and solutions provider of choice through an integrated global platform. While we have confidence that our strategic plan reflects opportunities that are appropriate and achievable, there is a possibility that our strategy may not deliver projected long-term growth in revenue and profitability due to inadequate execution, incorrect assumptions, global or local economic conditions, competition, changes in the industries in which we operate, sub-optimal resource allocation or any of the other risks described in this ‘Risk Factors’ section. In addition, our strategy continues to evolve, and it is possible that we will be unable to successfully execute the associated strategy changes, due to factors discussed above or elsewhere in this ‘Risk Factors’ section. In pursuit of our growth strategy, we may also invest significant time and resources into new product or service offerings, as well as investments in technology and infrastructure to support these offerings, and there is the possibility that we may not realize our expected return on these offerings or that these offerings may fail to yield sufficient return to cover the cost of investment. The failure to continually develop and execute optimally on our global business strategy could have a material adverse effect on our business, financial condition and results of operations.
We may not be able to fully realize the anticipated benefits of our growth strategy or our expected product, service, and transaction pipelines.
We have stated certain financial goals through the end of fiscal 2024, including with respect to our cash flows, our growth and margin targets, and our share repurchases. We have stated, and may in the future state, other goals for 2024 or future periods. Our initiatives aiming to implement our targets and future financial objectives pose potential operational risks and may result in distraction of management and colleagues. We cannot be certain whether we will be able to realize benefits from current revenue-generating or cost-saving initiatives, including our Transformation program, and ultimately realize our strategic objectives. In addition, costs necessary to realize the savings benefits of such initiatives may be greater, or require more time, than originally projected. There can be no assurance that our actual results will meet our stated financial goals.
In addition, our pipeline estimates may prove to be unreliable either in a particular quarter or over a longer period of time. Should we be unable to succeed in our initiatives to drive growth and achieve our stated financial targets, we may have to delay, scale back or discontinue the development, deployment and commercialization of our products or services or delay our efforts to expand our transaction pipeline. As a result, our ability to deliver continued sustainable and profitable growth may be negatively impacted and financial performance across our segments and geographies may be adversely affected.
Our ability to successfully manage ongoing organizational changes could impact our business results, where the level of costs and/or disruption may be significant and change over time, and the benefits may be less than we originally expect.
We have in the past few years undergone several significant business and organizational changes, including multi-year operational transformation programs and a new management and organizational structure, among others. There are also a number of other initiatives planned or ongoing to transform and update our systems and processes and gain efficiencies. In addition, our strategy continues to evolve, and such evolution may result in further organizational changes or more or different investments than we currently anticipate. In connection with all these changes, we may manage a number of large-scale and complex projects. Such projects may include multiple and connected phases, many of which may be dependent on factors that are outside of our control. While we plan to undertake these types of large, complex projects based on our determination that each is necessary or desirable for
18
the execution of the Company’s business strategy, we cannot guarantee that the collective effect of all of these projects will not adversely impact our business or results of operations or that the benefits will be as we originally expected. Effectively managing these organizational changes (including ensuring that they are implemented on schedule, within budget and without interruption to the existing business, or that transitions to new systems do not create significant control vulnerabilities during the period of transition) is critical to retaining talent, servicing clients and our business success overall. We may have difficulty attracting, training, and retaining the talent that we need to successfully manage this change. Further, many of the risks described herein increase during periods of significant organizational change and transformation. The failure to effectively manage such risks could adversely impact our resources or business or financial results.
Our growth strategy depends, in part, on our ability to make acquisitions or grow our business organically. We face risks when we acquire or divest businesses, and we could have difficulty in acquiring, integrating or managing acquired businesses, or with effecting internal reorganizations, all of which could harm our business, financial condition, results of operations or reputation.
Our growth depends in part on our ability to make acquisitions and grow organically. We may not be successful in identifying appropriate acquisition and disposition candidates or consummating acquisitions on terms acceptable or favorable to us. We also face additional risks related to acquisitions, including the ability to negotiate transactions on favorable terms, the ability to secure regulatory approval of transactions where required, the ability to successfully integrate them into our existing businesses and culture, and the potential that any acquired business could significantly underperform relative to our expectations. In addition, we may not repurchase as many of our outstanding shares as anticipated due to our acquisition activity or investment opportunities, as well as other market or business conditions. If we are unable to identify and successfully make, integrate and manage acquisitions, our business could be materially adversely affected. In addition, we face risks related to divesting businesses, including that we may not receive adequate consideration in return for the divested business, we may continue to be subject to the liabilities of the divested business after its divestiture (including with respect to work we might have performed on behalf of the divested business), and we may not be able to reduce overhead or redeploy assets or retain colleagues after the divestiture closes. For example, we completed the divestiture of the Willis Re business to Gallagher in 2022 which gives rise to such risks including those risks associated with managing transition arrangements.
In addition, we cannot be certain that our acquisitions will be accretive to earnings or that our acquisitions or divestitures will otherwise meet our operational or strategic expectations. Acquisitions involve special risks, including the potential assumption of unanticipated liabilities and contingencies and difficulties in integrating acquired businesses, and acquired businesses may not achieve the levels of revenue, profit, or productivity we anticipate or otherwise perform as we expect. In addition, if the operating performance of an acquired business deteriorates significantly, we may need to write down the value of the goodwill and other acquisition-related intangible assets recorded on our consolidated balance sheet.
Beyond inorganic acquisition activity, we may further our organic growth strategy by entering into lines of business or by offering new products and services within existing lines of business. These lines of business, products and services present us with additional risks, particularly in instances where the markets are heavily regulated, meaningfully competitive with high bars to entry, or new or not fully developed. Such risks include the investment of significant time and resources; the possibility that these efforts will not be successful and could result in reputational damage to us; the possibility that the marketplace does not accept our products or services or that we are unable to retain clients that adopt our new products or services; and the risk of new or additional liabilities associated with these efforts, including potential E&O or other claims. In addition, many of the businesses that we acquire and develop will likely have significantly smaller scales of operations prior to the implementation of our growth strategy. External factors, such as compliance with new or revised regulations, competitive alternatives and shifting market preferences may also impact the successful implementation of a line of business, product or service.
We may be unable to effectively integrate an acquired business into our organization and may not succeed in managing such acquired businesses or the larger company that results from such acquisitions. The process of integrating an acquired business may subject us to a number of risks, including, without limitation, an inability to retain the management, key personnel and other colleagues of the acquired business; an inability to establish uniform standards, controls, systems, procedures and policies or to achieve anticipated savings; and exposure to legal claims or regulatory censure for activities of the acquired business prior to acquisition.
With respect to any such acquisition transactions, we face the risk related to the potential impacts of the transaction and integration on relationships, including with colleagues, correspondents, suppliers, clients and competitors, as well as the risk related to contingent liabilities (including litigation) potentially creating material liabilities for the Company. The following risks, in addition to those described above, may also adversely affect our ability to successfully implement and integrate these acquisitions: material changes in U.S. and foreign jurisdiction regulations (including those related to the healthcare system and Medicare and insurance brokerage, pension advisory, and investment services); changes in general economic, business and political conditions in relevant markets, including changes in the financial markets; significant competition in the marketplace; and compliance with extensive and evolving government regulations in the U.S. and in foreign jurisdictions.
19
If acquisitions or entry into businesses, products or services are not successfully integrated and the intended benefits of the acquisitions or business developments are not achieved, our business, financial condition and results of operations could be materially adversely affected, as well as our professional reputation. We also own an interest in a number of associates and companies where we do not exercise management control and we are therefore limited in our ability to direct or manage the business to realize the anticipated benefits that we could achieve if we had full ownership.
The sale of Willis Re to Gallagher, including transitional arrangements, creates incremental business, operational, regulatory and reputational risks.
The completion of the agreed-upon transaction to sell our Willis Re business to Gallagher, which has occurred in all jurisdictions globally, entails important risks, including, among others: the risk that the post-closing transition arrangements, which are complex, may impose costs or liabilities or may give rise to errors in execution, be distracting to our management, or cause disruption to our business or our relationships with clients, colleagues, suppliers, regulators, competitors, and other third parties; the risk that the triggers for the potential earnout payment may not be met; the risk that transaction and/or transition costs may be greater than expected, including as a result of the complexity of the transition arrangements in domestic and international jurisdictions across the globe; the risk that litigation associated with the Gallagher transaction or with contingent liabilities we have retained, if any, may arise; and other risks in this Annual Report on Form 10-K and in our other SEC filings.
Our business performance and growth plans could be negatively affected if we are not able to develop and implement improvements in technology and effectively apply technology, data and analytics to drive value for our clients through technology-based solutions or gain internal efficiencies through the effective application of technology, analytics and related tools.
Our success depends, in part, on our ability to develop and implement technology, data and analytic solutions that anticipate, lead, or keep pace with rapid and continuing changes in technology both for internal operations and for maintaining industry standards and meeting client preferences. We may not be successful in anticipating or responding to these developments in a timely and cost-effective manner or in attracting and maintaining personnel with the necessary skills in this area. Additionally, our ideas may not lead to the desired internal efficiencies or be accepted in the marketplace. In addition, we may not be able to implement technology-based solutions as quickly as desired if, for example, greater resources are required than originally expected or resources are otherwise needed elsewhere. The effort to gain technological and data expertise and develop new technologies or analytic techniques in our business requires us to incur significant cost and attract qualified technical talent who are in high demand. Our competitors are seeking to develop competing or new technologies, and their success in this space may impact our ability to differentiate our services to our clients through the use of unique technological solutions. For example, incorporating artificial intelligence into certain product offerings may become more important in our operations over time. If we fail to keep pace with rapidly evolving artificial intelligence technological developments, our competitive position and business results may be negatively impacted. In certain cases, we may decide, based on perceived business needs, to make investments that may be greater than we currently anticipate. If we cannot offer new technologies or data and analytic services or solutions as quickly or effectively as our competitors, or if our competitors develop more cost-effective technologies or analytic tools, it could have a material adverse effect on our ability to obtain and complete client engagements.
We depend on our technology systems for conducting business, as well as for providing the data and analytics we use to manage our business. As a result, our business success is dependent on maintaining the effectiveness of existing technology systems and on continuing to develop and enhance technology systems that support our business processes and strategic initiatives in a cost- and resource-efficient manner, particularly as our business processes become more digital.
We have a number of strategic initiatives involving investments in technology and infrastructure to support our own systems as well as partnerships with technology companies as part of our Transformation program and as a subset of our overall growth strategy. These investments may be costly and require significant capital expenditures and/or may not be profitable or may be less profitable than what we have experienced historically. In addition, investments in technology systems may not deliver the benefits or perform as expected or may be replaced or become obsolete more quickly than expected, which could result in operational difficulties or additional costs. If we do not keep up with technological changes or execute effectively on our strategic initiatives, our business and results of operations could be adversely impacted.
As part of our efforts to enhance our technological capabilities, from time to time, we may utilize artificial intelligence, machine learning, data analytics, and similar tools that collect, aggregate and analyze data (collectively, ‘Data Tools’). There are significant risks involved in utilizing Data Tools and no assurance can be provided that the usage of such Data Tools will enhance our business or assist us in being more efficient or profitable. While Data Tools may improve the efficiency of data analytics and reduce certain costs, there is no assurance that the expenses related to Data Tools directly or indirectly borne by us will outweigh such reduced investment costs or outweigh such risks. In addition, the use of Data Tools may enhance cybersecurity risks and operational and technological risks. The technologies underlying Data Tools and their use cases are rapidly developing, and remain subject to existing laws, including privacy, consumer protection and federal equal opportunity laws. As a result, it is not possible to predict all of the legal,
20
operational or technological risks related to the use of Data Tools. Moreover, Data Tools are the subject of evolving review by various regulatory agencies, including the SEC and the U.S. Federal Trade Commission, and changes in the regulation of the use of Data Tools may adversely affect our ability to use them in a manner that is cost- and resource-effective. For further discussion of risks relating to these technology systems, please see ‘Data and cybersecurity breaches or improper disclosure of confidential company or personal data could result in material financial loss, regulatory actions, reputational harm, and/or legal liability’ below.
Business Environment Risks
Macroeconomic trends, including inflation, changes in interest rates and trade policies, as well as political events, trade and other international disputes, war, terrorism, natural disasters, public health issues and other business interruptions, can adversely affect our business, results of operations or financial condition.
Global economic events and other factors, such as accommodative monetary and fiscal policy and the impacts of the COVID-19 pandemic, have contributed to significant inflation in many of the markets in which we operate. In particular, recently inflation in the United States, Europe and other geographies had risen to levels not experienced in recent decades and we have and may see its impact on various aspects of our business, which in some cases have, or could in the future, negatively affect our business and financial condition. In order to combat inflation and restore price stability, a number of central banks around the world have raised interest rates and may continue to do so in 2024. Increased inflation and the fluctuation of interest rates may hinder the economic growth in a number of markets where we do business, and has had, and may continue to have, far-reaching effects on the global economy. Weakness in the economy and the possibility of a global recession has had, and may continue to have, a negative effect on our business and financial condition, including on the value of our ordinary shares.
Moreover, U.S. and global economic conditions have created market uncertainty and volatility. Such general economic conditions, such as inflation, stagflation, political volatility, costs of labor, cost of capital, interest rates and tax rates, affect our operating and general and administrative expenses, and we have no control or limited ability to control such factors. If our costs grow significantly in excess of our ability to raise revenue, our margins and results of operations may be materially and adversely impacted and we may not be able to achieve our strategic and financial objectives. These conditions also affect our clients’ businesses and the markets that they serve and may reduce demand for our services, increase demands for pricing accommodations or cause a higher rate of delays in the collection of, or losses on, our accounts receivable, which could adversely affect our results of operations.
Major public health issues, including the COVID-19 pandemic, have adversely affected, and could in the future materially adversely affect our business, results of operations or financial condition. The COVID-19 pandemic disrupted certain aspects of our business and the businesses of our clients, third-party vendors, business partners and others, in every geography in which we operate and the ultimate extent of its impact on us, how we operate and our results, will depend on future developments that we are unable to predict. Public health issues could continue to disrupt, possibly materially, our business operations and services that we provide or impact our business operations and results in the future.
Additionally, U.S. and global markets are affected by geopolitical conflict in highly unpredictable ways and are currently experiencing volatility and disruption as a result of the war between Russia and Ukraine and the Israel-Hamas war. These ongoing wars and other geopolitical conflicts could lead to further market disruptions and could have a material adverse effect on our business, prospects, financial condition, and operating results as further discussed in ‘Our business, financial condition, results of operations, and long-term goals may continue to be adversely affected, possibly materially, by negative impacts on the global economy and capital markets resulting from wars or any other geopolitical tensions’ below.
Further, the continued slowdown in the global economy, including a recession, or in a particular region or industry, inflation or a tightening of the credit markets could negatively impact our business, financial condition and liquidity, including our ability to continue to access preferred sources of liquidity when we would like, and our borrowing costs could increase. In particular, further tightening of the credit markets could limit our ability to obtain external financing to fund our operations and capital expenditures, if and when needed. In addition, we could experience losses on our holdings of cash and investments due to failures of financial institutions and other parties. Thus, a deterioration or prolonged period of negative or stagnant macroeconomic conditions in the U.S. and globally could adversely affect our business, results of operations or financial condition.
21
Demand for our services could decrease for various reasons, including a general economic downturn, increased competition, or a decline in a client’s or an industry’s financial condition or prospects, all of which could substantially and negatively affect us.
The demand for our services may not grow or be maintained, and we may not be able to compete successfully with our existing competitors, new competitors or our clients’ internal capabilities. Client demand for our services may change based on the clients’ needs and financial conditions, among other factors.
Our results of operations are affected directly by the level of business activity of our clients, which in turn is affected by the level of economic activity in the industries and markets that they serve. For example, any changes in U.S. trade policy (including any increases in tariffs that result in a trade war), recessionary conditions in some of the markets where we do business, inflationary conditions, ongoing stock market volatility or an increase in, or unmet market expectations with respect to, interest rates could adversely affect the general economy. As a result, global financial markets may continue to experience disruptions, including increased volatility and reduced credit availability, which could substantially impact our results. Likewise, the lingering effects of the COVID-19 pandemic and related economic disruptions have impacted and could have a material adverse impact on global demand from our clients, as well as our operations as discussed elsewhere in this report. While it is difficult to predict the consequences of any deterioration in global economic conditions on our business, any significant reduction or delay by our clients in purchasing our services or insurance or making payment of premiums could have a material adverse impact on our financial condition and results of operations. In addition, the potential for a significant insurer to fail, be downgraded or withdraw from writing certain lines of insurance coverages that we offer our clients could negatively impact overall capacity in the industry, which could then reduce the placement of certain lines and types of insurance and reduce our revenue and profitability. The potential for an insurer to fail or be downgraded could also result in errors and omissions claims by clients.
In addition, the markets for our principal services are highly competitive. Our competitors include other insurance brokerage (including direct-to-consumer Medicare brokerage), human capital and risk management consulting and actuarial firms, and the human capital and risk management divisions of diversified professional services, insurance, brokerage and accounting firms and specialty, regional and local firms.
Competition for business is intense in all of our business lines and in every insurance market, and some competitors have greater market share in certain lines of business than we do. Some of our competitors have greater financial, technical and marketing resources than us, which could enhance their ability to finance acquisitions, fund internal growth and respond more quickly to professional and technological changes. New competitors, as well as increasing and evolving consolidation or alliances among existing competitors, have created and could continue to create additional competition and could significantly reduce our market share, resulting in a loss of business for us and a corresponding decline in revenue and profit margin. In order to respond to increased competition and pricing pressure, we may have to lower our prices, which would also have an adverse effect on our revenue and profit margin.
In addition, existing and new competitors (whether traditional competitors or non-traditional competitors, such as technology companies) may continue to develop competing technologies or product or service offerings. Any new technology or product or service offering (including insurance companies selling their products directly to consumers or other insureds) that reduces or eliminates the need for intermediaries in insurance sales transactions could have a material adverse effect on our business and results of operations. Further, the increasing willingness of clients to either self-insure or maintain a captive insurance company, and the development of capital markets-based solutions and other alternative capital sources for traditional insurance needs, could also materially adversely affect us and our results of operations.
An example of a business that may be significantly impacted by changes in customer demand is our retirement consulting and actuarial business, which comprises a substantial portion of our revenue and profit. We provide clients with actuarial and consulting services relating to both defined benefit and defined contribution pension plans. Defined benefit pension plans generally require more actuarial services than defined contribution plans because defined benefit plans typically involve large asset pools, complex calculations to determine employer costs, funding requirements and sophisticated analysis to match liabilities and assets over long periods of time. If organizations shift to defined contribution plans more rapidly than we anticipate, or if we are unable to otherwise compensate for the decline in our business that results from employers moving away from defined benefit plans, our business, financial condition and results of operations could be materially adversely affected. Furthermore, large and complex consulting projects, often involving dedicated personnel, resources and expenses, comprise a significant portion of this business, which are based on our clients’ discretionary needs and may be reduced based on a decline in a client’s or an industry’s financial condition or prospects. We also face the risk that certain large and complex project contracts may be reduced or terminated based on dissatisfaction with service levels, which could result in reduced revenue, write-offs of assets associated with the project, and disputes over the contract, all of which may adversely impact our results and business.
In addition, the demand for many of our core benefit services, including compliance-related services, is affected by government regulation and taxation of employee benefit plans. Significant changes in tax or social welfare policy or other regulations could lead some employers to discontinue their employee benefit plans, including defined benefit pension plans, thereby reducing the demand for our services. A simplification of regulations or tax policy could also reduce the need for our services.
22
Our business, financial condition, results of operations, and long-term goals may continue to be adversely affected, possibly materially, by negative impacts on the global economy and capital markets resulting from wars or any other geopolitical tensions.
U.S. and global markets are experiencing volatility and disruption as a result of the Russia-Ukraine and Israel-Hamas wars. Although the length and impact of the ongoing wars are highly unpredictable, these geopolitical conflicts could continue to lead to further market disruptions. Geopolitical tensions that have not crystallized into active wars could similarly cause market disruptions, directly or indirectly. The extent and duration of geopolitical crises, sanctions and resulting market disruptions are impossible to predict, but could be substantial.
Sanctions imposed by the U.S., the E.U., the U.K. and other countries on Russia, as well as Russian counter-sanctions, are extensive. Additional sanctions and penalties have also been enacted, proposed and/or threatened. Russian actions and the resulting sanctions could adversely affect the global economy and financial markets and lead to instability and lack of liquidity in capital markets. The ramifications of the hostilities and sanctions, however, may not be limited to Russia and Russian companies but may spill over to and negatively impact other regional and global economic markets (including Europe and the United States), companies in other countries (particularly those that have done business with Russia) and various sectors, industries and markets for securities and commodities globally, such as oil and natural gas. Accordingly, the actions discussed above and the potential for a wider conflict could increase financial market volatility and could cause severe negative effects on regional and global economic markets, industries, and companies. In addition, Russia may take retaliatory actions and other countermeasures, including cyberattacks and espionage against other countries and companies around the world, which may negatively impact such countries and companies. The extent and duration of the Russian actions or future escalation of such hostilities, the extent and impact of existing and future sanctions, market disruptions and volatility, and the result of any diplomatic negotiations cannot be predicted. For additional sanctions-related risks, also see ‘Sanctions imposed by governments, or changes to such sanction regulations (such as sanctions imposed on Russia), and related counter-sanctions, could have a material adverse impact on our operations or financial results’ below.
Damage to our business, including to our reputation arising from, among other things, the failure of third parties on whom we rely to perform services or maintain positive public perceptions, could adversely affect our business, operations and results.
Maintaining a positive reputation is critical to our ability to attract and maintain relationships with clients and colleagues. Damage to our reputation could therefore cause significant harm to our business and prospects. Harm to our reputation can arise from numerous sources, including among others, colleague misconduct, litigation or regulatory action, failure to deliver minimum standards of service and quality, compliance failures, allegations of conflicts of interest and unethical behavior. Such harm could also arise from negative public opinion or political conditions arising from our association with third parties in any number of activities or circumstances. Negative perceptions or publicity, whether or not true, may result in harm to our prospects. In addition, the failure to deliver satisfactory service and quality performance, on time and within budget, in one line of business could cause clients to terminate the services we provide to those clients in many other lines of business. This risk has increased as the Company has become larger and more complex and as we take on increasingly complicated projects for our clients (such as complex outsourcing engagements and technology solutions development/implementation projects that require a significant amount of dedicated personnel resources and expenses).
In addition, as part of providing services to clients and managing our business, we not only depend on a number of third-party service providers and suppliers today, but we expect to engage the services of new third parties in the future as we continue to implement our operational transformation programs. Our ability to perform effectively depends in part on the ability of these service providers to meet their obligations, as well as on our effective oversight of their performance. The quality of our services could suffer, or we could be required to incur unanticipated costs if our third-party service providers do not perform as expected or their services are disrupted. This could have a material adverse effect on our reputation as well as our business and results of operations.
Our business may be harmed by any negative developments that may occur in the insurance industry or if we fail to maintain good relationships with insurance carriers.
Many of our businesses are heavily dependent on the insurance industry. Any negative developments that occur in the insurance industry may have a material adverse effect on our business and our results of operations. In addition, if we fail to maintain good relationships with insurance carriers, it may have a material adverse effect on our business and results of operations.
The private health insurance industry in the U.S. has experienced a substantial amount of consolidation over the past several years, resulting in a decrease in the number of insurance carriers. In the future, it may become necessary for us to offer insurance plans from a reduced number of insurance carriers or to derive a greater portion of our revenue from a more concentrated number of carriers as our business and the health insurance industry continue to evolve. The termination, amendment or consolidation of our relationships with our insurance carriers in the U.S. or in any other jurisdiction could harm our business, results of operations and financial condition.
23
Human Capital Risks
We depend on the continued services of our executive officers, senior management team, and skilled individual contributors, and any changes in our management structure and in senior leadership could affect our business and financial results.
Our success and future performance has depended largely upon the continued services of our executive officers, senior management, and other highly skilled personnel. We have relied on our leadership team to execute on our business plan, for strategy, growth, research and development, marketing, sales, provision, maintenance, and support of our products and services, and general and administrative functions, and on mission-critical individual contributors. From time to time, our executive management team and the groups of skilled individual contributors may change from the hiring or departure of executive officers or such contributors, which could disrupt our business. The employment agreements with our executive officers (to the extent our officers are party to such agreements) and other key personnel will not require them to continue to work for us for any specified period; therefore, they could terminate their employment at any time. The loss of one or more of our executive officers, senior management, or other key colleagues (including any limitation on the performance of their duties) could significantly delay or prevent the achievement of our development and strategic objectives.
A leadership transition may also increase the likelihood of turnover among our colleagues and result in changes in our business strategy, which may create uncertainty and negatively impact our ability to execute our business strategy quickly and effectively. Leadership transitions may also impact our relationships with customers and other market participants, and create uncertainty among investors, colleagues, and others concerning our future direction and performance. Any significant disruption, uncertainty or change in business strategy could adversely affect our business, operating results and financial condition.
The loss of key colleagues or a large number of colleagues could damage or result in the loss of client relationships and could result in such colleagues competing against us.
Our success depends on our ability to attract, retain and motivate qualified personnel, including key managers and colleagues. In addition, our success largely depends upon our colleagues’ abilities to generate business and provide quality services. Our ability to provide services our clients demand requires such skills and training, in insurance, actuarial, human resources and other areas, which are also in high demand among our competitors. The market for talent in our industry is extremely competitive, and competitors for talent increasingly attempt to hire, and to varying degrees have been successful in hiring, our colleagues or employment candidates. In particular, our colleagues’ business relationships with our clients are a critical element of obtaining and maintaining client engagements. Labor markets have continued to tighten globally, and we have experienced intense competition and increased costs for certain types of colleagues, especially as new entrants in the insurance business (among others) continue to expend significant resources in their own hiring. Also, in the past, we have lost colleagues who manage substantial client relationships or possess substantial experience or expertise; if we lose additional colleagues such as those, or if we lose a large number of other colleagues, it could result in such colleagues competing against us. It may take longer than expected to hire new colleagues to replace colleagues who have left and/or these new colleagues may be subject to restrictive covenants that impact the amount of business they can generate while those covenants are in effect. Further, the increased availability of remote working arrangements has also expanded the pool of companies that can compete for our colleagues and employment candidates. Our operational transformation efforts require us to attract, onboard, and retain individuals relevant for those efforts and we may not be able to do that successfully. The failure to successfully attract and retain qualified personnel could materially adversely affect our ability to secure and complete engagements or could disrupt our business or cause increased operational risk, which would materially adversely affect our results of operations and prospects.
Failure to maintain our corporate culture, including in a remote or hybrid work environment, could damage our reputation.
We aim to foster a culture that is based on a strong client focus, an emphasis on teamwork, integrity, mutual respect and striving for excellence. Our colleagues are the cornerstone of this culture, and acts of misconduct by any colleague, and particularly by senior management, could erode trust and confidence and damage our reputation among existing and potential clients and other stakeholders. Our business is managing people, risk and capital, and our success depends on our ability to develop and promote an ethical culture of trust, integrity and other important qualities in which our colleagues are comfortable speaking up about potential misconduct. While we do not believe we have experienced any material adverse cultural impacts as a result of our remote and hybrid work environment, this may manifest over time. As a result, remote and hybrid work arrangements may negatively impact our ability to maintain and promote our culture and increase related risks.
24
Intellectual Property, Technology, Cybersecurity and Data Protection Risks
Data and cybersecurity breaches or improper disclosure of confidential company or personal data could result in material financial loss, regulatory actions, reputational harm, and/or legal liability.
We depend on information technology networks and systems to process, transmit and store electronic information and to communicate among our locations around the world and with our alliance partners, insurance carriers/markets, clients and third-party vendors. Additionally, one of our significant responsibilities is to maintain the security and privacy of our clients’ confidential and proprietary information and the personal data of their customers and employees. Our information systems, and those of our third-party service providers and vendors, are vulnerable to an increasing threat of continually evolving cybersecurity risks. We are regularly subject to cyberattacks and are the target of computer viruses, hackers, distributed denial of service attacks, malware infections, ransomware attacks, phishing and spear-phishing campaigns, and/or other external hazards, as well as improper or inadvertent workforce behavior which, could expose confidential company and personal data systems and information to security breaches.
Many of the software applications that we use in our business are licensed from, and supported, upgraded and maintained by, third-party vendors. Our third-party applications include, but are not limited to, enterprise cloud storage and cloud computing application services provided and maintained by third-party vendors. These third-party applications store or may afford access to confidential and proprietary data of the Company, our colleagues and our clients. We have processes designed to require third-party vendors that provide IT outsourcing, offsite storage and other services to agree to maintain certain standards with respect to the storage, protection and transfer of confidential, personal and proprietary information. However, this data is at risk of compromise or unauthorized access or use in the event of a breakdown of a vendor’s data protection processes, a data breach due to the intentional or unintentional non-compliance by a vendor’s employee or agent, or as a result of a cyber-attack on the product, software or information systems of a vendor in our software supply chain. Any compromise of the product, software, data or infrastructure of a Company vendor, including a software or IT vendor in our supply chain has, and could again, in turn result in the compromise of Company data or infrastructure or result in material operational disruption, although no such previous compromise has been material to our business or financial results. Further, the risk and potential impact of a data breach on our third-party vendors’ products, software or systems increase as we move more of our data and our clients’ data into our vendors’ cloud storage, engage in IT outsourcing, and consolidate the group of third-party vendors that provide cloud storage or other IT services for the Company. Over time, the frequency, severity and sophistication of the attacks against us and our vendors have increased, including due to the use of artificial intelligence for purposes of cybercrime, and the broader range of threat actors, including state-sponsored actors and hacker activists.
We and our vendors regularly experience cybersecurity incidents, including successful attacks from time to time, and we expect that to continue going forward. Cybersecurity incidents include those resulting from human error or malfeasance, implantation of malware and viruses, phishing and spear-phishing attacks, unauthorized access to our information technology networks and systems, and unauthorized access to data or individual account funds through fraud or other means of deceiving our colleagues, clients, third-party service providers and vendors. We have experienced successful attacks, by various types of hacking groups, in which personal and commercially sensitive information, belonging to the Company or its clients, has been compromised. However, none of these cybersecurity incidents or attacks to our knowledge have been material to our business or financial results. We cannot assure that such cybersecurity incidents or attacks will not have a material impact on our business or financial results in the future. When required by law, we have notified individuals, clients and relevant regulatory authorities (such as insurance/financial services regulators and privacy regulators) of such cybersecurity incidents or attacks.
We maintain policies, procedures and administrative, physical and technological safeguards (such as, where in place, multifactor authentication and encryption of data in transit and at rest) designed to protect the security and privacy of the data in our custody and control. However, such safeguards are time-consuming and expensive to deploy broadly and are not necessarily always in place or effective, and we cannot entirely eliminate the risk of data security breaches, improper access to, takeover of or disclosure of confidential company or personally identifiable information. We may not be able to detect and assess such issues, or implement appropriate mitigation or remediation, in a timely manner. We are engaged in an ongoing effort to enhance our protections against such attacks; this effort will require significant expenditures and may not be successful. Our technology may fail to adequately secure the private information we hold and protect it from theft, computer viruses, hackers or inadvertent loss.
As has happened in the past, if any person, including any of our colleagues, intentionally or unintentionally fails to comply with, disregards or intentionally breaches our established controls with respect to such data or otherwise mismanages or misappropriates that data, we could be subject to monetary damages, fines, regulatory enforcement, and/or criminal prosecution, although the prior instances have not been material to our business or financial results. Unauthorized disclosure of sensitive or confidential client, supplier or colleague data, whether through systems failure, accident, colleague negligence, fraud or misappropriation, could damage our reputation and cause us to lose clients. Similarly, unauthorized access to or through our information systems or those we develop for our clients, whether by our colleagues or third parties, could result in significant additional expenses (including expenses relating to incident response and investigation, remediation work, notification of data security breaches and costs of credit monitoring
25
services), negative publicity, operational disruption, legal liability and/or damage to our reputation, as well as require substantial resources and effort of management, thereby diverting management’s focus and resources from business operations.
The methods used to obtain unauthorized access to, disable or degrade service or sabotage the Company’s systems are also constantly evolving, are increasingly sophisticated, and may be difficult to anticipate or detect. For example, the U.S. Federal Bureau of Investigation, the Cybersecurity and Infrastructure Security Agency, and other U.S. federal agencies continue to issue warnings about trends in cybercriminal and nation-state activity and other threats that are consistent with some of the types of incidents we have experienced. To our knowledge, these incidents have not had a material impact on our business or operations thus far. However, our reputation could be harmed and our business and results of operations could be materially and adversely affected if we were to be the target of such attacks in the future, or if, despite our controls and efforts to detect breaches, we were to be the victim of an undetected breach.
We have implemented and regularly review and update processes and procedures to protect against fraud and unauthorized access to and use of secured data and to prevent data loss. The ever-evolving threats mean that we and our third-party service providers and vendors must continually evaluate, adapt, enhance and otherwise improve our respective systems and processes, especially as we grow our mobile, cloud and other internet-based services. There is no guarantee that such efforts will be adequate to safeguard against all fraud, data security breaches, unauthorized access, operational impacts or misuses of data. For example, our policies, colleague training (including phishing prevention training), procedures and technical safeguards have been insufficient to prevent or detect improper access to confidential, personal or proprietary information by colleagues, vendors or other third parties with otherwise legitimate access to our systems, although the prior instances have not been material to our business or financial results. In addition, we may not be able to implement such efforts as quickly as desired if, for example, greater resources are required than originally expected or resources and management’s focus are insufficient. Any future significant compromise or breach of our data security or fraud, whether external or internal, or misuse of client, colleague, supplier or company data, could result in additional significant costs, lost revenue opportunities, disruption of operations and service, fines, lawsuits, and damage to our reputation with our clients and in the broader market.
For further discussion of the commercial risks related to the cybersecurity and data protection technology we use, please see ‘Our business performance and growth plans could be negatively affected if we are not able to develop and implement improvements in technology and effectively apply technology, data and analytics to drive value for our clients through technology-based solutions or gain internal efficiencies through the effective application of technology, analytics and related tools’ above. In addition, please see Part I, Item 1C Cybersecurity of this Form 10-K
Our inability to comply with complex and evolving laws and regulations related to data privacy and cybersecurity could result in material financial loss, regulatory actions, reputational harm, and/or legal liability.
We are subject to numerous laws and regulations in the U.S. and foreign jurisdictions, only certain of which are named here, designed to protect the personally identifiable information of client and company constituents and suppliers, notably the European Union’s General Data Protection Regulation (‘GDPR’), which became effective on May 25, 2018, the California Consumer Privacy Act of 2018, as amended by the California Privacy Rights Act of 2020 and its implementing regulations (‘CCPA’), which became effective in its current form on January 1, 2023, the Virginia Consumer Data Protection Act (‘VCDPA’), which became effective on January 1, 2023 and Connecticut Data Privacy Act (‘CDPA’), which became effective on July 1, 2023. We are also subject to regulations from other countries that prohibit or restrict the transmission of data outside of such countries’ borders, and to various U.S. federal and state laws governing the protection of health, financial or other individually identifiable information. The GDPR, as well as other more recently enacted privacy laws, significantly increased our responsibilities when handling personal data including, without limitation, requiring us to conduct privacy impact assessments, restricting the transmission of data, and requiring public disclosure of significant data breaches. Violations of the GDPR may result in possible fines of up to 4% of global annual turnover for the preceding financial year or €20 million (whichever is higher). A July 2020 judgment by the Court of Justice of the European Union on Schrems II has made cross border data transfers to organizations outside the European Economic Area more onerous and uncertain. Further, as a result of the U.K.’s withdrawal from the European Union (‘Brexit’), the data transfer regime between the U.K. and the European Economic Area is subject to some uncertainty if the U.K.’s data strategy diverges from the E.U.’s in the coming years. The Company is also subject to numerous U.S. and foreign marketing and telecommunications laws and regulations designed to protect consumers from unwanted or fraudulent communications. A violation of any such law may lead to litigation or regulatory liability, including substantial financial damages or fines.
Laws and regulations in this area are evolving and generally becoming more stringent, including, without limitation, the U.S. Health Insurance Portability and Accountability Act of 1996 (‘HIPAA’), enforced by the Office for Civil Rights within the Department of Health and Human Services, and the New York State Department of Financial Services’ cybersecurity regulations outlining required security measures for the protection of data. Certain U.S. states have also recently enacted laws requiring certain data security and privacy measures of regulated entities, notably the CCPA, VDCPA, and CDPA, with other states enacting similar data privacy laws that will become effective in the next 24 months. We expect that other U.S. states and other countries will follow in implementing
26
their own data privacy and data security laws. The People’s Republic of China and India, among other countries, have enacted stringent data protection laws that, among other things, may restrict data transfers out of each of those countries.
Each of these evolving laws and regulations, in the United States and abroad, as well as laws applicable to the Company that are not named here, may be subject to evolving and conflicting interpretations, restrict the manner in which we provide services to our clients, divert resources from other important initiatives, increase the risk of non-compliance, impose significant compliance and other costs that are likely to increase over time, and increase the risk of fines, lawsuits or other potential liability, all of which could have a material adverse effect on our business and results of operations. Our failure to adhere to or successfully develop processes in response to legal or regulatory requirements, including legal or regulatory requirements that may be developed or revised due to economic or geopolitical changes such as Brexit, and changing customer expectations in this area, could result in substantial legal liability and impairment to our reputation or business.
We are also subject to the terms of our privacy policies and contractual obligations to third parties related to privacy, data protection and information security. In addition to government regulation, privacy advocates and industry groups may propose new and different self-regulatory standards that either legally or contractually apply to us. We also expect that there will continue to be new proposed laws and regulations concerning privacy, data protection and information security, but cannot yet determine the impact such future laws, regulations and standards may have on our business. New laws, amendments to or re-interpretations of existing laws and regulations, industry standards, contractual obligations and other obligations may require us to incur additional costs and restrict our business operations. Because the interpretation and application of laws and other obligations relating to privacy and data protection are still uncertain, it is possible that these laws and other obligations may be interpreted and applied in a manner that is inconsistent with our existing data management practices. If so, in addition to the possibility of fines, lawsuits and other claims, we could be required to fundamentally change our business activities and practices, which could harm our business. We may be unable to make such changes and modifications in a commercially reasonable manner or at all. Any inability to adequately address privacy concerns, even if unfounded, or comply with applicable privacy or data protection laws, regulations and policies, could result in additional cost and liability, damage to our reputation, or harm to our business.
Our inability to successfully mitigate and recover should we experience a disaster or other business continuity problem could cause material financial loss, loss of human capital, regulatory actions, reputational harm, and/or legal liability.
Should we or a third party on whom we rely experience a disaster or other business continuity problem, such as an earthquake, hurricane, terrorist attack, act of war or other geopolitical conflict, pandemic, including prolonged effects of the COVID-19 pandemic, security breach, ransomware or destructive malware attack, power loss, telecommunications failure or other natural or man-made disaster, our continued success will depend, in part, on the availability of our personnel, our office facilities, our outsourcing providers or other vendors, access to data, and the proper functioning of our computer, telecommunication and other related systems and operations. In such an event, we could experience operational challenges with regard to our operations.
A disaster on a significant scale or affecting certain of our key operating areas within or across regions, or our inability to successfully recover should we experience a disaster or other business continuity problem, could materially interrupt our business operations and cause material financial loss, loss of human capital, regulatory actions, reputational harm, damaged client relationships or legal liability, particularly if any of these problems occur during peak times.
Material interruption to or loss of our information processing capabilities or failure to effectively maintain and upgrade our information processing hardware or systems could cause material financial loss, regulatory actions, reputational harm, and/or legal liability.
Our business depends significantly on effective information systems. Our capacity to service our clients relies on effective storage, retrieval, processing and management of information. Our information systems also rely on the commitment of significant financial and other resources to maintain and enhance existing systems, develop and create new systems and products in order to keep pace with continuing changes in information processing technology or evolving industry and regulatory standards. We rely on being at the forefront of a range of technology options relevant to our business, including by staying ahead of the technology offered by our competitors, and attracting, developing, and retaining skilled individuals in the cybersecurity space. The market for such qualified individuals is competitive and we may be unable to hire the necessary talent to mitigate the foregoing risks.
In addition, many of the software applications, including enterprise cloud storage and cloud computing application services, that we use in our business are licensed from, and supported, upgraded and maintained by, third-party vendors. We are significantly increasing our use of such cloud services and expect this to continue over time. These third-party applications store confidential and proprietary data of the Company, our clients and our colleagues. A suspension or termination of certain of these licenses or the related support, upgrades and maintenance could cause temporary system delays or interruptions that could adversely impact our business. As a global organization, we occasionally acquire other companies or divest certain of our existing business lines and companies. These strategic business decisions may require us to manage complex integrations or dissolutions of information systems or the transfer of information from one system to another, and we may fail to identify vulnerabilities in our targets’ information systems or in integrated components of our respective information systems. These transactions may make us more susceptible to cyberattacks and could result in the theft of Company intellectual property, the compromise of Company, colleague, and client data or operational disruption.
27
Any finding that the data we rely on to run our business is inaccurate or unreliable, that we fail to maintain effective and efficient systems (including through a telecommunications failure, failure to replace or update redundant or obsolete computer hardware, applications or software systems, or the loss of skilled people with the knowledge needed to operate older systems), or that we experience cost overruns, delays, or other disruptions, could result in material financial loss, regulatory action, reputational harm or legal liability.
Limited protection of our intellectual property could harm our business and our ability to compete effectively, and we face the risk that our services or products may infringe upon the intellectual property rights of others.
We cannot guarantee that trade secret, trademark, and copyright law protections, or our internal policies and procedures regarding our management of intellectual property, are adequate to deter misappropriation of our intellectual property (including our software, which may become an increasingly important part of our business). Existing laws of some countries in which we provide services or products may offer only limited protection of our intellectual property rights. Also, we may be unable to detect the unauthorized use of our intellectual property and take the necessary steps to enforce our rights, which may have a material adverse impact on our business, financial condition or results of operations. We cannot be sure that our services and products, or the products of others that we offer to our clients, do not infringe on the intellectual property rights of third parties, and we may have infringement claims asserted against us or our clients. These claims may harm our reputation, result in financial liability, consume financial resources to pursue or defend, and prevent us from offering some services or products. In addition, these claims, whether with or without merit, could be expensive, take significant time and divert management’s focus and resources from business operations. Successful challenges against us could require us to modify or discontinue our use of technology or business processes where such use is found to infringe or violate the rights of others, or require us to purchase licenses from third parties, any of which could adversely affect our business, financial condition and operating results.
Legal, Non-Financial/Regulatory and Compliance Risks
From time to time, we receive claims and are party to lawsuits arising from our work, which could materially adversely affect our reputation, business and financial condition.
We depend in large part on our relationships with clients and our reputation for high-quality services to secure future engagements. Clients that become dissatisfied with our services may terminate their business relationships with us, and clients and third parties that claim they suffered damages caused by our services may bring lawsuits against us. We are subject to various actual and potential claims, lawsuits, investigations and other proceedings relating principally to alleged errors and omissions in connection with the provision of our services or the placement of insurance and reinsurance in the ordinary course of business. We are also subject to actual and potential claims, lawsuits, investigations and proceedings outside of errors and omissions claims. See Note 15 - Commitments and Contingencies within Item 8 of this Annual Report on Form 10-K for examples of claims to which we are subject.
Because we often assist our clients with matters involving substantial amounts of money and complex regulatory requirements, including actuarial services, asset management, technology solutions development and implementation and the placement of insurance coverage and the handling of related claims, errors and omissions claims against us may arise that allege our potential liability for all or part of the substantial amounts in question. The nature of our work, particularly our actuarial services, necessarily involves the use of assumptions and the preparation of estimates relating to future and contingent events, the actual outcome of which we cannot know in advance. Our actuarial and brokerage services also rely on substantial amounts of data provided by clients, the accuracy and quality of which we may not be able to ensure. In addition, we could make computational, software programming or data management errors in connection with the services we provide to clients.
Clients may seek to hold us responsible for alleged errors or omissions relating to any of the brokerage advice and services we provide, including when claims they submit to their insurance carriers are disputed or denied. This risk is likely to be higher in circumstances, such as claims related to COVID-19, where there are significant disputes between clients and insurance carriers over coverage and clients allege claims against us. This risk also may be higher in circumstances where we have significant numbers of departures or new joiners or other disruptions to our business, such as changes in ways of working. Given that many of our clients have very high insurance policy limits to cover their risks, alleged errors and omissions claims against us arising from disputed or denied claims are often significant. Moreover, in certain circumstances, our brokerage, investment and certain other types of business may not limit the maximum liability to which we may be exposed for claims involving alleged errors or omissions; and as such, we do not have limited liability for the work we provide to the associated clients.
Further, given that we frequently work with large pension funds and insurance companies as well as other large clients, relatively small percentage errors or variances can create significant financial variances and result in significant claims for unintended or unfunded liabilities. The risks from such variances or errors could be aggravated in an environment of declining pension fund asset values and insurance company capital levels. In almost all cases, our exposure to liability with respect to a particular engagement is substantially greater than the revenue opportunity that the engagement generates for us.
Clients may seek to hold us responsible for the financial consequences of variances between assumptions and estimates and actual outcomes or for errors. For example, in the case of pension plan actuarial work, a client’s claims might focus on the client’s alleged
28
reliance on actuarial assumptions that it believes were unreasonable and, based on such reliance, the client made benefit commitments that it may later claim are not affordable or funding decisions that result in plan underfunding if and when actual outcomes vary from actuarial assumptions.
We also continue to create new products and services (including increasingly complex technology solutions) and to grow the business of providing products and services to institutional investors, financial services companies and other clients. The risk of claims from these lines of business and related products and services may be greater than from our core products or services, and such claims may be for significant amounts as we take on increasingly complicated projects, including those with complex regulatory requirements.
We also provide advice on both asset allocation and selection of investment managers. Increasingly, for many clients, we are responsible for making decisions on both of these matters, or we may serve in a fiduciary capacity, either of which may increase liability exposure. In addition, the Company offers affiliated investment funds, including in the U.S. and Ireland, with plans to launch additional funds over time. Given that our Investments business may recommend affiliated investment funds or affirmatively invest such clients’ assets in such funds under delegated authority, this may increase our liability exposure. We may also be liable for actions of managers or other service providers to the funds. Further, for certain clients, we are responsible for some portions of cash and investment management, including rebalancing of investment portfolios and guidance to third parties on the structure of derivatives and securities transactions. Asset classes may experience poor absolute performance, and investment managers may underperform their benchmarks; in both cases the investment return shortfall can be significant. Clients experiencing this underperformance, including from our affiliated investment funds, may assert claims against us, and such claims may be for significant amounts. In addition, our failure to properly execute our role can cause monetary damage to our clients or such third parties for which we might be found liable, and such claims may be for significant amounts. Our expected expansion of this business geographically and in new offerings will subject us to additional contractual exposures and obligations with investors, asset managers and third-party service providers, as well as increased regulatory exposures. Overall, our ability to contractually limit our potential liability may be limited in certain jurisdictions or markets or in connection with claims involving breaches of fiduciary duties or other alleged errors or omissions.
The ultimate outcome of all of the above matters cannot be ascertained and liabilities in indeterminate amounts may be imposed on us. In addition, our insurance coverage may not be sufficient in type or amount to cover us against such liabilities. It is thus possible that future results of operations or cash flows for any particular quarterly or annual period could be materially adversely affected by an unfavorable resolution of these matters. In addition, these matters continue to divert management and personnel resources away from operating our business. Even if we do not experience significant monetary costs, there may be adverse publicity associated with these matters that could result in reputational harm to the industries we operate in or to us in particular that may adversely affect our business, client or colleague relationships. In addition, defending against these claims can involve potentially significant costs, including legal defense costs.
As a highly regulated company, we are subject from time to time to inquiries or investigations by governmental agencies or regulators that could have a material adverse effect on our business or results of operations.
We have also been and may continue to be subject to inquiries and investigations by federal, state or other governmental agencies regarding aspects of our clients’ businesses or our own businesses, especially regulated businesses such as our insurance broker, BDA, securities broker-dealer and investment advisory services. Such inquiries or investigations may consume significant management time and result in regulatory sanctions, fines or other actions as well as significant legal fees, which could have a material adverse impact on our business, results of operations and liquidity. Also, we may face additional regulatory scrutiny as we expand our businesses geographically and in new products and services that we offer.
All of these items reflect an increased focus by regulators (in the U.K., U.S., and elsewhere) on various aspects of the operations and affairs of our regulated businesses. We are unable to predict the outcome of these inquiries or investigations. Any proposed changes that result from these investigations and inquiries, or any other investigations, inquiries or regulatory developments, or any potential fines or enforcement action, could materially adversely affect our business and our results of operations.
29
In conducting our businesses around the world, we are subject to political, economic, legal, regulatory, cultural, market, operational and other risks that are inherent in operating in many countries.
In conducting our businesses and maintaining and supporting our global operations, we are subject to political, economic, legal, regulatory, market, operational and other risks. Our businesses and operations continue to expand into new regions throughout the world, including emerging markets. The possible effects of political, economic, financial and climate change related disruptions throughout the world could have an adverse impact on our businesses and financial results. These risks include:
Sanctions imposed by governments, or changes to such sanction regulations (such as sanctions imposed on Russia), and related counter-sanctions, could have a material adverse impact on our operations or financial results.
As described above, our businesses are subject to the risk of sanctions imposed by the U.S., the E.U., the U.K. and other governments. International conflicts and related geopolitical tensions increase the risk of sanctions impacting our business. In February 2022, Russia invaded Ukraine, which led to a series of economic and other sanctions on Russia imposed by the U.S., the E.U., and the U.K. There also continue to be diplomatic and trade tensions between the U.S. and China, which have been exacerbated by Chinese military exercises around Taiwan, and which could lead to an increase in sanctions and the implementation of other trade measures. There has been an increase in U.S. sanctions designations in relation to Russia and China and counter-sanctions from both Russia and China in response to these sanctions.
Touchpoints with sanctioned individuals, entities or locations can be difficult to identify and, given the increased scope and complexity of sanctions and the manual nature of some of our processes, there is an increased risk of non-compliance. A number of volatile geopolitical events are likely to affect the implementation of sanctions such as the escalation of sanctions towards Belarus, Russia's invasion of Ukraine, the Israel-Hamas conflict, negotiations between the E.U., U.S. and Iran over a new nuclear deal as well as continuing tensions between the U.S. and China with their sanctions and subsequent counter-sanctions. Some of these jurisdictions, such as China, may include significant businesses for us. As a result, we cannot predict the impacts of any changes in the U.S., E.U., U.K. or other sanctions, and whether such changes could have a material adverse impact on our operations or financial results.
Our business will be negatively affected if we are not able to anticipate and keep pace with rapid changes in government laws or regulations, or if government laws or regulations decrease the need for our services, increase our costs or limit our compensation.
A material portion of our revenue is affected by statutory or regulatory changes. An example of a statutory or regulatory change that could materially impact us is any change to the U.S. Patient Protection and Affordable Care Act (‘PPACA’), and the Healthcare and Education Reconciliation Act of 2010 (‘HCERA’), which we refer to collectively as ‘Healthcare Reform’. While the U.S. Congress has not passed legislation replacing or fundamentally amending Healthcare Reform (other than changes to the individual mandate), such legislation, or another version of Healthcare Reform, could be implemented in the future. In addition, some U.S. political candidates and representatives elected to office have expressed a desire to amend all or a portion of Healthcare Reform or otherwise establish alternatives to employer-sponsored health insurance or replace it with government-sponsored health insurance, often referred
30
to as ‘Medicare for All’. If we are unable to adapt our services to potential new laws and regulations, or judicial modifications, with respect to Healthcare Reform or otherwise, our ability to provide effective services in these areas may be substantially impacted. In addition, more restrictive marketing rules or interpretations of the Centers for Medicare and Medicaid Services, or judicial decisions that restrict or otherwise change existing provisions of U.S. healthcare regulation, could have a material adverse impact on our healthcare-related businesses. In addition, as we implement and expand our direct-to-consumer sales and marketing solutions, we are subject to various federal and state laws and regulations that prescribe when and how we may market to consumers (including, without limitation, the Telephone Consumer Protection Act and other telemarketing laws and the Medicare Communications and Marketing Guidelines issued by the Center for Medicare Services (‘CMS’) of the U.S. Department of Health and Human Service). Federal and state legislators and/or regulators recently have expressed concerns about existing methods of marketing individual health policies, particularly Medicare Advantage and Medicare Supplement policies, and have held hearings and sought information from us and from competitors. In addition, CMS has recently expanded its regulation and oversight of the marketing of Medicare Advantage policies. Changes to these laws and/or regulations, or increased scrutiny or enforcement by regulators, could negatively affect our ability to market directly to consumers or increase our costs or liabilities. In particular, CMS recently issued a proposed rule for Contract Year 2025 for the Medicare Advantage and Medicare Prescription Drug programs that modifies the agent, broker and other third-party requirements. Among other things, the proposed rule seeks to limit the administrative fees that agents and brokers may receive in relation to the initial enrollment and renewals of Medicare Advantage and Medicare Prescription Drug policies. Substantial uncertainty remains regarding the interpretation and implementation of the proposed rule, but the proposed rule has the potential to materially and negatively affect the amount of revenue that our Medicare insurance business may receive. In addition, the United States Department of Labor (‘DOL’) recently released a proposed rule defining who is an investment advice fiduciary rule (‘Proposed DOL Fiduciary Rule’) under the Employee Retirement Income Security Act (‘ERISA’). Substantial uncertainty exists regarding this proposed rule as well, but the proposed rule may have a material and potentially negative impact on one or more of our businesses. For example, if the current Proposed DOL Fiduciary Rule were implemented without change, our Health Savings Accounts business may need to be restructured before it could continue to receive certain compensation for its services.
Many other areas in which we provide services are the subject of government regulation, which is constantly evolving. For example, our activities in connection with insurance brokerage services are subject to regulation and supervision by national, state or other authorities. Insurance laws in the markets in which we operate are often complex and generally grant broad discretion to supervisory authorities in adopting regulations and supervising regulated activities. That supervision generally includes the licensing of insurance brokers and agents and the regulation of the handling and investment of client funds held in a fiduciary capacity. Our continuing ability to provide insurance brokerage in the markets in which we currently operate is dependent upon our compliance with the rules and regulations promulgated from time to time by the regulatory authorities in each of these locations.
Changes in government and accounting regulations in the U.S. and the U.K., two of our principal geographic markets, affecting the value, use or delivery of benefits and human capital programs, may materially adversely affect the demand for, or the profitability of, our various services. In addition, we have significant operations throughout the world, which further subject us to applicable laws and regulations of countries outside the U.S. and the U.K. Changes in legislation or regulations and actions by regulators in particular countries, including changes in administration and enforcement policies, could require operational improvements or modifications, which may result in higher costs or hinder our ability to operate our business in those countries.
Our compliance systems and controls cannot guarantee that we comply with all applicable federal and state or foreign laws and regulations, and actions by regulatory authorities or changes in applicable laws and regulations in the jurisdictions in which we operate could impact our operations or have an adverse effect on our business.
Our activities are subject to extensive regulation under the laws of the U.S., the U.K., the E.U. and its member states, and the other jurisdictions around the world in which we operate. In addition, we own an interest in a number of associates and companies where we do not exercise management control. Over the last few years, regulators across the world are increasingly seeking to regulate brokers who operate in their jurisdictions. The foreign and U.S. laws and regulations applicable to our operations are complex, continually evolving and may increase the costs of regulatory compliance, limit or restrict the products or services we sell or subject our business to the possibility of regulatory actions or proceedings. These laws and regulations include insurance and financial industry regulations, antitrust and competition laws, economic and trade sanctions laws relating to countries in which certain subsidiaries do business or may do business (‘Sanctioned Jurisdictions’) such as Crimea (and any occupied territories of Ukraine), Cuba, Iran, Russia, Sudan, Syria and Venezuela, anti-corruption laws such as the FCPA, the U.K. Bribery Act 2010, and similar local laws prohibiting corrupt payments to governmental officials and the Foreign Account Tax Compliance provisions of the Hiring Incentives to Restore Employment Act in the U.S., as well as laws and regulations related to data privacy, artificial intelligence, cybersecurity and telemarketing. Because of changes in regulation and company practice, our non-U.S. subsidiaries are providing more services with connections to various countries, including some Sanctioned Jurisdictions, that our U.S. subsidiaries are unable to perform.
In most jurisdictions, governmental and regulatory authorities have the ability to interpret and amend these laws and regulations and impose penalties for non-compliance, including sanctions, civil remedies, monetary fines, injunctions, revocation of licenses or approvals, suspension of individuals, limitations on business activities or redress to clients. While we believe that we have
31
substantially increased our focus on the geographic breadth of regulations to which we are subject, maintain good relationships with our key regulators and our current systems and controls are adequate, we cannot assure that such systems and controls will prevent any violations of any applicable laws and regulations. While we strive to remain fully compliant with applicable laws and regulations, we cannot guarantee that we will fully comply at all times with all laws and regulations, especially in countries with developing or evolving legal systems or with evolving or extra-territorial regulations. In particular, given the challenges of integrating operations, many of which are decentralized and have manual processes, we cannot assure that business systems and controls, including those of acquired or decentralized entities, have prevented or will prevent any and all violations of applicable laws or regulations. Further, our policies and procedures may not be effective or may not be complied with consistency across the enterprise. In the event that we believe our colleagues or agents may have caused us or any of our subsidiaries to violate applicable sanctions laws or other laws or regulations, we may be required to investigate or have outside counsel investigate the relevant facts and circumstances which could be costly and require significant time and attention from senior management. Non-compliance with these laws can result in criminal or civil penalties, which could disrupt our business and result in a material adverse effect on our financial condition, results of operation, cash flows, and cause significant brand or reputational damage.
Allegations of conflicts of interest or anti-competitive behavior, including in connection with accepting market derived income (‘MDI’), may have a material adverse effect on our business, financial condition, results of operation or reputation.
The ways in which insurance intermediaries are compensated receive scrutiny from regulators in part because of the potential for anti-competitive behavior and conflicts of interest. We could suffer significant financial or reputational harm if we fail to properly identify and manage any such potential conflicts of interest or allegations of anti-competitive behavior. Conflicts of interest exist or could exist any time the Company or any of its colleagues have or may have an interest in a transaction or engagement that is inconsistent with our clients’ interests. This could occur, for example, when the Company is providing services to multiple parties in connection with a transaction. In addition, as we provide more solutions-based services, there is greater potential for conflicts with advisory services. Managing conflicts of interest is an important issue for the Company, but can be a challenge for a large and complex company such as ours. Due to the broad scope of our businesses and our client base, we regularly address potential conflicts of interest, including, without limitation, situations where our services to a particular client or our own investments or other interests conflict, or are perceived to conflict, with the interests of another client. If these are not carefully managed, this could then lead to failure or perceived failure to protect the client’s interests, with attendant regulatory and reputational risks that could materially adversely affect us and our operations. There is no guarantee that all potential conflicts of interest will be identified, and undetected conflicts may result in damage to our professional reputation and result in legal liability which may have a material adverse effect on our business. Identifying conflicts of interest may also prove particularly difficult as we continue to bring systems and information together and integrate newly acquired businesses. In addition, we may not be able to adequately address such conflicts of interest.
In addition, insurance intermediaries have traditionally been remunerated by base commissions paid by insurance carriers in respect of placements we make for clients, or by fees paid by clients. Intermediaries also obtain other revenue from insurance carriers. This revenue, when derived from carriers in their capacity as insurance markets (as opposed to as corporate clients of the intermediaries where they may be purchasing insurance or reinsurance or other non-market-related services), is commonly known as market derived income or ‘MDI’. MDI is another example of an area in which allegations of conflicts of interest may arise. MDI takes a variety of forms, including volume- or profit-based contingent commissions, facilities administration charges, business development agreements, and fees for providing certain data to carriers.
MDI creates various risks. Intermediaries in many markets have a duty to act in the best interests of their clients and payments from carriers can incentivize intermediaries to put carriers’ or their own interests ahead of their clients. Accordingly, MDI may be subject to scrutiny by various regulators under conflict of interest, anti-trust, unfair competition, conduct and anti-bribery laws and regulations. While accepting MDI is a lawful and acceptable business practice, and while we have established systems and controls to manage these risks, we cannot predict whether our position will result in regulatory or other scrutiny and our controls may not be effective.
In addition, the Company offers affiliated investment funds, with plans to launch additional funds over time. Given that our Investments business may recommend affiliated investment funds or affirmatively invest such clients’ assets in such funds under delegated authority, there may be a perceived conflict of interest. While the Company has processes, procedures and controls in place intended to mitigate potential conflicts, such perception could cause regulatory inquiries, or could impact client demand and the business’ financial performance, and our controls may not be effective. In addition, underperformance by our affiliated investment funds could lead to lawsuits by clients that were invested in such funds.
The failure or perceived failure to adequately address actual or potential conflicts of interest or allegations of anti-competitive behavior could affect the willingness of clients to deal with us or give rise to litigation or enforcement actions. Conflicts of interest or anti-competitive activities may also arise in the future that could cause material harm to us.
32
Changes and developments in the health insurance system in the United States could harm our business.
In 2010, the Federal government enacted significant reforms to healthcare legislation through Healthcare Reform. Many of our lines of business depend upon the private sector of the U.S. insurance system, its role in financing health care delivery, and insurance carriers’ use of, and payment of commissions to, agents, brokers and other organizations to market and sell individual and family health insurance plans. Healthcare Reform provisions have changed and will continue to change the industry in which we operate in substantial ways. Any changes to the roles of the private and public sectors in the health insurance system could also substantially change the industry.
Healthcare legislation and changes to government-funded healthcare programs remain a focus in Congress, while various aspects of Healthcare Reform have been challenged in the judicial system with some success. Any partial or complete repeal or amendment, judicial modifications or implementation difficulties, or uncertainty regarding such events, could increase our costs of compliance, prevent or delay future adoption or revisions to our business, and adversely impact our results of operations and financial condition. In addition, other members of Congress and certain state governments have expressed a desire to establish alternatives to employer-sponsored health insurance or replace it with government-sponsored health insurance, often referred to as ‘Medicare for All’. Given the uncertainties relating to the potential repeal and replacement of Healthcare Reform or other alternative proposals related to health insurance plans, the impact is difficult to determine, but it could have material negative effects on us, including:
Any of these effects could materially harm our business and results of operations. For example, various aspects of Healthcare Reform could cause insurance carriers to limit the types of health insurance plans we are able to sell and the geographies in which we are able to sell them and to limit the compensation we may receive for our services. In addition, the U.S. Congress may seek to find spending cuts, and such cuts may include Medicare. If cuts are made to Medicare, there may be substantial changes in the types of health insurance plans we are able to sell, especially through our Individual Marketplace business, which focuses on direct-to-consumer Medicare policy sales. Further, changes in customer demand for these Medicare policies, particularly differences in customer persistency and renewals from what we have currently assumed, or changes in regulations could cause us to write down receivable assets we have booked. Changes in the law could also cause insurance carriers to exit the business of selling insurance plans in a particular jurisdiction, to eliminate certain categories of products or to attempt to move members into new plans for which we receive lower commissions, or to limit the services that they receive from us and/or the amount of compensation that they pay to us. If such legal or regulatory changes do occur, or if insurance carriers decide to limit our ability to sell their plans or determine not to sell individual health insurance plans altogether, our business, results of operations and financial condition would be materially harmed.
Our global operations expose us to increasing, and sometimes conflicting, legal and regulatory requirements in environmental, social and governance (‘ESG’) matters, and violation of these regulations could harm our business.
Increasing focus on ESG matters has resulted in, and is expected to continue to result in, the adoption of legal and regulatory requirements designed to mitigate, among other things, the effects of climate change on the environment, which require additional disclosure and reporting. As a result of our global operations, the regulatory requirements are also sometimes conflicting. If new laws or regulations are more stringent than current legal or regulatory requirements, or conflict, we may experience increased compliance burdens and costs to meet such obligations. In addition, our selection of voluntary disclosure frameworks and standards, and the interpretation or application of those frameworks and standards, may change from time to time or may not meet the expectations of investors or other stakeholders. Our ability to achieve our ESG commitments is subject to numerous risks, many of which are outside of our control, such as the availability and cost of low- or non-greenhouse gas-intensive energy sources, infrastructure and technologies, evolving regulatory requirements affecting ESG standards or disclosures, and the ESG posture of others in our value chain such as suppliers and other counterparties. We may also face challenges in obtaining sufficient information on such parties when seeking to evaluate how such relationships impact our own position on ESG matters. Furthermore, if we determine it is in the Company’s interest to do so, we may decide that a commitment or goal, or membership or support for certain ESG-related organizations or initiatives, should change or be withdrawn.
33
Our processes and controls for reporting ESG matters across our operations are evolving along with standards for identifying, measuring and reporting ESG metrics, including ESG-related disclosures that may be required by the SEC, European and other regulators, and such standards may change over time, which could result in significant revisions to our current goals, reported progress in achieving such goals, or ability to achieve such goals in the future. Methodologies for reporting ESG data may be updated and previously-reported ESG data may be adjusted to reflect: improvement in availability or quality of data, changing assumptions, changes in the nature and scope of our operations and other changes in circumstances. As we work to align our reporting with the recommendations of the Financial Stability Board’s Task Force on Climate-related Financial Disclosures, the Sustainability Accounting Standards Board and other reporting frameworks, and comply with the adoption of and changes to applicable legal and regulatory requirements, including reporting obligations pursuant to the Corporate Sustainability Reporting Directive as well as focus on our own ESG assessments and priorities, we may disclose additional metrics against which we may measure ourselves or be measured and tracked by others over time. We cannot predict future legal, regulatory and other developments in these areas, and any changes to the regulatory framework or our disclosure obligations could also negatively impact our business and results.
Increasing scrutiny and changing expectations from investors, clients and our colleagues with respect to our ESG practices can impose additional costs on us or expose us to reputational or other risks.
There is increased and sometimes conflicting focus, including from governments, non-governmental organizations, investors, colleagues and clients, on ESG issues such as environmental stewardship, climate change, diversity and inclusion, racial justice and workplace conduct. Negative public perception, adverse publicity or negative comments in social media and other forums could damage our reputation if we do not, or are not perceived to, adequately or appropriately address any one or more of these issues. Any harm to our reputation could impact colleague engagement and retention and the willingness of clients and others to do business with us.
Investors, in particular, have increased their emphasis on the ESG practices of companies across all industries, including with respect to climate and human capital management. Certain investors have developed their own ESG ratings while others use third-party benchmarks or scores to measure a company’s ESG practices and make investment decisions or otherwise engage with the company to influence its practices in these areas. Additionally, our clients may evaluate our ESG practices and/or request that we adopt certain ESG policies in order to work with us. Also, organizations that provide ratings information to certain investors on ESG matters may assign unfavorable ratings to the Company, which may lead to negative investor sentiment and the diversion of investment capital to other companies or industries, which could have a negative impact on the price of our ordinary shares and our costs of capital.
New government regulations could also result in new or more stringent forms of ESG oversight and new mandatory and voluntary reporting, diligence and disclosure. These new laws, rules and regulations of our business could affect our operations or require significant expenditures.
Our failure to meet expectations or metrics, whether expectations or metrics set by us or by investors or other stakeholders, or to any other failure to make progress in this area on a timely basis, or at all, could negatively impact our reputation and our business.
The economic, regulatory and political impact of the United Kingdom’s exit from the European Union, which occurred on January 31, 2020, could adversely affect us.
In 2023, approximately 18% of our revenue from continuing operations was generated in the U.K., although only about 11% of revenue from continuing operations was denominated in Pounds sterling as much of the insurance business is transacted in U.S. dollars or other currencies. Approximately 17% of our expenses from continuing operations were denominated in Pounds sterling. The impact that Brexit has had and may continue to have on the economy and market conditions in Europe, including in the U.K., or on the Pound sterling, Euro or other European currencies could materially adversely affect us and our operations. Among other things, the ongoing and future effects of Brexit could result in: lower growth in the region due to indecision by businesses holding off on generating new projects or due to adverse market conditions and/or reduced reported revenue and earnings because foreign currencies may translate into fewer U.S. dollars due to the fact that we convert revenue denominated in non-U.S. currencies, such as Pounds sterling, into U.S. dollars for our financial statements. In addition, there is a corresponding risk that our current or future hedging strategies may not be effective.
On December 24, 2020, the E.U. and the U.K. agreed to the terms of a Trade and Cooperation Agreement (the ‘TCA’) that reflects certain matters agreed upon between the parties in relation to a broad range of separation issues, which provisionally applied as of January 1, 2021, and entered into force on May 1, 2021. While many separation issues have been resolved, some uncertainty remains in relation to the future regulation of financial services, among other matters. The TCA addresses issues related to financial services on a limited basis. The E.U. and the U.K. have separately agreed to a Memorandum of Understanding to establish a framework for future regulatory cooperation. The British government and the E.U. will therefore continue over time to negotiate certain terms of the U.K.’s future relationship with the E.U. that are not addressed in the TCA. The Company is heavily invested in the U.K. through our businesses and activities. If the outcomes of Brexit and the TCA negatively impact the U.K., then it could have a material adverse impact on us.
34
Brexit has resulted in greater restrictions on business conducted between the U.K. and E.U. countries and has increased regulatory complexities. Uncertainty remains as to how changes to the U.K.’s access to the E.U. Single Market and the wider trading, legal, regulatory, tax, social and labor environments, especially in the U.K. and E.U., will be impacted over time, including the resulting impacts on our business and that of our clients. For example, the loss of pre-Brexit passporting rights or regulatory limitations on the ability to conduct business in various E.U. countries by relying on a regulatory permission in the U.K. (or, conversely, doing business in the U.K. by relying on a regulatory permission in an E.U. country) may increase our costs of doing business or our ability to conduct business in impacted jurisdictions. These Brexit-related changes may adversely affect our operations and financial results.
We believe we have implemented appropriate arrangements for the continued servicing of client business in the countries most affected. These arrangements include the transaction of certain businesses and/or the movement of certain businesses outside of the U.K. However, various significant risks remain in relation to the effects of the post-Brexit arrangements between the E.U. and U.K. some of which have yet to be agreed upon, including the following, among others:
There is also a risk that other countries may decide to leave the E.U. We cannot predict the impact that any additional countries leaving the E.U. will have on us, but any such impacts could materially adversely affect us.
Financial and Related Regulatory Risks
We have material pension liabilities that can fluctuate significantly and adversely affect our financial position or net income or result in other financial impacts.
We have material pension liabilities, some of which represent unfunded and underfunded pension and postretirement liabilities. Movements in the interest rate environment, investment returns, inflation, changes in other assumptions that are used to estimate our benefit obligations, changes to existing legislation or interpretation thereof, the outcome of current or future litigation, and other factors could have a material effect on the level of liabilities in these pension plans and schemes at any given time. Most pension plans and schemes have minimum funding requirements that may require material amounts of periodic additional funding and accounting requirements that may result in increased pension expense. Depending on the foregoing factors, among others, we could be required to recognize further pension expense in the future. Increased pension expense could adversely affect our earnings or cause earnings volatility. In addition, the need to make additional cash contributions may reduce our financial flexibility and increase liquidity risk by reducing the cash available to meet our other obligations, including the payment obligations under our credit facilities and other long-term debt or other needs of our business.
35
Our outstanding debt could adversely affect our cash flows and financial flexibility, and we may not be able to obtain financing on favorable terms or at all.
WTW had total consolidated debt outstanding of approximately $5.2 billion as of December 31, 2023, and our interest expense was $235 million for the year ended December 31, 2023.
Although management believes that our cash flows will be sufficient to service this debt, there may be circumstances in which required payments of principal and/or interest on this level of indebtedness may:
The terms of our current financings also include certain limitations. For example, the agreements relating to the debt arrangements and credit facility contain numerous operating and financial covenants, including requirements to maintain minimum ratios of consolidated EBITDA to consolidated cash interest expense and maximum levels of consolidated funded indebtedness to consolidated EBITDA, in each case subject to certain adjustments. The operating restrictions and financial covenants in our credit facility do, and any future financing agreements may, limit our ability to finance future operations or capital needs or to engage in other business activities.
A failure to comply with the restrictions under our credit facility and outstanding notes could result in a default or a cross-default under the financing obligations or could require us to obtain waivers from our lenders or noteholders, as applicable, for failure to comply with these restrictions. The occurrence of a default that is not cured, or the inability to secure a necessary consent or waiver, could cause our obligations with respect to our debt to be accelerated and have a material adverse effect on our business, financial condition or results of operations.
The maintenance and growth of our business depends on our access to capital, which will depend in large part on cash flow generated by our business and the availability of equity and debt financing. Also, we could be at risk to rising interest rates in the future to the extent that we borrow at floating rates under our existing borrowing agreements or refinance existing debt at higher rates. There can be no assurance that our operations will generate sufficient positive cash flow to finance all of our capital needs or that we will be able to obtain equity or debt financing on favorable terms or at all, which could have a material adverse effect on us.
A downgrade to our corporate credit rating, the credit ratings of our outstanding debt or other market speculation may adversely affect our borrowing costs and financial flexibility and, under certain circumstances, may require us to offer to buy back some of our outstanding debt.
A downgrade in our corporate credit rating or the credit ratings of our debt would increase our borrowing costs, including those under our credit facility, and reduce our financial flexibility. Real or anticipated changes in our credit ratings will generally affect any trading market for, or trading value of, our securities. Such changes could result from any number of factors, including the modification by a credit rating agency of the criteria or methodology it applies to particular issuers, a change in the agency’s view of us or our industry, or as a consequence of actions we take to implement our corporate strategies. If we need to raise capital in the future, any credit rating downgrade could negatively affect our financing costs or access to financing sources. A change in our credit rating could also adversely impact our competitive position.
In addition, under the indentures for our 3.600% senior notes due 2024, our 4.400% senior notes due 2026, our 4.650% senior notes due 2027, our 4.500% senior notes due 2028, our 2.950% senior notes due 2029, our 5.350% senior notes due 2033, our 6.125% senior notes due 2043, our 5.050% senior notes due 2048, and our 3.875% senior notes due 2049, if we experience a ratings decline together with a change of control event, we would be required to offer to purchase these notes from holders unless we had previously redeemed those notes. We may not have sufficient funds available or access to funding to repurchase tendered notes in that event, which could result in a default under the notes. Any future debt that we incur may contain covenants regarding repurchases in the event of a change of control triggering event.
Our significant non-U.S. operations, particularly our London market operations, expose us to exchange rate fluctuations and various other risks that could impact our business.
A significant portion of our operations is conducted outside of the U.S. Accordingly, we are subject to legal, economic and market risks associated with operating in foreign countries, including devaluations and fluctuations in currency exchange rates; imposition of limitations on conversion of foreign currencies into Pounds sterling or U.S. dollars or remittance of dividends and other payments by
36
foreign subsidiaries; hyperinflation in certain foreign countries; adverse or unexpected impacts of fiscal and monetary policies of foreign countries; imposition or increase of investment and other restrictions by foreign governments; and the requirement of complying with a wide variety of foreign laws.
We report our operating results and financial condition in U.S. dollars. Our U.S. operations earn revenue and incur expenses primarily in U.S. dollars. In our London market operations however, we earn revenue in a number of different currencies, but expenses are almost entirely incurred in Pounds sterling. Outside of the U.S. and our London market operations, we predominantly generate revenue and expenses in local currencies.
Because of devaluations and fluctuations in currency exchange rates or the imposition of limitations on conversion of foreign currencies into U.S. dollars, we are subject to currency translation exposure on the profits of our operations, in addition to economic exposure. Furthermore, the mismatch between Pounds sterling revenue and expenses, together with any net Pounds sterling balance sheet position we hold in our U.S. dollar-denominated London market operations, creates an exchange exposure. While we do utilize hedging strategies to attempt to reduce the impact of foreign currency fluctuations, there can be no assurance that our hedging strategies will be effective.
Changes in accounting principles or in our accounting estimates and assumptions could negatively affect our financial position and results of operations.
We prepare our financial statements in accordance with U.S. GAAP. Any change to accounting principles, particularly to U.S. GAAP, could have a material adverse effect on us or our results of operations.
U.S. GAAP accounting principles require us to make estimates and assumptions that affect the reported amounts of assets and liabilities, and the disclosure of contingent assets and liabilities at the date of our financial statements. We are also required to make certain judgments that affect the reported amounts of revenue and expenses during each reporting period. We periodically evaluate our estimates and assumptions, including those relating to revenue recognition, valuation of billed and unbilled receivables from clients, discretionary compensation, incurred-but-not-reported liabilities, restructuring, pensions, goodwill and other intangible assets, contingencies, share-based payments and income taxes. We base our estimates on historical experience and various assumptions that we believe to be reasonable based on specific circumstances. Actual results could differ from these estimates, and changes in accounting standards could have an adverse impact on our future financial position and results of operations.
In addition, we have a substantial amount of goodwill on our consolidated balance sheet as a result of acquisitions we have completed. We review goodwill for impairment annually or whenever events or circumstances indicate impairment may have occurred. Application of the impairment test requires judgment, including the identification of reporting units, assignment of assets, liabilities and goodwill to reporting units and the determination of the fair value of each reporting unit. A significant deterioration in a key estimate or assumption or a less significant deterioration to a combination of assumptions, or the sale of a part of a reporting unit, could result in an impairment charge in the future, which could have a significant adverse impact on our reported earnings.
Our quarterly revenue and cash flow could fluctuate, including as a result of factors outside of our control, while our expenses may remain relatively fixed or be higher than expected.
Quarterly variations in our revenue, cash flow and results of operations have occurred in the past and could occur as a result of a number of factors, such as: the significance of client engagements commenced and completed during a quarter; seasonality of certain types of services; the number of business days in a quarter; colleague hiring and utilization rates; our clients’ ability to terminate engagements without penalty; the size and scope of assignments; our ability to enhance our billing, collection and working capital management efforts; differences in timing of renewals; non-recurring revenue from disposals and book-of-business sales; and general economic conditions.
We derive significant revenue from commissions for brokerage services, but do not determine the insurance premiums on which our commissions are generally based. Commission levels generally follow the same trend as premium levels, as they are a percentage of the premiums paid by the insureds. Fluctuations in the premiums charged by the insurance carriers can therefore have a direct and potentially material impact on our results of operations. Due to the cyclical nature of the insurance market and the impact of other market conditions on insurance premiums, commission levels may vary widely between accounting periods. A period of low or declining premium rates, generally known as a ‘soft’ or ‘softening’ market, generally leads to downward pressure on commission revenue and can have a material adverse impact on our commission revenue and operating margin. We could be negatively impacted by soft market conditions across certain sectors and geographic regions. In addition, insurance carriers may seek to reduce their expenses by reducing the commission rates payable to insurance agents or brokers such as us. The reduction of these commission rates, along with general volatility and/or declines in premiums, may significantly undermine our profitability. Because we do not determine the timing or extent of premium pricing changes, it is difficult to accurately forecast our commission revenue, including whether they will significantly decline. As a result, we may have to adjust our plans for future acquisitions, capital expenditures,
37
dividend payments, loan repayments and other expenditures to account for unexpected changes in revenue, and any decreases in premium rates may adversely affect the results of our operations.
In addition to movements in premium rates, our ability to generate premium-based commission revenue may be challenged by disintermediation and the growing availability of alternative methods for clients to meet their risk-protection needs. This trend includes a greater willingness on the part of corporations to self-insure, the use of captive insurers, and the presence of capital markets-based solutions for traditional insurance and reinsurance needs. Further, the profitability of our risk and broking businesses depends in part on our ability to be compensated for the analytical services and other advice that we provide, including the consulting and analytics services that we provide to insurers. If we are unable to achieve and maintain adequate billing rates for all of our services, our margins and profitability could decline.
A sizeable portion of our total operating expenses is relatively fixed or may even be higher than expected, encompassing the majority of administrative, occupancy, communications and other expenses, depreciation and amortization, and salaries and employee benefits excluding fiscal year-end incentive bonuses. Therefore, a variation in the number of client assignments and collection of accounts receivable, or in the timing of the initiation or the completion of client assignments, or our inability to forecast demand, can cause significant variations in quarterly operating results and could result in losses and volatility in the price of our ordinary shares.
We are a holding company and therefore, may not be able to receive dividends or other distributions in needed amounts from our subsidiaries.
The Company is organized as a holding company, a legal entity separate and distinct from our operating subsidiaries. As a holding company without significant operations of our own, we are dependent upon dividends and other payments from our operating subsidiaries to meet our obligations for paying principal and interest on outstanding debt obligations, for paying dividends to shareholders, for repurchasing our ordinary shares and for corporate expenses. Legal and regulatory restrictions, foreign exchange controls, as well as operating requirements of our subsidiaries, may limit our ability to obtain cash from these subsidiaries. For example, Willis Limited, our U.K. brokerage subsidiary regulated by the FCA, is currently required to maintain $105 million in unencumbered and available financial resources, of which at least $66 million must be in cash, for regulatory purposes. In the event our operating subsidiaries are unable to pay dividends and other payments to the Company, we may not be able to service debt, pay obligations or pay dividends on, or repurchase, our ordinary shares. In the event we are unable to generate cash from our operating subsidiaries for any of the reasons discussed above, our overall liquidity could deteriorate.
Tax Risks
If a U.S. person is treated as owning at least 10% of our shares, such a holder may be subject to adverse U.S. federal income tax consequences.
Under current U.S. federal tax law, many of our non-U.S. subsidiaries are now classified as ‘controlled foreign corporations’ (‘CFCs’) for U.S. federal income tax purposes due to the expanded application of certain ownership attribution rules within a multinational corporate group. If a U.S. person is treated as owning (directly, indirectly or constructively) at least 10% of the value or voting power of our shares, such a person may be treated as a U.S. shareholder with respect to one or more of our CFC subsidiaries. In addition, if our shares are treated as owned more than 50% by U.S. shareholders, we would be treated as a CFC. A U.S. shareholder of a CFC may be required to annually report and include in its U.S. taxable income, as ordinary income, its pro-rata share of Subpart F income, global intangible low-taxed income, and investments in U.S. property by CFCs, whether or not we make any distributions to such U.S. shareholder. An individual U.S. shareholder generally would not be allowed certain tax deductions or foreign tax credits that would be allowed to a corporate U.S. shareholder with respect to a CFC. A failure by a U.S. shareholder to comply with its reporting obligations may subject the U.S. shareholder to significant monetary penalties and may extend the statute of limitations with respect to the U.S. shareholder’s U.S. federal income tax return for the year for which such reporting was due. We cannot provide any assurances that we will assist investors in determining whether we or any of our non-U.S. subsidiaries are CFCs or whether any investor is a U.S. shareholder with respect to any such CFCs. We also cannot guarantee that we will furnish to U.S. shareholders any or all of the information that may be necessary for them to comply with the aforementioned obligations. U.S. investors should consult their own advisors regarding the potential application of these rules to their investments in us.
38
Legislative or regulatory action or developments in case law in the U.S. or elsewhere could have a material adverse impact on our worldwide effective corporate tax rate.
We cannot give any assurance as to what our effective tax rate will be in the future, because of, among other things, uncertainty regarding the tax laws and policies of the jurisdictions where we operate. Our actual effective tax rate may vary from expectations, and that variance may be material.
The tax laws of Ireland and other jurisdictions could change in the future. There may be an enactment of additional, or the revision of existing, state, federal and/or non-U.S. regulatory and tax laws, and/or a development of case law, regulations and policy changes in the jurisdictions in which we operate. Any such changes could cause a material change in our effective tax rate.
Further, it is possible that taxing authorities may propose significant changes, which, if executed, could limit the availability of tax benefits or deductions that we currently claim, override tax treaties upon which we rely, or otherwise affect the taxes that Ireland, the U.S. or other territories impose on our worldwide operations.
Such new legislation (or changes to existing legislation or interpretation thereof) could materially adversely affect our effective tax rate and/or require us to take further action, at potentially significant additional expense, to seek to preserve our effective tax rate. Relatedly, if proposals were enacted that have the effect of limiting our ability as an Irish company to take advantage of tax treaties with the U.S. or other territories, we could incur additional tax expense and/or otherwise experience business detriment.
For example, in August 2022, the U.S. enacted the Inflation Reduction Act of 2022 (‘IRA’), which, among other effects, creates a new corporate alternative minimum tax of at least 15% on adjusted financial statement income for certain corporations with average book income of more than $1 billion. The book minimum tax applies to us in 2023 and did not have a material impact on our effective tax rate.
In addition, the U.S. Congress, the Organization for Economic Co-operation and Development (‘OECD’), the World Trade Organization and other government agencies in non-U.S. jurisdictions where we and our affiliates do business have had an extended focus on issues related to the taxation of multinational corporations. One example is around base erosion and profit shifting, where payments are made between affiliates from a jurisdiction with high tax rates to a jurisdiction with lower tax rates. Several jurisdictions have enacted legislation that is aligned with, and in some cases exceeds the scope of, the recommendations in the OECD’s 2015 reports addressing 15 specific actions as part of a comprehensive plan to create an agreed set of international rules for fighting base erosion and profit shifting.
Finally, on October 8, 2021, the OECD announced an international agreement with more than 140 countries to implement a two-pillar solution to address tax challenges arising from digitalization of the economy. The agreement introduced rules that would result in the reallocation of certain taxing rights over multinational companies from their home countries to the markets where they have business activities and earn profits, regardless of physical presence (‘Pillar One’) and introduced a global corporate minimum tax of 15% for certain large multinational companies starting in 2024 (‘Pillar Two’). On December 20, 2021, the OECD/G20 Inclusive Framework on Base Erosion and Profit Shifting released the Model Global Anti-Base Erosion (‘GloBE’) rules (the ‘OECD Model Rules’) under Pillar Two. On December 12, 2022, E.U. member states reached an agreement to implement Pillar Two and this requires E.U. member states to enact domestic legislation to put Pillar Two into effect. In 2023, many E.U. countries enacted the necessary legislation (based on the OECD Model Rules) to implement Pillar Two in 2024. Ireland, in particular, enacted Pillar Two by signing Finance (No. 2) Bill 2023 into law in December 2023. Other countries and territories have indicated they will introduce Pillar Two beginning in 2025.
These changes, when enacted and implemented by various countries in which we do business, could increase uncertainty and may adversely affect our tax rate and cash flow in future years.
Risks Related to Being an Irish-Incorporated Company
The laws of Ireland differ from the laws in effect in the United States and may afford less protection to holders of our securities.
It may not be possible to enforce court judgments obtained in the U.S. against us in Ireland, based on the civil liability provisions of the U.S. federal or state securities laws. In addition, there is some uncertainty as to whether the courts of Ireland would recognize or enforce judgments of U.S. courts obtained against us or our directors or officers based on the civil liabilities provisions of the U.S. federal or state securities laws or hear actions against us or those persons based on those laws. We have been advised that the U.S. currently does not have a treaty with Ireland providing for the reciprocal recognition and enforcement of judgments in civil and commercial matters. Therefore, a final judgment for the payment of money rendered by any U.S. federal or state court based on civil liability, whether or not based solely on U.S. federal or state securities laws, would not automatically be enforceable in Ireland.
As an Irish company, we are governed by the Irish Companies Act, which differs in some material respects from laws generally applicable to U.S. corporations and shareholders, including, among others, differences relating to interested director and officer transactions and shareholder lawsuits. Likewise, the duties of directors and officers of an Irish company generally are owed to the
39
company only. Shareholders of Irish companies generally do not have a personal right of action against directors or officers of the company and may exercise such rights of action on behalf of the company only in limited circumstances. Accordingly, holders of our securities may have more difficulty protecting their interests than would holders of securities of a corporation incorporated in a jurisdiction of the United States.
As an Irish public limited company, certain decisions related to our capital structure will require the approval of shareholders, which may limit our flexibility to manage our capital structure.
Irish law generally provides that a board of directors may allot and issue shares (or rights to subscribe for or convert into shares) if authorized to do so by a company’s constitution or by an ordinary resolution of shareholders. Such authorization may be granted in respect of up to the entirety of a company’s authorized but unissued share capital and for a maximum period of five years, at which point it must be renewed by another ordinary resolution. The Company’s constitution authorizes our directors to allot shares up to the maximum of the Company’s authorized but unissued share capital for a period of five years. This authorization will need to be renewed by ordinary resolution upon its expiration and at periodic intervals thereafter. Under Irish law, an allotment authority may be given for up to five years at each renewal, but governance considerations may result in renewals for shorter periods or in respect of less than the maximum permitted number of shares being sought or approved.
Additionally, under Irish law, we may only pay dividends and, generally, make share repurchases and redemptions from distributable profits. Distributable profits may be created through the earnings of the Company or other methods (including certain intragroup reorganizations involving the capitalization of the Company’s undistributable profits and their subsequent reduction). While it is our intention to maintain a sufficient level of distributable profits in order to pay dividends on our ordinary shares and make share repurchases, there is no assurance that the Company will maintain the necessary level of distributable profits to do so.
ITEM 1B. UNRESOLVED STAFF COMMENTS
None.
ITEM 1C. CYBERSECURITY
WTW’s management is responsible for the day-to-day management of risks, and the board, including through its committees, is responsible for understanding and overseeing the various risks facing WTW.
Cybersecurity Risk Management and Strategy
Increased global cybersecurity vulnerabilities, threats and more sophisticated and targeted cyber-related attacks pose an ongoing risk to the security of our information systems and networks. WTW seeks to manage cybersecurity risks consistent with its general approach to enterprise risk management (‘ERM’). Technology and cyber risks that meet certain thresholds are escalated and tracked by the ERM team within the Risk function.
WTW engages third parties to conduct assessments to help it identify, categorize and manage cyber risks including SOC 2 - Type 2, ISO 27001 and a National Institute of Standards and Technology (‘NIST’) cybersecurity maturity assessment. Additionally, management and third parties from time to time conduct penetration testing and vulnerability scanning to help WTW identify and reduce the threat of known and emerging cybersecurity risks.
Board Oversight and Governance
WTW’s board of directors has delegated the oversight of risks to the Audit and Risk Committee through its charter. The Audit and Risk Committee assists the board of directors in its oversight of the ERM framework, policies and practices used by WTW to identify, assess and manage key risks facing WTW, including financial and strategic risks as well as risks relating to matters of compliance and internal control, tax and pension, among other matters. The Operational Transformation Committee (the ‘OT Committee’) oversees risks arising out of WTW’s operations related to cybersecurity and other risks. WTW’s Chief Information Security Officer (‘CISO’) and Chief Information Officer (‘CIO’) report to the OT Committee on cybersecurity matters, including key risks. The OT Committee reports to the board of directors at each formal board meeting and the board of directors discusses those reports.
Management Oversight and Governance
Management plays an important role in assessing and managing WTW’s material risks from cybersecurity threats. The CISO is responsible for designing and implementing a security program and strategy. WTW's CISO has served in various roles in information technology and information security for over 32 years, including serving as CISO of several public companies. The CISO holds undergraduate and graduate degrees in mathematics and strategic information systems and has attained the professional certification of
40
Certified Information Systems Security Professional. The CISO reports to the CIO. WTW's CIO has served in various roles in information technology for over 36 years.
As part of the WTW cybersecurity program, cross-functional teams throughout WTW address cybersecurity threats and respond to cybersecurity incidents. Through ongoing communications with these teams, the CISO and senior management are informed about and monitor the prevention, detection, mitigation and remediation of cybersecurity threats and incidents and escalate such threats and incidents as appropriate through the processes described in more detail below.
Management’s cybersecurity risk management strategy and processes focus on several key areas, including:
Material Effects of Cybersecurity Incidents
We do not believe that risks from cybersecurity threats, including as a result of any previous cybersecurity incidents, have materially affected our business strategy, results of operations, or financial condition. However, there is no guarantee that a future cyber incident would not materially affect our business strategy, results of operations or financial condition. To learn more about risks from cybersecurity threats, review the risk factors included in Part I, Item 1A Risk Factors in this Annual Report on Form 10-K, as updated by WTW’s subsequent SEC filings. The risks described in such filings are not the only risks facing WTW. Additional risks and uncertainties not currently known or that may currently be deemed to be immaterial also may materially adversely affect WTW’s business, financial condition or results of operations.
ITEM 2. PROPERTIES
We operate offices in many countries throughout the world and believe that our properties are generally suitable and adequate for the purposes for which they are used. The principal properties are located in the United States and the United Kingdom. In addition, we have other offices in various locations, including among others, Europe, Asia, Australia and Latin America. Operations of each of our segments are carried out in owned or leased offices under operating leases that typically do not exceed 10 years in length, except for certain properties in key locations. We do not anticipate difficulty in meeting our space needs at lease expiration.
ITEM 3. LEGAL PROCEEDINGS
From time to time, we are party to various lawsuits, arbitrations or mediations that arise in the ordinary course of business. The disclosure called for by Item 3 regarding our legal proceedings is incorporated by reference herein from Note 15 — Commitments and Contingencies, within Item 8 in this Annual Report on Form 10-K.
ITEM 4. MINE SAFETY DISCLOSURES
Not applicable.
41
PART II.
ITEM 5. MARKET FOR REGISTRANT’S COMMON EQUITY, RELATED STOCKHOLDER MATTERS AND ISSUER PURCHASES OF EQUITY SECURITIES
Share Data
Our ordinary shares trade on the NASDAQ Global Select Market under the symbol ‘WTW’ as of January 10, 2022. As of February 16, 2024, there were 1,020 shareholders of record of our ordinary shares, not including those ordinary shares held in street or nominee name.
Dividends
We normally pay dividends on a quarterly basis to shareholders of record on March 31, June 30, September 30 and December 31. In February 2024, the board of directors is expected to approve a quarterly cash dividend to shareholders of record as of March 31, 2024.
There are no governmental laws, decrees or regulations in Ireland that restrict the remittance of dividends or other payments to non-resident holders of the Company’s shares.
In circumstances where one of Ireland’s many exemptions from dividend withholding tax (‘DWT’) does not apply, dividends paid by the Company will be subject to Irish DWT (currently 20 percent). Residents of the United States should be exempt from Irish DWT provided relevant documentation supporting the exemption has been put in place. While the U.S.-Ireland Double Tax Treaty contains provisions reducing the rate of Irish DWT in prescribed circumstances, it should generally be unnecessary for U.S. residents to rely on the provisions of this treaty due to the wide scope of exemptions from Irish DWT available under Irish domestic law. Irish income tax may also arise in respect of dividends paid by the Company. However, U.S. residents entitled to an exemption from Irish DWT generally have no Irish income tax liability on dividends.
With respect to non-corporate U.S. shareholders, certain dividends from a qualified foreign corporation may be subject to reduced rates of taxation. A foreign corporation is treated as a qualified foreign corporation with respect to dividends received from that corporation on shares that are readily tradeable on an established securities market in the United States, such as our shares. Non-corporate U.S. shareholders that do not meet a minimum holding period requirement for our shares during which they are not protected from the risk of loss or that elect to treat the dividend income as investment income pursuant to section 163(d)(4) of the Code will not be eligible for the reduced rates of taxation regardless of our status as a qualified foreign corporation. In addition, the rate reduction will not apply to dividends if the recipient of a dividend is obligated to make related payments with respect to positions in substantially similar or related property. This disallowance applies even if the minimum holding period has been met. U.S. shareholders should consult their own tax advisors regarding the application of these rules given their particular circumstances.
42
Performance Graph
Comparison of Five-Year Cumulative Total Shareholder Return
The graph below depicts cumulative total shareholder returns for WTW for the period from December 31, 2018 through December 31, 2023.
The graph also depicts the total return for the S&P 500 and for a peer group for WTW comprised of Aon plc, Arthur J. Gallagher & Co., Automatic Data Processing, Inc., Booz Allen Hamilton Holding Corporation, Cognizant Technology Solutions Corporation, Conduent Incorporated, Fidelity National Financial, Inc., Fidelity National Information Services, Inc., First American Financial Corporation, Fiserv, Inc., Marsh & McLennan Companies, Inc., Principal Financial Group, Inc., Robert Half International Inc., S&P Global Inc., The Hartford Financial Services Group, Inc., and Unum Group. The graph charts the performance of $100 invested on the initial date indicated, December 31, 2018, assuming full dividend reinvestment.
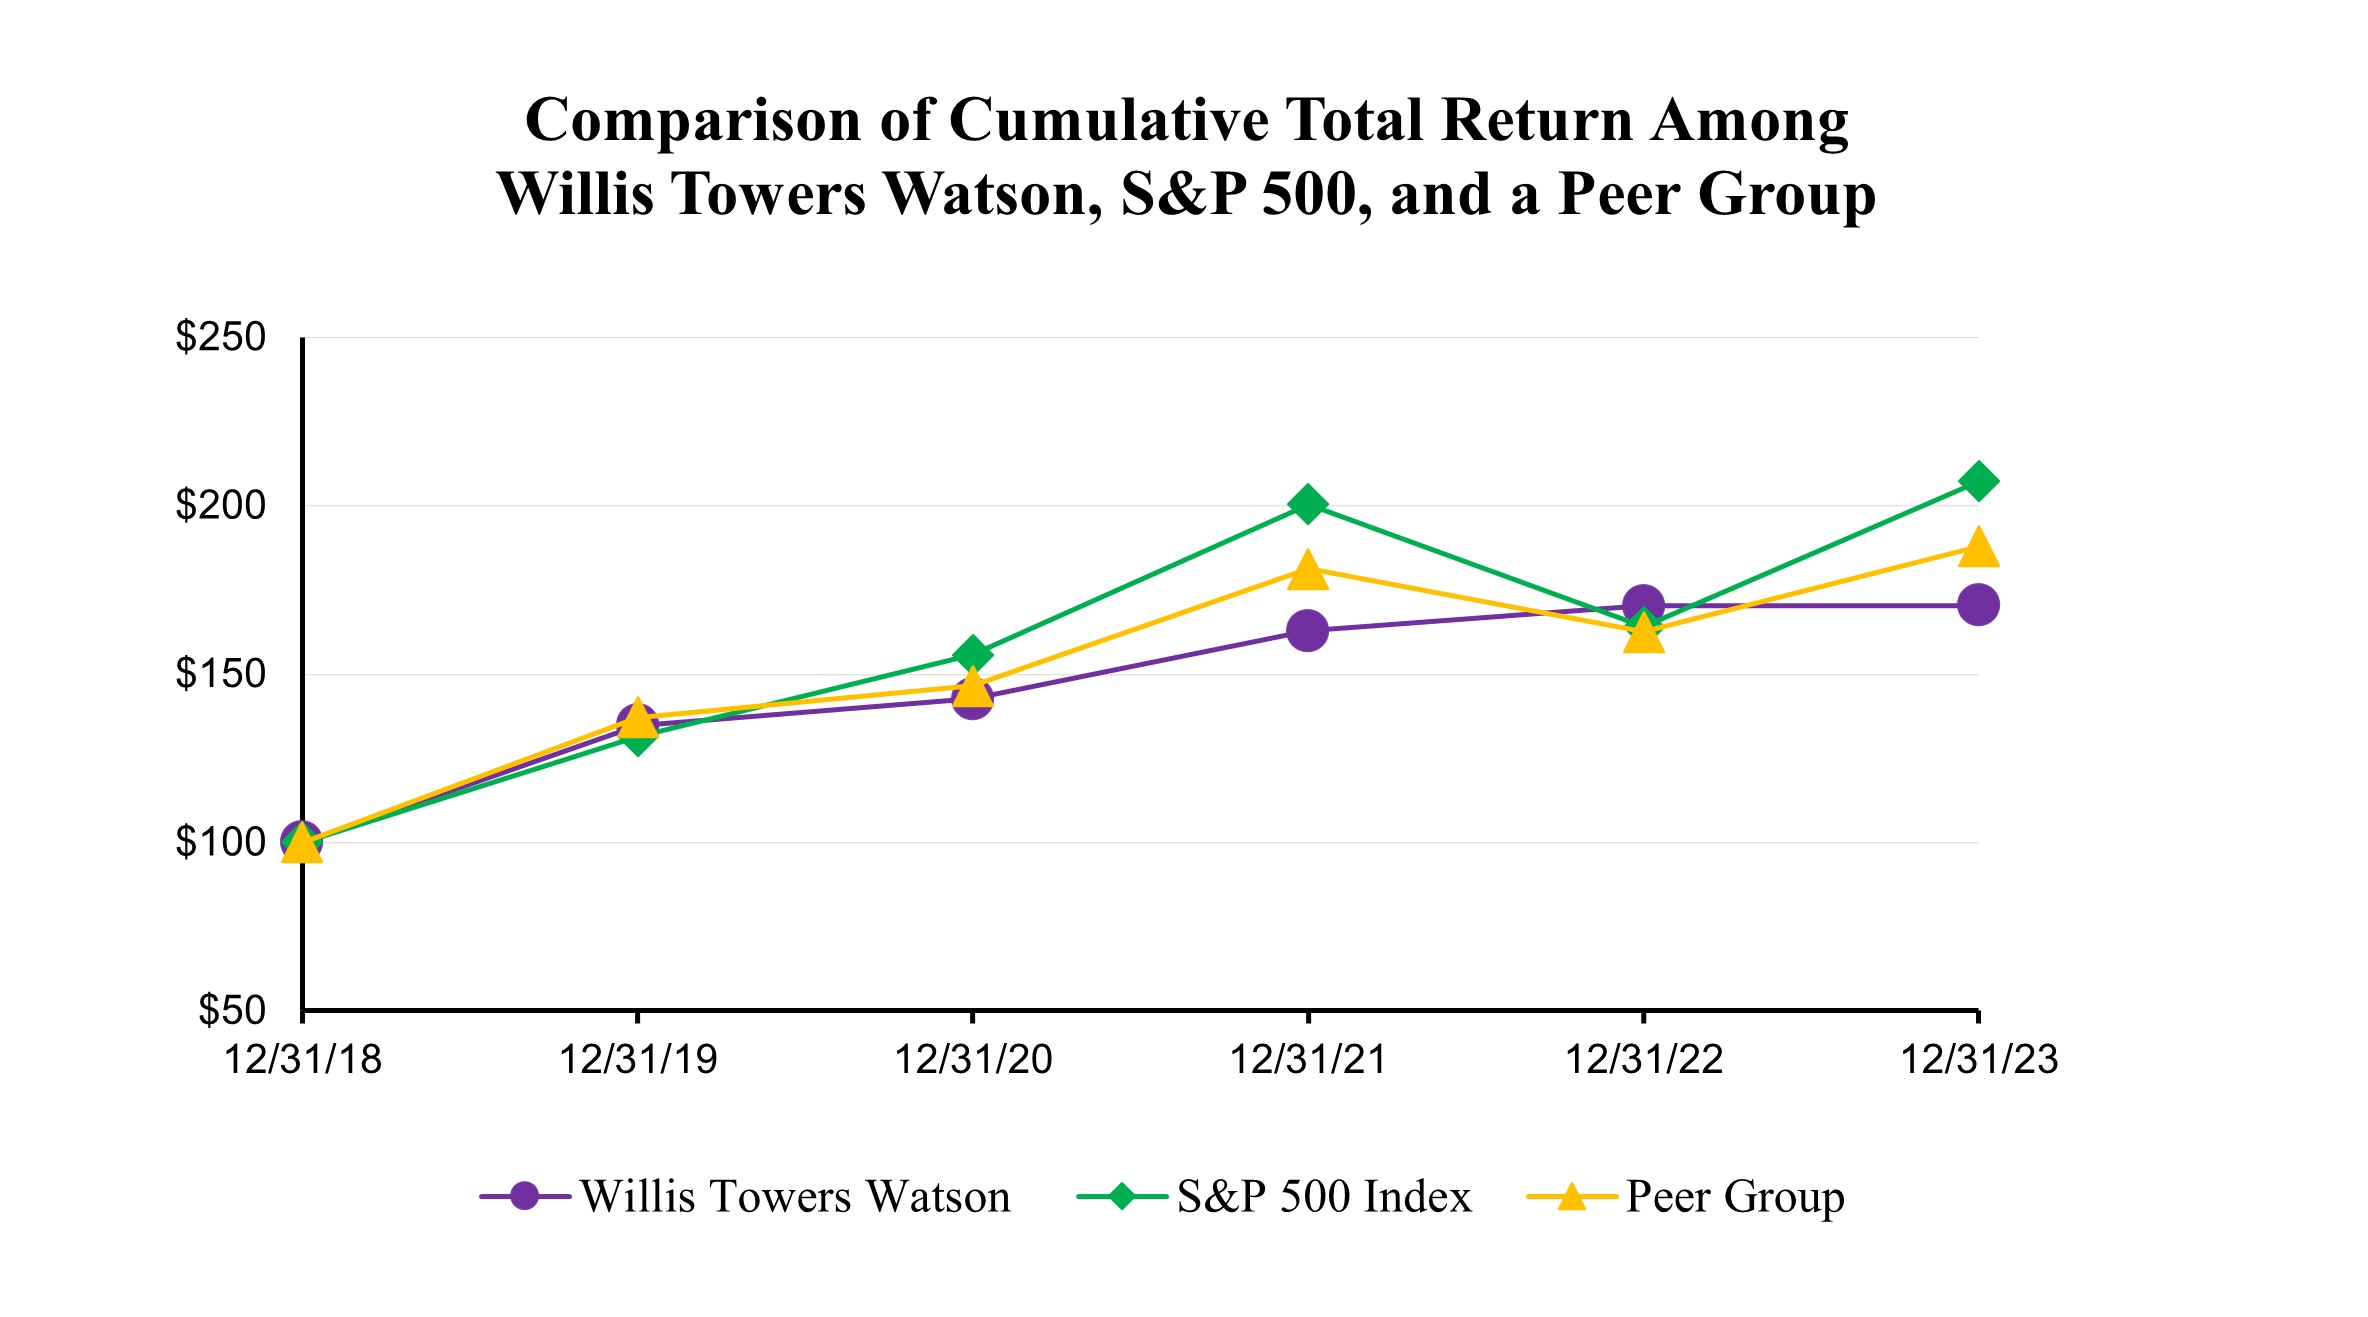
Unregistered Sales of Equity Securities and Use of Proceeds
During the year ended December 31, 2023, no shares were issued by the Company without registration under the Securities Act of 1933, as amended.
Purchases of Equity Securities by the Issuer and Affiliated Purchasers
The Company is authorized to repurchase shares, by way of redemption, and will consider whether to do so from time to time, based on many factors, including market conditions. Since April 20, 2016, when the WTW board reconfirmed, reapproved and reauthorized the remaining $529 million portion of the Legacy Willis program to repurchase the Company’s ordinary shares on the open market or by way of redemption or otherwise, the following additional authorizations have occurred:
43
There are no expiration dates for these repurchase plans or programs. The following table presents specified information about the Company’s repurchases of ordinary shares in the fourth quarter and the Company’s repurchase authority.
Period |
Total number of shares purchased |
|
|
Average price paid per share |
|
|
Total number of shares purchased as part of publicly announced plans or programs |
|
|
Maximum number of shares that may yet be purchased under the plans or programs |
|
||||
October 1, 2023 through October 31, 2023 |
|
119,221 |
|
|
$ |
209.69 |
|
|
|
119,221 |
|
|
|
6,278,743 |
|
November 1, 2023 through November 30, 2023 |
|
359,608 |
|
|
$ |
239.52 |
|
|
|
359,608 |
|
|
|
5,919,135 |
|
December 1, 2023 through December 31, 2023 |
|
353,180 |
|
|
$ |
240.29 |
|
|
|
353,180 |
|
|
|
5,565,955 |
|
|
|
832,009 |
|
|
$ |
235.57 |
|
|
|
832,009 |
|
|
|
|
|
At December 31, 2023, the maximum number of shares that may be purchased under the existing stock repurchase program is 5,565,955, with approximately $1.3 billion remaining on the current open-ended repurchase authority granted by the board. An estimate of the maximum number of shares under the existing authorities was determined using the closing price of our ordinary shares on December 31, 2023 of $241.20.
Securities Authorized for Issuance Under Equity Compensation Plans
The following table provides information, as of December 31, 2023, about the securities authorized for issuance under the Company’s equity compensation plans and is categorized according to whether or not the equity plan was previously approved by shareholders.
Plan Category |
|
Number of Shares to be Issued Upon Exercise of Outstanding Options, Warrants and Rights |
|
Weighted Average Exercise Price of Outstanding Options, Warrants and Rights |
|
Number of Shares Remaining Available for Future Issuance (ii) |
Equity Compensation Plans Approved by Security Holders (i) |
|
1,563,028 |
|
— |
|
4,924,629 |
Equity Compensation Plans Not Approved by Security Holders |
|
— |
|
— |
|
— |
Total |
|
1,563,028 |
|
— |
|
4,924,629 |
44
ITEM 6. [Reserved]
45
ITEM 7. MANAGEMENT’S DISCUSSION AND ANALYSIS OF FINANCIAL CONDITION AND RESULTS OF OPERATIONS
This discussion includes forward-looking statements. See ‘Disclaimer Regarding Forward-looking Statements’ for certain cautionary information regarding forward-looking statements and Part I, Item 1A Risk Factors for a list of factors that could cause actual results to differ materially from those predicted in those statements.
This discussion includes references to non-GAAP financial measures as defined in the rules of the SEC. We present such non-GAAP financial measures, specifically, adjusted, constant currency and organic non-GAAP financial measures, as we believe such information is of interest to the investment community because it provides additional meaningful methods of evaluating certain aspects of the Company’s operating performance from period to period on a basis that may not be otherwise apparent under U.S. GAAP, and these provide a measure against which our businesses may be assessed in the future.
Our methods of calculating these measures may differ from those used by other companies and therefore comparability may be limited. These financial measures should be viewed in addition to, not in lieu of, the consolidated financial statements for the year ended December 31, 2023.
See ‘Non-GAAP Financial Measures’ below for further discussion of our adjusted, constant currency and organic non-GAAP financial measures.
Executive Overview
Market Conditions
Typically, our business benefits from regulatory change, political risk or economic uncertainty. Insurance broking generally tracks the economy, but demand for both insurance broking and consulting services usually remains steady during times of uncertainty. We have some businesses, such as our health and benefits and administration businesses, which can be counter cyclical during the early period of a significant economic change.
Within our insurance and brokerage business, due to the cyclical nature of the insurance market and the impact of other market conditions on insurance premiums, commission revenue may vary widely between accounting periods. A period of low or declining premium rates, generally known as a ‘soft’ or ‘softening’ market, generally leads to downward pressure on commission revenue and can have a material adverse impact on our revenue and operating margin. A ‘hard’ or ‘firming’ market, during which premium rates rise, generally has a favorable impact on our revenue and operating margin. Rates, however, vary by geography, industry and client segment. As a result, and due to the global and diverse nature of our business, we view rates in the aggregate. Overall, we are currently seeing a stabilizing market.
Market conditions in the broking industry in which we operate are generally defined by factors such as the strength of the economies in the various geographic regions in which we serve around the world, insurance rate movements, and insurance and reinsurance buying patterns of our clients.
The markets for our consulting, technology and solutions, and marketplace services are affected by economic, regulatory and legislative changes, technological developments, and increased competition from established and new competitors. We believe that the primary factors in selecting a human resources or risk management consulting company include reputation, the ability to provide measurable increases to shareholder value and return on investment, global scale, quality of service and the ability to tailor services to clients’ unique needs. In that regard, we are focused on developing and implementing technology, data and analytic solutions for both internal operations and for maintaining industry standards and meeting client preferences. We have made such investments from time to time and may decide, based on perceived business needs, to make investments in the future that may be different from past practice or what we currently anticipate.
With regard to the market for exchanges, we believe that clients base their decisions on a variety of factors that include the ability of the provider to deliver measurable cost savings for clients, a strong reputation for efficient execution and an innovative service delivery model and platform. Part of the employer-sponsored insurance market has matured and become more fragmented while other segments remain in the entry phase. As these market segments continue to evolve, we may experience growth in intervals, with periods of accelerated expansion balanced by periods of modest growth. In recent years, growth in the market for exchanges has slowed, and this trend may continue.
Risks and Uncertainties of the Economic Environment
U.S. and global markets are continuing to experience volatility and disruption as a result of the ongoing Russia-Ukraine and Israel-Hamas wars. Although the length and impact of these ongoing situations are highly unpredictable, they have caused disruption in the global markets and could continue to lead to further market disruptions. The conflicts have contributed to negative impacts on and
46
volatility of the global economy and capital markets, resulting in significant inflation and fluctuating interest rates in many of the markets in which we operate. This impacts not only the cost of and access to liquidity, but also other costs to run and invest in our business.
Other global economic events, such as accommodative monetary and fiscal policy and geopolitical tensions beyond the ongoing wars, have also contributed to significant inflation across the globe. In particular, inflation in the United States, Europe, and other geographies has risen to levels not experienced in recent decades and we are seeing its impact on various aspects of our business. Moreover, U.S. and global economic conditions have created market uncertainty and volatility. Such general economic conditions, including inflation, stagflation, political volatility, costs of labor, cost of capital, interest rates, bank stability, credit availability, and tax rates, affect our operating and general and administrative expenses, and we have no control or limited ability to control such factors. These general economic conditions can also impact revenue, including revenue from customers as well as income from funds we hold on behalf of customers and pension-related income.
From time to time, our financial results have been (such as in 2021 and 2022), and may in the future be, negatively impacted by adverse workforce factors in a number of businesses, particularly commercial risk broking and health and benefits broking. Additionally, our performance has benefited (such as in 2021 and 2022), and may benefit in the future, from revenue from book sales, which is non-recurring revenue. The net impact of these factors, which caused our growth in 2021 and 2022 to be meaningfully slower than other competitors, has affected the comparability of our 2022 results against those in 2023 and could affect comparability of other future periods. See Part I, Item 1A Risk Factors in this Annual Report on Form 10-K for a discussion of risks that may affect our growth relative to expectations and our ability to compete.
Transformation Program
In the fourth quarter of 2021, the Company initiated a three-year ‘Transformation program’ designed to enhance operations, optimize technology and align its real estate footprint to its new ways of working. During the fourth quarter of 2023, we revised the expected costs and savings under the program and we now expect the program to generate annual cost savings in excess of $425 million by the end of 2024. The program is expected to incur cumulative costs of approximately $995 million and capital expenditures of approximately $130 million, for a total investment of $1.125 billion. The main categories of charges have been in the following four areas:
Certain costs under the Transformation program are accounted for under ASC 420, Exit or Disposal Cost Obligation, and are included as restructuring costs in the consolidated statements of comprehensive income. For the years ended December 31, 2023, 2022 and 2021, restructuring charges under our Transformation program totaled $68 million, $99 million and $26 million, respectively. Other costs incurred under the Transformation program are included in transaction and transformation, net and were $347 million and $136 million for the years ended December 31, 2023 and 2022, respectively.
From the actions taken during 2023, we have identified an additional $188 million of annualized run-rate savings during the year due to newly-realized opportunities and incremental sources of value. Since the inception of the program, we have identified $337 million of cumulative annualized run-rate savings, which overall are primarily attributable to process optimization. We began to recognize the benefits from the program during 2022.
For a discussion of material risks associated with the Transformation program, please see Part I, Item 1A Risk Factors - ‘We may not be able to fully realize the anticipated benefits of our growth strategy or our expected product, service and transaction pipelines’ and other Risk Factors in this Annual Report on Form 10-K.
47
For management’s discussion of our results of operations for the year ended December 31, 2022 in comparison with the year ended December 31, 2021, please see our Annual Report on Form 10-K filed with the SEC on February 24, 2023.
Financial Statement Overview
The tables below set forth our summarized consolidated statements of comprehensive income and data as a percentage of revenue for the periods indicated.
Consolidated Statements of Comprehensive Income
($ in millions, except per share data)
|
|
Years ended December 31, |
|
|||||||||||||
|
|
2023 |
|
|
2022 |
|
||||||||||
|
|
|
|
|
|
|
|
|
|
|
|
|
||||
Revenue |
|
$ |
9,483 |
|
|
|
100 |
% |
|
$ |
8,866 |
|
|
|
100 |
% |
Costs of providing services |
|
|
|
|
|
|
|
|
|
|
|
|
||||
Salaries and benefits |
|
|
5,344 |
|
|
|
56 |
% |
|
|
5,065 |
|
|
|
57 |
% |
Other operating expenses |
|
|
1,815 |
|
|
|
19 |
% |
|
|
1,776 |
|
|
|
20 |
% |
Depreciation |
|
|
242 |
|
|
|
3 |
% |
|
|
255 |
|
|
|
3 |
% |
Amortization |
|
|
263 |
|
|
|
3 |
% |
|
|
312 |
|
|
|
4 |
% |
Restructuring costs |
|
|
68 |
|
|
|
1 |
% |
|
|
99 |
|
|
|
1 |
% |
Transaction and transformation |
|
|
386 |
|
|
|
4 |
% |
|
|
181 |
|
|
|
2 |
% |
Total costs of providing services |
|
|
8,118 |
|
|
|
|
|
|
7,688 |
|
|
|
|
||
Income from operations |
|
|
1,365 |
|
|
|
14 |
% |
|
|
1,178 |
|
|
|
13 |
% |
Interest expense |
|
|
(235 |
) |
|
|
(2 |
)% |
|
|
(208 |
) |
|
|
(2 |
)% |
Other income, net |
|
|
149 |
|
|
|
2 |
% |
|
|
288 |
|
|
|
3 |
% |
INCOME FROM CONTINUING OPERATIONS |
|
|
1,279 |
|
|
|
13 |
% |
|
|
1,258 |
|
|
|
14 |
% |
Provision for income taxes |
|
|
(215 |
) |
|
|
(2 |
)% |
|
|
(194 |
) |
|
|
(2 |
)% |
INCOME FROM CONTINUING OPERATIONS |
|
|
1,064 |
|
|
|
11 |
% |
|
|
1,064 |
|
|
|
12 |
% |
LOSS FROM DISCONTINUED OPERATIONS, |
|
|
— |
|
|
|
— |
% |
|
|
(40 |
) |
|
|
— |
% |
Income attributable to non-controlling interests |
|
|
(9 |
) |
|
|
— |
% |
|
|
(15 |
) |
|
|
— |
% |
NET INCOME ATTRIBUTABLE TO WTW |
|
$ |
1,055 |
|
|
|
11 |
% |
|
$ |
1,009 |
|
|
|
11 |
% |
Diluted earnings per share from continuing operations |
|
$ |
9.95 |
|
|
|
|
|
$ |
9.34 |
|
|
|
|
||
Consolidated Revenue (Continuing Operations)
We derive the majority of our revenue from commissions from our brokerage services and fees for consulting and administration services. No single client represented a significant concentration of our consolidated revenue for any of our three most recent fiscal years.
The following table details our top five markets based on percentage of consolidated revenue (in U.S. dollars) from the countries where work was performed for the year ended December 31, 2023. These figures do not represent the currency of the related revenue, which is presented in the next table.
Geographic Region |
|
% of Revenue |
|
|
United States |
|
|
53 |
% |
United Kingdom |
|
|
18 |
% |
France |
|
|
4 |
% |
Canada |
|
|
3 |
% |
Germany |
|
|
3 |
% |
48
The table below details the approximate percentage of our revenue and expenses from continuing operations by transactional currency for the year ended December 31, 2023.
Transactional Currency |
|
Revenue |
|
|
Expenses (i) |
|
||
U.S. dollars |
|
|
60 |
% |
|
|
54 |
% |
Pounds sterling |
|
|
11 |
% |
|
|
17 |
% |
Euro |
|
|
14 |
% |
|
|
12 |
% |
Other currencies |
|
|
15 |
% |
|
|
17 |
% |
The following table sets forth the total revenue for the years ended December 31, 2023 and 2022 and the components of the change in total revenue for the year ended December 31, 2023, as compared to the prior year. The components of the revenue change may not add due to rounding.
|
|
|
|
|
|
|
|
|
|
Components of Revenue Change |
||||||||
|
|
|
|
|
|
|
|
As |
|
Less: |
|
Constant |
|
Less: |
|
|
||
|
|
Years Ended December 31, |
|
|
Reported |
|
Currency |
|
Currency |
|
Acquisitions/ |
|
Organic |
|||||
|
|
2023 |
|
|
2022 |
|
|
Change |
|
Impact |
|
Change |
|
Divestitures |
|
Change |
||
|
|
($ in millions) |
|
|
|
|
|
|
|
|
|
|
|
|||||
Revenue |
|
$ |
9,483 |
|
|
$ |
8,866 |
|
|
7% |
|
—% |
|
7% |
|
—% |
|
8% |
Revenue for the year ended December 31, 2023 was $9.5 billion, compared to $8.9 billion for the year ended December 31, 2022, an increase of $617 million, or 7%, on an as-reported basis. Adjusting for the impact of foreign currency and acquisitions and disposals, our organic revenue growth was 8% for the year ended December 31, 2023. The increases in both as-reported and organic revenue were driven by strong performances in both segments as well as the recognition of higher interest income that is not allocated to the segments.
Our revenue can be materially impacted by changes in currency conversions, which can fluctuate significantly over the course of a calendar year. For the year ended December 31, 2023, currency translation decreased our consolidated revenue by $10 million. The primary currencies driving this change were the Argentine Peso and Canadian Dollar.
Definitions of Constant Currency Change and Organic Change are included in the section entitled ‘Non-GAAP Financial Measures’ elsewhere within this Form 10-K.
Segment Revenue
Segment revenue excludes amounts that were directly incurred on behalf of our clients and reimbursed by them (reimbursed expenses); however, these amounts are included in consolidated revenue, as required by applicable accounting standards and SEC rules. See Note 5 – Segment Information within Item 8 of this Annual Report on Form 10-K for more information about how our segment revenue is calculated and a reconciliation to our GAAP results.
The Company experiences seasonal fluctuations in its revenue. Revenue is typically higher during the Company’s first and fourth quarters due primarily to the timing of broking-related activities.
For all tables presented below, the components of the revenue change may not add due to rounding.
Health, Wealth & Career (‘HWC’)
The HWC segment provides an array of advice, broking, solutions and technology for employee benefit plans, institutional investors, compensation and career programs, and the employee experience overall.
HWC is the larger of the two segments of the Company, generating approximately 60% of our segment revenue for the year ended December 31, 2023. Addressing four key areas, Health, Wealth, Career and Benefits Delivery & Outsourcing, the segment is focused on addressing our clients’ people and risk needs to help them succeed in a global marketplace.
49
The following table sets forth HWC segment revenue for the years ended December 31, 2023 and 2022, and the components of the change in revenue for the year ended December 31, 2023 from the year ended December 31, 2022.
|
|
|
|
|
|
|
|
|
|
Components of Revenue Change |
||||||||
|
|
|
|
|
|
|
|
As |
|
Less: |
|
Constant |
|
Less: |
|
|
||
|
|
Years Ended December 31, |
|
|
Reported |
|
Currency |
|
Currency |
|
Acquisitions/ |
|
Organic |
|||||
|
|
2023 |
|
|
2022 |
|
|
Change |
|
Impact |
|
Change |
|
Divestitures |
|
Change |
||
|
|
($ in millions) |
|
|
|
|
|
|
|
|
|
|
|
|||||
Segment revenue |
|
$ |
5,582 |
|
|
$ |
5,287 |
|
|
6% |
|
—% |
|
6% |
|
—% |
|
6% |
HWC segment revenue for the years ended December 31, 2023 and 2022 was $5.6 billion and $5.3 billion, respectively. Organic growth was led by Benefits Delivery & Outsourcing, driven by higher volumes and placements of Medicare Advantage and life policies in Individual Marketplace and increased project activity in Outsourcing. Our Wealth businesses generated organic revenue growth from higher levels of Retirement work in North America and Europe, along with new client acquisitions and higher fees in Investments. Health had organic revenue growth driven by the continued expansion of our Global Benefits Management client portfolio, expanded consulting work and increased brokerage income. Career had organic revenue growth from increased compensation survey sales and executive compensation and other reward-based advisory services.
Risk & Broking (‘R&B’)
The R&B segment provides a broad range of risk advice, insurance brokerage and consulting services to clients worldwide ranging from small businesses to multinational corporations.
R&B generated approximately 40% of our segment revenue for the year ended December 31, 2023. The segment comprises two primary businesses - Corporate Risk & Broking and Insurance Consulting and Technology.
The following table sets forth R&B segment revenue for the years ended December 31, 2023 and 2022, and the components of the change in revenue for the year ended December 31, 2023 from the year ended December 31, 2022.
|
|
|
|
|
|
|
|
|
|
Components of Revenue Change |
||||||||
|
|
|
|
|
|
|
|
As |
|
Less: |
|
Constant |
|
Less: |
|
|
||
|
|
Years Ended December 31, |
|
|
Reported |
|
Currency |
|
Currency |
|
Acquisitions/ |
|
Organic |
|||||
|
|
2023 |
|
|
2022 |
|
|
Change |
|
Impact |
|
Change |
|
Divestitures |
|
Change |
||
|
|
($ in millions) |
|
|
|
|
|
|
|
|
|
|
|
|||||
Segment revenue |
|
$ |
3,735 |
|
|
$ |
3,460 |
|
|
8% |
|
—% |
|
8% |
|
(1)% |
|
10% |
R&B segment revenue for the years ended December 31, 2023 and 2022 was $3.7 billion and $3.5 billion, respectively. Despite significant pressure from headwinds from book-of-business settlement revenue in the comparable period, Corporate Risk & Broking generated solid organic revenue growth driven by strong new business and improved client retention. Insurance Consulting and Technology had organic revenue growth from software sales and increased project revenue.
Costs of Providing Services (Continuing Operations)
Total costs of providing services for the year ended December 31, 2023 were $8.1 billion, compared to $7.7 billion for the year ended December 31, 2022, an increase of $430 million, or 6%. See the following discussion for further details.
Salaries and Benefits
Salaries and benefits for the year ended December 31, 2023 were $5.3 billion, compared to $5.1 billion for the year ended December 31, 2022, an increase of $279 million, or 6%. The increase in the current year is primarily due to higher salary expense, driven by increased colleague headcount and cost-of-living compensation adjustments, and increased incentive and benefit costs for the year.
Salaries and benefits, as a percentage of revenue, represented 56% and 57% for the years ended December 31, 2023 and 2022, respectively.
Other Operating Expenses
Other operating expenses include occupancy, legal, marketing, licenses, royalties, supplies, technology, printing and telephone costs, as well as insurance, including premiums on excess insurance and losses on professional liability claims, travel by colleagues, publications, professional subscriptions and development, recruitment, other professional fees and irrecoverable value-added and sales taxes. Additionally, other operating expenses included costs historically allocated to our Willis Re business which are partially offset by fees under a cost reimbursement Transition Services Agreement (‘TSA’; see Note 3 — Acquisitions and Divestitures within Item 8 of this Annual Report on Form 10-K) with Gallagher.
50
Other operating expenses for both years ended December 31, 2023 and 2022 were $1.8 billion, an increase of $39 million, or 2%. The increase was primarily due to higher professional service and marketing-related expenses for the current year as compared to the prior-year, and higher travel and entertainment costs due to the continued increase of post-pandemic activity. These increases were partially offset by the absence of the prior-year asset impairments incurred, mostly accounts receivables, related to Russian insurance contracts placed by U.K. brokers in the London market (see Note 3 — Acquisitions and Divestitures within Item 8 of this Annual Report on Form 10-K) and lower external labor fees in the current year.
Depreciation
Depreciation represents the expense incurred over the useful lives of our tangible fixed assets and internally-developed software. Depreciation for the year ended December 31, 2023 was $242 million, compared to $255 million for the year ended December 31, 2022, a decrease of $13 million, or 5%. The year-over-year decrease was primarily due to a lower depreciable base of assets resulting from business disposals and a lower dollar value of assets placed in service during the past few years.
Amortization
Amortization represents the amortization of acquired intangible assets, including acquired internally-developed software. Amortization for the year ended December 31, 2023 was $263 million, compared to $312 million for the year ended December 31, 2022, a decrease of $49 million, or 16%. Our intangible amortization is generally more heavily weighted to the initial years of the useful lives of the related intangibles, and therefore amortization related to intangible assets will continue to decrease over time.
Restructuring Costs
Restructuring costs for the years ended December 31, 2023 and 2022 were $68 million and $99 million, respectively. Restructuring costs in both the current year and prior year primarily related to the real estate rationalization component of the Transformation program commenced by the Company during the fourth quarter of 2021 (see Transformation Program within this section and Note 6 — Restructuring Costs within Item 8 of this Annual Report on Form 10-K).
Transaction and Transformation, Net
Transaction and transformation, net for the years ended December 31, 2023 was $386 million, compared to $181 million for the year ended December 31, 2022, an increase of $205 million. Transaction and transformation costs for the current year were higher primarily due to increased consulting and compensation costs related to our Transformation program (see ‘Transformation Program’ elsewhere within this Item 7) incurred in the current year as compared to the prior year.
Income from Operations
Income from operations for the year ended December 31, 2023 was $1.4 billion, compared to $1.2 billion for the year ended December 31, 2022, an increase of $187 million. This increase resulted primarily from higher revenue, the absence of the prior-year’s asset impairment expense discussed above and lower restructuring costs in the current year, partially offset by higher salary expense and incentive and benefit costs, increased transaction and transformation costs, higher professional service and marketing-related expenses and increased travel and entertainment costs in the current year as compared to the prior year.
Interest Expense
Interest expense for the years ended December 31, 2023 and 2022 was $235 million and $208 million, respectively. Interest expense, which is attributable primarily to our senior notes, increased by $27 million for the year ended December 31, 2023, which was primarily the result of higher levels of indebtedness in the current year.
Other Income, Net
Other income, net includes gains and losses on disposals of operations, pension credits or expenses that are not attributable to service expense, interest in earnings of associates, foreign exchange gains and losses and other miscellaneous non-operating income and costs.
Other income, net for the year ended December 31, 2023 was $149 million, compared to $288 million for the year ended December 31, 2022, a decrease of $139 million. Other income, net decreased due to lower pension income, which was primarily attributable to higher interest costs resulting from higher assumed discount rates in the current year, partially offset by greater gains on disposals in the current year.
Provision for Income Taxes
Provision for income taxes on continuing operations for the year ended December 31, 2023 was $215 million, compared to $194 million for the year ended December 31, 2022. The effective tax rates for the years ended December 31, 2023 and 2022 were 16.8%
51
and 15.4%, respectively. These effective tax rates are calculated using extended values from our consolidated statements of comprehensive income and are therefore more precise tax rates than can be calculated from rounded values. The current year effective tax rate includes a $20 million deferred tax benefit related to changes in state apportionment and a $10 million deferred tax benefit related to the remeasurement of deferred tax assets and liabilities associated with the enactment of the Bermuda corporate income tax law. The prior-year effective tax rate includes a $34 million tax benefit associated with amending the Company’s U.S. federal income tax returns for tax years 2019 and 2020, primarily related to the reduction of Base Erosion and Anti Abuse Tax (‘BEAT’), and a $22 million income tax benefit associated with foreign exchange remeasurement on income tax account balances.
In December 2022, E.U. member states formally adopted the E.U.’s Pillar Two Directive, which introduces a global corporate minimum tax of 15% for certain large multinational companies. For the rules to take effect, E.U. member states were required to enact domestic legislation by the end of 2023 to be effective January 1, 2024. While we do not anticipate that this will have a material impact on our tax provision or effective tax rate, we continue to monitor evolving tax legislation in the jurisdictions in which we operate.
Loss from Discontinued Operations, Net of Tax
The following table presents selected financial information as it relates to loss from discontinued operations, net of tax:
|
|
Year ended December 31, |
|
|
|
|
2022 |
|
|
Revenue from discontinued operations |
|
$ |
48 |
|
Costs of providing services |
|
|
|
|
Salaries and benefits |
|
|
14 |
|
Other operating expenses |
|
|
10 |
|
Total costs of providing services |
|
|
24 |
|
Other income, net |
|
|
5 |
|
Income from discontinued operations before income taxes |
|
|
29 |
|
Loss on disposal of Willis Re |
|
|
(65 |
) |
Benefit from income tax expense |
|
|
1 |
|
Net income payable to Gallagher on Deferred Closing |
|
|
(5 |
) |
Loss from discontinued operations, net of tax |
|
$ |
(40 |
) |
Loss from discontinued operations, net of tax for the year ended December 31, 2022 was $40 million. The operations of our Willis Re business were reclassified to discontinued operations upon our entering into an agreement to sell the business during the third quarter of 2021 (see Note 3 - Acquisitions and Divestitures within Item 8 of this Annual Report on Form 10-K). Loss from discontinued operations in the prior year are primarily attributable to the adjustments to the gain on disposal resulting from finalizing the value of the net assets transferred and the operations of the deferred closing entities and run-off activity associated with the divestiture.
Net Income Attributable to WTW
Net income attributable to WTW for the year ended December 31, 2023 was $1.1 billion, compared to $1.0 billion for the year ended December 31, 2022, an increase of $46 million. This increase resulted primarily from higher revenue, the absence of the prior-year’s asset impairment expense discussed above, higher gains on disposals and lower restructuring costs in the current year, partially offset by higher salary expense and incentive and benefit costs, increased transaction and transformation costs, lower pension income, higher professional service and marketing-related expenses and higher travel and entertainment costs in the current year.
Liquidity and Capital Resources
Executive Summary
Our principal sources of liquidity are funds generated by operating activities, available cash and cash equivalents and amounts available under our revolving credit facility and any new debt offerings. These sources of liquidity will fund our short-term and long-term obligations at December 31, 2023. Our most significant long-term obligations include mandatory debt and related interest, operating leases and pension obligations and contributions to our qualified pension plans.
There has been significant volatility in financial markets, including occasional declines in equity markets, inflation and changes in interest rates and reduced liquidity on a global basis. Specific to WTW, following the reduced spending driven by the COVID-19 pandemic, spending on travel and associated expenses began to increase in 2022, and this trend continued during 2023 following the return to office for many companies increasing in-person interactions.
52
Based on our current balance sheet and cash flows, current market conditions and information available to us at this time, we believe that WTW has access to sufficient liquidity, which includes all of the borrowing capacity available to draw against our $1.5 billion revolving credit facility, to meet our cash needs for the next twelve months, including investments in the business for growth and those related to our Transformation program, scheduled debt repayments, share repurchases and dividend payments. During the year ended December 31, 2023, we completed an offering of $750 million aggregate principal amount of 5.350% senior notes due 2033 and used the net proceeds to repay in full the $250 million aggregate principal amount and related accrued interest of 4.625% senior notes. The Company will use the remaining net proceeds for general corporate purposes. Additionally, during the year ended December 31, 2023 we repurchased $1.0 billion of shares, with remaining authorization to repurchase an additional $1.3 billion as of December 31, 2023.
We consider many factors, including market and economic conditions, applicable legal requirements and other business considerations, when considering whether to repurchase shares. The share repurchase program has no termination date and may be suspended or discontinued at any time.
Before its disposal in 2021, Willis Re’s operating cash flows approximated its pre-tax income and any adjustments for working capital movements (see Note 3 — Acquisitions and Divestitures in Item 8 within this Annual Report on Form 10-K). Certain costs historically allocated to the Willis Re business are included in continuing operations and were retained following the disposal, but are being partially offset by reimbursements through the TSA. Costs incurred to service the TSA are expected to be reduced as part of the Company’s Transformation program as quickly as possible when the services are no longer required by Gallagher.
Events that could change the historical cash flow dynamics discussed above include significant changes in operating results, potential future acquisitions or divestitures, material changes in geographic sources of cash, unexpected adverse impacts from litigation or regulatory matters, or future pension funding during periods of severe downturn in the capital markets.
Distributable Profits - We are required under Irish law to have available ‘distributable profits’ to make share repurchases or pay dividends to shareholders. Distributable profits are created through the earnings of the Irish parent company and, among other methods, through intercompany dividends or a reduction in share capital approved by the High Court of Ireland. Distributable profits are not linked to a U.S. GAAP reported amount (e.g. retained earnings). At WTW's Annual General Meeting on June 8, 2022, its shareholders voted in favor of a proposed capital reduction. In accordance with Part 3 of the Irish Companies Act 2014 the Parent Company submitted an application to the High Court of Ireland to reduce its share premium account. On July 19, 2022, the High Court of Ireland approved a reduction of the share premium account of the Parent Company of approximately $9.5 billion, with the resulting balance being treated as realized profits of the Parent Company. The High Court of Ireland's order was registered with the Irish Companies Registration Office and became effective on July 21, 2022.
Tax considerations - The Company recognizes deferred tax balances related to the undistributed earnings of subsidiaries when it expects that it will recover those undistributed earnings in a taxable manner, such as through receipt of dividends or sale of the investments. We continue to have certain subsidiaries whose earnings have not been deemed permanently reinvested, for which we have been accruing estimates of the tax effects of such repatriation. Excluding these certain subsidiaries, we continue to assert that the historical cumulative earnings for the remainder of our subsidiaries have been reinvested indefinitely and therefore do not provide deferred taxes on these amounts. If future events, including material changes in estimates of cash, working capital, long-term investment requirements or additional legislation, necessitate that these earnings be distributed, an additional provision for income and foreign withholding taxes, net of credits, may be necessary. Other potential sources of cash may be through the settlement of intercompany loans or return of capital distributions in a tax-efficient manner.
Cash and Cash Equivalents
Our cash and cash equivalents at December 31, 2023 and 2022 totaled $1.4 billion and $1.3 billion, respectively. The increase in cash from December 31, 2022 to December 31, 2023 was due primarily to increased cash flow from operations, driven by operating margin improvement and the non-recurrence of certain prior-year headwinds related to foreign currency, tax and discretionary compensation, partially offset by increased Transformation program costs and $1.0 billion of share repurchases.
Additionally, we had all of the borrowing capacity available to draw against our $1.5 billion revolving credit facility at December 31, 2023.
Included within cash and cash equivalents at December 31, 2023 and 2022 are amounts held for regulatory capital adequacy requirements, including $105 million and $99 million, respectively, held within our regulated U.K. entities.
53
Summarized Consolidated Cash Flows
The following table presents the summarized consolidated cash flow information for the years ended:
|
|
Years ended December 31, |
|
|||||
|
|
2023 |
|
|
2022 |
|
||
|
|
(in millions) |
|
|||||
Net cash from/(used in): |
|
|
|
|
|
|
||
Operating activities |
|
$ |
1,345 |
|
|
$ |
812 |
|
Investing activities |
|
|
(1,085 |
) |
|
|
(173 |
) |
Financing activities |
|
|
(1,200 |
) |
|
|
(3,445 |
) |
DECREASE IN CASH, CASH EQUIVALENTS AND |
|
|
(940 |
) |
|
|
(2,806 |
) |
Effect of exchange rate changes on cash, cash equivalents and restricted cash |
|
|
11 |
|
|
|
(164 |
) |
CASH, CASH EQUIVALENTS AND RESTRICTED CASH, BEGINNING OF |
|
|
4,721 |
|
|
|
7,691 |
|
CASH, CASH EQUIVALENTS AND RESTRICTED CASH, END OF YEAR (i) |
|
$ |
3,792 |
|
|
$ |
4,721 |
|
Cash Flows From Operating Activities
Cash flows from operating activities were $1.3 billion for 2023, compared to $812 million for 2022. The $1.3 billion net cash from operating activities for 2023 included net income of $1.1 billion and $652 million of favorable non-cash adjustments, partially offset by unfavorable changes in operating assets and liabilities of $371 million. The $652 million of favorable non-cash adjustments primarily includes depreciation, amortization and non-cash lease expense. The increase in cash flows from operating activities as compared to the prior year was due primarily to operating margin improvement and the non-recurrence of prior-year headwinds, including realized losses on foreign currency hedges, payments made in the prior year for certain discretionary compensation and taxes for one-time gains recognized in connection with the Willis Re divestiture and the 2021 income receipt related to the Aon plc (‘Aon’) transaction termination. These tailwinds were partially offset by increased Transformation program-related costs.
Cash flows from operating activities of $812 million for 2022 included net income of $1.0 billion, and $676 million of favorable non-cash adjustments, partially offset by unfavorable changes in operating assets and liabilities of $888 million. The $676 million of favorable non-cash adjustments primarily includes depreciation, amortization and non-cash lease expense.
Cash Flows Used In Investing Activities
Cash flows used in investing activities for the year ended December 31, 2023 were $1.1 billion compared to $173 million for the year ended December 31, 2022. The cash flows used in investing activities for the year ended December 31, 2023 consisted primarily of cash and fiduciary funds of $922 million associated with the transfer to Gallagher under a new side letter to the Willis Re sale agreement (see Note 3 — Acquisitions and Divestitures within Item 8 of this Annual Report on Form 10-K for more information) and $242 million of capital expenditures and capitalized software additions.
Cash flows used in investing activities of $173 million for the year ended December 31, 2022 consisted of capital expenditures and capitalized software additions of $204 million and net cash outflows for acquisitions and divestitures of $169 million, partially offset by sales of investments of $200 million.
Cash Flows Used In Financing Activities
Cash flows used in financing activities for the year ended December 31, 2023 were $1.2 billion. The significant financing activities included share repurchases of $1.0 billion, dividend payments of $352 million and net payments from fiduciary funds held for clients of $234 million, partially offset by $487 million of net proceeds from the issuance of debt.
Cash flows used in financing activities for the year ended December 31, 2022 were $3.4 billion. The significant financing activities included share repurchases of $3.5 billion, debt repayments of $585 million and dividend payments of $369 million, partially offset by $750 million of net proceeds from the issuance of debt and $354 million of net proceeds from fiduciary funds held for clients.
54
Indebtedness
Total debt, total equity, and the capitalization ratio at December 31, 2023 and December 31, 2022 were as follows:
|
|
December 31, |
|
|||||
|
|
2023 |
|
|
2022 |
|
||
|
|
(in millions) |
|
|||||
Long-term debt |
|
$ |
4,567 |
|
|
$ |
4,471 |
|
Current debt |
|
|
650 |
|
|
|
250 |
|
Total debt |
|
$ |
5,217 |
|
|
$ |
4,721 |
|
|
|
|
|
|
|
|
||
Total WTW shareholders’ equity |
|
$ |
9,520 |
|
|
$ |
10,016 |
|
|
|
|
|
|
|
|
||
Capitalization ratio |
|
|
35.4 |
% |
|
|
32.0 |
% |
At December 31, 2023, our mandatory debt repayments over the next twelve months include $650 million outstanding on our 3.600% senior notes due 2024. For more information regarding our current and long-term debt, please see ‘Supplemental Guarantor Financial Information’ elsewhere within this Item 7 Management's Discussion and Analysis of Financial Condition and Results of Operations.
At December 31, 2023 and 2022, we were in compliance with all financial covenants.
Fiduciary Funds
As an intermediary, we hold funds, generally in a fiduciary capacity, for the account of third parties, typically as the result of premiums received from clients that are in transit to insurers and claims due to clients that are in transit from insurers. We also hold funds for clients of our benefits account businesses, some of which are invested in open-ended mutual funds as directed by the participant. These fiduciary funds are included in fiduciary assets on our consolidated balance sheets. We present the equal and corresponding fiduciary liabilities related to these fiduciary funds representing amounts or claims due to our clients or premiums due on their behalf to insurers on our consolidated balance sheets.
Fiduciary funds are generally required to be kept in regulated bank accounts subject to guidelines which emphasize capital preservation and liquidity; such funds are not available to service the Company’s debt or for other corporate purposes. Notwithstanding the legal relationships with clients and insurers, the Company is entitled to retain investment income earned on certain of these fiduciary funds in accordance with industry custom and practice and, in some cases, as supported by agreements with insureds.
At December 31, 2023 and 2022, we had fiduciary funds of $2.6 billion and $3.6 billion, respectively. At December 31, 2022, $945 million of these funds were attributable to the divested Willis Re business. All amounts have since been settled or transferred to Gallagher due to the termination of the co-broking agreement (see Note 3 — Acquisitions and Divestitures within Item 8 of this Annual Report on Form 10-K for further information).
Share Repurchase Program
The Company is authorized to repurchase shares, by way of redemption or otherwise, and will consider whether to do so from time to time, based on many factors, including market conditions. There are no expiration dates for our repurchase plans or programs.
On July 26, 2021, the board of directors approved a $1.0 billion increase to the existing share repurchase program, which was previously at $500 million. Additionally, on September 16, 2021, the board of directors approved a $4.0 billion increase to the existing share repurchase program, on May 25, 2022, approved a $1.0 billion increase to the existing share repurchase program, and on September 20, 2023, approved a $1.0 billion increase to the existing share repurchase program. These increases brought the total approved authorization, since April 20, 2016, to $9.2 billion. See Part II, Item 5 Market for Registrant’s Common Equity, Related Stockholder Matters and Issuer Purchases of Equity Securities in this Annual Report on Form 10-K for further information regarding the Company’s share repurchase program.
At December 31, 2023, approximately $1.3 billion remained on the current repurchase authority. The maximum number of shares that could be repurchased based on the closing price of our ordinary shares on December 31, 2023 of $241.20 was 5,565,955.
55
The following table presents specified information about the Company’s repurchases of ordinary shares for the year ended December 31, 2023:
|
|
Year ended |
Shares repurchased |
|
4,482,846 |
Average price per share |
|
$223.10 |
Aggregate repurchase cost (excluding broker costs) |
|
$1.0 billion |
Dividends
Total cash dividends of $352 million were paid during the year ended December 31, 2023. In February 2024, the board of directors is expected to approve a quarterly cash dividend to shareholders of record as of March 31, 2024.
Capital Commitments
The Company’s capital expenditures for fixed assets and software for internal use were $153 million for the year ended December 31, 2023. Capital expenditures for fixed assets and software for internal use, which include expenditures under our Transformation program, are expected to be in the range of $175 million to $200 million for the year ended December 31, 2024. We expect cash from operations to adequately provide for these cash needs.
Supplemental Guarantor Financial Information
As of December 31, 2023, WTW has issued the following debt securities (the ‘notes’):
The following table presents a summary of the entities that issue each note and those wholly-owned subsidiaries of the Company that guarantee each respective note on a joint and several basis as of December 31, 2023. These subsidiaries are all consolidated by Willis Towers Watson plc (the ‘parent company’) and together with the parent company comprise the ‘Obligor group’.
Entity |
|
Trinity Acquisition plc Notes |
|
Willis North America Inc. Notes |
Willis Towers Watson plc |
|
Guarantor |
|
Guarantor |
Trinity Acquisition plc |
|
Issuer |
|
Guarantor |
Willis North America Inc. |
|
Guarantor |
|
Issuer |
Willis Netherlands Holdings B.V. |
|
Guarantor |
|
Guarantor |
Willis Investment UK Holdings Limited |
|
Guarantor |
|
Guarantor |
TA I Limited |
|
Guarantor |
|
Guarantor |
Willis Group Limited |
|
Guarantor |
|
Guarantor |
Willis Towers Watson Sub Holdings Unlimited Company |
|
Guarantor |
|
Guarantor |
Willis Towers Watson UK Holdings Limited |
|
Guarantor |
|
Guarantor |
The notes issued by Willis North America and Trinity Acquisition plc:
All other subsidiaries of the parent company are non-guarantor subsidiaries (‘the non-guarantor subsidiaries’).
56
Each member of the Obligor group has only a stockholder’s claim on the assets of the non-guarantor subsidiaries. This stockholder’s claim is junior to the claims that creditors have against those non-guarantor subsidiaries. Holders of the notes will only be creditors of the Obligor group and not creditors of the non-guarantor subsidiaries. As a result, all of the existing and future liabilities of the non-guarantor subsidiaries, including any claims of trade creditors and preferred stockholders, will be structurally senior to the notes. As of and for the periods ended December 31, 2023 and 2022, the non-guarantor subsidiaries represented substantially all of the total assets and accounted for substantially all of the total revenue of the Company prior to consolidating adjustments. The non-guarantor subsidiaries have other liabilities, including contingent liabilities that may be significant. Each indenture does not contain any limitations on the amount of additional debt that the Obligor group and the non-guarantor subsidiaries may incur. The amounts of this debt could be substantial, and this debt may be debt of the non-guarantor subsidiaries, in which case this debt would be effectively senior in right of payment to the notes.
The notes are obligations exclusively of the Obligor group. Substantially all of the Obligor group’s operations are conducted through its non-guarantor subsidiaries. Therefore, the Obligor group’s ability to service its debt, including the notes, is dependent upon the net cash flows of its non-guarantor subsidiaries and their ability to distribute those net cash flows as dividends, loans or other payments to the Obligor group. Certain laws restrict the ability of these non-guarantor subsidiaries to pay dividends and make loans and advances to the Obligor group. In addition, such non-guarantor subsidiaries may enter into contractual arrangements that limit their ability to pay dividends and make loans and advances to the Obligor group.
Intercompany balances and transactions between members of the Obligor group have been eliminated. All intercompany balances and transactions between the Obligor group and the non-guarantor subsidiaries have been presented in the disclosures below on a net presentation basis, rather than a gross basis, as this better reflects the nature of the intercompany positions and presents the funding or funded position that is to be received or owed. The intercompany balances and transactions between the Obligor group and non-guarantor subsidiaries, presented below, relate to a number of items including loan funding for acquisitions and other purposes, transfers of surplus cash between subsidiary companies, funding provided for working capital purposes, settlement of expense accounts, transactions related to share-based payment arrangements and share issuances, intercompany royalty arrangements, intercompany dividends and intercompany interest. At December 31, 2023 and 2022, the intercompany balances of the Obligor group with non-guarantor subsidiaries were net receivables of $3.4 billion and $600 million, respectively, and net payables of $14.0 billion and $10.2 billion, respectively.
No balances or transactions of non-guarantor subsidiaries are presented in the disclosures other than the intercompany items noted above.
Presented below is certain summarized financial information for the Obligor group.
|
|
As of |
|
|
As of |
|
||
|
|
(in millions) |
|
|||||
Total current assets |
|
$ |
299 |
|
|
$ |
216 |
|
Total non-current assets |
|
|
3,454 |
|
|
|
685 |
|
Total current liabilities |
|
|
7,576 |
|
|
|
6,916 |
|
Total non-current liabilities |
|
|
11,848 |
|
|
|
8,212 |
|
|
|
Year ended |
|
|
|
|
(in millions) |
|
|
Revenue |
|
$ |
1,951 |
|
Income from operations |
|
|
1,643 |
|
Income from operations before income taxes (i) |
|
|
849 |
|
Net income |
|
|
1,022 |
|
Net income attributable to Willis Towers Watson |
|
|
1,022 |
|
57
Non-GAAP Financial Measures
In order to assist readers of our consolidated financial statements in understanding the core operating results that WTW’s management uses to evaluate the business and for financial planning purposes, we present the following non-GAAP measures and their most directly comparable U.S. GAAP measure:
Most Directly Comparable U.S. GAAP Measure |
|
Non-GAAP Measure |
As reported change |
|
Constant currency change |
As reported change |
|
Organic change |
Income from operations/margin |
|
Adjusted operating income/margin |
Net income/margin |
|
Adjusted EBITDA/margin |
Net income attributable to WTW |
|
Adjusted net income |
Diluted earnings per share |
|
Adjusted diluted earnings per share |
Income from continuing operations before income taxes |
|
Adjusted income before taxes |
Provision for income taxes/U.S. GAAP tax rate |
|
Adjusted income taxes/tax rate |
Net cash from operating activities |
|
Free cash flow/margin |
The Company believes that these measures are relevant and provide pertinent information widely used by analysts, investors and other interested parties in our industry to provide a baseline for evaluating and comparing our operating performance, and in the case of free cash flow, our liquidity results.
Within the measures referred to as ‘adjusted’, we adjust for significant items which will not be settled in cash, or which we believe to be items that are not core to our current or future operations. These items include the following:
These non-GAAP measures are not defined in the same manner by all companies and may not be comparable to other similarly titled measures of other companies. Non-GAAP measures should be considered in addition to, and not as a substitute for, the information contained within our consolidated financial statements.
58
Constant Currency Change and Organic Change
We evaluate our revenue on an as reported (U.S. GAAP), constant currency and organic basis. We believe presenting constant currency and organic information provides valuable supplemental information regarding our comparable results, consistent with how we evaluate our performance internally.
The constant currency and organic change results, and a reconciliation from the reported results for consolidated revenue, are included in the ‘Consolidated Revenue (Continuing Operations)’ section within this Form 10-K. These measures are also reported by segment in the ‘Segment Revenue’ section within this Form 10-K.
A reconciliation of the reported change to the constant currency and organic change for the year ended December 31, 2023 from the year ended December 31, 2022 is as follows. The components of revenue change may not add due to rounding.
|
|
|
|
|
|
|
|
|
|
Components of Revenue Change |
||||||||
|
|
|
|
|
|
|
|
As |
|
Less: |
|
Constant |
|
Less: |
|
|
||
|
|
Years ended December 31, |
|
|
Reported |
|
Currency |
|
Currency |
|
Acquisitions/ |
|
Organic |
|||||
|
|
2023 |
|
|
2022 |
|
|
Change |
|
Impact |
|
Change |
|
Divestitures |
|
Change |
||
|
|
($ in millions) |
|
|
|
|
|
|
|
|
|
|
|
|||||
Revenue |
|
$ |
9,483 |
|
|
$ |
8,866 |
|
|
7% |
|
—% |
|
7% |
|
—% |
|
8% |
For the year ended December 31, 2023, our as-reported revenue increased by 7%, and our organic revenue increased by 8%. The increases in both as-reported and organic revenue were driven by strong performances in both segments as well as the recognition of higher interest income that is not allocated to the segments.
Adjusted Operating Income/Margin
We consider adjusted operating income/margin to be important financial measures, which are used internally to evaluate and assess our core operations and to benchmark our operating results against our competitors.
Adjusted operating income is defined as income from operations adjusted for impairment, amortization, restructuring costs, transaction and transformation and non-recurring items that, in management’s judgment, significantly affect the period-over-period assessment of operating results. Adjusted operating income margin is calculated by dividing adjusted operating income by revenue.
59
Reconciliations of income from operations to adjusted operating income for the years ended December 31, 2023 and 2022 are as follows:
|
|
Years Ended December 31, |
|
|||||
|
|
2023 |
|
|
2022 |
|
||
|
|
($ in millions) |
|
|||||
Income from operations |
|
$ |
1,365 |
|
|
$ |
1,178 |
|
Adjusted for certain items: |
|
|
|
|
|
|
||
Impairment |
|
|
— |
|
|
|
81 |
|
Amortization |
|
|
263 |
|
|
|
312 |
|
Restructuring costs |
|
|
68 |
|
|
|
99 |
|
Transaction and transformation |
|
|
386 |
|
|
|
181 |
|
Adjusted operating income |
|
$ |
2,082 |
|
|
$ |
1,851 |
|
Income from operations margin |
|
|
14.4 |
% |
|
|
13.3 |
% |
Adjusted operating income margin |
|
|
22.0 |
% |
|
|
20.9 |
% |
Adjusted operating income increased for the year ended December 31, 2023 to $2.1 billion, from $1.9 billion for the year ended December 31, 2022. This increase resulted primarily from higher revenue, partially offset by higher salary expense and incentive and benefit costs, higher professional service and marketing-related expenses and increased travel and entertainment costs in the current year as compared to the prior year.
Adjusted EBITDA/Margin
We consider adjusted EBITDA/margin to be important financial measures, which are used internally to evaluate and assess our core operations, to benchmark our operating results against our competitors and to evaluate and measure our performance-based compensation plans.
Adjusted EBITDA is defined as net income adjusted for income or loss from discontinued operations, net of tax, provision for income taxes, interest expense, impairment, depreciation and amortization, restructuring costs, transaction and transformation, gains and losses on disposals of operations and non-recurring items that, in management’s judgment, significantly affect the period-over-period assessment of operating results. Adjusted EBITDA margin is calculated by dividing adjusted EBITDA by revenue.
Reconciliations of net income to adjusted EBITDA for the years ended December 31, 2023 and 2022 are as follows:
|
|
Years Ended December 31, |
|
|||||
|
|
2023 |
|
|
2022 |
|
||
|
|
($ in millions) |
|
|||||
NET INCOME |
|
$ |
1,064 |
|
|
$ |
1,024 |
|
Loss from discontinued operations, net of tax |
|
|
— |
|
|
|
40 |
|
Provision for income taxes |
|
|
215 |
|
|
|
194 |
|
Interest expense |
|
|
235 |
|
|
|
208 |
|
Impairment |
|
|
— |
|
|
|
81 |
|
Depreciation |
|
|
242 |
|
|
|
255 |
|
Amortization |
|
|
263 |
|
|
|
312 |
|
Restructuring costs |
|
|
68 |
|
|
|
99 |
|
Transaction and transformation |
|
|
386 |
|
|
|
181 |
|
Gain on disposal of operations |
|
|
(43 |
) |
|
|
(7 |
) |
Adjusted EBITDA |
|
$ |
2,430 |
|
|
$ |
2,387 |
|
Net income margin |
|
|
11.2 |
% |
|
|
11.5 |
% |
Adjusted EBITDA margin |
|
|
25.6 |
% |
|
|
26.9 |
% |
Adjusted EBITDA for both the years ended December 31, 2023 and 2022 was $2.4 billion, an increase of $43 million. This increase was due primarily to higher revenue, partially offset by higher salary expense and incentive and benefit costs, lower pension income, higher professional service and marketing-related expenses and increased travel and entertainment costs in the current year as compared to the prior year.
60
Adjusted Net Income and Adjusted Diluted Earnings Per Share
Adjusted net income is defined as net income attributable to WTW adjusted for income or loss from discontinued operations, net of tax, impairment, amortization, restructuring costs, transaction and transformation, gains and losses on disposals of operations and non-recurring items that, in management’s judgment, significantly affect the period-over-period assessment of operating results and the related tax effect of those adjustments and the tax effects of internal reorganizations. This measure is used solely for the purpose of calculating adjusted diluted earnings per share.
Adjusted diluted earnings per share is defined as adjusted net income divided by the weighted-average number of ordinary shares, diluted. Adjusted diluted earnings per share is used to internally evaluate and assess our core operations and to benchmark our operating results against our competitors.
Reconciliations of net income attributable to WTW to adjusted diluted earnings per share for the years ended December 31, 2023 and 2022 are as follows:
|
|
Years Ended December 31, |
|
|||||
|
|
2023 |
|
|
2022 |
|
||
|
|
($ and weighted-average shares in millions) |
|
|||||
NET INCOME ATTRIBUTABLE TO WTW |
|
$ |
1,055 |
|
|
$ |
1,009 |
|
Adjusted for certain items: |
|
|
|
|
|
|
||
Loss from discontinued operations, net of tax |
|
|
— |
|
|
|
40 |
|
Impairment |
|
|
— |
|
|
|
81 |
|
Amortization |
|
|
263 |
|
|
|
312 |
|
Restructuring costs |
|
|
68 |
|
|
|
99 |
|
Transaction and transformation |
|
|
386 |
|
|
|
181 |
|
Gain on disposal of operations |
|
|
(43 |
) |
|
|
(7 |
) |
Tax effect on certain items listed above (i) |
|
|
(195 |
) |
|
|
(188 |
) |
Tax effect of the CARES Act |
|
|
— |
|
|
|
(24 |
) |
Tax effect of internal reorganizations |
|
|
2 |
|
|
|
4 |
|
|
|
$ |
1,536 |
|
|
$ |
1,507 |
|
Weighted-average ordinary shares — diluted |
|
|
106 |
|
|
|
112 |
|
Diluted earnings per share |
|
$ |
9.95 |
|
|
$ |
8.98 |
|
Adjusted for certain items (ii): |
|
|
|
|
|
|
||
Loss from discontinued operations, net of tax |
|
|
— |
|
|
|
0.36 |
|
Impairment |
|
|
— |
|
|
|
0.72 |
|
Amortization |
|
|
2.48 |
|
|
|
2.78 |
|
Restructuring costs |
|
|
0.64 |
|
|
|
0.88 |
|
Transaction and transformation |
|
|
3.64 |
|
|
|
1.61 |
|
Gain on disposal of operations |
|
|
(0.41 |
) |
|
|
(0.06 |
) |
Tax effect on certain items listed above (i) |
|
|
(1.84 |
) |
|
|
(1.67 |
) |
Tax effect of the CARES Act |
|
|
— |
|
|
|
(0.21 |
) |
Tax effect of internal reorganizations |
|
|
0.02 |
|
|
|
0.04 |
|
Adjusted diluted earnings per share |
|
$ |
14.49 |
|
|
$ |
13.41 |
|
Our adjusted diluted earnings per share increased for the year ended December 31, 2023 as compared to the year ended December 31, 2022 primarily due to a lower weighted-average outstanding share count attributable to our share repurchase activity in the current year and higher revenue, partially offset by higher salary expense and incentive and benefit costs, lower pension income, higher professional service and marketing-related expenses and increased travel and entertainment costs in the current year as compared to the prior year.
Adjusted Income Before Taxes and Adjusted Income Taxes/Tax Rate
Adjusted income before taxes is defined as income from operations before income taxes adjusted for impairment, amortization, restructuring costs, transaction and transformation, gains and losses on disposals of operations and non-recurring items that, in management’s judgment, significantly affect the period-over-period assessment of operating results. Adjusted income before taxes is used solely for the purpose of calculating the adjusted income tax rate.
61
Adjusted income taxes/tax rate is defined as the provision for income taxes adjusted for taxes on certain items of impairment, amortization, restructuring costs, transaction and transformation, gains and losses on disposals of operations, the tax effects of internal reorganizations and non-recurring items that, in management’s judgment, significantly affect the period-over-period assessment of operating results, divided by adjusted income before taxes. Adjusted income taxes is used solely for the purpose of calculating the adjusted income tax rate.
Management believes that the adjusted income tax rate presents a rate that is more closely aligned to the rate that we would incur if not for the reduction of pre-tax income for the adjusted items and the tax effects of internal reorganizations, which are not core to our current and future operations.
Reconciliations of income from continuing operations before income taxes to adjusted income before taxes and provision for income taxes to adjusted income taxes for the years ended December 31, 2023 and 2022 are as follows:
|
|
Years Ended December 31, |
|
|||||
|
|
2023 |
|
|
2022 |
|
||
|
|
($ in millions) |
|
|||||
INCOME FROM CONTINUING OPERATIONS BEFORE |
|
$ |
1,279 |
|
|
$ |
1,258 |
|
Adjusted for certain items: |
|
|
|
|
|
|
||
Impairment |
|
|
— |
|
|
|
81 |
|
Amortization |
|
|
263 |
|
|
|
312 |
|
Restructuring costs |
|
|
68 |
|
|
|
99 |
|
Transaction and transformation |
|
|
386 |
|
|
|
181 |
|
Gain on disposal of operations |
|
|
(43 |
) |
|
|
(7 |
) |
Adjusted income before taxes |
|
$ |
1,953 |
|
|
$ |
1,924 |
|
|
|
|
|
|
|
|
||
Provision for income taxes |
|
$ |
215 |
|
|
$ |
194 |
|
Tax effect on certain items listed above (i) |
|
|
195 |
|
|
|
188 |
|
Tax effect of the CARES Act |
|
|
— |
|
|
|
24 |
|
Tax effect of internal reorganizations |
|
|
(2 |
) |
|
|
(4 |
) |
Adjusted income taxes |
|
$ |
408 |
|
|
$ |
402 |
|
|
|
|
|
|
|
|
||
U.S. GAAP tax rate |
|
|
16.8 |
% |
|
|
15.4 |
% |
Adjusted income tax rate |
|
|
20.9 |
% |
|
|
20.9 |
% |
Our U.S. GAAP tax rates were 16.8% and 15.4% for the years ended December 31, 2023 and 2022, respectively. The current year U.S. GAAP tax rate includes a $20 million deferred tax benefit related to changes in state apportionment and a $10 million deferred tax benefit related to the remeasurement of deferred tax assets and liabilities associated with the enactment of the Bermuda corporate income tax law. The prior year U.S. GAAP tax rate includes a $34 million tax benefit associated with amending the Company’s U.S. federal income tax returns for tax years 2019 and 2020, primarily related to the reduction of the BEAT, and a $22 million income tax benefit associated with foreign exchange remeasurement on income tax account balances.
Our adjusted income tax rates were 20.9% for both years ended December 31, 2023 and 2022.
Free Cash Flow/Margin
Free cash flow is defined as cash flows from operating activities less cash used to purchase fixed assets and software for internal use. Free cash flow is a liquidity measure and is not meant to represent residual cash flow available for discretionary expenditures. Free cash flow margin, which we include on an annual basis as seasonal fluctuations in our revenue render it not meaningful during interim periods, is calculated by dividing free cash flow by revenue.
Management believes that free cash flow and free cash flow margin present the core operating performance and cash generating capabilities of our business operations.
62
Reconciliations of cash flows from operating activities to free cash flow for the years ended December 31, 2023 and 2022 are as follows:
|
|
Years ended December 31, |
|
|||||
|
|
2023 |
|
|
2022 |
|
||
|
|
(in millions) |
|
|||||
Cash flows from operating activities |
|
$ |
1,345 |
|
|
$ |
812 |
|
Less: Additions to fixed assets and software for internal use |
|
|
(153 |
) |
|
|
(138 |
) |
Free cash flow |
|
$ |
1,192 |
|
|
$ |
674 |
|
Revenue |
|
$ |
9,483 |
|
|
$ |
8,866 |
|
Free cash flow margin |
|
|
12.6 |
% |
|
|
7.6 |
% |
The favorable movement in free cash flow and free cash flow margin during the current-year period was primarily due to operating margin improvement and the non-recurrence of prior-year headwinds, including realized losses on foreign currency hedges, payments made in the prior year for certain discretionary compensation and taxes for one-time gains recognized in connection with the Willis Re divestiture and the 2021 income receipt related to the Aon transaction termination. These tailwinds were partially offset by increased Transformation program-related costs.
Critical Accounting Estimates
These consolidated financial statements conform to U.S. GAAP, which requires management to make estimates and assumptions that affect the reported amounts of assets and liabilities, disclosures of contingent assets and liabilities at the date of the financial statements and the reported amounts of revenue and expenses during the reporting period. Our estimates, judgments and assumptions are continually evaluated based on available information and experience. Because of the use of estimates inherent in the financial reporting process, actual results could differ from those estimates. The areas that we believe include critical accounting estimates are revenue recognition, costs to fulfill under our broking contracts, valuation of billed and unbilled receivables from clients, income taxes, commitments, contingencies and accrued liabilities, pension assumptions, and goodwill and intangible assets. The critical accounting estimates discussed below involve making difficult, subjective or complex accounting estimates that could have a material effect on our financial condition and results of operations. These critical accounting estimates require us to make assumptions about matters that are highly uncertain at the time of the estimate or assumption. Different estimates that we could have used, or changes in estimates that are reasonably likely to occur, may have a material effect on our results of operations and financial condition.
Revenue Recognition
We use significant estimates related to revenue recognition most commonly during our estimation of the transaction prices or where we recognize revenue over time on a proportional performance basis. A brief description of these policies and estimates is included below:
Estimation of transaction prices — This process occurs most frequently in certain broking transactions. In situations in which our fees are not fixed but are variable, we must estimate the likely commission per policy, taking into account the likelihood of cancellation before the end of the policy. For Medicare broking and Affinity arrangements, the commissions to which we will be entitled can vary based on the underlying individual insurance policies that are placed. For Medicare broking in particular, we base the estimates of transaction prices on supportable evidence from an analysis of past transactions, and only include amounts that are probable of being received or not refunded (referred to as applying ‘constraint’ under ASC 606, Revenue From Contracts With Customers). In our direct-to-consumer Medicare broking arrangements, the estimate of the total renewal commissions that will be received over the lifetime of the policy requires significant judgment, and will vary based on product type, estimated commission rates, the expected lives of the respective policies and other factors. The Company has applied an actuarial model to account for these uncertainties, which is updated periodically based on actual experience. Each of these processes result in us estimating a transaction price that may be significantly lower than the ultimate amount of commissions we may collect. The transaction price is then adjusted over time as we receive confirmation of our remuneration through receipt of commissions, or as other information becomes available.
Proportional performance basis over time recognition — Where we recognize revenue on a proportional performance basis, primarily in our consulting and outsourced administration arrangements, the amount we recognize is affected by a number of factors that can change the estimated amount of work required to complete the project, such as the staffing on the engagement and/or the level of client participation. Our periodic engagement evaluations require us to make judgments and estimates regarding the overall profitability and stages of project completion that, in turn, affect how we recognize revenue. We recognize a loss on an engagement when estimated revenue to be received for that engagement is less than the total estimated costs associated with the engagement. Losses are recognized in the period in which the loss becomes probable and the amount of the loss is reasonably estimable.
63
Costs to Fulfill —Broking Contracts
For our broking business, the Company must estimate the fulfillment costs incurred during the pre-placement of the broking contracts. These judgments include the following:
Valuation of Billed and Unbilled Receivables from Clients
We maintain allowances for doubtful accounts to reflect estimated losses resulting from a client’s failure to pay for the services after the services have been rendered, which are recorded in other operating expenses. We also maintain allowances related to our unbilled receivables for such items as expected realization or client disputes, the related provision for which is recorded as a reduction to revenue. Our allowance policy is based in part on the aging of the billed and unbilled client receivables and has been developed based on our write-off history. However, facts and circumstances, such as the average length of time the receivables are past due, general market conditions at the time we perform the work, current economic trends and our clients’ ability to pay, may cause fluctuations in our valuation of billed and unbilled receivables.
Income Taxes
The Company recognizes deferred tax assets and liabilities for the estimated future tax consequences of events attributable to differences between the financial statement carrying amounts of existing assets and liabilities and their respective tax bases and operating and capital loss and tax credit carryforwards. Deferred tax assets and liabilities are measured using enacted tax rates in effect for the year in which the differences are expected to be recovered or settled. The effect on deferred tax assets and liabilities of changes in tax rates is recognized for continuing operations in the consolidated statement of comprehensive income in the period in which the change is enacted. Deferred tax assets are reduced through the establishment of a valuation allowance at such time as, based on available evidence, it is more likely than not that the deferred tax assets will not be realized. The Company adjusts valuation allowances to measure deferred tax assets at the amounts considered realizable in future periods, which is assessed at each balance sheet date. In making such determinations, the Company considers all available positive and negative evidence, including future reversals of existing taxable temporary differences, projected future taxable income, tax planning strategies and recent financial operating results. We place more reliance on evidence that is objectively verifiable.
Commitments, Contingencies and Accrued Liabilities
We have established provisions against various actual and potential claims, lawsuits and other proceedings relating principally to alleged errors and omissions in connection with the placement of insurance and reinsurance and the provision of consulting services in the ordinary course of business. Such provisions cover claims that have been reported but not paid and also claims that have been incurred but not reported. These provisions are established based on actuarial estimates together with individual case reviews and are believed to be adequate in the light of current information and legal advice. In certain cases, where a range of loss exists, we accrue the minimum amount in the range if no amount within the range is a better estimate than any other amount.
See Note 15 — Commitments and Contingencies in Item 8 within this Annual Report on Form 10-K.
Pension Assumptions
We maintain defined benefit pension plans for employees in several countries, with the most significant defined benefit plans offered in the U.S. and U.K. Our disclosures in Note 13 — Retirement Benefits contain additional information about our other less significant but material retirement plans. Within our critical accounting policy discussion, we have excluded analysis for plans outside of those noted in the description below, as any variance of recorded information based on management’s estimates would be immaterial.
64
Descriptions of our U.S. and U.K. plans, which comprise 88% of our projected benefit obligations and 91% of our plan assets, are below:
United States
Legacy Willis – This plan was frozen in 2009. Approximately 600 WTW employees in the United States have a frozen accrued benefit under this plan.
WTW Plan – Substantially all U.S. employees are eligible to participate in this plan. Benefits are provided under a stable value pension plan design. The original stable value design came into effect on January 1, 2012. Plan participants prior to July 1, 2017 earn benefits without having to make employee contributions, and all newly-eligible employees after that date are required to contribute 2% of pay on an after-tax basis to participate in the plan. Effective January 1, 2024, stable value benefits are earned under the same contributory formula for all eligible colleagues. To participate, participants are required to contribute 2% of eligible earnings (base salary only) on an after-tax basis.
United Kingdom
Legacy Willis – This plan covers approximately 400 WTW employees in the U.K. The plan is now closed to new entrants. New employees in the U.K. are offered the opportunity to join a defined contribution plan.
Legacy Towers Watson – Benefit accruals earned under the Legacy Watson Wyatt defined benefit plan (predominantly pension benefits) ceased on February 28, 2015, although benefits earned prior to January 1, 2008 retain a link to salary until the employee leaves the Company. Benefit accruals earned under the legacy Towers Perrin defined benefit plan (predominantly lump sum benefits) were frozen on March 31, 2008. All participants now accrue defined contribution benefits.
The determination of the Company’s obligations and annual expense under the plans is based on a number of assumptions that, given the longevity of the plans, are long-term in focus. A change in one or a combination of these assumptions could have a material impact on our projected benefit obligation. However, certain of these changes, such as changes in the discount rates and other actuarial assumptions, are not recognized immediately in net income, but are instead recorded in other comprehensive income. The accumulated gains and losses not yet recognized in net income are amortized into net income as a component of the net periodic benefit cost/(income) over the average remaining service period or average remaining life expectancy, as appropriate, of the plan’s participants to the extent that the net gains or losses as of the beginning of the year exceed 10% of the greater of the market-related value of plan assets or the projected benefit obligation.
WTW considers several factors prior to the start of each fiscal year when determining the appropriate annual assumptions, including economic forecasts, relevant benchmarks, historical trends, portfolio composition and peer company comparisons. These assumptions, used to determine our pension liabilities and pension expense, are reviewed annually by senior management and changed when appropriate. A discount rate will be changed annually if underlying rates have moved, whereas an expected long-term return on assets will be changed less frequently as longer-term trends in asset returns emerge or long-term target asset allocations are revised. To calculate the discount rate, we use the granular approach to determining service cost and interest cost. The expected rate of return assumptions for all plans are supported by an analysis of the weighted-average yield expected to be achieved with the anticipated makeup of investments. We have allowed for actual and known inflation in preparing our estimates. Other material assumptions include rates of participant mortality, and the expected long-term rates of compensation and pension increases.
Funding is based on actuarially determined contributions and is limited to amounts that are currently deductible for tax purposes, or as agreed to with the plan trustees for the U.K. plans. Since funding calculations are based on different measurements than those used for accounting purposes, pension contributions are not equal to net periodic benefit cost.
65
We recorded a combined $39 million net periodic benefit income for our U.S. and U.K. plans for the year ended December 31, 2023. For the U.S. and U.K. plans, the following table presents our estimated net periodic benefit income for 2024 and the impact to both plans of a 0.25% increase and decrease to both the expected return on assets (‘EROA’) and the discount rate assumptions; and the projected benefit obligations as of December 31, 2023 and the impact of a 0.25% increase and decrease to the discount rates:
|
|
Totals - |
|
|
Impact of 0.25% change to |
|
|
Impact of 0.25% change to |
|
|||||||||||
|
|
|
|
|
Increase |
|
|
Decrease |
|
|
Increase |
|
|
Decrease |
|
|||||
Estimated 2024 (income)/expense: |
|
|
|
|
|
|
|
|
|
|
|
|
|
|
|
|||||
U.S. Plans |
|
$ |
(28 |
) |
|
$ |
(9 |
) |
|
$ |
9 |
|
|
$ |
(7 |
) |
|
$ |
7 |
|
U.K. Plans |
|
$ |
3 |
|
|
$ |
(8 |
) |
|
$ |
8 |
|
|
$ |
(1 |
) |
|
$ |
1 |
|
Projected benefit obligation at December 31, 2023: |
|
|
|
|
|
|
|
|
|
|
||||||||||
U.S. Plans |
|
$ |
4,098 |
|
|
N/A |
|
|
N/A |
|
|
$ |
(103 |
) |
|
$ |
108 |
|
||
U.K. Plans |
|
$ |
2,558 |
|
|
N/A |
|
|
N/A |
|
|
$ |
(82 |
) |
|
$ |
87 |
|
||
Economic factors and conditions often affect multiple assumptions simultaneously, and the effects of changes in key assumptions are not necessarily linear.
Goodwill and Intangible Assets — Impairment Review
In applying the acquisition method of accounting for business combinations, amounts assigned to identifiable assets and liabilities acquired were based on estimated fair values as of the date of acquisition, with the remainder recorded as goodwill. Intangible assets are initially valued at fair value using generally accepted valuation methods appropriate for the type of intangible asset. Intangible assets with definite lives are amortized over their estimated useful lives and are reviewed for impairment if indicators of impairment arise. Intangible assets with indefinite lives are tested for impairment annually as of October 1, and whenever indicators of impairment arise. The fair value of the intangible assets is compared with their carrying value and an impairment loss would be recognized for the amount by which the carrying amount exceeds the fair value. Goodwill is tested for impairment annually as of October 1, and whenever indicators of impairment arise.
Goodwill is tested at the reporting unit level, and the Company had seven reporting units as of October 1, 2023. During fiscal year 2023, the Company performed the impairment test for all reporting units which resulted in no impairments being identified. Six out of seven of our reporting units had estimated fair values that were significantly in excess of their carrying values. However, through this analysis, we determined that the reporting unit comprising our BDA business had a narrowed margin of excess fair value in 2023, driven primarily by reductions in market multiples for industry-specific competitors and an increase in the discount rate. This business had an excess fair value margin of 6.4% and holds $2.3 billion of goodwill at December 31, 2023. The Company continuously monitors and evaluates relevant events and circumstances that could unfavorably impact the significant assumptions noted above, including changes to the regulatory environment, general industry, market and macro-economic conditions and recent market valuations from transactions of comparable companies. It is possible that future changes in such circumstances, or in the inputs or assumptions used in estimating the fair value of the reporting unit, could require the Company to record a non-cash impairment charge.
To perform the test, we used valuation techniques to estimate the fair value of a reporting unit that are under the income and/or market approaches of valuation methods:
66
ITEM 7A. QUANTITATIVE AND QUALITATIVE DISCLOSURES ABOUT MARKET RISK
Financial Risk Management
We are exposed to market risk from changes in foreign currency exchange rates. In order to manage the risk arising from these exposures, we enter into a variety of foreign currency derivatives. We do not hold financial or derivative instruments for trading purposes.
A discussion of our accounting policies for financial and derivative instruments is included in Note 2 — Basis of Presentation, Significant Accounting Policies and Recent Accounting Pronouncements and Note 10 — Derivative Financial Instruments within Item 8 of this Annual Report on Form 10-K.
Foreign Exchange Risk
Because of the large number of countries and currencies we operate in, movements in currency exchange rates may affect our results.
We report our operating results and financial condition in U.S. dollars. Our U.S. operations earn revenue and incur expenses primarily in U.S. dollars. Outside the U.S., we predominantly generate revenue and expenses in the local currency with the exception of our London market operations which earn revenue in several currencies but incur expenses predominantly in Pounds sterling.
The table below gives an approximate analysis of revenue and expenses from continuing operations by currency in 2023.
|
|
U.S. |
|
Pounds |
|
Euro |
|
Other |
Revenue |
|
60% |
|
11% |
|
14% |
|
15% |
Expenses (i) |
|
54% |
|
17% |
|
12% |
|
17% |
Our principal exposures to foreign exchange risk arise from:
London market operations
The Company’s primary foreign exchange risks in its London market operations arise from changes in the exchange rate between the U.S. dollar and Pound sterling as its London market operations earn the majority of its revenue in U.S. dollars but incur expenses predominantly in Pounds sterling and may also hold significant foreign currency asset or liability positions on its consolidated balance sheet. In addition, the London market operations earn significant revenue in Euro and Japanese yen.
The foreign exchange risks in our London market operations are hedged to the extent that:
Intercompany lending between subsidiaries
The Company engages in intercompany borrowing and lending between subsidiaries, primarily through its in-house banking operations which give rise to foreign exchange exposures. The Company mitigates these risks through the use of short-term foreign currency forward and swap transactions that offset the underlying exposure created when the borrower and lender have different functional currencies. These derivatives are not generally designated as hedging instruments and at December 31, 2023, we had notional amounts of $1.2 billion (denominated primarily in U.S. dollars, Pounds sterling and Euros), with a net asset fair value of $3 million. Such derivatives typically mature within three months.
67
Translation risk
Outside our U.S. and London market operations, we predominantly earn revenue and incur expenses in the local currency. When we translate the results and net assets of these operations into U.S. dollars for reporting purposes, movements in exchange rates will affect reported results and net assets. For example, if the U.S. dollar strengthens against the Euro, the reported results of our Eurozone operations in U.S. dollar terms will be lower.
The table below provides information about our foreign currency forward exchange and option contracts which are designated as hedging instruments and are sensitive to exchange rate risk. The table summarizes the U.S. dollar equivalent amounts of each currency bought and sold forward and the weighted-average contractual exchange rates. All forward exchange contracts mature within two years.
|
|
Settlement date before December 31, |
||||||||||
|
|
2024 |
|
2025 |
||||||||
December 31, 2023 |
|
Contract |
|
|
Average |
|
Contract |
|
|
Average |
||
|
|
(millions) |
|
|
|
|
(millions) |
|
|
|
||
Foreign currency sold |
|
|
|
|
|
|
|
|
|
|
||
U.S. dollars sold for Pounds |
|
$ |
63 |
|
|
$1.23 = £1 |
|
$ |
26 |
|
|
$1.24 = £1 |
Euros sold for U.S. dollars |
|
|
24 |
|
|
€1 = $1.07 |
|
|
6 |
|
|
€1 = $1.10 |
Total |
|
$ |
87 |
|
|
|
|
$ |
32 |
|
|
|
Fair value (i) |
|
$ |
1 |
|
|
|
|
$ |
1 |
|
|
|
Income earned within foreign subsidiaries outside of the U.K. is generally offset by expenses in the same local currency, however the Company does have exposure to foreign exchange movements on the net income of these entities.
Interest Rate Risk
The Company has access to $1.5 billion under a revolving credit facility (see Note 11 — Debt within Item 8 of this Annual Report on Form 10-K for further information). As of December 31, 2023, no amount was drawn on this facility. We are also subject to market risk from exposure to changes in interest rates based on our investing activities where our primary interest rate risk arises from changes in short-term interest rates in U.S. dollars, Pounds sterling and Euros.
The table below provides information about our financial instruments that are sensitive to changes in interest rates. The Company had no outstanding floating rate-based debt at December 31, 2023.
|
|
Expected to mature before December 31, |
|
|
|
|
|
|
|
|
|
|
||||||||||||||||||||
|
|
2024 |
|
|
2025 |
|
|
2026 |
|
|
2027 |
|
|
2028 |
|
|
Thereafter |
|
|
Total |
|
|
Fair Value (i) |
|
||||||||
|
|
($ in millions) |
|
|||||||||||||||||||||||||||||
Fixed rate debt |
|
|
|
|
|
|
|
|
|
|
|
|
|
|
|
|
|
|
|
|
|
|
|
|
||||||||
Principal |
|
$ |
650 |
|
|
$ |
— |
|
|
$ |
550 |
|
|
$ |
750 |
|
|
$ |
600 |
|
|
$ |
2,700 |
|
|
$ |
5,250 |
|
|
$ |
5,004 |
|
Fixed rate payable |
|
|
3.600 |
% |
|
|
— |
|
|
|
4.400 |
% |
|
|
4.650 |
% |
|
|
4.500 |
% |
|
|
4.440 |
% |
|
|
4.368 |
% |
|
|
|
|
Interest Income on Fiduciary Funds
We are exposed to interest rate risk. Specifically, as a result of our operating activities, we receive cash for premiums and claims which we deposit in high-quality bank term deposit and money market funds, on which we earn interest, where permitted. We also hold funds for clients of our benefits accounts businesses. For the benefit funds not invested, cash and cash equivalents are held, on which we earn interest, until the funds are directed by plan participants to either be invested in mutual funds or paid out on their behalf. This interest earned is included in our consolidated financial statements as interest income. These funds are regulated in terms of access and the instruments in which they may be invested, most of which are short-term in maturity. As a result of measures taken by central banks around the world, rates offered on these investments have increased, in some cases significantly, over the course of the last year. This has resulted in the Company recognizing higher interest income over the same period in the prior year. Interest income in the future will be a function of the short-term rates we are able to obtain by currency and the cash balances available to
68
invest in these instruments. Interest income was $145 million, $55 million and $12 million for the years ended December 31, 2023, 2022 and 2021, respectively. At December 31, 2023, we held $2.2 billion of fiduciary funds invested in interest-bearing accounts. If short-term interest rates increased or decreased by 25 basis points, interest earned on these invested fiduciary funds, and therefore our interest income recognized, would increase or decrease by approximately $6 million on an annualized basis.
Credit Risk and Concentrations of Credit Risk
Credit risk represents the loss that would be recognized at the reporting date if counterparties failed to perform as contracted. The Company currently does not anticipate non-performance by its counterparties. The Company generally does not require collateral or other security to support financial instruments with credit risk.
Concentrations of credit risk that arise from financial instruments exist for groups of customers or counterparties when they have similar economic characteristics that would cause their ability to meet contractual obligations to be similarly affected by changes in economic or other conditions. Financial instruments on the balance sheet that potentially subject the Company to concentrations of credit risk consist primarily of cash and cash equivalents, fiduciary funds, accounts receivable and derivatives which are recorded at fair value.
The Company maintains a policy of providing for the diversification of cash and cash equivalent investments and places such investments in an extensive number of financial institutions to limit the amount of credit risk exposure. These financial institutions are monitored on an ongoing basis for credit quality predominantly using information provided by credit agencies.
Concentrations of credit risk with respect to receivables are limited due to the large number of clients and markets in which the Company does business, as well as the dispersion across many geographic areas. Management does not believe that significant risk exists in connection with the Company’s concentrations of credit as of December 31, 2023.
69
ITEM 8. FINANCIAL STATEMENTS AND SUPPLEMENTARY DATA
WILLIS TOWERS WATSON PUBLIC LIMITED COMPANY
INDEX TO FORM 10-K
For the year ended December 31, 2023
|
|
|
|
|
Page |
Report of Independent Registered Public Accounting Firm (PCAOB ID: |
|
71 |
|
73 |
|
Consolidated Balance Sheets as of December 31, 2023 and 2022 |
|
74 |
|
75 |
|
|
76 |
|
|
77 |
|
70
REPORT OF INDEPENDENT REGISTERED PUBLIC ACCOUNTING FIRM
To the Shareholders and the Board of Directors of Willis Towers Watson Public Limited Company
Opinion on the Financial Statements
We have audited the accompanying consolidated balance sheets of Willis Towers Watson Public Limited Company and subsidiaries (the ‘Company’) as of December 31, 2023 and 2022, the related consolidated statements of comprehensive income, changes in equity and cash flows, for each of the three years in the period ended December 31, 2023, and the related notes (collectively referred to as the ‘financial statements’). In our opinion, the financial statements present fairly, in all material respects, the financial position of the Company as of December 31, 2023 and 2022, and the results of its operations and its cash flows for each of the three years in the period ended December 31, 2023, in conformity with accounting principles generally accepted in the United States of America (‘US GAAP’).
We have also audited, in accordance with the standards of the Public Company Accounting Oversight Board (United States) (‘PCAOB’), the Company’s internal control over financial reporting as of December 31, 2023, based on criteria established in Internal Control — Integrated Framework (2013) issued by the Committee of Sponsoring Organizations of the Treadway Commission and our report dated February 22, 2024, expressed an unqualified opinion on the Company’s internal control over financial reporting.
Basis for Opinion
These financial statements are the responsibility of the Company's management. Our responsibility is to express an opinion on the Company's financial statements based on our audits. We are a public accounting firm registered with the PCAOB and are required to be independent with respect to the Company in accordance with the U.S. federal securities laws and the applicable rules and regulations of the Securities and Exchange Commission and the PCAOB.
We conducted our audits in accordance with the standards of the PCAOB. Those standards require that we plan and perform the audit to obtain reasonable assurance about whether the financial statements are free of material misstatement, whether due to error or fraud. Our audits included performing procedures to assess the risks of material misstatement of the financial statements, whether due to error or fraud, and performing procedures that respond to those risks. Such procedures included examining, on a test basis, evidence regarding the amounts and disclosures in the financial statements. Our audits also included evaluating the accounting principles used and significant estimates made by management, as well as evaluating the overall presentation of the financial statements. We believe that our audits provide a reasonable basis for our opinion.
Critical Audit Matters
The critical audit matters communicated below are matters arising from the current-period audit of the financial statements that were communicated or required to be communicated to the audit committee and that (1) relate to accounts or disclosures that are material to the financial statements and (2) involved our especially challenging, subjective, or complex judgments. The communication of critical audit matters does not alter in any way our opinion on the financial statements, taken as a whole, and we are not, by communicating the critical audit matters below, providing separate opinions on the critical audit matters or on the accounts or disclosures to which they relate.
Provisions for Liabilities - Errors & Omissions Reserve — Refer to Notes 2, 15 and 16 to the financial statements
Critical Audit Matter Description
The Company has established provisions against various actual and potential claims, lawsuits and other proceedings relating principally to alleged errors and omissions (‘E&O’) which arise in connection with the placement of insurance and reinsurance and provision of broking, consulting and outsourcing services in the ordinary course of business. Such provisions cover claims that have been reported but not paid and also claims that have been incurred but not reported (‘IBNR’). These provisions are established based on actuarial estimates together with individual case reviews. Significant management judgment is required to estimate the amounts of such claims.
Auditing management’s judgments related to its E&O provision, and in particular the broking, consulting and outsourcing business provisions related to the IBNR, and the provisions related to significant claims reported but not paid, involved especially complex and subjective judgment and an increased extent of effort, including the need to involve our actuarial specialists.
How the Critical Audit Matter Was Addressed in the Audit
Our audit procedures related to the determination of E&O provisions included the following, among others:
71
Goodwill – Benefits Delivery & Administration Reporting Unit— Refer to Notes 2 and 9 to the financial statements
Critical Audit Matter Description
The Company's evaluation of goodwill for impairment is performed annually as of October 1, and whenever indicators of impairment exist. Goodwill is tested at the reporting unit level, and the Company had seven reporting units as of October 1, 2023. In the impairment test, the fair value of each reporting unit is compared with its carrying value, including goodwill. If the carrying value of a reporting unit exceeds its fair value, the difference is recognized as an impairment loss. Through this analysis, the Company determined that the reporting unit comprising its Benefits Delivery & Administration (‘BDA’) business had a narrowed margin of excess fair value in 2023. The Company estimated the fair value of the reporting unit using the discounted cash flow method and guideline public company method. Significant management judgement is required to make assumptions and estimates that are subject to risk and uncertainty related to discount rate, and forecasts of future revenue and operating margin. Changes in these assumptions could have a significant impact on either the fair value, the amount of any goodwill impairment charge, or both.
Auditing management’s judgments related to its goodwill impairment analysis on the BDA reporting unit, and in particular the discount rate, and forecasts of future revenue and operating margin, involved especially complex and subjective auditor judgment and an increased extent of effort. This included the need to involve our fair value specialists when performing audit procedures to evaluate the reasonableness of management’s estimates and assumptions related to the selection of the discount rate, specifically due to the sensitivity of the BDA reporting unit’s fair value to a change in the discount rate.
How the Critical Audit Matter Was Addressed in the Audit
Our audit procedures related to the discount rate and forecasts of future revenue and operating margin used by management to estimate the fair value of the BDA reporting unit included the following, among others:
/s/
February 22, 2024
We have served as the Company’s auditor since 2017.
72
WILLIS TOWERS WATSON PUBLIC LIMITED COMPANY
Consolidated Statements of Comprehensive Income
(In millions of U.S. dollars, except per share data)
|
|
Years ended December 31, |
|
|||||||||
|
|
2023 |
|
|
2022 |
|
|
2021 |
|
|||
Revenue |
|
$ |
|
|
$ |
|
|
$ |
|
|||
Costs of providing services |
|
|
|
|
|
|
|
|
|
|||
Salaries and benefits |
|
|
|
|
|
|
|
|
|
|||
Other operating expenses |
|
|
|
|
|
|
|
|
|
|||
Depreciation |
|
|
|
|
|
|
|
|
|
|||
Amortization |
|
|
|
|
|
|
|
|
|
|||
Restructuring costs |
|
|
|
|
|
|
|
|
|
|||
Transaction and transformation, net |
|
|
|
|
|
|
|
|
( |
) |
||
Total costs of providing services |
|
|
|
|
|
|
|
|
|
|||
Income from operations |
|
|
|
|
|
|
|
|
|
|||
Interest expense |
|
|
( |
) |
|
|
( |
) |
|
|
( |
) |
Other income, net |
|
|
|
|
|
|
|
|
|
|||
INCOME FROM CONTINUING OPERATIONS BEFORE INCOME TAXES |
|
|
|
|
|
|
|
|
|
|||
Provision for income taxes |
|
|
( |
) |
|
|
( |
) |
|
|
( |
) |
INCOME FROM CONTINUING OPERATIONS |
|
|
|
|
|
|
|
|
|
|||
(LOSS)/INCOME FROM DISCONTINUED OPERATIONS, NET OF TAX |
|
|
|
|
|
( |
) |
|
|
|
||
NET INCOME |
|
|
|
|
|
|
|
|
|
|||
Income attributable to non-controlling interests |
|
|
( |
) |
|
|
( |
) |
|
|
( |
) |
NET INCOME ATTRIBUTABLE TO WTW |
|
$ |
|
|
$ |
|
|
$ |
|
|||
EARNINGS PER SHARE |
|
|
|
|
|
|
|
|
|
|||
|
|
|
|
|
|
|
|
|
|
|||
Basic earnings per share: |
|
|
|
|
|
|
|
|
|
|||
Income from continuing operations per share |
|
$ |
|
|
$ |
|
|
$ |
|
|||
(Loss)/income from discontinued operations per share |
|
|
|
|
|
( |
) |
|
|
|
||
Basic earnings per share |
|
$ |
|
|
$ |
|
|
$ |
|
|||
Diluted earnings per share: |
|
|
|
|
|
|
|
|
|
|||
Income from continuing operations per share |
|
$ |
|
|
$ |
|
|
$ |
|
|||
(Loss)/income from discontinued operations per share |
|
|
|
|
|
( |
) |
|
|
|
||
Diluted earnings per share |
|
$ |
|
|
$ |
|
|
$ |
|
|||
|
|
|
|
|
|
|
|
|
|
|||
NET INCOME |
|
$ |
|
|
$ |
|
|
$ |
|
|||
Other comprehensive (loss)/income, net of tax: |
|
|
|
|
|
|
|
|
|
|||
Foreign currency translation |
|
$ |
|
|
$ |
( |
) |
|
$ |
( |
) |
|
Defined pension and post-retirement benefits |
|
|
( |
) |
|
|
|
|
|
|
||
Derivative instruments |
|
|
|
|
|
( |
) |
|
|
|
||
Other comprehensive (loss)/income, net of tax, before non-controlling interests |
|
|
( |
) |
|
|
( |
) |
|
|
|
|
Comprehensive income before non-controlling interests |
|
|
|
|
|
|
|
|
|
|||
Comprehensive income attributable to non-controlling interests |
|
|
( |
) |
|
|
( |
) |
|
|
( |
) |
Comprehensive income attributable to WTW |
|
$ |
|
|
$ |
|
|
$ |
|
|||
See accompanying notes to the consolidated financial statements
73
WILLIS TOWERS WATSON PUBLIC LIMITED COMPANY
Consolidated Balance Sheets
(In millions of U.S. dollars, except share data)
|
|
December 31, |
|
|
December 31, |
|
||
ASSETS |
|
|
|
|
|
|
||
Cash and cash equivalents |
|
$ |
|
|
$ |
|
||
Fiduciary assets |
|
|
|
|
|
|
||
Accounts receivable, net |
|
|
|
|
|
|
||
Prepaid and other current assets |
|
|
|
|
|
|
||
Total current assets |
|
|
|
|
|
|
||
Fixed assets, net |
|
|
|
|
|
|
||
Goodwill |
|
|
|
|
|
|
||
Other intangible assets, net |
|
|
|
|
|
|
||
Right-of-use assets |
|
|
|
|
|
|
||
Pension benefits assets |
|
|
|
|
|
|
||
Other non-current assets |
|
|
|
|
|
|
||
Total non-current assets |
|
|
|
|
|
|
||
TOTAL ASSETS |
|
$ |
|
|
$ |
|
||
LIABILITIES AND EQUITY |
|
|
|
|
|
|
||
Fiduciary liabilities |
|
$ |
|
|
$ |
|
||
Deferred revenue and accrued expenses |
|
|
|
|
|
|
||
Current debt |
|
|
|
|
|
|
||
Current lease liabilities |
|
|
|
|
|
|
||
Other current liabilities |
|
|
|
|
|
|
||
Total current liabilities |
|
|
|
|
|
|
||
Long-term debt |
|
|
|
|
|
|
||
Liability for pension benefits |
|
|
|
|
|
|
||
Deferred tax liabilities |
|
|
|
|
|
|
||
Provision for liabilities |
|
|
|
|
|
|
||
Long-term lease liabilities |
|
|
|
|
|
|
||
Other non-current liabilities |
|
|
|
|
|
|
||
Total non-current liabilities |
|
|
|
|
|
|
||
TOTAL LIABILITIES |
|
|
|
|
|
|
||
|
|
|
|
|
|
|||
EQUITY (i) |
|
|
|
|
|
|
||
Additional paid-in capital |
|
|
|
|
|
|
||
Retained earnings |
|
|
|
|
|
|
||
Accumulated other comprehensive loss, net of tax |
|
|
( |
) |
|
|
( |
) |
Treasury shares, at cost, |
|
|
|
|
|
( |
) |
|
Total WTW shareholders’ equity |
|
|
|
|
|
|
||
Non-controlling interests |
|
|
|
|
|
|
||
Total equity |
|
|
|
|
|
|
||
TOTAL LIABILITIES AND EQUITY |
|
$ |
|
|
$ |
|
||
See accompanying notes to the consolidated financial statements
74
WILLIS TOWERS WATSON PUBLIC LIMITED COMPANY
Consolidated Statements of Cash Flows
(In millions of U.S. dollars)
|
|
Years ended December 31, |
|
|||||||||
|
|
2023 |
|
|
2022 |
|
|
2021 |
|
|||
CASH FLOWS FROM OPERATING ACTIVITIES |
|
|
|
|
|
|
|
|
|
|||
NET INCOME |
|
$ |
|
|
$ |
|
|
$ |
|
|||
Adjustments to reconcile net income to total net cash from operating activities: |
|
|
|
|
|
|
|
|
|
|||
Depreciation |
|
|
|
|
|
|
|
|
|
|||
Amortization |
|
|
|
|
|
|
|
|
|
|||
Impairment |
|
|
|
|
|
|
|
|
|
|||
Non-cash restructuring charges |
|
|
|
|
|
|
|
|
|
|||
Non-cash lease expense |
|
|
|
|
|
|
|
|
|
|||
Net periodic benefit of defined benefit pension plans |
|
|
( |
) |
|
|
( |
) |
|
|
( |
) |
Provision for doubtful receivables from clients |
|
|
|
|
|
|
|
|
|
|||
(Benefit from)/provision for deferred income taxes |
|
|
( |
) |
|
|
( |
) |
|
|
|
|
Share-based compensation |
|
|
|
|
|
|
|
|
|
|||
Net (gain)/loss on disposal of operations |
|
|
( |
) |
|
|
|
|
|
( |
) |
|
Non-cash foreign exchange loss/(gain) |
|
|
|
|
|
( |
) |
|
|
( |
) |
|
Other, net |
|
|
|
|
|
|
|
|
( |
) |
||
Changes in operating assets and liabilities, net of effects from purchase of subsidiaries: |
|
|
|
|
|
|
|
|
|
|||
Accounts receivable |
|
|
( |
) |
|
|
( |
) |
|
|
( |
) |
Other assets |
|
|
( |
) |
|
|
( |
) |
|
|
( |
) |
Other liabilities |
|
|
|
|
|
( |
) |
|
|
( |
) |
|
Provisions |
|
|
|
|
|
( |
) |
|
|
( |
) |
|
Net cash from operating activities |
|
|
|
|
|
|
|
|
|
|||
CASH FLOWS (USED IN)/FROM INVESTING ACTIVITIES |
|
|
|
|
|
|
|
|
|
|||
Additions to fixed assets and software for internal use |
|
|
( |
) |
|
|
( |
) |
|
|
( |
) |
Capitalized software costs |
|
|
( |
) |
|
|
( |
) |
|
|
( |
) |
Acquisitions of operations, net of cash acquired |
|
|
( |
) |
|
|
( |
) |
|
|
( |
) |
Net proceeds/(payments) from sale of operations |
|
|
|
|
|
( |
) |
|
|
|
||
Cash and fiduciary funds transferred in sale of operations |
|
|
( |
) |
|
|
( |
) |
|
|
( |
) |
(Purchase)/sale of investments |
|
|
( |
) |
|
|
|
|
|
( |
) |
|
Net cash (used in)/from investing activities |
|
|
( |
) |
|
|
( |
) |
|
|
|
|
CASH FLOWS USED IN FINANCING ACTIVITIES |
|
|
|
|
|
|
|
|
|
|||
Senior notes issued |
|
|
|
|
|
|
|
|
|
|||
Debt issuance costs |
|
|
( |
) |
|
|
( |
) |
|
|
( |
) |
Repayments of debt |
|
|
( |
) |
|
|
( |
) |
|
|
( |
) |
Repurchase of shares |
|
|
( |
) |
|
|
( |
) |
|
|
( |
) |
Proceeds from issuance of shares |
|
|
|
|
|
|
|
|
|
|||
Net (payments)/proceeds from fiduciary funds held for clients |
|
|
( |
) |
|
|
|
|
|
( |
) |
|
Payments of deferred and contingent consideration related to acquisitions |
|
|
( |
) |
|
|
( |
) |
|
|
( |
) |
Cash paid for employee taxes on withholding shares |
|
|
( |
) |
|
|
( |
) |
|
|
( |
) |
Dividends paid |
|
|
( |
) |
|
|
( |
) |
|
|
( |
) |
Acquisitions of and dividends paid to non-controlling interests |
|
|
( |
) |
|
|
( |
) |
|
|
( |
) |
Net cash used in financing activities |
|
|
( |
) |
|
|
( |
) |
|
|
( |
) |
(DECREASE)/INCREASE IN CASH, CASH EQUIVALENTS AND RESTRICTED |
|
|
( |
) |
|
|
( |
) |
|
|
|
|
Effect of exchange rate changes on cash, cash equivalents and restricted cash |
|
|
|
|
|
( |
) |
|
|
( |
) |
|
CASH, CASH EQUIVALENTS AND RESTRICTED CASH, BEGINNING OF YEAR (i) |
|
|
|
|
|
|
|
|
|
|||
CASH, CASH EQUIVALENTS AND RESTRICTED CASH, END OF YEAR (i) |
|
$ |
|
|
$ |
|
|
$ |
|
|||
See accompanying notes to the consolidated financial statements
75
WILLIS TOWERS WATSON PUBLIC LIMITED COMPANY
Consolidated Statements of Changes in Equity
(In millions of U.S. dollars and number of shares in thousands)
|
|
Shares |
|
|
Additional |
|
|
Retained |
|
|
Treasury |
|
|
AOCL (i) |
|
|
Total WTW |
|
|
Non-controlling |
|
|
Total equity |
|
||||||||
Balance as of January 1, 2021 |
|
|
|
|
$ |
|
|
$ |
|
|
$ |
( |
) |
|
$ |
( |
) |
|
$ |
|
|
$ |
|
|
$ |
|
||||||
Shares repurchased |
|
|
( |
) |
|
|
— |
|
|
|
( |
) |
|
|
— |
|
|
|
— |
|
|
|
( |
) |
|
|
— |
|
|
|
( |
) |
Net income |
|
|
— |
|
|
|
— |
|
|
|
|
|
|
— |
|
|
|
— |
|
|
|
|
|
|
|
|
|
|
||||
Dividends declared ($ |
|
|
— |
|
|
|
— |
|
|
|
( |
) |
|
|
— |
|
|
|
— |
|
|
|
( |
) |
|
|
— |
|
|
|
( |
) |
Dividends attributable to non-controlling |
|
|
— |
|
|
|
— |
|
|
|
— |
|
|
|
— |
|
|
|
— |
|
|
|
— |
|
|
|
( |
) |
|
|
( |
) |
Other comprehensive income |
|
|
— |
|
|
|
— |
|
|
|
— |
|
|
|
— |
|
|
|
|
|
|
|
|
|
|
|
|
|
||||
Issuance of shares under employee stock |
|
|
|
|
|
|
|
|
— |
|
|
|
— |
|
|
|
— |
|
|
|
|
|
|
— |
|
|
|
|
||||
Share-based compensation and net settlements |
|
|
— |
|
|
|
|
|
|
— |
|
|
|
— |
|
|
|
— |
|
|
|
|
|
|
— |
|
|
|
|
|||
Reduction of non-controlling interests (ii) |
|
|
— |
|
|
|
( |
) |
|
|
— |
|
|
|
— |
|
|
|
— |
|
|
|
( |
) |
|
|
( |
) |
|
|
( |
) |
Foreign currency translation |
|
|
— |
|
|
|
|
|
|
— |
|
|
|
— |
|
|
|
— |
|
|
|
|
|
|
— |
|
|
|
|
|||
Balance as of December 31, 2021 |
|
|
|
|
$ |
|
|
$ |
|
|
$ |
( |
) |
|
$ |
( |
) |
|
$ |
|
|
$ |
|
|
$ |
|
||||||
Shares repurchased |
|
|
( |
) |
|
|
— |
|
|
|
( |
) |
|
|
— |
|
|
|
— |
|
|
|
( |
) |
|
|
— |
|
|
|
( |
) |
Net income |
|
|
— |
|
|
|
— |
|
|
|
|
|
|
— |
|
|
|
— |
|
|
|
|
|
|
|
|
|
|
||||
Dividends declared ($ |
|
|
— |
|
|
|
— |
|
|
|
( |
) |
|
|
— |
|
|
|
— |
|
|
|
( |
) |
|
|
— |
|
|
|
( |
) |
Dividends attributable to non-controlling |
|
|
— |
|
|
|
— |
|
|
|
— |
|
|
|
— |
|
|
|
— |
|
|
|
— |
|
|
|
( |
) |
|
|
( |
) |
Other comprehensive loss |
|
|
— |
|
|
|
— |
|
|
|
— |
|
|
|
— |
|
|
|
( |
) |
|
|
( |
) |
|
|
( |
) |
|
|
( |
) |
Issuance of shares under employee stock |
|
|
|
|
|
|
|
|
— |
|
|
|
— |
|
|
|
— |
|
|
|
|
|
|
— |
|
|
|
|
||||
Share-based compensation and net settlements |
|
|
— |
|
|
|
|
|
|
— |
|
|
|
— |
|
|
|
— |
|
|
|
|
|
|
— |
|
|
|
|
|||
Additional non-controlling interests |
|
|
— |
|
|
|
— |
|
|
|
— |
|
|
|
— |
|
|
|
— |
|
|
|
— |
|
|
|
|
|
|
|
||
Reduction of non-controlling interests (ii) |
|
|
— |
|
|
|
|
|
|
— |
|
|
|
— |
|
|
|
— |
|
|
|
|
|
|
( |
) |
|
|
— |
|
||
Foreign currency translation |
|
|
— |
|
|
|
|
|
|
— |
|
|
|
— |
|
|
|
— |
|
|
|
|
|
|
— |
|
|
|
|
|||
Balance as of December 31, 2022 |
|
|
|
|
$ |
|
|
$ |
|
|
$ |
( |
) |
|
$ |
( |
) |
|
$ |
|
|
$ |
|
|
$ |
|
||||||
Shares repurchased |
|
|
( |
) |
|
|
( |
) |
|
|
( |
) |
|
|
|
|
|
— |
|
|
|
( |
) |
|
|
— |
|
|
|
( |
) |
|
Net income |
|
|
— |
|
|
|
— |
|
|
|
|
|
|
— |
|
|
|
— |
|
|
|
|
|
|
|
|
|
|
||||
Dividends declared ($ |
|
|
— |
|
|
|
— |
|
|
|
( |
) |
|
|
— |
|
|
|
— |
|
|
|
( |
) |
|
|
— |
|
|
|
( |
) |
Dividends attributable to non-controlling |
|
|
— |
|
|
|
— |
|
|
|
— |
|
|
|
— |
|
|
|
— |
|
|
|
— |
|
|
|
( |
) |
|
|
( |
) |
Other comprehensive (loss)/income |
|
|
— |
|
|
|
— |
|
|
|
— |
|
|
|
— |
|
|
|
( |
) |
|
|
( |
) |
|
|
|
|
|
( |
) |
|
Issuance of shares under employee stock |
|
|
|
|
|
|
|
|
— |
|
|
|
— |
|
|
|
— |
|
|
|
|
|
|
— |
|
|
|
|
||||
Share-based compensation and net settlements |
|
|
— |
|
|
|
|
|
|
— |
|
|
|
— |
|
|
|
— |
|
|
|
|
|
|
— |
|
|
|
|
|||
Reduction of non-controlling interests (ii) |
|
|
— |
|
|
|
( |
) |
|
|
— |
|
|
|
— |
|
|
|
— |
|
|
|
( |
) |
|
|
( |
) |
|
|
( |
) |
Foreign currency translation |
|
|
— |
|
|
|
( |
) |
|
|
— |
|
|
|
— |
|
|
|
— |
|
|
|
( |
) |
|
|
— |
|
|
|
( |
) |
Balance as of December 31, 2023 |
|
|
|
|
$ |
|
|
$ |
|
|
$ |
|
|
$ |
( |
) |
|
$ |
|
|
$ |
|
|
$ |
|
|||||||
See accompanying notes to the consolidated financial statements
76
WILLIS TOWERS WATSON PUBLIC LIMITED COMPANY
Notes to the Consolidated Financial Statements
(Tabular amounts are in millions of U.S. dollars, except per share data)
Note 1 — Nature of Operations
Willis Towers Watson Public Limited Company is a leading global advisory, broking and solutions company that provides data-driven, insight-led solutions in the areas of people, risk and capital. The Company has
We design and deliver solutions that manage risk, optimize benefits, cultivate talent and expand the power of capital to protect and strengthen institutions and individuals.
Our risk control services include strategic risk consulting (including providing actuarial analysis), a variety of due diligence services, the provision of practical on-site risk control services (such as health and safety or property loss control consulting), and analytical and advisory services (such as hazard modeling and climate risk quantification). We also assist our clients with managing incidents or crises when they occur. These services include contingency planning, security audits and product tampering plans.
We help our clients enhance their business performance by delivering consulting services, technology and solutions that help them anticipate, identify and capitalize on emerging opportunities in human capital management, as well as offer investment advice to help them develop disciplined and efficient strategies to meet their investment goals.
As an insurance broker, we act as an intermediary between our clients and insurance carriers by advising on their risk management requirements, helping them to determine the best means of managing risk and negotiating and placing insurance with insurance carriers through our global distribution network.
We operate a private Medicare marketplace in the U.S. through which, along with our active employee marketplace, we help our clients move to a more sustainable economic model by capping and controlling the costs associated with healthcare benefits. We also provide direct-to-consumer sales of Medicare coverage.
We are not an insurance company, and therefore we do not underwrite insurable risks for our own account. We help sharpen strategies, enhance organizational resilience, motivate workforces and maximize performance to uncover opportunities for sustainable success.
Note 2 — Basis of Presentation, Significant Accounting Policies and Recent Accounting Pronouncements
Basis of Presentation
The accompanying audited consolidated financial statements of WTW and our subsidiaries are presented in accordance with the rules and regulations of the SEC for annual reports on Form 10-K and are prepared in accordance with U.S. GAAP. All intercompany accounts and transactions have been eliminated in consolidation.
Significant Accounting Policies
Principles of Consolidation — The accompanying consolidated financial statements include the accounts of WTW and those of our majority-owned and controlled subsidiaries. We determine whether we have a controlling financial interest in an entity by first evaluating whether the entity is a voting interest entity or a variable interest entity (‘VIE’). Variable interest entities are entities that lack one or more of the characteristics of a voting interest entity and therefore require a different approach in determining which party involved with the VIE should consolidate the entity. With a VIE, either the entity does not have sufficient equity at risk to finance its activities without additional subordinated financial support from other parties, or the equity holders, as a group, do not have the power to direct the activities that most significantly impact its financial performance, the obligation to absorb expected losses of the entity, or the right to receive the expected residual returns of the entity. The entity that has a controlling financial interest in a VIE is referred to as the primary beneficiary and is required to consolidate the VIE.
Voting interest entities are entities that have sufficient equity and provide equity investors voting rights that give them the power to make significant decisions related to the entity’s operations. The usual condition for a controlling financial interest in a voting interest entity is ownership of a majority voting interest. Accordingly, we consolidate our voting interest entity investments in which we hold, directly or indirectly, more than
Use of Estimates — These consolidated financial statements conform to U.S. GAAP, which requires management to make estimates and assumptions that affect the reported amounts of assets and liabilities as well as disclosures of contingent assets and liabilities at the date of the financial statements and the reported amounts of revenue and expenses during the reporting periods. Our estimates,
77
judgments and assumptions are continually evaluated based on available information and experience. Because of the use of estimates inherent in the financial reporting process, actual results could differ from those estimates. Estimates are used when accounting for revenue recognition and related costs, the selection of useful lives of fixed and intangible assets, impairment testing, valuation of billed and unbilled receivables from clients, discretionary compensation, income taxes, pension assumptions, incurred but not reported claims, legal reserves and goodwill and intangible assets.
Going Concern — Management evaluates at each annual and interim period whether there are conditions or events, considered in the aggregate, that raise substantial doubt about our ability to continue as a going concern within one year after the date that the consolidated financial statements are issued. Management’s evaluation is based on relevant conditions and events that are known and reasonably knowable at the date that the consolidated financial statements are issued. Management has concluded that there are no conditions or events, considered in the aggregate, that raise substantial doubt about our ability to continue as a going concern within one year after the date of these financial statements.
Fair Value of Financial Instruments — The carrying values of our cash, cash equivalents and restricted cash, accounts receivable, short-term investments, accrued expenses and revolving lines of credit approximate their fair values because of the short maturity and liquidity of those instruments. The fair value of our senior notes and note receivable are considered Level 2 financial instruments as they are corroborated by observable market data. See Note 12 — Fair Value Measurements for additional information about our measurements of fair value.
Cash and Cash Equivalents — Cash and cash equivalents primarily consist of time deposits with original maturities of three months or less. In certain of the countries in which we conduct business, we are subject to capital adequacy requirements. Most significantly, Willis Limited, our U.K. brokerage subsidiary regulated by the Financial Conduct Authority, is currently required to maintain $
Fiduciary Assets and Liabilities — The Company collects premiums from insureds and, after deducting commissions, remits the premiums to the respective insurers. The Company also collects claims or refunds from insurers on behalf of insureds. Certain of our health and welfare benefits administration outsourcing agreements require us to hold funds on behalf of clients to pay obligations on their behalf or for plan participants to pay for medical costs (‘benefit funds’). Benefit funds held in cash and cash equivalents are part of fiduciary funds. In some instances, plan participants direct us to invest these benefit funds on their behalf (‘benefit funds investments’). Each of these transactions is reported on our consolidated balance sheets as assets and corresponding liabilities unless such balances are due to or from the same party and a right of offset exists, in which case the balances are recorded net.
Fiduciary assets on the consolidated balance sheets are comprised of fiduciary funds, benefit funds investments and fiduciary receivables:
Fiduciary funds – These amounts are restricted cash and cash equivalents held for unremitted insurance premiums and claims and benefit funds not invested, and are recorded within fiduciary assets on the consolidated balance sheets. Fiduciary funds are generally required to be kept in certain regulated bank accounts subject to guidelines which emphasize capital preservation and liquidity. Such funds are not available to service the Company’s debt or for other corporate purposes. Notwithstanding the legal relationships with insureds and insurers and excluding earnings on benefit funds, the Company is entitled to retain investment income earned on fiduciary funds in accordance with industry custom and practice and, in some cases, as supported by agreements with insureds. The period for which the Company holds such funds in its broking capacity is dependent upon the date the insured remits the payment of the premium to the Company, or the date the Company receives a refund from the insurer, and the date the Company is required to forward such payments to the insurer or insured, respectively. For the benefit funds, cash and cash equivalents are held until the funds are directed by plan participants to either be invested in mutual funds or paid out on their behalf. Fiduciary funds are included in the beginning and ending balances of cash, cash equivalents and restricted cash in the consolidated statements of cash flows. See Note 21 — Supplemental Disclosures of Cash Flow Information for a reconciliation of the fiduciary funds as presented on our consolidated balance sheets and the consolidated statements of cash flows.
Benefit funds investments – Benefit funds investments can be invested in open-ended mutual funds at the direction of the participant. Such funds are not available to service the Company’s debt or for other corporate purposes and earnings accrue to the participant.
Fiduciary receivables – Uncollected premiums from insureds, uncollected claims or refunds from insurers and unremitted benefits funds are recorded as fiduciary assets on the consolidated balance sheets. In certain instances, the Company advances premiums, refunds or claims to insurance underwriters or insureds prior to collection. Such advances are made from fiduciary funds and are reflected in the consolidated balance sheets as fiduciary assets.
78
Fiduciary liabilities on the consolidated balance sheets represent the obligations to remit all fiduciary assets as required under the terms of the various arrangements. Fiduciary receivables and liabilities for which cash has not been collected are equal and offsetting and have not been presented in the consolidated statements of cash flows.
Accounts Receivable — Accounts receivable includes both billed and unbilled receivables and is stated at estimated net realizable values. Provision for billed receivables is recorded, when necessary, in an amount considered by management to be sufficient to meet probable future losses related to uncollectible accounts. Accrued and unbilled receivables are stated at net realizable value which includes an allowance for accrued and unbillable amounts. See Note 4 — Revenue for additional information about our accounts receivable.
Acquired Accounts Receivable — As part of the acquisition accounting for the TRANZACT business in 2019, the acquired accounts receivable arising from direct-to-consumer Medicare broking sales were present-valued at the acquisition date in accordance with ASC 805, Business Combinations (‘ASC 805’). Cash collections for these receivables are expected to occur over a period of several years. Due to the provisions of ASC 606, Revenue From Contracts With Customers (‘ASC 606’), these receivables are not discounted for a significant financing component when initially recognized. Following the acquisition, the acquired renewal commissions receivables have been accounted for prospectively using the cost-recovery method in which future cash receipts will initially be applied against the acquisition date fair value until the value reaches zero. Any cash received in excess of the fair value determined at acquisition is recorded to earnings when it is received. The adjusted values of these acquired renewal commissions receivables are included in Prepaid and other current assets or Other non-current assets, as appropriate, on the consolidated balance sheets.
Income Taxes — The Company recognizes deferred tax assets and liabilities for the estimated future tax consequences of events attributable to differences between the financial statement carrying amounts of existing assets and liabilities and their respective tax bases and operating and capital loss and tax credit carryforwards. Deferred tax assets and liabilities are measured using enacted tax rates in effect for the year in which the differences are expected to be recovered or settled. The effect on deferred tax assets and liabilities of changes in tax rates is recognized for continuing operations in the consolidated statement of comprehensive income in the period in which the change is enacted. Deferred tax assets are reduced through the establishment of a valuation allowance at such time as, based on available evidence, it is more likely than not that the deferred tax assets will not be realized. The Company adjusts valuation allowances to measure deferred tax assets at the amounts considered realizable in future periods, which is assessed at each balance sheet date. In making such determinations, the Company considers all available positive and negative evidence, including future reversals of existing taxable temporary differences, projected future taxable income, tax planning strategies and recent financial operating results. We place more reliance on evidence that is objectively verifiable.
Positions taken in the Company’s tax returns may be subject to challenge by the taxing authorities upon examination. The Company recognizes the benefits of uncertain tax positions in the financial statements when it is more likely than not that a position will be sustained on the basis of the technical merits of the position assuming the tax authorities have full knowledge of the position and all relevant facts. Recognition also occurs upon either the lapse of the relevant statute of limitations or when positions are effectively settled. The benefit recognized is the largest amount of tax benefit that is greater than 50 percent likely to be realized on settlement with the tax authority. The Company adjusts its recognition of uncertain tax benefits in the period in which new information is available impacting either the recognition or measurement of its uncertain tax positions. Such adjustments are reflected as increases or decreases to income taxes in the period in which they are determined.
The Company recognizes interest and penalties relating to unrecognized tax benefits within income taxes. See Note 7 — Income Taxes for additional information regarding the Company’s income taxes.
Foreign Currency — Transactions in currencies other than the functional currency of the entity are recorded at the rates of exchange prevailing at the date of the transaction. Monetary assets and liabilities in currencies other than the functional currency are translated at the rates of exchange prevailing at the balance sheet date and the related transaction gains and losses are reported as income or expense in the consolidated statements of comprehensive income. Certain intercompany loans are determined to be of a long-term investment nature. The Company records transaction gains and losses from re-measuring such loans as other comprehensive income in the consolidated statements of comprehensive income.
Upon consolidation, the results of operations of subsidiaries and associates whose functional currency is other than the U.S. dollar are translated into U.S. dollars at the average exchange rates, and assets and liabilities are translated at year-end exchange rates. Translation adjustments are presented as a separate component of other comprehensive income in the financial statements and are included in net income only upon sale or liquidation of the underlying foreign subsidiary or associated company.
Derivatives — The Company uses derivative financial instruments to alter the risk profile of an existing underlying exposure. Forward and option foreign currency exchange contracts are used to manage currency exposures arising from future income and expenses and to offset balance sheet exposures in currencies other than the functional currency of an entity. We do not hold any derivatives for trading purposes. The fair values of derivative contracts are recorded in other assets and other liabilities in the consolidated balance sheets. The effective portions of changes in the fair value of derivatives that qualify for hedge accounting as cash flow hedges are
79
recorded in other comprehensive income. Amounts are reclassified from other comprehensive income into earnings when the hedged exposure affects earnings. If the derivative is designated and qualifies as an effective hedge, the changes in the fair value of the derivative and of the hedged item associated with the hedged risk are both recognized in earnings. The amount of hedge ineffectiveness recognized in earnings is based on the extent to which an offset between the fair value of the derivative and hedged item is not achieved. Changes in the fair value of derivatives that do not qualify for hedge accounting, together with any hedge ineffectiveness on those that do qualify, are recorded in Other income, net or interest expense as appropriate.
The Company evaluates whether its contracts include clauses or conditions which would be required to be separately accounted for at fair value as embedded derivatives. See Note 10 — Derivative Financial Instruments for additional information about the Company’s derivatives.
Commitments, Contingencies and Provisions for Liabilities — The Company establishes provisions against various actual and potential claims, lawsuits and other proceedings relating principally to alleged errors and omissions in the ordinary course of business. Such provisions cover claims that have been reported but not paid and also unasserted claims and related legal fees. These provisions are established based on actuarial estimates together with individual case reviews and are believed to be adequate in light of current information and legal advice. In certain cases, where a range of loss exists, we accrue the minimum amount in the range if no amount within the range is a better estimate than any other amount. To the extent such losses can be recovered under the Company’s insurance programs, estimated recoveries are recorded when losses for insured events are recognized and the recoveries are likely to be realized. Significant management judgment is required to estimate the amounts of such unasserted claims and the related insurance recoveries. The Company analyzes its litigation exposure based on available information, including consultation with outside counsel handling the defense of these matters, to assess its potential liability. These contingent liabilities are not discounted. See Note 15 — Commitments and Contingencies and Note 16 — Supplementary Information for Certain Balance Sheet Accounts for additional information about our commitments, contingencies and provisions for liabilities.
Share-Based Compensation — The Company has equity-based compensation plans that provide for grants of restricted stock units and stock options to employees and non-employee directors of the Company. Additionally, the Company has cash-settled share-based compensation plans that provide for grants to employees.
The Company expenses equity-based compensation, which is included in Salaries and benefits in the consolidated statements of comprehensive income, primarily on a straight-line basis over the requisite service period. The significant assumptions underlying our expense calculations include the fair value of the award on the date of grant, the estimated achievement of any performance targets and estimated forfeiture rates. The awards under equity-based compensation are classified as equity and are included as a component of equity on the Company’s consolidated balance sheets, as the ultimate payment of such awards will not be achieved through use of the Company’s cash or other assets.
For the cash-settled share-based compensation, the Company recognizes a liability for the fair-value of the awards as of each reporting date. The liability for these awards is included within Other current liabilities or Other non-current liabilities in the consolidated balance sheets depending on when the amounts are payable. Expense is recognized over the service period, and as the liability is remeasured at the end of each reporting period, changes in fair value are recognized as compensation cost within Salaries and benefits in the consolidated statements of comprehensive income. The significant assumptions underlying our expense calculations include the estimated achievement of any performance targets and estimated forfeiture rates.
See Note 19 — Share-based Compensation for additional information about the Company’s share-based compensation.
Fixed Assets — Fixed assets are stated at cost less accumulated depreciation. Expenditures for improvements are capitalized; repairs and maintenance are charged to expense as incurred. Depreciation is computed primarily using the straight-line method based on the estimated useful lives of assets.
Depreciation on internally-developed software is amortized over the estimated useful life of the asset ranging from
Long-lived assets are tested for recoverability whenever events or changes in circumstance indicate that their carrying amounts may not be recoverable. An impairment loss is recognized if the carrying amount of a long-lived asset is not recoverable and exceeds its fair value. Recoverability is determined based on the undiscounted cash flows expected to result from the use and eventual disposition of the asset or asset group. Long-lived assets and certain identifiable intangible assets to be disposed of are reported at the lower of carrying amount or fair value less cost to sell. See Note 8 — Fixed Assets for additional information about our fixed assets.
80
Leases — As an advisory, broking and solutions company providing services to clients in more than 140 countries, we enter into lease agreements from time to time, primarily for the use of real estate for our office space. We determine if an arrangement is a lease at the inception of the contract, and the nature of our operations is such that it is generally clear whether an arrangement contains a lease and what underlying asset is being leased. The majority of the leases into which we enter are operating leases. Upon entering into leases, we obtain the right to control the use of an identified space for a lease term and recognize these right-of-use (‘ROU’) assets on our consolidated balance sheets with corresponding lease liabilities reflecting our obligation to make the related lease payments. ROU assets are amortized over the term of the lease.
Our real estate leases are generally long-term in nature, with terms that currently range from to
In addition to payments for previously-agreed base rent, many of our lease agreements are subject to variable and unknown future payments, typically in the form of common area maintenance charges (a non-lease component as defined by ASC 842, Leases (‘ASC 842’)) or real estate taxes. These variable payments are excluded from our lease liabilities and ROU assets, and instead are recognized as lease expense within Other operating expenses on the consolidated statement of comprehensive income as the amounts are incurred. To the extent that we have agreed to fixed charges for common area maintenance or other non-lease components, or our base rent increases by an index or rate (most commonly an inflation rate), these amounts are included in the measurement of our lease liabilities and ROU assets. We have elected the practical expedient under ASC 842 which allows the lease and non-lease components to be combined in our measurement of lease liabilities and ROU assets.
From time to time we may enter into subleases if we are unable to cancel or fully occupy a space and are able to find an appropriate subtenant. However, entering subleases is not a primary objective of our business operations and these arrangements do not currently represent a material amount of cash flows.
We are required to use judgment in the determination of the incremental borrowing rates to calculate the present values of our future lease payments. Since the majority of our debt is publicly traded, our real estate function is centralized, and our treasury function is centralized and generally prohibits our subsidiaries from borrowing externally, we have determined it appropriate to use the Company’s consolidated unsecured borrowing rate, and we adjust for collateralization in accordance with ASC 842. Using the resulting interest rate curves from publicly traded debt at this collateralized borrowing rate, we select the interest rate at lease inception by reference to the lease term and lease currency. Approximately
Our leases generally do not subject us to restrictive covenants and contain no residual value guarantees.
See Note 14 — Leases for additional information about our operating leases.
Goodwill and Other Intangible Assets — In applying the acquisition method of accounting for business combinations, amounts assigned to identifiable assets and liabilities acquired were based on estimated fair values as of the date of acquisition, with the remainder recorded as goodwill. Intangible assets are initially valued at fair value using generally accepted valuation methods appropriate for the type of intangible asset. Intangible assets with definite lives are amortized over their estimated useful lives and are reviewed for impairment if indicators of impairment arise. Intangible assets with indefinite lives are tested for impairment annually as of October 1, and whenever indicators of impairment exist. The fair values of intangible assets are compared with their carrying values, and an impairment loss would be recognized for the amount by which a carrying amount exceeds its fair value.
Acquired intangible assets held at December 31, 2023 are being amortized on the basis noted and over the following expected life:
|
Amortization basis |
|
Expected life (years) |
Client relationships |
In line with underlying cash flows |
|
|
Software |
In line with underlying cash flows or straight-line basis |
|
|
Trademark and trade name |
Straight-line basis |
|
|
Other |
In line with underlying cash flows or straight-line basis |
|
|
Goodwill is tested for impairment annually as of October 1, and whenever indicators of impairment exist. Goodwill is tested at the reporting unit level, and the Company had
81
the difference is recognized as an impairment loss. The Company’s goodwill impairment tests for the years ended December 31, 2023 and 2022 have not resulted in any impairment charges. See Note 9 — Goodwill and Other Intangible Assets for additional information about our goodwill and other intangible assets.
Pensions — The Company has multiple defined benefit pension and defined contribution plans. The net periodic cost of the Company’s defined benefit plans is measured on an actuarial basis using various methods and actuarial assumptions. The most significant assumptions are the discount rates (formulated using the granular approach to calculating service and interest cost) and the expected long-term rates of return on plan assets. Other material assumptions include rates of participant mortality, the expected long-term rates of compensation and pension increases and rates of employee termination. Gains and losses occur when actual experience differs from actuarial assumptions. If such gains or losses exceed ten percent of the greater of the market-related value of plan assets or the projected benefit obligation, the Company amortizes those gains or losses over the average remaining service period or average remaining life expectancy, as appropriate, of the plan participants. In accordance with U.S. GAAP, the Company records the funded status of its pension plans based on the projected benefit obligation on its consolidated balance sheets.
Contributions to the Company’s defined contribution plans are recognized as incurred. Differences between contributions payable in the year and contributions actually paid are shown as either other assets or other liabilities in the consolidated balance sheets. See Note 13 — Retirement Benefits for additional information about our pensions.
Revenue Recognition — We recognize revenue from a variety of services, with broking, consulting and outsourced administration representing our most significant offerings. All other revenue streams, which can be recognized at either a point in time or over time, are individually less significant and are grouped in Other in our revenue disaggregation disclosures in Note 4 — Revenue. These Other revenue streams represent approximately
Broking — Representing
Due to the nature of the majority of our broking arrangements, no single document constitutes the contract for ASC 606 purposes. Our services may be governed by a mixture of different types of contractual arrangements depending on the jurisdiction or type of coverage, including terms of business agreements, broker-of-record letters, statements of work or local custom and practice. This is then confirmed by the client’s acceptance of the underlying insurance contract. Prior to the policy inception date, the client has not accepted nor formally committed to perform under the arrangement (i.e. pay for the insurance coverage in place). Therefore, in the majority of broking arrangements, the contract date is the date the insurance policy incepts. However, in certain instances such as employer-sponsored Medicare broking or Affinity arrangements, where the employer or sponsoring organization is our customer, client acceptance of underlying individual policy placements is not required, and therefore the date at which we have a contract with a customer is not dependent upon placement.
As noted, our primary performance obligations typically consist of only the placement of an effective insurance policy which precedes the inception date of the policy. Therefore, most of our fulfillment costs are incurred before we can recognize revenue, and are thus deferred during the pre-placement process. Where we have material post-placement services obligations, we estimate the relative fair value of the post-placement services using either the expected cost-plus-margin or the market assessment approach.
Revenue from our broking services consists of commissions or fees negotiated in lieu of commissions. At times, we may receive additional income for performing these services from the insurance and reinsurance carriers’ markets, which is collectively referred to as ‘market derived income’. In situations in which our fees are not fixed but are variable, we must estimate the likely commission per policy, taking into account the likelihood of cancellation before the end of the policy term. For employer-sponsored Medicare broking, Affinity arrangements and historically for proportional treaty reinsurance broking, the commissions to which we will be entitled can vary based on the underlying individual insurance policies that are placed. For employer-sponsored Medicare broking and proportional treaty reinsurance broking in particular, we base the estimates of transaction prices on supportable evidence from an analysis of past transactions, and only include amounts that are probable of being received or not refunded (referred to as applying ‘constraint’ under ASC 606). This is an area requiring significant judgment and results in us estimating a transaction price that may be significantly lower than the ultimate amount of commissions we may collect. The transaction price is then adjusted over time as we receive confirmation of our remuneration through receipt of treaty statements, or as other information becomes available.
82
We recognize revenue for most broking arrangements as of a point in time at the later of the policy inception date or when the policy placement is complete, because this is viewed as the date when control is transferred to the client. For employer-sponsored Medicare broking, we recognize revenue over time, as we stand ready under our agreements to place retiree Medicare coverage. For this type of broking arrangement, we recognize the majority of our placement revenue in the fourth quarter of the calendar year when most of the placement or renewal activity occurs.
We also have a direct-to-consumer Medicare broking offering. The contractual arrangements in this offering differ from our employer-sponsored Medicare broking offering described above. The governing contracts in our direct-to-consumer Medicare broking offering are the contractual arrangements with insurance carriers, for whom we act as an agent, that provide compensation in return for issued policies. Once an application is submitted to a carrier, our obligation is complete, and we have no ongoing fulfillment obligations. We receive compensation from carriers in the form of commissions, administrative fees and marketing fees in the first year, and depending on the type of policy issued, we may receive renewal commissions for up to
Because our obligation is complete upon application submission to the carrier, we recognize revenue at that date, which includes both compensation due to us in the first year as well as an estimate of the total renewal commissions that will be received over the lifetime of the policy. This variable consideration estimate requires significant judgment, and will vary based on product type, estimated commission rates, the expected lives of the respective policies and other factors. The Company has applied an actuarial model to account for these uncertainties, which is updated periodically based on actual experience, and includes an element of ‘constraint’ as defined by ASC 606 such that no significant reversal is expected to occur in the future. Actual results will differ from these estimates.
The timing of renewal payments in our direct-to-consumer Medicare broking offering is reflective of regulatory restrictions and insurance carriers’ protection for cancellations and varies based on policy holder decisions that are outside of the control of both the Company and the insurance carriers. As such, the estimate of these renewal commissions receivables has not been discounted to reflect a significant financing component.
Consulting — We earn revenue for advisory and consulting work that may be structured as different types of service offerings, including annual recurring projects, projects of a short duration or stand-ready obligations. Collectively, our consulting arrangements represent
We have engagement letters with our clients that specify the terms and conditions upon which the engagements are based. These terms and conditions can only be changed upon agreement by both parties.
In assessing our performance obligations, our consulting work is typically highly integrated, with the various promised services representing inputs of the combined overall output. We view these arrangements as representing a single performance obligation. To the extent we do not integrate our services, as is the case with unrelated services that may be sourced from different areas of our business, we consider these separate performance obligations.
Fee terms can be in the form of fixed-fees (including fixed-fees offset by commissions), time-and-expense fees, commissions, per-participant fees, or fees based on assets under management. Payment is typically due on a monthly basis as we perform under the contract, and we are entitled to be reimbursed for work performed to date in the event of termination.
The majority of our revenue from these consulting engagements is recognized over time, either because our clients are simultaneously receiving and consuming the benefits of our services, or because we have an enforceable right to payment for performance rendered to date. Additionally, from time to time, we may be entitled to an additional fee based on achieving certain performance criteria. To the extent that we cannot estimate with reasonable assurance the likelihood that we will achieve the performance target, we will ‘constrain’ this portion of the transaction price and recognize it when or as the uncertainty is resolved.
We use different progress measures to determine our revenue depending on the nature of the engagement:
83
Where we recognize revenue on a proportional performance basis, the amount we recognize is affected by a number of factors that can change the estimated amount of work required to complete the project such as the staffing on the engagement and/or the level of client participation. Our periodic engagement evaluations require us to make judgments and estimates regarding the overall profitability and stage of project completion that, in turn, affect how we recognize revenue. We recognize a loss on an engagement when estimated revenue to be received for that engagement is less than the total estimated costs associated with the engagement. Losses are recognized in the period in which the loss becomes probable and the amount of the loss is reasonably estimable.
Outsourced Administration — We provide customized benefits outsourcing and co-sourcing solutions services in relation to the administration of defined benefit, defined contribution, and health and welfare plans. These plans are sponsored by our clients to provide benefits to their active or retired employees. Additionally, these services include operating call centers and may include providing access to, and managing, a variety of consumer-directed savings accounts. The operation of call centers and consumer-directed accounts can be provisioned as part of an ongoing administration or solutions service, or separately as part of a broking arrangement. The products and services available to all clients are the same, but the selections by a client can vary and portray customized products and services based on the customer’s specific needs. Our services often include the use of proprietary systems that are configured for each of our clients’ needs. In total, our outsourced administration services represent
These contracts typically consist of an implementation phase and an ongoing administration phase:
We have engagement letters with our clients that specify the terms and conditions upon which the engagements are based. These terms and conditions can only be changed upon agreement by both parties. Fees for these arrangements can be fixed, per-participant-per-month, or in the case of call center services, provided in conjunction with our broking services, with an allocation based on commissions. Our fees are not typically payable until the commencement of the ongoing administration phase. However, in our health and welfare arrangements, we begin transferring services to our customers approximately four months prior to payments being due as part of our annual onboarding and enrollment work. Although our per-participant-per-month and commission-based fees are considered variable, they are typically predictable in nature, and therefore we generally do not ‘constrain’ any portion of our transaction price estimates. Once fees become payable, payment is typically due on a monthly basis as we perform under the contract, and we are entitled to be reimbursed for work performed to date in the event of termination.
Revenue is recognized over time as the services are performed because our clients are simultaneously receiving and consuming the benefits of our services. For our health and welfare arrangements where each benefits cycle represents a time increment under the series guidance, revenue is recognized based on proportional performance. We use an input measure (value of labor hours worked) as the measure of progress. Given that the service is stand-ready in nature, it can be difficult to predict the remaining obligation under the benefits cycle. Therefore, the input measure is based on the historical effort expended each month, which is measured as labor cost. This results in slightly more revenue being recognized during periods of annual onboarding since we are performing both our normal monthly services and our annual services during this portion of the benefits cycle.
84
For all other outsourced administration arrangements where a month represents our time increment under the series guidance, we allocate transaction price to the month we are performing our services. Therefore, the amount recognized each month is the variable consideration related to that month plus the fixed monthly or annual fee. The fixed monthly or annual fee is recognized on a straight-line basis. Revenue recognition for these types of arrangements is therefore more consistent throughout the year.
Reimbursed expenses — Client reimbursable expenses, including those relating to travel, other out-of-pocket expenses and any third-party costs, are included in revenue, and an equivalent amount of reimbursable expenses is included in other operating expenses as a cost of revenue as incurred. Reimbursed expenses represented approximately
Interest income — Interest income is recognized as earned.
Other income — Other income includes gains on disposal of intangible assets, which primarily arise from settlements through enforcing non-compete agreements in the event of losing accounts through producer defection or the disposal of books of business.
Cost to obtain or fulfill contracts — Costs to obtain customers include commissions for brokers under specific agreements that would not be incurred without a contract being signed and executed. The Company has elected to apply the ASC 606 ‘practical expedient’ which allows us to expense these costs as incurred if the amortization period related to the resulting asset would be one year or less. The Company has no significant instances of contracts that would be amortized for a period greater than a year, and therefore has no contract costs capitalized for these arrangements.
Costs to fulfill include costs incurred by the Company that are expected to be recovered within the expected contract period. The costs associated with our system implementation activities and consulting contracts are recorded through time entry.
For our broking business, the Company must estimate the fulfillment costs incurred during the pre-placement of the broking contracts. These judgments include:
We amortize costs to fulfill over the period we receive the related benefits. For broking pre-placement costs, this is typically less than a year. In our system implementation and consulting arrangements, we include the likelihood of contract renewals in our estimate of the amortization period, resulting in most costs being amortized for a greater length of time than the initial contract term.
Transaction and transformation, net — Transaction and transformation, net consists of two components, transaction-related costs and termination income receipts related to acquisitions and disposals, and transformation expenses associated with our Transformation program (see Note 6 — Restructuring Costs).
Transaction costs primarily include legal and other professional fees as well as other costs that are directly attributable to an acquisition or an in-process but not yet completed divestiture. Costs related to divestitures incurred during the period of the divestment are not included in transaction costs, but are instead included in the gain or loss on disposal of a business within Other income, net on the consolidated statements of comprehensive income. Additionally, on July 26, 2021, WTW and Aon plc (‘Aon’) announced they had terminated the business combination agreement between the two companies previously entered into in March 2020. Per the terms of the agreement and as part of this termination, Aon agreed to pay WTW $
Transformation costs are costs incurred under the Transformation program but are not eligible to be classified as restructuring costs under ASC 420, Exit or Disposal Cost Obligation (‘ASC 420’). These costs are not expected to continue beyond the defined period of the program.
Recent Accounting Pronouncements
In November 2023, the FASB issued ASU No. 2023-07, Segment Reporting (Topic 280): Improvements to Reportable Segment Disclosures, which is intended to improve reportable segment disclosure requirements through enhanced disclosures about significant segment expenses. Among other amendments, this ASU creates a ‘significant expense principle,’ and adds required disclosures of significant expenses for each reportable segment, as well as certain other disclosures to help investors understand how the chief
85
operating decision maker (‘CODM’) evaluates segment expenses and operating results. In addition, this ASU requires for interim periods all disclosures about a reportable segment’s profit or loss and assets under ASC 280, Segment Reporting, that had previously only been provided annually (e.g., interest revenue and expense, depreciation and amortization expense). The annual requirements of this ASU became effective for the Company on January 1, 2024, at which time we adopted it, and will include the new disclosures in our Annual Report on Form 10-K for the year ended December 31, 2024. New interim disclosures are required for fiscal years beginning January 1, 2025.
In December 2023, the FASB issued ASU No. 2023-09, Income Taxes (Topic 740): Improvements to Income Tax Disclosures, which is intended to improve the transparency of income tax disclosures by requiring consistent categories and greater disaggregation of information within the income tax rate reconciliation and income taxes paid disclosures. It also includes certain other amendments intended to improve the effectiveness of income tax disclosures. Specifically, this ASU requires a tabular income tax rate reconciliation using both percentages and amounts disaggregated into specific categories with certain reconciling items at or above 5% of the statutory tax, further disaggregated by its nature and/or jurisdiction. Additionally, income taxes paid will be required to be presented by federal, state, local and foreign jurisdictions, including amounts paid to individual jurisdictions representing 5% or more of the total income taxes paid. This ASU becomes effective for the Company on January 1, 2025, with early adoption permitted. The guidance is applied prospectively, with the option for retrospective application. The Company does not plan to early-adopt this ASU and is assessing the expected impact on its consolidated financial statements.
Other Legislation
Inflation Reduction Act
The Inflation Reduction Act (the ‘IRA’) was enacted into law on August 16, 2022 and certain portions of the IRA became effective January 1, 2023. The IRA introduced, among other provisions, a share repurchase excise tax and a new Corporate Alternative Minimum Tax (‘CAMT’) which imposes a 15% tax on the adjusted financial statement income of ‘applicable corporations’. Since becoming effective, the IRA has not had a material impact on the Company's consolidated financial statements.
Pillar Two
E.U. member states formally adopted the E.U.’s Pillar Two Directive, which introduces a global corporate minimum tax of 15% for certain large multinational companies. For the rules to take effect, E.U. member states were required to enact domestic legislation by the end of 2023 to be effective January 1, 2024. While we do not anticipate that this legislation will have a material impact on our tax provision or effective tax rate, we continue to monitor evolving tax legislation in the jurisdictions in which we operate.
Note 3 — Acquisitions and Divestitures
The following disclosures discuss significant transactions during the three-year period ended December 31, 2023.
Acquisitions
The Company completed acquisitions, including acquisitions of non-controlling interests of certain subsidiaries, during the years ended December 31, 2023, 2022 and 2021 for combined cash payments of $
Divestitures
Divestment of Russian Business
During the first quarter of 2022, WTW announced its intention to transfer ownership of its Russian subsidiaries to local management who will operate independently in the Russian market. Due to the sanctions and prohibitions on certain types of business and activities, WTW deconsolidated its Russian entities on March 14, 2022. The transfer of its Russian subsidiaries to local management was completed on the agreed-upon terms on July 18, 2022, and the transfer was registered in Russia on July 25, 2022. The deconsolidation in the first quarter of 2022 resulted in a loss of $
86
Willis Re Divestiture
On August 13, 2021, the Company entered into a definitive security and asset purchase agreement (the ‘Willis Re SAPA’) to sell its treaty-reinsurance business (‘Willis Re’) to Arthur J. Gallagher & Co. (‘Gallagher’), a leading global provider of insurance, risk management and consulting services, for total upfront cash consideration of $
In connection with the transaction, the Company reclassified the results of its Willis Re operations as discontinued operations on its consolidated statements of comprehensive income and reclassified Willis Re assets and liabilities as held for sale on its consolidated balance sheets. The consolidated cash flow statements were not adjusted for the divestiture. Willis Re was previously included in the Company's former Investment, Risk and Reinsurance segment. As noted above, the results of the Deferred Closing businesses following the Principal Closing until their respective Deferred Closing dates had been included in income from discontinued operations on the consolidated statements of comprehensive income during 2022.
The Company is accounting for the earnout as a gain contingency and therefore did not record any receivables upon close. Rather, the earnout will be recognized in the Company’s consolidated financial statements if and when a receipt becomes certain in 2025.
A number of services are continuing under a cost reimbursement Transition Services Agreement (‘TSA’) in which WTW is providing Gallagher support including real estate leases, information technology, payroll, human resources and accounting. During the third quarter of 2023, the term for these services was extended from November 30, 2023 to May 31, 2024 and may be further extended by Gallagher, in accordance with the terms of the TSA. Fees earned under the TSA were $
87
The following selected financial information relates to the operations of Willis Re for the periods presented:
|
|
Years ended December 31, |
|
|||||
|
|
2022 |
|
|
2021 |
|
||
Revenue from discontinued operations |
|
$ |
|
|
$ |
|
||
Costs of providing services |
|
|
|
|
|
|
||
Salaries and benefits |
|
|
|
|
|
|
||
Other operating expenses |
|
|
|
|
|
|
||
Depreciation and amortization |
|
|
|
|
|
|
||
Transaction and transformation, net |
|
|
|
|
|
|
||
Total costs of providing services |
|
|
|
|
|
|
||
Other income, net |
|
|
|
|
|
|
||
Income from discontinued operations before income taxes |
|
|
|
|
|
|
||
(Loss)/gain on disposal of Willis Re |
|
|
( |
) |
|
|
|
|
Benefit from/(provision for) income tax expense |
|
|
|
|
|
( |
) |
|
Net income (payable to)/receivable from Gallagher on Deferred Closing |
|
|
( |
) |
|
|
|
|
(Loss)/income from discontinued operations, net of tax |
|
$ |
( |
) |
|
$ |
|
|
The expense amounts reflected above represent only the direct costs attributable to the Willis Re business and exclude allocations of corporate costs that were retained following the sale. Neither the discontinued operations presented above, nor the unallocated corporate costs, reflect the impact of any cost reimbursement that has been received under the TSA.
Certain amounts included in the consolidated balance sheets did not transfer to Gallagher under the terms of the Willis Re SAPA, and instead are to be settled by the Company, noting that certain fiduciary positions continued to be held under the terms of various co-broking agreements between subsidiaries of the Company and Gallagher. At December 31, 2022, the amounts of significant assets and liabilities related to the Willis Re businesses which were not transferred in the sale were $
Miller Divestiture
On March 1, 2021, the Company completed the transaction to sell its U.K.-based, majority-owned wholesale subsidiary Miller for final total consideration of GBP
Other Disposals
The Company completed other disposals during the years ended December 31, 2023, 2022 and 2021 for cash proceeds of $
88
Note 4 — Revenue
Disaggregation of Revenue
The Company reports revenue by segment in Note 5 — Segment Information.
Year Ended |
|
Broking |
|
|
Consulting |
|
|
Outsourced |
|
|
Other |
|
|
Total revenue by service offering |
|
|
Reimbursable expenses and other (i) |
|
|
Total revenue from customer contracts |
|
|
Interest and other income |
|
|
Total revenue |
|
|||||||||
HWC |
|
|
|
|
|
|
|
|
|
|
|
|
|
|
|
|
|
|
|
|
|
|
|
|
|
|
|
|||||||||
2023 |
|
$ |
|
|
$ |
|
|
$ |
|
|
$ |
|
|
$ |
|
|
$ |
|
|
$ |
|
|
$ |
|
|
$ |
|
|||||||||
2022 |
|
|
|
|
|
|
|
|
|
|
|
|
|
|
|
|
|
|
|
|
|
|
|
|
|
|
|
|||||||||
2021 |
|
|
|
|
|
|
|
|
|
|
|
|
|
|
|
|
|
|
|
|
|
|
|
|
|
|
|
|||||||||
R&B |
|
|
|
|
|
|
|
|
|
|
|
|
|
|
|
|
|
|
|
|
|
|
|
|
|
|
|
|||||||||
2023 |
|
|
|
|
|
|
|
|
|
|
|
|
|
|
|
|
|
|
|
|
|
|
|
|
|
|
|
|||||||||
2022 |
|
|
|
|
|
|
|
|
|
|
|
|
|
|
|
|
|
|
|
|
|
|
|
|
|
|
|
|||||||||
2021 |
|
|
|
|
|
|
|
|
|
|
|
|
|
|
|
|
|
|
|
|
|
|
|
|
|
|
|
|||||||||
Divested Businesses |
|
|
|
|
|
|
|
|
|
|
|
|
|
|
|
|
|
|
|
|
|
|
|
|
|
|
|
|||||||||
2023 |
|
|
|
|
|
|
|
|
|
|
|
|
|
|
|
|
|
|
|
|
|
|
|
|
|
|
|
|||||||||
2022 |
|
|
|
|
|
|
|
|
|
|
|
|
|
|
|
|
|
|
|
|
|
|
|
|
|
|
|
|||||||||
2021 |
|
|
|
|
|
|
|
|
|
|
|
|
|
|
|
|
|
|
|
|
|
|
|
|
|
|
|
|||||||||
Corporate (i) |
|
|
|
|
|
|
|
|
|
|
|
|
|
|
|
|
|
|
|
|
|
|
|
|
|
|
|
|||||||||
2023 |
|
|
|
|
|
|
|
|
|
|
|
|
|
|
|
|
|
|
|
|
|
|
|
|
|
|
|
|||||||||
2022 |
|
|
|
|
|
|
|
|
|
|
|
|
|
|
|
|
|
|
|
|
|
|
|
|
|
|
|
|||||||||
2021 |
|
|
|
|
|
|
|
|
|
|
|
|
|
|
|
|
|
( |
) |
|
|
( |
) |
|
|
|
|
|
( |
) |
||||||
Total |
|
|
|
|
|
|
|
|
|
|
|
|
|
|
|
|
|
|
|
|
|
|
|
|
|
|
|
|||||||||
2023 |
|
$ |
|
|
$ |
|
|
$ |
|
|
$ |
|
|
$ |
|
|
$ |
|
|
$ |
|
|
$ |
|
|
$ |
|
|||||||||
2022 |
|
$ |
|
|
$ |
|
|
$ |
|
|
$ |
|
|
$ |
|
|
$ |
|
|
$ |
|
|
$ |
|
|
$ |
|
|||||||||
2021 |
|
$ |
|
|
$ |
|
|
$ |
|
|
$ |
|
|
$ |
|
|
$ |
|
|
$ |
|
|
$ |
|
|
$ |
|
|||||||||
Interest and other income is included in segment revenue and total revenue, however it has been presented separately in the above tables because it does not arise directly from contracts with customers. The significant components of interest and other income are as follows for the periods presented above:
|
|
Year Ended December 31, |
|
|||||||||||||||||||||||||||||||||||||||||||||
|
|
Book-of-business settlements |
|
|
Interest income |
|
|
Other income |
|
|
Total |
|
||||||||||||||||||||||||||||||||||||
|
|
2023 |
|
|
2022 |
|
|
2021 |
|
|
2023 |
|
|
2022 |
|
|
2021 |
|
|
2023 |
|
|
2022 |
|
|
2021 |
|
|
2023 |
|
|
2022 |
|
|
2021 |
|
||||||||||||
HWC |
|
$ |
|
|
$ |
|
|
$ |
|
|
$ |
|
|
$ |
|
|
$ |
|
|
$ |
|
|
$ |
|
|
$ |
|
|
$ |
|
|
$ |
|
|
$ |
|
||||||||||||
R&B |
|
|
|
|
|
|
|
|
|
|
|
|
|
|
|
|
|
|
|
|
|
|
|
( |
) |
|
|
|
|
|
|
|
|
|
|
|
|
|||||||||||
Divested businesses |
|
|
|
|
|
|
|
|
|
|
|
|
|
|
|
|
|
|
|
|
|
|
|
|
|
|
|
|
|
|
|
|
|
|
|
|
||||||||||||
Corporate |
|
|
|
|
|
|
|
|
|
|
|
|
|
|
|
|
|
( |
) |
|
|
|
|
|
|
|
|
|
|
|
|
|
|
|
|
|
|
|||||||||||
Total interest and other income |
|
$ |
|
|
$ |
|
|
$ |
|
|
$ |
|
|
$ |
|
|
$ |
|
|
$ |
|
|
$ |
|
|
$ |
|
|
$ |
|
|
$ |
|
|
$ |
|
||||||||||||
As a result of the cessation of the co-broking agreement, (see Note 3 — Acquisitions and Divestitures) interest income associated with fiduciary funds is now allocated more directly to the Risk and Broking segment beginning in the third quarter of 2023. These amounts were previously allocated to the Corporate segment following the disposal of Willis Re.
89
The following table presents revenue from service offerings by the geography where our work was performed for the years ended December 31, 2023, 2022 and 2021. The reconciliation to total revenue on our consolidated statements of comprehensive income and to segment revenue is shown in the table above.
Year Ended |
|
North America |
|
|
Europe |
|
|
International |
|
|
Total revenue by geography |
|
||||
HWC |
|
|
|
|
|
|
|
|
|
|
|
|
||||
2023 |
|
$ |
|
|
$ |
|
|
$ |
|
|
$ |
|
||||
2022 |
|
|
|
|
|
|
|
|
|
|
|
|
||||
2021 |
|
|
|
|
|
|
|
|
|
|
|
|
||||
R&B |
|
|
|
|
|
|
|
|
|
|
|
|
||||
2023 |
|
|
|
|
|
|
|
|
|
|
|
|
||||
2022 |
|
|
|
|
|
|
|
|
|
|
|
|
||||
2021 |
|
|
|
|
|
|
|
|
|
|
|
|
||||
Divested Businesses |
|
|
|
|
|
|
|
|
|
|
|
|
||||
2023 |
|
|
|
|
|
|
|
|
|
|
|
|
||||
2022 |
|
|
|
|
|
|
|
|
|
|
|
|
||||
2021 |
|
|
|
|
|
|
|
|
|
|
|
|
||||
Corporate |
|
|
|
|
|
|
|
|
|
|
|
|
||||
2023 |
|
|
|
|
|
|
|
|
|
|
|
|
||||
2022 |
|
|
|
|
|
|
|
|
|
|
|
|
||||
2021 |
|
|
|
|
|
|
|
|
|
|
|
|
||||
Total |
|
|
|
|
|
|
|
|
|
|
|
|
||||
2023 |
|
$ |
|
|
$ |
|
|
$ |
|
|
$ |
|
||||
2022 |
|
$ |
|
|
$ |
|
|
$ |
|
|
$ |
|
||||
2021 |
|
$ |
|
|
$ |
|
|
$ |
|
|
$ |
|
||||
Contract Balances
The Company reports accounts receivable, net on the consolidated balance sheet, which includes billed and unbilled receivables and current contract assets. In addition to accounts receivable, net, the Company had the following non-current contract assets and deferred revenue balances at December 31, 2023 and 2022:
|
|
December 31, 2023 |
|
|
December 31, 2022 |
|
||
Billed receivables, net of allowance for doubtful accounts of $ |
|
$ |
|
|
$ |
|
||
Unbilled receivables |
|
|
|
|
|
|
||
Current contract assets |
|
|
|
|
|
|
||
Accounts receivable, net |
|
$ |
|
|
$ |
|
||
Non-current accounts receivable, net |
|
$ |
|
|
$ |
|
||
Non-current contract assets |
|
$ |
|
|
$ |
|
||
Deferred revenue |
|
$ |
|
|
$ |
|
||
The Company receives payments from customers based on billing schedules or terms as written in our contracts. Those balances denoted as contract assets relate to situations where we have completed some or all performance under the contract, however our right to consideration is conditional. Contract assets result most materially in our Medicare intermediary businesses. The significant increases in both current and non-current contract assets relate to our direct-to-consumer Medicare broking business. Billed and unbilled receivables are recorded when the right to consideration becomes unconditional. Deferred revenue relates to payments received in advance of performance under the contract and is recognized as revenue as (or when) we perform under the contract.
Accounts receivable are stated at estimated net realizable values. The following table presents the changes in our allowance for doubtful accounts for the years ended December 31, 2023, 2022 and 2021.
|
|
December 31, |
|
|
December 31, |
|
|
December 31, |
|
|||
Balance at beginning of year |
|
$ |
|
|
$ |
|
|
$ |
|
|||
Additions charged to costs and expenses |
|
|
|
|
|
|
|
|
|
|||
Deductions/other movements |
|
|
( |
) |
|
|
( |
) |
|
|
( |
) |
Foreign exchange |
|
|
|
|
|
|
|
|
|
|||
Balance at end of year |
|
$ |
|
|
$ |
|
|
$ |
|
|||
The changes in our allowance for doubtful accounts presented above do not include receivables that were impaired as a result of the divestment of our Russian businesses in March 2022. See Note 3 — Acquisitions and Divestitures.
90
During the year ended December 31, 2023, revenue of approximately $
During the year ended December 31, 2023, the Company recognized revenue of approximately $
Performance Obligations
The Company has contracts for which performance obligations have not been satisfied as of December 31, 2023 or have been partially satisfied as of this date. The following table shows the expected timing for the satisfaction of the remaining performance obligations. This table does not include contract renewals or variable consideration, which was excluded from the transaction prices in accordance with the guidance on constraining estimates of variable consideration.
In addition, in accordance with ASC 606, the Company has elected not to disclose the remaining performance obligations when one or both of the following circumstances apply:
|
|
2024 |
|
|
2025 |
|
|
2026 onward |
|
|
Total |
|
||||
Revenue expected to be recognized on contracts as of |
|
$ |
|
|
$ |
|
|
$ |
|
|
$ |
|
||||
Since most of the Company’s contracts are cancellable with less than one year’s notice and have no substantive penalty for cancellation, the majority of the Company’s remaining performance obligations as of December 31, 2023 have been excluded from the table above.
Costs to obtain or fulfill a contract
The Company incurs costs to obtain or fulfill contracts which it would not incur if a contract with a customer was not executed.
The following table shows the categories of costs that are capitalized and deferred over the expected life of a contract.
|
|
Costs to fulfill |
|
|||||||||
|
|
December 31, |
|
|
December 31, |
|
|
December 31, |
|
|||
Balance at beginning of the year |
|
$ |
|
|
$ |
|
|
$ |
|
|||
New capitalized costs |
|
|
|
|
|
|
|
|
|
|||
Amortization |
|
|
( |
) |
|
|
( |
) |
|
|
( |
) |
Disposals |
|
|
|
|
|
|
|
|
( |
) |
||
Impairments |
|
|
|
|
|
|
|
|
( |
) |
||
Foreign currency translation |
|
|
|
|
|
( |
) |
|
|
|
||
Balance at end of the year |
|
$ |
|
|
$ |
|
|
$ |
|
|||
Note 5 — Segment Information
WTW has
WTW’s chief operating decision maker is its chief executive officer. We determined that the operational data used by the chief operating decision maker is at the segment level. Management bases strategic goals and decisions on these segments and the data presented below is used to assess the adequacy of strategic decisions and the methods of achieving these strategies and related financial results. Management evaluates the performance of its segments and allocates resources to them based on net operating income on a pre-tax basis.
The Company experiences seasonal fluctuations of its revenue. Revenue is typically higher during the Company’s first and fourth quarters due primarily to the timing of broking-related activities.
Under the segment structure and for internal and segment reporting, WTW segment revenue includes commissions and fees, interest and other income. U.S. GAAP revenue also includes amounts that were directly incurred on behalf of our clients and reimbursed by
91
them (reimbursable expenses), which are removed from segment revenue. Segment operating income excludes certain costs, including (i) amortization of intangibles; (ii) restructuring costs; (iii) certain transaction and transformation expenses; and (iv) to the extent that the actual expense based upon which allocations are made differs from the forecast/budget amount, a reconciling item will be created between internally-allocated expenses and the actual expenses that we report for U.S. GAAP purposes.
The following table presents segment revenue and segment operating income for our reportable segments for the years ended December 31, 2023, 2022 and 2021.
|
|
Segment revenue |
|
|
Segment operating income |
|
||||||||||||||||||
|
|
Years ended December 31 |
|
|
Years ended December 31 |
|
||||||||||||||||||
|
|
2023 |
|
|
2022 |
|
|
2021 |
|
|
2023 |
|
|
2022 |
|
|
2021 |
|
||||||
HWC |
|
$ |
|
|
$ |
|
|
$ |
|
|
$ |
|
|
$ |
|
|
$ |
|
||||||
R&B |
|
|
|
|
|
|
|
|
|
|
|
|
|
|
|
|
|
|
||||||
Total |
|
$ |
|
|
$ |
|
|
$ |
|
|
$ |
|
|
$ |
|
|
$ |
|
||||||
The following table presents reconciliations of the information reported by segment to the Company’s consolidated amounts reported for the years ended December 31, 2023, 2022 and 2021.
|
|
Years ended December 31, |
|
|||||||||
|
|
2023 |
|
|
2022 |
|
|
2021 |
|
|||
Revenue: |
|
|
|
|
|
|
|
|
|
|||
Total segment revenue |
|
$ |
|
|
$ |
|
|
$ |
|
|||
Divested businesses (i) |
|
|
|
|
|
|
|
|
|
|||
Reimbursable expenses and other |
|
|
|
|
|
|
|
|
|
|||
Revenue |
|
$ |
|
|
$ |
|
|
$ |
|
|||
|
|
|
|
|
|
|
|
|
|
|||
Total segment operating income |
|
$ |
|
|
$ |
|
|
$ |
|
|||
Divested businesses (i) |
|
|
|
|
|
|
|
|
( |
) |
||
Impairment (ii) |
|
|
|
|
|
( |
) |
|
|
|
||
Amortization |
|
|
( |
) |
|
|
( |
) |
|
|
( |
) |
Restructuring costs (iii) |
|
|
( |
) |
|
|
( |
) |
|
|
( |
) |
Transaction and transformation, net (iv) |
|
|
( |
) |
|
|
( |
) |
|
|
|
|
Unallocated, net (v) |
|
|
( |
) |
|
|
( |
) |
|
|
( |
) |
Income from operations |
|
|
|
|
|
|
|
|
|
|||
Interest expense |
|
|
( |
) |
|
|
( |
) |
|
|
( |
) |
Other income, net |
|
|
|
|
|
|
|
|
|
|||
INCOME FROM CONTINUING OPERATIONS BEFORE INCOME |
|
$ |
|
|
$ |
|
|
$ |
|
|||
The Company does not currently provide asset information by reportable segment as it does not routinely evaluate the total asset position by segment.
None of the Company’s customers individually represented more than
92
Below are our revenue and tangible long-lived assets for Ireland, our country of domicile, countries with significant concentrations, and all other foreign countries as of and for the years ended as indicated:
|
|
Revenue |
|
|
Long-Lived Assets (i) |
|
||||||||||||||
|
|
Years ended December 31, |
|
|
December 31, |
|
|
December 31, |
|
|||||||||||
|
|
2023 |
|
|
2022 |
|
|
2021 |
|
|
2023 |
|
|
2022 |
|
|||||
Ireland |
|
$ |
|
|
$ |
|
|
$ |
|
|
$ |
|
|
$ |
|
|||||
|
|
|
|
|
|
|
|
|
|
|
|
|
|
|
|
|||||
United States |
|
|
|
|
|
|
|
|
|
|
|
|
|
|
|
|||||
United Kingdom |
|
|
|
|
|
|
|
|
|
|
|
|
|
|
|
|||||
Rest of World |
|
|
|
|
|
|
|
|
|
|
|
|
|
|
|
|||||
Total Foreign Countries |
|
|
|
|
|
|
|
|
|
|
|
|
|
|
|
|||||
|
|
$ |
|
|
$ |
|
|
$ |
|
|
$ |
|
|
$ |
|
|||||
Note 6 — Restructuring Costs
93
Certain costs under the Transformation program are accounted for under ASC 420 and are included as restructuring costs in the consolidated statements of comprehensive income. Other costs incurred under the Transformation program are included in transaction and transformation, net and were $
|
|
HWC |
|
|
R&B |
|
|
Corporate |
|
|
Total |
|
||||
2021 |
|
|
|
|
|
|
|
|
|
|
|
|
||||
Real estate rationalization |
|
$ |
— |
|
|
$ |
— |
|
|
$ |
|
|
$ |
|
||
Technology modernization |
|
|
— |
|
|
|
|
|
|
— |
|
|
|
|
||
Process optimization |
|
|
— |
|
|
|
— |
|
|
|
— |
|
|
|
— |
|
Other |
|
|
— |
|
|
|
— |
|
|
|
|
|
|
|
||
2022 |
|
|
|
|
|
|
|
|
|
|
|
|
||||
Real estate rationalization |
|
|
— |
|
|
|
— |
|
|
|
|
|
|
|
||
Technology modernization |
|
|
— |
|
|
|
|
|
|
|
|
|
|
|||
Process optimization |
|
|
|
|
|
— |
|
|
|
— |
|
|
|
|
||
Other |
|
|
— |
|
|
|
— |
|
|
|
— |
|
|
|
— |
|
2023 |
|
|
|
|
|
|
|
|
|
|
|
|
||||
Real estate rationalization |
|
|
— |
|
|
|
— |
|
|
|
|
|
|
|
||
Technology modernization |
|
|
|
|
|
|
|
|
|
|
|
|
||||
Process optimization |
|
|
— |
|
|
|
— |
|
|
|
— |
|
|
|
— |
|
Other |
|
|
— |
|
|
|
— |
|
|
|
— |
|
|
|
— |
|
Total |
|
|
|
|
|
|
|
|
|
|
|
|
||||
Real estate rationalization |
|
|
— |
|
|
|
— |
|
|
|
|
|
|
|
||
Technology modernization |
|
|
|
|
|
|
|
|
|
|
|
|
||||
Process optimization |
|
|
|
|
|
— |
|
|
|
— |
|
|
|
|
||
Other |
|
|
— |
|
|
|
— |
|
|
|
|
|
|
|
||
Total |
|
$ |
|
|
$ |
|
|
$ |
|
|
$ |
|
||||
A rollforward of the liability associated with cash-based charges related to restructuring costs associated with the Transformation program is as follows:
|
|
Real estate rationalization |
|
|
Technology modernization |
|
|
Process optimization |
|
|
Other |
|
|
Total |
|
|||||
Balance at October 1, 2021 |
|
$ |
— |
|
|
$ |
— |
|
|
$ |
— |
|
|
$ |
|
|
$ |
|
||
Charges incurred |
|
|
— |
|
|
|
— |
|
|
|
— |
|
|
|
|
|
|
|
||
Cash payments |
|
|
— |
|
|
|
— |
|
|
|
— |
|
|
|
( |
) |
|
|
( |
) |
Balance at December 31, 2021 |
|
|
— |
|
|
|
— |
|
|
|
— |
|
|
|
|
|
|
|
||
Charges incurred |
|
|
|
|
|
— |
|
|
|
|
|
|
— |
|
|
|
|
|||
Cash payments |
|
|
( |
) |
|
|
— |
|
|
|
( |
) |
|
|
( |
) |
|
|
( |
) |
Balance at December 31, 2022 |
|
|
|
|
|
— |
|
|
|
— |
|
|
|
— |
|
|
|
|
||
Charges incurred |
|
|
|
|
|
|
|
|
— |
|
|
|
— |
|
|
|
|
|||
Cash payments |
|
|
( |
) |
|
|
— |
|
|
|
— |
|
|
|
— |
|
|
|
( |
) |
Balance at December 31, 2023 |
|
$ |
|
|
$ |
|
|
$ |
— |
|
|
$ |
|
|
$ |
|
||||
Note 7 — Income Taxes
Provision for income taxes
An analysis of income from continuing operations before income taxes by taxing jurisdiction is shown below:
|
|
Years ended December 31, |
|
|||||||||
|
|
2023 |
|
|
2022 |
|
|
2021 |
|
|||
Ireland |
|
$ |
|
|
$ |
( |
) |
|
$ |
|
||
U.S. |
|
|
|
|
|
|
|
|
|
|||
U.K. |
|
|
( |
) |
|
|
|
|
|
|
||
Rest of World |
|
|
|
|
|
|
|
|
|
|||
Total |
|
$ |
|
|
$ |
|
|
$ |
|
|||
94
The components of the provision for income taxes from continuing operations include:
|
|
Years ended December 31, |
|
|||||||||
|
|
2023 |
|
|
2022 |
|
|
2021 |
|
|||
Current tax expense: |
|
|
|
|
|
|
|
|
|
|||
U.S. federal taxes |
|
$ |
( |
) |
|
$ |
( |
) |
|
$ |
( |
) |
U.S. state and local taxes |
|
|
( |
) |
|
|
( |
) |
|
|
( |
) |
U.K. corporation tax |
|
|
( |
) |
|
|
( |
) |
|
|
( |
) |
Other jurisdictions |
|
|
( |
) |
|
|
( |
) |
|
|
( |
) |
Total current tax expense |
|
|
( |
) |
|
|
( |
) |
|
|
( |
) |
Deferred tax benefit/(expense): |
|
|
|
|
|
|
|
|
|
|||
U.S. federal taxes |
|
|
|
|
|
|
|
|
( |
) |
||
U.S. state and local taxes |
|
|
|
|
|
( |
) |
|
|
|
||
U.K. corporation tax |
|
|
|
|
|
( |
) |
|
|
( |
) |
|
Other jurisdictions |
|
|
|
|
|
|
|
|
|
|||
Total deferred tax benefit/(expense) |
|
|
|
|
|
|
|
|
( |
) |
||
Total provision for income taxes |
|
$ |
( |
) |
|
$ |
( |
) |
|
$ |
( |
) |
Effective tax rate reconciliation
The reported provision for income taxes differs from the amounts that would have resulted had the reported income from continuing operations before income taxes been taxed at the U.S. federal statutory rate. The principal reasons for the differences between the amounts provided and those that would have resulted from the application of the U.S. federal statutory tax rate are as follows:
|
|
Years ended December 31, |
|
|||||||||
|
|
2023 |
|
|
2022 |
|
|
2021 |
|
|||
INCOME FROM CONTINUING OPERATIONS BEFORE |
|
$ |
|
|
$ |
|
|
$ |
|
|||
U.S. federal statutory income tax rate |
|
|
% |
|
|
% |
|
|
% |
|||
Income tax expense at U.S. federal tax rate |
|
|
( |
) |
|
|
( |
) |
|
|
( |
) |
Adjustments to derive effective tax rate: |
|
|
|
|
|
|
|
|
|
|||
Non-deductible expenses and dividends |
|
|
( |
) |
|
|
( |
) |
|
|
( |
) |
Net adjustments on acquisition costs |
|
|
( |
) |
|
|
( |
) |
|
|
|
|
Impact of change in rate on deferred tax balances |
|
|
|
|
|
( |
) |
|
|
( |
) |
|
Effect of foreign exchange and other differences |
|
|
|
|
|
|
|
|
|
|||
Changes in valuation allowances |
|
|
( |
) |
|
|
|
|
|
|
||
Net tax effect on intra-group items |
|
|
|
|
|
|
|
|
|
|||
Net tax effect on disposal of operations |
|
|
|
|
|
|
|
|
|
|||
Tax differentials of non-U.S. jurisdictions |
|
|
|
|
|
|
|
|
( |
) |
||
Impact of U.S. state and local taxes |
|
|
( |
) |
|
|
( |
) |
|
|
( |
) |
Global Intangible Low-Taxed Income (GILTI) |
|
|
( |
) |
|
|
( |
) |
|
|
( |
) |
Subpart F income |
|
|
( |
) |
|
|
( |
) |
|
|
( |
) |
Base Erosion Anti-Abuse Tax (BEAT) |
|
|
|
|
|
|
|
|
( |
) |
||
Tax on unremitted earnings |
|
|
( |
) |
|
|
( |
) |
|
|
|
|
Other items, net |
|
|
|
|
|
|
|
|
( |
) |
||
Provision for income taxes |
|
$ |
( |
) |
|
$ |
( |
) |
|
$ |
( |
) |
The current year effective tax rate includes a $
Willis Towers Watson plc is a non-trading holding company tax resident in Ireland where it is taxed at the statutory rate of
95
Deferred income taxes
Deferred income tax assets and liabilities reflect the effect of temporary differences between the assets and liabilities recognized for financial reporting purposes and the amounts recognized for income tax purposes. We recognize deferred tax assets if it is more likely than not that a benefit will be realized.
Deferred income tax assets and liabilities included in the consolidated balance sheets at December 31, 2023 and 2022 are comprised of the following:
|
|
December 31, |
|
|||||
|
|
2023 |
|
|
2022 |
|
||
Deferred tax assets: |
|
|
|
|
|
|
||
Accrued expenses not currently deductible |
|
$ |
|
|
$ |
|
||
Interest carryforwards |
|
|
|
|
|
|
||
Net operating losses |
|
|
|
|
|
|
||
Capital loss carryforwards |
|
|
|
|
|
|
||
Accrued retirement benefits |
|
|
|
|
|
|
||
Operating lease liabilities |
|
|
|
|
|
|
||
Deferred compensation |
|
|
|
|
|
|
||
Share-based compensation |
|
|
|
|
|
|
||
Financial derivative transactions |
|
|
|
|
|
|
||
Gross deferred tax assets |
|
|
|
|
|
|
||
Less: valuation allowance |
|
|
( |
) |
|
|
( |
) |
Net deferred tax assets |
|
$ |
|
|
$ |
|
||
Deferred tax liabilities: |
|
|
|
|
|
|
||
Cost of intangible assets, net of related amortization |
|
$ |
|
|
$ |
|
||
Operating lease right-of-use assets |
|
|
|
|
|
|
||
Cost of tangible assets, net of related depreciation |
|
|
|
|
|
|
||
Prepaid retirement benefits |
|
|
|
|
|
|
||
Accrued revenue not currently taxable |
|
|
|
|
|
|
||
Unremitted earnings |
|
|
|
|
|
|
||
Deferred tax liabilities |
|
$ |
|
|
$ |
|
||
Net deferred tax liabilities |
|
$ |
|
|
$ |
|
||
The net deferred income tax assets are included in Other non-current assets and the net deferred tax liabilities are included in Deferred tax liabilities in our consolidated balance sheets.
|
|
December 31, |
|
|||||
|
|
2023 |
|
|
2022 |
|
||
Balance sheet classifications: |
|
|
|
|
|
|
||
Other non-current assets |
|
$ |
|
|
$ |
|
||
Deferred tax liabilities |
|
|
|
|
|
|
||
Net deferred tax liability |
|
$ |
|
|
$ |
|
||
At December 31, 2023, we had U.S. federal and non-U.S. net operating loss carryforwards amounting to $
Management believes, based on the evaluation of positive and negative evidence, including the future reversal of existing taxable temporary differences, it is more likely than not that the Company will realize the benefits of net deferred tax assets of $
96
At December 31, 2023 and 2022, the Company had valuation allowances of $
An analysis of our valuation allowance is shown below.
|
|
Years ended December 31, |
|
|||||||||
|
|
2023 |
|
|
2022 |
|
|
2021 |
|
|||
Balance at beginning of year |
|
$ |
|
|
$ |
|
|
$ |
|
|||
Additions charged to costs and expenses |
|
|
|
|
|
|
|
|
|
|||
Deductions |
|
|
( |
) |
|
|
( |
) |
|
|
( |
) |
Balance at end of year |
|
$ |
|
|
$ |
|
|
$ |
|
|||
The movement in the 2023 valuation allowance differs from the 2023 rate reconciliation primarily due to the increase in state net operating losses and the related valuation allowance. The movement in the prior-year valuation allowance differs from the 2022 rate reconciliation primarily due to the write-down of state net operating losses and the related valuation allowance. In addition, 2022 and 2021 valuation allowances differ from the 2022 and 2021 rate reconciliations, respectively, as part of the tax benefits were allocated to discontinued operations.
The Company recognizes deferred tax balances related to the undistributed earnings of subsidiaries when it expects that it will recover those undistributed earnings in a taxable manner, such as through receipt of dividends or sale of the investments. At December 31, 2023 the Company has $
Uncertain tax positions
At December 31, 2023, the amount of unrecognized tax benefits associated with uncertain tax positions, determined in accordance with ASC Subtopic 740-10, excluding interest and penalties, was $
|
|
2023 |
|
|
2022 |
|
|
2021 |
|
|||
Balance at beginning of year |
|
$ |
|
|
$ |
|
|
$ |
|
|||
Increases related to tax positions in prior years |
|
|
|
|
|
|
|
|
|
|||
Decreases related to tax positions in prior years |
|
|
( |
) |
|
|
( |
) |
|
|
|
|
Increases related to tax positions in current year |
|
|
|
|
|
|
|
|
|
|||
Decreases related to settlements |
|
|
|
|
|
( |
) |
|
|
|
||
Decreases related to lapse in statute of limitations |
|
|
( |
) |
|
|
( |
) |
|
|
( |
) |
Cumulative translation adjustment and other adjustments |
|
|
|
|
|
( |
) |
|
|
( |
) |
|
Balance at end of year |
|
$ |
|
|
$ |
|
|
$ |
|
|||
The liability for unrecognized tax benefits for each of the years ended December 31, 2023, 2022 and 2021 can be reduced by $
Interest and penalties related to unrecognized tax benefits are included as a component of income tax expense. At December 31, 2023, and 2022, we had cumulative accrued interest of $
Tax expense allocated to continuing operations for both the years ended December 31, 2023 and 2022 includes $
The Company believes that the outcomes which are reasonably possible within the next 12 months may result in a reduction in the liability for unrecognized tax benefits in the range of $
The Company and its subsidiaries file income tax returns in various tax jurisdictions in which it operates.
97
We have ongoing state income tax examinations in certain states for tax years ranging from December 31, 2015 to December 31, 2021. The statute of limitations in certain states remains open back to the tax period ended December 31, 2015.
All U.K. tax returns have been filed timely and are in the normal process of being reviewed by His Majesty’s Revenue & Customs. The Company is not currently subject to any material examinations in other jurisdictions. A summary of the tax years that remain open to tax examination in our major tax jurisdictions are as follows:
|
Open Tax Years (fiscal year ending in) |
U.S. — federal |
|
U.S. — various states |
|
U.K. |
|
Ireland |
|
France |
|
Germany |
|
Canada - federal |
Note 8 — Fixed Assets
The following table reflects changes in the net carrying amount of the components of fixed assets for the years ended December 31, 2023 and 2022:
|
|
Furniture, |
|
|
Leasehold |
|
|
Land and |
|
|
Total |
|
||||
Cost: at January 1, 2022 |
|
$ |
|
|
$ |
|
|
$ |
|
|
$ |
|
||||
Additions |
|
|
|
|
|
|
|
|
|
|
|
|
||||
Acquisitions |
|
|
|
|
|
|
|
|
|
|
|
|
||||
Disposals (i) |
|
|
( |
) |
|
|
( |
) |
|
|
|
|
|
( |
) |
|
Foreign exchange |
|
|
( |
) |
|
|
( |
) |
|
|
( |
) |
|
|
( |
) |
Cost: at December 31, 2022 |
|
|
|
|
|
|
|
|
|
|
|
|
||||
Additions |
|
|
|
|
|
|
|
|
|
|
|
|
||||
Disposals (i) |
|
|
( |
) |
|
|
( |
) |
|
|
|
|
|
( |
) |
|
Foreign exchange |
|
|
|
|
|
|
|
|
|
|
|
|
||||
Cost: at December 31, 2023 |
|
$ |
|
|
$ |
|
|
$ |
|
|
$ |
|
||||
|
|
|
|
|
|
|
|
|
|
|
|
|
||||
Depreciation: at January 1, 2022 |
|
$ |
( |
) |
|
$ |
( |
) |
|
$ |
( |
) |
|
$ |
( |
) |
Depreciation expense |
|
|
( |
) |
|
|
( |
) |
|
|
( |
) |
|
|
( |
) |
Disposals |
|
|
|
|
|
|
|
|
|
|
|
|
||||
Foreign exchange |
|
|
|
|
|
|
|
|
|
|
|
|
||||
Depreciation: at December 31, 2022 |
|
|
( |
) |
|
|
( |
) |
|
|
( |
) |
|
|
( |
) |
Depreciation expense |
|
|
( |
) |
|
|
( |
) |
|
|
( |
) |
|
|
( |
) |
Disposals |
|
|
|
|
|
|
|
|
|
|
|
|
||||
Foreign exchange |
|
|
( |
) |
|
|
( |
) |
|
|
( |
) |
|
|
( |
) |
Depreciation: at December 31, 2023 |
|
$ |
( |
) |
|
$ |
( |
) |
|
$ |
( |
) |
|
$ |
( |
) |
|
|
|
|
|
|
|
|
|
|
|
|
|
||||
Net book value: |
|
|
|
|
|
|
|
|
|
|
|
|
||||
At December 31, 2022 |
|
$ |
|
|
$ |
|
|
$ |
|
|
$ |
|
||||
|
|
|
|
|
|
|
|
|
|
|
|
|
||||
At December 31, 2023 |
|
$ |
|
|
$ |
|
|
$ |
|
|
$ |
|
||||
98
Included within land and buildings are the following assets held under finance leases:
|
|
December 31, |
|
|||||
|
|
2023 |
|
|
2022 |
|
||
Finance leases |
|
$ |
|
|
$ |
|
||
Accumulated depreciation |
|
|
( |
) |
|
|
( |
) |
|
|
$ |
|
|
$ |
|
||
Note 9 — Goodwill and Other Intangible Assets
Goodwill
The components of goodwill are outlined below for the years ended December 31, 2023 and 2022.
|
|
HWC |
|
|
R&B |
|
|
Total |
|
|||
Balance at December 31, 2021 |
|
|
|
|
|
|
|
|
|
|||
Goodwill, gross |
|
$ |
|
|
$ |
|
|
$ |
|
|||
Accumulated impairment losses |
|
|
( |
) |
|
|
( |
) |
|
|
( |
) |
Goodwill, net - December 31, 2021 |
|
|
|
|
|
|
|
|
|
|||
Goodwill acquired |
|
|
|
|
|
|
|
|
|
|||
Goodwill disposals |
|
|
|
|
|
( |
) |
|
|
( |
) |
|
Foreign exchange |
|
|
( |
) |
|
|
( |
) |
|
|
( |
) |
Balance at December 31, 2022 |
|
|
|
|
|
|
|
|
|
|||
Goodwill, gross |
|
|
|
|
|
|
|
|
|
|||
Accumulated impairment losses |
|
|
( |
) |
|
|
( |
) |
|
|
( |
) |
Goodwill, net - December 31, 2022 |
|
|
|
|
|
|
|
|
|
|||
Goodwill disposals |
|
|
( |
) |
|
|
|
|
|
( |
) |
|
Foreign exchange |
|
|
|
|
|
|
|
|
|
|||
Balance at December 31, 2023 |
|
|
|
|
|
|
|
|
|
|||
Goodwill, gross |
|
|
|
|
|
|
|
|
|
|||
Accumulated impairment losses |
|
|
( |
) |
|
|
( |
) |
|
|
( |
) |
Goodwill, net - December 31, 2023 |
|
$ |
|
|
$ |
|
|
$ |
|
|||
99
Other Intangible Assets
The following table reflects changes in the net carrying amounts of the components of finite-lived intangible assets for the years ended December 31, 2023 and 2022:
|
Client relationships |
|
|
Software |
|
|
Trademark and trade name |
|
|
Other |
|
|
Total |
|
|||||
Balance at December 31, 2021: |
|
|
|
|
|
|
|
|
|
|
|
|
|
|
|||||
Intangible assets, gross |
$ |
|
|
$ |
|
|
$ |
|
|
$ |
|
|
$ |
|
|||||
Accumulated amortization |
|
( |
) |
|
|
( |
) |
|
|
( |
) |
|
|
( |
) |
|
|
( |
) |
Intangible assets, net - December 31, 2021 |
|
|
|
|
|
|
|
|
|
|
|
|
|
|
|||||
Intangible assets acquired |
|
|
|
|
|
|
|
|
|
|
|
|
|
|
|||||
Intangible asset disposals |
|
( |
) |
|
|
|
|
|
|
|
|
( |
) |
|
|
( |
) |
||
Amortization |
|
( |
) |
|
|
( |
) |
|
|
( |
) |
|
|
( |
) |
|
|
( |
) |
Foreign exchange |
|
( |
) |
|
|
( |
) |
|
|
( |
) |
|
|
|
|
|
( |
) |
|
Balance at December 31, 2022: |
|
|
|
|
|
|
|
|
|
|
|
|
|
|
|||||
Intangible assets, gross |
|
|
|
|
|
|
|
|
|
|
|
|
|
|
|||||
Accumulated amortization |
|
( |
) |
|
|
( |
) |
|
|
( |
) |
|
|
( |
) |
|
|
( |
) |
Intangible assets, net - December 31, 2022 |
|
|
|
|
|
|
|
|
|
|
|
|
|
|
|||||
Intangible assets acquired |
|
|
|
|
|
|
|
|
|
|
|
|
|
|
|||||
Intangible asset disposals |
|
|
|
|
|
|
|
|
|
|
( |
) |
|
|
( |
) |
|||
Amortization |
|
( |
) |
|
|
( |
) |
|
|
( |
) |
|
|
( |
) |
|
|
( |
) |
Foreign exchange |
|
|
|
|
|
|
|
|
|
|
|
|
|
|
|||||
Balance at December 31, 2023: |
|
|
|
|
|
|
|
|
|
|
|
|
|
|
|||||
Intangible assets, gross |
|
|
|
|
|
|
|
|
|
|
|
|
|
|
|||||
Accumulated amortization |
|
( |
) |
|
|
( |
) |
|
|
( |
) |
|
|
( |
) |
|
|
( |
) |
Intangible assets, net - December 31, 2023 |
$ |
|
|
$ |
|
|
$ |
|
|
$ |
|
|
$ |
|
|||||
The weighted-average remaining life of amortizable intangible assets and liabilities at December 31, 2023 was
The table below reflects the future estimated amortization expense for amortizable intangible assets for the next five years and thereafter:
Years ended December 31, |
|
|
Amortization |
|
|
2024 |
|
|
$ |
|
|
2025 |
|
|
|
|
|
2026 |
|
|
|
|
|
2027 |
|
|
|
|
|
2028 |
|
|
|
|
|
Thereafter |
|
|
|
|
|
Total |
|
|
$ |
|
|
Note 10 — Derivative Financial Instruments
We are exposed to certain foreign currency risks. Where possible, we identify exposures in our business that can be offset internally. Where no natural offset is identified, we may choose to enter into various derivative transactions. These instruments have the effect of reducing our exposure to unfavorable changes in foreign currency rates. The Company’s board of directors reviews and approves policies for managing this risk as summarized below. Additional information regarding our derivative financial instruments can be found in Note 2 — Basis of Presentation, Significant Accounting Policies and Recent Accounting Pronouncements, Note 12 — Fair Value Measurements and Note 18 — Accumulated Other Comprehensive Loss.
Foreign Currency Risk
Certain non-U.S. subsidiaries receive revenue and incur expenses in currencies other than their functional currency, and as a result, the foreign subsidiary’s functional currency revenue and/or expenses will fluctuate as the currency rates change. Additionally, the forecast Pounds sterling expenses of our London brokerage market operations may exceed their Pounds sterling revenue, and the entity with such operations may also hold significant foreign currency asset or liability positions in the consolidated balance sheets. To reduce such variability, we use foreign exchange contracts to hedge against this currency risk.
100
These derivatives were designated as hedging instruments and at December 31, 2023 and December 31, 2022 had total notional amounts of $
At December 31, 2023, the Company estimates, based on current exchange rates, there will be $
|
|
Gain/(loss) recognized in OCL (effective element) |
|
|||||||||
|
|
2023 |
|
|
2022 |
|
|
2021 |
|
|||
Foreign exchange contracts |
|
$ |
|
|
$ |
( |
) |
|
$ |
|
||
Location of gain/(loss) reclassified from Accumulated OCL into income |
|
Gain/(loss) reclassified from Accumulated OCL into income (effective element) |
|
|||||||||
|
|
2023 |
|
|
2022 |
|
|
2021 |
|
|||
|
$ |
|
|
$ |
|
|
$ |
( |
) |
|||
|
|
( |
) |
|
|
( |
) |
|
|
|
||
|
|
|
|
|
|
|
|
|
||||
|
|
$ |
( |
) |
|
$ |
( |
) |
|
$ |
|
|
The Company engages in intercompany borrowing and lending between subsidiaries, primarily through its in-house banking operations which give rise to foreign exchange exposures. The Company mitigates these risks through the use of short-term foreign currency forward and swap transactions that offset the underlying exposure created when the borrower and lender have different functional currencies. These derivatives are not generally designated as hedging instruments, and at December 31, 2023 and December 31, 2022, we had notional amounts of $
The effects of derivatives that have not been designated as hedging instruments on the consolidated statements of comprehensive income for the years ended December 31, 2023, 2022 and 2021 are as follows (see Note 17 — Other Income, Net for the net foreign currency impact on the Company’s consolidated statements of comprehensive income which includes the results of the offset of underlying exposures):
|
|
Location of gain/(loss) |
|
Gain/(loss) recognized in income |
|
|||||||||
Derivatives not designated as hedging instruments: |
|
recognized in income |
|
2023 |
|
|
2022 |
|
|
2021 |
|
|||
Foreign exchange contracts |
|
Other income, net |
|
$ |
|
|
$ |
( |
) |
|
$ |
|
||
101
Note 11 — Debt
Current debt consists of the following:
|
|
December 31, |
|
|||||
|
|
2023 |
|
|
2022 |
|
||
|
$ |
|
|
$ |
|
|||
|
|
|
|
|
|
|||
|
|
$ |
|
|
$ |
|
||
Long-term debt consists of the following:
|
|
December 31, |
|
|||||
|
|
2023 |
|
|
2022 |
|
||
Revolving $ |
|
$ |
— |
|
|
$ |
— |
|
|
|
|
|
|
|
|||
|
|
|
|
|
|
|||
|
|
|
|
|
|
|||
|
|
|
|
|
|
|||
|
|
|
|
|
|
|||
|
|
|
|
|
|
|||
|
|
|
|
|
|
|||
|
|
|
|
|
|
|||
|
|
|
|
|
|
|||
|
|
$ |
|
|
$ |
|
||
Guarantees
The following table presents a summary of the entities that issued each note or entered into the revolving credit facility and those wholly-owned and consolidated subsidiaries of the Company that guarantee each respective note and the revolving credit facility on a joint and several basis as of December 31, 2023.
Entity |
|
Revolving credit facility |
|
3.600% due 2024 |
Willis Towers Watson plc |
|
Guarantor |
|
Guarantor |
Trinity Acquisition plc |
|
Issuer |
|
Guarantor |
Willis North America Inc. |
|
Guarantor |
|
Issuer |
Willis Netherlands Holdings B.V. |
|
Guarantor |
|
Guarantor |
Willis Investment UK Holdings Limited |
|
Guarantor |
|
Guarantor |
TA I Limited |
|
Guarantor |
|
Guarantor |
Willis Group Limited |
|
Guarantor |
|
Guarantor |
Willis Towers Watson Sub Holdings Unlimited Company |
|
Guarantor |
|
Guarantor |
Willis Towers Watson UK Holdings Limited |
|
Guarantor |
|
Guarantor |
Revolving Credit Facility
$1.5 billion revolving credit facility
On October 6, 2021, Trinity Acquisition plc entered into a second amended and restated revolving credit facility (the ‘new RCF’) for $
On June 29, 2023, Trinity Acquisition plc amended its revolving credit facility to replace the use of London Interbank Offered Rate (‘LIBOR’) with the Secured Overnight Financing Rate (‘SOFR’) in connection with its base-rate borrowings. This amendment was done in connection with the cessation of LIBOR and all other terms remain the same. Borrowing costs under the $
102
differ if the borrowing is a ‘base rate’ borrowing or a ‘Eurocurrency’ borrowing, both as defined by the new RCF, and equal the sum of the relevant benchmark plus a margin based on the Company’s senior unsecured long-term debt rating:
The new RCF also carries a commitment fee, applicable to the unused portion, of
$1.25 billion revolving credit facility
Amounts outstanding under the previous $1.25 billion revolving credit facility bore interest at LIBOR plus a margin of
Senior Notes
5.350% senior notes due 2033
On May 17, 2023, the Company, together with its wholly-owned subsidiary, Willis North America Inc. as issuer, completed an offering of $
4.650% senior notes due 2027
On May 19, 2022, the Company, together with its wholly-owned subsidiary, Willis North America Inc. as issuer, completed an offering of $
2.950% senior notes due 2029 and 3.875% senior notes due 2049
On September 10, 2019, the Company, together with its wholly-owned subsidiary, Willis North America Inc., as issuer, completed an offering of $
103
2029 senior notes offering were used to repay $
4.500% senior notes due 2028 and 5.050% senior notes due 2048
On September 10, 2018, the Company, together with its wholly-owned subsidiary, Willis North America Inc. as issuer, completed an offering of $
3.600% senior notes due 2024
On May 16, 2017, Willis North America Inc. issued $
3.500% senior notes due 2021 (repaid in August 2021) and 4.400% senior notes due 2026
On March 22, 2016, Trinity Acquisition plc issued $
4.625% senior notes due 2023 (repaid in August 2023) and 6.125% senior notes due 2043
On August 15, 2013, Trinity Acquisition plc issued $
Additional Information Regarding Fully Repaid Senior Notes and Collateralized Facility
2.125% senior notes due 2022
On May 26, 2016, Trinity Acquisition plc issued €
104
5.750% senior notes due 2021
In March 2011, the Company issued $
Collateralized Facility
As part of the acquisition of TRANZACT, the Company assumed debt of $
Covenants
The terms of our current financings also include certain limitations. For example, the agreements relating to the debt arrangements and credit facilities generally contain numerous operating and financial covenants, including requirements to maintain minimum ratios of consolidated EBITDA to consolidated cash interest expense and maximum levels of consolidated funded indebtedness in relation to consolidated EBITDA, in each case subject to certain adjustments. The operating restrictions and financial covenants in our current credit facilities do, and any future financing agreements may, limit our ability to finance future operations or capital needs or to engage in other business activities. At December 31, 2023 and 2022, we were in compliance with all financial covenants.
Debt Maturity
The following table summarizes the maturity of our debt and interest on senior notes and excludes any reduction for debt issuance costs:
|
|
2024 |
|
|
2025 |
|
|
2026 |
|
|
2027 |
|
|
2028 |
|
|
Thereafter |
|
|
Total |
|
|||||||
Senior notes |
|
$ |
|
|
$ |
|
|
$ |
|
|
$ |
|
|
$ |
|
|
$ |
|
|
$ |
|
|||||||
Interest on senior notes |
|
|
|
|
|
|
|
|
|
|
|
|
|
|
|
|
|
|
|
|
|
|||||||
Revolving $ |
|
|
|
|
|
|
|
|
|
|
|
|
|
|
|
|
|
|
|
|
|
|||||||
Total |
|
$ |
|
|
$ |
|
|
$ |
|
|
$ |
|
|
$ |
|
|
$ |
|
|
$ |
|
|||||||
Interest Expense
The following table shows an analysis of the interest expense for the years ended December 31, 2023, 2022 and 2021:
|
|
Years ended December 31, |
|
|||||||||
|
|
2023 |
|
|
2022 |
|
|
2021 |
|
|||
Senior notes |
|
$ |
|
|
$ |
|
|
$ |
|
|||
Revolving credit facility |
|
|
|
|
|
|
|
|
|
|||
Collateralized facility |
|
|
|
|
|
|
|
|
|
|||
Other (i) |
|
|
|
|
|
|
|
|
|
|||
Total interest expense |
|
$ |
|
|
$ |
|
|
$ |
|
|||
105
Note 12 — Fair Value Measurements
The Company has categorized its assets and liabilities that are measured at fair value on a recurring and non-recurring basis into a three-level fair value hierarchy, based on the reliability of the inputs used to determine fair value as follows:
The following methods and assumptions were used by the Company in estimating its fair value disclosure for financial instruments:
The following tables present our assets and liabilities measured at fair value on a recurring basis at December 31, 2023 and December 31, 2022:
|
|
|
|
Fair Value Measurements on a Recurring Basis at |
|
|||||||||||||
|
|
Balance Sheet Location |
|
Level 1 |
|
|
Level 2 |
|
|
Level 3 |
|
|
Total |
|
||||
Assets: |
|
|
|
|
|
|
|
|
|
|
|
|
|
|
||||
Available-for-sale securities: |
|
|
|
|
|
|
|
|
|
|
|
|
|
|
||||
Mutual funds/exchange traded funds (i) |
|
Prepaid and other current assets and |
|
$ |
|
|
$ |
|
|
$ |
|
|
$ |
|
||||
|
|
Fiduciary assets |
|
|
|
|
|
|
|
|
|
|
|
|
||||
Commingled funds (i) (ii) |
|
Other non-current assets |
|
|
|
|
|
|
|
|
|
|
|
|
||||
Hedge funds (i) (iii) |
|
Other non-current assets |
|
|
|
|
|
|
|
|
|
|
|
|
||||
Derivatives: |
|
|
|
|
|
|
|
|
|
|
|
|
|
|
||||
Derivative financial instruments (iv) |
|
Prepaid and other current assets and |
|
$ |
|
|
$ |
|
|
$ |
|
|
$ |
|
||||
Liabilities: |
|
|
|
|
|
|
|
|
|
|
|
|
|
|
||||
Contingent consideration: |
|
|
|
|
|
|
|
|
|
|
|
|
|
|
||||
Contingent consideration (v) (vi) |
|
Other current liabilities and |
|
$ |
|
|
$ |
|
|
$ |
|
|
$ |
|
||||
Derivatives: |
|
|
|
|
|
|
|
|
|
|
|
|
|
|
||||
Derivative financial instruments (iv) |
|
Other current liabilities and |
|
$ |
|
|
$ |
|
|
$ |
|
|
$ |
|
||||
106
|
|
|
|
Fair Value Measurements on a Recurring Basis at |
|
|||||||||||||
|
|
Balance Sheet Location |
|
Level 1 |
|
|
Level 2 |
|
|
Level 3 |
|
|
Total |
|
||||
Assets: |
|
|
|
|
|
|
|
|
|
|
|
|
|
|
||||
Available-for-sale securities: |
|
|
|
|
|
|
|
|
|
|
|
|
|
|
||||
Mutual funds/exchange traded funds (i) |
|
Prepaid and other current assets and |
|
$ |
|
|
$ |
|
|
$ |
|
|
$ |
|
||||
|
|
Fiduciary assets |
|
|
|
|
|
|
|
|
|
|
|
|
||||
Derivatives: |
|
|
|
|
|
|
|
|
|
|
|
|
|
|
||||
Derivative financial instruments (iv) |
|
Prepaid and other current assets and |
|
$ |
|
|
$ |
|
|
$ |
|
|
$ |
|
||||
Liabilities: |
|
|
|
|
|
|
|
|
|
|
|
|
|
|
||||
Contingent consideration: |
|
|
|
|
|
|
|
|
|
|
|
|
|
|
||||
Contingent consideration (v) (vi) |
|
Other current liabilities and |
|
$ |
|
|
$ |
|
|
$ |
|
|
$ |
|
||||
Derivatives: |
|
|
|
|
|
|
|
|
|
|
|
|
|
|
||||
Derivative financial instruments (iv) |
|
Other current liabilities and |
|
$ |
|
|
$ |
|
|
$ |
|
|
$ |
|
||||
The following table summarizes the change in fair value of the Level 3 liabilities:
Fair Value Measurements Using Significant Unobservable Inputs (Level 3) |
|
December 31, 2023 |
|
|
Balance at December 31, 2022 |
|
$ |
|
|
Obligations assumed |
|
|
|
|
Payments |
|
|
( |
) |
(i) |
|
|
|
|
|
|
|
||
Balance at December 31, 2023 |
|
$ |
|
|
There were
Fair value information about financial instruments not measured at fair value
The following tables present our assets and liabilities not measured at fair value on a recurring basis at December 31, 2023 and 2022:
|
|
December 31, 2023 |
|
|
December 31, 2022 |
|
||||||||||
|
|
Carrying |
|
|
Fair |
|
|
Carrying |
|
|
Fair |
|
||||
Assets: |
|
|
|
|
|
|
|
|
|
|
|
|
||||
Long-term note receivable |
|
$ |
|
|
$ |
|
|
$ |
|
|
$ |
|
||||
Liabilities: |
|
|
|
|
|
|
|
|
|
|
|
|
||||
Current debt |
|
$ |
|
|
$ |
|
|
$ |
|
|
$ |
|
||||
Long-term debt |
|
$ |
|
|
$ |
|
|
$ |
|
|
$ |
|
||||
The carrying value of our revolving credit facility approximates its fair value. The fair values above, which exclude accrued interest, are not necessarily indicative of the amounts that the Company would realize upon disposition, nor do they indicate the Company’s intent or ability to dispose of the financial instruments. The fair values of our respective senior notes and long-term note receivable are considered Level 2 financial instruments as they are corroborated by observable market data.
107
Note 13 — Retirement Benefits
Defined Benefit Plans
WTW sponsors both qualified and non-qualified defined benefit pension plans throughout the world. The majority of our plan assets and obligations are in the U.S. and the U.K. We have also included disclosures related to defined benefit plans in certain other countries, including Canada, France, Germany, Switzerland and Ireland. Together, these disclosed funded and unfunded plans represent
As part of these obligations, in the U.S., the U.K. and Canada, we have non-qualified plans that provide for the additional pension benefits that would be covered under the qualified plan in the respective country were it not for statutory maximums. The non-qualified plans are unfunded.
The significant plans within each grouping are described below:
United States
Legacy Willis – This plan was frozen in 2009. Approximately 600 WTW employees in the United States have a frozen accrued benefit under this plan.
WTW Plan – Substantially all U.S. employees are eligible to participate in this plan. Benefits are provided under a stable value pension plan design. The original stable value design came into effect on January 1, 2012. Plan participants prior to July 1, 2017 earn benefits without having to make employee contributions, and all newly-eligible employees after that date were required to contribute
United Kingdom
Legacy Willis – This plan covers approximately 400 WTW employees in the U.K. The plan is now closed to new entrants. New employees in the U.K. are offered the opportunity to join a defined contribution plan.
Legacy Towers Watson – Benefit accruals earned under the Legacy Watson Wyatt defined benefit plan (predominantly pension benefits) ceased on February 28, 2015, although benefits earned prior to January 1, 2008 retain a link to salary until the employee leaves the Company. Benefit accruals earned under the legacy Towers Perrin defined benefit plan (predominantly lump sum benefits) were frozen on March 31, 2008. All participants now accrue defined contribution benefits.
Legacy Miller – This plan is no longer with WTW following the divestiture of its Miller business in March 2021 (see Note 3 — Acquisitions and Divestitures for further information). The plan provided retirement benefits based on members’ salaries at the point at which they ceased to accrue benefits under the scheme.
Other
Canada (WTW) – Participants accrue qualified and non-qualified benefits based on a career-average benefit formula. Additionally, participants can choose to make voluntary contributions to purchase enhancements to their pension.
France (legacy broking business) – The mandatory retirement indemnity plan is a termination benefit which provides lump sum benefits at retirement. There is no vesting before the retirement date, and the benefit formula is determined through the collective bargaining agreement and the labor code. All employees with permanent employment contracts are eligible.
Germany – The defined benefit plans are closed to new entrants and include certain legacy employee populations hired before 2011. These benefits are primarily account-based, with some long-service participants continuing to accrue benefits according to grandfathered final-average-pay formulas.
Ireland (Legacy Willis) – Benefit accruals ceased effective from December 31, 2019; however accrued benefits for active employees are indexed to salary increases (to a maximum annual salary of €
Ireland (Legacy Towers Watson) – Benefit accruals ceased effective from May 1, 2015; however accrued benefits for active employees are indexed to salary increases (to a maximum annual salary of €
108
Switzerland (WTW) – The defined benefit plans require all employees with local employment contracts to participate. The Company provides benefits in excess of the mandatory minimum required under Swiss occupational pension law. Participants continue to accrue benefits until retirement or upon leaving the Company.
Amounts Recognized in our Consolidated Financial Statements
The following schedules provide information concerning the defined benefit pension plans as of and for the years ended December 31, 2023 and 2022:
|
|
2023 |
2022 |
|
||||||||||||||||||||
|
|
U.S. |
|
|
U.K. |
|
|
Other |
|
|
U.S. |
|
|
U.K. |
|
|
Other |
|
||||||
Change in Benefit Obligation |
|
|
|
|
|
|
|
|
|
|
|
|
|
|
|
|
|
|
||||||
Benefit obligation, beginning of year |
|
$ |
|
|
$ |
|
|
$ |
|
|
$ |
|
|
$ |
|
|
$ |
|
||||||
Service cost |
|
|
|
|
|
|
|
|
|
|
|
|
|
|
|
|
|
|
||||||
Interest cost |
|
|
|
|
|
|
|
|
|
|
|
|
|
|
|
|
|
|
||||||
Employee contributions |
|
|
|
|
|
|
|
|
|
|
|
|
|
|
|
|
|
|
||||||
Actuarial losses/(gains) |
|
|
|
|
|
( |
) |
|
|
|
|
|
( |
) |
|
|
( |
) |
|
|
( |
) |
||
Settlements |
|
|
( |
) |
|
|
|
|
|
( |
) |
|
|
( |
) |
|
|
( |
) |
|
|
( |
) |
|
Benefits paid |
|
|
( |
) |
|
|
( |
) |
|
|
( |
) |
|
|
( |
) |
|
|
( |
) |
|
|
( |
) |
Other |
|
|
( |
) |
|
|
|
|
|
|
|
|
|
|
|
|
|
|
|
|||||
Foreign currency changes |
|
|
|
|
|
|
|
|
|
|
|
|
|
|
( |
) |
|
|
( |
) |
||||
Benefit obligation, end of year |
|
$ |
|
|
$ |
|
|
$ |
|
|
$ |
|
|
$ |
|
|
$ |
|
||||||
Change in Plan Assets |
|
|
|
|
|
|
|
|
|
|
|
|
|
|
|
|
|
|
||||||
Fair value of plan assets, beginning of |
|
$ |
|
|
$ |
|
|
$ |
|
|
$ |
|
|
$ |
|
|
$ |
|
||||||
Actual return on plan assets |
|
|
|
|
|
( |
) |
|
|
|
|
|
( |
) |
|
|
( |
) |
|
|
( |
) |
||
Employer contributions |
|
|
|
|
|
|
|
|
|
|
|
|
|
|
|
|
|
|
||||||
Employee contributions |
|
|
|
|
|
|
|
|
|
|
|
|
|
|
|
|
|
|
||||||
Settlements |
|
|
( |
) |
|
|
|
|
|
( |
) |
|
|
( |
) |
|
|
( |
) |
|
|
( |
) |
|
Benefits paid |
|
|
( |
) |
|
|
( |
) |
|
|
( |
) |
|
|
( |
) |
|
|
( |
) |
|
|
( |
) |
Other |
|
|
|
|
|
|
|
|
|
|
|
|
|
|
|
|
|
|
||||||
Foreign currency changes |
|
|
|
|
|
|
|
|
|
|
|
|
|
|
( |
) |
|
|
( |
) |
||||
Fair value of plan assets, end of year |
|
$ |
|
|
$ |
|
|
$ |
|
|
$ |
|
|
$ |
|
|
$ |
|
||||||
Funded status at end of year |
|
$ |
( |
) |
|
$ |
|
|
$ |
( |
) |
|
$ |
( |
) |
|
$ |
|
|
$ |
( |
) |
||
Accumulated Benefit Obligation |
|
$ |
|
|
$ |
|
|
$ |
|
|
$ |
|
|
$ |
|
|
$ |
|
||||||
Components on the Consolidated |
|
|
|
|
|
|
|
|
|
|
|
|
|
|
|
|
|
|
||||||
Pension benefits assets |
|
$ |
|
|
$ |
|
|
$ |
|
|
$ |
|
|
$ |
|
|
$ |
|
||||||
Current liability for pension benefits |
|
$ |
( |
) |
|
$ |
( |
) |
|
$ |
( |
) |
|
$ |
( |
) |
|
$ |
|
|
$ |
( |
) |
|
Non-current liability for pension |
|
$ |
( |
) |
|
$ |
( |
) |
|
$ |
( |
) |
|
$ |
( |
) |
|
$ |
( |
) |
|
$ |
( |
) |
|
|
$ |
( |
) |
|
$ |
|
|
$ |
( |
) |
|
$ |
( |
) |
|
$ |
|
|
$ |
( |
) |
||
For the year ended December 31, 2023, bond yields decreased, driving decreases in the discount rates and increasing the benefit obligation for all plans although certain U.K. plans benefited from favorable changes in demographic assumptions and plan experience. The U.K. and Other plans also had unfavorable effects from foreign exchange, and the U.S. plan had a change in mortality assumptions, all of which increased their respective benefit obligations.
For the year ended December 31, 2022, bond yields increased, driving an increase in the discount rates and actuarial gains for all plans. The U.K. and Other plans also had favorable effects from foreign exchange on their benefit obligations.
Amounts recognized in accumulated other comprehensive loss as of December 31, 2023 and 2022 consist of:
|
|
2023 |
2022 |
|
||||||||||||||||||||
|
|
U.S. |
|
|
U.K. |
|
|
Other |
|
|
U.S. |
|
|
U.K. |
|
|
Other |
|
||||||
Net actuarial loss |
|
$ |
|
|
$ |
|
|
$ |
|
|
$ |
|
|
$ |
|
|
$ |
|
||||||
Net prior service loss/(gain) |
|
|
|
|
|
|
|
|
|
|
|
|
|
|
|
|
|
|
||||||
Accumulated other comprehensive loss |
|
$ |
|
|
$ |
|
|
$ |
|
|
$ |
|
|
$ |
|
|
$ |
|
||||||
The following table presents the projected benefit obligation and fair value of plan assets for our plans that have a projected benefit obligation in excess of plan assets as of December 31, 2023 and 2022:
|
|
2023 |
|
|
2022 |
|
||||||||||||||||||
|
|
U.S. |
|
|
U.K. |
|
|
Other |
|
|
U.S. |
|
|
U.K. |
|
|
Other |
|
||||||
Projected benefit obligation at end of year |
|
$ |
|
|
$ |
|
|
$ |
|
|
$ |
|
|
$ |
|
|
$ |
|
||||||
Fair value of plan assets at end of year |
|
$ |
|
|
$ |
|
|
$ |
|
|
$ |
|
|
$ |
|
|
$ |
|
||||||
109
The following table presents the projected benefit obligation, accumulated benefit obligation and fair value of plan assets for our plans that have an accumulated benefit obligation in excess of plan assets as of December 31, 2023 and 2022.
|
|
2023 |
|
|
2022 |
|
||||||||||||||||||
|
|
U.S. |
|
|
U.K. |
|
|
Other |
|
|
U.S. |
|
|
U.K. |
|
|
Other |
|
||||||
Projected benefit obligation at end of year |
|
$ |
|
|
$ |
|
|
$ |
|
|
$ |
|
|
$ |
|
|
$ |
|
||||||
Accumulated benefit obligation at end of year |
|
$ |
|
|
$ |
|
|
$ |
|
|
$ |
|
|
$ |
|
|
$ |
|
||||||
Fair value of plan assets at end of year |
|
$ |
|
|
$ |
|
|
$ |
|
|
$ |
|
|
$ |
|
|
$ |
|
||||||
The components of the net periodic benefit income and other amounts recognized in other comprehensive (income)/loss for the years ended December 31, 2023, 2022 and 2021 for the defined benefit pension plans are as follows:
|
|
2023 |
2022 |
2021 |
|
|||||||||||||||||||||||||||||||
|
|
U.S. |
|
|
U.K. |
|
|
Other |
|
|
U.S. |
|
|
U.K. |
|
|
Other |
|
|
U.S. |
|
|
U.K. |
|
|
Other |
|
|||||||||
Components of net periodic |
|
|
|
|
|
|
|
|
|
|
|
|
|
|
|
|
|
|
|
|
|
|
|
|
|
|
|
|||||||||
Service cost |
|
$ |
|
|
$ |
|
|
$ |
|
|
$ |
|
|
$ |
|
|
$ |
|
|
$ |
|
|
$ |
|
|
$ |
|
|||||||||
|
|
|
|
|
|
|
|
|
|
|
|
|
|
|
|
|
|
|
|
|
|
|
|
|
|
|
||||||||||
Expected return on plan |
|
|
( |
) |
|
|
( |
) |
|
|
( |
) |
|
|
( |
) |
|
|
( |
) |
|
|
( |
) |
|
|
( |
) |
|
|
( |
) |
|
|
( |
) |
Amortization of unrecognized |
|
|
|
|
|
( |
) |
|
|
|
|
|
— |
|
|
|
( |
) |
|
|
|
|
|
— |
|
|
|
( |
) |
|
|
|
||||
Amortization of unrecognized |
|
|
|
|
|
|
|
|
|
|
|
|
|
|
|
|
|
|
|
|
|
|
|
|
|
|
|
|||||||||
Settlement |
|
|
|
|
|
|
|
|
( |
) |
|
|
|
|
|
|
|
|
( |
) |
|
|
|
|
|
|
|
|
|
|||||||
Curtailment gain |
|
|
|
|
|
|
|
|
|
|
|
— |
|
|
|
— |
|
|
|
— |
|
|
|
— |
|
|
|
( |
) |
|
|
— |
|
|||
Other |
|
|
— |
|
|
|
— |
|
|
|
— |
|
|
|
— |
|
|
|
— |
|
|
|
— |
|
|
|
|
|
|
— |
|
|
|
— |
|
|
Net periodic benefit (income)/cost |
|
$ |
( |
) |
|
$ |
|
|
$ |
|
|
$ |
( |
) |
|
$ |
( |
) |
|
$ |
|
|
$ |
( |
) |
|
$ |
( |
) |
|
$ |
|
||||
Other changes in plan assets |
|
|
|
|
|
|
|
|
|
|
|
|
|
|
|
|
|
|
|
|
|
|
|
|
|
|
|
|||||||||
Net actuarial (gain)/loss |
|
$ |
|
|
$ |
|
|
$ |
|
|
$ |
( |
) |
|
$ |
|
|
$ |
( |
) |
|
$ |
( |
) |
|
$ |
|
|
$ |
( |
) |
|||||
Amortization of unrecognized |
|
|
( |
) |
|
|
( |
) |
|
|
|
|
|
( |
) |
|
|
( |
) |
|
|
( |
) |
|
|
( |
) |
|
|
( |
) |
|
|
( |
) |
|
Prior service cost |
|
|
|
|
|
|
|
|
|
|
|
— |
|
|
|
— |
|
|
|
— |
|
|
|
— |
|
|
|
— |
|
|
|
|
||||
Amortization of unrecognized |
|
|
|
|
|
|
|
|
( |
) |
|
|
— |
|
|
|
|
|
|
( |
) |
|
|
— |
|
|
|
|
|
|
( |
) |
||||
Settlement |
|
|
( |
) |
|
|
|
|
|
|
|
|
( |
) |
|
|
( |
) |
|
|
|
|
|
( |
) |
|
|
( |
) |
|
|
( |
) |
|||
Curtailment gain |
|
|
|
|
|
|
|
|
|
|
|
— |
|
|
|
— |
|
|
|
— |
|
|
|
— |
|
|
|
|
|
|
— |
|
||||
Plan (disposal)/addition |
|
|
|
|
|
|
|
|
|
|
|
— |
|
|
|
— |
|
|
|
— |
|
|
|
— |
|
|
|
( |
) |
|
|
|
||||
Total recognized in other |
|
|
|
|
|
|
|
|
|
|
|
( |
) |
|
|
|
|
|
( |
) |
|
|
( |
) |
|
|
|
|
|
( |
) |
|||||
Total recognized in net periodic |
|
$ |
|
|
$ |
|
|
$ |
|
|
$ |
( |
) |
|
$ |
|
|
$ |
( |
) |
|
$ |
( |
) |
|
$ |
|
|
$ |
( |
) |
|||||
Assumptions Used in the Valuations of the Defined Benefit Pension Plans
The determination of the Company’s obligations and annual expense under the plans is based on a number of assumptions that, given the longevity of the plans, are long-term in focus. A change in one or a combination of these assumptions could have a material impact on our projected benefit obligation. However, certain of these changes, such as changes in the discount rate and actuarial assumptions, are not recognized immediately in net income, but are instead recorded in other comprehensive income. The accumulated gains and losses not yet recognized in net income are amortized into net income as a component of the net periodic benefit cost/(income) generally based on the average working life expectancy or remaining life expectancy, where appropriate, of each of the plan’s active participants to the extent that the net gains or losses as of the beginning of the year exceed 10% of the greater of the market-related value of plan assets or the projected benefit obligation.
The Company considers several factors prior to the start of each fiscal year when determining the appropriate annual assumptions, including economic forecasts, relevant benchmarks, historical trends, portfolio composition and peer company comparisons. These assumptions, used to determine our pension liabilities and pension expense, are reviewed annually by senior management and changed when appropriate. A discount rate will be changed annually if underlying rates have moved, whereas an expected long-term return on assets will be changed less frequently as longer-term trends in asset returns emerge or long-term target asset allocations are revised. To calculate the discount rate, we use the granular approach to determining service and interest costs. The expected rate of return assumptions for all plans are supported by an analysis of the weighted-average yield expected to be achieved based upon the anticipated makeup of the plans’ investments. Other material assumptions include rates of participant mortality, and the expected long-term rate of compensation and pension increases.
110
The following assumptions were used in the valuations of WTW’s defined benefit pension plans. The assumptions presented in each column represent the weighted-average of rates for all plans included in the U.S., U.K., and Other groups.
|
|
Years ended December 31, |
||||||||||||||||
|
|
2023 |
2022 |
2021 |
||||||||||||||
|
|
U.S. |
|
U.K. |
|
Other |
|
U.S. |
|
U.K. |
|
Other |
|
U.S. |
|
U.K. |
|
Other |
Discount rate - PBO |
|
|
|
|
|
|
|
|
|
|||||||||
Discount rate - service cost |
|
|
|
|
|
|
|
|
|
|||||||||
Discount rate - interest cost on |
|
|
|
|
|
|
|
|
|
|||||||||
Discount rate - interest cost on PBO |
|
|
|
|
|
|
|
|
|
|||||||||
Expected long-term rate of return |
|
|
|
|
|
|
|
|
|
|||||||||
Rate of increase in compensation |
|
|
|
|
|
|
|
|
|
|||||||||
|
|
December 31, 2023 |
December 31, 2022 |
|||||||||
|
|
U.S. |
|
U.K. |
|
Other |
|
U.S. |
|
U.K. |
|
Other |
Discount rate |
|
|
|
|
|
|
||||||
Rate of increase in compensation levels |
|
|
|
|
|
|
||||||
The expected return on plan assets was determined on the basis of the weighted-average of the expected future returns of the various asset classes, using the target allocations shown below.
|
|
U.S. |
|
U.K. |
|
Switzerland |
|
Canada |
|
Germany |
|
Ireland |
||||||
Asset Category |
|
WTW |
|
Willis |
|
Willis |
|
Towers |
|
WTW |
|
WTW |
|
WTW |
|
Willis |
|
Towers |
Equity securities |
|
|
|
|
|
|
|
|
|
|||||||||
Debt securities |
|
|
|
|
|
|
|
|
|
|||||||||
Real estate |
|
|
|
|
|
|
|
|
|
|||||||||
Other |
|
|
|
|
|
|
|
|
|
|||||||||
Total |
|
|
|
|
|
|
|
|
|
|||||||||
Our investment strategy is designed to generate returns that will reduce the interest rate risk inherent in each of the plan’s benefit obligations and enable the plans to meet their future obligations. The precise amount for which these obligations will be settled depends on future events, including the life expectancy of the plan participants and salary inflation. The obligations are estimated using actuarial assumptions based on the current economic environment.
Each pension plan seeks to achieve total returns sufficient to meet expected future obligations when considered in conjunction with expected future contributions and prudent levels of investment risk and diversification. Each plan’s targeted asset allocation is generally determined through a plan-specific asset-liability modeling study. These comprehensive studies provide an evaluation of the projected status of asset and benefit obligation measures for each plan under a range of both positive and negative factors. The studies include a number of different asset mixes, spanning a range of diversification and potential equity exposures.
In evaluating the strategic asset allocation choices, an emphasis is placed on the long-term characteristics of each individual asset class, such as expected return, volatility of returns and correlations with other asset classes within the portfolios. Consideration is also given to the proper long-term level of risk for each plan, the impact of the volatility and magnitude of plan contributions and costs, and the impact that certain actuarial techniques may have on the plan’s recognition of investment experience.
We monitor investment performance and portfolio characteristics on a quarterly basis to ensure that managers are meeting expectations with respect to their investment approach. There are also various restrictions and controls placed on managers, including prohibition from investing in our stock.
111
Fair Value of Plan Assets
The fair value hierarchy has three levels based on the reliability of the inputs used to determine fair value:
The fair values of our U.S. plan assets by asset category at December 31, 2023 and 2022 are as follows:
|
|
December 31, 2023 |
|
|
December 31, 2022 |
|
||||||||||||||||||||||||||
|
|
Level 1 |
|
|
Level 2 |
|
|
Level 3 |
|
|
Total |
|
|
Level 1 |
|
|
Level 2 |
|
|
Level 3 |
|
|
Total |
|
||||||||
Asset category: |
|
|
|
|
|
|
|
|
|
|
|
|
|
|
|
|
|
|
|
|
|
|
|
|
||||||||
Cash |
|
$ |
|
|
$ |
— |
|
|
$ |
— |
|
|
$ |
|
|
$ |
|
|
$ |
— |
|
|
$ |
— |
|
|
$ |
|
||||
Short-term securities |
|
|
— |
|
|
|
|
|
|
— |
|
|
|
|
|
|
— |
|
|
|
|
|
|
— |
|
|
|
|
||||
Pooled/commingled funds |
|
|
— |
|
|
|
— |
|
|
|
— |
|
|
|
|
|
|
— |
|
|
|
— |
|
|
|
— |
|
|
|
|
||
Private equity |
|
|
— |
|
|
|
— |
|
|
|
— |
|
|
|
|
|
|
— |
|
|
|
— |
|
|
|
— |
|
|
|
|
||
Hedge funds |
|
|
— |
|
|
|
— |
|
|
|
— |
|
|
|
|
|
|
— |
|
|
|
— |
|
|
|
— |
|
|
|
|
||
Total assets |
|
$ |
|
|
$ |
|
|
$ |
— |
|
|
$ |
|
|
$ |
|
|
$ |
|
|
$ |
— |
|
|
$ |
|
||||||
The fair values of our U.K. plan assets by asset category at December 31, 2023 and 2022 are as follows:
|
|
December 31, 2023 |
|
|
December 31, 2022 |
|
||||||||||||||||||||||||||
|
|
Level 1 |
|
|
Level 2 |
|
|
Level 3 |
|
|
Total |
|
|
Level 1 |
|
|
Level 2 |
|
|
Level 3 |
|
|
Total |
|
||||||||
Asset category: |
|
|
|
|
|
|
|
|
|
|
|
|
|
|
|
|
|
|
|
|
|
|
|
|
||||||||
Cash |
|
$ |
|
|
$ |
— |
|
|
$ |
— |
|
|
$ |
|
|
$ |
|
|
$ |
— |
|
|
$ |
— |
|
|
$ |
|
||||
Government bonds |
|
|
|
|
|
— |
|
|
|
— |
|
|
|
|
|
|
|
|
|
— |
|
|
|
— |
|
|
|
|
||||
Corporate bonds |
|
|
— |
|
|
|
|
|
|
— |
|
|
|
|
|
|
— |
|
|
|
|
|
|
— |
|
|
|
|
||||
Other fixed income |
|
|
— |
|
|
|
|
|
|
— |
|
|
|
|
|
|
— |
|
|
|
|
|
|
— |
|
|
|
|
||||
Pooled/commingled funds |
|
|
— |
|
|
|
— |
|
|
|
— |
|
|
|
|
|
|
— |
|
|
|
— |
|
|
|
— |
|
|
|
|
||
Private equity |
|
|
— |
|
|
|
— |
|
|
|
— |
|
|
|
|
|
|
— |
|
|
|
— |
|
|
|
— |
|
|
|
|
||
Derivatives |
|
|
— |
|
|
|
|
|
|
— |
|
|
|
|
|
|
— |
|
|
|
|
|
|
— |
|
|
|
|
||||
Real estate |
|
|
— |
|
|
|
— |
|
|
|
— |
|
|
|
|
|
|
— |
|
|
|
— |
|
|
|
— |
|
|
|
|
||
Insurance contracts |
|
|
— |
|
|
|
— |
|
|
|
|
|
|
|
|
|
— |
|
|
|
— |
|
|
|
|
|
|
|
||||
Total assets |
|
$ |
|
|
$ |
|
|
$ |
|
|
$ |
|
|
$ |
|
|
$ |
|
|
$ |
|
|
$ |
|
||||||||
|
|
|
|
|
|
|
|
|
|
|
|
|
|
|
|
|
|
|
|
|
|
|
|
|
||||||||
Liability category: |
|
|
|
|
|
|
|
|
|
|
|
|
|
|
|
|
|
|
|
|
|
|
|
|
||||||||
Repurchase agreements |
|
|
— |
|
|
|
|
|
|
— |
|
|
|
|
|
|
— |
|
|
|
|
|
|
— |
|
|
|
|
||||
Derivatives |
|
|
— |
|
|
|
|
|
|
— |
|
|
|
|
|
|
— |
|
|
|
|
|
|
— |
|
|
|
|
||||
Net assets |
|
$ |
|
|
$ |
|
|
$ |
|
|
$ |
|
|
$ |
|
|
$ |
|
|
$ |
|
|
$ |
|
||||||||
The fair values of our Other plan assets by asset category at December 31, 2023 and 2022 are as follows:
|
|
December 31, 2023 |
|
|
December 31, 2022 |
|
||||||||||||||||||||||||||
|
|
Level 1 |
|
|
Level 2 |
|
|
Level 3 |
|
|
Total |
|
|
Level 1 |
|
|
Level 2 |
|
|
Level 3 |
|
|
Total |
|
||||||||
Asset category: |
|
|
|
|
|
|
|
|
|
|
|
|
|
|
|
|
|
|
|
|
|
|
|
|
||||||||
Cash |
|
$ |
|
|
$ |
— |
|
|
$ |
— |
|
|
$ |
|
|
$ |
|
|
$ |
— |
|
|
$ |
— |
|
|
$ |
|
||||
Pooled/commingled funds |
|
|
— |
|
|
|
— |
|
|
|
— |
|
|
|
|
|
|
— |
|
|
|
— |
|
|
|
— |
|
|
|
|
||
Hedge funds |
|
|
— |
|
|
|
— |
|
|
|
— |
|
|
|
|
|
|
— |
|
|
|
— |
|
|
|
— |
|
|
|
|
||
Insurance contracts |
|
|
— |
|
|
|
— |
|
|
|
|
|
|
|
|
|
— |
|
|
|
— |
|
|
|
|
|
|
|
||||
Investment in multiple- |
|
|
— |
|
|
|
— |
|
|
|
|
|
|
|
|
|
— |
|
|
|
— |
|
|
|
|
|
|
|
||||
Total assets |
|
$ |
|
|
$ |
— |
|
|
$ |
|
|
$ |
|
|
$ |
|
|
$ |
— |
|
|
$ |
|
|
$ |
|
||||||
We evaluate the need to transfer between levels based upon the nature of the financial instrument and size of the transfer relative to the total net assets of the plans. There were no significant transfers between Levels 1, 2 or 3 in the fiscal years ended December 31, 2023 and 2022.
112
In accordance with ASC Subtopic 820-10, Fair Value Measurement and Disclosures, certain investments that are measured at fair value using the net asset value per share practical expedient have not been classified in the fair value hierarchy. The fair value amounts presented in these tables are intended to permit reconciliation of the fair value hierarchy to the total fair value of plan assets.
Following is a description of the valuation methodologies used for investments at fair value:
Short-term securities: Valued at the net value of shares held by the Company at year end as reported by the sponsor of the funds.
Government bonds: Valued at the closing price reported in the active market in which the bond is traded.
Corporate bonds: Valued using pricing models maximizing the use of observable inputs for similar securities. This includes basing values on yields currently available on comparable securities of issuers with similar credit ratings.
Other fixed income: Foreign and municipal bonds are valued using pricing models maximizing the use of observable inputs for similar securities.
Pooled / commingled funds: Valued at the net value of shares held by the Company at year end as reported by the manager of the funds. These funds are not exchange-traded and are not reported by level in the tables above.
Derivative investments: Valued at the closing level of the relevant index or security and interest accrual through the valuation date.
Private equity funds, real estate funds, hedge funds: The fair values for these investments are estimated based on the net asset values derived from the latest audited financial statements or most recent capital account statements provided by the private equity fund’s investment manager or third-party administrator.
Insurance contracts: The fair values are determined using model-based techniques that include option-pricing models, discounted cash flow models and similar techniques.
Investment in multiple-employer pension plan: The Company sponsors a pension plan for its Swiss employees in which assets of the plan are invested in a collective fund with multiple employers through a Swiss insurance company. WTW does not have rights to, nor does it have investment authority over, the individual assets of the plan. The fair value of the plan assets is estimated based on information provided by the collective fund.
Repurchase agreements: Valued at the repurchase obligation which includes an interest rate linked to the underlying fixed interest government bond portfolio. These agreements are short-term in nature (less than one year) and were entered into for the purpose of purchasing additional government bonds.
The following table reconciles the net plan investments to the total fair value of the plan assets:
|
|
December 31, |
|
|||||
|
|
2023 |
|
|
2022 |
|
||
Net assets held in investments |
|
$ |
|
|
$ |
|
||
Net receivable for investments purchased |
|
|
|
|
|
|
||
Fair value of plan assets |
|
$ |
|
|
$ |
|
||
Level 3 investments
As a result of the inherent limitations related to the valuations of the Level 3 investments, due to the unobservable inputs of the underlying funds, the estimated fair values may differ significantly from the values that would have been used had a market for those investments existed.
The following table sets forth a summary of changes in the fair value of the plans’ Level 3 assets for the fiscal year ended December 31, 2023:
|
|
Level 3 |
|
|
Beginning balance at December 31, 2022 |
|
$ |
|
|
Purchases |
|
|
|
|
Unrealized gain |
|
|
|
|
Foreign exchange |
|
|
|
|
Ending balance at December 31, 2023 |
|
$ |
|
|
113
Contributions and Benefit Payments
Funding is based on actuarially-determined contributions and is limited to amounts that are currently deductible for tax purposes. Since funding calculations are based on different measurements than those used for accounting purposes, pension contributions are not equal to net periodic pension costs.
The following table sets forth our projected pension contributions to our qualified plans for fiscal year 2023, as well as the pension contributions to our qualified plans in fiscal years 2023 and 2022:
|
|
2024 |
|
|
2023 |
|
|
2022 |
|
|||
U.S. |
|
$ |
|
|
$ |
|
|
$ |
|
|||
U.K. |
|
$ |
|
|
$ |
|
|
$ |
|
|||
Other |
|
$ |
|
|
$ |
|
|
$ |
|
|||
Expected benefit payments from our defined benefit pension plans to current plan participants, including the effects of their expected future service, as appropriate, are as follows:
|
|
Benefit Payments |
|
|||||||||||||
Fiscal Year |
|
U.S. |
|
|
U.K. |
|
|
Other |
|
|
Total |
|
||||
2024 |
|
$ |
|
|
$ |
|
|
$ |
|
|
$ |
|
||||
2025 |
|
|
|
|
|
|
|
|
|
|
|
|
||||
2026 |
|
|
|
|
|
|
|
|
|
|
|
|
||||
2027 |
|
|
|
|
|
|
|
|
|
|
|
|
||||
2028 |
|
|
|
|
|
|
|
|
|
|
|
|
||||
Years 2029 – 2033 |
|
|
|
|
|
|
|
|
|
|
|
|
||||
|
|
$ |
|
|
$ |
|
|
$ |
|
|
$ |
|
||||
Defined Contribution Plans
We have defined contribution plans covering eligible employees in many countries. The most significant plans are in the U.S. and U.K. and are described here.
We have a U.S. defined contribution plan covering all eligible employees of WTW. The plan allowed participants to make pre-tax and Roth after-tax contributions, and the Company provided a
Our U.K. pension plans provide for a defined contribution component as part of a master trust. We make contributions to the plan, a portion of which represents matching contributions made by the participants up to a maximum rate.
We had defined contribution plan expense for the years ended December 31, 2023, 2022 and 2021 amounting to $
Note 14 — Leases
The following tables present amounts recorded on our consolidated balance sheets at December 31, 2023 and 2022, classified as either operating or finance leases. Operating leases are presented separately on our consolidated balance sheets. For the finance leases, the ROU assets are included in fixed assets, net, and the liabilities are classified within Other current liabilities and Other non-current liabilities.
|
|
December 31, 2023 |
|
|
December 31, 2022 |
|
||||||||||||||||||
|
|
Operating Leases |
|
|
Finance Leases |
|
|
Total |
|
|
Operating Leases |
|
|
Finance Leases |
|
|
Total |
|
||||||
|
$ |
|
|
$ |
|
|
$ |
|
|
$ |
|
|
$ |
|
|
$ |
|
|||||||
|
|
|
|
|
|
|
|
|
|
|
|
|
|
|
|
|
|
|||||||
|
|
|
|
|
|
|
|
|
|
|
|
|
|
|
|
|
|
|||||||
114
The following tables present amounts recorded on our consolidated statements of comprehensive income for the years ended December 31, 2023, 2022 and 2021:
|
|
Years ended December 31, |
|
|||||||||
|
|
2023 |
|
|
2022 |
|
|
2021 |
|
|||
Finance lease cost: |
|
|
|
|
|
|
|
|
|
|||
Amortization of right-of-use assets |
|
$ |
|
|
$ |
|
|
$ |
|
|||
Interest on lease liabilities |
|
|
|
|
|
|
|
|
|
|||
Operating lease cost |
|
|
|
|
|
|
|
|
|
|||
Short-term lease cost |
|
|
|
|
|
|
|
|
|
|||
Variable lease cost |
|
|
|
|
|
|
|
|
|
|||
Sublease income |
|
|
( |
) |
|
|
( |
) |
|
|
( |
) |
Total lease cost, net |
|
$ |
|
|
$ |
|
|
$ |
|
|||
The total lease cost is recognized in different locations in our consolidated statements of comprehensive income. Amortization of the finance lease ROU assets is included in depreciation, while the interest cost component of these finance leases is included in interest expense. All other costs are included in other operating expenses, with the exception of $
Cash paid for amounts included in the measurement of lease liabilities for the years ended December 31, 2023, 2022 and 2021, as well as its location in the consolidated statements of cash flows, is as follows:
|
|
Years ended December 31, |
|
|||||||||
|
|
2023 |
|
|
2022 |
|
|
2021 |
|
|||
Cash flows from operating activities: |
|
|
|
|
|
|
|
|
|
|||
Operating leases |
|
$ |
|
|
$ |
|
|
$ |
|
|||
Finance leases |
|
|
|
|
|
|
|
|
|
|||
Cash flows used in financing activities: |
|
|
|
|
|
|
|
|
|
|||
Finance leases |
|
|
|
|
|
|
|
|
|
|||
Total lease payments |
|
$ |
|
|
$ |
|
|
$ |
|
|||
Non-cash additions to our operating lease ROU assets, net of modifications, were $
Our operating and finance leases have the following weighted-average terms and discount rates as of December 31, 2023 and 2022:
|
|
December 31, 2023 |
|
|
December 31, 2022 |
|
||||||||||
|
|
Operating |
|
|
Finance |
|
|
Operating |
|
|
Finance |
|
||||
Weighted-average term (in years) |
|
|
|
|
|
|
|
|
|
|
|
|
||||
Weighted-average discount rate |
|
|
% |
|
|
% |
|
|
% |
|
|
% |
||||
The maturity of our lease liabilities on an undiscounted basis, including a reconciliation to the total lease liabilities reported on the consolidated balance sheet as of December 31, 2023, is as follows:
|
|
Operating Leases |
|
|
Finance Leases |
|
|
Total Leases |
|
|||
2024 |
|
$ |
|
|
$ |
|
|
$ |
|
|||
2025 |
|
|
|
|
|
|
|
|
|
|||
2026 |
|
|
|
|
|
|
|
|
|
|||
2027 |
|
|
|
|
|
|
|
|
|
|||
2028 |
|
|
|
|
|
|
|
|
|
|||
Thereafter |
|
|
|
|
|
|
|
|
|
|||
Total future lease payments |
|
|
|
|
|
|
|
|
|
|||
Interest |
|
|
( |
) |
|
|
( |
) |
|
|
( |
) |
Total lease liabilities |
|
$ |
|
|
$ |
|
|
$ |
|
|||
115
Note 15 — Commitments and Contingencies
Guarantees
Guarantees issued by certain of WTW’s subsidiaries with respect to the senior notes and credit facilities are discussed in Note 11 — Debt.
Certain of WTW’s subsidiaries in the U.S. and the U.K. have given the landlords of some leased properties occupied by the Company guarantees with respect to the repayment of the lease obligations. The operating lease obligations subject to such guarantees amounted to $
Acquisition liabilities
In addition to the contingent consideration that may be payable related to our acquisitions (see Note 12 — Fair Value Measurements), we have deferred consideration of $
Other contractual obligations
For certain subsidiaries and associates, the Company has the right to purchase shares (a call option) from co-shareholders at various dates in the future. In addition, the co-shareholders of certain subsidiaries and associates have the right to sell their shares (a put option) to the Company at various dates in the future. Generally, the exercise prices of such put options and call options are formula-based (using revenue and earnings) and are designed to reflect fair value. Based on current projections of profitability and exchange rates, and assuming the put options are exercised, the potential amount payable from these put options is not expected to exceed $
Additionally, the Company has capital commitments with Trident V Parallel Fund, LP, an investment fund managed by Stone Point Capital, Dowling Capital Partners I, LP., and PruVen Capital Partners Fund II, LP. At December 31, 2023, the Company is obligated to make capital contributions of approximately $
Indemnification Agreements
WTW has various agreements which provide that it may be obligated to indemnify the other party to the agreement with respect to certain matters. Generally, these indemnification provisions are included in contracts arising in the normal course of business and in connection with the purchase and sale of certain businesses, including the disposal of Willis Re. It is not possible to predict the maximum potential amount of future payments that may become due under these indemnification agreements because of the conditional nature of the Company’s obligations and the unique facts of each particular agreement. However, we do not believe that any potential liability that may arise from such indemnity provisions is probable or material.
Legal Proceedings
In the ordinary course of business, the Company is subject to various actual and potential claims, lawsuits and other proceedings. Some of the claims, lawsuits and other proceedings seek damages in amounts which could, if assessed, be significant. The Company also receives subpoenas in the ordinary course of business and, from time to time, receives requests for information in connection with governmental investigations.
Errors and omissions claims, lawsuits, and other proceedings arising in the ordinary course of business are covered in part by professional indemnity or other appropriate insurance. The terms of this insurance vary by policy year. Regarding self-insured risks, the Company has established provisions which are believed to be adequate in light of current information and legal advice, or, in certain cases, where a range of loss exists, the Company accrues the minimum amount in the range if no amount within the range is a better estimate than any other amount. The Company adjusts such provisions from time to time according to developments. See Note 16 — Supplementary Information for Certain Balance Sheet Accounts for the amounts accrued at December 31, 2023 and 2022 in the consolidated balance sheets.
On the basis of current information, the Company does not expect that the actual claims, lawsuits and other proceedings to which it is subject, or potential claims, lawsuits, and other proceedings relating to matters of which it is aware, will ultimately have a material adverse effect on its financial condition, results of operations or liquidity. Nonetheless, given the large or indeterminate amounts sought in certain of these actions, and the inherent unpredictability of litigation and disputes with insurance companies, it is possible that an adverse outcome or settlement in certain matters could, from time to time, have a material adverse effect on the Company’s results of operations or cash flows in a particular quarterly or annual period.
116
The Company provides for contingent liabilities based on ASC 450, Contingencies, when it is determined that a liability, inclusive of defense costs, is probable and reasonably estimable. The contingent liabilities recorded are primarily developed actuarially. Litigation is subject to many factors which are difficult to predict so there can be no assurance that in the event of a material unfavorable result in one or more claims, we will not incur material costs.
Note 16 — Supplementary Information for Certain Balance Sheet Accounts
Additional details of specific balance sheet accounts are detailed below.
Prepaid and other current assets consist of the following:
|
|
December 31, |
|
|
December 31, |
|
||
Prepayments and accrued income |
|
$ |
|
|
$ |
|
||
Deferred contract costs |
|
|
|
|
|
|
||
Derivatives and investments |
|
|
|
|
|
|
||
Deferred compensation plan assets |
|
|
|
|
|
|
||
Corporate income and other taxes |
|
|
|
|
|
|
||
Acquired renewal commissions receivable |
|
|
|
|
|
|
||
Other current assets |
|
|
|
|
|
|
||
Total prepaid and other current assets |
|
$ |
|
|
$ |
|
||
Other non-current assets consist of the following:
|
|
December 31, |
|
|
December 31, |
|
||
Prepayments and accrued income |
|
$ |
|
|
$ |
|
||
Deferred contract costs |
|
|
|
|
|
|
||
Deferred compensation plan assets |
|
|
|
|
|
|
||
Deferred tax assets |
|
|
|
|
|
|
||
Accounts receivable, net |
|
|
|
|
|
|
||
Acquired renewal commissions receivable |
|
|
|
|
|
|
||
Long-term note receivable |
|
|
|
|
|
|
||
Other investments |
|
|
|
|
|
|
||
Insurance recovery receivables |
|
|
|
|
|
|
||
Non-current contract assets |
|
|
|
|
|
|
||
Other non-current assets |
|
|
|
|
|
|
||
Total other non-current assets |
|
$ |
|
|
$ |
|
||
Deferred revenue and accrued expenses consist of the following:
|
|
December 31, |
|
|
December 31, |
|
||
Accounts payable, accrued liabilities and deferred income |
|
$ |
|
|
$ |
|
||
Accrued discretionary and incentive compensation |
|
|
|
|
|
|
||
Accrued vacation |
|
|
|
|
|
|
||
Other employee-related liabilities |
|
|
|
|
|
|
||
Total deferred revenue and accrued expenses |
|
$ |
|
|
$ |
|
||
117
Other current liabilities consist of the following:
|
|
December 31, |
|
|
December 31, |
|
||
Dividends payable |
|
$ |
|
|
$ |
|
||
Income taxes payable |
|
|
|
|
|
|
||
Interest payable |
|
|
|
|
|
|
||
Deferred compensation plan liabilities |
|
|
|
|
|
|
||
Contingent and deferred consideration on acquisitions |
|
|
|
|
|
|
||
Accrued retirement benefits |
|
|
|
|
|
|
||
Payroll and other benefits-related liabilities (i) |
|
|
|
|
|
|
||
Other taxes payable (i) |
|
|
|
|
|
|
||
Derivatives |
|
|
|
|
|
|
||
Third-party commissions |
|
|
|
|
|
|
||
Other current liabilities (i) |
|
|
|
|
|
|
||
Total other current liabilities |
|
$ |
|
|
$ |
|
||
Provision for liabilities consists of the following:
|
|
December 31, |
|
|
December 31, |
|
||
Claims, lawsuits and other proceedings |
|
$ |
|
|
$ |
|
||
Other provisions |
|
|
|
|
|
|
||
Total provision for liabilities |
|
$ |
|
|
$ |
|
||
Other non-current liabilities consist of the following:
|
|
December 31, |
|
|
December 31, |
|
||
Deferred and long-term compensation plan liabilities (i) |
|
$ |
|
|
$ |
|
||
Contingent and deferred consideration on acquisitions |
|
|
|
|
|
|
||
Liabilities for uncertain tax positions |
|
|
|
|
|
|
||
Finance leases |
|
|
|
|
|
|
||
Other non-current liabilities (i) |
|
|
|
|
|
|
||
Total other non-current liabilities |
|
$ |
|
|
$ |
|
||
Note 17 — Other Income, Net
Other income, net consists of the following:
|
|
Years ended December 31, |
|
|||||||||
|
|
2023 |
|
|
2022 |
|
|
2021 |
|
|||
Gain on disposal of operations (i) |
|
$ |
|
|
$ |
|
|
$ |
|
|||
Net periodic pension and postretirement benefit credits |
|
|
|
|
|
|
|
|
|
|||
Interest in earnings of associates and other investments |
|
|
|
|
|
|
|
|
|
|||
Foreign exchange (loss)/gain (ii) |
|
|
( |
) |
|
|
|
|
|
|
||
Other |
|
|
|
|
|
|
|
|
|
|||
Other income, net |
|
$ |
|
|
$ |
|
|
$ |
|
|||
118
Note 18 — Accumulated Other Comprehensive Loss
The components of other comprehensive (loss)/income are as follows:
|
|
December 31, 2023 |
|
|
December 31, 2022 |
|
|
December 31, 2021 |
|
|||||||||||||||||||||||||||
|
|
Before |
|
|
Tax |
|
|
Net of |
|
|
Before |
|
|
Tax |
|
|
Net of |
|
|
Before |
|
|
Tax |
|
|
Net of |
|
|||||||||
Other comprehensive (loss)/income: |
|
|
|
|
|
|
|
|
|
|
|
|
|
|
|
|
|
|
|
|
|
|
|
|
|
|
|
|||||||||
Foreign currency translation |
|
$ |
|
|
$ |
|
|
$ |
|
|
$ |
( |
) |
|
$ |
|
|
$ |
( |
) |
|
$ |
( |
) |
|
$ |
|
|
$ |
( |
) |
|||||
Defined pension and post-retirement benefits |
|
|
( |
) |
|
|
|
|
|
( |
) |
|
|
|
|
|
( |
) |
|
|
|
|
|
|
|
|
( |
) |
|
|
|
|||||
Derivative instruments |
|
|
|
|
|
( |
) |
|
|
|
|
|
( |
) |
|
|
|
|
|
( |
) |
|
|
( |
) |
|
|
|
|
|
|
|||||
Other comprehensive (loss)/income |
|
|
( |
) |
|
|
|
|
|
( |
) |
|
|
( |
) |
|
|
( |
) |
|
|
( |
) |
|
|
|
|
|
( |
) |
|
|
|
|||
Less: Other comprehensive (income)/loss |
|
|
( |
) |
|
|
|
|
|
( |
) |
|
|
|
|
|
|
|
|
|
|
|
( |
) |
|
|
|
|
|
( |
) |
|||||
Other comprehensive (loss)/income attributable |
|
$ |
( |
) |
|
$ |
|
|
$ |
( |
) |
|
$ |
( |
) |
|
$ |
( |
) |
|
$ |
( |
) |
|
$ |
|
|
$ |
( |
) |
|
$ |
|
|||
Changes in accumulated other comprehensive loss, net of non-controlling interests and net of tax are provided in the following table. This table excludes amounts attributable to non-controlling interests, which are not material for further disclosure.
|
|
Foreign currency |
|
|
Derivative |
|
|
Defined pension |
|
|
Total |
|
||||
Balance, January 1, 2021 |
|
$ |
( |
) |
|
$ |
|
|
$ |
( |
) |
|
$ |
( |
) |
|
Other comprehensive (loss)/income before reclassifications |
|
|
( |
) |
|
|
|
|
|
|
|
|
|
|||
Loss/(gain) reclassified from accumulated other |
|
|
|
|
|
( |
) |
|
|
|
|
|
|
|||
Net other comprehensive (loss)/income |
|
|
( |
) |
|
|
|
|
|
|
|
|
|
|||
Balance, December 31, 2021 |
|
$ |
( |
) |
|
$ |
|
|
$ |
( |
) |
|
$ |
( |
) |
|
Other comprehensive (loss)/income before reclassifications |
|
|
( |
) |
|
|
( |
) |
|
|
|
|
|
( |
) |
|
Loss reclassified from accumulated other |
|
|
|
|
|
|
|
|
|
|
|
|
||||
Net other comprehensive (loss)/income |
|
|
( |
) |
|
|
( |
) |
|
|
|
|
|
( |
) |
|
Balance, December 31, 2022 |
|
$ |
( |
) |
|
$ |
|
|
$ |
( |
) |
|
$ |
( |
) |
|
Other comprehensive income/(loss) before reclassifications |
|
|
|
|
|
|
|
|
( |
) |
|
|
( |
) |
||
Loss reclassified from accumulated other |
|
|
|
|
|
|
|
|
|
|
|
|
||||
Net other comprehensive income/(loss) |
|
|
|
|
|
|
|
|
( |
) |
|
|
( |
) |
||
Balance, December 31, 2023 |
|
$ |
( |
) |
|
$ |
|
|
$ |
( |
) |
|
$ |
( |
) |
|
Note 19 — Share-based Compensation
Amounts related to discontinued operations in the tables and other disclosures below were not material during the years ended December 31, 2023, 2022 and 2021.
Plan Summaries
On December 31, 2023, the Company had a number of open share-based compensation plans, which provide for the granting of time-based and performance-based options, time-based and performance-based restricted stock units, and various other share-based grants to employees. All of the Company’s share-based compensation plans under which any options, restricted stock units (‘RSUs’) or other share-based grants are outstanding as of December 31, 2023 are described below.
119
During 2023, approximately
The compensation cost that has been recognized for these plans for the years ended December 31, 2023, 2022 and 2021 was $
2012 Equity Incentive Plan
This plan, established on April 25, 2012 and amended and restated on June 10, 2016, provides for the granting of incentive stock options, time-based or performance-based non-statutory stock options, share appreciation rights, restricted shares, time-based or performance-based RSUs, performance-based awards and other share-based grants or any combination thereof to employees, officers, non-employee directors and consultants of the Company (‘2012 Plan’). The board of directors also adopted a sub-plan under the 2012 Plan to provide an employee sharesave scheme in the U.K.
There were
Options
There were
Award Activity
Classification of options as time-based or performance-based is dependent on the original terms of the award.
During the year ended December 31, 2023, the remaining
All remaining performance-based options outstanding were exercised during 2022. The total intrinsic values of performance-based options exercised during the years ended December 31, 2022 and 2021 were $
Cash received from option exercises under all share-based payment arrangements for the year ended December 31, 2023 was immaterial, and for the years ended December 31, 2022 and 2021 was $
Equity-settled RSUs
Valuation Assumptions
The grant date fair value of each time-based RSU is equal to the grant date stock price. Performance-based RSUs granted during the years ended December 31, 2023 and December 31, 2022, contain only non-market-based performance targets, and the grant date fair value of these awards is equal to the grant date stock price. Because performance-based RSUs granted during the year ended December 31, 2021 contain market-based performance targets, the fair value is estimated on the grant date using a Monte-Carlo simulation that uses the assumptions noted in the following table. Expected volatility is based on the historical volatility of the
120
Company’s shares. The risk-free interest rate is based on the U.S. Treasury yield curve in effect at the time of the grant.
|
|
Year ended |
|
|
|
|
2021 |
|
|
Expected volatility |
|
|
% |
|
Expected dividend yield |
|
|
— |
% |
Expected life (years) |
|
|
|
|
Risk-free interest rate |
|
|
% |
|
During the year ended December 31, 2023, certain performance-based RSU awards were modified to either better align the payout percentages for the broad-based population with the awards granted to the executive officers, or to reflect the impact of the divestment of our Russian business (see Note 3 — Acquisitions and Divestitures for additional information). In total,
Award Activity
A summary of time-based and performance-based RSU activity under the plans at December 31, 2023, and changes during the year then ended, is presented below:
|
|
Shares |
|
|
Weighted- |
|
||
Time-based RSUs |
|
|
|
|
|
|
||
Balance as of December 31, 2022 |
|
|
|
|
$ |
|
||
Granted |
|
|
|
|
$ |
|
||
Vested |
|
|
( |
) |
|
$ |
|
|
Forfeited |
|
|
( |
) |
|
$ |
|
|
Balance as of December 31, 2023 |
|
|
|
|
$ |
|
||
Performance-based RSUs |
|
|
|
|
|
|
||
Balance as of December 31, 2022 |
|
|
|
|
$ |
|
||
Granted |
|
|
|
|
$ |
|
||
Vested |
|
|
( |
) |
|
$ |
|
|
Forfeited |
|
|
( |
) |
|
$ |
|
|
Balance as of December 31, 2023 |
|
|
|
|
$ |
|
||
Time-based RSUs approximating
Performance-based RSUs approximating
The actual tax benefits recognized for the tax deductions from RSUs that vested totaled $
The amounts reflected above include awards which will be cash-settled due to local requirements. These awards are classified as liabilities in our consolidated balance sheets and are not material.
Phantom RSUs
During the year ended December 31, 2022, cash payments totaling $
121
Note 20 — Earnings Per Share
Basic and diluted earnings per share from continuing operations attributable to WTW and discontinued operations, net of tax are calculated by dividing net income from continuing operations attributable to WTW and discontinued operations, net of tax, respectively, by the average number of ordinary shares outstanding during each period. The computation of diluted earnings per share reflects the potential dilution that could occur if dilutive securities and other contracts to issue shares were exercised or converted into shares or resulted in the issuance of shares that then shared in the net income of the Company. See Note 19 — Share-based Compensation for a summary of our outstanding options and RSUs.
Basic and diluted earnings per share are as follows:
|
|
Years ended December 31, |
|
|||||||||
|
|
2023 |
|
|
2022 |
|
|
2021 |
|
|||
Income from continuing operations |
|
$ |
|
|
$ |
|
|
$ |
|
|||
Less: income attributable to non-controlling interests |
|
|
( |
) |
|
|
( |
) |
|
|
( |
) |
Income from continuing operations attributable to WTW |
|
$ |
|
|
$ |
|
|
$ |
|
|||
|
|
|
|
|
|
|
|
|
|
|||
(Loss)/income from discontinued operations, net of tax |
|
$ |
|
|
$ |
( |
) |
|
$ |
|
||
|
|
|
|
|
|
|
|
|
|
|||
Basic weighted-average number of shares outstanding |
|
|
|
|
|
|
|
|
|
|||
Dilutive effect of potentially issuable shares |
|
|
|
|
|
|
|
|
|
|||
Diluted weighted-average number of shares outstanding |
|
|
|
|
|
|
|
|
|
|||
|
|
|
|
|
|
|
|
|
|
|||
Basic earnings per share from continuing operations attributable to WTW |
|
$ |
|
|
$ |
|
|
$ |
|
|||
Dilutive effect of potentially issuable shares |
|
|
( |
) |
|
|
( |
) |
|
|
( |
) |
Diluted earnings per share from continuing operations attributable to WTW |
|
$ |
|
|
$ |
|
|
$ |
|
|||
|
|
|
|
|
|
|
|
|
|
|||
Basic (loss)/earnings per share from discontinued operations, net of tax |
|
$ |
|
|
$ |
( |
) |
|
$ |
|
||
Dilutive effect of potentially issuable shares |
|
|
|
|
|
|
|
|
( |
) |
||
Diluted (loss)/earnings per share from discontinued operations, net of tax |
|
$ |
|
|
$ |
( |
) |
|
$ |
|
||
There were
Note 21 — Supplemental Disclosures of Cash Flow Information
Supplemental disclosures regarding cash flow information and non-cash investing and financing activities are as follows:
|
|
As of and for the years ended December 31, |
|
|||||||||
|
|
2023 |
|
|
2022 |
|
|
2021 |
|
|||
Supplemental disclosures of cash flow information: |
|
|
|
|
|
|
|
|
|
|||
Cash and cash equivalents |
|
$ |
|
|
$ |
|
|
$ |
|
|||
Fiduciary funds (included in fiduciary assets) |
|
|
|
|
|
|
|
|
|
|||
Cash and cash equivalents and fiduciary funds (included in current assets held |
|
|
|
|
|
|
|
|
|
|||
Total cash, cash equivalents and restricted cash |
|
$ |
|
|
$ |
|
|
$ |
|
|||
|
|
|
|
|
|
|
|
|
|
|||
Increase/(decrease) in cash, cash equivalents and other restricted cash |
|
$ |
|
|
$ |
( |
) |
|
$ |
|
||
(Decrease)/increase in fiduciary funds |
|
|
( |
) |
|
|
|
|
|
( |
) |
|
Total |
|
$ |
( |
) |
|
$ |
( |
) |
|
$ |
|
|
|
|
|
|
|
|
|
|
|
|
|||
Cash payments for income taxes, net |
|
$ |
|
|
$ |
|
|
$ |
|
|||
Cash payments for interest |
|
$ |
|
|
$ |
|
|
$ |
|
|||
Cash acquired |
|
$ |
|
|
$ |
|
|
$ |
|
|||
Supplemental disclosures of non-cash investing and financing activities: |
|
|
|
|
|
|
|
|
|
|||
Non-cash consideration received |
|
$ |
|
|
$ |
|
|
$ |
|
|||
Fair value of deferred and contingent consideration related to acquisitions |
|
$ |
|
|
$ |
|
|
$ |
|
|||
122
ITEM 9. CHANGES IN AND DISAGREEMENTS WITH ACCOUNTANTS ON ACCOUNTING AND FINANCIAL DISCLOSURE
None.
ITEM 9A. CONTROLS AND PROCEDURES
Evaluation of Disclosure Controls and Procedures
An evaluation was performed under the supervision and with the participation of our chief executive officer (‘CEO’) and chief financial officer (‘CFO’), of the effectiveness of the design and operation of our disclosure controls and procedures, as defined in Rules 13a-15(e) and 15d-15(e) under the Securities Exchange Act of 1934, as amended (the ‘Exchange Act’), as of the end of the period covered by this Annual Report on Form 10-K. Based upon that evaluation, our management, including the CEO and CFO, concluded that our disclosure controls and procedures were effective as of December 31, 2023 in providing reasonable assurance that the information required to be disclosed in the periodic reports we file or submit under the Exchange Act is (1) recorded, processed, summarized and reported within the time periods specified in SEC rules and forms, and (2) accumulated and communicated to our management, including the CEO and the CFO, as appropriate, to allow for timely decisions regarding required disclosure.
Changes in Internal Control Over Financial Reporting
There were no changes in our internal control over financial reporting, as defined in Rules 13a-15(f) and 15d-15(f) under the Exchange Act, identified in connection with the evaluation required by Rules 13a-15(d) or 15d-15(d) under the Exchange Act in the quarter and year ended December 31, 2023 that materially affected, or are reasonably likely to materially affect, our internal control over financial reporting.
Management’s Report on Internal Control over Financial Reporting
Internal control over financial reporting refers to the process designed by, or under the supervision of, our CEO and CFO, and overseen by our board of directors, management and other personnel, to provide reasonable assurance regarding the reliability of financial reporting and the preparation of financial statements for external purposes in accordance with U.S. generally accepted accounting principles (‘U.S. GAAP’), and includes those policies and procedures that:
Internal control over financial reporting cannot provide absolute assurance of achieving financial reporting objectives because of its inherent limitations. Internal control over financial reporting is a process that involves human diligence and compliance and is subject to lapses in judgment and breakdowns resulting from human failures. Internal control over financial reporting can also be circumvented by collusion or improper management override. Also, projections of any evaluation of effectiveness to future periods are subject to the risk that controls may become inadequate because of changes in conditions, or that the degree of compliance with the policies or procedures may deteriorate. Because of such limitations, there is a risk that material misstatements may not be prevented or detected on a timely basis by internal control over financial reporting. However, these inherent limitations are known features of the financial reporting process. Therefore, it is possible to design into the process safeguards to reduce, though not eliminate, this risk.
Management is responsible for establishing and maintaining the adequacy and effectiveness of our internal control over financial reporting. Under the supervision and with the participation of our management, including our CEO and CFO, we evaluated the effectiveness of our internal control over financial reporting as of December 31, 2023. In making this evaluation, management used the criteria set forth by the Committee of Sponsoring Organizations of the Treadway Commission in the report entitled Internal Control — Integrated Framework (2013). Based on this evaluation, management has concluded that we maintained effective internal control over financial reporting as of December 31, 2023.
The effectiveness of our internal control over financial reporting has been audited by Deloitte & Touche LLP, an independent registered public accounting firm, as stated in their report titled “Report of Independent Registered Public Accounting Firm on Internal Control over Financial Reporting,” which is included herein.
123
REPORT OF INDEPENDENT REGISTERED PUBLIC ACCOUNTING FIRM
To the Shareholders and the Board of Directors of Willis Towers Watson Public Limited Company
Opinion on Internal Control over Financial Reporting
We have audited the internal control over financial reporting of Willis Towers Watson Public Limited Company and subsidiaries (the ‘Company’) as of December 31, 2023, based on criteria established in Internal Control — Integrated Framework (2013) issued by the Committee of Sponsoring Organizations of the Treadway Commission (‘COSO’). In our opinion, the Company maintained, in all material respects, effective internal control over financial reporting as of December 31, 2023, based on criteria established in Internal Control — Integrated Framework (2013) issued by COSO.
We have also audited, in accordance with the standards of the Public Company Accounting Oversight Board (United States) (‘PCAOB’), the consolidated financial statements as of and for the year ended December 31, 2023, of the Company and our report dated February 22, 2024, expressed an unqualified opinion on those financial statements.
Basis for Opinion
The Company’s management is responsible for maintaining effective internal control over financial reporting and for its assessment of the effectiveness of internal control over financial reporting, included in the accompanying Management’s Report on Internal Control over Financial Reporting. Our responsibility is to express an opinion on the Company’s internal control over financial reporting based on our audit. We are a public accounting firm registered with the PCAOB and are required to be independent with respect to the Company in accordance with the U.S. federal securities laws and the applicable rules and regulations of the Securities and Exchange Commission and the PCAOB.
We conducted our audit in accordance with the standards of the PCAOB. Those standards require that we plan and perform the audit to obtain reasonable assurance about whether effective internal control over financial reporting was maintained in all material respects. Our audit included obtaining an understanding of internal control over financial reporting, assessing the risk that a material weakness exists, testing and evaluating the design and operating effectiveness of internal control based on the assessed risk, and performing such other procedures as we considered necessary in the circumstances. We believe that our audit provides a reasonable basis for our opinion.
Definition and Limitations of Internal Control over Financial Reporting
A company’s internal control over financial reporting is a process designed to provide reasonable assurance regarding the reliability of financial reporting and the preparation of financial statements for external purposes in accordance with generally accepted accounting principles. A company’s internal control over financial reporting includes those policies and procedures that (1) pertain to the maintenance of records that, in reasonable detail, accurately and fairly reflect the transactions and dispositions of the assets of the company; (2) provide reasonable assurance that transactions are recorded as necessary to permit preparation of financial statements in accordance with generally accepted accounting principles, and that receipts and expenditures of the company are being made only in accordance with authorizations of management and directors of the company; and (3) provide reasonable assurance regarding prevention or timely detection of unauthorized acquisition, use, or disposition of the company’s assets that could have a material effect on the financial statements.
Because of its inherent limitations, internal control over financial reporting may not prevent or detect misstatements. Also, projections of any evaluation of effectiveness to future periods are subject to the risk that controls may become inadequate because of changes in conditions, or that the degree of compliance with the policies or procedures may deteriorate.
/s/ Deloitte & Touche LLP
Philadelphia, PA
February 22, 2024
124
ITEM 9B. OTHER INFORMATION
(a) None.
(b) None.
(c) Insider Trading Arrangements
For the quarter ended December 31, 2023, none of the Company’s directors or officers (as defined under SEC Rule 16a-1(f))
125
ITEM 9C. DISCLOSURE REGARDING FOREIGN JURISDICTIONS THAT PREVENT INSPECTIONS
Not Applicable.
126
PART III.
ITEM 10. DIRECTORS, EXECUTIVE OFFICERS AND CORPORATE GOVERNANCE
Information with respect to the executive officers of the Company is provided in Part I, Item 1 Business above under the heading ‘Information about Executive Officers of the Registrant’ and information required by Item 406 of Regulation S-K is below. All other information required by this Item will be provided in accordance with Instruction G(3) to Form 10-K no later than 120 days after the end of the Company’s fiscal year.
The Company has adopted a Code of Conduct applicable to all our directors, officers and employees, including our CEO, the CFO, the Principal Accounting Officer and all those involved in the Company’s accounting functions. The Code of Conduct can be found in the ‘Investor Relations — Corporate Governance’ section of the Company’s website at www.wtwco.com. It is also available free of charge on request from the Company Secretary at corporatesecretary@wtwco.com. The Company intends to post on its website any amendments to, or waivers of, a provision of the Code of Conduct in accordance with Item 406 of Regulation S-K.
ITEM 11. EXECUTIVE COMPENSATION
The information required by this Item will be provided in accordance with Instruction G(3) to Form 10-K no later than 120 days after the end of the Company’s fiscal year.
ITEM 12. SECURITY OWNERSHIP OF CERTAIN BENEFICIAL OWNERS AND MANAGEMENT AND RELATED STOCKHOLDER MATTERS
Information with respect to the Company’s Securities Authorized for Issuance Under Equity Compensation Plans as required by Item 201(d) of Regulation S-K is incorporated herein by reference to Item 5 of this Annual Report on Form 10-K. All other information required by this Item will be provided in accordance with Instruction G(3) to Form 10-K no later than 120 days after the end of the Company’s fiscal year.
ITEM 13. CERTAIN RELATIONSHIPS AND RELATED TRANSACTIONS, AND DIRECTOR INDEPENDENCE
The information required by this Item will be provided in accordance with Instruction G(3) to Form 10-K no later than 120 days after the end of the Company’s fiscal year.
ITEM 14. PRINCIPAL ACCOUNTANT FEES AND SERVICES
The information required by this Item will be provided in accordance with Instruction G(3) to Form 10-K no later than 120 days after the end of the Company’s fiscal year.
127
PART IV.
ITEM 15. EXHIBITS AND FINANCIAL STATEMENT SCHEDULES
Report of Independent Registered Public Accounting Firm
Consolidated Financial Statements of Willis Towers Watson Public Limited Company
Financial Statements:
Consolidated Statements of Comprehensive Income for each of the three years in the period ended December 31, 2023
Consolidated Balance Sheets at December 31, 2023 and 2022
Consolidated Statements of Cash Flows for each of the three years in the period ended December 31, 2023
Consolidated Statements of Changes in Equity for each of the three years in the period ended December 31, 2023
Notes to the Consolidated Financial Statements
In reviewing the agreements included or incorporated by reference as exhibits to this Annual Report on Form 10-K, it is important to note that they are included to provide investors with information regarding their terms, and are not intended to provide any other factual or disclosure information about WTW or the other parties to the agreements. The agreements contain representations and warranties made by each of the parties to the applicable agreement. These representations and warranties have been made solely for the benefit of the other parties to the applicable agreement, and: should not be treated as categorical statements of fact, but rather as a way of allocating risk between the parties; have in some cases been qualified by disclosures that were made to the other party in connection with the negotiation of the applicable agreement, which disclosures are not necessarily reflected in the agreement; may apply standards of materiality in a way that is different from what may be material to investors; and were made only as of the date of the applicable agreement or such other date or dates as may be specified in the agreement and are subject to more recent developments.
Accordingly, these representations and warranties may not describe the actual state of affairs as of the date they were made or at any other time. Additional information about WTW may be found elsewhere in this Annual Report on Form 10-K and our other public filings, which are available without charge through the SEC’s website at http://www.sec.gov.
|
|
|
|
Incorporated by Reference |
|
|||||
Exhibit Number |
|
Description of Exhibit |
|
Schedule/ Form |
|
Exhibit |
|
Filing Date |
|
Filed Herewith |
2.1 |
|
|
8-K |
|
2.1 |
|
June 30, 2015 |
|
|
|
2.2 |
|
|
8-K |
|
2.1 |
|
November 20, 2015 |
|
|
|
3.1 |
|
|
8-K |
|
3.1 |
|
June 15, 2017 |
|
|
|
4.1 |
|
Description of Willis Towers Watson Public Limited Company’s ordinary shares |
|
10-K |
|
4.1 |
|
February 26, 2020 |
|
|
128
|
|
|
|
|
|
|
|
|
|
|
|
|
|
|
Incorporated by Reference |
|
|||||
Exhibit Number |
|
Description of Exhibit |
|
Schedule/ Form |
|
Exhibit |
|
Filing Date |
|
Filed Herewith |
4.2 |
|
|
8-K |
|
4.1 |
|
August 15, 2013 |
|
|
|
4.3 |
|
|
8-K |
|
4.2 |
|
August 15, 2013 |
|
|
|
4.4 |
|
|
8-K |
|
4.3 |
|
March 10, 2016 |
|
|
|
4.5 |
|
|
8-K |
|
4.1 |
|
March 22, 2016 |
|
|
|
4.6 |
|
|
8-K |
|
4.3 |
|
August 16, 2017 |
|
|
|
4.7 |
|
|
8-K |
|
4.1 |
|
May 16, 2017 |
|
|
|
4.8 |
|
|
8-K |
|
4.2 |
|
May 16, 2017 |
|
|
|
4.9 |
|
|
8-K |
|
4.4 |
|
August 16, 2017 |
|
|
|
4.10 |
|
|
8-K |
|
4.1 |
|
September 10, 2018 |
|
|
|
4.11 |
|
|
8-K |
|
4.1 |
|
September 10, 2019 |
|
|
|
4.12 |
|
|
8-K |
|
4.1 |
|
May 19, 2022 |
|
|
|
4.13 |
|
|
8-K |
|
4.1 |
|
May 29, 2020 |
|
|
|
4.14 |
|
|
S-3 |
|
4.6 |
|
February 28, 2022 |
|
|
|
4.15 |
|
|
8-K |
|
4.1 |
|
May 17, 2023 |
|
|
|
129
|
|
|
|
Incorporated by Reference |
|
|||||
Exhibit Number |
|
Description of Exhibit |
|
Schedule/ Form |
|
Exhibit |
|
Filing Date |
|
Filed Herewith |
10.1^ |
|
|
8-K |
|
10.1 |
|
October 7, 2021 |
|
|
|
10.2 |
|
|
8-K |
|
10.2 |
|
October 7, 2021 |
|
|
|
10.3^ |
|
|
10-Q |
|
10.1 |
|
July 27, 2023 |
|
|
|
10.4 |
|
|
8-K |
|
10.4 |
|
January 4, 2010 |
|
|
|
10.5 |
|
|
8-K |
|
10.1 |
|
August 16, 2021 |
|
|
|
10.6 |
|
|
8-K |
|
10.1 |
|
December 6, 2021 |
|
|
|
10.7† |
|
Willis Towers Watson Public Limited Company 2012 Equity Incentive Plan |
|
DEF14A |
|
A |
|
April 28, 2022 |
|
|
10.8† |
|
|
10-Q |
|
10.1 |
|
August 9, 2012 |
|
|
|
10.9† |
|
|
10-K |
|
10.9 |
|
February 24, 2022 |
|
|
|
10.10† |
|
|
10-K |
|
10.32 |
|
February 28, 2013 |
|
|
|
10.11† |
|
Amended and Restated Willis U.S. 2005 Deferred Compensation Plan |
|
8-K |
|
10.1 |
|
November 20, 2009 |
|
|
10.12† |
|
|
10-Q |
|
10.1 |
|
August 9, 2011 |
|
|
|
10.13† |
|
Second Amendment to the Amended and Restated Willis U.S. 2005 Deferred Compensation Plan |
|
10-Q |
|
10.6 |
|
November 5, 2013 |
|
|
10.14† |
|
Amendment 2017-1 to the Amended and Restated Willis U.S. 2005 Deferred Compensation Plan |
|
10-K |
|
10.34 |
|
February 28, 2018 |
|
|
10.15† |
|
Amendment 2019-1 to the Amended and Restated Willis U.S. 2005 Deferred Compensation Plan |
|
10-Q |
|
10.2 |
|
November 1, 2019 |
|
|
10.16† |
|
Form of Deed of Indemnity of Willis Towers Watson Public Limited Company |
|
8-K |
|
10.1 |
|
January 5, 2016 |
|
|
10.17† |
|
Form of Indemnification Agreement of Willis North America Inc. |
|
8-K |
|
10.2 |
|
January 5, 2016 |
|
|
130
|
|
|
|
Incorporated by Reference |
|
|||||
Exhibit Number |
|
Description of Exhibit |
|
Schedule/ Form |
|
Exhibit |
|
Filing Date |
|
Filed Herewith |
10.18† |
|
|
10-Q |
|
10.1 |
|
July 28, 2022 |
|
|
|
10.19† |
|
|
10-Q |
|
10.4 |
|
October 28, 2021 |
|
|
|
10.20† |
|
|
10-Q |
|
10.5 |
|
October 28, 2021 |
|
|
|
10.21† |
|
|
10-K |
|
10.45 |
|
February 24, 2022 |
|
|
|
10.22† |
|
Contract of Employment, dated May 11, 2009, by and between Willis Limited and Adam Garrard |
|
10-K |
|
10.21 |
|
February 24, 2023 |
|
|
10.23† |
|
|
8-K |
|
10.1 |
|
February 5, 2021 |
|
|
|
10.24† |
|
Towers Watson Amended and Restated 2009 Long Term Incentive Plan |
|
S-8 |
|
99.1 |
|
January 5, 2016 |
|
|
10.25† |
|
Trust Deed and Rules of the Towers Watson Limited Share Incentive Plan 2005 (U.K.) |
|
10-K |
|
10.21 |
|
September 1, 2006 |
|
|
10.26† |
|
Towers Watson Limited Share Incentive Plan 2005 Deed of Amendment (U.K.) |
|
10-K |
|
10.22 |
|
September 1, 2006 |
|
|
10.27† |
|
Towers Watson Limited Share Incentive Plan 2005 Deed to Change the Trust Deed and Rules (U.K.) |
|
10-K |
|
10.10 |
|
August 29, 2012 |
|
|
10.28† |
|
|
10-Q |
|
10.1 |
|
November 7, 2016 |
|
|
|
10.29† |
|
Amendment 2018-1 to the Willis Towers Watson Non-Qualified Deferred Savings Plan for U.S. Employees |
|
8-K |
|
99.3 |
|
July 18, 2018 |
|
|
10.30† |
|
Amendment 2020-1 to the Willis Towers Watson Non-Qualified Deferred Savings Plan for U.S. Employees |
|
10-K |
|
10.62 |
|
February 23, 2021 |
|
|
10.31† |
|
|
|
|
|
|
|
|
X |
|
10.32† |
|
|
10-Q |
|
10.2 |
|
August 4, 2021 |
|
|
|
10.33† |
|
|
10-Q |
|
10.3 |
|
August 4, 2021 |
|
|
|
10.34† |
|
|
8-K |
|
10.1 |
|
February 28, 2022 |
|
|
|
10.35† |
|
|
8-K |
|
10.2 |
|
February 28, 2022 |
|
|
|
131
|
|
|
|
Incorporated by Reference |
|
|||||
Exhibit Number |
|
Description of Exhibit |
|
Schedule/ Form |
|
Exhibit |
|
Filing Date |
|
Filed Herewith |
10.36† |
|
|
10-Q |
|
10.1 |
|
April 27, 2023 |
|
|
|
10.37† |
|
|
10-Q |
|
10.2 |
|
April 27, 2023 |
|
|
|
10.38† |
|
|
8-K |
|
10.3 |
|
February 28, 2022 |
|
|
|
10.39† |
|
|
8-K |
|
10.4 |
|
February 28, 2022 |
|
|
|
10.40† |
|
|
10-Q |
|
10.1 |
|
July 28, 2022 |
|
|
|
21.1 |
|
|
|
|
|
|
|
|
X |
|
22.1 |
|
|
10-Q |
|
22.1 |
|
October 26, 2023 |
|
|
|
23.1 |
|
|
|
|
|
|
|
|
X |
|
31.1 |
|
|
|
|
|
|
|
|
X |
|
31.2 |
|
|
|
|
|
|
|
|
X |
|
32.1** |
|
|
|
|
|
|
|
|
|
|
32.2** |
|
|
|
|
|
|
|
|
|
|
97.1† |
|
|
|
|
|
|
|
|
X |
|
101.INS |
|
Inline XBRL Instance Document – the instance document does not appear in the Interactive Data File because XBRL tags are embedded within the Inline XBRL document |
|
|
|
|
|
|
|
X |
101.SCH |
|
Inline XBRL Taxonomy Extension Schema With Embedded Linkbase Documents |
|
|
|
|
|
|
|
X |
104 |
|
Cover Page Interactive Data File (formatted as inline XBRL and contained in Exhibit 101) |
|
|
|
|
|
|
|
X |
** Furnished herewith. Any exhibits furnished herewith (including the certifications furnished in Exhibits 32.1 and 32.2) are deemed to accompany this Annual Report on Form 10-K and will not be deemed “filed” for purposes of Section 18 of the Securities Exchange Act of 1934, as amended, or otherwise subject to the liability of that section, except to the extent that the registrant specifically incorporates it by reference.
† Management contract or compensatory plan or arrangement.
^ Certain of the exhibits and schedules to this Exhibit have been omitted in accordance with Regulation S-K Item 601(a)(5). We agree to furnish a copy of all omitted exhibits and schedules to the SEC upon its request.
132
All exhibits that are incorporated by reference herein to a filing with the SEC are filed under SEC File No. 001-16503, except for filings made more than seven years ago which are filed under: SEC File No. 001-16503, for any filings that were made by Willis Group Holdings or the Company; SEC File No. 001-34594, for any filings that were made by Towers Watson; and SEC File No. 001-16159, for any filings that were made by Watson Wyatt Worldwide.
133
ITEM 16. FORM 10-K SUMMARY
Not applicable.
134
SIGNATURES
Pursuant to the requirements of Section 13 or 15(d) of the Securities Exchange Act of 1934, the registrant has duly caused this report to be signed on its behalf by the undersigned, thereunto duly authorized.
|
WILLIS TOWERS WATSON PUBLIC LIMITED COMPANY (REGISTRANT) |
|
|
|
|
|
By: |
/s/ Carl Hess |
|
|
Carl Hess |
|
|
Chief Executive Officer |
Date: February 22, 2024
Pursuant to the requirements of the Securities Exchange Act of 1934, this report has been signed below by the following persons on behalf of the registrant and in the capacities indicated.
/s/ Carl Hess |
|
/s/ Andrew Krasner |
Carl Hess Chief Executive Officer and Director (Principal Executive Officer) |
|
Andrew Krasner Chief Financial Officer |
|
|
|
/s/ Joseph Kurpis |
|
|
Joseph Kurpis Principal Accounting Officer and Controller |
|
|
|
|
|
/s/ Dame Inga Beale |
|
/s/ Fumbi Chima |
Dame Inga Beale Director |
|
Fumbi Chima Director |
|
|
|
/s/ Stephen Chipman |
|
/s/ Michael Hammond |
Stephen Chipman Director |
|
Michael Hammond Director |
|
|
|
/s/ Jacqueline Hunt |
|
/s/ Paul Reilly |
Jacqueline Hunt Director |
|
Paul Reilly Director |
|
|
|
/s/ Michelle Swanback |
|
/s/ Paul Thomas |
Michelle Swanback Director |
|
Paul Thomas Director |
/s/ Fredric Tomczyk |
|
|
Fredric Tomczyk Director |
|
|
135