Exhibit 4
Chunghwa Telecom Co., Ltd. and Subsidiaries
Consolidated Financial Statements for the
Three Months Ended March 31, 2012 and 2011 and
Independent Accountants’ Review Report
INDEPENDENT ACCOUNTANTS’ REVIEW REPORT
To the Board of Directors and Stockholders of
Chunghwa Telecom Co., Ltd.
We have reviewed the accompanying consolidated balance sheets of Chunghwa Telecom Co., Ltd. and subsidiaries (“the Company”) as of March 31, 2012 and 2011, and the related consolidated statements of income and cash flows for the three months then ended. These consolidated financial statements are the responsibility of the Company’s management. Our responsibility is to issue a report on these consolidated financial statements based on our review.
Except for the matters described in the next paragraph, we conducted our reviews in accordance with the Statement of Auditing Standards No. 36, “Review of Financial Statements”, issued by the Auditing Committee of the Accounting Research and Development Foundation of the Republic of China. A review consists principally of applying analytical procedures to financial data and making inquiries of persons responsible for financial and accounting matters. It is substantially less in scope than an audit conducted in accordance with auditing standards generally accepted in the Republic of China, the objective of which is the expression of an opinion regarding the financial statements taken as a whole. Accordingly, we do not express such an audit opinion.
As discussed in Note 2 to the consolidated financial statements, the financial statements of certain subsidiaries as of and for the three months ended March 31, 2012 and 2011 have not been reviewed. The total assets of these subsidiaries were 3.43% (NT$15,412,474 thousand) and 3.43% (NT$15,290,879 thousand), and the total liabilities of these subsidiaries were 7.64% (NT$5,068,890 thousand) and 9.96% (NT$6,450,737 thousand), of the related consolidated amounts as of March 31, 2012 and 2011, respectively. The total revenues of these subsidiaries were 3.17% (NT$1,757,410 thousand) and 2.02% (NT$1,058,007 thousand) of the related consolidated revenues for the three months ended March 31, 2012 and 2011, respectively, and their net losses were NT$3,453 thousand and NT$8,788 thousand for the three months ended March 31, 2012 and 2011, respectively. Further, as discussed in Note 12 to the consolidated financial statements, the financial statements of certain equity method investees as of and for the three months ended March 31, 2012 and 2011 have not been reviewed, and as discussed in Note 35 to the consolidated financial statements, the disclosed information was based on the aforementioned financial statements, which have not been reviewed, of certain equity method investees as of and for the three months ended March, 2012 and 2011. The aggregate carrying values of these equity method investees were NT$2,695,836 thousand and NT$1,786,162 thousand as of March 31, 2012 and 2011, respectively, and the equity in earnings of these equity method investees were NT$173,202 thousand and NT$63,587 thousand for the three months ended March 31, 2012 and 2011, respectively.
1
Based on our reviews, except for the effects of such adjustments, if any, as might have been determined to be necessary had we reviewed financial statements of certain subsidiaries and equity method investees referred to in the preceding paragraph, we are not aware of any material modifications that should be made to the financial statements referred to above for them to be in conformity with the Guidelines Governing the Preparation of Financial Reports by Securities Issuers, and accounting principles generally accepted in the Republic of China.
|
/s/ DELOITTE & TOUCHE |
|
|
Deloitte & Touche |
|
|
Taipei, Taiwan |
|
|
The Republic of China |
|
April 27, 2012
Notice to Readers
The accompanying consolidated financial statements are intended only to present the financial position, results of operations and cash flows in accordance with accounting principles and practices generally accepted in the Republic of China and not those of any other jurisdictions. The standards, procedures and practices to review such consolidated financial statements are those generally accepted and applied in the Republic of China.
For the convenience of readers, the accountants’ review report and the accompanying consolidated financial statements have been translated into English from the original Chinese version prepared and used in the Republic of China. If there is any conflict between the English version and the original Chinese version or any difference in the interpretation of the two versions, the Chinese-language accountants’ review report and consolidated financial statements shall prevail.
2
CHUNGHWA TELECOM CO., LTD. AND SUBSIDIARIES
CONSOLIDATED BALANCE SHEETS
MARCH 31, 2012 AND 2011
(Amounts in Thousands of New Taiwan Dollars, Except Par Value Data)
(Reviewed, Not Audited)
|
|
|
2012 |
|
2011 |
|
|
|
|
Amount |
|
% |
|
Amount |
|
% |
|
|
ASSETS |
|
|
|
|
|
|
|
|
|
|
CURRENT ASSETS |
|
|
|
|
|
|
|
|
|
|
Cash and cash equivalents (Notes 2 and 4) |
|
$ |
69,938,896 |
|
16 |
|
$ |
75,002,169 |
|
17 |
|
|
Financial assets at fair value through profit or loss (Notes 2 and 5) |
|
65,023 |
|
— |
|
79,443 |
|
— |
|
|
Available-for-sale financial assets (Notes 2 and 6) |
|
2,724,087 |
|
1 |
|
2,162,591 |
|
1 |
|
|
Held-to-maturity financial assets (Notes 2 and 7) |
|
500,266 |
|
— |
|
2,062,915 |
|
— |
|
|
Trade notes and accounts receivable, net of allowance for doubtful accounts of $2,396,696 in 2012 and $2,526,507 in 2011 (Notes 2, 8 and 21) |
|
22,037,757 |
|
5 |
|
19,530,851 |
|
4 |
|
|
Receivables from related parties (Note 28) |
|
38,050 |
|
— |
|
26,881 |
|
— |
|
|
Other monetary assets (Note 9) |
|
1,667,273 |
|
— |
|
2,637,635 |
|
1 |
|
|
Inventories (Notes 2, 10, 21 and 30) |
|
5,401,850 |
|
1 |
|
5,735,456 |
|
1 |
|
|
Deferred income tax assets (Notes 2 and 25) |
|
110,998 |
|
— |
|
125,313 |
|
— |
|
|
Restricted assets (Notes 21 and 29) |
|
— |
|
— |
|
39,005 |
|
— |
|
|
Other current assets (Notes 10, 11, 21 and 28) |
|
8,308,815 |
|
2 |
|
6,639,790 |
|
2 |
|
|
|
|
|
|
|
|
|
|
|
|
|
Total current assets |
|
110,793,015 |
|
25 |
|
114,042,049 |
|
26 |
|
|
|
|
|
|
|
|
|
|
|
|
|
LONG-TERM INVESTMENTS |
|
|
|
|
|
|
|
|
|
|
Investments accounted for using equity method (Notes 2 and 12) |
|
2,716,972 |
|
— |
|
1,786,162 |
|
— |
|
|
Financial assets carried at cost (Notes 2 and 13) |
|
2,758,779 |
|
1 |
|
2,739,335 |
|
1 |
|
|
Available-for-sale financial assets (Notes 2 and 6) |
|
3,211,161 |
|
1 |
|
— |
|
— |
|
|
Held-to-maturity financial assets (Notes 2 and 7) |
|
14,590,889 |
|
3 |
|
9,973,059 |
|
2 |
|
|
Other monetary assets (Notes 14 and 30) |
|
1,000,000 |
|
— |
|
1,000,000 |
|
— |
|
|
|
|
|
|
|
|
|
|
|
|
|
Total long-term investments |
|
24,277,801 |
|
5 |
|
15,498,556 |
|
3 |
|
|
|
|
|
|
|
|
|
|
|
|
|
PROPERTY, PLANT AND EQUIPMENT (Notes 2, 15, 28 and 29) |
|
|
|
|
|
|
|
|
|
|
Cost |
|
|
|
|
|
|
|
|
|
|
Land |
|
103,808,185 |
|
23 |
|
103,828,369 |
|
23 |
|
|
Land improvements |
|
1,572,448 |
|
— |
|
1,551,988 |
|
— |
|
|
Buildings |
|
67,696,301 |
|
15 |
|
67,450,256 |
|
15 |
|
|
Computer equipment |
|
15,028,053 |
|
3 |
|
15,936,481 |
|
4 |
|
|
Telecommunications equipment |
|
658,802,536 |
|
147 |
|
657,319,135 |
|
148 |
|
|
Transportation equipment |
|
2,584,674 |
|
1 |
|
2,258,925 |
|
— |
|
|
Miscellaneous equipment |
|
6,977,717 |
|
2 |
|
7,087,675 |
|
2 |
|
|
Total cost |
|
856,469,914 |
|
191 |
|
855,432,829 |
|
192 |
|
|
Revaluation increment on land |
|
5,762,418 |
|
1 |
|
5,762,611 |
|
1 |
|
|
|
|
862,232,332 |
|
192 |
|
861,195,440 |
|
193 |
|
|
Less: Accumulated depreciation |
|
575,688,456 |
|
128 |
|
570,644,684 |
|
128 |
|
|
|
|
286,543,876 |
|
64 |
|
290,550,756 |
|
65 |
|
|
Construction in progress and advances related to acquisition of equipment |
|
14,154,846 |
|
3 |
|
11,161,809 |
|
3 |
|
|
|
|
|
|
|
|
|
|
|
|
|
Property, plant and equipment, net |
|
300,698,722 |
|
67 |
|
301,712,565 |
|
68 |
|
|
|
|
|
|
|
|
|
|
|
|
|
INTANGIBLE ASSETS (Note 2) |
|
|
|
|
|
|
|
|
|
|
3G concession |
|
5,053,109 |
|
1 |
|
5,801,718 |
|
1 |
|
|
Goodwill |
|
245,184 |
|
— |
|
283,054 |
|
— |
|
|
Others |
|
829,978 |
|
— |
|
563,892 |
|
— |
|
|
|
|
|
|
|
|
|
|
|
|
|
Total intangible assets |
|
6,128,271 |
|
1 |
|
6,648,664 |
|
1 |
|
|
|
|
|
|
|
|
|
|
|
|
|
OTHER ASSETS |
|
|
|
|
|
|
|
|
|
|
Leased assets |
|
397,724 |
|
— |
|
408,645 |
|
— |
|
|
Idle assets (Note 2) |
|
899,441 |
|
— |
|
901,818 |
|
— |
|
|
Refundable deposits (Note 28) |
|
1,653,679 |
|
1 |
|
1,380,145 |
|
1 |
|
|
Deferred income tax assets (Notes 2 and 25) |
|
340,360 |
|
— |
|
499,527 |
|
— |
|
|
Restricted assets (Note 29) |
|
8,672 |
|
— |
|
63,439 |
|
— |
|
|
Others (Note 28) |
|
4,197,120 |
|
1 |
|
4,417,941 |
|
1 |
|
|
|
|
|
|
|
|
|
|
|
|
|
Total other assets |
|
7,496,996 |
|
2 |
|
7,671,515 |
|
2 |
|
|
|
|
|
|
|
|
|
|
|
|
|
TOTAL |
|
$ |
449,394,805 |
|
100 |
|
$ |
445,573,349 |
|
100 |
|
|
|
|
|
|
|
|
|
|
|
|
|
LIABILITIES AND STOCKHOLDERS’ EQUITY |
|
|
|
|
|
|
|
|
|
|
|
|
|
|
|
|
|
|
|
|
|
CURRENT LIABILITIES |
|
|
|
|
|
|
|
|
|
|
Short-term loans (Note 16) |
|
$ |
75,000 |
|
— |
|
$ |
115,000 |
|
— |
|
|
Short-term bills payable (Note 17) |
|
— |
|
— |
|
29,977 |
|
— |
|
|
Financial liabilities at fair value through profit or loss (Notes 2 and 5) |
|
803 |
|
— |
|
7,589 |
|
— |
|
|
Trade notes and accounts payable |
|
12,630,673 |
|
3 |
|
9,183,150 |
|
2 |
|
|
Payables to related parties (Note 28) |
|
366,715 |
|
— |
|
158,122 |
|
— |
|
|
Income tax payable (Notes 2 and 25) |
|
5,474,430 |
|
1 |
|
6,930,237 |
|
2 |
|
|
Accrued expenses (Notes 18 and 21) |
|
15,042,834 |
|
3 |
|
15,890,445 |
|
4 |
|
|
Current portion of long-term loans (Note 20) |
|
683,723 |
|
— |
|
306,802 |
|
— |
|
|
Other current liabilities (Notes 10, 19, 21 and 28) |
|
21,565,357 |
|
5 |
|
18,719,272 |
|
4 |
|
|
|
|
|
|
|
|
|
|
|
|
|
Total current liabilities |
|
55,839,535 |
|
12 |
|
51,340,594 |
|
12 |
|
|
|
|
|
|
|
|
|
|
|
|
|
NONCURRENT LIABILITIES |
|
|
|
|
|
|
|
|
|
|
Long-term loans (Note 20) |
|
1,050,000 |
|
— |
|
3,123,141 |
|
1 |
|
|
Deferred income (Note 2) |
|
2,589,481 |
|
1 |
|
2,587,891 |
|
— |
|
|
|
|
|
|
|
|
|
|
|
|
|
Total noncurrent liabilities |
|
3,639,481 |
|
1 |
|
5,711,032 |
|
1 |
|
|
|
|
|
|
|
|
|
|
|
|
|
RESERVE FOR LAND VALUE INCREMENTAL TAX (Note 15) |
|
94,986 |
|
— |
|
94,986 |
|
— |
|
|
|
|
|
|
|
|
|
|
|
|
|
OTHER LIABILITIES |
|
|
|
|
|
|
|
|
|
|
Accrued pension liabilities (Notes 2 and 27) |
|
1,492,529 |
|
1 |
|
1,334,341 |
|
— |
|
|
Customers’ deposits (Note 28) |
|
4,954,927 |
|
1 |
|
5,834,716 |
|
2 |
|
|
Others |
|
342,638 |
|
— |
|
423,749 |
|
— |
|
|
|
|
|
|
|
|
|
|
|
|
|
Total other liabilities |
|
6,790,094 |
|
2 |
|
7,592,806 |
|
2 |
|
|
|
|
|
|
|
|
|
|
|
|
|
Total liabilities |
|
66,364,096 |
|
15 |
|
64,739,418 |
|
15 |
|
|
|
|
|
|
|
|
|
|
|
|
|
EQUITY ATTRIBUTABLE TO STOCKHOLDERS OF THE PARENT (Notes 2, 6, 15 and 22) |
|
|
|
|
|
|
|
|
|
|
Common stock - $10 par value; |
|
|
|
|
|
|
|
|
|
|
Authorized: 12,000,000 thousand shares |
|
|
|
|
|
|
|
|
|
|
Issued: 7,757,447 thousand shares |
|
77,574,465 |
|
17 |
|
77,574,465 |
|
17 |
|
|
Additional paid-in capital |
|
|
|
|
|
|
|
|
|
|
Capital surplus |
|
169,496,289 |
|
38 |
|
169,496,289 |
|
38 |
|
|
Donated capital |
|
13,170 |
|
— |
|
13,170 |
|
— |
|
|
Equity in additional paid-in capital reported by equity-method investees |
|
28,872 |
|
— |
|
10,675 |
|
— |
|
|
Total additional paid-in capital |
|
169,538,331 |
|
38 |
|
169,520,134 |
|
38 |
|
|
Retained earnings |
|
|
|
|
|
|
|
|
|
|
Legal reserve |
|
66,122,145 |
|
15 |
|
61,361,255 |
|
14 |
|
|
Special reserve |
|
2,675,894 |
|
1 |
|
2,675,894 |
|
1 |
|
|
Unappropriated earnings |
|
56,558,333 |
|
12 |
|
59,450,673 |
|
13 |
|
|
Total retained earnings |
|
125,356,372 |
|
28 |
|
123,487,822 |
|
28 |
|
|
Other adjustments |
|
|
|
|
|
|
|
|
|
|
Cumulative translation adjustments |
|
(73,603 |
) |
— |
|
(87,526 |
) |
— |
|
|
Unrecognized net loss of pension |
|
(38,106 |
) |
— |
|
(40,182 |
) |
— |
|
|
Unrealized gain on financial instruments |
|
178,880 |
|
— |
|
167,997 |
|
— |
|
|
Unrealized revaluation increment |
|
5,762,636 |
|
1 |
|
5,765,148 |
|
1 |
|
|
Total other adjustments |
|
5,829,807 |
|
1 |
|
5,805,437 |
|
1 |
|
|
|
|
|
|
|
|
|
|
|
|
|
Total equity attributable to stockholders of the parent |
|
378,298,975 |
|
84 |
|
376,387,858 |
|
84 |
|
|
|
|
|
|
|
|
|
|
|
|
|
MINORITY INTERESTS IN SUBSIDIARIES |
|
4,731,734 |
|
1 |
|
4,446,073 |
|
1 |
|
|
|
|
|
|
|
|
|
|
|
|
|
Total stockholders’ equity |
|
383,030,709 |
|
85 |
|
380,833,931 |
|
85 |
|
|
|
|
|
|
|
|
|
|
|
|
|
TOTAL |
|
$ |
449,394,805 |
|
100 |
|
$ |
445,573,349 |
|
100 |
|
The accompanying notes are an integral part of the consolidated financial statements.
(With Deloitte & Touche review report dated April 27, 2012)
3
CHUNGHWA TELECOM CO., LTD. AND SUBSIDIARIES
CONSOLIDATED STATEMENTS OF INCOME
THREE MONTHS ENDED MARCH 31, 2012 AND 2011
(Amounts in Thousands of New Taiwan Dollars, Except Earnings Per Share)
(Reviewed, Not Audited)
|
|
|
2012 |
|
2011 |
|
|
|
|
Amount |
|
% |
|
Amount |
|
% |
|
|
|
|
|
|
|
|
|
|
|
|
|
NET REVENUES (Note 28) |
|
$ |
55,418,294 |
|
100 |
|
$ |
52,475,031 |
|
100 |
|
|
|
|
|
|
|
|
|
|
|
|
|
OPERATING COSTS (Note 28) |
|
36,622,429 |
|
66 |
|
31,243,436 |
|
60 |
|
|
|
|
|
|
|
|
|
|
|
|
|
GROSS PROFIT |
|
18,795,865 |
|
34 |
|
21,231,595 |
|
40 |
|
|
|
|
|
|
|
|
|
|
|
|
|
OPERATING EXPENSES (Note 28) |
|
|
|
|
|
|
|
|
|
|
Marketing |
|
5,600,296 |
|
10 |
|
5,465,668 |
|
10 |
|
|
General and administrative |
|
1,006,461 |
|
2 |
|
994,778 |
|
2 |
|
|
Research and development |
|
858,193 |
|
2 |
|
826,942 |
|
2 |
|
|
|
|
|
|
|
|
|
|
|
|
|
Total operating expenses |
|
7,464,950 |
|
14 |
|
7,287,388 |
|
14 |
|
|
|
|
|
|
|
|
|
|
|
|
|
INCOME FROM OPERATIONS |
|
11,330,915 |
|
20 |
|
13,944,207 |
|
26 |
|
|
|
|
|
|
|
|
|
|
|
|
|
NON-OPERATING INCOME AND GAINS (Note 28) |
|
|
|
|
|
|
|
|
|
|
Interest income |
|
189,429 |
|
1 |
|
141,401 |
|
— |
|
|
Equity in earnings of equity method investees, net |
|
173,925 |
|
— |
|
63,587 |
|
— |
|
|
Gain on disposal of financial instruments, net |
|
49,058 |
|
— |
|
86,786 |
|
— |
|
|
Valuation gain on financial instruments, net |
|
16,602 |
|
— |
|
— |
|
— |
|
|
Gain on disposal of property, plant and equipment, net |
|
4,872 |
|
— |
|
318,479 |
|
1 |
|
|
Others |
|
97,689 |
|
— |
|
55,810 |
|
— |
|
|
|
|
|
|
|
|
|
|
|
|
|
Total non-operating income and gains |
|
531,575 |
|
1 |
|
666,063 |
|
1 |
|
|
|
|
|
|
|
|
|
|
|
|
|
NON-OPERATING EXPENSES AND LOSSES |
|
|
|
|
|
|
|
|
|
|
Foreign exchange loss, net |
|
5,748 |
|
— |
|
114,526 |
|
— |
|
|
Interest expense |
|
5,645 |
|
— |
|
8,633 |
|
— |
|
|
Valuation loss on financial instruments, net |
|
— |
|
— |
|
42,721 |
|
— |
|
|
Others |
|
18,224 |
|
— |
|
7,970 |
|
— |
|
|
|
|
|
|
|
|
|
|
|
|
|
Total non-operating expenses and losses |
|
29,617 |
|
— |
|
173,850 |
|
— |
|
|
|
|
|
|
|
|
|
|
|
|
|
INCOME BEFORE INCOME TAX |
|
11,832,873 |
|
21 |
|
14,436,420 |
|
27 |
|
|
|
|
|
|
|
|
|
|
|
|
|
INCOME TAX EXPENSE (Notes 2 and 25) |
|
1,954,566 |
|
3 |
|
2,318,990 |
|
4 |
|
|
|
|
|
|
|
|
|
|
|
|
|
CONSOLIDATED NET INCOME |
|
$ |
9,878,307 |
|
18 |
|
$ |
12,117,430 |
|
23 |
|
(Continued)
4
CHUNGHWA TELECOM CO., LTD. AND SUBSIDIARIES
CONSOLIDATED STATEMENTS OF INCOME
THREE MONTHS ENDED MARCH 31, 2012 AND 2011
(Amounts in Thousands of New Taiwan Dollars, Except Earnings Per Share)
(Reviewed, Not Audited)
|
|
|
2012 |
|
2011 |
|
|
|
|
Amount |
|
% |
|
Amount |
|
% |
|
|
|
|
|
|
|
|
|
|
|
|
|
ATTRIBUTABLE TO |
|
|
|
|
|
|
|
|
|
|
Stockholders of the parent |
|
$ |
9,489,503 |
|
17 |
|
$ |
11,834,866 |
|
23 |
|
|
Minority interests |
|
388,804 |
|
1 |
|
282,564 |
|
— |
|
|
|
|
|
|
|
|
|
|
|
|
|
|
|
$ |
9,878,307 |
|
18 |
|
$ |
12,117,430 |
|
23 |
|
|
|
|
2012 |
|
2011 |
|
|
|
|
Before
Income
Tax |
|
After
Income
Tax |
|
Before
Income
Tax |
|
After
Income
Tax |
|
|
|
|
|
|
|
|
|
|
|
|
|
EARNINGS PER SHARE (Note 26) |
|
|
|
|
|
|
|
|
|
|
Basic earnings per share |
|
$ |
1.46 |
|
$ |
1.22 |
|
$ |
1.79 |
|
$ |
1.50 |
|
|
Diluted earnings per share |
|
$ |
1.45 |
|
$ |
1.22 |
|
$ |
1.78 |
|
$ |
1.50 |
|
The accompanying notes are an integral part of the consolidated financial statements.
|
(With Deloitte & Touche review report dated April 27, 2012) |
|
(Concluded) |
5
CHUNGHWA TELECOM CO., LTD. AND SUBSIDIARIES
CONSOLIDATED STATEMENTS OF CASH FLOWS
THREE MONTHS ENDED MARCH 31, 2012 AND 2011
(Amounts in Thousands of New Taiwan Dollars)
(Reviewed, Not Audited)
|
|
|
2012 |
|
2011 |
|
|
|
|
|
|
|
|
|
CASH FLOWS FROM OPERATING ACTIVITIES |
|
|
|
|
|
|
Consolidated net income |
|
$ |
9,878,307 |
|
$ |
12,117,430 |
|
|
Adjustments to reconcile net income to net cash provided by operating activities: |
|
|
|
|
|
|
Provision for doubtful accounts |
|
11,391 |
|
42,539 |
|
|
Depreciation and amortization |
|
8,075,791 |
|
8,062,708 |
|
|
Amortization of premium of financial assets |
|
16,357 |
|
14,086 |
|
|
Gain on disposal of financial instruments, net |
|
(49,058 |
) |
(86,786 |
) |
|
Valuation loss (gain) on financial instruments, net |
|
(16,602 |
) |
42,721 |
|
|
Gain on disposal of property, plant and equipment, net |
|
(4,872 |
) |
(318,479 |
) |
|
Equity in earnings of equity method investees, net |
|
(173,925 |
) |
(63,587 |
) |
|
Deferred income taxes |
|
3,870 |
|
(61,699 |
) |
|
Changes in operating assets and liabilities: |
|
|
|
|
|
|
Decrease (increase) in: |
|
|
|
|
|
|
Financial assets held for trading |
|
27,401 |
|
35,008 |
|
|
Trade notes and accounts receivable |
|
315,192 |
|
(5,138,402 |
) |
|
Receivables from related parties |
|
423,917 |
|
486,244 |
|
|
Other monetary assets |
|
397,924 |
|
(490,922 |
) |
|
Inventories |
|
(168,132 |
) |
(1,166,933 |
) |
|
Other current assets |
|
(2,800,497 |
) |
(1,969,087 |
) |
|
Increase (decrease) in: |
|
|
|
|
|
|
Trade notes and accounts payable |
|
(1,600,956 |
) |
(2,670,970 |
) |
|
Payables to related parties |
|
(805,593 |
) |
(366,323 |
) |
|
Income tax payable |
|
1,935,670 |
|
2,360,272 |
|
|
Accrued expenses |
|
(3,521,523 |
) |
(2,511,269 |
) |
|
Other current liabilities |
|
1,118,010 |
|
1,367,196 |
|
|
Deferred income |
|
12,019 |
|
(1,019 |
) |
|
Accrued pension liabilities |
|
47,836 |
|
43,109 |
|
|
|
|
|
|
|
|
|
Net cash provided by operating activities |
|
13,122,527 |
|
9,725,837 |
|
|
|
|
|
|
|
|
|
CASH FLOWS FROM INVESTING ACTIVITIES |
|
|
|
|
|
|
Acquisition of designated financial assets at fair value through profit or loss |
|
(24,513 |
) |
(58,233 |
) |
|
Proceeds from disposal of designated financial assets at fair value through profit or loss |
|
34,767 |
|
22,323 |
|
|
Acquisition of available-for-sale financial assets |
|
(3,713,215 |
) |
(340,946 |
) |
|
Proceeds from disposal of available-for-sale financial assets |
|
443,360 |
|
414,786 |
|
|
Acquisition of held-to-maturity financial assets |
|
(1,411,766 |
) |
(1,978,103 |
) |
|
Proceeds from disposal of held-to-maturity financial assets |
|
1,000,629 |
|
300,000 |
|
|
Acquisition of financial assets carried at cost |
|
— |
|
(19,264 |
) |
|
Proceeds from disposal of financial assets carried at cost |
|
1,977 |
|
6,979 |
|
|
Acquisition of property, plant and equipment |
|
(6,689,309 |
) |
(4,376,298 |
) |
|
Proceeds from disposal of property, plant and equipment |
|
19,851 |
|
647,721 |
|
|
|
|
|
|
|
|
|
(Continued)
6
CHUNGHWA TELECOM CO., LTD. AND SUBSIDIARIES
CONSOLIDATED STATEMENTS OF CASH FLOWS
THREE MONTHS ENDED MARCH 31, 2012 AND 2011
(Amounts in Thousands of New Taiwan Dollars)
(Reviewed, Not Audited)
|
|
|
2012 |
|
2011 |
|
|
|
|
|
|
|
|
|
Increase in intangible assets |
|
$ |
(67,429 |
) |
$ |
(40,372 |
) |
|
Decrease in restricted assets |
|
— |
|
3,803 |
|
|
Decrease (increase) in other assets |
|
4,171 |
|
(609,128 |
) |
|
|
|
|
|
|
|
|
Net cash used in investing activities |
|
(10,401,477 |
) |
(6,026,732 |
) |
|
|
|
|
|
|
|
|
CASH FLOWS FROM FINANCING ACTIVITIES |
|
|
|
|
|
|
Decrease in short term bill payable |
|
— |
|
(199,919 |
) |
|
Repayment of long-term loans |
|
(26,536 |
) |
(27,211 |
) |
|
Decrease in customers’ deposits |
|
(80,018 |
) |
(65,027 |
) |
|
Increase (decrease) in other liabilities |
|
(65,051 |
) |
53,659 |
|
|
Capital reduction |
|
— |
|
(19,393,617 |
) |
|
Proceeds from exercise of employee stock option granted by subsidiary |
|
27,775 |
|
44,232 |
|
|
|
|
|
|
|
|
|
Net cash used in financing activities |
|
(143,830 |
) |
(19,587,883 |
) |
|
|
|
|
|
|
|
|
EFFECT OF EXCHANGE RATE CHANGES |
|
(27,880 |
) |
15,725 |
|
|
|
|
|
|
|
|
|
NET INCREASE (DECREASE) IN CASH AND CASH EQUIVALENTS |
|
2,549,340 |
|
(15,873,053 |
) |
|
|
|
|
|
|
|
|
CASH AND CASH EQUIVALENTS, BEGINNING OF PERIOD |
|
67,389,556 |
|
90,875,222 |
|
|
|
|
|
|
|
|
|
CASH AND CASH EQUIVALENTS, END OF PERIOD |
|
$ |
69,938,896 |
|
$ |
75,002,169 |
|
|
|
|
|
|
|
|
|
SUPPLEMENTAL INFORMATION |
|
|
|
|
|
|
Interest paid (excluding capitalized interest expense) |
|
$ |
7,956 |
|
$ |
13,537 |
|
|
Income tax paid |
|
$ |
21,359 |
|
$ |
15,595 |
|
|
|
|
|
|
|
|
|
NON-CASH FINANCING ACTIVITIES |
|
|
|
|
|
|
Current portion of long-term loans |
|
$ |
8,372 |
|
$ |
233,545 |
|
|
|
|
|
|
|
|
|
CASH AND NON-CASH INVESTING ACTIVITIES |
|
|
|
|
|
|
Increase in property, plant and equipment |
|
$ |
5,781,689 |
|
$ |
3,938,098 |
|
|
Payables to suppliers |
|
849,769 |
|
438,420 |
|
|
Prepayments for equipment |
|
57,851 |
|
(220 |
) |
|
|
|
$ |
6,689,309 |
|
$ |
4,376,298 |
|
(Continued)
7
CHUNGHWA TELECOM CO., LTD. AND SUBSIDIARIES
CONSOLIDATED STATEMENTS OF CASH FLOWS
THREE MONTHS ENDED MARCH 31, 2012 AND 2011
(Amounts in Thousands of New Taiwan Dollars)
(Reviewed, Not Audited)
InfoExplorer Co., Ltd. (“IFE”) merged with International Integrated System, Inc. and e-ToYou International, Inc. on April 1, 2011. After the merger, IFE became the surviving entity and was renamed as International Integrated System, Inc. (“IISI”). International Integrated System, Inc. and e-ToYou International, Inc. were dissolved. As IFE issued new shares for the aforementioned share swap, the following table presents the allocation of acquisition costs of International Integrated System Inc. and e-ToYou International Inc. to assets acquired and liabilities assumed based on their fair values:
|
Cash and cash equivalents |
|
$ |
46,592 |
|
|
Accounts receivables |
|
199,592 |
|
|
Financial assets at fair value through profit and loss |
|
38,073 |
|
|
Other current assets |
|
17,822 |
|
|
Long-term investments |
|
34,051 |
|
|
Property, plant, and equipment |
|
4,996 |
|
|
Refundable deposits |
|
43,553 |
|
|
Other assets |
|
4,472 |
|
|
Accounts payables |
|
(79,713 |
) |
|
Other current liabilities |
|
(25,145 |
) |
|
Other liabilities |
|
(38,480 |
) |
|
Common stock issued by IFE |
|
$ |
245,813 |
|
Chunghwa has lost control over International Integrated System Inc. (“IISI”) on June 24, 2011. The following table presents assets and liabilities of IISI based on their fair values:
|
Current assets (excluding cash) |
|
$ |
591,925 |
|
|
Long-term investments |
|
64,219 |
|
|
Property, plant, and equipment |
|
59,891 |
|
|
Intangible assets |
|
2,679 |
|
|
Other assets |
|
130,173 |
|
|
Current liabilities |
|
(276,356 |
) |
|
Other liabilities |
|
(102,917 |
) |
|
Net assets |
|
(628,912 |
) |
|
Cash balance upon deconsolidation |
|
$ |
(159,298 |
) |
The accompanying notes are an integral part of the consolidated financial statements.
|
(With Deloitte & Touche review report dated April 27, 2012) |
|
(Concluded) |
8
CHUNGHWA TELECOM CO., LTD. AND SUBSIDIARIES
NOTES TO CONSOLIDATED FINANCIAL STATEMENT
FOR THE THREE MONTHS ENDED MARCH 31, 2012 AND 2011
(Amounts in Thousands of New Taiwan Dollars, Unless Stated Otherwise)
(Reviewed, Not Audited)
1. GENERAL
Chunghwa Telecom Co., Ltd. (“Chunghwa”) was incorporated on July 1, 1996 in the Republic of China (“ROC”) pursuant to the Article 30 of the Telecommunications Act. Chunghwa is a company limited by shares and, prior to August 2000, was wholly owned by the Ministry of Transportation and Communications (“MOTC”). Prior to July 1, 1996, the current operations of Chunghwa were carried out under the Directorate General of Telecommunications (“DGT”). The DGT was established by the MOTC in June 1943 to take primary responsibility in the development of telecommunications infrastructure and to formulate policies related to telecommunications. On July 1, 1996, the telecom operations of the DGT were spun-off to as Chunghwa which continues to carry out the business and the DGT continues to be the industry regulator.
As the dominate telecommunications service provider of fixed-line and Global System for Mobile Communications (“GSM”) in the ROC, Chunghwa is subject to additional regulations imposed by ROC.
Effective August 12, 2005, the MOTC had completed the process of privatizing Chunghwa by reducing the government ownership to below 50% in various stages. In July 2000, Chunghwa received approval from the Securities and Futures Commission (the “SFC”) for a domestic initial public offering and its common shares were listed and traded on the Taiwan Stock Exchange (the “TSE”) on October 27, 2000. Certain of Chunghwa’s common shares had been sold, in connection with the foregoing privatization plan, in domestic public offerings at various dates from August 2000 to July 2003. Certain of Chunghwa’s common shares had also been sold in an international offering of securities in the form of American Depository Shares (“ADS”) on July 17, 2003 and were listed and traded on the New York Stock Exchange (the “NYSE”). The MOTC sold common shares of Chunghwa by auction in the ROC on August 9, 2005 and completed the second international offering on August 10, 2005. Upon completion of the share transfers associated with these offerings on August 12, 2005, the MOTC owned less than 50% of the outstanding shares of Chunghwa and completed the privatization plan.
Senao International Co., Ltd. (“SENAO”) was incorporated in 1979. SENAO has been listed on the Taiwan Stock Exchange under the number “2450” since May 2001. SENAO engages mainly in selling and maintaining mobile phones and its peripheral products. Chunghwa acquired 31.33% shares of SENAO on January 15, 2007 and has substantial control in SENAO by obtaining half of the seats of the board of directors of SENAO on April 12, 2007. At general annual stockholder meeting of SENAO in June 2010, Chunghwa continued to maintain control of a majority of the board of directors through the continued support of other shareholder. The Company’s equity ownership of SENAO decreased from 31.33% as of January 15, 2007 to 28.33% as of March 31, 2012 due to the exercise of options by employees that were previously granted before 2007.
Senao International (Samoa) Holding Ltd. (“SIS”) was established by SENAO in 2009. SIS engages mainly in international investment activities.
Senao International HK Limited (“SIHK”) was established by SIS in 2009. SIHK engages mainly in international investment activities.
Senao Trading (Fujian) Co., Ltd. (“STF”) was established by SIHK in 2011. STF engages mainly in sale of information and communication technology services.
9
Senao International Trading (Shanghai) Co., Ltd. (“SITS”) was established by SIHK in 2011. SITS engages mainly in sale of information and communication technology services.
Senao International Trading (Shanghai) Co., Ltd. (“SEITS”) was established by SIHK in 2011. SEITS engages mainly in provision of information and communication maintenance services.
The English name is the same as the above entity; however, the Chinese names included in the respective Articles of Incorporations are different.
Senao International Trading (Jiangsu) Co., Ltd. (“SITJ”) was established by SIHK in 2011. SITJ engages mainly in sale of information and communication technology services.
Chunghwa established Chunghwa International Yellow Pages Co., Ltd. (“CIYP”) in January 2007. CIYP engages mainly in yellow pages sales and advertisement services.
CHIEF Telecom Inc. (“CHIEF”) was incorporated in 1991. CHIEF engages mainly in internet communication and internet data center (“IDC”) service. Chunghwa acquired 70% shares of CHIEF on September 2006.
Unigate Telecom Inc. (“Unigate”) was established by CHIEF in 1999. Unigate engages mainly in telecommunication and information software service.
Chief International Corp. (“CIC”) was established by CHIEF in 2008. CIC engages mainly in internet communication and internet data center (“IDC”) services.
Chunghwa System Integration Co., Ltd. (“CHSI”) was incorporated in 2002. CHSI engages mainly in providing communication and information integration services. Chunghwa acquired 100% shares of CHSI in December 2007.
Concord Technology Co., Ltd. (“Concord”), a subsidiary of CHSI, was incorporated in 2006. Concord engages mainly in investment activities.
Glory Network System Service (Shanghai) Co., Ltd. (“GNSS (Shanghai)”), a subsidiary of Concord, was incorporated in 2006. GNSS (Shanghai) engages mainly in planning and designing of systems and communications and information integration services.
Chunghwa Telecom Global, Inc. (“CHTG”) was incorporated in 2004. CHTG engages mainly in international data and internet services and long distance call wholesales to carriers. Chunghwa acquired 100% shares of CHTG in December 2007.
Donghwa Telecom Co., Ltd. (“DHT”) was incorporated in 2004. DHT engages mainly in international telecommunications, IP fictitious internet and internet transfer services. Chunghwa acquired 100% shares of DHT in December 2007.
Spring House Entertainment Inc. (“SHE”) was incorporated in 2000. SHE engages mainly in network services, producing digital entertainment contents and broadband visual sound terrace development. Chunghwa obtained control interest over it in January 2008.
Ceylon Innovation Co., Ltd. (“CEI”) was established by SHE in April 2011. CEI engages mainly in international trade, general advertisement and book publishing service.
Chunghwa established Light Era Development Co., Ltd. (“LED”) in January 2008. LED engages mainly in development of property for rent and sale.
10
Yao Yong Real Property Co., Ltd. (“YYRP”) was incorporated in 2002. YYRP engages mainly in real estate management and leasing business. LED acquired 100% ownership interest of YYRP on March 1, 2010.
Chunghwa established Chunghwa Telecom Singapore Pte. Ltd. (“CHTS”) in July 2008, CHTS engages mainly in telecommunication wholesale, internet transfer services, international data, long distance call wholesales to carriers and the world satellite business.
Chunghwa established Chunghwa Telecom Japan Co., Ltd. (“CHTJ”) in October 2008. CHTJ engages mainly in telecommunication business, information processing and information providing service, development and sale of software and consulting services in telecommunication.
InfoExplorer Co., Ltd. (“IFE”) issued new shares as the consideration to merge with International Integrated System, Inc. and e-ToYou International, Inc. on April 1, 2011. After the merger, IFE became the surviving entity and was renamed as International Integrated System, Inc. (“IISI”). International Integrated System, Inc. and e-ToYou International, Inc. were dissolved. As a result of the additional shares being issued by IFE in connection with this transaction, Chunghwa’s ownership interest in IISI decreased from 49% to 33% after the merger, and after the stockholders’ meeting of IISI on June 24, 2011, Chunghwa lost control of the board of directors.
Chunghwa Investment Co., Ltd. (“CHI”) was established in 2002. CHI engages mainly in professional investing in telecommunication business, and telecommunication valued-added services. CHI was equity-method investee of the parent company. Chunghwa acquired over 50% shares of CHI on September 2009.
Chunghwa Precision Test Tech. Co., Ltd. (“CHPT”) was established in 2005 as the subsidiary of CHI. CHPT engages mainly in production and marketing in semiconductor testers and printed circuit board.
Chunghwa Precision Test Tech. USA Corporation (“CHPT (US)”) was established by CHPT in 2010. CHPT (US) engages mainly in production and marketing in semiconductor testers and printed circuit boards.
Chunghwa Investment Holding Co., Ltd. (“CIHC”) was established by CHI in 2004. CIHC engages mainly in investment activities.
CHI One Investment Co., Ltd. (“COI”) was established by CIHC in 2009. COI engages mainly in investment activities.
Chunghwa has established New Prospect Investments Holdings Ltd. (“New Prospect”) in March 2006. The holding company is operating as investment company and Chunghwa has 100% ownership interest in an amount of US$1 in the holding company as of March 31, 2012.
Chunghwa has established Prime Asia Investments Group Ltd. (“Prime Asia”) in March 2006. This holding company is operating as an investment company.
Chunghwa Hsingta Company Ltd. (“CHC”) was established by Prime Asia in December 2010. CHC engages mainly in investment activities.
Chunghwa Telecom (China) Co., Ltd. (“CTC”) was established by CHC in March 2011. CTC engages mainly in energy conserving and providing services of planning, design, and integration of information systems.
Jiangsu Zhenhua Information Technology Company, LLC. (“JZIT”) was established by CHC and Zhenjiang New Area Hi-Tech Industrial Investment Co., Ltd. in January 2012. JZIT engages mainly in intelligent energy networks (iEN) and incorporating iEN into buildings.
11
Chunghwa has established Chunghwa Telecom Vietnam Co., Ltd. (“CHTV”) in May 2011. CHTV engages mainly in providing information and communications technology, international private leased circuit, and intelligent energy network services.
Chunghwa and Sochamp Technology Inc. established a joint venture, Chunghwa Sochamp Technology Inc. (“CHST”), in July 2011. CHST mainly engages in license plate recognition system.
Chunghwa and United Daily News established a joint venture, Smartfun Digital Co., Ltd. (“SFD”), in August 2011. SFD mainly engages in sales of educational software which provides digital parenting education.
As of March 31, 2012 and 2011, the Company had 29,113 and 28,243 employees, respectively.
The following diagram presents information regarding the relationship and ownership percentages between Chunghwa and its subsidiaries as of March 31, 2012:
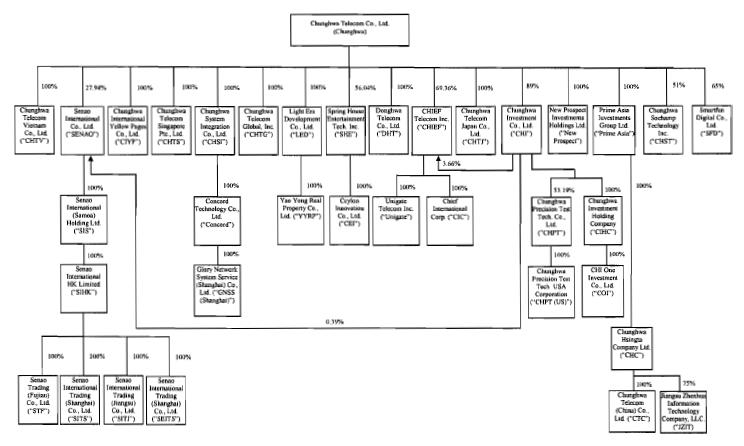
Chunghwa together with its subsidiaries are hereinafter referred to collectively as the “Company”. Minority interests in the aforementioned subsidiaries are presented as a separate component of stockholders’ equity.
2. SUMMARY OF SIGNIFICANT ACCOUNTING POLICIES
The accompanying consolidated financial statements were prepared in conformity with the Guidelines Governing the Preparation of Financial Reports by Securities Issuers and accounting principles generally accepted in the ROC (“ROC GAAP”). The significant accounting policies are summarized as follows:
12
Principle of Consolidation
The Company accounts for business combinations in accordance with the requirements of the Statement of Financial Accounting Standards No. 25, “Business Combinations”.
The accompanying consolidated financial statements include the accounts of all directly and indirectly majority owned subsidiaries of the Company, and the accounts of investees in which the Company’s ownership percentage is less than 50% but over which the Company has a controlling interest. All significant intercompany transactions and balances are eliminated upon consolidation.
The consolidated financial statements for the three months ended March 31, 2012 include the accounts of Chunghwa, SENAO, SIS, SIHK, STF, SITS, SEITS, SITJ, CIYP, CHIEF, Unigate, CIC, CHSI, Concord, GNSS (Shanghai), CHTG, DHT, SHE, CEI, LED, YYRP, CHTS, CHTJ, CHI, CHPT, CHPT (US), CIHC, COI, New Prospect, Prime Asia, CHC, CTC, JZIT, CHTV, CHST, and SFD. The consolidated financial statements for the three months ended March 31, 2011 include the accounts of Chunghwa, SENAO, SIS, SIHK, STF, SITS, SITJ, CIYP, CHIEF, Unigate, CIC, CHSI, Concord, GNSS (Shanghai), CHTG, DHT, SHE, LED, YYRP, CHTS, CHTJ, IISI, IESA, IEHK, CHI, CHPT, CHPT (US), CIHC, COI, New Prospect, Prime Asia, CHC and CTC.
For foreign subsidiaries using their local currency as their functional currency, assets and liabilities are translated into New Taiwan dollars at the exchange rates in effect on the balance sheet date; stockholders’ equity accounts are translated into New Taiwan dollars at historical exchange rates and income statement accounts are translated into New Taiwan dollars at average exchange rates during the period.
The consolidated financial statements as of and for the three months ended March 31, 2012 and 2011 of the following subsidiaries have not been reviewed: CIYP, CHIEF, Unigate, CIC, CHSI, Concord, GNSS (Shanghai), CHTG, DHT, SHE, CEI, LED, YYRP, CHTS, CHTJ, CHI, CHPT, CHPT (US), CIHC, COI, New Prospect, Prime Asia, CHC, CTC, JZIT, CHTV, CHST and SFD, as of and for the three months ended March 31, 2012. CIYP, CHIEF, Unigate, CIC, CHSI, Concord, GNSS (Shanghai), CHTG, DHT, SHE, LED, YYRP, CHTS, CHTJ, IISI, IESA, IEHK, CHI, CHPT, CHPT (US), CIHC, COI, New Prospect, Prime Asia, CHC, and CTC, as of and for the three months ended March 31, 2011. The total assets of these subsidiaries were 3.43% ($15,412,474 thousand) and 3.43% ($15,290,879 thousand), and the total liabilities of these subsidiaries were 7.64% ($5,068,890 thousand) and 9.96% ($6,450,737 thousand), of the related consolidated amounts as of March 31, 2012 and 2011, respectively. The total revenues of these subsidiaries were 3.17% ($1,757,410 thousand) and 2.02% ($1,058,007 thousand) of the related consolidated revenues for the three months ended March 31, 2012 and 2011, respectively, and their net losses were $3,453 thousand and $8,788 thousand for the three months ended March 31, 2012 and 2011, respectively.
Foreign-currency Transactions
Foreign-currency transactions other than derivative contracts are recorded in New Taiwan dollars at the rates of exchange in effect when the transactions occur. Exchange gains or losses derived from foreign-currency transactions or monetary assets and liabilities denominated in foreign currencies are recognized in earnings. At the balance sheet date, monetary assets and liabilities denominated in foreign currencies are revalued at prevailing exchange rates with the resulting gains or losses recognized in earnings.
At the balance sheet date, foreign-currency nonmonetary assets (such as equity instruments) and liabilities that are measured at fair value are revalued using prevailing exchange rates. When a gain or loss on a nonmonetary item is recognized in stockholders’ equity, any exchange component of that gain or loss shall be recognized in stockholders’ equity. Conversely, when a gain or loss on a non-monetary item is recognized in earnings, any exchange component of that gain or loss shall be recognized in earnings.
Foreign-currency nonmonetary assets and liabilities that are carried at cost continue to be stated at exchange rates at trade dates.
13
The financial statements of foreign equity investees and consolidated subsidiaries are translated into New Taiwan dollars at the following exchange rates. Assets and liabilities - spot rates at period-end; stockholders’ equity - historical rates, income and expenses - average rates during the period.
The resulting translation adjustments of financial statements shall be recorded as cumulative translation adjustments, a separate component of stockholders’ equity.
Accounting Estimates
Under above guidelines, law and principles, certain estimates and assumptions have been used for the allowance for doubtful accounts, allowance for loss on inventories, depreciation of property, plant and equipment, impairment of assets, bonuses to employees, directors and supervisors, pension cost, income tax, etc. Actual results may differ from these estimates.
Current and Noncurrent Assets and Liabilities
Current assets include cash and cash equivalents, and those assets held primarily for trading purposes or to be realized, sold or consumed within one year from the balance sheet date. All other assets are classified as noncurrent. Current liabilities are obligations incurred for trading purposes or to be settled within one year from the balance sheet date. All other liabilities are classified as noncurrent.
LED engages mainly in development of property for rent and sale. The assets and liabilities of LED related to property development within its operating cycle, which is over one year, are classified as current items. Assets and liabilities related to property development over its operating cycle are classified as noncurrent items.
Cash Equivalents
Cash equivalents are commercial paper purchased with maturities of three months or less from the date of acquisition. The carrying amount approximates fair value.
Financial Assets and Liabilities at Fair Value Through Profit or Loss
Financial instruments classified as financial assets or financial liabilities at fair value through profit or loss (“FVTPL”) include financial assets or financial liabilities held for trading and are designated as at FVTPL on initial recognition. The Company recognizes a financial asset or a financial liability when the Company becomes a party to the contractual provisions of the financial instrument. A financial asset is derecognized when the Company losses control of its contractual rights over the financial asset. A financial liability is derecognized when the obligation specified in the relevant contract is discharged, cancelled or expired.
Financial instruments at FVTPL are initially measured at fair value. Transaction costs directly attributable to the acquisition of financial assets or financial liabilities at FVTPL are recognized as expenses as incurred. Financial assets or financial liabilities at FVTPL are remeasured at fair value, subsequently with changes in fair value recognized in earnings. Cash dividends received subsequently (including those received in the period of investment) are recognized as income. On derecognition of a financial asset or a financial liability, the difference between its carrying amount and the sum of the consideration received and receivable or consideration paid and payable is recognized in earnings. Regular way purchases or sales of financial assets are accounted for using trade date accounting.
Derivatives that do not meet the criteria for hedge accounting are classified as financial assets or financial liabilities held for trading. When the fair value is positive, the derivative is recognized as a financial asset; when the fair value is negative, the derivative is recognized as a financial liability.
14
Fair values of financial assets and financial liabilities at the balance sheet date are determined as follows: Forward exchange contracts and currency swap contracts are estimated by valuation techniques; index future contracts are determined at their market quotation on the balance sheet date; bonds are based on prices quoted by GreTai Securities Market (GTSM).
Available-for-sale Financial Assets
Available-for-sale financial assets are initially recognized at fair value plus transaction costs that are directly attributable to the acquisition. Changes in fair value from subsequent remeasurement are reported as a separate component of stockholders’ equity. The corresponding accumulated gains or losses are recognized in earnings when the financial asset is derecognized from the balance sheet. A regular way purchase or sale of financial assets is accounted for using trade date accounting.
The recognition and derecognition of available-for-sale financial assets are the same with those of financial assets at FVTPL.
Fair values are determined as follows: Listed stocks - at closing prices at the balance sheet date; open-end mutual funds - at net asset values at the balance sheet date; bonds - quoted at prices provided by the Taiwan GreTai Securities Market; and financial assets and financial liabilities without quoted prices in an active market - at values determined using valuation techniques.
Cash dividends are recognized in earnings on the ex-dividend date, except for the dividends declared before acquisition which are treated as a reduction of investment cost. Stock dividends are recorded as an increase in the number of shares and do not affect investment income. The total number of shares subsequent to the increase of stock dividends is used to recalculate cost per share. The difference between the initial carrying amount of a debt instrument and its maturity amount is amortized using the effective interest method, with the amortized interest recognized in profit or loss.
An impairment loss is recognized when there is objective evidence that the financial asset is impaired. If, in a subsequent period, the amount of the impairment loss decreases, for equity securities, the previously recognized impairment loss is reversed to the extent of the decrease and recorded as an adjustment to stockholders’ equity; for debt securities, the amount of the decrease is recognized in earnings, provided that the decrease is clearly attributable to an event which occurred after the impairment loss was recognized.
Held-to-maturity Financial Assets
Held-to-maturity financial assets are carried at amortized cost using the effective interest method. Those financial assets are initially recognized at fair value plus transaction costs that are directly attributable to the acquisition. Gains and losses are recognized at the time of derecognition, impairment or amortization. A regular way purchase or sale of financial assets is accounted for using trade date accounting.
If there is objective evidence which indicates that a financial asset is impaired, a loss is recognized. If, in a subsequent period, the amount of the impairment loss decreases and the decrease is clearly attributable to an event which occurred after the impairment loss was recognized, the previously recognized impairment loss is reversed to the extent of the decrease. The reversal may not result in a carrying amount that exceeds the amortized cost that would have been determined as if no impairment loss had been recognized.
Financial Assets Carried at Cost
Investments in equity instruments with no quoted prices in an active market and with fair values that cannot be reliably measured, such as non-publicly traded stocks and stocks traded in the Emerging Stock Market, are measured at their original cost. The accounting treatment for dividends on financial assets carried at cost is the same with that for dividends on available-for-sale financial assets. An impairment loss is recognized when there is objective evidence that the asset is impaired. A reversal of this impairment loss is disallowed.
15
Impairment of Accounts Receivable
An allowance for doubtful accounts is provided on the basis of a review of the collectibility of accounts receivable before January 1, 2011. The Company assesses the probability of collections of accounts receivable by examining the aging analysis of the outstanding receivables and assessing the value of the collateral provided by customers.
On January 1, 2011, the Company adopted the third-time revised Statement of Financial Accounting Standards (SFAS) No. 34, “Financial Instruments: Recognition and Measurement.” One of the main revisions is that the impairment of receivables originated by the Company should be covered by SFAS No. 34. Accounts receivable are assessed for impairment at the end of each reporting period and considered to be impaired when there is objective evidence that, as a result of one or more events that occurred after the initial recognition of the accounts receivable, the estimated future cash flows of the asset have been affected.
The amount of the impairment loss recognized is the difference between the asset carrying amount and the present value of estimated future cash flows, after taking into account the related collateral and guarantees, discounted at the receivable’s original effective interest rate.
The carrying amount of the accounts receivable is reduced through the use of an allowance account.
Inventories
Inventories including merchandise and work-in-process are stated at the lower of cost (weighted-average cost) or net realizable value item by item, except for those that may be appropriate to group items of similar or related inventories. Net realizable value is the estimated selling price of inventories less all estimated costs of completion and costs necessary to make the sale. The calculation of the cost of inventory is derived using the weighted-average method.
Buildings and Lands Consigned to Constructing Firm
Inventories of LED are stated at the lower of cost or net realizable value item by item, except for those that may be appropriate to group as similar items or related inventories. Land acquired before construction is classified as land held for development, and then reclassified as land held under development after LED begins its construction project. Prepayments for licensing and other miscellaneous costs have been capitalized as part of inventory.
When using the completed-contract method for its construction projects, LED recognizes the proceeds from customers as advances from customers for land and building before the construction project is completed. After completion of the construction project and ownership is transferred to the customers, LED recognizes the relevant revenues.
When using percentage-of-completion method, profits are recorded based on LED’s estimates of the percentage of completion of individual contracts, commencing when the work performed under the contracts reaches a point where the final costs can be estimated with reasonable accuracy. Changes in job performance, job conditions and estimated profitability may result in revisions to costs and income and are recognized in the period in which the revisions are determined. If the current estimates of total contract revenue and contract cost indicate a loss, a provision for the entire loss on the contract is recorded in the period in which it becomes evident.
The percentage of completion is measured based on the completion of the contract milestones predetermined by the architects and engineers. Construction in progress is stated at cost plus (less) amounts associated with estimated profit (loss) recognized on the basis of the percentage-of-completion method.
16
Investments Accounted for Using Equity Method
Investments in companies in which the Company exercises significant influence over the operating and financial policy decisions are accounted for by the equity method. Under the equity method, the investment is initially stated at cost and subsequently adjusted for its proportionate share in the net earnings of the investee companies. Any cash dividends received are recognized as a reduction in the carrying value of the investments.
Gains or losses on sales from the Company to equity method investees wherein Chunghwa exercises significant influence over these equity method investees are deferred in proportion to the Company’s ownership percentage in the investees until such gains or losses are realized through transactions with third parties. Gains or losses on sales from equity method investees to Chunghwa are deferred in proportion to Chunghwa’s ownership percentages in the investees until they are realized through transactions with third parties.
When the Company subscribes for additional investees shares at a percentage different from its existing ownership percentage, the resulting carrying amount of the investment in the investee differs from the amount of the Company’s share of the investee’s equity. The Company records such a difference as an adjustment to long-term investments with the corresponding amount charged or credited to additional paid-in capital to the extent available, with the balance charged to retained earnings.
Property, Plant and Equipment
Property, plant and equipment are stated at cost plus a revaluation increment, if any, less accumulated depreciation and accumulated impairment loss. The interest costs that are directly attributable to the acquisition, construction of a qualifying asset are capitalized as property, plant and equipment. Major renewals and betterments are capitalized, while maintenance and repairs are expensed as incurred.
When an indication of impairment is identified, any excess of the carrying amount of an asset over its recoverable amount is recognized as a loss. If the recoverable amount increases in a subsequent period, the amount previously recognized as impairment would be reversed and recognized as a gain. However, the adjusted amount may not exceed the carrying amount that would have been determined, net of depreciation, as if no impairment loss had been recognized.
An impairment loss on a revalued asset is charged to “unrealized revaluation increment” under equity to the extent available, with the balance recognized as a loss in earnings. If the recoverable amount increases in a subsequent period, the amount previously recognized as impairment loss could be reversed and recognized as a gain, with the remaining credited to “unrealized revaluation increment”.
Depreciation expense is computed using the straight-line method over the following estimated service lives: land improvements - 10 to 30 years; buildings - 3 to 60 years; computer equipment - 2 to 15 years; telecommunication equipment - 3 to 20 years; transportation equipment - 3 to 10 years; and miscellaneous equipment - 2 to 12 years.
Upon sale or disposal of property, plant and equipment, the related cost, accumulated depreciation, accumulated impairment losses and any unrealized revaluation increment are deducted from the corresponding accounts, and any gain or loss is recorded as non-operating gains or losses in the period of sale or disposal.
Intangible Assets
Intangible assets mainly include 3G Concession, computer software, patents and goodwill.
17
The 3G Concession is valid through December 31, 2018. The 3G Concession fee is amortized on a straight-line basis from the date operations commence through the date the license expires. Computer software costs and patents are amortized using the straight-line method over the estimated useful lives of 2 to 20 years.
When an indication of impairment is identified for intangible assets other than goodwill, any excess of the carrying amount of an asset over its recoverable amount is recognized as a loss. If the recoverable amount increases in a subsequent period, the amount previously recognized as impairment would be reversed and recognized as a gain. However, the adjusted amount may not exceed the carrying amount that would have been determined, as if no impairment loss had been recognized.
Goodwill represents the excess of the consideration paid for business acquisition over the fair value of identifiable net assets acquired. Goodwill is tested for impairment annually. If an event occurs or circumstances change which indicates that the fair value of goodwill is below its carrying amount, an impairment loss is recognized. A subsequent reversal of such impairment loss is not allowed.
Idle Assets
Idle assets are carried at the lower of recoverable amount or carrying amount.
Pension Costs
Pension cost under a defined benefit plan is determined by actuarial valuations. Contributions made under a defined contribution plan are recognized as pension cost during the year in which employees render services.
Income Tax
The Company applies inter-period allocations for its income tax, whereby deferred income tax assets and liabilities are recognized for the tax effects of temporary differences and unused tax credits. Valuation allowances are provided to the extent, if any, that it is more likely than not that deferred income tax assets will not be realized. A deferred tax asset or liability is classified as current or noncurrent in accordance with the classification of its related asset or liability. However, if a deferred tax asset or liability does not relate to an asset or liability in the financial statements, then it is classified as either current or noncurrent based on the expected length of time before it is realized or settled.
Any tax credits arising from purchases of machinery, equipment and technology, research and development expenditures, personnel training, and investments in important technology based enterprises are recognized using the flow-through method.
Adjustments of prior years’ tax liabilities are added to or deducted from the current year’s tax provision.
Income taxes (10%) on undistributed earnings is recorded in the year of stockholders approval which is the year subsequent to the year the earnings are generated.
Share-based Compensation
Employee stock options granted on or after January 1, 2008 are accounted for using fair value method in accordance with SFAS No. 39, “Accounting for Share-based Payment.” The adoption of SFAS No. 39 did not have any impact on the Company.
18
Employee stock options granted between January 1, 2004 and December 31, 2007 were accounted for under the interpretations issued by the Accounting Research and Development Foundation (the “ARDF”). The Company adopted the intrinsic value method, under which compensation cost was amortized over the vesting period.
Revenue Recognition
Revenues are recognized when they are realized or realizable and earned. Revenues are realized or realizable and earned when the Company has persuasive evidence of an arrangement, the goods have been delivered or the services have been rendered to the customer, the sales price is fixed or determinable and collectibility is reasonably assured.
Revenue is measured at the fair value of the consideration received or receivable and represents amounts agreed between the Company and the customers for goods sold in the normal course of business, net of sales discounts and volume rebates. For trade receivables due within one year from the balance sheet date, as the nominal value of the consideration to be received approximates its fair value and transactions are frequent, fair value of the consideration is not determined by discounting all future receipts using an imputed rate of interest.
Usage revenues from fixed-line services (including local, domestic long distance and international long distance), cellular services, internet and data services, and interconnection and call transfer fees from other telecommunications companies and carriers are billed in arrears and are recognized based upon minutes of traffic processed when the services are provided in accordance with contract terms.
Other revenues are recognized as follows: (a) one-time subscriber connection fees (on fixed-line services) are deferred and recognized over the average expected customer service periods, (b) monthly fees (on fixed-line, mobile, Internet and data services) are accrued every month, and (c) prepaid services (fixed-line, mobile, Internet and data services) are recognized as income based upon actual usage by customers or when the right to use those services expires.
Where the Company enters into transactions which involve both the provision of air time bundled with products such as 3G data card and handset, total consideration received from handsets in these arrangements are allocated and measured using units of accounting within the arrangement based on relative fair values limited to the amount that is not contingent upon the delivery of other items or services.
Where the Company sells products to third party cellular phone stores the Company records the direct sale of the products, typically handsets, as gross revenue when the Company is the primary obligor in the arrangement and when title is passed and the products are accepted by the stores.
Expense Recognition
The costs of providing services and operating expenses are recognized as incurred.
3. EFFECT OF CHANGES IN ACCOUNTING PRINCIPLES
The Company adopted the newly-revised Statements of Financial Accounting Standards No. 34, “Financial Instruments,” (“SFAS No. 34”) beginning from January 1, 2011. When an enterprise adopts the revised provisions, the initial recognition of loans and receivables shall be accounted for under SFAS No. 34.
19
4. CASH AND CASH EQUIVALENTS
|
|
|
March 31 |
|
|
|
|
2012 |
|
2011 |
|
|
|
|
|
|
|
|
|
Cash |
|
|
|
|
|
|
Cash on hand |
|
$ |
192,895 |
|
$ |
188,523 |
|
|
Bank deposits |
|
5,925,151 |
|
6,664,255 |
|
|
Negotiable certificate of deposit, annual yield rate - ranging from 0.70%-1.05% and 0.63%-0.72% for 2012 and 2011, respectively. |
|
43,897,632 |
|
53,250,000 |
|
|
|
|
50,015,678 |
|
60,102,778 |
|
|
Cash equivalents |
|
|
|
|
|
|
Commercial paper, annual yield rate - ranging from 0.70%-0.80% and 0.45%-0.57% for 2012 and 2011, respectively. |
|
19,923,218 |
|
14,899,391 |
|
|
|
|
|
|
|
|
|
|
|
$ |
69,938,896 |
|
$ |
75,002,169 |
|
5. FINANCIAL ASSETS AND LIABILITIES AT FAIR VALUE THROUGH PROFIT OR LOSS
|
|
|
March 31 |
|
|
|
|
2012 |
|
2011 |
|
|
|
|
|
|
|
|
|
Derivatives - financial assets |
|
|
|
|
|
|
Currency swap contracts |
|
$ |
18,674 |
|
$ |
645 |
|
|
Forward exchange contracts |
|
31 |
|
— |
|
|
Designated financial assets at fair value through profit or loss |
|
18,705 |
|
645 |
|
|
Convertible bonds |
|
46,318 |
|
78,798 |
|
|
|
|
|
|
|
|
|
|
|
$ |
65,023 |
|
$ |
79,443 |
|
|
|
|
|
|
|
|
|
Derivatives - financial liabilities |
|
|
|
|
|
|
Currency swap contracts |
|
$ |
517 |
|
$ |
6,348 |
|
|
Forward exchange contracts |
|
255 |
|
760 |
|
|
Index future contracts |
|
31 |
|
481 |
|
|
|
|
|
|
|
|
|
|
|
$ |
803 |
|
$ |
7,589 |
|
The Company entered into currency swap contracts, forward exchange contracts and index future contracts to reduce its exposure to foreign currency risk and variability in operating results due to fluctuations in exchange rates and stock prices. However, the aforementioned derivatives did not meet the criteria for hedge accounting and were classified as financial assets or financial liabilities held for trading.
Outstanding currency swap contracts and forward exchange contracts as of March 31, 2012 and 2011:
|
|
|
|
|
|
|
Contract Amount |
|
|
|
|
Currency |
|
Maturity Period |
|
(In Thousands) |
|
|
|
|
|
|
|
|
|
|
|
March 31, 2012 |
|
|
|
|
|
|
|
|
|
|
|
|
|
|
|
|
|
Currency swap contracts |
|
US$/NT$ |
|
2012.04-2012.06 |
|
US$55,000/NT$1,641,726 |
|
|
Currency swap contracts |
|
US$/NT$ |
|
2012.05-2012.06 |
|
US$12,000/NT$353,495 |
|
|
Forward exchange contracts - buy |
|
NT$/US$ |
|
2012.04 |
|
NT$310,184/US$10,500 |
|
(Continued)
20
|
|
|
|
|
|
|
Contract Amount |
|
|
|
|
Currency |
|
Maturity Period |
|
(In Thousands) |
|
|
March 31, 2011 |
|
|
|
|
|
|
|
|
|
|
|
|
|
|
|
|
|
Currency swap contracts |
|
US$/NT$ |
|
2011.04-2012.05 |
|
US$23,000/NT$670,586 |
|
|
Currency swap contracts |
|
US$/NT$ |
|
2011.06 |
|
US$5,000/NT$147,663 |
|
|
Forward exchange contracts - buy |
|
NT$/US$ |
|
2011.04 |
|
NT$347,760/US$11,800 |
|
(Concluded)
Outstanding index future contracts on March 31, 2012 and 2011 were as follows:
|
|
|
|
|
|
|
Contract |
|
|
|
|
|
|
|
|
Amount |
|
|
|
|
Maturity Period |
|
Units |
|
(In Thousands) |
|
|
March 31, 2012 |
|
|
|
|
|
|
|
|
|
|
|
|
|
|
|
|
|
|
|
TAIFEX futures |
|
|
|
|
|
|
|
|
|
TX |
|
2012.04 |
|
6 |
|
|
NT$ |
9,463 |
|
|
TX |
|
2012.06 |
|
34 |
|
|
NT$ |
53,664 |
|
|
TE |
|
2012.04 |
|
9 |
|
|
NT$ |
10,849 |
|
|
TF |
|
2012.04 |
|
5 |
|
|
NT$ |
77,965 |
|
|
|
|
|
|
|
|
|
|
|
|
|
March 31, 2011 |
|
|
|
|
|
|
|
|
|
|
|
|
|
|
|
|
|
|
|
|
|
TAIFEX futures |
|
|
|
|
|
|
|
|
|
|
TX |
|
2011.04 |
|
14 |
|
|
NT$ |
23,788 |
|
|
TX |
|
2011.06 |
|
12 |
|
|
NT$ |
21,171 |
|
|
TE |
|
2011.04 |
|
4 |
|
|
NT$ |
5,034 |
|
|
TE |
|
2011.05 |
|
21 |
|
|
NT$ |
26,504 |
|
As of March 31, 2012 and 2011, the deposits paid for outstanding index future contracts (classified as other current assets) were $3,820 thousand and $2,914 thousand, respectively.
The convertible bonds owned by subsidiaries are hybrid financial instruments that are designated to be measured at fair value and changes in fair value are recognized in earnings.
Net gain (loss) arising from financial assets and liabilities at fair value through profit or loss for the three months ended March 31, 2012 and 2011 were $54,621 thousand (including realized settlement gain of $38,019 thousand and valuation gain of $16,602 thousand) and $(6,506) thousand (including realized settlement gain of $36,215 thousand and valuation loss of $42,721 thousand), respectively.
6. AVAILABLE-FOR-SALE FINANCIAL ASSETS
|
|
|
March 31 |
|
|
|
|
2012 |
|
2011 |
|
|
|
|
|
|
|
|
|
Domestic listed stocks |
|
$ |
3,441,088 |
|
$ |
519,850 |
|
|
Open-end mutual funds |
|
2,406,540 |
|
1,540,837 |
|
|
Corporate bonds |
|
76,025 |
|
101,904 |
|
|
Foreign listed stocks |
|
11,595 |
|
— |
|
|
|
|
5,935,248 |
|
2,162,591 |
|
|
Less: Current portion |
|
2,724,087 |
|
2,162,591 |
|
|
|
|
|
|
|
|
|
|
|
$ |
3,211,161 |
|
$ |
— |
|
21
The board of directors resolved to acquire 263,622 thousand common shares of China Airline Ltd. (“CAL”) at $11.73 per share for the three months ended March 31, 2012. Chunghwa expected to hold it as long-term investment and classified it as available-for-sale financial assets - noncurrent. CAL engages mainly in aviatic transportation services.
Movements of unrealized gain (loss) on available-for-sale financial assets were as follows:
|
|
|
Three Months Ended March 31 |
|
|
|
|
2012 |
|
2011 |
|
|
|
|
|
|
|
|
|
Balance, beginning of period |
|
$ |
67,674 |
|
$ |
176,048 |
|
|
Recognized in stockholders’ equity |
|
118,241 |
|
(6,398 |
) |
|
Transferred to profit or loss |
|
(7,035 |
) |
(1,653 |
) |
|
|
|
|
|
|
|
|
Balance, end of period |
|
$ |
178,880 |
|
$ |
167,997 |
|
7. HELD-TO-MATURITY FINANCIAL ASSETS
|
|
|
March 31 |
|
|
|
|
2012 |
|
2011 |
|
|
|
|
|
|
|
|
|
Corporate bonds, nominal interest rate ranging from 1.15%-2.90% and 1.20%-4.75% for 2012 and 2011, respectively; effective interest rate ranging from 1.00%-2.86% and 1.00%-2.95% for 2012 and 2011, respectively |
|
$ |
14,185,818 |
|
$ |
10,929,432 |
|
|
Bank debentures, nominal interest rate ranging from 1.37%-1.60% and 1.37%-2.11% for 2012 and 2011, respectively; effective interest rate ranging from 1.25%-1.40% and 1.25%-2.45% for 2012 and 2011, respectively |
|
905,337 |
|
1,106,542 |
|
|
|
|
15,091,155 |
|
12,035,974 |
|
|
Less: Current portion |
|
500,266 |
|
2,062,915 |
|
|
|
|
|
|
|
|
|
|
|
$ |
14,590,889 |
|
$ |
9,973,059 |
|
8. ALLOWANCE FOR DOUBTFUL ACCOUNTS
|
|
|
Three Months Ended March 31 |
|
|
|
|
2012 |
|
2011 |
|
|
|
|
|
|
|
|
|
Balance, beginning of period |
|
$ |
2,423,012 |
|
$ |
2,551,464 |
|
|
Provision for doubtful accounts |
|
9,765 |
|
39,018 |
|
|
Accounts receivable written off |
|
(36,081 |
) |
(63,975 |
) |
|
|
|
|
|
|
|
|
Balance, end of period |
|
$ |
2,396,696 |
|
$ |
2,526,507 |
|
22
9. OTHER MONETARY ASSETS - CURRENT
|
|
|
March 31 |
|
|
|
|
2012 |
|
2011 |
|
|
|
|
|
|
|
|
|
Accrued custodial receipts of MOD service |
|
$ |
137,556 |
|
$ |
59,540 |
|
|
Other receivables |
|
1,529,717 |
|
2,578,095 |
|
|
|
|
|
|
|
|
|
|
|
$ |
1,667,273 |
|
$ |
2,637,635 |
|
10. INVENTORIES
|
|
|
March 31 |
|
|
|
|
2012 |
|
2011 |
|
|
|
|
|
|
|
|
|
Merchandise |
|
$ |
3,653,533 |
|
$ |
2,988,868 |
|
|
Work in process |
|
408,686 |
|
1,001,360 |
|
|
Raw materials |
|
24,256 |
|
— |
|
|
|
|
4,086,475 |
|
3,990,228 |
|
|
Land available for sale |
|
395,537 |
|
738,633 |
|
|
Land held under development |
|
111,536 |
|
499,045 |
|
|
Construction in progress |
|
772,486 |
|
471,734 |
|
|
Land held for development |
|
35,816 |
|
35,816 |
|
|
|
|
|
|
|
|
|
|
|
$ |
5,401,850 |
|
$ |
5,735,456 |
|
The operating costs related to inventories were $12,624,395 thousand (including valuation loss on inventories of $20,888 thousand) and $7,306,973 thousand (including valuation loss on inventories of $43,187 thousand) for the three months ended March 31, 2012 and 2011, respectively.
Land available for sale on March 31, 2012 was for Wan-Xi and Covent projects. Land available for sale on March 31, 2011 was for Wan-Xi and Li-Shui (B) projects.
Land held under development and construction in progress on March 31, 2012 was for Guang-Diang and Li-Shui (A) projects. Guang-Diang and Li-Shui (A) projects are expected to be completed in 2012. Land held under development and construction in progress on March 31, 2011 was for Guang-Diang, Li-Shui (A) and Covent projects. Covent project was completed in 2011, and reclassified to land available for sale.
LED recognizes the relevant revenues of Guang-Diang Project by percentage of completion method. The related information were as follows (in thousands):
|
|
|
March 31 |
|
|
|
|
2012 |
|
2011 |
|
|
|
|
|
|
|
|
|
Percentage of completion method |
|
|
|
|
|
|
|
|
|
|
|
|
|
Guang-Diang project |
|
|
|
|
|
|
Contract price |
|
$ |
983,129 |
|
$ |
983,129 |
|
|
Estimated construction cost |
|
$ |
430,203 |
|
$ |
425,493 |
|
|
Land held under development |
|
$ |
64,987 |
|
$ |
64,987 |
|
(Continued)
23
|
|
|
March 31 |
|
|
|
|
2012 |
|
2011 |
|
|
|
|
|
|
|
|
|
Construction in progress |
|
|
|
|
|
|
Construction cost |
|
$ |
328,809 |
|
$ |
212,120 |
|
|
Recognized cumulative gain |
|
443,677 |
|
256,254 |
|
|
|
|
|
|
|
|
|
|
|
$ |
772,486 |
|
$ |
468,374 |
|
|
|
|
|
|
|
|
|
Deferred marketing expenses (classified as other current assets) |
|
$ |
10,612 |
|
$ |
32,206 |
|
|
Advance from land and building (classified as other current liabilities) |
|
$ |
178,882 |
|
$ |
156,204 |
|
|
|
|
|
|
|
|
|
Percentage of completion |
|
91 |
% |
56 |
% |
|
Expected year of completion |
|
2012 |
|
2012 |
|
(Concluded)
11. OTHER CURRENT ASSETS
|
|
|
March 31 |
|
|
|
|
2012 |
|
2011 |
|
|
|
|
|
|
|
|
|
Prepaid expenses |
|
$ |
3,759,735 |
|
$ |
3,029,591 |
|
|
Spare parts |
|
2,835,018 |
|
2,069,892 |
|
|
Prepaid rents |
|
1,058,353 |
|
857,530 |
|
|
Miscellaneous |
|
655,709 |
|
682,777 |
|
|
|
|
|
|
|
|
|
|
|
$ |
8,308,815 |
|
$ |
6,639,790 |
|
12. INVESTMENTS ACCOUNTED FOR USING EQUITY METHOD
|
|
|
March 31 |
|
|
|
|
2012 |
|
2011 |
|
|
|
|
Carrying
Amount |
|
% of
Ownership |
|
Carrying
Amount |
|
% of
Ownership |
|
|
|
|
|
|
|
|
|
|
|
|
|
Non-listed |
|
|
|
|
|
|
|
|
|
|
Taiwan International Standard Electronics Co., Ltd. (“TISE”) |
|
$ |
709,852 |
|
40 |
|
$ |
598,205 |
|
40 |
|
|
ST-2 Satellite Ventures Pte., Ltd. (“STS”) |
|
490,707 |
|
38 |
|
408,944 |
|
38 |
|
|
Senao Networks, Inc. (“SNI”) |
|
372,310 |
|
41 |
|
318,933 |
|
41 |
|
|
International Integrated System, Inc. (“IISI”) |
|
259,520 |
|
33 |
|
— |
|
— |
|
|
Viettel-CHT Co., Ltd. (“Viettel-CHT”) |
|
256,560 |
|
30 |
|
238,242 |
|
30 |
|
|
Huada Digital Corporation (“HDD”) |
|
250,778 |
|
50 |
|
— |
|
— |
|
|
Skysoft Co., Ltd. (“SKYSOFT”) |
|
125,290 |
|
30 |
|
98,101 |
|
30 |
|
|
Dian Zuan Intergrating Marketing Co., Ltd. (“DZIM”) |
|
108,533 |
|
40 |
|
— |
|
— |
|
|
Kingwaytek Technology Co., Ltd. (“KWT”) |
|
76,849 |
|
33 |
|
63,901 |
|
33 |
|
|
So-net Entertainment Co., Ltd. (“So-net”) |
|
34,644 |
|
30 |
|
28,620 |
|
30 |
|
|
HopeTech Technologies Limited (“HopeTech”) |
|
21,136 |
|
45 |
|
18,942 |
|
45 |
|
|
|
|
|
|
|
|
|
|
|
|
|
(Continued)
24
|
|
|
March 31 |
|
|
|
|
2012 |
|
2011 |
|
|
|
|
Carrying
Amount |
|
% of
Ownership |
|
Carrying
Amount |
|
% of
Ownership |
|
|
Xiamen Sertec Business Technology Co., Ltd. (“Sertec”) |
|
$ |
10,793 |
|
49 |
|
$ |
5,795 |
|
49 |
|
|
Tatung Technology Inc. (“Tatung”) |
|
— |
|
— |
|
6,479 |
|
28 |
|
|
Panda Monium Company Ltd. |
|
— |
|
43 |
|
— |
|
43 |
|
|
|
|
|
|
|
|
|
|
|
|
|
|
|
$ |
2,716,972 |
|
|
|
$ |
1,786,162 |
|
|
|
(Concluded)
InfoExplorer Co., Ltd. (“IFE”) issued new shares as the consideration to merge with International Integrated System, Inc. and e-ToYou International, Inc. on April 1, 2011. After the merger, IFE became the surviving entity and was renamed as International Integrated System, Inc. (“IISI”). International Integrated System, Inc. and e-ToYou International, Inc. were dissolved. As a result of the additional shares being issued by IFE in connection with this transaction, Chunghwa’s ownership interest in IISI decreased from 49% to 33% after the merger, and after the stockholders’ meeting of IISI on June 24, 2011, Chunghwa lost control of the board of directors.
Chunghwa invested in HDD in September 2011 by investing $250,000 thousand cash to acquire 50% of its shares. HDD engages mainly in providing software service.
Chunghwa, President Chain Store Corporation and EasyCard Corporation established a joint venture, DZIM, in May 2011. Chunghwa invested $114,640 thousand cash and held a 40% ownership of DZIM. DZIM engages mainly in information technology service and general advertisement service.
Tatung, the former equity method investee of CHI, completed a capital reduction and a capital increase plan in July 2011, however, CHI did not invested in the capital increase plan of Tatung as the percentage it held; therefore, CHI lost significant influence over Tatung. CHI reclassified Tatung from investments accounted for using equity method to financial assets carried at cost.
Except for the carrying value and net equity in earnings of HopeTech were calculated based on reviewed financial statements as of and for the three months ended March 31, 2012, the aggregate carrying values of the equity method investments whose financial statements have not been reviewed were $2,695,836 thousand and $1,786,162 thousand as of March 31, 2012 and 2011, respectively. The net equity in earnings of such equity investees were $173,202 thousand and $63,587 thousand for the three months ended March 31, 2012 and 2011, respectively.
13. FINANCIAL ASSETS CARRIED AT COST
|
|
|
March 31 |
|
|
|
|
2012 |
|
2011 |
|
|
|
|
Carrying
Amount |
|
% of
Ownership |
|
Carrying
Amount |
|
% of
Ownership |
|
|
Non-listed |
|
|
|
|
|
|
|
|
|
|
Taipei Financial Center (“TFC”) |
|
$ |
1,789,530 |
|
12 |
|
$ |
1,789,530 |
|
12 |
|
|
Industrial Bank of Taiwan II Venture Capital Co., Ltd. (“IBT II”) |
|
200,000 |
|
17 |
|
200,000 |
|
17 |
|
|
iD Branding Ventures (“iDBV”) |
|
89,553 |
|
11 |
|
99,504 |
|
11 |
|
|
|
|
|
|
|
|
|
|
|
|
|
(Continued)
25
|
|
|
March 31 |
|
|
|
|
2012 |
|
2011 |
|
|
|
|
Carrying
Amount |
|
% of
Ownership |
|
Carrying
Amount |
|
% of
Ownership |
|
|
|
|
|
|
|
|
|
|
|
|
|
Global Mobile Corp. (“GMC”) |
|
$ |
77,018 |
|
3 |
|
$ |
127,018 |
|
8 |
|
|
Innovation Works Development Fund, L.P. (“IWDF”) |
|
73,154 |
|
4 |
|
38,035 |
|
7 |
|
|
Procrystal Technology Co., Ltd. (“Procrystal”) |
|
68,185 |
|
2 |
|
30,000 |
|
1 |
|
|
Tons Lightology Inc. |
|
66,150 |
|
4 |
|
66,150 |
|
4 |
|
|
Tatung Technology Inc. (“Tatung”) |
|
60,081 |
|
11 |
|
— |
|
— |
|
|
UniDisplay Inc. |
|
55,450 |
|
3 |
|
55,450 |
|
4 |
|
|
MEDIAPRO TECHNOLOGY LTD. |
|
44,871 |
|
1 |
|
— |
|
— |
|
|
Innovation Works Limited (“IW”) |
|
31,391 |
|
2 |
|
31,391 |
|
7 |
|
|
Alder Optomechanical Corp. |
|
29,750 |
|
1 |
|
— |
|
— |
|
|
VisEra Technologies Company Ltd. |
|
29,371 |
|
— |
|
29,371 |
|
— |
|
|
Ultra Fine Optical Technology Co., Ltd. |
|
27,000 |
|
8 |
|
27,000 |
|
8 |
|
|
Hiroca Holdings Ltd. |
|
17,847 |
|
— |
|
— |
|
— |
|
|
Digimax Inc. (“DIG”) |
|
15,080 |
|
4 |
|
15,080 |
|
4 |
|
|
N.T.U. Innovation Incubation |
|
12,000 |
|
9 |
|
12,000 |
|
9 |
|
|
CoaTronics Inc. |
|
12,000 |
|
9 |
|
12,000 |
|
9 |
|
|
Fashion Guide Co., Ltd. |
|
10,000 |
|
2 |
|
— |
|
— |
|
|
Aide Energy (“Cayman”) Holding Co., Ltd. (“Aide”) |
|
9,380 |
|
1 |
|
— |
|
— |
|
|
SuperAlloy Industrial Co., Ltd. |
|
6,732 |
|
— |
|
7,123 |
|
— |
|
|
CQi Energy Infocom Inc. (“CQi”) |
|
6,000 |
|
18 |
|
20,000 |
|
18 |
|
|
DelSolar Co. |
|
5,702 |
|
— |
|
6,097 |
|
— |
|
|
Optivision Technology Inc. |
|
5,087 |
|
— |
|
10,189 |
|
— |
|
|
Cando Corporation |
|
4,946 |
|
— |
|
4,946 |
|
— |
|
|
Tatung Fine Chemicals Co. (“TFChemicals”) |
|
4,365 |
|
— |
|
9,135 |
|
— |
|
|
Subtron Technology Co. |
|
3,608 |
|
— |
|
5,053 |
|
— |
|
|
3 Link Information Service Co., Ltd. |
|
3,450 |
|
10 |
|
3,450 |
|
10 |
|
|
XinTec Inc. |
|
1,078 |
|
— |
|
1,078 |
|
— |
|
|
RPTI International (“RPTI”) |
|
— |
|
10 |
|
34,500 |
|
10 |
|
|
Taimide Technology Ltd. |
|
— |
|
— |
|
18,909 |
|
1 |
|
|
Lextar Electronics Corp. |
|
— |
|
— |
|
16,243 |
|
— |
|
|
PChome Store Inc. |
|
— |
|
— |
|
14,072 |
|
3 |
|
|
Huga Optotech Inc. |
|
— |
|
— |
|
12,870 |
|
— |
|
|
Win Semiconductors Corp. |
|
— |
|
— |
|
10,555 |
|
— |
|
|
A2peak Power Co., Ltd. (“A2P”) |
|
— |
|
3 |
|
9,858 |
|
3 |
|
|
Chia Chang Co., Ltd. |
|
— |
|
— |
|
9,366 |
|
— |
|
|
ChipSip Technology Co., Ltd. (“ChipSip”) |
|
— |
|
— |
|
6,133 |
|
2 |
|
|
Crystal Media Inc. (“CMI”) |
|
— |
|
— |
|
5,630 |
|
5 |
|
|
G-Tech Optoelectronics Corp. |
|
— |
|
— |
|
1,599 |
|
— |
|
|
Essence Technology Solution, Inc. (“ETS”) |
|
— |
|
7 |
|
— |
|
7 |
|
|
eASPNet Inc. |
|
— |
|
— |
|
— |
|
2 |
|
|
|
|
|
|
|
|
|
|
|
|
|
|
|
$ |
2,758,779 |
|
|
|
$ |
2,739,335 |
|
|
|
(Concluded)
The above investments do not have quoted market prices in an active market and the fair values cannot be reliably measured; therefore, these investments are carried at original cost.
26
14. OTHER MONETARY ASSETS - NONCURRENT
|
|
|
March 31 |
|
|
|
|
2012 |
|
2011 |
|
|
|
|
|
|
|
|
|
Piping Fund |
|
$ |
1,000,000 |
|
$ |
1,000,000 |
|
|
|
|
|
|
|
|
|
As part of the government’s effort to upgrade the existing telecommunications infrastructure, Chunghwa and other public utility companies were required by the ROC government to contribute a total of $1,000,000 thousand to a Piping Fund administered by the Taipei City Government. This fund was used to finance various telecommunications infrastructure projects.
15. PROPERTY, PLANT AND EQUIPMENT
|
|
|
March 31 |
|
|
|
|
2012 |
|
2011 |
|
|
|
|
|
|
|
|
|
Cost |
|
|
|
|
|
|
Land |
|
$ |
103,808,185 |
|
$ |
103,828,369 |
|
|
Land improvements |
|
1,572,448 |
|
1,551,988 |
|
|
Buildings |
|
67,696,301 |
|
67,450,256 |
|
|
Computer equipment |
|
15,028,053 |
|
15,936,481 |
|
|
Telecommunications equipment |
|
658,802,536 |
|
657,319,135 |
|
|
Transportation equipment |
|
2,584,674 |
|
2,258,925 |
|
|
Miscellaneous equipment |
|
6,977,717 |
|
7,087,675 |
|
|
Total cost |
|
856,469,914 |
|
855,432,829 |
|
|
Revaluation increment on land |
|
5,762,418 |
|
5,762,611 |
|
|
|
|
862,232,332 |
|
861,195,440 |
|
|
Accumulated depreciation |
|
|
|
|
|
|
Land improvements |
|
1,055,246 |
|
1,014,410 |
|
|
Buildings |
|
20,027,643 |
|
18,882,108 |
|
|
Computer equipment |
|
11,206,729 |
|
12,223,984 |
|
|
Telecommunications equipment |
|
536,606,919 |
|
531,127,049 |
|
|
Transportation equipment |
|
1,223,611 |
|
1,524,816 |
|
|
Miscellaneous equipment |
|
5,568,308 |
|
5,872,317 |
|
|
|
|
575,688,456 |
|
570,644,684 |
|
|
Construction in progress and advances related to acquisition of equipment |
|
14,154,846 |
|
11,161,809 |
|
|
|
|
|
|
|
|
|
Property, plant and equipment, net |
|
$ |
300,698,722 |
|
$ |
301,712,565 |
|
Pursuant to the related regulation, Chunghwa revalued its land owned as of April 30, 2000 based on the publicly announced value on July 1, 1999. These revaluations which were approved by the Ministry of Auditing resulted in increases in the carrying values of property, plant and equipment of $5,986,074 thousand, liabilities for land value incremental tax of $211,182 thousand, and stockholders’ equity - other adjustments of $5,774,892 thousand.
The amendment to the Land Tax Act, relating to the article to permanently lower land value incremental tax, went effective from February 1, 2005. In accordance with the lowered tax rates, Chunghwa recomputed its land value incremental tax, and reclassified the reserve for land value incremental tax of $116,196 thousand to stockholders’ equity - other adjustments. As of March 31, 2012, the unrealized revaluation increment was decreased to $5,762,636 thousand due to disposal of revaluation assets.
27
Depreciation expense on property, plant and equipment for the three months ended March 31, 2012 and 2011 were $7,711,261 thousand and $7,714,492 thousand, respectively. Capitalized interest expense for the three months ended March 31, 2012 and 2011 were $6 thousand and $30 thousand, respectively. The capitalized interest rate were 1.20% and 1.10%, respectively.
16. SHORT-TERM LOANS
|
|
|
March 31 |
|
|
|
|
2012 |
|
2011 |
|
|
|
|
|
|
|
|
|
Unsecured loans - annual rate - 1.24%-1.53% and 1.10%-1.45% for the 2012 and 2011, respectively |
|
$ |
75,000 |
|
$ |
115,000 |
|
|
|
|
|
|
|
|
|
17. SHORT-TERM BILLS PAYABLE
|
|
|
March 31 |
|
|
|
|
2012 |
|
2011 |
|
|
|
|
|
|
|
|
|
Commercial paper - annual rate - 0.84% |
|
$ |
— |
|
$ |
29,977 |
|
|
|
|
|
|
|
|
|
18. ACCRUED EXPENSES
|
|
|
March 31 |
|
|
|
|
2012 |
|
2011 |
|
|
|
|
|
|
|
|
|
Accrued salary and compensation |
|
$ |
6,230,835 |
|
$ |
6,952,935 |
|
|
Accrued franchise fees |
|
2,742,409 |
|
2,719,377 |
|
|
Accrued employees’ bonuses and remuneration to directors and supervisors |
|
2,728,615 |
|
2,924,790 |
|
|
Other accrued expenses |
|
3,340,975 |
|
3,293,343 |
|
|
|
|
|
|
|
|
|
|
|
$ |
15,042,834 |
|
$ |
15,890,445 |
|
19. OTHER CURRENT LIABILITIES
|
|
|
March 31 |
|
|
|
|
2012 |
|
2011 |
|
|
|
|
|
|
|
|
|
Advance receipts |
|
$ |
12,918,140 |
|
$ |
11,296,223 |
|
|
Payables to equipment suppliers |
|
1,755,372 |
|
1,304,937 |
|
|
Amounts collected in trust for others |
|
1,361,600 |
|
1,676,680 |
|
|
Payables to contractors |
|
1,247,230 |
|
697,783 |
|
|
Refundable customers’ deposits |
|
1,081,913 |
|
1,102,520 |
|
|
Others |
|
3,201,102 |
|
2,641,129 |
|
|
|
|
|
|
|
|
|
|
|
$ |
21,565,357 |
|
$ |
18,719,272 |
|
28
20. LONG-TERM LOANS (INCLUDING LONG-TERM LOANS - CURRENT PORTION)
|
|
|
March 31 |
|
|
|
|
2012 |
|
2011 |
|
|
Secured loans - annual rate - 1.10% and 0.92%-1.66% for 2012 and 2011, respectively |
|
$ |
1,650,000 |
|
$ |
3,245,752 |
|
|
Unsecured loans - annual rate - 2.01% and 2.01%-2.17% for 2012 and 2011, respectively |
|
83,723 |
|
184,191 |
|
|
|
|
1,733,723 |
|
3,429,943 |
|
|
Less: Current portion of long-term loans |
|
683,723 |
|
306,802 |
|
|
|
|
|
|
|
|
|
|
|
$ |
1,050,000 |
|
$ |
3,123,141 |
|
LED obtained a secured loan from Chang Hwa Bank in September 2010. Interest is paid monthly and the principal is paid yearly from December 2011 and due in September 2015. LED renegotiated the loan repayment schedule with Chang Hwa bank in September 2011. LED early repaid $1,100,000 thousand in 2011, and will repay $600,000 thousand and $1,050,000 thousand in December 2012 and September 2015, respectively.
LED obtained a secured loan from First Commercial Bank in September 2010. Interest is paid monthly and the principal is paid yearly from September 2014 and due in September 2017. The loan was repaid early in June 2011.
CHPT obtained a secured loan from the E.SUN Commercial Bank in February 2009. Interest and the principal are paid monthly from March 2009 and due in February 2012.
CHIEF obtained an unsecured loan from Bank of Taiwan in January 2009. Interest and principal amount are paid monthly from January 2009 and due in January 2013.
21. MATURITY ANALYSIS OF ASSETS AND LIABILITIES
The Company classified LED’s assets and liabilities of the construction operations as current and noncurrent according to the length of the operating cycle of the construction operations. Maturity analysis of LED’s related assets and liabilities was as follows:
|
|
|
March 31, 2012 |
|
|
|
|
Within
One Year |
|
Over
One Year |
|
Total |
|
|
Assets |
|
|
|
|
|
|
|
|
|
|
|
|
|
|
|
|
|
Accounts receivable |
|
$ |
16,662 |
|
$ |
— |
|
$ |
16,662 |
|
|
Inventories |
|
1,000,367 |
|
315,008 |
|
1,315,375 |
|
|
Deferred expenses (classified as other current assets) |
|
4,448 |
|
6,164 |
|
10,612 |
|
|
|
|
|
|
|
|
|
|
|
|
|
$ |
1,021,477 |
|
$ |
321,172 |
|
$ |
1,342,649 |
|
|
Liabilities |
|
|
|
|
|
|
|
|
|
|
|
|
|
|
|
|
|
Accrued expenses |
|
$ |
31,542 |
|
$ |
— |
|
$ |
31,542 |
|
|
Payable to contractors (classified as other current liabilities) |
|
29,279 |
|
— |
|
29,279 |
|
|
Advance from land and building (classified as other current liabilities) |
|
281,591 |
|
— |
|
281,591 |
|
|
|
|
|
|
|
|
|
|
|
|
|
$ |
342,412 |
|
$ |
— |
|
$ |
342,412 |
|
29
|
|
|
March 31, 2011 |
|
|
|
|
Within
One Year |
|
Over
One Year |
|
Total |
|
|
Assets |
|
|
|
|
|
|
|
|
|
|
|
|
|
|
|
|
|
Inventories |
|
$ |
— |
|
$ |
1,745,228 |
|
$ |
1,745,228 |
|
|
Deferred expenses (classified as other current assets) |
|
— |
|
113,835 |
|
113,835 |
|
|
Restricted assets |
|
— |
|
35,671 |
|
35,671 |
|
|
|
|
|
|
|
|
|
|
|
|
|
$ |
— |
|
$ |
1,894,734 |
|
$ |
1,894,734 |
|
|
|
|
|
|
|
|
|
|
|
Liabilities |
|
|
|
|
|
|
|
|
|
|
|
|
|
|
|
|
|
Payable to contractors (classified as other current liabilities) |
|
$ |
— |
|
$ |
11,583 |
|
$ |
11,583 |
|
|
Advance from land and building (classified as other current liabilities) |
|
— |
|
555,517 |
|
555,517 |
|
|
|
|
|
|
|
|
|
|
|
|
|
$ |
— |
|
$ |
567,100 |
|
$ |
567,100 |
|
22. STOCKHOLDERS’ EQUITY
Under Chunghwa’s Articles of Incorporation, Chunghwa’s authorized capital is $120,000,000 thousand, which is divided into 12,000,000 thousand common shares (at $10 par value per share), among which 7,757,447 thousand common shares are issued and outstanding as of March 31, 2012.
For the purpose of privatizing Chunghwa, the MOTC sold 1,109,750 thousand common shares of Chunghwa in an international offering of securities in the form of American Depositary Shares (“ADS”) amounting to 110,975 thousand units (one ADS represents ten common shares) on the New York Stock Exchange on July 17, 2003. Afterwards, the MOTC sold 1,350,682 thousand common shares in the form of ADS amounting to 135,068 thousand units on August 10, 2005. Subsequently, the MOTC and Taiwan Mobile Co., Ltd. sold 505,389 thousand and 58,959 thousand common shares of Chunghwa, respectively, in the form of ADS totally amounting to 56,435 thousand units on September 29, 2006. The MOTC and Taiwan Mobile Co., Ltd. have sold 3,024,780 thousand common shares in the form of ADS amounting to 302,478 thousand units. As of March 31, 2012, the outstanding ADSs were 439,309 thousand common shares, which equaled approximately 43,931 thousand units and represented 5.66% of Chunghwa’s total outstanding common shares.
The ADS holders generally have the same rights and obligations as other common stockholders, subject to the provision of relevant laws. The exercise of such rights and obligations shall comply with the related regulations and deposit agreement, which stipulate, among other things, that ADS holders can, through deposit agents:
a. Exercise their voting rights,
b. Sell their ADSs, and
c. Receive dividends declared and subscribe to the issuance of new shares.
30
Under the ROC Company Law, additional paid-in capital may only be utilized to offset deficits. However, the additional paid-in capital from shares issued in excess of par and donations may be capitalized, which however is limited to a certain percentage of Chunghwa’s paid-in capital. However, where a company undergoes an organizational change (such as a merger, acquisition, or reorganization) that results in the capitalization of undistributed earnings after the organizational change, the above restriction does not apply. Under the revised Company Law issued on January 4, 2012, the aforementioned additional paid-in capital also may be distributed in cash. The additional paid-in capital from long-term investments may not be used for any purpose.
In addition, before distributing a dividend or making any other distribution to stockholders, Chunghwa must pay all outstanding taxes, recover any past losses and set aside a legal reserve equal to 10% of its net income, and depending on its business needs or requirements, may also set aside a special reserve. In accordance with the Articles of Incorporation, no less than 50% of the remaining earnings comprising remaining balance of net income, if any, plus cumulative undistributed earnings shall be distributed in the following order: (a) from 2% to 5% of distributable earnings shall be distributed to employees as employee bonus; (b) no more than 0.2% of distributable earnings shall be distributed to board of directors and supervisors as remuneration; and (c) cash dividends to be distributed shall not be less than 50% of the total amount of dividends to be distributed. If cash dividends to be distributed is less than $0.10 per share, such cash dividend shall be distributed in the form of common shares.
For the three months ended March 31, 2012 and 2011, the accrual amounts for bonuses to employees and remuneration to directors and supervisors were accrued on past experiences and probable amount to be paid in accordance with Chunghwa’s Articles of Incorporation and Implementation Guidance for the Employee’s Bonus Distribution of Chunghwa Telecom Co., Ltd.
If the initial accrual amounts of the aforementioned bonus are significantly different from the amounts proposed by the board of directors, the difference is charged to the earnings of the year making the initial estimate. Otherwise, the difference between initial accrual amount and the amount resolved in the stockholders’ meeting is charged to the earnings of the following year as a result of change in accounting estimate.
Under the ROC Company Law, the appropriation for legal reserve shall be made until the accumulated reserve equals the aggregate par value of the outstanding capital stock of Chunghwa. This reserve can only be used to offset a deficit, or, under the revised Company Law issued on January 4, 2012, when the legal reserve has exceeded 25% of the Company’s paid-in capital, the excess may be transferred to capital or distributed in cash.
The appropriations and distributions of the 2011 earnings of Chunghwa have been resolved by the board of directors on March 27, 2012, and the appropriations and distributions of the 2010 earnings of Chunghwa have been approved by the stockholders on June 24, 2011 as follows:
|
|
|
Appropriation of Earnings |
|
Dividends Per Share |
|
|
|
|
For Fiscal
Year 2011 |
|
For Fiscal
Year 2010 |
|
For Fiscal
Year 2011 |
|
For Fiscal
Year 2010 |
|
|
|
|
|
|
|
|
|
|
|
|
|
Legal reserve |
|
$ |
4,706,838 |
|
$ |
4,760,890 |
|
|
|
|
|
|
Cash dividends |
|
42,361,864 |
|
42,854,462 |
|
$ |
5.46 |
|
$ |
5.52 |
|
|
|
|
|
|
|
|
|
|
|
|
|
|
|
The amounts for bonuses to employees and remuneration to directors and supervisors resolved in the board of directors on March 27, 2012, were $2,040,090 thousand and $44,446 thousand, respectively. There was no difference between the initial accrual amounts and the amounts resolved in board of directors of the aforementioned bonuses to employees and the remuneration to directors and supervisors.
31
The amounts for bonuses to employees and remuneration to directors and supervisors approved in the stockholders’ meeting on June 24, 2011, were $2,144,074 thousand and $45,044 thousand, respectively. There was no difference between the initial accrual amounts and the amounts resolved in stockholders’ meeting of the aforementioned bonuses to employees and the remuneration to directors and supervisors.
The appropriation and distribution of the 2011 earnings, and the amounts for bonuses to employees and remuneration to directors and supervisors is subject to the approval in the stockholders’ meeting on June 22, 2012. Information on the appropriation of Chunghwa’s earnings, employees bonuses and remuneration to directors and supervisors resolved by the board of directors and approved by the stockholders is available at the Market Observation Post System website.
The stockholders, at the stockholders’ meeting held on June 18, 2010, resolved to reduce the amount of $19,393,617 thousand in capital of Chunghwa by a cash distribution to its stockholders. The abovementioned 2010 capital reduction proposal was effectively approved by FSC. The board of directors of Chunghwa was authorized to designate the record date of capital reduction as of October 26, 2010. Subsequently, the stock transfer record date of capital reduction was designated as January 15, 2011. The amount due to stockholders for capital reduction was $19,393,617 thousand and such cash payment to stockholders was made in January 2011.
23. SHARE-BASED COMPENSATION PLANS
SENAO share-based compensation plans (“SENAO Plans”) described as follows:
|
Effective Date |
|
Grant Date |
|
Stock Options Units
(Thousand) |
|
Exercise Price |
|
|
|
|
|
|
|
|
|
|
|
2004.12.01 |
|
2005.11.28 |
|
1,500 |
|
13.5 |
|
|
|
|
|
|
|
|
(Original price $18.3 |
) |
|
2005.09.30 |
|
2006.05.05 |
|
10,000 |
|
12.1 |
|
|
|
|
|
|
|
|
(Original price $16.9 |
) |
|
2007.10.16 |
|
2007.10.31 |
|
6,181 |
|
42.6 |
|
|
|
|
|
|
|
|
(Original price $44.2 |
) |
|
|
|
|
|
|
|
|
|
|
|
|
|
|
17,681 |
|
|
|
Each option is eligible to subscribe for one common share when exercisable. Under the terms of the Plans, the options are granted at an exercise price equal to the closing price of the SENAO’s common shares listed on the TSE on the higher of closing price or par value. The SENAO Plans have an exercise price adjustment formula upon the issuance of new common shares, capitalization of retained earnings and/or capital reserves, stock split as well as distribution of cash dividend (except for 2007 Plan), except (i) in the case of issuance of new shares in connection with mergers and in the case of cancellation of outstanding shares in connection with capital reduction (2007 Plan is out of this exception), and (ii) except if the exercise price after adjustment exceeds the exercise price before adjustment. The options of all the Plans are valid for six years and the graded vesting schedule for which 50% of option granted will vest two years after the grant date and another two tranches of 25%, each will vest three and four years after the grant date respectively.
32
Information about SENAO’s outstanding stock options for the three months ended March 31, 2012 and 2011 was as follows:
|
|
|
Stock Options Outstanding |
|
|
|
|
2012 |
|
2011 |
|
|
|
|
Number of
Options
(Thousand) |
|
Weighted
Average
Exercise Price
(NT$) |
|
Number of
Options
(Thousand) |
|
Weighted
Average
Exercise Price
(NT$) |
|
|
|
|
|
|
|
|
|
|
|
|
|
Options outstanding, beginning of period |
|
2,278 |
|
$ |
38.85 |
|
5,103 |
|
$ |
36.15 |
|
|
Options exercised |
|
(828 |
) |
33.57 |
|
(1,274 |
) |
34.72 |
|
|
Options expired |
|
(5 |
) |
12.10 |
|
(7 |
) |
39.94 |
|
|
|
|
|
|
|
|
|
|
|
|
|
Options outstanding, end of period |
|
1,445 |
|
41.97 |
|
3,822 |
|
36.61 |
|
|
|
|
|
|
|
|
|
|
|
|
|
Options exercisable, end of period |
|
1,445 |
|
|
|
2,440 |
|
|
|
|
|
|
|
|
|
|
|
|
|
|
|
As of March 31, 2012, information about SENAO’s outstanding and exercisable options was as follows:
|
Options Outstanding |
|
Options Exercisable |
|
|
Range of Exercise
Price
(NT$) |
|
Number of
Options
(Thousand) |
|
Weighted
Average
Remaining
Contractual
Life (Years) |
|
Weighted
Average
Exercise
Price
(NT$) |
|
Number of
Options
(Thousand) |
|
Weighted
Average
Exercise
Price
(NT$) |
|
|
|
|
|
|
|
|
|
|
|
|
|
|
|
$ |
12.1 |
|
30 |
|
0.08 |
|
$ |
12.10 |
|
30 |
|
$ |
12.10 |
|
|
$ |
42.6 |
|
1,415 |
|
1.67 |
|
42.60 |
|
1,415 |
|
42.60 |
|
|
|
|
|
|
|
|
|
|
|
|
|
|
|
|
As of March 31, 2011, information about SENAO’s outstanding and exercisable options was as follows:
|
Options Outstanding |
|
Options Exercisable |
|
|
Range of Exercise
Price
(NT$) |
|
Number of
Options
(Thousand) |
|
Weighted
Average
Remaining
Contractual
Life (Years) |
|
Weighted
Average
Exercise
Price
(NT$) |
|
Number of
Options
(Thousand) |
|
Weighted
Average
Exercise
Price
(NT$) |
|
|
|
|
|
|
|
|
|
|
|
|
|
|
|
$ |
12.4 |
|
758 |
|
1.08 |
|
$ |
12.40 |
|
758 |
|
$ |
12.40 |
|
|
$ |
42.6 |
|
3,064 |
|
2.67 |
|
42.60 |
|
1,682 |
|
42.60 |
|
|
|
|
|
|
|
|
|
|
|
|
|
|
|
|
No compensation cost was recognized under the intrinsic value method for the three months ended March 31, 2012 and 2011. Had SENAO used the fair value method to recognize the compensation cost, there would have been no significant impact on the consolidated net income and earnings per share.
Had SENAO used the fair value method to evaluate the options using the Black-Scholes model, the assumptions of SENAO would have been as follows:
|
|
|
October 31,
2007 |
|
May 5,
2006 |
|
November 28,
2005 |
|
|
|
|
|
|
|
|
|
|
|
Expected dividend yield |
|
1.49 |
% |
— |
|
— |
|
|
Risk free interest rate |
|
2.00 |
% |
1.75 |
% |
2.00 |
% |
|
Expected life |
|
4.375 years |
|
4.375 years |
|
4.375 years |
|
|
Expected volatility |
|
39.82 |
% |
39.63 |
% |
43.40 |
% |
|
Weighted-average fair value of grants |
|
$ |
13.69 |
|
$ |
5.88 |
|
$ |
6.93 |
|
|
|
|
|
|
|
|
|
|
|
|
33
24. COMPENSATION, DEPRECIATION AND AMORTIZATION EXPENSES
|
|
|
Three Months Ended March 31, 2012 |
|
|
|
|
Operating |
|
Operating |
|
|
|
|
|
|
Costs |
|
Expenses |
|
Total |
|
|
|
|
|
|
|
|
|
|
|
Compensation expense |
|
|
|
|
|
|
|
|
Salaries |
|
$ |
3,240,311 |
|
$ |
2,860,037 |
|
$ |
6,100,348 |
|
|
Insurance |
|
281,476 |
|
237,800 |
|
519,276 |
|
|
Pension |
|
450,168 |
|
326,188 |
|
776,356 |
|
|
Other compensation |
|
1,916,693 |
|
1,366,479 |
|
3,283,172 |
|
|
|
|
|
|
|
|
|
|
|
|
|
$ |
5,888,648 |
|
$ |
4,790,504 |
|
$ |
10,679,152 |
|
|
|
|
|
|
|
|
|
|
|
Depreciation expense |
|
$ |
7,241,629 |
|
$ |
469,632 |
|
$ |
7,711,261 |
|
|
Amortization expense |
|
$ |
296,598 |
|
$ |
57,102 |
|
$ |
353,700 |
|
|
|
|
Three Months Ended March 31, 2011 |
|
|
|
|
Operating |
|
Operating |
|
|
|
|
|
|
Costs |
|
Expenses |
|
Total |
|
|
|
|
|
|
|
|
|
|
|
Compensation expense |
|
|
|
|
|
|
|
|
Salaries |
|
$ |
3,072,279 |
|
$ |
2,631,848 |
|
$ |
5,704,127 |
|
|
Insurance |
|
272,432 |
|
220,066 |
|
492,498 |
|
|
Pension |
|
435,031 |
|
310,388 |
|
745,419 |
|
|
Other compensation |
|
2,442,144 |
|
1,717,516 |
|
4,159,660 |
|
|
|
|
|
|
|
|
|
|
|
|
|
$ |
6,221,886 |
|
$ |
4,879,818 |
|
$ |
11,101,704 |
|
|
|
|
|
|
|
|
|
|
|
Depreciation expense |
|
$ |
7,287,955 |
|
$ |
426,987 |
|
$ |
7,714,942 |
|
|
Amortization expense |
|
$ |
289,316 |
|
$ |
54,858 |
|
$ |
344,174 |
|
25. INCOME TAX
a. Income tax expense consisted of the following:
|
|
|
Three Months Ended March 31 |
|
|
|
|
2012 |
|
2011 |
|
|
|
|
|
|
|
|
|
Income tax payable |
|
$ |
1,946,775 |
|
$ |
2,380,261 |
|
|
Income tax - deferred |
|
3,870 |
|
(61,699 |
) |
|
Adjustments of prior years’ income tax |
|
(730 |
) |
428 |
|
|
Foreign income tax |
|
4,651 |
|
— |
|
|
|
|
|
|
|
|
|
Income tax |
|
$ |
1,954,566 |
|
$ |
2,318,990 |
|
34
b. Net deferred income tax assets (liabilities) consisted of the following:
|
|
|
March 31 |
|
|
|
|
2012 |
|
2011 |
|
|
|
|
|
|
|
|
|
Current |
|
|
|
|
|
|
|
|
|
|
|
|
|
Deferred income tax assets (liabilities) |
|
|
|
|
|
|
Provision for doubtful accounts |
|
$ |
255,934 |
|
$ |
227,177 |
|
|
Valuation loss on inventory |
|
36,249 |
|
13,510 |
|
|
Loss carryforward |
|
27,540 |
|
— |
|
|
Unrealized accrued expense |
|
26,590 |
|
50,620 |
|
|
Estimated warranty liabilities |
|
8,630 |
|
22,016 |
|
|
Unrealized foreign exchange loss, net |
|
5,289 |
|
19,703 |
|
|
Investment tax credit |
|
3,402 |
|
8,995 |
|
|
Valuation loss (gain) on financial instruments, net |
|
(3,087 |
) |
969 |
|
|
Other |
|
4,709 |
|
16,331 |
|
|
|
|
365,256 |
|
359,321 |
|
|
Valuation allowance |
|
(254,258 |
) |
(234,008 |
) |
|
|
|
|
|
|
|
|
Net deferred income tax assets - current |
|
$ |
110,998 |
|
$ |
125,313 |
|
|
|
|
|
|
|
|
|
Noncurrent |
|
|
|
|
|
|
|
|
|
|
|
|
|
Deferred income tax assets (liabilities) |
|
|
|
|
|
|
Accrued pension cost |
|
$ |
249,172 |
|
$ |
303,046 |
|
|
Equity in losses of equity method investees, net |
|
48,483 |
|
9,670 |
|
|
Loss carryforward |
|
34,616 |
|
88,996 |
|
|
Impairment loss |
|
11,947 |
|
62,854 |
|
|
Investment tax credit |
|
3,487 |
|
7,239 |
|
|
Abandonment of equipment not approved by National Tax Administration |
|
107 |
|
37,562 |
|
|
Other |
|
(2,603 |
) |
3,189 |
|
|
|
|
345,209 |
|
512,556 |
|
|
Valuation allowance |
|
(4,849 |
) |
(13,029 |
) |
|
|
|
|
|
|
|
|
Net deferred income tax assets - noncurrent |
|
$ |
340,360 |
|
$ |
499,527 |
|
As of March 31, 2012, details for investment tax credit of CHPT are as follows:
|
|
|
|
|
Remaining |
|
|
|
|
|
|
|
|
Creditable |
|
Expiry |
|
|
Law/Statue |
|
Items |
|
Amount |
|
Year |
|
|
|
|
|
|
|
|
|
|
|
Statute for Upgrading Industries |
|
Personnel training expenditures |
|
$ |
1,823 |
|
2012 |
|
|
|
|
Personnel training expenditures |
|
3,288 |
|
2013 |
|
|
|
|
Purchase of machinery and equipment |
|
1,579 |
|
2012 |
|
|
|
|
Purchase of machinery and equipment |
|
199 |
|
2013 |
|
|
|
|
|
|
|
|
|
|
|
|
|
|
|
$ |
6,889 |
|
|
|
35
As of March 31, 2012, loss carryforward of CHIEF, Unigate, CEI, LED, CHI and SFD are as follows:
|
|
|
Total |
|
Unused |
|
Expiry |
|
|
Company |
|
Amounts |
|
Amounts |
|
Year |
|
|
|
|
|
|
|
|
|
|
|
CHIEF |
|
$ |
17,267 |
|
$ |
5,108 |
|
2015 |
|
|
|
|
14,943 |
|
14,943 |
|
2016 |
|
|
|
|
8,558 |
|
8,558 |
|
2017 |
|
|
|
|
1,409 |
|
1,409 |
|
2018 |
|
|
Unigate |
|
13 |
|
13 |
|
2017 |
|
|
|
|
6 |
|
6 |
|
2018 |
|
|
|
|
8 |
|
8 |
|
2020 |
|
|
|
|
23 |
|
23 |
|
2021 |
|
|
|
|
5 |
|
5 |
|
2022 |
|
|
CEI |
|
9 |
|
9 |
|
2021 |
|
|
|
|
3 |
|
3 |
|
2022 |
|
|
LED |
|
5,426 |
|
4,253 |
|
2018 |
|
|
|
|
7,571 |
|
7,571 |
|
2019 |
|
|
|
|
7,957 |
|
7,957 |
|
2020 |
|
|
|
|
10,458 |
|
10,458 |
|
2021 |
|
|
CHI |
|
3,376 |
|
574 |
|
2020 |
|
|
SFD |
|
1,258 |
|
1,258 |
|
2021 |
|
|
|
|
|
|
|
|
|
|
|
|
|
$ |
78,290 |
|
$ |
62,156 |
|
|
|
c. The related information under the Integrated Income Tax System is as follows:
|
|
|
March 31 |
|
|
|
|
2012 |
|
2011 |
|
|
|
|
|
|
|
|
|
Balance of Imputation Credit Account (“ICA”) |
|
|
|
|
|
|
Chunghwa |
|
$ |
4,831,010 |
|
$ |
4,483,339 |
|
|
|
|
|
|
|
|
|
The estimated and the actual creditable ratios distribution of Chunghwa’s of 2011 and 2010 for earnings were 17.46% and 18.76%, respectively. The imputation credit allocated to stockholders is based on its balance as of the date of dividend distribution. The estimated creditable ratio may change when the actual distribution of imputation credit is made.
d. Undistributed earnings information
All Chunghwa’s earnings generated prior to June 30, 1998 have been appropriated.
Chunghwa’s income tax returns have been examined by tax authorities through 2007. The following subsidiaries income tax returns have been examined by authorities through 2009: SENAO, CHIEF, Unigate, CHPT, CHSI and SHE. The following subsidiaries income tax returns have been examined by tax authorities through 2010: CHI, YYRP, LED and CIYP.
36
26. EARNINGS PER SHARE
EPS was calculated as follows:
|
|
|
Amount (Numerator) |
|
Weighted-
average
Number of |
|
Earnings Per Share
(Dollars) |
|
|
|
|
Income
Before
Income Tax |
|
Net Income |
|
Common Shares
(Thousand)
(Denominator) |
|
Income
Before
Income Tax |
|
Net Income |
|
|
|
|
|
|
|
|
|
|
|
|
|
|
|
Three months ended March 31, 2012 |
|
|
|
|
|
|
|
|
|
|
|
|
|
|
|
|
|
|
|
|
|
|
|
|
|
Basic EPS |
|
|
|
|
|
|
|
|
|
|
|
|
Income attributable to stockholders of the parent |
|
$ |
11,320,545 |
|
$ |
9,489,503 |
|
7,757,447 |
|
$ |
1.46 |
|
$ |
1.22 |
|
|
Effect of dilutive potential common stock |
|
|
|
|
|
|
|
|
|
|
|
|
SENAO’s stock options |
|
(2,254 |
) |
(2,254 |
) |
— |
|
|
|
|
|
|
Employee bonus |
|
— |
|
— |
|
25,386 |
|
|
|
|
|
|
|
|
|
|
|
|
|
|
|
|
|
|
|
Diluted EPS |
|
|
|
|
|
|
|
|
|
|
|
|
Income attributable to stockholders of the parent (including effect of dilutive potential common stock) |
|
$ |
11,318,291 |
|
$ |
9,487,249 |
|
7,782,833 |
|
$ |
1.45 |
|
$ |
1.22 |
|
|
|
|
|
|
|
|
|
|
|
|
|
|
|
Three months ended March 31, 2011 |
|
|
|
|
|
|
|
|
|
|
|
|
|
|
|
|
|
|
|
|
|
|
|
|
|
Basic EPS |
|
|
|
|
|
|
|
|
|
|
|
|
Income attributable to stockholders of the parent |
|
$ |
14,078,894 |
|
$ |
11,834,866 |
|
7,886,737 |
|
$ |
1.79 |
|
$ |
1.50 |
|
|
Effect of dilutive potential common stock |
|
|
|
|
|
|
|
|
|
|
|
|
SENAO’s stock options |
|
(1,685 |
) |
(1,685 |
) |
— |
|
|
|
|
|
|
Employee bonus |
|
— |
|
— |
|
27,383 |
|
|
|
|
|
|
|
|
|
|
|
|
|
|
|
|
|
|
|
Diluted EPS |
|
|
|
|
|
|
|
|
|
|
|
|
Income attributable to stockholders of the parent (including effect of dilutive potential common stock) |
|
$ |
14,077,209 |
|
$ |
11,833,181 |
|
7,914,120 |
|
$ |
1.78 |
|
$ |
1.50 |
|
In March 2007, the ARDF issued an Interpretation 96-052 that requires companies to recognize bonuses paid to employees, directors and supervisors as an expense rather than an appropriation of earnings beginning from January 1, 2008. According to the Interpretation 97-169 issued by ARDF in May 2008, Chunghwa presumed that the employee bonuses to be paid will be settled in shares and takes those shares into consideration when calculating the weighted average number of outstanding shares used in the calculation of diluted EPS if the shares have a dilutive effect for the three months ended March 31, 2012 and 2011. The number of shares is calculated by dividing the amount of bonuses by the closing price of the Chunghwa’s shares of the balance sheet date. The dilutive effect of the shares needs to be considered until the stockholders resolve the number of shares to be distributed to employees in their meeting in the following year.
The diluted earnings per share for the three months ended March 31, 2012 and 2011 were also due to the effect of potential common stock of stock options by SENAO.
37
27. PENSION PLAN
Chunghwa completed privatization plans on August 12, 2005. Chunghwa is required to pay all accrued pension obligations including service clearance payment, lump sum payment under civil service plan, additional separation payments, etc. upon the completion of the privatization in accordance with the Statute Governing Privatization of Stated-owned Enterprises. After paying all pension obligations for privatization, the plan assets of Chunghwa should be transferred to the Fund for Privatization of Government-owned Enterprises (the “Privatization Fund”) under the Executive Yuan. On August 7, 2006, Chunghwa transferred the remaining balance of fund to the Privatization Fund. However, according to the instructions of MOTC, Chunghwa is requested to pay all accrued pension obligations including service clearance payment, lump sum payment under civil service plan, additional separation payments, etc. upon the completion of the privatization.
The pension plan under the Labor Pension Act of ROC (the “LPA”) is considered as a defined contribution plan. Based on the LPA, Chunghwa and its subsidiaries make monthly contributions to employees’ individual pension accounts at 6% of monthly salaries and wages.
The Company’s pension plan is considered as a defined benefit plan under the Labor Standards Law that provide benefits based on an employee’s length of service and average six-month salary prior to retirement. Chunghwa and its subsidiaries contribute an amount no more than 15% of salaries paid each month to their respective pension funds (the Funds), which are administered by the Labor Pension Fund Supervisory Committee (the Committee) and deposited in the names of the Committees in the Bank of Taiwan.
Pension costs of the Company were $805,495 thousand ($743,052 thousand subject to defined benefit plan and $62,443 thousand subject to defined contribution plan) and $773,253 thousand ($716,772 thousand subject to defined benefit plan and $56,481 thousand subject to defined contribution plan) for the three months ended March 31, 2012 and 2011, respectively.
28. TRANSACTIONS WITH RELATED PARTIES
The ROC Government, one of Chunghwa’s customers held significant equity interest in Chunghwa. Chunghwa provides fixed-line services, wireless services, Internet and data and other services to the various departments and institutions of the ROC Government and other state-owned enterprises in the normal course of business and at arm’s-length prices. The information on service revenues from government bodies and related organizations have not been provided because details of the type of transactions were not summarized by Chunghwa. Chunghwa believes that all revenues and costs of doing business are reflected in the financial statements.
a. The Company engages in business transactions with the following related parties:
|
Company |
|
Relationship |
|
|
|
|
|
|
|
Taiwan International Standard Electronics Co., Ltd. (“TISE”) |
|
Equity-method investee |
|
|
Kingwaytek Technology Co., Ltd. Co., Ltd. (“KWT”) |
|
Equity-method investee |
|
|
Skysoft Co., Ltd. (“SKYSOFT”) |
|
Equity-method investee |
|
|
Dian Zuan Intergrating Marketing Co., Ltd. (“DZIM”) |
|
Equity-method investee |
|
|
So-net Entertainment Taiwan Limited (“So-net”) |
|
Equity-method investee |
|
|
Viettel - CHT Co., Ltd. (“Viettel - CHT”) |
|
Equity-method investee |
|
|
Huada Digital Corporation (“HDD”) |
|
Equity-method investee |
|
|
Senao Networks, Inc. (“SNI”) |
|
Equity-method investee of SENAO |
|
|
HopeTech Technologies Limited (“HopeTech”) |
|
Equity-method investee of SIS |
|
(Continued)
38
|
Company |
|
Relationship |
|
|
|
|
|
|
|
Senao Technical and Cultural Foundation (“STCF”) |
|
A nonprofit organization of which the funds donated by SENAO exceeds one third of its total funds |
|
|
Institute for Information Industry (“III”) |
|
Investor with significant influence over IISI |
|
|
International Integrated System, Inc. (“IISI”) |
|
Equity-method investee, which was a subsidiary of Chunghwa before Chunghwa lost control over IISI on June 24, 2011 |
|
|
ST-2 Satellite Ventures Pte., Ltd. (“STS”) |
|
Equity-method investee of CHTS |
|
|
Sochamp Technology Co., Ltd. (“Sochamp”) |
|
Equity-method investee of CHST |
|
|
United Daily News Co., Ltd. (“UDN”) |
|
Investor of significant influence over SFD |
|
|
udn Digital Co., Ltd. (“udnD”) |
|
Investor of significant influence over SFD |
|
|
Xiamen Sertec Business Technology Co., Ltd. (“Sertec”) |
|
Equity-method investee of COI |
|
(Concluded)
b. Significant transactions with the above related parties are summarized as follows:
|
|
|
March 31 |
|
|
|
|
2012 |
|
2011 |
|
|
|
|
Amount |
|
% |
|
Amount |
|
% |
|
|
1) Receivables |
|
|
|
|
|
|
|
|
|
|
|
|
|
|
|
|
|
|
|
|
|
Trade notes and accounts receivable |
|
|
|
|
|
|
|
|
|
|
So-net |
|
$ |
33,460 |
|
88 |
|
$ |
8,735 |
|
32 |
|
|
Hope Tech |
|
— |
|
— |
|
15,422 |
|
57 |
|
|
Others |
|
4,590 |
|
12 |
|
2,724 |
|
11 |
|
|
|
|
|
|
|
|
|
|
|
|
|
|
|
$ |
38,050 |
|
100 |
|
$ |
26,881 |
|
100 |
|
|
|
|
|
|
|
|
|
|
|
|
|
2) Prepaid expenses (include in other current assets) |
|
|
|
|
|
|
|
|
|
|
|
|
|
|
|
|
|
|
|
|
|
Others |
|
$ |
4 |
|
— |
|
$ |
476 |
|
— |
|
|
|
|
|
|
|
|
|
|
|
|
|
3) Refundable deposit |
|
|
|
|
|
|
|
|
|
|
|
|
|
|
|
|
|
|
|
|
|
Others |
|
$ |
— |
|
— |
|
$ |
383 |
|
— |
|
|
|
|
|
|
|
|
|
|
|
|
|
4) Payables |
|
|
|
|
|
|
|
|
|
|
|
|
|
|
|
|
|
|
|
|
|
Trade notes payable, accounts payable and accrued expenses |
|
|
|
|
|
|
|
|
|
|
STS |
|
$ |
132,325 |
|
36 |
|
$ |
— |
|
— |
|
|
IISI |
|
100,201 |
|
27 |
|
— |
|
— |
|
|
TISE |
|
64,855 |
|
18 |
|
109,775 |
|
69 |
|
|
Others |
|
34,882 |
|
10 |
|
48,347 |
|
31 |
|
|
|
|
332,263 |
|
91 |
|
158,122 |
|
100 |
|
|
Amounts collected in trust for others |
|
|
|
|
|
|
|
|
|
|
So-net |
|
22,896 |
|
6 |
|
— |
|
— |
|
|
Others |
|
11,556 |
|
3 |
|
— |
|
— |
|
|
|
|
34,452 |
|
9 |
|
— |
|
— |
|
|
|
|
|
|
|
|
|
|
|
|
|
|
|
$ |
366,715 |
|
100 |
|
$ |
158,122 |
|
100 |
|
39
|
|
|
March 31 |
|
|
|
|
2012 |
|
2011 |
|
|
|
|
Amount |
|
% |
|
Amount |
|
% |
|
|
5) |
Advances from customers (include in other current liabilities) |
|
|
|
|
|
|
|
|
|
|
|
|
|
|
|
|
|
|
|
|
|
|
|
Others |
|
$ |
2,739 |
|
— |
|
$ |
2,739 |
|
— |
|
|
|
|
|
|
|
|
|
|
|
|
|
|
6) |
Customers’ deposits |
|
|
|
|
|
|
|
|
|
|
|
|
|
|
|
|
|
|
|
|
|
|
|
Others |
|
$ |
1,670 |
|
— |
|
$ |
434 |
|
— |
|
|
|
|
|
Three Months Ended March 31 |
|
|
|
|
|
2012 |
|
2011 |
|
|
|
|
|
Amount |
|
% |
|
Amount |
|
% |
|
|
|
|
|
|
|
|
|
|
|
|
|
|
7) |
Revenues |
|
|
|
|
|
|
|
|
|
|
|
|
|
|
|
|
|
|
|
|
|
|
|
So-net |
|
$ |
91,924 |
|
— |
|
$ |
42,131 |
|
— |
|
|
|
HopeTech |
|
20,606 |
|
— |
|
32,898 |
|
— |
|
|
|
Others |
|
12,292 |
|
— |
|
16,438 |
|
— |
|
|
|
|
|
|
|
|
|
|
|
|
|
|
|
|
|
$ |
124,822 |
|
— |
|
$ |
91,467 |
|
— |
|
|
|
|
|
|
|
|
|
|
|
|
|
|
8) |
Operating costs and expenses |
|
|
|
|
|
|
|
|
|
|
|
|
|
|
|
|
|
|
|
|
|
|
|
STS |
|
$ |
101,625 |
|
— |
|
$ |
— |
|
— |
|
|
|
TISE |
|
91,887 |
|
— |
|
94,940 |
|
— |
|
|
|
IISI |
|
52,882 |
|
— |
|
— |
|
— |
|
|
|
SKYSOFT |
|
22,225 |
|
— |
|
13,240 |
|
— |
|
|
|
Others |
|
20,956 |
|
— |
|
23,959 |
|
— |
|
|
|
|
|
|
|
|
|
|
|
|
|
|
|
|
|
$ |
289,575 |
|
— |
|
$ |
132,139 |
|
— |
|
|
|
|
|
|
|
|
|
|
|
|
|
|
9) |
Non-operating income and gains |
|
|
|
|
|
|
|
|
|
|
|
|
|
|
|
|
|
|
|
|
|
|
|
Others |
|
$ |
7,803 |
|
1 |
|
$ |
7,817 |
|
1 |
|
|
|
|
|
|
|
|
|
|
|
|
|
|
10) |
Acquisitions of property, plant and equipment |
|
|
|
|
|
|
|
|
|
|
|
|
|
|
|
|
|
|
|
|
|
|
|
TISE |
|
$ |
34,064 |
|
1 |
|
$ |
37,639 |
|
1 |
|
Chunghwa has entered into a contract with ST-2 Satellite Ventures Pte., Ltd. on March 12, 2010 to lease capacity on the ST-2 satellite. This lease term is 15 years which will start from the commercial operation of ST-2 satellite and the total contract value is approximately $6,000,000 thousand (SG$260,723 thousand), which included a prepayment of $3,067,711 thousand, and the rest of amount will be paid annually when ST-2 satellite starts its commercial operation. ST-2 satellite was launched in May 2011, and began its commercial operation in August 2011. The total rental expense for the three months ended March 31, 2012 was $101,625 thousand, which consisted of a reduction of the prepayment of $51,128 thousand and an additional accrual of $50,497 thousand. The prepayment was $2,931,369 thousand (classified as other current assets $204,514 thousand, and other assets - others $2,726,855 thousand) as of March 31, 2012.
SENAO rents out part of its plant to SNI, and the rent is collected monthly.
40
The foregoing transactions with related parties were determined in accordance with mutual agreements.
29. PLEDGED ASSETS
The following assets are pledged as collaterals for short-term and long-term bank loans and contract deposits by LED, CHPT and CHTS.
|
|
|
March 31 |
|
|
|
|
2012 |
|
2011 |
|
|
|
|
|
|
|
|
|
Property, plant and equipment, net |
|
$ |
2,720,059 |
|
$ |
3,383,157 |
|
|
Restricted assets |
|
8,672 |
|
66,773 |
|
|
|
|
|
|
|
|
|
|
|
$ |
2,728,731 |
|
$ |
3,449,930 |
|
30. SIGNIFICANT COMMITMENTS AND CONTINGENCIES
As of March 31, 2012, the Company’s remaining commitments under non-cancelable contracts with various parties were as follows:
a. Acquisitions of land and buildings of $2,598 thousand.
b. Acquisitions of telecommunications equipment of $22,273,201 thousand.
c. Unused letters of credit of $300,000 thousand.
d. Contract to print billing, envelopes and marketing gifts of $17,401 thousand.
e. LED has already contracted to advance sale of land and building for $905,990 thousand, and collected $178,882 thousand in advance according to the contracts.
f. For the purpose of completion the construction, acquisition of the building construction license and registration ownerships of all buildings for LightEra Covent Garden Project, LED signed the trust deeds with Land Bank of Taiwan and China Real Estate Management Co., Ltd., for the fund management, property rights and related development to the extent of authority they are given.
Trust assets are as follow:
|
|
|
March 31, 2012 |
|
|
|
|
|
|
|
Land held for sale |
|
$ |
125,245 |
|
|
|
|
|
|
g. The Company also has non-cancelable operating leases covering certain buildings, computers, computer peripheral equipment and operation system software under contracts that expire in various years.
Future lease payments were as follows:
|
|
|
Amount |
|
|
|
|
|
|
|
2012 (from April 1, 2012 to December 31, 2012) |
|
$ |
1,466,012 |
|
|
2013 |
|
1,580,699 |
|
|
2014 |
|
1,284,771 |
|
|
2015 |
|
1,009,515 |
|
|
2016 and thereafter |
|
993,336 |
|
|
|
|
|
|
41
h. A commitment to contribute $2,000,000 thousand to a Piping Fund administered by the Taipei City Government, of which $1,000,000 thousand was contributed by Chunghwa on August 15, 1996 (classified as long-term investment - other monetary assets). If the fund is not sufficient, Chunghwa will contribute the remaining $1,000,000 thousand upon notification from the Taipei City Government.
31. FAIR VALUE OF FINANCIAL INSTRUMENTS
a. Carrying amount and fair value of financial instruments were as follows:
|
|
|
March 31 |
|
|
|
|
2012 |
|
2011 |
|
|
|
|
Carrying |
|
Fair |
|
Carrying |
|
Fair |
|
|
|
|
Amount |
|
Value |
|
Amount |
|
Value |
|
|
|
|
|
|
|
|
|
|
|
|
|
Assets |
|
|
|
|
|
|
|
|
|
|
Cash and cash equivalents |
|
$ |
69,938,896 |
|
$ |
69,938,896 |
|
$ |
75,002,169 |
|
$ |
75,002,169 |
|
|
Financial assets at fair value through profit or loss |
|
65,023 |
|
65,023 |
|
79,443 |
|
79,443 |
|
|
Available-for-sale financial assets |
|
2,724,087 |
|
2,724,087 |
|
2,162,591 |
|
2,162,591 |
|
|
Held-to-maturity financial assets - current |
|
500,266 |
|
500,266 |
|
2,062,915 |
|
2,062,915 |
|
|
Trade notes and accounts receivable, net |
|
22,037,757 |
|
22,037,757 |
|
19,530,851 |
|
19,530,851 |
|
|
Receivable from related parties |
|
38,050 |
|
38,050 |
|
26,881 |
|
26,881 |
|
|
Other current monetary assets |
|
1,667,273 |
|
1,667,273 |
|
2,637,635 |
|
2,637,635 |
|
|
Restricted assets - current |
|
— |
|
— |
|
39,005 |
|
39,005 |
|
|
Financial assets carried at cost |
|
2,758,779 |
|
— |
|
2,739,335 |
|
— |
|
|
Available-for-sale financial assets - noncurrent |
|
3,211,161 |
|
3,211,161 |
|
— |
|
— |
|
|
Held-to-maturity financial assets - noncurrent |
|
14,590,889 |
|
14,590,889 |
|
9,973,059 |
|
9,973,059 |
|
|
Other noncurrent monetary assets |
|
1,000,000 |
|
1,000,000 |
|
1,000,000 |
|
1,000,000 |
|
|
Refundable deposits |
|
1,653,679 |
|
1,653,679 |
|
1,380,145 |
|
1,380,145 |
|
|
Restricted assets - noncurrent |
|
8,672 |
|
8,672 |
|
63,439 |
|
63,439 |
|
|
Liabilities |
|
|
|
|
|
|
|
|
|
|
Short-term loans |
|
75,000 |
|
75,000 |
|
115,000 |
|
115,000 |
|
|
Short-term bills payable |
|
— |
|
— |
|
29,977 |
|
29,977 |
|
|
Financial liabilities at fair value through profit or loss |
|
803 |
|
803 |
|
7,589 |
|
7,589 |
|
|
Trade notes and accounts payable |
|
12,630,673 |
|
12,633,230 |
|
9,183,150 |
|
9,183,150 |
|
|
Payable to related parties |
|
366,715 |
|
366,715 |
|
158,122 |
|
158,122 |
|
|
Accrued expenses |
|
15,042,834 |
|
15,042,834 |
|
15,890,445 |
|
15,890,445 |
|
|
Payables to equipment suppliers (included in “other current liabilities”) |
|
1,755,372 |
|
1,755,372 |
|
1,304,937 |
|
1,304,937 |
|
|
Amounts collected in trust for others (included in “other current liabilities”) |
|
1,361,600 |
|
1,361,600 |
|
1,676,680 |
|
1,676,680 |
|
|
Payables to contractors (included in “other current liabilities”) |
|
1,247,230 |
|
1,247,230 |
|
697,783 |
|
697,783 |
|
|
Refundable customers’ deposits (included in “other current liabilities”) |
|
1,081,913 |
|
1,081,913 |
|
1,102,520 |
|
1,102,520 |
|
|
Current portion of long-term loans |
|
683,723 |
|
683,723 |
|
306,802 |
|
306,802 |
|
|
Long-term loans |
|
1,050,000 |
|
1,050,000 |
|
3,123,141 |
|
3,123,141 |
|
|
Customers’ deposits |
|
4,954,927 |
|
4,954,927 |
|
5,834,716 |
|
5,834,716 |
|
|
|
|
|
|
|
|
|
|
|
|
|
|
|
b. Methods and assumptions used in the estimation of fair values of financial instruments:
1) The fair values of certain financial instruments recognized in the balance sheet generally correspond to the market prices of the financial assets. Because of the short maturities of these instruments, the carrying value represents a reasonable basis to estimate fair values. This method does not apply to the financial instruments discussed in Notes 2, 3, and 4 below.
2) If the financial instruments have quoted market prices in an active market, the quoted market prices are viewed as fair values. If the market price of the other financial instruments are not readily available, valuation techniques are used incorporating estimates and assumptions that are consistent with prevailing market conditions.
42
3) Financial assets carried at cost are investments in nonlisted shares, which have no quoted prices in an active market and entail an unreasonably high cost to obtain verifiable fair values. Therefore, no fair value is presented.
4) The fair value of long-term loans (including current portion) is discounted based on projected cash flow which approximate their carrying amounts. The projected cash flows were discounted using the interest rate of similar long-term loans.
c. Fair value of financial assets and liabilities using quoted market price or valuation techniques were as follows:
|
|
|
Amount Based on Quoted
Market Price |
|
Amount Determined Using
Valuation Techniques |
|
|
|
|
March 31 |
|
March 31 |
|
|
|
|
2012 |
|
2011 |
|
2012 |
|
2011 |
|
|
|
|
|
|
|
|
|
|
|
|
|
Assets |
|
|
|
|
|
|
|
|
|
|
Financial assets at fair value through profit or loss |
|
$ |
46,318 |
|
$ |
78,798 |
|
$ |
18,705 |
|
$ |
645 |
|
|
Available-for-sale financial assets |
|
5,859,223 |
|
2,060,687 |
|
76,025 |
|
101,904 |
|
|
Liabilities |
|
|
|
|
|
|
|
|
|
|
Financial liabilities at fair value through profit or loss |
|
31 |
|
481 |
|
772 |
|
7,108 |
|
|
|
|
|
|
|
|
|
|
|
|
|
|
|
d. Information about financial risks
1) Market risk
The foreign exchange rate fluctuations would result in the Company’s foreign-currency-dominated assets and liabilities, outstanding currency swap contracts, and forward exchange contracts exposed to rate risk.
The fluctuations of market price would result in the index future contracts exposed to price risk.
The financial instruments categorized as available-for-sale financial assets are mainly listed stocks and open-end mutual funds and corporate bonds. Therefore, the market risk is the fluctuations of market price. In order to manage this risk, the Company would assess the risk before investing, therefore, no material market risk are anticipated.
2) Credit risk
Credit risk represents the potential loss that would be incurred by the Company if the counter-parties or third-parties breached contracts. Financial instruments with positive fair values at the balance sheet date are evaluated for credit risk. The counter-parties or third-parties of the aforementioned financial instruments are reputable financial institutions and corporations. Management does not expect the Company’s exposure to default by those parties to be material. The company held a variety of financial instruments, the maximum credit exposed amount is the same as their carrying amounts.
3) Liquidity risk
The Company has sufficient operating capital to meet cash needs upon settlement of derivative financial instruments. Therefore, the liquidity risk is low.
43
The financial instruments of the Company categorized as available-for-sale financial assets are publicly-traded, easily converted to cash. Therefore, no material liquidity risk is anticipated. The financial instruments categorized as financial assets carried at cost are investments that do not have a quoted market price in an active market. Therefore, material liquidity risk is anticipated.
4) Cash flow interest rate risk
The Company engages in investments in fixed-interest-rate debt securities. Therefore, cash flows from such securities are not expected to fluctuate significantly due to changes in market interest rates.
32. ADDITIONAL DISCLOSURES
Following are the additional disclosures required by the SFC for Chunghwa and its investees:
a. Financing provided: None.
b. Endorsement/guarantee provided: Please see Table 1.
c. Marketable securities held: Please see Table 2.
d. Marketable securities acquired and disposed of at costs or prices at least $100 million or 20% of the paid-in capital: Please see Table 3.
e. Acquisition of individual real estate at costs of at least $100 million or 20% of the paid-in capital: None.
f. Disposal of individual real estate at prices of at least $100 million or 20% of the paid-in capital: None.
g. Total purchases from or sales to related parties amounting to at least $100 million or 20% of the paid-in capital: Please see Table 4.
h. Receivables from related parties amounting to $100 million or 20% of the paid-in capital: Please see Table 5.
i. Names, locations, and other information of investees on which the Company exercises significant influence: Please see Table 6.
j. Financial transactions: Please see Notes 5 and 31.
k. Investment in Mainland China: Please see Table 7.
l. Intercompany relationships and significant intercompany transaction: Please see Table 8.
33. THE FINANCIAL INFORMATION OF OPERATING SEGMENTS
Segment information: Please see Table 9.
44
34. OTHERS
The significant information of foreign-currency financial assets and liabilities as below:
|
|
|
March 31 |
|
|
|
|
2012 |
|
2011 |
|
|
|
|
Foreign
Currencies
(Thousands) |
|
Exchange
Rate |
|
New Taiwan
Dollars
(Thousands) |
|
Foreign
Currencies
(Thousands) |
|
Exchange
Rate |
|
New Taiwan
Dollars
(Thousands) |
|
|
|
|
|
|
|
|
|
|
|
|
|
|
|
|
|
Financial assets |
|
|
|
|
|
|
|
|
|
|
|
|
|
|
|
|
|
|
|
|
|
|
|
|
|
|
|
|
|
Monetary items |
|
|
|
|
|
|
|
|
|
|
|
|
|
|
Cash |
|
|
|
|
|
|
|
|
|
|
|
|
|
|
USD |
|
$ |
21,595 |
|
29.51 |
|
$ |
637,283 |
|
$ |
26,124 |
|
29.40 |
|
$ |
769,217 |
|
|
HKD |
|
112,157 |
|
3.80 |
|
426,197 |
|
71,442 |
|
3.78 |
|
269,837 |
|
|
JPY |
|
83,411 |
|
0.36 |
|
30,028 |
|
38,803 |
|
0.36 |
|
13,775 |
|
|
SGD |
|
4,657 |
|
23.49 |
|
109,386 |
|
12,934 |
|
23.34 |
|
301,881 |
|
|
RMB |
|
48,639 |
|
4.69 |
|
228,116 |
|
292 |
|
4.51 |
|
1,315 |
|
|
VND |
|
22,080,441 |
|
0.00137 |
|
30,250 |
|
— |
|
0.00137 |
|
— |
|
|
Accounts receivable |
|
|
|
|
|
|
|
|
|
|
|
|
|
|
USD |
|
181,289 |
|
29.51 |
|
5,349,842 |
|
138,068 |
|
29.40 |
|
4,059,206 |
|
|
HKD |
|
58,858 |
|
3.80 |
|
223,778 |
|
53,607 |
|
3.78 |
|
202,473 |
|
|
SGD |
|
— |
|
23.49 |
|
— |
|
1,023 |
|
23.34 |
|
23,871 |
|
|
Available-for-sale financial assets |
|
|
|
|
|
|
|
|
|
|
|
|
|
|
USD |
|
73,546 |
|
29.51 |
|
2,170,334 |
|
35,321 |
|
29.40 |
|
1,038,440 |
|
|
Investments accounted for using equity method |
|
|
|
|
|
|
|
|
|
|
|
|
|
|
USD |
|
735 |
|
29.51 |
|
21,694 |
|
907 |
|
29.40 |
|
26,666 |
|
|
VND |
|
187,270,073 |
|
0.00137 |
|
256,560 |
|
173,899,270 |
|
0.00137 |
|
238,242 |
|
|
SGD |
|
20,890 |
|
23.49 |
|
490,707 |
|
17,521 |
|
23.34 |
|
408,944 |
|
|
|
|
|
|
|
|
|
|
|
|
|
|
|
|
|
Financial liabilities |
|
|
|
|
|
|
|
|
|
|
|
|
|
|
|
|
|
|
|
|
|
|
|
|
|
|
|
|
|
Monetary items |
|
|
|
|
|
|
|
|
|
|
|
|
|
|
Payable to suppliers |
|
|
|
|
|
|
|
|
|
|
|
|
|
|
USD |
|
$ |
165,815 |
|
29.51 |
|
$ |
4,893,190 |
|
$ |
114,453 |
|
29.40 |
|
$ |
3,364,906 |
|
|
EUR |
|
32,498 |
|
39.41 |
|
1,280,740 |
|
23,545 |
|
41.71 |
|
982,081 |
|
|
SGD |
|
5,708 |
|
23.49 |
|
134,088 |
|
389 |
|
23.34 |
|
9,091 |
|
|
RMB |
|
15,496 |
|
4.69 |
|
72,678 |
|
— |
|
4.51 |
|
— |
|
35. PRE-DISCLOSURE FOR ADOPTION OF INTERNATIONAL FINANCIAL REPORTING STANDARDS
Under Rule No. 0990004943 issued by the Financial Supervisory Commission (FSC) on February 2, 2010, the Company pre-discloses the following information on the adoption of International Financial Reporting Standards (IFRSs) as follows, except for SENAO International Co., Ltd. and its subsidiaries, the related affected amount and information of subsidiaries and the Company’s long-term equity investments have not been reviewed.
a. On May 14, 2009, the FSC announced the “Framework for Adoption of International Financial Reporting Standards by Companies in the ROC.” In this framework, starting 2013, companies with shares listed on the TSE or traded on the Taiwan GreTai Securities Market or Emerging Stock Market should prepare their financial statements in accordance with the Guidelines Governing the Preparation of Financial Reports by Securities Issuers and the International Financial Reporting Standards, International Accounting Standards, and the Interpretations as well as related guidance translated by the ARDF and issued by the FSC. To comply with this framework, the Company has set up a project
45
team and made a plan to adopt the IFRSs. Leading the implementation of this plan is the President, Mr. Chang. The main contents of the plan, anticipated schedule and status of execution as of March 31, 2012 were as follows:
|
Contents of Plan |
|
Responsible Department |
|
Status of
Execution |
|
|
|
|
|
|
|
|
1) |
Evaluation Phase: August 1, 2009 - March 31, 2010 |
|
|
|
|
|
|
|
|
|
|
|
|
|
a) Make IFRSs adoption plan and set up a IFRSs project team |
|
Accounting department |
|
Completed |
|
|
b) Compare and analyze the differences between current accounting policies and IFRSs |
|
Accounting department |
|
Completed |
|
|
c) Evaluate the modification of current accounting policies for IFRSs adoption |
|
Accounting department |
|
Completed |
|
|
d) Evaluate the adoption of IFRS 1, “First-time Adoption of International Financial Reporting Standards” |
|
Accounting department |
|
Completed |
|
|
e) Conduct the first stage of internal employee training |
|
Accounting department |
|
Completed |
|
|
|
|
|
|
|
|
2) |
Preparation Phase: April 1, 2010 - December 31, 2011 |
|
|
|
|
|
|
|
|
|
|
|
|
|
a) Determine accounting policies in accordance with IFRSs |
|
Accounting department |
|
Completed |
|
|
b) Choose the optional exemptions under IFRS 1, “First-time Adoption of International Financial Reporting Standards” |
|
Accounting department |
|
Completed |
|
|
c) Modify related information system |
|
Information technology department, accounting department |
|
Completed |
|
|
d) Amend internal control and related policies |
|
Accounting department, related departments |
|
Completed |
|
|
e) Conduct the second stage of internal employee training |
|
Accounting department |
|
Completed |
|
|
|
|
|
|
|
|
3) |
Application Phase: January 1, 2012 - December 31, 2013 |
|
|
|
|
|
|
|
|
|
|
|
|
|
a) Prepare opening IFRSs balance sheet |
|
Accounting department |
|
Completed |
|
|
b) Prepare IFRS comparative financial statements for the year ended December 31, 2012. |
|
Accounting department |
|
In progress |
|
|
c) Prepare financial statements in accordance with IFRSs |
|
Accounting department |
|
In progress |
b. Based on IFRS 1 “First-time adoption of International Financial Reporting Standards”, when the Company first adopts IFRSs, the Company should apply the IFRSs to establish its accounting policies, prepare its financial statements and make required adjustments retroactively to the transition date (January 1, 2012). IFRS 1 provided several optional exemptions. The main exemptions adopted by the Company were discussed as follows:
1) Business combination
The Company elected not to apply IFRS 3 retrospectively to business combinations occurred on or before December 31, 2011.
46
2) Share-based payment transactions
The Company elected not to apply IFRS 2 retrospectively to the share-based payment transactions which were granted and vested on or before December 31, 2011.
3) Deemed costs
The Company elected to measure its revalued land at the date of transition to IFRSs at its revalued amount determined under ROC GAAP as its deemed cost.
4) Employee benefits
The Company elected to recognize all unrecognized cumulative actuarial gains and losses as retained earnings as of January 1, 2012.
The impacts of the aforementioned optional exemptions were included in the following part d. of “explanation for the adjustments of IFRSs transition”.
c. The Company had assessed the material differences and the impacts between the existing accounting policies and the accounting policies to be adopted under IFRSs as follows:
1) Reconciliation of consolidated balance sheet as of January 1, 2012
|
|
|
|
|
|
|
|
|
|
|
|
|
|
|
|
|
|
|
|
|
|
|
|
Adjustments |
|
|
|
|
|
|
|
|
|
|
|
|
Differences in |
|
|
|
|
|
|
|
|
|
|
ROC GAAP |
|
Recognitions and |
|
Differences in |
|
IFRSs |
|
|
|
|
Items |
|
Amount |
|
Measurements |
|
Presentations |
|
Amount |
|
Items |
|
Notes |
|
|
|
|
|
|
|
|
|
|
|
|
|
|
|
|
|
Current assets |
|
$ |
106,538,985 |
|
$ |
(337,754 |
) |
$ |
(115,464 |
) |
$ |
106,085,767 |
|
Current assets |
|
4, 7, 9, 13 |
|
|
Long-term investments |
|
19,876,491 |
|
(5,553 |
) |
(1,000,000 |
) |
18,870,938 |
|
Long-term investments |
|
10,13 |
|
|
Property, plant and equipment |
|
302,612,014 |
|
— |
|
(7,602,063 |
) |
295,009,951 |
|
Property, plant and equipment |
|
1, 2, 13 |
|
|
|
|
|
|
— |
|
9,060,081 |
|
9,060,081 |
|
Investment property |
|
1,2 |
|
|
Intangible assets |
|
6,330,253 |
|
— |
|
12,475 |
|
6,342,728 |
|
Intangible assets |
|
13 |
|
|
Other assets |
|
7,562,539 |
|
581,839 |
|
(334,947 |
) |
7,809,431 |
|
Other noncurrent assets |
|
1, 2, 4, 5, 6, 7,13 |
|
|
|
|
|
|
|
|
|
|
|
|
|
|
|
|
|
Total |
|
$ |
442,920,282 |
|
$ |
238,532 |
|
$ |
20,082 |
|
$ |
443,178,896 |
|
Total |
|
|
|
|
|
|
|
|
|
|
|
|
|
|
|
|
|
|
|
Current liabilities |
|
$ |
59,280,808 |
|
$ |
(72,301 |
) |
$ |
— |
|
$ |
59,208,507 |
|
Current liabilities |
|
7, 9 |
|
|
Noncurrent liabilities |
|
3,635,835 |
|
1,962,186 |
|
— |
|
5,598,021 |
|
Long-term liabilities |
|
7, 8 |
|
|
Reserve for land value incremental tax |
|
94,986 |
|
— |
|
(94,986 |
) |
— |
|
|
|
4 |
|
|
Other liabilities |
|
6,866,005 |
|
1,549,205 |
|
115,068 |
|
8,530,278 |
|
Other noncurrent liabilities |
|
4, 6 |
|
|
Total liabilities |
|
69,877,634 |
|
3,439,090 |
|
20,082 |
|
73,336,806 |
|
Total liabilities |
|
|
|
|
Common stock |
|
77,574,465 |
|
— |
|
— |
|
77,574,465 |
|
Common stock |
|
|
|
|
Additional paid-in capital |
|
169,536,289 |
|
20,621,248 |
|
— |
|
190,157,537 |
|
Additional paid-in capital |
|
6, 12 |
|
|
Retained earnings |
|
115,866,869 |
|
(18,050,922 |
) |
— |
|
97,815,947 |
|
Retained earnings |
|
3, 5, 6, 7, 8, 9, 10, 11, 12 |
|
|
Other adjustments |
|
5,753,403 |
|
(5,724,647 |
) |
— |
|
28,756 |
|
Other adjustments |
|
3, 6, 10 |
|
|
Total equity attributable to stockholders of the parent |
|
368,731,026 |
|
(3,154,321 |
) |
— |
|
365,576,705 |
|
Total equity attributable to shareholders of the parent |
|
|
|
|
Minority interests in subsidiaries |
|
4,311,622 |
|
(46,237 |
) |
— |
|
4,265,385 |
|
Noncontrolling interest |
|
5, 6, 10, 11 |
|
|
Total stockholders’ equity |
|
373,042,648 |
|
(3,200,558 |
) |
— |
|
369,842,090 |
|
Total shareholders ‘ equity |
|
|
|
|
|
|
|
|
|
|
|
|
|
|
|
|
|
|
|
Total |
|
$ |
442,920,282 |
|
$ |
238,532 |
|
$ |
20,082 |
|
$ |
443,178,896 |
|
Total |
|
|
|
2) Reconciliation of consolidated balance sheet as of March 31, 2012
|
|
|
|
|
|
|
|
|
|
|
|
|
|
|
|
|
|
|
|
|
|
|
Adjustments |
|
|
|
|
|
|
|
|
|
|
|
|
Differences in |
|
|
|
|
|
|
|
|
|
|
ROC GAAP |
|
Recognitions and |
|
Differences in |
|
IFRSs |
|
|
|
|
Items |
|
Amount |
|
Measurements |
|
Presentations |
|
Amount |
|
Items |
|
Notes |
|
|
|
|
|
|
|
|
|
|
|
|
|
|
|
|
Current assets |
|
$ |
110,793,015 |
|
$ |
(390,390 |
) |
$ |
(110,998 |
) |
$ |
110,291,627 |
|
Current assets |
|
4, 7, 9, 13 |
|
Long-term investments |
|
24,277,801 |
|
(7,555 |
) |
(1,000,000 |
) |
23,270,246 |
|
Long-term investments |
|
10, 12, 13 |
|
Property, plant and equipment |
|
300,698,722 |
|
— |
|
(7,605,051 |
) |
293,093,671 |
|
Property, plant and equipment |
|
1, 2, 13 |
|
|
|
|
|
— |
|
9,055,986 |
|
9,055,986 |
|
Investment property |
|
1, 2 |
|
Intangible assets |
|
6,128,271 |
|
— |
|
10,158 |
|
6,138,429 |
|
Intangible assets |
|
13 |
|
Other assets |
|
7,496,996 |
|
549,508 |
|
(339,832 |
) |
7,706,672 |
|
Other noncurrent assets |
|
1, 2, 4, 5, 6, 7,13 |
|
|
|
|
|
|
|
|
|
|
|
|
|
|
|
Total |
|
$ |
449,394,805 |
|
$ |
151,563 |
|
$ |
10,263 |
|
$ |
449,556,631 |
|
Total |
|
|
|
|
|
|
|
|
|
|
|
|
|
|
|
|
|
|
|
|
|
|
|
|
|
|
|
|
|
|
(Continued)
47
|
|
|
|
|
|
|
|
|
|
|
|
|
|
|
|
|
|
|
|
|
|
|
Adjustments |
|
|
|
|
|
|
|
|
|
|
|
Differences in |
|
|
|
|
|
|
|
|
|
ROC GAAP |
|
Recognitions and |
|
Differences in |
|
IFRSs |
|
|
|
Items |
|
Amount |
|
Measurements |
|
Presentations |
|
Amount |
|
Items |
|
Notes |
|
|
|
|
|
|
|
|
|
|
|
|
|
|
|
Current liabilities |
|
$ |
55,839,535 |
|
$ |
(91,412 |
) |
$ |
— |
|
$ |
55,748,123 |
|
Current liabilities |
|
7, 9 |
|
Noncurrent liabilities |
|
3,639,481 |
|
1,788,685 |
|
— |
|
5,428,166 |
|
Long-term liabilities |
|
7, 8 |
|
Reserve for land value incremental tax |
|
94,986 |
|
— |
|
(94,986 |
) |
— |
|
|
|
4 |
|
Other liabilities |
|
6,790,094 |
|
1,548,125 |
|
105,249 |
|
8,443,468 |
|
Other noncurrent liabilities |
|
4, 5, 6 |
|
Total liabilities |
|
66,364,096 |
|
3,245,398 |
|
10,263 |
|
69,619,757 |
|
Total liabilities |
|
|
|
|
|
|
|
|
|
|
|
|
|
|
|
|
|
Common stock |
|
77,574,465 |
|
— |
|
— |
|
77,574,465 |
|
Common stock |
|
|
|
Additional paid-in capital |
|
169,538,331 |
|
20,620,873 |
|
— |
|
190,159,204 |
|
Additional paid-in capital |
|
6, 12 |
|
Retained earnings |
|
125,356,372 |
|
(17,943,165 |
) |
— |
|
107,413,207 |
|
Retained earnings |
|
3, 5, 6, 7, 8, 9, 10, 11, 12 |
|
Other adjustments |
|
5,829,807 |
|
(5,724,530 |
) |
— |
|
105,277 |
|
Other adjustments |
|
3, 6, 10 |
|
Total equity attributable to stockholders of the parent |
|
378,298,975 |
|
(3,046,822 |
) |
— |
|
375,252,153 |
|
Total equity attributable to shareholders of the parent |
|
|
|
Minority interests in subsidiaries |
|
4,731,734 |
|
(47,013 |
) |
— |
|
4,684,721 |
|
Noncontrolling interest |
|
5, 6, 10, 11 |
|
Total stockholders’ equity |
|
383,030,709 |
|
(3,093,835 |
) |
— |
|
379,936,874 |
|
Total shareholders’ equity |
|
|
|
|
|
|
|
|
|
|
|
|
|
|
|
|
|
Total |
|
$ |
449,394,805 |
|
$ |
151,563 |
|
$ |
10,263 |
|
$ |
449,556,631 |
|
Total |
|
|
3) Reconciliation of consolidated statement of comprehensive income for three months ended March 31, 2012
|
|
|
|
|
|
|
|
|
|
|
|
|
|
|
|
|
|
|
|
|
|
|
Adjustments |
|
|
|
|
|
|
|
|
|
|
|
Differences in |
|
|
|
|
|
|
|
|
|
ROC GAAP |
|
Recognitions and |
|
Differences in |
|
IFRSs |
|
|
|
Items |
|
Amount |
|
Measurements |
|
Presentations |
|
Amount |
|
Items |
|
Notes |
|
|
|
|
|
|
|
|
|
|
|
|
|
|
|
Net revenues |
|
$ |
55,418,294 |
|
$ |
65,572 |
|
$ |
— |
|
$ |
55,483,866 |
|
Net revenues |
|
7, 8, 9 |
|
Operating costs |
|
(36,622,429 |
) |
41,778 |
|
(273 |
) |
(36,580,924 |
) |
Operating costs |
|
7, 9, 14 |
|
Gross profits |
|
18,795,865 |
|
107,350 |
|
(273 |
) |
18,902,942 |
|
Gross profits |
|
|
|
Operating expenses |
|
(7,464,950 |
) |
33,290 |
|
273 |
|
(7,431,387 |
) |
Operating expenses |
|
6, 7, 9, 11, 14 |
|
Income from operations |
|
11,330,915 |
|
140,640 |
|
— |
|
11,471,555 |
|
Income from operations |
|
|
|
Non-operating income and losses |
|
501,958 |
|
(1,744 |
) |
— |
|
500,214 |
|
Non-operating income and losses |
|
3, 10, 12, 14 |
|
Income before income tax |
|
11,832,873 |
|
138,896 |
|
— |
|
11,971,769 |
|
Income before income tax |
|
|
|
Income tax expense |
|
(1,954,566 |
) |
(31,933 |
) |
— |
|
(1,986,499 |
) |
Income tax expenses |
|
5 |
|
Consolidated net income |
|
$ |
9,878,307 |
|
$ |
106,963 |
|
$ |
— |
|
9,985,270 |
|
Consolidated net income |
|
|
|
|
|
|
|
|
|
|
|
(43,548 |
) |
Exchange differences arising from the translation of the foreign operations |
|
|
|
|
|
|
|
|
|
|
|
115,632 |
|
Unrealized valuation gain on available-for-sale financial assets |
|
|
|
|
|
|
|
|
|
|
|
72,084 |
|
Other comprehensive income - current period (after tax) |
|
|
|
|
|
|
|
|
|
|
|
$ |
10,057,354 |
|
Total comprehensive income |
|
|
d. Explanation for the adjustments of IFRSs transition:
1) Classification of investment property
On January 1, 2012, the assets that met definitions of investment property under IAS 40 “Investment Property” were reclassified from property, plant and equipment of $8,596,664 thousand, and other assets - idle assets of $463,417 thousand, to investment property. The total amount of reclassification was $9,060,081 thousand. On March 31, 2012, the assets that met definition of investment property were reclassified from property, plant and equipment, $8,592,569 thousand, and other assets - idle assets, $463,417 thousand, to investment property. The total amount of reclassification was $9,055,986 thousand.
2) Classification of leased assets and idle assets
Under ROC GAAP, leased and idle assets were classified as other assets; after the transition to IFRSs, leased and idle assets were reclassified to property, plant and equipment or investment property based on the nature of these assets.
48
The Company reclassified leased assets to property, plant and equipment and the amounts were $400,453 thousand and $397,724 thousand as of January 1, 2012 and March 31, 2012, respectively. Except for the abovementioned Item 1) which discussed the reclassification from idle assets to investment property, the Company reclassified the remaining idle assets to property, plant and equipment amounting to $436,619 thousand and $436,024 thousand, as of January 1, 2012 and March 31, 2012, respectively.
3) Deemed costs of property, plant and equipment
The Company elected to apply the optional exemption in IFRS 1. The management measured land (classified as property, plant and equipment and investment property under IFRSs) at its revalued amount which was determined under ROC GAAP as deemed costs. On January 1, 2012, the Company reclassified the unrealized revaluation increment (classified as stockholders’ equity) to retained earnings and the amount was $5,762,753 thousand. This reclassification did not affect total equity. Due to disposal of some revalued assets, unrealized revaluation increment reclassified to retained earnings was decreased by $117 thousand and unrealized revaluation increment as of March 31, 2012 was $5,762,636 thousand. As a result of the above adjustments, gain on disposal of property, plant and equipment was reduced by $117 thousand.
4) Classification of deferred income tax asset and liability, and valuation allowance
Under ROC GAAP, a deferred income tax asset and liability should be classified as current and noncurrent in accordance with the classification of its related asset or liability. When a deferred income tax asset and liability does not relate to an asset or liability, then it is classified as either current or noncurrent based on the expected length of time before it is realized or settled. However, under IFRSs, a deferred income tax asset and liability should be classified as noncurrent, and could not be netted.
Under ROC GAAP, if it is more likely than not that deferred income tax assets will not be realized, the valuation allowances are provided to the extent. However, under IFRSs, deferred income tax assets are only recognized when it is more likely than not to be realized, and the valuation allowance is not used under IFRSs.
Based on the Guidelines Governing the Preparation of Financial Reports by Securities Issuers, the reserve for land value incremental tax caused by revaluation of land is classified as long-term liabilities. Under IFRSs, if the Company elects to apply the IFRS 1 exemption and measure the revalued land using the carrying amount determined under ROC GAAP as its deemed cost, the related reserve for land value incremental tax should be classified as deferred income tax liabilities.
The Company reclassified its deferred income tax assets - current to noncurrent assets and the amounts were $115,464 thousand and $110,998 thousand as of January 1, 2012 and March 31, 2012, respectively. Further, deferred income tax liabilities, which were netted with deferred income tax assets under ROC GAAP, were reversed. As a result of such reversal, deferred income tax liabilities - noncurrent and deferred income tax assets - noncurrent were increased by $20,082 thousand and $10,263 thousand, respectively, and reserve for land value incremental tax of $94,986 thousand was also reclassified as deferred income tax liabilities - noncurrent under IFRSs.
5) Income tax
Based on IAS 12 “Income Taxes”, the income tax adjustments as a result of the transition to IFRSs are as follows: Deferred income tax assets were increased by $596,271 thousand and $564,423 thousand as of January 1, 2012 and March 31, 2012, respectively; retained earnings were increased by $587,418 thousand and $555,564 thousand as of January 1, 2012 and March 31, 2012, respectively; noncontrolling interest were increased by $8,853 thousand and $8,774 thousand as of January 1, 2012 and March 31, 2012, respectively. Deferred income tax liabilities were increased by $85 thousand as of March 31, 2012. For the three months ended March 31, 2012, due to the
49
adjustment of deferred income tax assets and deferred income tax liabilities (decreased by $31,848 thousand in deferred tax assets and increased by $85 thousand in deferred income tax liabilities), income tax expense was increased by $31,933 thousand.
6) Employee benefits
Under ROC GAAP, net transaction obligation that was resulted from the first time adoption of SFAS No. 18 “Pension” should be amortized on a straight-line basis over the average remaining service life of active plan participants and recognized as net periodic pension cost. After the transition to IFRSs, transitional rules in IAS 19 “Employee Benefits” did not apply, so the related amounts of net transaction obligation should be recognized at once and adjusted in retain earnings.
Further, under ROC GAAP, actuarial gains (losses) are recognized based on the corridor approach and the amounts are amortized over the average remaining service life of active plan participants. However, under IFRSs, the Company elected to recognize pension gains (losses) resulting from defined benefit plans as other comprehensive income immediately and subsequent reclassification to earnings is not permitted.
As a result of the aforementioned adjustments, other liabilities were increased by $1,549,205 thousand and $1,548,040 thousand as of January 1, 2012 and March 31, 2012, respectively; other noncurrent assets were decreased by $14,524 thousand and $15,022 thousand as of January 1, 2012 and March 31, 2012, respectively; retained earnings were decreased by $1,512,034 thousand and $1,511,833 thousand as of January 1, 2012 and March 31, 2012, respectively; unrecognized net losses of pension were decreased by $215 thousand as of January 1, 2012 and March 31, 2012; noncontrolling interests were decreased by $51,910 thousand and $51,444 thousand as of January 1, 2012 and March 31, 2012, respectively. For the three months ended March 31, 2012, pension cost under operating expense was decreased by $667 thousand.
Further, prior to Chunghwa’s privatization in 2005, the pension contributions were made according to the related regulations. After privatization, the pension obligations of retained employees that were civil employees and entitled to receive future monthly pension payments based on the “Labor Pension Act”, “Act of Privatization of Government-Owned Enterprises”, and “Enforcement Rules of Statute of Privatization of Government-Owned Enterprises” were borne by the government. The settlement impact upon privatization of $20,648,078 thousand calculated according to the actuarial report under IAS 19 shall be retroactively adjusted from retained earnings to additional paid-in capital- privatization at the date of transition of IFRSs.
7) Award credits (often known as “points”)
Under ROC GAAP, there’s no related guidance about award credits. After the transition to IFRSs, Chunghwa applied IFRIC 13 “Customer Royalty Program” retroactively. The award credit should be measured at its fair value to defer the recognition of revenue. When the customers redeem the points, the related revenues and costs shall be recognized. The guidance will replace Chunghwa’s current accounting policy that Chunghwa would accrue expenses when the award credits were given.
Accrued award credits liabilities (classified as other current liabilities) were decreased by $70,036 thousand and $88,786 thousand as of January 1, 2012 and March 31, 2012, respectively; receivables were increased by $12,128 thousand ($12,036 thousand was classified as current assets and $92 thousand was classified as noncurrent assets) and $15,193 thousand ($15,086 thousand was classified as current assets and $107 thousand was classified as noncurrent assets) as of January 1, 2012 and March 31, 2012, respectively; deferred award credits revenue (classified as long-term liabilities - deferred revenue) were increased by $36,370 thousand and $49,412 thousand as of January 1, 2012 and March 31, 2012, respectively; retained earnings were increased by $45,794 thousand and $54,567 thousand as of January 1, 2012 and March 31, 2012, respectively. The revenue was decreased by $9,977 thousand, the marketing expenses were decreased by $25,552 thousand and the operating cost was increased by $6,802 thousand for the three months ended March 31, 2012.
50
8) Recognition of revenue from providing fixed line connection service
Prior to privatization, according to the laws and regulations applicable to state-owned enterprises in Taiwan, Chunghwa recorded revenue from providing fixed line connection service at the time the service was performed. Under IFRSs, following the revenue recognition guidance, the above service revenue should be treated as deferred income and recognized over the time when the service is continuously provided.
Chunghwa should retrospectively adjust the deferred income of $1,925,816 thousand and $1,739,273 thousand as of January 1, 2012 and March 31, 2012, respectively, by decreasing retained earnings and increasing the deferred revenue from providing fixed line connection service (classified as long-term liabilities - deferred income). For the three months ended March 31, 2012, revenue from providing fixed line connection service was increased by $186,543 thousand.
9) Recognition of construction contract revenue
The construction contracts did not meet the criteria in IFRIC 15.11, so IAS 11 “Construction Contracts” does not apply. The Company could only recognize the revenues when the projects are completed and sold out based on IAS 18 “Revenue”. Due to the reasons mentioned above, the Company should reverse the revenue that was recognized based on percentage completion method.
Inventories were decreased by $392,040 thousand and $454,454 thousand as of January 1, 2012 and March 31, 2012, respectively; deferred marketing expenses (classified as other current assets) were increased by $42,250 thousand and $48,978 thousand as of January 1, 2012 and March 31, 2012, respectively; accrued expenses (classified as other current liabilities) were decreased by $2,265 thousand and $2,626 thousand as of January 1, 2012 and March 31, 2012, respectively; retained earnings were decreased by $347,525 thousand and $402,850 thousand as of January 1, 2012 and March 31, 2012, respectively. The construction revenue was decreased by $110,995 thousand, the construction cost was decreased by $48,581 thousand and the marking expenses were decreased by $7,089 thousand for the three months ended March 31, 2012.
10) Equity method investments
Associates and joint ventures that accounted for using equity method should also adopt IFRSs in coordinated with the Company’s transition to IFRSs. The main adjustment includes employee benefit and share-based payments, etc. Due to the adjustments, long-term investments were decreased by $5,553 thousand and $7,180 thousand as of January 1, 2012 and March 31, 2012, respectively; retained earnings were decreased by $39,681 thousand and $40,136 thousand as of January 1, 2012 and March 31, 2012, respectively; unrecognized net loss of pension was both decreased by $37,891 thousand as of January 1, 2012 and March 31, 2012; noncontrolling interest was decreased by $3,763 thousand and $4,935 thousand as of January 1, 2012 and March 31, 2012, respectively. Investment income from associates and joint ventures was decreased by $1,627 thousand for the three months ended March 31, 2012.
11) Share-based payment transactions
The employee stock options granted by subsidiary were not vested on the transition date. Therefore, the subsidiary should apply IFRS 2 “Share-based Payment” retroactively.
Under IFRSs, subsidiaries recognized the additional paid-in capital - employee stock option when the options were granted. Such paid-in capital - employee stock option does not belong to the equity attributable to parent company, so it should be regarded as noncontrolling interest. As of January 1, 2012, retained earnings were decreased by $583 thousand and noncontrolling interest was increased by $583 thousand. As of March 1, 2012, retained earnings were decreased by $592
51
thousand and noncontrolling interest was increased by $592 thousand. For the three months ended March 31, 2012, the company recognized compensation cost under general and administrative expense of $18 thousand.
12) Paid-in capital related to long-term investments
According to SFAS No. 5 “Long-term Investments under Equity Method” under ROC GAAP, when an investee issues new shares and original shareholders did not acquire new shares proportionately, and the changes in investor’s shareholdings resulting in the changes in the net equity value of the equity method investee attributable to the investor, such changes shall adjust additional paid-in capital and long-term investments. However, under IFRSs, if the changes did not cause the investor lose control over subsidiaries, the change shall be treated as equity transactions. When the Company applied IFRS 1, it did not apply IAS 27 “Consolidated and Separate Financial Statements” retroactively. Therefore, the Company could only comply with the rule in IFRSs FAQs published by Taiwan Stock Exchange, and reclassify the paid-in capitals which did not meet the definitions under IFRSs or Company Act and Regulation of Ministry of Economics Affairs to retained earnings. The Company reclassified such paid-in capital of $26,830 thousand as of January 1, 2012 to retained earnings. As of March 31, 2012, the paid-in capital from long-term investments recognized under ROC GAAP was decreased by $2,042 thousand; paid-in capital - disposal of subsidiary was increased by $1,667 thousand, and long-term investment was decreased by $375 thousand.
13) Presentation of consolidated balance sheets
a) Piping fund
As part of the government’s effort to upgrade the existing telecommunications infrastructure project, Chunghwa and other public utility companies were required by the ROC government to contribute a total of $1,000,000 thousand to a Piping Fund administered by the Taipei City Government. Since the net assets of this fund would be returned proportionately after the project was completed, in order to conform to the presentation of the financial statements under IFRSs, the fund was reclassified as other noncurrent assets.
b) Certified deposits with maturities of more than three months
Under ROC GAAP, cash and cash equivalents includes time deposits that are cancellable but without any loss of principal. Under IFRSs, cash equivalents are short-term, highly liquid investments that are readily convertible to known amounts of cash and which are subject to an insignificant risk of changes in value. Therefore, an investment normally qualifies as a cash equivalent only when it has a short maturity of three months or less from the date of acquisition.
Certified deposits with maturities of more than three months held by the Company were $40,709,500 thousand and $41,633,500 thousand as of January 1, 2012 and March 31, 2012, respectively. In order to conform to the presentation of the financial statements under IFRSs, such amounts were reclassified from cash to other monetary assets - current.
c) Deferred expense
Under IFRSs, the deferred expense, which was classified as other assets under ROC GAAP, was reclassified based on its nature. Deferred expenses belonged to decoration construction projects and advertisement signboard, etc. were reclassified as property, plant and equipment of $157,529 thousand and $153,770 thousand as of January 1, 2012 and March 31, 2012, respectively. Deferred expenses belonged to computer software were reclassified as intangible assets of $12,475 thousand and $10,158 thousand as of January 1, 2012 and March 31, 2012, respectively.
52
14) Presentation of consolidated statements of comprehensive income
After the transition to IFRSs, the consolidated statement of comprehensive income includes net income and other comprehensive income. Further, certain accounts were reclassified to conform to the presentation of the financial statements under IFRSs.
d. The Company has prepared the above assessments in compliance with (a) the 2010 version of the IFRSs translated by the ARDF and issued by the FSC and (b) the Guidelines Governing the Preparation of Financial Reports by Securities Issuers amended and issued by the FSC on December 22, 2011. These assessments may be changed as the FSC may issue new rules governing the adoption of IFRSs, and as other laws and regulations may be amended to comply with the adoption of IFRSs. Therefore, the above assessments may be affected, and differ from the new accounting policies that are drafted by IFRSs.
53
TABLE 1
CHUNGHWA TELECOM CO., LTD. AND SUBSIDIARIES
ENDORSEMENTS/GUARANTEES PROVIDED
THREE MONTHS ENDED MARCH 31, 2012
(In Thousands of New Taiwan Dollars, Unless Specified Otherwise)
|
|
|
|
|
Guaranteed Party |
|
Limits on
Endorsement/ |
|
|
|
|
|
Amount of
Endorsement/ |
|
Ratio of Accumulated
Endorsement/ |
|
Maximum |
|
|
No. |
|
Endorsement/Guarantee
Provider |
|
Name |
|
Nature of
Relationship
(Note 2) |
|
Guarantee Amount
Provided to Each
Guaranteed Party |
|
Maximum Balance for
the Period |
|
Ending Balance |
|
Guarantee
Collateralized by
Properties |
|
Guarantee to Net
Equity Per Latest
Financial Statements |
|
Endorsement/
Guarantee Amount
Allowable |
|
|
|
|
|
|
|
|
|
|
|
|
|
|
|
|
|
|
|
|
|
|
|
0 |
|
Chunghwa Telecom Co., Ltd. |
|
Donghwa Telecom Co., Ltd. |
|
b |
|
$ |
3,782,990 |
|
$ |
1,031,923 |
|
$ |
954,477 |
|
$ |
— |
|
0.3 |
% |
$ |
15,131,959 |
|
|
|
(Note 3) |
|
|
(Note 4) |
|
|
|
(Note 6) |
|
|
|
|
|
|
|
|
|
|
|
|
|
|
|
|
|
|
|
|
|
|
|
25 |
|
Yao Yong Real Property Co., Ltd. |
|
Light Era Development Co., Ltd. |
|
d |
|
3,859,207 |
|
2,150,000 |
|
2,150,000 |
|
2,150,000 |
|
0.5 |
% |
3,859,207 |
|
|
|
(Note 7) |
|
|
|
(Note 5) |
|
(Note 5) |
|
|
(Note 7) |
|
|
|
|
|
|
|
|
|
|
|
|
|
|
|
|
|
|
|
|
|
|
|
|
|
|
Note 1: Significant transactions between the Company and its subsidiaries or among subsidiaries are numbered as follows:
a. “0” for the Company.
b. Subsidiaries are numbered from “1”.
Note 2: Relationships between the endorsement/guarantee provider and the guaranteed party:
a. Trading partner.
b. Majority owned subsidiary.
c. The Company and subsidiary owns over 50% ownership of the investee company.
d. A subsidiary jointly owned by the Company and the Company’s directly-owned subsidiary.
e. Guaranteed by the Company according to the construction contract.
f. An investee company. The guarantees were provided based on the Company’s proportionate share in the investee company.
Note 3: The maximum amount of endorsement or guarantee is up to 1% of the total stockholders’ equity of the financial statements for the three months ended March 31, 2012 of the Company.
Note 4: The actual amount used by guaranteed party is $954,477 thousand.
Note 5: The actual amount used by guaranteed party is $1,650,000 thousand.
Note 6: The maximum amount of endorsement or guarantee is up to 4% of the total stockholders’ equity of the latest financial statements of the Company.
Note 7: The maximum amount of endorsement or guarantee is up to 200% of the asset value of the latest financial statements of Yao Yong Real Property Co., Ltd.
54
TABLE 2
CHUNGHWA TELECOM CO., LTD. AND SUBSIDIARIES
MARKETABLE SECURITIES HELD
MARCH 31, 2012
(Amounts in Thousands of New Taiwan Dollars, Unless Otherwise Specified)
|
|
|
|
|
|
|
|
|
|
|
March 31, 2012 |
|
|
|
|
No. |
|
Held Company Name |
|
Marketable Securities Type and Name |
|
Relationship with the
Company |
|
Financial Statement Account |
|
Shares
(Thousands/
Thousand Units) |
|
Carrying Value
(Note 5) |
|
Percentage of
Ownership |
|
Market Value or
Net Asset Value |
|
Note |
|
|
|
|
|
|
|
|
|
|
|
|
|
|
|
|
|
|
|
|
|
|
|
0 |
|
Chunghwa Telecom Co., Ltd. |
|
Stocks |
|
|
|
|
|
|
|
|
|
|
|
|
|
|
|
|
|
|
|
|
Senao International Co., Ltd. |
|
Subsidiary |
|
Investments accounted for using equity method |
|
71,773 |
|
$ |
1,684,305
(Note 10) |
|
28 |
|
$ |
9,904,695 |
|
Note 4 |
|
|
|
|
|
|
Light Era Development Co., Ltd. |
|
Subsidiary |
|
Investments accounted for using equity method |
|
300,000 |
|
4,422,825
(Note 10) |
|
100 |
|
4,424,453 |
|
Note 1 |
|
|
|
|
|
|
Chunghwa Investment Co., Ltd. |
|
Subsidiary |
|
Investments accounted for using equity method |
|
178,000 |
|
1,786,637
(Note 10) |
|
89 |
|
1,843,877 |
|
Note 1 |
|
|
|
|
|
|
Donghwa Telecom Co., Ltd. |
|
Subsidiary |
|
Investments accounted for using equity method |
|
223,190 |
|
870,919
(Note 10) |
|
100 |
|
870,919 |
|
Note 1 |
|
|
|
|
|
|
Chunghwa System Integration Co., Ltd. |
|
Subsidiary |
|
Investments accounted for using equity method |
|
60,000 |
|
723,715
(Note 10) |
|
100 |
|
684,566 |
|
Note 1 |
|
|
|
|
|
|
Taiwan International Standard Electronics Co., Ltd. |
|
Equity-method investee |
|
Investments accounted for using equity method |
|
1,760 |
|
709,852 |
|
40 |
|
992,403 |
|
Note 1 |
|
|
|
|
|
|
Chunghwa Telecom Singapore Pte., Ltd |
|
Subsidiary |
|
Investments accounted for using equity method |
|
26,383 |
|
690,872
(Note 10) |
|
100 |
|
690,872 |
|
Note 1 |
|
|
|
|
|
|
CHIEF Telecom Inc. |
|
Subsidiary |
|
Investments accounted for using equity method |
|
37,942 |
|
607,343
(Note 10) |
|
69 |
|
550,516 |
|
Note 1 |
|
|
|
|
|
|
International Integrated System, Inc. |
|
Equity-method investee |
|
Investments accounted for using equity method |
|
22,498 |
|
259,520 |
|
33 |
|
239,071 |
|
Note 1 |
|
|
|
|
|
|
Viettel-CHT Co., Ltd. |
|
Equity-method investee |
|
Investments accounted for using equity method |
|
— |
|
256,560 |
|
30 |
|
256,560 |
|
Note 1 |
|
|
|
|
|
|
Huada Digital Corporation |
|
Equity-method investee |
|
Investments accounted for using equity method |
|
25,000 |
|
250,778 |
|
50 |
|
250,778 |
|
Note 1 |
|
|
|
|
|
|
Chunghwa International Yellow Pages Co., Ltd. |
|
Subsidiary |
|
Investments accounted for using equity method |
|
15,000 |
|
204,202
(Note 10) |
|
100 |
|
204,202 |
|
Note 1 |
|
|
|
|
|
|
Prime Asia Investments Group Ltd. (B.V.I.) |
|
Subsidiary |
|
Investments accounted for using equity method |
|
6,960 |
|
174,899
(Note 10) |
|
100 |
|
175,126 |
|
Note 1 |
|
|
|
|
|
|
Skysoft Co., Ltd. |
|
Equity-method investee |
|
Investments accounted for using equity method |
|
4,438 |
|
125,290 |
|
30 |
|
87,602 |
|
Note 1 |
|
|
|
|
|
|
Spring House Entertainment Tech. Inc. |
|
Subsidiary |
|
Investments accounted for using equity method |
|
5,996 |
|
109,623
(Note 10) |
|
56 |
|
96,963 |
|
Note 1 |
|
|
|
|
|
|
Dian Zuan Integrating Marketing Co., Ltd. |
|
Equity-method investee |
|
Investments accounted for using equity method |
|
11,464 |
|
108,533 |
|
40 |
|
108,533 |
|
Note 1 |
|
|
|
|
|
|
Chunghwa Telecom Global, Inc. |
|
Subsidiary |
|
Investments accounted for using equity method |
|
6,000 |
|
90,832
(Note 10) |
|
100 |
|
105,550 |
|
Note 1 |
|
|
|
|
|
|
Kingwaytek Technology Co., Ltd. |
|
Equity-method investee |
|
Investments accounted for using equity method |
|
1,703 |
|
76,849 |
|
33 |
|
38,442 |
|
Note 1 |
|
|
|
|
|
|
Smartfun Digital Co., Ltd. |
|
Subsidiary |
|
Investments accounted for using equity method |
|
6,500 |
|
56,461
(Note 10) |
|
65 |
|
56,504 |
|
Note 1 |
|
|
|
|
|
|
Chunghwa Telecom Vietnam Co., Ltd. |
|
Subsidiary |
|
Investments accounted for using equity method |
|
— |
|
34,737
(Note 10) |
|
100 |
|
34,737 |
|
Note 1 |
|
|
|
|
|
|
So-net Entertainment Taiwan Co., Ltd. |
|
Equity-method investee |
|
Investments accounted for using equity method |
|
3,429 |
|
34,644 |
|
30 |
|
17,208 |
|
Note 1 |
|
|
|
|
|
|
Chunghwa Telecom Japan Co., Ltd. |
|
Subsidiary |
|
Investments accounted for using equity method |
|
1 |
|
22,858
(Note 10) |
|
100 |
|
22,858 |
|
Note 1 |
|
|
|
|
|
|
|
|
|
|
|
|
|
|
|
|
|
|
|
|
|
|
|
(Continued)
55
|
|
|
|
|
|
|
|
|
|
|
March 31, 2012 |
|
|
|
|
No. |
|
Held Company Name |
|
Marketable Securities Type and Name |
|
Relationship with the
Company |
|
Financial Statement Account |
|
Shares
(Thousands/
Thousand Units) |
|
Carrying Value
(Note 5) |
|
Percentage of
Ownership |
|
Market Value or
Net Asset Value |
|
Note |
|
|
|
|
|
|
|
|
|
|
|
|
|
|
|
|
|
|
|
|
|
|
|
|
|
|
|
Chunghwa Sochamp Technology Inc. |
|
Subsidiary |
|
Investments accounted for using equity method |
|
2,040 |
|
$ |
18,711
(Note 10) |
|
51 |
|
$ |
18,871 |
|
Note 1 |
|
|
|
|
|
|
New Prospect Investments Holdings Ltd. (B.V.I.) |
|
Subsidiary |
|
Investments accounted for using equity method |
|
— |
|
US$ |
—
(1 dollar
(Note 10) |
)
|
100 |
|
US$ |
—
(1 dollar |
) |
Note 2 |
|
|
|
|
|
|
Taipei Financial Center Corp. |
|
— |
|
Financial assets carried at cost - noncurrent |
|
172,927 |
|
1,789,530 |
|
12 |
|
1,608,027 |
|
Note 1 |
|
|
|
|
|
|
Industrial Bank of Taiwan II Venture Capital Co., Ltd. (IBT II) |
|
— |
|
Financial assets carried at cost - noncurrent |
|
20,000 |
|
200,000 |
|
17 |
|
210,964 |
|
Note 1 |
|
|
|
|
|
|
Global Mobile Corp. |
|
— |
|
Financial assets carried at cost - noncurrent |
|
7,617 |
|
77,018 |
|
3 |
|
65,843 |
|
Note 1 |
|
|
|
|
|
|
Innovation Works Development Fund, L.P. |
|
— |
|
Financial assets carried at cost - noncurrent |
|
— |
|
73,154 |
|
4 |
|
71,838 |
|
Note 1 |
|
|
|
|
|
|
iD Branding Ventures |
|
— |
|
Financial assets carried at cost - noncurrent |
|
6,750 |
|
67,500 |
|
8 |
|
62,070 |
|
Note 1 |
|
|
|
|
|
|
Innovation Works Limited |
|
— |
|
Financial assets carried at cost - noncurrent |
|
1,000 |
|
31,391 |
|
2 |
|
36,403 |
|
Note 1 |
|
|
|
|
|
|
CQi Energy Infocom Inc. |
|
— |
|
Financial assets carried at cost - noncurrent |
|
2,000 |
|
6,000 |
|
18 |
|
(128 |
) |
Note 1 |
|
|
|
|
|
|
|
|
|
|
|
|
|
|
|
|
|
|
|
|
|
|
|
|
|
|
|
RPTI Intergroup International Ltd. |
|
— |
|
Financial assets carried at cost - noncurrent |
|
4,765 |
|
— |
|
10 |
|
41,413 |
|
Note 1 |
|
|
|
|
|
|
Essence Technology Solution, Inc. |
|
— |
|
Financial assets carried at cost - noncurrent |
|
200 |
|
— |
|
7 |
|
638 |
|
Note 1 |
|
|
|
|
|
|
|
|
|
|
|
|
|
|
|
|
|
|
|
|
|
|
|
|
|
|
|
Beneficiary certificates (mutual fund) |
|
|
|
|
|
|
|
|
|
|
|
|
|
|
|
|
|
|
|
|
HSBC Glbl Emerging Markets Bd A Inc. |
|
— |
|
Available-for-sale financial assets |
|
304 |
|
172,231 |
|
— |
|
178,968 |
|
Note 3 |
|
|
|
|
|
|
Templeton Global Bond A (Acc) |
|
— |
|
Available-for-sale financial assets |
|
418 |
|
307,114 |
|
— |
|
322,904 |
|
Note 3 |
|
|
|
|
|
|
PIMCO Global Investment Grade Credit - Ins H Acc |
|
— |
|
Available-for-sale financial assets |
|
751 |
|
307,245 |
|
— |
|
330,472 |
|
Note 3 |
|
|
|
|
|
|
PIMCO GIS Total Return Bond Fund - H Institutional Class (Acc) |
|
— |
|
Available-for-sale financial assets |
|
770 |
|
534,453 |
|
— |
|
556,272 |
|
Note 3 |
|
|
|
|
|
|
Janus Flexible Income Bond Fund |
|
— |
|
Available-for-sale financial assets |
|
671 |
|
230,472 |
|
— |
|
241,150 |
|
Note 3 |
|
|
|
|
|
|
PIMCO GIS Diversified Bond Fund - H Institutional Class (Acc) |
|
— |
|
Available-for-sale financial assets |
|
984 |
|
347,452 |
|
— |
|
374,450 |
|
Note 3 |
|
|
|
|
|
|
Fidelity Funds - US Dollar Bond Fund Y-ACC-USD |
|
— |
|
Available-for-sale financial assets |
|
397 |
|
148,410 |
|
— |
|
148,019 |
|
Note 3 |
|
|
|
|
|
|
|
|
|
|
|
|
|
|
|
|
|
|
|
|
|
|
|
|
|
|
|
Stocks |
|
|
|
|
|
|
|
|
|
|
|
|
|
|
|
|
|
|
|
|
China Airlines Ltd. |
|
— |
|
Available-for-sale financial assets - noncurrent |
|
263,622 |
|
3,092,287 |
|
5 |
|
3,137,103 |
|
Note 4 |
|
|
|
|
|
|
|
|
|
|
|
|
|
|
|
|
|
|
|
|
|
|
|
|
|
|
|
Bond |
|
|
|
|
|
|
|
|
|
|
|
|
|
|
|
|
|
|
|
|
Taiwan Power Co. 2nd Unsecured Bond-EB Issue in 2005 |
|
— |
|
Held-to-maturity financial assets |
|
— |
|
307,721 |
|
— |
|
307,721 |
|
Note 6 |
|
|
|
|
|
|
Taiwan Power Co. 2nd Unsecured Bond-EB Issue in 2005 |
|
— |
|
Held-to-maturity financial assets |
|
— |
|
204,701 |
|
— |
|
204,701 |
|
Note 6 |
|
|
|
|
|
|
Chinese Petroleum Corporation 1st Unsecured Corporate Bond-B Issue in 2006 |
|
— |
|
Held-to-maturity financial assets |
|
— |
|
303,708 |
|
— |
|
303,708 |
|
Note 6 |
|
|
|
|
|
|
Chinese Petroleum Corporation 1st Unsecured Corporate Bond-B Issue in 2006 |
|
— |
|
Held-to-maturity financial assets |
|
— |
|
404,942 |
|
— |
|
404,942 |
|
Note 6 |
|
|
|
|
|
|
Chinese Petroleum Corporation 1st Unsecured Corporate Bond-C Issue in 2006 |
|
— |
|
Held-to-maturity financial assets |
|
— |
|
208,464 |
|
— |
|
208,464 |
|
Note 6 |
|
|
|
|
|
|
Chinese Petroleum Corporation 1st Unsecured Corporate Bond-C Issue in 2006 |
|
— |
|
Held-to-maturity financial assets |
|
— |
|
104,149 |
|
— |
|
104,149 |
|
Note 6 |
|
|
|
|
|
|
|
|
|
|
|
|
|
|
|
|
|
|
|
|
|
|
|
|
|
(Continued)
56
|
|
|
|
|
|
|
|
|
|
|
March 31, 2012 |
|
|
|
|
No. |
|
Held Company Name |
|
Marketable Securities Type and Name |
|
Relationship with the
Company |
|
Financial Statement Account |
|
Shares
(Thousands/
Thousand Units) |
|
Carrying Value
(Note 5) |
|
Percentage of
Ownership |
|
Market Value or
Net Asset Value |
|
Note |
|
|
|
|
|
|
|
|
|
|
|
|
|
|
|
|
|
|
|
|
|
|
|
|
|
|
|
Taiwan Power Co. 2nd Unsecured Corporate Bond-C Issue in 2006 |
|
— |
|
Held-to-maturity financial assets |
|
— |
|
$ |
209,788 |
|
— |
|
$ |
209,788 |
|
Note 6 |
|
|
|
|
|
|
Yuanta Securities Co., Ltd. 1st Unsecured Corporate Bonds-B Issue in 2007 |
|
— |
|
Held-to-maturity financial assets |
|
— |
|
200,266 |
|
— |
|
200,266 |
|
Note 6 |
|
|
|
|
|
|
|
|
|
|
|
|
|
|
|
|
|
|
|
|
|
|
|
|
|
|
|
Chinese Petroleum Corporation 1st Unsecured Corporate Bond-A Issue in 2008 |
|
— |
|
Held-to-maturity financial assets |
|
— |
|
101,698 |
|
— |
|
101,698 |
|
Note 6 |
|
|
|
|
|
|
China Steel Corporation 1st Unsecured Corporate Bonds Issue in 2008 |
|
— |
|
Held-to-maturity financial assets |
|
— |
|
101,295 |
|
— |
|
101,295 |
|
Note 6 |
|
|
|
|
|
|
China Steel Corporation 2nd Unsecured Corporate Bonds Issue in 2008 |
|
— |
|
Held-to-maturity financial assets |
|
— |
|
100,008 |
|
— |
|
100,008 |
|
Note 6 |
|
|
|
|
|
|
China Steel Corporation 2nd Unsecured Corporate Bonds Issue in 2008 |
|
— |
|
Held-to-maturity financial assets |
|
— |
|
101,252 |
|
— |
|
101,252 |
|
Note 6 |
|
|
|
|
|
|
China Steel Corporation 2nd Unsecured Corporate Bonds-B Issue in 2008 |
|
— |
|
Held-to-maturity financial assets |
|
— |
|
309,995 |
|
— |
|
309,995 |
|
Note 6 |
|
|
|
|
|
|
China Steel Corporation 2nd Unsecured Corporate Bonds-B Issue in 2008 |
|
— |
|
Held-to-maturity financial assets |
|
— |
|
205,664 |
|
— |
|
205,664 |
|
Note 6 |
|
|
|
|
|
|
Taiwan Power Co. 2nd Unsecured Corporate Bonds-B Issue in 2008 |
|
— |
|
Held-to-maturity financial assets |
|
— |
|
152,650 |
|
— |
|
152,650 |
|
Note 6 |
|
|
|
|
|
|
Taiwan Power Co. 3rd Unsecured Corporate Bond-B Issue in 2008 |
|
— |
|
Held-to-maturity financial assets |
|
— |
|
50,521 |
|
— |
|
50,521 |
|
Note 6 |
|
|
|
|
|
|
Taiwan Power Co. 4th Unsecured Corporate Bond-B Issue in 2008 |
|
— |
|
Held-to-maturity financial assets |
|
— |
|
204,108 |
|
— |
|
204,108 |
|
Note 6 |
|
|
|
|
|
|
Taiwan Power Co. 7th Unsecured Corporate Bond-A Issue in 2008 |
|
— |
|
Held-to-maturity financial assets |
|
— |
|
152,854 |
|
— |
|
152,854 |
|
Note 6 |
|
|
|
|
|
|
NAN YA Company 2nd Unsecured Corporate Bonds Issue in 2008 |
|
— |
|
Held-to-maturity financial assets |
|
— |
|
402,539 |
|
— |
|
402,539 |
|
Note 6 |
|
|
|
|
|
|
NAN YA Company 3rd Unsecured Corporate Bonds Issue in 2008 |
|
— |
|
Held-to-maturity financial assets |
|
— |
|
201,634 |
|
— |
|
201,634 |
|
Note 6 |
|
|
|
|
|
|
China Development Financial Holding Corporation 1st Unsecured Corporate Bonds-A Issue in 2008 |
|
— |
|
Held-to-maturity financial assets |
|
— |
|
101,307 |
|
— |
|
101,307 |
|
Note 6 |
|
|
|
|
|
|
Formosa Petrochemical Corporation 1st Unsecured Corporate Bonds Issue in 2008 |
|
— |
|
Held-to-maturity financial assets |
|
— |
|
99,963 |
|
— |
|
99,963 |
|
Note 6 |
|
|
|
|
|
|
Formosa Petrochemical Corporation 2nd Unsecured Corporate Bonds Issue in 2008 |
|
— |
|
Held-to-maturity financial assets |
|
— |
|
100,903 |
|
— |
|
100,903 |
|
Note 6 |
|
|
|
|
|
|
Formosa Petrochemical Corporation 2nd Unsecured Corporate Bonds Issue in 2008 |
|
— |
|
Held-to-maturity financial assets |
|
— |
|
404,691 |
|
— |
|
404,691 |
|
Note 6 |
|
|
|
|
|
|
Formosa Petrochemical Corporation 3rd Unsecured Corporate Bonds Issue in 2008 |
|
— |
|
Held-to-maturity financial assets |
|
— |
|
202,908 |
|
— |
|
202,908 |
|
Note 6 |
|
|
|
|
|
|
Formosa Petrochemical Corporation 3rd Unsecured Corporate Bonds Issue in 2008 |
|
— |
|
Held-to-maturity financial assets |
|
— |
|
49,975 |
|
— |
|
49,975 |
|
Note 6 |
|
|
|
|
|
|
Chinese Petroleum Corporation 1st Unsecured Corporate Bonds-A Issue in 2009 |
|
— |
|
Held-to-maturity financial assets |
|
— |
|
200,573 |
|
— |
|
200,573 |
|
Note 6 |
|
|
|
|
|
|
FCFC 1st Unsecured Corporate Bonds Issue in 2009 |
|
— |
|
Held-to-maturity financial assets |
|
— |
|
251,299 |
|
— |
|
251,299 |
|
Note 6 |
|
|
|
|
|
|
|
|
|
|
|
|
|
|
|
|
|
|
|
|
|
|
|
(Continued)
57
|
|
|
|
|
|
|
|
|
|
|
March 31, 2012 |
|
|
|
|
No. |
|
Held Company Name |
|
Marketable Securities Type and Name |
|
Relationship with the
Company |
|
Financial Statement Account |
|
Shares
(Thousands/
Thousand Units) |
|
Carrying Value
(Note 5) |
|
Percentage of
Ownership |
|
Market Value or
Net Asset Value |
|
Note |
|
|
|
|
|
|
|
|
|
|
|
|
|
|
|
|
|
|
|
|
|
|
|
|
|
|
|
Taiwan Power Co. 1st Secured Corporate Bond-A Issue in 2009 |
|
— |
|
Held-to-maturity financial assets |
|
— |
|
$ |
40,379 |
|
— |
|
$ |
40,379 |
|
Note 6 |
|
|
|
|
|
|
Taiwan Power Co. 1st Secured Corporate Bond-A Issue in 2009 |
|
— |
|
Held-to-maturity financial assets |
|
— |
|
200,834 |
|
— |
|
200,834 |
|
Note 6 |
|
|
|
|
|
|
Taiwan Power Co. 2nd Secured Corporate Bond-B Issue in 2009 |
|
— |
|
Held-to-maturity financial assets |
|
— |
|
100,280 |
|
— |
|
100,280 |
|
Note 6 |
|
|
|
|
|
|
Taiwan Power Company 4th Secured Corporate Bond-B Issue in 2009 |
|
— |
|
Held-to-maturity financial assets |
|
— |
|
349,187 |
|
— |
|
349,187 |
|
Note 6 |
|
|
|
|
|
|
Taiwan Power Company 5th Secured Corporate Bond-B Issue in 2009 |
|
— |
|
Held-to-maturity financial assets |
|
— |
|
100,482 |
|
— |
|
100,482 |
|
Note 6 |
|
|
|
|
|
|
NAN YA Company 1st Unsecured Corporate Bond-A Issue in 2009 |
|
— |
|
Held-to-maturity financial assets |
|
— |
|
202,163 |
|
— |
|
202,163 |
|
Note 6 |
|
|
|
|
|
|
NAN YA Company 1st Unsecured Corporate Bond-A Issue in 2009 |
|
— |
|
Held-to-maturity financial assets |
|
— |
|
303,034 |
|
— |
|
303,034 |
|
Note 6 |
|
|
|
|
|
|
NAN YA Company 1st Unsecured Corporate Bond-A Issue in 2009 |
|
— |
|
Held-to-maturity financial assets |
|
— |
|
99,957 |
|
— |
|
99,957 |
|
Note 6 |
|
|
|
|
|
|
NAN YA Company 3rd Unsecured Corporate Bond-A Issue in 2009 |
|
— |
|
Held-to-maturity financial assets |
|
— |
|
200,448 |
|
— |
|
200,448 |
|
Note 6 |
|
|
|
|
|
|
NAN YA Company 3rd Unsecured Corporate Bond-A Issue in 2009 |
|
— |
|
Held-to-maturity financial assets |
|
— |
|
50,255 |
|
— |
|
50,255 |
|
Note 6 |
|
|
|
|
|
|
NAN YA Company 4th Unsecured Corporate Bond-A Issue in 2009 |
|
— |
|
Held-to-maturity financial assets |
|
— |
|
302,228 |
|
— |
|
302,228 |
|
Note 6 |
|
|
|
|
|
|
NAN YA Company 4th Unsecured Corporate Bond-A Issue in 2009 |
|
— |
|
Held-to-maturity financial assets |
|
— |
|
199,763 |
|
— |
|
199,763 |
|
Note 6 |
|
|
|
|
|
|
MLPC 1st Unsecured Corporate Bond Issue in 2008 |
|
— |
|
Held-to-maturity financial assets |
|
— |
|
303,470 |
|
— |
|
303,470 |
|
Note 6 |
|
|
|
|
|
|
MLPC 1st Unsecured Corporate Bond Issue in 2008 |
|
— |
|
Held-to-maturity financial assets |
|
— |
|
99,939 |
|
— |
|
99,939 |
|
Note 6 |
|
|
|
|
|
|
MLPC 1st Unsecured Corporate Bond Issue in 2008 |
|
— |
|
Held-to-maturity financial assets |
|
— |
|
99,939 |
|
— |
|
99,939 |
|
Note 6 |
|
|
|
|
|
|
Formosa Petrochemical Corporation 1st Unsecured Corporate Bonds Issue in 2008 |
|
— |
|
Held-to-maturity financial assets |
|
— |
|
201,584 |
|
— |
|
201,584 |
|
Note 6 |
|
|
|
|
|
|
Formosa Petrochemical Corporation 1st Unsecured Corporate Bonds Issue in 2008 |
|
— |
|
Held-to-maturity financial assets |
|
— |
|
303,270 |
|
— |
|
303,270 |
|
Note 6 |
|
|
|
|
|
|
Formosa Petrochemical Corporation 1st Unsecured Corporate Bonds Issue in 2008 |
|
— |
|
Held-to-maturity financial assets |
|
— |
|
200,440 |
|
— |
|
200,440 |
|
Note 6 |
|
|
|
|
|
|
Hon Hai Precision Industry Co., Ltd. First Debenture Issuing of 2009 |
|
— |
|
Held-to-maturity financial assets |
|
— |
|
176,447 |
|
— |
|
176,447 |
|
Note 6 |
|
|
|
|
|
|
Hon Hai Precision Industry Co., Ltd. First Debenture Issuing of 2009 |
|
— |
|
Held-to-maturity financial assets |
|
— |
|
100,728 |
|
— |
|
100,728 |
|
Note 6 |
|
|
|
|
|
|
Hon Hai Precision Industry Co., Ltd. First Debenture Issuing of 2009 |
|
— |
|
Held-to-maturity financial assets |
|
— |
|
100,867 |
|
— |
|
100,867 |
|
Note 6 |
|
|
|
|
|
|
FCFC 2st Unsecured Corporate Bonds Issue in 2010 |
|
— |
|
Held-to-maturity financial assets |
|
— |
|
100,328 |
|
— |
|
100,328 |
|
Note 6 |
|
|
|
|
|
|
FCFC 2st Unsecured Corporate Bonds Issue in 2010 |
|
— |
|
Held-to-maturity financial assets |
|
— |
|
200,932 |
|
— |
|
200,932 |
|
Note 6 |
|
|
|
|
|
|
|
|
|
|
|
|
|
|
|
|
|
|
|
|
|
|
|
(Continued)
58
|
|
|
|
|
|
|
|
|
|
|
March 31, 2012 |
|
|
|
|
No. |
|
Held Company Name |
|
Marketable Securities Type and Name |
|
Relationship with the
Company |
|
Financial Statement Account |
|
Shares
(Thousands/
Thousand Units) |
|
Carrying Value
(Note 5) |
|
Percentage of
Ownership |
|
Market Value or
Net Asset Value |
|
Note |
|
|
|
|
|
|
|
|
|
|
|
|
|
|
|
|
|
|
|
|
|
|
|
|
|
|
|
|
|
TaipeiFubon Bank 5th Financial Debenturees-A Issue in 2010 |
|
— |
|
Held-to-maturity financial assets |
|
— |
|
$ |
100,608 |
|
— |
|
$ |
100,608 |
|
Note 6 |
|
|
|
|
|
|
TaipeiFubon Bank 5th Financial Debenturees-A Issue in 2010 |
|
— |
|
Held-to-maturity financial assets |
|
— |
|
201,523 |
|
— |
|
201,523 |
|
Note 6 |
|
|
|
|
|
|
TaipeiFubon Bank 5th Financial Debenturees-A Issue in 2010 |
|
— |
|
Held-to-maturity financial assets |
|
— |
|
303,207 |
|
— |
|
303,207 |
|
Note 6 |
|
|
|
|
|
|
Formosa Petrochemical Corporation 1st Unsecured Corporate Bonds Issue in 2010 |
|
— |
|
Held-to-maturity financial assets |
|
— |
|
100,396 |
|
— |
|
100,396 |
|
Note 6 |
|
|
|
|
|
|
Formosa Petrochemical Corporation 1st Unsecured Corporate Bonds Issue in 2010 |
|
— |
|
Held-to-maturity financial assets |
|
— |
|
302,349 |
|
— |
|
302,349 |
|
Note 6 |
|
|
|
|
|
|
Taiwan Power Company 2nd Secured Corporate Bond-A Issue in 2010 |
|
— |
|
Held-to-maturity financial assets |
|
— |
|
100,207 |
|
— |
|
100,207 |
|
Note 6 |
|
|
|
|
|
|
Taiwan Power Co 3rd Secured Corporate Bond-A Issue in 2010 |
|
— |
|
Held-to-maturity financial assets |
|
— |
|
201,314 |
|
— |
|
201,314 |
|
Note 6 |
|
|
|
|
|
|
Taiwan Power Co. 4th Secured Corporate Bond-A Issue in 2010 |
|
— |
|
Held-to-maturity financial assets |
|
— |
|
199,883 |
|
— |
|
199,883 |
|
Note 6 |
|
|
|
|
|
|
Taiwan Power Co. 4th Secured Corporate Bond-A Issue in 2010 |
|
— |
|
Held-to-maturity financial assets |
|
— |
|
99,942 |
|
— |
|
99,942 |
|
Note 6 |
|
|
|
|
|
|
Taiwan Power Co. 4th Secured Corporate Bond-A Issue in 2010 |
|
— |
|
Held-to-maturity financial assets |
|
— |
|
300,585 |
|
— |
|
300,585 |
|
Note 6 |
|
|
|
|
|
|
Mega Securities Co., Ltd. 1st Unsecured Corporate Bond Issue in 2009 |
|
— |
|
Held-to-maturity financial assets |
|
— |
|
300,000 |
|
— |
|
300,000 |
|
Note 6 |
|
|
|
|
|
|
NAN YA Company 2nd Unsecured Corporate Bonds Issue in 2010 |
|
— |
|
Held-to-maturity financial assets |
|
— |
|
50,440 |
|
— |
|
50,440 |
|
Note 6 |
|
|
|
|
|
|
China Development Holding Corporation 1st Unsecured Corporate Bond-A Issue in 2009 |
|
— |
|
Held-to-maturity financial assets |
|
— |
|
202,556 |
|
— |
|
202,556 |
|
Note 6 |
|
|
|
|
|
|
Formosa Petrochemical Corporation 3rd Unsecured Corporate Bonds Issue in 2010 |
|
— |
|
Held-to-maturity financial assets |
|
— |
|
299,668 |
|
— |
|
299,668 |
|
Note 6 |
|
|
|
|
|
|
Yuanta FHC 1st Unsecured Corporate Bonds-A Issue in 2011 |
|
— |
|
Held-to-maturity financial assets |
|
— |
|
300,000 |
|
— |
|
300,000 |
|
Note 6 |
|
|
|
|
|
|
China Steel Corporation 1st Unsecured Corporate Bonds Issue in 2011 |
|
— |
|
Held-to-maturity financial assets |
|
— |
|
100,430 |
|
— |
|
100,430 |
|
Note 6 |
|
|
|
|
|
|
FCFC 1st Unsecured Corporate Bonds Issue in 2011 |
|
— |
|
Held-to-maturity financial assets |
|
— |
|
299,460 |
|
— |
|
299,460 |
|
Note 6 |
|
|
|
|
|
|
TSMC 1st Unsecured Corporate Bond-A Issue in 2011 |
|
— |
|
Held-to-maturity financial assets |
|
— |
|
299,733 |
|
— |
|
299,733 |
|
Note 6 |
|
|
|
|
|
|
TSMC 1st Unsecured Corporate Bond-A Issue in 2011 |
|
— |
|
Held-to-maturity financial assets |
|
— |
|
100,868 |
|
— |
|
100,868 |
|
Note 6 |
|
|
|
|
|
|
Fubon Financial Holding Co., Ltd. 1st Unsecured Corporate Bond issued in 2011 |
|
— |
|
Held-to-maturity financial assets |
|
— |
|
302,004 |
|
— |
|
302,004 |
|
Note 6 |
|
|
|
|
|
|
HSBC Bank (Taiwan) Limited 1st Financial Debenture-D Issue in 2011 |
|
— |
|
Held-to-maturity financial assets |
|
— |
|
300,000 |
|
— |
|
300,000 |
|
Note 6 |
|
|
|
|
|
|
Formosa Petrochemical Corporation 1st Unsecured Corporate Bonds Issue in 2011 |
|
— |
|
Held-to-maturity financial assets |
|
— |
|
149,741 |
|
— |
|
149,741 |
|
Note 6 |
|
|
|
|
|
|
Formosa Petrochemical Corporation 3rd Unsecured Corporate Bonds Issue in 2011 |
|
— |
|
Held-to-maturity financial assets |
|
— |
|
199,626 |
|
— |
|
199,626 |
|
Note 6 |
|
(Continued)
59
|
|
|
|
|
|
|
|
|
|
|
March 31, 2012 |
|
|
|
|
No. |
|
Held Company Name |
|
Marketable Securities Type and Name |
|
Relationship with the
Company |
|
Financial Statement Account |
|
Shares
(Thousands/
Thousand Units) |
|
Carrying Value
(Note 5) |
|
Percentage of
Ownership |
|
Market Value or
Net Asset Value |
|
Note |
|
|
|
|
|
|
|
|
|
|
|
|
|
|
|
|
|
|
|
|
|
|
|
|
|
|
|
|
|
TSMC 1st Unsecured Corporate Bond-A Issue in 2012 |
|
— |
|
Held-to-maturity financial assets |
|
— |
|
$ |
|
200,366 |
|
— |
|
$ |
|
200,366 |
|
Note 6 |
|
|
|
|
|
|
TSMC 1st Unsecured Corporate Bond-A Issue in 2012 |
|
— |
|
Held-to-maturity financial assets |
|
— |
|
|
99,906 |
|
— |
|
|
99,906 |
|
Note 6 |
|
|
|
|
|
|
TSMC 1st Unsecured Corporate Bond-A Issue in 2012 |
|
— |
|
Held-to-maturity financial assets |
|
— |
|
|
199,813 |
|
— |
|
|
199,813 |
|
Note 6 |
|
|
|
|
|
|
KGI Securities Co., Ltd. 1st Unsecured Corporate Bonds in 2011 |
|
— |
|
Held-to-maturity financial assets |
|
— |
|
|
300,000 |
|
— |
|
|
300,000 |
|
Note 6 |
|
|
|
|
|
|
|
|
|
|
|
|
|
|
|
|
|
|
|
|
|
|
|
|
|
1 |
|
Senao International Co., |
|
Stocks |
|
|
|
|
|
|
|
|
|
|
|
|
|
|
|
|
|
|
|
|
Ltd. |
|
Senao Networks, Inc. |
|
Equity-method investee |
|
Investments accounted for using equity method |
|
16,824 |
|
|
372,310 |
|
41 |
|
|
372,310 |
|
Note 1 |
|
|
|
|
|
|
Senao International (Samoa) Holding Ltd. |
|
Subsidiary |
|
Investments accounted for using equity method |
|
23,975 |
|
US$ |
503,403
(17,047 (Note 10) |
) |
100 |
|
US$ |
503,961
(17,066 |
) |
Note 8 |
|
|
|
|
|
|
N.T.U. Innovation Incubation Corporation |
|
— |
|
Financial assets carried at cost - noncurrent |
|
1,200 |
|
|
12,000 |
|
9 |
|
|
12,000 |
|
Note 1 |
|
|
|
|
|
|
|
|
|
|
|
|
|
|
|
|
|
|
|
|
|
|
|
|
|
2 |
|
CHIEF Telecom Inc. |
|
Stocks |
|
|
|
|
|
|
|
|
|
|
|
|
|
|
|
|
|
|
|
|
|
|
Unigate Telecom Inc. |
|
Subsidiary |
|
Investments accounted for using equity method |
|
200 |
|
|
1,774
(Note 10) |
|
100 |
|
|
1,774 |
|
Note 1 |
|
|
|
|
|
|
Chief International Corp. |
|
Subsidiary |
|
Investments accounted for using equity method |
|
200 |
|
US$ |
10,952
(371
(Note 10) |
) |
100 |
|
US$ |
10,952
(371 |
) |
Note 1 |
|
|
|
|
|
|
3 Link Information Service Co., Ltd. |
|
— |
|
Financial assets carried at cost - noncurrent |
|
374 |
|
|
3,450 |
|
10 |
|
|
7,022 |
|
Note 1 |
|
|
|
|
|
|
21Vianet Group. Inc. |
|
— |
|
Available-for-sale financial assets |
|
208 |
|
US$ |
11,595
(393 |
) |
— |
|
US$ |
11,595
(393 |
) |
Note 4 |
|
|
|
|
|
|
|
|
|
|
|
|
|
|
|
|
|
|
|
|
|
|
|
|
|
3 |
|
Chunghwa System |
|
Stocks |
|
|
|
|
|
|
|
|
|
|
|
|
|
|
|
|
|
|
|
|
Integration Co., Ltd. |
|
Concord Technology Co., Ltd. |
|
Subsidiary |
|
Investments accounted for using equity method |
|
1,500 |
|
RMB |
20,407
(4,362(Note 10) |
) |
100 |
|
RMB |
20,407
(4,362 |
) |
Note 1 |
|
|
|
|
|
|
|
|
|
|
|
|
|
|
|
|
|
|
|
|
|
|
|
|
|
7 |
|
Spring House |
|
Stocks |
|
|
|
|
|
|
|
|
|
|
|
|
|
|
|
|
|
|
|
|
Entertainment Tech. Inc. |
|
Ceylon Innovation Co., Ltd. |
|
Subsidiary |
|
Investments accounted for using equity method |
|
— |
|
|
942
(Note 10) |
|
100 |
|
|
942 |
|
Note 1 |
|
|
|
|
|
|
|
|
|
|
|
|
|
|
|
|
|
|
|
|
|
|
|
|
|
8 |
|
Light Era Development |
|
Stocks |
|
|
|
|
|
|
|
|
|
|
|
|
|
|
|
|
|
|
|
|
Co., Ltd. |
|
Yao Yong Real Property Co., Ltd. |
|
Subsidiary |
|
Investments accounted for using equity method |
|
83,290 |
|
|
2,837,303
(Note 10) |
|
100 |
|
|
1,931,727 |
|
Note 1 |
|
|
|
|
|
|
|
|
|
|
|
|
|
|
|
|
|
|
|
|
|
|
|
|
|
9 |
|
Chunghwa Telecom |
|
Stocks |
|
|
|
|
|
|
|
|
|
|
|
|
|
|
|
|
|
|
|
|
Singapore Pte., Ltd. |
|
ST-2 Satellite Ventures Pte., Ltd. |
|
Equity-method investee |
|
Investments accounted for using equity method |
|
18,102 |
|
|
490,707 |
|
38 |
|
|
490,707 |
|
Note 1 |
|
|
|
|
|
|
|
|
|
|
|
|
|
|
SG$ |
(20,890 |
) |
|
|
SG$ |
(20,890 |
) |
|
|
|
|
|
|
|
|
|
|
|
|
|
|
|
|
|
|
|
|
|
|
|
|
|
|
(Continued)
60
|
|
|
|
|
|
|
|
|
|
|
March 31, 2012 |
|
|
|
|
No. |
|
Held Company Name |
|
Marketable Securities Type and Name |
|
Relationship with the
Company |
|
Financial Statement Account |
|
Shares
(Thousands/
Thousand Units) |
|
Carrying Value
(Note 5) |
|
Percentage of
Ownership |
|
Market Value or
Net Asset Value |
|
Note |
|
|
|
|
|
|
|
|
|
|
|
|
|
|
|
|
|
|
|
|
|
|
|
14 |
|
Chunghwa Investment Co., Ltd. |
|
Stocks |
|
|
|
|
|
|
|
|
|
|
|
|
|
|
|
|
|
|
|
|
Chunghwa Precision Test Tech. Co., Ltd. |
|
Subsidiary |
|
Investments accounted for using equity method |
|
10,317 |
|
$ |
124,047
(Note 10) |
|
53 |
|
$ |
124,047 |
|
Note 1 |
|
|
|
|
|
|
Chunghwa Investment Holding Co., Ltd. (CIHC) |
|
Subsidiary |
|
Investments accounted for using equity method |
|
1,432 |
|
21,214
(Note 10) |
|
100 |
|
21,214 |
|
Note 1 |
|
|
|
|
|
|
PandaMonium Company Ltd. |
|
Equity-method investee |
|
Investments accounted for using equity method |
|
602 |
|
— |
|
43 |
|
— |
|
Note 1 |
|
|
|
|
|
|
CHIEF Telecom Inc. |
|
Equity-method investee |
|
Investments accounted for using equity method |
|
2,000 |
|
28,676
(Note 10) |
|
4 |
|
28,676 |
|
Note 1 |
|
|
|
|
|
|
Senao International Co., Ltd. |
|
Equity-method investee |
|
Investments accounted for using equity method |
|
1,001 |
|
50,278
(Note 10) |
|
— |
|
138,138 |
|
Note 4 |
|
|
|
|
|
|
Tatung Technology Inc. |
|
— |
|
Financial assets carried at cost - noncurrent |
|
3,542 |
|
60,081 |
|
11 |
|
60,081 |
|
Note 1 |
|
|
|
|
|
|
Digimax Inc. |
|
— |
|
Financial assets carried at cost - noncurrent |
|
2,000 |
|
15,080 |
|
4 |
|
14,578 |
|
Note 1 |
|
|
|
|
|
|
iD Branding Ventures |
|
— |
|
Financial assets carried at cost - noncurrent |
|
2,250 |
|
22,500 |
|
3 |
|
25,591 |
|
Note 1 |
|
|
|
|
|
|
Uni Display Inc. |
|
— |
|
Financial assets carried at cost - noncurrent |
|
4,630 |
|
55,450 |
|
4 |
|
40,196 |
|
Note 1 |
|
|
|
|
|
|
A2peak Power Co., Ltd. |
|
— |
|
Financial assets carried at cost - noncurrent |
|
990 |
|
— |
|
3 |
|
— |
|
Note 1 |
|
|
|
|
|
|
CoaTronics Inc. |
|
— |
|
Financial assets carried at cost - noncurrent |
|
1,200 |
|
12,000 |
|
9 |
|
4,725 |
|
Note 1 |
|
|
|
|
|
|
VisEra Technologies Company Ltd. |
|
— |
|
Financial assets carried at cost - noncurrent |
|
649 |
|
29,371 |
|
— |
|
11,236 |
|
Note 1 |
|
|
|
|
|
|
Ultra Fine Optical Technology Co., Ltd. |
|
— |
|
Financial assets carried at cost - noncurrent |
|
1,800 |
|
27,000 |
|
8 |
|
27,000 |
|
Note 1 |
|
|
|
|
|
|
Procrystal Technology Co., Ltd. |
|
— |
|
Financial assets carried at cost - noncurrent |
|
1,350 |
|
68,185 |
|
— |
|
35,627 |
|
Note 1 |
|
|
|
|
|
|
Tons Lightology Inc. |
|
— |
|
Financial assets carried at cost - noncurrent |
|
1,113 |
|
66,150 |
|
— |
|
41,014 |
|
Note 1 |
|
|
|
|
|
|
Alder Optomechanical Corp. |
|
— |
|
Financial assets carried at cost - noncurrent |
|
490 |
|
29,750 |
|
2 |
|
29,750 |
|
Note 7 |
|
|
|
|
|
|
Aide Energy (Cayman) Holding Co., Ltd. |
|
— |
|
Financial assets carried at cost - noncurrent |
|
800 |
|
9,380 |
|
1 |
|
29,940 |
|
Note 1 |
|
|
|
|
|
|
XinTec Inc. |
|
— |
|
Financial assets carried at cost - noncurrent |
|
24 |
|
1,076 |
|
— |
|
678 |
|
Note 7 |
|
|
|
|
|
|
DelSolar Co., Ltd. |
|
— |
|
Financial assets carried at cost - noncurrent |
|
119 |
|
5,702 |
|
— |
|
2,516 |
|
Note 7 |
|
|
|
|
|
|
Subtron Technology Co., Ltd. |
|
— |
|
Financial assets carried at cost - noncurrent |
|
187 |
|
3,483 |
|
— |
|
1,808 |
|
Note 1 |
|
|
|
|
|
|
Cando Corporation |
|
— |
|
Financial assets carried at cost - noncurrent |
|
376 |
|
4,937 |
|
— |
|
3,899 |
|
Note 7 |
|
|
|
|
|
|
Tatung Fine Chemicals Co. |
|
— |
|
Financial assets carried at cost - noncurrent |
|
111 |
|
4,364 |
|
— |
|
2,530 |
|
Note 7 |
|
|
|
|
|
|
OptiVision Technology Inc. |
|
— |
|
Financial assets carried at cost - noncurrent |
|
300 |
|
5,087 |
|
— |
|
1,230 |
|
Note 7 |
|
|
|
|
|
|
SuperAlloy Industrial Co., Ltd. |
|
— |
|
Financial assets carried at cost - noncurrent |
|
481 |
|
6,732 |
|
— |
|
7,726 |
|
Note 7 |
|
|
|
|
|
|
MEDIAPRO TECHNOLOGY LTD. |
|
— |
|
Financial assets carried at cost - noncurrent |
|
55 |
|
44,871 |
|
1 |
|
44,871 |
|
Note 7 |
|
|
|
|
|
|
Fashion Guide Co., Ltd. |
|
— |
|
Financial assets carried at cost - noncurrent |
|
400 |
|
10,000 |
|
2 |
|
10,000 |
|
Note 7 |
|
|
|
|
|
|
Hiroca Holdings Ltd. |
|
— |
|
Financial assets carried at cost - noncurrent |
|
140 |
|
17,847 |
|
— |
|
16,380 |
|
Note 7 |
|
|
|
|
|
|
Fubon Financial Holding Co., Ltd. |
|
— |
|
Available-for-sale financial assets |
|
80 |
|
2,728 |
|
— |
|
2,661 |
|
Note 4 |
|
|
|
|
|
|
Cathay Financial Holding Co., Ltd. |
|
— |
|
Available-for-sale financial assets |
|
92 |
|
4,134 |
|
— |
|
3,076 |
|
Note 4 |
|
|
|
|
|
|
Taiwan Hon Chuan Enterprise Co., Ltd. |
|
— |
|
Available-for-sale financial assets |
|
4 |
|
200 |
|
— |
|
231 |
|
Note 4 |
|
|
|
|
|
|
Wei Chuan Foods Corp. |
|
— |
|
Available-for-sale financial assets |
|
203 |
|
8,913 |
|
— |
|
6,669 |
|
Note 4 |
|
|
|
|
|
|
Gemtek Technology Co., Ltd. |
|
— |
|
Available-for-sale financial assets |
|
49 |
|
2,620 |
|
— |
|
1,279 |
|
Note 4 |
|
|
|
|
|
|
Coxon Precise Industrial Co., Ltd. |
|
— |
|
Available-for-sale financial assets |
|
107 |
|
8,206 |
|
— |
|
4,879 |
|
Note 4 |
|
|
|
|
|
|
Altek Corp. |
|
— |
|
Available-for-sale financial assets |
|
36 |
|
1,824 |
|
— |
|
981 |
|
Note 4 |
|
|
|
|
|
|
I-Chiun Precision Industry Co., Ltd. |
|
— |
|
Available-for-sale financial assets |
|
80 |
|
3,904 |
|
— |
|
1,776 |
|
Note 4 |
|
|
|
|
|
|
Taiwan Semiconductor Manufacturing Co., Ltd. |
|
— |
|
Available-for-sale financial assets |
|
10 |
|
783 |
|
— |
|
849 |
|
Note 4 |
|
|
|
|
|
|
Wistron NeWeb Corporation |
|
— |
|
Available-for-sale financial assets |
|
57 |
|
4,889 |
|
— |
|
3,721 |
|
Note 4 |
|
|
|
|
|
|
MasterLink Securities Corporation |
|
— |
|
Available-for-sale financial assets |
|
250 |
|
3,162 |
|
— |
|
2,575 |
|
Note 4 |
|
|
|
|
|
|
Chipbond Technology Corporation |
|
— |
|
Available-for-sale financial assets |
|
60 |
|
2,724 |
|
— |
|
2,295 |
|
Note 4 |
|
|
|
|
|
|
Chung Hwa Pulp Corp. |
|
— |
|
Available-for-sale financial assets |
|
74 |
|
1,141 |
|
— |
|
816 |
|
Note 4 |
|
|
|
|
|
|
Makalot Industrial Co., Ltd. |
|
— |
|
Available-for-sale financial assets |
|
15 |
|
1,056 |
|
— |
|
1,319 |
|
Note 4 |
|
|
|
|
|
|
|
|
|
|
|
|
|
|
|
|
|
|
|
|
|
|
|
(Continued)
61
|
|
|
|
|
|
|
|
|
|
|
March 31, 2012 |
|
|
|
|
No. |
|
Held Company Name |
|
Marketable Securities Type and Name |
|
Relationship with the
Company |
|
Financial Statement Account |
|
Shares
(Thousands/
Thousand Units) |
|
Carrying Value
(Note 5) |
|
Percentage of
Ownership |
|
Market Value or
Net Asset Value |
|
Note |
|
|
|
|
|
|
|
|
|
|
|
|
|
|
|
|
|
|
|
|
|
|
|
|
|
|
|
Macronix International Co., Ltd. |
|
— |
|
Available-for-sale financial assets |
|
170 |
|
$ |
3,075 |
|
— |
|
$ |
1,870 |
|
Note 4 |
|
|
|
|
|
|
Thxe Ming Industrial Co., Ltd. |
|
— |
|
Available-for-sale financial assets |
|
70 |
|
2,609 |
|
— |
|
1,999 |
|
Note 4 |
|
|
|
|
|
|
Apex Biotechnology Corp. |
|
— |
|
Available-for-sale financial assets |
|
1 |
|
32 |
|
— |
|
40 |
|
Note 4 |
|
|
|
|
|
|
Cyberlink Co. |
|
— |
|
Available-for-sale financial assets |
|
36 |
|
5,645 |
|
— |
|
3,338 |
|
Note 4 |
|
|
|
|
|
|
Optotech Corporation |
|
— |
|
Available-for-sale financial assets |
|
190 |
|
3,553 |
|
— |
|
2,746 |
|
Note 4 |
|
|
|
|
|
|
Tang Eng Iron Works Co., Ltd. |
|
— |
|
Available-for-sale financial assets |
|
75 |
|
2,151 |
|
— |
|
2,205 |
|
Note 4 |
|
|
|
|
|
|
Yuanta Financial Holdings |
|
— |
|
Available-for-sale financial assets |
|
246 |
|
4,599 |
|
— |
|
3,771 |
|
Note 4 |
|
|
|
|
|
|
Visual Photonics Epitaxy Co., Ltd. |
|
— |
|
Available-for-sale financial assets |
|
10 |
|
478 |
|
— |
|
559 |
|
Note 4 |
|
|
|
|
|
|
Taiwan PCB Techvest Co., Ltd. |
|
— |
|
Available-for-sale financial assets |
|
— |
|
14 |
|
— |
|
11 |
|
Note 4 |
|
|
|
|
|
|
Chung Hung Steel Corporation |
|
— |
|
Available-for-sale financial assets |
|
128 |
|
1,543 |
|
— |
|
1,323 |
|
Note 4 |
|
|
|
|
|
|
Edison Opto Corporation |
|
— |
|
Available-for-sale financial assets |
|
35 |
|
2,671 |
|
— |
|
2,162 |
|
Note 4 |
|
|
|
|
|
|
Delta Electronics Inc. |
|
— |
|
Available-for-sale financial assets |
|
54 |
|
5,270 |
|
— |
|
4,671 |
|
Note 4 |
|
|
|
|
|
|
San Shing Fastech Corp. |
|
— |
|
Available-for-sale financial assets |
|
345 |
|
11,766 |
|
— |
|
15,870 |
|
Note 4 |
|
|
|
|
|
|
USI Corp. |
|
— |
|
Available-for-sale financial assets |
|
10 |
|
293 |
|
— |
|
291 |
|
Note 4 |
|
|
|
|
|
|
President Chain Store Corp. |
|
— |
|
Available-for-sale financial assets |
|
60 |
|
9,959 |
|
— |
|
9,840 |
|
Note 4 |
|
|
|
|
|
|
Champion Microelectronic Corp. |
|
— |
|
Available-for-sale financial assets |
|
51 |
|
2,665 |
|
— |
|
1,441 |
|
Note 4 |
|
|
|
|
|
|
Unimicron Corporation |
|
— |
|
Available-for-sale financial assets |
|
135 |
|
5,289 |
|
— |
|
4,941 |
|
Note 4 |
|
|
|
|
|
|
Taiwan Cooperative Bank |
|
— |
|
Available-for-sale financial assets |
|
200 |
|
4,443 |
|
— |
|
3,694 |
|
Note 4 |
|
|
|
|
|
|
Polaris/P-shares MSCI Taiwan Financial ETF |
|
— |
|
Available-for-sale financial assets |
|
230 |
|
2,646 |
|
— |
|
2,560 |
|
Note 4 |
|
|
|
|
|
|
Test Rite International Co., Ltd. |
|
— |
|
Available-for-sale financial assets |
|
221 |
|
5,385 |
|
— |
|
4,497 |
|
Note 4 |
|
|
|
|
|
|
Formosa Petrochemical Corporation |
|
— |
|
Available-for-sale financial assets |
|
40 |
|
3,651 |
|
— |
|
3,680 |
|
Note 4 |
|
|
|
|
|
|
Oriental Union Chemical Corporation |
|
— |
|
Available-for-sale financial assets |
|
85 |
|
3,493 |
|
— |
|
3,243 |
|
Note 4 |
|
|
|
|
|
|
Huga Optotech Inc. |
|
— |
|
Available-for-sale financial assets |
|
78 |
|
1,986 |
|
— |
|
1,176 |
|
Note 4 |
|
|
|
|
|
|
Far Eastern Department Stores Ltd. |
|
— |
|
Available-for-sale financial assets |
|
105 |
|
4,024 |
|
— |
|
3,964 |
|
Note 4 |
|
|
|
|
|
|
MediaTek Inc. |
|
— |
|
Available-for-sale financial assets |
|
5 |
|
1,612 |
|
— |
|
1,412 |
|
Note 4 |
|
|
|
|
|
|
Career Technology (MFG.) Co., Ltd. |
|
— |
|
Available-for-sale financial assets |
|
100 |
|
5,208 |
|
— |
|
4,750 |
|
Note 4 |
|
|
|
|
|
|
Taimide Technology Ltd. |
|
— |
|
Available-for-sale financial assets - noncurrent |
|
712 |
|
17,825 |
|
— |
|
32,104 |
|
Note 4 |
|
|
|
|
|
|
PChome Store Inc. |
|
— |
|
Available-for-sale financial assets - noncurrent |
|
325 |
|
14,072 |
|
— |
|
39,813 |
|
Note 4 |
|
|
|
|
|
|
IC Plus Corp. |
|
— |
|
Available-for-sale financial assets - noncurrent |
|
210 |
|
5,630 |
|
— |
|
2,632 |
|
Note 4 |
|
|
|
|
|
|
Formosa Plastics Corporation |
|
— |
|
Available-for-sale financial assets |
|
36 |
|
3,102 |
|
— |
|
3,102 |
|
Note 4 |
|
|
|
|
|
|
Phoenix Tours International, Inc. |
|
— |
|
Available-for-sale financial assets |
|
10 |
|
717 |
|
— |
|
644 |
|
Note 4 |
|
|
|
|
|
|
Asustek Computer Inc. |
|
— |
|
Available-for-sale financial assets |
|
10 |
|
2,351 |
|
— |
|
2,785 |
|
Note 4 |
|
|
|
|
|
|
Chunghwa Chemical Synthesis & Biotech Co., Ltd |
|
— |
|
Available-for-sale financial assets |
|
50 |
|
3,014 |
|
— |
|
2,510 |
|
Note 4 |
|
|
|
|
|
|
Evergreen International Corp. |
|
— |
|
Available-for-sale financial assets |
|
110 |
|
1,947 |
|
— |
|
1,705 |
|
Note 4 |
|
|
|
|
|
|
Kung Long Batteries Industrial Co., Ltd |
|
— |
|
Available-for-sale financial assets |
|
110 |
|
6,269 |
|
— |
|
5,687 |
|
Note 4 |
|
|
|
|
|
|
Tingyi (Cayman Islands) Holding Corp. |
|
— |
|
Available-for-sale financial assets |
|
60 |
|
2,570 |
|
— |
|
2,562 |
|
Note 4 |
|
|
|
|
|
|
Taiwan Mobile Co., Ltd. |
|
— |
|
Available-for-sale financial assets |
|
70 |
|
6,152 |
|
— |
|
6,293 |
|
Note 4 |
|
|
|
|
|
|
Uni-President Enterprises Corp. |
|
— |
|
Available-for-sale financial assets |
|
135 |
|
5,862 |
|
— |
|
5,515 |
|
Note 4 |
|
|
|
|
|
|
Ruentex Development Co., Ltd. |
|
— |
|
Available-for-sale financial assets |
|
20 |
|
781 |
|
— |
|
870 |
|
Note 4 |
|
|
|
|
|
|
Arcadyan Technology Corporation |
|
— |
|
Available-for-sale financial assets |
|
70 |
|
3,188 |
|
— |
|
3,007 |
|
Note 4 |
|
|
|
|
|
|
Lcy Chemical Corp. |
|
— |
|
Available-for-sale financial assets |
|
85 |
|
4,639 |
|
— |
|
3,995 |
|
Note 4 |
|
|
|
|
|
|
Microbio Co., Ltd. |
|
— |
|
Available-for-sale financial assets |
|
80 |
|
3,258 |
|
— |
|
2,948 |
|
Note 4 |
|
|
|
|
|
|
China Development Financial Holding Corp. |
|
— |
|
Available-for-sale financial assets |
|
200 |
|
1,975 |
|
— |
|
1,800 |
|
Note 4 |
|
|
|
|
|
|
Cheng Shin Rubber Ind., Co., Ltd. |
|
— |
|
Available-for-sale financial assets |
|
40 |
|
2,757 |
|
— |
|
2,836 |
|
Note 4 |
|
|
|
|
|
|
Huaku Development Co., Ltd. |
|
— |
|
Available-for-sale financial assets |
|
20 |
|
1,557 |
|
— |
|
1,498 |
|
Note 4 |
|
|
|
|
|
|
|
|
|
|
|
|
|
|
|
|
|
|
|
|
|
|
|
(Continued)
62
|
|
|
|
|
|
|
|
|
|
|
March 31, 2012 |
|
|
|
|
No. |
|
Held Company Name |
|
Marketable Securities Type and Name |
|
Relationship with the
Company |
|
Financial Statement Account |
|
Shares
(Thousands/
Thousand Units) |
|
Carrying Value
(Note 5) |
|
Percentage of
Ownership |
|
Market Value or
Net Asset Value |
|
Note |
|
|
|
|
|
|
|
|
|
|
|
|
|
|
|
|
|
|
|
|
|
|
|
|
|
|
|
Formosa Chemicals & Fibre Corporation |
|
— |
|
Available-for-sale financial assets |
|
50 |
|
$ |
4,505 |
|
— |
|
$ |
4,310 |
|
Note 4 |
|
|
|
|
|
|
Tsann Kuen Enterprise Co., Ltd |
|
— |
|
Available-for-sale financial assets |
|
35 |
|
2,489 |
|
— |
|
2,467 |
|
Note 4 |
|
|
|
|
|
|
Foxconn Technology Co., Ltd |
|
— |
|
Available-for-sale financial assets |
|
10 |
|
1,298 |
|
— |
|
1,220 |
|
Note 4 |
|
|
|
|
|
|
Integrated Memory Logic Limited |
|
— |
|
Available-for-sale financial assets |
|
25 |
|
2,879 |
|
— |
|
2,650 |
|
Note 4 |
|
|
|
|
|
|
HTC Corporation |
|
— |
|
Available-for-sale financial assets |
|
5 |
|
3,118 |
|
— |
|
2,985 |
|
Note 4 |
|
|
|
|
|
|
Formosa Laboratories, Inc. |
|
— |
|
Available-for-sale financial assets |
|
10 |
|
777 |
|
— |
|
747 |
|
Note 4 |
|
|
|
|
|
|
Gigasolar Materials Corporation |
|
— |
|
Available-for-sale financial assets |
|
164 |
|
21,050 |
|
— |
|
48,119 |
|
Note 4 |
|
|
|
|
|
|
|
|
|
|
|
|
|
|
|
|
|
|
|
|
|
|
|
|
|
|
|
Beneficiary certificates (mutual fund) |
|
|
|
|
|
|
|
|
|
|
|
|
|
|
|
|
|
|
|
|
Mega Diamond Bond Fund |
|
— |
|
Available-for-sale financial assets |
|
4,139 |
|
50,000 |
|
— |
|
50,037 |
|
Note 3 |
|
|
|
|
|
|
Manulife Asia Pacific Bond |
|
— |
|
Available-for-sale financial assets |
|
749 |
|
8,000 |
|
— |
|
8,071 |
|
Note 3 |
|
|
|
|
|
|
Paradigm high Yield Bond Fund-A |
|
— |
|
Available-for-sale financial assets |
|
1,100 |
|
11,988 |
|
— |
|
12,707 |
|
Note 3 |
|
|
|
|
|
|
Upamc Quality Growth Fund |
|
— |
|
Available-for-sale financial assets |
|
393 |
|
8,000 |
|
— |
|
7,643 |
|
Note 3 |
|
|
|
|
|
|
Cathay Mandarin Fund |
|
— |
|
Available-for-sale financial assets |
|
250 |
|
2,500 |
|
— |
|
1,908 |
|
Note 3 |
|
|
|
|
|
|
Fubon Agribusiness Equity Fund |
|
— |
|
Available-for-sale financial assets |
|
1,000 |
|
10,000 |
|
— |
|
9,230 |
|
Note 3 |
|
|
|
|
|
|
Fuh Hwa Emerging Market Active Allocation Fund of Funds |
|
— |
|
Available-for-sale financial assets |
|
1,000 |
|
10,000 |
|
— |
|
9,840 |
|
Note 3 |
|
|
|
|
|
|
Franklin Templeton Sinoam Franklin Templeton Global Fund of Funds |
|
— |
|
Available-for-sale financial assets |
|
870 |
|
11,622 |
|
— |
|
11,356 |
|
Note 3 |
|
|
|
|
|
|
PowerShares QQQ |
|
— |
|
Available-for-sale financial assets |
|
1 |
|
1,712 |
|
— |
|
2,393 |
|
Note 3 |
|
|
|
|
|
|
Pro Shares UltraShort 20+ Year Treasury |
|
— |
|
Available-for-sale financial assets |
|
1 |
|
1,041 |
|
— |
|
604 |
|
Note 3 |
|
|
|
|
|
|
iShares FTSE/Xinhua A50 China Index ETF |
|
— |
|
Available-for-sale financial assets |
|
85 |
|
4,113 |
|
— |
|
3,486 |
|
Note 3 |
|
|
|
|
|
|
WISE-CSI 300 China Tracker |
|
— |
|
Available-for-sale financial assets |
|
14 |
|
2,047 |
|
— |
|
1,552 |
|
Note 3 |
|
|
|
|
|
|
Manulife China offshore Bond Fund-A |
|
— |
|
Available-for-sale financial assets |
|
2,000 |
|
20,000 |
|
— |
|
20,030 |
|
Note 3 |
|
|
|
|
|
|
Cathy Man AHL Futures Trust Fund of Funds |
|
— |
|
Available-for-sale financial assets |
|
998 |
|
10,053 |
|
— |
|
9,596 |
|
Note 3 |
|
|
|
|
|
|
iPath S&P 500VIX Short-Term Futures ETN |
|
— |
|
Available-for-sale financial assets |
|
1 |
|
918 |
|
— |
|
346 |
|
Note 3 |
|
|
|
|
|
|
Union Money Market Fund |
|
— |
|
Available-for-sale financial assets |
|
5,491 |
|
70,000 |
|
— |
|
70,060 |
|
Note 3 |
|
|
|
|
|
|
Paradigm Emerging Asia Pacific Bond B Fund |
|
— |
|
Available-for-sale financial assets |
|
3,000 |
|
30,000 |
|
— |
|
30,000 |
|
Note 3 |
|
|
|
|
|
|
Cathay Small & Med Cap Fund |
|
— |
|
Available-for-sale financial assets |
|
166 |
|
5,000 |
|
— |
|
5,010 |
|
Note 3 |
|
|
|
|
|
|
|
|
|
|
|
|
|
|
|
|
|
|
|
|
|
|
|
|
|
|
|
Bond |
|
|
|
|
|
|
|
|
|
|
|
|
|
|
|
|
|
|
|
|
Hua Nan Financial Holdings Company 1st Unsecured Subordinate Corporate Bonds Issue in 2006 |
|
— |
|
Available-for-sale financial assets |
|
50,000 |
|
50,509 |
|
— |
|
50,808 |
|
Note 9 |
|
|
|
|
|
|
AU Optronics Corporation 1st Secured Corporate Bonds Issue in 2008 |
|
— |
|
Available-for-sale financial assets |
|
25,000 |
|
25,112 |
|
— |
|
25,217 |
|
Note 9 |
|
|
|
|
|
|
|
|
|
|
|
|
|
|
|
|
|
|
|
|
|
|
|
|
|
|
|
Convertible bonds |
|
|
|
|
|
|
|
|
|
|
|
|
|
|
|
|
|
|
|
|
Epistar Corporation Ltd. 3rd Convertible Bond |
|
— |
|
Financial assets at fair value through profit or loss |
|
17 |
|
1,815 |
|
— |
|
1,722 |
|
Note 4 |
|
|
|
|
|
|
Everlight Electronics Co., Ltd. 3rd Convertible Bonds |
|
— |
|
Financial assets at fair value through profit or loss |
|
60 |
|
6,415 |
|
— |
|
6,000 |
|
Note 4 |
|
|
|
|
|
|
Ability Enterprise Co., Ltd. 1st Unsecured Convertible Bonds |
|
— |
|
Financial assets at fair value through profit or loss |
|
40 |
|
4,008 |
|
— |
|
3,988 |
|
Note 4 |
|
|
|
|
|
|
TUL the Third Security Convertible Bond |
|
— |
|
Financial assets at fair value through profit or loss |
|
15 |
|
1,500 |
|
— |
|
1,507 |
|
Note 4 |
|
|
|
|
|
|
|
|
|
|
|
|
|
|
|
|
|
|
|
|
|
|
|
(Continued)
63
|
|
|
|
|
|
|
|
|
|
|
March 31, 2012 |
|
|
|
|
No. |
|
Held Company Name |
|
Marketable Securities Type and Name |
|
Relationship with the
Company |
|
Financial Statement Account |
|
Shares
(Thousands/
Thousand Units) |
|
Carrying Value
(Note 5) |
|
Percentage of
Ownership |
|
Market Value or
Net Asset Value |
|
Note |
|
|
|
|
|
|
|
|
|
|
|
|
|
|
|
|
|
|
|
|
|
|
|
|
|
|
|
Yuanta Financial Holding Co., Ltd. 1st Domestic Convertible Bond |
|
— |
|
Financial assets at fair value through profit or loss |
|
70 |
|
$ |
|
7,000 |
|
— |
|
$ |
|
7,231 |
|
Note 4 |
|
|
|
|
|
|
Ruentex Industry Co., Ltd. 2010 1st Domestic Unsecured Convertible Corporate Bonds |
|
— |
|
Financial assets at fair value through profit or loss |
|
10 |
|
|
1,007 |
|
— |
|
989 |
|
Note 4 |
|
|
|
|
|
|
Ruentex Development Co., Ltd. 2010 1st Domestic Unsecured Convertible Corporate Bonds. |
|
— |
|
Financial assets at fair value through profit or loss |
|
76 |
|
|
7,638 |
|
— |
|
7,623 |
|
Note 4 |
|
|
|
|
|
|
Synnex Technology International Corporation 2nd Unsecured Convertible Bond Issue |
|
— |
|
Financial assets at fair value through profit or loss |
|
20 |
|
|
2,004 |
|
— |
|
2,031 |
|
Note 4 |
|
|
|
|
|
|
Far Eastern Department Store Ltd. 1st Domestic Unsecured Convertible Corporate Bond |
|
— |
|
Financial assets at fair value through profit or loss |
|
67 |
|
|
6,674 |
|
— |
|
6,700 |
|
Note 4 |
|
|
|
|
|
|
Asia Optical 3rd Domestic Unsecured Convertible Bond |
|
— |
|
Financial assets at fair value through profit or loss |
|
15 |
|
|
1,505 |
|
— |
|
1,470 |
|
Note 4 |
|
|
|
|
|
|
Hon Chuan Enterprise Co., Ltd. Domestic 1st Unsecured Convertible Bond |
|
— |
|
Financial assets at fair value through profit or loss |
|
20 |
|
|
2,020 |
|
— |
|
1,980 |
|
Note 4 |
|
|
|
|
|
|
HiTi Digital Inc. Domestic Unsecured Convertible Corporate Bond |
|
— |
|
Financial assets at fair value through profit or loss |
|
19 |
|
|
1,680 |
|
— |
|
1,862 |
|
Note 4 |
|
|
|
|
|
|
ACHEM Technology Corporation 1st Secured Convertible Bonds Issue in 2011 |
|
— |
|
Financial assets at fair value through profit or loss |
|
16 |
|
|
1,595 |
|
— |
|
1,651 |
|
Note 4 |
|
|
|
|
|
|
Foxconn Technology Co., Ltd. 1st domestic unsecured convertible bond |
|
— |
|
Financial assets at fair value through profit or loss |
|
4 |
|
|
398 |
|
— |
|
398 |
|
Note 4 |
|
|
|
|
|
|
Welldone Company Domestic 1st Secured Convertible Bonds |
|
— |
|
Financial assets at fair value through profit or loss |
|
11 |
|
|
1,186 |
|
— |
|
1,166 |
|
Note 4 |
|
|
|
|
|
|
|
|
|
|
|
|
|
|
|
|
|
|
|
|
|
|
|
|
|
18 |
|
Concord Technology Co.,Ltd. |
|
Stocks |
|
|
|
|
|
|
|
|
|
|
|
|
|
|
|
|
|
|
|
|
|
|
Glory Network System Service (Shanghai) Co., Ltd. |
|
Subsidiary |
|
Investments accounted for using equity method |
|
1,500 |
|
RMB |
20,407
(4,362
(Note 10) |
) |
100 |
|
RMB |
20,407
(4,362 |
) |
Note 1 |
|
|
|
|
|
|
|
|
|
|
|
|
|
|
|
|
|
|
|
|
|
|
|
|
|
20 |
|
Chunghwa Precision Test Tech. Co., Ltd. |
|
Stocks |
|
|
|
|
|
|
|
|
|
|
|
|
|
|
|
|
|
|
|
|
|
Chunghwa Precision Test Tech. USA Corporation |
|
Subsidiary |
|
Investments accounted for using equity method |
|
400 |
|
US$ |
9,820
(333
(Note 10) |
) |
100 |
|
US$ |
9,820
(333 |
) |
Note 1 |
|
|
|
|
|
|
|
|
|
|
|
|
|
|
|
|
|
|
|
|
|
|
|
|
|
22 |
|
Senao International (Samoa) Holding Ltd. |
|
Stocks |
|
|
|
|
|
|
|
|
|
|
|
|
|
|
|
|
|
|
|
|
|
|
Senao International HK Limited |
|
Subsidiary |
|
Investments accounted for using equity method |
|
23,260 |
|
US$ |
481,192
(16,295
(Note 10) |
) |
100 |
|
US$ |
481,192
(16,295 |
) |
Note 8 |
|
|
|
|
|
|
|
|
|
|
|
|
|
|
|
|
|
|
|
|
|
|
|
|
|
|
|
|
|
HopeTech Technologies Limited |
|
Equity-method investee |
|
Investments accounted for using equity method |
|
5,240 |
|
US$ |
21,694
(735 |
) |
45 |
|
US$ |
21,694
(735 |
) |
Note 1 |
|
(Continued)
64
|
|
|
|
|
|
|
|
|
|
|
March 31, 2012 |
|
|
|
|
No. |
|
Held Company Name |
|
Marketable Securities Type and Name |
|
Relationship with the
Company |
|
Financial Statement Account |
|
Shares
(Thousands/
Thousand Units) |
|
Carrying Value
(Note 5) |
|
Percentage of
Ownership |
|
Market Value or
Net Asset Value |
|
Note |
|
|
|
|
|
|
|
|
|
|
|
|
|
|
|
|
|
|
|
|
|
|
|
23 |
|
Senao International HK Limited |
|
Stocks |
|
|
|
|
|
|
|
|
|
|
|
|
|
|
|
|
|
|
|
|
|
Senao Trading (Fujian) Co., Ltd. |
|
Subsidiary |
|
Investments accounted for using equity method |
|
— |
|
$
US$ |
119,476
(4,046
(Note 10) |
) |
100 |
|
$
US$ |
119,476 (4,046 |
) |
Note 8 |
|
|
|
|
|
|
Senao International Trading (Shanghai) Co., Ltd. |
|
Subsidiary |
|
Investments accounted for using equity method |
|
— |
|
US$ |
91,711
(3,108
(Note 10) |
) |
100 |
|
US$ |
91,711 (3,108 |
) |
Note 8 |
|
|
|
|
|
|
Senao International Trading (Shanghai) Co., Ltd. |
|
Subsidiary |
|
Investments accounted for using equity method |
|
— |
|
US$ |
56,848
(1,925
(Note 10) |
) |
100 |
|
US$ |
56,848 (1,925 |
) |
Notes 8 and 11 |
|
|
|
|
|
|
Senao International Trading (Jiangsu) Co., Ltd. |
|
Subsidiary |
|
Investments accounted for using equity method |
|
— |
|
US$ |
210,157
(7,117
(Note 10) |
) |
100 |
|
US$ |
210,157 (7,117 |
) |
Note 8 |
|
|
|
|
|
|
|
|
|
|
|
|
|
|
|
|
|
|
|
|
|
|
|
|
|
24 |
|
Chunghwa Investment Holding Co., Ltd. |
|
Stocks |
|
|
|
|
|
|
|
|
|
|
|
|
|
|
|
|
|
|
|
|
|
|
CHI One Investment Co., Limited |
|
Subsidiary |
|
Investments accounted for using equity method |
|
6,520 |
|
HK$ |
10,981
(2,970
(Note 10) |
) |
100 |
|
HK$ |
10,981
(2,970 |
) |
Note 1 |
|
|
|
|
|
|
|
|
|
|
|
|
|
|
|
|
|
|
|
|
|
|
|
|
|
26 |
|
CHI One Investment Co., Limited |
|
Stocks |
|
|
|
|
|
|
|
|
|
|
|
|
|
|
|
|
|
|
|
|
|
|
Xiamen Sertec Business Technology Co., Ltd. |
|
Equity-method investee |
|
Investments accounted for using equity method |
|
— |
|
RMB |
10,793
(2,305 |
) |
49 |
|
RMB |
10,793 (2,305 |
) |
Note 1 |
|
|
|
|
|
|
|
|
|
|
|
|
|
|
|
|
|
|
|
|
|
|
|
|
|
27 |
|
Prime Asia Investments Group, Ltd. (B.V.I.) |
|
Stocks |
|
|
|
|
|
|
|
|
|
|
|
|
|
|
|
|
|
|
|
|
|
|
Chunghwa Hsingta Company Ltd. |
|
Subsidiary |
|
Investments accounted for using equity method |
|
— |
|
RMB |
175,125 (37,340 (Note 10) |
) |
100 |
|
RMB |
175,125 (37,340 |
) |
Note 1 |
|
|
|
|
|
|
|
|
|
|
|
|
|
|
|
|
|
|
|
|
|
|
|
|
|
29 |
|
Chunghwa Hsingta Company Ltd. |
|
Stocks |
|
|
|
|
|
|
|
|
|
|
|
|
|
|
|
|
|
|
|
|
|
|
Chunghwa Telecom (China) Co., Ltd. |
|
Subsidiary |
|
Investments accounted for using equity method |
|
— |
|
RMB |
147,604 (31,472 (Note 10) |
) |
100 |
|
RMB |
147,604 (31,472 |
) |
Note 1 |
|
|
|
|
|
|
Jiangsu Zhenhua Information Technology Company, LLC |
|
Subsidiary |
|
Investments accounted for using equity method |
|
— |
|
RMB |
27,521
(5,868
(Note 10) |
) |
75 |
|
RMB |
27,521 (5,868 |
) |
Note 1 |
|
Note 1: The net asset values of investees were based on unreviewed financial statements.
Note 2: New Prospect Investments Holdings Ltd. (B.V.I.) was incorporated in March 2006, but not yet begun operation as of March 31, 2012.
Note 3: The net asset values of beneficiary certificates (mutual fund) were based on the net asset values on March 31, 2012.
Note 4: Market value was based on the closing price of March 31, 2012.
Note 5: Showing at their original carrying amounts without adjustments for fair values, except for held-to-maturity financial assets.
Note 6: The net asset values of investees were based on amortized cost.
(Continued)
65
Note 7: Market value of emerging stock was based on the average trading price on March 31, 2012.
Note 8: The net asset values of investees were based on reviewed financial statements.
Note 9: The market value is determined by the hundred price of transaction market on March 31, 2012.
Note 10: The amount was eliminated upon consolidation.
Note 11: The English name is the same as the above entity; however, the Chinese names included in the respective Articles of Incorporations are different.
(Concluded)
66
TABLE 3
CHUNGHWA TELECOM CO., LTD. AND SUBSIDIARIES
MARKETABLE SECURITIES ACQUIRED AND DISPOSED OF AT COSTS OR PRICES OF AT LEAST NT$100 MILLION OR 20% OF THE PAID-IN CAPITAL
THREE MONTHS ENDED MARCH 31, 2012
(Amounts in Thousands of New Taiwan Dollars)
|
|
|
|
|
|
|
|
|
|
|
|
|
Beginning Balance |
|
Acquisition |
|
Disposal |
|
Ending Balance |
|
|
No. |
|
Company Name |
|
Marketable Securities
Type and Name |
|
Financial Statement
Account |
|
Counter-party |
|
Nature of
Relationship |
|
Shares
(Thousands/
Thousand
Units) |
|
Amount
(Note 1) |
|
Shares
(Thousands/
Thousand
Units) |
|
Amount |
|
Shares
(Thousands/
Thousand
Units) |
|
Amount |
|
Carrying
Value
(Note 1) |
|
Gain (Loss)
on Disposal |
|
Shares
(Thousands/
Thousand
Units) |
|
Amount
(Note 1) |
|
|
|
|
|
|
|
|
|
|
|
|
|
|
|
|
|
|
|
|
|
|
|
|
|
|
|
|
|
|
|
|
|
|
|
0 |
|
Chunghwa Telecom Co., Ltd. |
|
Stocks |
|
|
|
|
|
|
|
|
|
|
|
|
|
|
|
|
|
|
|
|
|
|
|
|
|
|
|
|
|
|
|
|
China Airlines Ltd. |
|
Available-for-sale financial assets - noncurrent |
|
— |
|
— |
|
— |
|
$ |
|
— |
|
263,622 |
|
$ |
|
3,092,287 |
|
— |
|
$ |
|
— |
|
$ |
|
— |
|
$ |
|
— |
|
263,622 |
|
$ |
|
3,092,287 |
|
|
|
|
|
|
|
|
|
|
|
|
|
|
|
|
|
|
|
|
|
|
|
|
|
|
|
|
|
|
|
|
|
|
|
|
|
|
|
Beneficiary certificates (mutual fund) |
|
|
|
|
|
|
|
|
|
|
|
|
|
|
|
|
|
|
|
|
|
|
|
|
|
|
|
|
|
|
|
|
Fidelity Funds - US Dollar Bond Fund Y-ACC-USD |
|
Available-for-sale financial assets |
|
— |
|
— |
|
— |
|
— |
|
397 |
|
148,410 |
|
— |
|
— |
|
— |
|
— |
|
397 |
|
148,410 |
|
|
|
|
|
|
|
|
|
|
|
|
|
|
|
|
|
|
|
|
|
|
|
|
|
|
|
|
|
|
|
|
|
|
|
|
|
|
|
Bonds |
|
|
|
|
|
|
|
|
|
|
|
|
|
|
|
|
|
|
|
|
|
|
|
|
|
|
|
|
|
|
|
|
TSMC 1st Unsecured Corporate Bond-C Issue in 2002 |
|
Held-to-maturity financial assets |
|
— |
|
— |
|
— |
|
300,000
(Note 2) |
|
— |
|
— |
|
— |
|
300,000
(Note 2) |
|
300,000
(Note 2) |
|
— |
|
— |
|
— |
|
|
|
|
|
|
TSMC 1st Unsecured Corporate Bond-C Issue in 2002 |
|
Held-to-maturity financial assets |
|
— |
|
— |
|
— |
|
300,000
(Note 2) |
|
— |
|
— |
|
— |
|
300,000
(Note 2) |
|
300,000
(Note 2) |
|
— |
|
— |
|
— |
|
|
|
|
|
|
TSMC 1st Unsecured Corporate Bond-A Issue in 2011 |
|
Held-to-maturity financial assets |
|
— |
|
— |
|
— |
|
300,000
(Note 2) |
|
— |
|
100,000
(Note 2) |
|
— |
|
— |
|
— |
|
— |
|
— |
|
400,000
(Note 2) |
|
|
|
|
|
|
TSMC 1st Unsecured Corporate Bond-A Issue in 2012 |
|
Held-to-maturity financial assets |
|
— |
|
— |
|
— |
|
— |
|
— |
|
500,000
(Note 2) |
|
— |
|
— |
|
— |
|
— |
|
— |
|
500,000
(Note 2) |
|
|
|
|
|
|
Chinese Petroleum Corporation 1st Unsecured Corporate Bonds-C Issue in 2006 |
|
Held-to-maturity financial assets |
|
— |
|
— |
|
— |
|
100,000
(Note 2) |
|
— |
|
200,000
(Note 2) |
|
— |
|
— |
|
— |
|
— |
|
— |
|
300,000
(Note 2) |
|
|
|
|
|
|
KGI Securities Co., Ltd. 1st Unsecured Corporate Bonds in 2011 |
|
Held-to-maturity financial assets |
|
— |
|
— |
|
— |
|
— |
|
— |
|
300,000
(Note 2) |
|
— |
|
— |
|
— |
|
— |
|
— |
|
300,000
(Note 2) |
|
|
|
|
|
|
China Development Holding Corporation 1st Unsecured Corporate Bonds-A Issue in 2007 |
|
Held-to-maturity financial assets |
|
— |
|
— |
|
— |
|
400,000
(Note 2) |
|
— |
|
— |
|
— |
|
400,000
(Note 2) |
|
400,000
(Note 2) |
|
— |
|
— |
|
— |
|
|
|
|
|
|
TaipeiFubon Bank 1st Financial Debentures-A Issue in 2011 |
|
Held-to-maturity financial assets |
|
— |
|
— |
|
— |
|
— |
|
— |
|
300,000
(Note 2) |
|
— |
|
— |
|
— |
|
— |
|
— |
|
300,000
(Note 2) |
|
|
|
|
|
|
|
|
|
|
|
|
|
|
|
|
|
|
|
|
|
|
|
|
|
|
|
|
|
|
|
|
|
|
|
1 |
|
Senao International Co., Ltd. |
|
Stocks |
|
|
|
|
|
|
|
|
|
|
|
|
|
|
|
|
|
|
|
|
|
|
|
|
|
|
|
|
|
|
|
|
|
|
|
|
|
|
|
|
|
|
|
|
|
|
|
|
|
|
|
|
|
|
|
|
|
|
|
|
|
|
|
|
|
|
|
|
|
|
|
|
|
|
|
|
Senao International (Samoa) Holding Ltd. |
|
Investments accounted for using equity method |
|
— |
|
Subsidiary |
|
15,875 |
|
US$ |
466,517 (15,875 |
) |
8,100 |
|
US$ |
240,246 (8,100 |
) |
— |
|
— |
|
— |
|
— |
|
23,975 |
|
US$ |
706,763
(23,975 (Notes 4 and 5) |
) |
|
|
|
|
|
|
|
|
|
|
|
|
|
|
|
|
|
|
|
|
|
|
|
|
|
|
|
|
|
|
|
|
|
|
22 |
|
Senao International (Samoa) Holding Ltd. |
|
Stocks |
|
|
|
|
|
|
|
|
|
|
|
|
|
|
|
|
|
|
|
|
|
|
|
|
|
|
|
|
|
|
|
|
Senao International HK Limited |
|
Investments accounted for using equity method |
|
— |
|
Subsidiary |
|
15,180 |
|
US$ |
477,712
(15,180 |
) |
8,080 |
|
US$ |
206,640
(8,080 |
) |
— |
|
— |
|
— |
|
— |
|
23,260 |
|
US$ |
684,532
(23,260
(Notes 4 and 5) |
) |
|
|
|
|
|
|
|
|
|
|
|
|
|
|
|
|
|
|
|
|
|
|
|
|
|
|
|
|
|
|
|
|
|
|
23 |
|
Senao International HK Limited |
|
Stocks |
|
|
|
|
|
|
|
|
|
|
|
|
|
|
|
|
|
|
|
|
|
|
|
|
|
|
|
|
|
|
|
|
Senao International Trading (Jiangsu) Co., Ltd. |
|
Investments accounted for using equity method |
|
— |
|
Subsidiary |
|
— |
|
US$ |
115,971
(4,000 |
) |
— |
|
US$ |
147,765
(5,000 |
) |
— |
|
— |
|
— |
|
— |
|
— |
|
US$ |
263,736
(9,000
(Notes 4 and 5) |
) |
|
|
|
|
|
|
|
|
|
|
|
|
|
|
|
|
|
|
|
|
|
|
|
|
|
|
|
|
|
|
|
|
|
|
|
|
Note 1: Showing at their original carrying amounts without adjustments for fair values.
Note 2: Stated at its nominal amounts.
Note 3: The ending balance includes cumulative transaction adjustments.
Note 4: Stated at its original investment amounts
Note 5: The amount was eliminated upon consolidation.
67
TABLE 4
CHUNGHWA TELECOM CO., LTD. AND SUBSIDIARIES
TOTAL PURCHASES FROM OR SALES TO RELATED PARTIES AMOUNTING TO AT LEAST NT$100 MILLION OR 20% OF THE PAID-IN CAPITAL
THREE MONTHS ENDED MARCH 31, 2012
(Amounts in Thousands of New Taiwan Dollars)
|
|
|
|
|
|
|
|
|
|
|
|
|
|
|
|
|
|
|
|
|
Notes/Accounts Payable or
Receivable |
|
|
|
|
|
|
|
|
Nature of |
|
Transaction Details |
|
Abnormal Transaction |
|
Ending Balance |
|
|
|
|
No. |
|
Company Name |
|
Related Party |
|
Relationship |
|
Purchase/Sale |
|
Amount |
|
% to Total |
|
Payment Terms |
|
Units Price |
|
Payment Terms |
|
(Note 1) |
|
% to Total |
|
|
|
|
|
|
|
|
|
|
|
|
|
|
|
|
|
|
|
|
|
|
|
|
|
|
|
0 |
|
Chunghwa Telecom Co., Ltd. |
|
Senao International Co., Ltd. |
|
Subsidiary |
|
Purchase |
|
$ |
2,391,632 |
|
8 |
|
30-90 days |
|
— |
|
— |
|
$ |
(1,137,849 |
) |
(9 |
) |
|
|
|
|
|
|
|
|
|
|
|
(Notes 3 and 6) |
|
|
|
|
|
|
|
|
|
(Notes 4 and 6) |
|
|
|
|
|
|
|
|
|
|
|
|
|
|
|
|
|
|
|
|
|
|
|
|
|
|
|
|
|
|
|
|
|
Chunghwa System Integration |
|
Subsidiary |
|
Purchase |
|
235,111 |
|
1 |
|
30 days |
|
— |
|
— |
|
(325,321 |
) |
(3 |
) |
|
|
|
|
|
Co., Ltd. |
|
|
|
|
|
(Notes 5 and 6) |
|
|
|
|
|
|
|
|
|
(Note 6) |
|
|
|
|
|
|
|
|
|
|
|
|
|
|
|
|
|
|
|
|
|
|
|
|
|
|
|
|
|
1 |
|
Senao International Co., Ltd. |
|
Chunghwa Telecom Co., Ltd. |
|
Parent company |
|
Sales |
|
2,363,097 |
|
27 |
|
30-90 days |
|
— |
|
— |
|
1,208,541 |
|
44 |
|
|
|
|
|
|
|
|
|
|
|
|
(Notes 3 and 6) |
|
|
|
|
|
|
|
|
|
(Notes 4 and 6) |
|
|
|
|
|
|
|
|
|
|
|
|
|
|
|
|
|
|
|
|
|
|
|
|
|
|
|
|
|
3 |
|
Chunghwa System Integration |
|
Chunghwa Telecom Co., Ltd. |
|
Parent company |
|
Sales |
|
665,412 |
|
91 |
|
30 days |
|
— |
|
— |
|
325,321 |
|
84 |
|
|
|
|
Co., Ltd. |
|
|
|
|
|
|
|
(Notes 5 and 6) |
|
|
|
|
|
|
|
|
|
(Note 6) |
|
|
|
|
|
|
|
|
|
|
|
|
|
|
|
|
|
|
|
|
|
|
|
|
|
|
|
|
|
Note 1: Excluding payment and receipts collected in trust for others.
Note 2: Transaction terms were determined in accordance with mutual agreements.
Note 3: The difference was because Senao International Co., Ltd. classified the amount as other current liabilities.
Note 4: The difference was because Chunghwa Telecom Co., Ltd. classified the amount as amounts collected in trust for others.
Note 5: The difference was because Chunghwa Telecom Co., Ltd. classified the amount as inventory, property, plant and equipment and intangible assets.
Note 6: The amount was eliminated upon consolidation.
68
TABLE 5
CHUNGHWA TELECOM CO., LTD. AND SUBSIDIARIES
RECEIVABLES FROM RELATED PARTIES AMOUNTING TO AT LEAST NT$100 MILLION OR 20% OF THE PAID-IN CAPITAL
MARCH 31, 2012
(Amounts in Thousands of New Taiwan Dollars)
|
|
|
|
|
|
|
|
|
|
|
|
|
|
|
|
|
|
|
|
|
|
|
|
|
|
|
|
|
|
|
|
|
|
|
|
|
|
|
|
Amounts Received |
|
|
|
|
|
|
|
|
|
|
|
|
|
|
Turnover |
|
Overdue |
|
in Subsequent |
|
Allowance for |
|
|
No. |
|
Company Name |
|
Related Party |
|
Nature of Relationship |
|
Ending Balance |
|
Rate |
|
Amounts |
|
Action Taken |
|
Period |
|
Bad Debts |
|
|
0 |
|
Chunghwa Telecom Co., Ltd. |
|
Senao International Co., Ltd. |
|
Subsidiary |
|
$ |
302,121
(Note 2) |
|
12.01 |
|
$ |
— |
|
— |
|
$ |
298,373 |
|
$ |
— |
|
|
1 |
|
Senao International Co., Ltd. |
|
Chunghwa Telecom Co., Ltd. |
|
Parent company |
|
1,493,698
(Note 2) |
|
7.67 |
|
— |
|
— |
|
8,710 |
|
— |
|
|
3 |
|
Chunghwa System Integration Co., Ltd. |
|
Chunghwa Telecom Co., Ltd. |
|
Parent company |
|
325,321
(Note 2) |
|
5.17 |
|
— |
|
— |
|
79,121 |
|
— |
|
Note 1: Payments and receipts collected in trust for others are excluded from the accounts receivable for calculating the turnover rate.
Note 2: The amount was eliminated upon consolidation.
69
TABLE 6
CHUNGHWA TELECOM CO., LTD. AND SUBSIDIARIES
NAMES, LOCATIONS, AND OTHER INFORMATION OF INVESTEES IN WHICH THE COMPANY EXERCISES SIGNIFICANT INFLUENCE
THREE MONTHS ENDED MARCH 31, 2012
(Amounts in Thousands of New Taiwan Dollars, Unless Otherwise Specified)
|
|
|
|
|
|
|
|
|
|
|
Original Investment Amount |
|
Balance as of March 31, 2012 |
|
Net Income |
|
Recognized Gain |
|
|
|
|
No. |
|
Investor Company |
|
Investee Company |
|
Location |
|
Main Businesses and Products |
|
March 31, 2012 |
|
December 31,
2011 |
|
Shares
(Thousands) |
|
Percentage of
Ownership (%) |
|
Carrying Value |
|
(Loss) of the
Investee |
|
(Loss)
(Notes 1 and 2) |
|
Note |
|
|
0 |
|
Chunghwa Telecom Co., Ltd. |
|
Senao International Co., Ltd. |
|
Taiwan |
|
Selling and maintaining mobile phones and its peripheral products |
|
$ |
|
1,065,813 |
|
$ |
|
1,065,813 |
|
71,773 |
|
28 |
|
$ |
|
1,684,305
(Note 4) |
|
$ |
|
516,142 |
|
$ |
|
143,193
(Note 4) |
|
Subsidiary |
|
|
|
|
|
|
Light Era Development Co., Ltd. |
|
Taiwan |
|
Housing, office building development, rent and sale services |
|
3,000,000 |
|
3,000,000 |
|
300,000 |
|
100 |
|
4,422,825
(Note 4) |
|
199,964 |
|
199,967
(Note 4) |
|
Subsidiary |
|
|
|
|
|
|
Chunghwa Investment Co., Ltd. |
|
Taiwan |
|
Telecommunications, telecommunications value-added services and other related professional investment |
|
1,738,709 |
|
1,738,709 |
|
178,000 |
|
89 |
|
1,786,637
(Note 4) |
|
7,573 |
|
6,586
(Note 4) |
|
Subsidiary |
|
|
|
|
|
|
Donghwa Telecom Co., Ltd. |
|
Hong Kong |
|
International telecommunications IP fictitious internet and internet transfer services |
|
882,219 |
|
882,219 |
|
223,190 |
|
100 |
|
870,919
(Note 4) |
|
1,592 |
|
1,592
(Note 4) |
|
Subsidiary |
|
|
|
|
|
|
Chunghwa System Integration Co., Ltd. |
|
Taiwan |
|
Providing communication and information aggregative services |
|
838,506 |
|
838,506 |
|
60,000 |
|
100 |
|
723,715
(Note 4) |
|
9,189 |
|
16,006
(Note 4) |
|
Subsidiary |
|
|
|
|
|
|
Taiwan International Standard Electronics Co., Ltd. |
|
Taiwan |
|
Manufacturing, selling, designing, and maintaining of telecommunications systems and equipment |
|
164,000 |
|
164,000 |
|
1,760 |
|
40 |
|
709,852 |
|
233,032 |
|
100,919 |
|
Equity-method investee |
|
|
|
|
|
|
Chunghwa Telecom Singapore Pte., Ltd. |
|
Singapore |
|
Telecommunication wholesale, internet transfer services international data and long distance call wholesales to carriers |
|
574,112 |
|
574,112 |
|
26,383 |
|
100 |
|
690,872
(Note 4) |
|
26,643 |
|
26,643
(Note 4) |
|
Subsidiary |
|
|
|
|
|
|
CHIEF Telecom Inc. |
|
Taiwan |
|
Internet communication and internet data center (“IDC”) service |
|
482,165 |
|
482,165 |
|
37,942 |
|
69 |
|
607,343
(Note 4) |
|
47,749 |
|
33,771
(Note 4) |
|
Subsidiary |
|
|
|
|
|
|
InfoExplorer Co., Ltd. |
|
Taiwan |
|
IT solution provider, IT application consultation, system integration and package solution |
|
283,500 |
|
283,500 |
|
22,498 |
|
33 |
|
259,520 |
|
4,406 |
|
2,050 |
|
Equity-method investee |
|
|
|
|
|
|
Viettel-CHT Co., Ltd. |
|
Vietnam |
|
IDC services |
|
288,327 |
|
288,327 |
|
— |
|
30 |
|
256,560 |
|
15,380 |
|
4,616 |
|
Equity-method investee |
|
|
|
|
|
|
Huada Digital Corporation |
|
Taiwan |
|
Providing software service |
|
250,000 |
|
250,000 |
|
25,000 |
|
50 |
|
250,778 |
|
178 |
|
89 |
|
Equity-method investee |
|
|
|
|
|
|
Chunghwa International Yellow Pages Co., Ltd. |
|
Taiwan |
|
Yellow pages sales and advertisement services |
|
150,000 |
|
150,000 |
|
15,000 |
|
100 |
|
204,202
(Note 4) |
|
9,858 |
|
9,858
(Note 4) |
|
Subsidiary |
|
|
|
|
|
|
Prime Asia Investments Group Ltd. (B.V.I.) |
|
British Virgin Islands |
|
Investment |
|
206,089 |
|
206,089 |
|
6,960 |
|
100 |
|
174,899
(Note 4) |
|
(8,214 |
) |
(8,300
(Note 4) |
) |
Subsidiary |
|
|
|
|
|
|
Skysoft Co., Ltd. |
|
Taiwan |
|
Providing of music on-line, software, electronic information, and advertisement services |
|
67,025 |
|
67,025 |
|
4,438 |
|
30 |
|
125,290 |
|
39,351 |
|
11,985 |
|
Equity-method investee |
|
|
|
|
|
|
Spring House Entertainment Inc. |
|
Taiwan |
|
Network services, producing digital entertainment contents and broadband visual sound terrace development |
|
62,209 |
|
62,209 |
|
5,996 |
|
56 |
|
109,623
(Note 4) |
|
14,546 |
|
8,481
(Note 4) |
|
Subsidiary |
|
|
|
|
|
|
Dian Zuan Integrating Marketing Co., Ltd. |
|
Taiwan |
|
Information technology service and general advertisement service |
|
114,640 |
|
114,640 |
|
11,464 |
|
40 |
|
108,533 |
|
(3,127 |
) |
(1,251 |
) |
Equity-method investee |
|
|
|
|
|
|
Chunghwa Telecom Global, Inc. |
|
United States |
|
International data and internet services and long distance call wholesales to carriers |
|
70,429 |
|
70,429 |
|
6,000 |
|
100 |
|
90,832
(Note 4) |
|
6,409 |
|
6,973
(Note 4) |
|
Subsidiary |
|
|
|
|
|
|
KingWay Technology Co., Ltd. |
|
Taiwan |
|
Publishing books, data processing and software services |
|
71,770 |
|
71,770 |
|
1,703 |
|
33 |
|
76,849 |
|
8,566 |
|
1,481 |
|
Equity-method investee |
|
|
|
|
|
|
Smartfun Digital Co., Ltd. |
|
Taiwan |
|
Software retail |
|
65,000 |
|
65,000 |
|
6,500 |
|
65 |
|
56,461
(Note 4) |
|
(5,643 |
) |
(3,664
(Note 4) |
) |
Subsidiary |
|
|
|
|
|
|
Chunghwa Telecom Vietnam Co., Ltd. |
|
Vietnam |
|
Information and communications technology, international circuit, and intelligent energy network service |
|
43,847 |
|
43,847 |
|
— |
|
100 |
|
34,737
(Note 4) |
|
(2,291 |
) |
(2,291
(Note 4) |
) |
Subsidiary |
|
|
|
|
|
|
So-net Entertainment Taiwan |
|
Taiwan |
|
Online service and sale of computer hardware |
|
60,008 |
|
60,008 |
|
3,429 |
|
30 |
|
34,644 |
|
278 |
|
99 |
|
Equity-method investee |
|
|
|
|
|
|
|
|
|
|
|
|
|
|
|
|
|
|
|
|
|
|
|
|
|
|
|
|
|
|
|
|
|
|
|
|
|
(Continued)
70
|
|
|
|
|
|
|
|
|
|
|
Original Investment Amount |
|
Balance as of March 31, 2012 |
|
|
|
|
|
|
|
|
No. |
|
Investor Company |
|
Investee Company |
|
Location |
|
Main Businesses and Products |
|
March 31, 2012 |
|
December 31,
2011 |
|
Shares
(Thousands) |
|
Percentage of
Ownership (%) |
|
Carrying Value |
|
Net Income
(Loss) of the
Investee |
|
Recognized Gain
(Loss)
(Notes 1 and 2) |
|
Note |
|
|
|
|
|
|
|
|
|
|
|
|
|
|
|
|
|
|
|
|
|
|
|
|
|
|
|
|
|
|
|
|
|
Chunghwa Telecom Japan Co., Ltd. |
|
Japan |
|
Telecom business, information process and information provide service, development and sale of software and consulting services in telecommunication |
|
$ |
17,291 |
|
$ |
17,291 |
|
1 |
|
100 |
|
$ |
22,858
(Note 4) |
|
$ |
2,327 |
|
$ |
2,327
(Note 4) |
|
Subsidiary |
|
|
|
|
|
|
Chunghwa Sochamp Technology Inc. |
|
Taiwan |
|
License plate recognition system |
|
20,400 |
|
20,400 |
|
2,040 |
|
51 |
|
18,711
|
|
(3,215 |
) |
(1,640 |
) |
Subsidiary |
|
|
|
|
|
|
New Prospect Investments Holdings Ltd. (B.V.I.) |
|
British Virgin Islands |
|
Investment |
|
—
(Note 3) |
|
—
(Note 3) |
|
— |
|
100 |
|
—
(Notes 3 and 4) |
|
—
|
|
—
(Notes 3 and 4) |
|
Subsidiary |
|
|
1 |
|
Senao International Co., Ltd. |
|
Senao Networks, Inc. |
|
Taiwan |
|
Telecommunication facilities manufactures and sales. |
|
206,190 |
|
206,190 |
|
16,824 |
|
41 |
|
372,310 |
|
72,968 |
|
29,626 |
|
Equity-method investee |
|
|
|
|
|
|
Senao International (Samoa) Holding Ltd. |
|
Samoa Islands |
|
International investment. |
|
US$ |
706,763
(23,975 |
) |
US$ |
466,517
(15,875 |
) |
23,975 |
|
100 |
|
US$ |
503,403
(17,047
(Notes 4) |
) |
US$ |
(41,761
((1,406
|
)
)) |
US$ |
(41,777
((1,406
(Notes 4) |
)
)) |
Subsidiary |
|
|
2 |
|
CHIEF Telecom Inc. |
|
Unigate Telecom Inc. |
|
Taiwan |
|
Telecommunication and internet service. |
|
2,000 |
|
2,000 |
|
200 |
|
100 |
|
1,774
(Note 4) |
|
(31 |
) |
(31)
(Note 4) |
|
Subsidiary |
|
|
|
|
|
|
Chief International Corp. |
|
Samoa Islands |
|
Network communication and engine room hiring |
|
US$ |
6,068
(200 |
) |
US$ |
6,068
(200 |
) |
200 |
|
100 |
|
US$ |
10,952
(371
(Note 4) |
) |
US$ |
1,005
(34 |
) |
US$ |
1,005
(34
(Note 4) |
) |
Subsidiary |
|
|
3 |
|
Chunghwa System Integrated Co., Ltd. |
|
Concord Technology Co., Ltd. |
|
Brunei |
|
Providing advanced business solutions to telecommunications |
|
US$ |
47,321
(1,500 |
) |
US$ |
31,973
(1,010 |
) |
1,500 |
|
100 |
|
RMB |
20,407
(4,362
(Note 4 |
)
) |
RMB |
779
(166 |
) |
US$ |
779
(166
(Note 4) |
) |
Subsidiary |
|
|
7 |
|
Spring House Entertainment Tech. Inc. |
|
Ceylon Innovation Co., Ltd |
|
Taiwan |
|
International trading, general advertisement and book publishment service |
|
1,000 |
|
1,000 |
|
— |
|
100 |
|
942
(Note 4) |
|
(12 |
) |
(12
(Note 4) |
) |
Subsidiary |
|
|
8 |
|
Light Era Development Co., Ltd. |
|
Yao Yong Real Property co., Ltd. |
|
Taiwan |
|
Real estate leasing business |
|
2,793,667 |
|
2,793,667 |
|
83,290 |
|
100 |
|
2,837,303
(Note 4) |
|
13,281 |
|
9,221
(Note 4) |
|
Subsidiary |
|
|
9 |
|
Chunghwa Telecom Singapore Pte., Ltd. |
|
ST-2 Satellite Ventures Pte., Ltd. |
|
Singapore |
|
Operation of ST-2 telecommunication satellite |
|
SG$ |
409,061
(18,102 |
) |
SG$ |
409,061
(18,102 |
) |
18,102 |
|
38 |
|
SG$ |
490,707
(20,890 |
) |
SG$ |
65,478
(2,789 |
) |
SG$ |
24,967
(1,063 |
) |
Equity-method investee |
|
|
14 |
|
Chunghwa Investment Co., Ltd. |
|
Chunghwa Precision Test Tech Co., Ltd. |
|
Taiwan |
|
Semiconductor testing components and printed circuit board industry production and marketing of electronic products |
|
91,875 |
|
91,875 |
|
10,317 |
|
53 |
|
124,047
(Note 4) |
|
4,923 |
|
2,619
(Note 4) |
|
Subsidiary |
|
|
|
|
|
|
Chunghwa Investment Holding Co., Ltd. |
|
Burnei |
|
General investment |
|
US$
|
46,035
(1,432 |
) |
US$ |
34,483
(1,043 |
) |
1,432 |
|
100 |
|
21,214
(Note 4) |
|
(1,363
|
)
|
(1,363
(Note 4) |
) |
Subsidiary |
|
|
|
|
|
|
Panda Monium Company Ltd. |
|
Cayman |
|
The production of animation |
|
US$ |
20,000
(602 |
) |
US$ |
20,000
(602 |
) |
602 |
|
43 |
|
— |
|
— |
|
— |
|
Equity-method investee |
|
|
|
|
|
|
CHIEF Telecom Inc. |
|
Taiwan |
|
Telecommunication and internet service |
|
20,000 |
|
20,000 |
|
2,000 |
|
4 |
|
28,676
(Note 4) |
|
47,749 |
|
1,748
(Note 4) |
|
Equity-method investee |
|
|
|
|
|
|
Senao International Co., Ltd. |
|
Taiwan |
|
Selling and maintaining mobile phones and its peripheral products |
|
49,731 |
|
49,731 |
|
1,001 |
|
— |
|
50,278
(Note 4) |
|
516,142 |
|
1,519
(Note 4) |
|
Equity-method investee |
|
|
18 |
|
Concord Technology Co., Ltd. |
|
Glory Network System Service (Shanghai) Co., Ltd. |
|
China |
|
Providing advanced business solutions to telecommunications |
|
US$ |
47,321
(1,500 |
) |
US$ |
31,973
(1,010 |
) |
1,500 |
|
100 |
|
RMB |
20,407
(4,362
(Note 4) |
) |
RMB |
(779
((166 |
)
)) |
RMB |
(779)
((166
(Note 4) |
)) |
Subsidiary |
|
|
20 |
|
Chunghwa Precision Test Tech. Co., Ltd. |
|
Chunghwa Precision Test Tech. USA Corporation |
|
United States |
|
Semiconductor testing components and printed circuit board industry production and marketing of electronic products |
|
US$ |
12,504
(400 |
) |
US$ |
12,504
(400 |
) |
400 |
|
100 |
|
US$ |
9,820
(333
(Note 4) |
) |
US$ |
1,692
(57 |
) |
US$ |
1,692
(57
(Note 4) |
) |
Subsidiary |
|
|
22 |
|
Senao International (Samoa) Holding Ltd. |
|
Senao International HK Limited. |
|
Hong Kong |
|
Sales of communication business |
|
US$ |
684,352
(23,260 |
) |
US$ |
444,712
(15,180 |
) |
23,260 |
|
100 |
|
US$ |
481,192
(16,295
(Note 4) |
) |
US$ |
(42,476
((1,430 |
)
)) |
US$ |
(42,476
((1,430
(Note 4) |
)
)) |
Subsidiary |
|
|
|
|
|
|
HopeTech Technologies Limited |
|
Hong Kong |
|
Information technology and telecommunication products sales. |
|
US$ |
21,177
(675 |
) |
US$ |
21,177
(675 |
) |
5,240 |
|
45 |
|
US$ |
21,694
(735 |
) |
US$ |
1,607
(54 |
) |
US$ |
723
(24 |
) |
Equity-method investee |
|
|
|
|
|
|
|
|
|
|
|
|
|
|
|
|
|
|
|
|
|
|
|
|
|
|
|
|
|
|
|
|
|
|
|
|
|
|
|
|
|
|
|
|
|
|
(Continued)
71
|
|
|
|
|
|
|
|
|
|
|
Original Investment Amount |
|
Balance as of March 31, 2012 |
|
|
|
|
|
|
|
|
No. |
|
Investor Company |
|
Investee Company |
|
Location |
|
Main Businesses and Products |
|
March 31, 2012 |
|
December 31,
2011 |
|
Shares
(Thousands) |
|
Percentage of
Ownership (%) |
|
Carrying Value |
|
Net Income
(Loss) of the
Investee |
|
Recognized Gain
(Loss)
(Notes 1 and 2) |
|
Note |
|
|
|
|
|
|
|
|
|
|
|
|
|
|
|
|
|
|
|
|
|
|
|
|
|
|
|
|
|
24 |
|
Chunghwa Investment Holding Co., Ltd. |
|
CHI One Investment Co., Limited |
|
Hong Kong |
|
General investment |
|
$
HK$ |
26,035
(6,520 |
) |
$
HK$ |
14,483
(3,924 |
) |
6,520 |
|
100 |
|
$
HK$ |
10,981
(2,970
(Note 4) |
) |
$
HK$ |
(1,363
((356 |
)
)) |
$
HK$ |
(1,363
((356
(Note 4) |
)
)) |
Subsidiary |
|
|
26 |
|
CHI One Investment Co., Limited |
|
Xiamen Sertec Business Technology Co., Ltd. |
|
China |
|
Customer Services and platform rental activities |
|
RMB |
25,414
(5,390 |
) |
RMB |
13,862
(2,936 |
) |
— |
|
49 |
|
RMB |
10,793
(2,305 |
) |
RMB |
(2,781
(592 |
)
) |
RMB |
(1,363
(290 |
)
) |
Equity-method investee |
|
|
23 |
|
Senao International HK Limited. |
|
Senao Trading (Fujian) Co., Ltd. |
|
China |
|
Information technology services and sale of communication products |
|
US$ |
175,972
(6,000 |
) |
US$ |
116,821
(4,000 |
) |
— |
|
100 |
|
US$ |
119,476
(4,046
(Note 4) |
) |
US$ |
(11,320
((381 |
)
)) |
US$ |
(11,320
((381
(Note 4) |
)
)) |
Subsidiary |
|
|
|
|
|
|
Senao International Trading (Shanghai) Co., Ltd. |
|
China |
|
Information technology services and sale of communication products |
|
US$ |
178,713
(6,000 |
) |
US$ |
148,413
(5,000 |
) |
— |
|
100 |
|
US$ |
91,771
(3,108
(Note 4) |
) |
US$ |
(16,058
((541
|
)
)) |
US$ |
(16,058
((541
(Note 4) |
)
)) |
Subsidiary |
|
|
|
|
|
|
Senao International Trading (Shanghai) Co., Ltd.
|
|
China |
|
Information technology services and sale of communication products |
|
US$ |
57,860
(2,000 |
) |
US$ |
57,860
(2,000 |
) |
— |
|
100 |
|
US$ |
56,848
(1,925
(Note 4) |
) |
US$ |
(1,115
((38
|
)
)) |
US$ |
(1,115
((38
(Note 4) |
)
)) |
Subsidiary
(Note 5) |
|
|
|
|
|
|
Semao International Trading (Jiangsu) Co., Ltd. |
|
China |
|
Information technology services and sale of communication products |
|
US$ |
263,736
(9,000 |
) |
US$ |
115,971
(4,000 |
) |
— |
|
100 |
|
US$ |
210,157
(7,117
(Note 4) |
) |
US$ |
(13,956
((470
|
)
)) |
US$ |
(13,956
((470
(Note 4) |
)
)) |
Subsidiary |
|
|
27 |
|
Prime Asia Investments Group, Ltd. (B.V.I.) |
|
Chunghwa Hsingta Co., Ltd. |
|
Hong Kong |
|
Investment |
|
RMB |
206,089
(45,448 |
) |
RMB |
206,089
(45,448 |
) |
— |
|
100 |
|
RMB |
175,125
(37,340
(Note 4) |
) |
RMB |
(8,214
((1,748
|
)
)) |
RMB |
(8,214
((1,748
(Note 4) |
)
)) |
Subsidiary |
|
|
29 |
|
Chunghwa Hsingta Company Ltd. |
|
Chunghwa Telecom (China) Co., Ltd. |
|
China |
|
Planning and design of energy conservation and software and hareware system services, and integration of information system |
|
RMB |
177,176
(39,376 |
) |
RMB |
177,176
(39,376 |
) |
— |
|
100 |
|
RMB |
147,604
(31,472
(Note 4) |
) |
RMB |
(7,257
((1,544
|
)
)) |
RMB |
(7,257
((1,544
(Note 4) |
)
)) |
Subsidiary |
|
|
|
|
|
|
Jiangsu Zhenhua Information Technology Company, LLC |
|
China |
|
Intelligent energy conserving and intelligent building services |
|
RMB |
28,912
(6,072 |
) |
— |
|
— |
|
75 |
|
RMB |
27,521
(5,868
(Note 4) |
) |
RMB |
(1,275
((271
|
)
)) |
RMB |
(957
((204
(Note 4) |
)
)) |
Subsidiary |
|
Note 1: The equity in net income (loss) of investees was based on unreviewed financial statements, except the equity in earnings of Senao International Co., Ltd. and its subsidiaries, and HopeTech Technologies Limited.
Note 2: The equity in net income (loss) of investees includes amortization of differences between the investment cost and net value and elimination of unrealized transactions.
Note 3: New Prospect Investments Holdings Ltd. (B.V.I.) was incorporated in March 2006, but has not yet begun operation as of March 31, 2012. Chunghwa has 100% ownership right in an amount of US$1 in the holding company.
Note 4: The amount was eliminated upon consolidation.
Note 5: The English name is the same as the above entity; however, the Chinese names included in the respective Articles of Incorporations are different.
(concluded)
72
TABLE 7
CHUNGHWA TELECOM CO., LTD. AND SUBSIDIARIES
INVESTMENT IN MAINLAND CHINA
THREE MONTHS ENDED MARCH 31, 2012
(Amounts in Thousands of New Taiwan Dollars, in Thousands of U.S. Dollars)
|
|
|
|
|
|
|
|
|
Accumulated |
|
|
|
Accumulated |
|
|
|
|
|
|
|
|
|
|
|
|
|
|
Total Amount
of Paid-in |
|
Investment |
|
Outflow of
Investment
from Taiwan as
of |
|
Investment Flows |
|
Outflow of
Investment
from Taiwan as
of |
|
% Ownership
of Direct or
Indirect |
|
Investment
Gain (Loss) |
|
Carrying Value
as of |
|
Accumulated
Inward
Remittance of
Earnings as of |
|
|
Investee |
|
Main Businesses and Products |
|
Capital |
|
Type |
|
January 1, 2012 |
|
Outflow |
|
Inflow |
|
March 31, 2012 |
|
Investment |
|
(Note 2) |
|
March 31, 2012 |
|
March 31, 2012 |
|
|
|
|
|
|
|
|
|
|
|
|
|
|
|
|
|
|
|
|
|
|
|
|
|
|
|
Glory Network System Service (Shanghai) Co., Ltd. |
|
Providing advanced business solutions to telecommunications |
|
$ |
47,321 |
|
Note 1 |
|
$ |
31,973 |
|
$ |
15,348 |
|
$ |
— |
|
$ |
47,321 |
|
100 |
% |
$ |
(779
(Note 7) |
) |
$ |
20,407
(Note 7) |
|
$ |
— |
|
|
|
|
|
|
|
|
|
|
|
|
|
|
|
|
|
|
|
|
|
|
|
|
|
|
|
Xiamen Sertec Business Technology Co., Ltd. |
|
Customer services and platform rental activities |
|
51,552 |
|
Note 1 |
|
13,862 |
|
11,552 |
|
— |
|
25,414 |
|
49 |
% |
(1,363
(Note 7) |
) |
10,793
(Note 7) |
|
— |
|
|
|
|
|
|
|
|
|
|
|
|
|
|
|
|
|
|
|
|
|
|
|
|
|
|
|
Senao Trading (Fujian) Co., Ltd. |
|
Information technology services and sale of communication products |
|
175,972 |
|
Note 1 |
|
116,821 |
|
59,151 |
|
— |
|
175,972 |
|
100 |
% |
(11,320
(Note 7) |
) |
119,476
(Note 7) |
|
— |
|
|
|
|
|
|
|
|
|
|
|
|
|
|
|
|
|
|
|
|
|
|
|
|
|
|
|
Senao International Trading (Shanghai) Co., Ltd. |
|
Information technology services and sale of communication products |
|
178,713 |
|
Note 1 |
|
148,413 |
|
30,300 |
|
— |
|
178,713 |
|
100 |
% |
(16,058
(Note 7) |
) |
91,771
(Note 7) |
|
— |
|
|
|
|
|
|
|
|
|
|
|
|
|
|
|
|
|
|
|
|
|
|
|
|
|
|
|
Senao International Trading (Shanghai) Co., Ltd. (Note 8) |
|
Information technology services and sale of communication products |
|
57,860 |
|
Note 1 |
|
57,860 |
|
— |
|
— |
|
57,860 |
|
100 |
% |
(1,115
(Note 7) |
) |
56,848
(Note 7) |
|
— |
|
|
|
|
|
|
|
|
|
|
|
|
|
|
|
|
|
|
|
|
|
|
|
|
|
|
|
Senao International Trading (Jiangsu) Co., Ltd. |
|
Information technology services and sale of communication products |
|
263,736 |
|
Note 1 |
|
115,971 |
|
147,765 |
|
— |
|
263,736 |
|
100 |
% |
(13,956
(Note 7) |
) |
210,157
(Note 7) |
|
— |
|
|
|
|
|
|
|
|
|
|
|
|
|
|
|
|
|
|
|
|
|
|
|
|
|
|
|
Chunghwa Telecom (China) Co., Ltd. |
|
Energy conserving and providing installation, design and maintenance services |
|
177,176 |
|
Note 1 |
|
177,176 |
|
— |
|
— |
|
177,176 |
|
100 |
% |
(7,257
(Note 7) |
) |
147,604
(Note 7) |
|
— |
|
|
|
|
|
|
|
|
|
|
|
|
|
|
|
|
|
|
|
|
|
|
|
|
|
|
|
Jiangsu Zhenhua Information Technology Company, LLC |
|
Intelligent energy conserving and intelligent building services |
|
38,549 |
|
Note 1 |
|
28,912 |
|
— |
|
— |
|
28,912 |
|
75 |
% |
(957
(Note 7) |
) |
27,521
(Note 7) |
|
— |
|
|
|
|
|
|
|
|
|
|
|
|
|
|
|
|
|
|
|
|
|
|
|
|
|
|
|
|
|
|
|
|
|
(Continued)
73
|
Accumulated Investment in |
|
Investment Amounts Authorized |
|
Upper Limit on Investment |
|
|
Mainland China as of |
|
by Investment Commission, |
|
Stipulated by Investment |
|
|
March 31, 2012 |
|
MOEA |
|
Commission, MOEA |
|
|
|
|
|
|
|
|
|
$ |
47,321 |
|
$ |
48,169 |
|
$ |
410,739 |
|
|
US$ |
(1,500 |
) |
US$ |
(1,500 |
) |
(Note 3) |
|
|
25,414 |
|
79,882 |
|
1,308,565 |
|
|
US$ |
(820 |
) |
US$ |
(2,500 |
) |
(Note 4) |
|
|
676,281 |
|
676,281 |
|
3,411,200 |
|
|
US$ |
(23,000 |
) |
US$ |
(23,000 |
) |
(Note 5) |
|
|
177,176 |
|
177,176 |
|
229,818,425 |
|
|
US$ |
(6,000 |
) |
US$ |
(6,000 |
) |
(Note 6) |
|
|
28,912 |
|
141,077 |
|
229,818,425 |
|
|
US$ |
(960 |
) |
US$ |
(4,800 |
) |
(Note 6) |
|
|
|
|
|
|
|
|
|
|
|
|
|
Note 1: Investments were through an holding company registered in a third region.
Note 2: Recognition of investment gains (losses) was calculated based on the investee’s unreviewed financial statements, except the recognition of investment gains (losses) of Senao Trading (Fujian) Co., Ltd., Senao International Trading (Shanghai) Co., Ltd., Senao International Trading (Shanghai) Co., Ltd. (Note 8), and Senao International Trading (Jiangsu) Co., Ltd. was calculated based on the reviewed financial statements.
Note 3: The amount was calculated based on the consolidated net assets value of Chunghwa System Integration Co., Ltd.
Note 4: The amount was calculated based on the consolidated net assets value of Chunghwa Investment Co., Ltd.
Note 5: The amount was calculated based on the consolidated net assets value of Senao International Co., Ltd.
Note 6: The amount was calculated based on the consolidated net assets value of Chunghwa Telecom Co., Ltd.
Note 7: The amount was eliminated upon consolidation.
Note 8: The English name is the same as the above entity; however, the Chinese names included in the respective Articles of Incorporations are different.
(Concluded)
74
TABLE 8
CHUNGHWA TELECOM CO., LTD. AND SUBSIDIARIES
INTERCOMPANY RELATIONSHIPS AND SIGNIFICANT TRANSACTIONS
THREE MONTHS ENDED MARCH 31, 2012 AND 2011
(Amounts in Thousands of New Taiwan Dollars)
|
|
|
|
|
|
|
|
|
|
|
Transaction Details |
|
|
Year |
|
No.
(Note 1) |
|
Company Name |
|
Related Party |
|
Nature of
Relationship
(Note 2) |
|
Financial Statement Account |
|
Amount
(Note 5) |
|
Payment Terms
(Note 3) |
|
% to
Total Sales or
Assets
(Note 4) |
|
|
|
|
|
|
|
|
|
|
|
|
|
|
|
|
|
|
|
|
|
2012 |
|
0 |
|
Chunghwa Telecom Co., Ltd. |
|
Senao International Co., Ltd. |
|
a |
|
Accounts receivable |
|
$ |
5,684 |
|
— |
|
— |
|
|
|
|
|
|
|
|
|
|
|
|
Accounts payable |
|
1,137,849 |
|
— |
|
— |
|
|
|
|
|
|
|
|
|
|
|
|
Accrued custodial receipts |
|
296,437 |
|
— |
|
— |
|
|
|
|
|
|
|
|
|
|
|
|
Amounts collected in trust for others |
|
355,862 |
|
— |
|
— |
|
|
|
|
|
|
|
|
|
|
|
|
Revenues |
|
76,366 |
|
— |
|
— |
|
|
|
|
|
|
|
|
|
|
|
|
Operating costs and expenses |
|
2,391,632 |
|
— |
|
4 |
|
|
|
|
|
|
|
|
|
|
|
|
Property, plant and equipment |
|
8,378 |
|
— |
|
— |
|
|
|
|
|
|
|
|
|
|
|
|
Customer’s deposits |
|
1,208 |
|
— |
|
— |
|
|
|
|
|
|
|
|
CHIEF Telecom Inc. |
|
a |
|
Accounts receivable |
|
32,918 |
|
— |
|
— |
|
|
|
|
|
|
|
|
|
|
|
|
Accounts payable |
|
48,044 |
|
— |
|
— |
|
|
|
|
|
|
|
|
|
|
|
|
Amounts collected in trust for others |
|
4,239 |
|
— |
|
— |
|
|
|
|
|
|
|
|
|
|
|
|
Revenues |
|
61,981 |
|
— |
|
— |
|
|
|
|
|
|
|
|
|
|
|
|
Operating costs and expenses |
|
87,043 |
|
— |
|
— |
|
|
|
|
|
|
|
|
|
|
|
|
Customer’s deposits |
|
333 |
|
— |
|
— |
|
|
|
|
|
|
|
|
Chunghwa Precision Test Tech. Co., Ltd. |
|
a |
|
Accounts receivable |
|
23 |
|
— |
|
— |
|
|
|
|
|
|
|
|
|
|
|
|
Accounts payable |
|
3 |
|
— |
|
— |
|
|
|
|
|
|
|
|
|
|
|
|
Revenues |
|
618 |
|
— |
|
— |
|
|
|
|
|
|
|
|
|
|
|
|
Non-operating income and gains |
|
68 |
|
— |
|
— |
|
|
|
|
|
|
|
|
Chunghwa International Yellow Pages Co., Ltd. |
|
a |
|
Accounts receivable |
|
2,788 |
|
— |
|
— |
|
|
|
|
|
|
|
|
|
|
|
|
Accounts payable |
|
16,677 |
|
— |
|
— |
|
|
|
|
|
|
|
|
|
|
|
|
Amounts collected in trust for others |
|
22,850 |
|
— |
|
— |
|
|
|
|
|
|
|
|
|
|
|
|
Accrued custodial payments |
|
14,383 |
|
— |
|
— |
|
|
|
|
|
|
|
|
|
|
|
|
Revenues |
|
3,513 |
|
— |
|
— |
|
|
|
|
|
|
|
|
|
|
|
|
Operating costs and expenses |
|
27,025 |
|
— |
|
— |
|
|
|
|
|
|
|
|
Chunghwa System Integration Co., Ltd |
|
a |
|
Accounts receivable |
|
1,308 |
|
— |
|
— |
|
|
|
|
|
|
|
|
|
|
|
|
Accrued custodial receipts |
|
9,655 |
|
— |
|
— |
|
|
|
|
|
|
|
|
|
|
|
|
Accounts payable |
|
325,321 |
|
— |
|
— |
|
|
|
|
|
|
|
|
|
|
|
|
Revenues |
|
2,221 |
|
— |
|
— |
|
|
|
|
|
|
|
|
|
|
|
|
Non-operating income and gains |
|
26 |
|
— |
|
— |
|
|
|
|
|
|
|
|
|
|
|
|
Operating costs and expenses |
|
235,111 |
|
— |
|
— |
|
|
|
|
|
|
|
|
|
|
|
|
Property, plant and equipment |
|
243,695 |
|
— |
|
— |
|
|
|
|
|
|
|
|
|
|
|
|
Work in process |
|
1,876 |
|
— |
|
— |
|
|
|
|
|
|
|
|
|
|
|
|
Spare parts |
|
1,148 |
|
— |
|
— |
|
|
|
|
|
|
|
|
|
|
|
|
Intangible assets |
|
35,439 |
|
— |
|
— |
|
|
|
|
|
|
|
|
|
|
|
|
Other deferred expenses |
|
1,693 |
|
— |
|
— |
|
|
|
|
|
|
|
|
|
|
|
|
Customer’s deposits |
|
14,030 |
|
— |
|
— |
|
|
|
|
|
|
|
|
|
|
|
|
|
|
|
|
|
|
|
|
(Continued)
75
|
|
|
|
|
|
|
|
|
|
|
Transaction Details |
|
|
Year |
|
No.
(Note 1) |
|
Company Name |
|
Related Party |
|
Nature of
Relationship
(Note 2) |
|
Financial Statement Account |
|
Amount
(Note 5) |
|
Payment Terms
(Note 3) |
|
% to
Total Sales or
Assets
(Note 4) |
|
|
|
|
|
|
|
|
|
|
|
|
|
|
|
|
|
|
|
|
|
|
|
|
|
|
|
Chunghwa Telecom Global Inc. |
|
a |
|
Accounts receivable |
|
$ |
19,056 |
|
— |
|
— |
|
|
|
|
|
|
|
|
|
|
|
|
Accounts payable |
|
65,671 |
|
— |
|
— |
|
|
|
|
|
|
|
|
|
|
|
|
Revenues |
|
19,378 |
|
— |
|
— |
|
|
|
|
|
|
|
|
|
|
|
|
Operating costs and expenses |
|
66,108 |
|
— |
|
— |
|
|
|
|
|
|
|
|
|
|
|
|
Property, plant and equipment |
|
23,805 |
|
— |
|
— |
|
|
|
|
|
|
|
|
|
|
|
|
Customer’s deposits |
|
14,481 |
|
— |
|
— |
|
|
|
|
|
|
|
|
Donghwa Telecom Co., Ltd. |
|
a |
|
Accounts receivable |
|
31,499 |
|
— |
|
— |
|
|
|
|
|
|
|
|
|
|
|
|
Accounts payable |
|
81,273 |
|
— |
|
— |
|
|
|
|
|
|
|
|
|
|
|
|
Revenues |
|
31,136 |
|
— |
|
— |
|
|
|
|
|
|
|
|
|
|
|
|
Operating costs and expenses |
|
31,818 |
|
— |
|
— |
|
|
|
|
|
|
|
|
Spring House Entertainment Inc. |
|
a |
|
Accounts receivable |
|
685 |
|
— |
|
— |
|
|
|
|
|
|
|
|
|
|
|
|
Accounts payable |
|
4,146 |
|
— |
|
— |
|
|
|
|
|
|
|
|
|
|
|
|
Amounts collected in trust for others |
|
35,070 |
|
— |
|
— |
|
|
|
|
|
|
|
|
|
|
|
|
Revenues |
|
3,231 |
|
— |
|
— |
|
|
|
|
|
|
|
|
|
|
|
|
Non-operating income and gains |
|
1 |
|
— |
|
— |
|
|
|
|
|
|
|
|
|
|
|
|
Operating costs and expenses |
|
7,271 |
|
— |
|
— |
|
|
|
|
|
|
|
|
|
|
|
|
Customer’s deposits |
|
5 |
|
— |
|
— |
|
|
|
|
|
|
|
|
Chunghwa Telecom Japan Co., Ltd. |
|
a |
|
Accounts receivable |
|
7,094 |
|
— |
|
— |
|
|
|
|
|
|
|
|
|
|
|
|
Accounts payable |
|
6,565 |
|
— |
|
— |
|
|
|
|
|
|
|
|
|
|
|
|
Revenues |
|
7,697 |
|
— |
|
— |
|
|
|
|
|
|
|
|
|
|
|
|
Operating costs and expenses |
|
17,478 |
|
— |
|
— |
|
|
|
|
|
|
|
|
Light Era Development Co., Ltd |
|
a |
|
Accounts payable |
|
278 |
|
— |
|
— |
|
|
|
|
|
|
|
|
|
|
|
|
Amounts collected in trust for others |
|
1,696 |
|
— |
|
— |
|
|
|
|
|
|
|
|
|
|
|
|
Revenues |
|
627 |
|
— |
|
— |
|
|
|
|
|
|
|
|
|
|
|
|
Operating costs and expenses |
|
91 |
|
— |
|
— |
|
|
|
|
|
|
|
|
Chunghwa Telecom Singapore Pte., Ltd. |
|
a |
|
Accounts receivable |
|
3,520 |
|
— |
|
— |
|
|
|
|
|
|
|
|
|
|
|
|
Accounts payable |
|
4,035 |
|
— |
|
— |
|
|
|
|
|
|
|
|
|
|
|
|
Revenues |
|
14,559 |
|
— |
|
— |
|
|
|
|
|
|
|
|
|
|
|
|
Operating costs and expenses |
|
9,836 |
|
— |
|
— |
|
|
|
|
|
|
|
|
Chunghwa Investment Co., Ltd. |
|
a |
|
Revenues |
|
49 |
|
— |
|
— |
|
|
|
|
|
|
|
|
Chunghwa Telecom (China) Co., Ltd. |
|
a |
|
Accounts payable |
|
852 |
|
— |
|
— |
|
|
|
|
|
|
|
|
|
|
|
|
Operating costs and expenses |
|
2,598 |
|
— |
|
— |
|
|
|
|
|
|
|
|
Smartfun Digital Co., Ltd. |
|
a |
|
Revenues |
|
377 |
|
— |
|
— |
|
|
|
|
|
|
|
|
Chunghwa Telecom Vietnam Co., Ltd. |
|
a |
|
Accounts payable |
|
151 |
|
— |
|
— |
|
|
|
|
|
|
|
|
|
|
|
|
Operating costs and expenses |
|
447 |
|
— |
|
— |
|
|
|
|
|
|
|
|
Chunghwa Sochamp Technology Inc. |
|
a |
|
Accounts payable |
|
113 |
|
— |
|
— |
|
|
|
|
|
|
|
|
|
|
|
|
Revenues |
|
39 |
|
— |
|
— |
|
|
|
|
|
|
|
|
|
|
|
|
Operating costs and expenses |
|
250 |
|
— |
|
— |
|
|
|
|
|
|
|
|
|
|
|
|
|
|
|
|
|
|
|
|
|
|
|
1 |
|
Senao International Co., Ltd. |
|
Chunghwa Telecom Co., Ltd. |
|
b |
|
Accounts receivable |
|
1,208,541 |
|
— |
|
— |
|
|
|
|
|
|
|
|
|
|
|
|
Other receivables |
|
285,156 |
|
— |
|
— |
|
|
|
|
|
|
|
|
|
|
|
|
Prepaid expenses |
|
14 |
|
— |
|
— |
|
|
|
|
|
|
|
|
|
|
|
|
Accounts payable |
|
302,121 |
|
— |
|
— |
|
|
|
|
|
|
|
|
|
|
|
|
Deferred revenue |
|
36,899 |
|
— |
|
— |
|
|
|
|
|
|
|
|
|
|
|
|
Revenues |
|
2,363,097 |
|
— |
|
4 |
|
|
|
|
|
|
|
|
|
|
|
|
|
|
|
|
|
|
|
|
|
|
|
|
|
|
|
|
|
|
|
|
|
|
|
|
|
|
|
(Continued)
76
|
|
|
|
|
|
|
|
|
|
|
|
|
|
|
|
|
|
|
|
|
|
|
|
|
|
|
|
|
|
|
Transaction Details |
|
|
Year |
|
No.
(Note 1) |
|
Company Name |
|
Related Party |
|
Nature of
Relationship
(Note 2) |
|
Financial Statement Account |
|
Amount
(Note 5) |
|
Payment Terms
(Note 3) |
|
% to
Total Sales or
Assets
(Note 4) |
|
|
|
|
|
|
|
|
|
|
|
|
|
|
|
|
|
|
|
|
|
|
|
|
|
|
|
|
|
|
|
|
Non-operating income and gains |
|
$ |
14 |
|
— |
|
— |
|
|
|
|
|
|
|
|
|
|
|
|
Purchases |
|
62,486 |
|
— |
|
— |
|
|
|
|
|
|
|
|
|
|
|
|
Operating expenses |
|
13,880 |
|
— |
|
— |
|
|
|
|
|
|
|
|
|
|
|
|
Refundable deposits |
|
1,208 |
|
— |
|
— |
|
|
|
|
|
|
|
|
Spring House Entertainment Inc. |
|
c |
|
Revenues |
|
298 |
|
— |
|
— |
|
|
|
|
|
|
|
|
|
|
|
|
Accounts receivable |
|
59 |
|
— |
|
— |
|
|
|
|
|
|
|
|
Chunghwa International Yellow Pages Co., Ltd. |
|
c |
|
Revenues |
|
90 |
|
— |
|
— |
|
|
|
|
|
|
|
|
|
|
|
|
Accounts receivable |
|
94 |
|
— |
|
— |
|
|
|
|
|
|
|
|
Light Era Development Co., Ltd |
|
c |
|
Revenues |
|
46 |
|
— |
|
— |
|
|
|
|
|
|
|
|
|
|
|
|
|
|
|
|
|
|
|
|
|
|
|
2 |
|
CHIEF Telecom Inc. |
|
Chunghwa Telecom Co., Ltd. |
|
b |
|
Accounts receivable |
|
50,606 |
|
— |
|
— |
|
|
|
|
|
|
|
|
|
|
|
|
Prepaid expenses |
|
24 |
|
— |
|
— |
|
|
|
|
|
|
|
|
|
|
|
|
Other deferred expenses |
|
1,653 |
|
— |
|
— |
|
|
|
|
|
|
|
|
|
|
|
|
Accounts payable |
|
32,469 |
|
— |
|
— |
|
|
|
|
|
|
|
|
|
|
|
|
Advances from customers |
|
449 |
|
— |
|
— |
|
|
|
|
|
|
|
|
|
|
|
|
Revenues |
|
87,043 |
|
— |
|
— |
|
|
|
|
|
|
|
|
|
|
|
|
Operating costs and expenses |
|
61,981 |
|
— |
|
— |
|
|
|
|
|
|
|
|
|
|
|
|
Refundable deposits |
|
333 |
|
— |
|
— |
|
|
|
|
|
|
|
|
Chunghwa System Integration Co., Ltd. |
|
c |
|
Revenues |
|
23 |
|
— |
|
— |
|
|
|
|
|
|
|
|
|
|
|
|
Accounts receivable |
|
8 |
|
— |
|
— |
|
|
|
|
|
|
|
|
Chunghwa Telecom Singapore Pte., Ltd. |
|
c |
|
Accounts receivable |
|
3,544 |
|
— |
|
— |
|
|
|
|
|
|
|
|
|
|
|
|
Accounts payable |
|
1,385 |
|
— |
|
— |
|
|
|
|
|
|
|
|
|
|
|
|
Revenues |
|
6,078 |
|
— |
|
— |
|
|
|
|
|
|
|
|
|
|
|
|
Operating costs and expenses |
|
2,991 |
|
— |
|
— |
|
|
|
|
|
|
|
|
Donghwa Telecom Co., Ltd. |
|
c |
|
Accounts receivable |
|
70 |
|
— |
|
— |
|
|
|
|
|
|
|
|
|
|
|
|
Revenues |
|
200 |
|
— |
|
— |
|
|
|
|
|
|
|
|
Chunghwa Telecom Japan Co., Ltd. |
|
c |
|
Accounts payable |
|
265 |
|
— |
|
— |
|
|
|
|
|
|
|
|
|
|
|
|
Operating costs and expenses |
|
476 |
|
— |
|
— |
|
|
|
|
|
|
|
|
Yao Yong Real Property Co., Ltd. |
|
c |
|
Operating costs and expenses |
|
21,695 |
|
— |
|
— |
|
|
|
|
|
|
|
|
|
|
|
|
|
|
|
|
|
|
|
|
|
|
|
3 |
|
Chunghwa System Integration Co., Ltd. |
|
Chunghwa Telecom Co., Ltd. |
|
b |
|
Accounts receivable |
|
325,321 |
|
— |
|
— |
|
|
|
|
|
|
|
|
|
|
|
|
Accounts payable |
|
10,963 |
|
— |
|
— |
|
|
|
|
|
|
|
|
|
|
|
|
Deferred revenue |
|
146,965 |
|
— |
|
— |
|
|
|
|
|
|
|
|
|
|
|
|
Revenues |
|
665,927 |
|
— |
|
1 |
|
|
|
|
|
|
|
|
|
|
|
|
Operating costs and expenses |
|
2,247 |
|
— |
|
— |
|
|
|
|
|
|
|
|
|
|
|
|
Refundable deposits |
|
14,030 |
|
— |
|
— |
|
|
|
|
|
|
|
|
CHIEF Telecom Inc. |
|
c |
|
Operating costs and expenses |
|
23 |
|
— |
|
— |
|
|
|
|
|
|
|
|
|
|
|
|
Accounts payable |
|
8 |
|
— |
|
— |
|
|
|
|
|
|
|
|
Spring House Entertainment Inc. |
|
c |
|
Accounts receivable |
|
123 |
|
— |
|
— |
|
|
|
|
|
|
|
|
|
|
|
|
Revenues |
|
349 |
|
— |
|
— |
|
|
|
|
|
|
|
|
Light Era Development Co., Ltd |
|
c |
|
Revenues |
|
45 |
|
— |
|
— |
|
|
|
|
|
|
|
|
|
|
|
|
|
|
|
|
|
|
|
|
|
|
|
4 |
|
Chunghwa International Yellow Pages Co., Ltd. |
|
Chunghwa Telecom Co., Ltd. |
|
b |
|
Accounts receivable |
|
29,429 |
|
— |
|
— |
|
|
|
|
|
|
|
|
|
|
|
|
Accrued custodial receipts |
|
9,205 |
|
— |
|
— |
|
|
|
|
|
|
|
|
|
|
|
|
Prepaid expenses |
|
893 |
|
— |
|
— |
|
|
|
|
|
|
|
|
|
|
|
|
Accounts payable |
|
1,528 |
|
— |
|
— |
|
(Continued)
77
|
|
|
|
|
|
|
|
|
|
|
|
|
|
|
|
|
|
|
|
|
|
|
|
|
|
|
|
|
|
|
Transaction Details |
|
|
Year |
|
No.
(Note 1) |
|
Company Name |
|
Related Party |
|
Nature of
Relationship
(Note 2) |
|
Financial Statement Account |
|
Amount
(Note 5) |
|
Payment Terms
(Note 3) |
|
% to
Total Sales or
Assets
(Note 4) |
|
|
|
|
|
|
|
|
|
|
|
|
|
|
|
|
|
|
|
|
|
|
|
|
|
|
|
|
|
|
|
Amounts collected in trust for others |
|
$ |
14,383 |
|
— |
|
— |
|
|
|
|
|
|
|
|
|
|
|
|
Advances from customers |
|
1,260 |
|
— |
|
— |
|
|
|
|
|
|
|
|
|
|
|
|
Revenues |
|
27,025 |
|
— |
|
— |
|
|
|
|
|
|
|
|
|
|
|
|
Operating costs and expenses |
|
3,513 |
|
— |
|
— |
|
|
|
|
|
|
|
|
Senao International Co., Ltd. |
|
c |
|
Operating costs and expenses |
|
90 |
|
— |
|
— |
|
|
|
|
|
|
|
|
|
|
|
|
Accounts payable |
|
94 |
|
— |
|
— |
|
|
|
|
|
|
|
|
|
|
|
|
|
|
|
|
|
|
|
|
|
|
|
5 |
|
Chunghwa Telecom Global, Inc. |
|
Chunghwa Telecom Co., Ltd. |
|
b |
|
Accounts receivable |
|
65,665 |
|
— |
|
— |
|
|
|
|
|
|
|
|
|
|
|
|
Prepaid expenses |
|
6 |
|
— |
|
— |
|
|
|
|
|
|
|
|
|
|
|
|
Advances from customers |
|
1,402 |
|
— |
|
— |
|
|
|
|
|
|
|
|
|
|
|
|
Accounts payable |
|
17,654 |
|
— |
|
— |
|
|
|
|
|
|
|
|
|
|
|
|
Revenues |
|
89,913 |
|
— |
|
— |
|
|
|
|
|
|
|
|
|
|
|
|
Operating costs and expenses |
|
19,378 |
|
— |
|
— |
|
|
|
|
|
|
|
|
|
|
|
|
Refundable deposits |
|
14,481 |
|
— |
|
— |
|
|
|
|
|
|
|
|
Donghwa Telecom Co., Ltd. |
|
c |
|
Revenues |
|
964 |
|
— |
|
— |
|
|
|
|
|
|
|
|
|
|
|
|
Accounts receivable |
|
964 |
|
— |
|
— |
|
|
|
|
|
|
|
|
Chunghwa Precision Test Tech. Co., Ltd. |
|
c |
|
Accounts receivable |
|
136 |
|
— |
|
— |
|
|
|
|
|
|
|
|
|
|
|
|
Revenues |
|
102 |
|
— |
|
— |
|
|
|
|
|
|
|
|
|
|
|
|
|
|
|
|
|
|
|
|
|
|
|
7 |
|
Spring House Entertainment Inc. |
|
Chunghwa Telecom Co., Ltd. |
|
b |
|
Accounts receivable |
|
39,216 |
|
— |
|
— |
|
|
|
|
|
|
|
|
|
|
|
|
Accounts payable |
|
685 |
|
— |
|
— |
|
|
|
|
|
|
|
|
|
|
|
|
Revenues |
|
7,271 |
|
— |
|
— |
|
|
|
|
|
|
|
|
|
|
|
|
Operating costs and expenses |
|
3,232 |
|
— |
|
— |
|
|
|
|
|
|
|
|
|
|
|
|
Refundable deposits |
|
5 |
|
— |
|
— |
|
|
|
|
|
|
|
|
Senao International Co., Ltd. |
|
c |
|
Operating costs and expenses |
|
298 |
|
— |
|
— |
|
|
|
|
|
|
|
|
|
|
|
|
Accounts payable |
|
59 |
|
— |
|
— |
|
|
|
|
|
|
|
|
Chunghwa System Integration Co., Ltd. |
|
c |
|
Accounts payable |
|
123 |
|
— |
|
— |
|
|
|
|
|
|
|
|
|
|
|
|
Operating costs and expenses |
|
349 |
|
— |
|
— |
|
|
|
|
|
|
|
|
|
|
|
|
|
|
|
|
|
|
|
|
|
|
|
6 |
|
Donghwa Telecom Co., Ltd. |
|
Chunghwa Telecom Co., Ltd. |
|
b |
|
Accounts receivable |
|
22,212 |
|
— |
|
— |
|
|
|
|
|
|
|
|
|
|
|
|
Prepaid expenses |
|
59,061 |
|
— |
|
— |
|
|
|
|
|
|
|
|
|
|
|
|
Accounts payable |
|
9,224 |
|
— |
|
— |
|
|
|
|
|
|
|
|
|
|
|
|
Advances from customers |
|
22,275 |
|
— |
|
— |
|
|
|
|
|
|
|
|
|
|
|
|
Revenues |
|
31,818 |
|
— |
|
— |
|
|
|
|
|
|
|
|
|
|
|
|
Operating costs and expenses |
|
31,136 |
|
— |
|
— |
|
|
|
|
|
|
|
|
CHIEF Telecom Inc. |
|
c |
|
Accounts payable |
|
70 |
|
— |
|
— |
|
|
|
|
|
|
|
|
|
|
|
|
Operating costs and expenses |
|
200 |
|
— |
|
— |
|
|
|
|
|
|
|
|
Chunghwa Telecom Global, Inc. |
|
c |
|
Accounts payable |
|
964 |
|
— |
|
— |
|
|
|
|
|
|
|
|
|
|
|
|
Operating costs and expenses |
|
964 |
|
— |
|
— |
|
|
|
|
|
|
|
|
|
|
|
|
|
|
|
|
|
|
|
|
|
|
|
8 |
|
Light Era Development Co., Ltd |
|
Chunghwa Telecom Co., Ltd. |
|
b |
|
Accounts receivable |
|
1,696 |
|
— |
|
— |
|
|
|
|
|
|
|
|
|
|
|
|
Prepaid expenses |
|
278 |
|
— |
|
— |
|
|
|
|
|
|
|
|
|
|
|
|
Operating costs and expenses |
|
627 |
|
— |
|
— |
|
|
|
|
|
|
|
|
|
|
|
|
Revenues |
|
91 |
|
— |
|
— |
|
|
|
|
|
|
|
|
Senao International Co., Ltd. |
|
c |
|
Operating costs and expenses |
|
46 |
|
— |
|
— |
|
|
|
|
|
|
|
|
Chunghwa System Integration Co., Ltd. |
|
c |
|
Operating costs and expenses |
|
45 |
|
— |
|
— |
|
(Continued)
78
|
|
|
|
|
|
|
|
|
|
|
|
|
|
|
|
|
|
|
|
|
|
|
|
|
|
|
|
|
|
Transaction Details |
|
|
Year |
|
No.
(Note 1) |
|
Company Name |
|
Related Party |
|
Nature of
Relationship
(Note 2) |
|
Financial Statement Account |
|
Amount
(Note 5) |
|
Payment Terms
(Note 3) |
|
% to
Total Sales or
Assets
(Note 4) |
|
|
|
|
|
|
|
|
|
|
|
|
|
|
|
|
|
|
|
|
|
|
|
9 |
|
Chunghwa Telecom Singapore Pte., Ltd. |
|
Chunghwa Telecom Co., Ltd. |
|
b |
|
Accounts receivable |
|
$ |
4,035 |
|
— |
|
— |
|
|
|
|
|
|
|
|
|
|
|
|
Accounts payable |
|
3,520 |
|
— |
|
— |
|
|
|
|
|
|
|
|
|
|
|
|
Revenues |
|
9,836 |
|
— |
|
— |
|
|
|
|
|
|
|
|
|
|
|
|
Operating costs and expenses |
|
14,559 |
|
— |
|
— |
|
|
|
|
|
|
|
|
CHIEF Telecom Inc. |
|
c |
|
Accounts receivable |
|
1,385 |
|
— |
|
— |
|
|
|
|
|
|
|
|
|
|
|
|
Accounts payable |
|
3,544 |
|
— |
|
— |
|
|
|
|
|
|
|
|
|
|
|
|
Revenues |
|
2,991 |
|
— |
|
— |
|
|
|
|
|
|
|
|
|
|
|
|
Operating costs and expenses |
|
6,078 |
|
— |
|
— |
|
|
|
|
|
|
|
|
|
|
|
|
|
|
|
|
|
|
|
|
|
|
|
10 |
|
Chunghwa Telecom Japan Co., Ltd. |
|
Chunghwa Telecom Co., Ltd. |
|
b |
|
Accounts receivable |
|
6,565 |
|
— |
|
— |
|
|
|
|
|
|
|
|
|
|
|
|
Accounts payable |
|
6,209 |
|
— |
|
— |
|
|
|
|
|
|
|
|
|
|
|
|
Advances from customers |
|
885 |
|
— |
|
— |
|
|
|
|
|
|
|
|
|
|
|
|
Revenues |
|
17,478 |
|
— |
|
— |
|
|
|
|
|
|
|
|
|
|
|
|
Operating costs and expenses |
|
7,697 |
|
— |
|
— |
|
|
|
|
|
|
|
|
CHIEF Telecom Inc. |
|
c |
|
Accounts receivable |
|
265 |
|
— |
|
— |
|
|
|
|
|
|
|
|
|
|
|
|
Revenues |
|
476 |
|
— |
|
— |
|
|
|
|
|
|
|
|
|
|
|
|
|
|
|
|
|
|
|
|
|
|
|
14 |
|
Chunghwa Investment Co., Ltd. |
|
Chunghwa Telecom Co., Ltd. |
|
b |
|
Operating costs and expenses |
|
49 |
|
— |
|
— |
|
|
|
|
|
|
|
|
|
|
|
|
|
|
|
|
|
|
|
|
|
|
|
20 |
|
Chunghwa Precision Test Tech. Co., Ltd. |
|
Chunghwa Telecom Co., Ltd. |
|
b |
|
Accounts receivable |
|
3 |
|
— |
|
— |
|
|
|
|
|
|
|
|
|
|
|
|
Accounts payable |
|
23 |
|
— |
|
— |
|
|
|
|
|
|
|
|
|
|
|
|
Operating costs and expenses |
|
686 |
|
— |
|
— |
|
|
|
|
|
|
|
|
Chunghwa Telecom Global, Inc. |
|
c |
|
Accounts payable |
|
136 |
|
— |
|
— |
|
|
|
|
|
|
|
|
|
|
|
|
Operating costs and expenses |
|
102 |
|
— |
|
— |
|
|
|
|
|
|
|
|
|
|
|
|
|
|
|
|
|
|
|
|
|
|
|
25 |
|
Yao Yong Real Property Co., Ltd. |
|
CHIEF Telecom Inc. |
|
c |
|
Revenues |
|
21,695 |
|
— |
|
— |
|
|
|
|
|
|
|
|
|
|
|
|
|
|
|
|
|
|
|
|
|
|
|
30 |
|
Chunghwa Telecom (China) Co., Ltd. |
|
Chunghwa Telecom Co., Ltd. |
|
b |
|
Accounts receivable |
|
852 |
|
— |
|
— |
|
|
|
|
|
|
|
|
|
|
|
|
Revenues |
|
2,598 |
|
— |
|
— |
|
|
|
|
|
|
|
|
|
|
|
|
|
|
|
|
|
|
|
|
|
|
|
31 |
|
Smartfun Digital Co., Ltd. |
|
Chunghwa Telecom Co., Ltd. |
|
b |
|
Operating costs and expenses |
|
377 |
|
— |
|
— |
|
|
|
|
|
|
|
|
|
|
|
|
|
|
|
|
|
|
|
|
|
|
|
32 |
|
Chunghwa Telecom Vietnam Co., Ltd. |
|
Chunghwa Telecom Co., Ltd. |
|
b |
|
Accounts receivable |
|
151 |
|
— |
|
— |
|
|
|
|
|
|
|
|
|
|
|
|
Revenues |
|
447 |
|
— |
|
— |
|
|
|
|
|
|
|
|
|
|
|
|
|
|
|
|
|
|
|
|
|
|
|
33 |
|
Chunghwa Sochamp Technology Inc. |
|
Chunghwa Telecom Co., Ltd. |
|
b |
|
Operating costs and expenses |
|
39 |
|
— |
|
— |
|
|
|
|
|
|
|
|
|
|
|
|
Accounts receivable |
|
113 |
|
— |
|
— |
|
|
|
|
|
|
|
|
|
|
|
|
Revenues |
|
250 |
|
— |
|
— |
|
|
|
|
|
|
|
|
|
|
|
|
|
|
|
|
|
|
|
|
(Continued)
79
|
|
|
|
|
|
|
|
|
|
|
|
|
|
|
|
|
|
|
|
|
|
|
|
|
|
|
|
|
|
Transaction Details |
|
|
Year |
|
No.
(Note 1) |
|
Company Name |
|
Related Party |
|
Nature of
Relationship
(Note 2) |
|
Financial Statement Account |
|
Amount
(Note 5) |
|
Payment Terms
(Note 3) |
|
% to
Total Sales or
Assets
(Note 4) |
|
|
|
|
|
|
|
|
|
|
|
|
|
|
|
|
|
|
|
|
|
|
2011 |
|
0 |
|
Chunghwa Telecom Co., Ltd. |
|
Senao International Co., Ltd. |
|
a |
|
Accounts receivable |
|
$ |
319,609 |
|
— |
|
— |
|
|
|
|
|
|
|
|
|
|
|
|
Accounts payable |
|
836,679 |
|
— |
|
— |
|
|
|
|
|
|
|
|
|
|
|
|
Amounts collected in trust for others |
|
235,102 |
|
— |
|
— |
|
|
|
|
|
|
|
|
|
|
|
|
Revenues |
|
305,409 |
|
— |
|
1 |
|
|
|
|
|
|
|
|
|
|
|
|
Non-operating income and gains |
|
5 |
|
— |
|
— |
|
|
|
|
|
|
|
|
|
|
|
|
Operating costs and expenses |
|
1,650,294 |
|
— |
|
4 |
|
|
|
|
|
|
|
|
|
|
|
|
Work in process |
|
266 |
|
— |
|
— |
|
|
|
|
|
|
|
|
|
|
|
|
Customer’s deposits |
|
1,690 |
|
— |
|
— |
|
|
|
|
|
|
|
|
CHIEF Telecom Inc. |
|
a |
|
Accounts receivable |
|
29,711 |
|
— |
|
— |
|
|
|
|
|
|
|
|
|
|
|
|
Accounts payable |
|
43,349 |
|
— |
|
— |
|
|
|
|
|
|
|
|
|
|
|
|
Amounts collected in trust for others |
|
591 |
|
— |
|
— |
|
|
|
|
|
|
|
|
|
|
|
|
Revenues |
|
76,770 |
|
— |
|
— |
|
|
|
|
|
|
|
|
|
|
|
|
Operating costs and expenses |
|
74,540 |
|
— |
|
— |
|
|
|
|
|
|
|
|
|
|
|
|
Customer’s deposits |
|
333 |
|
— |
|
— |
|
|
|
|
|
|
|
|
Chunghwa International Yellow Pages Co., Ltd. |
|
a |
|
Accounts receivable |
|
20,849 |
|
— |
|
— |
|
|
|
|
|
|
|
|
|
|
|
|
Accounts payable |
|
28,252 |
|
— |
|
— |
|
|
|
|
|
|
|
|
|
|
|
|
Amounts collected in trust for others |
|
4,747 |
|
— |
|
— |
|
|
|
|
|
|
|
|
|
|
|
|
Revenues |
|
3,160 |
|
— |
|
— |
|
|
|
|
|
|
|
|
|
|
|
|
Work in process |
|
1,301 |
|
— |
|
— |
|
|
|
|
|
|
|
|
|
|
|
|
Operating costs and expenses |
|
6,526 |
|
— |
|
— |
|
|
|
|
|
|
|
|
Chunghwa System Integration Co., Ltd. |
|
a |
|
Accounts receivable |
|
12,907 |
|
— |
|
— |
|
|
|
|
|
|
|
|
|
|
|
|
Accounts payable |
|
123,698 |
|
— |
|
— |
|
|
|
|
|
|
|
|
|
|
|
|
Payables to contractors |
|
53 |
|
— |
|
— |
|
|
|
|
|
|
|
|
|
|
|
|
Revenues |
|
2,098 |
|
— |
|
— |
|
|
|
|
|
|
|
|
|
|
|
|
Non-operating income and gains |
|
305 |
|
— |
|
— |
|
|
|
|
|
|
|
|
|
|
|
|
Operating costs and expenses |
|
67,488 |
|
— |
|
— |
|
|
|
|
|
|
|
|
|
|
|
|
Property, plant and equipment |
|
133,468 |
|
— |
|
— |
|
|
|
|
|
|
|
|
|
|
|
|
Work in process |
|
59 |
|
— |
|
— |
|
|
|
|
|
|
|
|
|
|
|
|
Intangible assets |
|
7,122 |
|
— |
|
— |
|
|
|
|
|
|
|
|
|
|
|
|
Customer’s deposits |
|
21,566 |
|
— |
|
— |
|
|
|
|
|
|
|
|
Chunghwa Telecom Global, Inc. |
|
a |
|
Accounts receivable |
|
25,206 |
|
— |
|
— |
|
|
|
|
|
|
|
|
|
|
|
|
Accounts payable |
|
45,039 |
|
— |
|
— |
|
|
|
|
|
|
|
|
|
|
|
|
Amounts collected in trust for others |
|
201 |
|
— |
|
— |
|
|
|
|
|
|
|
|
|
|
|
|
Revenues |
|
24,216 |
|
— |
|
— |
|
|
|
|
|
|
|
|
|
|
|
|
Operating costs and expenses |
|
44,907 |
|
— |
|
— |
|
|
|
|
|
|
|
|
|
|
|
|
Property, plant and equipment |
|
6,069 |
|
— |
|
— |
|
|
|
|
|
|
|
|
|
|
|
|
Customer’s deposits |
|
14,429 |
|
— |
|
— |
|
|
|
|
|
|
|
|
Donghwa Telecom Co., Ltd. |
|
a |
|
Accounts receivable |
|
36,671 |
|
— |
|
— |
|
|
|
|
|
|
|
|
|
|
|
|
Accounts payable |
|
61,634 |
|
— |
|
— |
|
|
|
|
|
|
|
|
|
|
|
|
Revenues |
|
25,753 |
|
— |
|
— |
|
|
|
|
|
|
|
|
|
|
|
|
Operating costs and expenses |
|
15,522 |
|
— |
|
— |
|
|
|
|
|
|
|
|
Spring House Entertainment Inc. |
|
a |
|
Accounts receivable |
|
14,167 |
|
— |
|
— |
|
|
|
|
|
|
|
|
|
|
|
|
Accounts payable |
|
18,637 |
|
— |
|
— |
|
|
|
|
|
|
|
|
|
|
|
|
Revenues |
|
2,237 |
|
— |
|
— |
|
|
|
|
|
|
|
|
|
|
|
|
Operating costs and expenses |
|
7,167 |
|
— |
|
— |
|
|
|
|
|
|
|
|
|
|
|
|
Customer’s deposits |
|
5 |
|
— |
|
— |
|
(Continued)
80
|
|
|
|
|
|
|
|
|
|
|
Transaction Details |
|
|
Year |
|
No.
(Note 1) |
|
Company Name |
|
Related Party |
|
Nature of
Relationship
(Note 2) |
|
Financial Statement Account |
|
Amount
(Note 5) |
|
Payment Terms
(Note 3) |
|
% to
Total Sales or
Assets
(Note 4) |
|
|
|
|
|
|
|
|
|
|
|
|
|
|
|
|
|
|
|
|
|
|
|
|
|
|
|
Chunghwa Telecom Japan Co., Ltd. |
|
a |
|
Accounts receivable |
|
$ |
8,949 |
|
— |
|
— |
|
|
|
|
|
|
|
|
|
|
|
|
Accounts payable |
|
5,015 |
|
— |
|
— |
|
|
|
|
|
|
|
|
|
|
|
|
Revenues |
|
10,635 |
|
— |
|
— |
|
|
|
|
|
|
|
|
|
|
|
|
Operating costs and expenses |
|
11,110 |
|
— |
|
— |
|
|
|
|
|
|
|
|
Light Era Development Co., Ltd |
|
a |
|
Accounts payable |
|
12,447 |
|
— |
|
— |
|
|
|
|
|
|
|
|
|
|
|
|
Revenues |
|
98,668 |
|
— |
|
— |
|
|
|
|
|
|
|
|
Chunghwa Telecom Singapore Co., Ltd. |
|
a |
|
Accounts receivable |
|
3,770 |
|
— |
|
— |
|
|
|
|
|
|
|
|
|
|
|
|
Accounts payable |
|
2,219 |
|
— |
|
— |
|
|
|
|
|
|
|
|
|
|
|
|
Revenues |
|
10,657 |
|
— |
|
— |
|
|
|
|
|
|
|
|
|
|
|
|
Operating costs and expenses |
|
7,809 |
|
— |
|
— |
|
|
|
|
|
|
|
|
InfoExplorer Co., Ltd. |
|
a |
|
Accounts receivable |
|
152 |
|
— |
|
— |
|
|
|
|
|
|
|
|
|
|
|
|
Accounts payable |
|
30,881 |
|
— |
|
— |
|
|
|
|
|
|
|
|
|
|
|
|
Revenues |
|
752 |
|
— |
|
— |
|
|
|
|
|
|
|
|
|
|
|
|
Operating costs and expenses |
|
38,364 |
|
— |
|
— |
|
|
|
|
|
|
|
|
|
|
|
|
Work in process |
|
1,192 |
|
— |
|
— |
|
|
|
|
|
|
|
|
|
|
|
|
Customer’s deposits |
|
1,225 |
|
— |
|
— |
|
|
|
|
|
|
|
|
Chunghwa Precision Test Tech. Co., Ltd. |
|
a |
|
Accounts receivable |
|
488 |
|
— |
|
— |
|
|
|
|
|
|
|
|
|
|
|
|
Accounts payable |
|
475 |
|
— |
|
— |
|
|
|
|
|
|
|
|
|
|
|
|
Revenues |
|
468 |
|
— |
|
— |
|
|
|
|
|
|
|
|
|
|
|
|
Non-operating income and gains |
|
25 |
|
— |
|
— |
|
|
|
|
|
|
|
|
|
|
|
|
Operating costs and expenses |
|
1 |
|
— |
|
— |
|
|
|
|
|
|
|
|
|
|
|
|
Customer’s deposits |
|
157 |
|
— |
|
— |
|
|
|
|
|
|
|
|
Chunghwa Investment Co., Ltd. |
|
a |
|
Revenues |
|
3 |
|
— |
|
— |
|
|
|
|
|
|
|
|
|
|
|
|
|
|
|
|
|
|
|
|
|
|
|
1 |
|
Senao International Co., Ltd. |
|
Chunghwa Telecom Co., Ltd. |
|
b |
|
Accounts receivable |
|
825,482 |
|
— |
|
— |
|
|
|
|
|
|
|
|
|
|
|
|
Other receivables |
|
246,299 |
|
— |
|
— |
|
|
|
|
|
|
|
|
|
|
|
|
Accounts payable |
|
108,547 |
|
— |
|
— |
|
|
|
|
|
|
|
|
|
|
|
|
Other payables |
|
211,062 |
|
— |
|
— |
|
|
|
|
|
|
|
|
|
|
|
|
Advances from customers |
|
14,869 |
|
|
|
— |
|
|
|
|
|
|
|
|
|
|
|
|
Revenues |
|
1,635,677 |
|
— |
|
4 |
|
|
|
|
|
|
|
|
|
|
|
|
Non-operating income and gains |
|
14 |
|
— |
|
— |
|
|
|
|
|
|
|
|
|
|
|
|
Operating costs and expenses |
|
305,409 |
|
— |
|
1 |
|
|
|
|
|
|
|
|
|
|
|
|
Refundable deposits |
|
1,690 |
|
— |
|
— |
|
|
|
|
|
|
|
|
|
|
|
|
Non-operating costs and expenses |
|
5 |
|
— |
|
— |
|
|
|
|
|
|
|
|
Spring House Entertainment Inc. |
|
c |
|
Revenues |
|
290 |
|
— |
|
— |
|
|
|
|
|
|
|
|
Chunghwa International Yellow Pages Co., Ltd. |
|
c |
|
Revenues |
|
19 |
|
— |
|
— |
|
|
|
|
|
|
|
|
InfoExplorer Co., Ltd. |
|
c |
|
Revenues |
|
152 |
|
— |
|
— |
|
|
|
|
|
|
|
|
CHIEF Telecom Inc. |
|
c |
|
Revenues |
|
1 |
|
— |
|
— |
|
|
|
|
|
|
|
|
|
|
|
|
|
|
|
|
|
|
|
|
|
|
|
2 |
|
CHIEF Telecom Inc. |
|
Chunghwa Telecom Co., Ltd. |
|
b |
|
Accounts receivable |
|
43,686 |
|
— |
|
— |
|
|
|
|
|
|
|
|
|
|
|
|
Prepaid expenses |
|
254 |
|
— |
|
— |
|
|
|
|
|
|
|
|
|
|
|
|
Accounts payable |
|
29,262 |
|
— |
|
— |
|
|
|
|
|
|
|
|
|
|
|
|
Advances from customers |
|
449 |
|
— |
|
— |
|
|
|
|
|
|
|
|
|
|
|
|
Revenues |
|
74,540 |
|
— |
|
— |
|
|
|
|
|
|
|
|
|
|
|
|
Operating costs and expenses |
|
76,770 |
|
— |
|
— |
|
|
|
|
|
|
|
|
|
|
|
|
Refundable deposits |
|
333 |
|
— |
|
— |
|
|
|
|
|
|
|
|
|
|
|
|
|
|
|
|
|
|
|
|
(Continued)
81
|
|
|
|
|
|
|
|
|
|
|
|
|
|
|
|
|
|
|
|
|
|
|
|
|
|
|
|
|
|
Transaction Details |
|
|
Year |
|
No.
(Note 1) |
|
Company Name |
|
Related Party |
|
Nature of
Relationship
(Note 2) |
|
Financial Statement Account |
|
Amount
(Note 5) |
|
Payment Terms
(Note 3) |
|
% to
Total Sales or
Assets
(Note 4) |
|
|
|
|
|
|
|
|
|
|
|
|
|
|
|
|
|
|
|
|
|
|
|
|
|
|
|
Senao International Co., Ltd. |
|
c |
|
Operating costs and expenses |
|
$ |
1 |
|
— |
|
— |
|
|
|
|
|
|
|
|
Chunghwa Telecom Singapore Co., Ltd. |
|
c |
|
Accounts receivable |
|
8 |
|
— |
|
— |
|
|
|
|
|
|
|
|
|
|
|
|
Accounts payable |
|
11 |
|
— |
|
— |
|
|
|
|
|
|
|
|
|
|
|
|
Revenues |
|
8 |
|
— |
|
— |
|
|
|
|
|
|
|
|
|
|
|
|
Operating costs and expenses |
|
11 |
|
— |
|
— |
|
|
|
|
|
|
|
|
Donghwa Telecom Co., Ltd. |
|
c |
|
Accounts receivable |
|
77 |
|
— |
|
— |
|
|
|
|
|
|
|
|
|
|
|
|
Revenues |
|
214 |
|
— |
|
— |
|
|
|
|
|
|
|
|
Chunghwa Telecom Japan Co., Ltd. |
|
c |
|
Accounts payable |
|
168 |
|
— |
|
— |
|
|
|
|
|
|
|
|
|
|
|
|
Operating costs and expenses |
|
226 |
|
— |
|
— |
|
|
|
|
|
|
|
|
Chunghwa Telecom Global, Inc. |
|
c |
|
Operating costs and expenses |
|
18 |
|
— |
|
— |
|
|
|
|
|
|
|
|
Chunghwa System Integration Co., Ltd. |
|
c |
|
Revenues |
|
23 |
|
— |
|
— |
|
|
|
|
|
|
|
|
Yao Yong Real Property Co., Ltd. |
|
c |
|
Operating costs and expenses |
|
21,695 |
|
— |
|
— |
|
|
|
|
|
|
|
|
|
|
|
|
|
|
|
|
|
|
|
|
|
|
|
3 |
|
Chunghwa System Integration Co., Ltd. |
|
Chunghwa Telecom Co., Ltd. |
|
b |
|
Accounts receivable |
|
123,570 |
|
— |
|
— |
|
|
|
|
|
|
|
|
|
|
|
|
Prepaid expenses |
|
181 |
|
— |
|
— |
|
|
|
|
|
|
|
|
|
|
|
|
Accounts payable |
|
12,907 |
|
— |
|
— |
|
|
|
|
|
|
|
|
|
|
|
|
Revenues |
|
208,137 |
|
— |
|
— |
|
|
|
|
|
|
|
|
|
|
|
|
Operating costs and expenses |
|
2,403 |
|
— |
|
— |
|
|
|
|
|
|
|
|
|
|
|
|
Refundable deposits |
|
21,566 |
|
— |
|
— |
|
|
|
|
|
|
|
|
CHIEF Telecom Inc. |
|
c |
|
Operating costs and expenses |
|
23 |
|
— |
|
— |
|
|
|
|
|
|
|
|
InfoExplorer Co., Ltd. |
|
c |
|
Accounts receivable |
|
1,935 |
|
— |
|
— |
|
|
|
|
|
|
|
|
|
|
|
|
Accounts payable |
|
86 |
|
— |
|
— |
|
|
|
|
|
|
|
|
|
|
|
|
Revenues |
|
2,002 |
|
— |
|
— |
|
|
|
|
|
|
|
|
|
|
|
|
Operating costs and expenses |
|
82 |
|
— |
|
— |
|
|
|
|
|
|
|
|
|
|
|
|
Customer’s deposits |
|
15 |
|
— |
|
— |
|
|
|
|
|
|
|
|
Light Era Development Co., Ltd |
|
c |
|
Revenues |
|
48 |
|
— |
|
— |
|
|
|
|
|
|
|
|
Chunghwa Precision Test Tech. Co., Ltd. |
|
c |
|
Revenues |
|
70 |
|
— |
|
— |
|
|
|
|
|
|
|
|
|
|
|
|
|
|
|
|
|
|
|
|
|
|
|
4 |
|
Chunghwa International Yellow Pages Co., |
|
Chunghwa Telecom Co., Ltd. |
|
b |
|
Accounts receivable |
|
13,836 |
|
— |
|
— |
|
|
|
|
|
|
Ltd. |
|
|
|
|
|
Accrued custodial receipts |
|
18,219 |
|
— |
|
— |
|
|
|
|
|
|
|
|
|
|
|
|
Prepaid expenses |
|
944 |
|
— |
|
— |
|
|
|
|
|
|
|
|
|
|
|
|
Accounts payable |
|
1,815 |
|
— |
|
— |
|
|
|
|
|
|
|
|
|
|
|
|
Advances from customers |
|
2,826 |
|
— |
|
— |
|
|
|
|
|
|
|
|
|
|
|
|
Amounts collected in trust for others |
|
16,208 |
|
— |
|
— |
|
|
|
|
|
|
|
|
|
|
|
|
Revenues |
|
6,526 |
|
— |
|
— |
|
|
|
|
|
|
|
|
|
|
|
|
Operating costs and expenses |
|
3,160 |
|
— |
|
— |
|
|
|
|
|
|
|
|
|
|
|
|
Deferred revenue |
|
1,301 |
|
— |
|
— |
|
|
|
|
|
|
|
|
Senao International Co., Ltd. |
|
c |
|
Operating costs and expenses |
|
19 |
|
— |
|
— |
|
|
|
|
|
|
|
|
|
|
|
|
|
|
|
|
|
|
|
|
|
|
|
5 |
|
Chunghwa Telecom Global, Inc. |
|
Chunghwa Telecom Co., Ltd. |
|
b |
|
Accounts receivable |
|
45,227 |
|
— |
|
— |
|
|
|
|
|
|
|
|
|
|
|
|
Prepaid expenses |
|
13 |
|
— |
|
— |
|
|
|
|
|
|
|
|
|
|
|
|
Accounts payable |
|
24,464 |
|
— |
|
— |
|
|
|
|
|
|
|
|
|
|
|
|
Advances from customers |
|
515 |
|
— |
|
— |
|
|
|
|
|
|
|
|
|
|
|
|
Accrued expenses |
|
227 |
|
— |
|
— |
|
|
|
|
|
|
|
|
|
|
|
|
Revenues |
|
50,976 |
|
— |
|
— |
|
|
|
|
|
|
|
|
|
|
|
|
|
|
|
|
|
|
|
|
(Continued)
82
|
|
|
|
|
|
|
|
|
|
|
Transaction Details |
|
|
Year |
|
No.
(Note 1) |
|
Company Name |
|
Related Party |
|
Nature of
Relationship
(Note 2) |
|
Financial Statement Account |
|
Amount
(Note 5) |
|
Payment Terms
(Note 3) |
|
% to
Total Sales or
Assets
(Note 4) |
|
|
|
|
|
|
|
|
|
|
|
|
|
|
|
|
|
|
|
|
|
|
|
|
|
|
|
|
|
|
|
Operating costs and expenses |
|
$ |
24,216 |
|
— |
|
— |
|
|
|
|
|
|
|
|
|
|
|
|
Refundable deposits |
|
14,429 |
|
— |
|
— |
|
|
|
|
|
|
|
|
Chunghwa Precision Test Tech. Co., Ltd. |
|
c |
|
Accounts receivable |
|
136 |
|
— |
|
— |
|
|
|
|
|
|
|
|
|
|
|
|
Revenues |
|
406 |
|
— |
|
— |
|
|
|
|
|
|
|
|
CHIEF Telecom Inc. |
|
c |
|
Revenues |
|
18 |
|
— |
|
— |
|
|
|
|
|
|
|
|
|
|
|
|
|
|
|
|
|
|
|
|
|
|
|
7 |
|
Spring House Entertainment Inc. |
|
Chunghwa Telecom Co., Ltd. |
|
b |
|
Accounts receivable |
|
18,637 |
|
— |
|
— |
|
|
|
|
|
|
|
|
|
|
|
|
Accrued expenses |
|
501 |
|
— |
|
— |
|
|
|
|
|
|
|
|
|
|
|
|
Advances from customers |
|
13,666 |
|
— |
|
— |
|
|
|
|
|
|
|
|
|
|
|
|
Revenues |
|
7,167 |
|
— |
|
— |
|
|
|
|
|
|
|
|
|
|
|
|
Operating costs and expenses |
|
2,237 |
|
— |
|
— |
|
|
|
|
|
|
|
|
|
|
|
|
Refundable deposits |
|
5 |
|
— |
|
— |
|
|
|
|
|
|
|
|
Senao International Co., Ltd. |
|
c |
|
Operating costs and expenses |
|
290 |
|
— |
|
— |
|
|
|
|
|
|
|
|
|
|
|
|
|
|
|
|
|
|
|
|
|
|
|
6 |
|
Donghwa Telecom Co., Ltd. |
|
Chunghwa Telecom Co., Ltd. |
|
b |
|
Accounts receivable |
|
41,752 |
|
— |
|
— |
|
|
|
|
|
|
|
|
|
|
|
|
Prepaid expenses |
|
19,882 |
|
— |
|
— |
|
|
|
|
|
|
|
|
|
|
|
|
Accounts payable |
|
18,709 |
|
— |
|
— |
|
|
|
|
|
|
|
|
|
|
|
|
Advances from customers |
|
17,962 |
|
— |
|
— |
|
|
|
|
|
|
|
|
|
|
|
|
Revenues |
|
15,522 |
|
— |
|
— |
|
|
|
|
|
|
|
|
|
|
|
|
Operating costs and expenses |
|
25,753 |
|
— |
|
— |
|
|
|
|
|
|
|
|
CHIEF Telecom Inc. |
|
c |
|
Accounts payable |
|
77 |
|
— |
|
— |
|
|
|
|
|
|
|
|
|
|
|
|
Operating costs and expenses |
|
214 |
|
— |
|
— |
|
|
|
|
|
|
|
|
Chunghwa Telecom Singapore Co., Ltd. |
|
c |
|
Accounts payable |
|
821 |
|
— |
|
— |
|
|
|
|
|
|
|
|
|
|
|
|
Operating costs and expenses |
|
1,223 |
|
— |
|
— |
|
|
|
|
|
|
|
|
|
|
|
|
|
|
|
|
|
|
|
|
|
|
|
8 |
|
Light Era Development Co., Ltd |
|
Chunghwa Telecom Co., Ltd. |
|
b |
|
Accounts receivable |
|
11,926 |
|
— |
|
— |
|
|
|
|
|
|
|
|
|
|
|
|
Prepaid expenses |
|
521 |
|
— |
|
— |
|
|
|
|
|
|
|
|
|
|
|
|
Operating costs and expenses |
|
98,668 |
|
— |
|
— |
|
|
|
|
|
|
|
|
Chunghwa System Integration Co., Ltd. |
|
c |
|
Operating costs and expenses |
|
48 |
|
— |
|
— |
|
|
|
|
|
|
|
|
InfoExplorer Co., Ltd. |
|
c |
|
Revenues |
|
2,587 |
|
— |
|
— |
|
|
|
|
|
|
|
|
|
|
|
|
Non-operating costs and expenses |
|
4 |
|
— |
|
— |
|
|
|
|
|
|
|
|
|
|
|
|
Customer’s deposits |
|
1,486 |
|
— |
|
|
|
|
|
|
|
|
|
|
|
|
|
|
|
|
|
|
|
|
|
|
|
|
|
9 |
|
Chunghwa Telecom Singapore Co., Ltd. |
|
Chunghwa Telecom Co., Ltd. |
|
b |
|
Accounts receivable |
|
2,219 |
|
— |
|
— |
|
|
|
|
|
|
|
|
|
|
|
|
Accounts payable |
|
3,770 |
|
— |
|
— |
|
|
|
|
|
|
|
|
|
|
|
|
Revenues |
|
7,809 |
|
— |
|
— |
|
|
|
|
|
|
|
|
|
|
|
|
Operating costs and expenses |
|
10,657 |
|
— |
|
— |
|
|
|
|
|
|
|
|
Donghwa Telecom Co., Ltd. |
|
c |
|
Accounts receivable |
|
821 |
|
— |
|
— |
|
|
|
|
|
|
|
|
|
|
|
|
Revenues |
|
1,223 |
|
— |
|
— |
|
|
|
|
|
|
|
|
CHIEF Telecom Inc. |
|
c |
|
Accounts receivable |
|
11 |
|
— |
|
— |
|
|
|
|
|
|
|
|
|
|
|
|
Accounts payable |
|
8 |
|
— |
|
— |
|
|
|
|
|
|
|
|
|
|
|
|
Revenues |
|
11 |
|
— |
|
— |
|
|
|
|
|
|
|
|
|
|
|
|
Operating costs and expenses |
|
8 |
|
— |
|
— |
|
|
|
|
|
|
|
|
Chunghwa Telecom Japan Co., Ltd. |
|
c |
|
Prepaid expenses |
|
941 |
|
— |
|
— |
|
|
|
|
|
|
|
|
|
|
|
|
|
|
|
|
|
|
|
|
(Continued)
83
|
|
|
|
|
|
|
|
|
|
|
Transaction Details |
|
|
Year |
|
No.
(Note 1) |
|
Company Name |
|
Related Party |
|
Nature of
Relationship
(Note 2) |
|
Financial Statement Account |
|
Amount
(Note 5) |
|
Payment Terms
(Note 3) |
|
% to
Total Sales or
Assets
(Note 4) |
|
|
|
|
|
|
|
|
|
|
|
|
|
|
|
|
|
|
|
|
|
|
|
11 |
|
|
|
Chunghwa Telecom Co., Ltd. |
|
b |
|
Accounts receivable |
|
$ |
30,881 |
|
— |
|
— |
|
|
|
|
|
|
|
|
|
|
|
|
Advances from customers |
|
152 |
|
— |
|
— |
|
|
|
|
|
|
|
|
|
|
|
|
Revenues |
|
39,556 |
|
— |
|
— |
|
|
|
|
|
|
|
|
|
|
|
|
Operating costs and expenses |
|
752 |
|
— |
|
— |
|
|
|
|
|
|
|
|
|
|
|
|
Refundable deposits |
|
1,225 |
|
— |
|
— |
|
|
|
|
|
|
|
|
Chunghwa System Integration Co., Ltd. |
|
c |
|
Accounts receivable |
|
86 |
|
— |
|
— |
|
|
|
|
|
|
|
|
|
|
|
|
Accounts payable |
|
1,935 |
|
— |
|
— |
|
|
|
|
|
|
|
|
|
|
|
|
Revenues |
|
82 |
|
— |
|
— |
|
|
|
|
|
|
|
|
|
|
|
|
Operating costs and expenses |
|
2,002 |
|
— |
|
— |
|
|
|
|
|
|
|
|
|
|
|
|
Refundable deposits |
|
15 |
|
— |
|
— |
|
|
|
|
|
|
|
|
Light Era Development Co., Ltd |
|
c |
|
Non-operating income and gains |
|
4 |
|
— |
|
— |
|
|
|
|
|
|
|
|
|
|
|
|
Operating costs and expenses |
|
2,587 |
|
— |
|
— |
|
|
|
|
|
|
|
|
|
|
|
|
Refundable deposits |
|
1,486 |
|
— |
|
— |
|
|
|
|
|
|
|
|
Senao International Co., Ltd. |
|
c |
|
Operating costs and expenses |
|
152 |
|
— |
|
— |
|
|
|
|
|
|
|
|
|
|
|
|
|
|
|
|
|
|
|
|
|
|
|
10 |
|
Chunghwa Telecom Japan Co., Ltd. |
|
Chunghwa Telecom Co., Ltd. |
|
b |
|
Accounts receivable |
|
5,015 |
|
— |
|
— |
|
|
|
|
|
|
|
|
|
|
|
|
Accounts payable |
|
8,675 |
|
— |
|
— |
|
|
|
|
|
|
|
|
|
|
|
|
Advances from customers |
|
274 |
|
— |
|
— |
|
|
|
|
|
|
|
|
|
|
|
|
Revenues |
|
11,110 |
|
— |
|
— |
|
|
|
|
|
|
|
|
|
|
|
|
Operating costs and expenses |
|
10,635 |
|
— |
|
— |
|
|
|
|
|
|
|
|
CHIEF Telecom Inc. |
|
c |
|
Accounts receivable |
|
168 |
|
— |
|
— |
|
|
|
|
|
|
|
|
|
|
|
|
Revenues |
|
226 |
|
— |
|
— |
|
|
|
|
|
|
|
|
Chunghwa Telecom Singapore Co., Ltd. |
|
c |
|
Advances from customers |
|
941 |
|
— |
|
— |
|
|
|
|
|
|
|
|
|
|
|
|
|
|
|
|
|
|
|
|
|
|
|
14 |
|
Chunghwa Investment Co., Ltd. |
|
Chunghwa Telecom Co., Ltd. |
|
b |
|
Operating costs and expenses |
|
3 |
|
— |
|
— |
|
|
|
|
|
|
|
|
|
|
|
|
|
|
|
|
|
|
|
|
|
|
|
20 |
|
Chunghwa Precision Test Tech. Co., Ltd. |
|
Chunghwa Telecom Co., Ltd. |
|
b |
|
Prepaid expenses |
|
475 |
|
— |
|
— |
|
|
|
|
|
|
|
|
|
|
|
|
Accounts payable |
|
472 |
|
— |
|
— |
|
|
|
|
|
|
|
|
|
|
|
|
Accrued expenses |
|
16 |
|
— |
|
— |
|
|
|
|
|
|
|
|
|
|
|
|
Non-operating income and gains |
|
1 |
|
— |
|
— |
|
|
|
|
|
|
|
|
|
|
|
|
Operating costs and expenses |
|
493 |
|
— |
|
— |
|
|
|
|
|
|
|
|
|
|
|
|
Refundable deposits |
|
157 |
|
— |
|
— |
|
|
|
|
|
|
|
|
Chunghwa Telecom Global, Inc. |
|
c |
|
Accounts payable |
|
136 |
|
— |
|
— |
|
|
|
|
|
|
|
|
|
|
|
|
Operating costs and expenses |
|
406 |
|
— |
|
— |
|
|
|
|
|
|
|
|
Chunghwa System Integration Co., Ltd. |
|
c |
|
Operating costs and expenses |
|
70 |
|
— |
|
— |
|
|
|
|
|
|
|
|
|
|
|
|
|
|
|
|
|
|
|
|
|
|
|
25 |
|
Yao Yong Real Property Co., Ltd. |
|
CHIEF Telecom Inc. |
|
c |
|
Revenues |
|
21,695 |
|
— |
|
— |
|
|
|
|
|
|
|
|
|
|
|
|
|
|
|
|
|
|
|
|
Note 1: Significant transactions between the Company and its subsidiaries or amount subsidiaries are numbered as follows:
a. “0” for the Company.
b. Subsidiaries are numbered from “1”.
(Continued)
84
Note 2: Related party transactions are divided into three categories as follows:
a. The Company to subsidiaries.
b. Subsidiaries to the Company.
c. Subsidiaries to subsidiaries.
Note 3: Transaction terms were determined in accordance with mutual agreements.
Note 4: For assets and liabilities, amount is shown as a percentage to consolidated total assets as of March 31, 2012, while revenues, costs and expenses are shown as a percentage to consolidated total operating revenues for the three months ended March 31, 2012.
Note 5: The amount was eliminated upon consolidation.
(Concluded)
85
TABLE 9
CHUNGHWA TELECOM CO., LTD. AND SUBSIDIARIES
SEGMENT INFORMATION
THREE MONTHS ENDED MARCH 31, 2012 AND 2011
(Amount in Thousands of New Taiwan Dollars)
|
|
|
Domestic Fixed
Communications
Business |
|
Mobile
Communications
Business |
|
Internet Business |
|
International
Fixed
Communications
Business |
|
Others |
|
Adjustment |
|
Total |
|
|
|
|
|
|
|
|
|
|
|
|
|
|
|
|
|
|
|
Three months ended March 31, 2012 |
|
|
|
|
|
|
|
|
|
|
|
|
|
|
|
|
|
|
|
|
|
|
|
|
|
|
|
|
|
|
|
|
|
Revenues from external customers |
|
$ |
18,998,403 |
|
$ |
25,581,549 |
|
$ |
6,186,001 |
|
$ |
3,643,905 |
|
$ |
1,008,436 |
|
$ |
— |
|
$ |
55,418,294 |
|
|
Intersegment revenues (Note 2) |
|
$ |
4,096,960 |
|
$ |
1,661,560 |
|
$ |
670,616 |
|
$ |
523,129 |
|
$ |
284,875 |
|
$ |
(7,237,140 |
) |
$ |
— |
|
|
Segment income before tax |
|
$ |
4,465,817 |
|
$ |
5,178,112 |
|
$ |
2,235,330 |
|
$ |
113,195 |
|
$ |
(159,581 |
) |
$ |
— |
|
$ |
11,832,873 |
|
|
Total assets |
|
$ |
227,957,496 |
|
$ |
65,080,192 |
|
$ |
19,999,970 |
|
$ |
25,062,019 |
|
$ |
111,295,128 |
|
$ |
— |
|
$ |
449,394,805 |
|
|
|
|
|
|
|
|
|
|
|
|
|
|
|
|
|
|
|
Three months ended March 31, 2011 |
|
|
|
|
|
|
|
|
|
|
|
|
|
|
|
|
|
|
|
|
|
|
|
|
|
|
|
|
|
|
|
|
|
Revenues from external customers |
|
$ |
19,200,760 |
|
$ |
22,843,551 |
|
$ |
6,081,948 |
|
$ |
3,793,884 |
|
$ |
554,888 |
|
$ |
— |
|
$ |
52,475,031 |
|
|
Intersegment revenues (Note 2) |
|
$ |
3,726,226 |
|
$ |
1,449,844 |
|
$ |
385,797 |
|
$ |
388,699 |
|
$ |
92,143 |
|
$ |
(6,042,709 |
) |
$ |
— |
|
|
Segment income before tax |
|
$ |
5,717,609 |
|
$ |
6,369,326 |
|
$ |
2,684,163 |
|
$ |
292,276 |
|
$ |
(626,954 |
) |
$ |
— |
|
$ |
14,436,420 |
|
|
Total assets |
|
$ |
226,798,835 |
|
$ |
65,464,969 |
|
$ |
17,410,691 |
|
$ |
22,747,542 |
|
$ |
113,151,312 |
|
$ |
— |
|
$ |
445,573,349 |
|
Note 1: The Company organizes its reporting segments based on types of organizational business. The five reporting segments are segregated as below: Domestic fixed communications business, mobile communications business, internet business, international fixed communications business and others.
· Domestic fixed communications business - the provision of local telephone services, domestic long distance telephone services, broadband access, and related services;
· Mobile communications business - the provision of mobile services, sales of mobile handsets and data cards, and related services;
· Internet business - the provision of HiNet services and related services;
· International fixed communications business - the provision of international long distance telephone services and related services;
· Others - the provision of non-Telecom Services, and the corporate related items not allocated to reportable segments.
Note 2: Represents intersegment revenues from goods and services, etc.
86