EX-99.2
Exhibit 99.2
Index to the Management’s Discussion and Analysis
|
|
|
|
|
| EXECUTIVE SUMMARY |
|
|
2 |
|
|
|
| CORE BUSINESS AND STRATEGY |
|
|
4 |
|
| Core Business |
|
|
4 |
|
| Business Objective |
|
|
4 |
|
| Strategy |
|
|
5 |
|
|
|
| KEY PERFORMANCE DRIVERS AND CAPABILITIES |
|
|
11 |
|
| Key External Drivers |
|
|
11 |
|
| Key Internal Drivers |
|
|
13 |
|
|
|
| RESULTS |
|
|
20 |
|
| Overall Annual Performance |
|
|
20 |
|
| Selected Annual Information |
|
|
21 |
|
| Results Compared to 2016 Targets |
|
|
23 |
|
| Acquisitions |
|
|
24 |
|
| Discussion of Operations |
|
|
25 |
|
| Fourth Quarter Results |
|
|
40 |
|
| Quarterly Trends |
|
|
44 |
|
| Statements of Financial Position |
|
|
46 |
|
| Liquidity and Capital Resources |
|
|
48 |
|
| Other |
|
|
54 |
|
|
|
| OUTLOOK |
|
|
58 |
|
|
|
| CRITICAL ACCOUNTING ESTIMATES, DEVELOPMENTS, AND MEASURES |
|
|
63 |
|
| Critical Accounting Estimates |
|
|
63 |
|
| Accounting Developments |
|
|
64 |
|
| Materiality |
|
|
64 |
|
| Definition of Non-IFRS Measures |
|
|
65 |
|
|
|
| RISK FACTORS |
|
|
68 |
|
|
|
| CONTROLS AND PROCEDURES |
|
|
78 |
|
|
|
| CORPORATE GOVERNANCE |
|
|
78 |
|
|
|
| SUBSEQUENT EVENTS |
|
|
80 |
|
|
|
| CAUTIONARY NOTE REGARDING FORWARD-LOOKING STATEMENTS |
|
|
80 |
|
|
|
|
|
|
| Management’s Discussion and Analysis
December 31, 2016 |
|
M-1 |
|
Stantec Inc. |
Management’s Discussion and Analysis
FEBRUARY 22, 2017
This discussion and analysis of Stantec Inc.’s (Stantec or the Company) operations, financial position, and cash flows for the year ended
December 31, 2016, dated February 22, 2017, should be read in conjunction with the Company’s 2016 audited consolidated financial statements and related notes for the year ended December 31, 2016. Our 2016 audited consolidated
financial statements and related notes are prepared in accordance with International Financial Reporting Standards (IFRS) as issued by the International Accounting Standards Board (IASB). Unless otherwise indicated, all amounts shown in this report
are in Canadian dollars.
Additional information regarding the Company, including our Annual Information Form, is available on SEDAR at www.sedar.com and
on EDGAR at www.sec.gov. Such additional information is not incorporated by reference unless otherwise specified and should not be deemed to be made part of this Management’s Discussion and Analysis.
Executive Summary
CORE BUSINESS AND
STRATEGY
| • |
|
We collaborate across disciplines and industries to bring buildings, energy and resource, environmental, water, and infrastructure projects to life. We provide services in engineering, architecture, interior design,
landscape architecture, surveying, environmental sciences, construction services, project management, and project economics, from initial project concept and planning through to design, construction, commissioning, maintenance, decommissioning, and
remediation. Our promise is to design with community in mind. |
| • |
|
Our business objective is to be a top 10 global design firm. We plan to achieve a compound average annual growth rate of 15% through a combination of organic and acquisition growth. |
| • |
|
To achieve our business objective, we focus on the following: providing professional consulting services while maintaining our newly acquired construction management at-risk
services; using the strength of our local positioning to bring our world-class expertise to the communities in which we live and work; driving a client-focused culture through cross-selling efforts, account management strategies, and strong
local relationships; focusing on quality and creativity; positioning ourselves among the top-tier service providers in the sectors and geographic locations in which we operate; and strengthening our
capabilities and geographic reach through strategic hires and the acquisition and integration of firms to solidify our North American presence while building on our global platform. |
|
|
|
|
|
| Management’s Discussion and Analysis
December 31, 2016 |
|
M-2 |
|
Stantec Inc. |
KEY PERFORMANCE DRIVERS AND CAPABILITIES
| • |
|
Our performance is driven by external factors in the infrastructure and facilities industry and by internal strategic drivers and capabilities that are articulated through our value statements: we put people first,
we are better together, we do what is right, and we are driven to achieve. |
RESULTS
| • |
|
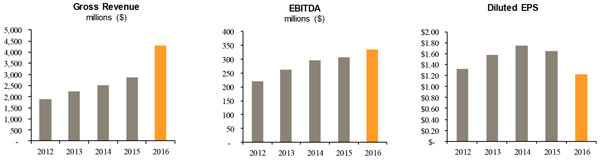
Continued profitability and growth. Our gross revenue grew 49.5% in 2016 compared to 2015. Of this gross revenue growth, 53.4% resulted from acquisitions and 1.7% was due to foreign exchange; this growth was
partly offset by a 5.6% retraction in organic revenue. We achieved a 9.8% increase in EBITDA1 and a 15.5% increase in adjusted EBITDA1. Our net
income was $130.5 million in 2016 compared to $156.4 million in 2015. Diluted earnings per share (EPS) was $1.22 in 2016 compared to $1.65 in 2015 and adjusted diluted EPS1 was $1.69 in
2016 compared to $1.84 in 2015. |
EBITDA for 2016 was impacted by a decrease in gross margin as a percentage of net revenue
and an increase in our administrative and marketing expenses—due in part to increases in acquisition-related costs in connection with the acquisition of MWH Global, Inc. (MWH), retention and merit payments to retain key employees, severance
costs in our Energy & Resources business, and professional fees. Net income was also impacted by an increase in the amortization of our intangible assets from acquisitions and software additions. As well, net interest expense increased year
over year, mainly resulting from an increase in outstanding long-term debt at the end of 2016 compared to 2015, which was primarily related to the MWH acquisition. In addition, our annual effective income tax rate increased in 2016. See pages M-21 to M-23 in this Management’s Discussion and Analysis for further EBITDA, EPS, and net income highlights.
| • |
|
Growth through acquisition. Acquisitions completed in 2016 and 2015 contributed $1.5 billion to the increase in our gross revenue in 2016 compared to 2015. We completed five acquisitions in 2016 and six in
2015, strengthening our North American presence while expanding our global reach. The MWH acquisition expanded many areas of our legacy Consulting Services business, positioned us as a global leader in the Water sector, and created a new service
offering—Construction Services. |
| • |
|
Successful public offering and new credit facilities. We financed the MWH acquisition with the net proceeds of a public offering that generated $578.1 million and with funds drawn from our new
$1.25 billion syndicated senior secured credit facilities. The proceeds from these new credit facilities were also used to repay all outstanding indebtedness under our existing $350 million revolving credit facility, redeem all our senior
secured notes, and repay the outstanding indebtedness of MWH under its existing revolving credit facility. As at December 31, 2016, $329.1 million of additional borrowing was available under our revolving credit facility for future
acquisitions, working capital needs, and general corporate purposes. |
OUTLOOK
| • |
|
We anticipate continued economic improvement in the United States, increased infrastructure spending in both Canada and the United States, increased spending in the water and wastewater sector, strong spending growth in
the US transportation sector, a modest improvement in the energy and resource sectors compared to 2016, continued support for alternative project delivery (APD) methods—including public-private partnerships (P3s)—in Canada with increasing
opportunities for APD in the United States, and modest global economic growth, offset by a moderate slowdown in the Canadian housing market. |
|
| 1 EBITDA, adjusted EBITDA, and adjusted diluted EPS are defined in the Definition of Non-IFRS Measures
in the Critical Accounting Estimates, Developments, and Measures section (the “Definitions section”) of this report. |
|
|
|
|
|
| Management’s Discussion and Analysis
December 31, 2016 |
|
M-3 |
|
Stantec Inc. |
RISKS
| • |
|
Various risk factors could cause our actual results to differ materially from those projected in the Outlook section and forward-looking statements of this report. The material known risks are described in the
Risk Factors section of this report. We believe there will be increased activity from the improving US economy and recent government infrastructure spending announcements in both Canada and the United States. Economic pressures and
uncertainties, volatility in foreign exchange rates, volatility in energy and commodity prices, changes in private industry spending, and changes in public infrastructure funding may adversely impact our current outlook for 2017. In addition, our
current outlook for 2017 could be unfavorably impacted if we are unable to successfully manage our integration program—particularly for larger acquisitions such as the MWH acquisition—or respond to the complexity of managing and running a
global business. |
Core Business and Strategy
The following discussion includes forward-looking statements. For an outline of the material risks and assumptions associated with these statements, refer to
the Cautionary Note Regarding Forward-Looking Statements at the end of this report.
CORE BUSINESS
We collaborate across disciplines and industries to bring buildings, energy and resource, environmental, water, and infrastructure projects to life. Our
work—engineering, architecture, interior design, landscape architecture, surveying, environmental sciences, construction services, project management, and project economics, from initial project concept and planning through to design,
construction, commissioning, maintenance, decommissioning, and remediation—begins at the intersection of community, creativity, and client relationships.
Our local strength, knowledge, and relationships, coupled with our world-class expertise, have allowed us to go anywhere to meet our clients’ needs in
more creative and personalized ways. With a long-term commitment to the people and places we serve, Stantec has the unique ability to connect to projects on a personal level and advance the quality of life in communities across the globe.
BUSINESS OBJECTIVE
Our business objective is to be a top 10 global
design firm. Based on our annual gross revenue, we are currently within the top 5 design firms in North America and top 15 design firms globally. We continue to work diligently to be the top-tier service
provider in the sectors and geographic regions we serve. While revenue and size are one way of measuring our position as top tier, our position in the industry is also measured qualitatively for information that tells us about our position in a
sector, our local presence, and our global expertise.
We believe that our continued growth will increase shareholder value and give our employees the
opportunity to bring their talent and expertise to top clients that have complex projects spanning multiple disciplines around the world. We plan to achieve a compound average annual growth rate of 15% through a combination of organic and
acquisition growth.
|
|
|
|
|
| Management’s Discussion and Analysis
December 31, 2016 |
|
M-4 |
|
Stantec Inc. |
STRATEGY
To establish
a clear plan for achieving our business objective—to be a top 10 global design firm—we employ a three-year strategic planning process: three execution years where the third year is also a comprehensive strategic review year. During that
year, we develop our long-range (five-year) strategy, performing a more in-depth review of the market environment and industry and challenging the direction of past
strategic plans. In the interim execution years, we focus on implementing and executing that long-range strategy. In 2015, we completed a comprehensive strategic review, determining that the key elements of our strategy will not materially change
over the next three years. This remains true following the 2016 acquisition of MWH, the largest acquisition in our Company’s history; however, we have evolved our 2017 strategic plan to leverage this achievement.
On May 6, 2016, we acquired MWH, a Broomfield, Colorado-based global engineering, consulting, and construction management firm providing program
management and management consulting, construction management, and engineering and technical services, particularly in the water, renewable energy, and sustainability sectors. Worldwide, MWH had 187 offices operating in 26 countries with
approximately 6,800 employees. This acquisition expanded our presence in water resources infrastructure while earning us a greater presence in key targeted geographic regions, including the United States, the United Kingdom,
Australia, New Zealand, South and Central America, Europe, and the Middle East.
A key component of implementing our strategic plan is the full
integration of acquired companies. Therefore, in 2017, one of our focuses will be successfully integrating MWH’s people, systems, and best practices into legacy Stantec, thereby creating a successful combined company poised for growth. Our
business objectives for integrating MWH include achieving costs synergies, creating a combined North American organization structure that supports future growth, executing a strategy that positions global operations for investments in markets with
strong growth potential, and incorporating best-in-class systems, tools, and processes from each organization.
Historically, our acquisition strategy has focused on acquisitions in North America to develop a mature presence across our business portfolio. In our
comprehensive planning year, we identified the constraints of this North American-focused acquisition strategy, namely, the availability of suitable firms. As part of our 2016 Strategic Plan, we expanded our acquisition strategy by including
firms with a global presence. That resulted in the MWH acquisition, which greatly expanded our global presence. For 2017, we plan to augment our disciplined North American acquisition strategy, integrate our new operations, and explore opportunities
to further expand our global footprint.
Purpose, Promise, and Values
Our Company’s purpose, promise, and values form the foundation of our strategy and have not changed from 2015. Our purpose is to create communities, and
our promise is to design with community in mind. Our values follow:
| • |
|
We are driven to achieve |
Our values provide the principles that govern our employees and how we behave and
make decisions. For each action-oriented value, we identify annual initiatives for talent management, learning and growth, client relationships, business processes, and operational and financial performance. (Our value statements, the results of our
2016 key initiatives, and our 2017 initiatives are further described in the Key Performance Drivers and Capabilities section of this report.)
|
|
|
|
|
| Management’s Discussion and Analysis
December 31, 2016 |
|
M-5 |
|
Stantec Inc. |
Strategic Elements
The elements of our strategy have not materially changed; however, we have enhanced some elements given our Company’s significant growth in 2016.
Corporate strategic pillars
| • |
|
Design. We focus on professional consulting while maintaining our newly acquired construction management at-risk services. |
| • |
|
Top tier. We position ourselves among the top-tier service providers in the sectors and geographic regions we serve. |
| • |
|
Diversification. We continue to diversify our projects, clients, and geographies, thereby mitigating risk. |
| • |
|
Community presence. We use the strength of our local position to bring world-class expertise to the communities where we live and work. |
| • |
|
Strengthening our reach. We continue to solidify our North American presence while building on our new global platform, particularly in the United Kingdom, Australia, and New Zealand. |
| • |
|
Business conduct. We embrace safety and ethical business practices as the foundation for everything we do. |
Business strategic pillars
| • |
|
Single brand and platform. Our guiding principle is to use a common brand and common systems, as well as to follow common operational policies, practices, and programs. We customize this approach to
accommodate the unique needs of our various business operating units. |
| • |
|
Local and global client focus. We drive a client-focused culture through cross-selling efforts and account management strategies. |
| • |
|
Leadership model. We organize and manage our business through a collaborative, consensus-based approach. Our leadership model evolves to meet the needs of our business and geographic regions we serve.
|
| • |
|
Technical excellence. We focus on quality to provide value-added services through integrated quality management systems. |
| • |
|
Creative solutions. We focus on creativity to provide value-added services. |
| • |
|
People. We attract talent, develop our people, and provide a diverse and inclusive work environment, ensuring we have the right people in the right roles. |
Reportable Segments
In the first quarter of 2016, our Company had
one reportable segment, Consulting Services, an aggregate of our previous operating segments. These operating segments were based on regional geographic areas. Our chief operating decision maker (chief executive officer) assesses our Company’s
performance based on financial information available from our operating segments.
As a result of the MWH acquisition and effective the second quarter of
2016, our reportable segments (in accordance with IFRS) are based on our two primary service offerings—Consulting Services and Construction Services—and our regional geographic areas. The Company now has four operating and reportable
segments:
| • |
|
Consulting Services – Canada |
| • |
|
Consulting Services – United States |
| • |
|
Consulting Services – Global |
|
|
|
|
|
| Management’s Discussion and Analysis
December 31, 2016 |
|
M-6 |
|
Stantec Inc. |
In 2016, we earned 27% of our gross revenue in Consulting Services – Canada, 48% in Consulting Services
– United States, 10% in Consulting Services – Global, and 15% in Construction Services.
Consulting Services
In Consulting Services, we provide knowledge-based solutions through value-added professional consulting services in engineering, architecture, interior
design, landscape architecture, surveying, environmental sciences, project management, and project economics in the area of infrastructure and facilities, principally under
fee-for-service agreements with clients. Our business operating unit leaders provide strategic direction, mentoring, and technical support to operations across our
geographic regions.
Construction Services
In
Construction Services, we provide construction management and project delivery at-risk services, primarily on water-related projects to key long-term clients in the United States and United Kingdom. We offer start-to-finish construction capabilities to municipal, utility, federal, and industrial clients, including commissioning and start-up
services. Separate from project delivery, we also provide construction management and professional supervision services. Construction Services revenue is derived primarily from cost-reimbursable, guaranteed-maximum price contracts and fixed-price
contracts. Compared to our other reportable segments, Construction Services uses more subcontractors and subconsultants and has lower gross margins.
The
main contract types in this segment fall generally into four functional areas:
| • |
|
Construction management at-risk |
| • |
|
Design-build and progressive design-build |
| • |
|
Construction management in support of design completed by Consulting Services |
| • |
|
Hard-bid construction with self-performance |
We separate the
construction business from the consulting businesses in our operational structure. This is key to leveraging our construction capabilities when they are advantageous to the client. This separation allows both streams of expertise to operate
effectively and allows synergies to develop that complement but do not distract from the strategy of each business. In addition, the two businesses can be bundled when beneficial for the client.
We expect that the expertise available in our newly acquired Construction Services business will augment and improve our Consulting Services business.
Consulting Services can then better prepare for and execute design-build projects with construction partners outside of Stantec in water markets and other sectors that we participate in.
Business Model
Our business model, a key element of our strategy,
is based on providing services across diverse geographic regions, business operating unit specialization, and all phases of the infrastructure and facilities project life cycle—planning, design, construction, commissioning, maintenance,
decommissioning, and remediation.
Because of our diverse model, we can generally adapt to changes in market conditions by offsetting a decreased demand
for services in one business operating unit or geographic location with an increased demand in another. We believe this strategy helps us mitigate risk while we continue to increase our revenue and earnings. Also, we work on tens of thousands of
projects for thousands of clients in hundreds of locations. This ensures we do not rely on a few large projects for our revenue.
The following
information outlines the three main components of our business model: geographic diversification, business operating units, and life-cycle solutions.
|
|
|
|
|
| Management’s Discussion and Analysis
December 31, 2016 |
|
M-7 |
|
Stantec Inc. |
Geographic Diversification
The first element of our business model is geographic diversification. Traditionally, we operated in three regional operating units—Canada, the United
States, and International. Before acquiring MWH, we had international offices in the Middle East, the United Kingdom, and the Caribbean. The MWH acquisition has increased our geographic diversification as follows:
| • |
|
Expanded our geographic footprint. MWH is strongly positioned and experienced in global markets through its platform in the United Kingdom, Australia, New Zealand, South and Central America, Europe, and the
Middle East. The MWH acquisition provided us with immediate geographic breadth, creating a platform for expansion and diversification. We believe that the combination of MWH’s and Stantec’s complementary capabilities, market presence, and
cultures creates opportunities to service more clients and offer a broader range of services worldwide. |
| • |
|
Created additional growth opportunities. We believe that the engineering and construction sector will continue to consolidate and that both scale and global capabilities will be important competitive
differentiators, particularly on large and complex projects. MWH has been in business for approximately 200 years, so it has a wealth of experience operating in global markets. Augmented by our strong statement of financial position, history of
operational effectiveness, and experience in successfully completing and integrating acquisitions, we expect to be well positioned to grow both organically and by acquisition. MWH’s platform in the United Kingdom and Asia Pacific regions gives
us the opportunity to expand our current North American acquisition strategy into new global markets, which we believe widens the platform for our acquisition program. |
Geographic Opportunities
Since the MWH
acquisition, our Consulting Services business has continued to operate as three regional operating units—Canada, the United States, and Global (formerly International). Our Construction Services business is a new reportable segment.
Over the next two years, we will continue our growth in North America through both organic and acquisition growth; we expect to augment this growth with
acquisitions and organic growth in the United Kingdom, Australia, and New Zealand. During this time, we will gradually increase our geographic reach in other markets that are suited for and receptive to our services.
Canada. At December 31, 2016, we had approximately 7,500 employees in Canada. We benefit from a mature position within each region and view
our strategic opportunities as follows:
| • |
|
Pursuing business expansion opportunities within our Water and Transportation sectors |
| • |
|
Continuing to strengthen our infrastructure presence in the Greater Toronto Area, other parts of Ontario, and the Atlantic, Alberta, and British Columbia regions |
| • |
|
Continuing to capitalize on opportunities in LNG facilities; pipelines; ports and marine terminals; tidal water markets; and health, education, commercial, and civic markets |
| • |
|
Capitalizing on alternative energy projects, specifically in the expanding wind, hydro, co-generation, and carbon-capture markets |
| • |
|
Securing additional projects serving First Nations communities because of our strong Aboriginal partnerships and connection to local communities, as well as the federal government’s plans for infrastructure
spending |
| • |
|
Continuing to capitalize on opportunities in P3 markets |
|
|
|
|
|
| Management’s Discussion and Analysis
December 31, 2016 |
|
M-8 |
|
Stantec Inc. |
United States. At December 31, 2016, we had approximately 9,700 employees in the United States
(including 750 in Construction Services), where the economy is expanding. Due to acquisitions completed over the past number of years we are achieving critical mass and diversity in many sectors and geographies.
We will remain focused on strengthening our service capabilities and reaching maturity in the markets we serve. We view our strategic opportunities as
follows:
| • |
|
Continuing to leverage our recognized expertise in community development and infrastructure to capitalize on opportunities related to the strong US housing market |
| • |
|
Continuing to pursue infrastructure opportunities in the US West region and Sunbelt states |
| • |
|
Expanding our Federal Services group and our disaster management and resilience efforts |
| • |
|
Growing our Environmental Services business across the United States |
| • |
|
Continuing to expand our US Buildings business, particularly in the US West, and diversifying from healthcare |
| • |
|
Continuing to pursue acquisition opportunities in our Energy & Resources business operating unit |
Global. At December 31, 2016, we had approximately 4,800 employees in our Global operations (including 1,000 in Construction Services, all located
in the United Kingdom). The MWH acquisition provided immediate geographic breadth, creating a platform for expanding and diversifying. Our focus in 2017 will be to develop a leadership and organizational structure that brings together Stantec’s
legacy International operations with MWH’s global operations and supports further growth in key markets and regions. We view our strategic opportunities as follows:
| • |
|
Continuing to solidify our existing Stantec presence in the United Kingdom and the United Arab Emirates |
| • |
|
Leveraging MWH’s top-tier brand in the United Kingdom so we can continue working on projects through the United Kingdom’s Asset Management Program |
| • |
|
Enhancing and growing our strategic technical consulting business in the United Kingdom and expanding MWH’s UK service offerings beyond water through a focused acquisition strategy |
| • |
|
Cross-selling services in continental Europe |
| • |
|
Expanding service offerings in the United Kingdom, Australia, and New Zealand by capitalizing on Stantec synergies |
Business Operating Unit Specialization
Business operating unit
specialization is the second element of our business model. In Consulting Services during 2016, we had four specialized business operating units: Buildings, Energy & Resources, Environmental Services, and Infrastructure. In 2016, we earned
22% of our Consulting Services gross revenue in Buildings, 12% in Energy & Resources, 17% in Environmental Services, and 49% in Infrastructure.
Within these four Consulting Services business operating units, we focus on the top 14 sectors that our clients operate in. By better understanding our
clients’ goals, the market influences, and our business drivers, we can offer multidisciplinary solutions to meet their needs.
Buildings
We generate most revenue in our Buildings business operating unit by providing pre-design, design, and
construction administration services in planning, architecture, buildings engineering, and interior design services for vertical infrastructure. We earn most of our revenue from private sector and institutional clients; the remaining revenue is
from public sector clients. We provide services in the following sectors:
|
|
|
|
|
| Management’s Discussion and Analysis
December 31, 2016 |
|
M-9 |
|
Stantec Inc. |
Energy & Resources
We generate most of our revenue in our Energy & Resources business operating unit from industrial engineering, project management, and construction
management services primarily for private sector clients. Services are provided in the following sectors:
Environmental Services
We generate most of our revenue in our Environmental Services business operating unit by providing front-end
environmental services for private sector clients and remediation activities for private and public sector clients. Environmental Services provides services across all Company sectors, though more than 45% of its revenue is generated from our
Energy & Resources business operating unit.
Infrastructure
We generate most of our revenue in our Infrastructure business operating unit by providing front-end design and
engineering services, with a small portion from project and construction management services. We provide services in the following sectors:
| • |
|
Transportation (Bridges, Roadways, and Transit & Rail) |
Our Community Development sector mainly serves private sector clients. Our Transportation and Water
sectors mainly serve public sector clients, but a growth area is delivering these services using alternative project delivery methods.
MWH’s
cross-selling capabilities to various end markets
MWH adds global capabilities in water-related design services to our key hydropower, oil and
gas, mining, and industrial clients. MWH’s global client portfolio is expected to generate opportunities for our Energy & Resources business operating unit to cross-sell its engineering services. We believe that further opportunities
exist to cross-sell services provided by our Buildings and Environmental Services business operating units to MWH’s clients.
Evolution of our
business operating unit specialization
We continually evolve our organizational structure so that it adapts to changes in the marketplace, meets
our business needs, and positions us for long-term success. The MWH acquisition added a world-class design presence to our Water sector and a truly global platform from which we can enhance our Consulting Services offerings. For these reasons, we
are realigning our Consulting Services organizational structure. Bringing our
|
|
|
|
|
| Management’s Discussion and Analysis
December 31, 2016 |
|
M-10 |
|
Stantec Inc. |
total number of business operating units to five, at the beginning of 2017, we added Water as a separate business operating unit by segregating the legacy Stantec Water sector from our
Infrastructure business operating unit and combining it with MWH’s capabilities in water.
Considering this realignment, our restated 2016 gross
revenue earned in Consulting Services is 22% in Buildings, 12% in Energy & Resources, 17% in Environmental Services, 28% in Infrastructure, and 21% in Water. (Refer to the Results section of this report for additional details about the
restated 2016 figures.)
Life-Cycle Solutions
We provide
professional services in all phases of the project life cycle: planning, design, construction, commissioning, maintenance, decommissioning, and remediation. This inclusive approach enables us to deliver services during periods of strong new capital
project activity (design and construction) and of redevelopment and operational spending activity (maintenance, integrity management, and remediation). We believe this strategy enables us to maintain long-term client relationships throughout the
life of a project or an infrastructure asset.
Beginning with the planning and design stages, we provide conceptual and detailed design services, conduct
feasibility studies, and prepare plans and specifications. During the construction phase, we generally act as the owner’s representative, providing project management, construction management, surveying, and resident engineering services. In
our Consulting Services business, we focus principally on fee-for-service work and rarely act as the contractor or take on construction risk. In our Construction
Services business, we provide construction management at-risk services. During the maintenance phase that follows project completion, we provide ongoing professional services for integrity management, as well
as for maintenance and rehabilitation projects such as facilities and infrastructure management, facilities operations, and performance engineering. In the final decommissioning phase, we provide solutions, recommendations, and remediation
strategies for taking facilities out of active service. The MWH acquisition provided a broader enhanced service offering throughout the complete project life cycle and expanded our service offerings in the construction phase.
Key Performance Drivers and Capabilities
Our key performance drivers are defined by external forces and by internal initiatives that are articulated through our value statements: we put people first,
we are better together, we do what is right, and we are driven to achieve.
The following discussion includes forward-looking statements. For an outline
of the material risks and assumptions associated with these statements, refer to the Cautionary Note Regarding Forward-Looking Statements at the end of this report.
KEY EXTERNAL DRIVERS
Consulting Services
Our Consulting Services business is driven by external industry factors that affect the demand for our services.
Buildings
Our Buildings business operating unit
consists of seven market sector groups. This diversity means that Buildings is driven by a combination of factors such as economic outlook, technology advancements, aging infrastructure, resiliency trends, regulatory changes, project complexity,
population growth, urbanization, and demographic changes. Drivers specific to our key market sectors include the following: passenger and air freight traffic (Airports & Aviation), US healthcare reform (Healthcare), the incorporation of
full automation in warehousing and the supply chain (Industrial), Internet commerce (Commercial), municipal government funding (Civic), and a focus on science, technology, engineering, and mathematics education (Education and Science &
Technology).
|
|
|
|
|
| Management’s Discussion and Analysis
December 31, 2016 |
|
M-11 |
|
Stantec Inc. |
Energy & Resources
Our Energy & Resources business operating unit is driven primarily by supply and demand for commodities both globally and locally. Our Oil &
Gas and Mining sectors are impacted by economics, commodity prices, cost reduction and efficiencies, technological advancement, and political and regulatory drivers (including carbon emission reductions). Other considerations include alternative
fuels, aging infrastructure, and energy efficiency trends. These sectors are highly cyclical and can experience rapid and dramatic fluctuations in price and supply and demand.
Our Power sector is more of an infrastructure business, but economic activity also affects power demand and therefore impacts this market. Regulations,
infrastructure age, the location of supply and demand for transmission and distribution, and renewable subsidization also influence activity in our Power sector.
Significant drivers for the Waterpower & Dams sector include climate change and the associated demand for hydroelectric power, both as a renewable
generation source and for its ability to integrate other renewables (wind and solar). Aging infrastructure results in the need to rehabilitate, modernize, and upgrade existing dam and hydroelectric projects.
Environmental Services
Our Environmental Services
business operating unit performs services in some capacity across all Company sectors, though most significantly in our Energy & Resources business operating unit and our Transportation and Commercial sectors. Therefore, the drivers
for Environmental Services overlap with those affecting other business operating units. Following are the most significant drivers affecting Environmental Services: economic and political conditions, construction growth, environmental regulations,
emphasis on environmentally sustainable behaviors, demand for emergency site remediation planning and cleanups, Aboriginal involvement in resource-based projects, and increasing spending on infrastructure improvements in Canada and the United
States.
Infrastructure
Our Infrastructure
business operating unit is driven by a combination of economic, demographic, urbanization and housing, technology, public funding, and regulatory factors. Additional drivers include employment rates, interest rates, water conservation efforts,
public and active transport usage, technological advancements, aging infrastructure, resiliency trends, and regulatory changes. Drivers specific to key market sectors include the housing-affordability crisis (Community Development), connected and
autonomous vehicles, and Smart Cities and design-build (Transportation). Overall, this business operating unit relies heavily on local and regional clients and benefits from Stantec’s strong community presence.
Water
We will report Water as a distinct
Consulting Services business operating unit effective January 1, 2017. The Water business operating unit performs services in the following sectors:
| • |
|
Client Enterprise Systems |
| • |
|
Urban Stormwater & Wet Weather Flow |
| • |
|
Water Resources Planning & Management |
|
|
|
|
|
| Management’s Discussion and Analysis
December 31, 2016 |
|
M-12 |
|
Stantec Inc. |
Our Water business operating unit is driven primarily by regulatory and public funding factors as well as aging
infrastructure, resiliency strategies, demographic shifts, water scarcity, climate change, globalization and geopolitics, technology, and economic cycles.
Construction Services
Key performance drivers for Construction
Services are similar to the drivers for our legacy Stantec Water sector; these Water sector drivers were carried over to our newly defined Water business operating unit. Specifically, trends that are expected to impact water infrastructure
requirements and drive growth in the sector include demographic shifts, water scarcity, climate change, globalization and geopolitics, technology, and economic cycles.
KEY INTERNAL DRIVERS
We believe our actionable value statements
best reflect what unites Stantec and compels our people to come to work and to do their best every day. Our performance depends on our ability to achieve excellence by putting people first, developing strong, long-lasting relationships with each
other and our clients, doing what is right, and being driven to achieve at every level. Our value system provides a framework for the strategic initiatives that we implement to drive our performance and help obtain our overall business objective of
being a top 10 global design firm.
We Put People First
We
continue to evolve by attracting talent and developing our people. This entails assessing and guiding current employees, engaging and developing leadership, and ensuring we create an experience and a work environment that retains talent. The total
number of employees at our Company was approximately 15,200 at the end of 2015 and approximately 22,000 at the end of 2016.
Employees
Our people remain at the core of what we do. We strive to attract and retain the best employees in the field and to further develop their talents.
We are committed to supporting, fostering, and investing in each employee’s success through a culture of opportunity, equity, development, diversity, and
innovation. Specific career streams provide employees with career development direction and growth opportunities based on their primary area of interest. We also have a formalized succession planning process and offer a number of leadership
programs. In 2016, we initiated the pilot phase of a Talent Management System so we can collect and integrate all talent data across Stantec. In 2017, we will start a phased-in implementation process.
Our Diversity and Inclusion committees foster a workplace that supports the unique differences of our clients and employees. In 2016, we continued to deliver
initiatives supporting diversity and inclusion, including rolling out unconscious-bias training to leadership, and in 2017, it will be available Company-wide. We will also expand our mandate for employee resource groups to bring together communities
of employees with shared backgrounds and values. We will also call on the expertise of the Canadian Centre for Diversity and Inclusion to support our ongoing development of a comprehensive diversity and inclusion plan.
We measure the success of our various initiatives through retention rates, employee surveys, 360-degree feedback, and
exit interviews. The results help us develop future programs and initiatives.
|
|
|
|
|
| Management’s Discussion and Analysis
December 31, 2016 |
|
M-13 |
|
Stantec Inc. |
Senior leadership
Our Executive Vice President Team (EVPT) is made up of our senior leaders: the chief executive officer (CEO), chief financial officer (CFO), chief operating
officer (COO), chief business officer (CBO), and executive vice presidents (EVPs). The EVPT oversees the Company’s overall performance, including developing and monitoring our business plan, monitoring financial performance and risks, approving
policies and procedures, and overseeing acquisitions and divestitures. EVPs are specifically responsible for the performance of our reportable segments and business operating units.
In 2016, we worked toward building fully developed processes to assess, grow, reward, and promote our leaders to achieve success today and prepare for future
talent and business needs. In 2017, we will compare core leadership needs and gaps to our business plan and acquisition needs. We will assess current succession planning processes, tools, and outcomes for employees, including those joining Stantec
through acquisition. We will identify mission-critical roles and run succession-planning pilots in certain areas of our Company.
Compensation
Our ability to align the activities of our senior leadership and other key employees with our short- and long-term financial and strategic goals
is a key driver of our success. In addition to their fixed salaries, we provide short- and long-term compensation on a discretionary basis for their individual and corporate contributions to meeting our objectives.
For our senior leadership, senior managers, and other key employees, we provide a short-term incentive program (STIP) that is paid annually in cash. The total
amount available in the STIP for any given year is calculated as a percentage of our annual pretax, pre-STIP net income, which encourages our senior managers to achieve profitable business results. To
determine the STIP awards for the year, we evaluate each eligible employee’s personal performance and achievement of Company-wide and business unit objectives. In our view, this compensation program creates a sense of shared responsibility for
achieving outstanding business results and meeting our clients’ needs.
Our compensation program for our senior leadership team provides a long-term
incentive plan (LTIP) using both share options and performance share units (PSUs), in addition to base salary and STIP participation. The mix of fixed salary, STIP compensation, and LTIP compensation varies, depending on the seniority of the
executive within the organization. Our CEO, CFO, COO, CBO, and EVP targeted total compensation is more heavily weighted to long-term incentives. This motivates our most senior executives to make decisions that are in the long-term interest of the
shareholders.
Certain key employees who are not members of the senior leadership team are also granted options through an LTIP approved by shareholders
in 2014, further aligning their interests with our shareholders’ interests, as well as encouraging them to remain with us over the long term.
The
CEO’s STIP is evaluated by the board annually and is based on achieving corporate and individual performance metrics, and he is awarded annual long-term incentive grants of share options and PSUs. His total compensation is 25% fixed base
salary, 25% short-term cash incentive opportunity, and 50% equity-based long-term incentives. The long-term incentives granted are one-third share options and two-thirds
PSUs.
We require our CEO, CFO, COO, CBO, and EVPs to own a minimum number of shares in the Company. These executives must own a multiple of their base
salary in shares. We believe that our long-term programs and the minimum ownership requirement provide the appropriate incentives for our EVPT to achieve growth in our share price, thereby aligning their compensation with the interests of
shareholders.
|
|
|
|
|
| Management’s Discussion and Analysis
December 31, 2016 |
|
M-14 |
|
Stantec Inc. |
We also have an executive compensation claw-back policy which shows our commitment to the principle that
compensation paid to our executives—based on financial information that has since been restated—should be returned.
We Are Better Together
Strong, long-lasting relationships are at the center of everything we do, and each employee brings individual strengths to our Company, whether that
is technical expertise, particular sector experience, or exceptional client relationships. When we combine those strengths, we believe we reach our full potential to build lasting relationships with our clients. Building and developing a
consistently positive client-centered experience is essential for the continued growth and success of our organization.
Organizational evolution
In 2016, we continued the process of realigning our internal structure to better serve our clients. The acquisition of MWH added a world-class
design presence in the water sector, including a top-tier presence in the United States and United Kingdom, and a world-class presence in waterpower and dams. To best leverage this expertise and offer a higher
degree of leadership and increased visibility for clients and employees, effective January 1, 2017, we are combining legacy Stantec’s Water sector (from the Infrastructure business operating unit) and MWH’s Water businesses into a
separate business operating unit—Water.
Account management and client development
We continue to pursue a client strategy that focuses on growing global accounts while augmenting the strength of our local client base and differentiating
ourselves from our peers in the marketplace. The purpose of our account management program is to position Stantec for sustainable organic growth. In 2017, we will focus on strengthening our ability to establish key accounts, align capable account
managers, develop new business with those accounts, and measure our success.
In 2016, we developed a client-centric, cross-functional Client Services
team to improve the growth of our key accounts and the services we provide to our clients. As well, account managers were asked to develop account development plans for each national and global top client identified for 2017. We plan to extend this
program to local and regional accounts in 2017. We also plan to leverage MWH’s sales and client development capabilities.
Alternative project
delivery
Although our business has historically followed a
fee-for-service model, we do have processes for evaluating, pursuing, and executing projects using alternative project delivery (APD) methods, such as various forms of
design-build and P3s, and bundling engineering, procurement, and construction management (EPCM) services. In 2016, we proposed that—over a period of a few years and for select projects, clients, and sectors—we will continue exploring our
service delivery approach and risk appetite to better meet our clients’ needs. We will continue this approach in 2017.
MWH’s Construction
Services will continue to focus on its existing business, but we will consider how we can incorporate their construction knowledge and identify ways they might support our overall strategy for EPCM projects.
Creativity and Innovation Program
We continue to
support and promote creative and innovative thinking. In 2016, we formalized a program that recognizes and celebrates, internally and externally, the efforts of our employees to develop and apply ideas that benefit us, our clients, and our
communities. The program includes an annual fund to support research, development, and innovative ideas initiated by our employees, as well as financial rewards for staff who publish
|
|
|
|
|
| Management’s Discussion and Analysis
December 31, 2016 |
|
M-15 |
|
Stantec Inc. |
articles or speak at conferences. The program also includes a venture fund intended to support innovative ventures into markets we are not yet in or services we do not currently offer. In 2017,
we will work to integrate MWH best practices into our existing program with the goal of having a fully integrated approach for 2017.
Practice
technology framework and cybersecurity
Our Company embraces digital technologies that assist us in delivering professional services and help us
improve services to our clients. We also recognize the importance of cybersecurity and therefore have a comprehensive IT security program designed to predict, prevent, detect, and respond to cybersecurity threats. (Cybersecurity is further described
in the Risk section of this report.) In 2016, we completed an assessment of practice technology needs across the business. We are now focused on developing strategic priorities and critical business needs to improve practice technology support,
governance, and resources.
Balanced leadership model
Because our Company has evolved, we continue to strengthen and customize our balanced leadership model to enable the unique needs of our business. The balanced
leadership model—consisting of both geographic and business leadership—offers our clients a local presence and diverse services and facilitates the cross-selling of services to new clients and in new geographies. Our structure will
continue evolving to meet our clients’ needs.
Brand positioning
In 2016, we began resurveying our clients and industry decision makers to measure the progress we made in our brand positioning since 2013. We also surveyed
MWH clients to better understand MWH’s position in its markets and the key attributes that matter most to its clients. The research findings will help us make recommendations for effectively integrating MWH’s brand into Stantec’s
brand and identify ways to develop Stantec’s existing strategic brand platform. The intent is to leverage the strengths of both brands in the global marketplace in 2017 and beyond. Following these recommendations, we will develop comprehensive
internal and external brand campaigns to communicate our combined brand to employees and the marketplace.
We Do What Is Right
Doing what is right means paying attention to the impact that every decision has on the way we do business and holding ourselves to a high standard of ethics
and integrity in everything we do. It also means committing to professional excellence in a manner that fosters an innovative, forward-looking culture of safety and sustainability.
Ethics and integrity
Our reputation remains a
significant asset; therefore, our focus continues to be on aligning our actions and decisions with our ethics and integrity policies. One way we ensure this is by conducting annual mandatory ethics, integrity, and anti-corruption compliance training
for all employees. We articulate our high standard of business practices through our Project Management Framework, Code of Ethics, and policies and practices. We also engage an outside agency to monitor, review, and report any issues identified
through our Integrity Hotline. In 2017, we will deploy an updated ethics and integrity compliance training program to focus on issues routinely faced by design and construction firms and build on MWH’s strong global compliance program.
Health, safety, security, and environment
We are
committed to ensuring the health and safety of all employees and stakeholders involved in our professional work. We continue to promote a culture of safety across our organization by implementing numerous formal and informal initiatives. In 2016, we
reorganized our former Health, Safety, and Environment group. The Health, Safety, Security, and Environment (HSSE) group is now focused on three main areas: occupational health and safety, security, and the environment.
|
|
|
|
|
| Management’s Discussion and Analysis
December 31, 2016 |
|
M-16 |
|
Stantec Inc. |
We will continue developing a mature health and safety culture that is focused on leading indicators and that
decreases our total recordable injury rate. In 2017, HSSE will focus on refining our environmental management system and tools and establishing security processes which address both staff mobility and facilities assessment to enhance leadership
engagement and reduce employee injuries. To achieve this, we will enhance our employees’ understanding of how Stantec employees are “Safer Together” by highlighting the employees’ personal connection and commitment and senior
leadership’s accountability. In addition, we will focus on combining the best of the systems and processes acquired through the MWH transaction.
Quality management
We use various methods to
ensure high-quality project execution, including the following:
| • |
|
Project Management Framework. We are committed to efficient and high-quality project execution within a framework that incorporates ethics, safety, sustainability, innovation, and profitability. In legacy Stantec
operations, our Project Management (PM) Framework helps us improve project planning, remain committed to quality assurance, and fulfill independent review requirements, and these principles are consistently applied to all projects. For MWH
operations, we use a proprietary handbook of PM practices that will be integrated with the legacy Stantec PM Framework in 2017 and adopted by all our Consulting Services operations. MWH Construction Services uses a Project Management Administration
Plan to tailor its project management practices to each project and integrate quality, risk, health and safety, information technology (IT), and change management procedures. |
We always strive to enhance our project execution and forecasting ability and to facilitate more efficient resource management. Currently, we
use a diverse range of tools, including our Enterprise Management System, to execute projects effectively, and we will continue to invest in these tools in 2017.
| • |
|
Internal practice audits. We conduct internal practice audits to identify opportunities for practice improvement across regions, disciplines, and sectors. |
| • |
|
Integrated Management System. In legacy Stantec operations, our Integrated Management System (IMS) clarifies expectations for project delivery and client service excellence and conveys the steps employees must
take to achieve more consistent and successful project outcomes. In 2016, we redefined our internal practice audit program and expanded the number of internal practice audits and client surveys conducted annually. We are also in the process of
consolidating our audit, client survey, incident notification, and improvement plans on a Company-wide Governance Risk Control application. |
| • |
|
Programs and Business Solutions. Effective project management depends not only on tools but also on people. Project Management is a career stream at Stantec. In 2016, we merged our legacy Stantec Project Delivery
Office with MWH’s Business Solutions group to create the Programs and Business Solutions (PBS) group. PBS houses a group of senior project managers and project management specialists who can be deployed when needed to any project throughout
Stantec. PBS addresses the project and commercial needs of major projects, including APD and P3 projects. It also provides a systematic way to manage and mitigate the risk profiles on major projects. |
| • |
|
Regulatory compliance. We operate in diverse regulatory environments and are committed to complying with regulatory requirements. For instance, we comply with employment practices and financial reporting
standards and controls. We also demonstrate our commitment to excellence through our documented policies and practices. |
|
|
|
|
|
| Management’s Discussion and Analysis
December 31, 2016 |
|
M-17 |
|
Stantec Inc. |
Sustainability
We believe that every service that Stantec provides—from external services to our clients that ensure we continue to design in a sustainable way to our
own internal impact on the environment while we deliver our services—contributes to a sustainable environment.
We are committed to finding ways to
further enhance our services. In addition, we continue to invest in LEED-accredited and Envision professionals through training and mentorship to ensure we are well positioned as leaders in the field of sustainable and integrated infrastructure
solutions. Envision is a planning framework and evaluation system developed by the Institute for Sustainable Infrastructure and the Harvard Graduate School of Design. It provides a holistic framework for planning, designing, evaluating, and rating
the community, environmental, and economic benefits of infrastructure projects and systems.
In our internal operations, we are committed to reducing our
negative impact on the environment by progressing toward least-impact approaches to energy consumption, paper consumption, and waste disposal. We track and report our progress in our annual Sustainability Report and in the Carbon Disclosure Project
(CDP). In 2017, we will remain focused on meeting established targets to reduce our environmental impact.
Community engagement
Our purpose is to create communities. At Stantec, we are active members in our communities, making lasting connections with the people that we live with and
work with. To help support their growth and development, we regularly partner with a number of charitable and community organizations to work on social projects, environmental projects, and charitable initiatives.
In 2016, our Company contributed approximately $3 million to community engagement activities in arts, education, environment, and health and wellness. In
addition to these funds, we continued to give back to our communities by volunteering, fundraising, and being a partner. For example, as part of our fourth annual Company-wide Stantec in the Community Day, more than 8,000 employees volunteered
approximately 16,000 hours in communities around the world.
In every region, we make decisions with local input. We recognize that local employees
best understand how to match our resources and capabilities to our communities’ priorities and how to provide support to the organizations that make a difference. Corporately, we provide the framework that guides decision making,
ensuring our community investments align with our organizational objectives and resonate with our employees and business leaders in the communities we serve.
We target donating up to 1% of our annual pretax profits through direct cash contributions or services in kind to charitable and not-for-profit endeavors in the arts and in education, environment, and health and wellness.
We Are Driven to Achieve
Achievement at every level begins and
ends with a firm commitment to being the best that we can be. To do this, we will continue to balance growth, execution, and risk appetite while we focus on long-term sustainability.
We will continue to pursue top-tier positioning in the markets we serve and maintain the balance of our diversified
business model over the long term. We will do so through our organic growth strategies and continue to strategically execute our small- and mid-sized North American acquisitions and augment that strategy to
include small to midsized acquisitions in the United Kingdom, Australia, and New Zealand.
|
|
|
|
|
| Management’s Discussion and Analysis
December 31, 2016 |
|
M-18 |
|
Stantec Inc. |
Growth opportunities
Our aim is to achieve consistent growth and profitability. We will do this by sustaining a culture of excellence and remaining committed to our clients, our
people, our communities, and our shareholders. We commit to maintaining our diversification strategy, ensuring an appropriate balance within our sector mix.
Achieving a high level of market presence in communities we serve is a key driver to our success. Our approach to regional growth is to effectively service
our existing regional and local clients, develop new client relationships, and grow our reputation and business where opportunities exist. Our target is to be among the top-tier service providers in each
region and sector. With this level of market presence, we are less likely to be affected by downturns in regional economies.
Organic growth has been and
continues to be an element of our strategy. To achieve growth, we leverage client relationships by cross-selling, following a sector-based approach, and delivering our account management programs. We refine internal strategies that promote a culture
of revenue generation in all areas of our Company.
Acquisitions are key to our strategy, and increasing the depth of our capabilities and broadening our
geographic coverage enables us to better service our clients and achieve growth. Historically, we have focused our acquisition strategy on growth in design-related services in North America. As part of our 2016 strategic plan development, we
recognized the need to start modifying our strategy to maintain our historical growth rates. MWH presented an opportunity to acquire a North American firm that aligns with our Company’s culture and strategy and that expands our services and
growth opportunities into a larger global marketplace.
For 2017, we intend to continue executing a disciplined North American acquisition approach:
targeting firms that enhance our service capabilities, deepening our geographic positioning, aligning our culture and strategy, and acting as a catalyst for enhanced organic growth. As we focus on integrating our global operations, we plan to
explore opportunities to further expand our new global footprint.
Financing
Our continued ability to finance our growth plan supports our success. Adequate financing gives us the flexibility to acquire firms that are appropriate for
our vision and complement our business model.
Since the public trading of our shares began on the Toronto Stock Exchange (TSX) in 1994, we have increased
our gross revenue at a compound annual rate of 19.3%. To fund acquisition growth, we require cash generated from both internal and external sources. Historically, we have completed acquisitions almost entirely using cash generated from operations,
credit facilities, and vendor notes. However, under certain favorable market conditions, we do consider issuing common shares to facilitate acquisition growth or to reduce borrowings under our credit facilities. This was the case for the MWH
acquisition: we financed the acquisition through the net proceeds of both a public offering of common shares and funds drawn from our credit facilities (further described in the Capital Management and Shareholders’ Equity sections of this
report).
|
|
|
|
|
| Management’s Discussion and Analysis
December 31, 2016 |
|
M-19 |
|
Stantec Inc. |
Results
OVERALL ANNUAL PERFORMANCE
In 2016, we continued to grow by consistently executing our strategy. Our results and performance reflect the five
strategic acquisitions completed in the year, a common share offering, and the renegotiation of our long-term debt in the second quarter of 2016. In particular, the MWH acquisition, the largest in our history, significantly added to our
operating results.
The following highlights other major financial achievements and strategic activities in 2016 that contributed to our financial
performance and overall financial condition:
| • |
|
Continuous profitability. We ended 2016 with 49.5% growth in gross revenue. EBITDA increased 9.8% and adjusted EBITDA increased 15.5% in 2016 compared to 2015. Our net income was $130.5 million in 2016
compared to $156.4 million in 2015. Diluted earnings per share (EPS) was $1.22 in 2016 compared to $1.65 in 2015; adjusted diluted EPS was $1.69 in 2016 compared to $1.84 in 2015. See pages M-21 to M-23 in this report for further EBITDA and net income highlights. (EBITDA, adjusted EBITDA, and adjusted diluted EPS are defined in the Definition of Non-IFRS Measures in
the Critical Accounting Estimates, Developments, and Measures section the “Definitions section” of this report.) |
| • |
|
Growth through acquisition. By successfully executing our acquisition and integration strategy, acquisitions completed in 2016 and 2015 contributed $1.5 billion to our growth in gross revenue year over year,
mainly from our MWH acquisition. In particular, MWH expanded many areas of our Consulting Services business, positioned us as a global leader in the Water sector, and created a new service offering—Construction Services. |
| • |
|
Effective and diversified business model. By consistently executing our business strategy and by capitalizing on opportunities to increase project activity in our Infrastructure business operating unit, we were
able to partly offset the organic revenue retraction in our Buildings, Energy & Resources, and Environmental Services business operating units. Overall, in 2016, organic gross revenue retracted 5.6%. |
| • |
|
Growth in backlog. Our contract backlog grew 77.3%—from $2.2 billion at December 31, 2015, to $3.9 billion at December 31, 2016. (Backlog, a
non-IFRS measure, is further discussed in the Definitions section of this report.) |
| • |
|
Successful public offering. We financed the MWH acquisition through the net proceeds of (a) a public
offering of 19,964,000 shares for $30.25 each and (b) funds drawn from New Credit Facilities described |
|
|
|
|
|
| Management’s Discussion and Analysis
December 31, 2016 |
|
M-20 |
|
Stantec Inc. |
| |
below. The $603.9 million public offering of shares was completed through an agreement with CIBC World Markets Inc. and RBC Dominion Securities Inc. on behalf of a syndicate of underwriters.
After share issuance costs and underwriters’ fees, our net proceeds from the public offering were $578.1 million. |
| • |
|
New credit facilities. Concurrent with the acquisition of MWH, we entered into an agreement for new $1.25 billion senior secured credit facilities (New Credit Facilities) consisting of a senior
secured revolving credit facility of a maximum of $800 million and a $450 million senior secured term loan in three tranches. The proceeds from the New Credit Facilities were used to repay all outstanding indebtedness under our
existing $350 million revolving credit facility and redeem all senior secured notes. We also used the proceeds from the New Credit Facilities to repay the outstanding indebtedness of MWH under its existing revolving credit facility with Bank of
America Merrill Lynch. (See the Capital Management section of this report for additional information.) |
SELECTED ANNUAL INFORMATION
The following table highlights trending of certain annual information:
|
|
|
|
|
|
|
|
|
|
|
|
|
|
|
|
|
|
|
|
|
| (In millions of Canadian dollars,
except per share amounts and %) |
|
2016 |
|
|
2016 vs.
2015
(%) |
|
|
2015 |
|
|
2015 vs.
2014
(%) |
|
|
2014 |
|
|
|
|
|
|
|
| Gross revenue |
|
|
4,300.1 |
|
|
|
49.5% |
|
|
|
2,877.2 |
|
|
|
13.7% |
|
|
|
2,529.9 |
|
| Net revenue |
|
|
3,098.4 |
|
|
|
30.5% |
|
|
|
2,373.7 |
|
|
|
14.4% |
|
|
|
2,075.3 |
|
| EBITDA (note 1) |
|
|
336.3 |
|
|
|
9.8% |
|
|
|
306.3 |
|
|
|
3.9% |
|
|
|
294.7 |
|
| Adjusted EBITDA (note 1) |
|
|
352.3 |
|
|
|
15.5% |
|
|
|
305.1 |
|
|
|
3.2% |
|
|
|
295.6 |
|
| Net income |
|
|
130.5 |
|
|
|
(16.6%) |
|
|
|
156.4 |
|
|
|
(4.9%) |
|
|
|
164.5 |
|
| EPS – basic |
|
|
1.22 |
|
|
|
(26.5%) |
|
|
|
1.66 |
|
|
|
(5.7%) |
|
|
|
1.76 |
|
| EPS – diluted |
|
|
1.22 |
|
|
|
(26.1%) |
|
|
|
1.65 |
|
|
|
(5.2%) |
|
|
|
1.74 |
|
| Adjusted EPS – basic (note 1) |
|
|
1.69 |
|
|
|
(8.6%) |
|
|
|
1.85 |
|
|
|
(1.1%) |
|
|
|
1.87 |
|
| Adjusted EPS – diluted (note 1) |
|
|
1.69 |
|
|
|
(8.2%) |
|
|
|
1.84 |
|
|
|
(0.5%) |
|
|
|
1.85 |
|
| Cash dividends declared per common share |
|
|
0.45 |
|
|
|
7.1% |
|
|
|
0.42 |
|
|
|
13.5% |
|
|
|
0.37 |
|
|
|
|
|
|
|
| Total assets |
|
|
4,284.7 |
|
|
|
83.0% |
|
|
|
2,341.9 |
|
|
|
19.5% |
|
|
|
1,959.6 |
|
| Total long-term debt |
|
|
1,020.5 |
|
|
|
179.3% |
|
|
|
365.4 |
|
|
|
18.1% |
|
|
|
309.3 |
|
|
|
|
|
|
|
| Cash flows |
|
|
|
|
|
|
|
|
|
|
|
|
|
|
|
|
|
|
|
|
| From operating activities |
|
|
285.7 |
|
|
|
|
|
|
|
205.5 |
|
|
|
|
|
|
|
207.2 |
|
| Used in investing activities |
|
|
(1,136.6) |
|
|
|
|
|
|
|
(252.4) |
|
|
|
|
|
|
|
(174.3) |
|
| From (Used) in financing activities |
|
|
995.1 |
|
|
|
|
|
|
|
(44.3) |
|
|
|
|
|
|
|
(24.7) |
|
|
|
|
|
|
|
| Outstanding common shares as at |
|
|
|
|
|
|
|
|
|
|
|
|
|
|
|
|
|
|
|
|
| December 31 |
|
|
114,081,229 |
|
|
|
|
|
|
|
94,435,898 |
|
|
|
|
|
|
|
93,836,258 |
|
| February 22, 2017 |
|
|
114,128,589 |
|
|
|
|
|
|
|
|
|
|
|
|
|
|
|
|
|
| Outstanding share options as at |
|
|
|
|
|
|
|
|
|
|
|
|
|
|
|
|
|
|
|
|
| December 31 |
|
|
3,655,020 |
|
|
|
|
|
|
|
2,980,601 |
|
|
|
|
|
|
|
2,676,568 |
|
| February 22, 2017 |
|
|
3,600,660 |
|
|
|
|
|
|
|
|
|
|
|
|
|
|
|
|
|
note 1: EBITDA, adjusted EBITDA, and adjusted basic and diluted earnings per share (EPS) are
non-IFRS measures and are further discussed in the Definitions section of this report.
|
|
|
|
|
| Management’s Discussion and Analysis
December 31, 2016 |
|
M-21 |
|
Stantec Inc. |
2016 vs. 2015
We
ended 2016 with 49.5% growth in gross revenue. Gross revenue increased 53.4% due to acquisitions completed in 2016 and 2015 and 1.7% from the weakening of the Canadian dollar. These increases were partly offset by organic retraction of 5.6%. We
experienced moderate organic gross revenue growth in our Infrastructure business operating unit while Buildings, Energy & Resources, and Environmental Services business operating units retracted.
In 2016, EBITDA increased 9.8% over 2015. It was impacted by
| • |
|
A decrease in our gross margin as a percentage of net revenue—from 54.5% in 2015 to 54.1% in 2016—resulting primarily from decreased margins in our Canadian operations due to margin pressures in our
Energy & Resources business and lower margins in Construction Services. Construction Services is a high volume, lower-margin business that incurs more subcontractors and direct expenditures than Consulting Services. |
| • |
|
An increase in our administrative and marketing expenses—from 41.6% in 2015 to 43.1% in 2016—due in part to the following: |
| |
• |
|
A $13.8 million increase in acquisition-related costs, which in 2016 included legal, accounting, and financial advisory fees resulting primarily from due diligence services incurred for the MWH acquisition
|
| |
• |
|
A $7.6 million increase in retention and merit payments to retain key employees during the integration periods that follow our acquisitions |
| |
• |
|
A $4.0 million increase in severance costs due to the decline in the oil and gas and mining sectors and employee rationalization following our acquisitions |
| |
• |
|
An $11.2 million increase in professional fees |
| |
• |
|
An increase in acquisition- and integration-related administration labor expenses |
Our net income was
$130.5 million in 2016 compared to $156.4 million in 2015, and diluted EPS was $1.22 in 2016 compared to $1.65 in 2015. Net income was impacted by the EBITDA items noted above, and a $37.8 million increase in the amortization of
intangible assets mainly related to backlog, client relationships, finite-lived trademarks, and software acquired from acquisitions completed in 2015 and 2016, and software additions over the last two years. We added $354.2 million to
intangible assets from acquisitions in 2016. As well, net interest expense increased year over year, mainly resulting from a $655.1 million increase in our outstanding long-term debt at December 31, 2016, compared to December 31,
2015, primarily due to the MWH acquisition. In addition, our annual effective income tax rate increased to 27.8% from the 26.1% rate in 2015 as further discussed on M-40.
2015 vs. 2014
We ended 2015 with 13.7% growth in gross revenue.
Gross revenue increased 12.1% due to acquisitions completed in 2015 and 2014 and 7.5% from the weakening Canadian dollar. These increases were partly offset by organic revenue retraction of 5.9%. We experienced strong organic gross revenue growth in
our Buildings and Infrastructure business operating units that was offset by a retraction in our Energy & Resources business operating unit.
In
2015, EBITDA increased 3.9% over 2014. It was impacted by
| • |
|
A decrease in our gross margin as a percentage of net revenue—from 54.9% in 2014 to 54.5% in 2015—due primarily to the mix of projects, lower margins from projects acquired in our Dessau acquisition, P3
pursuits, and margin pressures in the energy and resource market |
|
|
|
|
|
| Management’s Discussion and Analysis
December 31, 2016 |
|
M-22 |
|
Stantec Inc. |
| • |
|
An increase in our administrative and marketing expenses—from 40.8% in 2014 to 41.6% in 2015— due in part to the following: |
| |
• |
|
A $4.3 million increase in severance costs resulting from our employee rationalization due to the decline in the oil and gas and mining sectors |
| |
• |
|
An increase in acquisition and integration expenses, including French translation costs associated with our Quebec operations |
| |
• |
|
An overall reduction in utilization due to the impact of the decline in the above-noted sectors as well as the impact of the continued integration of acquisitions |
| |
• |
|
A $3.5 million increase in our share-based compensation expense |
| • |
|
The recognition of a $4.1 million non-operating loss related to the sale of our India subsidiary in Q4 15 |
Our net income was $156.4 million in 2015 compared to $164.5 million in 2014, and diluted EPS was $1.65 in 2015 compared to $1.74 in 2014. Net
income was impacted by a $13.6 million increase in the amortization of intangible assets related to backlog and client relationships acquired from acquisitions completed in 2014 and 2015, as well as software additions during the year. Also, net
interest expense increased year over year, mainly resulting from an increase in interest expense on our revolving credit facility and on our notes payable from acquisitions. These increases were partly offset by a slight reduction in our annual
effective income tax rate to 26.1% from the 26.3% rate in 2014.
RESULTS COMPARED TO 2016 TARGETS
In the Management’s Discussion and Analysis in our 2015 Annual Report (in the Outlook section on pages M-54 and M-55), we established various target ranges of expected performance measures for fiscal year 2016. As a result of the MWH acquisition on May 6, 2016, our 2016 budgets were no longer appropriate and our
capital structure had changed. Because these budgets and capital structure were key assumptions when we established our targets for 2016, we withdrew our 2016 performance measure targets in Q2 16.
In our 2015 Management’s Discussion and Analysis, we also set expectations for our organic gross revenue growth in 2016 compared to 2015, and we updated
these expectations quarterly. The acquisition of MWH did not impact these targets. In Q3 16, we anticipated that organic revenue would retract in 2016 compared to 2015, and we ended the year with a retraction of 5.6%. We also established annual
organic gross revenue targets for each regional operating unit and business operating unit. The following table shows our Q3 16 expectations compared to our actual results.
|
|
|
|
|
|
|
| Organic Growth
|
|
Q3 16
Target |
|
Results |
|
|
|
|
|
|
| Reportable Segments |
|
|
|
|
|
|
| Canada |
|
Retraction |
|
Retraction |
|
✓ |
| United States |
|
Moderate |
|
Stable |
|
x |
| Global |
|
Retraction |
|
Retraction |
|
✓ |
|
|
|
|
| Business Operating Unit |
|
|
|
|
|
|
| Buildings |
|
Stable |
|
Retraction |
|
x |
| Energy & Resources |
|
Retraction |
|
Retraction |
|
✓ |
| Environmental Services |
|
Retraction |
|
Retraction |
|
✓ |
| Infrastructure |
|
Moderate |
|
Moderate |
|
✓ |
|
|
|
| ✓ |
|
Met or performed better than target. |
| x |
|
Did not meet target. |
|
|
|
|
|
| Management’s Discussion and Analysis
December 31, 2016 |
|
M-23 |
|
Stantec Inc. |
We met all these regional and business operating unit expectations, except we ended the year with stable organic
revenue in our US operations and retraction in our Buildings business operating unit. In the United States, strong growth in our Transportation sector and US Buildings business operating unit was offset by retraction in our Oil & Gas sector
and Environmental Services business operating unit because of the ongoing challenges in those markets due to lower commodity prices. Our Buildings business operating unit retracted in our Canadian and Global operations because of the decline in the
oil and gas sector that impacted both private and public spending. (Further details regarding our organic gross revenue are provided in the Results section, Gross and Net Revenue subsection, of this report.)
ACQUISITIONS
Consideration for acquisitions completed was
$1.2 billion in 2016 and $207.1 million in 2015. We completed the following acquisitions in 2016:
| • |
|
On March 11, 2016, we acquired all the shares and business of Bury Holdings, Inc. (Bury), increasing our staff count by approximately 300. Adding Bury expands our Infrastructure business by enhancing our
engineering, landscape architecture, planning, construction administration, surveying, and sustainable solutions expertise in the US South and into the Southwest. |
| • |
|
On May 6, 2016, we acquired MWH Global, Inc. (MWH), adding approximately 6,800 staff to our Company and increasing our global footprint. Operating in 26 countries, MWH provides program management and management
consulting, construction management, and engineering and technical services, particularly in the water, renewable energy, and sustainability sectors. The MWH acquisition created a new service offering for us—Construction Services.
|
| • |
|
On May 26, 2016, we acquired VOA Associates, Inc. (VOA), increasing our staff by approximately 280. VOA provides expertise in architecture, interior design, landscaping, and planning. This addition enhances our
Buildings business operating unit in the US Midwest, Mid-Atlantic, Gulf, and Tri-State regions. |
| • |
|
On September 16, 2016, we acquired Edwards and Zuck, P.C. and Edwards and Zuck Consulting Engineers, D.P.C. (collectively called Edwards & Zuck), increasing our staff by approximately 120. Adding
Edwards & Zuck enhances our buildings engineering and architecture services in the US Tri-State and Gulf regions. |
| • |
|
On December 2, 2016, we acquired Architecture | Tkalcic Bengert (Arch | TB), increasing our staff by approximately 60. Based in Edmonton, Alberta, Arch | TB adds to our expertise in our Buildings business operating
unit in Canada. |
|
|
|
|
|
| Management’s Discussion and Analysis
December 31, 2016 |
|
M-24 |
|
Stantec Inc. |
DISCUSSION OF OPERATIONS
The following table summarizes our key operating results on a percentage of net revenue basis and the percentage increase in the dollar amount for each key
operating result:
|
|
|
|
|
|
|
| |
|
Year Ended Dec 31 |
| |
|
Percentage of
Net Revenue |
|
Percentage
Increase
(Decrease) * |
| |
|
2016 |
|
2015 |
|
2016 vs. 2015 |
|
|
|
|
| Gross revenue |
|
138.8% |
|
121.2% |
|
49.5% |
| Net revenue |
|
100.0% |
|
100.0% |
|
30.5% |
| Direct payroll costs |
|
45.9% |
|
45.5% |
|
31.5% |
| Gross margin |
|
54.1% |
|
54.5% |
|
29.7% |
| Administrative and marketing expenses |
|
43.1% |
|
41.6% |
|
35.0% |
| Depreciation of property and equipment |
|
1.7% |
|
1.9% |
|
11.5% |
| Amortization of intangible assets |
|
2.4% |
|
1.6% |
|
99.7% |
| Net interest expense |
|
0.9% |
|
0.5% |
|
162.4% |
| Other net finance expense |
|
0.3% |
|
0.2% |
|
100.0% |
| Share of income from joint ventures and associates |
|
(0.1%) |
|
(0.1%) |
|
25.0% |
| Foreign exchange loss (gain) |
|
0.0% |
|
0.0% |
|
n/m |
| Other expense (income) |
|
0.0% |
|
(0.1%) |
|
(109.4%) |
| Income before income taxes |
|
5.8% |
|
8.9% |
|
(14.6%) |
| Income taxes |
|
1.6% |
|
2.3% |
|
(8.9%) |
| Net income |
|
4.2% |
|
6.6% |
|
(16.6%) |
n/m = not meaningful
* Percentage increase (decrease) calculated based on the dollar change from the comparable period.
The percentage increase in gross and net revenue in 2016 compared to 2015 was due to acquisition growth and the impact of foreign exchange rates on revenue
earned in foreign subsidiaries (further explained in the Gross and Net Revenue section that follows). We were negatively impacted by a decrease in gross margin as a percentage of net revenue and an increase in administrative and marketing expenses,
amortization of intangible assets, and net interest expense compared to 2015 (further explained in the respective sections of this report). Our net income for 2016 decreased 16.6%.
Gross and Net Revenue
The following discussion includes
forward-looking statements. For an outline of the material risks and assumptions associated with these statements, refer to the Cautionary Note Regarding Forward-Looking Statements at the end of this report.
While providing professional services, we incur certain direct costs for subconsultants, equipment, and other expenditures that are recoverable directly from
our clients. Revenue associated with these direct costs is included in gross revenue. Because these direct costs and associated revenue can vary significantly from contract to contract, changes in gross revenue may not be indicative of our revenue
trends. Accordingly, we also report net revenue (which is gross revenue less subconsultant, subcontractor, and other direct expenses) and analyze results in relation to net revenue rather than gross revenue. The difference between gross revenue and
net revenue is larger for construction-related projects than for consulting-related projects since Construction Services incurs proportionately higher costs for subcontractors, direct materials, and equipment.
|
|
|
|
|
| Management’s Discussion and Analysis
December 31, 2016 |
|
M-25 |
|
Stantec Inc. |
Revenue earned by acquired companies in the first 12 months following acquisition is reported as revenue from
acquisitions and, thereafter, as organic revenue.
Consulting Services generates a portion of gross revenue in foreign currencies, primarily in US
dollars. Construction Services primarily generates gross revenue in British pound sterling and US dollars. In 2015, Consulting Services generated a portion of gross revenue in the United States. The value of the Canadian dollar averaged US$0.76 in
2016 compared to US$0.78 in 2015, a 2.6% decrease. The weakening Canadian dollar had a positive effect on revenue reported in 2016 compared to 2015.
Our
contract backlog was $3.9 billion at December 31, 2016—$2.8 billion in Consulting Services and $1.1 billion in Construction Services—compared to $2.2 billion at December 31, 2015. The MWH acquisition added
$1.7 billion to our backlog at December 31, 2016. We define “backlog” as the total value of secured work that has not yet been completed where we have an executed contract or a letter of intent that management is reasonably
assured will be finalized in a formal contract. (Backlog, a non-IFRS measure, is further described in the Definitions section of this report.) Only approximately the first 12 to 18 months of the total value of
secured work for a project is included in contract backlog.
The following tables summarize the impact of acquisition growth, organic retraction, and
foreign exchange on our gross and net revenue for 2016 compared to 2015:
|
|
|
| Gross Revenue
(In millions of Canadian
dollars) |
|
2016 vs. 2015 |
|
|
| Increase due to |
|
|
| Acquisition growth |
|
1,536.1 |
| Organic retraction |
|
(162.0) |
| Impact of foreign exchange rates on revenue earned by foreign subsidiaries |
|
48.8 |
| |
|
| Total net increase in gross revenue |
|
1,422.9 |
|
|
| Net Revenue
(In millions of Canadian dollars) |
|
2016 vs. 2015 |
|
|
| Increase due to |
|
|
| Acquisition growth |
|
827.5 |
| Organic retraction |
|
(141.4) |
| Impact of foreign exchange rates on revenue earned by foreign subsidiaries |
|
38.6 |
| |
|
| Total net increase in net revenue |
|
724.7 |
The acquisitions that led to acquisition growth are listed in the following Gross Revenue by Reportable Segments section. Our
Infrastructure business operating unit had moderate organic revenue growth in 2016 because of growth in our Transportation sector. Organic gross revenue retracted in our Buildings, Energy & Resources, and Environmental Services business
operating units.
|
|
|
|
|
| Management’s Discussion and Analysis
December 31, 2016 |
|
M-26 |
|
Stantec Inc. |
Gross Revenue by Reportable Segments
The following charts and tables summarize gross revenue and gross revenue growth in our two service offerings and four reportable segments—Consulting
Services for Canada, United States, and Global; and Construction Services:
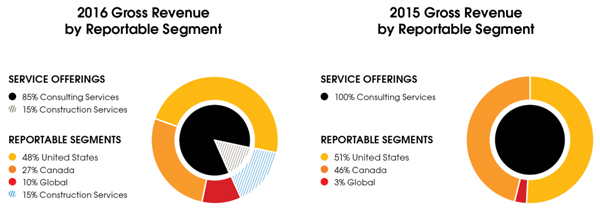
Gross Revenue by Reportable Segment
|
|
|
|
|
|
|
|
|
|
|
|
|
|
|
|
|
|
|
|
|
|
|
| (In millions of Canadian dollars) |
|
Year Ended
Dec 31,
2016 |
|
|
Year Ended
Dec 31,
2015 |
|
|
Total
Change |
|
|
Change Due to
Acquisitions |
|
|
Change Due
to Organic
Growth
(Retraction) |
|
Change Due
to Foreign
Exchange |
|
| Consulting Services |
|
|
|
|
|
|
|
|
|
|
|
|
|
|
|
|
|
|
|
|
|
|
| Canada |
|
|
1,168.9 |
|
|
|
1,317.0 |
|
|
|
(148.1) |
|
|
|
11.2 |
|
|
(159.3) |
|
|
n/a |
|
| United States |
|
|
2,070.4 |
|
|
|
1,461.0 |
|
|
|
609.4 |
|
|
|
535.4 |
|
|
26.9 |
|
|
47.1 |
|
| Global |
|
|
415.6 |
|
|
|
99.2 |
|
|
|
316.4 |
|
|
|
344.3 |
|
|
(29.6) |
|
|
1.7 |
|
|
|
|
|
|
|
|
| Total Consulting Services |
|
|
3,654.9 |
|
|
|
2,877.2 |
|
|
|
777.7 |
|
|
|
890.9 |
|
|
(162.0) |
|
|
48.8 |
|
| Construction Services |
|
|
645.2 |
|
|
|
- |
|
|
|
645.2 |
|
|
|
645.2 |
|
|
- |
|
|
- |
|
|
|
|
|
|
|
|
| Total |
|
|
4,300.1 |
|
|
|
2,877.2 |
|
|
|
1,422.9 |
|
|
|
1,536.1 |
|
|
(162.0) |
|
|
48.8 |
|
n/a = not applicable
Total gross revenue was positively impacted by acquisitions completed in 2015 and 2016, and by foreign exchange due to the weakening of the Canadian dollar.
This was partly offset by organic revenue retraction, primarily in Canada.
Following is a list of acquisitions completed in 2015 and 2016 that impacted
specific reportable segments during 2016:
Consulting Services – Canada
| |
• |
|
Canadian engineering operations of Dessau Inc., 9073-4195 Quebec Inc., and Azimut Services (Central) Inc. (collectively, Dessau) (January 2015) |
| |
• |
|
MWH Global, Inc. (MWH) (May 2016) |
| |
• |
|
Architecture | Tkalcic Bengert (Arch | TB) (December 2016) |
|
|
|
|
|
| Management’s Discussion and Analysis
December 31, 2016 |
|
M-27 |
|
Stantec Inc. |
Consulting Services – United States
| |
• |
|
Sparling, Inc. (Sparling) (February 2015) |
| |
• |
|
VI Engineering, LLC (VI Engineering) (July 2015) |
| |
• |
|
VA Consulting, Inc. (VA Consulting) (August 2015) |
| |
• |
|
Fay, Spofford & Thorndike, Inc. (FST) (October 2015) |
| |
• |
|
The Infrastructure Americas Division of Kellogg Brown & Root Services, Inc. (KBR) (December 2015) |
| |
• |
|
Bury Holdings, Inc. (Bury) (March 2016) |
| |
• |
|
MWH Global, Inc. (MWH) (May 2016) |
| |
• |
|
VOA Associates, Inc. (VOA) (May 2016) |
| |
• |
|
Edwards and Zuck, P.C. and Edwards and Zuck Consulting Engineers, D.P.C. (collectively, Edwards & Zuck) (September 2016) |
Consulting Services – Global
| |
• |
|
MWH Global, Inc. (MWH) (May 2016) |
Construction Services
| |
• |
|
MWH Global, Inc. (MWH) (May 2016) |
Consulting Services – Canada. Gross revenue from our Consulting
Services – Canada operations decreased 11.2% in 2016 compared to 2015. We experienced a retraction in our Energy & Resources, Environmental Services, and Buildings business operating units. This retraction was partly offset by strong
growth in our Infrastructure business operating unit.
In the private sector, our Energy & Resources business operating unit experienced
retraction in all three sectors: Oil & Gas, Mining, and Power. Oil and gas prices were lower in 2016 compared to 2015. In our Oil & Gas business, organic gross revenue retraction was at a slower rate in the second half of the year
compared to the first. This occurred mainly because there was lower revenue in the second half of 2015. We continue to win a stream of generally smaller projects as a result of our strong client relationships and industry expertise. Mining retracted
because a few significant projects wound down in the last half of 2015 and were not able to be replaced by projects of equal scale in 2016. This sector continued to be challenged by weak metal and commodity prices. Power retracted as a result of the
slow oil and gas market conditions in Alberta. In our Environmental Services business operating unit, gross revenue retraction was less in Q4 16 than in previous quarters. Clients in the oil and gas sector continued to make up almost 25% of Canadian
Environmental Services revenue; therefore, the main reason for the retraction, felt mostly in western Canada, was the downturn in the oil and gas sector. However, there was small growth in our Ontario and Quebec Community Development sectors because
these economies benefited from low interest rates, housing demand with low inventory of properties, and employment growth.
In contrast, the public
sector’s support of investment in infrastructure remains robust, demonstrated by the federal and key provincial budgets released this year, which we believe will continue to benefit our Transportation and Water sectors in our Infrastructure
business operating unit. We experienced strong organic growth in Transportation and Water sectors because of ongoing significant public investments to meet demands for new infrastructure in roadways, bridges, and transit systems and water and
wastewater treatment facilities. Buildings retracted in 2016 compared to 2015 because some major projects were completed, and we invested our time in several significant P3 pursuits to replace that backlog. Although we have been and continue to be
successful in pursuing design-build P3 projects, a number of them are in the bid phase. During this phase for this type of project, we perform work at reduced fees and margins, which are then increased if our team is successful in securing the
project. We continued to benefit from projects under the P3 model in a number of sectors because of our experience and expertise in this delivery model.
|
|
|
|
|
| Management’s Discussion and Analysis
December 31, 2016 |
|
M-28 |
|
Stantec Inc. |
Consulting Services – United States. Gross revenue in our Consulting Services – United States
operations increased 41.7% in 2016 compared to 2015. This increase resulted primarily from acquisition growth. Growth also resulted from foreign exchange because the US dollar strengthened compared to the Canadian dollar. Organic revenue increased
1.8% in 2016 compared to 2015, largely driven by Transportation due to Stantec’s strategic market position in program management, bridge inspection, light-rail transit, and bridge projects resulting in significant projects in Hawaii, New York,
and Florida. Organic growth in our Buildings business in 2016 mainly resulted from an expansion in our Commercial and Education sectors. These organic increases were offset by retraction in our Oil & Gas sector and Environmental Services
business operating unit with the ongoing challenges in those markets due to lower commodity prices.
In the private sector, the housing market continued
to grow, specifically in Florida, Texas, and the western United States. We saw a persistent trend toward urbanization, which means that cities need to be revitalized. Our Buildings business operating unit was supported by our expanded
architectural presence because of recent acquisitions and increased work in the healthcare and biopharmaceutical sectors. We continued to capitalize on our expertise in environmental mitigation and to build on our remediation and recovery
expertise in our Environmental Services business. Environmental Protection Agency regulations provided opportunities with our Power clients, and transmission and distribution opportunities remained steady.
The public sector continued to be an area of growth for Stantec, though there remains some uncertainty in the political and regulatory environment, notably at
the federal level. Partly in response to fiscal constraints, design-build opportunities increased in the United States. Organic revenue growth occurred in our Transportation sector due to our strategic market position in North America. Our Water
sector benefited from regulatory requirements, including the consent decrees in the United States that mandate municipalities to upgrade their water and wastewater facilities, as well as the ongoing efforts of public agencies to improve the
efficiency of their operations. We continued to build our expertise in flood protection and resiliency.
The MWH acquisition expanded our US
Energy & Resources, Environmental Services, and Infrastructure operations; mainly in our Water sector. Water had solid performance, and we secured major water projects in the year.
Consulting Services – Global. Gross revenue from our Consulting Services – Global operations increased by $316.4 million in 2016
compared to 2015. This increase resulted mainly from the MWH acquisition and a slight strengthening of foreign currencies compared to the Canadian dollar. Organic revenue retracted in our Mining sector and our Buildings business operating unit. The
decline in Mining resulted from the general decline in the global commodities market. Revenue retraction in Buildings was due in part to not replacing completed projects with projects of a similar size, project delays due to government
budget constraints, and the divestiture of our India operations in Q4 15.
Revenue generated from the MWH acquisition since May 6, 2016, makes
up the majority of our Consulting Services – Global revenue. Our Water sector in the United Kingdom benefited from strong revenue growth and solid project execution in the second year of the UK Water Asset Management Program (AMP) cycle, and in
the Asia Pacific Water operation, revenues are meeting expectations. Acquisition revenue was partly impacted by a softening Asia Pacific Transportation sector, as well as project delays and lower volume in Latin American mining and energy projects.
In Australia, depressed commodity prices slowed the country’s mining and energy sectors, and infrastructure spending was down in the private and public sectors while federal and some state governments address fiscal deficits.
|
|
|
|
|
| Management’s Discussion and Analysis
December 31, 2016 |
|
M-29 |
|
Stantec Inc. |
Construction Services. Construction Services earned $645.2 million in gross revenue since the MWH
acquisition on May 6, 2016. Revenue was generated primarily in the United States and United Kingdom.
The United States generated $405.1 million
in gross revenue since May 6, 2016. Significant activity in 2016 related to strong wastewater treatment plant construction activity in the west on a number of major projects. Also, project activity increased in the US on a major new commercial
and facility management project.
The remaining $240.1 million in gross revenue for Construction Services was earned mainly in the United Kingdom.
Revenue in the United Kingdom was driven by construction activities for water utilities in the second year of the AMP cycle. Gross revenue earned in the United Kingdom was negatively impacted by a 10.8% decline in the British pound sterling from
May 6, 2016, to December 31, 2016, compared to the Canadian dollar.
Gross Revenue by Consulting Services – Business Operating Units
The following charts and tables summarize gross revenue and gross revenue growth in our four Consulting Services business operating units—Buildings,
Energy & Resources, Environmental Services, and Infrastructure:
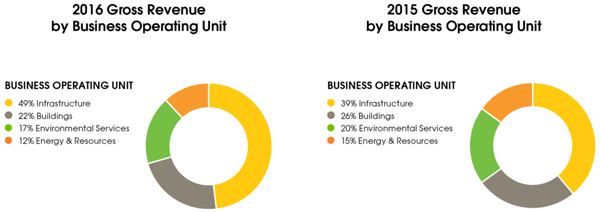
Gross Revenue by Consulting Services - Business Operating Unit
|
|
|
|
|
|
|
|
|
|
|
|
|
|
|
|
|
|
|
|
|
| (In millions of Canadian dollars, except %) |
|
2016 |
|
|
% of
Consulting
Services
Gross Revenue |
|
|
2015 |
|
|
% of
Consulting
Services
Gross Revenue |
|
|
% Change in
Gross Revenue
2016 vs. 2015 |
|
| Consulting Services |
|
|
|
|
|
|
|
|
|
|
|
|
|
|
|
|
|
|
|
|
| Buildings |
|
|
816.2 |
|
|
|
22.4% |
|
|
|
763.7 |
|
|
|
26.5% |
|
|
|
6.9% |
|
| Energy & Resources |
|
|
428.6 |
|
|
|
11.7% |
|
|
|
430.3 |
|
|
|
15.0% |
|
|
|
(0.4%) |
|
| Environmental Services |
|
|
636.5 |
|
|
|
17.4% |
|
|
|
566.4 |
|
|
|
19.7% |
|
|
|
12.4% |
|
| Infrastructure |
|
|
1,773.6 |
|
|
|
48.5% |
|
|
|
1,116.8 |
|
|
|
38.8% |
|
|
|
58.8% |
|
| |
|
|
|
|
|
| Total Consulting Services |
|
|
3,654.9 |
|
|
|
100.0% |
|
|
|
2,877.2 |
|
|
|
100.0% |
|
|
|
27.0% |
|
Note: Comparative figures have been reclassified due to a realignment of several business lines between our
Energy & Resources and Infrastructure business operating units.
|
|
|
|
|
| Management’s Discussion and Analysis
December 31, 2016 |
|
M-30 |
|
Stantec Inc. |
As indicated above, gross revenue growth was impacted by acquisitions, organic revenue retraction, and the effect
of foreign exchange rates on revenue earned by our foreign subsidiaries. The impact that these factors had on gross revenue earned by each Consulting Services business operating unit is summarized in the following table:
Gross Revenue by Consulting Services - Business Operating Unit
|
|
|
|
|
|
|
|
|
|
|
|
|
|
|
|
|
| |
|
2016 Compared to 2015 |
|
|
|
|
|
|
| (In millions of Canadian dollars) |
|
Total Change |
|
|
Change Due to
Acquisitions |
|
|
Change Due to
Organic Growth
(Retraction) |
|
|
Change Due to
Foreign Exchange |
|
| Consulting Services |
|
|
|
|
|
|
|
|
|
|
|
|
|
|
|
|
| Buildings |
|
|
52.5 |
|
|
|
59.6 |
|
|
|
(20.0) |
|
|
|
12.9 |
|
| Energy & Resources |
|
|
(1.7) |
|
|
|
128.7 |
|
|
|
(134.6) |
|
|
|
4.2 |
|
| Environmental Services |
|
|
70.1 |
|
|
|
110.2 |
|
|
|
(49.1) |
|
|
|
9.0 |
|
| Infrastructure |
|
|
656.8 |
|
|
|
592.4 |
|
|
|
41.7 |
|
|
|
22.7 |
|
|
|
|
|
|
| Total Consulting Services |
|
|
777.7 |
|
|
|
890.9 |
|
|
|
(162.0) |
|
|
|
48.8 |
|
|
| Note: Comparative figures have been reclassified due to a realignment of several business lines between our
Energy & Resources and Infrastructure business operating units. |
The following summarizes the acquisitions completed in 2015 and 2016 that impacted specific Consulting Services business
operating units during 2016:
|
|
|
|
|
|
|
| • Buildings
Dessau (Jan. 2015)
Sparling (Feb. 2015)
FST (Oct. 2015)
VOA (May 2016)
Edwards & Zuck (Sep. 2016)
Arch | TB (Dec. 2016) |
|
• Energy & Resources
Dessau (Jan. 2015)
VI Engineering (July 2015)
MWH (May 2016) |
|
• Environmental Services
Dessau (Jan. 2015)
FST (Oct. 2015)
MWH (May 2016) |
|
• Infrastructure
Dessau (Jan. 2015)
VA Consulting (Aug. 2015)
FST (Oct. 2015)
KBR (Dec. 2015)
Bury (Mar. 2016)
MWH (May 2016) |
Buildings. Gross revenue for our Buildings business operating unit increased 6.9% in 2016 compared to 2015. Gross
revenue increased as a result of acquisition growth and foreign exchange because the US dollar strengthened compared to the Canadian dollar. Organic revenue retraction was 2.6%. Our Canada and Global operations experienced retraction that was partly
offset by strong organic growth in our US operations. Retraction occurred mainly due to the number of design-build P3 projects that were in the bid phase (explained in the Consulting Services – Canada section above) and the decline in the oil
and gas sector, which impacted private and public spending in our Canadian and Middle East operations.
In Canada, we maintained strong activity in the
healthcare, commercial, and education markets, and we also experienced steady activity in the Civic and Industrial sectors. In the United States, gross revenue increased due to strategic acquisitions completed in 2015 and 2016. We saw increased
opportunities in the eastern United States, particularly in our Commercial sector. We benefit from the urbanization trend across North America as inner cities are revitalized. Our newly created Civic sector provides a range of services to respond to
these needs.
Of the projects secured in the year, one highlight is our Company being the prime consultant and design lead on the successful team for the
new Mackenzie Vaughan Hospital in Vaughan, Ontario. Our architecture, landscape, and transportation teams are collaborating on this large greenfield
state-of-the-art hospital that will include over
|
|
|
|
|
| Management’s Discussion and Analysis
December 31, 2016 |
|
M-31 |
|
Stantec Inc. |
350 patient beds with the capacity to expand to more than 500. It will be the first hospital in Canada to include fully integrated “smart” technology, which features systems and medical
devices that can transmit data to one another, maximizing clinical and operational efficiencies. In addition, during the second quarter, Mecklenburg County commissioners selected a partnership we assembled to redevelop Brooklyn Village, 16 acres (7
hectares) of land in downtown Charlotte, North Carolina. The project involves designing, building, and operating a walkable urban village of more than 2.3 million square feet (213,697 square metres) of new development that includes residential,
retail, hospitality, recreational, and public art spaces.
Energy & Resources. Gross revenue for our Energy &
Resources business operating unit decreased 0.4% in 2016 compared to 2015. Revenue was positively impacted by acquisition growth. Organic gross revenue retracted 31.3% in 2016 compared to 2015.
The sustained weakness in the oil and gas sector in Canada and the United States has been impacting our engineering services, although at a reduced rate
of retraction in the second half of 2016. We experienced organic revenue growth in our US Power and Mining sectors, offset by organic revenue retraction for these sectors in our Canadian operations. Throughout the significant and rapid decline in
the oil and gas industry, we aligned our staffing levels with workload, managed our margins, and maintained our strong client relationships. In 2014, our oil and gas engineering services represented approximately 15% of our Company’s overall
annual gross revenue; in 2015, it represented approximately 8%; and in 2016 it represented approximately 4%. This change and the change in the environmental services we provide to this industry (described below) reduce the impact of our exposure to
further potential declines in this industry.
The retraction in our Oil & Gas sector continued because of the ongoing substantially lower price
environment and volatility in oil and gas prices that caused curtailed capital spending and continued pressure to reduce rates in this sector. Delays in regulatory approvals for export pipelines have also contributed to the slowdown in both
midstream and upstream work. In our midstream business, new work in 2016 continued to be awarded for smaller projects but was slow due to the impact of uncertain market conditions. Despite these conditions, we were selected by a major midstream
service provider to complete detailed engineering of the scope for upgrades to an existing butane injection facility in Edmonton, Alberta. The project will increase flow for future capacity. In the upstream sector—a smaller portion of our
business—projects were deferred or cancelled as clients adapted to lower commodity prices and market supply and demand changes.
In our Power sector,
we continued securing projects as a result of infrastructure improvement, environmental compliance, and resiliency requirements in the transmission and distribution and the power replacement markets. In the United States, organic revenue was stable,
assisted by the renewable energy and transmission and distribution markets. Our Canadian Power operations were impacted by the slowdown in capital spending by oil and gas clients, resulting in deferred and cancelled proposed gas-generation projects. Nonetheless, we continued to secure projects. For example, we were awarded the civil and electrical engineering design services for the transmission infrastructure, electrical system
studies, and underground alternating-current and direct-current collector systems that will support the Southgate and Windsor solar farms in Ontario. Each ground-mount solar farm will have a generating capacity of 50 megawatts.
Our Mining sector’s organic revenue retraction was primarily attributed to the continuing slowdown in the mining market but was also caused by the one-time recognition of additional fees in the first half of 2015, which resulted from attaining certain performance metrics on a major project. Our US Mining operations had organic growth offset by organic
retraction in our Canadian and Global operations, primarily due to continued challenging macroeconomic industry conditions and clients managing their debt levels. These debt levels resulted in a cautious approach to capital spending. The retraction
in 2016 was challenging for the mining industry; however, small to midsized capital projects increased.
|
|
|
|
|
| Management’s Discussion and Analysis
December 31, 2016 |
|
M-32 |
|
Stantec Inc. |
The MWH acquisition added to our Mining and Waterpower & Dams sectors. Mining experienced project delays
and decreased project activity in Latin America. Activity remains strong in the Waterpower & Dams sector, especially in our US East operations.
Environmental Services. Gross revenue for our Environmental Services business operating unit increased 12.4% in 2016 compared to 2015. Revenue was
positively impacted by acquisition growth and by foreign exchange. Organic gross revenue retracted 8.7% in 2016 compared to 2015.
Retraction in organic
gross revenue resulted from low commodity prices and reduced capital spending, primarily in the oil and gas midstream sector. This led to project delays and cancellations and put downward pressure on project fees. In the United States, organic gross
revenue retracted due to the winding down of projects and was partly offset by growth in the Power and Transportation sectors. We experienced increased activity in airport and rail projects as well as highway and road projects, particularly in
our US east operations. In 2014, our Oil & Gas environmental services represented approximately 11% of our Company’s overall gross revenue; in 2015, it represented approximately 7%; and in 2016, it represented approximately 5%. This
change reduces the impact of our exposure to further potential declines in this industry.
In slower market conditions, clients in the industry review
their supply chain for opportunities to gain efficiencies; therefore, our margins are impacted. The retraction slowed in the last half of 2016 as evidenced by some recent wins, including some new clients and an increased number of smaller project
opportunities. Although oil and gas and mining continue to be challenged markets across North America, we maintained our backlog because of our strong emphasis on operations and maintenance programs.
Growth opportunities for environmental services work in the power sector exist within the renewables market in both Canada and the United States.
Opportunities in Canada also exist through the federal government’s plans for infrastructure spending (specifically in Aboriginal communities), including water, transportation, and wastewater infrastructure projects. Emerging opportunities in
Canada include municipal, rail, and port projects, as well as insurance and brownfield redevelopment in our Commercial sector. US federal funding programs that impact our Environmental Services remain stable.
The MWH acquisition expanded our Environmental Services business operating unit. Greater-than-expected project activity occurred in Italy because of the
acceleration of a large environmental services contract. Activity continues to soften in the United States, partly due to lower mobilization on projects by key clients.
Highlights of projects secured during 2016 include a project to develop the environmental sustainability programs and environmental compliance programs and
provide pre-construction biological resource monitoring along a 21-mile (34-kilometre) section of the California High Speed Rail
Authority’s high-speed rail in Kern County, California. In addition, our Environmental Services team was awarded archaeological impact assessment work for all remaining areas scheduled for construction along a large cross-provincial pipeline in
western Canada.
Infrastructure. Gross revenue for our Infrastructure business operating unit increased 58.8% in 2016 compared to 2015. This
increase was mainly due to acquisition growth. Growth also resulted from foreign exchange, and organic gross revenue grew 3.7% in 2016 compared to 2015. Strong organic growth in our Transportation sector was partly offset by retraction in our
Community Development sector.
Our Community Development sector saw organic gross revenue retraction in 2016 compared to the same period in 2015;
retraction occurred primarily in Canada (and mostly in western Canada). We perform approximately 40% of our Community Development work in Canada and approximately 60% in the United States. The slowing economy in Alberta resulted in lower business
volume, but eastern Canada remained stable. With the exception of Alberta, both countries otherwise experienced a continued demand for housing, continued interest in urban development, and an increase in
mixed-use commercial projects. We continued to work on
|
|
|
|
|
| Management’s Discussion and Analysis
December 31, 2016 |
|
M-33 |
|
Stantec Inc. |
US urban design projects, further diversifying our strong greenfield business in the Sunbelt states. As well, opportunities for municipal parks and open space work and for private sector
commercial and institutional work continued to improve.
Our Transportation sector generates approximately 75% of its revenue in the United States. An
expanding US economy and our North American strategic market position led to increased organic growth opportunities such as program management, bridge inspection, light-rail transit, roadway, and bridge projects. The KBR and FST acquisitions,
completed in 2015, further expanded our US presence. The MWH acquisition expanded our Transportation sector business in Australia and New Zealand. Our Transportation sector works on projects of various sizes; this provides diversity, limits our
liability exposure, and positions us to compete in both large and small markets. Transportation’s backlog grew and we continued to pursue large project opportunities in both Canada and the United States. Our work is a diverse mix of design,
bridge condition inspection, intelligent transportation systems, transit, airport infrastructure, and program management and construction inspection; the most prevalent work was roadway design for multiple Departments and Ministries of
Transportation. For example, in the fourth quarter, we were named prime consultant for the 3.7-mile (5.6-kilometre) streetcar project in Tempe, Arizona. It is a vital
extension to Valley Metro’s 26-mile (42-kilometre) Light Rail system, connecting university students and surrounding neighborhoods to downtown Tempe and a newly
developed business district. Our responsibilities include design management and project controls on the construction management at-risk project, along with design of the track, roadway, drainage, traffic,
utilities, communications, and system-wide electrical, structures, and architecture.
Our Water sector had stable organic revenue in 2016 compared to
2015. During 2016 the Canadian market outpaced the United States. We continued to benefit from the need to replace aging and obsolete infrastructure and from environmental regulatory requirements. Our water and wastewater treatment facilities
planning and design business performed well with a diverse mix of private and public clients addressing capacity expansion needs and regulatory requirements. Several large projects in Canada were extended or resumed, and major new projects in the
United States were started. We continued to benefit from regulatory requirements, including the consent decrees in the United States that mandate municipalities to upgrade their water and wastewater facilities, as well as from the continued efforts
of public agencies and private industrial concerns to improve operational efficiency. Our Canadian and US Water operations continued work on existing projects and saw new treatment plant work in British Columbia, Ontario, and Virginia.
The MWH acquisition expanded our Water and Transportation sectors. Water in the United States had solid performance; utilization was strong, and we secured
major projects. Our UK Water sector is in year two of the AMP five-year cycle. Year one was slower to generate revenue compared to the revenue expected for years two to four. Gross revenue earned in the United Kingdom was negatively impacted by a
decline in the British pound sterling compared to the Canadian dollar—from $1.86 at the beginning of May to $1.66 on December 31, 2016, representing a 10.8% decrease. Revenues in our Asia Pacific transportation group remain soft, driven by
market changes in New Zealand and demand weaknesses in provincial markets where MWH has historically had a strong presence.
Highlights of work secured in
2016 include our participation in a joint venture composed of MWH and Joe Hill Consulting Engineers, a San Francisco-based engineering firm, to provide as-needed specialized and technical water contract
services including water supply, treatment, and transmission services as well as public health, and environmental and regulatory compliance services for the San Francisco Public Utilities Commission. In the third quarter, we were selected to provide
town planning work for 486 hectares (1,200 acres) of designated lands within the Tsuu T’ina First Nation west of Calgary, Alberta. The work includes roadway layout, public realm concept design, land use zoning creation, urban and architectural
design guidelines, and land lease plots. In the fourth quarter, we were selected to provide legal survey services, design, and resident engineering for Calgary’s new Hotchkiss residential community. Once complete, the 85-hectare (210-acre) community will be home to approximately 3,700 residents.
|
|
|
|
|
| Management’s Discussion and Analysis
December 31, 2016 |
|
M-34 |
|
Stantec Inc. |
Gross Margin
Gross
margin is calculated as net revenue minus direct payroll costs. Direct payroll costs include the cost of salaries and related fringe benefits for labor hours that are directly associated with the completion of projects. Labor costs and related
fringe benefits for labor hours that are not directly associated with the completion of projects are included in administrative and marketing expenses.
In general, gross margin fluctuations depend on the particular mix of projects in progress during any year and on our project execution. These fluctuations
reflect the basis of our business model, which is based on providing two primary service offerings—Consulting Services and Construction Services—across diverse geographic locations, business operating units (within Consulting Services),
and all phases of the infrastructure and facilities project life cycle.
Gross margin as a percentage of net revenue decreased from 54.5% in 2015 to 54.1%
in 2016. This decrease was due to a decrease in margins in Canada and partly offset by an increase in our Global and US margins. The decrease was also impacted by the addition of the Construction Services business, which generates a lower margin
than our Consulting Services business.
The following table summarizes our gross margin percentages by reportable segments:
Gross Margin by Reportable Segments
|
|
|
|
|
| |
|
2016 |
|
2015 |
| Consulting Services |
|
|
|
|
| Canada |
|
53.9% |
|
55.0% |
| United States |
|
55.3% |
|
54.0% |
| Global |
|
58.1% |
|
53.4% |
| Construction Services |
|
37.0% |
|
n/a |
In our Consulting Services – Canada operations, the decreases in gross margin in 2016 compared to 2015 resulted from the
mix of projects. The increase in gross margins in our US operations resulted mainly from higher margins on the mix of projects acquired from MWH, predominantly in the Water and Waterpower & Dams sectors. Our Consulting Services –
Global operations had higher margins, primarily a result of higher margins on the mix of projects acquired from MWH.
Construction Services is a
high-volume, lower-margin business that incurs more subcontractors and direct expenditures compared to subconsultants and direct expenditures incurred by Consulting Services.
Consulting Services can be further described by business operating unit. The following table summarizes our gross margin percentages by business operating
unit:
|
|
|
|
|
| Management’s Discussion and Analysis
December 31, 2016 |
|
M-35 |
|
Stantec Inc. |
Gross Margin by Consulting Services - Business Operating Unit
|
|
|
|
|
| |
|
2016 |
|
2015 |
| Consulting Services |
|
|
|
|
| Buildings |
|
54.8% |
|
55.2% |
| Energy & Resources |
|
51.0% |
|
48.5% |
| Environmental Services |
|
57.6% |
|
58.4% |
| Infrastructure |
|
55.5% |
|
54.7% |
|
| Note: Comparative figures have been reclassified
due to a realignment of several business lines between our Energy & Resources and Infrastructure business operating units. |
In our Buildings business operating unit, gross margin decreased in 2016 compared to 2015 as a result of increases in
competition in our Canadian operations and in pursuits for design-build P3 projects. During the pursuit phase of this type of project, we perform work at reduced margins, which are then increased if our team secures the project.
Our Energy & Resources business operating unit had higher margins in 2016 compared to 2015, mainly due to the mix of projects acquired from MWH. In
Canada, reduced capital investment in our Oil & Gas and Mining sectors resulted in reduced margins on projects that were awarded in the year.
Our Environmental Services business operating unit had lower margins, mainly because of clients’ downward pressures on fees in response to economic
challenges in certain markets, especially in the oil and gas industry. Rate fee pressures also existed in the mining and power industries.
Infrastructure
had higher margins in 2016 compared to 2015, primarily because of improved margins in our Water sector and the projects acquired from MWH.
Revenue and Gross
Margin Realignment by Business Operating Unit
Effective 2017, we are realigning our organizational structure in Consulting Services from four to five
business operating units. (For further information regarding this realignment, see the Evolution of our Business Operating Unit Specialization section of this report on page M-9)
The following table realigns the quarterly and annual gross revenue we earned in 2016 that resulted from this change.
Gross Revenue by Consulting Services - Business Operating Unit
|
|
|
|
|
|
|
|
|
|
|
|
|
|
|
|
|
|
|
| (In millions of Canadian dollars) |
|
Quarter
Ended
March 31,
2016 |
|
|
Quarter
Ended
June 30,
2016 |
|
|
Quarter
Ended
Sept 30,
2016 |
|
|
Quarter
Ended
Dec 31,
2016 |
|
|
Year
Ended
2016 |
| Consulting Services |
|
|
|
|
|
|
|
|
|
|
|
|
|
|
|
|
|
|
| Buildings |
|
|
219.6 |
|
|
|
193.4 |
|
|
|
201.2 |
|
|
|
202.0 |
|
|
816.2 |
| Energy & Resources |
|
|
85.5 |
|
|
|
109.0 |
|
|
|
123.0 |
|
|
|
111.1 |
|
|
428.6 |
| Environmental Services |
|
|
122.0 |
|
|
|
153.5 |
|
|
|
174.3 |
|
|
|
186.7 |
|
|
636.5 |
| Infrastructure |
|
|
242.4 |
|
|
|
262.1 |
|
|
|
254.2 |
|
|
|
243.8 |
|
|
1,002.5 |
| Water |
|
|
85.9 |
|
|
|
187.9 |
|
|
|
255.3 |
|
|
|
242.0 |
|
|
771.1 |
|
|
|
|
|
|
| Total |
|
|
755.4 |
|
|
|
905.9 |
|
|
|
1,008.0 |
|
|
|
985.6 |
|
|
3,654.9 |
|
|
|
|
|
| Management’s Discussion and Analysis
December 31, 2016 |
|
M-36 |
|
Stantec Inc. |
The following table details our gross margins as a percentage of net revenue by our five business operating units
on a quarterly and annual basis for 2016.
Gross Margin by Consulting Services - Business Operating Unit
|
|
|
|
|
|
|
|
|
|
|
|
|
|
|
|
|
|
|
| |
|
Quarter
Ended
March 31,
2016 |
|
|
Quarter
Ended
June 30,
2016 |
|
|
Quarter
Ended
Sept 30,
2016 |
|
|
Quarter
Ended
Dec 31,
2016 |
|
|
Year
Ended
2016 |
| Consulting Services |
|
|
|
|
|
|
|
|
|
|
|
|
|
|
|
|
|
|
| Buildings |
|
|
56.0% |
|
|
|
53.5% |
|
|
|
54.6% |
|
|
|
55.0% |
|
|
54.8% |
| Energy & Resources |
|
|
44.6% |
|
|
|
50.8% |
|
|
|
53.8% |
|
|
|
53.3% |
|
|
51.0% |
| Environmental Services |
|
|
57.2% |
|
|
|
57.3% |
|
|
|
56.9% |
|
|
|
59.0% |
|
|
57.6% |
| Infrastructure |
|
|
53.1% |
|
|
|
52.8% |
|
|
|
53.7% |
|
|
|
52.9% |
|
|
53.1% |
| Water |
|
|
56.6% |
|
|
|
58.9% |
|
|
|
58.7% |
|
|
|
60.7% |
|
|
59.1% |
Administrative and Marketing Expenses
Administrative and marketing expenses increased $346.5 million from 2015 to 2016. As a percentage of net revenue, our administrative and marketing
expenses increased from 41.6% in 2015 to 43.1% in 2016.
Administrative and marketing expenses fluctuate from year to year because of the amount of staff
time charged to marketing and administrative labor, which is influenced by the mix of projects in progress during the period, as well as by business development and acquisition integration activities.
In 2016, administrative and marketing expenses were higher compared to 2015 mainly due to a $13.8 million increase in acquisition-related costs from
$0.7 million in 2015 to $14.5 million in 2016. Acquisition-related costs in 2016 included legal, accounting, and financial advisory fees incurred for the MWH acquisition. Excluding the $14.5 million in acquisition-related costs in
2016, our administrative and marketing expenses as a percentage of net revenue would have been 42.6%. In addition, we had higher professional fees of $9.3 million and higher administrative labor costs due in part to the increase in integration
activities resulting from the MWH acquisition. As well, retention and merit payments related to acquisitions increased by $7.6 million and severance payments increased by $4.0 million compared to 2015.
Depreciation of Property and Equipment
Depreciation increased
$5.3 million year over year. As a percentage of net revenue, depreciation of property and equipment decreased from 1.9% in 2015 to 1.7% in 2016. This decrease is due to the following: (i) a decrease in additions to property and equipment
as a percentage of net revenue over the last two years and (ii) MWH has less depreciation as a percentage of net revenue compared to legacy Stantec. During 2016, additions (excluding acquisitions) to property and equipment were
$58.7 million compared to $37.5 million in 2015. We had higher purchases in 2016 due to an increase in leasehold improvements made to various office locations and increased spending because of acquisition growth.
As a professional services organization, we are not capital intensive. In the past, we made capital expenditures mostly for items such as leasehold
improvements, computer equipment, furniture, and other office and field equipment. The $58.7 million additions to property and equipment met our expectations; we budgeted approximately $60.0 million at the beginning of 2016. We expect our
total capital additions in 2017 to be approximately $75.0 million, excluding capital assets acquired from acquisitions. The increase in budgeted
|
|
|
|
|
| Management’s Discussion and Analysis
December 31, 2016 |
|
M-37 |
|
Stantec Inc. |
spending, compared to spending in 2016, relates to the anticipated build-out of technology infrastructure in our primary data center facility and allocated
capital for the integration of MWH to our systems. We plan to continue to invest in enhancements to our information technology infrastructure and enterprise system; this will optimize and streamline business processes and prepare us for continued
growth. Our capital expenditures during 2016 were financed by cash flows from operations.
Intangible Assets
The timing of completed acquisitions, size of acquisitions, and type of intangible assets acquired impact the amount of amortization of intangible assets in a
period. Client relationships are amortized over estimated useful lives ranging from 10 to 15 years, and contract backlog and finite-lived trademarks are generally amortized over an estimated useful life of 1 to 3 years.
Consequently, the impact of the amortization of contract backlog can be significant in the 4 to 12 quarters following an acquisition. As at December 31, 2016, $36.3 million of the $449.5 million in intangible assets related to
backlog.
Also included in intangible assets are purchased and internally generated computer software that is replaceable and not an integral part of
related hardware. This computer software is amortized over an estimated useful life ranging from 3 to 7 years.
The following table summarizes the
amortization of identifiable intangible assets:
Amortization of Intangibles
|
|
|
|
|
| (In thousands of Canadian dollars) |
|
2016 |
|
2015 |
|
|
|
| Client relationships |
|
26,817 |
|
14,985 |
| Backlog |
|
22,328 |
|
8,618 |
| Software |
|
21,613 |
|
12,956 |
| Other |
|
6,787 |
|
2,458 |
| Lease disadvantage |
|
(1,885) |
|
(1,164) |
|
|
|
| Total amortization of intangible assets |
|
75,660 |
|
37,853 |
The $37.8 million increase in intangible asset amortization from 2015 to 2016 was mainly due to an increase in backlog,
client relationships, finite-lived trademarks, and software from acquisitions completed in 2015 and 2016 and an increase in software additions over the last two years. During 2016, we added $380.5 million to intangible assets; of this amount,
$354.2 million resulted from acquisitions and the remaining $26.3 million resulted mainly from the renewal of various software agreements. The MWH acquisition added $315.3 million to intangible assets consisting mainly of client
relationships, contract backlog, trademarks, software, lease advantages, and lease disadvantages.
The $26.3 million additions to intangible software
was below our budgeted expectation of $33.0 million (set at the beginning of 2016), mainly due to the postponement of certain planned software purchases. We expect total software additions in 2017 to be approximately $15.0 million. Our
plan is to continue investing in enhancements to our business information systems to optimize and streamline our business processes and prepare for continued growth.
Based on the unamortized intangible asset balance remaining at the end of 2016, we expect our amortization expense for intangible assets for the full year
2017 to be approximately $85.0 million. The actual expense may be impacted by any new acquisitions completed in 2017.
|
|
|
|
|
| Management’s Discussion and Analysis
December 31, 2016 |
|
M-38 |
|
Stantec Inc. |
In accordance with our accounting policies, we review intangible assets at each reporting period to determine
whether there is an indication of impairment. An asset may be impaired if (1) there is objective evidence of impairment as a result of one or more events that have occurred after the initial recognition of the asset and (2) if that
event has an impact on the estimated future cash flows of the asset.
To determine indicators of impairment of intangible assets, we consider external
sources of information such as prevailing economic and market conditions. We also consider internal sources of information such as the historical and expected financial performance of the intangible assets. If indicators of impairment are present,
the asset’s recoverable amount is estimated. If the carrying amount exceeds the recoverable amount (on a discounted basis), the asset value is written down to the recoverable amount. (For further discussion on the methodology used in testing
long-lived assets and intangibles for impairment, refer to the Critical Accounting Estimates in the Critical Accounting Estimates, Developments, and Measures section of this report.)
Based on our review of intangible assets at each reporting period in 2016 and 2015, there have been no material indications of impairment.
Net Interest Expense
Net interest expense increased by
$17.7 million in 2016 compared to 2015. This increase was primarily due to a $655.1 million increase in our outstanding long-term debt at December 31, 2016, compared to December 31, 2015, mainly for the MWH acquisition. The
balance outstanding on our new revolving credit facility and term loan as at December 31, 2016, was $870.2 million compared to $221.8 million on our former revolving credit facility and senior secured notes at December 31, 2015.
The average interest rate for our new revolving credit facility and term loan was approximately 3.1% at December 31, 2016, and approximately 3.3% at December 31, 2015, for our former revolving credit facility and senior secured notes. The
senior secured notes were redeemed on May 6, 2016, and a breakage fee of $3.9 million was paid and recorded in net interest expense in Q2 16. The balance of our notes payable was higher at $127.2 million at December 31, 2016,
than the $124.5 million at December 31, 2015. The weighted average interest rate on our notes payable was 3.45% (2015 – 3.63%). (The revolving credit facility and term loan are further described in the Liquidity and Capital Resources
section of this report.)
Based on our credit balance at December 31, 2016, we estimate that a 0.5% increase in interest rates, with all other
variables held constant, would have decreased net income by $2.4 million and decreased basic earnings per share by $0.02. If the interest rate was 0.5% lower, an equal and opposite impact on net income and basic earnings per share would have
occurred.
Foreign Exchange Losses and Gains
We reported a
foreign exchange loss of $0.7 million in 2016, compared to a $0.3 million gain in 2015. These foreign exchange losses and gains arose from the translation of the foreign-denominated assets and liabilities held in our Canadian, US,
and other foreign subsidiaries. We minimize our exposure to foreign exchange fluctuations by matching foreign currency assets with foreign currency liabilities and, when appropriate, by entering into forward contracts to buy or sell foreign
currencies in exchange for Canadian dollars. The foreign exchange losses and gains in 2016 and 2015 were caused by the volatility of daily foreign exchange rates and the timing of the recognition and relief of foreign-denominated assets and
liabilities.
Before May 6, 2016, we entered into foreign-currency forward-contract agreements of US$773.0 million to purchase
US$773.0 million for $1,008.9 million at fixed rates varying from 1.32360 to 1.28655 that matured on May 6, 2016. These derivative financial instruments were entered into to mitigate foreign currency fluctuation risk on the purchase
price of MWH to be paid in US dollars. The fair value of the contracts resulted in a realized loss of $10.2 million. We designated these foreign currency forward contracts as a cash flow hedge against the purchase price of MWH; therefore, the
unrealized loss was recorded in other comprehensive income and in the
|
|
|
|
|
| Management’s Discussion and Analysis
December 31, 2016 |
|
M-39 |
|
Stantec Inc. |
consolidated statements of financial position until it was realized on the maturity date and was included as part of the consideration paid for MWH. The hedging relationship was effective to the
date of maturity. As at December 31, 2016, we had no material foreign-currency, forward-contract agreements.
We estimate that because of a net
exposure at December 31, 2016, a 1.0% decrease in foreign exchange rates, with all other variables held constant, would have decreased net income by $129,000 and increased basic earnings per share by less than $0.01. If the exchange rates
increased by 1.0%, an equal and opposite impact on net income and basic earnings per share would have occurred.
Income Taxes
Our 2016 effective income tax rate was 27.8% compared to 26.1% in 2015. The effective tax rate is based on statutory rates in jurisdictions where the combined
companies of legacy Stantec and MWH operate and on our earnings in each of these jurisdictions. The MWH acquisition altered Stantec’s legacy tax profile and the mix of jurisdictional earnings and tax rates, resulting in an increase in the
effective tax rate. In addition, our effective income tax rate increased due to non-deductible acquisition-related costs, unrecognized tax losses and temporary differences, and an increase in non-deductible expenditures in relation to net income.
FOURTH QUARTER RESULTS
Overall Q4 16 Results
Gross revenue increased 74.7%—from
$710.4 million in Q4 15 to $1,240.8 million in Q4 16. Total gross revenue was positively impacted by acquisitions completed in 2015 and 2016 and 2.2% organic revenue growth in our Infrastructure business operating unit. This was partly
offset by organic revenue retraction in our Buildings and Energy & Resources business operating units. Environmental Services had stable organic revenue.
Adjusted EBITDA increased 41.3%—from $59.3 million in Q4 15 to $83.8 million in Q4 16. EBITDA increased 51.8%—from $54.6 million in
Q4 15 to $82.9 million in Q4 16. EBITDA was positively impacted by an increase in our gross margin as a percentage of net revenue—from 54.1% in Q4 15 to 54.5% in Q4 16—primarily due to higher margins in the mix of projects acquired
from MWH.
Net income increased 16.2%—from $25.3 million in Q4 15 to $29.4 million in Q4 16. Diluted earnings per share decreased
3.7%—from $0.27 in Q4 15 to $0.26 in Q4 16. Adjusted diluted EPS was $0.35 compared to $0.34 in Q4 15, an increase of 2.9%. Net income was positively impacted by a decrease in depreciation expense as a percentage of net revenue—from 2.2%
in Q4 15 to 1.8% in Q4 16. However, there was an increase in the amortization of intangible assets resulting from acquisitions and an increase in our net interest expense due to an increase in our outstanding long-term debt mainly for the MWH
acquisition. In addition, our effective tax rate decreased from 28.0% at Q3 16 to 27.8% at Q4 16 (further explained on page M-44).
The following table summarizes our key operating results for Q4 16 on a percentage of net revenue basis and the percentage increase in the dollar amount of
these results compared to the same period last year:
|
|
|
|
|
| Management’s Discussion and Analysis
December 31, 2016 |
|
M-40 |
|
Stantec Inc. |
|
|
|
|
|
|
|
|
|
|
|
|
|
|
|
|
|
|
|
|
|
| |
|
Quarter Ended
December 31 |
|
|
|
|
|
% of Net Revenue |
|
|
|
|
% Increase
(Decrease)* |
| (In millions of Canadian dollars, except %) |
|
2016 |
|
2015 |
|
|
|
|
|
2016 |
|
2015 |
|
|
|
|
2016 vs. 2015 |
|
|
|
|
|
|
|
|
| Gross revenue |
|
1,240.8 |
|
|
710.4 |
|
|
|
|
|
|
151.3% |
|
125.2% |
|
|
|
|
|
74.7% |
| Net revenue |
|
820.2 |
|
|
567.4 |
|
|
|
|
|
|
100.0% |
|
100.0% |
|
|
|
|
|
44.6% |
| Direct payroll costs |
|
373.0 |
|
|
260.5 |
|
|
|
|
|
|
45.5% |
|
45.9% |
|
|
|
|
|
43.2% |
| Gross margin |
|
447.2 |
|
|
306.9 |
|
|
|
|
|
|
54.5% |
|
54.1% |
|
|
|
|
|
45.7% |
| Administrative and marketing expenses |
|
363.5 |
|
|
248.1 |
|
|
|
|
|
|
44.3% |
|
43.7% |
|
|
|
|
|
46.5% |
| Depreciation of property and equipment |
|
14.8 |
|
|
12.3 |
|
|
|
|
|
|
1.8% |
|
2.2% |
|
|
|
|
|
20.3% |
| Amortization of intangible assets |
|
20.7 |
|
|
8.8 |
|
|
|
|
|
|
2.5% |
|
1.5% |
|
|
|
|
|
135.2% |
| Net interest expense |
|
7.0 |
|
|
2.7 |
|
|
|
|
|
|
0.9% |
|
0.5% |
|
|
|
|
|
159.3% |
| Other net finance expense |
|
0.8 |
|
|
0.8 |
|
|
|
|
|
|
0.1% |
|
0.2% |
|
|
|
|
|
0.0% |
| Share of income from joint ventures and associates |
|
(0.7) |
|
|
(0.4) |
|
|
|
|
|
|
(0.1%) |
|
(0.1%) |
|
|
|
|
|
75.0% |
| Foreign exchange loss |
|
0.2 |
|
|
0.0 |
|
|
|
|
|
|
0.0% |
|
0.0% |
|
|
|
|
|
n/m |
| Other expense |
|
0.5 |
|
|
3.8 |
|
|
|
|
|
|
0.1% |
|
0.7% |
|
|
|
|
|
(86.8%) |
| Income before income taxes |
|
40.4 |
|
|
30.8 |
|
|
|
|
|
|
4.9% |
|
5.4% |
|
|
|
|
|
31.2% |
| Income taxes |
|
11.0 |
|
|
5.5 |
|
|
|
|
|
|
1.3% |
|
0.9% |
|
|
|
|
|
100.0% |
| Net income |
|
29.4 |
|
|
25.3 |
|
|
|
|
|
|
3.6% |
|
4.5% |
|
|
|
|
|
16.2% |
n/m = not meaningful
* % increase
(decrease) calculated based on the dollar change from the comparable period.
Gross Revenue
|
|
|
| (In millions of Canadian dollars) |
|
Q4 16 vs. Q4 15 |
|
|
| Increase due to |
|
|
| Acquisition growth |
|
563.7 |
| Organic retraction |
|
(31.3) |
| Impact of foreign exchange rates on revenue earned by
foreign subsidiaries |
|
(2.0) |
| Total net increase in gross revenue |
|
530.4 |
During Q4 16, gross revenue increased by $530.4 million, or 74.7%, compared to the same period in 2015. This change
occurred because of the impact of acquisitions completed in 2015 and 2016, in particular, the MWH acquisition. The average exchange rate for the Canadian dollar was US$0.75 during both Q4 16 and Q4 15.
The following tables summarize the change in gross revenue by reportable segment and by business operating unit in the fourth quarter of 2016 compared to the
same period in 2015:
|
|
|
|
|
| Management’s Discussion and Analysis
December 31, 2016 |
|
M-41 |
|
Stantec Inc. |
Gross Revenue by Reportable Segment
|
|
|
|
|
|
|
|
|
|
|
|
|
|
|
|
|
|
|
|
|
|
|
| (In millions of Canadian dollars) |
|
Quarter
Ended
Dec 31,
2016 |
|
|
Quarter
Ended
Dec 31,
2015 |
|
|
Total
Change |
|
|
Change Due
to
Acquisitions |
|
|
Change Due
to Organic
Growth
(Retraction) |
|
|
Change Due
to Foreign
Exchange |
| Consulting Services |
|
|
|
|
|
|
|
|
|
|
|
|
|
|
|
|
|
|
|
|
|
|
| Canada |
|
|
284.9 |
|
|
|
309.0 |
|
|
|
(24.1) |
|
|
|
1.7 |
|
|
|
(25.8) |
|
|
n/a |
| United States |
|
|
540.9 |
|
|
|
376.4 |
|
|
|
164.5 |
|
|
|
161.2 |
|
|
|
4.5 |
|
|
(1.2) |
| Global |
|
|
159.8 |
|
|
|
25.0 |
|
|
|
134.8 |
|
|
|
145.6 |
|
|
|
(10.0) |
|
|
(0.8) |
|
|
|
|
|
|
|
| Total Consulting Services |
|
|
985.6 |
|
|
|
710.4 |
|
|
|
275.2 |
|
|
|
308.5 |
|
|
|
(31.3) |
|
|
(2.0) |
| Construction Services |
|
|
255.2 |
|
|
|
- |
|
|
|
255.2 |
|
|
|
255.2 |
|
|
|
- |
|
|
- |
|
|
|
|
|
|
|
| Total |
|
|
1,240.8 |
|
|
|
710.4 |
|
|
|
530.4 |
|
|
|
563.7 |
|
|
|
(31.3) |
|
|
(2.0) |
n/a = not applicable
Gross Revenue by Consulting Services - Business Operating Unit
|
|
|
|
|
|
|
|
|
|
|
|
|
|
|
|
|
|
|
|
|
|
|
| (In millions of Canadian dollars) |
|
Quarter
Ended
Dec 31,
2016 |
|
|
Quarter
Ended
Dec 31,
2015 |
|
|
Total
Change |
|
|
Change Due
to
Acquisitions |
|
|
Change Due
to Organic
Growth
(Retraction) |
|
|
Change Due
to Foreign
Exchange |
| Consulting Services |
|
|
|
|
|
|
|
|
|
|
|
|
|
|
|
|
|
|
|
|
|
|
| Buildings |
|
|
202.0 |
|
|
|
190.2 |
|
|
|
11.8 |
|
|
|
25.6 |
|
|
|
(12.7) |
|
|
(1.1) |
| Energy & Resources |
|
|
111.1 |
|
|
|
90.3 |
|
|
|
20.8 |
|
|
|
43.1 |
|
|
|
(22.2) |
|
|
(0.1) |
| Environmental Services |
|
|
186.7 |
|
|
|
142.4 |
|
|
|
44.3 |
|
|
|
47.1 |
|
|
|
(2.7) |
|
|
(0.1) |
| Infrastructure |
|
|
485.8 |
|
|
|
287.5 |
|
|
|
198.3 |
|
|
|
192.7 |
|
|
|
6.3 |
|
|
(0.7) |
|
|
|
|
|
|
|
| Total Consulting Services |
|
|
985.6 |
|
|
|
710.4 |
|
|
|
275.2 |
|
|
|
308.5 |
|
|
|
(31.3) |
|
|
(2.0) |
| Note: Comparative figures have been reclassified
due to a realignment of several business lines between our Energy & Resources and Infrastructure business operating units. |
In our business operating units in Q4 16 compared to Q4 15, we had moderate organic revenue growth in Infrastructure, stable
organic revenue in Environmental Services, and organic revenue retraction in Buildings and Energy & Resources. Infrastructure grew 2.2% organically in Q4 16 compared to Q4 15 mainly due to growth in our Transportation and Water sectors in
both Canada and the United States. Buildings had 6.7% organic revenue retraction due to our Canadian and Global operations, partly offset by strong organic growth in the United States. The retraction occurred primarily because of the decline in the
oil and gas sector, impacting both private and public spending in Canada and the Middle East. Our Energy & Resources business operating unit continued to experience organic revenue retraction mainly due to the decline in the oil and gas and
power sectors in Q4 16 compared to Q4 15.
|
|
|
|
|
| Management’s Discussion and Analysis
December 31, 2016 |
|
M-42 |
|
Stantec Inc. |
Gross Margin
Gross
margin increased from 54.1% in Q4 15 to 54.5% in Q4 16. Our gross margins quarter over quarter in our reportable segments and our business operating units are summarized in the tables below:
Gross Margin by Reportable Segments
|
|
|
|
|
| |
|
Quarter Ended
Dec 31 |
| |
|
2016 |
|
2015 |
| Consulting Services |
|
|
|
|
| Canada |
|
54.2% |
|
54.1% |
| United States |
|
56.7% |
|
53.9% |
| Global |
|
58.5% |
|
57.0% |
| Construction Services |
|
34.8% |
|
n/a |
| Gross Margin by Consulting Services - Business
Operating Unit |
| |
|
Quarter Ended
Dec 31 |
| |
|
2016 |
|
2015 |
| Consulting Services |
|
|
|
|
| Buildings |
|
55.0% |
|
55.3% |
| Energy & Resources |
|
53.3% |
|
45.6% |
| Environmental Services |
|
59.0% |
|
59.0% |
| Infrastructure |
|
56.5% |
|
54.1% |
| Note: Comparative figures have been
reclassified due to a realignment of several business lines between our Energy & Resources and Infrastructure business operating units. |
In general, gross margin fluctuations depend on the particular mix of projects in progress during any quarter and on project
execution. These fluctuations reflect the essence of our business model, which is based on providing two primary service offerings—Consulting Services and Construction Services—across diverse geographic locations, business operating units
(within Consulting Services), and all phases of the infrastructure and facilities project life cycle. The increase in gross margins in our US operations resulted mainly from higher margins on the mix of projects acquired from MWH, predominantly in
the Water and Waterpower & Dams sectors. Our Global operations and Energy & Resources business operating unit had improved margins also due to higher margins on the mix of projects acquired from MWH. Infrastructure’s gross
margin increased in Q4 16 compared to Q4 15, primarily because of improved margins in our Water and Transportation sectors.
Other
Administrative and marketing expenses as a percentage of net revenue increased to 44.3% in Q4 16, from 43.7% in Q4 15. This was mainly due to an increase in
professional fees and marketing and business development labor as a percentage of net revenue in Q4 16 compared to Q4 15. This increase was partly offset by decreases in occupancy costs and provision for self-insurance expense as a percentage of net
revenue.
Depreciation as a percentage of net revenue decreased in Q4 16 compared to Q4 15. This decrease is a result of a decrease in additions to
property and equipment as a percentage of net revenue over the last two years and the fact that MWH has less depreciation as a percentage of net revenue compared to legacy Stantec. There were increases in the amortization of intangible assets
resulting from acquisitions and in our net interest expense
|
|
|
|
|
| Management’s Discussion and Analysis
December 31, 2016 |
|
M-43 |
|
Stantec Inc. |
due to an increase in our outstanding long-term debt mainly for the MWH acquisition. Other expense decreased due to the recognition of a $4.1 million
non-operating loss related to the sale of our India subsidiary in Q4 15.
Our effective tax rate is based on
statutory rates in jurisdictions where we operate. Our effective income tax rate decreased from 28.0% at Q3 16 to 27.8% at Q4 16 due mainly to less income earned in higher tax rate jurisdictions.
QUARTERLY TRENDS
The following is a summary of our quarterly
operating results for the last two fiscal years, all prepared in accordance with IFRS:
|
|
|
|
|
|
|
|
|
| Quarterly Unaudited Financial Information
|
| (In millions of Canadian dollars,
except per share amounts) |
|
Dec 31, 2016 |
|
Sept 30, 2016 |
|
Jun 30, 2016 |
|
Mar 31, 2016 |
|
|
|
|
|
| Gross revenue |
|
1,240.8 |
|
1,257.3 |
|
1,046.6 |
|
755.4 |
| Net revenue |
|
820.2 |
|
872.2 |
|
777.4 |
|
628.6 |
| Net income |
|
29.4 |
|
49.3 |
|
21.2 |
|
30.6 |
|
|
|
|
|
| EPS – basic |
|
0.26 |
|
0.43 |
|
0.20 |
|
0.33 |
| EPS – diluted |
|
0.26 |
|
0.43 |
|
0.20 |
|
0.32 |
| Adjusted EPS – basic (note 1) |
|
0.35 |
|
0.55 |
|
0.37 |
|
0.40 |
| Adjusted EPS – diluted (note
1) |
|
0.35 |
|
0.55 |
|
0.37 |
|
0.40 |
|
|
|
|
|
| |
|
Dec 31, 2015 |
|
Sept 30, 2015 |
|
Jun 30, 2015 |
|
Mar 31, 2015 |
|
|
|
|
|
| Gross revenue |
|
710.4 |
|
750.8 |
|
710.3 |
|
705.7 |
| Net revenue |
|
567.4 |
|
620.1 |
|
593.9 |
|
592.3 |
| Net income |
|
25.3 |
|
49.9 |
|
43.1 |
|
38.0 |
|
|
|
|
|
| EPS – basic |
|
0.27 |
|
0.53 |
|
0.46 |
|
0.40 |
| EPS – diluted |
|
0.27 |
|
0.53 |
|
0.46 |
|
0.40 |
| Adjusted EPS – basic (note 1) |
|
0.35 |
|
0.59 |
|
0.45 |
|
0.46 |
| Adjusted EPS – diluted (note
1) |
|
0.34 |
|
0.58 |
|
0.45 |
|
0.46 |
| Quarterly earnings per share (EPS) and
basic and diluted adjusted EPS are not additive and may not equal the annual EPS reported. This is a result of the effect of shares issued on the weighted average number of shares. Quarterly and annual diluted EPS and diluted adjusted EPS are also
affected by the change in the market price of our shares, since we do not include in dilution options when the exercise price of the option is not in the money.
Note 1: Adjusted basic and diluted EPS are non-IFRS measures and are further discussed in the
Definition of Non-IFRS Measures section of this report. |
|
|
|
|
|
| Management’s Discussion and Analysis
December 31, 2016 |
|
M-44 |
|
Stantec Inc. |
The following items impact the comparability of our quarterly results:
|
|
|
|
|
|
|
|
|
|
|
|
|
|
|
|
|
| Gross Revenue
(In millions of Canadian dollars) |
|
Q4 16 vs.
Q4 15 |
|
|
Q3 16 vs.
Q3 15 |
|
|
Q2 16 vs.
Q2 15 |
|
|
Q1 16 vs.
Q1 15 |
|
|
|
|
|
|
| Increase (decrease) in gross revenue due to |
|
|
|
|
|
|
|
|
|
|
|
|
|
|
|
|
| Acquisition growth |
|
|
563.7 |
|
|
|
568.6 |
|
|
|
354.6 |
|
|
|
49.2 |
|
| Organic growth (retraction) |
|
|
(31.3) |
|
|
|
(59.1) |
|
|
|
(36.0) |
|
|
|
(35.6) |
|
| Impact of foreign exchange rates on revenue earned by foreign
subsidiaries |
|
|
(2.0) |
|
|
|
(3.0) |
|
|
|
17.7 |
|
|
|
36.1 |
|
|
|
|
|
|
| Total net increase in gross
revenue |
|
|
530.4 |
|
|
|
506.5 |
|
|
|
336.6 |
|
|
|
49.7 |
|
Q1 16 vs. Q1 15. During Q1 16, net income decreased by $7.4 million, or 19.5%, from Q1 15, and adjusted diluted
earnings per share for Q1 16 decreased by $0.06, or 13.0%, compared to Q1 15. Net income for Q1 16 was positively impacted by an increase in revenue because of acquisitions completed in 2015 and 2016 and the impact of foreign exchange rates on
revenue earned by our US subsidiaries. This was partly offset by organic revenue retraction in our Energy & Resources business operating unit. Our gross margin decreased—from 55.2% in Q1 15 to 53.9% in Q1 16—mainly due to the
recognition of certain performance metric fees obtained in Q1 15 on a major mining project, as well as downward margin pressures in the energy and resources market. Our administrative and marketing expenses as a percentage of net revenue
increased—from 42.5% in Q1 15 to 43.2% in Q1 16—mainly due to an increase in acquisition-related transaction costs and lease exit costs.
Q2
16 vs. Q2 15. During Q2 16, net income decreased $21.9 million, or 50.8%, from Q2 15, and adjusted diluted earnings per share for Q2 16 decreased $0.08, or 17.8%, compared to Q2 15. Net income for Q2 15 was positively impacted by an
increase in revenue due to acquisitions completed in 2015 and 2016 and the impact of foreign exchange rates on revenue earned by our US subsidiaries. The acquisition of MWH significantly added to our operating results and created a new service
offering—Construction Services. Organic revenue retracted 5.1% in Q2 16 compared to Q2 15. We had strong organic revenue growth in our Infrastructure business operating unit compared to Q2 15 and our other Consulting Services business
operating units retracted organically in the quarter. Our gross margin decreased—from 54.0% in Q2 15 to 53.6% in Q2 16. This decrease was due to the addition of the Construction Services business, which generates a lower margin than our
Consulting Services business. In addition, there were downward margin pressures in some sectors and execution challenges with projects in our Buildings business operating unit and Transportation sector. Our administrative and marketing expenses as a
percentage of net revenue increased—from 41.2% in Q2 15 to 43.9% in Q2 16—mainly due to an increase in acquisition-related transaction costs, in particular, those costs related to the MWH acquisition, as well as an increase in lease exit
costs.
Q3 16 vs. Q3 15. During Q3 16, net income decreased $0.6 million, or 1.2%, from Q3 15, and adjusted diluted earnings per share for Q3
16 decreased $0.03, or 5.2%, compared to Q3 15. Net income for Q3 16 was positively impacted by an increase in revenue due to acquisitions completed in 2015 and 2016. This was partly offset by the impact of foreign exchange rates on revenue earned
by our US subsidiaries and by 7.9% organic revenue retraction. Our gross margin decreased—from 54.5% in Q3 15 to 54.2% in Q3 16. This decrease was caused by the mix of projects, downward pressures on fees in some sectors, and the
addition of the Construction Services business, which generates a lower margin than our Consulting Services business. Our administrative and marketing expenses as a percentage of net revenue increased—from 39.4% in Q3 15 to 41.1% in Q3
16—mainly due to higher administrative labor costs and an increase in integration activities from the MWH acquisition.
|
|
|
|
|
| Management’s Discussion and Analysis
December 31, 2016 |
|
M-45 |
|
Stantec Inc. |
Interest expense increased $5.0 million in Q3 16 compared to Q3 15, primarily because of an increase in our outstanding long-term debt, attributable to the MWH acquisition.
STATEMENTS OF FINANCIAL POSITION
The following highlights the
major changes to our assets, liabilities, and equity from December 31, 2015, to December 31, 2016:
|
|
|
|
|
|
|
|
|
|
|
|
|
|
|
| Balance Sheet Summary |
|
|
|
|
|
|
|
|
|
|
|
|
|
|
| (In millions of Canadian dollars) |
|
Dec 31, 2016 |
|
|
Dec 31, 2015 |
|
|
$ Change |
|
|
% Change |
| Total current assets |
|
|
1,582.5 |
|
|
|
951.4 |
|
|
|
631.1 |
|
|
66.3% |
| Property and equipment |
|
|
213.9 |
|
|
|
158.1 |
|
|
|
55.8 |
|
|
35.3% |
| Goodwill |
|
|
1,828.1 |
|
|
|
966.5 |
|
|
|
861.6 |
|
|
89.1% |
| Intangible assets |
|
|
449.5 |
|
|
|
138.1 |
|
|
|
311.4 |
|
|
225.5% |
| Deferred tax assets |
|
|
26.2 |
|
|
|
11.3 |
|
|
|
14.9 |
|
|
131.9% |
| Other financial assets |
|
|
160.1 |
|
|
|
111.5 |
|
|
|
48.6 |
|
|
43.6% |
| All other assets |
|
|
24.4 |
|
|
|
5.0 |
|
|
|
19.4 |
|
|
n/m |
| |
|
|
|
|
| Total assets |
|
|
4,284.7 |
|
|
|
2,341.9 |
|
|
|
1,942.8 |
|
|
83.0% |
|
|
|
|
|
| Long-term debt |
|
|
91.9 |
|
|
|
133.1 |
|
|
|
(41.2 |
) |
|
(31.0%) |
| Provisions |
|
|
36.0 |
|
|
|
22.9 |
|
|
|
13.1 |
|
|
57.2% |
| All other current liabilities |
|
|
944.9 |
|
|
|
476.1 |
|
|
|
468.8 |
|
|
98.5% |
| Total current liabilities |
|
|
1,072.8 |
|
|
|
632.1 |
|
|
|
440.7 |
|
|
69.7% |
|
|
|
|
|
| Long-term debt |
|
|
928.6 |
|
|
|
232.3 |
|
|
|
696.3 |
|
|
299.7% |
| Provisions |
|
|
80.7 |
|
|
|
62.6 |
|
|
|
18.1 |
|
|
28.9% |
| Net employee defined benefit liability |
|
|
50.5 |
|
|
|
- |
|
|
|
50.5 |
|
|
- |
| Deferred tax liabilities |
|
|
79.6 |
|
|
|
21.3 |
|
|
|
58.3 |
|
|
273.7% |
| Other liabilities |
|
|
88.4 |
|
|
|
67.7 |
|
|
|
20.7 |
|
|
30.6% |
| Other financial liabilities |
|
|
7.6 |
|
|
|
2.6 |
|
|
|
5.0 |
|
|
192.3% |
| Equity |
|
|
1,975.7 |
|
|
|
1,323.3 |
|
|
|
652.4 |
|
|
49.3% |
| Non-controlling
interests |
|
|
0.8 |
|
|
|
- |
|
|
|
0.8 |
|
|
- |
|
|
|
|
|
| Total liabilities and equity |
|
|
4,284.7 |
|
|
|
2,341.9 |
|
|
|
1,942.8 |
|
|
83.0% |
| n/m = not meaningful |
|
|
|
|
|
|
|
|
|
|
|
|
|
|
Refer to the Liquidity and Capital Resources section of this report for an explanation of the changes in current assets and
current liabilities.
Overall, the carrying amounts of assets and liabilities for our US subsidiaries on our consolidated balance sheets decreased because
of the strengthening Canadian dollar—from US$0.72 at December 31, 2015, to US$0.74 at December 31, 2016. Other factors that impacted our long-term assets and liabilities are indicated below.
Property and equipment, goodwill, intangible assets, and other financial assets increased as a result of the acquisitions completed in 2016. Most notably,
from MWH, we acquired $46.2 million in property and equipment, $744.2 million in goodwill, $315.3 million in intangible assets, and $36.1 million in other financial assets
|
|
|
|
|
| Management’s Discussion and Analysis
December 31, 2016 |
|
M-46 |
|
Stantec Inc. |
mainly relating to holdbacks on long-term contracts. Other financial assets also increased due to an increase of $14.7 million in our investments held for self-insured liabilities.
Total current and long-term debt increased, mainly because funds drawn from our New Credit Facilities (explained in the Capital Management section of this
report) were required for the MWH acquisition. Total current and long-term provisions increased as well, primarily because we assumed provisions for claims and various
end-of-employment benefit plans from MWH. Also from MWH we assumed $18.6 million in net deferred tax liabilities and $19.9 million in other liabilities due to
uncertain tax positions. With the MWH acquisition, we became the sponsor of defined benefit pension plans covering certain full-time employees and past employees, primarily in the United Kingdom. The $50.5 million net employee defined benefit
liability represents the unfunded status of these plans at December 31, 2016. Benefits are based on final compensation and years of service, and contributions to the plans must be made to separately administered funds that are maintained
independently by custodians.
Goodwill
In accordance with our
accounting policies (described in note 4 of our audited consolidated financial statements), we conduct a goodwill impairment test annually as at October 1 or more frequently if circumstances indicate that an impairment may occur or if a
significant acquisition occurs between the annual impairment test date and December 31.
We allocate goodwill to our cash generating units (CGUs) or group
of CGUs. In 2015 and prior to the second quarter of 2016, our CGUs were defined as Canada, the United States and International. As a result of the MWH acquisition, and effective the second quarter of 2016, we have six CGUs. Three of the six CGUs are
grouped into Consulting Services – Global for the purposes of allocating goodwill and testing impairment. The other three CGUs are Consulting Services – Canada, Consulting Services – United States, and Construction Services. CGUs are
defined based on the smallest identifiable group of assets that generates cash inflows that are largely independent of cash inflows from other assets or groups of assets. Other factors are considered, including how management monitors the
entity’s operations. As a Company, we constantly evolve and continue to expand into new geographic locations. As we evolve, we regularly review our corporate and management structure to ensure our operations are organized into logical units,
particularly for making operating decisions and assessing performance. If we determine that our corporate and management structure should change, we review our definitions of CGUs and reportable segments. We do not allocate goodwill to or monitor it
by our business operating units.
On October 1, 2016, and October 1, 2015, we performed our annual goodwill impairment test. Based on the
results of these tests, we concluded that the recoverable amount of each CGU or group of CGUs exceeded its carrying amount and, therefore, goodwill was not impaired.
Valuation techniques
When performing our goodwill
impairment test, we compare the recoverable amount of our CGUs or group of CGUs to their respective carrying amounts. If the carrying amount of a CGU or group of CGUs is higher than its recoverable amount, an impairment charge is recorded as a
reduction in the carrying amount of the goodwill on the consolidated statement of financial position and recognized as a non-cash impairment charge in income. We estimate the recoverable amount by using the
fair value less costs of disposal approach. It estimates fair value using market information and discounted after-tax cash flow projections, which is known as the income approach. The income approach uses a
CGU’s or group of CGUs’ projection of estimated operating results and discounted cash flows based on a discounted rate that reflects current market conditions.
We use cash flow projections from financial forecasts approved by senior management for a five-year period. For our last two impairment tests on
October 1, 2016, and October 1, 2015, we discounted the cash flows for each
|
|
|
|
|
| Management’s Discussion and Analysis
December 31, 2016 |
|
M-47 |
|
Stantec Inc. |
CGU or group of CGUs using after-tax discount rates ranging from 9.0% to 13.7%. To arrive at cash flow projections, we use estimates of economic and market
information, including growth rates in revenues, estimates of future changes in operating margins, and cash expenditures. Other significant estimates and assumptions include estimates of future capital expenditures and changes in future working
capital requirements.
We believe that our methodology provides us with a reasonable basis for determining whether an impairment charge should be taken.
Note 11 in our 2016 audited consolidated financial statements provides more details about our goodwill impairment test and is incorporated by reference in this report.
If market and economic conditions deteriorate or if volatility in the financial markets causes declines in our share price, increases our weighted-average
cost of capital, or changes valuation multiples or other inputs to our goodwill assessment, our goodwill may require testing for impairment between our annual test dates. Moreover, changes in the numerous variables associated with the judgments,
assumptions, and estimates we made in assessing the fair value of our goodwill could cause our CGUs or group of CGUs to be impaired. These impairments are non-cash charges that could have a material adverse
effect on our consolidated financial statements but would not have any adverse effect on our liquidity, cash flows from operating activities, or debt covenants, and would not have an impact on future operations.
Sensitivity
The calculation of fair value less
costs of disposal for all of our CGUs or group of CGUs is most sensitive to the following assumptions:
| • |
|
Operating margins based on actual experience and management’s long-term projections. |
| • |
|
Discount rates—reflecting investors’ expectations when discounting future cash flows to a present value—that take into consideration market rates of return, capital structure, company size, and industry
risk. This rate is further adjusted to reflect risks specific to the CGU or group of CGUs for which future estimates of cash flows have not been adjusted. |
| • |
|
Growth rate estimates based on actual experience and market analysis. Projections are extrapolated beyond five years using a growth rate that typically does not exceed 3.0%. |
At October 1, 2016, the recoverable amounts of our CGUs or group of CGUs exceeded their carrying amounts. For assessing fair value less costs of
disposal, we believe that no reasonably possible change in any key assumption listed above would have caused the carrying amount of a CGUs or group of CGUs to materially exceed its recoverable amount.
LIQUIDITY AND CAPITAL RESOURCES
The following discussion includes
forward-looking statements. For an outline of the material risks and assumptions associated with these statements, refer to the Cautionary Note Regarding Forward-Looking Statements section at the end of this report.
We are able to meet our liquidity needs through a variety of sources, including cash generated from operations, long- and short-term borrowings from our
$800 million revolving credit facility, and the issuance of common shares. We use funds primarily to pay operational expenses; complete acquisitions; sustain capital spending on property, equipment, and software; repay long-term debt; and pay dividend distributions to shareholders.
We believe that internally generated cash flows,
supplemented by borrowings, if necessary, will be sufficient to cover our normal operating and capital expenditures. We also believe that the design of our business model (explained in the Core Business and Strategy section of this report) reduces
the impact of changing market conditions on our operating cash flows. However, under certain favorable market conditions, we do consider
|
|
|
|
|
| Management’s Discussion and Analysis
December 31, 2016 |
|
M-48 |
|
Stantec Inc. |
issuing common shares to facilitate acquisition growth or to reduce borrowings under our New Credit Facilities. This was the case for the MWH acquisition: we financed the acquisition through the
net proceeds of both a public offering and funds drawn from our New Credit Facilities (as defined and further described in the Capital Management and Shareholders’ Equity sections of this report).
We continue to limit our exposure to credit risk by placing our cash and short-term deposits in—and, when appropriate, by entering into derivative
agreements with—high-quality credit institutions. Investments held for self-insured liabilities include bonds, equities, and term deposits. We mitigate risk associated with these bonds, equities, and term deposits through the overall quality
and mix of our investment portfolio.
Working Capital
The
following table shows summarized working capital information as at December 31, 2016, compared to December 31, 2015:
|
|
|
|
|
|
|
|
|
|
|
| (In millions of Canadian dollars, except ratio) |
|
2016 |
|
|
2015 |
|
|
$ Change |
|
|
|
|
| Current assets |
|
|
1,582.5 |
|
|
|
951.4 |
|
|
631.1 |
| Current liabilities |
|
|
(1,072.8) |
|
|
|
(632.1) |
|
|
(440.7) |
| Working capital (Note) |
|
|
509.7 |
|
|
|
319.3 |
|
|
190.4 |
| Current ratio (Note) |
|
|
1.48 |
|
|
|
1.51 |
|
|
n/a |
| Note: Working capital is calculated
by subtracting current liabilities from current assets. Current ratio is calculated by dividing current assets by current liabilities. Both non-IFRS measures are further described in the Definitions section of
this report. n/a= not applicable |
Current assets increased primarily because of a $143.6 million increase in cash and cash equivalents (further explained
in the Cash Flows section of this report), a $428.6 million increase in trade and other receivables and in unbilled revenue, and a $33.3 million increase in prepaid expenses, all primarily due to the MWH acquisition. Investment in trade
and other receivables and in unbilled revenue decreased to 88 days at December 31, 2016, from 96 days at December 31, 2015. A decrease occurred in all business operating units in Consulting Services. As well, our newly acquired
Construction Services business has lower overall investment in trade and other receivables and in unbilled revenue—59 days at December 31, 2016. Income taxes recoverable increased by $27.0 million, mainly because of the timing of
income tax instalments for 2015 and 2016 and the MWH acquisition.
Gross revenue trade receivables increased 32.6%, or $189.2 million, from
December 31, 2015, to December 31, 2016, mainly due to the addition of MWH, which made up approximately $231.0 million of our gross trade receivables at December 31, 2016. During the year, our gross trade receivables in the over-90-day aging categories increased 47.3% or $43.1 million. This increase was due to the nature of clients acquired from MWH, which added $58.6 million in the over-90-day aging categories. Approximately 25% of this amount is from two major government water projects where the collection period has historically been longer. The
remaining amount relates to the mix of clients where, in certain cases, extended payment terms may apply. This mix of clients may impact our trade receivables aging categories going forward. We reduce our gross revenue trade receivables with an
allowance for doubtful accounts that is calculated using historical statistics for collection and loss experience. We also allow for specific projects based on our best estimate of an allowance after assessing the collectability of the outstanding
receivables balance.
Current liabilities increased primarily due to a $366.0 million increase in trade and other payables that is mainly
attributable to the MWH acquisition, higher payroll accruals because of an increase in employee numbers, and a higher dividend accrual. In addition, billings in excess of costs increased $92.6 million and provisions increased
|
|
|
|
|
| Management’s Discussion and Analysis
December 31, 2016 |
|
M-49 |
|
Stantec Inc. |
$13.1 million, mostly a result of the MWH acquisition. These increases were partly offset by a decrease in the current portion of long-term debt because our $70 million in senior
secured notes (originally due May 10, 2016) were redeemed in Q2 16 as part of the New Credit Facilities arrangement. Our current portion of long-term debt was also impacted by an increase in the current portion of notes payable from
acquisitions.
Cash Flows
Our cash flows from (used in)
operating, investing, and financing activities, as reflected in our consolidated statements of cash flows, are summarized in the following table:
|
|
|
|
|
|
|
|
|
|
|
| (In millions of Canadian dollars) |
|
2016 |
|
|
2015 |
|
|
$ Change |
|
|
|
|
| Cash flows from operating activities |
|
|
285.7 |
|
|
|
205.5 |
|
|
80.2 |
| Cash flows used in investing activities |
|
|
(1,136.6) |
|
|
|
(252.4) |
|
|
(884.2) |
| Cash flows from (used in) financing
activities |
|
|
995.1 |
|
|
|
(44.3) |
|
|
1,039.4 |
Cash flows from operating activities
Cash flows from operating activities are impacted by the timing of acquisitions, particularly the timing of payments for acquired trade and other payables,
including annual employee short-term incentive payments. The increase in cash flows from operating activities in 2016 compared to 2015 resulted from an increase in cash receipts from clients due to acquisition growth and a $16.4 million
decrease in taxes paid as a result of paying less in tax instalments. The increase in cash flows was partly offset by an increase in cash paid to employees, which, in turn, was caused by an increase in the number of employees and short-term
incentive payments in 2016. As well, cash paid to suppliers increased because of acquisition growth and the timing of various payments. Interest paid increased $19.7 million, mainly as a result of a $3.9 million breakage fee relating to
the redemption of our senior secured notes and an increase in our level of borrowings year over year.
Cash flows used in investing activities
Cash flows used in investing activities increased in 2016 compared to 2015 due to an increase in cash used for business acquisitions. We used
$1.1 billion in 2016 to pay cash consideration for current year acquisitions (mainly for MWH) and notes payable compared to $203.5 million in 2015. Cash outflows for the purchase of property and equipment increased by $20.2 million.
Property and equipment and software purchases totaled $65.8 million in 2016 compared to $41.7 million for the same period in 2015. We had higher purchases in 2016 due to an increase in leasehold improvements made to various office
locations and increased spending due to acquisition growth. Also contributing to the increase in cash flows used was a $4.6 million increase in the purchase of investments held for self-insured liabilities. These increases in cash flows used in
investing activities were partly offset by a $9.3 million increase in cash inflows from other financial assets that mainly related to the liquidation of a trust acquired from MWH. As well, there was a $5.6 million increase in proceeds from
lease inducements and from the disposition of various property and equipment.
Cash flows from financing activities
Cash flows from financing activities increased in 2016 compared to 2015, as a result of a net cash inflow of $583.1 million from the issuance of shares,
plus a net cash inflow of $490.7 million from the settlement of our old revolving credit facility and senior secured notes and from funds drawn on our new revolving credit facility and term loans (as further described in the Shareholders’
Equity and Capital Management sections of this report). These increases in cash inflows were partly offset by $18.2 million paid for the repurchase of shares for
|
|
|
|
|
| Management’s Discussion and Analysis
December 31, 2016 |
|
M-50 |
|
Stantec Inc. |
cancellation under our Normal Course Issuer Bid and a $7.8 million increase in the payment of dividends in 2016 compared to 2015.
Financing the MWH Acquisition
The following table provides a
description of the actual sources and uses of funds relating to the MWH acquisition, transaction costs, and the repayment of the existing revolving credit facility and senior secured notes compared to the estimates made in the prospectus filed on
April 7, 2016.
|
|
|
|
|
|
|
|
|
|
|
|
|
|
|
|
|
|
|
|
|
|
|
|
|
|
|
| (In millions of Canadian dollars) |
|
|
|
|
|
|
|
|
|
|
|
|
|
|
|
|
|
|
|
|
| Sources: |
|
Prospectus |
|
|
Actual |
|
|
Variance |
|
|
Uses: |
|
Prospectus |
|
|
Actual |
|
|
Variance |
|
| |
|
|
|
|
| New term loan |
|
|
450.0 |
|
|
|
450.0 |
|
|
|
0.0 |
|
|
Net purchase price for the MWH acquisition |
|
|
1,057.0 |
|
|
|
999.4 |
|
|
|
(57.6) |
|
| New revolving credit facility |
|
|
454.0 |
|
|
|
439.6 |
|
|
|
(14.4) |
|
|
Transaction costs (note) |
|
|
56.0 |
|
|
|
53.3 |
|
|
|
(2.7) |
|
| Proceeds from the offering |
|
|
504.0 |
|
|
|
603.9 |
|
|
|
99.9 |
|
|
Repayment of MWH indebtedness |
|
|
73.0 |
|
|
|
109.9 |
|
|
|
36.9 |
|
|
|
|
|
|
|
|
|
|
|
|
|
|
|
Repayment of existing revolving credit |
|
|
97.0 |
|
|
|
205.9 |
|
|
|
108.9 |
|
|
|
|
|
|
|
|
|
|
|
|
|
|
|
Redemption of senior secured notes |
|
|
125.0 |
|
|
|
125.0 |
|
|
|
0.0 |
|
|
|
|
|
|
|
|
|
|
|
|
| Total Sources: |
|
|
1,408.0 |
|
|
|
1,493.5 |
|
|
|
85.5 |
|
|
Total Uses: |
|
|
1,408.0 |
|
|
|
1,493.5 |
|
|
|
85.5 |
|
|
|
|
|
|
|
|
|
|
|
|
note: Actual transaction costs consist of share issuance costs of $25.9 million, debt issuance costs of
$9.4 million, acquisition-related costs of $14.1 million, and breakage fees on redemption of senior secured notes of $3.9 million.
Our
actual sources of cash were $85.5 million greater than estimated, for the most part a result of the underwriters exercising their overallotment option of 2,604,000 subscription receipts for $78.8 million. Our uses of cash were greater than
estimated mainly because the outstanding balances at May 6, 2016, on our existing revolving credit facility and MWH’s indebtedness were greater than those included in the prospectus (which was based on December 31, 2015, balances).
The purchase price for MWH was less than anticipated because the estimated US exchange rate was higher than the actual exchange rate. The foreign currency hedge on the purchase price is further described in the Foreign Exchange Losses and Gains
section of this report.
Capital Management
We manage our
capital structure according to our internal guideline of maintaining a net debt to EBITDA ratio of less than 2.5 to 1.0. At December 31, 2016, our net debt to EBITDA ratio was 2.38, calculated on a trailing four-quarter basis. There may be
occasions when we exceed our target by completing opportune acquisitions that increase our debt level for a period of time.
Concurrent with the closing
of the MWH acquisition, we entered into an agreement for new $1.25 billion syndicated senior secured credit facilities (New Credit Facilities) consisting of a senior secured revolving credit facility of a maximum $800 million and a
$450 million term loan in three tranches. This agreement allows us access to an additional $200 million, subject to approval, under the same terms and conditions. The revolving credit facility expires May 6, 2020, and may be repaid
from time to time at our option. The facility is available for future acquisitions, working capital needs, and general corporate purposes. Tranches A and B of the term loan were drawn in Canadian funds of $150 million each (due May 6,
2018, and May 6, 2019, respectively) and tranche C was drawn in US funds of $116.7 million (due May 6, 2020). Transaction costs of $9.4 million for the New Credit Facilities will be amortized over the life of the facilities.
The New Credit Facilities may be drawn in Canadian dollars as either a prime rate loan or a bankers’ acceptance; US dollars as either a US base rate
or a LIBOR advance; or, in the case of the revolving credit facility, in sterling or euros as a LIBOR advance; and by way of letters of credit. Depending on the form under which the credit facilities are accessed, rates of interest vary between
Canadian prime, US base rate, and LIBOR
|
|
|
|
|
| Management’s Discussion and Analysis
December 31, 2016 |
|
M-51 |
|
Stantec Inc. |
or bankers’ acceptance rates, plus specified basis points. The specified basis points vary—depending on our leverage ratio (a non-IFRS
measure)—from 0 to 175 for Canadian prime and US base rate loans, and from 100 to 275 for bankers’ acceptances, LIBOR advances, and letters of credit. As security for the obligations under these facilities, Stantec and certain of our
subsidiaries granted the lenders a first-ranking security interest over all present and after-acquired assets, property, and undertakings, subject to customary carve-outs.
The funds available under the revolving credit facility are reduced by any outstanding letters of credit issued pursuant to the facility agreement. At
December 31, 2016, $329.1 million was available in our revolving credit facility for future activities.
We previously entered into an agreement
for a $350 million revolving credit facility expiring August 31, 2018, that allowed us to access an additional $150 million under the same terms and conditions on approval from our lenders. This revolving credit facility was repaid
with the proceeds from the New Credit Facilities.
We previously issued $70 million of 4.332% senior secured notes due May 10, 2016, and
$55 million of 4.757% senior secured notes due May 10, 2018. These amounts were recorded net of transaction costs of $1.1 million. Interest on the senior secured notes was payable semi-annually in arrears on May 10 and
November 10 each year until maturity or the earlier payment, redemption, or purchase in full of the notes. The senior secured notes were redeemable by Stantec, in whole at any time or in part from time to time, at specified redemption
prices and subject to certain conditions required by the indenture, with an option for us to purchase the notes for cancellation at any time. The senior secured notes were redeemed with the proceeds from the New Credit Facilities described above.
The breakage fee paid on redemption was $3.9 million and was recorded in net interest expense.
We are subject to financial and operating covenants
related to our New Credit Facilities. Failure to meet the terms of one or more of these covenants constitutes a default, potentially resulting in accelerated repayment of our debt obligation. In particular, we are required to satisfy the
following at all times: (1) our leverage ratio must not exceed 3.0 to 1.0, except in the case of a material acquisition when our leverage ratio must not exceed 3.5 to 1.0 for a period of four complete quarters following the acquisition and
(2) our interest coverage ratio must not be less than 3.0 to 1.0. Leverage ratio and interest coverage ratio are defined in the Definition of Non-IFRS Measures section of this report.
During the first two quarters of 2016, we were also subject to financial and operating covenants related to our $350 million revolving credit facility
and senior secured notes. These facilities were repaid and redeemed, respectively, during the quarter ended June 30, 2016.
We were in compliance
with all of these covenants (both for our previous facilities that were repaid and redeemed in Q2 16 and for the New Credit Facilities) as at and throughout the year ended December 31, 2016.
|
|
|
|
|
| Management’s Discussion and Analysis
December 31, 2016 |
|
M-52 |
|
Stantec Inc. |
Shareholders’ Equity
Our shareholders’ equity increased by $652.4 million in 2016 and by $237.1 million in 2015. The following table summarizes the reasons for these
increases:
|
|
|
|
|
|
|
|
|
| (In millions of Canadian dollars) |
|
2016 |
|
|
2015 |
|
|
|
|
| Beginning shareholders’
equity |
|
|
1,323.3 |
|
|
|
1,086.2 |
|
|
|
|
| Net income for the year |
|
|
130.5 |
|
|
|
156.4 |
|
| Currency translation adjustments |
|
|
12.3 |
|
|
|
109.0 |
|
| Net unrealized gain on financial assets |
|
|
3.8 |
|
|
|
0.1 |
|
| Net realized gain on financial assets transferred to income |
|
|
(0.1) |
|
|
|
(4.5) |
|
| Realized exchange difference on a sale of a subsidiary |
|
|
- |
|
|
|
1.0 |
|
| Remeasurement losses on net employee defined benefit liability |
|
|
(14.4) |
|
|
|
- |
|
| Recognition of fair value of share-based compensation |
|
|
4.4 |
|
|
|
5.2 |
|
| Share options exercised for cash |
|
|
5.0 |
|
|
|
9.5 |
|
| Shares repurchased under Normal Course Issuer Bid |
|
|
(18.2) |
|
|
|
- |
|
| Shares issued, net of transaction costs |
|
|
578.1 |
|
|
|
- |
|
| Dividends declared |
|
|
(49.0) |
|
|
|
(39.6) |
|
|
|
|
| Total change |
|
|
652.4 |
|
|
|
237.1 |
|
|
|
|
| Ending shareholders’
equity |
|
|
1,975.7 |
|
|
|
1,323.3 |
|
We recorded a $12.3 million foreign exchange gain in our currency translation adjustments in other comprehensive income
in 2016 compared to a $109.0 million gain in 2015. These unrealized gains arose when translating our foreign operations into Canadian dollars. We do not hedge for this foreign exchange translation risk. The gain recorded during 2016 was caused
primarily by the strengthening of the US dollar compared to the Canadian dollar from the date we acquired MWH’s US-subsidiaries to December 31, 2016.
We hold investments for self-insured liabilities consisting of government and corporate bonds, equity securities, and term deposits. These investments are
classified as available for sale and are stated at fair value with the unrecognized gain or loss recorded in other comprehensive income. The unrealized gain on the fair value of these investments was $3.8 million in 2016 and $0.1 million
in 2015.
Resulting from the MWH acquisition on May 6, 2016, we became the sponsor of defined benefit pension plans. During 2016, we recorded
$14.4 million in remeasurement losses on the net employee defined benefit liability in other comprehensive income, comprised of actuarial losses of $36.9 million and the return on plan assets of $19.5 million, net of deferred taxes of
$3.0 million.
Our board of directors grants share options as part of our incentive programs. In 2016, our board granted 995,904 share options
(965,064 in 2015) to various officers and employees of the Company. These options vest equally over a three-year period and have a contractual life of five years from the grant date. Share options exercised in 2016 generated $5.0 million in
cash compared to $9.5 million in 2015.
|
|
|
|
|
| Management’s Discussion and Analysis
December 31, 2016 |
|
M-53 |
|
Stantec Inc. |
In 2015, we filed a Normal Course Issuer Bid with the TSX that enabled us to purchase up to 3,774,179 common
shares during the period of November 10, 2015, to November 9, 2016. We believe that, at times, the market price of our common shares does not fully reflect the value of our business or future business prospects and that, at these times,
outstanding common shares are an attractive, appropriate, and desirable use of available Company funds. During 2016, 572,825 common shares were repurchased for cancellation pursuant to the ongoing Normal Course Issuer Bid at a cost of
$18.2 million. On November 9, 2016, we received approval from the TSX respecting the renewal of the Company’s Normal Course Issuer Bid that enables us to purchase up to 3,418,357 common shares during the period November 14, 2016,
to November 13, 2017.
Through a public offering completed in Q2 16, we generated net cash proceeds of $578.1 million to finance the MWH
acquisition. On April 7, 2016, we filed a short-form prospectus with securities regulators in Canada and the United States to allow for the issuance of 17,360,000 in subscription receipts for $525.1 million, representing the right of the
holder to receive one common share upon closing of the acquisition. After share issuance costs of $22.8 million, our net proceeds were $502.3 million. The underwriters exercised their option to purchase an overallotment of 2,604,000
subscription receipts for $78.8 million under the same terms as above. After share issuance costs of $3.1 million, our net proceeds on the overallotment were $75.7 million. Therefore, the total price to the public, the issuance costs,
and our net proceeds were $603.9 million, $25.9 million, and $578.1 million, respectively.
Our board of directors has declared dividends
to common shareholders: $49.0 million in dividends were declared in 2016 and $39.6 million were declared in 2015.
OTHER
Outstanding Share Data
At December 31, 2016, there were
114,081,229 common shares and 3,655,020 share options outstanding. From January 1, 2017, to February 22, 2017, no shares were repurchased and cancelled under our Normal Course Issuer Bid, no share options were granted, 47,360 share options
were exercised, and 7,000 share options were forfeited. At February 22, 2017, there were 114,128,589 common shares and 3,600,660 share options outstanding.
Contractual Obligations
As part of our continuing operations, we
enter into long-term contractual arrangements from time to time. The following table summarizes the contractual obligations due on our long-term debt, operating and finance lease commitments, purchase and service obligations, and other liabilities
as at December 31, 2016:
|
|
|
|
|
|
|
|
|
|
|
|
|
|
|
|
|
|
|
|
|
| |
|
Payment Due by Period |
|
|
|
|
|
|
|
| (In millions of Canadian dollars) |
|
Total |
|
|
Less than
1 Year |
|
|
1–3 Years |
|
|
4–5 Years |
|
|
After
5 Years |
|
|
|
|
|
|
|
| Debt |
|
|
999.9 |
|
|
|
80.2 |
|
|
|
346.4 |
|
|
|
572.9 |
|
|
|
0.4 |
|
| Interest on debt |
|
|
81.6 |
|
|
|
30.3 |
|
|
|
45.3 |
|
|
|
6.0 |
|
|
|
- |
|
| Operating leases |
|
|
1,068.1 |
|
|
|
192.8 |
|
|
|
293.7 |
|
|
|
199.7 |
|
|
|
381.9 |
|
| Finance lease obligation |
|
|
23.1 |
|
|
|
12.8 |
|
|
|
8.9 |
|
|
|
1.4 |
|
|
|
- |
|
| Purchase and service obligations |
|
|
69.4 |
|
|
|
27.8 |
|
|
|
28.3 |
|
|
|
13.3 |
|
|
|
- |
|
| Other obligations |
|
|
44.7 |
|
|
|
5.5 |
|
|
|
13.0 |
|
|
|
1.1 |
|
|
|
25.1 |
|
|
|
|
|
|
|
| Total contractual obligations |
|
|
2,286.8 |
|
|
|
349.4 |
|
|
|
735.6 |
|
|
|
794.4 |
|
|
|
407.4 |
|
|
|
|
|
|
| Management’s Discussion and Analysis
December 31, 2016 |
|
M-54 |
|
Stantec Inc. |
For further information regarding the nature and repayment terms of our long-term debt, operating leases, and
finance lease obligations, refer to the Cash Flows Used in Financing Activities section of this report and notes 17 and 22 in our 2016 audited consolidated financial statements incorporated by reference in this report.
Our operating lease commitments include future minimum rental payments under non-cancellable agreements for office
space. Our purchase and service obligations include agreements to purchase future goods and services that are enforceable and legally binding. Our other obligations include amounts payable under our deferred share unit plan and amounts payable for
performance share units issued under our long-term incentive program. Failure to meet the terms of our operating lease commitments may constitute a default, potentially resulting in a lease termination payment, accelerated payments, or a penalty as
detailed in each lease agreement. The previous table does not include obligations to fund defined benefit pension plans although we make regular contributions. Funding levels are monitored regularly and reset with triennial funding valuations
performed for the pension plans’ board of trustees. The Company expects to contribute $11.8 million to the pension plans in 2017.
Off-Balance Sheet Arrangements
As at December 31, 2016, we had
off-balance sheet financial arrangements relating to letters of credit in the amount of $58.4 million that expire at various dates before January 2018. These—including the guarantee of certain office
rental obligations—were issued in the normal course of operations.
Also as part of the normal course of operations, our surety facilities allow for
the issuance of bonds for certain types of project work. As at December 31, 2016, $432.1 million in bonds—expiring at various dates before November 2020—were issued under these surety facilities. This is an increase of
$427.0 million from 2015, mainly due to the MWH acquisition, which requires the use of construction and performance bonds related mainly to our construction business. These bonds are intended to provide owners financial security regarding the
completion of their construction project in the event of default. As well as surety facilities, we had a bid bond facility that was cancelled in Q2 16 because we entered into the agreement for the New Credit Facilities.
In the normal course of business, we also provide indemnifications and, in limited circumstances, guarantees. These are granted on commercially reasonable
contractual terms and are provided to counterparties in transactions such as purchase and sale contracts for assets or shares, service agreements, and leasing transactions. We also indemnify our directors and officers against any and all claims or
losses reasonably incurred in the performance of their service to the Company to the extent permitted by law. These indemnifications may require us to compensate the counterparty for costs incurred through various events. The terms of these
indemnifications and guarantees will vary based on the contract, the nature of which prevents us from making a reasonable estimate of the maximum potential amount that could be required to pay counterparties. Historically, we have not made any
significant payments under such indemnifications or guarantees, and no amounts have been accrued in our consolidated financial statements with respect to these guarantees.
Financial Instruments and Market Risk
Fair value. As at
December 31, 2016, we value and record our financial instruments as follows:
| • |
|
Cash and cash equivalents and cash in escrow are classified as financial assets at fair value through profit and loss (FVPL) and are recorded at fair value, with realized and unrealized gains and losses reported in
income. |
| • |
|
Trade and other receivables are classified as receivables and are initially accounted for at fair value and subsequently adjusted for any allowance for doubtful accounts, with allowances reported in administrative and
marketing expenses. |
|
|
|
|
|
| Management’s Discussion and Analysis
December 31, 2016 |
|
M-55 |
|
Stantec Inc. |
| • |
|
Investments held for self-insured liabilities, consisting of bonds, equity securities, and term deposits, are classified as financial assets available for sale and are recorded at fair value, with accumulated unrealized
gains and losses reported in other comprehensive income until disposed of. At that time, the realized gains and losses are recognized in other income for equity securities and in net finance income for bonds and term deposits. Interest income is
recorded in finance income; dividends are recorded in other income. |
| • |
|
Trade and other payables are classified as other financial liabilities and recorded at fair value and subsequently recorded at amortized cost using the effective interest rate (EIR) method. Realized gains and losses are
reported in income. The EIR method discounts estimated future cash payments or receipts through the expected life of a financial instrument, thereby calculating the amortized cost and subsequently allocating the interest income or expense over the
life of the instrument. |
| • |
|
Long-term debts, including non-interest-bearing debts, are classified as loans and borrowings and are initially recorded at fair value and subsequently recorded at amortized cost
using the EIR method. EIR amortization and realized gains and losses are reported in net finance expense. |
All financial assets are
recognized initially at fair value plus directly attributable transaction costs, except for financial assets at FVPL, for which transaction costs are expensed. Purchases or sales of financial assets are accounted for at trade dates. All financial
liabilities are recognized initially at fair value and, in the case of loans and borrowings, net of directly attributable transaction costs.
After
initial recognition, the fair values of financial instruments are based on the bid prices in quoted active markets for financial assets and on the ask prices for financial liabilities. For financial instruments not traded in active markets, fair
values are determined using appropriate valuation techniques, which may include recent arm’s-length market transactions, reference to the current fair value of another instrument that is substantially the same, and discounted cash flow
analysis; however, other valuation models may be used. The fair values of derivatives are based on third-party indicators and forecasts. The fair values of cash and cash equivalents, cash in escrow, trade and other receivables, and trade and other
payables approximate their carrying amounts because of the short-term maturity of these instruments. The carrying amounts of bank loans approximate their fair values because the applicable interest rate is based on variable reference rates. The
carrying amounts of other financial assets and financial liabilities approximate their fair values.
Market risk. We are exposed to various market
factors that can affect our performance, primarily our currency and interest rates.
Currency
Our currency exchange rate risk results primarily from the following three factors:
| 1. |
A significant portion of our revenue and expenses is generated or incurred in US dollars; therefore, we are exposed to fluctuations in
exchange rates. To the extent that |
| |
• |
|
US-dollar revenues are greater than US-dollar expenses in a strengthening US-dollar environment, we
expect to see a positive impact on our income from operations |
| |
• |
|
US-dollar revenues are greater than US-dollar expenses in a weakening US-dollar environment, we
expect to see a negative impact on our income from operations |
This exchange rate risk primarily reflects, on an annual
basis, the impact of fluctuating exchange rates on the net difference between total US-dollar revenue and US-dollar expenses. Other exchange rate risk arises from the
revenue and expenses generated or incurred by subsidiaries located outside Canada and the United States. Our income from operations will be impacted by exchange rate fluctuations used in translating these revenues
|
|
|
|
|
| Management’s Discussion and Analysis
December 31, 2016 |
|
M-56 |
|
Stantec Inc. |
and expenses, and they are recorded in other comprehensive income. We do not hedge for this foreign exchange translation risk.
| 2. |
Foreign exchange fluctuations may also arise on the translation of the balance sheet of (net investment in) our US-based subsidiaries or other foreign subsidiaries where the
functional currency is different from the Canadian dollar, and they are recorded in other comprehensive income. We do not hedge for this foreign exchange translation risk. |
| 3. |
Foreign exchange gains or losses arise on the translation of foreign-denominated assets and liabilities (such as accounts receivable, accounts payable and accrued liabilities, and long-term debt) held in our Canadian,
US, and other foreign subsidiaries. We minimize our exposure to foreign exchange fluctuations on these items by matching US-dollar foreign currency assets with US-dollar
foreign currency liabilities and, when appropriate, by entering into forward foreign currency contracts. |
Although we may
buy or sell foreign currencies in exchange for Canadian dollars in accordance with our foreign exchange risk mitigation strategy, on occasion we may have a net exposure to foreign exchange fluctuations because of the timing of the recognition and
relief of foreign-denominated assets and liabilities. Based on a slight net exposure at December 31, 2016, we estimate that a 1.0% decrease in the exchange rates (with all other variables held constant) would have decreased net income by
$129,000. A 1.0% increase would have an equal and opposite impact on net income.
Interest rates
Changes in interest rates also present a risk to our performance. Our revolving credit facility carries a floating rate of interest. In addition, we are
subject to interest rate pricing risk to the extent that our investments held for self-insured liabilities contain fixed-rate government and corporate bonds and term deposits. We estimate that, based on our loan balance at December 31, 2016, a
0.5% increase in interest rates (with all other variables held constant) would have decreased net income by $2.4 million. A 0.5% decrease would have an equal and opposite impact on net income.
Price risk
We are subject to market price risk to
the extent that our investments held for self-insured liabilities contain equity funds. This risk is mitigated because the portfolio of equity funds is monitored regularly and is appropriately diversified. The effects of a 1.0% increase in equity
prices (with all other variables held constant) would have increased comprehensive income by $0.3 million. A 1.0% decrease would have an equal and opposite impact on comprehensive income.
Related-Party Transactions
We have subsidiaries that are 100%
owned and are consolidated in our financial statements. We also have management agreements in place with several structured entities to provide various services, including architecture, engineering, planning, and project management. Based on these
management agreements, we have assessed that we have control over the relevant activities, we are exposed to variable returns, and we can use our power to influence the variable returns; therefore, we control these entities and have consolidated
them in our consolidated financial statements. We receive a management fee generally equal to the net income of the entities and have an obligation regarding their liabilities and losses. Transactions among subsidiaries and structured entities are
entered into in the normal course of business and on an arm’s-length basis. Using the consolidated method of accounting, all intercompany balances are eliminated.
|
|
|
|
|
| Management’s Discussion and Analysis
December 31, 2016 |
|
M-57 |
|
Stantec Inc. |
From time to time, we enter into transactions with associated companies and other entities pursuant to a joint
arrangement. These transactions involve providing or receiving services and are entered into in the normal course of business and on an arm’s-length basis. Associated companies are entities over which we
are able to exercise significant influence but not control. A joint arrangement is classified as either a joint venture or joint operation, based on the rights and obligations arising from the contractual obligations between the parties to the
arrangement. A joint venture provides us with rights to the net assets of the arrangement. A joint operation provides us with rights to the individual assets and obligations.
We account for a joint operation by recognizing our share of assets, liabilities, revenues, and expenses of the joint operation and by combining them line by
line with similar items in our consolidated financial statements. We use the equity method of accounting for our associated companies and joint ventures. In 2016, the total sales to our associates were $11.9 million and distributions paid by
our associates were $0.5 million. At December 31, 2016, receivables from our associates were $2.4 million. Total sales to our joint ventures were $41.5 million and distributions paid by our joint ventures were $0.3 million
in 2016. At December 31, 2016, receivables from our joint ventures were $28.1 million.
From time to time, we guarantee the obligations of a
subsidiary or structured entities for lease agreements, service agreements, and obligations to a third party pursuant to an acquisition agreement. In addition, we may guarantee service agreements for associated companies, joint ventures, and joint
operations. Transactions with subsidiaries, structured entities, associated companies, joint ventures, and joint operations are further described in notes 13, 23, and 34 of our 2016 audited consolidated financial statements and are incorporated by
reference in this report.
Key management personnel have authority and responsibility for planning, directing, and controlling the activities of our
Company and include our CEO, CFO, COO, CBO, and executive vice presidents. Total compensation to key management personnel and directors recognized as an expense was $16.5 million in 2016 compared to $16.1 million in 2015.
Outlook
The following discussion
includes forward-looking statements. For an outline of the material risks and assumptions associated with these statements, refer to the Cautionary Note Regarding Forward-Looking Statements section.
The following table summarizes our expectations for the coming year:
|
|
|
| Measure |
|
2017 Target Range |
|
|
| Gross margin as a % of net revenue |
|
Between 53% and 55% |
| Administrative and marketing expenses as a % of net revenue |
|
Between 41% and 43% |
| EBITDA as a % of net revenue |
|
Between 11% and 13% |
| Net income as a % of net revenue
|
|
At or above 5.0%
|
As part of our annual budget process, we reviewed our targets for 2017. We determined our 2017 targets needed to be
reevaluated from that of our 2016 targets. Our 2016 targets were impacted because our capital structure changed and the MWH acquisition (in particular the addition of Construction Services) changed the mix of our projects and the locations where we
earn revenue.
|
|
|
|
|
| Management’s Discussion and Analysis
December 31, 2016 |
|
M-58 |
|
Stantec Inc. |
Actual performance for 2017 will fluctuate, particularly from quarter to quarter, depending on the mix of clients
and projects and seasonality, as well as the number of acquisitions completed in the year. Some targets could potentially be exceeded if we completed an opportune larger acquisition that, for instance, impacted our administrative and marketing
expenses or temporarily increased our debt level.
The diverse infrastructure and facilities market consists of many sectors and industries in both the
public and private sectors. Clients within this market require services from multiple disciplines and areas of expertise for projects of varying complexities across the project life cycle. Market size is affected by many factors, including capital
spending plans of private sector clients, government allocations to infrastructure, and the range of alternative project delivery (APD) methods in certain sectors. Our footprint in global markets has increased because of the MWH acquisition.
For 2017, our outlook was determined based on various expectations, including the following:
| • |
|
Continued economic improvement in the United States as we build a top-tier position and as growth in non-residential construction remains strong |
| • |
|
Increased infrastructure through regulatory support and spending by provincial, state, and federal governments in North America |
| • |
|
Increased spending in the water and wastewater sector that is supported by increased government spending in this sector |
| • |
|
Modest improvement in the energy and resource sector compared to 2016 because oil and gas and commodity prices are expected to stabilize and slowly improve and companies are expected to increase capital spending
|
| • |
|
Continued support for APD methods, including P3s, in Canada, and new opportunities for APD in the United States |
| • |
|
Moderate slowdown in the Canadian housing market and strong housing growth in the United States |
| • |
|
Modest global economic growth and our ability to expand our global footprint |
In addition to these
expectations, we base our outlook on successfully capitalizing on opportunities and strategic initiatives (described in the Strategy section, Geographic Opportunities subsection of this report). Further details regarding our expectations are
described below.
GEOGRAPHIC OUTLOOK
Canada
In 2017, we believe we will benefit from increased levels of federal government infrastructure spending, positively impacting our Buildings, Infrastructure,
and Water business operating units. We believe this will be offset by an expected slowdown in residential construction and persistent weakness in the oil and gas and mining sectors.
We anticipate growth in government infrastructure spending, driven by increased fiscal stimulus from the federal government and significant commitments from
key provinces in recent budgets. For instance, in its Fall Economic Statement on October 31, 2016, the Canadian federal government earmarked $81 billion additional investment in public infrastructure over the next 11 years, bringing the
total expected infrastructure spending to $180 billion over that period. Over the next five years, public transit, water and wastewater infrastructure, and affordable housing will receive the greatest amount of this public infrastructure
investment.
We anticipate a slowdown in the Canadian housing market based on recently enacted market cooling measures from both the BC and federal
governments, declining housing affordability, elevated debt to income levels, and increasing mortgage rates. However, we expect strong building activity to persist in the Greater Vancouver and Toronto markets since the sharp increase in housing
prices in 2016 may provide a strong incentive for the market to increase supply.
|
|
|
|
|
| Management’s Discussion and Analysis
December 31, 2016 |
|
M-59 |
|
Stantec Inc. |
We expect P3 projects will continue to be released and that we will continue to secure our share of these
projects in a highly competitive market.
We expect modest increases in capital spending in the oil and gas sector. We believe this will be supported by
increases in oil and gas prices, more cost certainty as the Alberta government rolls out its Climate Leadership Plan, and accommodating federal government policy decisions, including the approval of various energy infrastructure projects.
The non-energy export sector is expected to benefit from the weak Canadian dollar and strong US demand, thereby
supporting increased capital investment. However, the new US administration may cast a cloud of uncertainty over this sector given the protectionist and anti-trade position; this could dampen spending until greater clarity is achieved on the status
of US-Canada trade relations going forward.
Other factors: Overall, the following factors support our
outlook for 2017:
| • |
|
GDP growth is projected to be 2.0% in 2017, according to the Bank of Canada |
| • |
|
The overnight interest rate target—currently at 0.50%—is expected to remain at this level in 2017 |
| • |
|
The unemployment rate—6.9% at the end of 2016—is not expected to change significantly in 2017 |
| • |
|
According to the US Energy Information Administration, the price of WTI crude oil is expected to average $52.50 in 2017 compared to an average of $43.33 in 2016, and US crude oil production is expected to average
9.0 million barrels a day in 2017 compared to an average of 8.9 million barrels a day in 2016 |
| • |
|
The Canadian dollar is expected to remain stable or depreciate from its current level given the anticipated increases in the US federal funds rate |
| • |
|
As suggested by the Canadian Mortgage and Housing Corporation, total housing starts are expected to remain stable; single family housing starts are expected to range from 174,500 to 184,300 units in 2017, down modestly
from 2016 |
United States
The US economy is
expected to continue to expand in 2017, supported by a strong job market, wage growth, and increasing personal consumption expenditure. This, in turn, may positively impact our Buildings, Infrastructure, and Water business operating units.
We believe the outlook for water and wastewater infrastructure spending is increasingly optimistic since the federal government approved the Water
Infrastructure Improvements for the Nation (WIIN) Act in December 2016. This Act authorizes approximately $10 billion for stormwater management, alternative water supply, and port, levee and dam projects. We also expect increased construction
spending in the water and wastewater market. This spending will be supported by improving municipal government balance sheets that increase the likelihood of new projects receiving necessary funding and by increased single family home construction
that increase the need for water supply upgrades and expansions.
We expect spending growth in our Transportation sector because of increased funding from
the recent passage of the FAST Act—a new multiyear federal transportation bill enacted on December 4, 2015—which authorizes $305 billion in new funding over five years: $230 billion for highways, $60 billion for public
transit, $10 billion for Amtrak, and $5 billion for highway safety programs.
We anticipate educational construction spending to grow in 2017.
In 2015 and 2016, various bond measures for K-12 construction projects were passed to support infrastructure investment in key regions where we operate. We anticipate higher education construction spending
growth will be modest over the near term because enrollment rates have slowed and endowment returns were lower than what was achieved in previous years.
|
|
|
|
|
| Management’s Discussion and Analysis
December 31, 2016 |
|
M-60 |
|
Stantec Inc. |
Healthcare construction spending over the past five years was relatively flat because asset owners held back
investment given the various congressional challenges that faced the Patient Protection and Affordable Care Act (PPACA), introduced in 2015. We expect that healthcare construction spending growth will be modest until greater clarity in healthcare
reform is achieved. A rapidly aging population, the need to replace aging facilities, and constant technological changes support an optimistic outlook over the longer term for the healthcare construction sector.
In our Environmental Services operations, with expected increases in infrastructure and construction-related spending, we believe we are well positioned to
support growth in the power, transportation, community development, and water sectors. Our ability to adapt could also serve us well as we navigate regulatory changes that may occur under the new federal administration.
In the power generation subsector, the fundamentals over the medium term are positive, with aging infrastructure and coal-to-gas switching driving new investment. For construction in the power transmission and distribution subsector, despite significant investment in new renewable energy projects that must be tied in the
grid, the combination of lower demand for electricity and the retirement of large-scale coal and nuclear projects resulted in a decreased need for transmission or distribution additions over the near term. We expect spending to increase modestly in
this subsector over the next several years, supported by the need to tie new natural gas-fired power plant and renewable energy projects to the electrical grid and to improve the efficiency and reliability of
the North American transmission and distribution network.
The housing market is expected to have positive momentum, with persistently low interest rates,
a strong job market, and growth in household formation all supporting increasing residential construction spending.
The following factors support our
outlook for 2017:
| • |
|
Real GDP growth is projected to increase to 2.4% in 2017, according to the US Congressional Budget Office |
| • |
|
The Federal Reserve is expected to gradually increase the federal funds rate in 2017 |
| • |
|
The unemployment rate—4.7% at the end of 2016—is expected to be at or around this level throughout 2017 |
| • |
|
In recent months, the Architecture Billings Index (ABI) from the American Institute of Architects has remained around 50.0, suggesting stable demand for design services; we anticipate that it will largely remain above
50.0 throughout 2017 as nonresidential construction continues to trend upwards toward pre-recession levels |
| • |
|
Housing activity is expected to remain positive in 2017; the seasonally adjusted annual rate of total housing starts is expected to increase to 1,239,000 from the expected 1,162,000 total housing starts in 2016
|
Global
Following the acquisition of MWH,
Stantec has an expanded presence in the United Kingdom, New Zealand, India, Australia, Peru, Chile, Argentina, the Netherlands, Italy, and the Middle East. The vast majority of our staff in India service projects that are outside of India.
In the United Kingdom, Brexit has injected uncertainty into financial markets as analysts begin to assess its implications. Over the near term, we believe
companies operating in the United Kingdom can expect higher costs of capital, lower economic growth, and deteriorating government balance sheets. Economic growth has held up following the Brexit vote, and PwC is now forecasting real GDP growth of
1.2% in 2017. We expect our operations in the UK water market to be insulated from the Brexit-related uncertainty because service providers have already gone through the bidding process for the Asset Management Program 6 project cycle (which runs
from April 2015 to March 2020) and therefore have largely secured their workload over the next several years.
|
|
|
|
|
| Management’s Discussion and Analysis
December 31, 2016 |
|
M-61 |
|
Stantec Inc. |
We believe the economic outlook for New Zealand is positive—the Australia and New Zealand Banking Group
(ANZ) has forecasted GDP growth of 3.3% in 2017 and 2.4% in 2018. Growth is expected to be supported by a stable housing market, a booming tourism sector, a modest increase in consumer spending, and solid export growth.
We anticipate that Australia’s economy will continue to be adversely impacted by low commodity prices and weaker Chinese demand. However, the general
economic outlook is positive, supported by low interest rates, growth in housing construction, accelerating public sector spending, and modest non-mining business investment. The Reserve Bank of Australia
forecasted GDP growth of 2.5% to 3.5% in 2017 and 3.0% to 4.0% in 2018.
The World Bank forecasted GDP growth in the Middle East and Northern Africa of
3.1% in 2017 and 3.5% in 2018 as governments in the region begin to reduce investment in response to declining government revenues and to undertake reforms to diversify their economies away from oil in light of the recent decline in prices.
The infrastructure construction market in the Netherlands is highly dependent on government investment and therefore is highly sensitive to the health of
public finances and, more indirectly, the strength of the broader economy. Both measures are currently positive: the Netherlands’ economy is gaining momentum and public finances are in good shape. Nevertheless, we believe growth is expected to
be modest as the need and appetite for new infrastructure in the country remains low. Specifically, utility construction is suffering from an imbalance of supply versus demand.
The Italian National Institute of Statistics is forecasting GDP growth of 0.9% in 2017, supported by renewed strength in the country’s job market and
accelerating residential household consumption expenditure. We expect to see growth in Italy’s construction sector as firms begin to respond to low interest rates, government reforms, and increased consumer spending and confidence.
Economic activity is expected to bottom out in Latin America in 2016, and we anticipate a modest recovery in 2017. Economic growth has been robust in Peru in
recent years, supported by expanding copper production, increased public spending, and accelerating household consumption. We expect that the recent upturn in copper prices will encourage increased investment in Peru’s mining sector over the
near term. Growth was weaker in Chile because the country’s economy experienced weakening export demand, lower commodity prices, and a deteriorating job market. We expect modest GDP growth in 2017 as a stronger global economy and higher
commodity prices support a recovery in business investment and private consumption.
The following factors support our outlook for 2017:
| • |
|
According to the World Bank, prices for most metals, minerals, and precious metals are expected to increase in 2017 compared to 2016 |
| • |
|
According to the World Bank, global GDP growth will be 2.7% in 2017 |
OVERALL OUTLOOK
Because of our diversity of operations, mix of clients, and flexible business model, as well as our ability to position our Company to work effectively in
local communities and on national opportunities, we believe that we will continue to operate our business efficiently, to adapt our business to changing economic conditions, and to position ourselves for growth in a very large infrastructure and
facilities market.
Going forward, we expect to achieve a long-term average annual compound growth rate for gross revenue of 15%—a target we have met
or exceeded since our initial public offering in 1994. This continued growth results from successfully executing our strategy by allowing us to enhance the depth of our expertise, broaden our service offerings, increase our geographic presence in
communities across North America and globally, provide expanded opportunities for our employees, and leverage our Integrated Management Systems. Further maximizing the
|
|
|
|
|
| Management’s Discussion and Analysis
December 31, 2016 |
|
M-62 |
|
Stantec Inc. |
critical mass and maturity we have achieved in certain sectors and geographic locations also enables us to increase our business with key clients and sell our services across local markets.
Our ability to expand depends on our strategic efforts to grow organically and the availability of acquisition opportunities. We believe our opportunities to
expand have increased given our greater global footprint resulting from the MWH acquisition. We do not expect to encounter constraints in 2017 when looking for available acquisition candidates, given our past success and the trend in our
industry—smaller firms wanting to join larger and more stable organizations. At any particular time, we discuss consolidation opportunities with many firms. Since we want an appropriate cultural fit and complementary services that can provide
an accretive transaction, the acquisition process can extend over months, even years.
Since the close of the MWH acquisition, we have focused our efforts
on addressing the alignment of our operations, and financial systems to facilitate external reporting and internal operational and financial management. We will integrate segments of MWH’s North American Consulting Services into Stantec’s
business systems during 2017. We expect to continue to review some of our Global operations, and that integration will begin later in 2017. Construction Services are not being integrated into Stantec’s Consulting Services platform and will be
reported as a separate segment of our business. Management believes that synergies associated with revenue opportunities and cross-selling capabilities, as well as back-office functions, are progressing and
expects that these synergies will be realized as we move through the integration phases.
To establish our budgets for 2017, we
| • |
|
Assumed that the average value of the Canadian dollar would be US$0.77 in 2017 |
| • |
|
Assumed that the average interest rate would remain relatively stable in 2017 compared to 2016 |
| • |
|
Considered the tax rates substantially enacted at December 31, 2016, for the countries we operate in (primarily Canada and the United States) to establish our effective income tax rate |
| • |
|
Expected to support our targeted level of growth using a combination of cash flows from operations and borrowings |
Critical Accounting Estimates, Developments, and Measures
CRITICAL ACCOUNTING ESTIMATES
The preparation of consolidated financial statements in accordance with IFRS requires us to make various judgments, estimates, and assumptions. Note 5 of our
December 31, 2016, consolidated financial statements outlines our significant accounting estimates and is incorporated by reference in this report.
The accounting estimates discussed in our consolidated financial statements are considered particularly important because they require the most difficult,
subjective, and complex management judgments. Accounting estimates are done for the following:
| • |
|
Revenue and cost recognition on contracts |
| • |
|
Allowance for doubtful accounts |
| • |
|
Provision for self-insured liabilities |
| • |
|
Share-based transactions |
| • |
|
Fair values on business combinations |
| • |
|
Assessment of impairment of non-financial assets |
| • |
|
Fair value of financial instruments |
| • |
|
Categorizing interests in other entities |
|
|
|
|
|
| Management’s Discussion and Analysis
December 31, 2016 |
|
M-63 |
|
Stantec Inc. |
Because of the uncertainties inherent in making assumptions and estimates regarding unknown future outcomes,
future events may result in significant differences between estimates and actual results. We believe that each of our assumptions and estimates is appropriate to the circumstances and represents the most likely future outcome.
Unless otherwise specified in our discussion of specific critical accounting estimates, we expect no material changes in overall financial performance and
financial statement line items to arise, either from reasonably likely changes in material assumptions underlying an estimate or within a valid range of estimates from which the recorded estimate was selected. In addition, we are not aware of
trends, commitments, events, or uncertainties that can reasonably be expected to materially affect the methodology or assumptions associated with our critical accounting estimates, subject to items identified in the Risk Factors, Outlook, and
Cautionary Note Regarding Forward-Looking Statements sections of this report.
ACCOUNTING DEVELOPMENTS
Recently Adopted
Effective January 1, 2016, we adopted the
following amendments:
| • |
|
Accounting for Acquisitions of Interests in Joint Operations (Amendments to IFRS 11) |
| • |
|
Annual Improvements (2012–2014 Cycle) |
| • |
|
Disclosure Initiative (Amendments to IAS 1) |
The adoption of these amendments did not have an impact on the
financial position or performance of our Company. Note 6 to our December 31, 2016, consolidated financial statements describes these amendments and is incorporated by reference in this report.
Future Adoptions
The listing below includes issued standards,
amendments, and interpretations that we reasonably expect to be applicable at a future date and intend to adopt when they become effective. We are currently assessing the impact of adopting these standards, amendments, and interpretations on our
consolidated financial statements and cannot reasonably estimate the effect at this time.
| • |
|
IFRS 15 Revenue from Contracts with Customers |
| • |
|
IFRS 9 Financial Instruments |
| • |
|
Recognition of Deferred Tax Assets for Unrealized Losses (Amendments to IAS 12) |
| • |
|
Disclosure Initiative (Amendments to IAS 7) |
| • |
|
Classification and Measurement of Share-based Payment Transactions (Amendments to IFRS 2) |
| • |
|
Annual Improvements (2014–2016 Cycle) |
| • |
|
IFRIC 22 Foreign Currency Transactions and Advance Consideration |
These standards, amendments, and
interpretations are described in note 6 of our December 31, 2016, consolidated financial statements and are incorporated by reference in this report.
MATERIALITY
We determine whether information is
“material” based on whether we believe that a reasonable investor’s decision to buy, sell, or hold securities in our Company would likely be influenced or changed if the information was omitted or misstated.
|
|
|
|
|
| Management’s Discussion and Analysis
December 31, 2016 |
|
M-64 |
|
Stantec Inc. |
DEFINITION OF NON-IFRS MEASURES
This Management’s Discussion and Analysis includes references to and uses terms that are not specifically defined in IFRS and do not have any standardized
meaning prescribed by IFRS. These measures and terms are working capital, current ratio, return on equity, EBITDA, net debt to EBITDA, leverage ratio, interest coverage ratio, backlog, adjusted EBITDA, and adjusted EPS. These non-IFRS measures may not be comparable to similar measures presented by other companies. We believe that the measures defined here are useful for providing investors with additional information to assist them in
understanding components of our financial results.
Working Capital. We use working capital as a measure for assessing overall liquidity. Working
capital is calculated by subtracting current liabilities from current assets. There is no directly comparable IFRS measure for working capital.
Current Ratio. We use current ratio as a measure for assessing overall liquidity. Current ratio is calculated by dividing current assets by current
liabilities. There is no directly comparable IFRS measure for current ratio.
Return on Equity. As part of our overall assessment of value added
for shareholders, we monitor our return on equity. Return on equity is calculated as net income for the last four quarters, divided by the average shareholders’ equity over each of the last four quarters. There is no directly comparable IFRS
measure for return on equity.
EBITDA. EBITDA represents net income before interest expense, income taxes, depreciation of property
and equipment, amortization of intangible assets, and goodwill and intangible impairment. This measure is referenced in our credit facility agreement as part of our debt covenants, and we use it as part of our overall assessment of our
operating performance. There is no directly comparable IFRS measure for EBITDA.
Net Debt to EBITDA. As part of our assessment of our capital
structure, we monitor net debt to EBITDA. This measure is referenced in our credit facility agreement as part of our debt covenants. It is defined as the sum of (1) long-term debt, including current portion, less cash and cash equivalents and
cash in escrow, divided by (2) EBITDA (as defined above). There is no directly comparable IFRS measure for net debt to EBITDA.
Leverage Ratio.
This ratio is referenced in our New Credit Facilities agreement as part of our debt covenants. It is defined as total indebtedness divided by EBITDA. Total indebtedness is defined in the credit facility agreement as including all obligations for
borrowed money; bonds, debentures, notes, or similar instruments; the deferred purchase price of property or services (excluding current accounts payable); and bankers’ acceptances; plus all of the following: obligations upon which interest is
customarily paid; obligations under conditional sale or other title retention agreements related to property acquired; indebtedness secured by liens on owned property; guarantees; capital lease obligations; letters of credit or guarantee; hedge
exposures; and obligations to purchase, redeem, retire, or otherwise acquire our equity securities. There is no directly comparable IFRS measure for leverage ratio.
Interest Coverage Ratio. This ratio is referenced in our New Credit Facilities agreement as part of our debt covenants. It is defined as EBITDA divided
by interest expense, including any interim amount payable pursuant to a hedge arrangement with respect to interest rate risk. There is no directly comparable IFRS measure for interest coverage ratio.
Backlog. As part of our assessment of our financial condition, we monitor our backlog. We define backlog as the total value of secured work that has
not yet been completed that
| • |
|
Is assessed by management as having a high certainty of being performed by either the existence of an executed contract or work order specifying the job scope, value, and timing, or |
|
|
|
|
|
| Management’s Discussion and Analysis
December 31, 2016 |
|
M-65 |
|
Stantec Inc. |
| • |
|
Has been awarded to us through an executed binding or nonbinding letter of intent or agreement describing the general job scope, value, and timing. Management must be reasonably assured that the letter of intent or
agreement will be finalized in the form of a formal contract. |
Only the first 12 to 18 months of the total value of secured work of a
project are included in work backlog.
Backlog is not a recognized performance measure under IFRS and does not have any standardized meaning prescribed by
IFRS. We believe that backlog is a useful means of projecting activity in future periods. There is no directly comparable IFRS measure for backlog.
We
currently use EBITDA as a measure of pretax operating cash flow. Management defines adjusted EBITDA and adjusted EPS as follows:
| • |
|
Adjusted EBITDA. This is EBITDA adjusted for acquisition-related costs, out-of-ordinary course severance, and gains or losses on
property and equipment, discontinued operations, and the rebalancing of our investments held for self-insured liabilities. There is no directly comparable IFRS measure for adjusted EBITDA; the most directly comparable measure is net income.
|
| • |
|
Adjusted EPS. This is earnings per share as prescribed by IFRS, adjusted to exclude the amortization of acquisition-related intangibles, acquisition-related costs, out-of-ordinary course severance, and gains or losses on property and equipment, discontinued operations, and the rebalancing of our investments held for self-insured liabilities. There is no directly
comparable IFRS measure for adjusted EPS; the most directly comparable measure is EPS. |
We believe adjusted EBITDA and adjusted EPS are
useful for providing securities analysts, investors, and other interested parties with additional information to assist them in understanding components of our financial results (including a more complete understanding of factors and trends
affecting our operating performance), and they provide supplemental measures of operating performance, thus highlighting trends that may not otherwise be apparent when relying solely on IFRS financial measures.
Below are reconciliations of net income to EBITDA and adjusted EBITDA and of EPS to adjusted EPS.
|
|
|
|
|
| Management’s Discussion and Analysis
December 31, 2016 |
|
M-66 |
|
Stantec Inc. |
|
|
|
|
|
|
|
|
|
|
|
|
|
|
|
|
|
|
|
|
|
| Reconciliation of Net Income to Adjusted EBITDA |
|
Quarter Ended
December 31 |
|
|
Year Ended
December 31 |
|
| (In thousands of Canadian dollars, except per share amounts) |
|
2016 |
|
|
2015 |
|
|
2016 |
|
|
2015 |
|
|
2014 |
|
|
|
|
|
|
|
| Net income for the period |
|
|
29,488 |
|
|
|
25,317 |
|
|
|
130,549 |
|
|
|
156,378 |
|
|
|
164,498 |
|
| Add back: |
|
|
|
|
|
|
|
|
|
|
|
|
|
|
|
|
|
|
|
|
| Income taxes |
|
|
10,965 |
|
|
|
5,516 |
|
|
|
50,267 |
|
|
|
55,229 |
|
|
|
58,702 |
|
| Net interest expense |
|
|
7,050 |
|
|
|
2,700 |
|
|
|
28,648 |
|
|
|
10,929 |
|
|
|
8,515 |
|
| Depreciation of property and equipment |
|
|
14,774 |
|
|
|
12,255 |
|
|
|
51,172 |
|
|
|
45,880 |
|
|
|
38,698 |
|
| Amortization of intangible assets |
|
|
20,651 |
|
|
|
8,762 |
|
|
|
75,660 |
|
|
|
37,853 |
|
|
|
24,252 |
|
| EBITDA |
|
|
82,928 |
|
|
|
54,550 |
|
|
|
336,296 |
|
|
|
306,269 |
|
|
|
294,665 |
|
|
|
|
|
|
|
| Acquisition-related costs |
|
|
25 |
|
|
|
212 |
|
|
|
14,548 |
|
|
|
755 |
|
|
|
978 |
|
| Loss (gain) on sale of property and equipment |
|
|
809 |
|
|
|
420 |
|
|
|
1,452 |
|
|
|
(1,888) |
|
|
|
- |
|
| Rebalancing of investments held for self-insured liabilities (note 4) |
|
|
- |
|
|
|
- |
|
|
|
- |
|
|
|
(4,156) |
|
|
|
- |
|
| Loss on sale of a subsidiary |
|
|
- |
|
|
|
4,096 |
|
|
|
- |
|
|
|
4,096 |
|
|
|
- |
|
|
Adjusted EBITDA |
|
|
83,762 |
|
|
|
59,278 |
|
|
|
352,296 |
|
|
|
305,076 |
|
|
|
295,643 |
|
| Reconciliation of EPS to Adjusted EPS |
|
Quarter Ended
December 31 |
|
|
Year Ended
December 31 |
|
| (In thousands of Canadian dollars, except per share amounts) |
|
2016 |
|
|
2015 |
|
|
2016 |
|
|
2015 |
|
|
2014 |
|
|
|
|
|
|
|
| Net income for the period |
|
|
29,488 |
|
|
|
25,317 |
|
|
|
130,549 |
|
|
|
156,378 |
|
|
|
164,498 |
|
| Add back: |
|
|
|
|
|
|
|
|
|
|
|
|
|
|
|
|
|
|
|
|
| Amortization of intangible assets related to acquisitions (note 1) |
|
|
10,320 |
|
|
|
3,843 |
|
|
|
39,022 |
|
|
|
18,399 |
|
|
|
9,568 |
|
| Acquisition-related costs (note 2) |
|
|
18 |
|
|
|
157 |
|
|
|
10,504 |
|
|
|
558 |
|
|
|
721 |
|
| Loss (gain) on sale of property and equipment (note 3) |
|
|
584 |
|
|
|
310 |
|
|
|
1,048 |
|
|
|
(1,395) |
|
|
|
- |
|
| Rebalancing of investments held for self-insured liabilities (note 4) |
|
|
- |
|
|
|
- |
|
|
|
- |
|
|
|
(3,071) |
|
|
|
- |
|
| Loss on sale of a subsidiary |
|
|
- |
|
|
|
3,027 |
|
|
|
- |
|
|
|
3,027 |
|
|
|
- |
|
|
Adjusted net income |
|
|
40,410 |
|
|
|
32,654 |
|
|
|
181,123 |
|
|
|
173,896 |
|
|
|
174,787 |
|
|
|
|
|
|
|
| Weighted average number of shares outstanding - basic |
|
|
113,995,604 |
|
|
|
94,386,178 |
|
|
|
107,006,168 |
|
|
|
94,143,455 |
|
|
|
93,540,206 |
|
| Weighted average number of shares outstanding -
diluted |
|
|
114,377,441 |
|
|
|
94,904,836 |
|
|
|
107,325,791 |
|
|
|
94,593,935 |
|
|
|
94,328,059 |
|
| Adjusted earnings per
share |
|
|
|
|
|
|
|
|
|
|
|
|
|
|
|
|
|
|
|
|
|
|
|
|
|
|
| Adjusted earnings per share - basic |
|
|
0.35 |
|
|
|
0.35 |
|
|
|
1.69 |
|
|
|
1.85 |
|
|
|
1.87 |
|
| Adjusted earnings per share - diluted |
|
|
0.35 |
|
|
|
0.34 |
|
|
|
1.69 |
|
|
|
1.84 |
|
|
|
1.85 |
|
note 1: The add back of intangible amortization relates only to the amortization from intangible assets acquired through
acquisitions and excludes the amortization of software purchased by Stantec. This amount for the quarter ended December 31, 2016, is net of tax of $3,974 (2015 - $1,357). For the year ended December 31, 2016, this amount is net of tax of
$15,025 (2015 - $6,498).
note 2: This amount for the quarter ended December 31, 2016, is net of tax of $7 (2015 - $56). For the year ended
December 31, 2016, this amount is net of tax of $4,044 (2015 - $197).
note 3: This amount for the quarter ended December 31, 2016, is net
of tax of $225 (2015 - $110). For the year ended December 31, 2016, this amount is net of tax of (recovery) $404 (2015 - ($493)).
note 4: For
the year ended December 31, 2015, this amount is net of tax of $1,085.
|
|
|
|
|
| Management’s Discussion and Analysis
December 31, 2016 |
|
M-67 |
|
Stantec Inc. |
Risk Factors
ENTERPRISE RISK MANAGEMENT PROGRAM
To preserve and enhance
stakeholder value, we approach the management of risk strategically through our Enterprise Risk Management (ERM) program. We have adopted the integrated framework for Enterprise Risk Management designed by the Committee of Sponsoring Organizations
of the Treadway Commission (COSO).
THE TEAM
ERM is delivered
by team members that range from our highest level to our frontline staff:
| • |
|
The board of directors provides oversight and carries out its risk management mandate primarily through the Audit and Risk Committee (ARC). |
| • |
|
The ARC’s oversight role is to ensure that |
| |
• |
|
Management has developed appropriate methods to identify, evaluate, mitigate, and report the principal risks inherent to our business and strategic direction |
| |
• |
|
Our systems, policies, and practices are appropriate and address our principal risks |
| |
• |
|
Our risk appetite is appropriate for the organization |
The board receives a comprehensive risk
report annually at the same time it receives the Strategic Plan. Quarterly, the ARC receives a report on the changes in principal risks and mitigation strategies. This ensures the board has proper oversight of key risk initiatives.
| • |
|
The C-suite (CEO, CFO, COO, and CBO), supported by our Risk Management team, is directly accountable to the board for all
risk-taking activities and risk management practices. |
| • |
|
The Risk Management team provides legal and insurance expertise and contract review support. Although the team owns the ERM process, the responsibility for identifying and mitigating our principal risks rests
with our EVPT and Functional Services Teams. |
| • |
|
Our Integrity Management team serves a key mandated control function conducting fraud risk assessments for our operations. |
| • |
|
Our Internal Audit team provides assurance services to assist the ARC in the discharge of its responsibilities relating to financial controls and control deviations. |
| • |
|
The Practice Services team conducts internal practice audits of one-third of our offices each year, assessing compliance with the ISO 9001:2008 registered Quality
Management System and ISO 14001:2004 registered Environmental Management System. The internal practice audits also include health and safety compliance. The team also monitors our operational compliance with our risk mitigation strategies and
provides valuable feedback to the ERM program by identifying emerging risks and areas for further improvement. |
Although management remains
confident about our ability to successfully carry out long-term objectives, we are exposed to a number of risks and uncertainties, just like other professional infrastructure and facilities services firms. When appropriate, we realign our risk
disclosures as part of the continual monitoring and annual assessment of our risks. In 2016, we refocused our attention on risks relating to our global operations as well as to construction services.
The most significant risks are listed below (from most to least serious) based on an assessment of the impact on our Company and the probability that the
risks will occur. Readers of this report should consider carefully the risks and uncertainties described below, together with all other information in this report.
|
|
|
|
|
| Management’s Discussion and Analysis
December 31, 2016 |
|
M-68 |
|
Stantec Inc. |
The risks and uncertainties described in this report are not the only ones we face. Additional risks and
uncertainties—that we are unaware of or that we currently believe are not material—may also become important factors that adversely affect our business. If any of the following risks occur, the effects described below in respect of each
risk are not the only ones we face, and our business, financial condition, results of operations, and future prospects could be materially and adversely affected in ways we do not currently anticipate.
TYPES OF RISKS
Strategic Risks
Stantec’s global operations increase the complexity of managing and running the business.
Due to our global platform, we are increasingly subject to a variety of risks, including (a) greater risk of uncollectible accounts and longer collection
cycles, (b) cultural, logistical, and communications challenges, (c) changes in labor conditions, (d) general social, economic, security, and political conditions in foreign markets, (e) international hostilities and terrorism,
(f) risks related to complying with a wide variety of local, national, and international laws, together with potential adverse changes in laws and regulatory practices, (g) the difficulties and costs of staffing and managing global
operations, including the global mobility of staff, (h) fluctuations in exchange rates, (i) multiple and possibly overlapping tax structures, (j) exchange controls and other funding restrictions, (k) political and economic
instability, (l) changes in government trade policies affecting the markets for Stantec’s services, (m) embargoes, (n) foreign corrupt practices, (o) offshoring, (p) lack of local knowledge, (q) imbalance of negotiating
power when dealing with foreign government clients, and (r) compliance with licensing requirements. In addition, we will face competition in other countries from companies that may have more experience operating in such countries or with global
operations generally. These risks could adversely impact our results of operations and financial condition.
Stantec may have difficulty achieving
organic growth targets.
We may not be able to increase the size of our operations organically. Organic growth is achieved when we meet our
clients’ expectations by effectively delivering quality projects and expanding the services provided to both existing and new clients by cross-selling effectively. If we are unable to effectively compete for projects, expand services to
existing and new clients by cross-selling our services, and attract qualified staff, we will have difficulty increasing market share and achieving growth plans. Organic growth is also affected by factors such as economic conditions that are beyond
Stantec’s control. During economic downturns, the ability of both private and government entities to fund expenditures may decline significantly, which could in turn have a material adverse effect on our organic growth.
Demand for Stantec’s services is vulnerable to economic downturns and reductions in government and private industry spending. If the economy
weakens, Stantec’s revenue and financial condition may be adversely affected.
For several years, the global capital and credit markets and
the global economy have experienced significant uncertainty, characterized by the bankruptcy, failure, collapse, or sale of various financial institutions; the European sovereign debt crisis; the ongoing decline and volatility in commodity prices;
geopolitical risks; and a considerable level of intervention from governments around the world. Economic conditions in Canada and a number of other countries and regions have been weak and may remain difficult in the near future.
Demand for our services is and will continue to be vulnerable to economic downturns and reductions in government and private industry spending, and is
affected by the general level of economic activity in the markets in which we operate, both in North America and globally. In addition, currency and interest rate fluctuations, inflation, financial market volatility, or credit market disruptions may
limit our access to capital
|
|
|
|
|
| Management’s Discussion and Analysis
December 31, 2016 |
|
M-69 |
|
Stantec Inc. |
and may also negatively affect the ability of our clients to obtain credit to finance their businesses on acceptable terms. If the operating and financial performance of our clients deteriorates
or if they are unable to make scheduled payments or obtain credit, they may not be able to pay Stantec. An inability to pay may adversely affect our backlog, earnings, and cash flows.
In addition, adverse economic conditions could alter the overall mix of services that clients seek to purchase, and increased competition during a period of
economic decline could force us to accept contract terms that are less favorable to Stantec than we could otherwise be able to negotiate under different circumstances. Changes in our mix of services or a less favorable contracting environment may
cause our revenue and margins to decline.
If we are not able to successfully manage our integration program, then our business and results of
operations may be adversely affected.
Stantec has significantly increased in size to approximately 22,000 employees, and we expect
to continue to pursue growth opportunities. Integrations can be time consuming and challenging and require a large and sustained effort by our senior management. One of Stantec’s core strategies has been to integrate companies immediately;
however, we simply cannot achieve a quick integration with larger acquisitions. Difficulties encountered while combining operations and running our operation through several different platforms could adversely affect the Company’s businesses.
This may prevent us from achieving the anticipated improvement in professional service offerings, market penetration, profitability, and geographic presence that are the key pillars underpinning our acquisition program. Employees of the acquired
business could depart because of uncertainties regarding the acquisition and integration or the difficulties of completing the acquisition and integration or because they do not want to remain with the combined Company.
We may not achieve our strategic objectives unless we manage the challenges of responding to the sensitivities of cultural diversity and the particularities
of local markets. Cultural differences in various countries may present barriers to introducing new ideas and aligning our vision and strategy throughout the organization. A material adverse effect on our business and results of operations
could occur if we do not effectively manage our growth or our employees do not achieve anticipated performance standards. We also risk losing or diminishing our entrepreneurial and innovative culture if our overall corporate growth is burdened by
increased process and administration.
Failure to source additional acquisition targets could impair our growth.
Historically, we have supplemented our internal growth with acquisitions, joint arrangements, and investments in associates. We expect that a significant
portion of any future growth will continue to come from these transactions. However, we may not be able to locate suitable acquisitions in North America or globally or find potential acquisitions with terms and conditions that are acceptable to us.
We expect that as the professional services industry consolidates, suitable acquisition candidates will become more difficult to find and may be available only at prices or under terms that are less favorable than they once were. Future acquisitions
may result in a decrease in our operating income or operating margins, and we may be unable to recover investments made in any such acquisitions. Acquired firms may expose Stantec to unanticipated problems or legal liabilities.
Operational Risks
The inability to enhance Stantec’s
cybersecurity may cause loss of critical data and could delay or prevent operations and cause prejudice to our clients.
Stantec faces the threat
of unauthorized system access, computer hackers, malicious code, and organized cyberattacks. Although we devote significant resources to the security of Stantec’s computer systems, we may still be vulnerable to threats. Anyone who circumvents
security measures could misappropriate proprietary
|
|
|
|
|
| Management’s Discussion and Analysis
December 31, 2016 |
|
M-70 |
|
Stantec Inc. |
information or cause interruptions or malfunctions in system operations. Therefore, we may be required to expend significant resources to protect against the threat of system disruptions and
security breaches or to alleviate problems caused by disruptions and breaches. If we are unable to enhance our Company’s cybersecurity to prevent or contain network and data breaches or other unauthorized access to corporate systems, we run the
risk that our service delivery and revenue generation capabilities could be interrupted, delayed, or destroyed. As well, adversaries may seek information about critical infrastructure projects that Stantec is engaged in, so we have a critical
requirement to protect sensitive project information, including as-built and future design documents. These or other events could cause system interruptions, delays, and loss of critical data; could delay or
prevent operations; and could cause prejudice to our clients.
Failure to maintain effective operational management practices may adversely affect
Stantec’s financial condition and results of operations.
Our clients depend on us to deliver projects on time, on budget, and at
acceptable quality levels. For Stantec to succeed, our internal processes—for example, strong project managers and project management tools, a simple and effective way to bill and collect from clients, and an appropriate insurance
program—must support effective professional practice standards. If we do not manage projects effectively, we may incur additional costs, which may, in turn, result in projects being less profitable than expected. Projects that are not completed
on schedule further reduce profitability: staff must continue to work on them longer than anticipated; this may prevent them from pursuing and working on new projects. Projects that are over budget or not on schedule may
also lead to client dissatisfaction. Also, because of the nature of Stantec’s contracts, we commit resources to projects before we receive payments in amounts sufficient to cover our expenditures. Delays in billings and customer
payments may require Stantec to make a working capital investment. In our experience, clients who withhold payment are more likely to be dissatisfied with services and to bring claims against Stantec.
The outcome of claims and litigation and the threat of a major loss, even if Stantec is ultimately found not liable, could adversely impact our
business.
The threat of a major loss—such as the filing of a design-defect lawsuit against Stantec for damages that exceed
Stantec’s professional liability insurance limits—could adversely impact our business even if, after several years of protracted legal proceedings, Stantec is ultimately not found liable for the loss or claim.
The threat could be deemed by Stantec’s bankers to be a material adverse event under our credit facility, and they could immediately cut off the liquidity we need to fund our day-to-day operations. The threat could also adversely affect business because of the effect on our Company’s reputation, and our inability to win or renew contracts pending a
determination of liability could harm our operations and reduce our profits and revenues.
Stantec bears the risk of cost overruns on fixed-price
contracts. Stantec may experience reduced profits or, in some cases, losses under these contracts if costs increase above our estimates.
As
Stantec grows, we have the opportunity to work on larger and more complex projects. Our business has historically followed a fee-for-service model;
however, some clients in select markets and business operating units are demanding alternative project delivery (APD) methods, such as bundled services of engineering, procurement, and construction; design-builds; and
public-private partnerships. Failure to respond to these market demands may result in clients awarding projects to Stantec’s competitors, which would result in lost revenue. Poor project management may result in a higher
probability of cost overruns and liabilities.
Stantec relies heavily on our information technology (IT) infrastructure
and requires highly skilled staff to manage and deploy IT projects. A failure in our IT infrastructure could lead to system interruption and loss of critical data and, therefore, may adversely affect our operating results.
To sustain business operations and remain competitive, we rely heavily on our core and regional networks, complex server infrastructure and
operating systems, communications and collaboration technology, design
|
|
|
|
|
| Management’s Discussion and Analysis
December 31, 2016 |
|
M-71 |
|
Stantec Inc. |
software, and business applications. As the size of our Company changes, if we do not scale this core infrastructure and constantly upgrade our applications, systems, and network
infrastructure, as well as attract and retain key IT personnel, then our service delivery and revenues could be interrupted or delayed. If we do not have strong IT leadership, we run the risk of failing to adequately plan and respond to the
organization’s IT infrastructure needs; this may severely impair our ability to meet our clients’ needs. Similarly, we must adequately plan for IT initiatives and successfully implement each project. Failure to do this could
cause system interruptions and loss of critical data, could delay or prevent operations, and could adversely affect our operating results, liquidity, or financial position. In addition, Stantec’s computer and communications systems and
operations could be damaged or interrupted by natural disasters, telecommunications failures, acts of war or terrorism, computer viruses, physical or electronic security breaches, or similar events or disruptions. Possible adverse financial impacts
of these events are remediation and litigation costs, costs associated with increased protection, lost revenues, and reputational damage leading to lost clients.
If we fail to attract, retain, and mobilize skilled employees, we would adversely affect our ability to execute our strategy.
Stantec derives revenue almost exclusively from services performed by our employees. Therefore, one crucial driver of our success is our ability
to attract, retain, and develop highly qualified people. There is significant competition—from major consulting, boutique consulting, engineering, public agency, research, and other professional services firms—for talented people with the
skills necessary to provide the types of services that we require to execute our strategy. An inability to attract and retain highly qualified staff could impede our ability to secure and complete projects and
maintain or expand client relationships. If Stantec’s high-performing, high-potential employees are not engaged or, worse, are disengaged, unable, or unwilling to continue employment with our Company—and we do
not have a well-developed succession plan in place before their departure—our business, operations, and prospects may be adversely affected. We are increasingly facing budgetary pressure to deliver more services for less. We run
the risk of underfunding critical projects that serve as an investment in our people. Critical and collaborative analyses by our operational leadership and our Human Resources leadership is required to ensure we make the right investments for
our future.
Project workplaces are inherently dangerous. Failure to maintain safe work sites could have an adverse impact on Stantec’s
business, reputation, financial condition, and results of operations.
Stantec’s Health, Safety, Security, and Environment (HSSE) program is
aimed at reducing risks to people, the environment, and our business. These risks could result in personal injury, loss of life, or environmental or other damage to our property or the property of others. Because we are a multinational company, our
employees travel to and work in high-security-risk countries around the world that are undergoing political, social, and economic problems resulting in war, civil unrest, criminal activity, acts of terrorism, or public health crises. We may incur
material costs to maintain the safety of our personnel and consultants. If we have inadequate health and safety policies and practices, we could be exposed to civil or statutory liability arising from injuries or deaths. If we cannot or elect not to
insure because of high premium costs or other reasons, we could become liable for damages arising from these events. We risk incurring additional costs if we require additional time to complete projects or lose employee time because of injury on
projects that have sustained environmental, health, and safety incidents. We also risk losing existing projects if our HSSE program and metrics fail to meet our clients’ expectations.
Force majeure events could negatively impact our ability to complete client work.
Stantec’s offices, computer and communications systems, and operations could be damaged or interrupted by natural disasters, telecommunications failures,
acts of war or terrorism, or other similar events. If we fail to maintain clear crisis communications plans, effective emergency response plans, and effective pandemic response plans, we put our employees and clients at risk. Failure to quickly
respond to crises could adversely affect our ability to start or complete work for clients, which, in turn, could lead to client dissatisfaction and claims.
|
|
|
|
|
| Management’s Discussion and Analysis
December 31, 2016 |
|
M-72 |
|
Stantec Inc. |
Stantec has defined benefit plans that currently have a significant deficit. These could grow in the
future, causing us to incur additional costs.
Following the MWH acquisition, Stantec has foreign defined benefit pension plans for certain
employees. At December 31, 2016, the defined benefit pension plans had an aggregate deficit (the excess of the project benefit obligations over the fair value of the plan assets) of approximately $50.5 million. In the future, our pension
deficits may increase or decrease depending on changes in interest rate levels, pension plan performance, inflation and mortality rates, and other factors. If we are forced or elect to make up all or a portion of the deficit for unfunded benefit
plans over a short time, our cash flow could be materially and adversely affected.
Compliance and Regulatory Risks
The nature of Stantec’s engineering services performed globally exposes it to various rules and regulations and potential liability, claims, fines,
or sanctions that may reduce its profitability.
Stantec is subject to a variety of regulations and standards. Stantec’s business model
includes a range of business operating units and jurisdictions, each with its own set of rules and regulations. Compliance with additional regulations and standards could materially increase Stantec’s costs, and noncompliance with laws and
regulations could have a significant impact on results.
The United States Foreign Corrupt Practices Act and similar worldwide anticorruption laws,
including the UK’s Bribery Act and the Corruption of Foreign Public Officials Act of 2010 (Canada), generally prohibit companies and their intermediaries from making improper payments to officials for the purpose of obtaining or retaining
business. Stantec operates in many parts of the world that have, to some degree, experienced government corruption. In certain circumstances, strict compliance with anticorruption laws may conflict with local customs and practices. Despite
Stantec’s training and compliance programs, we cannot assure that our internal control policies and procedures will always protect us from inadvertent, reckless, or criminal acts committed by our employees or agents. Stantec’s continued
expansion outside the United States and Canada, including in developing countries, could increase the risk of such violations in the future. Violations of these laws or allegations of such violations could disrupt our business and result in a
material adverse effect on our results of operations or financial condition.
Inadequate disclosure controls or internal controls over financial
reporting could result in a material misstatement in our financial statements and related public disclosures; this could lead to a loss of market confidence and a decrease in market value.
Inadequate disclosure and internal controls could result in system downtime, delayed processing, inappropriate decisions based on non-current internal financial information, fraud, or the inability to continue our business operation.
Currency
and interest rate fluctuations, inflation, financial market volatility, or credit market disruptions may limit our access to capital and also negatively affect the ability of our clients to obtain credit to finance their businesses on acceptable
terms. Shareholder activists could disrupt the business and detract from management’s ability to focus on operations. In addition, Stantec is subject to income tax in various foreign jurisdictions; failure to adequately tax plan could
significantly impair Stantec’s overall capital efficiency.
Several capital market risks could affect our business; however, the key drivers
impacting our business are currency risk, interest rate risk, and availability of capital. Although we report our financial results in Canadian dollars, a substantial portion of our revenue and expenses is generated or incurred in non-Canadian dollars. Therefore, if the Canadian dollar strengthened relative to the US dollar and other currencies, the amount of net income from our non-Canadian dollar
business could decrease, having a material adverse effect on our business, financial condition, and results of operations. Changes in interest rates also present a risk to our performance.
|
|
|
|
|
| Management’s Discussion and Analysis
December 31, 2016 |
|
M-73 |
|
Stantec Inc. |
Our revolving credit facility carries a floating rate of interest. We are also subject to interest rate pricing risk to the extent that our investments held for self-insured liabilities contain
fixed-rate government and corporate bonds. If we are unable to obtain additional debt or equity capital on acceptable terms, we may have to reduce the scope of our anticipated expansion, which may negatively affect our competitiveness and results of
operations. We have no assurance that existing debt will continue to be available from our current lenders or other financial institutions on similar favorable terms. Similarly, there is no assurance that equity markets will be available to raise
the level of capital to meet our needs.
In recent years, shareholder activism has increased in equity markets. Canada, in particular, has a
shareholder-friendly legal framework. If Stantec is unable to provide the market with a compelling business strategy that is attractive to investors, it may be targeted by activist investors who may seek to bring about a change in the strategic
direction, operations, governance, or financial structure of the Company. An activist investor campaign on Stantec could create management distraction, impose a potentially significant cost to defeat it, and disrupt the business. The equity markets
may not support management’s view of the Company’s strategic vision, impacting Stantec’s access to the level of capital required to meet our needs. A successful activist campaign would impact the execution of Stantec’s current
strategic plan.
Stantec is subject to income taxes in various foreign jurisdictions. The tax legislation, regulations, and interpretations
that apply to Stantec’s operations are continually changing. As well, future tax benefits and liabilities are dependent on factors that are inherently uncertain and subject to change, including future earnings,
future tax rates, and anticipated business mix in the various jurisdictions in which we operate. Significant judgment is required to determine the required provision for income taxes, and management uses accounting and fiscal
principles to determine income tax positions that we believe are likely to be sustained by applicable tax authorities. However, there is no assurance that Stantec’s tax benefits or tax liability will not materially differ from our
estimates or expectations. In the ordinary course of business, the ultimate tax determination is uncertain for many transactions and calculations. Any of the above factors could affect our operations and profitability, the availability of tax
credits, the cost of the services we provide, and the availability of deductions for operating losses as Stantec grows. This, in turn, could have a material adverse effect on our net income or cash flows. An increase or decrease in Stantec’s
effective tax rate could have a material adverse impact on our financial condition and results of operations.
Construction Services Risks
In addition to the above risks, certain risks are unique to our Construction Services business, including the following:
To a significant extent, our prospects depend on our ability to attract a sufficient number of skilled workers.
The construction industry is increasingly facing a shortage of skilled laborers in some areas and disciplines, particularly in remote locations that require
workers to live in temporary camps. The resulting competition for labor may limit our ability to take advantage of opportunities that would otherwise be available or may impact the profitability of these endeavors as we move forward.
A major subcontractor default or failure to properly manage subcontractor performance could materially impact results.
Profitable completion of some contracts depends largely on the satisfactory performance of the subcontractors and design and engineering consultants who
complete various elements of the work. If these subcontractors and consultants do not perform to accepted standards, we may have to hire others to complete the tasks; this could impact scheduling, add contract costs, impact profitability on a
specific job, and, in certain circumstances, lead to significant losses.
|
|
|
|
|
| Management’s Discussion and Analysis
December 31, 2016 |
|
M-74 |
|
Stantec Inc. |
Claims and litigation may result in unfavorable outcomes that could materially impact the Company’s
financial position.
Disputes are common in the construction industry; therefore, in the normal course of business, we are involved in various
legal actions and proceedings that arise from time to time. Some of these may be substantial. We have no assurance that our insurance arrangements will be sufficient to cover any particular claim or claims that may arise. Furthermore, we are subject
to the risk of claims and legal actions for various commercial and contractual matters that may arise primarily from construction disputes, in respect of which insurance is not available.
Capital requirements may impact the availability of working capital.
Construction services requires higher capital expenditures which reduces free cash. Although the overall impact to our balance sheet is not material, the
impact to working capital exists.
Access to bonding may be unavailable in the future due to economic or other external factors.
Many construction contracts require sufficient bonding. The construction industry has endured a certain degree of instability and uncertainty that arises from
weak economic conditions; the long-term effects may increase pressures on debt obligations causing delays on projects or failure to complete projects. Additionally, the issuance of bonds under surety facilities is at the sole discretion of the
surety company on a project-by-project basis, and the indemnity agreements can be called at any time. As such, even sizeable surety facilities are no guarantee of surety
support on any specific project.
Extended periods of poor weather can have an adverse effect on a project’s profitability.
Unfavorable weather conditions are one of the most significant uncontrollable risks for construction services to the extent that the risk is not mitigated in
the contract terms. Delays resulting from extended periods of poor weather can have an adverse effect on the profitability of construction projects. We could be penalized for late completion (imposed by the contract) or incur incremental costs
arising from loss of productivity, compressed schedules, or overtime work used to offset time lost because of the adverse weather.
MANAGING OUR RISKS
Global Operations
We manage our global Consulting Services
business through a combination of centralized and decentralized controls programs to address the unique aspects of the various markets, cultures, and geographies we operate in. Our matrix-based leadership structure provides distinct yet coordinated
oversight of our business services and geographies.
Construction services are purposefully restricted to primarily two jurisdictions—the United
States and the United Kingdom—to reduce the risks of performing work in jurisdictions where we have little background or experience.
Our
approach to integration involves implementing our Company-wide information technology and financial management systems and providing support services from our corporate and regional offices.
Business Model
Our business model—based on geographic,
business operating unit specialization, and life-cycle diversification—reduces our dependency on any particular industry or economic driver. We intend to continue diversifying our geographic presence and service offerings and focusing on key
client sectors. We believe this will reduce our susceptibility to industry-specific and regional economic cycles and will help us take advantage of economies of scale in the highly fragmented professional services industry.
|
|
|
|
|
| Management’s Discussion and Analysis
December 31, 2016 |
|
M-75 |
|
Stantec Inc. |
We also differentiate our Consulting Services business from competitors by entering into both large and small
contracts with various fee amounts. We work on tens of thousands of projects for thousands of clients in hundreds of locations. Our broad project mix strengthens our brand identity and ensures that we do not rely on only a few large projects for our
revenue. We expect to continue to pursue selective acquisitions, enabling us to enhance our market penetration and to increase and diversify our revenue base.
Our Construction Services business operates separately; however, Construction Services may be coordinated with our Consulting Services business when
appropriate and advantageous for our client.
Effective Processes and Systems
Our Integrated Management System (IMS) provides a disciplined and accountable framework for managing risks, quality outcomes, and occupational health and
safety and environmental compliance. Our legacy Stantec operations are certified to the following four internationally recognized consensus ISO standards:
| • |
|
ISO 9001:2008 (Quality Management) |
| • |
|
ISO 14001:2004 (Environmental Management) |
| • |
|
OHSAS 18001:2007 (Occupational Health & Safety Management) |
| • |
|
ISO/IEC 20000-1:2011 (IT Service Management) |
MWH also has a number of
ISO certifications in certain geographies. As part of our integration plan, these will be reviewed and incorporated into Stantec’s Integrated Management System in 2017.
Our legacy Stantec operations use a 10-point Project Management (PM) Framework that—along with the more detailed
practice frameworks that exist in our business operating units—clearly conveys the steps employees must take to achieve more consistent and successful project outcomes. The PM Framework creates standard principles relating to project execution
and helps ensure consistent application of those principles to all of our projects. To improve PM Framework compliance, improvement plans are issued to address specific corrective actions, with responsibilities and deadlines assigned for completion.
MWH operations use a proprietary handbook of PM practices that will be integrated with our PM framework beginning in 2017 and adopted by all our Consulting Services operations. MWH Construction Services uses a Project Management Administration Plan
(the MAP) to tailor its project management practices to each project and integrate quality, risk, health and safety, IT, and change management procedures.
In Consulting Services, our largest and most complex projects are supported by our Programs and Business Solutions (PBS) group, which provides specialized
program and project management services.
All Construction Services projects have a MAP prepared at the outset, a component of which is a project quality
plan. Project quality is assessed throughout the course of the project through a combination of periodic operational and scheduling reviews by management and mid-project quality reviews performed by an
independent Global Risk Management team.
Our comprehensive IT security (Cybersecurity) program is designed to predict, prevent, detect, and respond. Key
initiatives of the program include detailed security and acceptable use policies, practices, and procedures; awareness campaigns to staff; and a comprehensive array of security initiatives for enforcing security standards, including regular
penetration tests. We have an integrated security incident response team, linked to our crisis communication plan, to ensure that breach response protocols are aligned with our overall corporate crisis response plans.
|
|
|
|
|
| Management’s Discussion and Analysis
December 31, 2016 |
|
M-76 |
|
Stantec Inc. |
We invest resources in our Risk Management team. Team members are dedicated to providing Company-wide support and
guidance on risk avoidance practices and procedures. Structured risk assessments are conducted before we begin pursuing projects that involve heightened or unique risk factors.
Insurance
We maintain insurance coverage for our operations,
including policies covering general, automobile, environmental, workers’ compensation and employers’, directors’ and officers’, professional, cyber, patent infringement, fiduciary, crime, constructors all risk, wrap up, and
contractors’ equipment liability. We have a regulated captive insurance company to insure and fund the payment of any professional liability self-insured retentions related to claims arising after August 1, 2003. We or our
clients also obtain project-specific insurance when required.
Growth Management
We have an acquisition and integration program managed by a dedicated acquisition team to address the risk of being unsuccessful when integrating acquired
companies. A senior regional or business leader is appointed for each acquisition. The team supports and is responsible for
| • |
|
Identifying and valuing acquisition candidates |
| • |
|
Undertaking and coordinating due diligence |
| • |
|
Negotiating and closing transactions |
| • |
|
Integrating employees and leadership structures immediately and systems as soon as practical following an acquisition |
Capital Liquidity
We are able to meet our liquidity needs and
expansion strategy through various sources that include cash generated from operations, short- and long-term borrowings from our $1.25 billion syndicated senior secured credit facilities, and the issuance of common shares.
Executive Compensation
We seek to align our compensation practices
with our risk mitigation strategies.
We provide our executives with a mix of fixed, variable, and at-risk
compensation. This mix helps us attract and retain highly qualified executives, which is critical for our Company’s ongoing success. Our annual short-term incentive plan (STIP) rewards near-term performance contributions to encourage executives
to achieve profitable business results. Each executive has a target STIP amount, and the actual payment can range from 0% to a maximum of 200% of the target. This maximum STIP payout mitigates the risk of unreasonably high short-term compensation.
Our annual long-term incentive plan (LTIP), granted to executives, includes a mix of one-third share options and two-thirds performance share units (PSUs). These incentives reward long-term performance by aligning the interests of our executives with increased shareholder returns and vest based on the achievement of three-year
performance hurdles related to net income growth and return on equity. Our share options also vest over a three-year period. This deferred vesting for our LTIP further encourages long-term alignment with the interests of our shareholders.
In addition to our compensation programs, we have adopted share ownership requirements for our executives to further demonstrate their commitment to creating
shareholder value. Our CEO is also required to maintain his share ownership requirements for at least a year following his retirement from Stantec. As well, our executives are prohibited from speculating in the securities of the Company or
purchasing financial instruments that are designed to hedge or offset a decrease in value of equity securities of the Company.
|
|
|
|
|
| Management’s Discussion and Analysis
December 31, 2016 |
|
M-77 |
|
Stantec Inc. |
We also have an executive compensation claw-back policy that shows our commitment to the principle that
compensation paid to our executives—based on financial information that has since been restated—should be returned.
Controls and Procedures
Disclosure
controls and procedures are designed to ensure that information we are required to disclose in reports filed with securities regulatory agencies is recorded, processed, summarized, and reported on a timely basis and is accumulated and communicated
to management—including our CEO and CFO, as appropriate—to allow timely decisions regarding required disclosure.
Under the supervision and with
the participation of management, including our CEO and CFO, we carried out an evaluation of the effectiveness of our disclosure controls and procedures as of December 31, 2016 (as defined in rules adopted by the SEC in the United States and as
defined in Canada by National Instrument 52-109, Certification of Disclosure in Issuer’s Annual and Interim Filings). Based on this evaluation, our CEO and CFO concluded that the design and operation of
our disclosure controls and procedures were effective.
As permitted by published guidance of the U.S. Securities and Exchange commission (SEC), our
evaluation of and conclusions on the effectiveness of internal control over financial reporting did not include the internal controls of Bury; MWH, VOA, and Edwards & Zuck, which are included in our 2016 consolidated financial statements.
The aggregate assets acquired were $818.7 million, representing 19.1% of our total assets as at December 31, 2016. The gross revenue earned from their dates of acquisition to December 31, 2016, constituted 32.3% of our gross revenue
for the year ended December 31, 2016.
Internal control over financial reporting is a process designed to provide reasonable assurance regarding the
reliability of financial reporting and preparation of financial statements for external purposes in accordance with IFRS. A control system, no matter how well designed and operated, can provide only reasonable, not absolute, assurance with respect
to the reliability of our financial reporting and preparation of our financial statements. Accordingly, management, including our CEO and CFO, does not expect that our internal control over financial reporting will prevent or detect all errors and
all fraud. Management’s Annual Report on Internal Control over Financial Reporting and the Independent Auditors’ Report on Internal Controls are included in our 2016 consolidated financial statements.
There has been no change in our internal control over financial reporting during the year ended December 31, 2016, that materially affected or is
reasonably likely to materially affect our internal control over financial reporting.
We will continue to periodically review our disclosure controls and
procedures and internal control over financial reporting and may make modifications from time to time as considered necessary or desirable.
Corporate Governance
DISCLOSURE COMMITTEE
Stantec has a Disclosure Committee, consisting of a cross-section of management. The committee’s mandate is to provide ongoing review of
Stantec’s continuous disclosure policy and to facilitate compliance with applicable legislative and regulatory reporting requirements.
|
|
|
|
|
| Management’s Discussion and Analysis
December 31, 2016 |
|
M-78 |
|
Stantec Inc. |
BOARD OF DIRECTORS
Stantec’s board of directors currently includes nine members—eight are independent under Canadian securities laws and under the rules of the SEC and
the NYSE and are free from any interest or relationship that could materially interfere with their ability to act in the best interest of our Company and shareholders. Bob Gomes is not independent by virtue of his service as the Company’s chief
executive officer. The chair of Stantec’s board of directors, Aram Keith, is an independent director.
The board’s mandate is to supervise
Stantec’s management with a view to the Company’s best interests. The board fulfills its mandate by
| • |
|
Overseeing the Company’s strategic planning process |
| • |
|
Satisfying itself as to the integrity of the CEO and other executive officers |
| • |
|
Ensuring that the Company has a policy in place for communicating effectively with shareholders, other stakeholders, and the public |
| • |
|
Reviewing and monitoring the Company’s principal business risks as identified by management, along with the systems for managing such risks |
| • |
|
Overseeing senior management succession planning, including the appointment, development, and monitoring of senior management |
| • |
|
Ensuring that management maintains the integrity of the Company’s internal controls and management information systems |
In 2016, Stantec’s board included two committees: the Audit and Risk Committee and the Corporate Governance and Compensation Committee. Both committees
are composed entirely of independent directors.
AUDIT AND RISK COMMITTEE
The Audit and Risk Committee monitors, evaluates, approves, and makes recommendations on matters affecting Stantec’s external audit, financial reporting,
accounting control policies, and risk management matters. The chair provides regular reports at the Company’s board meetings. The board has determined that each member is financially literate and independent, and two of the four members are
“financial experts” as the term is defined under the rules of the SEC and NYSE.
CORPORATE GOVERNANCE AND COMPENSATION COMMITTEE
The Corporate Governance and Compensation Committee monitors, evaluates, approves, and makes recommendations on matters affecting corporate governance and
board and executive compensation. Governance matters include, but are not limited to, board size, director nominations, orientation, education, and self-evaluation. Compensation matters include, but are not limited to, director and executive
management compensation, performance review, and succession planning. The committee reviews and approves the CEO’s objectives and monitors these objectives quarterly. The chair provides regular reports at the Company’s board meetings.
More information about Stantec’s corporate governance can be found on our website (www.stantec.com), and additional information will be available in
the Management Information Circular prepared for our May 11, 2017, Annual General Meeting of Shareholders. As well, the following documents are posted on our website:
| • |
|
Corporate Governance Guidelines |
| • |
|
Audit and Risk Committee Terms of Reference |
| • |
|
Corporate Governance and Compensation Committee Terms of Reference |
|
|
|
|
|
| Management’s Discussion and Analysis
December 31, 2016 |
|
M-79 |
|
Stantec Inc. |
The documents listed above are not and should not be deemed to be incorporated by reference. Copies of these
documents will be made available in print form to any shareholder who requests them.
Subsequent Events
On February 22, 2017, the Company declared a cash dividend of $0.125 per share, payable on April 13, 2017, to shareholders of record on
March 31, 2017, an increase of 11.11% from last year.
Cautionary Note Regarding Forward-Looking Statements
Our public communications often include written or verbal forward-looking statements within the meaning of the US Private Securities Litigation Reform Act
and Canadian securities laws. Forward-looking statements are disclosures regarding possible events, conditions, or results of operations that are based on assumptions about future economic conditions or courses of action and include financial
outlook or future-oriented financial information. Any financial outlook or future-oriented financial information in this Management’s Discussion and Analysis has been approved by management of Stantec. Such financial outlook or
future-oriented financial information is provided for the purpose of providing information about management’s current expectations and plans relating to the future.
Forward-looking statements may involve, but are not limited to, comments with respect to our objectives for 2017 and beyond, our strategies or future
actions, our targets, our expectations for our financial condition or share price, or the results of or outlook for our operations. Statements of this type may be contained in filings with securities regulators or in other communications and are
contained in this report. Forward-looking statements in this report include, but are not limited to, the following:
| • |
|
The discussion of our goals in the Core Business and Strategy section, including but not limited to our plan to achieve a compound average growth rate of 15% through a combination of organic and acquisition
growth |
| • |
|
Our 2017 target ranges for certain measures in the Outlook section |
| • |
|
Our short-term and long-term expectations for our reportable segments under Discussion of Operations – Gross Revenue by Reportable Segment and Gross Revenue by Consulting Services – Business Operating
Units, including but not limited to: |
| |
• |
|
Our expectation that our Transportation and Water sectors in our Infrastructure business unit will continue to benefit from the Canadian federal and certain key provincial budgets recently released
|
| |
• |
|
Our expectation that growth opportunities exist for environmental services work in the power sector in the renewables market in Canada and the United States |
| |
• |
|
Our expectation that the Canadian government’s plans for infrastructure spending will result in new opportunities for us |
| • |
|
Our expectations for the costs of software additions and amortization expenses for 2017 |
| • |
|
Our 2017 overall outlook under the Outlook – Overall Outlook section |
| • |
|
Our expectation on the timing for the completion of the MWH integration and the expected synergies and efficiencies of the combined business in the Outlook – Overall Outlook section |
| • |
|
Our expectations regarding economic trends, industry trends, and commodity prices in the sectors and regions in which we operate |
| • |
|
Our expectations regarding our sources of cash and ability to meet our normal operating and capital expenditures in the Liquidity and Capital Resources section |
|
|
|
|
|
| Management’s Discussion and Analysis
December 31, 2016 |
|
M-80 |
|
Stantec Inc. |
| • |
|
Our statements about our expectation and abilities to build on the construction capabilities of MWH and expand our current North American acquisition strategy into global markets, and our expectations for revenue
breakdown geographically in the Core Business and Strategy section |
| • |
|
Our expectation that the economic impact of the Brexit referendum will not, in the short term, have a significant impact on our UK operations |
These describe the management expectations and targets by which we measure our success and assist our shareholders in understanding our financial position
as at and for the periods ended on the dates presented in this report. Readers are cautioned that this information may not be appropriate for other purposes.
By their nature, forward-looking statements require us to make assumptions and are subject to inherent risks and uncertainties. There is a significant risk
that predictions, forecasts, conclusions, projections, and other forward-looking statements will not prove to be accurate. We caution readers of this report not to place undue reliance on our forward-looking statements since a number of factors
could cause actual future results, conditions, actions, or events to differ materially from the targets, expectations, estimates, or intentions expressed in these forward-looking statements.
Future outcomes relating to forward-looking statements may be influenced by many factors and material risks, including the risks described in the Risk
Factors section of this report.
Assumptions
In determining our forward-looking statements, we consider material factors including assumptions about the performance of the Canadian, US, and Global
economies in 2017 and their effect on our business. The factors and assumptions we used about the performance of Canadian, US, and Global economies in 2017 in determining our annual targets and our outlook for 2017 are listed in the Outlook section
of this report. In addition, our budget is a key input for making certain forward-looking statements, and certain key assumptions underlying our budget are also set forth under Overall Outlook.
The preceding list of factors is not exhaustive. Investors and the public should carefully consider these factors, other uncertainties and potential
events, and the inherent uncertainty of forward-looking statements when relying on these statements to make decisions with respect to our Company. The forward-looking statements contained herein represent our expectations as of February 22,
2017, and, accordingly, are subject to change after such date. Except as may be required by law, we do not undertake to update any forward-looking statement, whether written or verbal, that may be made from time to time. In the case of the ranges of
expected performance for fiscal year 2017, it is our current practice to evaluate and, where we deem appropriate, provide updates. However, subject to legal requirements, we may change this practice at any time at our sole discretion.
|
|
|
|
|
| Management’s Discussion and Analysis
December 31, 2016 |
|
M-81 |
|
Stantec Inc. |