Table of Contents
UNITED STATES
SECURITIES AND EXCHANGE COMMISSION
Washington, D.C. 20549
FORM N-CSR
CERTIFIED SHAREHOLDER REPORT OF REGISTERED
MANAGEMENT INVESTMENT COMPANIES
Investment Company Act file number 811-10263
GuideStone Funds
(Exact name of registrant as specified in charter)
2401 Cedar Springs Road
Dallas, TX 75201-1407
(Address of principal executive offices) (Zip code)
Cherika N. Latham, Esq.
GuideStone Financial Resources of the Southern Baptist Convention
2401 Cedar Springs Road
Dallas, TX 75201-1407
(Name and address of agent for service)
Registrant’s telephone number, including area code: 214-720-4640
Date of fiscal year end: December 31
Date of reporting period: June 30, 2014
Form N-CSR is to be used by management investment companies to file reports with the Commission not later than 10 days after the transmission to stockholders of any report that is required to be transmitted to stockholders under Rule 30e-1 under the Investment Company Act of 1940 (17 CFR 270.30e-1). The Commission may use the information provided on Form N-CSR in its regulatory, disclosure review, inspection, and policymaking roles.
A registrant is required to disclose the information specified by Form N-CSR, and the Commission will make this information public. A registrant is not required to respond to the collection of information contained in Form N-CSR unless the Form displays a currently valid Office of Management and Budget (“OMB”) control number. Please direct comments concerning the accuracy of the information collection burden estimate and any suggestions for reducing the burden to Secretary, Securities and Exchange Commission, 100 F Street, NE, Washington, DC 20549. The OMB has reviewed this collection of information under the clearance requirements of 44 U.S.C. § 3507.
Table of Contents
Item 1. Reports to Stockholders.
The Report to Shareholders is attached herewith.
Table of Contents
Semi-Annual Report June 30, 2014 (Unaudited) Institutional Investor DATE TARGET FUNDS MyDestination 2005 Fund GMIZX MyDestination 2015 Fund GMTZX MyDestination 2025 Fund GMWZX MyDestination 2035 Fund GMHZX MyDestination 2045 Fund GMFZX MyDestination 2055 Fund GMGZX ASSET ALLOCATION FUNDS Conservative Allocation Fund GFIZX Balanced Allocation Fund GGIZX Growth Allocation Fund GCOZX Aggressive Allocation Fund GGBZX Conservative Allocation Fund I GFIYX Balanced Allocation Fund I GGIYX Growth Allocation Fund I GCOYX Aggressive Allocation Fund I GGBYX SELECT FUNDS Money Market Fund GMYXX GMZXX Low-Duration Bond Fund GLDYX GLDZX Medium-Duration Bond Fund GMDYX GMDZX Extended-Duration Bond Fund GEDYX GEDZX Inflation Protected Bond Fund GIPZX Global Bond Fund GGBFX Flexible Income Fund GFLZX Defensive Market Strategies Fund GDMYX GDMZX Real Assets Fund GRAZX Equity Index Fund GEQYX GEQZX Real Estate Securities Fund GREZX Value Equity Fund GVEYX GVEZX Growth Equity Fund GGEYX GGEZX Small Cap Equity Fund GSCYX GSCZX International Equity Fund GIEYX GIEZX Emerging Markets Equity Fund GEMYX GEMZX Global Natural Resources Equity Fund GNRZX Well Done…good and faithful servant. MATTHEW 25:21
Table of Contents
GuideStone Funds
Privacy Notice
NOTICE CONCERNING YOUR PRIVACY RIGHTS
This notice will provide you with information concerning our policies with respect to non-public personal information that we collect about you in connection with the following financial products and services provided and/or serviced by the entities listed below: individual retirement accounts ( “IRAs”) and/ or personal mutual fund accounts.
The confidentiality of your information is important to us, as we recognize that you depend on us to keep your information confidential, as described in this notice.
We collect non-public personal information about you with regard to your IRA and/or mutual fund accounts from the following sources:
| • | Information we receive from you on applications or other forms; |
| • | Information about your transactions with us, our affiliates or others (including our third-party service providers); |
| • | Information we receive from others, such as service providers, broker-dealers and your personal agents or representatives; and |
| • | Information you and others provide to us in correspondence sent to us, whether written, electronic or by telephone. |
We may disclose such non-public personal financial information about you to one or more of our affiliates as permitted by law. An affiliate of an organization means any entity that controls, is controlled by or is under common control with that organization. GuideStone Funds, GuideStone Financial Resources of the Southern Baptist Convention, GuideStone Capital Management, LLC, GuideStone Resource Management, Inc., GuideStone Investment Services, GuideStone Trust Services, GuideStone Financial Services and GuideStone Advisors (collectively “GuideStone”) are affiliates of one another. GuideStone and Foreside Funds Distributors LLC do not sell your personal information to non-affiliated third parties.
We may also disclose any of the personal information that we collect about you to non-affiliated third parties as permitted by law. For example, we may provide your information to non-affiliated companies that provide account services or that perform marketing services on our behalf and to other financial institutions with whom we have joint marketing agreements. We restrict access to non-public personal information about you to those of our employees who need to know that information in order for us to provide products and services to you. We also maintain physical, electronic and procedural safeguards to guard your personal information.
These procedures will continue to remain in effect after you cease to receive financial products and services from us.
If you have any questions concerning our customer information policy, please contact a customer relations specialist at
1-888-GS-FUNDS (1-888-473-8637).
Table of Contents
| 2 | ||||
| 3 | ||||
| 5 | ||||
| 8 | ||||
| Date Target Funds: |
||||
| 12 | ||||
| 14 | ||||
| 16 | ||||
| 18 | ||||
| 20 | ||||
| 21 | ||||
| 22 | ||||
| Asset Allocation Funds: |
||||
| 30 | ||||
| 32 | ||||
| 34 | ||||
| 36 | ||||
| 37 | ||||
| 43 | ||||
| 45 | ||||
| 47 | ||||
| 48 | ||||
| 49 | ||||
| Money Market and Bond Funds: |
||||
| 55 | ||||
| 59 | ||||
| 73 | ||||
| 94 | ||||
| 99 | ||||
| 112 | ||||
| Equity Funds: |
||||
| 122 | ||||
| 132 | ||||
| 138 | ||||
| 142 | ||||
| 145 | ||||
| 151 | ||||
| 161 | ||||
| 168 | ||||
| Real Return Funds: |
||||
| 179 | ||||
| 181 | ||||
| 186 | ||||
| 187 | ||||
| 191 | ||||
| 194 | ||||
| 201 | ||||
| 270 | ||||
| 273 |
This report has been prepared for shareholders of GuideStone Funds. It is not authorized for distribution to prospective investors unless accompanied or preceded by a current prospectus, which contains more complete information about the Funds. Investors are reminded to read the prospectus carefully before investing. Past performance is no guarantee of future results. Share prices will fluctuate and there may be a gain or loss when shares are redeemed. Fund shares are distributed by Foreside Funds Distributors LLC, 400 Berwyn Park, 899 Cassatt Road, Suite 110, Berwyn, PA 19312.
1
Table of Contents

Dear Shareholder:
We are pleased to present you with the 2014 GuideStone Funds Semi-Annual Report. This report reflects our unwavering commitment to integrity in financial reporting so you may stay fully informed of your investments. We trust that you will find this information valuable when making investment decisions.
For the third consecutive year, GuideStone Funds was recognized by the Lipper Fund Awards. Ranking No. 1 out of 57 eligible funds, the Extended-Duration Bond Fund was recognized as Best Fund Over 3 Years, and ranking No. 1 out of 51 eligible funds, as Best Fund Over 5 Years in the Corporate Debt A-Rated Funds category for the Fund’s performance ending November 30, 2013.
We continue to work diligently to enhance the products and services to our shareholders. Several examples of our ongoing commitment are noted below:
GuideStone Funds were made available to an expanded audience. In early May, we expanded our availability to individual and institutional retail investors, providing access to our award-winning, values-driven investments. This expansion helps provide additional economies of scale, allowing us to continue to provide quality services at competitive pricing for all of our investors.
eDelivery of shareholder reports were made available. Shareholders can now choose whether to receive shareholder disclosure reports electronically or through U.S. Mail. These disclosures include the prospectus, the annual report and other important disclosure documents. Shareholders interested in enrolling in the optional, free eDelivery service can do so by logging into their account at www.MyGuideStone.org, or by calling GuideStone. Visit www.GuideStoneFunds.com/Disclosures for more information about delivery preferences.
We invite you to learn more about the continued success of GuideStone Funds and the various investment options available by visiting our website at www.GuideStoneFunds.com or contacting us at 1-888-GS-FUNDS (1-888-473-8637). Thank you for choosing to invest in GuideStone Funds.
Sincerely,

John R. Jones, CFA
President
Lipper, a Thomson Reuters company, provides independent insight on global collective investments including mutual funds, retirement funds, hedge funds, fund fees and expenses to the asset management and media communities. Lipper is the world’s leading fund research and analysis organization, covering over 231,000 share classes and over 122,000 funds in 61 registered for sale (RFS) universes. It provides the free Lipper Leader ratings for mutual funds registered for sale in over 30 countries. Additional information is available at www.lipperweb.com.
2
Table of Contents
FROM THE CHIEF INVESTMENT OFFICER

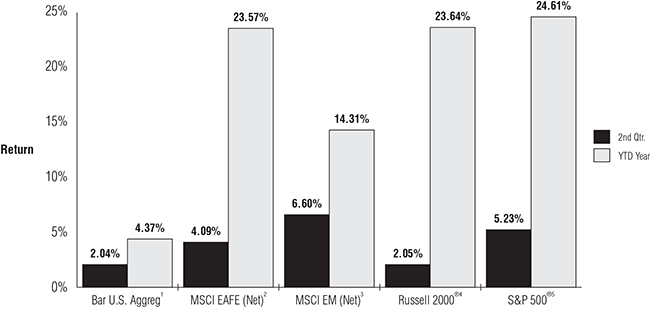
For the quarter, all major asset classes moved noticeably higher and well-balanced portfolios continued to produce solid gains. The quarter was led by the broad category of real assets as the securities of commodity producers and Real Estate Investment Trusts posted high single digit returns. Year-to-date, these two real asset segments are up 10.49% and 18.14%, respectively. Also, Treasury Inflation Protected Securities, another key real asset strategy was up 3.81% for the quarter. It was also a good period for stocks, both in the U.S. and abroad. U.S. stocks returned 5.23% and closed near all-time highs. Finally, interest rates fell for the second consecutive quarter, resulting in a return of 2.04% for bond investments.
As we move into the second half of the year, the rebound in economic growth in the 2nd quarter serves as a testimony to the resilience of the US economy. While the rebound is an encouragement to investors, there is skepticism entering the minds of many institutional investors and well-respected economists that are looking further down the road. With interest rates remaining low and labor markets nearing full employment, there are growing concerns that the Federal Reserve is overstaying its aggressive monetary policies and pro-growth strategies. If this is the case, the Fed, after years of running monetary policy at full throttle, will be increasingly called upon to walk a proverbial tightrope that may very well introduce more volatility into the investment markets. The Fed will need to properly balance their economic growth objective, which is the remedy for secular deleveraging, with the risk of over stimulating the economy which may lead to inflationary pressures and asset bubbles.
Lastly, with stock market valuations near historical averages and interest rates near historical lows, we continue to expect capital market returns in the coming years will most likely reflect the slow economic growth pattern predicted of world economies. This reinforces the need for investors to maintain broad diversification to combat periods of rising volatility, maintain a broad opportunity set for investment returns, and apply a consistent and robust savings plan to combat periods of low returns. All three are proven principles that will help you face changing market environments with confidence and help you meet your investment objectives over time.
3
Table of Contents
Asset Class Performance Comparison
The following graph illustrates the performance of the major assets classes during 2014.
Index
| 1 | The Barclays U.S. Aggregate Bond Index represents securities that are SEC-registered, taxable and dollar denominated. The index covers the U.S. investment grade bond market, with index components for government and corporate securities, mortgage pass-through securities and asset-backed securities. |
| 2 | The MSCI EAFE Index (Europe, Australasia, Far East) is a free float-adjusted market capitalization index that is designed to measure the equity market performance of developed markets, excluding the U.S. & Canada. The MSCI EAFE Index consists of the following 21 developed market country indices: Australia, Austria, Belgium, Denmark, Finland, France, Germany, Hong Kong, Ireland, Israel, Italy, Japan, the Netherlands, New Zealand, Norway, Portugal, Singapore, Spain, Sweden, Switzerland, and the United Kingdom. |
| 3 | The MSCI EM (Emerging Markets) Index is a free float-adjusted market capitalization index that is designed to measure equity market performance of emerging markets. The index consisted of the following 21 emerging market country indices: Brazil, Chile, China, Colombia, Czech Republic, Egypt, Greece, Hungary, India, Indonesia, Korea, Malaysia, Mexico, Peru, Philippines, Poland, Russia, South Africa, Taiwan, Thailand, and Turkey. |
| 4 | The Russell 2000® Index measures the performance of the small-cap segment of the U.S. equity universe. The Russell 2000® Index is a subset of the Russell 3000® Index representing approximately 10% of the total market capitalization of that index. It includes approximately 2,000 of the smallest securities based on a combination of their market cap and current index membership. The Russell 2000® Index is constructed to provide a comprehensive and unbiased small-cap barometer and is completely reconstituted annually to ensure that larger stocks do not distort the performance and characteristics of the actual small-cap opportunity set. |
| 5 | The S&P 500® Index is an unmanaged index (with no defined investment objective) of common stocks, includes reinvestment of dividends and is a registered trademark of McGraw-Hill Co., Inc. The S&P 500® Index includes 500 of the largest stocks (in terms of market value) in the United States. |
4
Table of Contents
As a shareholder of the Funds, you incur ongoing costs, including advisory fees and to the extent applicable, shareholder services fees, as well as other Fund expenses. This example is intended to help you to understand your ongoing costs (in dollars) of investing in the Funds and to compare these costs with the ongoing costs of investing in other mutual funds. It is based on an investment of $1,000 invested at the beginning of the period and held for the entire period from January 1, 2014 to June 30, 2014.
Actual Expenses
The first section of the table below provides information about actual account values and actual expenses. You may use the information in this section, together with the amount you invested, to estimate the expenses that you incurred over the period. Simply divide your account value by $1,000 (for example, an $8,600 account value divided by $1,000 = 8.6), then multiply the result by the number in the first section under the heading entitled “Expenses Paid During Period” to estimate the expenses attributable to your investment during this period.
Hypothetical Example for Comparison Purposes
The second section of the table below provides information about hypothetical account values and hypothetical expenses based on the Fund’s actual expense ratio and an assumed rate of return of 5% per year before expenses, which is not the Fund’s actual return. Thus, you should not use the hypothetical account values and expenses to estimate the actual ending account balance or your expenses for the period. Rather, these figures are provided to enable you to compare the ongoing costs of investing in the Fund and other funds. To do so, compare this 5% hypothetical example with the 5% hypothetical examples that appear in the shareholder reports of the other funds. Please note that the expenses shown in the table are meant to highlight your ongoing costs only. Therefore, the second section of the table is useful in comparing ongoing costs only and will not help you determine the relative total costs of owning different funds.
| Actual |
||||||||||||||||||
| Beginning | Ending | Annualized | Expenses | |||||||||||||||
| Account Value | Account Value | Expense | Paid During | |||||||||||||||
| Fund |
Class | 01/01/14 | 06/30/14 | Ratio (1) | Period (2) | |||||||||||||
| MyDestination 2005 |
Investor | $ | 1,000.00 | $ | 1,037.38 | 0.20 | % | $ | 1.01 | |||||||||
| MyDestination 2015 |
Investor | 1,000.00 | 1,050.14 | 0.14 | 0.71 | |||||||||||||
| MyDestination 2025 |
Investor | 1,000.00 | 1,054.63 | 0.14 | 0.69 | |||||||||||||
| MyDestination 2035 |
Investor | 1,000.00 | 1,054.68 | 0.15 | 0.78 | |||||||||||||
| MyDestination 2045 |
Investor | 1,000.00 | 1,054.00 | 0.20 | 1.02 | |||||||||||||
| MyDestination 2055 |
Investor | 1,000.00 | 1,052.51 | 0.20 | 1.02 | |||||||||||||
| Conservative Allocation |
Investor | 1,000.00 | 1,030.40 | 0.12 | 0.60 | |||||||||||||
| Balanced Allocation |
Investor | 1,000.00 | 1,054.80 | 0.12 | 0.61 | |||||||||||||
| Growth Allocation |
Investor | 1,000.00 | 1,054.29 | 0.12 | 0.61 | |||||||||||||
| Aggressive Allocation |
Investor | 1,000.00 | 1,046.55 | 0.12 | 0.61 | |||||||||||||
| Conservative Allocation I |
Institutional | 1,000.00 | 1,030.74 | 0.15 | 0.77 | |||||||||||||
| Balanced Allocation I |
Institutional | 1,000.00 | 1,055.19 | 0.13 | 0.67 | |||||||||||||
| Growth Allocation I |
Institutional | 1,000.00 | 1,054.65 | 0.14 | 0.72 | |||||||||||||
| Aggressive Allocation I |
Institutional | 1,000.00 | 1,047.15 | 0.15 | 0.77 | |||||||||||||
| Money Market |
Institutional | 1,000.00 | 1,000.09 | 0.18 | 0.90 | |||||||||||||
| Investor | 1,000.00 | 1,000.06 | 0.19 | 0.93 | ||||||||||||||
| Low-Duration Bond |
Institutional | 1,000.00 | 1,010.67 | 0.36 | 1.79 | |||||||||||||
| Investor | 1,000.00 | 1,009.55 | 0.57 | 2.84 | ||||||||||||||
| Medium-Duration Bond |
Institutional | 1,000.00 | 1,041.98 | 0.48 | 2.43 | |||||||||||||
| Investor | 1,000.00 | 1,040.97 | 0.63 | 3.19 | ||||||||||||||
5
Table of Contents
About Your Expenses (Continued)
| Actual |
||||||||||||||||||
| Beginning | Ending | Annualized | Expenses | |||||||||||||||
| Account Value | Account Value | Expense | Paid During | |||||||||||||||
| Fund |
Class | 01/01/14 | 06/30/14 | Ratio (1) | Period (2) | |||||||||||||
| Extended-Duration Bond |
Institutional | $ | 1,000.00 | $ | 1,122.04 | 0.56 | % | $ | 2.97 | |||||||||
| Investor | 1,000.00 | 1,120.57 | 0.75 | 3.94 | ||||||||||||||
| Global Bond |
Investor | 1,000.00 | 1,062.00 | 0.78 | 3.99 | |||||||||||||
| Defensive Market Strategies (3) |
Institutional | 1,000.00 | 1,069.22 | 1.02 | 5.26 | |||||||||||||
| Investor | 1,000.00 | 1,068.39 | 1.20 | 6.16 | ||||||||||||||
| Equity Index |
Institutional | 1,000.00 | 1,070.20 | 0.21 | 1.10 | |||||||||||||
| Investor | 1,000.00 | 1,069.07 | 0.38 | 1.95 | ||||||||||||||
| Value Equity |
Institutional | 1,000.00 | 1,066.49 | 0.66 | 3.36 | |||||||||||||
| Investor | 1,000.00 | 1,064.94 | 0.90 | 4.61 | ||||||||||||||
| Growth Equity |
Institutional | 1,000.00 | 1,035.82 | 0.85 | 4.31 | |||||||||||||
| Investor | 1,000.00 | 1,035.06 | 1.06 | 5.33 | ||||||||||||||
| Small Cap Equity |
Institutional | 1,000.00 | 1,022.22 | 0.97 | 4.84 | |||||||||||||
| Investor | 1,000.00 | 1,021.44 | 1.20 | 6.01 | ||||||||||||||
| International Equity (3) |
Institutional | 1,000.00 | 1,038.09 | 1.19 | 6.02 | |||||||||||||
| Investor | 1,000.00 | 1,036.75 | 1.44 | 7.25 | ||||||||||||||
| Emerging Markets Equity |
Institutional | 1,000.00 | 1,071.79 | 1.25 | 6.42 | |||||||||||||
| Investor | 1,000.00 | 1,070.77 | 1.50 | 7.70 | ||||||||||||||
| Inflation Protected Bond |
Investor | 1,000.00 | 1,054.37 | 0.62 | 3.14 | |||||||||||||
| Flexible Income |
Investor | 1,000.00 | 1,014.96 | 1.20 | 6.00 | |||||||||||||
| Real Assets |
Investor | 1,000.00 | 1,074.34 | 0.12 | 0.62 | |||||||||||||
| Real Estate Securities |
Investor | 1,000.00 | 1,119.01 | 1.10 | 5.79 | |||||||||||||
| Global Natural Resources Equity |
Investor | 1,000.00 | 1,157.57 | 1.35 | 7.23 | |||||||||||||
| HYPOTHETICAL (assuming a 5% return before expenses) |
||||||||||||||||||
| Beginning | Ending | Annualized | Expenses | |||||||||||||||
| Account Value | Account Value | Expense | Paid During | |||||||||||||||
| Fund |
Class | 01/01/14 | 06/30/14 | Ratio (1) | Period (2) | |||||||||||||
| MyDestination 2005 |
Investor | $ | 1,000.00 | $ | 1,023.79 | 0.20 | % | $ | 1.00 | |||||||||
| MyDestination 2015 |
Investor | 1,000.00 | 1,024.09 | 0.14 | 0.70 | |||||||||||||
| MyDestination 2025 |
Investor | 1,000.00 | 1,024.11 | 0.14 | 0.68 | |||||||||||||
| MyDestination 2035 |
Investor | 1,000.00 | 1,024.02 | 0.15 | 0.77 | |||||||||||||
| MyDestination 2045 |
Investor | 1,000.00 | 1,023.79 | 0.20 | 1.00 | |||||||||||||
| MyDestination 2055 |
Investor | 1,000.00 | 1,023.79 | 0.20 | 1.00 | |||||||||||||
| Conservative Allocation |
Investor | 1,000.00 | 1,024.19 | 0.12 | 0.60 | |||||||||||||
| Balanced Allocation |
Investor | 1,000.00 | 1,024.19 | 0.12 | 0.60 | |||||||||||||
| Growth Allocation |
Investor | 1,000.00 | 1,024.19 | 0.12 | 0.60 | |||||||||||||
| Aggressive Allocation |
Investor | 1,000.00 | 1,024.19 | 0.12 | 0.60 | |||||||||||||
| Conservative Allocation I |
Institutional | 1,000.00 | 1,024.03 | 0.15 | 0.76 | |||||||||||||
| Balanced Allocation I |
Institutional | 1,000.00 | 1,024.13 | 0.13 | 0.66 | |||||||||||||
| Growth Allocation I |
Institutional | 1,000.00 | 1,024.08 | 0.14 | 0.71 | |||||||||||||
| Aggressive Allocation I |
Institutional | 1,000.00 | 1,024.03 | 0.15 | 0.76 | |||||||||||||
| Money Market |
Institutional | 1,000.00 | 1,023.88 | 0.18 | 0.91 | |||||||||||||
| Investor | 1,000.00 | 1,023.85 | 0.19 | 0.94 | ||||||||||||||
6
Table of Contents
| HYPOTHETICAL (assuming a 5% return before expenses) |
||||||||||||||||||
| Beginning | Ending | Annualized | Expenses | |||||||||||||||
| Account Value | Account Value | Expense | Paid During | |||||||||||||||
| Fund |
Class | 01/01/14 | 06/30/14 | Ratio (1) | Period (2) | |||||||||||||
| Low-Duration Bond |
Institutional | $ | 1,000.00 | $ | 1,022.98 | 0.36 | % | $ | 1.81 | |||||||||
| Investor | 1,000.00 | 1,021.93 | 0.57 | 2.86 | ||||||||||||||
| Medium-Duration Bond |
Institutional | 1,000.00 | 1,022.38 | 0.48 | 2.41 | |||||||||||||
| Investor | 1,000.00 | 1,021.63 | 0.63 | 3.16 | ||||||||||||||
| Extended-Duration Bond |
Institutional | 1,000.00 | 1,021.96 | 0.56 | 2.83 | |||||||||||||
| Investor | 1,000.00 | 1,021.02 | 0.75 | 3.77 | ||||||||||||||
| Global Bond |
Investor | 1,000.00 | 1,020.87 | 0.78 | 3.92 | |||||||||||||
| Defensive Market Strategies (3) |
Institutional | 1,000.00 | 1,019.65 | 1.02 | 5.14 | |||||||||||||
| Investor | 1,000.00 | 1,018.76 | 1.20 | 6.03 | ||||||||||||||
| Equity Index |
Institutional | 1,000.00 | 1,023.71 | 0.21 | 1.08 | |||||||||||||
| Investor | 1,000.00 | 1,022.88 | 0.38 | 1.91 | ||||||||||||||
| Value Equity |
Institutional | 1,000.00 | 1,021.49 | 0.66 | 3.30 | |||||||||||||
| Investor | 1,000.00 | 1,020.27 | 0.90 | 4.52 | ||||||||||||||
| Growth Equity |
Institutional | 1,000.00 | 1,020.50 | 0.85 | 4.29 | |||||||||||||
| Investor | 1,000.00 | 1,019.49 | 1.06 | 5.30 | ||||||||||||||
| Small Cap Equity |
Institutional | 1,000.00 | 1,019.94 | 0.97 | 4.85 | |||||||||||||
| Investor | 1,000.00 | 1,018.77 | 1.20 | 6.02 | ||||||||||||||
| International Equity (3) |
Institutional | 1,000.00 | 1,018.81 | 1.19 | 5.98 | |||||||||||||
| Investor | 1,000.00 | 1,017.58 | 1.44 | 7.21 | ||||||||||||||
| Emerging Markets Equity |
Institutional | 1,000.00 | 1,018.51 | 1.25 | 6.28 | |||||||||||||
| Investor | 1,000.00 | 1,017.26 | 1.50 | 7.53 | ||||||||||||||
| Inflation Protected Fund |
Investor | 1,000.00 | 1,021.69 | 0.62 | 3.10 | |||||||||||||
| Flexible Income |
Investor | 1,000.00 | 1,018.77 | 1.20 | 6.02 | |||||||||||||
| Real Assets |
Investor | 1,000.00 | 1,024.19 | 0.12 | 0.60 | |||||||||||||
| Real Estate Securities Fund |
Investor | 1,000.00 | 1,019.26 | 1.10 | 5.53 | |||||||||||||
| Global Natural Resources Equity |
Investor | 1,000.00 | 1,018.01 | 1.35 | 6.78 | |||||||||||||
| (1) | Expenses include the effect of contractual waivers by GuideStone Capital Management. The Date Target Funds’, Asset Allocation Funds’ and Real Assets Fund’s proportionate share of the operating expenses of the Select Funds is not reflected in the tables above. |
| (2) | Expenses are equal to the Fund’s annualized expense ratios for the period January 1, 2014 through June 30, 2014, multiplied by the average account value over the period, multiplied by 181/365 (to reflect the one-half year period). |
| (3) | The expense ratios for the Defensive Market Strategies Fund and the International Equity Fund include the impact of dividend and interest expense on securities sold short. |
7
Table of Contents
ABBREVIATIONS, FOOTNOTES AND INDEX DEFINITIONS
8
Table of Contents
ABBREVIATIONS, FOOTNOTES AND INDEX DEFINITIONS
9
Table of Contents
ABBREVIATIONS, FOOTNOTES AND INDEX DEFINITIONS
INDEX DEFINITIONS:
The Barclays U.S. Aggregate Bond Index represents securities that are SEC-registered, taxable and dollar denominated. The index covers the U.S. investment grade fixed-rate bond market, with index components for government and corporate securities, mortgage pass-through securities, and asset-backed securities.
The CMBX Indexes are a group of indices made up of 25 tranches of commercial mortgage-backed securities (CMBS), each with different credit ratings.
The Dow Jones CDX Indexes are a series of indices that track North American and emerging market credit derivative indexes. This family of indices comprises a basket of credit derivatives that are representative of certain segments such as North American investment grade credit derivatives (NA.IG), high yield (NA.HY), and emerging markets (NA.EM).
The iTraxx Indexes are a group of international credit derivative indices that are monitored by the International Index Company (IIC). iTraxx indices cover credit derivatives markets in Europe, Asia and Australia.
The MSCI EAFE Index (Europe, Australasia, Far East) is a free float-adjusted market capitalization index that is designed to measure the equity market performance of developed markets, excluding the U.S. & Canada. The MSCI EAFE Index consists of the following 21 developed market country indices: Australia, Austria, Belgium, Denmark, Finland, France, Germany, Hong Kong, Ireland, Israel, Italy, Japan, the Netherlands, New Zealand, Norway, Portugal, Singapore, Spain, Sweden, Switzerland, and the United Kingdom.
The MSCI EM (Emerging Markets) Index is a free float-adjusted market capitalization index that is designed to measure equity market performance of emerging markets. The index consisted of the following 21 emerging market country indices: Brazil, Chile, China, Colombia, Czech Republic, Egypt, Greece, Hungary, India, Indonesia, Korea, Malaysia, Mexico, Peru, Philippines, Poland, Russia, South Africa, Taiwan, Thailand, and Turkey
The Russell 1000® Value Index is a large-cap index consisting of those Russell 1000® Index securities with a less-than-average growth orientation. Companies in this index tend to exhibit lower price-to-book and price-to-earnings ratios, higher dividend yields and lower forecasted growth values than the growth universe.
The Russell 2000® Index measures the performance of the small-cap segment of the U.S. equity universe. The Russell 2000® Index is a subset of the Russell 3000® Index representing approximately 10% of the total market capitalization of that index. It includes approximately 2,000 of the smallest securities based on a combination of their market cap and current index membership. The Russell 2000® Index is constructed to provide a comprehensive and unbiased small-cap barometer and is completely reconstituted annually to ensure that larger stocks do not distort the performance and characteristics of the actual small-cap opportunity set.
The S&P 500® Index is an unmanaged index (with no defined investment objective) of common stocks, includes reinvestment of dividends, and is a registered trademark of McGraw-Hill Co., Inc. The S&P 500® Index includes 500 of the largest stocks (in terms of market value) in the United States.
10
Table of Contents
(This page intentionally left blank)
11
Table of Contents
| MYDESTINATION 2005 FUND | ||
| SCHEDULE OF INVESTMENTS | June 30, 2014 (Unaudited) |
See Notes to Financial Statements.
12
Table of Contents
VALUATION HIERARCHY
The following is a summary of the inputs used, as of June 30, 2014, in valuing the Fund’s investments carried at fair value:
| Level 2 | Level 3 | |||||||||||||||
| Total | Level 1 | Other Significant | Significant | |||||||||||||
| Value | Quoted Prices | Observable Inputs | Unobservable Inputs | |||||||||||||
| Assets: |
||||||||||||||||
| Investments in Securities: |
||||||||||||||||
| Mutual Funds |
$ | 90,512,887 | $ | 90,512,887 | $ | — | $ | — | ||||||||
|
|
|
|
|
|
|
|
|
|||||||||
| Total Assets — Investments in Securities |
$ | 90,512,887 | $ | 90,512,887 | $ | — | $ | — | ||||||||
|
|
|
|
|
|
|
|
|
|||||||||
| Other Financial Instruments*** |
||||||||||||||||
| Futures Contracts |
$ | 8,762 | $ | 8,762 | $ | — | $ | — | ||||||||
|
|
|
|
|
|
|
|
|
|||||||||
| Total Assets — Other Financial Instruments |
$ | 8,762 | $ | 8,762 | $ | — | $ | — | ||||||||
|
|
|
|
|
|
|
|
|
|||||||||
| *** | Other financial instruments are derivative instruments not reflected in the Schedule of Investments, such as futures, forwards and swap contracts, which are valued at the unrealized appreciation (depreciation) on the investment. Details of these investments can be found in the Notes to Financial Statements. |
See Notes to Financial Statements.
13
Table of Contents
| MYDESTINATION 2015 FUND | ||
| SCHEDULE OF INVESTMENTS | June 30, 2014 (Unaudited) |
See Notes to Financial Statements.
14
Table of Contents
VALUATION HIERARCHY
The following is a summary of the inputs used, as of June 30, 2014, in valuing the Fund’s investments carried at fair value:
| Total Value |
Level 1 Quoted Prices |
Level 2 Other Significant Observable Inputs |
Level
3 Significant Unobservable Inputs |
|||||||||||||
| Assets: |
||||||||||||||||
| Investments in Securities: |
||||||||||||||||
| Mutual Funds |
$ | 477,363,960 | $ | 477,363,960 | $ | — | $ | — | ||||||||
|
|
|
|
|
|
|
|
|
|||||||||
| Total Assets — Investments in Securities |
$ | 477,363,960 | $ | 477,363,960 | $ | — | $ | — | ||||||||
|
|
|
|
|
|
|
|
|
|||||||||
| Other Financial Instruments*** |
||||||||||||||||
| Futures Contracts |
$ | 46,717 | $ | 46,717 | $ | — | $ | — | ||||||||
|
|
|
|
|
|
|
|
|
|||||||||
| Total Assets — Other Financial Instruments |
$ | 46,717 | $ | 46,717 | $ | — | $ | — | ||||||||
|
|
|
|
|
|
|
|
|
|||||||||
| *** | Other financial instruments are derivative instruments not reflected in the Schedule of Investments, such as futures, forwards and swap contracts, which are valued at the unrealized appreciation (depreciation) on the investment. Details of these investments can be found in the Notes to Financial Statements. |
See Notes to Financial Statements.
15
Table of Contents
| MYDESTINATION 2025 FUND | ||
| SCHEDULE OF INVESTMENTS | June 30, 2014 (Unaudited) |
See Notes to Financial Statements.
16
Table of Contents
VALUATION HIERARCHY
The following is a summary of the inputs used, as of June 30, 2014, in valuing the Fund’s investments carried at fair value:
| Level 2 | Level 3 | |||||||||||||||
| Total | Level 1 | Other Significant | Significant | |||||||||||||
| Value | Quoted Prices | Observable Inputs | Unobservable Inputs | |||||||||||||
| Assets: |
||||||||||||||||
| Investments in Securities: |
||||||||||||||||
| Mutual Funds |
$ | 619,882,057 | $ | 619,882,057 | $ | — | $ | — | ||||||||
|
|
|
|
|
|
|
|
|
|||||||||
| Total Assets — Investments in Securities |
$ | 619,882,057 | $ | 619,882,057 | $ | — | $ | — | ||||||||
|
|
|
|
|
|
|
|
|
|||||||||
| Other Financial Instruments*** |
||||||||||||||||
| Futures Contracts |
$ | 69,168 | $ | 69,168 | $ | — | $ | — | ||||||||
|
|
|
|
|
|
|
|
|
|||||||||
| Total Assets — Other Financial Instruments |
$ | 69,168 | $ | 69,168 | $ | — | $ | — | ||||||||
|
|
|
|
|
|
|
|
|
|||||||||
| *** | Other financial instruments are derivative instruments not reflected in the Schedule of Investments, such as futures, forwards and swap contracts, which are valued at the unrealized appreciation (depreciation) on the investment. Details of these investments can be found in the Notes to Financial Statements. |
See Notes to Financial Statements.
17
Table of Contents
| SCHEDULE OF INVESTMENTS |
June 30, 2014 (Unaudited) |
See Notes to Financial Statements.
18
Table of Contents
VALUATION HIERARCHY
The following is a summary of the inputs used, as of June 30, 2014, in valuing the Fund’s investments carried at fair value:
| Total Value |
Level 1 Quoted Prices |
Level 2 Other Significant Observable Inputs |
Level
3 Significant Unobservable Inputs |
|||||||||||||
| Assets: |
||||||||||||||||
| Investments in Securities: |
||||||||||||||||
| Mutual Funds |
$ | 338,396,829 | $ | 338,396,829 | $ | — | $ | — | ||||||||
|
|
|
|
|
|
|
|
|
|||||||||
| Total Assets — Investments in Securities |
$ | 338,396,829 | $ | 338,396,829 | $ | — | $ | — | ||||||||
|
|
|
|
|
|
|
|
|
|||||||||
| Other Financial Instruments*** |
||||||||||||||||
| Futures Contracts |
$ | 58,163 | $ | 58,163 | $ | — | $ | — | ||||||||
|
|
|
|
|
|
|
|
|
|||||||||
| Total Assets — Other Financial Instruments |
$ | 58,163 | $ | 58,163 | $ | — | $ | — | ||||||||
|
|
|
|
|
|
|
|
|
|||||||||
| *** | Other financial instruments are derivative instruments not reflected in the Schedule of Investments, such as futures, forwards and swap contracts, which are valued at the unrealized appreciation (depreciation) on the investment. Details of these investments can be found in the Notes to Financial Statements. |
See Notes to Financial Statements.
19
Table of Contents
|
SCHEDULE OF INVESTMENTS |
June 30, 2014 (Unaudited) |
VALUATION HIERARCHY
The following is a summary of the inputs used, as of June 30, 2014, in valuing the Fund’s investments carried at fair value:
| Total Value |
Level 1 Quoted Prices |
Level
2 Other Significant Observable Inputs |
Level
3 Significant Unobservable Inputs |
|||||||||||||
| Assets: |
||||||||||||||||
| Investments in Securities: |
||||||||||||||||
| Mutual Funds |
$ | 240,646,690 | $ | 240,646,690 | $ | — | $ | — | ||||||||
|
|
|
|
|
|
|
|
|
|||||||||
| Total Assets — Investments in Securities |
$ | 240,646,690 | $ | 240,646,690 | $ | — | $ | — | ||||||||
|
|
|
|
|
|
|
|
|
|||||||||
| Other Financial Instruments*** |
||||||||||||||||
| Futures Contracts |
$ | 43,327 | $ | 43,327 | $ | — | $ | — | ||||||||
|
|
|
|
|
|
|
|
|
|||||||||
| Total Assets — Other Financial Instruments |
$ | 43,327 | $ | 43,327 | $ | — | $ | — | ||||||||
|
|
|
|
|
|
|
|
|
|||||||||
| *** | Other financial instruments are derivative instruments not reflected in the Schedule of Investments, such as futures, forwards and swap contracts, which are valued at the unrealized appreciation (depreciation) on the investment. Details of these investments can be found in the Notes to Financial Statements. |
See Notes to Financial Statements.
20
Table of Contents
| SCHEDULE OF INVESTMENTS |
June 30, 2014 (Unaudited) |
VALUATION HIERARCHY
The following is a summary of the inputs used, as of June 30, 2014, in valuing the Fund’s investments carried at fair value:
| Total Value |
Level
1 Quoted Prices |
Level 2 Other Significant Observable Inputs |
Level 3 Significant Unobservable Inputs |
|||||||||||||
| Assets: |
||||||||||||||||
| Investments in Securities: |
||||||||||||||||
| Mutual Funds |
$ | 21,887,094 | $ | 21,887,094 | $ | — | $ | — | ||||||||
|
|
|
|
|
|
|
|
|
|||||||||
| Total Assets — Investments in Securities |
$ | 21,887,094 | $ | 21,887,094 | $ | — | $ | — | ||||||||
|
|
|
|
|
|
|
|
|
|||||||||
| Other Financial Instruments*** |
||||||||||||||||
| Futures Contracts |
$ | 5,840 | $ | 5,840 | $ | — | $ | — | ||||||||
|
|
|
|
|
|
|
|
|
|||||||||
| Total Assets — Other Financial Instruments |
$ | 5,840 | $ | 5,840 | $ | — | $ | — | ||||||||
|
|
|
|
|
|
|
|
|
|||||||||
| *** | Other financial instruments are derivative instruments not reflected in the Schedule of Investments, such as futures, forwards and swap contracts, which are valued at the unrealized appreciation (depreciation) on the investment. Details of these investments can be found in the Notes to Financial Statements. |
See Notes to Financial Statements.
21
Table of Contents
| STATEMENTS OF ASSETS AND LIABILITIES | June 30, 2014 (Unaudited) |
| MyDestination 2005 Fund |
MyDestination 2015 Fund |
|||||||
| Assets |
||||||||
| Investments in securities of unaffiliated issuers, at value |
$ | 1,727,154 | $ | 10,062,589 | ||||
| Investments in securities of affiliated issuers, at value |
88,785,733 | 467,301,371 | ||||||
|
|
|
|
|
|||||
| Total investments (1) |
90,512,887 | 477,363,960 | ||||||
| Cash collateral for derivatives |
77,200 | 238,000 | ||||||
| Receivables: |
||||||||
| Dividends and reclaims |
14 | 63 | ||||||
| Receivable from advisor |
— | — | ||||||
| Fund shares sold |
51,628 | 29,485 | ||||||
| Variation margin on financial futures contracts |
120 | 2,904 | ||||||
| Prepaid expenses and other assets |
9,345 | 9,749 | ||||||
|
|
|
|
|
|||||
| Total Assets |
90,651,194 | 477,644,161 | ||||||
|
|
|
|
|
|||||
| Liabilities |
||||||||
| Payables: |
||||||||
| Fund shares redeemed |
13,782 | 222,985 | ||||||
| Variation margin on financial futures contracts |
— | 800 | ||||||
| Accrued expenses: |
||||||||
| Investment advisory fees |
4,745 | 39,683 | ||||||
| Other expenses |
24,456 | 31,564 | ||||||
|
|
|
|
|
|||||
| Total Liabilities |
42,983 | 295,032 | ||||||
|
|
|
|
|
|||||
| Net Assets |
$ | 90,608,211 | $ | 477,349,129 | ||||
|
|
|
|
|
|||||
| Net Assets Consist of: |
||||||||
| Paid-in-capital |
$ | 83,663,036 | $ | 409,115,905 | ||||
| Accumulated net investment income |
462,678 | 2,094,504 | ||||||
| Undistributed net realized gain on investments and derivative transactions |
989,363 | 6,506,321 | ||||||
| Net unrealized appreciation (depreciation) on investments and derivative transactions |
5,493,134 | 59,632,399 | ||||||
|
|
|
|
|
|||||
| Net Assets |
$ | 90,608,211 | $ | 477,349,129 | ||||
|
|
|
|
|
|||||
| Net Asset Value: |
||||||||
| $0.001 par value, unlimited shares authorized |
||||||||
| Net assets applicable to the Investor Class |
$ | 90,608,211 | $ | 477,349,129 | ||||
|
|
|
|
|
|||||
| Investor shares outstanding |
8,160,612 | 41,430,892 | ||||||
|
|
|
|
|
|||||
| Net asset value, offering and redemption price per Investor share |
$ | 11.10 | $ | 11.52 | ||||
|
|
|
|
|
|||||
|
(1) Investments in securities of unaffiliated issuers, at cost |
$ | 1,632,332 | $ | 9,596,400 | ||||
| Investments in securities of affiliated issuers, at cost |
83,396,183 | 408,181,878 | ||||||
|
|
|
|
|
|||||
| Total investments at cost |
$ | 85,028,515 | $ | 417,778,278 | ||||
|
|
|
|
|
See Notes to Financial Statements.
22
Table of Contents
| MyDestination |
MyDestination 2035 Fund |
MyDestination 2045 Fund |
MyDestination 2055 Fund |
|||||||||||
| $ | 18,128,505 | $ | 10,367,103 | $ | 7,484,101 | $ | 701,294 | |||||||
| 601,753,552 | 328,029,726 | 233,162,589 | 21,185,800 | |||||||||||
|
|
|
|
|
|
|
|
|
|||||||
| 619,882,057 | 338,396,829 | 240,646,690 | 21,887,094 | |||||||||||
| 360,300 | 351,900 | 275,500 | 35,000 | |||||||||||
| 83 | 58 | 40 | 4 | |||||||||||
| — | — | — | 5,902 | |||||||||||
| 160,802 | 51,528 | 79,955 | 24,227 | |||||||||||
| 4,069 | 3,042 | 1,821 | 80 | |||||||||||
| 10,074 | 9,316 | 8,881 | 7,397 | |||||||||||
|
|
|
|
|
|
|
|
|
|||||||
| 620,417,385 | 338,812,673 | 241,012,887 | 21,959,704 | |||||||||||
|
|
|
|
|
|
|
|
|
|||||||
| 20 | 119,798 | — | 1,509 | |||||||||||
| 1,600 | 1,350 | 1,120 | — | |||||||||||
| 51,330 | 28,078 | 26,506 | — | |||||||||||
| 34,825 | 29,346 | 27,056 | 14,813 | |||||||||||
|
|
|
|
|
|
|
|
|
|||||||
| 87,775 | 178,572 | 54,682 | 16,322 | |||||||||||
|
|
|
|
|
|
|
|
|
|||||||
| $ | 620,329,610 | $ | 338,634,101 | $ | 240,958,205 | $ | 21,943,382 | |||||||
|
|
|
|
|
|
|
|
|
|||||||
| $ | 519,112,671 | $ | 272,177,178 | $ | 192,556,824 | $ | 19,224,714 | |||||||
| 2,174,223 | 748,747 | 285,643 | 22,105 | |||||||||||
| 12,160,295 | 10,380,688 | 7,257,805 | 846,118 | |||||||||||
| 86,882,421 | 55,327,488 | 40,857,933 | 1,850,445 | |||||||||||
|
|
|
|
|
|
|
|
|
|||||||
| $ | 620,329,610 | $ | 338,634,101 | $ | 240,958,205 | $ | 21,943,382 | |||||||
|
|
|
|
|
|
|
|
|
|||||||
| $ | 620,329,610 | $ | 338,634,101 | $ | 240,958,205 | $ | 21,943,382 | |||||||
|
|
|
|
|
|
|
|
|
|||||||
| 54,439,627 | 29,745,373 | 22,051,815 | 1,609,685 | |||||||||||
|
|
|
|
|
|
|
|
|
|||||||
| $ | 11.39 | $ | 11.38 | $ | 10.93 | $ | 13.63 | |||||||
|
|
|
|
|
|
|
|
|
|||||||
| $ | 17,133,700 | $ | 9,778,450 | $ | 7,113,900 | $ | 668,480 | |||||||
| 515,935,104 | 273,349,054 | 192,718,184 | 19,374,009 | |||||||||||
|
|
|
|
|
|
|
|
|
|||||||
| $ | 533,068,804 | $ | 283,127,504 | $ | 199,832,084 | $ | 20,042,489 | |||||||
|
|
|
|
|
|
|
|
|
|||||||
See Notes to Financial Statements.
23
Table of Contents
| STATEMENTS OF OPERATIONS | For the Six Months Ended June 30, 2014 (Unaudited) |
| MyDestination 2005 Fund |
MyDestination 2015 Fund |
|||||||
| Investment Income |
||||||||
| Income dividends received from affiliated funds |
$ | 466,068 | $ | 2,411,022 | ||||
|
|
|
|
|
|||||
| Total Investment Income |
466,068 | 2,411,022 | ||||||
|
|
|
|
|
|||||
| Expenses |
||||||||
| Investment advisory fees |
44,482 | 230,234 | ||||||
| Transfer agent fees: |
||||||||
| Investor Shares |
9,722 | 11,701 | ||||||
| Custodian fees |
7,402 | 11,815 | ||||||
| Distribution (12b-1) fees: |
||||||||
| Shareholder servicing fees: |
||||||||
| Accounting and administration fees |
4,368 | 13,901 | ||||||
| Professional fees |
22,797 | 22,797 | ||||||
| Blue sky fees: |
||||||||
| Investor Shares |
9,444 | 9,970 | ||||||
| Shareholder reporting fees: |
||||||||
| Investor Shares |
2,576 | 6,807 | ||||||
| Trustee expenses |
414 | 2,127 | ||||||
| Line of credit facility fees |
311 | 1,593 | ||||||
| Other expenses |
4,643 | 5,573 | ||||||
|
|
|
|
|
|||||
| Total Expenses |
106,159 | 316,518 | ||||||
| Expenses waived/reimbursed net of amount recaptured(1) |
(18,984 | ) | — | |||||
|
|
|
|
|
|||||
| Net Expenses |
87,175 | 316,518 | ||||||
|
|
|
|
|
|||||
| Net investment income |
378,893 | 2,094,504 | ||||||
|
|
|
|
|
|||||
| Realized and Unrealized Gain (Loss) |
||||||||
| Capital gain distributions received from affiliated funds |
216,910 | 1,754,547 | ||||||
| Net realized gain on investment securities of affiliated issuers |
552,939 | 1,410,194 | ||||||
| Net realized gain (loss) on investment securities of unaffiliated issuers |
3,552 | — | ||||||
| Net realized gain on futures transactions |
47,041 | 354,582 | ||||||
|
|
|
|
|
|||||
| Net realized gain |
820,442 | 3,519,323 | ||||||
|
|
|
|
|
|||||
| Change in unrealized appreciation (depreciation) on investment securities of affiliated issuers |
2,005,607 | 16,597,784 | ||||||
| Change in unrealized appreciation (depreciation) on investment securities of unaffiliated issuers |
106,662 | 614,211 | ||||||
| Change in unrealized appreciation (depreciation) on futures |
(9,341 | ) | (53,783 | ) | ||||
|
|
|
|
|
|||||
| Net change in unrealized appreciation (depreciation) |
2,102,928 | 17,158,212 | ||||||
|
|
|
|
|
|||||
| Net Realized and Unrealized Gain |
2,923,370 | 20,677,535 | ||||||
|
|
|
|
|
|||||
| Net Increase in Net Assets Resulting from Operations |
$ | 3,302,263 | $ | 22,772,039 | ||||
|
|
|
|
|
|||||
| (1) | See Note 3a and 3c in Notes to Financial Statements. |
See Notes to Financial Statements.
24
Table of Contents
| MyDestination |
MyDestination 2035 Fund |
MyDestination 2045 Fund |
MyDestination 2055 Fund |
|||||||||||
| $ | 2,563,656 | $ | 984,705 | $ | 506,451 | $ | 40,629 | |||||||
|
|
|
|
|
|
|
|
|
|||||||
| 2,563,656 | 984,705 | 506,451 | 40,629 | |||||||||||
|
|
|
|
|
|
|
|
|
|||||||
| 292,081 | 157,656 | 112,916 | 9,492 | |||||||||||
| 12,271 | 10,686 | 10,532 | 8,740 | |||||||||||
| 14,962 | 12,009 | 10,271 | 3,564 | |||||||||||
| 17,010 | 10,081 | 7,806 | 1,925 | |||||||||||
| 22,797 | 22,797 | 22,797 | 22,797 | |||||||||||
| 10,313 | 9,661 | 9,213 | 8,648 | |||||||||||
| 8,333 | 4,830 | 4,506 | 947 | |||||||||||
| 2,636 | 1,402 | 1,012 | 79 | |||||||||||
| 1,973 | 1,048 | 757 | 59 | |||||||||||
| 7,057 | 5,788 | 5,512 | 4,742 | |||||||||||
|
|
|
|
|
|
|
|
|
|||||||
| 389,433 | 235,958 | 185,322 | 60,993 | |||||||||||
| — | — | 35,486 | (42,469 | ) | ||||||||||
|
|
|
|
|
|
|
|
|
|||||||
| 389,433 | 235,958 | 220,808 | 18,524 | |||||||||||
|
|
|
|
|
|
|
|
|
|||||||
| 2,174,223 | 748,747 | 285,643 | 22,105 | |||||||||||
|
|
|
|
|
|
|
|
|
|||||||
| 2,681,159 | 1,467,133 | 1,122,194 | 101,954 | |||||||||||
| 1,239,856 | 378,632 | 84,021 | — | |||||||||||
| — | — | 351,220 | 84,020 | |||||||||||
| 609,371 | 539,348 | 380,437 | 30,761 | |||||||||||
|
|
|
|
|
|
|
|
|
|||||||
| 4,530,386 | 2,385,113 | 1,937,872 | 216,735 | |||||||||||
|
|
|
|
|
|
|
|
|
|||||||
| 24,262,108 | 13,724,241 | 9,475,165 | 772,085 | |||||||||||
| 1,085,104 | 638,617 | 461,716 | 35,341 | |||||||||||
| (113,326) | (102,067 | ) | (86,195 | ) | (5,022 | ) | ||||||||
|
|
|
|
|
|
|
|
|
|||||||
| 25,233,886 | 14,260,791 | 9,850,686 | 802,404 | |||||||||||
|
|
|
|
|
|
|
|
|
|||||||
| 29,764,272 | 16,645,904 | 11,788,558 | 1,019,139 | |||||||||||
|
|
|
|
|
|
|
|
|
|||||||
| $ | 31,938,495 | $ | 17,394,651 | $ | 12,074,201 | $ | 1,041,244 | |||||||
|
|
|
|
|
|
|
|
|
|||||||
See Notes to Financial Statements.
25
Table of Contents
STATEMENTS OF CHANGES IN NET ASSETS
| MyDestination 2005 Fund |
MyDestination 2015 Fund |
|||||||||||||||
| For the Six Months Ended 06/30/14 |
For the
Year Ended 12/31/13 |
For the Six Months Ended 06/30/14 |
For the
Year Ended 12/31/13 |
|||||||||||||
| (Unaudited) | (Unaudited) | |||||||||||||||
| Operations: |
||||||||||||||||
| Net investment income |
$ | 378,893 | $ | 737,222 | $ | 2,094,504 | $ | 4,363,754 | ||||||||
| Net realized gain on investment securities and futures transactions |
820,442 | 6,635,901 | 3,519,323 | 30,185,454 | ||||||||||||
| Net change in unrealized appreciation (depreciation) on investment securities and futures |
2,102,928 | (2,368,726 | ) | 17,158,212 | 4,099,123 | |||||||||||
|
|
|
|
|
|
|
|
|
|||||||||
| Net increase in net assets resulting from operations |
3,302,263 | 5,004,397 | 22,772,039 | 38,648,331 | ||||||||||||
|
|
|
|
|
|
|
|
|
|||||||||
| Dividends and Distributions to Shareholders: |
||||||||||||||||
| Dividends from net investment income(1) |
— | (1,430,800 | ) | — | (11,087,547 | ) | ||||||||||
| Distributions from net realized capital gains |
— | — | — | (502,477 | ) | |||||||||||
|
|
|
|
|
|
|
|
|
|||||||||
| Total dividends and distributions |
— | (1,430,800 | ) | — | (11,590,024 | ) | ||||||||||
|
|
|
|
|
|
|
|
|
|||||||||
| Capital Share Transactions: |
||||||||||||||||
| Proceeds from shares sold |
||||||||||||||||
| Proceeds from Investor shares sold |
12,333,092 | 25,244,242 | 36,333,966 | 84,263,438 | ||||||||||||
| Reinvestment of dividends and distributions into Investor shares |
— | 1,430,198 | — | 11,589,750 | ||||||||||||
| Value of Investor shares redeemed |
(9,843,820 | ) | (26,013,585 | ) | (22,237,938 | ) | (35,006,811 | ) | ||||||||
|
|
|
|
|
|
|
|
|
|||||||||
| Net increase from capital share transactions(2) |
2,489,272 | 660,855 | 14,096,028 | 60,846,377 | ||||||||||||
|
|
|
|
|
|
|
|
|
|||||||||
| Total increase in net assets |
5,791,535 | 4,234,452 | 36,868,067 | 87,904,684 | ||||||||||||
|
|
|
|
|
|
|
|
|
|||||||||
| Net Assets: |
||||||||||||||||
| Beginning of Period |
84,816,676 | 80,582,224 | 440,481,062 | 352,576,378 | ||||||||||||
|
|
|
|
|
|
|
|
|
|||||||||
| End of Period* |
$ | 90,608,211 | $ | 84,816,676 | $ | 477,349,129 | $ | 440,481,062 | ||||||||
|
|
|
|
|
|
|
|
|
|||||||||
| *Including undistributed net investment income |
$ | 462,678 | $ | 83,785 | $ | 2,094,504 | $ | — | ||||||||
|
|
|
|
|
|
|
|
|
|||||||||
| (1) | Includes dividends paid from the short-term portion of capital gain distributions received from affiliated funds. |
| (2) | See Note 6 in Notes to Financial Statements. |
See Notes to Financial Statements.
26
Table of Contents
| MyDestination 2025 Fund |
MyDestination 2035 Fund |
MyDestination 2045 Fund |
MyDestination 2055 Fund |
|||||||||||||||||||||||||||
| For the Six Months Ended 06/30/14 |
For the
Year Ended 12/31/13 |
For the Six Months Ended 06/30/14 |
For the
Year Ended 12/31/13 |
For the Six Months Ended 06/30/14 |
For the
Year Ended 12/31/13 |
For the
Six Months Ended 06/30/14 |
For the
Year Ended 12/31/13 |
|||||||||||||||||||||||
| (Unaudited) | (Unaudited) | (Unaudited) | (Unaudited) | |||||||||||||||||||||||||||
| $ | 2,174,223 | $ | 5,440,061 | $ | 748,747 | $ | 2,496,038 | $ | 285,643 | $ | 1,602,964 | $ | 22,105 | $ | 113,731 | |||||||||||||||
| 4,530,386 | 32,924,021 | 2,385,113 | 20,635,090 | 1,937,872 | 21,473,432 | 216,735 | 1,415,762 | |||||||||||||||||||||||
| 25,233,886 | 25,057,082 | 14,260,791 | 22,713,146 | 9,850,686 | 12,875,542 | 802,404 | 717,247 | |||||||||||||||||||||||
|
|
|
|
|
|
|
|
|
|
|
|
|
|
|
|
|
|||||||||||||||
| 31,938,495 | 63,421,164 | 17,394,651 | 45,844,274 | 12,074,201 | 35,951,938 | 1,041,244 | 2,246,740 | |||||||||||||||||||||||
|
|
|
|
|
|
|
|
|
|
|
|
|
|
|
|
|
|||||||||||||||
| — | (13,457,157 | ) | — | (5,775,453 | ) | — | (4,223,953 | ) | — | (317,866 | ) | |||||||||||||||||||
| — | (12,131,890 | ) | — | (10,105,288 | ) | — | (12,839,584 | ) | — | (708,786 | ) | |||||||||||||||||||
|
|
|
|
|
|
|
|
|
|
|
|
|
|
|
|
|
|||||||||||||||
| — | (25,589,047 | ) | — | (15,880,741 | ) | — | (17,063,537 | ) | — | (1,026,652 | ) | |||||||||||||||||||
|
|
|
|
|
|
|
|
|
|
|
|
|
|
|
|
|
|||||||||||||||
| 53,268,675 | 122,536,784 | 33,907,992 | 64,052,474 | 20,487,385 | 45,024,377 | 6,381,844 | 9,768,081 | |||||||||||||||||||||||
| — | 25,589,047 | — | 15,880,741 | — | 17,063,537 | — | 1,026,652 | |||||||||||||||||||||||
| (10,529,600 | ) | (15,543,835 | ) | (4,542,067 | ) | (6,265,695 | ) | (3,705,001 | ) | (4,070,598 | ) | (1,862,218 | ) | (1,948,729 | ) | |||||||||||||||
|
|
|
|
|
|
|
|
|
|
|
|
|
|
|
|
|
|||||||||||||||
| 42,739,075 | 132,581,996 | 29,365,925 | 73,667,520 | 16,782,384 | 58,017,316 | 4,519,626 | 8,846,004 | |||||||||||||||||||||||
|
|
|
|
|
|
|
|
|
|
|
|
|
|
|
|
|
|||||||||||||||
| 74,677,570 | 170,414,113 | 46,760,576 | 103,631,053 | 28,856,585 | 76,905,717 | 5,560,870 | 10,066,092 | |||||||||||||||||||||||
|
|
|
|
|
|
|
|
|
|
|
|
|
|
|
|
|
|||||||||||||||
| 545,652,040 | 375,237,927 | 291,873,525 | 188,242,472 | 212,101,620 | 135,195,903 | 16,382,512 | 6,316,420 | |||||||||||||||||||||||
|
|
|
|
|
|
|
|
|
|
|
|
|
|
|
|
|
|||||||||||||||
| $ | 620,329,610 | $ | 545,652,040 | $ | 338,634,101 | $ | 291,873,525 | $ | 240,958,205 | $ | 212,101,620 | $ | 21,943,382 | $ | 16,382,512 | |||||||||||||||
|
|
|
|
|
|
|
|
|
|
|
|
|
|
|
|
|
|||||||||||||||
| $ | 2,174,223 | $ | — | $ | 748,747 | $ | — | $ | 285,643 | $ | — | $ | 22,105 | $ | — | |||||||||||||||
|
|
|
|
|
|
|
|
|
|
|
|
|
|
|
|
|
|||||||||||||||
See Notes to Financial Statements.
27
Table of Contents
FINANCIAL HIGHLIGHTS (Unaudited)
| For a Share Outstanding For the Years Ending December 31, unless otherwise indicated | Ratios to Average Net Assets | |||||||||||||||||||||||||||||||||||||||||||||||||||
| Net Asset Value, Beginning of Period |
Net Investment Income (1) |
Capital Gain Distributions Received from Affiliated Funds |
Realized and Unrealized Gain (Loss) on Investments |
Dividends from Net Investment Income (2) |
Distributions from Net Realized Capital Gains |
Net Asset Value, End of Year |
Total Return |
Net Assets, End of Year (000) |
Expenses, Net (3)(4) |
Expenses, Gross (3)(5) |
Investment Income, Net (1)(4) |
Portfolio Turnover Rate |
||||||||||||||||||||||||||||||||||||||||
| MyDestination 2005 Fund |
|
|||||||||||||||||||||||||||||||||||||||||||||||||||
| Investor Class |
|
|||||||||||||||||||||||||||||||||||||||||||||||||||
| 2014(6) |
$ | 10.70 | $ | 0.05 | # | $ | 0.03 | $ | 0.32 | $ | — | $ | — | $ | 11.10 | 3.74 | % | $ | 90,608 | 0.20 | % | 0.24 | % | 0.87 | % | 4 | % | |||||||||||||||||||||||||
| 2013 |
10.25 | 0.09 | # | 0.25 | 0.29 | (0.18 | ) | — | 10.70 | 6.18 | 84,817 | 0.20 | 0.25 | 0.87 | 27 | |||||||||||||||||||||||||||||||||||||
| 2012 |
9.60 | 0.13 | # | 0.18 | 0.55 | (0.21 | ) | — | 10.25 | 8.92 | 80,582 | 0.20 | 0.27 | 1.24 | 8 | |||||||||||||||||||||||||||||||||||||
| 2011 |
9.53 | 0.14 | # | 0.05 | 0.05 | (0.17 | ) | — | 9.60 | 2.52 | 64,608 | 0.20 | 0.35 | 1.43 | 31 | |||||||||||||||||||||||||||||||||||||
| 2010 |
8.84 | 0.14 | # | 0.09 | 0.70 | (0.24 | ) | — | 9.53 | 10.56 | 54,683 | 0.20 | 0.26 | 1.50 | 19 | |||||||||||||||||||||||||||||||||||||
| 2009 |
7.44 | 0.18 | # | 0.04 | 1.40 | (0.22 | ) | — | 8.84 | 21.84 | 66,830 | 0.20 | 0.26 | 2.31 | 57 | |||||||||||||||||||||||||||||||||||||
| MyDestination 2015 Fund |
|
|||||||||||||||||||||||||||||||||||||||||||||||||||
| Investor Class |
|
|||||||||||||||||||||||||||||||||||||||||||||||||||
| 2014(6) |
$ | 10.97 | $ | 0.05 | # | $ | 0.04 | $ | 0.46 | $ | — | $ | — | $ | 11.52 | 5.01 | % | $ | 477,349 | 0.14 | % | 0.14 | % | 0.92 | % | 1 | % | |||||||||||||||||||||||||
| 2013 |
10.21 | 0.12 | # | 0.44 | 0.49 | (0.28 | ) | (0.01 | ) | 10.97 | 10.35 | 440,481 | 0.14 | 0.14 | 1.10 | 15 | ||||||||||||||||||||||||||||||||||||
| 2012 |
9.37 | 0.15 | # | 0.22 | 0.70 | (0.23 | ) | — | 10.21 | 11.46 | 352,576 | 0.15 | 0.15 | 1.47 | 2 | |||||||||||||||||||||||||||||||||||||
| 2011 |
9.36 | 0.14 | # | 0.05 | (0.02 | ) | (0.16 | ) | — | 9.37 | 1.84 | 274,096 | 0.17 | 0.17 | 1.46 | 33 | ||||||||||||||||||||||||||||||||||||
| 2010 |
8.42 | 0.14 | # | 0.06 | 0.94 | (0.20 | ) | — | 9.36 | 13.54 | 245,672 | 0.16 | 0.16 | 1.65 | 28 | |||||||||||||||||||||||||||||||||||||
| 2009 |
6.83 | 0.17 | # | 0.02 | 1.58 | (0.18 | ) | — | 8.42 | 26.27 | 219,264 | 0.16 | 0.16 | 2.25 | 25 | |||||||||||||||||||||||||||||||||||||
| MyDestination 2025 Fund |
|
|||||||||||||||||||||||||||||||||||||||||||||||||||
| Investor Class |
|
|||||||||||||||||||||||||||||||||||||||||||||||||||
| 2014(6) |
$ | 10.80 | $ | 0.04 | # | $ | 0.05 | $ | 0.50 | $ | — | $ | — | $ | 11.39 | 5.46 | % | $ | 620,330 | 0.14 | % | 0.14 | % | 0.76 | % | 1 | % | |||||||||||||||||||||||||
| 2013 |
9.84 | 0.13 | # | 0.57 | 0.78 | (0.27 | ) | (0.25 | ) | 10.80 | 15.15 | 545,652 | 0.14 | 0.14 | 1.19 | 16 | ||||||||||||||||||||||||||||||||||||
| 2012 |
8.81 | 0.14 | # | 0.22 | 0.86 | (0.19 | ) | — | 9.84 | 13.90 | 375,238 | 0.15 | 0.15 | 1.51 | 2 | |||||||||||||||||||||||||||||||||||||
| 2011 |
8.94 | 0.13 | # | 0.03 | (0.16 | ) | (0.13 | ) | — | 8.81 | 0.03 | 278,239 | 0.17 | 0.17 | 1.42 | 24 | ||||||||||||||||||||||||||||||||||||
| 2010 |
7.88 | 0.14 | # | 0.03 | 1.04 | (0.15 | ) | — | 8.94 | 15.32 | 236,502 | 0.20 | 0.17 | 1.72 | 15 | |||||||||||||||||||||||||||||||||||||
| 2009 |
6.18 | 0.14 | # | 0.01 | 1.69 | (0.14 | ) | — | 7.88 | 30.12 | 169,563 | 0.20 | 0.19 | 2.11 | 13 | |||||||||||||||||||||||||||||||||||||
| # | Calculated using the average shares outstanding method. |
| (1) | Recognition of net investment income by the Fund is affected by the timing of the declaration of dividends by the underlying investment companies in which the Fund invests. |
| (2) | Includes dividends paid from the short-term portion of capital gain distributions received from affiliated Funds. |
| (3) | Does not include expenses of the investment companies in which the Fund invests. |
| (4) | The ratio includes expenses waived/reimbursed net of amount recaptured and fees paid indirectly, where applicable; if expenses waived/reimbursed net of amount recaptured and fees paid indirectly were excluded, the ratio would have been higher (lower) than the ratio shown. |
| (5) | The ratio excludes expenses waived/reimbursed net of amount recaptured and fees paid indirectly, where applicable; if expenses waived/reimbursed net of amount recaptured and fees paid indirectly were included, the ratio would have been lower than the ratio shown. |
| (6) | For the six months ended June 30, 2014. All ratios for the period have been annualized. Total return and portfolio turnover for the period have not been annualized. |
See Notes to Financial Statements.
28
Table of Contents
| For a Share Outstanding For the Years Ending December 31, unless otherwise indicated | Ratios to Average Net Assets | |||||||||||||||||||||||||||||||||||||||||||||||||||
| Net Asset Value, Beginning of Period |
Net Investment Income (1) |
Capital
Gain Distributions Received from Affiliated Funds |
Realized and Unrealized Gain (Loss) on Investments |
Dividends from Net Investment Income (2) |
Distributions from Net Realized Capital Gains |
Net Asset Value, End of Year |
Total Return |
Net Assets, End of Year (000) |
Expenses, Net (3)(4) |
Expenses, Gross (3)(5) |
Investment Income, Net (1)(4) |
Portfolio Turnover Rate |
||||||||||||||||||||||||||||||||||||||||
| MyDestination 2035 Fund |
|
|||||||||||||||||||||||||||||||||||||||||||||||||||
| Investor Class |
|
|||||||||||||||||||||||||||||||||||||||||||||||||||
| 2014(6) |
$ | 10.79 | $ | 0.03 | # | $ | 0.05 | $ | 0.51 | $ | — | $ | — | $ | 11.38 | 5.47 | % | $ | 338,634 | 0.15 | % | 0.15 | % | 0.49 | % | 1 | % | |||||||||||||||||||||||||
| 2013 |
9.40 | 0.11 | # | 0.64 | 1.26 | (0.22 | ) | (0.40 | ) | 10.79 | 21.41 | 291,874 | 0.19 | 0.16 | 1.05 | 17 | ||||||||||||||||||||||||||||||||||||
| 2012 |
8.22 | 0.11 | # | 0.21 | 1.02 | (0.11 | ) | (0.05 | ) | 9.40 | 16.30 | 188,242 | 0.20 | 0.18 | 1.23 | 1 | ||||||||||||||||||||||||||||||||||||
| 2011 |
8.62 | 0.10 | # | 0.01 | (0.37 | ) | (0.09 | ) | (0.05 | ) | 8.22 | (2.99 | ) | 131,446 | 0.20 | 0.23 | 1.13 | 10 | ||||||||||||||||||||||||||||||||||
| 2010 |
7.52 | 0.10 | # | 0.01 | 1.10 | (0.10 | ) | (0.01 | ) | 8.62 | 16.02 | 110,206 | 0.20 | 0.23 | 1.32 | 9 | ||||||||||||||||||||||||||||||||||||
| 2009 |
5.85 | 0.10 | # | — | † | 1.70 | (0.11 | ) | (0.02 | ) | 7.52 | 30.99 | 75,419 | 0.20 | 0.28 | 1.57 | 4 | |||||||||||||||||||||||||||||||||||
| MyDestination 2045 Fund |
|
|||||||||||||||||||||||||||||||||||||||||||||||||||
| Investor Class |
|
|||||||||||||||||||||||||||||||||||||||||||||||||||
| 2014(6) |
$ | 10.37 | $ | 0.01 | # | $ | 0.05 | $ | 0.50 | $ | — | $ | — | $ | 10.93 | 5.40 | % | $ | 240,958 | 0.20 | % | 0.17 | % | 0.26 | % | 1 | % | |||||||||||||||||||||||||
| 2013 |
9.14 | 0.10 | # | 0.68 | 1.35 | (0.21 | ) | (0.69 | ) | 10.37 | 23.44 | 212,102 | 0.20 | 0.18 | 0.94 | 18 | ||||||||||||||||||||||||||||||||||||
| 2012 |
7.96 | 0.10 | # | 0.21 | 1.01 | (0.09 | ) | (0.05 | ) | 9.14 | 16.60 | 135,196 | 0.20 | 0.21 | 1.14 | 1 | ||||||||||||||||||||||||||||||||||||
| 2011 |
8.52 | 0.07 | # | — | † | (0.38 | ) | (0.07 | ) | (0.18 | ) | 7.96 | (3.63 | ) | 89,954 | 0.20 | 0.29 | 0.87 | 25 | |||||||||||||||||||||||||||||||||
| 2010 |
7.38 | 0.08 | # | — | † | 1.16 | (0.07 | ) | (0.03 | ) | 8.52 | 16.80 | 75,803 | 0.20 | 0.30 | 1.08 | 1 | |||||||||||||||||||||||||||||||||||
| 2009 |
5.75 | 0.08 | # | — | † | 1.67 | (0.09 | ) | (0.03 | ) | 7.38 | 30.71 | 44,159 | 0.20 | 0.41 | 1.23 | 7 | |||||||||||||||||||||||||||||||||||
| MyDestination 2055 Fund |
|
|||||||||||||||||||||||||||||||||||||||||||||||||||
| Investor Class |
|
|||||||||||||||||||||||||||||||||||||||||||||||||||
| 2014(6) |
$ | 12.95 | $ | 0.02 | # | $ | 0.07 | $ | 0.59 | $ | — | $ | — | $ | 13.63 | 5.25 | % | $ | 21,943 | 0.20 | % | 0.66 | % | 0.24 | % | 3 | % | |||||||||||||||||||||||||
| 2013 |
11.20 | 0.13 | # | 1.02 | 1.47 | (0.26 | ) | (0.61 | ) | 12.95 | 23.44 | 16,383 | 0.20 | 1.01 | 1.05 | 30 | ||||||||||||||||||||||||||||||||||||
| 2012* |
10.00 | 0.13 | # | 0.30 | 0.98 | (0.10 | ) | (0.11 | ) | 11.20 | 14.18 | 6,316 | 0.20 | 2.31 | 1.24 | 18 | ||||||||||||||||||||||||||||||||||||
| † | Amount represents less than $0.005 per share. |
| # | Calculated using the average shares outstanding method. |
| * | Inception date was January 1, 2012. |
| (1) | Recognition of net investment income by the Fund is affected by the timing of the declaration of dividends by the underlying investment companies in which the Fund invests. |
| (2) | Includes dividends paid from the short-term portion of capital gain distributions received from affiliated Funds. |
| (3) | Does not include expenses of the investment companies in which the Fund invests. |
| (4) | The ratio includes expenses waived/reimbursed net of amount recaptured and fees paid indirectly, where applicable; if expenses waived/reimbursed net of amount recaptured and fees paid indirectly were excluded, the ratio would have been higher (lower) than the ratio shown. |
| (5) | The ratio excludes expenses waived/reimbursed net of amount recaptured and fees paid indirectly, where applicable; if expenses waived/reimbursed net of amount recaptured and fees paid indirectly were included, the ratio would have been lower than the ratio shown. |
| (6) | For the six months ended June 30, 2014. All ratios for the period have been annualized. Total return and portfolio turnover for the period have not been annualized. |
See Notes to Financial Statements.
29
Table of Contents
| SCHEDULE OF INVESTMENTS |
June 30, 2014 (Unaudited) |
See Notes to Financial Statements.
30
Table of Contents
VALUATION HIERARCHY
The following is a summary of the inputs used, as of June 30, 2014, in valuing the Fund’s investments carried at fair value:
| Total Value |
Level 1 Quoted Prices |
Level 2 Other Significant Observable Inputs |
Level
3 Significant Unobservable Inputs |
|||||||||||||
| Assets: |
||||||||||||||||
| Investments in Securities: |
||||||||||||||||
| Mutual Funds |
$ | 322,539,199 | $ | 322,539,199 | $ | — | $ | — | ||||||||
|
|
|
|
|
|
|
|
|
|||||||||
| Total Assets — Investments in Securities |
$ | 322,539,199 | $ | 322,539,199 | $ | — | $ | — | ||||||||
|
|
|
|
|
|
|
|
|
|||||||||
| Other Financial Instruments*** |
||||||||||||||||
| Futures Contracts |
$ | 13,010 | $ | 13,010 | $ | — | $ | — | ||||||||
|
|
|
|
|
|
|
|
|
|||||||||
| Total Assets — Other Financial Instruments |
$ | 13,010 | $ | 13,010 | $ | — | $ | — | ||||||||
|
|
|
|
|
|
|
|
|
|||||||||
| *** | Other financial instruments are derivative instruments not reflected in the Schedule of Investments, such as futures, forwards and swap contracts, which are valued at the unrealized appreciation (depreciation) on the investment. Details of these investments can be found in the Notes to Financial Statements. |
See Notes to Financial Statements.
31
Table of Contents
| SCHEDULE OF INVESTMENTS |
June 30, 2014 (Unaudited) |
See Notes to Financial Statements.
32
Table of Contents
VALUATION HIERARCHY
The following is a summary of the inputs used, as of June 30, 2014, in valuing the Fund’s investments carried at fair value:
| Level 2 | Level 3 | |||||||||||||||
| Total | Level 1 | Other Significant | Significant | |||||||||||||
| Value | Quoted Prices | Observable Inputs | Unobservable Inputs | |||||||||||||
| Assets: |
||||||||||||||||
| Investments in Securities: |
||||||||||||||||
| Mutual Funds |
$ | 1,341,917,998 | $ | 1,341,917,998 | $ | — | $ | — | ||||||||
|
|
|
|
|
|
|
|
|
|||||||||
| Total Assets — Investments in Securities |
$ | 1,341,917,998 | $ | 1,341,917,998 | $ | — | $ | — | ||||||||
|
|
|
|
|
|
|
|
|
|||||||||
| Other Financial Instruments*** |
||||||||||||||||
| Futures Contracts |
$ | 169,112 | $ | 169,112 | $ | — | $ | — | ||||||||
|
|
|
|
|
|
|
|
|
|||||||||
| Total Assets — Other Financial Instruments |
$ | 169,112 | $ | 169,112 | $ | — | $ | — | ||||||||
|
|
|
|
|
|
|
|
|
|||||||||
| *** | Other financial instruments are derivative instruments not reflected in the Schedule of Investments, such as futures, forwards and swap contracts, which are valued at the unrealized appreciation (depreciation) on the investment. Details of these investments can be found in the Notes to Financial Statements. |
See Notes to Financial Statements.
33
Table of Contents
|
SCHEDULE OF INVESTMENTS |
June 30, 2014 (Unaudited)
|
See Notes to Schedules of Investments.
34
Table of Contents
VALUATION HIERARCHY
The following is a summary of the inputs used, as of June 30, 2014, in valuing the Fund’s investments carried at fair value:
| Level 2 | Level 3 | |||||||||||||||
| Total | Level 1 | Other Significant | Significant | |||||||||||||
| Value | Quoted Prices | Observable Inputs | Unobservable Inputs | |||||||||||||
| Assets: |
||||||||||||||||
| Investments in Securities: |
||||||||||||||||
| Mutual Funds |
$ | 996,638,726 | $ | 996,638,726 | $ | — | $ | — | ||||||||
|
|
|
|
|
|
|
|
|
|||||||||
| Total Assets — Investments in Securities |
$ | 996,638,726 | $ | 996,638,726 | $ | — | $ | — | ||||||||
|
|
|
|
|
|
|
|
|
|||||||||
| Other Financial Instruments*** |
||||||||||||||||
| Futures Contracts |
$ | 185,556 | $ | 185,556 | $ | — | $ | — | ||||||||
|
|
|
|
|
|
|
|
|
|||||||||
| Total Assets — Other Financial Instruments |
$ | 185,556 | $ | 185,556 | $ | — | $ | — | ||||||||
|
|
|
|
|
|
|
|
|
|||||||||
| *** | Other financial instruments are derivative instruments not reflected in the Schedule of Investments, such as futures, forwards and swap contracts, which are valued at the unrealized appreciation (depreciation) on the investment. Details of these investments can be found in the Notes to Financial Statements. |
See Notes to Schedules of Investments.
35
Table of Contents
|
SCHEDULE OF INVESTMENTS |
June 30, 2014 (Unaudited) |
VALUATION HIERARCHY
The following is a summary of the inputs used, as of June 30, 2014, in valuing the Fund’s investments carried at fair value:
| Level 2 | Level 3 | |||||||||||||||
| Total | Level 1 | Other Significant | Significant | |||||||||||||
| Value | Quoted Prices | Observable Inputs | Unobservable Inputs | |||||||||||||
| Assets: |
||||||||||||||||
| Investments in Securities: |
||||||||||||||||
| Mutual Funds |
$ | 895,829,544 | $ | 895,829,544 | $ | — | $ | — | ||||||||
|
|
|
|
|
|
|
|
|
|||||||||
| Total Assets — Investments in Securities |
$ | 895,829,544 | $ | 895,829,544 | $ | — | $ | — | ||||||||
|
|
|
|
|
|
|
|
|
|||||||||
| Other Financial Instruments*** |
||||||||||||||||
| Futures Contracts |
$ | 176,839 | $ | 176,839 | $ | — | $ | — | ||||||||
|
|
|
|
|
|
|
|
|
|||||||||
| Total Assets — Other Financial Instruments |
$ | 176,839 | $ | 176,839 | $ | — | $ | — | ||||||||
|
|
|
|
|
|
|
|
|
|||||||||
| *** | Other financial instruments are derivative instruments not reflected in the Schedule of Investments, such as futures, forwards and swap contracts, which are valued at the unrealized appreciation (depreciation) on the investment. Details of these investments can be found in the Notes to Financial Statements. |
See Notes to Financial Statements.
36
Table of Contents
| June 30, 2014 (Unaudited) |
| Conservative | Balanced | Growth | Aggressive | |||||||||||||
| Allocation Fund | Allocation Fund | Allocation Fund | Allocation Fund | |||||||||||||
| Assets |
||||||||||||||||
| Investments in securities of affiliated issuers, at value (1) |
$ | 322,539,199 | $ | 1,341,917,998 | $ | 996,638,726 | $ | 895,829,544 | ||||||||
| Cash collateral for derivatives |
74,200 | 884,600 | 983,400 | 947,200 | ||||||||||||
| Receivables: |
||||||||||||||||
| Dividends from affiliated funds |
42 | 234 | 189 | 143 | ||||||||||||
| Fund shares sold |
111,193 | 141,005 | 20,504 | 179,026 | ||||||||||||
| Variation margin on financial futures contracts |
897 | 16,934 | 11,094 | 7,220 | ||||||||||||
| Prepaid expenses and other assets |
14,800 | 14,482 | 13,565 | 12,218 | ||||||||||||
|
|
|
|
|
|
|
|
|
|||||||||
| Total Assets |
322,740,331 | 1,342,975,253 | 997,667,478 | 896,975,351 | ||||||||||||
|
|
|
|
|
|
|
|
|
|||||||||
| Liabilities |
||||||||||||||||
| Cash overdraft |
— | 6 | — | 224 | ||||||||||||
| Payables: |
||||||||||||||||
| Investment securities purchased |
— | — | 298 | — | ||||||||||||
| Fund shares redeemed |
78,610 | 249,664 | 410,620 | 17,834 | ||||||||||||
| Variation margin on financial futures contracts |
160 | 3,680 | 4,160 | 4,960 | ||||||||||||
| Accrued expenses: |
||||||||||||||||
| Investment advisory fees |
15,998 | 104,013 | 75,992 | 68,083 | ||||||||||||
| Professional fees |
10,207 | 10,207 | 10,207 | 10,207 | ||||||||||||
| Other expenses |
28,114 | 56,835 | 40,916 | 34,666 | ||||||||||||
|
|
|
|
|
|
|
|
|
|||||||||
| Total Liabilities |
133,089 | 424,405 | 542,193 | 135,974 | ||||||||||||
|
|
|
|
|
|
|
|
|
|||||||||
| Net Assets |
$ | 322,607,242 | $ | 1,342,550,848 | $ | 997,125,285 | $ | 896,839,377 | ||||||||
|
|
|
|
|
|
|
|
|
|||||||||
| Net Assets Consist of: |
||||||||||||||||
| Paid-in-capital |
$ | 295,332,602 | $ | 1,115,179,169 | $ | 800,192,168 | $ | 668,027,036 | ||||||||
| Accumulated net investment income |
1,256,387 | 6,601,476 | 2,601,977 | 549,606 | ||||||||||||
| Undistributed net realized gain on investments and derivative transactions |
3,579,289 | 29,116,211 | 36,154,759 | 50,301,208 | ||||||||||||
| Net unrealized appreciation (depreciation) on investments and derivative transactions |
22,438,964 | 191,653,992 | 158,176,381 | 177,961,527 | ||||||||||||
|
|
|
|
|
|
|
|
|
|||||||||
| Net Assets |
$ | 322,607,242 | $ | 1,342,550,848 | $ | 997,125,285 | $ | 896,839,377 | ||||||||
|
|
|
|
|
|
|
|
|
|||||||||
| Net Asset Value: |
||||||||||||||||
| $0.001 par value, unlimited shares authorized |
||||||||||||||||
| Net assets applicable to the Investor Class |
$ | 322,607,242 | $ | 1,342,550,848 | $ | 997,125,285 | $ | 896,839,377 | ||||||||
|
|
|
|
|
|
|
|
|
|||||||||
| Investor shares outstanding |
26,442,132 | 96,878,531 | 67,536,825 | 57,841,531 | ||||||||||||
|
|
|
|
|
|
|
|
|
|||||||||
| Net asset value, offering and redemption price per Investor share |
$ | 12.20 | $ | 13.86 | $ | 14.76 | $ | 15.51 | ||||||||
|
|
|
|
|
|
|
|
|
|||||||||
|
|
||||||||||||||||
|
(1) Investments in securities of affiliated issuers, at cost |
$ | 300,113,245 | $ | 1,150,433,118 | $ | 838,647,901 | $ | 718,044,856 | ||||||||
|
|
|
|
|
|
|
|
|
|||||||||
See Notes to Financial Statements.
37
Table of Contents
| STATEMENTS OF OPERATIONS |
For the Six Months Ended June 30, 2014 (Unaudited) |
| Conservative | Balanced | Growth | Aggressive | |||||||||||||
| Allocation Fund | Allocation Fund | Allocation Fund | Allocation Fund | |||||||||||||
| Investment Income |
||||||||||||||||
| Income dividends received from affiliated funds |
$ | 1,446,067 | $ | 7,379,286 | $ | 3,179,706 | $ | 1,068,659 | ||||||||
|
|
|
|
|
|
|
|
|
|||||||||
| Total Investment Income |
1,446,067 | 7,379,286 | 3,179,706 | 1,068,659 | ||||||||||||
|
|
|
|
|
|
|
|
|
|||||||||
| Expenses |
||||||||||||||||
| Investment advisory fees |
160,332 | 662,475 | 490,383 | 441,667 | ||||||||||||
| Transfer agent fees: |
||||||||||||||||
| Investor shares |
15,811 | 29,086 | 19,079 | 16,912 | ||||||||||||
| Custodian fees |
9,848 | 17,564 | 14,717 | 12,066 | ||||||||||||
| Accounting and administration fees |
10,771 | 36,194 | 27,445 | 24,798 | ||||||||||||
| Professional fees |
22,797 | 22,797 | 22,797 | 22,797 | ||||||||||||
| Blue sky fees: |
||||||||||||||||
| Investor shares |
13,989 | 11,685 | 11,117 | 10,641 | ||||||||||||
| Shareholder reporting fees: |
||||||||||||||||
| Investor shares |
13,304 | 27,280 | 18,074 | 15,561 | ||||||||||||
| Trustee expenses |
1,537 | 6,200 | 4,587 | 4,153 | ||||||||||||
| Line of credit facility fees |
1,155 | 4,656 | 3,443 | 3,115 | ||||||||||||
| Other expenses |
4,337 | 5,216 | 5,662 | 5,558 | ||||||||||||
|
|
|
|
|
|
|
|
|
|||||||||
| Total Expenses |
253,881 | 823,153 | 617,304 | 557,268 | ||||||||||||
| Expenses waived/reimbursed(1) |
(64,201 | ) | (45,343 | ) | (41,597 | ) | (38,215 | ) | ||||||||
|
|
|
|
|
|
|
|
|
|||||||||
| Net Expenses |
189,680 | 777,810 | 575,707 | 519,053 | ||||||||||||
|
|
|
|
|
|
|
|
|
|||||||||
| Net investment income |
1,256,387 | 6,601,476 | 2,603,999 | 549,606 | ||||||||||||
|
|
|
|
|
|
|
|
|
|||||||||
| Realized and Unrealized Gain (Loss) |
||||||||||||||||
| Capital gain distributions received from affiliated funds |
580,697 | 3,892,573 | 3,969,684 | 5,336,726 | ||||||||||||
| Net realized gain on investment securities of affiliated issuers |
2,104,359 | 2,760,061 | 2,600,708 | 6,398,749 | ||||||||||||
| Net realized gain on futures transactions |
116,861 | 1,524,234 | 1,503,295 | 1,562,899 | ||||||||||||
|
|
|
|
|
|
|
|
|
|||||||||
| Net realized gain |
2,801,917 | 8,176,868 | 8,073,687 | 13,298,374 | ||||||||||||
|
|
|
|
|
|
|
|
|
|||||||||
| Change in unrealized appreciation (depreciation) on investment securities of affiliated issuers |
5,671,043 | 55,476,686 | 41,523,902 | 26,391,096 | ||||||||||||
| Change in unrealized appreciation (depreciation) on futures |
(25,181 | ) | (224,031 | ) | (369,845 | ) | (579,215 | ) | ||||||||
|
|
|
|
|
|
|
|
|
|||||||||
| Net change in unrealized appreciation |
5,645,862 | 55,252,655 | 41,154,057 | 25,811,881 | ||||||||||||
|
|
|
|
|
|
|
|
|
|||||||||
| Net Realized and Unrealized Gain |
8,447,779 | 63,429,523 | 49,227,744 | 39,110,255 | ||||||||||||
|
|
|
|
|
|
|
|
|
|||||||||
| Net Increase in Net Assets Resulting from Operations |
$ | 9,704,166 | $ | 70,030,999 | $ | 51,831,743 | $ | 39,659,861 | ||||||||
|
|
|
|
|
|
|
|
|
|||||||||
| (1) | See Note 3a and 3c in Notes to Financial Statements. |
See Notes to Financial Statements.
38
Table of Contents
(This page intentionally left blank)
39
Table of Contents
STATEMENTS OF CHANGES IN NET ASSETS
| Conservative Allocation Fund | Balanced Allocation Fund | |||||||||||||||
| For the Six Months Ended 06/30/14 |
For the Year Ended 12/31/13 |
For the Six Months Ended 06/30/14 |
For the Year Ended 12/31/13 |
|||||||||||||
| (Unaudited) | (Unaudited) | |||||||||||||||
| Operations: |
||||||||||||||||
| Net investment income |
$ | 1,256,387 | $ | 2,732,261 | $ | 6,601,476 | $ | 15,446,235 | ||||||||
| Net realized gain on investment securities and futures transactions |
2,801,917 | 21,019,598 | 8,176,868 | 78,636,889 | ||||||||||||
| Net change in unrealized appreciation (depreciation) on investment securities and futures |
5,645,862 | (12,258,840 | ) | 55,252,655 | 25,436,869 | |||||||||||
|
|
|
|
|
|
|
|
|
|||||||||
| Net increase in net assets resulting from operations |
9,704,166 | 11,493,019 | 70,030,999 | 119,519,993 | ||||||||||||
|
|
|
|
|
|
|
|
|
|||||||||
| Dividends and Distributions to Shareholders: |
||||||||||||||||
| Dividends from net investment income(1) |
— | (4,587,228 | ) | — | (26,717,331 | ) | ||||||||||
| Distributions from net realized capital gains |
— | (17,676,838 | ) | — | (54,188,791 | ) | ||||||||||
|
|
|
|
|
|
|
|
|
|||||||||
| Total dividends and distributions |
— | (22,264,066 | ) | — | (80,906,122 | ) | ||||||||||
|
|
|
|
|
|
|
|
|
|||||||||
| Capital Share Transactions: |
||||||||||||||||
| Proceeds from Investor shares sold |
18,957,355 | 44,406,970 | 32,398,385 | 81,882,324 | ||||||||||||
| Reinvestment of dividends and distributions into Investor shares |
— | 22,243,595 | — | 80,865,441 | ||||||||||||
|
|
|
|
|
|
|
|
|
|||||||||
| Total proceeds from shares sold and reinvested |
18,957,355 | 66,650,565 | 32,398,385 | 162,747,765 | ||||||||||||
|
|
|
|
|
|
|
|
|
|||||||||
| Value of Investor shares redeemed |
(25,267,213 | ) | (63,987,436 | ) | (48,407,080 | ) | (117,701,721 | ) | ||||||||
|
|
|
|
|
|
|
|
|
|||||||||
| Total value of shares redeemed |
(25,267,213 | ) | (63,987,436 | ) | (48,407,080 | ) | (117,701,721 | ) | ||||||||
|
|
|
|
|
|
|
|
|
|||||||||
| Net increase (decrease) from capital share transactions(2) |
(6,309,858 | ) | 2,663,129 | (16,008,695 | ) | 45,046,044 | ||||||||||
|
|
|
|
|
|
|
|
|
|||||||||
| Total increase (decrease) in net assets |
3,394,308 | (8,107,918 | ) | 54,022,304 | 83,659,915 | |||||||||||
|
|
|
|
|
|
|
|
|
|||||||||
| Net Assets: |
||||||||||||||||
| Beginning of Period |
319,212,934 | 327,320,852 | 1,288,528,544 | 1,204,868,629 | ||||||||||||
|
|
|
|
|
|
|
|
|
|||||||||
| End of Period* |
$ | 322,607,242 | $ | 319,212,934 | $ | 1,342,550,848 | $ | 1,288,528,544 | ||||||||
|
|
|
|
|
|
|
|
|
|||||||||
| * Including undistributed net investment income |
$ | 1,256,387 | $ | — | $ | 6,601,476 | $ | — | ||||||||
|
|
|
|
|
|
|
|
|
|||||||||
| (1) | Includes dividends paid from the short-term portion of capital gain distributions received from affiliated funds. |
| (2) | See Note 6 in Notes to Financial Statements. |
See Notes to Financial Statements.
40
Table of Contents
|
Growth Allocation Fund |
Aggressive Allocation Fund | |||||||||||||
| For the Six |
For the Year Ended 12/31/13 |
For the Six Months Ended 06/30/14 |
For the Year Ended 12/31/13 |
|||||||||||
| (Unaudited) | (Unaudited) | |||||||||||||
| $ | 2,603,999 | $ | 9,316,274 | $ | 549,606 | $ | 6,114,532 | |||||||
|
|
8,073,687 |
|
95,016,447 | 13,298,374 | 69,027,097 | |||||||||
|
|
41,154,057 |
|
48,875,218 | 25,811,881 | 118,241,629 | |||||||||
|
|
|
|
|
|
|
|
|
|||||||
| 51,831,743 | 153,207,939 | 39,659,861 | 193,383,258 | |||||||||||
|
|
|
|
|
|
|
|
|
|||||||
| (2,022 | ) | (18,512,739 | ) | — | (16,817,289 | ) | ||||||||
| — | (72,279,436 | ) | — | (41,616,328 | ) | |||||||||
|
|
|
|
|
|
|
|
|
|||||||
| (2,022 | ) | (90,792,175 | ) | — | (58,433,617 | ) | ||||||||
|
|
|
|
|
|
|
|
|
|||||||
| 18,243,039 | 43,881,701 | 10,544,336 | 30,036,829 | |||||||||||
|
|
2,022 |
|
90,787,186 | — | 58,430,316 | |||||||||
|
|
|
|
|
|
|
|
|
|||||||
| 18,245,061 | 134,668,887 | 10,544,336 | 88,467,145 | |||||||||||
|
|
|
|
|
|
|
|
|
|||||||
| (36,851,093 | ) | (86,415,713 | ) | (32,927,968 | ) | (70,518,946 | ) | |||||||
|
|
|
|
|
|
|
|
|
|||||||
| (36,851,093 | ) | (86,415,713 | ) | (32,927,968 | ) | (70,518,946 | ) | |||||||
|
|
|
|
|
|
|
|
|
|||||||
| (18,606,032 | ) | 48,253,174 | (22,383,632 | ) | 17,948,199 | |||||||||
|
|
|
|
|
|
|
|
|
|||||||
| 33,223,689 | 110,668,938 | 17,276,229 | 152,897,840 | |||||||||||
|
|
|
|
|
|
|
|
|
|||||||
| 963,901,596 | 853,232,658 | 879,563,148 | 726,665,308 | |||||||||||
|
|
|
|
|
|
|
|
|
|||||||
| $ | 997,125,285 | $ | 963,901,596 | $ | 896,839,377 | $ | 879,563,148 | |||||||
|
|
|
|
|
|
|
|
|
|||||||
| $ | 2,601,977 | $ | — | $ | 549,606 | $ | — | |||||||
|
|
|
|
|
|
|
|
|
|||||||
See Notes to Financial Statements.
41
Table of Contents
FINANCIAL HIGHLIGHTS (Unaudited)
| For a Share Outstanding For the Years Ending December 31, unless otherwise indicated | Ratios to Average Net Assets | |||||||||||||||||||||||||||||||||||||||||||||||||||
| Net Asset Value, Beginning of Period |
Net Investment Income (1) |
Capital Gain Distributions Received from Affiliated Funds |
Realized and Unrealized Gain (Loss) on Investments |
Dividends from Net Investment Income (2) |
Distributions from Net Realized Capital Gains |
Net Asset Value, End of Period |
Total Return |
Net
Assets, End of Period (000) |
Expenses, Net (3)(4) |
Expenses, Gross (3)(5) |
Investment Income, Net (1)(4) |
Portfolio Turnover Rate |
||||||||||||||||||||||||||||||||||||||||
| Conservative Allocation Fund |
|
|||||||||||||||||||||||||||||||||||||||||||||||||||
| Investor Class |
||||||||||||||||||||||||||||||||||||||||||||||||||||
| 2014(6) |
$ | 11.84 | $ | 0.05 | # | $ | 0.02 | $ | 0.29 | $ | — | $ | — | $ | 12.20 | 3.04 | % | $ | 322,607 | 0.12 | % | 0.16 | % | 0.79 | % | 1 | % | |||||||||||||||||||||||||
| 2013 |
12.27 | 0.11 | # | 0.21 | 0.12 | (0.17 | ) | (0.70 | ) | 11.84 | 3.67 | 319,213 | 0.12 | 0.16 | 0.85 | 12 | ||||||||||||||||||||||||||||||||||||
| 2012 |
11.70 | 0.16 | # | 0.16 | 0.50 | (0.22 | ) | (0.03 | ) | 12.27 | 7.02 | 327,321 | 0.12 | 0.16 | 1.29 | 3 | ||||||||||||||||||||||||||||||||||||
| 2011 |
11.87 | 0.18 | # | 0.05 | (0.03 | ) | (0.19 | ) | (0.18 | ) | 11.70 | 1.71 | 293,236 | 0.12 | 0.17 | 1.47 | 9 | |||||||||||||||||||||||||||||||||||
| 2010 |
11.39 | 0.18 | # | 0.08 | 0.56 | (0.27 | ) | (0.07 | ) | 11.87 | 7.19 | 261,993 | 0.12 | 0.15 | 1.57 | 19 | ||||||||||||||||||||||||||||||||||||
| 2009 |
10.33 | 0.26 | # | — | † | 1.44 | (0.26 | ) | (0.38 | ) | 11.39 | 16.58 | 284,750 | 0.12 | 0.16 | 2.37 | 32 | |||||||||||||||||||||||||||||||||||
| Balanced Allocation Fund |
|
|||||||||||||||||||||||||||||||||||||||||||||||||||
| Investor Class |
||||||||||||||||||||||||||||||||||||||||||||||||||||
| 2014(6) |
$ | 13.14 | $ | 0.07 | # | $ | 0.04 | $ | 0.61 | $ | — | $ | — | $ | 13.86 | 5.48 | % | $ | 1,342,551 | 0.12 | % | 0.13 | % | 1.02 | % | 1 | % | |||||||||||||||||||||||||
| 2013 |
12.73 | 0.16 | # | 0.44 | 0.68 | (0.28 | ) | (0.59 | ) | 13.14 | 10.08 | 1,288,529 | 0.12 | 0.13 | 1.23 | 27 | ||||||||||||||||||||||||||||||||||||
| 2012 |
11.77 | 0.19 | # | 0.22 | 0.97 | (0.27 | ) | (0.15 | ) | 12.73 | 11.79 | 1,204,869 | 0.12 | 0.13 | 1.54 | 3 | ||||||||||||||||||||||||||||||||||||
| 2011 |
12.12 | 0.20 | # | 0.06 | (0.14 | ) | (0.26 | ) | (0.21 | ) | 11.77 | 1.01 | 1,097,275 | 0.12 | 0.13 | 1.65 | 16 | |||||||||||||||||||||||||||||||||||
| 2010 |
11.14 | 0.23 | # | 0.09 | 1.00 | (0.34 | ) | — | 12.12 | 11.87 | 1,120,981 | 0.12 | 0.12 | 1.95 | 17 | |||||||||||||||||||||||||||||||||||||
| 2009 |
9.20 | 0.26 | # | 0.05 | 1.97 | (0.27 | ) | (0.07 | ) | 11.14 | 25.05 | 1,132,991 | 0.12 | 0.13 | 2.58 | 19 | ||||||||||||||||||||||||||||||||||||
| Growth Allocation Fund |
|
|||||||||||||||||||||||||||||||||||||||||||||||||||
| Investor Class |
||||||||||||||||||||||||||||||||||||||||||||||||||||
| 2014(6) |
$ | 14.00 | $ | 0.04 | # | $ | 0.06 | $ | 0.66 | $ | — | † | $ | — | $ | 14.76 | 5.43 | % | $ | 997,125 | 0.12 | % | 0.13 | % | 0.54 | % | 1 | % | ||||||||||||||||||||||||
| 2013 |
13.04 | 0.15 | # | 0.67 | 1.57 | (0.27 | ) | (1.16 | ) | 14.00 | 18.49 | 963,902 | 0.12 | 0.13 | 1.03 | 22 | ||||||||||||||||||||||||||||||||||||
| 2012 |
11.60 | 0.15 | # | 0.26 | 1.30 | (0.17 | ) | (0.10 | ) | 13.04 | 14.84 | 853,233 | 0.12 | 0.13 | 1.17 | 2 | ||||||||||||||||||||||||||||||||||||
| 2011 |
12.28 | 0.16 | # | 0.03 | (0.49 | ) | (0.17 | ) | (0.21 | ) | 11.60 | (2.39 | ) | 783,344 | 0.12 | 0.14 | 1.26 | 10 | ||||||||||||||||||||||||||||||||||
| 2010 |
11.11 | 0.16 | # | 0.05 | 1.31 | (0.27 | ) | (0.08 | ) | 12.28 | 13.65 | 841,926 | 0.12 | 0.13 | 1.43 | 8 | ||||||||||||||||||||||||||||||||||||
| 2009 |
8.86 | 0.18 | # | 0.02 | 2.25 | (0.15 | ) | (0.05 | ) | 11.11 | 27.96 | 840,810 | 0.12 | 0.13 | 1.88 | 11 | ||||||||||||||||||||||||||||||||||||
| Aggressive Allocation Fund |
|
|||||||||||||||||||||||||||||||||||||||||||||||||||
| Investor Class |
||||||||||||||||||||||||||||||||||||||||||||||||||||
| 2014(6) |
$ | 14.82 | $ | 0.01 | # | $ | 0.09 | $ | 0.59 | $ | — | $ | — | $ | 15.51 | 4.66 | % | $ | 896,839 | 0.12 | % | 0.13 | % | 0.13 | % | 1 | % | |||||||||||||||||||||||||
| 2013 |
12.46 | 0.11 | # | 0.90 | 2.39 | (0.29 | ) | (0.75 | ) | 14.82 | 27.41 | 879,563 | 0.12 | 0.13 | 0.77 | 12 | ||||||||||||||||||||||||||||||||||||
| 2012 |
10.89 | 0.11 | # | 0.26 | 1.50 | (0.11 | ) | (0.19 | ) | 12.46 | 17.19 | 726,665 | 0.12 | 0.13 | 0.91 | 5 | ||||||||||||||||||||||||||||||||||||
| 2011 |
11.79 | 0.10 | # | — | † | (0.71 | ) | (0.10 | ) | (0.19 | ) | 10.89 | (5.14 | ) | 674,790 | 0.12 | 0.14 | 0.83 | 9 | |||||||||||||||||||||||||||||||||
| 2010 |
10.43 | 0.10 | # | — | † | 1.48 | (0.10 | ) | (0.12 | ) | 11.79 | 15.16 | 745,493 | 0.12 | 0.13 | 0.91 | 1 | |||||||||||||||||||||||||||||||||||
| 2009 |
8.13 | 0.10 | # | — | † | 2.38 | (0.10 | ) | (0.08 | ) | 10.43 | 30.82 | 729,734 | 0.12 | 0.14 | 1.17 | 3 | |||||||||||||||||||||||||||||||||||
| † | Amount represents less than $0.005 per share. |
| # | Calculated using the average shares outstanding method. |
| (1) | Recognition of net investment income by the Fund is affected by the timing of the declaration of dividends by the underlying investment companies in which the Fund invests. |
| (2) | Includes dividends paid from the short-term portion of capital gain distributions received from affiliated Funds. |
| (3) | Does not include expenses of the investment companies in which the Fund invests. |
| (4) | The ratio includes expenses waived/reimbursed net of amount recaptured and fees paid indirectly, where applicable; if expenses waived/reimbursed net of amount recaptured and fees paid indirectly were excluded, the ratio would have been higher (lower) than the ratio shown. |
| (5) | The ratio excludes expenses waived/reimbursed net of amount recaptured and fees paid indirectly, where applicable; if expenses waived/reimbursed net of amount recaptured and fees paid indirectly were included, the ratio would have been lower than the ratio shown. |
| (6) | For the six months ended June 30, 2014. All ratios for the period have been annualized. Total return and portfolio turnover for the period have not been annualized. |
See Notes to Financial Statements.
42
Table of Contents
| CONSERVATIVE ALLOCATION FUND I | ||
| SCHEDULE OF INVESTMENTS | June 30, 2014 (Unaudited) |
See Notes to Financial Statements.
43
Table of Contents
CONSERVATIVE ALLOCATION FUND I
SCHEDULE OF INVESTMENTS (Continued)
VALUATION HIERARCHY
The following is a summary of the inputs used, as of June 30, 2014, in valuing the Fund’s investments carried at fair value:
| Total Value |
Level 1 Quoted Prices |
Level 2 Other Significant Observable Inputs |
Level
3 Significant Unobservable Inputs |
|||||||||||||
| Assets: |
||||||||||||||||
| Investments in Securities: |
||||||||||||||||
| Mutual Funds |
$ | 82,320,924 | $ | 82,320,924 | $ | — | $ | — | ||||||||
|
|
|
|
|
|
|
|
|
|||||||||
| Total Assets — Investments in Securities |
$ | 82,320,924 | $ | 82,320,924 | $ | — | $ | — | ||||||||
|
|
|
|
|
|
|
|
|
|||||||||
| Other Financial Instruments*** |
||||||||||||||||
| Futures Contracts |
$ | 2,702 | $ | 2,702 | $ | — | $ | — | ||||||||
|
|
|
|
|
|
|
|
|
|||||||||
| Total Assets — Other Financial Instruments |
$ | 2,702 | $ | 2,702 | $ | — | $ | — | ||||||||
|
|
|
|
|
|
|
|
|
|||||||||
| *** | Other financial instruments are derivative instruments not reflected in the Schedule of Investments, such as futures, forwards and swap contracts, which are valued at the unrealized appreciation (depreciation) on the investment. Details of these investments can be found in the Notes to Financial Statements. |
See Notes to Financial Statements.
44
Table of Contents
| SCHEDULE OF INVESTMENTS |
June 30, 2014 (Unaudited) |
See Notes to Financial Statements.
45
Table of Contents
BALANCED ALLOCATION FUND I
SCHEDULE OF INVESTMENTS (Continued)
VALUATION HIERARCHY
The following is a summary of the inputs used, as of June 30, 2014, in valuing the Fund’s investments carried at fair value:
| Total Value |
Level 1 Quoted Prices |
Level 2 Other Significant Observable Inputs |
Level
3 Significant Unobservable Inputs |
|||||||||||||
| Assets: |
||||||||||||||||
| Investments in Securities: |
||||||||||||||||
| Mutual Funds |
$ | 401,406,417 | $ | 401,406,417 | $ | — | $ | — | ||||||||
|
|
|
|
|
|
|
|
|
|||||||||
| Total Assets — Investments in Securities |
$ | 401,406,417 | $ | 401,406,417 | $ | — | $ | — | ||||||||
|
|
|
|
|
|
|
|
|
|||||||||
| Other Financial Instruments*** |
||||||||||||||||
| Futures Contracts |
$ | 41,605 | $ | 41,605 | $ | — | $ | — | ||||||||
|
|
|
|
|
|
|
|
|
|||||||||
| Total Assets — Other Financial Instruments |
$ | 41,605 | $ | 41,605 | $ | — | $ | — | ||||||||
|
|
|
|
|
|
|
|
|
|||||||||
| *** | Other financial instruments are derivative instruments not reflected in the Schedule of Investments, such as futures, forwards and swap contracts, which are valued at the unrealized appreciation (depreciation) on the investment. Details of these investments can be found in the Notes to Financial Statements. |
See Notes to Financial Statements.
46
Table of Contents
| SCHEDULE OF INVESTMENTS |
June 30, 2014 (Unaudited) |
VALUATION HIERARCHY
The following is a summary of the inputs used, as of June 30, 2014, in valuing the Fund’s investments carried at fair value:
| Total Value |
Level 1 Quoted Prices |
Level 2 Other Significant Observable Inputs |
Level
3 Significant Unobservable Inputs |
|||||||||||||
| Assets: |
||||||||||||||||
| Investments in Securities: |
||||||||||||||||
| Mutual Funds |
$ | 281,616,598 | $ | 281,616,598 | $ | — | $ | — | ||||||||
|
|
|
|
|
|
|
|
|
|||||||||
| Total Assets — Investments in Securities |
$ | 281,616,598 | $ | 281,616,598 | $ | — | $ | — | ||||||||
|
|
|
|
|
|
|
|
|
|||||||||
| Other Financial Instruments*** |
||||||||||||||||
| Futures Contracts |
$ | 42,052 | $ | 42,052 | $ | — | $ | — | ||||||||
|
|
|
|
|
|
|
|
|
|||||||||
| Total Assets — Other Financial Instruments |
$ | 42,052 | $ | 42,052 | $ | — | $ | — | ||||||||
|
|
|
|
|
|
|
|
|
|||||||||
| *** | Other financial instruments are derivative instruments not reflected in the Schedule of Investments, such as futures, forwards and swap contracts, which are valued at the unrealized appreciation (depreciation) on the investment. Details of these investments can be found in the Notes to Financial Statements. |
See Notes to Financial Statements.
47
Table of Contents
| SCHEDULE OF INVESTMENTS |
June 30, 2014 (Unaudited) |
VALUATION HIERARCHY
The following is a summary of the inputs used, as of June 30, 2014, in valuing the Fund’s investments carried at fair value:
| Total Value |
Level 1 Quoted Prices |
Level 2 Other Significant Observable Inputs |
Level
3 Significant Unobservable Inputs |
|||||||||||||
| Assets: |
||||||||||||||||
| Investments in Securities: |
||||||||||||||||
| Mutual Funds |
$ | 195,612,035 | $ | 195,612,035 | $ | — | $ | — | ||||||||
|
|
|
|
|
|
|
|
|
|||||||||
| Total Assets — Investments in Securities |
$ | 195,612,035 | $ | 195,612,035 | $ | — | $ | — | ||||||||
|
|
|
|
|
|
|
|
|
|||||||||
| Other Financial Instruments*** |
||||||||||||||||
| Futures Contracts |
$ | 33,649 | $ | 33,649 | $ | — | $ | — | ||||||||
|
|
|
|
|
|
|
|
|
|||||||||
| Total Assets — Other Financial Instruments |
$ | 33,649 | $ | 33,649 | $ | — | $ | — | ||||||||
|
|
|
|
|
|
|
|
|
|||||||||
| *** | Other financial instruments are derivative instruments not reflected in the Schedule of Investments, such as futures, forwards and swap contracts, which are valued at the unrealized appreciation (depreciation) on the investment. Details of these investments can be found in the Notes to Financial Statements. |
See Notes to Financial Statements.
48
Table of Contents
| STATEMENTS OF ASSETS AND LIABILITIES | June 30, 2014 (Unaudited) |
| Conservative Allocation Fund I |
Balanced Allocation Fund I |
Growth Allocation Fund I |
Aggressive Allocation Fund I |
|||||||||||||
| Assets |
||||||||||||||||
| Investments in securities of affiliated issuers, at value (1) |
$ | 82,320,924 | $ | 401,406,417 | $ | 281,616,598 | $ | 195,612,035 | ||||||||
| Cash collateral for derivatives |
50,400 | 238,850 | 221,950 | 240,000 | ||||||||||||
| Receivables: |
||||||||||||||||
| Dividends from affiliated funds |
17 | 115 | 77 | 57 | ||||||||||||
| Fund shares sold |
8,103 | 10,845 | 3,357 | 3,163 | ||||||||||||
| Variation margin on financial futures contracts |
40 | 3,991 | 2,375 | 1,415 | ||||||||||||
| Prepaid expenses and other assets |
361 | 361 | 361 | 361 | ||||||||||||
|
|
|
|
|
|
|
|
|
|||||||||
| Total Assets |
82,379,845 | 401,660,579 | 281,844,718 | 195,857,031 | ||||||||||||
|
|
|
|
|
|
|
|
|
|||||||||
| Liabilities |
||||||||||||||||
| Payables: |
||||||||||||||||
| Fund shares redeemed |
— | — | 8,563 | 18,614 | ||||||||||||
| Variation margin on financial futures contracts |
— | 800 | 800 | 960 | ||||||||||||
| Accrued expenses: |
||||||||||||||||
| Investment advisory fees |
3,871 | 33,430 | 23,393 | 16,595 | ||||||||||||
| Professional fees |
10,207 | 10,207 | 10,207 | 10,207 | ||||||||||||
| Other expenses |
9,529 | 16,699 | 13,859 | 10,284 | ||||||||||||
|
|
|
|
|
|
|
|
|
|||||||||
| Total Liabilities |
23,607 | 61,136 | 56,822 | 56,660 | ||||||||||||
|
|
|
|
|
|
|
|
|
|||||||||
| Net Assets |
$ | 82,356,238 | $ | 401,599,443 | $ | 281,787,896 | $ | 195,800,371 | ||||||||
|
|
|
|
|
|
|
|
|
|||||||||
| Net Assets Consist of: |
||||||||||||||||
| Paid-in-capital |
$ | 81,368,906 | $ | 381,504,130 | $ | 251,272,171 | $ | 172,337,753 | ||||||||
| Undistributed net investment income |
510,537 | 8,927,175 | 3,126,710 | 4,866,469 | ||||||||||||
| Accumulated net realized loss on investments and futures transactions |
(1,272,753 | ) | (23,272,399 | ) | (5,953,035 | ) | (6,655,073 | ) | ||||||||
| Net unrealized appreciation (depreciation) on investments and futures |
1,749,548 | 34,440,537 | 33,342,050 | 25,251,222 | ||||||||||||
|
|
|
|
|
|
|
|
|
|||||||||
| Net Assets |
$ | 82,356,238 | $ | 401,599,443 | $ | 281,787,896 | $ | 195,800,371 | ||||||||
|
|
|
|
|
|
|
|
|
|||||||||
| Net Asset Value: |
||||||||||||||||
| $0.001 par value, unlimited shares authorized |
||||||||||||||||
| Net assets applicable to the Institutional Class |
$ | 82,356,238 | $ | 401,599,443 | $ | 281,787,896 | $ | 195,800,371 | ||||||||
|
|
|
|
|
|
|
|
|
|||||||||
| Institutional shares outstanding |
8,184,439 | 35,603,921 | 21,786,523 | 13,360,335 | ||||||||||||
|
|
|
|
|
|
|
|
|
|||||||||
| Net asset value, offering and redemption price per Institutional share |
$ | 10.06 | $ | 11.28 | $ | 12.93 | $ | 14.66 | ||||||||
|
|
|
|
|
|
|
|
|
|||||||||
|
|
||||||||||||||||
|
(1) Investments in securities of affiliated issuers, at cost |
$ | 80,574,078 | $ | 367,007,485 | $ | 248,316,600 | $ | 170,394,462 | ||||||||
|
|
|
|
|
|
|
|
|
|||||||||
See Notes to Financial Statements.
49
Table of Contents
| STATEMENTS OF OPERATIONS | For the Six Months Ended June 30, 2014 (Unaudited) |
| Conservative Allocation Fund I |
Balanced Allocation Fund I |
Growth Allocation Fund I |
Aggressive Allocation Fund I |
|||||||||||||
| Investment Income |
||||||||||||||||
| Income dividends received from affiliated funds |
$ | 572,938 | $ | 3,907,222 | $ | 1,851,377 | $ | 616,215 | ||||||||
| Interest |
— | — | 66 | — | ||||||||||||
|
|
|
|
|
|
|
|
|
|||||||||
| Total Investment Income |
572,938 | 3,907,222 | 1,851,443 | 616,215 | ||||||||||||
|
|
|
|
|
|
|
|
|
|||||||||
| Expenses |
||||||||||||||||
| Investment advisory fees |
41,606 | 196,528 | 136,960 | 94,920 | ||||||||||||
| Transfer agent fees: |
||||||||||||||||
| Institutional Shares |
1,927 | 2,006 | 1,914 | 1,914 | ||||||||||||
| Custodian fees |
5,499 | 12,053 | 10,308 | 6,742 | ||||||||||||
| Accounting and administration fees |
4,421 | 12,474 | 9,398 | 7,052 | ||||||||||||
| Professional fees |
22,797 | 22,797 | 22,797 | 22,797 | ||||||||||||
| Blue sky fees: |
||||||||||||||||
| Institutional Shares |
900 | 900 | 900 | 900 | ||||||||||||
| Shareholder reporting fees |
204 | 341 | 201 | 168 | ||||||||||||
| Trustee expenses |
402 | 1,855 | 1,288 | 890 | ||||||||||||
| Line of credit facility fees |
302 | 1,394 | 967 | 667 | ||||||||||||
| Other expenses |
4,563 | 4,782 | 4,856 | 4,666 | ||||||||||||
|
|
|
|
|
|
|
|
|
|||||||||
| Total Expenses |
82,621 | 255,130 | 189,589 | 140,716 | ||||||||||||
| Expenses waived/reimbursed net of amount recaptured(1) |
(20,220 | ) | — | — | (116 | ) | ||||||||||
|
|
|
|
|
|
|
|
|
|||||||||
| Net expenses |
62,401 | 255,130 | 189,589 | 140,600 | ||||||||||||
|
|
|
|
|
|
|
|
|
|||||||||
| Net investment income |
510,537 | 3,652,092 | 1,661,854 | 475,615 | ||||||||||||
|
|
|
|
|
|
|
|
|
|||||||||
| Realized and Unrealized Gain (Loss) |
||||||||||||||||
| Capital gain distributions received from affiliated funds |
223,933 | 2,011,829 | 2,227,584 | 2,308,226 | ||||||||||||
| Net realized gain (loss) on investment securities of affiliated issuers |
191,770 | 1,156,653 | 388,348 | (45,069 | ) | |||||||||||
| Net realized gain on futures transactions |
19,366 | 370,856 | 338,021 | 284,651 | ||||||||||||
|
|
|
|
|
|
|
|
|
|||||||||
| Net realized gain |
435,069 | 3,539,338 | 2,953,953 | 2,547,808 | ||||||||||||
|
|
|
|
|
|
|
|
|
|||||||||
| Change in unrealized appreciation (depreciation) on investment securities of affiliated issuers |
1,620,438 | 13,941,071 | 10,207,288 | 5,849,211 | ||||||||||||
| Change in unrealized depreciation on futures |
(4,539 | ) | (51,092 | ) | (98,527 | ) | (106,199 | ) | ||||||||
|
|
|
|
|
|
|
|
|
|||||||||
| Net change in unrealized appreciation |
1,615,899 | 13,889,979 | 10,108,761 | 5,743,012 | ||||||||||||
|
|
|
|
|
|
|
|
|
|||||||||
| Net Realized and Unrealized Gain |
2,050,968 | 17,429,317 | 13,062,714 | 8,290,820 | ||||||||||||
|
|
|
|
|
|
|
|
|
|||||||||
| Net Increase in Net Assets Resulting from Operations |
$ | 2,561,505 | $ | 21,081,409 | $ | 14,724,568 | $ | 8,766,435 | ||||||||
|
|
|
|
|
|
|
|
|
|||||||||
| (1) | See Note 3a and 3c in Notes to Financial Statements. |
See Notes to Financial Statements.
50
Table of Contents
(This page intentionally left blank)
51
Table of Contents
STATEMENTS OF CHANGES IN NET ASSETS
| Conservative Allocation Fund I | Balanced Allocation Fund I | |||||||||||||||
| For the Six Months Ended 06/30/14 |
For the Year Ended 12/31/13 |
For the Six Months Ended 06/30/14 |
For the Year Ended 12/31/13 |
|||||||||||||
| (Unaudited) | (Unaudited) | |||||||||||||||
| Operations: |
||||||||||||||||
| Net investment income |
$ | 510,537 | $ | 1,260,250 | $ | 3,652,092 | $ | 9,394,078 | ||||||||
| Net realized gain on investment securities and futures transactions |
435,069 | 5,102,173 | 3,539,338 | 21,655,771 | ||||||||||||
| Net change in unrealized appreciation (depreciation) on investment securities and futures |
1,615,899 | (3,235,070 | ) | 13,889,979 | 4,996,631 | |||||||||||
|
|
|
|
|
|
|
|
|
|||||||||
| Net increase in net assets resulting from operations |
2,561,505 | 3,127,353 | 21,081,409 | 36,046,480 | ||||||||||||
|
|
|
|
|
|
|
|
|
|||||||||
| Dividends to Shareholders: |
||||||||||||||||
| Dividends from net investment income(1) |
— | (2,555,816 | ) | — | (13,881,599 | ) | ||||||||||
| Distributions from net realized capital gains |
— | (476,714 | ) | — | — | |||||||||||
|
|
|
|
|
|
|
|
|
|||||||||
| Total dividends |
— | (3,032,530 | ) | — | (13,881,599 | ) | ||||||||||
|
|
|
|
|
|
|
|
|
|||||||||
| Capital Share Transactions: |
||||||||||||||||
| Proceeds from Institutional shares sold |
4,155,826 | 10,446,277 | 9,536,753 | 30,704,095 | ||||||||||||
| Reinvestment of dividends and distributions into Institutional shares |
— | 3,015,087 | — | 13,840,284 | ||||||||||||
| Value of Institutional shares redeemed |
(7,999,978 | ) | (12,635,464 | ) | (16,386,074 | ) | (24,596,392 | ) | ||||||||
|
|
|
|
|
|
|
|
|
|||||||||
| Net increase (decrease) from capital share transactions(2) |
(3,844,152 | ) | 825,900 | (6,849,321 | ) | 19,947,987 | ||||||||||
|
|
|
|
|
|
|
|
|
|||||||||
| Total increase (decrease) in net assets |
(1,282,647 | ) | 920,723 | 14,232,088 | 42,112,868 | |||||||||||
|
|
|
|
|
|
|
|
|
|||||||||
| Net Assets: |
||||||||||||||||
| Beginning of Period |
83,638,885 | 82,718,162 | 387,367,355 | 345,254,487 | ||||||||||||
|
|
|
|
|
|
|
|
|
|||||||||
| End of Period* |
$ | 82,356,238 | $ | 83,638,885 | $ | 401,599,443 | $ | 387,367,355 | ||||||||
|
|
|
|
|
|
|
|
|
|||||||||
| * Including undistributed net investment income |
$ | 510,537 | $ | — | $ | 8,927,175 | $ | 5,275,083 | ||||||||
|
|
|
|
|
|
|
|
|
|||||||||
| (1) | Includes dividends paid from the short-term portion of capital gain distributions received from affiliated funds. |
| (2) | See Note 6 in Notes to Financial Statements. |
See Notes to Financial Statements.
52
Table of Contents
| Growth Allocation Fund I | Aggressive Allocation Fund I | |||||||||||||
| For the Six Months Ended 06/30/14 |
For the Year Ended 12/31/13 |
For the Six Months Ended 06/30/14 |
For the Year Ended 12/31/13 |
|||||||||||
| (Unaudited) | (Unaudited) | |||||||||||||
| $ | 1,661,854 | $ | 5,423,835 | $ | 475,615 | $ | 2,726,763 | |||||||
|
|
2,953,953 |
|
16,880,871 | 2,547,808 | 13,387,781 | |||||||||
|
|
10,108,761 |
|
20,212,758 | 5,743,012 | 24,808,491 | |||||||||
|
|
|
|
|
|
|
|
|
|||||||
| 14,724,568 | 42,517,464 | 8,766,435 | 40,923,035 | |||||||||||
|
|
|
|
|
|
|
|
|
|||||||
| — | (9,414,953 | ) | — | (4,675,371 | ) | |||||||||
| — | — | — | — | |||||||||||
|
|
|
|
|
|
|
|
|
|||||||
| — | (9,414,953 | ) | — | (4,675,371 | ) | |||||||||
|
|
|
|
|
|
|
|
|
|||||||
| 6,989,961 | 29,753,490 | 5,612,392 | 17,600,936 | |||||||||||
| — | 9,406,951 | — | 4,673,297 | |||||||||||
| (11,022,636 | ) | (17,497,829 | ) | (7,439,858 | ) | (12,491,272 | ) | |||||||
|
|
|
|
|
|
|
|
|
|||||||
| (4,032,675 | ) | 21,662,612 | (1,827,466 | ) | 9,782,961 | |||||||||
|
|
|
|
|
|
|
|
|
|||||||
| 10,691,893 | 54,765,123 | 6,938,969 | 46,030,625 | |||||||||||
|
|
|
|
|
|
|
|
|
|||||||
| 271,096,003 | 216,330,880 | 188,861,402 | 142,830,777 | |||||||||||
|
|
|
|
|
|
|
|
|
|||||||
| $ | 281,787,896 | $ | 271,096,003 | $ | 195,800,371 | $ | 188,861,402 | |||||||
|
|
|
|
|
|
|
|
|
|||||||
| $ | 3,126,710 | $ | 1,464,856 | $ | 4,866,469 | $ | 4,390,854 | |||||||
|
|
|
|
|
|
|
|
|
|||||||
See Notes to Financial Statements.
53
Table of Contents
FINANCIAL HIGHLIGHTS (Unaudited)
| For a Share Outstanding For the Years Ending December 31, unless otherwise indicated | Ratios to Average Net Assets | |||||||||||||||||||||||||||||||||||||||||||||||||||
| Net Asset Value, Beginning of Period |
Net Investment Income (1) |
Capital Gain Distributions Received from Affiliated Funds |
Realized and Unrealized Gain (Loss) on Investments |
Dividends from Net Investment Income (2) |
Distributions from Net Realized Capital Gains |
Net Asset Value, End of Period |
Total Return |
Net Assets, End of Period (000) |
Expenses, Net (3)(4) |
Expenses, Gross (3)(5) |
Investment Income, Net (1)(4) |
Portfolio Turnover Rate |
||||||||||||||||||||||||||||||||||||||||
| Conservative Allocation Fund I |
|
|||||||||||||||||||||||||||||||||||||||||||||||||||
| Institutional Class |
||||||||||||||||||||||||||||||||||||||||||||||||||||
| 2014(6) |
$ | 9.76 | $ | 0.06 | # | $ | 0.03 | $ | 0.21 | $ | — | $ | — | $ | 10.06 | 3.07 | % | $ | 82,356 | 0.15 | % | 0.20 | % | 1.24 | % | 3 | % | |||||||||||||||||||||||||
| 2013 |
9.75 | 0.15 | # | 0.22 | 0.01 | (0.31 | ) | (0.06 | ) | 9.76 | 3.85 | 83,639 | 0.15 | 0.20 | 1.48 | 21 | ||||||||||||||||||||||||||||||||||||
| 2012 |
9.35 | 0.20 | # | 0.15 | 0.31 | (0.26 | ) | — | 9.75 | 7.07 | 82,718 | 0.15 | 0.21 | 2.10 | 8 | |||||||||||||||||||||||||||||||||||||
| 2011 |
9.42 | 0.22 | # | 0.05 | (0.09 | ) | (0.25 | ) | — | 9.35 | 1.92 | 74,141 | 0.15 | 0.24 | 2.26 | 26 | ||||||||||||||||||||||||||||||||||||
| 2010 |
9.06 | 0.23 | # | 0.10 | 0.33 | (0.30 | ) | — | 9.42 | 7.25 | 71,926 | 0.15 | 0.20 | 2.50 | 12 | |||||||||||||||||||||||||||||||||||||
| 2009 |
8.00 | 0.32 | # | — | † | 1.05 | (0.31 | ) | — | 9.06 | 17.13 | 64,230 | 0.15 | 0.23 | 3.70 | 35 | ||||||||||||||||||||||||||||||||||||
| Balanced Allocation Fund I |
|
|||||||||||||||||||||||||||||||||||||||||||||||||||
| Institutional Class |
||||||||||||||||||||||||||||||||||||||||||||||||||||
| 2014(6) |
$ | 10.69 | $ | 0.10 | # | $ | 0.06 | $ | 0.43 | $ | — | $ | — | $ | 11.28 | 5.52 | % | $ | 401,599 | 0.13 | % | 0.13 | % | 1.89 | % | 2 | % | |||||||||||||||||||||||||
| 2013 |
10.06 | 0.27 | # | 0.55 | 0.21 | (0.40 | ) | — | 10.69 | 10.22 | 387,367 | 0.13 | 0.13 | 2.51 | 31 | |||||||||||||||||||||||||||||||||||||
| 2012 |
9.35 | 0.31 | # | 0.30 | 0.51 | (0.41 | ) | — | 10.06 | 12.05 | 345,254 | 0.14 | 0.14 | 3.06 | 5 | |||||||||||||||||||||||||||||||||||||
| 2011 |
9.64 | 0.31 | # | 0.11 | (0.31 | ) | (0.40 | ) | — | 9.35 | 1.14 | 310,267 | 0.14 | 0.14 | 3.14 | 18 | ||||||||||||||||||||||||||||||||||||
| 2010 |
9.00 | 0.33 | # | 0.15 | 0.60 | (0.44 | ) | — | 9.64 | 12.04 | 347,489 | 0.13 | 0.13 | 3.56 | 19 | |||||||||||||||||||||||||||||||||||||
| 2009 |
7.53 | 0.37 | # | 0.08 | 1.46 | (0.44 | ) | — | 9.00 | 25.28 | 326,676 | 0.14 | 0.14 | 4.46 | 20 | |||||||||||||||||||||||||||||||||||||
| Growth Allocation Fund I |
|
|||||||||||||||||||||||||||||||||||||||||||||||||||
| Institutional Class |
||||||||||||||||||||||||||||||||||||||||||||||||||||
| 2014(6) |
$ | 12.26 | $ | 0.08 | # | $ | 0.10 | $ | 0.49 | $ | — | $ | — | $ | 12.93 | 5.47 | % | $ | 281,788 | 0.14 | % | 0.14 | % | 1.24 | % | 3 | % | |||||||||||||||||||||||||
| 2013 |
10.70 | 0.25 | # | 0.92 | 0.83 | (0.44 | ) | — | 12.26 | 18.72 | 271,096 | 0.14 | 0.14 | 2.15 | 28 | |||||||||||||||||||||||||||||||||||||
| 2012 |
9.56 | 0.25 | # | 0.36 | 0.83 | (0.30 | ) | — | 10.70 | 15.09 | 216,331 | 0.15 | 0.15 | 2.41 | 4 | |||||||||||||||||||||||||||||||||||||
| 2011 |
10.08 | 0.24 | # | 0.05 | (0.51 | ) | (0.30 | ) | — | 9.56 | (2.21 | ) | 197,883 | 0.15 | 0.15 | 2.34 | 13 | |||||||||||||||||||||||||||||||||||
| 2010 |
9.13 | 0.24 | # | 0.07 | 0.94 | (0.30 | ) | — | 10.08 | 13.68 | 233,557 | 0.14 | 0.14 | 2.60 | 13 | |||||||||||||||||||||||||||||||||||||
| 2009 |
7.35 | 0.26 | # | 0.04 | 1.78 | (0.30 | ) | — | 9.13 | 28.22 | 209,059 | 0.15 | 0.15 | 3.28 | 13 | |||||||||||||||||||||||||||||||||||||
| Aggressive Allocation Fund I |
|
|||||||||||||||||||||||||||||||||||||||||||||||||||
| Institutional Class |
||||||||||||||||||||||||||||||||||||||||||||||||||||
| 2014(6) |
$ | 14.00 | $ | 0.04 | # | $ | 0.17 | $ | 0.45 | $ | — | $ | — | $ | 14.66 | 4.72 | % | $ | 195,800 | 0.15 | % | 0.15 | % | 0.51 | % | 3 | % | |||||||||||||||||||||||||
| 2013 |
11.24 | 0.21 | # | 1.40 | 1.51 | (0.36 | ) | — | 14.00 | 27.73 | 188,861 | 0.15 | 0.16 | 1.62 | 17 | |||||||||||||||||||||||||||||||||||||
| 2012 |
9.74 | 0.20 | # | 0.37 | 1.11 | (0.18 | ) | — | 11.24 | 17.31 | 142,831 | 0.15 | 0.16 | 1.87 | 8 | |||||||||||||||||||||||||||||||||||||
| 2011 |
10.44 | 0.16 | # | 0.01 | (0.69 | ) | (0.18 | ) | — | 9.74 | (4.93 | ) | 129,466 | 0.15 | 0.18 | 1.51 | 9 | |||||||||||||||||||||||||||||||||||
| 2010 |
9.21 | 0.16 | # | — | † | 1.24 | (0.17 | ) | — | 10.44 | 15.23 | 157,310 | 0.15 | 0.16 | 1.67 | 5 | ||||||||||||||||||||||||||||||||||||
| 2009 |
7.20 | 0.16 | # | — | † | 2.06 | (0.21 | ) | — | 9.21 | 30.87 | 143,264 | 0.15 | 0.17 | 2.10 | 5 | ||||||||||||||||||||||||||||||||||||
| † | Amount represents less than $0.005 per share. |
| # | Calculated using the average shares outstanding method. |
| (1) | Recognition of net investment income by the Fund is affected by the timing of the declaration of dividends by the underlying investment companies in which the Fund invests. |
| (2) | Includes dividends paid from the short-term portion of capital gain distributions received from affiliated Funds. |
| (3) | Does not include expenses of the investment companies in which the Fund invests. |
| (4) | The ratio includes expenses waived/reimbursed net of amount recaptured and fees paid indirectly, where applicable; if expenses waived/reimbursed net of amount recaptured and fees paid indirectly were excluded, the ratio would have been higher (lower) than the ratio shown. |
| (5) | The ratio excludes expenses waived/reimbursed net of amount recaptured and fees paid indirectly, where applicable; if expenses waived/reimbursed net of amount recaptured and fees paid indirectly were included, the ratio would have been lower than the ratio shown. |
| (6) | For the six months ended June 30, 2014. All ratios for the period have been annualized. Total return and portfolio turnover for the period have not been annualized. |
See Notes to Financial Statements.
54
Table of Contents
| MONEY MARKET FUND | ||
| SCHEDULE OF INVESTMENTS | June 30, 2014 (Unaudited) |
See Notes to Financial Statements.
55
Table of Contents
MONEY MARKET FUND
SCHEDULE OF INVESTMENTS (Continued)
See Notes to Financial Statements.
56
Table of Contents
See Notes to Financial Statements.
57
Table of Contents
MONEY MARKET FUND
SCHEDULE OF INVESTMENTS (Continued)
VALUATION HIERARCHY
The following is a summary of the inputs used, as of June 30, 2014, in valuing the Fund’s investments carried at fair value:
| Total Value |
Level 1 Quoted Prices |
Level
2 Other Significant Observable Inputs |
Level
3 Significant Unobservable Inputs |
|||||||||||||
| Assets: |
||||||||||||||||
| Investments in Securities: |
||||||||||||||||
| Agency Obligation |
$ | 15,047,334 | $ | — | $ | 15,047,334 | $ | — | ||||||||
| Certificates of Deposit |
382,502,218 | — | 382,502,218 | — | ||||||||||||
| Commercial Paper |
599,657,256 | — | 599,657,256 | — | ||||||||||||
| Corporate Bond |
4,900,000 | — | 4,900,000 | — | ||||||||||||
| Municipal Bonds |
189,284,000 | — | 189,284,000 | — | ||||||||||||
| Repurchase Agreements |
32,581,000 | — | 32,581,000 | — | ||||||||||||
| Time Deposits |
34,000,000 | — | 34,000,000 | — | ||||||||||||
| U.S. Treasury Obligations |
66,983,482 | — | 66,983,482 | — | ||||||||||||
|
|
|
|
|
|
|
|
|
|||||||||
| Total Assets — Investments in Securities |
$ | 1,324,955,290 | $ | — | $ | 1,324,955,290 | $ | — | ||||||||
|
|
|
|
|
|
|
|
|
|||||||||
See Notes to Financial Statements.
58
Table of Contents
| LOW-DURATION BOND FUND | ||
| SCHEDULE OF INVESTMENTS | June 30, 2014 (Unaudited) |
See Notes to Financial Statements.
59
Table of Contents
LOW-DURATION BOND FUND
SCHEDULE OF INVESTMENTS (Continued)
See Notes to Financial Statements.
60
Table of Contents
See Notes to Financial Statements.
61
Table of Contents
LOW-DURATION BOND FUND
SCHEDULE OF INVESTMENTS (Continued)
See Notes to Financial Statements.
62
Table of Contents
See Notes to Financial Statements.
63
Table of Contents
LOW-DURATION BOND FUND
SCHEDULE OF INVESTMENTS (Continued)
See Notes to Financial Statements.
64
Table of Contents
See Notes to Financial Statements.
65
Table of Contents
LOW-DURATION BOND FUND
SCHEDULE OF INVESTMENTS (Continued)
See Notes to Financial Statements.
66
Table of Contents
See Notes to Financial Statements.
67
Table of Contents
LOW-DURATION BOND FUND
SCHEDULE OF INVESTMENTS (Continued)
See Notes to Financial Statements.
68
Table of Contents
See Notes to Financial Statements.
69
Table of Contents
LOW-DURATION BOND FUND
SCHEDULE OF INVESTMENTS (Continued)
Swap agreements outstanding at June 30, 2014:
| Reference Obligation |
Implied Credit Spread |
Fixed Deal (Pay) Rate |
Maturity Date |
Counterparty | Currency | Notional Amount |
Market Value | Upfront Premiums Paid/ (Received) |
Unrealized Appreciation (Depreciation) |
|||||||||||||||||||||||||||
| Credit Default Swaps on Corporate Issues — Sell Protection |
|
|||||||||||||||||||||||||||||||||||
| Barclays Bank PLC, 1.551% due 10/27/15 |
47.59 | % | 1.00 | % | 12/20/17 | GSC | EUR | 1,200,000 | $ | 30,320 | $ | (34,062 | ) | $ | 64,382 | |||||||||||||||||||||
| LaFarge SA, 5.375% due 11/29/18 |
101.66 | % | 1.00 | % | 06/20/19 | CITI | EUR | 100,000 | (86 | ) | (587 | ) | 501 | |||||||||||||||||||||||
|
|
|
|
|
|
|
|||||||||||||||||||||||||||||||
| $ | 30,234 | $ | (34,649 | ) | $ | 64,883 | ||||||||||||||||||||||||||||||
|
|
|
|
|
|
|
|||||||||||||||||||||||||||||||
| Reference Obligation |
Fixed Deal (Pay) Rate |
Maturity Date |
Counterparty | Currency | Notional Amount |
Market Value |
Upfront Premiums Paid/ (Received) |
Unrealized Appreciation (Depreciation) |
||||||||||||||||||||||||
| Credit Default Swaps on Credit Indices — Buy Protection |
|
|||||||||||||||||||||||||||||||
| CMBX.NA.AAA.4 Index |
(0.35 | )% | 02/17/51 | GSC | USD | 5,573,522 | $ | 30,407 | $ | 754,047 | $ | (723,640 | ) | |||||||||||||||||||
| Reference Obligation |
Implied Credit Spread |
Fixed Deal (Pay) Rate |
Maturity Date |
Counterparty | Currency | Notional Amount |
Market Value | Upfront Premiums Paid/ (Received) |
Unrealized Appreciation (Depreciation) |
|||||||||||||||||||||||||||
| Credit Default Swaps on Credit Indices — Sell Protection |
|
|||||||||||||||||||||||||||||||||||
| CMBX.NA.AAA.1 Index |
0.00 | % | 1.00 | % | 10/12/52 | CS | USD | 375,757 | $ | (1,342 | ) | $ | (1,217 | ) | $ | (125 | ) | |||||||||||||||||||
| Reference Obligation |
Fixed Deal (Pay) Rate |
Maturity Date |
Counterparty | Currency | Notional Amount |
Market Value |
Upfront Premiums Paid/ (Received) |
Unrealized Appreciation (Depreciation) |
||||||||||||||||||||||||
| Interest Rate Swaps |
||||||||||||||||||||||||||||||||
| Brazil CETIP Interbank Deposit |
8.27 | % | 01/02/15 | MSCS | BRL | 2,500,000 | $ | (23,579 | ) | $ | (3,096 | ) | $ | (20,483 | ) | |||||||||||||||||
| Brazil CETIP Interbank Deposit |
8.56 | % | 01/02/15 | UBS | BRL | 2,200,000 | (16,483 | ) | 57 | (16,540 | ) | |||||||||||||||||||||
| Brazil CETIP Interbank Deposit |
8.08 | % | 01/02/15 | HSBC | BRL | 1,200,000 | (10,999 | ) | 2,119 | (13,118 | ) | |||||||||||||||||||||
| Brazil CETIP Interbank Deposit |
8.43 | % | 01/02/15 | DEUT | BRL | 1,000,000 | (5,218 | ) | 5,742 | (10,960 | ) | |||||||||||||||||||||
| Brazil CETIP Interbank Deposit |
7.92 | % | 01/02/15 | BAR | BRL | 600,000 | (7,038 | ) | (42 | ) | (6,996 | ) | ||||||||||||||||||||
| Brazil CETIP Interbank Deposit |
9.93 | % | 01/02/15 | UBS | BRL | 400,000 | 4,249 | 116 | 4,133 | |||||||||||||||||||||||
| Brazil CETIP Interbank Deposit |
8.83 | % | 01/02/15 | HSBC | BRL | 200,000 | (222 | ) | 338 | (560 | ) | |||||||||||||||||||||
| 6-Month BBR BBSW Index |
5.50 | % | 12/15/17 | BAR | AUD | 1,500,000 | 116,529 | (3,516 | ) | 120,045 | ||||||||||||||||||||||
| 6-Month BBR BBSW Index |
5.50 | % | 12/15/17 | DEUT | AUD | 1,000,000 | 77,690 | (2,085 | ) | 79,775 | ||||||||||||||||||||||
| 6-Month BBR BBSW Index |
3.75 | % | 12/11/18 | CME | AUD | 3,600,000 | 82,048 | (8,057 | ) | 90,105 | ||||||||||||||||||||||
| 6-Month BBR BBSW Index |
3.75 | % | 03/15/23 | CME | AUD | 1,800,000 | 44,049 | 2,257 | 41,792 | |||||||||||||||||||||||
| 3-Month LIBOR |
3.50 | % | 12/18/43 | CME | USD | 2,700,000 | (106,473 | ) | 152,280 | (258,753 | ) | |||||||||||||||||||||
| 3-Month LIBOR |
3.75 | % | 06/18/44 | CME | USD | 3,500,000 | (308,115 | ) | (334,159 | ) | 26,044 | |||||||||||||||||||||
|
|
|
|
|
|
|
|||||||||||||||||||||||||||
| $ | (153,562 | ) | $ | (188,046 | ) | $ | 34,484 | |||||||||||||||||||||||||
|
|
|
|
|
|
|
|||||||||||||||||||||||||||
| Total Swap agreements outstanding at June 30, 2014 |
|
$ | (94,263 | ) | $ | 530,135 | $ | (624,398 | ) | |||||||||||||||||||||||
|
|
|
|
|
|
|
|||||||||||||||||||||||||||
See Notes to Financial Statements.
70
Table of Contents
VALUATION HIERARCHY
The following is a summary of the inputs used, as of June 30, 2014, in valuing the Fund’s investments carried at fair value:
| Total Value |
Level 1 Quoted Prices |
Level
2 Other Significant Observable Inputs |
Level
3 Significant Unobservable Inputs |
|||||||||||||
| Assets: |
||||||||||||||||
| Investments in Securities: |
||||||||||||||||
| Agency Obligations |
$ | 9,780,660 | $ | — | $ | 9,780,660 | $ | — | ||||||||
| Asset-Backed Securities |
83,520,491 | — | 78,345,345 | 5,175,146 | ||||||||||||
| Corporate Bonds |
214,506,113 | — | 211,256,106 | 3,250,007 | ||||||||||||
| Foreign Bonds: |
||||||||||||||||
| Australia |
10,156,993 | — | 8,715,383 | 1,441,610 | ||||||||||||
| Bermuda |
1,110,000 | — | 1,110,000 | — | ||||||||||||
| Brazil |
1,800,050 | — | 1,800,050 | — | ||||||||||||
| Canada |
3,744,672 | — | 3,744,672 | — | ||||||||||||
| Cayman Islands |
3,238,317 | — | 3,238,317 | — | ||||||||||||
| Chile |
4,929,305 | — | 4,929,305 | — | ||||||||||||
| Colombia |
220,238 | — | 220,238 | — | ||||||||||||
| Costa Rica |
513,750 | — | 513,750 | — | ||||||||||||
| France |
24,748,421 | — | 24,748,421 | — | ||||||||||||
| Germany |
2,500,948 | — | 2,500,948 | — | ||||||||||||
| Iceland |
905,150 | — | 905,150 | — | ||||||||||||
| Ireland |
705,250 | — | 705,250 | — | ||||||||||||
| Italy |
6,916,120 | — | 6,916,120 | — | ||||||||||||
| Japan |
4,703,963 | — | 4,703,963 | — | ||||||||||||
| Luxembourg |
618,000 | — | 618,000 | — | ||||||||||||
| Mexico |
5,286,970 | — | 5,286,970 | — | ||||||||||||
| Netherlands |
1,431,245 | — | 1,431,245 | — | ||||||||||||
| New Zealand |
1,245,244 | — | 1,245,244 | — | ||||||||||||
| Norway |
300,750 | — | 300,750 | — | ||||||||||||
| Panama |
311,960 | — | 311,960 | — | ||||||||||||
| Peru |
506,250 | — | 506,250 | — | ||||||||||||
| Singapore |
3,036,657 | — | 3,036,657 | — | ||||||||||||
| South Korea |
27,528,469 | — | 27,528,469 | — | ||||||||||||
| Spain |
1,298,637 | — | 1,298,637 | — | ||||||||||||
| Switzerland |
2,810,990 | — | 2,810,990 | — | ||||||||||||
| United Kingdom |
5,083,566 | — | 5,083,566 | — | ||||||||||||
| Virgin Islands (British) |
3,369,772 | — | 3,369,772 | — | ||||||||||||
| Foreign Government Inflation-Linked Bonds |
12,389,548 | — | 12,389,548 | — | ||||||||||||
| Loan Agreements |
1,774,909 | — | 1,774,909 | — | ||||||||||||
| Money Market Funds |
141,233,751 | 141,233,751 | — | — | ||||||||||||
| Mortgage-Backed Securities |
197,036,493 | — | 186,873,945 | 10,162,548 | ||||||||||||
| Municipal Bonds |
9,922,197 | — | 9,922,197 | — | ||||||||||||
| U.S. Treasury Obligations |
255,048,903 | — | 255,048,903 | — | ||||||||||||
|
|
|
|
|
|
|
|
|
|||||||||
| Total Assets — Investments in Securities |
$ | 1,044,234,752 | $ | 141,233,751 | $ | 882,971,690 | $ | 20,029,311 | ||||||||
|
|
|
|
|
|
|
|
|
|||||||||
| Other Financial Instruments*** |
||||||||||||||||
| Futures Contracts |
$ | 176,300 | $ | 234,531 | $ | (58,232 | ) | $ | — | |||||||
|
|
|
|
|
|
|
|
|
|||||||||
| Total Assets — Other Financial Instruments |
$ | 176,300 | $ | 234,531 | $ | (58,232 | ) | $ | — | |||||||
|
|
|
|
|
|
|
|
|
|||||||||
See Notes to Financial Statements.
71
Table of Contents
LOW-DURATION BOND FUND
SCHEDULE OF INVESTMENTS (Continued)
| Total Value |
Level 1 Quoted Prices |
Level
2 Other Significant Observable Inputs |
Level
3 Significant Unobservable Inputs |
|||||||||||||
| Liabilities: |
||||||||||||||||
| Investments in Securities: |
||||||||||||||||
| Security Sold Short |
$ | (3,116,467 | ) | $ | — | $ | (3,116,467 | ) | $ | — | ||||||
| TBA Sale Commitment |
(2,422,638 | ) | — | (2,422,638 | ) | — | ||||||||||
| Written Options |
(558 | ) | — | (558 | ) | — | ||||||||||
|
|
|
|
|
|
|
|
|
|||||||||
| Total Liabilities — Investments in Securities |
$ | (5,539,663 | ) | $ | — | $ | (5,539,663 | ) | $ | — | ||||||
|
|
|
|
|
|
|
|
|
|||||||||
| Other Financial Instruments*** |
||||||||||||||||
| Forward Foreign Currency Contracts |
$ | (381,224 | ) | $ | — | $ | (381,224 | ) | $ | — | ||||||
| Swap Agreements |
(94,263 | ) | — | (94,263 | ) | — | ||||||||||
|
|
|
|
|
|
|
|
|
|||||||||
| Total Liabilities — Other Financial Instruments |
$ | (475,487 | ) | $ | — | $ | (475,487 | ) | $ | — | ||||||
|
|
|
|
|
|
|
|
|
|||||||||
| *** | Other financial instruments are derivative instruments not reflected in the Schedule of Investments, such as futures, forwards and swap contracts, which are valued at the unrealized appreciation (depreciation) on the investment. Details of these investments can be found in the Notes to Financial Statements. |
Management has determined that the amount of transfers between Level 1 and Level 2 compared to total net assets of the Funds is not material, therefore, the transfers between Level 1 and Level 2 are not shown for the period ended June 30, 2014.
The unobservable inputs used in the fair value measurement of the reporting entity’s asset-backed securities, corporate bonds, foreign bonds and mortgage-backed securities are values based on evaluated quotations received from dealers who make markets in such securities. Significant increases (decreases) in those evaluated quotations would result in a significantly higher (lower) fair value measurement.
The following is a reconciliation of assets in which significant unobservable inputs (Level 3) were used in determining fair value:
| Total Value |
Asset-Backed Securities |
Corporate Bonds |
Foreign Bonds |
Mortgage- Backed Securities |
Written Option |
|||||||||||||||||||
| Balance, 12/31/13 |
$ | 20,265,191 | $ | 3,881,837 | $ | 3,442,534 | $ | 1,544,292 | $ | 11,548,393 | $ | (151,865 | ) | |||||||||||
| Accrued discounts/premiums |
(20,311 | ) | 630 | (17,079 | ) | (30 | ) | (3,832 | ) | — | ||||||||||||||
| Realized gain (loss)(1) |
(31,987 | ) | 2,117 | (14,379 | ) | (23,014 | ) | (34,480 | ) | 37,769 | ||||||||||||||
| Change in unrealized appreciation (depreciation)(2) |
403,874 | 31,113 | 32,260 | 90,362 | 94,943 | 155,196 | ||||||||||||||||||
| Purchases |
6,498,864 | 3,098,864 | — | — | 3,400,000 | — | ||||||||||||||||||
| Sales |
(605,137 | ) | (107,551 | ) | — | (145,837 | ) | (310,649 | ) | (41,100 | ) | |||||||||||||
| Transfers in to Level 3(3) |
407,158 | — | — | — | 407,158 | — | ||||||||||||||||||
| Transfers out of Level 3(4) |
(5,014,873 | ) | (1,345,251 | ) | — | — | (3,669,622 | ) | — | |||||||||||||||
| Maturities |
— | — | — | — | — | — | ||||||||||||||||||
| Paydowns |
(1,873,468 | ) | (386,613 | ) | (193,329 | ) | (24,163 | ) | (1,269,363 | ) | — | |||||||||||||
|
|
|
|
|
|
|
|
|
|
|
|
|
|||||||||||||
| Balance, 06/30/14 |
$ | 20,029,311 | $ | 5,175,146 | $ | 3,250,007 | $ | 1,441,610 | $ | 10,162,548 | $ | — | ||||||||||||
|
|
|
|
|
|
|
|
|
|
|
|
|
|||||||||||||
| (1) | Realized gain (loss) from the sale of Level 3 securities can be found on the Statement of Operations in Net realized gain (loss) from: Investment securities. |
| (2) | Change in unrealized appreciation (depreciation) can be found on the Statement of Operations in Net change in unrealized appreciation (depreciation) on: Investment securities and Net change in unrealized appreciation (depreciation) on: Option contracts written. |
| (3) | Transfers in to Level 3 represent the value of a security at June 30, 2014 that was transferred from Level 2 to Level 3 of the fair value hierarchy as a result of the inability of the Fund to obtain a price which was determined using observable inputs. |
| (4) | Transfers out of Level 3 represent the value of securities at June 30, 2014 that were transferred from Level 3 to Level 2 of the fair value hierarchy as a result of the ability of the Fund to obtain a price which was determined using observable inputs. |
See Notes to Financial Statements.
72
Table of Contents
|
SCHEDULE OF INVESTMENTS |
June 30, 2014 (Unaudited) |
See Notes to Financial Statements.
73
Table of Contents
MEDIUM-DURATION BOND FUND
SCHEDULE OF INVESTMENTS (Continued)
See Notes to Financial Statements.
74
Table of Contents
See Notes to Financial Statements.
75
Table of Contents
MEDIUM-DURATION BOND FUND
SCHEDULE OF INVESTMENTS (Continued)
See Notes to Financial Statements.
76
Table of Contents
See Notes to Financial Statements.
77
Table of Contents
MEDIUM-DURATION BOND FUND
SCHEDULE OF INVESTMENTS (Continued)
See Notes to Financial Statements.
78
Table of Contents
See Notes to Financial Statements.
79
Table of Contents
MEDIUM-DURATION BOND FUND
SCHEDULE OF INVESTMENTS (Continued)
See Notes to Financial Statements.
80
Table of Contents
See Notes to Financial Statements.
81
Table of Contents
MEDIUM-DURATION BOND FUND
SCHEDULE OF INVESTMENTS (Continued)
See Notes to Financial Statements.
82
Table of Contents
See Notes to Financial Statements.
83
Table of Contents
MEDIUM-DURATION BOND FUND
SCHEDULE OF INVESTMENTS (Continued)
See Notes to Financial Statements.
84
Table of Contents
See Notes to Financial Statements.
85
Table of Contents
MEDIUM-DURATION BOND FUND
SCHEDULE OF INVESTMENTS (Continued)
See Notes to Financial Statements.
86
Table of Contents
See Notes to Financial Statements.
87
Table of Contents
MEDIUM-DURATION BOND FUND
SCHEDULE OF INVESTMENTS (Continued)
See Notes to Financial Statements.
88
Table of Contents
Swap agreements outstanding at June 30, 2014:
| Upfront | ||||||||||||||||||||||||||||||||
| Fixed | Premiums | Unrealized | ||||||||||||||||||||||||||||||
| Deal | Maturity | Notional | Paid/ | Appreciation | ||||||||||||||||||||||||||||
| Reference Obligation |
(Pay) Rate | Date | Counterparty | Currency | Amount | Market Value | (Received) | (Depreciation) | ||||||||||||||||||||||||
| Credit Default Swaps on Corporate Issues — Buy Protection |
| |||||||||||||||||||||||||||||||
| CitiFinancial, |
(0.15 | )% | 06/20/15 | UBS | USD | 300,000 | $ | 146 | $ | — | $ | 146 | ||||||||||||||||||||
| Peoples Republic of China, |
(1.00 | )% | 06/20/19 | CITI | USD | 950,000 | (12,556 | ) | — | (12,556 | ) | |||||||||||||||||||||
| Peoples Republic of China, |
(1.00 | )% | 06/20/19 | CITI | USD | 460,000 | (6,077 | ) | (2,054 | ) | (4,023 | ) | ||||||||||||||||||||
| Peoples Republic of China, |
(1.00 | )% | 06/20/19 | CITI | USD | 430,000 | (6,338 | ) | (2,679 | ) | (3,659 | ) | ||||||||||||||||||||
| Peoples Republic of China, |
(1.00 | )% | 06/20/19 | CITI | USD | 250,000 | (3,304 | ) | (1,655 | ) | (1,649 | ) | ||||||||||||||||||||
| Peoples Republic of China, |
(1.00 | )% | 06/20/19 | CITI | USD | 220,000 | (3,243 | ) | (1,463 | ) | (1,780 | ) | ||||||||||||||||||||
| Peoples Republic of China, |
(1.00 | )% | 06/20/19 | CITI | USD | 210,000 | (2,647 | ) | (1,469 | ) | (1,178 | ) | ||||||||||||||||||||
| Peoples Republic of China, |
(1.00 | )% | 06/20/19 | CITI | USD | 190,000 | (2,799 | ) | (517 | ) | (2,282 | ) | ||||||||||||||||||||
| Peoples Republic of China, |
(1.00 | )% | 06/20/19 | CITI | USD | 190,000 | (2,799 | ) | (657 | ) | (2,142 | ) | ||||||||||||||||||||
| Peoples Republic of China, |
(1.00 | )% | 06/20/19 | CITI | USD | 180,000 | (2,653 | ) | (455 | ) | (2,198 | ) | ||||||||||||||||||||
| Peoples Republic of China, |
(1.00 | )% | 06/20/19 | CITI | USD | 140,000 | (2,063 | ) | (789 | ) | (1,274 | ) | ||||||||||||||||||||
| Peoples Republic of China, |
(1.00 | )% | 06/20/19 | CITI | USD | 130,000 | (1,915 | ) | (228 | ) | (1,687 | ) | ||||||||||||||||||||
| Peoples Republic of China, |
(1.00 | )% | 06/20/19 | CITI | USD | 120,000 | (1,513 | ) | (1,739 | ) | 226 | |||||||||||||||||||||
| Peoples Republic of China, |
(1.00 | )% | 06/20/19 | CITI | USD | 120,000 | (1,585 | ) | (772 | ) | (813 | ) | ||||||||||||||||||||
| Peoples Republic of China, |
(1.00 | )% | 06/20/19 | CITI | USD | 120,000 | (1,585 | ) | (758 | ) | (827 | ) | ||||||||||||||||||||
| Peoples Republic of China, |
(1.00 | )% | 06/20/19 | CITI | USD | 120,000 | (1,586 | ) | (1,542 | ) | (44 | ) | ||||||||||||||||||||
| Peoples Republic of China, |
(1.00 | )% | 06/20/19 | JPM | USD | 120,000 | (1,768 | ) | (407 | ) | (1,361 | ) | ||||||||||||||||||||
| Peoples Republic of China, |
(1.00 | )% | 06/20/19 | CITI | USD | 120,000 | (1,769 | ) | (233 | ) | (1,536 | ) | ||||||||||||||||||||
| Peoples Republic of China, |
(1.00 | )% | 06/20/19 | CITI | USD | 80,000 | (1,057 | ) | (1,217 | ) | 160 | |||||||||||||||||||||
| Peoples Republic of China, |
(1.00 | )% | 06/20/19 | CITI | USD | 80,000 | (1,179 | ) | (332 | ) | (847 | ) | ||||||||||||||||||||
| Peoples Republic of China, |
(1.00 | )% | 06/20/19 | CITI | USD | 60,000 | (793 | ) | (392 | ) | (401 | ) | ||||||||||||||||||||
| Peoples Republic of China, |
(1.00 | )% | 06/20/19 | CITI | USD | 60,000 | (793 | ) | (376 | ) | (417 | ) | ||||||||||||||||||||
| Peoples Republic of China, |
(1.00 | )% | 06/20/19 | JPM | USD | 60,000 | (884 | ) | (233 | ) | (651 | ) | ||||||||||||||||||||
| Peoples Republic of China, |
(1.00 | )% | 06/20/19 | CITI | USD | 50,000 | (661 | ) | (343 | ) | (318 | ) | ||||||||||||||||||||
| Peoples Republic of China, |
(1.00 | )% | 06/20/19 | CITI | USD | 40,000 | (504 | ) | (530 | ) | 26 | |||||||||||||||||||||
| Peoples Republic of China, |
(1.00 | )% | 06/20/19 | BOA | USD | 30,000 | (397 | ) | (179 | ) | (218 | ) | ||||||||||||||||||||
See Notes to Financial Statements.
89
Table of Contents
MEDIUM-DURATION BOND FUND
SCHEDULE OF INVESTMENTS (Continued)
| Upfront | ||||||||||||||||||||||||||||||||
| Fixed | Premiums | Unrealized | ||||||||||||||||||||||||||||||
| Deal | Maturity | Notional | Paid/ | Appreciation | ||||||||||||||||||||||||||||
| Reference Obligation |
(Pay) Rate | Date | Counterparty | Currency | Amount | Market Value | (Received) | (Depreciation) | ||||||||||||||||||||||||
| Peoples Republic of China, |
(1.00 | )% | 06/20/19 | BOA | USD | 20,000 | $ | (264 | ) | $ | (132 | ) | $ | (132 | ) | |||||||||||||||||
| Peoples Republic of China, |
(1.00 | )% | 06/20/19 | CITI | USD | 20,000 | (295 | ) | (39 | ) | (256 | ) | ||||||||||||||||||||
| Peoples Republic of China, |
(1.00 | )% | 06/20/19 | JPM | USD | 10,000 | (132 | ) | (61 | ) | (71 | ) | ||||||||||||||||||||
| Credit Suisse, Inc., |
(1.00 | )% | 09/20/20 | GSC | USD | 300,000 | (5,626 | ) | 4,812 | (10,438 | ) | |||||||||||||||||||||
|
|
|
|
|
|
|
|||||||||||||||||||||||||||
| $ | (68,639 | ) | $ | (16,439 | ) | $ | (52,200 | ) | ||||||||||||||||||||||||
|
|
|
|
|
|
|
|||||||||||||||||||||||||||
| Upfront | ||||||||||||||||||||||||||||||||||||
| Implied | Fixed | Premiums | Unrealized | |||||||||||||||||||||||||||||||||
| Credit | Deal | Maturity | Notional | Paid/ | Appreciation | |||||||||||||||||||||||||||||||
| Reference Obligation |
Spread | (Pay) Rate | Date | Counterparty | Currency | Amount | Market Value | (Received) | (Depreciation) | |||||||||||||||||||||||||||
| Credit Default Swaps on Corporate Issues — Sell Protection |
| |||||||||||||||||||||||||||||||||||
| Federated Republic of Brazil, 12.50% due 03/06/30 |
1.08 | % | (1.04 | )% | 05/20/17 | DEUT | USD | 1,000,000 | $ | 7,197 | $ | — | $ | 7,197 | ||||||||||||||||||||||
| GMAC LLC, 6.88% due 08/28/12 |
0.96 | % | (3.53 | )% | 09/20/17 | DEUT | USD | 4,100,000 | 355,433 | — | 355,433 | |||||||||||||||||||||||||
| Republic of Italy, 6.875% due 09/27/33 |
0.92 | % | 1.00 | % | 06/20/19 | HKSB | USD | 100,000 | 414 | 899 | (485 | ) | ||||||||||||||||||||||||
| Republic of Italy, 6.875% due 09/27/33 |
0.92 | % | 1.00 | % | 09/20/19 | CITI | USD | 5,600,000 | 19,630 | 17,919 | 1,711 | |||||||||||||||||||||||||
|
|
|
|
|
|
|
|||||||||||||||||||||||||||||||
| $ | 382,674 | $ | 18,818 | $ | 363,856 | |||||||||||||||||||||||||||||||
|
|
|
|
|
|
|
|||||||||||||||||||||||||||||||
| Upfront | ||||||||||||||||||||||||||||||||
| Fixed | Premiums | Unrealized | ||||||||||||||||||||||||||||||
| Deal | Maturity | Notional | Paid/ | Appreciation | ||||||||||||||||||||||||||||
| Reference Obligation |
(Pay) Rate | Date | Counterparty | Currency | Amount | Market Value | (Received) | (Depreciation) | ||||||||||||||||||||||||
| Credit Default Swaps on Credit Indices — Buy Protection |
| |||||||||||||||||||||||||||||||
| Dow Jones CDX.NA.HY15 Index |
(5.00 | )% | 12/20/15 | CME | USD | 2,090,000 | $ | (112,978 | ) | $ | 43,106 | $ | (156,084 | ) | ||||||||||||||||||
| Dow Jones CDX.NA.IG21 Index |
(5.00 | )% | 12/20/18 | CME | USD | 1,800,000 | (39,180 | ) | (31,533 | ) | (7,647 | ) | ||||||||||||||||||||
|
|
|
|
|
|
|
|||||||||||||||||||||||||||
| $ | (152,158 | ) | $ | 11,573 | $ | (163,731 | ) | |||||||||||||||||||||||||
|
|
|
|
|
|
|
|||||||||||||||||||||||||||
| Upfront | ||||||||||||||||||||||||||||||||||||
| Implied | Fixed | Premiums | Unrealized | |||||||||||||||||||||||||||||||||
| Credit | Deal | Maturity | Notional | Paid/ | Appreciation | |||||||||||||||||||||||||||||||
| Reference Obligation |
Spread | (Pay) Rate | Date | Counterparty | Currency | Amount | Market Value | (Received) | (Depreciation) | |||||||||||||||||||||||||||
| Credit Default Swaps on Credit Indices — Sell Protection |
| |||||||||||||||||||||||||||||||||||
| Dow Jones CDX.NA.IG16 Index |
0.94 | % | 1.00 | % | 06/20/16 | JPM | USD | 4,825,000 | $ | 78,166 | $ | 7,989 | $ | 70,177 | ||||||||||||||||||||||
| Dow Jones CDX.NA.IG16 Index |
0.97 | % | 1.00 | % | 06/20/16 | BOA | USD | 3,000,000 | 48,600 | 2,690 | 45,910 | |||||||||||||||||||||||||
| Dow Jones CDX.NA.IG16 Index |
0.94 | % | 1.00 | % | 06/20/16 | DEUT | USD | 2,125,000 | 34,425 | 3,440 | 30,985 | |||||||||||||||||||||||||
| Dow Jones iTraxx |
0.70 | % | 1.00 | % | 12/20/18 | CME | EUR | 1,350,000 | 37,253 | 25,758 | 11,495 | |||||||||||||||||||||||||
| Dow Jones CDX.NA.IG22 Index |
0.58 | % | 1.00 | % | 06/20/19 | CME | USD | 5,900,000 | 118,812 | 98,607 | 20,205 | |||||||||||||||||||||||||
|
|
|
|
|
|
|
|||||||||||||||||||||||||||||||
| $ | 317,256 | $ | 138,484 | $ | 178,772 | |||||||||||||||||||||||||||||||
|
|
|
|
|
|
|
|||||||||||||||||||||||||||||||
See Notes to Financial Statements.
90
Table of Contents
| Upfront | ||||||||||||||||||||||||||||||||
| Fixed | Premiums | Unrealized | ||||||||||||||||||||||||||||||
| Deal | Maturity | Notional | Paid/ | Appreciation | ||||||||||||||||||||||||||||
| Reference Obligation |
(Pay) Rate | Date | Counterparty | Currency | Amount | Market Value | (Received) | (Depreciation) | ||||||||||||||||||||||||
| Interest Rate Swaps |
||||||||||||||||||||||||||||||||
| 3-Month LIBOR |
(1.00 | )% | 09/17/16 | CME | USD | 10,100,000 | $ | (64,091 | ) | $ | (49,278 | ) | $ | (14,813 | ) | |||||||||||||||||
| Brazil CETIP Interbank Deposit |
12.40 | % | 01/02/17 | DEUT | BRL | 2,760,000 | 26,013 | — | 26,013 | |||||||||||||||||||||||
| Brazil CETIP Interbank Deposit |
12.65 | % | 01/02/17 | DEUT | BRL | 1,810,000 | 21,042 | — | 21,042 | |||||||||||||||||||||||
| Brazil CETIP Interbank Deposit |
12.27 | % | 01/02/17 | DEUT | BRL | 1,620,000 | 13,351 | — | 13,351 | |||||||||||||||||||||||
| 3-Month KORIBOR |
2.88 | % | 03/07/17 | CITI | KRW | 706,340,000 | 3,837 | — | 3,837 | |||||||||||||||||||||||
| 3-Month KLIBOR |
(3.88 | )% | 11/14/18 | DEUT | MYR | 860,000 | (333 | ) | — | (333 | ) | |||||||||||||||||||||
| 3-Month KLIBOR |
(3.92 | )% | 11/19/18 | CITI | MYR | 960,000 | 283 | — | 283 | |||||||||||||||||||||||
| 3-Month KLIBOR |
(3.97 | )% | 12/11/18 | JPM | MYR | 1,570,000 | (345 | ) | — | (345 | ) | |||||||||||||||||||||
| 3-Month LIBOR |
(2.25 | )% | 09/17/19 | CME | USD | 10,600,000 | (219,368 | ) | (161,336 | ) | (58,032 | ) | ||||||||||||||||||||
| 3-Month LIBOR |
2.56 | % | 10/20/20 | CME | USD | 2,800,000 | 103,054 | 11,262 | 91,792 | |||||||||||||||||||||||
| 3-Month LIBOR |
2.75 | % | 09/17/21 | CME | USD | 4,800,000 | 150,763 | 115,013 | 35,750 | |||||||||||||||||||||||
| 3-Month LIBOR |
2.65 | % | 07/31/23 | CME | USD | 6,200,000 | 144,209 | — | 144,209 | |||||||||||||||||||||||
| 3-Month KORIBOR |
(3.45 | )% | 08/08/23 | CITI | KRW | 1,328,210,000 | (52,234 | ) | — | (52,234 | ) | |||||||||||||||||||||
| 3-Month KORIBOR |
(3.42 | )% | 08/13/23 | JPM | KRW | 391,340,000 | (14,247 | ) | — | (14,247 | ) | |||||||||||||||||||||
| 3-Month KLIBOR |
(4.49 | )% | 08/14/23 | DEUT | MYR | 220,000 | (1,152 | ) | — | (1,152 | ) | |||||||||||||||||||||
| 3-Month KORIBOR |
(3.49 | )% | 08/16/23 | CITI | KRW | 185,320,000 | (7,616 | ) | — | (7,616 | ) | |||||||||||||||||||||
| 3-Month KORIBOR |
(3.56 | )% | 08/19/23 | JPM | KRW | 228,920,000 | (11,030 | ) | 5 | (11,035 | ) | |||||||||||||||||||||
| 3-Month KLIBOR |
(4.33 | )% | 09/26/23 | JPM | MYR | 370,000 | (303 | ) | — | (303 | ) | |||||||||||||||||||||
| 3-Month KLIBOR |
(4.45 | )% | 11/15/23 | CITI | MYR | 600,000 | (3,101 | ) | — | (3,101 | ) | |||||||||||||||||||||
| 6-Month WIBOR |
(4.16 | )% | 11/28/23 | CME | PLN | 970,000 | (21,769 | ) | — | (21,769 | ) | |||||||||||||||||||||
| 3-Month KORIBOR |
(3.47 | )% | 12/23/23 | CME | KRW | 239,520,000 | (9,548 | ) | — | (9,548 | ) | |||||||||||||||||||||
| 3-Month KORIBOR |
(3.47 | )% | 12/23/23 | JPM | KRW | 114,310,000 | (4,603 | ) | — | (4,603 | ) | |||||||||||||||||||||
| 3-Month KORIBOR |
(3.47 | )% | 01/07/24 | JPM | KRW | 275,210,000 | (11,627 | ) | — | (11,627 | ) | |||||||||||||||||||||
| 3-Month KORIBOR |
(3.47 | )% | 01/07/24 | CITI | KRW | 172,160,000 | (8,276 | ) | — | (8,276 | ) | |||||||||||||||||||||
| 3-Month KORIBOR |
(3.47 | )% | 01/08/24 | DEUT | KRW | 137,280,000 | (6,535 | ) | — | (6,535 | ) | |||||||||||||||||||||
| 3-Month KORIBOR |
(3.48 | )% | 01/10/24 | CITI | KRW | 237,220,000 | (10,098 | ) | — | (10,098 | ) | |||||||||||||||||||||
| 3-Month KORIBOR |
(3.45 | )% | 01/13/24 | JPM | KRW | 71,390,000 | (2,852 | ) | — | (2,852 | ) | |||||||||||||||||||||
| 3-Month KORIBOR |
(3.47 | )% | 01/15/24 | JPM | KRW | 86,930,000 | (3,000 | ) | — | (3,000 | ) | |||||||||||||||||||||
| 3-Month KORIBOR |
(3.46 | )% | 01/16/24 | JPM | KRW | 87,250,000 | (3,569 | ) | — | (3,569 | ) | |||||||||||||||||||||
| 3-Month KORIBOR |
(3.45 | )% | 01/16/24 | BOA | KRW | 27,040,000 | (1,080 | ) | — | (1,080 | ) | |||||||||||||||||||||
| 3-Month KORIBOR |
(3.44 | )% | 01/17/24 | JPM | KRW | 119,775,000 | (4,731 | ) | — | (4,731 | ) | |||||||||||||||||||||
| 3-Month KORIBOR |
(3.38 | )% | 01/27/24 | JPM | KRW | 163,080,000 | (5,426 | ) | — | (5,426 | ) | |||||||||||||||||||||
| 3-Month LIBOR |
4.25 | % | 01/30/24 | CME | USD | 8,300,000 | 226,034 | 72,742 | 153,292 | |||||||||||||||||||||||
| 3-Month LIBOR |
4.50 | % | 06/19/24 | CME | USD | 6,500,000 | 223,865 | 53,475 | 170,390 | |||||||||||||||||||||||
| 3-Month LIBOR |
(3.00 | )% | 09/17/24 | CME | GBP | 8,500,000 | (192,939 | ) | (129,541 | ) | (63,398 | ) | ||||||||||||||||||||
| 6-Month EURIBOR |
2.00 | % | 09/17/24 | CME | EUR | 12,400,000 | 827,674 | 503,940 | 323,734 | |||||||||||||||||||||||
| 3-Month LIBOR |
(1.63 | )% | 01/30/39 | CME | USD | 2,800,000 | (5,198 | ) | (1,031 | ) | (4,167 | ) | ||||||||||||||||||||
| 3-Month LIBOR |
(4.37 | )% | 01/30/39 | CME | USD | 2,800,000 | (189,118 | ) | (59,500 | ) | (129,618 | ) | ||||||||||||||||||||
| 3-Month LIBOR |
(3.00 | )% | 12/18/43 | CME | USD | 2,700,000 | 154,669 | 445,086 | (290,417 | ) | ||||||||||||||||||||||
| 6-Month EURIBOR |
(2.75 | )% | 09/17/44 | CME | EUR | 5,000,000 | (857,365 | ) | (604,001 | ) | (253,364 | ) | ||||||||||||||||||||
|
|
|
|
|
|
|
|||||||||||||||||||||||||||
| $ | 183,240 | $ | 196,836 | $ | (13,596 | ) | ||||||||||||||||||||||||||
|
|
|
|
|
|
|
|||||||||||||||||||||||||||
| Upfront | ||||||||||||||||||||||||||||
| Premiums | Unrealized | |||||||||||||||||||||||||||
| Maturity | Notional | Paid/ | Appreciation | |||||||||||||||||||||||||
| Reference Obligation |
Date | Counterparty | Currency | Amount | Market Value | (Received) | (Depreciation) | |||||||||||||||||||||
| Total Return Swap |
||||||||||||||||||||||||||||
| Brazil Nota do Tesouro Nacional |
04/10/15 | DEUT | BRL | 1,173,000 | $ | 1,297,700 | $ | 1,199,187 | $ | 98,513 | ||||||||||||||||||
|
|
|
|
|
|
|
|||||||||||||||||||||||
| Total Swap agreements outstanding at June 30, 2014 |
$ | 1,960,073 | $ | 1,548,459 | $ | 411,614 | ||||||||||||||||||||||
|
|
|
|
|
|
|
|||||||||||||||||||||||
See Notes to Financial Statements.
91
Table of Contents
MEDIUM-DURATION BOND FUND
SCHEDULE OF INVESTMENTS (Continued)
VALUATION HIERARCHY
The following is a summary of the inputs used, as of June 30, 2014, in valuing the Fund’s investments carried at fair value:
| Level 2 | Level 3 | |||||||||||||||
| Total | Level 1 | Other Significant | Significant | |||||||||||||
| Value | Quoted Prices | Observable Inputs | Unobservable Inputs | |||||||||||||
| Assets: |
||||||||||||||||
| Investments in Securities: |
||||||||||||||||
| Agency Obligations |
$ | 34,596,150 | $ | — | $ | 34,596,150 | $ | — | ||||||||
| Asset-Backed Securities |
19,019,170 | — | 17,139,257 | 1,879,913 | ||||||||||||
| Corporate Bonds |
146,184,931 | — | 144,343,390 | 1,841,541 | ||||||||||||
| Foreign Bonds: |
||||||||||||||||
| Australia |
4,464,929 | — | 4,464,929 | — | ||||||||||||
| Austria |
1,709,332 | — | 1,709,332 | — | ||||||||||||
| Bermuda |
745,607 | — | 745,607 | — | ||||||||||||
| Canada |
2,838,556 | — | 2,838,556 | — | ||||||||||||
| Cayman Islands |
4,216,864 | — | 4,216,864 | — | ||||||||||||
| Chile |
603,014 | — | 603,014 | — | ||||||||||||
| Colombia |
1,278,515 | — | 1,278,515 | — | ||||||||||||
| Dominican Republic |
561,544 | — | 561,544 | — | ||||||||||||
| France |
8,059,578 | — | 8,059,578 | — | ||||||||||||
| Germany |
2,507,395 | — | 2,507,395 | — | ||||||||||||
| Honduras |
222,923 | — | 222,923 | — | ||||||||||||
| Iceland |
14 | — | — | 14 | ||||||||||||
| Indonesia |
936,869 | — | 936,869 | — | ||||||||||||
| Israel |
2,320,786 | — | 2,320,786 | — | ||||||||||||
| Italy |
7,438,755 | — | 7,438,755 | — | ||||||||||||
| Japan |
1,520,255 | — | 1,520,255 | — | ||||||||||||
| Jersey |
247,853 | — | 247,853 | — | ||||||||||||
| Jordan |
1,207,500 | — | 1,207,500 | — | ||||||||||||
| Luxembourg |
3,923,725 | — | 3,923,725 | — | ||||||||||||
| Mexico |
21,212,890 | — | 21,212,890 | — | ||||||||||||
| Netherlands |
8,428,446 | — | 8,428,446 | — | ||||||||||||
| New Zealand |
1,425,053 | — | 1,425,053 | — | ||||||||||||
| Norway |
496,973 | — | 496,973 | — | ||||||||||||
| Poland |
1,600,810 | — | 1,600,810 | — | ||||||||||||
| Puerto Rico |
229,500 | — | 229,500 | — | ||||||||||||
| Russia |
873,371 | — | 873,371 | — | ||||||||||||
| Singapore |
316,466 | — | 316,466 | — | ||||||||||||
| Slovenia |
1,665,514 | — | 1,665,514 | — | ||||||||||||
| South Africa |
735,570 | — | 735,570 | — | ||||||||||||
| South Korea |
3,618,226 | — | 3,618,226 | — | ||||||||||||
| Spain |
12,011,987 | — | 12,011,987 | — | ||||||||||||
| Supranational |
387,866 | — | 387,866 | — | ||||||||||||
| Sweden |
1,586,053 | — | 1,586,053 | — | ||||||||||||
| Switzerland |
806,347 | — | 806,347 | — | ||||||||||||
| Turkey |
1,816,793 | — | 1,816,793 | — | ||||||||||||
| United Kingdom |
12,609,062 | — | 12,609,062 | — | ||||||||||||
| Virgin Islands (British) |
7,230,369 | — | 7,230,369 | — | ||||||||||||
| Foreign Government Inflation-Linked Bond |
6,147,720 | — | 6,147,720 | — | ||||||||||||
| Foreign Government Inflation-Linked Note |
969,834 | — | — | 969,834 | ||||||||||||
| Loan Agreement |
3,208,864 | — | 3,208,864 | — | ||||||||||||
| Money Market Funds |
175,839,074 | 175,839,074 | — | — | ||||||||||||
| Mortgage-Backed Securities |
240,625,170 | — | 235,639,277 | 4,985,893 | ||||||||||||
| Municipal Bonds |
7,301,301 | — | 7,301,301 | — | ||||||||||||
| Preferred Stocks |
651,897 | 651,897 | — | — | ||||||||||||
| Purchased Options |
360,886 | 20,463 | 340,423 | — | ||||||||||||
| U.S. Treasury Obligations |
256,416,972 | — | 256,416,972 | — | ||||||||||||
|
|
|
|
|
|
|
|
|
|||||||||
| Total Assets — Investments in Securities |
$ | 1,013,177,279 | $ | 176,511,434 | $ | 826,988,650 | $ | 9,677,195 | ||||||||
|
|
|
|
|
|
|
|
|
|||||||||
| Other Financial Instruments*** |
||||||||||||||||
| Swap Agreements |
$ | 1,960,073 | $ | — | $ | 662,373 | $ | 1,297,700 | ||||||||
|
|
|
|
|
|
|
|
|
|||||||||
| Total Assets — Other Financial Instruments |
$ | 1,960,073 | $ | — | $ | 662,373 | $ | 1,297,700 | ||||||||
|
|
|
|
|
|
|
|
|
|||||||||
See Notes to Financial Statements.
92
Table of Contents
| Level 2 | Level 3 | |||||||||||||||
| Total | Level 1 | Other Significant | Significant | |||||||||||||
| Value | Quoted Prices | Observable Inputs | Unobservable Inputs | |||||||||||||
| Liabilities: |
||||||||||||||||
| Investments in Securities: |
||||||||||||||||
| Security Sold Short |
$ | (9,433,768 | ) | $ | — | $ | (9,433,768 | ) | $ | — | ||||||
| TBA Sale Commitment |
(11,854,691 | ) | — | (11,854,691 | ) | — | ||||||||||
| Written Options |
(561,232 | ) | (99,991 | ) | (461,241 | ) | — | |||||||||
|
|
|
|
|
|
|
|
|
|||||||||
| Total Liabilities — Investments in Securities |
$ | (21,849,691 | ) | $ | (99,991 | ) | $ | (21,749,700 | ) | $ | — | |||||
|
|
|
|
|
|
|
|
|
|||||||||
| Other Financial Instruments*** |
||||||||||||||||
| Forward Foreign Currency Contracts |
$ | (88,722 | ) | $ | 67,760 | $ | (156,482 | ) | $ | — | ||||||
| Futures Contracts |
(361,685 | ) | (262,198 | ) | (99,487 | ) | — | |||||||||
|
|
|
|
|
|
|
|
|
|||||||||
| Total Liabilities — Other Financial Instruments |
$ | (450,407 | ) | $ | (194,438 | ) | $ | (255,969 | ) | $ | — | |||||
|
|
|
|
|
|
|
|
|
|||||||||
| *** | Other financial instruments are derivative instruments not reflected in the Schedule of Investments, such as futures, forwards and swap contracts, which are valued at the unrealized appreciation (depreciation) on the investment. Details of these investments can be found in the Notes to Financial Statements. |
Management has determined that the amount of transfers between Level 1 and Level 2 compared to total net assets of the Funds is not material, therefore, the transfers between Level 1 and Level 2 are not shown for the period ended June 30, 2014.
The unobservable inputs used in the fair value measurement of the reporting entity’s asset-backed securities, corporate bonds, foreign bonds, foreign government inflation-linked note, mortgage-backed securities, preferred stock and swap agreement are values based on evaluated quotations received from dealers who make markets in such securities. Significant increases (decreases) in those evaluated quotations would result in a significantly higher (lower) fair value measurement.
The following is a reconciliation of assets in which significant unobservable inputs (Level 3) were used in determining fair value:
| Foreign | ||||||||||||||||||||||||||||||||||||
| Government | ||||||||||||||||||||||||||||||||||||
| Asset- | Inflation- | Mortgage- | ||||||||||||||||||||||||||||||||||
| Total | Backed | Corporate | Foreign | Linked | Backed | Preferred | Swap | Written | ||||||||||||||||||||||||||||
| Value | Securities | Bonds | Bonds | Note | Securities | Stock | Agreement | Option | ||||||||||||||||||||||||||||
| Balance, 12/31/13 |
$ | 10,579,728 | $ | 1,885,701 | $ | 1,506,297 | $ | 14 | $ | — | $ | 4,716,402 | $ | 2,652,000 | $ | — | $ | (180,686 | ) | |||||||||||||||||
| Accrued discounts/premiums |
(3,226 | ) | 3,332 | (2,190 | ) | — | 67 | (4,435 | ) | — | — | — | ||||||||||||||||||||||||
| Realized gain (loss)(1) |
1,562,626 | 1,013 | (2,295 | ) | — | — | 6,353 | 1,514,543 | — | 43,012 | ||||||||||||||||||||||||||
| Change in unrealized appreciation (depreciation)(2) |
(963,135 | ) | 42,940 | (25,077 | ) | — | 15,749 | (50,467 | ) | (1,231,367 | ) | 98,513 | 186,574 | |||||||||||||||||||||||
| Purchases |
3,384,554 | — | 400,000 | — | 954,018 | 831,349 | — | 1,199,187 | — | |||||||||||||||||||||||||||
| Sales |
(3,239,207 | ) | — | — | — | — | (255,131 | ) | (2,935,176 | ) | — | (48,900 | ) | |||||||||||||||||||||||
| Transfers in to Level 3(3) |
356,015 | — | 31,596 | — | — | 324,419 | — | — | — | |||||||||||||||||||||||||||
| Transfers out of Level 3(4) |
(575,196 | ) | — | — | — | — | (575,196 | ) | — | — | — | |||||||||||||||||||||||||
| Maturities |
— | — | — | — | — | — | — | — | — | |||||||||||||||||||||||||||
| Paydowns |
(127,264 | ) | (53,073 | ) | (66,790 | ) | — | — | (7,401 | ) | — | — | — | |||||||||||||||||||||||
|
|
|
|
|
|
|
|
|
|
|
|
|
|
|
|
|
|
|
|||||||||||||||||||
| Balance, 06/30/14 |
$ | 10,974,895 | $ | 1,879,913 | $ | 1,841,541 | $ | 14 | $ | 969,834 | $ | 4,985,893 | $ | — | $ | 1,297,700 | $ | — | ||||||||||||||||||
|
|
|
|
|
|
|
|
|
|
|
|
|
|
|
|
|
|
|
|||||||||||||||||||
| (1) | Realized gain (loss) from the sale of Level 3 securities can be found on the Statement of Operations in Net realized gain (loss) from: Investment securities. |
| (2) | Change in unrealized appreciation (depreciation) can be found on the Statement of Operations in Net change in unrealized appreciation (depreciation) on: Investment securities and Net change in unrealized appreciation (depreciation) on: Option contracts written. |
| (3) | Transfers in to Level 3 represent the value of securities at June 30, 2014 that were transferred from Level 1 and Level 2 to Level 3 of the fair value hierarchy as a result of the inability of the Fund to obtain a price which was determined using observable inputs. |
| (4) | Transfers out of Level 3 represent the value of securities at June 30, 2014 that were transferred from Level 3 to Level 2 of the fair value hierarchy as a result of the ability of the Fund to obtain a price which was determined using observable inputs. |
See Notes to Financial Statements.
93
Table of Contents
| EXTENDED-DURATION BOND FUND | ||
| SCHEDULE OF INVESTMENTS | June 30, 2014 (Unaudited) |
See Notes to Financial Statements.
94
Table of Contents
See Notes to Financial Statements.
95
Table of Contents
EXTENDED-DURATION BOND FUND
SCHEDULE OF INVESTMENTS (Continued)
See Notes to Financial Statements.
96
Table of Contents
See Notes to Financial Statements.
97
Table of Contents
EXTENDED-DURATION BOND FUND
SCHEDULE OF INVESTMENTS (Continued)
PORTFOLIO SUMMARY(based on net assets)
VALUATION HIERARCHY
The following is a summary of the inputs used, as of June 30, 2014, in valuing the Fund’s investments carried at fair value:
| Level 2 | Level 3 | |||||||||||||||
| Total | Level 1 | Other Significant | Significant | |||||||||||||
| Value | Quoted Prices | Observable Inputs | Unobservable Inputs | |||||||||||||
| Assets: |
||||||||||||||||
| Investments in Securities: |
||||||||||||||||
| Asset-Backed Security |
$ | 2,876,161 | $ | — | $ | 2,876,161 | $ | — | ||||||||
| Corporate Bonds |
133,006,976 | — | 130,829,423 | 2,177,553 | ||||||||||||
| Foreign Bonds |
61,517,101 | — | 61,517,101 | — | ||||||||||||
| Money Market Funds |
39,344,199 | 39,344,199 | — | — | ||||||||||||
| Mortgage-Backed Security |
1,153,768 | — | 1,153,768 | — | ||||||||||||
| Municipal Bonds |
50,708,085 | — | 50,708,085 | — | ||||||||||||
| Preferred Stocks |
543,521 | 461,313 | — | 82,208 | ||||||||||||
| U.S. Treasury Obligations |
29,761,483 | — | 29,761,483 | — | ||||||||||||
|
|
|
|
|
|
|
|
|
|||||||||
| Total Assets — Investments in Securities |
$ | 318,911,294 | $ | 39,805,512 | $ | 276,846,021 | $ | 2,259,761 | ||||||||
|
|
|
|
|
|
|
|
|
|||||||||
There were no transfers between Level 1 and Level 2 during the period ended June 30, 2014.
Management has determined that the amount of Level 3 securities compared to total net assets is not material; therefore, the reconciliation of Level 3 securities and assumptions is not shown for the period ending June 30, 2014.
See Notes to Financial Statements.
98
Table of Contents
| GLOBAL BOND FUND | ||
| SCHEDULE OF INVESTMENTS | June 30, 2014 (Unaudited) |
See Notes to Financial Statements.
99
Table of Contents
GLOBAL BOND FUND
SCHEDULE OF INVESTMENTS (Continued)
See Notes to Financial Statements.
100
Table of Contents
See Notes to Financial Statements.
101
Table of Contents
GLOBAL BOND FUND
SCHEDULE OF INVESTMENTS (Continued)
See Notes to Financial Statements.
102
Table of Contents
See Notes to Financial Statements.
103
Table of Contents
GLOBAL BOND FUND
SCHEDULE OF INVESTMENTS (Continued)
See Notes to Financial Statements.
104
Table of Contents
See Notes to Financial Statements.
105
Table of Contents
GLOBAL BOND FUND
SCHEDULE OF INVESTMENTS (Continued)
See Notes to Financial Statements.
106
Table of Contents
See Notes to Financial Statements.
107
Table of Contents
GLOBAL BOND FUND
SCHEDULE OF INVESTMENTS (Continued)
See Notes to Financial Statements.
108
Table of Contents
See Notes to Financial Statements.
109
Table of Contents
GLOBAL BOND FUND
SCHEDULE OF INVESTMENTS (Continued)
VALUATION HIERARCHY
The following is a summary of the inputs used, as of June 30, 2014, in valuing the Fund’s investments carried at fair value:
| Level 2 | Level 3 | |||||||||||||||
| Total | Level 1 | Other Significant | Significant | |||||||||||||
| Value | Quoted Prices | Observable Inputs | Unobservable Inputs | |||||||||||||
| Assets: |
||||||||||||||||
| Investments in Securities: |
||||||||||||||||
| Common Stocks |
$ | 3,523,699 | $ | 3,523,699 | $ | — | $ | — | ||||||||
| Corporate Bonds |
135,334,268 | — | 130,967,541 | 4,366,727 | ||||||||||||
| Foreign Bonds: |
||||||||||||||||
| Argentina |
228,935 | — | 228,935 | — | ||||||||||||
| Australia |
3,618,194 | — | 3,618,194 | — | ||||||||||||
| Bermuda |
2,203,395 | — | 2,203,395 | — | ||||||||||||
| Brazil |
10,345,262 | — | 8,659,111 | 1,686,151 | ||||||||||||
| Canada |
23,409,642 | — | 23,403,042 | 6,600 | ||||||||||||
| Cayman Islands |
6,842,816 | — | 6,842,816 | — | ||||||||||||
| Chile |
2,015,148 | — | 2,015,148 | — | ||||||||||||
| Colombia |
2,801,510 | — | 2,801,510 | — | ||||||||||||
| Croatia (Hrvatska) |
521,875 | — | 521,875 | — | ||||||||||||
| France |
2,774,674 | — | 2,774,674 | — | ||||||||||||
| Germany |
17,425,782 | — | 17,425,782 | — | ||||||||||||
| Hungary |
2,939,305 | — | 2,939,305 | — | ||||||||||||
| Iceland |
2 | — | — | 2 | ||||||||||||
| Indonesia |
2,742,638 | — | 2,742,638 | — | ||||||||||||
| Ireland |
3,008,516 | — | 3,008,516 | — | ||||||||||||
| Isle of Man (U.K.) |
303,412 | — | 303,412 | — | ||||||||||||
| Italy |
9,438,747 | — | 9,438,747 | — | ||||||||||||
| Jersey |
193,729 | — | 193,729 | — | ||||||||||||
| Luxembourg |
11,394,591 | — | 11,394,591 | — | ||||||||||||
| Marshall Islands |
94,500 | — | 94,500 | — | ||||||||||||
| Mexico |
16,396,533 | — | 16,396,533 | — | ||||||||||||
| Morroco And Antilles |
578,188 | — | 578,188 | — | ||||||||||||
| Netherlands |
7,171,541 | — | 7,171,541 | — | ||||||||||||
| New Zealand |
1,237,182 | — | 1,237,182 | — | ||||||||||||
| Norway |
2,442,477 | — | 2,442,477 | — | ||||||||||||
| Panama |
3,716 | — | 3,716 | — | ||||||||||||
| Peru |
521,125 | — | 521,125 | — | ||||||||||||
| Philippines |
212,750 | — | 212,750 | — | ||||||||||||
| Poland |
5,564,628 | — | 5,564,628 | — | ||||||||||||
| Russia |
2,353,770 | — | 2,353,770 | — | ||||||||||||
| South Africa |
4,342,860 | — | 4,342,860 | — | ||||||||||||
| Spain |
530,841 | — | 530,841 | — | ||||||||||||
| Supranational |
2,971,822 | — | 2,971,822 | — | ||||||||||||
| Sweden |
436,270 | — | 436,270 | — | ||||||||||||
| Trinidad and Tobago |
430,100 | — | 430,100 | — | ||||||||||||
| Turkey |
5,231,824 | — | 5,231,824 | — | ||||||||||||
| United Arab Emirates |
1,680,000 | — | 1,680,000 | — | ||||||||||||
| United Kingdom |
13,828,662 | — | 13,828,662 | — | ||||||||||||
| Venezuela |
3,131,846 | — | 3,131,846 | — | ||||||||||||
| Virgin Islands (British) |
1,276,336 | — | 1,276,336 | — | ||||||||||||
| Foreign Common Stocks |
1,634,677 | 1,330,549 | — | 304,128 | ||||||||||||
| Money Market Funds |
99,923,883 | 99,923,883 | — | — | ||||||||||||
| Mortgage-Backed Security |
242,130 | — | 242,130 | — | ||||||||||||
| Municipal Bond |
437,488 | — | 437,488 | — | ||||||||||||
| Preferred Stocks |
2,456,826 | 2,055,814 | — | 401,012 | ||||||||||||
| U.S. Treasury Obligations |
44,588,125 | — | 44,588,125 | — | ||||||||||||
|
|
|
|
|
|
|
|
|
|||||||||
| Total Assets — Investments in Securities |
$ | 460,786,240 | $ | 106,833,945 | $ | 347,187,675 | $ | 6,764,620 | ||||||||
|
|
|
|
|
|
|
|
|
|||||||||
See Notes to Financial Statements.
110
Table of Contents
| Level 2 | Level 3 | |||||||||||||||
| Total | Level 1 | Other Significant | Significant | |||||||||||||
| Value | Quoted Prices | Observable Inputs | Unobservable Inputs | |||||||||||||
| Liabilities: |
||||||||||||||||
| Other Financial Instruments*** |
||||||||||||||||
| Forward Foreign Currency Contracts |
$ | (33,561 | ) | $ | — | $ | (33,561 | ) | $ | — | ||||||
| Futures Contracts |
(105,403 | ) | (105,403 | ) | — | — | ||||||||||
|
|
|
|
|
|
|
|
|
|||||||||
| Total Liabilities — Other Financial Instruments |
$ | (138,964 | ) | $ | (105,403 | ) | $ | (33,561 | ) | $ | — | |||||
|
|
|
|
|
|
|
|
|
|||||||||
| *** | Other financial instruments are derivative instruments not reflected in the Schedule of Investments, such as futures, forwards and swap contracts, which are valued at the unrealized appreciation (depreciation) on the investment. Details of these investments can be found in the Notes to Financial Statements. |
There were no transfers between Level 1 and Level 2 during the period ended June 30, 2014.
The unobservable inputs used in the fair value measurement of the reporting entity’s common stock, corporate bonds, foreign bonds, foreign common stock and preferred stock are values based on evaluated quotations received from dealers who make markets in such securities. Significant increases (decreases) in those evaluated quotations would result in a significantly higher (lower) fair value measurement.
The following is a reconciliation of assets in which significant unobservable inputs (Level 3) were used in determining fair value:
| Foreign | ||||||||||||||||||||||||
| Total | Common | Corporate | Foreign | Common | Preferred | |||||||||||||||||||
| Value | Stocks | Bonds | Bonds | Stock | Stock | |||||||||||||||||||
| Balance, 12/31/13 |
$ | 5,009,071 | $ | 2,462 | $ | 4,325,984 | $ | 6,602 | $ | 291,986 | $ | 382,037 | ||||||||||||
| Accrued discounts/premiums |
3,229 | — | 3,070 | 159 | — | — | ||||||||||||||||||
| Realized gain (loss)(1) |
(7,238 | ) | 624 | (7,862 | ) | — | — | — | ||||||||||||||||
| Change in unrealized appreciation (depreciation)(2) |
163,354 | (358 | ) | 68,299 | 36,296 | 12,142 | 46,975 | |||||||||||||||||
| Purchases |
1,871,696 | — | 250,000 | 1,649,696 | — | (28,000 | ) | |||||||||||||||||
| Sales |
(102,203 | ) | (2,728 | ) | (99,475 | ) | — | — | — | |||||||||||||||
| Transfers in to Level 3 |
— | — | — | — | — | — | ||||||||||||||||||
| Transfers out of Level 3 |
— | — | — | — | — | — | ||||||||||||||||||
| Maturities |
— | — | — | — | — | — | ||||||||||||||||||
| Paydowns |
(173,289 | ) | — | (173,289 | ) | — | — | — | ||||||||||||||||
|
|
|
|
|
|
|
|
|
|
|
|
|
|||||||||||||
| Balance, 06/30/14 |
$ | 6,764,620 | $ | — | $ | 4,366,727 | $ | 1,692,753 | $ | 304,128 | $ | 401,012 | ||||||||||||
|
|
|
|
|
|
|
|
|
|
|
|
|
|||||||||||||
| (1) | Realized gain (loss) from the sale of Level 3 securities can be found on the Statement of Operations in Net realized gain (loss) from: Investment securities. |
| (2) | Change in unrealized appreciation (depreciation) can be found on the Statement of Operations in Net change in unrealized appreciation (depreciation) on: Investment securities. |
See Notes to Financial Statements.
111
Table of Contents
| STATEMENTS OF ASSETS AND LIABILITIES | June 30, 2014 (Unaudited) |
| Money Market Fund |
Low-Duration Bond Fund |
|||||||||
| Assets |
||||||||||
| Investments in securities of unaffiliated issuers, at value |
$ | 1,292,374,290 | $ | 1,005,505,620 | ||||||
| Investments in repurchase agreements, at value |
32,581,000 | — | ||||||||
| Investments in securities of affiliated issuers, at value |
— | 38,729,132 | ||||||||
|
|
|
|
|
|||||||
| Total investments(1)(2) |
1,324,955,290 | 1,044,234,752 | ||||||||
| Cash |
390 | 118,887 | ||||||||
| Cash collateral for derivatives |
— | 742,012 | ||||||||
| Foreign currency(3) |
— | 2,143,541 | ||||||||
| Swap premiums paid |
— | 916,956 | ||||||||
| Receivables: |
||||||||||
| Dividends and reclaims |
— | 323 | ||||||||
| Interest |
234,899 | 3,367,673 | ||||||||
| Securities lending |
— | 11,749 | ||||||||
| Investment securities sold |
— | 3,391,026 | ||||||||
| Maturities |
— | 71,979 | ||||||||
| Fund shares sold |
9,130,790 | 130,854 | ||||||||
| Variation margin on exchange traded swaps |
— | 502,004 | ||||||||
| Variation margin on financial futures contracts |
— | 37,533 | ||||||||
| Unrealized appreciation on foreign currency exchange contracts |
— | 590,242 | ||||||||
| Unrealized appreciation on swap agreements |
— | 426,777 | ||||||||
| Prepaid expenses and other assets |
39,490 | 18,991 | ||||||||
|
|
|
|
|
|||||||
| Total Assets |
1,334,360,859 | 1,056,705,299 | ||||||||
|
|
|
|
|
|||||||
| Liabilities |
||||||||||
| Securities sold short, at value(4) |
— | 3,116,467 | ||||||||
| TBA sale commitments, at value(5) |
— | 2,422,638 | ||||||||
| Options written at value(6) |
— | 558 | ||||||||
| Swap premiums received |
— | 386,821 | ||||||||
| Unrealized depreciation on foreign currency exchange contracts |
— | 971,466 | ||||||||
| Unrealized depreciation on swap agreements |
— | 1,051,175 | ||||||||
| Collateral held for securities on loan at value |
— | 102,504,619 | ||||||||
| Collateral held for derivatives |
— | 460,000 | ||||||||
| Payables: |
||||||||||
| Investment securities purchased |
— | 77,374,451 | ||||||||
| Fund shares redeemed |
9,091,586 | 56,313 | ||||||||
| Variation margin on financial futures contracts |
— | 73,476 | ||||||||
| Distributions |
6,517 | — | ||||||||
| Securities lending |
— | 2,586 | ||||||||
| Accrued expenses: |
||||||||||
| Investment advisory fees |
158,163 | 174,863 | ||||||||
| Shareholder servicing fees |
2,565 | 142,856 | ||||||||
| Other expenses |
67,134 | 117,741 | ||||||||
|
|
|
|
|
|||||||
| Total Liabilities |
9,325,965 | 188,856,030 | ||||||||
|
|
|
|
|
|||||||
| Net Assets |
$ | 1,325,034,894 | $ | 867,849,269 | ||||||
|
|
|
|
|
|||||||
| Net Assets Consist of: |
||||||||||
| Paid-in-capital |
$ | 1,324,983,594 | $ | 868,312,880 | ||||||
| Accumulated (distributions in excess of) net investment income |
— | 31,010 | ||||||||
| Undistributed (accumulated) net realized gain (loss) on investments, foreign currency translations and derivative transactions |
51,300 | (2,166,575 | ) | |||||||
| Net unrealized appreciation (depreciation) on investments, foreign currency translations and derivative transactions |
— | 1,671,954 | ||||||||
|
|
|
|
|
|||||||
| Net Assets |
$ | 1,325,034,894 | $ | 867,849,269 | ||||||
|
|
|
|
|
|||||||
| Net Asset Value: |
||||||||||
| $0.001 par value, unlimited shares authorized |
||||||||||
| Net assets applicable to the Institutional Class |
$ | 140,308,983 | $ | 142,424,858 | ||||||
|
|
|
|
|
|||||||
| Institutional shares outstanding |
140,299,994 | 16,639,015 | ||||||||
|
|
|
|
|
|||||||
| Net asset value, offering and redemption price per Institutional share |
$ | 1.00 | $ | 8.56 | ||||||
|
|
|
|
|
|||||||
| Net assets applicable to the Investor Class |
$ | 1,184,725,911 | $ | 725,424,411 | ||||||
|
|
|
|
|
|||||||
| Investor shares outstanding |
1,184,648,953 | 54,049,968 | ||||||||
|
|
|
|
|
|||||||
| Net asset value, offering and redemption price per Investor share |
$ | 1.00 | $ | 13.42 | ||||||
|
|
|
|
|
|||||||
|
|
||||||||||
|
(1) |
Investments in securities of unaffiliated issuers, at cost |
$ | 1,292,374,290 | $ | 1,002,960,412 | |||||
| Investments in repurchase agreements, at cost |
32,581,000 | — | ||||||||
| Investments in securities of affiliated issuers, at cost |
— | 38,729,132 | ||||||||
|
|
|
|
|
|||||||
| Total investments at cost |
$ | 1,324,955,290 | $ | 1,041,689,544 | ||||||
|
|
|
|
|
|||||||
| (2) |
Includes securities loaned of: |
$ | — | $ | 100,892,424 | |||||
|
|
|
|
|
|||||||
| (3) |
Foreign currency at cost |
$ | — | $ | 2,169,847 | |||||
|
|
|
|
|
|||||||
| (4) |
Proceeds from securities sold short |
$ | — | $ | 3,093,622 | |||||
|
|
|
|
|
|||||||
| (5) |
TBA sale commitments at cost |
$ | — | $ | 2,412,577 | |||||
|
|
|
|
|
|||||||
| (6) |
Premiums received on options written |
$ | — | $ | 15,050 | |||||
|
|
|
|
|
|||||||
See Notes to Financial Statements.
112
Table of Contents
| Medium-Duration Bond Fund |
Extended-Duration Bond Fund |
Global Bond Fund |
||||||||||
| $ | 913,957,316 | $ | 310,831,660 | $ | 436,928,841 | |||||||
| — | — | — | ||||||||||
| 99,219,963 | 8,079,634 | 23,857,399 | ||||||||||
|
|
|
|
|
|
|
|||||||
| 1,013,177,279 | 318,911,294 | 460,786,240 | ||||||||||
| 329,186 | 12,470 | 7,341 | ||||||||||
| 1,875,116 | — | 480,003 | ||||||||||
| 1,204,290 | — | 1,767,554 | ||||||||||
| 2,605,930 | — | — | ||||||||||
| 713 | 102 | 27,434 | ||||||||||
| 4,573,729 | 3,228,134 | 4,752,449 | ||||||||||
| 10,284 | 1,931 | 10,269 | ||||||||||
| 53,297,087 | 3,308,053 | 29,488 | ||||||||||
| 428 | — | — | ||||||||||
| 106,648 | 6,050 | 73,798 | ||||||||||
| 48,975 | — | — | ||||||||||
| 26,588 | — | — | ||||||||||
| 518,976 | — | 383,611 | ||||||||||
| 1,625,877 | — | — | ||||||||||
| 19,792 | 15,977 | 10,790 | ||||||||||
|
|
|
|
|
|
|
|||||||
| 1,079,420,898 | 325,484,011 | 468,328,977 | ||||||||||
|
|
|
|
|
|
|
|||||||
| 9,433,768 | — | — | ||||||||||
| 11,854,691 | — | — | ||||||||||
| 561,232 | — | — | ||||||||||
| 1,057,471 | — | — | ||||||||||
| 607,698 | — | 417,172 | ||||||||||
| 1,214,263 | — | — | ||||||||||
| 76,619,111 | 31,264,565 | 76,066,484 | ||||||||||
| 1,090,560 | — | — | ||||||||||
| 115,401,430 | 2,919,385 | 1,318,649 | ||||||||||
| 39,816 | 152,558 | 113,527 | ||||||||||
| 10,816 | — | 9,339 | ||||||||||
| — | — | — | ||||||||||
| 2,263 | 424 | 2,259 | ||||||||||
| 213,490 | 101,335 | 140,465 | ||||||||||
| 119,096 | 46,863 | 76,213 | ||||||||||
| 165,708 | 47,013 | 65,698 | ||||||||||
|
|
|
|
|
|
|
|||||||
| 218,391,413 | 34,532,143 | 78,209,806 | ||||||||||
|
|
|
|
|
|
|
|||||||
| $ | 861,029,485 | $ | 290,951,868 | $ | 390,119,171 | |||||||
|
|
|
|
|
|
|
|||||||
| $ | 846,676,713 | $ | 252,598,109 | $ | 371,677,752 | |||||||
| 357,823 | 349,700 | (258,672 | ) | |||||||||
| (4,158,283 | ) | 2,753,228 | (8,454,063 | ) | ||||||||
| 18,153,232 | 35,250,831 | 27,154,154 | ||||||||||
|
|
|
|
|
|
|
|||||||
| $ | 861,029,485 | $ | 290,951,868 | $ | 390,119,171 | |||||||
|
|
|
|
|
|
|
|||||||
| $ | 253,189,940 | $ | 52,096,250 | N/A | ||||||||
|
|
|
|
|
|
|
|||||||
| 35,861,171 | 10,254,140 | N/A | ||||||||||
|
|
|
|
|
|
|
|||||||
| $ | 7.06 | $ | 5.08 | N/A | ||||||||
|
|
|
|
|
|
|
|||||||
| $ | 607,839,545 | $ | 238,855,618 | $ | 390,119,171 | |||||||
|
|
|
|
|
|
|
|||||||
| 41,658,096 | 13,193,539 | 37,023,572 | ||||||||||
|
|
|
|
|
|
|
|||||||
| $ | 14.59 | $ | 18.10 | $ | 10.54 | |||||||
|
|
|
|
|
|
|
|||||||
| $ | 896,123,823 | $ | 275,583,650 | $ | 409,649,749 | |||||||
| — | — | — | ||||||||||
| 99,219,963 | 8,079,634 | 23,857,399 | ||||||||||
|
|
|
|
|
|
|
|||||||
| $ | 995,343,786 | $ | 283,663,284 | $ | 433,507,148 | |||||||
|
|
|
|
|
|
|
|||||||
| $ | 75,788,322 | $ | 42,144,515 | $ | 74,567,749 | |||||||
|
|
|
|
|
|
|
|||||||
| $ | 1,197,957 | $ | — | $ | 1,767,038 | |||||||
|
|
|
|
|
|
|
|||||||
| $ | 9,394,445 | $ | — | $ | — | |||||||
|
|
|
|
|
|
|
|||||||
| $ | 11,719,062 | $ | — | $ | — | |||||||
|
|
|
|
|
|
|
|||||||
| $ | 1,086,496 | $ | — | $ | — | |||||||
|
|
|
|
|
|
|
|||||||
See Notes to Financial Statements.
113
Table of Contents
| STATEMENTS OF OPERATIONS | For the Six Months Ended June 30, 2014 (Unaudited) |
| Money Market Fund |
Low-Duration Bond Fund |
|||||||
| Investment Income |
||||||||
| Dividends |
$ | — | $ | — | ||||
| Income distributions received from affiliated funds |
— | 2,161 | ||||||
| Interest |
1,295,120 | 6,584,512 | ||||||
| Securities lending |
179 | 75,924 | ||||||
| Less foreign taxes withheld |
— | — | ||||||
|
|
|
|
|
|||||
| Total Investment Income |
1,295,299 | 6,662,597 | ||||||
|
|
|
|
|
|||||
| Expenses |
||||||||
| Investment advisory fees |
1,044,793 | 1,411,403 | ||||||
| Transfer agent fees: |
||||||||
| Institutional shares |
1,958 | 1,957 | ||||||
| Investor shares |
18,459 | 12,844 | ||||||
| Custodian fees |
15,966 | 60,879 | ||||||
| Shareholder servicing fees: |
||||||||
| Investor shares |
1,470,814 | 850,962 | ||||||
| Accounting and administration fees |
141,356 | 166,301 | ||||||
| Professional fees |
25,985 | 46,711 | ||||||
| Blue sky fees: |
||||||||
| Institutional shares |
904 | 900 | ||||||
| Investor shares |
18,722 | 11,451 | ||||||
| Shareholder reporting fees: |
||||||||
| Institutional shares |
412 | 358 | ||||||
| Investor shares |
17,429 | 7,360 | ||||||
| Trustee expenses |
6,537 | 4,110 | ||||||
| Line of credit facility fees |
4,928 | 3,199 | ||||||
| Other expenses |
18,965 | 30,996 | ||||||
|
|
|
|
|
|||||
| Total expenses |
2,787,228 | 2,609,431 | ||||||
| Expenses waived/reimbursed net of amount recaptured(1) |
(1,527,466 | ) | (342,756 | ) | ||||
|
|
|
|
|
|||||
| Net expenses |
1,259,762 | 2,266,675 | ||||||
|
|
|
|
|
|||||
| Net Investment Income |
35,537 | 4,395,922 | ||||||
|
|
|
|
|
|||||
| Realized and Unrealized Gain (Loss) |
||||||||
| Net realized gain (loss) from: |
||||||||
| Investment securities |
40,083 | 905,697 | ||||||
| Investment securities sold short |
— | (442,794 | ) | |||||
| Futures transactions |
— | (736,019 | ) | |||||
| Swap agreements |
— | (1,070,185 | ) | |||||
| Option contracts written |
— | 386,289 | ||||||
| Option contracts purchased |
— | 19,531 | ||||||
| Foreign currency transactions |
— | (377,692 | ) | |||||
|
|
|
|
|
|||||
| Net realized gain (loss) |
40,083 | (1,315,173 | ) | |||||
|
|
|
|
|
|||||
| Net change in unrealized appreciation (depreciation) on: |
||||||||
| Investment securities |
— | 5,416,376 | ||||||
| Investment securities sold short |
— | (7,951 | ) | |||||
| Futures |
— | (213,047 | ) | |||||
| Swap agreements |
— | 331,301 | ||||||
| Option contracts written |
— | 272,340 | ||||||
| Option contracts purchased |
— | (155,525 | ) | |||||
| Foreign currency translation |
— | (537,185 | ) | |||||
|
|
|
|
|
|||||
| Net change in unrealized appreciation (depreciation) |
— | 5,106,309 | ||||||
|
|
|
|
|
|||||
| Net Realized and Unrealized Gain |
40,083 | 3,791,136 | ||||||
|
|
|
|
|
|||||
| Net Increase in Net Assets Resulting from Operations |
$ | 75,620 | $ | 8,187,058 | ||||
|
|
|
|
|
|||||
| (1) | See Note 3a and 3c in Notes to Financial Statements. |
See Notes to Financial Statements.
114
Table of Contents
| Medium-Duration Bond Fund |
Extended-Duration Bond Fund |
Global Bond Fund |
||||||||||
| $ | 114,251 | $ | 7,333 | $ | 136,114 | |||||||
| 3,486 | 578 | 2,040 | ||||||||||
| 11,870,770 | 6,955,846 | 8,282,361 | ||||||||||
| 106,747 | 39,715 | 73,291 | ||||||||||
| — | — | (8,826 | ) | |||||||||
|
|
|
|
|
|
|
|||||||
| 12,095,254 | 7,003,472 | 8,484,980 | ||||||||||
|
|
|
|
|
|
|
|||||||
| 1,725,961 | 691,165 | 853,221 | ||||||||||
| 1,954 | 1,885 | — | ||||||||||
| 13,062 | 12,606 | 9,744 | ||||||||||
| 93,879 | 11,862 | 31,643 | ||||||||||
| 710,444 | 275,623 | 443,978 | ||||||||||
| 196,101 | 48,780 | 88,437 | ||||||||||
| 46,711 | 35,328 | 36,794 | ||||||||||
| 900 | 900 | — | ||||||||||
| 10,627 | 10,611 | 9,476 | ||||||||||
| 360 | 215 | — | ||||||||||
| 7,278 | 6,945 | 2,528 | ||||||||||
| 3,970 | 1,342 | 1,763 | ||||||||||
| 3,042 | 1,003 | 1,310 | ||||||||||
| 42,670 | 8,999 | 15,266 | ||||||||||
|
|
|
|
|
|
|
|||||||
| 2,856,959 | 1,107,264 | 1,494,160 | ||||||||||
| (437,249 | ) | (93,594 | ) | (49,043 | ) | |||||||
|
|
|
|
|
|
|
|||||||
| 2,419,710 | 1,013,670 | 1,445,117 | ||||||||||
|
|
|
|
|
|
|
|||||||
| 9,675,544 | 5,989,802 | 7,039,863 | ||||||||||
|
|
|
|
|
|
|
|||||||
| 7,913,274 | 2,524,234 | 1,041,646 | ||||||||||
| (185,382 | ) | — | (1,984 | ) | ||||||||
| 661,320 | — | 80,428 | ||||||||||
| (783,818 | ) | — | — | |||||||||
| 528,754 | — | — | ||||||||||
| (174,983 | ) | — | (197,327 | ) | ||||||||
| (291,790 | ) | 379,767 | (1,055,119 | ) | ||||||||
|
|
|
|
|
|
|
|||||||
| 7,667,375 | 2,904,001 | (132,356 | ) | |||||||||
|
|
|
|
|
|
|
|||||||
| 16,108,507 | 23,379,291 | 15,483,668 | ||||||||||
| (235,133 | ) | — | — | |||||||||
| (193,386 | ) | — | (114,552 | ) | ||||||||
| 378,307 | — | — | ||||||||||
| 830,882 | — | — | ||||||||||
| (474,760 | ) | — | 66,172 | |||||||||
| (93,448 | ) | 4,212 | 196,569 | |||||||||
|
|
|
|
|
|
|
|||||||
| 16,320,969 | 23,383,503 | 15,631,857 | ||||||||||
|
|
|
|
|
|
|
|||||||
| 23,988,344 | 26,287,504 | 15,499,501 | ||||||||||
|
|
|
|
|
|
|
|||||||
| $ | 33,663,888 | $ | 32,277,306 | $ | 22,539,364 | |||||||
|
|
|
|
|
|
|
|||||||
See Notes to Financial Statements.
115
Table of Contents
STATEMENTS OF CHANGES IN NET ASSETS
| Money Market Fund | ||||||||
| For the Six Months Ended 06/30/14 |
For the Year Ended 12/31/13 |
|||||||
| (Unaudited) | ||||||||
| Operations: |
||||||||
| Net investment income |
$ | 35,537 | $ | 199,522 | ||||
| Net realized gain (loss) on investment securities, foreign currency transactions and derivative transactions |
40,083 | 64,118 | ||||||
| Net change in unrealized appreciation (depreciation) on investment securities, foreign currency translations and derivative transactions |
— | — | ||||||
|
|
|
|
|
|||||
| Net increase (decrease) in net assets resulting from operations |
75,620 | 263,640 | ||||||
|
|
|
|
|
|||||
| Dividends and Distributions to Shareholders: |
||||||||
| Dividends from net investment income |
||||||||
| Institutional shares |
(10,869 | ) | (39,682 | ) | ||||
| Investor shares |
(61,281 | ) | (123,227 | ) | ||||
| Distributions from net realized capital gains |
||||||||
| Institutional shares |
— | (5,110 | ) | |||||
| Investor shares |
— | (60,366 | ) | |||||
|
|
|
|
|
|||||
| Total dividends and distributions |
(72,150 | ) | (228,385 | ) | ||||
|
|
|
|
|
|||||
| Capital Share Transactions: |
||||||||
| Proceeds from shares sold |
||||||||
| Institutional shares |
104,647,163 | 105,460,546 | ||||||
| Investor shares |
1,804,874,091 | 4,335,936,657 | ||||||
| Reinvestment of dividends and distributions |
||||||||
| Institutional shares |
9,355 | 38,908 | ||||||
| Investor shares |
21,436 | 105,203 | ||||||
|
|
|
|
|
|||||
| Total proceeds from shares sold and reinvested |
1,909,552,045 | 4,441,541,314 | ||||||
|
|
|
|
|
|||||
| Value of shares redeemed |
||||||||
| Institutional shares |
(70,407,810 | ) | (106,106,557 | ) | ||||
| Investor shares |
(1,883,110,800 | ) | (4,204,891,545 | ) | ||||
|
|
|
|
|
|||||
| Total value of shares redeemed |
(1,953,518,610 | ) | (4,310,998,102 | ) | ||||
|
|
|
|
|
|||||
| Net increase (decrease) from capital share transactions(1) |
(43,966,565 | ) | 130,543,212 | |||||
|
|
|
|
|
|||||
| Total increase (decrease) in net assets |
(43,963,095 | ) | 130,578,467 | |||||
|
|
|
|
|
|||||
| Net Assets: |
||||||||
| Beginning of Period |
1,368,997,989 | 1,238,419,522 | ||||||
|
|
|
|
|
|||||
| End of Period* |
$ | 1,325,034,894 | $ | 1,368,997,989 | ||||
|
|
|
|
|
|||||
| *Including undistributed (distributions in excess of) net investment income |
$ | — | $ | 36,613 | ||||
|
|
|
|
|
|||||
| (1) | See Note 6 in Notes to Financial Statements. |
See Notes to Financial Statements.
116
Table of Contents
| Low-Duration Bond Fund | Medium-Duration Bond Fund | |||||||||||||||
| For the Six Months Ended 06/30/14 |
For the Year Ended 12/31/13 |
For the Six Months Ended 06/30/14 |
For the Year Ended 12/31/13 |
|||||||||||||
| (Unaudited) | (Unaudited) | |||||||||||||||
| $ | 4,395,922 | $ | 8,948,237 | $ | 9,675,544 | $ | 17,749,366 | |||||||||
| (1,315,173 | ) | (199,750 | ) |
|
7,667,375 |
|
(9,532,523 | ) | ||||||||
|
|
5,106,309 |
|
(9,738,040 | ) | 16,320,969 | (25,840,900 | ) | |||||||||
|
|
|
|
|
|
|
|
|
|||||||||
| 8,187,058 | (989,553 | ) | 33,663,888 | (17,624,057 | ) | |||||||||||
|
|
|
|
|
|
|
|
|
|||||||||
| (1,030,353 | ) | (2,638,146 | ) | (4,578,785 | ) | (8,960,565 | ) | |||||||||
| (2,714,620 | ) | (6,980,736 | ) | (5,280,281 | ) | (10,135,398 | ) | |||||||||
| (106,639 | ) | (130,184 | ) | — | (238,953 | ) | ||||||||||
| (357,017 | ) | (404,740 | ) | — | (290,430 | ) | ||||||||||
|
|
|
|
|
|
|
|
|
|||||||||
| (4,208,629 | ) | (10,153,806 | ) | (9,859,066 | ) | (19,625,346 | ) | |||||||||
|
|
|
|
|
|
|
|
|
|||||||||
| 11,361,777 | 20,817,542 | 26,945,126 | 26,720,145 | |||||||||||||
| 34,860,873 | 96,538,640 | 24,731,348 | 73,101,056 | |||||||||||||
| 1,135,175 | 2,761,563 | 4,573,028 | 9,193,242 | |||||||||||||
| 3,071,440 | 7,383,801 | 5,279,340 | 10,422,967 | |||||||||||||
|
|
|
|
|
|
|
|
|
|||||||||
| 50,429,265 | 127,501,546 | 61,528,842 | 119,437,410 | |||||||||||||
|
|
|
|
|
|
|
|
|
|||||||||
| (7,342,806 | ) | (19,428,445 | ) | (10,498,099 | ) | (46,258,722 | ) | |||||||||
| (17,479,860 | ) | (72,290,918 | ) | (23,429,068 | ) | (98,816,806 | ) | |||||||||
|
|
|
|
|
|
|
|
|
|||||||||
| (24,822,666 | ) | (91,719,363 | ) | (33,927,167 | ) | (145,075,528 | ) | |||||||||
|
|
|
|
|
|
|
|
|
|||||||||
| 25,606,599 | 35,782,183 | 27,601,675 | (25,638,118 | ) | ||||||||||||
|
|
|
|
|
|
|
|
|
|||||||||
| 29,585,028 | 24,638,824 | 51,406,497 | (62,887,521 | ) | ||||||||||||
|
|
|
|
|
|
|
|
|
|||||||||
| 838,264,241 | 813,625,417 | 809,622,988 | 872,510,509 | |||||||||||||
|
|
|
|
|
|
|
|
|
|||||||||
| $ | 867,849,269 | $ | 838,264,241 | $ | 861,029,485 | $ | 809,622,988 | |||||||||
|
|
|
|
|
|
|
|
|
|||||||||
| $ | 31,010 | $ | (619,939 | ) | $ | 357,823 | $ | 541,345 | ||||||||
|
|
|
|
|
|
|
|
|
|||||||||
See Notes to Financial Statements.
117
Table of Contents
STATEMENTS OF CHANGES IN NET ASSETS
| Extended-Duration Bond Fund | ||||||||
| For the Six Months Ended 06/30/14 |
For the Year Ended 12/31/13 |
|||||||
| (Unaudited) | ||||||||
| Operations: |
||||||||
| Net investment income |
$ | 5,989,802 | $ | 16,173,397 | ||||
| Net realized gain (loss) on investment securities, foreign currency transactions and derivative transactions |
2,904,001 | 13,536,698 | ||||||
| Net change in unrealized appreciation (depreciation) on investment securities, foreign currency translations and derivative transactions |
23,383,503 | (55,249,908 | ) | |||||
|
|
|
|
|
|||||
| Net increase (decrease) in net assets resulting from operations |
32,277,306 | (25,539,813 | ) | |||||
|
|
|
|
|
|||||
| Dividends and Distributions to Shareholders: |
||||||||
| Dividends from net investment income |
||||||||
| Institutional shares |
(2,678,998 | ) | (7,171,639 | ) | ||||
| Investor shares |
(3,115,367 | ) | (9,578,417 | ) | ||||
| Distributions from net realized capital gains |
||||||||
| Institutional shares |
(218,192 | ) | (6,448,885 | ) | ||||
| Investor shares |
(269,288 | ) | (8,820,661 | ) | ||||
|
|
|
|
|
|||||
| Total dividends and distributions |
(6,281,845 | ) | (32,019,602 | ) | ||||
|
|
|
|
|
|||||
| Capital Share Transactions: |
||||||||
| Proceeds from shares sold |
||||||||
| Institutional shares |
7,592,549 | 8,686,398 | ||||||
| Investor shares |
23,270,857 | 32,327,945 | ||||||
| Reinvestment of dividends and distributions |
||||||||
| Institutional shares |
2,894,343 | 13,606,468 | ||||||
| Investor shares |
3,382,468 | 18,389,399 | ||||||
|
|
|
|
|
|||||
| Total proceeds from shares sold and reinvested |
37,140,217 | 73,010,210 | ||||||
|
|
|
|
|
|||||
| Value of shares redeemed |
||||||||
| Institutional shares |
(13,577,274 | ) | (38,446,492 | ) | ||||
| Investor shares |
(29,387,917 | ) | (177,196,077 | ) | ||||
|
|
|
|
|
|||||
| Total value of shares redeemed |
(42,965,191 | ) | (215,642,569 | ) | ||||
|
|
|
|
|
|||||
| Net increase (decrease) from capital share transactions(1) |
(5,824,974 | ) | (142,632,359 | ) | ||||
|
|
|
|
|
|||||
| Total increase (decrease) in net assets |
20,170,487 | (200,191,774 | ) | |||||
|
|
|
|
|
|||||
| Net Assets: |
||||||||
| Beginning of Period |
270,781,381 | 470,973,155 | ||||||
|
|
|
|
|
|||||
| End of Period* |
$ | 290,951,868 | $ | 270,781,381 | ||||
|
|
|
|
|
|||||
| *Including undistributed (distributions in excess of) net investment income |
$ | 349,700 | $ | 154,263 | ||||
|
|
|
|
|
|||||
| (1) | See Note 6 in Notes to Financial Statements. |
See Notes to Financial Statements.
118
Table of Contents
| Global Bond Fund | ||||||||
| For the Six Months Ended 06/30/14 |
For the Year Ended 12/31/13 |
|||||||
| (Unaudited) | ||||||||
| $ | 7,039,863 | $ | 10,852,037 | |||||
| (132,356 | ) |
|
218,973 |
| ||||
| |
15,631,857 |
|
(7,694,848 | ) | ||||
|
|
|
|
|
|||||
| 22,539,364 | 3,376,162 | |||||||
|
|
|
|
|
|||||
| — | — | |||||||
| (6,182,140 | ) | (9,497,750 | ) | |||||
| — | — | |||||||
| — | — | |||||||
|
|
|
|
|
|||||
| (6,182,140 | ) | (9,497,750 | ) | |||||
|
|
|
|
|
|||||
| — | — | |||||||
| 20,359,341 | 140,576,281 | |||||||
| — | — | |||||||
| 6,182,043 | 9,497,746 | |||||||
|
|
|
|
|
|||||
| 26,541,384 | 150,074,027 | |||||||
|
|
|
|
|
|||||
| — | — | |||||||
| (10,621,424 | ) | (18,966,067 | ) | |||||
|
|
|
|
|
|||||
| (10,621,424 | ) | (18,966,067 | ) | |||||
|
|
|
|
|
|||||
| 15,919,960 | 131,107,960 | |||||||
|
|
|
|
|
|||||
| 32,277,184 | 124,986,372 | |||||||
|
|
|
|
|
|||||
| 357,841,987 | 232,855,615 | |||||||
|
|
|
|
|
|||||
| $ | 390,119,171 | $ | 357,841,987 | |||||
|
|
|
|
|
|||||
| $ | (258,672 | ) | $ | (1,116,395 | ) | |||
|
|
|
|
|
|||||
See Notes to Financial Statements.
119
Table of Contents
FINANCIAL HIGHLIGHTS (Unaudited)
| For a Share Outstanding For the Years Ending December 31, unless otherwise indicated | Ratios to Average Net Assets | |||||||||||||||||||||||||||||||||||||||||||||||
| Net Asset Value, Beginning of Period |
Net Investment Income |
Realized and Unrealized Gain (Loss) on Investments |
Dividends from Net Investment Income |
Distributions from Net Realized Capital Gains |
Net Asset Value, End of Period |
Total Return |
Net Assets, End of Period (000) |
Expenses, Net(1) |
Expenses, Gross(2) |
Investment Income, Net(1) |
Portfolio Turnover Rate |
|||||||||||||||||||||||||||||||||||||
| Money Market Fund |
|
|||||||||||||||||||||||||||||||||||||||||||||||
| Institutional Class |
|
|||||||||||||||||||||||||||||||||||||||||||||||
| 2014(3) |
$ | 1.00 | $ | — | †# | $ | — | † | $ | — | † | $ | — | $ | 1.00 | 0.01 | % | $ | 140,309 | 0.18 | % | 0.19 | % | 0.01 | % | N/A | ||||||||||||||||||||||
| 2013(4) |
1.00 | — | †# | — | † | — | † | — | † | 1.00 | 0.04 | 106,060 | 0.18 | 0.20 | 0.04 | N/A | ||||||||||||||||||||||||||||||||
| 2012 |
1.00 | — | †# | — | † | — | † | — | † | 1.00 | 0.10 | 106,664 | 0.18 | 0.20 | 0.10 | N/A | ||||||||||||||||||||||||||||||||
| 2011 |
1.00 | — | †# | — | † | — | † | — | † | 1.00 | 0.10 | 116,298 | 0.18 | 0.19 | 0.09 | N/A | ||||||||||||||||||||||||||||||||
| 2010 |
1.00 | — | † | — | † | — | † | — | † | 1.00 | 0.18 | 119,311 | 0.17 | 0.18 | 0.17 | N/A | ||||||||||||||||||||||||||||||||
| 2009 |
1.00 | — | † | — | † | — | † | — | † | 1.00 | 0.47 | 133,323 | 0.23 | (5) | 0.23 | (5) | 0.49 | N/A | ||||||||||||||||||||||||||||||
| Investor Class |
|
|||||||||||||||||||||||||||||||||||||||||||||||
| 2014(3) |
$ | 1.00 | $ | — | †# | $ | — | † | $ | — | † | $ | — | $ | 1.00 | 0.01 | % | $ | 1,184,726 | 0.19 | % | 0.44 | % | 0.00 | % | N/A | ||||||||||||||||||||||
| 2013(4) |
1.00 | — | †# | — | † | — | † | — | † | 1.00 | 0.02 | 1,262,938 | 0.21 | 0.44 | 0.01 | N/A | ||||||||||||||||||||||||||||||||
| 2012 |
1.00 | — | †# | — | † | — | † | — | † | 1.00 | 0.01 | 1,131,756 | 0.27 | 0.44 | 0.01 | N/A | ||||||||||||||||||||||||||||||||
| 2011 |
1.00 | — | †# | — | † | — | † | — | † | 1.00 | 0.01 | 1,161,630 | 0.27 | 0.42 | 0.01 | N/A | ||||||||||||||||||||||||||||||||
| 2010 |
1.00 | — | † | — | † | — | † | — | † | 1.00 | 0.02 | 1,180,141 | 0.33 | 0.37 | 0.01 | N/A | ||||||||||||||||||||||||||||||||
| 2009 |
1.00 | — | † | — | † | — | † | — | † | 1.00 | 0.29 | 1,064,934 | 0.41 | (5) | 0.43 | (5) | 0.28 | N/A | ||||||||||||||||||||||||||||||
| Low-Duration Bond Fund |
|
|||||||||||||||||||||||||||||||||||||||||||||||
| Institutional Class |
|
|||||||||||||||||||||||||||||||||||||||||||||||
| 2014(3) |
$ | 8.54 | $ | 0.05 | # | $ | 0.04 | $ | (0.06 | ) | $ | (0.01 | ) | $ | 8.56 | 1.07 | % | $ | 142,425 | 0.36 | % | 0.41 | % | 1.22 | % | 201 | % | |||||||||||||||||||||
| 2013(6) |
8.71 | 0.11 | # | (0.11 | )(7) | (0.16 | ) | (0.01 | ) | 8.54 | 0.02 | 136,966 | 0.36 | 0.42 | 1.26 | 202 | ||||||||||||||||||||||||||||||||
| 2012 |
8.59 | 0.15 | # | 0.22 | (7) | (0.22 | ) | (0.03 | ) | 8.71 | 4.35 | 135,526 | 0.36 | 0.41 | 1.68 | 228 | ||||||||||||||||||||||||||||||||
| 2011 |
8.70 | 0.16 | # | (0.01 | )(7) | (0.23 | ) | (0.03 | ) | 8.59 | 1.77 | 122,462 | 0.36 | 0.42 | 1.84 | 221 | ||||||||||||||||||||||||||||||||
| 2010 |
8.70 | 0.20 | # | 0.17 | (0.28 | ) | (0.09 | ) | 8.70 | 4.35 | 128,143 | 0.36 | 0.41 | 2.27 | 257 | |||||||||||||||||||||||||||||||||
| 2009 |
8.11 | 0.29 | # | 0.69 | (0.39 | ) | — | 8.70 | 12.29 | 115,741 | 0.36 | 0.42 | 3.47 | 322 | ||||||||||||||||||||||||||||||||||
| Investor Class(6) |
|
|||||||||||||||||||||||||||||||||||||||||||||||
| 2014(3) |
$ | 13.35 | $ | 0.07 | # | $ | 0.06 | $ | (0.05 | ) | $ | (0.01 | ) | $ | 13.42 | 0.96 | % | $ | 725,424 | 0.57 | % | 0.66 | % | 1.01 | % | 201 | % | |||||||||||||||||||||
| 2013(6) |
13.52 | 0.14 | # | (0.16 | )(7) | (0.14 | ) | (0.01 | ) | 13.35 | (0.20 | ) | 701,299 | 0.57 | 0.66 | 1.04 | 202 | |||||||||||||||||||||||||||||||
| 2012 |
13.20 | 0.20 | # | 0.35 | (7) | (0.20 | ) | (0.03 | ) | 13.52 | 4.15 | 678,099 | 0.57 | 0.65 | 1.47 | 228 | ||||||||||||||||||||||||||||||||
| 2011 |
13.23 | 0.22 | # | (0.01 | )(7) | (0.21 | ) | (0.03 | ) | 13.20 | 1.58 | 621,713 | 0.55 | 0.65 | 1.64 | 221 | ||||||||||||||||||||||||||||||||
| 2010 |
13.04 | 0.28 | # | 0.26 | (0.26 | ) | (0.09 | ) | 13.23 | 4.20 | 580,452 | 0.52 | 0.61 | 2.11 | 257 | |||||||||||||||||||||||||||||||||
| 2009 |
11.99 | 0.42 | # | 1.00 | (0.37 | ) | — | 13.04 | 11.97 | 569,316 | 0.52 | 0.62 | 3.30 | 322 | ||||||||||||||||||||||||||||||||||
| Medium-Duration Bond Fund |
|
|||||||||||||||||||||||||||||||||||||||||||||||
| Institutional Class |
|
|||||||||||||||||||||||||||||||||||||||||||||||
| 2014(3) |
$ | 6.91 | $ | 0.09 | # | $ | 0.20 | $ | (0.14 | ) | $ | — | $ | 7.06 | 4.20 | % | $ | 253,190 | 0.48 | % | 0.52 | % | 2.46 | % | 231 | % | ||||||||||||||||||||||
| 2013(8) |
7.32 | 0.16 | # | (0.29 | )(7) | (0.27 | ) | (0.01 | ) | 6.91 | (1.90 | ) | 227,172 | 0.48 | 0.52 | 2.21 | 409 | |||||||||||||||||||||||||||||||
| 2012 |
7.24 | 0.17 | # | 0.39 | (7) | (0.28 | ) | (0.20 | ) | 7.32 | 7.93 | 251,565 | 0.48 | 0.51 | 2.32 | 570 | ||||||||||||||||||||||||||||||||
| 2011 |
7.25 | 0.20 | # | 0.27 | (7) | (0.35 | ) | (0.13 | ) | 7.24 | 6.56 | 228,024 | 0.48 | 0.52 | 2.76 | 609 | ||||||||||||||||||||||||||||||||
| 2010 |
7.47 | 0.25 | # | 0.40 | (0.41 | ) | (0.46 | ) | 7.25 | 8.86 | 236,369 | 0.48 | 0.49 | 3.21 | 487 | |||||||||||||||||||||||||||||||||
| 2009 |
7.13 | 0.31 | # | 0.85 | (0.51 | ) | (0.31 | ) | 7.47 | 17.07 | 139,917 | 0.48 | 0.51 | 4.17 | 427 | |||||||||||||||||||||||||||||||||
| Investor Class |
|
|||||||||||||||||||||||||||||||||||||||||||||||
| 2014(3) |
$ | 14.14 | $ | 0.16 | # | $ | 0.42 | $ | (0.13 | ) | $ | — | $ | 14.59 | 4.10 | % | $ | 607,840 | 0.63 | % | 0.76 | % | 2.31 | % | 231 | % | ||||||||||||||||||||||
| 2013(8) |
14.68 | 0.30 | # | (0.59 | )(7) | (0.24 | ) | (0.01 | ) | 14.14 | (1.98 | ) | 582,451 | 0.63 | 0.77 | 2.06 | 409 | |||||||||||||||||||||||||||||||
| 2012 |
14.07 | 0.32 | # | 0.75 | (7) | (0.26 | ) | (0.20 | ) | 14.68 | 7.68 | 620,945 | 0.63 | 0.75 | 2.18 | 570 | ||||||||||||||||||||||||||||||||
| 2011 |
13.65 | 0.37 | # | 0.51 | (7) | (0.33 | ) | (0.13 | ) | 14.07 | 6.49 | 636,218 | 0.61 | 0.75 | 2.62 | 609 | ||||||||||||||||||||||||||||||||
| 2010 |
13.36 | 0.43 | # | 0.71 | (0.39 | ) | (0.46 | ) | 13.65 | 8.65 | 614,082 | 0.58 | 0.68 | 3.11 | 487 | |||||||||||||||||||||||||||||||||
| 2009 |
12.16 | 0.53 | # | 1.48 | (0.50 | ) | (0.31 | ) | 13.36 | 16.97 | 868,800 | 0.58 | 0.70 | 4.08 | 427 | |||||||||||||||||||||||||||||||||
| † | Amount represents less than $0.005 per share. |
| # | Calculated using the average shares outstanding method. |
| (1) | The ratio includes expenses waived/reimbursed net of amount recaptured and fees paid indirectly, where applicable; if expenses waived/reimbursed net of amount recaptured and fees paid indirectly were excluded, the ratio would have been higher (lower) than the ratio shown. |
| (2) | The ratio excludes expenses waived/reimbursed net of amount recaptured and fees paid indirectly, where applicable; if expenses waived/reimbursed net of amount recaptured and fees paid indirectly were included, the ratio would have been lower than the ratio shown. |
| (3) | For the six months ended June 30, 2014. All ratios for the period have been annualized. Total return and portfolio turnover for the period have not been annualized. |
| (4) | An out of period adjustment to Investment Income had no impact on Net Investment Income per Share, Total Return or the Ratio of Net Investment Income to Average Net Assets for Institutional Class and Investor Class. |
| (5) | The Money Market Fund participated in the U.S. Department of the Treasury (the “Treasury”) Temporary Guarantee Program for Money Market Funds (the “Program”). The Fund bore the expense of its participation in the Program without regard to any expense limitation in effect. The Program expired on September 18, 2009. |
| (6) | An out of period adjustment to Investment Income had no impact on Net Investment Income per Share or Total Return; however, the Ratio of Net Investment Income to Average Net Assets increased by 0.02% and 0.02% for Institutional Class and Investor Class, respectively. |
| (7) | Amount includes Capital Gains distributions received by the Fund from the GuideStone Money Market Fund. The amount of these distributions represents less than $0.005 per share. |
| (8) | An out of period adjustment to Investment Income increased Net Investment Income per Share by $0.00 and $0.01, Total Return by 0.00% and 0.07%, and the Ratio of Net Investment Income to Average Net Assets by 0.04% and 0.04% for Institutional Class and Investor Class, respectively. |
See Notes to Financial Statements.
120
Table of Contents
| For a Share Outstanding For the Years Ending December 31, unless otherwise indicated | Ratios to Average Net Assets | |||||||||||||||||||||||||||||||||||||||||||||||
| Net Asset Value, Beginning of Period |
Net Investment Income |
Realized and Unrealized Gain (Loss) on Investments |
Dividends from Net Investment Income |
Distributions from Net Realized Capital Gains |
Net Asset Value, End of Period |
Total Return |
Net Assets, End of Period (000) |
Expenses, Net(1) |
Expenses, Gross(2) |
Investment Income, Net(1) |
Portfolio Turnover Rate |
|||||||||||||||||||||||||||||||||||||
| Extended-Duration Bond Fund |
|
|||||||||||||||||||||||||||||||||||||||||||||||
| Institutional Class |
|
|||||||||||||||||||||||||||||||||||||||||||||||
| 2014(3) |
$ | 4.78 | $ | 0.11 | # | $ | 0.46 | $ | (0.25 | ) | $ | (0.02 | ) | $ | 5.08 | 12.20 | % | $ | 52,096 | 0.56 | % | 0.57 | % | 4.38 | % | 14 | % | |||||||||||||||||||||
| 2013(4) |
6.36 | 0.27 | # | (0.58 | )(5) | (0.63 | ) | (0.64 | ) | 4.78 | (5.10 | ) | 51,959 | 0.55 | 0.55 | 4.61 | 37 | |||||||||||||||||||||||||||||||
| 2012 |
6.48 | 0.31 | # | 0.64 | (5) | (0.65 | ) | (0.42 | ) | 6.36 | 15.41 | 86,268 | 0.52 | 0.53 | 4.68 | 27 | ||||||||||||||||||||||||||||||||
| 2011 |
6.93 | 0.37 | # | 0.49 | (5) | (0.74 | ) | (0.57 | ) | 6.48 | 13.33 | 74,591 | 0.54 | 0.55 | 5.32 | 41 | ||||||||||||||||||||||||||||||||
| 2010 |
7.01 | 0.40 | # | 0.43 | (0.80 | ) | (0.11 | ) | 6.93 | 12.25 | 72,741 | 0.53 | 0.53 | 5.60 | 39 | |||||||||||||||||||||||||||||||||
| 2009 |
6.31 | 0.44 | # | 1.04 | (0.76 | ) | (0.02 | ) | 7.01 | 25.27 | 67,699 | 0.53 | 0.53 | 6.78 | 41 | |||||||||||||||||||||||||||||||||
| Investor Class |
|
|||||||||||||||||||||||||||||||||||||||||||||||
| 2014(3) |
$ | 16.39 | $ | 0.36 | # | $ | 1.60 | $ | (0.23 | ) | $ | (0.02 | ) | $ | 18.10 | 12.06 | % | $ | 238,856 | 0.75 | % | 0.83 | % | 4.19 | % | 14 | % | |||||||||||||||||||||
| 2013(4) |
18.58 | 0.78 | # | (1.74 | )(5) | (0.59 | ) | (0.64 | ) | 16.39 | (5.24 | ) | 218,822 | 0.75 | 0.80 | 4.40 | 37 | |||||||||||||||||||||||||||||||
| 2012 |
17.08 | 0.81 | # | 1.72 | (5) | (0.61 | ) | (0.42 | ) | 18.58 | 15.06 | 384,705 | 0.75 | 0.78 | 4.45 | 27 | ||||||||||||||||||||||||||||||||
| 2011 |
16.28 | 0.86 | # | 1.22 | (5) | (0.71 | ) | (0.57 | ) | 17.08 | 13.14 | 330,879 | 0.73 | 0.78 | 5.13 | 41 | ||||||||||||||||||||||||||||||||
| 2010 |
15.34 | 0.88 | # | 0.94 | (0.77 | ) | (0.11 | ) | 16.28 | 12.05 | 337,760 | 0.69 | 0.72 | 5.43 | 39 | |||||||||||||||||||||||||||||||||
| 2009 |
12.97 | 0.91 | # | 2.22 | (0.74 | ) | (0.02 | ) | 15.34 | 24.97 | 392,962 | 0.69 | 0.73 | 6.60 | 41 | |||||||||||||||||||||||||||||||||
| Global Bond Fund |
|
|||||||||||||||||||||||||||||||||||||||||||||||
| Investor Class |
|
|||||||||||||||||||||||||||||||||||||||||||||||
| 2014(3) |
$ | 10.09 | $ | 0.19 | # | $ | 0.43 | $ | (0.17 | ) | $ | — | $ | 10.54 | 6.20 | % | $ | 390,119 | 0.78 | % | 0.81 | % | 3.81 | % | 44 | % | ||||||||||||||||||||||
| 2013(6) |
10.38 | 0.39 | # | (0.36 | )(5) | (0.32 | ) | — | 10.09 | 0.30 | 357,842 | 0.80 | 0.83 | 3.77 | 101 | |||||||||||||||||||||||||||||||||
| 2012 |
9.73 | 0.45 | # | 0.74 | (5) | (0.54 | ) | — | 10.38 | 12.52 | 232,856 | 0.83 | 0.86 | 4.41 | 64 | |||||||||||||||||||||||||||||||||
| 2011 |
9.83 | 0.51 | # | (0.09 | )(5) | (0.52 | ) | — | 9.73 | 4.35 | 170,167 | 0.86 | 0.88 | 5.09 | 68 | |||||||||||||||||||||||||||||||||
| 2010 |
9.36 | 0.52 | # | 0.51 | (0.56 | ) | — | 9.83 | 11.29 | 161,070 | 0.79 | 0.81 | 5.40 | 40 | ||||||||||||||||||||||||||||||||||
| 2009 |
7.34 | 0.56 | # | 2.07 | (0.61 | ) | — | 9.36 | 37.35 | 221,555 | 0.79 | 0.81 | 6.81 | 96 | ||||||||||||||||||||||||||||||||||
| # | Calculated using the average shares outstanding method. |
| (1) | The ratio includes expenses waived/reimbursed net of amount recaptured and fees paid indirectly, where applicable; if expenses waived/reimbursed net of amount recaptured and fees paid indirectly were excluded, the ratio would have been higher (lower) than the ratio shown. |
| (2) | The ratio excludes expenses waived/reimbursed net of amount recaptured and fees paid indirectly, where applicable; if expenses waived/reimbursed net of amount recaptured and fees paid indirectly were included, the ratio would have been lower than the ratio shown. |
| (3) | For the six months ended June 30, 2014. All ratios for the period have been annualized. Total return and portfolio turnover for the period have not been annualized. |
| (4) | An out of period adjustment to Investment Income increased Net Investment Income per Share by $0.00 and $0.01, Total Return by 0.00% and 0.05%, and the Ratio of Net Investment Income to Average Net Assets by 0.04% and 0.04% for Institutional Class and Investor Class, respectively. |
| (5) | Amount includes Capital Gains distributions received by the Fund from the GuideStone Money Market Fund. The amount of these distributions represents less than $0.005 per share. |
| (6) | An out of period adjustment to Investment Income increased Net Investment Income per Share by $0.01, Total Return by 0.10%, and the Ratio of Net Investment Income to Average Net Assets by 0.02%. |
See Notes to Financial Statements.
121
Table of Contents
| DEFENSIVE MARKET STRATEGIES FUND SCHEDULE OF INVESTMENTS |
June 30, 2014 (Unaudited) |
See Notes to Financial Statements.
122
Table of Contents
See Notes to Financial Statements.
123
Table of Contents
DEFENSIVE MARKET STRATEGIES FUND
SCHEDULE OF INVESTMENTS (Continued)
See Notes to Financial Statements.
124
Table of Contents
See Notes to Financial Statements.
125
Table of Contents
DEFENSIVE MARKET STRATEGIES FUND
SCHEDULE OF INVESTMENTS (Continued)
See Notes to Financial Statements.
126
Table of Contents
See Notes to Financial Statements.
127
Table of Contents
DEFENSIVE MARKET STRATEGIES FUND
SCHEDULE OF INVESTMENTS (Continued)
See Notes to Financial Statements.
128
Table of Contents
See Notes to Financial Statements.
129
Table of Contents
DEFENSIVE MARKET STRATEGIES FUND
SCHEDULE OF INVESTMENTS (Continued)
VALUATION HIERARCHY
The following is a summary of the inputs used, as of June 30, 2014, in valuing the Fund’s investments carried at fair value:
| Total Value |
Level
1 Quoted Prices |
Level
2 Other Significant Observable Inputs |
Level
3 Significant Unobservable Inputs |
|||||||||||||
| Assets: |
||||||||||||||||
| Investments in Securities: |
||||||||||||||||
| Common Stocks |
$ | 239,365,185 | $ | 239,365,185 | $ | — | $ | — | ||||||||
| Corporate Bonds |
127,999,588 | — | 127,999,588 | — | ||||||||||||
| Foreign Bonds |
4,991,089 | — | 4,991,089 | — | ||||||||||||
| Foreign Common Stocks: |
||||||||||||||||
| Bermuda |
1,605,653 | 1,605,653 | — | — | ||||||||||||
| British Virgin Islands |
24,822 | 24,822 | — | — | ||||||||||||
| Canada |
1,711,851 | 1,711,851 | — | — | ||||||||||||
| Curacao |
257,957 | 257,957 | — | — | ||||||||||||
| France |
4,177,302 | 4,177,302 | — | — | ||||||||||||
| Ireland |
987,099 | 987,099 | — | — | ||||||||||||
| Japan |
398,024 | 398,024 | — | — | ||||||||||||
| Jersey |
15,604 | 15,604 | — | — | ||||||||||||
| Netherlands |
1,027,833 | 1,027,833 | — | — | ||||||||||||
| Panama |
47,264 | 47,264 | — | — | ||||||||||||
| Singapore |
19,531 | 19,531 | — | — | ||||||||||||
| Switzerland |
3,012,911 | 3,012,911 | — | — | ||||||||||||
| United Kingdom |
1,454,614 | 1,454,614 | — | — | ||||||||||||
| Master Limited Partnership |
2,879,886 | 2,879,886 | — | — | ||||||||||||
| Money Market Funds |
93,619,306 | 93,619,306 | — | — | ||||||||||||
| Preferred Stocks |
27,364,595 | 20,478,787 | — | 6,885,808 | ||||||||||||
| U.S. Treasury Obligations |
98,529,650 | — | 98,529,650 | — | ||||||||||||
| Synthetic Convertible Instrument |
4,138,437 | — | — | 4,138,437 | ||||||||||||
|
|
|
|
|
|
|
|
|
|||||||||
| Total Assets — Investments in Securities |
$ | 613,628,201 | $ | 371,083,629 | $ | 231,520,327 | $ | 11,024,245 | ||||||||
|
|
|
|
|
|
|
|
|
|||||||||
| Other Financial Instruments*** |
||||||||||||||||
| Futures Contracts |
$ | 198,923 | $ | 198,923 | $ | — | $ | — | ||||||||
|
|
|
|
|
|
|
|
|
|||||||||
| Total Assets — Other Financial Instruments |
$ | 198,923 | $ | 198,923 | $ | — | $ | — | ||||||||
|
|
|
|
|
|
|
|
|
|||||||||
See Notes to Financial Statements.
130
Table of Contents
| Total Value |
Level 1 Quoted Prices |
Level 2 Other Significant Observable Inputs |
Level
3 Significant Unobservable Inputs |
|||||||||||||
| Liabilities: |
||||||||||||||||
| Investments in Securities: |
||||||||||||||||
| Written Options |
$ | (195,590 | ) | $ | (195,590 | ) | $ | — | $ | — | ||||||
|
|
|
|
|
|
|
|
|
|||||||||
| Total Liabilities — Investments in Securities |
$ | (195,590 | ) | $ | (195,590 | ) | $ | — | $ | — | ||||||
|
|
|
|
|
|
|
|
|
|||||||||
| Other Financial Instruments*** |
||||||||||||||||
| Forward Foreign Currency Contracts |
$ | (47,065 | ) | $ | — | $ | (47,065 | ) | $ | — | ||||||
|
|
|
|
|
|
|
|
|
|||||||||
| Total Liabilities — Other Financial Instruments |
$ | (47,065 | ) | $ | — | $ | (47,065 | ) | $ | — | ||||||
|
|
|
|
|
|
|
|
|
|||||||||
| *** | Other financial instruments are derivative instruments not reflected in the Schedule of Investments, such as futures, forwards and swap contracts, which are valued at the unrealized appreciation (depreciation) on the investment. Details of these investments can be found in the Notes to Financial Statements. |
There were no transfers between Level 1 and Level 2 during the period ended June 30, 2014.
The Fund had securities that transferred from Level 2 to Level 1 of the fair value hierarchy as a result of foreign equities that were fair valued at December 31, 2013 that are now being valued based on quoted prices. The value of the securities that were transferred to Level 1 as of June 30, 2014 is $6,456,231.
The unobservable inputs used in the fair value measurement of the reporting entity’s corporate bonds, preferred stock and synthetic convertible instruments are values based on evaluated quotations received from dealers who make markets in such securities. Significant increases (decreases) in those evaluated quotations would result in a significantly higher (lower) fair value measurement.
The following is a reconciliation of assets in which significant unobservable inputs (Level 3) were used in determining fair value:
| Total Value |
Corporate Bonds |
Preferred Stock |
Synthetic Convertible Instruments |
|||||||||||||
| Balance, 12/31/13 |
$ | 12,995,786 | $ | 3,024,494 | $ | 7,867,600 | $ | 2,103,692 | ||||||||
| Accrued discounts/premiums |
(58,588 | ) | (58,588 | ) | — | — | ||||||||||
| Realized gain (loss)(1) |
436,028 | 140,861 | 295,167 | — | ||||||||||||
| Change in unrealized appreciation (depreciation)(2) |
351,445 | (178,770 | ) | 461,829 | 68,386 | |||||||||||
| Purchases |
4,732,999 | — | 618,647 | 4,114,352 | ||||||||||||
| Sales |
(7,433,425 | ) | (2,927,997 | ) | (2,357,435 | ) | (2,147,993 | ) | ||||||||
| Transfers in to Level 3 |
— | — | — | — | ||||||||||||
| Transfers out of Level 3 |
— | — | — | — | ||||||||||||
| Maturities |
— | — | — | — | ||||||||||||
| Paydowns |
— | — | — | — | ||||||||||||
|
|
|
|
|
|
|
|
|
|||||||||
| Balance, 06/30/14 |
$ | 11,024,245 | $ | — | $ | 6,885,808 | $ | 4,138,437 | ||||||||
|
|
|
|
|
|
|
|
|
|||||||||
| (1) | Realized gain (loss) from the sale of Level 3 securities can be found on the Statement of Operations in Net realized gain (loss) from: Investment securities. |
| (2) | Change in unrealized appreciation (depreciation) can be found on the Statement of Operations in Net change in unrealized appreciation (depreciation) on: Investment securities. |
See Notes to Financial Statements.
131
Table of Contents
| SCHEDULE OF INVESTMENTS |
June 30, 2014 (Unaudited) |
See Notes to Financial Statements.
132
Table of Contents
See Notes to Financial Statements.
133
Table of Contents
EQUITY INDEX FUND
SCHEDULE OF INVESTMENTS (Continued)
See Notes to Financial Statements.
134
Table of Contents
See Notes to Financial Statements.
135
Table of Contents
EQUITY INDEX FUND
SCHEDULE OF INVESTMENTS (Continued)
See Notes to Financial Statements.
136
Table of Contents
VALUATION HIERARCHY
The following is a summary of the inputs used, as of June 30, 2014, in valuing the Fund’s investments carried at fair value:
| Total Value |
Level 1 Quoted Prices |
Level 2 Other Significant Observable Inputs |
Level
3 Significant Unobservable Inputs |
|||||||||||||
| Assets: |
||||||||||||||||
| Investments in Securities: |
||||||||||||||||
| Common Stocks |
$ | 352,999,355 | $ | 352,999,355 | $ | — | $ | — | ||||||||
| Foreign Common Stocks |
14,377,079 | 14,377,079 | — | — | ||||||||||||
| Money Market Funds |
43,652,331 | 43,652,331 | — | — | ||||||||||||
| Rights/Warrants |
— | — | — | — | ||||||||||||
| U.S. Treasury Obligation |
534,950 | — | 534,950 | — | ||||||||||||
|
|
|
|
|
|
|
|
|
|||||||||
| Total Assets — Investments in Securities |
$ | 411,563,715 | $ | 411,028,765 | $ | 534,950 | $ | — | ||||||||
|
|
|
|
|
|
|
|
|
|||||||||
| Other Financial Instruments*** |
||||||||||||||||
| Futures Contracts |
$ | 212,686 | $ | 212,686 | $ | — | $ | — | ||||||||
|
|
|
|
|
|
|
|
|
|||||||||
| Total Assets — Other Financial Instruments |
$ | 212,686 | $ | 212,686 | $ | — | $ | — | ||||||||
|
|
|
|
|
|
|
|
|
|||||||||
| *** | Other financial instruments are derivative instruments not reflected in the Schedule of Investments, such as futures, forwards and swap contracts, which are valued at the unrealized appreciation (depreciation) on the investment. Details of these investments can be found in the Notes to Financial Statements. |
There were no transfers between Level 1 and Level 2 during the period ended June 30, 2014.
See Notes to Financial Statements.
137
Table of Contents
| VALUE EQUITY FUND | ||
| SCHEDULE OF INVESTMENTS | June 30, 2014 (Unaudited) |
See Notes to Financial Statements.
138
Table of Contents
See Notes to Financial Statements.
139
Table of Contents
VALUE EQUITY FUND
SCHEDULE OF INVESTMENTS (Continued)
See Notes to Financial Statements.
140
Table of Contents
VALUATION HIERARCHY
The following is a summary of the inputs used, as of June 30, 2014, in valuing the Fund’s investments carried at fair value:
| Total Value |
Level 1 Quoted Prices |
Level 2 Other Significant Observable Inputs |
Level
3 Significant Unobservable Inputs |
|||||||||||||
| Assets: |
||||||||||||||||
| Investments in Securities: |
||||||||||||||||
| Common Stocks |
$ | 1,217,387,234 | $ | 1,217,387,234 | $ | — | $ | — | ||||||||
| Foreign Common Stocks |
151,362,375 | 151,362,375 | — | — | ||||||||||||
| Money Market Funds |
209,754,091 | 209,754,091 | — | — | ||||||||||||
| Exchange Traded Fund |
2,288,702 | 2,288,702 | — | — | ||||||||||||
| U.S. Treasury Obligation |
649,939 | — | 649,939 | — | ||||||||||||
|
|
|
|
|
|
|
|
|
|||||||||
| Total Assets — Investments in Securities |
$ | 1,581,442,341 | $ | 1,580,792,402 | $ | 649,939 | $ | — | ||||||||
|
|
|
|
|
|
|
|
|
|||||||||
| Other Financial Instruments*** |
||||||||||||||||
| Futures Contracts |
$ | 382,902 | $ | 382,902 | $ | — | $ | — | ||||||||
|
|
|
|
|
|
|
|
|
|||||||||
| Total Assets — Other Financial Instruments |
$ | 382,902 | $ | 382,902 | $ | — | $ | — | ||||||||
|
|
|
|
|
|
|
|
|
|||||||||
| *** | Other financial instruments are derivative instruments not reflected in the Schedule of Investments, such as futures, forwards and swap contracts, which are valued at the unrealized appreciation (depreciation) on the investment. Details of these investments can be found in the Notes to Financial Statements. |
There were no transfers between Level 1 and Level 2 during the period ended June 30, 2014.
See Notes to Financial Statements.
141
Table of Contents
| GROWTH EQUITY FUND | ||
| SCHEDULE OF INVESTMENTS | June 30, 2014 (Unaudited) |
See Notes to Financial Statements.
142
Table of Contents
See Notes to Financial Statements.
143
Table of Contents
GROWTH EQUITY FUND
SCHEDULE OF INVESTMENTS (Continued)
VALUATION HIERARCHY
The following is a summary of the inputs used, as of June 30, 2014, in valuing the Fund’s investments carried at fair value:
| Total Value |
Level 1 Quoted Prices |
Level 2 Other Significant Observable Inputs |
Level
3 Significant Unobservable Inputs |
|||||||||||||
| Assets: |
||||||||||||||||
| Investments in Securities: |
||||||||||||||||
| Common Stocks |
$ | 1,234,484,735 | $ | 1,234,484,735 | $ | — | $ | — | ||||||||
| Foreign Common Stocks |
169,994,407 | 169,994,407 | — | — | ||||||||||||
| Money Market Funds |
258,117,001 | 258,117,001 | — | — | ||||||||||||
|
|
|
|
|
|
|
|
|
|||||||||
| Total Assets — Investments in Securities |
$ | 1,662,596,143 | $ | 1,662,596,143 | $ | — | $ | — | ||||||||
|
|
|
|
|
|
|
|
|
|||||||||
| Other Financial Instruments*** |
||||||||||||||||
| Futures Contracts |
$ | 871,985 | $ | 871,985 | $ | — | $ | — | ||||||||
|
|
|
|
|
|
|
|
|
|||||||||
| Total Assets — Other Financial Instruments |
$ | 871,985 | $ | 871,985 | $ | — | $ | — | ||||||||
|
|
|
|
|
|
|
|
|
|||||||||
| *** | Other financial instruments are derivative instruments not reflected in the Schedule of Investments, such as futures, forwards and swap contracts, which are valued at the unrealized appreciation (depreciation) on the investment. Details of these investments can be found in the Notes to Financial Statements. |
There were no transfers between Level 1 and Level 2 during the period ended June 30, 2014.
See Notes to Financial Statements.
144
Table of Contents
| SMALL CAP EQUITY FUND | ||
| SCHEDULE OF INVESTMENTS | June 30, 2014 (Unaudited) |
See Notes to Financial Statements.
145
Table of Contents
SMALL CAP EQUITY FUND
SCHEDULE OF INVESTMENTS (Continued)
See Notes to Financial Statements.
146
Table of Contents
See Notes to Financial Statements.
147
Table of Contents
SMALL CAP EQUITY FUND
SCHEDULE OF INVESTMENTS (Continued)
See Notes to Financial Statements.
148
Table of Contents
See Notes to Financial Statements.
149
Table of Contents
SMALL CAP EQUITY FUND
SCHEDULE OF INVESTMENTS (Continued)
VALUATION HIERARCHY
The following is a summary of the inputs used, as of June 30, 2014, in valuing the Fund’s investments carried at fair value:
| Total Value |
Level 1 Quoted Prices |
Level 2 Other Significant Observable Inputs |
Level 3 Significant Unobservable Inputs |
|||||||||||||
| Assets: |
||||||||||||||||
| Investments in Securities: |
||||||||||||||||
| Common Stocks: |
||||||||||||||||
| Consumer Discretionary |
$ | 76,279,320 | $ | 76,279,320 | $ | — | $ | — | ||||||||
| Consumer Staples |
9,240,681 | 9,240,681 | — | — | ||||||||||||
| Energy |
31,906,284 | 31,906,284 | — | — | ||||||||||||
| Financial Services |
83,855,874 | 83,855,874 | — | — | ||||||||||||
| Healthcare |
49,406,659 | 49,406,659 | — | — | ||||||||||||
| Materials & Processing |
36,184,592 | 36,184,592 | — | — | ||||||||||||
| Producer Durables |
117,707,394 | 117,707,394 | — | — | ||||||||||||
| Technology |
81,169,588 | 81,169,588 | — | — | ||||||||||||
| Utilities |
19,417,855 | 19,417,855 | — | — | ||||||||||||
| Corporate Bonds |
— | — | — | — | ||||||||||||
| Exchange Traded Fund |
2,184,982 | 2,184,982 | — | — | ||||||||||||
| Foreign Bond: |
||||||||||||||||
| Iceland |
1 | — | — | 1 | ||||||||||||
| Foreign Common Stocks |
41,149,877 | 41,149,877 | — | — | ||||||||||||
| Money Market Funds |
209,439,949 | 209,439,949 | — | — | ||||||||||||
| Rights/Warrants |
25 | — | — | 25 | ||||||||||||
|
|
|
|
|
|
|
|
|
|||||||||
| Total Assets — Investments in Securities |
$ | 757,943,081 | $ | 757,943,055 | $ | — | $ | 26 | ||||||||
|
|
|
|
|
|
|
|
|
|||||||||
| Liabilities: |
||||||||||||||||
| Other Financial Instruments*** |
||||||||||||||||
| Futures Contracts |
$ | 674,015 | $ | 674,015 | $ | — | $ | — | ||||||||
|
|
|
|
|
|
|
|
|
|||||||||
| Total Liabilities — Other Financial Instruments |
$ | 674,015 | $ | 674,015 | $ | — | $ | — | ||||||||
|
|
|
|
|
|
|
|
|
|||||||||
| *** | Other financial instruments are derivative instruments not reflected in the Schedule of Investments, such as futures, forwards and swap contracts, which are valued at the unrealized appreciation (depreciation) on the investment. Details of these investments can be found in the Notes to Financial Statements. |
There were no transfers between Level 1 and Level 2 during the period ended June 30, 2014.
Management has determined that the amount of Level 3 securities compared to total net assets is not material; therefore, the reconciliation of Level 3 securities and assumptions is not shown for the period ending June 30, 2014.
See Notes to Financial Statements.
150
Table of Contents
| SCHEDULE OF INVESTMENTS |
June 30, 2014 (Unaudited) |
See Notes to Financial Statements.
151
Table of Contents
INTERNATIONAL EQUITY FUND
SCHEDULE OF INVESTMENTS (Continued)
See Notes to Financial Statements.
152
Table of Contents
See Notes to Financial Statements.
153
Table of Contents
INTERNATIONAL EQUITY FUND
SCHEDULE OF INVESTMENTS (Continued)
See Notes to Financial Statements.
154
Table of Contents
See Notes to Financial Statements.
155
Table of Contents
INTERNATIONAL EQUITY FUND
SCHEDULE OF INVESTMENTS (Continued)
See Notes to Financial Statements.
156
Table of Contents
See Notes to Financial Statements.
157
Table of Contents
INTERNATIONAL EQUITY FUND
SCHEDULE OF INVESTMENTS (Continued)
PORTFOLIO SUMMARY (based on net assets)
See Notes to Financial Statements.
158
Table of Contents
VALUATION HIERARCHY
The following is a summary of the inputs used, as of June 30, 2014, in valuing the Fund’s investments carried at fair value:
| Total Value |
Level
1 Quoted Prices |
Level 2 Other Significant Observable Inputs |
Level 3 Significant Unobservable Inputs |
|||||||||||||
| Assets: |
||||||||||||||||
| Investments in Securities: |
||||||||||||||||
| Foreign Common Stocks: |
||||||||||||||||
| Australia |
$ | 44,223,761 | $ | 44,223,761 | $ | — | $ | — | ||||||||
| Austria |
3,625,830 | 3,625,830 | — | — | ||||||||||||
| Belgium |
3,876,959 | 3,876,959 | — | — | ||||||||||||
| Bermuda |
19,239,150 | 19,239,150 | — | — | ||||||||||||
| Brazil |
12,982,418 | 12,982,418 | — | — | ||||||||||||
| British Virgin Islands |
1,065,995 | 1,065,995 | — | — | ||||||||||||
| Canada |
12,460,372 | 12,460,372 | — | — | ||||||||||||
| Chile |
1,468,431 | 1,468,431 | — | — | ||||||||||||
| China |
37,912,570 | 37,912,570 | — | — | ||||||||||||
| Denmark |
26,179,611 | 26,179,611 | — | — | ||||||||||||
| Finland |
4,237,013 | 4,237,013 | — | — | ||||||||||||
| France |
131,689,236 | 131,689,236 | — | — | ||||||||||||
| Germany |
130,084,100 | 130,084,100 | — | — | ||||||||||||
| Guernsey |
221,787 | 221,787 | — | — | ||||||||||||
| Hong Kong |
22,706,277 | 22,704,843 | — | 1,434 | ||||||||||||
| India |
6,258,832 | 6,258,832 | — | — | ||||||||||||
| Indonesia |
623,309 | 623,309 | — | — | ||||||||||||
| Ireland |
6,200,416 | 6,200,416 | — | — | ||||||||||||
| Italy |
39,725,730 | 39,725,730 | — | — | ||||||||||||
| Japan |
229,788,195 | 229,788,195 | — | — | ||||||||||||
| Jersey |
11,493,077 | 11,493,077 | — | — | ||||||||||||
| Luxembourg |
2,541,102 | 2,541,102 | — | — | ||||||||||||
| Malaysia |
953,234 | 953,234 | — | — | ||||||||||||
| Mauritius |
134 | 134 | — | — | ||||||||||||
| Netherlands |
68,900,770 | 68,900,770 | — | — | ||||||||||||
| New Zealand |
1,360,944 | 1,360,944 | — | — | ||||||||||||
| Nigeria |
— | — | — | — | ||||||||||||
| Norway |
18,901,057 | 18,901,057 | — | — | ||||||||||||
| Portugal |
1,943,581 | 1,943,581 | — | — | ||||||||||||
| Russia |
1,712,593 | 1,712,593 | — | — | ||||||||||||
| Singapore |
28,121,569 | 28,121,569 | — | — | ||||||||||||
| South Korea |
16,258,994 | 16,258,994 | — | — | ||||||||||||
| Spain |
83,854,751 | 83,854,751 | — | — | ||||||||||||
| Sweden |
49,745,743 | 49,745,743 | — | — | ||||||||||||
| Switzerland |
137,886,995 | 137,886,995 | — | — | ||||||||||||
| Taiwan |
18,517,728 | 18,517,728 | — | — | ||||||||||||
| Thailand |
82,703 | 82,703 | — | — | ||||||||||||
| Turkey |
5,249,962 | 5,249,962 | — | — | ||||||||||||
| United Kingdom |
267,584,596 | 267,479,533 | — | 105,063 | ||||||||||||
| United States of America |
13,473,632 | 13,473,632 | — | — | ||||||||||||
| Foreign Preferred Stocks: |
||||||||||||||||
| Germany |
7,228,221 | 7,228,221 | — | — | ||||||||||||
| Money Market Funds |
146,828,076 | 146,828,076 | — | — | ||||||||||||
| Warrant |
1 | 1 | — | — | ||||||||||||
| Rights |
25,918 | 25,918 | — | — | ||||||||||||
|
|
|
|
|
|
|
|
|
|||||||||
| Total Assets — Investments in Securities |
$ | 1,617,235,373 | $ | 1,617,128,876 | $ | — | $ | 106,497 | ||||||||
|
|
|
|
|
|
|
|
|
|||||||||
| Other Financial Instruments*** |
||||||||||||||||
| Forward Foreign Currency Contracts |
$ | 834,300 | $ | — | $ | 834,300 | $ | — | ||||||||
|
|
|
|
|
|
|
|
|
|||||||||
| Total Assets — Other Financial Instruments |
$ | 834,300 | $ | — | $ | 834,300 | $ | — | ||||||||
|
|
|
|
|
|
|
|
|
|||||||||
See Notes to Financial Statements.
159
Table of Contents
INTERNATIONAL EQUITY FUND
SCHEDULE OF INVESTMENTS (Continued)
| Total Value |
Level 1 Quoted Prices |
Level 2 Other Significant Observable Inputs |
Level 3 Significant Unobservable Inputs |
|||||||||||||
| Liabilities: |
||||||||||||||||
| Investments in Securities: |
||||||||||||||||
| Foreign Common Stocks Sold Short: |
||||||||||||||||
| Australia |
$ | (7,728,181 | ) | $ | (7,728,181 | ) | $ | — | $ | — | ||||||
| Bermuda |
(374,082 | ) | (374,082 | ) | — | — | ||||||||||
| Denmark |
(1,747,983 | ) | (1,747,983 | ) | — | — | ||||||||||
| Finland |
(4,100,519 | ) | (4,100,519 | ) | — | — | ||||||||||
| France |
(12,158,794 | ) | (12,158,794 | ) | — | — | ||||||||||
| Germany |
(12,470,624 | ) | (12,470,624 | ) | — | — | ||||||||||
| Italy |
(3,462,080 | ) | (3,462,080 | ) | — | — | ||||||||||
| Japan |
(20,651,513 | ) | (20,651,513 | ) | — | — | ||||||||||
| Liberia |
(486,726 | ) | (486,726 | ) | — | — | ||||||||||
| Luxembourg |
(790,286 | ) | (790,286 | ) | — | — | ||||||||||
| Netherlands |
(6,131,747 | ) | (6,131,747 | ) | — | — | ||||||||||
| Norway |
(1,319,989 | ) | (1,319,989 | ) | — | — | ||||||||||
| Spain |
(2,867,676 | ) | (2,867,676 | ) | — | — | ||||||||||
| Sweden |
(2,838,110 | ) | (2,838,110 | ) | — | — | ||||||||||
| Switzerland |
(6,702,137 | ) | (6,702,137 | ) | — | — | ||||||||||
| United Kingdom |
(13,049,558 | ) | (13,049,558 | ) | — | — | ||||||||||
|
|
|
|
|
|
|
|
|
|||||||||
| Total Liabilities — Investments in Securities |
$ | (96,880,005 | ) | $ | (96,880,005 | ) | $ | — | $ | — | ||||||
|
|
|
|
|
|
|
|
|
|||||||||
| Other Financial Instruments*** |
||||||||||||||||
| Futures Contracts |
$ | (25,681 | ) | $ | (25,681 | ) | $ | — | $ | — | ||||||
|
|
|
|
|
|
|
|
|
|||||||||
| Total Liabilities — Other Financial Instruments |
$ | (25,681 | ) | $ | (25,681 | ) | $ | — | $ | — | ||||||
|
|
|
|
|
|
|
|
|
|||||||||
| *** | Other financial instruments are derivative instruments not reflected in the Schedule of Investments, such as futures, forwards and swap contracts, which are valued at the unrealized appreciation (depreciation) on the investment. Details of these investments can be found in the Notes to Financial Statements. |
There were no transfers between Level 1 and Level 2 during the period ended June 30, 2014.
The Fund had securities that transferred from Level 2 to Level 1 of the fair value hierarchy as a result of foreign equities that were fair valued at December 31, 2013 that are now being valued based on quoted prices. The value of the securities that were transferred to Level 1 as of June 30, 2014 is $660,424,531.
Management has determined that the amount of Level 3 securities compared to total net assets is not material; therefore, the reconciliation of Level 3 securities and assumptions is not shown for the period ending June 30, 2014.
See Notes to Financial Statements.
160
Table of Contents
| SCHEDULE OF INVESTMENTS |
June 30, 2014 (Unaudited) |
See Notes to Financial Statements.
161
Table of Contents
EMERGING MARKETS EQUITY FUND
SCHEDULE OF INVESTMENTS (Continued)
See Notes to Financial Statements.
162
Table of Contents
See Notes to Financial Statements.
163
Table of Contents
EMERGING MARKETS EQUITY FUND
SCHEDULE OF INVESTMENTS (Continued)
See Notes to Financial Statements.
164
Table of Contents
See Notes to Financial Statements.
165
Table of Contents
EMERGING MARKETS EQUITY FUND
SCHEDULE OF INVESTMENTS (Continued)
VALUATION HIERARCHY
The following is a summary of the inputs used, as of June 30, 2014, in valuing the Fund’s investments carried at fair value:
| Total Value |
Level 1 Quoted Prices |
Level 2 Other Significant Observable Inputs |
Level
3 Significant Unobservable Inputs |
|||||||||||||
| Assets: |
||||||||||||||||
| Investments in Securities: |
||||||||||||||||
| Foreign Common Stocks: |
||||||||||||||||
| Argentina |
$ | 524,813 | $ | 524,813 | $ | — | $ | — | ||||||||
| Austria |
1,130,575 | 1,130,575 | — | — | ||||||||||||
| Bermuda |
3,181,426 | 3,181,426 | — | — | ||||||||||||
| Brazil |
18,376,500 | 18,376,500 | — | — | ||||||||||||
| Canada |
8,396,169 | 8,396,169 | — | — | ||||||||||||
| Chile |
2,809,224 | 2,809,224 | — | — | ||||||||||||
| China |
23,372,475 | 23,372,475 | — | — | ||||||||||||
| Colombia |
1,861,156 | 1,861,156 | — | — | ||||||||||||
| Cyprus |
1,764,957 | 1,764,957 | — | — | ||||||||||||
| Egypt |
375,328 | 375,328 | — | — | ||||||||||||
| Estonia |
548,967 | 548,967 | — | — | ||||||||||||
| Hong Kong |
15,788,074 | 15,788,074 | — | — | ||||||||||||
| Hungary |
697,556 | 697,556 | — | — | ||||||||||||
| India |
24,678,495 | 24,678,495 | — | — | ||||||||||||
| Indonesia |
7,247,963 | 7,247,963 | — | — | ||||||||||||
| Jersey |
206,420 | 206,420 | — | — | ||||||||||||
| Kenya |
330,337 | 330,337 | — | — | ||||||||||||
| Luxembourg |
1,168,220 | 1,168,220 | — | — | ||||||||||||
| Malaysia |
6,699,763 | 6,699,763 | — | — | ||||||||||||
| Mexico |
16,129,145 | 16,129,145 | — | — | ||||||||||||
| Mongolia |
106,562 | 106,562 | — | — | ||||||||||||
| Netherlands |
5,009,249 | 5,009,249 | — | — | ||||||||||||
| Nigeria |
3,969,128 | 3,969,128 | — | — | ||||||||||||
| Philippines |
1,417,265 | 1,417,265 | — | — | ||||||||||||
| Poland |
2,766,571 | 2,766,571 | — | — | ||||||||||||
| Russia |
17,708,553 | 17,708,553 | — | — | ||||||||||||
| South Africa |
13,844,063 | 13,844,063 | — | — | ||||||||||||
| South Korea |
34,900,541 | 34,900,541 | — | — | ||||||||||||
| Switzerland |
1,640,432 | 1,640,432 | — | — | ||||||||||||
| Taiwan |
30,995,291 | 30,995,291 | — | — | ||||||||||||
| Thailand |
13,332,719 | 13,332,719 | — | — | ||||||||||||
| Turkey |
7,616,389 | 7,616,389 | — | — | ||||||||||||
| United Kingdom |
19,081,321 | 19,081,321 | — | — | ||||||||||||
| United States of America |
2,895,912 | 2,895,912 | — | — | ||||||||||||
| Foreign Preferred Stocks: |
||||||||||||||||
| Brazil |
3,773,373 | 3,773,373 | — | — | ||||||||||||
| South Korea |
4,513,224 | 4,513,224 | — | — | ||||||||||||
| Money Market Funds |
40,261,468 | 40,261,468 | — | — | ||||||||||||
|
|
|
|
|
|
|
|
|
|||||||||
| Total Assets — Investments in Securities |
$ | 339,119,624 | $ | 339,119,624 | $ | — | $ | — | ||||||||
|
|
|
|
|
|
|
|
|
|||||||||
| Liabilities: |
||||||||||||||||
| Other Financial Instruments*** |
||||||||||||||||
| Forward Foreign Currency Contracts |
$ | (186,748 | ) | $ | — | $ | (186,748 | ) | $ | — | ||||||
| Futures Contracts |
(164,077 | ) | (164,077 | ) | — | — | ||||||||||
|
|
|
|
|
|
|
|
|
|||||||||
| Total Liabilities — Other Financial Instruments |
$ | (350,825 | ) | $ | (164,077 | ) | $ | (186,748 | ) | $ | — | |||||
|
|
|
|
|
|
|
|
|
|||||||||
| *** | Other financial instruments are derivative instruments not reflected in the Schedule of Investments, such as futures, forwards and swap contracts, which are valued at the unrealized appreciation (depreciation) on the investment. Details of these investments can be found in the Notes to Financial Statements. |
There were no transfers between Level 1 and Level 2 during the period ended June 30, 2014.
The Fund had securities that transferred from Level 2 to Level 1 of the fair value hierarchy as a result of foreign equities that were fair valued at December 31, 2013 that are now being valued based on quoted prices. The value of the securities that were transferred to Level 1 as of June 30, 2014 is $49,418,885.
See Notes to Financial Statements.
166
Table of Contents
(This page intentionally left blank)
167
Table of Contents
| STATEMENTS OF ASSETS AND LIABILITIES | June 30, 2014 (Unaudited) |
| Defensive Market | Equity Index | |||||||
| Strategies Fund | Fund | |||||||
| Assets |
||||||||
| Investments in securities of unaffiliated issuers, at value |
$ | 595,868,309 | $ | 397,507,704 | ||||
| Investments in securities of affiliated issuers, at value |
17,759,892 | 14,056,011 | ||||||
|
|
|
|
|
|||||
| Total investments(1)(2) |
613,628,201 | 411,563,715 | ||||||
| Cash |
718,450 | — | ||||||
| Cash collateral for derivatives |
856,000 | 537,000 | ||||||
| Deposits with broker for securities sold short |
5,263 | — | ||||||
| Foreign currency(3) |
42,834 | — | ||||||
| Receivables: |
||||||||
| Dividends and reclaims |
543,466 | 339,688 | ||||||
| Interest |
703,864 | — | ||||||
| Securities lending |
14,616 | 2,543 | ||||||
| Investment securities sold |
1,702,159 | 492,601 | ||||||
| Fund shares sold |
424,733 | 218,575 | ||||||
| Variation margin on financial futures contracts |
3,700 | 3,076 | ||||||
| Unrealized appreciation on foreign currency exchange contracts |
21 | — | ||||||
| Prepaid expenses and other assets |
9,617 | 15,378 | ||||||
|
|
|
|
|
|||||
| Total Assets |
618,652,924 | 413,172,576 | ||||||
|
|
|
|
|
|||||
| Liabilities |
||||||||
| Securities sold short, at value(4) |
— | — | ||||||
| Options written at value(5) |
195,590 | — | ||||||
| Unrealized depreciation on foreign currency exchange contracts |
47,086 | — | ||||||
| Collateral held for securities on loan at value |
75,859,414 | 29,596,320 | ||||||
| Collateral held for derivatives |
— | — | ||||||
| Payables: |
||||||||
| Investment securities purchased |
1,706,639 | 320,145 | ||||||
| Dividends on short sales |
— | — | ||||||
| Fund shares redeemed |
66,344 | 196,904 | ||||||
| Variation margin on financial futures contracts |
— | — | ||||||
| Securities lending |
3,213 | 559 | ||||||
| Deferred foreign capital gains taxes |
— | — | ||||||
| Accrued expenses: |
||||||||
| Investment advisory fees |
315,246 | 21,930 | ||||||
| Shareholder servicing fees |
86,659 | 58,131 | ||||||
| Other expenses |
108,605 | 115,355 | ||||||
|
|
|
|
|
|||||
| Total Liabilities |
78,388,796 | 30,309,344 | ||||||
|
|
|
|
|
|||||
| Net Assets |
$ | 540,264,128 | $ | 382,863,232 | ||||
|
|
|
|
|
|||||
| Net Assets Consist of: |
||||||||
| Paid-in-capital |
$ | 464,370,656 | $ | 235,043,844 | ||||
| Accumulated (distributions in excess of) net investment income (loss) |
57,890 | 79,802 | ||||||
| Undistributed (accumulated) net realized gain (loss) on investments, foreign currency translations and derivative transactions |
18,513,384 | (3,032,117 | ) | |||||
| Net unrealized appreciation (depreciation) on investments, foreign currency translations and derivative transactions |
57,322,198 | 150,771,703 | ||||||
|
|
|
|
|
|||||
| Net Assets |
$ | 540,264,128 | $ | 382,863,232 | ||||
|
|
|
|
|
|||||
| Net Asset Value: |
||||||||
| $0.001 par value, unlimited shares authorized |
||||||||
| Net assets applicable to the Institutional Class |
$ | 95,665,400 | $ | 86,714,731 | ||||
|
|
|
|
|
|||||
| Institutional shares outstanding |
7,940,262 | 9,740,303 | ||||||
|
|
|
|
|
|||||
| Net asset value, offering and redemption price per Institutional share |
$ | 12.05 | $ | 8.90 | ||||
|
|
|
|
|
|||||
| Net assets applicable to the Investor Class |
$ | 444,598,728 | $ | 296,148,501 | ||||
|
|
|
|
|
|||||
| Investor shares outstanding |
36,932,352 | 13,496,466 | ||||||
|
|
|
|
|
|||||
| Net asset value, offering and redemption price per Investor share |
$ | 12.04 | $ | 21.94 | ||||
|
|
|
|
|
|||||
|
(1) Investments in securities of unaffiliated issuers, at cost |
$ | 538,945,493 | $ | 246,948,687 | ||||
| Investments in securities of affiliated issuers, at cost |
17,759,892 | 14,056,011 | ||||||
|
|
|
|
|
|||||
| Total investments at cost |
$ | 556,705,385 | $ | 261,004,698 | ||||
|
|
|
|
|
|||||
|
(2) Includes securities loaned of: |
$ | 74,358,611 | $ | 29,037,846 | ||||
|
|
|
|
|
|||||
|
(3) Foreign currency at cost |
$ | 41,964 | $ | — | ||||
|
|
|
|
|
|||||
|
(4) Proceeds from securities sold short |
$ | — | $ | — | ||||
|
|
|
|
|
|||||
|
(5) Premiums received on options written |
$ | 442,029 | $ | — | ||||
|
|
|
|
|
|||||
|
(6) Net of $(651,235) accrued foreign capital gains taxes on appreciated securities |
||||||||
See Notes to Financial Statements.
168
Table of Contents
| Value Equity Fund |
Growth Equity Fund |
Small Cap Equity Fund |
International Equity Fund |
Emerging Markets Equity Fund |
||||||||||||||||
| $ | 1,543,184,563 | $ | 1,595,912,672 | $ | 731,726,903 | $ | 1,547,610,063 | $ | 330,876,213 | |||||||||||
| 38,257,778 | 66,683,471 | 26,216,178 | 69,625,310 | 8,243,411 | ||||||||||||||||
|
|
|
|
|
|
|
|
|
|
|
|||||||||||
| 1,581,442,341 | 1,662,596,143 | 757,943,081 | 1,617,235,373 | 339,119,624 | ||||||||||||||||
| — | — | 65,803 | 37,555 | 8,534,034 | ||||||||||||||||
| 1,651,875 | 3,054,000 | 1,133,000 | 14,966,056 | 1,963,000 | ||||||||||||||||
| — | — | — | 2,173,043 | — | ||||||||||||||||
| — | — | 3 | 5,889,745 | 4,526,869 | ||||||||||||||||
| 1,141,202 | 555,779 | 320,042 | 5,507,564 | 922,995 | ||||||||||||||||
| — | — | 24 | — | — | ||||||||||||||||
| 13,175 | 17,588 | 66,606 | 52,588 | 28,104 | ||||||||||||||||
| 28,591,583 | 3,025,097 | 5,584,620 | 2,096,582 | 153,317 | ||||||||||||||||
| 43,785 | 128,993 | 134,189 | 73,521 | 119,684 | ||||||||||||||||
| 8,080 | 14,120 | 184,260 | 1,170,378 | 76,871 | ||||||||||||||||
| — | — | — | 2,976,493 | 646,544 | ||||||||||||||||
| 22,665 | 24,218 | 17,071 | 23,732 | 23,122 | ||||||||||||||||
|
|
|
|
|
|
|
|
|
|
|
|||||||||||
| 1,612,914,706 | 1,669,415,938 | 765,448,699 | 1,652,202,630 | 356,114,164 | ||||||||||||||||
|
|
|
|
|
|
|
|
|
|
|
|||||||||||
| — | — | — | 96,880,005 | — | ||||||||||||||||
| — | — | — | — | — | ||||||||||||||||
| — | — | — | 2,142,193 | 833,292 | ||||||||||||||||
| 171,496,313 | 191,433,530 | 183,223,771 | 77,202,766 | 32,018,057 | ||||||||||||||||
| — | — | — | 1,650,000 | — | ||||||||||||||||
| 32,636,677 | 10,135,762 | 5,548,000 | 2,963,969 | 497,321 | ||||||||||||||||
| — | — | — | 116,869 | — | ||||||||||||||||
| 165,498 | 431 | 175,018 | 184,877 | — | ||||||||||||||||
| — | — | — | 193,685 | 317,945 | ||||||||||||||||
| 2,897 | 3,868 | 14,636 | 11,570 | 6,180 | ||||||||||||||||
| — | — | — | 3,396 | 674,327 | ||||||||||||||||
| 709,831 | 932,338 | 404,564 | 964,507 | 234,143 | ||||||||||||||||
| 221,990 | 238,180 | 93,786 | 234,856 | 52,852 | ||||||||||||||||
| 94,686 | 91,211 | 120,830 | 377,677 | 295,359 | ||||||||||||||||
|
|
|
|
|
|
|
|
|
|
|
|||||||||||
| 205,327,892 | 202,835,320 | 189,580,605 | 182,926,370 | 34,929,476 | ||||||||||||||||
|
|
|
|
|
|
|
|
|
|
|
|||||||||||
| $ | 1,407,586,814 | $ | 1,466,580,618 | $ | 575,868,094 | $ | 1,469,276,260 | $ | 321,184,688 | |||||||||||
|
|
|
|
|
|
|
|
|
|
|
|||||||||||
| $ | 1,026,295,642 | $ | 1,033,809,825 | $ | 451,210,624 | $ | 1,235,268,091 | $ | 306,377,017 | |||||||||||
| 173,583 | (2,222,351 | ) | 351,241 | 20,371,763 | 494,514 | |||||||||||||||
| 43,756,033 | 63,448,140 | 43,834,517 | (30,940,736 | ) | 4,857,536 | |||||||||||||||
| 337,361,556 | 371,545,004 | 80,471,712 | 244,577,142 | 9,455,621 | (6) | |||||||||||||||
|
|
|
|
|
|
|
|
|
|
|
|||||||||||
| $ | 1,407,586,814 | $ | 1,466,580,618 | $ | 575,868,094 | $ | 1,469,276,260 | $ | 321,184,688 | |||||||||||
|
|
|
|
|
|
|
|
|
|
|
|||||||||||
| $ | 275,698,810 | $ | 243,841,050 | $ | 92,682,043 | $ | 276,449,479 | $ | 50,571,007 | |||||||||||
|
|
|
|
|
|
|
|
|
|
|
|||||||||||
| 26,921,883 | 19,806,920 | 8,757,443 | 23,063,319 | 4,837,866 | ||||||||||||||||
|
|
|
|
|
|
|
|
|
|
|
|||||||||||
| $ | 10.24 | $ | 12.31 | $ | 10.58 | $ | 11.99 | $ | 10.45 | |||||||||||
|
|
|
|
|
|
|
|
|
|
|
|||||||||||
| $ | 1,131,888,004 | $ | 1,222,739,568 | $ | 483,186,051 | $ | 1,192,826,781 | $ | 270,613,681 | |||||||||||
|
|
|
|
|
|
|
|
|
|
|
|||||||||||
| 51,280,340 | 52,041,567 | 26,005,668 | 75,476,138 | 25,930,496 | ||||||||||||||||
|
|
|
|
|
|
|
|
|
|
|
|||||||||||
| $ | 22.07 | $ | 23.50 | $ | 18.58 | $ | 15.80 | $ | 10.44 | |||||||||||
|
|
|
|
|
|
|
|
|
|
|
|||||||||||
| $ | 1,206,205,909 | $ | 1,225,239,653 | $ | 651,929,206 | $ | 1,297,687,012 | $ | 320,425,563 | |||||||||||
| 38,257,778 | 66,683,471 | 26,216,178 | 69,625,310 | 8,243,411 | ||||||||||||||||
|
|
|
|
|
|
|
|
|
|
|
|||||||||||
| $ | 1,244,463,687 | $ | 1,291,923,124 | $ | 678,145,384 | $ | 1,367,312,322 | $ | 328,668,974 | |||||||||||
|
|
|
|
|
|
|
|
|
|
|
|||||||||||
| $ | 167,163,731 | $ | 188,089,507 | $ | 179,121,179 | $ | 78,616,108 | $ | 33,884,953 | |||||||||||
|
|
|
|
|
|
|
|
|
|
|
|||||||||||
| $ | — | $ | — | $ | 3 | $ | 5,827,990 | $ | 4,523,936 | |||||||||||
|
|
|
|
|
|
|
|
|
|
|
|||||||||||
| $ | — | $ | — | $ | — | $ | 90,481,970 | $ | — | |||||||||||
|
|
|
|
|
|
|
|
|
|
|
|||||||||||
| $ | — | $ | — | $ | — | $ | — | $ | — | |||||||||||
|
|
|
|
|
|
|
|
|
|
|
|||||||||||
See Notes to Financial Statements.
169
Table of Contents
| STATEMENTS OF OPERATIONS | For the Six Months Ended June 30, 2014 (Unaudited) |
| Defensive Market Strategies Fund |
Equity Index Fund |
|||||||
| Investment Income |
||||||||
| Dividends |
$ | 3,994,114 | $ | 3,448,586 | ||||
| Income distributions received from affiliated funds |
1,743 | 634 | ||||||
| Interest |
1,274,854 | — | ||||||
| Securities lending |
89,020 | 23,748 | ||||||
| Less foreign taxes withheld |
(21,313 | ) | (391 | ) | ||||
|
|
|
|
|
|||||
| Total Investment Income |
5,338,418 | 3,472,577 | ||||||
|
|
|
|
|
|||||
| Expenses |
||||||||
| Investment advisory fees |
1,880,098 | 272,534 | ||||||
| Transfer agent fees: |
||||||||
| Institutional shares |
1,878 | 1,861 | ||||||
| Investor shares |
9,633 | 12,408 | ||||||
| Custodian fees |
72,914 | 14,640 | ||||||
| Shareholder servicing fees: |
||||||||
| Investor shares |
498,273 | 345,177 | ||||||
| Accounting and administration fees |
85,325 | 49,756 | ||||||
| Professional fees |
33,459 | 33,115 | ||||||
| Blue sky fees: |
||||||||
| Institutional shares |
1,007 | 902 | ||||||
| Investor shares |
10,465 | 10,580 | ||||||
| Shareholder reporting fees: |
||||||||
| Institutional shares |
237 | 176 | ||||||
| Investor shares |
2,798 | 7,479 | ||||||
| Trustee expenses |
2,368 | 1,701 | ||||||
| Line of credit facility fees |
1,759 | 1,262 | ||||||
| Other expenses |
91,794 | 10,602 | ||||||
|
|
|
|
|
|||||
| Total expenses before dividends and interest on securities sold short |
2,692,008 | 762,193 | ||||||
| Dividends and interest on securities sold short |
112,856 | — | ||||||
| Expenses waived/reimbursed net of amount recaptured(1) |
173,959 | (139,322 | ) | |||||
| Fees paid indirectly |
(25,716 | ) | — | |||||
|
|
|
|
|
|||||
| Net expenses |
2,953,107 | 622,871 | ||||||
|
|
|
|
|
|||||
| Net Investment Income (Loss) |
2,385,311 | 2,849,706 | ||||||
|
|
|
|
|
|||||
| Realized and Unrealized Gain (Loss) |
||||||||
| Net realized gain (loss) from: |
||||||||
| Investment securities |
27,913,625 | 3,122,198 | ||||||
| Investment securities sold short |
(2,965,401 | ) | — | |||||
| Futures transactions |
1,619,128 | 1,050,719 | ||||||
| Swap agreements |
— | — | ||||||
| Option contracts written |
1,306,921 | — | ||||||
| Option contracts purchased |
(186,885 | ) | — | |||||
| Foreign currency transactions |
21,062 | — | ||||||
|
|
|
|
|
|||||
| Net realized gain |
27,708,450 | 4,172,917 | ||||||
|
|
|
|
|
|||||
| Net change in unrealized appreciation (depreciation) on: |
||||||||
| Investment securities (net of estimated capital gains taxes of $(651,235) for Emerging Markets Equity) |
2,035,830 | 17,777,204 | ||||||
| Investment securities sold short |
2,005,549 | — | ||||||
| Futures |
(641,176 | ) | (215,315 | ) | ||||
| Option contracts written |
216,998 | — | ||||||
| Option contracts purchased |
144,396 | — | ||||||
| Foreign currency translation |
(15,143 | ) | — | |||||
|
|
|
|
|
|||||
| Net change in unrealized appreciation |
3,746,454 | 17,561,889 | ||||||
|
|
|
|
|
|||||
| Net Realized and Unrealized Gain |
31,454,904 | 21,734,806 | ||||||
|
|
|
|
|
|||||
| Net Increase in Net Assets Resulting from Operations |
$ | 33,840,215 | $ | 24,584,512 | ||||
|
|
|
|
|
|||||
(1) See Note 3a and 3c in Notes to Financial Statements.
See Notes to Financial Statements.
170
Table of Contents
| Value Equity Fund |
Growth Equity Fund |
Small Cap Equity Fund |
International Equity Fund |
Emerging Markets Equity Fund |
||||||||||||||||
| $ | 14,035,635 | $ | 4,892,673 | $ | 2,567,372 | $ | 35,700,860 | $ | 4,146,385 | |||||||||||
| 1,958 | 2,975 | 1,062 | 3,379 | 675 | ||||||||||||||||
| — | — | 369,439 | — | — | ||||||||||||||||
| 113,120 | 141,504 | 427,044 | 657,448 | 112,297 | ||||||||||||||||
| (144,885 | ) | (45,043 | ) | (1,922 | ) | (2,685,705 | ) | (349,609 | ) | |||||||||||
|
|
|
|
|
|
|
|
|
|
|
|||||||||||
| 14,005,828 | 4,992,109 | 3,362,995 | 33,675,982 | 3,909,748 | ||||||||||||||||
|
|
|
|
|
|
|
|
|
|
|
|||||||||||
| 4,181,241 | 5,828,905 | 2,485,429 | 6,180,959 | 1,857,163 | ||||||||||||||||
| 1,948 | 1,922 | 1,966 | 1,967 | 1,847 | ||||||||||||||||
| 13,722 | 13,272 | 14,109 | 13,108 | 9,335 | ||||||||||||||||
| 33,643 | 40,808 | 70,792 | 301,131 | 330,892 | ||||||||||||||||
| 1,300,714 | 1,419,635 | 568,830 | 1,374,105 | 300,352 | ||||||||||||||||
| 147,035 | 154,127 | 112,470 | 303,057 | 72,012 | ||||||||||||||||
| 32,212 | 32,212 | 34,706 | 34,082 | 31,293 | ||||||||||||||||
| 902 | 900 | 900 | 901 | 7,229 | ||||||||||||||||
| 11,047 | 10,088 | 11,888 | 10,651 | 10,325 | ||||||||||||||||
| 306 | 273 | 377 | 392 | 148 | ||||||||||||||||
| 10,103 | 9,118 | 10,806 | 9,606 | 598 | ||||||||||||||||
| 6,399 | 6,778 | 2,723 | 6,755 | 1,399 | ||||||||||||||||
| 4,756 | 5,045 | 2,026 | 5,046 | 1,039 | ||||||||||||||||
| 29,808 | 20,153 | 14,093 | 295,772 | 63,340 | ||||||||||||||||
|
|
|
|
|
|
|
|
|
|
|
|||||||||||
| 5,773,836 | 7,543,236 | 3,331,115 | 8,537,532 | 2,686,972 | ||||||||||||||||
| — | — | — | 1,670,824 | — | ||||||||||||||||
| (47,044 | ) | (308,038 | ) | (55,691 | ) | (409,307 | ) | (516,185 | ) | |||||||||||
| (16,024 | ) | (23,694 | ) | (28,728 | ) | (13,940 | ) | — | ||||||||||||
|
|
|
|
|
|
|
|
|
|
|
|||||||||||
| 5,710,768 | 7,211,504 | 3,246,696 | 9,785,109 | 2,170,787 | ||||||||||||||||
|
|
|
|
|
|
|
|
|
|
|
|||||||||||
| 8,295,060 | (2,219,395 | ) | 116,299 | 23,890,873 | 1,738,961 | |||||||||||||||
|
|
|
|
|
|
|
|
|
|
|
|||||||||||
| 72,941,707 | 69,746,657 | 33,173,090 | 46,808,511 | 2,585,225 | ||||||||||||||||
| — | — | — | (8,839,702 | ) | — | |||||||||||||||
| 3,733,916 | 6,070,920 | 4,771,598 | 1,749,054 | 2,294,247 | ||||||||||||||||
| — | — | — | — | (339,446 | ) | |||||||||||||||
| — | — | 12,505 | — | — | ||||||||||||||||
| — | — | (23,934 | ) | — | — | |||||||||||||||
| — | (5,644 | ) | (6,520 | ) | 1,271,553 | 888,550 | ||||||||||||||
|
|
|
|
|
|
|
|
|
|
|
|||||||||||
| 76,675,623 | 75,811,933 | 37,926,739 | 40,989,416 | 5,428,576 | ||||||||||||||||
|
|
|
|
|
|
|
|
|
|
|
|||||||||||
| 2,710,782 | (22,017,624 | ) | (22,555,184 | ) | (15,037,432 | ) | 15,902,575 | |||||||||||||
| — | — | — | 4,915,782 | — | ||||||||||||||||
| (1,408,191 | ) | (1,480,188 | ) | (3,687,772 | ) | (3,649,325 | ) | (1,098,716 | ) | |||||||||||
| — | — | 1,839 | — | — | ||||||||||||||||
| — | — | 954 | — | — | ||||||||||||||||
| — | — | (5,555 | ) | 1,462,025 | (218,646 | ) | ||||||||||||||
|
|
|
|
|
|
|
|
|
|
|
|||||||||||
| 1,302,591 | (23,497,812 | ) | (26,245,718 | ) | (12,308,950 | ) | 14,585,213 | |||||||||||||
|
|
|
|
|
|
|
|
|
|
|
|||||||||||
| 77,978,214 | 52,314,121 | 11,681,021 | 28,680,466 | 20,013,789 | ||||||||||||||||
|
|
|
|
|
|
|
|
|
|
|
|||||||||||
| $ | 86,273,274 | $ | 50,094,726 | $ | 11,797,320 | $ | 52,571,339 | $ | 21,752,750 | |||||||||||
|
|
|
|
|
|
|
|
|
|
|
|||||||||||
See Notes to Financial Statements.
171
Table of Contents
STATEMENTS OF CHANGES IN NET ASSETS
| Defensive Market Strategies Fund | ||||||||
| For the Six Months Ended 06/30/14 |
For the Year Ended 12/31/13 |
|||||||
| (Unaudited) | ||||||||
| Operations: |
||||||||
| Net investment income |
$ | 2,385,311 | $ | 4,705,867 | ||||
| Net realized gain on investment securities, foreign currency transactions and derivative transactions |
27,708,450 | 38,163,236 | ||||||
| Net change in unrealized appreciation (depreciation) on investment securities, foreign currency translations and derivative transactions |
3,746,454 | 31,726,828 | ||||||
|
|
|
|
|
|||||
| Net increase in net assets resulting from operations |
33,840,215 | 74,595,931 | ||||||
|
|
|
|
|
|||||
| Dividends and Distributions to Shareholders: |
||||||||
| Dividends from net investment income |
||||||||
| Institutional shares |
(434,894 | ) | (1,173,699 | ) | ||||
| Investor shares |
(1,663,665 | ) | (4,069,569 | ) | ||||
| Distributions from net realized capital gains |
||||||||
| Institutional shares |
(907,400 | ) | (7,059,195 | ) | ||||
| Investor shares |
(4,207,804 | ) | (30,890,202 | ) | ||||
|
|
|
|
|
|||||
| Total dividends and distributions |
(7,213,763 | ) | (43,192,665 | ) | ||||
|
|
|
|
|
|||||
| Capital Share Transactions: |
||||||||
| Proceeds from shares sold |
||||||||
| Institutional shares |
6,353,590 | 7,592,070 | ||||||
| Investor shares |
37,354,844 | 74,050,825 | ||||||
| Reinvestment of dividends and distributions |
||||||||
| Institutional shares |
1,340,829 | 8,223,321 | ||||||
| Investor shares |
5,870,805 | 34,959,748 | ||||||
|
|
|
|
|
|||||
| Total proceeds from shares sold and reinvested |
50,920,068 | 124,825,964 | ||||||
|
|
|
|
|
|||||
| Value of shares redeemed |
||||||||
| Institutional shares |
(6,151,345 | ) | (18,746,972 | ) | ||||
| Investor shares |
(15,838,057 | ) | (52,760,180 | ) | ||||
|
|
|
|
|
|||||
| Total value of shares redeemed |
(21,989,402 | ) | (71,507,152 | ) | ||||
|
|
|
|
|
|||||
| Net increase (decrease) from capital share transactions(1) |
28,930,666 | 53,318,812 | ||||||
|
|
|
|
|
|||||
| Total increase in net assets |
55,557,118 | 84,722,078 | ||||||
|
|
|
|
|
|||||
| Net Assets: |
||||||||
| Beginning of Period |
484,707,010 | 399,984,932 | ||||||
|
|
|
|
|
|||||
| End of Period* |
$ | 540,264,128 | $ | 484,707,010 | ||||
|
|
|
|
|
|||||
| *Including undistributed net investment income |
$ | 57,890 | $ | (228,862 | ) | |||
|
|
|
|
|
|||||
| (1) | See Note 6 in Notes to Financial Statements. |
See Notes to Financial Statements.
172
Table of Contents
| Equity Index Fund | Value Equity Fund | |||||||||||||||
| For the Six Months Ended 06/30/14 |
For the Year Ended 12/31/13 |
For the Six Months Ended 06/30/14 |
For the Year Ended 12/31/13 |
|||||||||||||
| (Unaudited) | (Unaudited) | |||||||||||||||
| $ | 2,849,706 | $ | 5,140,974 | $ | 8,295,060 | $ | 17,980,537 | |||||||||
| 4,172,917 | 6,248,500 | 76,675,623 | 145,880,242 | |||||||||||||
| 17,561,889 | 72,374,800 | 1,302,591 | 219,682,889 | |||||||||||||
|
|
|
|
|
|
|
|
|
|||||||||
| 24,584,512 | 83,764,274 | 86,273,274 | 383,543,668 | |||||||||||||
|
|
|
|
|
|
|
|
|
|||||||||
| (1,273,378 | ) | (1,910,992 | ) | (3,274,501 | ) | (9,104,181 | ) | |||||||||
| (1,561,414 | ) | (3,169,798 | ) | (5,093,196 | ) | (16,327,168 | ) | |||||||||
| (600,021 | ) | (1,874,438 | ) | (5,093,669 | ) | (12,958,074 | ) | |||||||||
| (844,022 | ) | (3,460,464 | ) | (9,851,199 | ) | (27,109,606 | ) | |||||||||
|
|
|
|
|
|
|
|
|
|||||||||
| (4,278,835 | ) | (10,415,692 | ) | (23,312,565 | ) | (65,499,029 | ) | |||||||||
|
|
|
|
|
|
|
|
|
|||||||||
| 17,317,795 | 8,865,349 | 19,183,331 | 23,449,413 | |||||||||||||
| 18,654,003 | 42,055,015 | 29,097,562 | 82,826,039 | |||||||||||||
| 1,871,680 | 3,781,445 | 8,361,170 | 22,042,894 | |||||||||||||
| 2,405,422 | 6,630,100 | 14,941,879 | 43,431,117 | |||||||||||||
|
|
|
|
|
|
|
|
|
|||||||||
| 40,248,900 | 61,331,909 | 71,583,942 | 171,749,463 | |||||||||||||
|
|
|
|
|
|
|
|
|
|||||||||
| (2,118,953 | ) | (5,225,280 | ) | (14,159,277 | ) | (58,523,134 | ) | |||||||||
| (31,887,350 | ) | (28,402,934 | ) | (55,813,191 | ) | (236,877,855 | ) | |||||||||
|
|
|
|
|
|
|
|
|
|||||||||
| (34,006,303 | ) | (33,628,214 | ) | (69,972,468 | ) | (295,400,989 | ) | |||||||||
|
|
|
|
|
|
|
|
|
|||||||||
| 6,242,597 | 27,703,695 | 1,611,474 | (123,651,526 | ) | ||||||||||||
|
|
|
|
|
|
|
|
|
|||||||||
| 26,548,274 | 101,052,277 | 64,572,183 | 194,393,113 | |||||||||||||
|
|
|
|
|
|
|
|
|
|||||||||
| 356,314,958 | 255,262,681 | 1,343,014,631 | 1,148,621,518 | |||||||||||||
|
|
|
|
|
|
|
|
|
|||||||||
| $ | 382,863,232 | $ | 356,314,958 | $ | 1,407,586,814 | $ | 1,343,014,631 | |||||||||
|
|
|
|
|
|
|
|
|
|||||||||
| $ | 79,802 | $ | 64,888 | $ | 173,583 | $ | 246,220 | |||||||||
|
|
|
|
|
|
|
|
|
|||||||||
See Notes to Financial Statements.
173
Table of Contents
| Growth Equity Fund | ||||||||
| For the Six Months Ended 06/30/14 |
For the Year Ended 12/31/13 |
|||||||
| (Unaudited) | ||||||||
| Operations: |
||||||||
| Net investment income (loss) |
$ | (2,219,395 | ) | $ | (2,466,606 | ) | ||
| Net realized gain (loss) on investment securities, foreign currency transactions and derivative transactions |
75,811,933 | 250,816,707 | ||||||
| Net change in unrealized appreciation (depreciation) on investment securities, foreign currency translations and derivative transactions |
(23,497,812 | ) | 143,263,745 | |||||
|
|
|
|
|
|||||
| Net increase (decrease) in net assets resulting from operations |
50,094,726 | 391,613,846 | ||||||
|
|
|
|
|
|||||
| Dividends and Distributions to Shareholders: |
||||||||
| Dividends from net investment income |
||||||||
| Institutional shares |
— | — | ||||||
| Investor shares |
(2,956 | ) | — | |||||
| Distributions from net realized capital gains |
||||||||
| Institutional shares |
(6,284,330 | ) | (59,354,927 | ) | ||||
| Investor shares |
(16,712,836 | ) | (184,064,261 | ) | ||||
|
|
|
|
|
|||||
| Total dividends and distributions |
(23,000,122 | ) | (243,419,188 | ) | ||||
|
|
|
|
|
|||||
| Capital Share Transactions: |
||||||||
| Proceeds from shares sold |
||||||||
| Institutional shares |
19,176,502 | 16,158,120 | ||||||
| Investor shares |
53,661,646 | 57,212,428 | ||||||
| Reinvestment of dividends and distributions |
||||||||
| Institutional shares |
6,281,118 | 59,313,648 | ||||||
| Investor shares |
16,714,617 | 184,053,788 | ||||||
|
|
|
|
|
|||||
| Total proceeds from shares sold and reinvested |
95,833,883 | 316,737,984 | ||||||
|
|
|
|
|
|||||
| Value of shares redeemed |
||||||||
| Institutional shares |
(11,719,675 | ) | (51,027,934 | ) | ||||
| Investor shares |
(63,272,039 | ) | (216,524,263 | ) | ||||
|
|
|
|
|
|||||
| Total value of shares redeemed |
(74,991,714 | ) | (267,552,197 | ) | ||||
|
|
|
|
|
|||||
| Net increase (decrease) from capital share transactions(2) |
20,842,169 | 49,185,787 | ||||||
|
|
|
|
|
|||||
| Total increase (decrease) in net assets |
47,936,773 | 197,380,445 | ||||||
|
|
|
|
|
|||||
| Net Assets: |
||||||||
| Beginning of Period |
1,418,643,845 | 1,221,263,400 | ||||||
|
|
|
|
|
|||||
| End of Period* |
$ | 1,466,580,618 | $ | 1,418,643,845 | ||||
|
|
|
|
|
|||||
| *Including undistributed (distributions in excess of) net investment income |
$ | (2,222,351 | ) | $ | — | |||
|
|
|
|
|
|||||
| (1) | Inception Date for the Emerging Markets Equity Fund was October 31, 2013. |
| (2) | See Note 6 in Notes to Financial Statements. |
See Notes to Financial Statements.
174
Table of Contents
| Small Cap Equity Fund | International Equity Fund | Emerging Markets Equity Fund | ||||||||||||||||||||||
| For the Six Months Ended 06/30/14 |
For the
Year Ended 12/31/13 |
For the
Six Months Ended 06/30/14 |
For the
Year Ended 12/31/13 |
For the
Six Months Ended 06/30/14 |
For the Period 10/31/13(1)-12/31/13 |
|||||||||||||||||||
| (Unaudited) | (Unaudited) | (Unaudited) | ||||||||||||||||||||||
| $ | 116,299 | $ | 1,303,539 | $ | 23,890,873 | $ | 22,034,086 | $ | 1,738,961 | $ | (255,400 | ) | ||||||||||||
| 37,926,739 | 107,941,603 | 40,989,416 | 94,811,477 | 5,428,576 | (1,814,887 | ) | ||||||||||||||||||
| (26,245,718 | ) | 55,420,545 | (12,308,950 | ) | 138,069,814 | 14,585,213 | (5,129,592 | ) | ||||||||||||||||
|
|
|
|
|
|
|
|
|
|
|
|
|
|||||||||||||
| 11,797,320 | 164,665,687 | 52,571,339 | 254,915,377 | 21,752,750 | (7,199,879 | ) | ||||||||||||||||||
|
|
|
|
|
|
|
|
|
|
|
|
|
|||||||||||||
| — | (680,686 | ) | — | (5,710,188 | ) | — | — | |||||||||||||||||
| (3,234 | ) | (1,183,448 | ) | — | (15,633,737 | ) | — | — | ||||||||||||||||
| — | (21,979,674 | ) | — | — | — | — | ||||||||||||||||||
| — | (82,693,531 | ) | — | — | — | — | ||||||||||||||||||
|
|
|
|
|
|
|
|
|
|
|
|
|
|||||||||||||
| (3,234 | ) | (106,537,339 | ) | — | (21,343,925 | ) | — | — | ||||||||||||||||
|
|
|
|
|
|
|
|
|
|
|
|
|
|||||||||||||
| 11,272,747 | 8,015,941 | 15,482,667 | 26,480,523 | 4,513,195 | 47,632,875 | |||||||||||||||||||
| 26,577,459 | 58,431,827 | 39,870,074 | 116,146,641 | 21,205,415 | 250,401,654 | |||||||||||||||||||
| — | 22,649,010 | — | 5,708,234 | — | — | |||||||||||||||||||
| 3,234 | 83,870,624 | — | 15,631,209 | — | — | |||||||||||||||||||
|
|
|
|
|
|
|
|
|
|
|
|
|
|||||||||||||
| 37,853,440 | 172,967,402 | 55,352,741 | 163,966,607 | 25,718,610 | 298,034,529 | |||||||||||||||||||
|
|
|
|
|
|
|
|
|
|
|
|
|
|||||||||||||
| (4,963,208 | ) | (16,576,386 | ) | (18,284,530 | ) | (75,614,406 | ) | (3,832,822 | ) | (64,000 | ) | |||||||||||||
| (43,661,055 | ) | (84,498,033 | ) | (37,044,167 | ) | (331,679,243 | ) | (13,054,938 | ) | (169,562 | ) | |||||||||||||
|
|
|
|
|
|
|
|
|
|
|
|
|
|||||||||||||
| (48,624,263 | ) | (101,074,419 | ) | (55,328,697 | ) | (407,293,649 | ) | (16,887,760 | ) | (233,562 | ) | |||||||||||||
|
|
|
|
|
|
|
|
|
|
|
|
|
|||||||||||||
| (10,770,823 | ) | 71,892,983 | 24,044 | (243,327,042 | ) | 8,830,850 | 297,800,967 | |||||||||||||||||
|
|
|
|
|
|
|
|
|
|
|
|
|
|||||||||||||
| 1,023,263 | 130,021,331 | 52,595,383 | (9,755,590 | ) | 30,583,600 | 290,601,088 | ||||||||||||||||||
|
|
|
|
|
|
|
|
|
|
|
|
|
|||||||||||||
| 574,844,831 | 444,823,500 | 1,416,680,877 | 1,426,436,467 | 290,601,088 | — | |||||||||||||||||||
|
|
|
|
|
|
|
|
|
|
|
|
|
|||||||||||||
| $ | 575,868,094 | $ | 574,844,831 | $ | 1,469,276,260 | $ | 1,416,680,877 | $ | 321,184,688 | $ | 290,601,088 | |||||||||||||
|
|
|
|
|
|
|
|
|
|
|
|
|
|||||||||||||
| $ | 351,241 | $ | 238,176 | $ | 20,371,763 | $ | (3,519,110 | ) | $ | 494,514 | $ | (1,244,447 | ) | |||||||||||
|
|
|
|
|
|
|
|
|
|
|
|
|
|||||||||||||
See Notes to Financial Statements.
175
Table of Contents
FINANCIAL HIGHLIGHTS (Unaudited)
| For a Share Outstanding For the Years Ending December 31, unless otherwise indicated | Ratios to Average Net Assets | |||||||||||||||||||||||||||||||||||||||||||||||
| Net
Asset Value, Beginning of Period |
Net
Investment Income |
Realized and Unrealized Gain (Loss) on Investments |
Dividends from Net Investment Income |
Distributions from Net Realized Capital Gains |
Net
Asset Value, End of Period |
Total Return |
Net Assets, End of Period (000) |
Expenses, Net(1) |
Expenses, Gross(2) |
Investment Income/ (Loss), Net(1) |
Portfolio Turnover Rate |
|||||||||||||||||||||||||||||||||||||
| Defensive Market Strategies Fund |
|
|||||||||||||||||||||||||||||||||||||||||||||||
| Institutional Class |
|
|||||||||||||||||||||||||||||||||||||||||||||||
| 2014(3) |
$ | 11.43 | $ | 0.06 | # | $ | 0.74 | $ | (0.06 | ) | $ | (0.12 | ) | $ | 12.05 | 6.92 | % | $ | 95,665 | 1.02 | %(4) | 0.91 | %(4) | 1.09 | % | 71 | % | |||||||||||||||||||||
| 2013(5) |
10.61 | 0.14 | # | 1.80 | (6) | (0.15 | ) | (0.97 | ) | 11.43 | 18.47 | 89,430 | 1.10 | (4) | 1.13 | (4) | 1.25 | 208 | ||||||||||||||||||||||||||||||
| 2012 |
10.20 | 0.18 | # | 0.73 | (6) | (0.18 | ) | (0.32 | ) | 10.61 | 8.93 | 85,347 | 1.04 | (4) | 1.12 | (4) | 1.67 | 304 | ||||||||||||||||||||||||||||||
| 2011(7) |
10.00 | 0.04 | # | 0.21 | (6) | (0.04 | ) | (0.01 | ) | 10.20 | 2.51 | 74,516 | 1.03 | (4) | 1.10 | (4) | 1.11 | 120 | ||||||||||||||||||||||||||||||
| Investor Class |
|
|||||||||||||||||||||||||||||||||||||||||||||||
| 2014(3) |
$ | 11.42 | $ | 0.05 | # | $ | 0.74 | $ | (0.05 | ) | $ | (0.12 | ) | $ | 12.04 | 6.84 | % | $ | 444,599 | 1.20 | %(4) | 1.15 | %(4) | 0.91 | % | 71 | % | |||||||||||||||||||||
| 2013(5) |
10.60 | 0.12 | # | 1.79 | (6) | (0.12 | ) | (0.97 | ) | 11.42 | 18.22 | 395,277 | 1.36 | (4) | 1.38 | (4) | 0.99 | 208 | ||||||||||||||||||||||||||||||
| 2012 |
10.20 | 0.15 | # | 0.72 | (6) | (0.15 | ) | (0.32 | ) | 10.60 | 8.57 | 314,638 | 1.30 | (4) | 1.37 | (4) | 1.42 | 304 | ||||||||||||||||||||||||||||||
| 2011(7) |
10.00 | 0.03 | # | 0.21 | (6) | (0.03 | ) | (0.01 | ) | 10.20 | 2.43 | 240,529 | 1.29 | (4) | 1.35 | (4) | 0.86 | 120 | ||||||||||||||||||||||||||||||
| Equity Index Fund |
|
|||||||||||||||||||||||||||||||||||||||||||||||
| Institutional Class |
|
|||||||||||||||||||||||||||||||||||||||||||||||
| 2014(3) |
$ | 8.50 | $ | 0.07 | # | $ | 0.52 | $ | (0.13 | ) | $ | (0.06 | ) | $ | 8.90 | 7.02 | % | $ | 86,715 | 0.21 | % | 0.22 | % | 1.72 | % | 3 | % | |||||||||||||||||||||
| 2013(8) |
6.85 | 0.14 | # | 2.02 | (6) | (0.26 | ) | (0.25 | ) | 8.50 | 32.04 | 66,378 | 0.23 | 0.24 | 1.81 | 4 | ||||||||||||||||||||||||||||||||
| 2012 |
6.29 | 0.13 | # | 0.86 | (6) | (0.25 | ) | (0.18 | ) | 6.85 | 15.92 | 47,071 | 0.23 | 0.24 | 1.95 | 3 | ||||||||||||||||||||||||||||||||
| 2011 |
8.63 | 0.15 | # | 0.04 | (6) | (0.31 | ) | (2.22 | ) | 6.29 | 3.00 | 36,721 | 0.23 | 0.24 | 1.71 | 4 | ||||||||||||||||||||||||||||||||
| 2010 |
7.77 | 0.14 | # | 0.97 | (0.25 | ) | — | 8.63 | 14.57 | 71,093 | 0.22 | 0.22 | 1.77 | 5 | ||||||||||||||||||||||||||||||||||
| 2009 |
6.36 | 0.14 | # | 1.49 | (0.22 | ) | — | 7.77 | 26.38 | 65,217 | 0.22 | 0.24 | 2.05 | 4 | ||||||||||||||||||||||||||||||||||
| Investor Class |
|
|||||||||||||||||||||||||||||||||||||||||||||||
| 2014(3) |
$ | 20.69 | $ | 0.16 | # | $ | 1.27 | $ | (0.12 | ) | $ | (0.06 | ) | $ | 21.94 | 6.91 | % | $ | 296,149 | 0.38 | % | 0.47 | % | 1.56 | % | 3 | % | |||||||||||||||||||||
| 2013(8) |
16.07 | 0.31 | # | 4.79 | (6) | (0.23 | ) | (0.25 | ) | 20.69 | 31.95 | 289,937 | 0.38 | 0.48 | 1.66 | 4 | ||||||||||||||||||||||||||||||||
| 2012 |
14.24 | 0.28 | # | 1.95 | (6) | (0.22 | ) | (0.18 | ) | 16.07 | 15.76 | 208,192 | 0.38 | 0.49 | 1.79 | 3 | ||||||||||||||||||||||||||||||||
| 2011 |
16.36 | 0.26 | # | 0.12 | (6) | (0.28 | ) | (2.22 | ) | 14.24 | 2.75 | 183,076 | 0.38 | 0.47 | 1.57 | 4 | ||||||||||||||||||||||||||||||||
| 2010 |
14.51 | 0.24 | # | 1.84 | (0.23 | ) | — | 16.36 | 14.45 | 335,859 | 0.37 | 0.41 | 1.60 | 5 | ||||||||||||||||||||||||||||||||||
| 2009 |
11.70 | 0.24 | # | 2.77 | (0.20 | ) | — | 14.51 | 26.14 | 321,486 | 0.37 | 0.43 | 1.90 | 4 | ||||||||||||||||||||||||||||||||||
| # | Calculated using the average shares outstanding method. |
| (1) | The ratio includes expenses waived/reimbursed net of amount recaptured and fees paid indirectly, where applicable; if expenses waived/reimbursed net of amount recaptured and fees paid indirectly were excluded, the ratio would have been higher (lower) than the ratio shown. |
| (2) | The ratio excludes expenses waived/reimbursed net of amount recaptured and fees paid indirectly, where applicable; if expenses waived/reimbursed net of amount recaptured and fees paid indirectly were included, the ratio would have been lower than the ratio shown. |
| (3) | For the six months ended June 30, 2014. All ratios for the period have been annualized. Total return and portfolio turnover for the period have not been annualized. |
| (4) | The ratio for the Defensive Market Strategies Fund includes the effect of dividend expense on securities sold short which increased the ratio by 0.04%, 0.05%, 0.11% and 0.04% for the years 2011, 2012, 2013 and the six months ended June 30, 2014 respectively. |
| (5) | An out of period adjustment to Investment Income increased Net Investment Income per Share by $0.00 and $0.01, the Total Return did not change, and the Ratio of Net Investment Income to Average Net Assets increased by 0.01% and 0.00% for Institutional Class and Investor Class, respectively. |
| (6) | Amount includes Capital Gains distributions received by the Fund from the GuideStone Money Market Fund. The amount of these distributions represents less than $0.005 per share. |
| (7) | Inception date was September 1, 2011. All ratios for the period have been annualized. Total return and portfolio turnover for the period have not been annualized. |
| (8) | An out of period adjustment to Investment Income increased Net Investment Income per Share by $0.00 and $0.01, the Total Return did not change, and the Ratio of Net Investment Income to Average Net Assets increased by 0.03% and 0.03% for Institutional Class and Investor Class, respectively. |
See Notes to Financial Statements.
176
Table of Contents
| For a Share Outstanding For the Years Ending December 31, unless otherwise indicated | Ratios to Average Net Assets | |||||||||||||||||||||||||||||||||||||||||||||||
| Net
Asset Value, Beginning of Period |
Net Investment Income/ (Loss) |
Realized and Unrealized Gain (Loss) on Investments |
Dividends from Net Investment Income |
Distributions from Net Realized Capital Gains |
Net
Asset Value, End of Period |
Total Return |
Net
Assets, End of Period (000) |
Expenses, Net(1) |
Expenses, Gross(2) |
Investment Income/ (Loss), Net(1) |
Portfolio Turnover Rate |
|||||||||||||||||||||||||||||||||||||
| Value Equity Fund |
|
|||||||||||||||||||||||||||||||||||||||||||||||
| Institutional Class |
|
|||||||||||||||||||||||||||||||||||||||||||||||
| 2014(3) |
$ | 9.90 | $ | 0.07 | # | $ | 0.59 | $ | (0.13 | ) | $ | (0.19 | ) | $ | 10.24 | 6.65 | % | $ | 275,699 | 0.66 | % | 0.67 | % | 1.44 | % | 25 | % | |||||||||||||||||||||
| 2013(4) |
7.99 | 0.15 | # | 2.64 | (5) | (0.34 | ) | (0.54 | ) | 9.90 | 35.52 | 253,988 | 0.66 | 0.67 | 1.61 | 45 | ||||||||||||||||||||||||||||||||
| 2012 |
7.03 | 0.15 | # | 1.06 | (5) | (0.25 | ) | — | 7.99 | 17.47 | 215,512 | 0.67 | 0.68 | 1.90 | 27 | |||||||||||||||||||||||||||||||||
| 2011 |
7.18 | 0.12 | # | (0.07 | )(5) | (0.20 | ) | — | 7.03 | 0.57 | 200,308 | 0.67 | 0.68 | 1.62 | 35 | |||||||||||||||||||||||||||||||||
| 2010 |
6.46 | 0.10 | # | 0.78 | (0.16 | ) | — | 7.18 | 14.01 | 231,079 | 0.67 | 0.68 | 1.52 | 36 | ||||||||||||||||||||||||||||||||||
| 2009 |
5.52 | 0.11 | # | 1.02 | (0.19 | ) | — | 6.46 | 21.35 | 181,123 | 0.68 | 0.69 | 2.06 | 32 | ||||||||||||||||||||||||||||||||||
| Investor Class |
|
|||||||||||||||||||||||||||||||||||||||||||||||
| 2014(3) |
$ | 21.00 | $ | 0.13 | # | $ | 1.23 | $ | (0.10 | ) | (0.19 | ) | $ | 22.07 | 6.49 | % | $ | 1,131,888 | 0.90 | % | 0.91 | % | 1.20 | % | 25 | % | ||||||||||||||||||||||
| 2013(4) |
16.18 | 0.26 | # | 5.39 | (5) | (0.29 | ) | (0.54 | ) | 21.00 | 35.22 | 1,089,026 | 0.90 | 0.91 | 1.36 | 45 | ||||||||||||||||||||||||||||||||
| 2012 |
14.00 | 0.25 | # | 2.14 | (5) | (0.21 | ) | — | 16.18 | 17.20 | 933,110 | 0.92 | 0.92 | 1.66 | 27 | |||||||||||||||||||||||||||||||||
| 2011 |
14.12 | 0.20 | # | (0.16 | )(5) | (0.16 | ) | — | 14.00 | 0.27 | 852,958 | 0.89 | 0.91 | 1.39 | 35 | |||||||||||||||||||||||||||||||||
| 2010 |
12.54 | 0.17 | # | 1.56 | (0.15 | ) | — | 14.12 | 13.96 | 958,211 | 0.85 | 0.87 | 1.35 | 36 | ||||||||||||||||||||||||||||||||||
| 2009 |
10.53 | 0.20 | # | 1.98 | (0.17 | ) | — | 12.54 | 21.16 | 1,001,814 | 0.84 | 0.88 | 1.89 | 32 | ||||||||||||||||||||||||||||||||||
| Growth Equity Fund |
|
|||||||||||||||||||||||||||||||||||||||||||||||
| Institutional Class |
|
|||||||||||||||||||||||||||||||||||||||||||||||
| 2014(3) |
$ | 12.20 | $ | (0.01 | )# | $ | 0.45 | $ | — | $ | (0.33 | ) | $ | 12.31 | 3.58 | % | $ | 243,841 | 0.85 | % | 0.87 | % | (0.15 | )% | 26 | % | ||||||||||||||||||||||
| 2013(6) |
12.19 | — | †# | 4.12 | (5) | — | (4.11 | ) | 12.20 | 34.83 | 227,934 | 0.84 | 0.88 | 0.00 | 83 | |||||||||||||||||||||||||||||||||
| 2012 |
11.76 | 0.04 | # | 2.00 | (5) | (0.06 | ) | (1.55 | ) | 12.19 | 17.39 | 198,329 | 0.87 | 0.89 | 0.33 | 67 | ||||||||||||||||||||||||||||||||
| 2011 |
11.91 | — | †# | (0.15 | )(5) | — | — | 11.76 | (1.26 | ) | 184,418 | 0.87 | 0.89 | 0.02 | 60 | |||||||||||||||||||||||||||||||||
| 2010 |
10.00 | — | † | 1.91 | — | † | — | 11.91 | 19.13 | 215,863 | 0.87 | 0.89 | 0.06 | 63 | ||||||||||||||||||||||||||||||||||
| 2009 |
7.26 | 0.02 | 2.74 | (0.02 | ) | — | 10.00 | 38.14 | 196,026 | 0.87 | 0.89 | 0.22 | 78 | |||||||||||||||||||||||||||||||||||
| Investor Class |
|
|||||||||||||||||||||||||||||||||||||||||||||||
| 2014(3) |
$ | 23.02 | $ | (0.04 | )# | $ | 0.85 | $ | — | $ | (0.33 | ) | $ | 23.50 | 3.51 | % | $ | 1,222,740 | 1.06 | % | 1.11 | % | (0.35 | )% | 26 | % | ||||||||||||||||||||||
| 2013(6) |
20.26 | 0.05 | # | 6.92 | (5) | — | (4.11 | ) | 23.02 | 34.52 | 1,190,710 | 1.05 | 1.12 | (0.22 | ) | 83 | ||||||||||||||||||||||||||||||||
| 2012 |
18.63 | 0.03 | # | 3.17 | (5) | (0.02 | ) | (1.55 | ) | 20.26 | 17.21 | 1,022,934 | 1.05 | 1.13 | 0.15 | 67 | ||||||||||||||||||||||||||||||||
| 2011 |
18.90 | (0.02 | )# | (0.25 | )(5) | — | — | 18.63 | (1.43 | ) | 915,960 | 1.02 | 1.11 | (0.13 | ) | 60 | ||||||||||||||||||||||||||||||||
| 2010 |
15.88 | (0.01 | ) | 3.03 | — | † | — | 18.90 | 19.03 | 1,044,060 | 0.97 | 1.08 | (0.04 | ) | 63 | |||||||||||||||||||||||||||||||||
| 2009 |
11.52 | 0.01 | 4.36 | (0.01 | ) | — | 15.88 | 37.99 | 1,067,654 | 0.96 | 1.09 | 0.13 | 78 | |||||||||||||||||||||||||||||||||||
| Small Cap Equity Fund |
|
|||||||||||||||||||||||||||||||||||||||||||||||
| Institutional Class |
|
|||||||||||||||||||||||||||||||||||||||||||||||
| 2014(3) |
$ | 10.35 | $ | 0.01 | # | $ | 0.22 | $ | — | $ | — | $ | 10.58 | 2.22 | % | $ | 92,682 | 0.97 | % | 0.99 | % | 0.25 | % | 67 | % | |||||||||||||||||||||||
| 2013(7) |
10.27 | 0.06 | # | 3.82 | (5) | (0.08 | ) | (3.72 | ) | 10.35 | 38.39 | 84,139 | 0.92 | 0.94 | 0.45 | 161 | ||||||||||||||||||||||||||||||||
| 2012 |
9.70 | 0.08 | # | 1.40 | (5) | (0.13 | ) | (0.78 | ) | 10.27 | 15.25 | 67,723 | 0.99 | 1.02 | 0.79 | 128 | ||||||||||||||||||||||||||||||||
| 2011 |
9.61 | 0.03 | # | 0.11 | (5) | (0.05 | ) | — | 9.70 | 1.40 | 63,903 | 1.00 | 1.03 | 0.27 | 165 | |||||||||||||||||||||||||||||||||
| 2010 |
7.57 | 0.03 | # | 2.06 | (0.05 | ) | — | 9.61 | 27.64 | 74,424 | 1.00 | 1.02 | 0.42 | 177 | ||||||||||||||||||||||||||||||||||
| 2009 |
5.94 | 0.03 | # | 1.64 | (0.04 | ) | — | 7.57 | 28.12 | 64,033 | 1.03 | 1.05 | 0.44 | 130 | ||||||||||||||||||||||||||||||||||
| Investor Class |
|
|||||||||||||||||||||||||||||||||||||||||||||||
| 2014(3) |
$ | 18.19 | $ | — | # | $ | 0.39 | $ | — | $ | — | $ | 18.58 | 2.14 | % | $ | 483,186 | 1.20 | % | 1.23 | % | 0.00 | % | 67 | % | |||||||||||||||||||||||
| 2013(7) |
15.94 | 0.04 | # | 5.97 | (5) | (0.04 | ) | (3.72 | ) | 18.19 | 38.09 | 490,706 | 1.16 | 1.19 | 0.22 | 161 | ||||||||||||||||||||||||||||||||
| 2012 |
14.62 | 0.09 | # | 2.10 | (5) | (0.09 | ) | (0.78 | ) | 15.94 | 15.02 | 377,101 | 1.19 | 1.27 | 0.59 | 128 | ||||||||||||||||||||||||||||||||
| 2011 |
14.46 | 0.01 | # | 0.17 | (5) | (0.02 | ) | — | 14.62 | 1.22 | 354,013 | 1.17 | 1.26 | 0.10 | 165 | |||||||||||||||||||||||||||||||||
| 2010 |
11.37 | 0.03 | # | 3.09 | (0.03 | ) | — | 14.46 | 27.47 | 400,072 | 1.15 | 1.21 | 0.27 | 177 | ||||||||||||||||||||||||||||||||||
| 2009 |
8.91 | 0.03 | # | 2.46 | (0.03 | ) | — | 11.37 | 27.93 | 356,043 | 1.14 | 1.25 | 0.33 | 130 | ||||||||||||||||||||||||||||||||||
| † | Amount represents less than $0.005 per share. |
| # | Calculated using the average shares outstanding method. |
| (1) | The ratio includes expenses waived/reimbursed net of amount recaptured and fees paid indirectly, where applicable; if expenses waived/reimbursed net of amount recaptured and fees paid indirectly were excluded, the ratio would have been higher (lower) than the ratio shown. |
| (2) | The ratio excludes expenses waived/reimbursed net of amount recaptured and fees paid indirectly, where applicable; if expenses waived/reimbursed net of amount recaptured and fees paid indirectly were included, the ratio would have been lower than the ratio shown. |
| (3) | For the six months ended June 30, 2014. All ratios for the period have been annualized. Total return and portfolio turnover for the period have not been annualized. |
| (4) | An out of period adjustment to Investment Income increased Net Investment Income per Share by $0.00 and $0.01, the Total Return did not change, and the Ratio of Net Investment Income to Average Net Assets increased by 0.02% and 0.02% for Institutional Class and Investor Class, respectively. |
| (5) | Amount includes Capital Gains distributions received by the Fund from the GuideStone Money Market Fund. The amount of these distributions represents less than $0.005 per share. |
| (6) | An out of period adjustment to Investment Income increased Net Investment Income per Share by $0.00 and $0.01, Total Return by 0.00% and 0.05%, and the Ratio of Net Investment Income to Average Net Assets by 0.03% and 0.03% for Institutional Class and Investor Class, respectively. |
| (7) | An out of period adjustment to Investment Income increased Net Investment Income per Share by $0.01 and $0.01, Total Return by 0.14% and 0.08%, and the Ratio of Net Investment Income to Average Net Assets by 0.07% and 0.08% for Institutional Class and Investor Class, respectively. |
See Notes to Financial Statements.
177
Table of Contents
FINANCIAL HIGHLIGHTS (Unaudited) (Continued)
| For a Share Outstanding For the Years Ended December 31, unless otherwise indicated | Ratios to Average Net Assets | |||||||||||||||||||||||||||||||||||||||||||||||
| Net Asset Value, Beginning of Period |
Net
Investment Income |
Realized and Unrealized Gain (Loss) on Investments |
Dividends from Net Investment Income |
Distributions from Net Realized Capital Gains |
Net Asset Value, End of Period |
Total Return |
Net Assets, End of Period (000) |
Expenses, Net(1) |
Expenses, Gross(2) |
Investment Income/ (Loss), Net(1) |
Portfolio Turnover Rate |
|||||||||||||||||||||||||||||||||||||
| International Equity Fund |
|
|||||||||||||||||||||||||||||||||||||||||||||||
| Institutional Class |
|
|||||||||||||||||||||||||||||||||||||||||||||||
| 2014(3) |
$ | 11.55 | $ | 0.20 | # | $ | 0.24 | $ | — | $ | — | $ | 11.99 | 3.81 | % | $ | 276,449 | 1.19 | %(4) | 1.25 | %(4) | 3.56 | % | 19 | % | |||||||||||||||||||||||
| 2013(5) |
9.96 | 0.18 | # | 1.66 | (6) | (0.25 | ) | — | 11.55 | 18.49 | 269,499 | 1.11 | (4) | 1.25 | (4) | 1.69 | 51 | |||||||||||||||||||||||||||||||
| 2012 |
8.67 | 0.18 | # | 1.33 | (6) | (0.22 | ) | — | 9.96 | 17.43 | 270,130 | 1.15 | (4) | 1.32 | (4) | 1.89 | 53 | |||||||||||||||||||||||||||||||
| 2011 |
10.35 | 0.22 | # | (1.66 | )(6) | (0.24 | ) | — | 8.67 | (13.86 | ) | 223,677 | 1.02 | (4) | 1.22 | (4) | 2.17 | 82 | ||||||||||||||||||||||||||||||
| 2010 |
9.64 | 0.17 | # | 0.83 | (0.29 | ) | — | 10.35 | 10.45 | 262,103 | 0.97 | (4) | 1.19 | (4) | 1.81 | 56 | ||||||||||||||||||||||||||||||||
| 2009 |
7.32 | 0.17 | # | 2.42 | (0.27 | ) | — | † | 9.64 | 35.81 | 240,483 | 0.98 | (4) | 1.21 | (4) | 2.12 | 59 | |||||||||||||||||||||||||||||||
| Investor Class |
|
|||||||||||||||||||||||||||||||||||||||||||||||
| 2014(3) |
$ | 15.24 | $ | 0.25 | # | $ | 0.31 | $ | — | $ | — | $ | 15.80 | 3.68 | % | $ | 1,192,827 | 1.44 | %(4) | 1.50 | %(4) | 3.36 | % | 19 | % | |||||||||||||||||||||||
| 2013(5) |
13.07 | 0.20 | # | 2.18 | (6) | (0.21 | ) | — | 15.24 | 18.23 | 1,147,181 | 1.35 | (4) | 1.49 | (4) | 1.44 | 51 | |||||||||||||||||||||||||||||||
| 2012 |
11.33 | 0.20 | # | 1.73 | (6) | (0.19 | ) | — | 13.07 | 17.05 | 1,156,306 | 1.39 | (4) | 1.57 | (4) | 1.65 | 53 | |||||||||||||||||||||||||||||||
| 2011 |
13.43 | 0.25 | # | (2.13 | )(6) | (0.22 | ) | — | 11.33 | (14.01 | ) | 955,305 | 1.24 | (4) | 1.45 | (4) | 1.95 | 82 | ||||||||||||||||||||||||||||||
| 2010 |
12.44 | 0.21 | # | 1.05 | (0.27 | ) | — | 13.43 | 10.14 | 1,029,317 | 1.15 | (4) | 1.38 | (4) | 1.67 | 56 | ||||||||||||||||||||||||||||||||
| 2009 |
9.38 | 0.20 | # | 3.11 | (0.25 | ) | — | † | 12.44 | 35.61 | 1,101,628 | 1.16 | (4) | 1.40 | (4) | 1.98 | 59 | |||||||||||||||||||||||||||||||
| Emerging Markets Equity Fund |
|
|||||||||||||||||||||||||||||||||||||||||||||||
| Institutional Class |
|
|||||||||||||||||||||||||||||||||||||||||||||||
| 2014(3) |
$ | 9.75 | $ | 0.07 | # | $ | 0.63 | $ | — | $ | — | $ | 10.45 | 7.18 | % | $ | 50,571 | 1.25 | % | 1.62 | % | 1.38 | % | 21 | % | |||||||||||||||||||||||
| 2013(7)(8) |
10.00 | (0.01 | )# | (0.24 | )(6) | — | — | 9.75 | (2.50 | ) | 46,420 | 1.25 | 1.55 | (0.34 | ) | 6 | ||||||||||||||||||||||||||||||||
| Investor Class |
|
|||||||||||||||||||||||||||||||||||||||||||||||
| 2014(3) |
$ | 9.75 | $ | 0.05 | # | $ | 0.64 | $ | — | $ | — | $ | 10.44 | 7.08 | % | $ | 270,614 | 1.50 | % | 1.84 | % | 1.13 | % | 21 | % | |||||||||||||||||||||||
| 2013(7)(8) |
10.00 | (0.01 | )# | (0.24 | )(6) | — | — | 9.75 | (2.50 | ) | 244,181 | 1.50 | 1.78 | (0.58 | ) | 6 | ||||||||||||||||||||||||||||||||
| † | Amount represents less than $0.005 per share. |
| # | Calculated using the average shares outstanding method. |
| (1) | The ratio includes expenses waived/reimbursed net of amount recaptured and fees paid indirectly, where applicable; if expenses waived/reimbursed net of amount recaptured and fees paid indirectly were excluded, the ratio would have been higher (lower) than the ratio shown. |
| (2) | The ratio excludes expenses waived/reimbursed net of amount recaptured and fees paid indirectly, where applicable; if expenses waived/reimbursed net of amount recaptured and fees paid indirectly were included, the ratio would have been lower than the ratio shown. |
| (3) | For the six months ended June 30, 2014. All ratios for the period have been annualized. Total return and portfolio turnover for the period have not been annualized. |
| (4) | The ratio for the International Equity Fund includes the effect of dividend expense on securities sold short which increased the ratio for both the Institutional and Investor Classes by 0.04% for the years 2009 and 2010, and 0.08%, 0.20% and 0.15% for the years 2011, 2012 and 2013, respectively, and increased the ratio 0.23% for the Institutional Class and 0.24% for the Investor Class for the six months ended June 30, 2014. |
| (5) | An out of period adjustment to Investment Income had no impact on Net Investment Income per Share or Total Return; however, the Ratio of Net Investment Income to Average Net Assets increased by 0.02% and 0.03% for Institutional Class and Investor Class, respectively. |
| (6) | Amount includes Capital Gains distributions received by the Fund from the GuideStone Money Market Fund. The amount of these distributions represents less than $0.005 per share. |
| (7) | An out of period adjustment to Investment Income had no impact on Net Investment Income per Share or Total Return; however, the Ratio of Net Investment Income to Average Net Assets increased by 0.00% and 0.01% for Institutional Class and Investor Class, respectively. |
| (8) | Inception Date was October 31, 2013. All ratios for the period have been annualized. Total return and portfolio turnover for the period have not been annualized. |
See Notes to Financial Statements.
178
Table of Contents
| SCHEDULE OF INVESTMENTS |
June 30, 2014 (Unaudited) |
See Notes to Financial Statements.
179
Table of Contents
INFLATION PROTECTED BOND FUND
SCHEDULE OF INVESTMENTS (Continued)
VALUATION HIERARCHY
The following is a summary of the inputs used, as of June 30, 2014, in valuing the Fund’s investments carried at fair value:
| Total Value |
Level
1 Quoted Prices |
Level
2 Other Significant Observable Inputs |
Level 3 Significant Unobservable Inputs |
|||||||||||||
| Assets: |
||||||||||||||||
| Investments in Securities: |
||||||||||||||||
| Foreign Government Inflation-Linked Bonds |
$ | 19,750,872 | $ | — | $ | 19,750,872 | $ | — | ||||||||
| Money Market Fund |
9,210,378 | 9,210,378 | — | — | ||||||||||||
| Purchased Options |
37,850 | 37,850 | — | — | ||||||||||||
| U.S. Treasury Obligations |
279,749,169 | — | 279,749,169 | — | ||||||||||||
|
|
|
|
|
|
|
|
|
|||||||||
| Total Assets — Investments in Securities |
$ | 308,748,269 | $ | 9,248,228 | $ | 299,500,041 | $ | — | ||||||||
|
|
|
|
|
|
|
|
|
|||||||||
| Liabilities: |
||||||||||||||||
| Investments in Securities: |
||||||||||||||||
| Written Options |
$ | (8,063 | ) | $ | (8,063 | ) | $ | — | $ | — | ||||||
|
|
|
|
|
|
|
|
|
|||||||||
| Total Liabilities — Investments in Securities |
$ | (8,063 | ) | $ | (8,063 | ) | $ | — | $ | — | ||||||
|
|
|
|
|
|
|
|
|
|||||||||
| Other Financial Instruments*** |
||||||||||||||||
| Forward Foreign Currency Contracts |
$ | (274,515 | ) | $ | — | $ | (274,515 | ) | $ | — | ||||||
| Futures Contracts |
(115,349 | ) | (115,349 | ) | — | — | ||||||||||
|
|
|
|
|
|
|
|
|
|||||||||
| Total Liabilities — Other Financial Instruments |
$ | (389,864 | ) | $ | (115,349 | ) | $ | (274,515 | ) | $ | — | |||||
|
|
|
|
|
|
|
|
|
|||||||||
| *** | Other financial instruments are derivative instruments not reflected in the Schedule of Investments, such as futures, forwards and swap contracts, which are valued at the unrealized appreciation (depreciation) on the investment. Details of these investments can be found in the Notes to Financial Statements. |
There were no transfers between Level 1 and Level 2 during the period ended June 30, 2014.
See Notes to Financial Statements.
180
Table of Contents
| SCHEDULE OF INVESTMENTS |
June 30, 2014 (Unaudited) |
See Notes to Financial Statements.
181
Table of Contents
FLEXIBLE INCOME FUND
SCHEDULE OF INVESTMENTS (Continued)
See Notes to Financial Statements.
182
Table of Contents
See Notes to Financial Statements.
183
Table of Contents
FLEXIBLE INCOME FUND
SCHEDULE OF INVESTMENTS (Continued)
VALUATION HIERARCHY
The following is a summary of the inputs used, as of June 30, 2014, in valuing the Fund’s investments carried at fair value:
| Total Value |
Level 1 Quoted Prices |
Level 2 Other Significant Observable Inputs |
Level
3 Significant Unobservable Inputs |
|||||||||||||
| Assets: |
||||||||||||||||
| Investments in Securities: |
||||||||||||||||
| Corporate Bonds |
$ | 11,363,469 | $ | — | $ | 11,363,469 | $ | — | ||||||||
| Loan Agreements |
105,136,545 | — | 99,884,642 | 5,251,903 | ||||||||||||
| Money Market Fund |
9,481,133 | 9,481,133 | — | — | ||||||||||||
|
|
|
|
|
|
|
|
|
|||||||||
| Total Assets — Investments in Securities |
$ | 125,981,147 | $ | 9,481,133 | $ | 111,248,111 | $ | 5,251,903 | ||||||||
|
|
|
|
|
|
|
|
|
|||||||||
There were no transfers between Level 1 and Level 2 during the period ended June 30, 2014.
The unobservable inputs used in the fair value measurement of the reporting entity’s loan agreements are values based on evaluated quotations received from dealers who make markets in such securities. Significant increases (decreases) in those evaluated quotations would result in a significantly higher (lower) fair value measurement.
See Notes to Financial Statements.
184
Table of Contents
The following is a reconciliation of assets in which significant unobservable inputs (Level 3) were used in determining fair value:
| Total Value |
Loan Agreements |
|||||||
| Balance, 12/31/13 |
$ | 7,100,142 | $ | 7,100,142 | ||||
| Accrued discounts/premiums |
4,096 | 4,096 | ||||||
| Realized gain (loss)(1) |
(124 | ) | (124 | ) | ||||
| Change in unrealized appreciation (depreciation)(2) |
16,675 | 16,675 | ||||||
| Purchases |
2,287,018 | 2,287,018 | ||||||
| Sales |
(492,536 | ) | (492,536 | ) | ||||
| Transfers in to Level 3(3) |
498,744 | 498,744 | ||||||
| Transfers out of Level 3(4) |
(4,162,112 | ) | (4,162,112 | ) | ||||
| Maturities |
— | — | ||||||
| Paydowns |
— | — | ||||||
|
|
|
|
|
|||||
| Balance, 06/30/14 |
$ | 5,251,903 | $ | 5,251,903 | ||||
|
|
|
|
|
|||||
| (1) | Realized gain (loss) from the sale of Level 3 securities can be found on the Statement of Operations in Net realized gain (loss) from: Investment securities. |
| (2) | Change in unrealized appreciation (depreciation) can be found on the Statement of Operations in Net change in unrealized appreciation (depreciation) on: Investment securities. |
| (3) | Transfers in to Level 3 represent the value of securities at June 30, 2014 that were transferred from Level 1 and Level 2 to Level 3 of the fair value hierarchy as a result of the inability of the Fund to obtain a price which was determined using observable inputs. |
| (4) | Transfers out of Level 3 represent the value of securities at June 30, 2014 that were transferred from Level 3 to Level 2 of the fair value hierarchy as a result of the ability of the Fund to obtain a price which was determined using observable inputs. |
See Notes to Financial Statements.
185
Table of Contents
| SCHEDULE OF INVESTMENTS |
June 30, 2014 (Unaudited) |
VALUATION HIERARCHY
The following is a summary of the inputs used, as of June 30, 2014, in valuing the Fund’s investments carried at fair value:
| Total Value |
Level 1 Quoted Prices |
Level 2 Other Significant Observable Inputs |
Level
3 Significant Unobservable Inputs |
|||||||||||||
| Assets: |
||||||||||||||||
| Investments in Securities: |
||||||||||||||||
| Mutual Funds |
$ | 51,829,815 | $ | 51,829,815 | $ | — | $ | — | ||||||||
|
|
|
|
|
|
|
|
|
|||||||||
| Total Assets — Investments in Securities |
$ | 51,829,815 | $ | 51,829,815 | $ | — | $ | — | ||||||||
|
|
|
|
|
|
|
|
|
|||||||||
See Notes to Financial Statements.
186
Table of Contents
| REAL ESTATE SECURITIES FUND | ||
| SCHEDULE OF INVESTMENTS | June 30, 2014 (Unaudited) |
See Notes to Financial Statements.
187
Table of Contents
REAL ESTATE SECURITIES FUND
SCHEDULE OF INVESTMENTS (Continued)
See Notes to Financial Statements.
188
Table of Contents
See Notes to Financial Statements.
189
Table of Contents
REAL ESTATE SECURITIES FUND
SCHEDULE OF INVESTMENTS (Continued)
VALUATION HIERARCHY
The following is a summary of the inputs used, as of June 30, 2014, in valuing the Fund’s investments carried at fair value:
| Total Value |
Level 1 Quoted Prices |
Level 2 Other Significant Observable Inputs |
Level 3 Significant Unobservable Inputs |
|||||||||||||
| Assets: |
||||||||||||||||
| Investments in Securities: |
||||||||||||||||
| Common Stocks |
$ | 125,660,343 | $ | 125,660,343 | $ | — | $ | — | ||||||||
| Foreign Common Stocks: |
||||||||||||||||
| Australia |
16,179,548 | 16,179,548 | — | — | ||||||||||||
| Austria |
391,168 | 391,168 | — | — | ||||||||||||
| Bermuda |
1,042,800 | 1,042,800 | — | — | ||||||||||||
| Canada |
9,113,597 | 9,113,597 | — | — | ||||||||||||
| Finland |
675,229 | 675,229 | — | — | ||||||||||||
| France |
8,314,890 | 8,314,890 | — | — | ||||||||||||
| Germany |
3,690,985 | 3,690,985 | — | — | ||||||||||||
| Guernsey |
302,033 | 302,033 | — | — | ||||||||||||
| Hong Kong |
17,089,423 | 17,089,423 | — | — | ||||||||||||
| Ireland |
630,487 | 630,487 | — | — | ||||||||||||
| Italy |
775,976 | 775,976 | — | — | ||||||||||||
| Japan |
34,333,068 | 34,333,068 | — | — | ||||||||||||
| Jersey |
967,952 | 967,952 | — | — | ||||||||||||
| Luxembourg |
1,668,911 | 1,668,911 | — | — | ||||||||||||
| Mexico |
810,563 | 810,563 | — | — | ||||||||||||
| Netherlands |
1,834,353 | 1,834,353 | — | — | ||||||||||||
| Norway |
835,764 | 835,764 | — | — | ||||||||||||
| Singapore |
9,406,447 | 9,406,447 | — | — | ||||||||||||
| Spain |
790,641 | 790,641 | — | — | ||||||||||||
| Sweden |
1,845,334 | 1,845,334 | — | — | ||||||||||||
| Switzerland |
1,460,120 | 1,460,120 | — | — | ||||||||||||
| United Kingdom |
14,921,671 | 14,921,671 | — | — | ||||||||||||
| Money Market Funds |
44,209,066 | 44,209,066 | — | — | ||||||||||||
| Rights/Warrants |
24,365 | 24,365 | — | — | ||||||||||||
|
|
|
|
|
|
|
|
|
|||||||||
| Total Assets — Investments in Securities |
$ | 296,974,734 | $ | 296,974,734 | $ | — | $ | — | ||||||||
|
|
|
|
|
|
|
|
|
|||||||||
| Other Financial Instruments*** |
||||||||||||||||
| Futures Contracts |
$ | 83,557 | $ | 83,557 | $ | — | $ | — | ||||||||
|
|
|
|
|
|
|
|
|
|||||||||
| Total Assets — Other Financial Instruments |
$ | 83,557 | $ | 83,557 | $ | — | $ | — | ||||||||
|
|
|
|
|
|
|
|
|
|||||||||
| *** | Other financial instruments are derivative instruments not reflected in the Schedule of Investments, such as futures, forwards and swap contracts, which are valued at the unrealized appreciation (depreciation) on the investment. Details of these investments can be found in the Notes to Financial Statements. |
There were no transfers between Level 1 and Level 2 during the period ended June 30, 2014.
The Fund had securities that transferred from Level 2 to Level 1 of the fair value hierarchy as a result of foreign equities that were fair valued at December 31, 2013 that are now being valued based on quoted prices. The value of the securities that were transferred to Level 1 as of June 30, 2014 is $45,176,377.
See Notes to Financial Statements.
190
Table of Contents
| GLOBAL NATURAL RESOURCES EQUITY FUND SCHEDULE OF INVESTMENTS |
June 30, 2014 (Unaudited) |
See Notes to Financial Statements.
191
Table of Contents
VALUATION HIERARCHY
The following is a summary of the inputs used, as of June 30, 2014, in valuing the Fund’s investments carried at fair value:
| Total Value |
Level 1 Quoted Prices |
Level
2 Other Significant Observable Inputs |
Level 3 Significant Unobservable Inputs |
|||||||||||||
| Assets: |
||||||||||||||||
| Investments in Securities: |
||||||||||||||||
| Common Stocks |
$ | 90,212,017 | $ | 90,212,017 | $ | — | $ | — | ||||||||
| Foreign Common Stocks: |
||||||||||||||||
| Australia |
19,095,771 | 18,752,164 | — | 343,607 | ||||||||||||
| Bermuda |
4,222,385 | 4,222,385 | — | — | ||||||||||||
| Canada |
121,365,945 | 121,365,945 | — | — | ||||||||||||
| Chile |
11,587,181 | 11,587,181 | — | — | ||||||||||||
| Jersey |
6,496,819 | 6,496,819 | — | — | ||||||||||||
| Papua New Guinea |
5,795,952 | 5,795,952 | — | — | ||||||||||||
| South Africa |
1,445,640 | 1,445,640 | — | — | ||||||||||||
| United Kingdom |
22,660,680 | 22,660,680 | — | — | ||||||||||||
| Money Market Funds |
105,714,805 | 105,714,805 | — | — | ||||||||||||
|
|
|
|
|
|
|
|
|
|||||||||
| Total Assets — Investments in Securities |
$ | 388,597,195 | $ | 388,253,588 | $ | — | $ | 343,607 | ||||||||
|
|
|
|
|
|
|
|
|
|||||||||
Management has determined that the amount of Level 3 securities compared to total net assets is not material; therefore, the reconciliation of Level 3 securities and assumptions is not shown for the period ending June 30, 2014.
See Notes to Financial Statements.
192
Table of Contents
(This page intentionally left blank)
193
Table of Contents
| STATEMENTS OF ASSETS AND LIABILITIES | June 30, 2014 (Unaudited) |
| Inflation Protected Bond Fund |
Flexible Income Fund |
|||||||
| Assets |
||||||||
| Investments in securities of unaffiliated issuers, at value |
$ | 299,537,891 | $ | 116,500,014 | ||||
| Investments in securities of affiliated issuers, at value |
9,210,378 | 9,481,133 | ||||||
|
|
|
|
|
|||||
| Total investments(1)(2) |
308,748,269 | 125,981,147 | ||||||
| Cash |
— | 785,993 | ||||||
| Cash collateral for derivatives |
— | — | ||||||
| Foreign currency(3) |
— | — | ||||||
| Receivables: |
||||||||
| Dividends and reclaims |
85 | 71 | ||||||
| Interest |
1,106,245 | 461,534 | ||||||
| Securities lending |
— | — | ||||||
| Receivable from advisor |
— | — | ||||||
| Investment securities sold |
32,804 | 4,174,904 | ||||||
| Fund shares sold |
173,159 | — | ||||||
| Variation margin on financial futures contracts |
5,005 | — | ||||||
| Unrealized appreciation on foreign currency exchange contracts |
33,283 | — | ||||||
| Prepaid expenses and other assets |
16,025 | 20,666 | ||||||
|
|
|
|
|
|||||
| Total Assets |
310,114,875 | 131,424,315 | ||||||
|
|
|
|
|
|||||
| Liabilities |
||||||||
| Cash overdraft |
5,423 | — | ||||||
| Foreign currency overdraft(3) |
51,028 | — | ||||||
| Options written at value(4) |
8,063 | — | ||||||
| Unrealized depreciation on foreign currency exchange contracts |
307,798 | — | ||||||
| Collateral held for securities on loan at value |
— | — | ||||||
| Payables: |
||||||||
| Investment securities purchased |
960,618 | 9,559,290 | ||||||
| Fund shares redeemed |
13,821 | — | ||||||
| Variation margin on financial futures contracts |
92,513 | — | ||||||
| Securities lending |
— | — | ||||||
| Deferred foreign capital gains taxes |
— | — | ||||||
| Accrued expenses: |
||||||||
| Investment advisory fees |
74,391 | 72,053 | ||||||
| Shareholder servicing fees |
59,730 | 23,370 | ||||||
| Other expenses |
45,174 | 54,401 | ||||||
|
|
|
|
|
|||||
| Total Liabilities |
1,618,559 | 9,709,114 | ||||||
|
|
|
|
|
|||||
| Net Assets |
$ | 308,496,316 | $ | 121,715,201 | ||||
|
|
|
|
|
|||||
| Net Assets Consist of: |
||||||||
| Paid-in-capital |
$ | 305,301,434 | $ | 121,087,251 | ||||
| Undistributed (distributions in excess of) net investment income |
890,078 | 108,767 | ||||||
| Undistributed (accumulated) net realized gain (loss) on investments, foreign currency translations and derivative transactions |
(2,666,102 | ) | 121,750 | |||||
| Net unrealized appreciation (depreciation) on investments, foreign currency translations and derivative transactions |
4,970,906 | 397,433 | ||||||
|
|
|
|
|
|||||
| Net Assets |
$ | 308,496,316 | $ | 121,715,201 | ||||
|
|
|
|
|
|||||
| Net Asset Value: |
||||||||
| $0.001 par value, unlimited shares authorized |
||||||||
| Net assets applicable to the Institutional Class |
N/A | N/A | ||||||
|
|
|
|
|
|||||
| Institutional shares outstanding |
N/A | N/A | ||||||
|
|
|
|
|
|||||
| Net asset value, offering and redemption price per Institutional share |
N/A | N/A | ||||||
|
|
|
|
|
|||||
| Net assets applicable to the Investor Class |
$ | 308,496,316 | $ | 121,715,201 | ||||
|
|
|
|
|
|||||
| Investor shares outstanding |
29,141,347 | 12,102,736 | ||||||
|
|
|
|
|
|||||
| Net asset value, offering and redemption price per Investor share |
$ | 10.59 | $ | 10.06 | ||||
|
|
|
|
|
|||||
| (1) | Investments in securities of unaffiliated issuers, at cost | $ | 294,241,218 | $ | 116,102,581 | |||||
| Investments in securities of affiliated issuers, at cost | 9,210,378 | 9,481,133 | ||||||||
|
|
|
|
|
|||||||
| Total investments at cost | $ | 303,451,596 | $ | 125,583,714 | ||||||
|
|
|
|
|
|||||||
| (2) | Includes securities loaned of: | $ | — | $ | — | |||||
|
|
|
|
|
|||||||
| (3) | Foreign currency at cost | $ | (50,149 | ) | $ | — | ||||
|
|
|
|
|
|||||||
| (4) | Premiums received on options written | $ | 61,653 | $ | — | |||||
|
|
|
|
|
See Notes to Financial Statements.
194
Table of Contents
| Real Assets Fund |
Real Estate Securities Fund |
Global Natural Resources Equity Fund |
||||||||||
| $ | 8,816,632 | $ | 290,719,974 | $ | 365,351,438 | |||||||
| 43,013,183 | 6,254,760 | 23,245,757 | ||||||||||
|
|
|
|
|
|
|
|||||||
| 51,829,815 | 296,974,734 | 388,597,195 | ||||||||||
| — | — | — | ||||||||||
| — | 315,250 | — | ||||||||||
| — | 1,213,276 | — | ||||||||||
| 8 | 1,333,608 | 47,745 | ||||||||||
| — | — | — | ||||||||||
| — | 5,717 | 13,339 | ||||||||||
| 4,824 | — | — | ||||||||||
| — | 3,240,950 | 929,198 | ||||||||||
| 316,858 | 32,786 | 137,228 | ||||||||||
| — | 27,470 | — | ||||||||||
| — | — | — | ||||||||||
| 20,192 | 10,201 | 21,666 | ||||||||||
|
|
|
|
|
|
|
|||||||
| 52,171,697 | 303,153,992 | 389,746,371 | ||||||||||
|
|
|
|
|
|
|
|||||||
| — | — | 156,176 | ||||||||||
| — | — | 27 | ||||||||||
| — | — | — | ||||||||||
| — | — | — | ||||||||||
| — | 37,954,306 | 82,469,048 | ||||||||||
| — | 4,569,062 | 1,157,559 | ||||||||||
| — | 36,445 | — | ||||||||||
| — | — | — | ||||||||||
| — | 1,257 | 2,934 | ||||||||||
| — | — | 1,440 | ||||||||||
| — | 149,539 | 243,213 | ||||||||||
| — | 50,996 | 58,451 | ||||||||||
| 17,728 | 32,487 | 75,357 | ||||||||||
|
|
|
|
|
|
|
|||||||
| 17,728 | 42,794,092 | 84,164,205 | ||||||||||
|
|
|
|
|
|
|
|||||||
| $ | 52,153,969 | $ | 260,359,900 | $ | 305,582,166 | |||||||
|
|
|
|
|
|
|
|||||||
| $ | 49,954,723 | $ | 243,341,693 | $ | 276,701,952 | |||||||
| 287,217 | 563,580 | (740,814 | ) | |||||||||
| 346,041 | 2,148,076 | 8,330,678 | ||||||||||
| 1,565,988 | 14,306,551 | 21,290,350 | ||||||||||
|
|
|
|
|
|
|
|||||||
| $ | 52,153,969 | $ | 260,359,900 | $ | 305,582,166 | |||||||
|
|
|
|
|
|
|
|||||||
| N/A | N/A | N/A | ||||||||||
|
|
|
|
|
|
|
|||||||
| N/A | N/A | N/A | ||||||||||
|
|
|
|
|
|
|
|||||||
| N/A | N/A | N/A | ||||||||||
|
|
|
|
|
|
|
|||||||
| $ | 52,153,969 | $ | 260,359,900 | $ | 305,582,166 | |||||||
|
|
|
|
|
|
|
|||||||
| 4,941,688 | 25,058,311 | 27,182,976 | ||||||||||
|
|
|
|
|
|
|
|||||||
| $ | 10.55 | $ | 10.39 | $ | 11.24 | |||||||
|
|
|
|
|
|
|
|||||||
| $ | 8,489,540 | $ | 276,505,353 | $ | 344,061,595 | |||||||
| 41,774,287 | 6,254,760 | 23,245,757 | ||||||||||
|
|
|
|
|
|
|
|||||||
| $ | 50,263,827 | $ | 282,760,113 | $ | 367,307,352 | |||||||
|
|
|
|
|
|
|
|||||||
| $ | — | $ | 37,204,254 | $ | 94,486,288 | |||||||
|
|
|
|
|
|
|
|||||||
| $ | — | $ | 1,207,755 | $ | (27 | ) | ||||||
|
|
|
|
|
|
|
|||||||
| $ | — | $ | — | $ | — | |||||||
|
|
|
|
|
|
|
|||||||
See Notes to Financial Statements.
195
Table of Contents
| STATEMENTS OF OPERATIONS | For the Six Months Ended June 30, 2014 (Unaudited) |
| Inflation Protected Bond Fund |
Flexible
Income Fund |
|||||||
| Investment Income |
||||||||
| Dividends |
$ | — | $ | — | ||||
| Income distributions received from affiliated funds |
854 | 434 | ||||||
| Interest |
4,535,341 | 2,373,301 | ||||||
| Securities lending |
82 | — | ||||||
| Less foreign taxes withheld |
— | — | ||||||
|
|
|
|
|
|||||
| Total Investment Income |
4,536,277 | 2,373,735 | ||||||
|
|
|
|
|
|||||
| Expenses |
||||||||
| Investment advisory fees |
441,915 | 414,859 | ||||||
| Transfer agent fees: |
||||||||
| Investor shares |
10,530 | 8,469 | ||||||
| Custodian fees |
20,112 | 30,726 | ||||||
| Shareholder servicing fees: |
||||||||
| Investor shares |
344,253 | 134,645 | ||||||
| Accounting and administration fees |
33,669 | 22,988 | ||||||
| Professional fees |
28,002 | 33,101 | ||||||
| Blue sky fees: |
||||||||
| Investor shares |
8,574 | 894 | ||||||
| Shareholder reporting fees: |
||||||||
| Investor shares |
3,206 | 276 | ||||||
| Trustee expenses |
1,344 | 531 | ||||||
| Line of credit facility fees |
1,007 | 6,239 | ||||||
| Other expenses |
13,126 | 5,515 | ||||||
|
|
|
|
|
|||||
| Total Expenses |
905,738 | 658,243 | ||||||
| Expenses waived/reimbursed net of amount recaptured(1) |
(20,516 | ) | 14,980 | |||||
| Fees paid indirectly |
— | — | ||||||
|
|
|
|
|
|||||
| Net expenses |
885,222 | 673,223 | ||||||
|
|
|
|
|
|||||
| Net Investment Income (Loss) |
3,651,055 | 1,700,512 | ||||||
|
|
|
|
|
|||||
| Realized and Unrealized Gain (Loss) |
||||||||
| Net realized gain (loss) from: |
||||||||
| Capital gain distributions received from affiliated funds |
— | — | ||||||
| Investment securities |
111,515 | 122,556 | ||||||
| Investment securities of affiliated issuers |
— | — | ||||||
| Futures transactions |
(1,522,235 | ) | — | |||||
| Option contracts written |
260,132 | — | ||||||
| Option contracts purchased |
(371,011 | ) | — | |||||
| Foreign currency transactions |
109,708 | — | ||||||
|
|
|
|
|
|||||
| Net realized gain (loss) |
(1,411,891 | ) | 122,556 | |||||
|
|
|
|
|
|||||
| Net change in unrealized appreciation (depreciation) on: |
||||||||
| Investment securities |
13,087,105 | (119,642 | ) | |||||
| Investment securities of unaffiliated issuers |
— | — | ||||||
| Futures |
(184,171 | ) | — | |||||
| Option contracts written |
21,210 | — | ||||||
| Option contracts purchased |
(118,334 | ) | — | |||||
| Foreign currency translation |
140,309 | — | ||||||
|
|
|
|
|
|||||
| Net change in unrealized appreciation (depreciation) |
12,946,119 | (119,642 | ) | |||||
|
|
|
|
|
|||||
| Net Realized and Unrealized Gain |
11,534,228 | 2,914 | ||||||
|
|
|
|
|
|||||
| Net Increase in Net Assets Resulting from Operations |
$ | 15,185,283 | $ | 1,703,426 | ||||
|
|
|
|
|
|||||
| (1) | See Note 3a and 3c in Notes to Financial Statements. |
See Notes to Financial Statements.
196
Table of Contents
| Real Assets Fund |
Real
Estate Securities Fund |
Global
Natural Resources Equity Fund |
||||||||||
| $ | — | $ | 4,276,702 | $ | 1,671,130 | |||||||
| 310,347 | 266 | 955 | ||||||||||
| — | 135 | — | ||||||||||
| — | 72,392 | 80,766 | ||||||||||
| — | (252,126 | ) | (107,003 | ) | ||||||||
|
|
|
|
|
|
|
|||||||
| 310,347 | 4,097,369 | 1,645,848 | ||||||||||
|
|
|
|
|
|
|
|||||||
| 19,923 | 865,208 | 1,457,332 | ||||||||||
| 8,757 | 12,014 | 8,446 | ||||||||||
| 5,109 | 60,437 | 39,929 | ||||||||||
| — | 292,149 | 336,957 | ||||||||||
| 2,174 | 44,502 | 51,077 | ||||||||||
| 21,997 | 32,553 | 29,206 | ||||||||||
| 8,065 | 10,109 | 894 | ||||||||||
| 1,142 | 6,270 | 260 | ||||||||||
| 145 | 1,138 | 1,254 | ||||||||||
| 106 | 849 | 944 | ||||||||||
| 4,836 | 22,438 | 8,259 | ||||||||||
|
|
|
|
|
|
|
|||||||
| 72,254 | 1,347,667 | 1,934,558 | ||||||||||
| (48,814 | ) | (6,258 | ) | (28,254 | ) | |||||||
| — | — | (9,746 | ) | |||||||||
|
|
|
|
|
|
|
|||||||
| 23,440 | 1,341,409 | 1,896,558 | ||||||||||
|
|
|
|
|
|
|
|||||||
| 286,907 | 2,755,960 | (250,710 | ) | |||||||||
|
|
|
|
|
|
|
|||||||
| 12,628 | — | — | ||||||||||
| — | 3,960,008 | 8,303,260 | ||||||||||
| 19,280 | — | — | ||||||||||
| — | 482,832 | — | ||||||||||
| — | — | — | ||||||||||
| — | — | — | ||||||||||
| — | 18,436 | (10,657 | ) | |||||||||
|
|
|
|
|
|
|
|||||||
| 31,908 | 4,461,276 | 8,292,603 | ||||||||||
|
|
|
|
|
|
|
|||||||
| 2,142,831 | 20,617,332 | 33,756,285 | ||||||||||
| 355,307 | — | — | ||||||||||
| — | (73,980 | ) | — | |||||||||
| — | — | — | ||||||||||
| — | — | — | ||||||||||
| — | 12,137 | 307 | ||||||||||
|
|
|
|
|
|
|
|||||||
| 2,498,138 | 20,555,489 | 33,756,592 | ||||||||||
|
|
|
|
|
|
|
|||||||
| 2,530,046 | 25,016,765 | 42,049,195 | ||||||||||
|
|
|
|
|
|
|
|||||||
| $ | 2,816,953 | $ | 27,772,725 | $ | 41,798,485 | |||||||
|
|
|
|
|
|
|
|||||||
See Notes to Financial Statements.
197
Table of Contents
STATEMENTS OF CHANGES IN NET ASSETS
| Inflation Protected Bond Fund |
||||||||
| For the Six Months Ended 06/30/14 |
For the Year Ended 12/31/13 |
|||||||
| (Unaudited) | ||||||||
| Operations: |
||||||||
| Net investment income (loss) |
$ | 3,651,055 | $ | 2,252,657 | ||||
| Net realized gain (loss) on investment securities, foreign currency transactions and derivative transactions |
(1,411,891 | ) | (1,116,237 | ) | ||||
| Net change in unrealized appreciation (depreciation) on investment securities, foreign currency translations and derivative transactions |
12,946,119 | (20,279,614 | ) | |||||
|
|
|
|
|
|||||
| Net increase (decrease) in net assets resulting from operations |
15,185,283 | (19,143,194 | ) | |||||
|
|
|
|
|
|||||
| Dividends and Distributions to Shareholders: |
||||||||
| Dividends from net investment income(2) |
(3,161,597 | ) | (1,868,128 | ) | ||||
| Distributions from net realized capital gains |
— | (882,675 | ) | |||||
|
|
|
|
|
|||||
| Total dividends and distributions |
(3,161,597 | ) | (2,750,803 | ) | ||||
|
|
|
|
|
|||||
| Capital Share Transactions: |
||||||||
| Proceeds from Investor shares sold |
30,812,014 | 151,311,796 | ||||||
| Reinvestment of dividends and distributions into Investor shares |
3,160,740 | 2,749,825 | ||||||
|
|
|
|
|
|||||
| Total proceeds from shares sold and reinvested |
33,972,754 | 154,061,621 | ||||||
|
|
|
|
|
|||||
| Value of Investor shares redeemed |
(11,610,638 | ) | (55,819,406 | ) | ||||
|
|
|
|
|
|||||
| Total value of shares redeemed |
(11,610,638 | ) | (55,819,406 | ) | ||||
|
|
|
|
|
|||||
| Net increase (decrease) from capital share transactions(3) |
22,362,116 | 98,242,215 | ||||||
|
|
|
|
|
|||||
| Total increase in net assets |
34,385,802 | 76,348,218 | ||||||
|
|
|
|
|
|||||
| Net Assets: |
||||||||
| Beginning of Period |
274,110,514 | 197,762,296 | ||||||
|
|
|
|
|
|||||
| End of Period* |
$ | 308,496,316 | $ | 274,110,514 | ||||
|
|
|
|
|
|||||
| *Including undistributed (distributions in excess of) net investment income |
$ | 890,078 | $ | 400,620 | ||||
|
|
|
|
|
|||||
| (1) | Inception date was July 1, 2013. |
| (2) | Includes dividends paid from the short-term portion of capital gain distributions received from affiliated funds for the Real Assets Fund. |
| (3) | See Note 6 in Notes to Financial Statements. |
See Notes to Financial Statements.
198
Table of Contents
| Flexible
Income Fund |
Real Assets Fund |
Real Estate Securities Fund |
Global Natural Resources Equity Fund |
|||||||||||||||||||||||||||
| For the Six |
For the Period 07/01/13(1) -12/31/13 |
For the Six Months Ended 06/30/14 |
For the Period 07/01/13(1) -12/31/13 |
For the Six Months Ended 06/30/14 |
For the Year Ended 12/31/13 |
For the Six Months Ended 06/30/14 |
For the Period 07/01/13(1) -12/31/13 |
|||||||||||||||||||||||
| (Unaudited) | (Unaudited) | (Unaudited) | (Unaudited) | |||||||||||||||||||||||||||
| $ | 1,700,512 | $ | 1,009,158 | $ | 286,907 | $ | 107,413 | $ | 2,755,960 | $ | 3,527,093 | $ | (250,710 | ) | $ | (281,723 | ) | |||||||||||||
|
|
122,556 |
|
109,553 | 31,908 | 464,211 | 4,461,276 | 25,142,395 | 8,292,603 | 2,955,718 | |||||||||||||||||||||
|
|
(119,642 |
) |
517,075 | 2,498,138 | (932,150 | ) | 20,555,489 | (26,798,154 | ) | 33,756,592 | (12,466,242 | ) | ||||||||||||||||||
|
|
|
|
|
|
|
|
|
|
|
|
|
|
|
|
|
|||||||||||||||
| 1,703,426 | 1,635,786 | 2,816,953 | (360,526 | ) | 27,772,725 | 1,871,334 | 41,798,485 | (9,792,247 | ) | |||||||||||||||||||||
|
|
|
|
|
|
|
|
|
|
|
|
|
|
|
|
|
|||||||||||||||
| (1,591,745 | ) | (1,014,482 | ) | — | (258,438 | ) | (1,824,668 | ) | (4,569,650 | ) | — | (747,193 | ) | |||||||||||||||||
| (91,993 | ) | (14,042 | ) | — | — | (258,537 | ) | (25,908,952 | ) | — | (2,379,831 | ) | ||||||||||||||||||
|
|
|
|
|
|
|
|
|
|
|
|
|
|
|
|
|
|||||||||||||||
| (1,683,738 | ) | (1,028,524 | ) | — | (258,438 | ) | (2,083,205 | ) | (30,478,602 | ) | — | (3,127,024 | ) | |||||||||||||||||
|
|
|
|
|
|
|
|
|
|
|
|
|
|
|
|
|
|||||||||||||||
| 12,236,833 | 109,825,782 | 23,729,370 | 29,147,087 | 17,961,772 | 142,160,856 | 17,905,220 | 274,513,313 | |||||||||||||||||||||||
| 1,683,738 | 1,028,524 | — | 258,438 | 2,080,227 | 30,476,790 | — | 3,127,024 | |||||||||||||||||||||||
|
|
|
|
|
|
|
|
|
|
|
|
|
|
|
|
|
|||||||||||||||
| 13,920,571 | 110,854,306 | 23,729,370 | 29,405,525 | 20,041,999 | 172,637,646 | 17,905,220 | 277,640,337 | |||||||||||||||||||||||
|
|
|
|
|
|
|
|
|
|
|
|
|
|
|
|
|
|||||||||||||||
| (1,387,713 | ) | (2,298,913 | ) | (2,042,966 | ) | (1,135,949 | ) | (20,274,332 | ) | (100,275,836 | ) | (14,843,392 | ) | (3,999,213 | ) | |||||||||||||||
|
|
|
|
|
|
|
|
|
|
|
|
|
|
|
|
|
|||||||||||||||
| (1,387,713 | ) | (2,298,913 | ) | (2,042,966 | ) | (1,135,949 | ) | (20,274,332 | ) | (100,275,836 | ) | (14,843,392 | ) | (3,999,213 | ) | |||||||||||||||
|
|
|
|
|
|
|
|
|
|
|
|
|
|
|
|
|
|||||||||||||||
| 12,532,858 | 108,555,393 | 21,686,404 | 28,269,576 | (232,333 | ) | 72,361,810 | 3,061,828 | 273,641,124 | ||||||||||||||||||||||
|
|
|
|
|
|
|
|
|
|
|
|
|
|
|
|
|
|||||||||||||||
| 12,552,546 | 109,162,655 | 24,503,357 | 27,650,612 | 25,457,187 | 43,754,542 | 44,860,313 | 260,721,853 | |||||||||||||||||||||||
|
|
|
|
|
|
|
|
|
|
|
|
|
|
|
|
|
|||||||||||||||
| 109,162,655 | — | 27,650,612 | — | 234,902,713 | 191,148,171 | 260,721,853 | — | |||||||||||||||||||||||
|
|
|
|
|
|
|
|
|
|
|
|
|
|
|
|
|
|||||||||||||||
| $ | 121,715,201 | $ | 109,162,655 | $ | 52,153,969 | $ | 27,650,612 | $ | 260,359,900 | $ | 234,902,713 | $ | 305,582,166 | $ | 260,721,853 | |||||||||||||||
|
|
|
|
|
|
|
|
|
|
|
|
|
|
|
|
|
|||||||||||||||
| $ | 108,767 | $ | — | $ | 287,217 | $ | 310 | $ | 563,580 | $ | (367,712 | ) | $ | (740,814 | ) | $ | (490,104 | ) | ||||||||||||
|
|
|
|
|
|
|
|
|
|
|
|
|
|
|
|
|
|||||||||||||||
See Notes to Financial Statements.
199
Table of Contents
FINANCIAL HIGHLIGHTS (Unaudited)
| For a Share Outstanding For the Years Ending December 31, unless otherwise indicated | Ratios to Average Net Assets | |||||||||||||||||||||||||||||||||||||||||||||||||||||||
| Net Asset Value, Beginning of Period |
Net Investment Income (1) |
Capital Gain Distributions Received from Affiliated Funds |
Realized and Unrealized Gain (Loss) on Investments |
Dividends from Net Investment Income |
Distributions from Net Realized Capital Gains (2) |
Excess Distribution/ Return of Capital |
Net Asset Value, End of Period |
Total Return |
Net Assets, End of Period (000) |
Expenses, Net (3)(4) |
Expenses, Gross (3)(5) |
Investment Income, Net (1)(4) |
Portfolio Turnover Rate |
|||||||||||||||||||||||||||||||||||||||||||
| Inflation Protected Bond Fund |
|
|||||||||||||||||||||||||||||||||||||||||||||||||||||||
| Investor Class |
|
|||||||||||||||||||||||||||||||||||||||||||||||||||||||
| 2014(6) |
$ | 10.15 | $ | 0.13 | # | $ | — | $ | 0.42 | $ | (0.11 | ) | $ | — | $ | — | $ | 10.59 | 5.44 | % | $ | 308,496 | 0.62 | % | 0.63 | % | 2.55 | % | 34 | % | ||||||||||||||||||||||||||
| 2013(7) |
11.25 | 0.10 | # | — | † | (1.06 | ) | (0.09 | ) | (0.05 | ) | — | 10.15 | (8.64 | ) | 274,111 | 0.64 | 0.65 | 0.98 | 75 | ||||||||||||||||||||||||||||||||||||
| 2012 |
11.16 | 0.21 | # | — | † | 0.46 | (0.20 | ) | (0.38 | ) | — | 11.25 | 6.06 | 197,762 | 0.65 | 0.66 | 1.80 | 94 | ||||||||||||||||||||||||||||||||||||||
| 2011 |
10.43 | 0.29 | # | — | † | 0.94 | (0.31 | ) | (0.19 | ) | — | 11.16 | 12.00 | 163,156 | 0.66 | 0.68 | 2.65 | 114 | ||||||||||||||||||||||||||||||||||||||
| 2010 |
10.32 | 0.20 | # | — | 0.40 | (0.21 | ) | (0.28 | ) | — | 10.43 | 5.82 | 107,825 | 0.65 | 0.66 | 1.90 | 113 | |||||||||||||||||||||||||||||||||||||||
| 2009(8) |
10.00 | 0.19 | # | — | 0.32 | (0.18 | ) | (0.01 | ) | — | 10.32 | 5.12 | 87,994 | 0.67 | 0.70 | 3.53 | 55 | |||||||||||||||||||||||||||||||||||||||
| Flexible Income Fund |
|
|||||||||||||||||||||||||||||||||||||||||||||||||||||||
| Investor Class |
|
|||||||||||||||||||||||||||||||||||||||||||||||||||||||
| 2014(6) |
$ | 10.06 | $ | 0.15 | # | $ | — | $ | — | $ | (0.14 | ) | $ | (0.01 | ) | $ | — | $ | 10.06 | 1.50 | % | $ | 121,715 | 1.20 | % | 1.17 | % | 3.03 | % | 50 | % | |||||||||||||||||||||||||
| 2013(9) |
10.00 | 0.11 | # | — | † | 0.05 | (0.10 | ) | — | † | — | 10.06 | 1.57 | 109,163 | 1.20 | 1.26 | 2.22 | 25 | ||||||||||||||||||||||||||||||||||||||
| Real Assets Fund |
|
|||||||||||||||||||||||||||||||||||||||||||||||||||||||
| Investor Class |
|
|||||||||||||||||||||||||||||||||||||||||||||||||||||||
| 2014(6) |
$ | 9.82 | $ | 0.07 | # | $ | — | † | $ | 0.66 | $ | — | $ | — | $ | — | $ | 10.55 | 7.43 | % | $ | 52,154 | 0.12 | % | 0.37 | % | 1.47 | % | 1 | % | ||||||||||||||||||||||||||
| 2013(9) |
10.00 | 0.06 | # | 0.27 | (0.42 | ) | (0.09 | ) | — | — | 9.82 | (0.87 | ) | 27,651 | 0.12 | 0.89 | 1.22 | 1 | ||||||||||||||||||||||||||||||||||||||
| Real Estate Securities Fund |
|
|||||||||||||||||||||||||||||||||||||||||||||||||||||||
| Investor Class |
|
|||||||||||||||||||||||||||||||||||||||||||||||||||||||
| 2014(6) |
$ | 9.36 | $ | 0.11 | # | $ | — | $ | 1.00 | $ | (0.07 | ) | $ | (0.01 | ) | $ | — | $ | 10.39 | 11.90 | % | $ | 260,360 | 1.10 | % | 1.11 | % | 2.26 | % | 61 | % | |||||||||||||||||||||||||
| 2013(10) |
10.60 | 0.17 | # | — | † | (0.02 | ) | (0.21 | ) | (1.18 | ) | — | 9.36 | 1.49 | 234,903 | 1.05 | 1.05 | 1.56 | 168 | |||||||||||||||||||||||||||||||||||||
| 2012 |
9.18 | 0.17 | # | — | † | 1.40 | (0.15 | ) | — | — | 10.60 | 17.09 | 191,148 | 1.05 | 1.06 | 1.62 | 95 | |||||||||||||||||||||||||||||||||||||||
| 2011 |
8.52 | 0.08 | # | — | † | 0.65 | (0.07 | ) | — | — | 9.18 | 8.51 | 150,227 | 1.14 | 1.14 | 0.85 | 90 | |||||||||||||||||||||||||||||||||||||||
| 2010 |
6.74 | 0.11 | # | — | 1.82 | (0.15 | ) | — | — | 8.52 | 28.80 | 141,900 | 1.19 | 1.19 | 1.41 | 105 | ||||||||||||||||||||||||||||||||||||||||
| 2009 |
5.25 | 0.12 | # | — | 1.49 | (0.12 | ) | — | — | † | 6.74 | 31.21 | 121,533 | 1.27 | 1.28 | 2.29 | 128 | |||||||||||||||||||||||||||||||||||||||
| Global Natural Resources Equity Fund |
|
|||||||||||||||||||||||||||||||||||||||||||||||||||||||
| Investor Class |
|
|||||||||||||||||||||||||||||||||||||||||||||||||||||||
| 2014(6) |
$ | 9.71 | $ | (0.01 | )# | $ | — | $ | 1.54 | $ | — | $ | — | $ | — | $ | 11.24 | 15.76 | % | $ | 305,582 | 1.35 | % | 1.38 | % | (0.18 | )% | 17 | % | |||||||||||||||||||||||||||
| 2013(9)(11) |
10.00 | (0.01 | )# | — | † | (0.16 | ) | (0.03 | ) | (0.09 | ) | — | 9.71 | 1.69 | 260,722 | 1.42 | 1.42 | (0.24 | ) | 18 | ||||||||||||||||||||||||||||||||||||
| † | Amount represents less than $0.005 per share. |
| # | Calculated using the average shares outstanding method. |
| (1) | Recognition of net investment income by the Fund is affected by the timing of the declaration of dividends by the underlying investment companies in which the Fund invests. |
| (2) | Includes dividends paid from the short-term portion of capital gain distributions received from affiliated Funds. |
| (3) | Does not include expenses of the investment companies in which the Fund invests. |
| (4) | The ratio includes expenses waived/reimbursed net of amount recaptured and fees paid indirectly, where applicable; if expenses waived/reimbursed net of amount recaptured and fees paid indirectly were excluded, the ratio would have been higher (lower) than the ratio shown. |
| (5) | The ratio excludes expenses waived/reimbursed net of amount recaptured and fees paid indirectly, where applicable; if expenses waived/reimbursed net of amount recaptured and fees paid indirectly were included, the ratio would have been lower than the ratio shown. |
| (6) | For the six months ended June 30, 2014. All ratios for the period have been annualized. Total return and portfolio turnover for the period have not been annualized. |
| (7) | An out of period adjustment to Investment Income had no impact on Net Investment Income per Share or Total Return; however, the Ratio of Net Investment Income to Average Net Assets increased by 0.01%. |
| (8) | Inception date was June 25, 2009. All ratios for the period have been annualized. Total return and portfolio turnover for the period have not been annualized. |
| (9) | Inception date was July 1, 2013. All ratios for the period have been annualized. Total return and portfolio turnover for the period have not been annualized. |
| (10) | An out of period adjustment to Investment Income had no impact on Net Investment Income per Share or Total Return; however, the Ratio of Net Investment Income to Average Net Assets increased by 0.03%. |
| (11) | An out of period adjustment to Investment Income had no impact on Net Investment Income per Share or Total Return; however, the Ratio of Net Investment Income to Average Net Assets increased by 0.01%. |
See Notes to Financial Statements.
200
Table of Contents
NOTES TO FINANCIAL STATEMENTS (Unaudited)
1. DESCRIPTION OF THE FUNDS
GuideStone Funds (the “Trust”) was organized as a Delaware statutory trust on March 2, 2000. The Trust has established twenty-seven series (each, a “Fund” and together, the “Funds”). Each Fund is a diversified, open-end management investment company, registered under the Investment Company Act of 1940, as amended (the “1940 Act”). The MyDestination 2005, MyDestination 2015, MyDestination 2025, MyDestination 2035, MyDestination 2045 and MyDestination 2055 Funds, are each referred to as a “Date Target Fund” and together as the “Date Target Funds.” The Conservative Allocation Fund, Balanced Allocation Fund, Growth Allocation Fund, Aggressive Allocation Fund, Conservative Allocation Fund I, Balanced Allocation Fund I, Growth Allocation Fund I and Aggressive Allocation Fund I are each referred to as an “Asset Allocation Fund” and together as the “Asset Allocation Funds.” The remaining Funds are each referred to as a “Select Fund” and are together referred to as the “Select Funds.” The Money Market Fund is referred to as the “Money Market Fund.” The Low-Duration Bond Fund, Medium-Duration Bond Fund, Extended-Duration Bond Fund, Inflation Protected Bond Fund and Global Bond Fund are together referred to as the “Bond Funds.” The Defensive Market Strategies Fund, Equity Index Fund, Real Estate Securities Fund, Value Equity Fund, Growth Equity Fund, Small Cap Equity Fund and International Equity Fund are together referred to as the “Equity Funds.” The Inflation Protected Bond Fund and the Real Estate Securities Fund may also be referenced as the “Real Return Select Fund(s).” The MyDestination 2055 Fund commenced operations as a registered investment company on January 1, 2012.
Effective May 1, 2014, the GS2 Class and the GS4 Class were designated as Institutional Class and Investor Class, respectively. There are two classes of shares issued by the Funds — the Institutional Class and the Investor Class (each, a “Class” and together the “Classes”), except for the Date Target Funds, the Inflation Protected Bond Fund, the Global Bond Fund, and the Real Estate Securities Fund, which issued the Investor Class only. The Conservative Allocation Fund I, Balanced Allocation Fund I, Growth Allocation Fund I and Aggressive Allocation Fund I issued the Institutional Class only. All Classes of shares have identical voting, dividend and liquidation rights. Income, expenses (other than class specific expenses) and realized and unrealized gains or losses on investments are allocated to each Class of shares based upon its relative net assets.
Each Fund is a separate mutual fund with its own investment objective, strategies and risks. The Select Funds invest directly in particular types of fixed-income obligations, stocks and other investments. The Asset Allocation and Date Target Funds primarily invest in a different mix of the Select Funds to meet a specified investment strategy. The Asset Allocation and Date Target Funds are commonly referred to as “Fund of Funds.”
2. SIGNIFICANT ACCOUNTING POLICIES
The following significant accounting policies are in conformity with generally accepted accounting principles (“GAAP”) in the United States of America which require management to make estimates and assumptions that affect the reported amounts of assets, liabilities, disclosures of contingent assets and liabilities at the date of the financial statements and the reported amounts of income and expenses during the reporting period. Actual results could differ from those estimates and those differences could be significant.
a. Valuation of Securities
The Funds (except the Money Market Fund) each value securities traded on national securities exchanges or included in national market systems at the last quoted sale price, or official close price, on the principal exchange on which they were traded, or, in the absence of any sale or official close price, at the closing bid price. Securities which are primarily traded on foreign exchanges are generally valued at the closing values of such securities on their respective exchanges, except that when an occurrence subsequent to the time when the foreign security is valued is likely to have changed such value, then the fair value of those securities will be determined through procedures established by or under the direction of the Board of Trustees of the Trust (the “Board of Trustees”). Non-exchange traded securities for which an over-the-counter quotation is readily available are valued at the last quoted bid price.
201
Table of Contents
Debt securities, excluding asset-backed and mortgage-backed securities, are valued at the mean of the last bid and ask prices available. Asset-backed and mortgage-backed securities are generally valued at the last bid price, if available. Certain debt securities may be valued on the basis of broker quotations, valuations provided by a pricing service which may use a matrix, formula or other objective methods that take into consideration market indices, matrices, yield curves and other specific adjustments or by a sub-adviser using various methodologies approved by the Board of Trustees.
Short-term securities maturing in more than 60 days from the valuation date are valued at the mean of the last bid and ask prices; those maturing in 60 days or less are generally valued at amortized cost which approximates current market value in accordance with Rule 2a-7 of the 1940 Act.
Forward foreign exchange contracts are valued based upon closing exchange rates from each respective foreign market.
Futures contracts are valued at the closing settlement price on the exchange on which they are primarily traded.
Options, rights and warrants for which the primary market is a national securities exchange are valued at the last sale price on the exchange on which they are traded, or, in the absence of any sale, at the closing bid price. Options, rights and warrants not traded on a national securities exchange are valued at the last quoted bid price.
Swap agreements are valued daily based upon the terms specific to each agreement with its counterparty.
To the extent available, valuations of portfolio securities are provided by independent pricing services approved by the Board of Trustees. Securities for which market quotations are not readily available are valued at fair value according to methods established in good faith by the Board of Trustees. Due to the potential excessive volatility at the time valuations are developed, pricing techniques may materially vary from the actual amounts realized upon sale of the securities.
For securities that principally trade on a foreign market or exchange, a significant gap in time can exist between the time of a particular security’s last trade and the time at which a Fund calculates its NAV. The closing prices of such securities may no longer reflect their market value at the time the Fund calculates its NAV if an event that could materially affect the value of those securities (a “Significant Event”) has occurred between the time of the security’s last close and the time that the Fund calculates its NAV. A Significant Event may relate to a single issuer or to an entire market sector. If a Fund becomes aware of a Significant Event that has occurred with respect to a security or group of securities after the closing of the exchange or market on which the security or securities principally trade, but before the time at which the Fund calculates its NAV, a Valuation Committee meeting may be called. The Trust uses Interactive Data Corporation (“IDC”) as a third party fair valuation vendor. IDC provides a fair value for foreign equity securities held by the Trust based on certain factors and methodologies applied by IDC in the event that there is movement in the U.S. market that exceeds a specific threshold established by the Valuation Committee in consultation with, and approved by, the Board of Trustees. Such methodologies generally involve tracking valuation correlations between the U.S. market and each non-U.S. security. As part of the valuation procedures, a “confidence interval” is used, when the threshold is exceeded, to determine the level of correlation between the value of a foreign equity security and movements in the U.S. market before a particular security will be fair valued. In the event that the threshold established by the Valuation Committee is exceeded on a specific day, the Trust will typically value non-U.S. equity securities in its portfolio that exceed the applicable confidence interval based upon the fair values provided by IDC.
The Asset Allocation and Date Target Funds value their investments in the underlying Select Funds daily at the closing NAV of each respective Select Fund.
The Financial Accounting Standards Board’s (“FASB”) “Fair Value Measurements and Disclosures” defines fair value as the price that a fund would receive to sell an asset or pay to transfer a liability in an orderly transaction between market participants
202
Table of Contents
at the measurement date. It establishes and requires disclosure of a fair value hierarchy, separately for each major category of assets and liabilities, which segregates fair value measurements into levels (Levels 1, 2, and 3). Categorizations of fair value measurements, and the criteria used to determine each categorization, are as follows:
Level 1 – quoted prices in active markets for identical securities which include:
Equity securities, including restricted securities, for which market quotations are readily available, that are valued at the last reported sale price or official closing price as reported by an independent pricing service on the primary market or exchange on which they are traded; and
Investments in open-end mutual funds, including the GuideStone Funds and the Northern Institutional Liquid Assets Portfolio, which are valued at their closing net asset value each business day.
| Level 2 – |
prices determined using other significant observable inputs (including quoted prices for similar securities, interest rates, prepayment speeds, credit risk, etc.) which include: |
Equity securities for which there were no sales or closing prices for that day, that are valued at the last quoted bid price or that may be valued using the last available price;
Foreign equity securities for which a Significant Event has occurred and a fair value price is provided by IDC;
Debt securities, including restricted securities that are valued based on evaluated quotations received from independent pricing. For corporate bonds, pricing services that utilize matrix pricing which considers yield or price of bonds of comparable quality, coupon, maturity and type as well as dealer supplied prices; and
Short-term securities with remaining maturities of sixty days or less for which quotations are not readily available and are valued at amortized cost.
| Level 3 – | prices determined using significant unobservable inputs (including the Fund’s own assumptions in determining the fair value of investments) which include: |
Restricted equity securities and private placements where observable inputs are limited, assumptions about market activity and risk are used; and
Debt securities, including restricted securities that are valued based on evaluated quotations received from dealers who make markets in such securities.
Valuation levels are not necessarily an indication of the risk associated with investing in those securities and changes in valuation techniques may result in transfers in or out of an assigned level within the disclosure hierarchy. Management has determined that the amount of transfers between Level 1 and Level 2 and between Level 2 and Level 3 compared to total net assets of the applicable Funds is not material; therefore, the transfers between Level 1 and Level 2 and between Level 2 and Level 3 are not shown for the period ended June 30, 2014.
b. Equity Linked Securities
The Defensive Market Strategies Fund invests in equity-linked securities. Equity-linked securities are hybrid financial instruments that generally combine both debt and equity characteristics into a single note form. Income received from equity linked securities will be recorded as realized gains in the Statement of Operations and may be based on the performance of an underlying equity security, an equity index, or an option position. The risks of investing in equity-linked securities include
203
Table of Contents
unfavorable price movements in the underlying security and the credit risk of the issuing financial institution. There may be no guarantee of a return of principal with equity linked securities and the appreciation potential may be limited. Equity-linked securities may be more volatile and less liquid than other investments held by the Fund.
c. Fixed Income Securities
The Bond Funds, Defensive Market Strategies Fund and the Small Cap Equity Fund may invest in mortgage-related and other asset-backed securities. These securities include mortgage pass-through securities, collateralized mortgage obligations, commercial mortgage-backed securities, stripped mortgage-backed securities, asset-backed securities, collateralized debt obligations and other securities that directly or indirectly represent a participation in, or are secured by and payable from, mortgage loans on real property. Mortgage-related and other asset-backed securities are interests in pools of loans or other receivables. Mortgage-related securities are created from pools of residential or commercial mortgage loans, including mortgage loans made by savings and loan institutions, mortgage bankers, commercial banks and others. Asset-backed securities are created from many types of assets, including auto loans, credit card receivables, home equity loans, and student loans. These securities provide a monthly payment which consists of both interest and principal payments. Interest payments may be determined by fixed or adjustable rates. The rate of pre-payments on underlying mortgages will affect the price and volatility of a mortgage-related security and may have the effect of shortening or extending the effective duration of the security relative to what was anticipated at the time of purchase. The timely payment of principal and interest of certain mortgage-related securities is guaranteed with the full faith and credit of the United States Government. Pools created and guaranteed by non-governmental issuers, including government-sponsored corporations, may be supported by various forms of insurance or guarantees, but there can be no assurance that the private insurers or guarantors can meet their obligations under the insurance policies or guarantee arrangements.
Collateralized Mortgage Obligations (“CMOs”) are debt obligations of a legal entity that are collateralized by mortgages and divided into classes. CMOs are structured into multiple classes, often referred to as “tranches,” with each class bearing a different stated maturity and entitled to a different schedule for payments of principal and interest, including pre-payments. Commercial Mortgage-Backed Securities (“CMBS”) include securities that reflect an interest in, and are secured by, mortgage loans on commercial real property. Many of the risks of investing in CMBS reflect the risks of investing in the real estate securing the underlying mortgage loans. These risks reflect the effects of local and other economic conditions on real estate markets, the ability of tenants to make loan payments, and the ability of a property to attract and retain tenants. CMOs and CMBS may be less liquid and may exhibit greater price volatility than other types of mortgage- or asset-backed securities. Stripped Mortgage-Backed Securities (“SMBS”) are derivative multi-class mortgage securities. SMBS are usually structured with two classes that receive different proportions of the interest and principal distributions on a pool of mortgage assets. A common type of SMBS will have one class receiving some of the interest and most of the principal from the mortgage assets, while the other class will receive most of the interest and the remainder of the principal. In the most extreme case, one class will receive all of the interest (the interest-only or “IO” class), while the other class will receive the entire principal (the principal-only or “PO” class). Payments received for IOs are included in interest income on the Statements of Operations. Because little to no principal will be received at the maturity of an IO, adjustments are made to the book value of the security on a monthly basis until maturity. These adjustments are included in interest income on the Statements of Operations. Payments received for POs are treated as reductions to the cost and par value of the securities.
Inflation-indexed bonds are fixed-income securities whose principal value is periodically adjusted to the rate of inflation. The interest rate on these bonds is generally fixed at issuance at a rate lower than typical bonds. Over the life of an inflation-indexed bond, however, interest will be paid based on a principal value, which is adjusted for inflation. Any increase or decrease in the principal amount of an inflation-indexed bond will be included as interest income on the Statements of Operations, even though investors do not receive their principal until maturity.
204
Table of Contents
“TBA” (to be announced) purchase commitments are commitments to purchase securities for a fixed price at a future date, typically not exceeding 45 days. TBAs may be considered securities in themselves and involve a risk of loss if the value of the security to be purchased declines prior to settlement date. This risk is in addition to the risk of decline in each Fund’s other assets. Unsettled TBAs are valued at the current market value of the underlying securities, according to the procedures described in the section entitled “Valuation of Securities”.
During the period ended June 30, 2014, the Low-Duration Bond Fund and Medium-Duration Bond Fund entered into dollar roll transactions, pursuant to which they sell a mortgage-backed TBA or security and simultaneously purchase a similar, but not identical, TBA with the same issuer, rate and terms. The Funds may execute a “roll” to obtain better underlying mortgage securities or to increase yield. The Funds account for dollar roll transactions as purchases and sales, which has the effect of increasing their portfolio turnover rates. Risks associated with dollar rolls are that actual mortgages received by the Funds may be less favorable than those anticipated or that counterparties may fail to perform under the terms of the contracts.
TBA sale commitments are commitments to sell mortgage-backed securities for a fixed price at a future date. TBAs may be considered securities in themselves and involve a risk of loss if the value of the security to be sold increases prior to settlement date of the Fund’s other assets.
U.S. Government securities are obligations of and, in certain cases, guaranteed by, the U.S. Government, its agencies or instrumentalities. The U.S. Government does not guarantee the NAV of the Funds’ shares. Some U.S. Government securities, such as Treasury bills, notes and bonds, and securities guaranteed by the Government National Mortgage Association (“GNMA” or “Ginnie Mae”), are supported by the full faith and credit of the United States Government; others, such as those of the Federal Home Loan Bank, are supported by the right of the issuer to borrow from the U.S. Department of the Treasury (the “U.S. Treasury”); others, such as those of the Federal National Mortgage Association (“FNMA” or “Fannie Mae”), are supported by the discretionary authority of the U.S. Government to purchase the agency’s obligations; and still others, such as those of the Student Loan Marketing Association, are supported only by the credit of the instrumentality. U.S. Government securities may include zero coupon securities, which do not distribute interest on a current basis and tend to be subject to greater risk than interest-paying securities of similar maturities.
Government-related guarantors (i.e., not backed by the full faith and credit of the United States Government) include FNMA and the Federal Home Loan Mortgage Corporation (“FHLMC” or “Freddie Mac”). FNMA is a government-sponsored corporation, the common stock of which is owned entirely by private stockholders. FNMA purchases conventional (i.e., not insured or guaranteed by any government agency) residential mortgages from a list of approved seller/servicers which include state and federally chartered savings and loan associations, mutual savings banks, commercial banks and credit unions and mortgage bankers. Pass-through securities issued by FNMA are guaranteed as to timely payment of principal and interest by FNMA, but are not backed by the full faith and credit of the United States Government. FHLMC issues Participation Certificates (“PCs”), which are pass-through securities, each representing an undivided interest in a pool of residential mortgages. FHLMC guarantees the timely payment of interest and ultimate collection of principal, but PCs are not backed by the full faith and credit of the United States Government.
The U.S. Treasury has historically had the authority to purchase obligations of Fannie Mae and Freddie Mac (collectively, the “GSEs”). However, in 2008, due to capitalization concerns, Congress provided the U.S. Treasury with additional authority to lend the GSEs emergency funds and to purchase their stock. In September 2008, those capital concerns led the U.S. Treasury and the Federal Housing Finance Authority (“FHFA”) to announce that the GSEs had been placed in conservatorship.
205
Table of Contents
Since that time, the GSEs have received significant capital support through U.S. Treasury preferred stock purchases, as well as Treasury and Federal Reserve purchases, of their mortgage backed securities (“MBS”). The FHFA and the U.S. Treasury (through its agreement to purchase GSE preferred stock) have imposed strict limits on the size of their mortgage portfolios. While the MBS purchase programs ended in 2010, the U.S. Treasury announced in December 2009 that it would continue its support for the entities’ capital as necessary to prevent a negative net worth through at least 2012. While the U.S. Treasury was committed to offset negative equity at the GSEs through its preferred stock purchases through 2012, no assurance could be given that the Federal Reserve, U.S. Treasury, or FHFA initiatives would ensure that the GSEs would remain successful in meeting their obligations with respect to the debt and MBS they issue beyond that date.
The problems faced by the GSEs resulting in their being placed into federal conservatorship and receiving significant U.S. Government support have sparked serious debate among federal policy makers regarding the continued role of the U.S. Government in providing liquidity for mortgage loans. The Obama Administration produced a report to Congress on February 11, 2011 outlining a proposal to wind down the GSEs by increasing their guarantee fees, reducing their conforming loan limits (the maximum amount of each loan they are authorized to purchase), and continuing progressive limits on the size of their investment portfolio. Congress is currently considering several pieces of legislation that would reform the GSEs and possibly wind down their existence, addressing portfolio limits and guarantee fees, among other issues.
Based on quarterly loss figures, in August 2011, both GSEs requested additional support from the U.S. Treasury (Fannie Mae requested $2.8 billion and Freddie Mac requested $1.5 billion, net of dividend payments to the U.S. Treasury). In August 2012, the U.S. Treasury announced a set of modifications to the Preferred Stock Purchase Agreements between the U.S. Treasury and the FHFA. Instead of receiving 10% dividends from the GSEs, the U.S. Treasury will take a quarterly sweep of all profits earned by the firms going forward.
Serious discussions among policymakers continue, however, as to what role the U.S. Government should play in the U.S. housing market. Fannie Mae and Freddie Mac also are the subject to several continuing legal actions and investigations over certain accounting, disclosure or corporate governance matters, which (along with any resulting financial restatements) may continue to have an adverse effect on the guaranteeing entities. Importantly, the future of the GSEs is in serious question as the U.S. Government considers multiple options.
d. Foreign Currency Translations
Investment securities and other assets and liabilities denominated in foreign currencies are translated into U.S. dollar amounts at the date of valuation. Purchases and sales of investment securities and income and expense items denominated in foreign currencies are translated into U.S. dollar amounts on the respective dates of such transactions.
The Funds isolate that portion of the results of operations resulting from changes in foreign exchange rates on investments from the fluctuations arising from changes in market prices of securities held.
Reported net realized foreign exchange gains or losses arise from sales of portfolio securities, sales and maturities of short-term securities, sales of foreign currencies, currency gains or losses realized between the trade and settlement dates on securities transactions, and the difference between the amounts of dividends, interest, and foreign withholding taxes recorded on the Fund’s books and the U.S. dollar equivalent of the amounts actually received or paid. Net unrealized foreign exchange gains and losses arise from changes in the values of assets and liabilities, including investments in securities at fiscal period end, resulting from changes in the exchange rate.
206
Table of Contents
e. Loan Participations
The Bond Funds and the Small Cap Equity Fund may invest in direct debt instruments which are interests in amounts owed to lenders or lending syndicates by corporate borrowers. A Fund’s investments in loans may be in the form of participations in
loans. A loan is often administered by a bank or other financial institution (the “lender”) that acts as agent for all holders. The agent administers the terms of the loan, as specified in the loan agreement. A Fund may invest in multiple series or tranches of a loan, which may have varying terms and carry different associated risks. A Fund generally has no right to enforce compliance with the terms of the loan agreement with the borrower. As a result, a Fund may be subject to the credit risk of both the borrower and the lender that is selling the loan agreement. When investing in a loan participation, a Fund has the right to receive payments of principal, interest and any fees to which it is entitled only from the lender selling the loan agreement and only upon receipt of payments by the lender from the borrower. A Fund may receive a commitment fee based on the undrawn portion of the underlying line of credit portion of a floating rate loan. In certain circumstances, a Fund may receive a prepayment penalty fee upon the prepayment of a floating rate loan by a borrower. Fees earned or paid are recorded as a component of interest income or interest expense on the Statements of Operations.
f. PIPEs
The Small Cap Equity Fund invests in Private Investment in Public Equity (“PIPE”) securities. PIPES involve the purchase of securities directly from a publicly traded company by a Fund. PIPES are restricted securities and cannot be immediately resold into the public markets. These investments are valued at fair value as determined in accordance with the procedures approved by the Board of Trustees. Risks include the potential decline in the value of the publicly traded company, the potential dilution of shareholder equity and the inability of the Fund to liquidate the position quickly.
g. REITs
The Real Estate Securities Fund invests substantial assets in real estate investment trusts (“REITs”) that involve risks not associated with investing in stocks. Risks include declines in the value of real estate, general and economic conditions, changes in the value of the underlying property and defaults by borrowers. The value of assets in the real estate industry may go through cycles of relative underperformance and outperformance in comparison to equity securities markets in general.
Dividend income is recorded using management’s estimate of the income included in distributions received from REIT investments. The actual amounts of income, return of capital and capital gains are only determined by each REIT after its fiscal year-end and may differ from the estimated amount. Estimates of income are adjusted in the Funds to the actual amounts when the amounts are determined.
h. Repurchase Agreements
Each Fund may agree to purchase securities from financial institutions subject to the seller’s agreement to repurchase them at a mutually agreed upon date and price. It is the Fund’s policy that repurchase agreements are fully collateralized by U.S. Treasury and Government Agency securities. All collateral is held by the Fund’s custodian bank or a bank with which the custodian bank has entered into a subcustodian agreement, or is segregated in the Federal Reserve Book Entry System. In connection with transactions in repurchase agreements, if the seller defaults and the value of the collateral declines, or if the seller enters an insolvency proceeding, realization of the collateral by the Fund may be delayed or limited.
Repurchase transactions are entered into by the Funds under Master Repurchase Agreements (“MRA”) which permit the Funds, under certain circumstances including an event of default (such as bankruptcy or insolvency), to offset payables and/or receivables under the MRA with collateral held and/or posted to the counterparty and create one single net payment due to or from the Fund.
207
Table of Contents
At June 30, 2014, the open repurchase agreements by counterparty which are subject to an MRA on a net payment basis are as follows:
| Fund/Counterparty |
Repurchase Agreements |
Fair Value
of Non-cash Collateral Received |
Cash Collateral Received |
Net Amount(1) | ||||||||||||
| Money Market |
||||||||||||||||
| Goldman Sachs & Co. |
$ | 32,581,000 | $ | (32,581,000 | ) | $ | — | $ | — | |||||||
|
|
|
|
|
|
|
|
|
|||||||||
| (1) | Net amount represents the net amount receivable due from (payable to) the counterparty in the event of default. |
Additional information about master netting arrangements can be found in the Derivative Financial Instruments and Securities Lending sections of the Notes to Financial Statements.
i. Short Sales
A short sale is a transaction in which a Fund sells a security it does not own. The Fund’s obligation to replace the security borrowed and sold short will be fully collateralized at all times by cash equivalents deposited in an account with the Fund’s custodian. If the price of the security sold short increases between the time of the short sale and the time the Fund replaces the borrowed security, the Fund will realize a loss; and if the price declines during the period, the Fund will realize a gain. Any realized gain will be decreased, and any realized loss increased, by the amount of transaction costs.
The Equity Funds may sell short exchange-listed equity futures contracts to reduce market exposure. The Date Target Funds, Asset Allocation Funds, Bond Funds and Small Cap Equity Fund may sell short U.S. Treasury securities and exchange-listed U.S. Treasury futures contracts to reduce market exposure. The Low-Duration Bond and Medium-Duration Bond Funds will occasionally enter into a short sale to initiate a dollar roll transaction. The Defensive Market Strategies Fund may establish short positions in stocks of companies with a market value of up to 30% of the Fund’s assets. The International Equity Fund may establish short positions in stocks of foreign companies with a market value of up to 7% of the Fund’s assets.
At June 30, 2014, the value of securities sold short in the Low-Duration Bond, Medium-Duration Bond and International Equity Funds amounted to $3,116,467, $9,433,768 and $96,880,005, respectively.
j. Derivative Financial Instruments
The Funds may engage in various portfolio strategies to seek to increase their returns by hedging their portfolios against adverse movements in the equity, debt and currency markets. Losses may arise due to changes in the value of the contract if the counterparty does not perform under the contract. The Funds, in their normal course of business, may enter into contracts that contain a variety of representations and warranties and which provide general indemnifications. The Funds’ exposure may include future claims that may be made against the Funds that have not yet occurred.
Financial Futures Contracts — The Funds (except the Money Market Fund) may purchase or sell financial futures contracts and the options on such futures contracts for the purpose of hedging risk on existing securities, demonstrating purchase of securities or gaining market exposure on cash balances. Financial futures contracts are contracts for the delivery of securities at a specified future date at an agreed upon price or yield. Upon entering into a contract, the Funds deposit and maintain as collateral such initial margin as required by the exchange on which the transaction is effected.
Pursuant to the contract, the Funds agree to pay to or receive from the broker an amount of cash equal to the daily fluctuation in the value of the contract. Such payments or receipts are known as variation margin and are recorded by the Funds as unrealized gains or losses until the contract is closed or settled.
Risks of entering into futures contracts include the possibility that there will be an imperfect price correlation between the futures and the underlying securities. Second, it is possible that a lack of liquidity for futures contracts could exist in the secondary market, resulting in an inability to close a futures position prior to its maturity date. Third, the purchase of a futures contract involves the risk that a Fund could lose more than the original margin deposit required to initiate a futures transaction. Futures contracts involve, to varying degrees, risk of loss in excess of the variation margin disclosed on the Statements of Assets and Liabilities.
208
Table of Contents
Foreign Currency Options and Futures — The Bond Funds, Defensive Market Strategies Fund, Small Cap Equity Fund and International Equity Fund may also enter into futures contracts on foreign currencies and related options on transactions as a short or long hedge against possible variations in foreign exchange rates.
Forward Foreign Exchange Contracts — Certain Funds may enter into forward foreign currency exchange contracts to hedge against adverse exchange rate fluctuation to the U.S. dollar or between different foreign currencies in connection with either specific security transactions or portfolio positions. Each contract is valued daily and the change in value is recorded as an unrealized gain or loss. When the contract is closed, a realized gain or loss is recorded equal to the difference between the opening value and the closing value of the contract. These contracts may involve market risk in excess of the unrealized gain or loss reflected on the Statements of Assets and Liabilities. The Funds could be exposed to risk if the counterparties to the contracts are unable to meet the terms of the contract and from unanticipated movements in the value of a foreign currency relative to the U.S. dollar.
Options — Certain Funds are authorized to write and purchase put and call options. The risk in writing a call option is that the Funds give up the opportunity for profit if the market price of the security increases. The risk in writing a put option is that the Funds may incur a loss if the market price of the security decreases and the option is exercised. The risk in purchasing an option is that the Funds pay a premium whether or not the option is exercised. The Funds also have the additional risk of being unable to enter into a closing transaction at an acceptable price if a liquid secondary market does not exist. The Funds also may write over-the-counter options where completing the obligation depends upon the credit standing of the other party and that party’s ability to perform. Option contracts also involve the risk that they may not work as intended due to unanticipated developments in market conditions or other causes.
Options purchased are recorded as an asset, and written options are recorded as liabilities to the extent of premiums paid or received. Each Fund will realize a gain or loss when the option transaction expires or closes. When an option is exercised, the proceeds on sales for a written call option, the purchase cost for a written put option or the cost of a security for a purchased put or call option is adjusted by the amount of the premium received or paid.
When a Fund writes a call or put option, an amount equal to the premium received is recorded as a liability and subsequently marked to market to reflect the current value of the option written. These liabilities are reflected as written options outstanding on the Statements of Assets and Liabilities.
Certain Funds may write swaption contracts to manage exposure to fluctuations in interest rates and to enhance portfolio yield. Swaption contracts written by the Funds represent an option that gives the purchaser the right, but not the obligation, to enter into a previously agreed upon swap contract on a future date. If a written call swaption is exercised, the writer will enter a swap and is obligated to pay the fixed-rate and receive a floating rate in exchange. If a written put swaption is exercised, the writer will enter a swap and is obligated to pay the floating rate and receive a fixed rate in exchange. Swaptions are marked-to-market daily based upon quotations from market makers. When a Fund writes a swaption, the premium received is recorded as a liability and is subsequently adjusted to the current market value of the swaption. Entering into a swaption contract involves, to varying degrees, the elements of credit, market and interest rate risk in excess of the associated option and swap contract amounts reported in the Statement of Assets and Liabilities. The Funds bear the market risk arising from any change in index values or interest rates.
Swap Agreements — Each Select Fund, except the Money Market Fund, may enter into swap agreements. The Defensive Market Strategies Fund and Equity Funds may enter into equity swap contracts and the Bond Funds and the Small Cap Equity Fund may enter into interest rate and credit default swaps. The Bond Funds and International Equity Fund may enter into cross-currency swaps, and each Select Fund may enter into total return swaps.
209
Table of Contents
Swap agreements are privately negotiated agreements between a Fund and a counterparty to exchange or swap investment cash flows, assets, foreign currencies or market-linked returns at specified, future intervals. A swap may be entered into in order to, among other things, change the maturity of a Fund’s portfolio, to protect a Fund’s value from changes in interest rates, to expose a Fund to a different security or market, or to help a Fund achieve a strategy relative to an index or other benchmark. By entering into a swap agreement, a Fund is exposed to the risk of unanticipated movements in interest rates or in the value of an underlying security or index (or the risk that the counterparty will not fulfill its obligation under the agreement). Credit default swaps involve the payment of amounts based on a specified rate multiplied by a notional amount as well as upon an event of default. In connection with these agreements, securities are set aside as collateral by the Fund’s custodian.
Swaps are marked-to-market daily based upon values from third party vendors or quotations from market makers to the extent available and the change in value, if any, is recorded as an unrealized gain or loss on the Statements of Assets and Liabilities. In the event that market quotations are not readily available or deemed reliable, certain swap agreements may be valued pursuant to guidelines established by the Board of Trustees. In the event that market quotes are not readily available and the swap cannot be valued pursuant to one of the valuation methods, the value of the swap will be determined in good faith by the Valuation Committee of the Board of Trustees, generally based upon recommendations provided by the Fund’s sub-adviser.
Payments received or made at the beginning of the measurement period are reflected as such on the Statements of Assets and Liabilities and represent payments made or received upon entering into the swap agreement to compensate for differences between the stated terms of the swap agreement and prevailing market conditions (credit spreads, currency exchange rates, interest rates, and other relevant factors). These upfront payments are recorded as realized gains or losses on the Statements of Operations upon termination or maturity of the swap. A liquidation payment received or made at the termination of the swap is recorded as realized gain or loss on the Statements of Operations. Net periodic payments received or paid by a Fund are included as part of realized gains or losses on the Statements of Operations.
Certain of the Fund’s derivative agreements contain provisions that require the Fund to maintain a predetermined level of net assets, and/or provide limits regarding the decline of the Fund’s NAV over one-month, three-month and 12-month periods. If a Fund were to violate such provisions, the counterparties to the derivative instruments could request immediate payment or demand immediate collateralization on derivative instruments in net liability positions. For the period ended June 30, 2014, all of the Funds maintained the required level of net assets and/or the NAVs of the Funds did not decline below the limits set forth in the derivative agreements.
Entering into these agreements involves, to varying degrees, elements of credit, market and documentation risk in excess of the amounts recognized on the Statements of Assets and Liabilities. Such risks involve the possibility that there will be no liquid market for these agreements, that the counterparty to the agreements may default on its obligation to perform or disagree as to the meaning of contractual terms in the agreements and that there may be unfavorable changes in interest rates.
Credit Default Swaps — Credit default swap agreements involve one party making a stream of payments (referred to as the buyer of protection) to another party (the seller of protection) in exchange for the right to receive a specified return in the event of a default or other credit event for the referenced entity, obligation or index. As a seller of protection on credit default swap agreements, a Fund will generally receive from the buyer of protection a fixed rate of income throughout the
term of the swap provided that there is no credit event. As the seller, a Fund would effectively add leverage to its portfolio because, in addition to its total net assets, a Fund would be subject to investment exposure on the notional amount of the swap.
210
Table of Contents
Any upfront payments made or received upon entering a credit default swap contract are treated as part of the cost and are reflected as part of the unrealized gain (loss) on valuation. Upon termination of the swap contract, the amount included in the cost is reversed and becomes part of the swap’s realized gain (loss).
The sub-advisers monitor a variety of factors including cash flow assumptions, market activity, market sentiment and valuation as part of their ongoing process of assessing payment and performance risk. As payment and performance risk increases, the value of a credit default swap increases, resulting in recognition of unrealized gains for long positions and unrealized losses for short positions. Conversely, as payment and performance risk decreases, unrealized gains are recognized for short positions and unrealized losses are recognized for long positions. Any current or future declines in the fair value of the swap may be partially offset by upfront payments received by the Fund as a seller of protection if applicable. The change in value is recorded within unrealized appreciation (depreciation) until the occurrence of a credit event or the termination of the swap, at which time a realized gain (loss) is recorded.
If a Fund is a seller of protection and a credit event occurs, as defined under the terms of that particular swap agreement, a Fund will either (i) pay to the buyer of protection an amount equal to the notional amount of the swap and take delivery of the referenced obligation, other deliverable obligations or underlying securities comprising the referenced index or (ii) pay a net settlement amount in the form of cash or securities equal to the notional amount of the swap less the recovery value of the referenced obligation or underlying securities comprising the referenced index. If a Fund is a buyer of protection and a credit event occurs, as defined under the terms of that particular swap agreement, a Fund will either (i) receive from the seller of protection an amount equal to the notional amount of the swap and deliver the referenced obligation, other deliverable obligations or underlying securities comprising the referenced index or (ii) receive a net settlement amount in the form of cash or securities equal to the notional amount of the swap less the recovery value of the referenced obligation or underlying securities comprising the referenced index. Recovery values are assumed by market makers considering either industry standard recovery rates or entity specific factors and considerations until a credit event occurs. If a credit event has occurred, the recovery value is determined by a facilitated auction whereby a minimum number of allowable broker bids, together with a specified valuation method, are used to calculate the settlement value.
Credit default swap agreements on corporate issues or sovereign issues of an emerging country involve one party making a stream of payments to another party in exchange for the right to receive a specified return in the event of a default or other credit event. If a credit event occurs and cash settlement is not elected, a variety of other deliverable obligations may be delivered in lieu of the specific referenced obligation. The ability to deliver other obligations may result in a cheapest-to-deliver option (the buyer of protection’s right to choose the deliverable obligation with the lowest value following a credit event). A Fund may use credit default swaps on corporate issues or sovereign issues of an emerging country to provide a measure of protection against defaults of the issuers (i.e., to reduce risk where a Fund owns or has exposure to the referenced obligation) or to take an active long or short position with respect to the likelihood of a particular issuer’s default.
Credit default swap agreements on asset-backed securities involve one party making a stream of payments to another party in exchange for the right to receive a specified return in the event of a default or other credit event. Unlike credit default swaps on corporate issues or sovereign issues of an emerging country, deliverable obligations in most instances would be limited to the specific referenced obligation as performance for asset-backed securities can vary across deals. Prepayments, principal paydowns, and other write down or loss events on the underlying mortgage loans will reduce the outstanding
211
Table of Contents
principal balance of the referenced obligation. These reductions may be temporary or permanent as defined under the terms of the swap agreement and the notional amount for the swap agreement will be adjusted by corresponding amounts. A Fund may use credit default swaps on asset-backed securities to provide a measure of protection against defaults of the referenced obligation or to take an active long or short position with respect to the likelihood of a particular referenced obligation’s default.
Credit default swap agreements on credit indices involve one party making a stream of payments to another party in exchange for the right to receive a specified return in the event of a write-down, principal shortfall, interest shortfall or default of all or part of the referenced entities comprising the credit index. A credit index is a list of a basket of credit instruments or exposures designed to be representative of some part of the credit market as a whole. These indices are made up of reference credits that are judged by a poll of dealers to be the most liquid entities in the credit default swap market based on the sector of the index. Components of the indices may include, but are not limited to, investment grade securities, high yield securities, asset-backed securities, emerging markets, and/or various credit ratings within each sector. Credit indices are traded using credit default swaps with standardized terms including a fixed spread and standard maturity dates. An index credit default swap references all the names in the index, and if there is a default, the credit event is settled based on that name’s weight in the index. The composition of the indices changes periodically, usually every six months, and for most indices, each name has an equal weight in the index. A Fund may use credit default swaps on credit indices to hedge a portfolio of credit default swaps or bonds with a credit default swap on indices which is less expensive than it would be to buy many credit default swaps to achieve a similar effect. Credit-default swaps on indices are benchmarks for protecting investors owning bonds against default, and traders use them to speculate on changes in credit quality.
Implied credit spreads, represented in absolute terms, utilized in determining the market value of credit default swap agreements on corporate issues or sovereign issues of an emerging country as of period end are disclosed in the footnotes to the Schedules of Investments and serve as an indicator of the current status of the payment/performance risk and represent the likelihood or risk of default for the credit derivative. The implied credit spread of a particular referenced entity reflects the cost of buying/selling protection and may include upfront payments required to be made to enter into the agreement. For credit default swap agreements on asset-backed securities and credit indices, the quoted market prices and resulting values serve as the indicator of the current status of the payment/performance risk. Wider credit spreads and increasing market values, in absolute terms when compared to the notional amount of the swap, represent a deterioration of the referenced entity’s credit soundness and a greater likelihood or risk of default or other credit event occurring as defined under the terms of the agreement.
The maximum potential amount of future payments (undiscounted) that a Fund as a seller of protection could be required to make under a credit default swap agreement would be an amount equal to the notional amount of the agreement. These potential amounts would be partially offset by any recovery values of the respective referenced obligations, upfront payments received upon entering into the agreement, or net amounts received from the settlement of buy protection credit default swap agreements entered into by a Fund for the same referenced entity or entities.
Credit default swaps involve greater risks than if the Funds had invested in the referenced obligation directly. In addition to general market risks, credit default swaps are subject to liquidity risk and counterparty credit risk. The Funds enter into credit default swaps with counterparties meeting defined criteria for financial strength. A buyer also may lose its investment and recover nothing should a credit event not occur. If a credit event did occur, the value of the referenced obligation received by the seller, coupled with the periodic payments previously received, may be less than the full notional value it pays to the buyer, resulting in a loss of value.
212
Table of Contents
Exchange Traded Swap Agreements — Exchange traded swaps are either interest rate or credit default swap agreements brokered by the Chicago Mercantile Exchange (the “CME”) where the CME is the counterparty to both the buyer and seller of protection. Exchange traded swaps involve a lesser degree of risk because the CME, as counterparty, monitors risk factors for the involved parties. Exchange traded swaps are subject to general market risks and to liquidity risk. Pursuant to the agreement, the Funds agree to pay to or receive from the broker an amount of cash equal to the daily fluctuation in the value of the contract (the “Margin”) and daily interest on the margin. In the case of exchange traded interest rate swaps, the daily settlement also includes the daily portion of interest. Such payments are recorded by the Funds as unrealized gains or losses until the contract is closed or settled.
Exchange traded swaps require no payments at the beginning of the measurement period nor are there liquidation payments at the termination of the swap.
Cross-Currency Swap Agreements — Cross-currency swap agreements involve two parties exchanging two different currencies with an agreement to reverse the exchange at a later date at specified exchange rates. The exchange of currencies at the inception date of the contract takes place at the current spot rate. The re-exchange at maturity may take place at the same exchange rate, a specified rate, or the then current spot rate. Interest payments, if applicable, are made between the parties based on interest rates available in the two currencies at the inception of the contract. The terms of cross-currency swap contracts may extend for many years. Cross-currency swaps are usually negotiated with commercial and investment banks. Some cross-currency swaps may not provide for exchanging principal cash flows but only for exchanging interest cash flows.
Interest Rate Swap Agreements — Interest rate swap agreements involve the exchange by a Fund with another party of their respective commitments to pay or receive interest with respect to the notional amount of principal. Certain forms of interest rate swap agreements may include: (i) interest rate caps, under which, in return for a premium, one party agrees to make payments to the other to the extent that interest rates exceed a specified rate, or “cap”, (ii) interest rate floors, under which, in return for a premium, one party agrees to make payments to the other to the extent that interest rates fall below a specified rate, or “floor”, (iii) interest rate collars, under which a party sells a cap and purchases a floor or vice versa in an attempt to protect itself against interest rate movements exceeding given minimum or maximum levels, (iv) callable interest rate swaps, under which the counterparty may terminate the swap transaction in whole at zero cost by a predetermined date and time prior to the maturity date, (v) spread locks, which allow the interest rate swap users to lock in the forward differential (or spread) between the interest rate swap rate and a specified benchmark, or (vi) basis swap, under which two parties can exchange variable interest rates based on different money markets.
Total Return Swap Agreements — Total return swap agreements on commodities involve commitments where exchanged cash flows are based on the price of a commodity and in return receives either fixed or determined by floating price or rate. One party would receive payments based on the market value of the commodity involved and pay a fixed amount. Total return swap agreements on indices involve commitments to pay interest in exchange for a market-linked return. One counterparty pays out the total return of a specific reference asset, which may be an equity, index, or bond, and in return receives a regular stream of payments. To the extent the total return of the security or index underlying the transaction exceeds or falls short of the offsetting interest rate obligation, a Fund will receive a payment from or make a payment to the counterparty.
FASB “Derivatives and Hedging” includes required disclosure for (i) the nature and terms of the derivative, reasons for entering into the derivative, the events or circumstances that would require the seller to perform under the derivative, and the current status of the payment/performance risk of the derivative, (ii) the maximum potential amount of future payments (undiscounted) the seller could be required to make under the derivative, (iii) the fair value of the derivative, and (iv) the
213
Table of Contents
nature of any recourse provisions and assets held either as collateral or by third parties. FASB “Guarantees” require additional disclosures about the current status of the payment/performance risk of a guarantee. All of this information has been incorporated for the current period as part of the Schedules of Investments within the Swap agreements outstanding disclosure and in the Notes to Financial Statements.
As of June 30, 2014, the Low-Duration Bond Fund and the Medium-Duration Bond Fund are the buyers (“receiving protection”) on a total notional amount of $5,573,522 and $9,070,000, respectively, and the sellers (“providing protection”) on a total notional amount of $1,675,757 and $28,000,000, respectively. The notional amounts of the swaps are not recorded in the financial statements; however, the notional amount does approximate the maximum potential amount of future payments that the Funds could be required to make if the Funds were the seller of protection and a credit event were to occur. Those credit default swaps for which the Funds are providing protection at balance sheet date are summarized as follows:
| Written Credit Derivative Contracts | Single Name Credit Default Swaps |
Credit Default Swap Index |
||||||||||||||||||
| Reference Asset | Corporate Debt |
Sovereign Debt |
Asset-Backed Securities |
Corporate Debt |
Total | |||||||||||||||
| Low-Duration Bond Fund |
||||||||||||||||||||
| Fair value of written credit derivatives |
$ | 30,234 | $ | — | $ | (1,342 | ) | $ | — | $ | 28,892 | |||||||||
| Maximum potential amount of future payments |
1,300,000 | — | 375,757 | — | 1,675,757 | |||||||||||||||
| Recourse provisions with third parties to recover any amounts paid under the credit derivative (including any purchased credit protection) |
— | — | — | — | — | |||||||||||||||
| Collateral held by the Funds or other third parties which the Funds can obtain upon occurrence of triggering event |
— | — | — | — | — | |||||||||||||||
| Medium-Duration Bond Fund |
||||||||||||||||||||
| Fair value of written credit derivatives |
$ | 355,433 | $ | 27,241 | $ | 317,256 | $ | — | $ | 699,930 | ||||||||||
| Maximum potential amount of future payments |
4,100,000 | 6,700,000 | 17,200,000 | — | 28,000,000 | |||||||||||||||
| Recourse provisions with third parties to recover any amounts paid under the credit derivative (including any purchased credit protection) |
— | — | — | — | — | |||||||||||||||
| Collateral held by the Funds or other third parties which the Funds can obtain upon occurrence of triggering event |
— | — | — | — | — | |||||||||||||||
214
Table of Contents
The credit spread disclosed below for each referenced obligation where the Funds are the seller of protection is a representation of the current payment/performance risk of the swap.
| Maximum Potential Amount of Future Payments by Contract Term | ||||||||||||||||||||||||
| Current credit spread on underlying (in basis points) |
0-6 Months |
6-12 Months |
1-5 Years |
5-10 Years |
More Than 10 Years |
Total | ||||||||||||||||||
| Low-Duration Bond Fund |
||||||||||||||||||||||||
| 0 - 100 |
$ | — | $ | — | $ | 1,200,000 | $ | — | $ | 375,757 | $ | 1,575,757 | ||||||||||||
| 101 - 250 |
— | — | 100,000 | — | — | 100,000 | ||||||||||||||||||
| 251 - 500 |
— | — | — | — | — | — | ||||||||||||||||||
| 501 - 1,000 |
— | — | — | — | — | — | ||||||||||||||||||
| Greater than 1,000 |
— | — | — | — | — | — | ||||||||||||||||||
|
|
|
|
|
|
|
|
|
|
|
|
|
|||||||||||||
| Total |
$ | — | $ | — | $ | 1,300,000 | $ | — | $ | 375,757 | $ | 1,675,757 | ||||||||||||
|
|
|
|
|
|
|
|
|
|
|
|
|
|||||||||||||
| Medium-Duration Bond Fund |
||||||||||||||||||||||||
| 0 - 100 |
$ | — | $ | — | $ | 21,400,000 | $ | 5,600,000 | $ | — | $ | 27,000,000 | ||||||||||||
| 101 - 250 |
— | — | 1,000,000 | — | — | 1,000,000 | ||||||||||||||||||
| 251 - 500 |
— | — | — | — | — | — | ||||||||||||||||||
| 501 - 1,000 |
— | — | — | — | — | — | ||||||||||||||||||
| Greater than 1,000 |
— | — | — | — | — | — | ||||||||||||||||||
|
|
|
|
|
|
|
|
|
|
|
|
|
|||||||||||||
| Total |
$ | — | $ | — | $ | 22,400,000 | $ | 5,600,000 | $ | — | $ | 28,000,000 | ||||||||||||
|
|
|
|
|
|
|
|
|
|
|
|
|
|||||||||||||
Certain Funds are parties to International Swap and Derivatives Association, Inc. (“ISDA”) Master Agreements (“MA”) with various counterparties that govern over-the-counter derivative and foreign exchange contracts entered into from time to time. The ISDA MA may contain provisions regarding, among other things, the parties’ general obligations, representations, agreements, collateral requirements, events of default and early termination. With respect to certain counterparties, in accordance with the terms of the ISDA MA, collateral posted to the Fund is held in a segregated account by the Fund’s custodian and with respect to those amounts which can be sold or repledged, are presented in the Fund’s portfolio or Statements of Assets and Liabilities.
For financial reporting purposes, the Funds do not offset derivative assets and derivative liabilities that are subject to an ISDA MA in the Statements of Assets and Liabilities.
At June 30, 2014, derivative assets and liabilities (by type) held by the Funds are as follows:
| Fund | Assets | Liabilities | ||||||
| MyDestination 2005 |
||||||||
| Derivative Financial Instruments: |
||||||||
| Financial futures contracts |
$ | 120 | $ | — | ||||
|
|
|
|
|
|||||
| Total derivative assets and liabilities in the Statements of Assets and Liabilities |
120 | — | ||||||
| Derivatives not subject to an MA or similar agreement |
120 | — | ||||||
|
|
|
|
|
|||||
| Total assets and liabilities subject to an MA |
$ | — | $ | — | ||||
|
|
|
|
|
|||||
| MyDestination 2015 |
||||||||
| Derivative Financial Instruments: |
||||||||
| Financial futures contracts |
$ | 2,904 | $ | 800 | ||||
|
|
|
|
|
|||||
| Total derivative assets and liabilities in the Statements of Assets and Liabilities |
2,904 | 800 | ||||||
| Derivatives not subject to an MA or similar agreement |
2,904 | 800 | ||||||
|
|
|
|
|
|||||
| Total assets and liabilities subject to an MA |
$ | — | $ | — | ||||
|
|
|
|
|
|||||
215
Table of Contents
| Fund | Assets | Liabilities | ||||||
| MyDestination 2025 |
||||||||
| Derivative Financial Instruments: |
||||||||
| Financial futures contracts |
$ | 4,069 | $ | 1,600 | ||||
|
|
|
|
|
|||||
| Total derivative assets and liabilities in the Statements of Assets and Liabilities |
4,069 | 1,600 | ||||||
| Derivatives not subject to an MA or similar agreement |
4,069 | 1,600 | ||||||
|
|
|
|
|
|||||
| Total assets and liabilities subject to an MA |
$ | — | $ | — | ||||
|
|
|
|
|
|||||
| MyDestination 2035 |
||||||||
| Derivative Financial Instruments: |
||||||||
| Financial futures contracts |
$ | 3,042 | $ | 1,350 | ||||
|
|
|
|
|
|||||
| Total derivative assets and liabilities in the Statements of Assets and Liabilities |
3,042 | 1,350 | ||||||
| Derivatives not subject to an MA or similar agreement |
3,042 | 1,350 | ||||||
|
|
|
|
|
|||||
| Total assets and liabilities subject to an MA |
$ | — | $ | — | ||||
|
|
|
|
|
|||||
| MyDestination 2045 |
||||||||
| Derivative Financial Instruments: |
||||||||
| Financial futures contracts |
$ | 1,821 | $ | 1,120 | ||||
|
|
|
|
|
|||||
| Total derivative assets and liabilities in the Statements of Assets and Liabilities |
1,821 | 1,120 | ||||||
| Derivatives not subject to an MA or similar agreement |
1,821 | 1,120 | ||||||
|
|
|
|
|
|||||
| Total assets and liabilities subject to an MA |
$ | — | $ | — | ||||
|
|
|
|
|
|||||
| MyDestination 2055 |
||||||||
| Derivative Financial Instruments: |
||||||||
| Financial futures contracts |
$ | 80 | $ | — | ||||
|
|
|
|
|
|||||
| Total derivative assets and liabilities in the Statements of Assets and Liabilities |
80 | — | ||||||
| Derivatives not subject to an MA or similar agreement |
80 | — | ||||||
|
|
|
|
|
|||||
| Total assets and liabilities subject to an MA |
$ | — | $ | — | ||||
|
|
|
|
|
|||||
| Conservative Allocation |
||||||||
| Derivative Financial Instruments: |
||||||||
| Financial futures contracts |
$ | 897 | $ | 160 | ||||
|
|
|
|
|
|||||
| Total derivative assets and liabilities in the Statements of Assets and Liabilities |
897 | 160 | ||||||
| Derivatives not subject to an MA or similar agreement |
897 | 160 | ||||||
|
|
|
|
|
|||||
| Total assets and liabilities subject to an MA |
$ | — | $ | — | ||||
|
|
|
|
|
|||||
216
Table of Contents
| Fund | Assets | Liabilities | ||||||
| Balanced Allocation |
||||||||
| Derivative Financial Instruments: |
||||||||
| Financial futures contracts |
$ | 16,934 | $ | 3,680 | ||||
|
|
|
|
|
|||||
| Total derivative assets and liabilities in the Statements of Assets and Liabilities |
16,934 | 3,680 | ||||||
| Derivatives not subject to an MA or similar agreement |
16,934 | 3,680 | ||||||
|
|
|
|
|
|||||
| Total assets and liabilities subject to an MA |
$ | — | $ | — | ||||
|
|
|
|
|
|||||
| Growth Allocation |
||||||||
| Derivative Financial Instruments: |
||||||||
| Financial futures contracts |
$ | 11,094 | $ | 4,160 | ||||
|
|
|
|
|
|||||
| Total derivative assets and liabilities in the Statements of Assets and Liabilities |
11,094 | 4,160 | ||||||
| Derivatives not subject to an MA or similar agreement |
11,094 | 4,160 | ||||||
|
|
|
|
|
|||||
| Total assets and liabilities subject to an MA |
$ | — | $ | — | ||||
|
|
|
|
|
|||||
| Aggressive Allocation |
||||||||
| Derivative Financial Instruments: |
||||||||
| Financial futures contracts |
$ | 7,220 | $ | 4,960 | ||||
|
|
|
|
|
|||||
| Total derivative assets and liabilities in the Statements of Assets and Liabilities |
7,220 | 4,960 | ||||||
| Derivatives not subject to an MA or similar agreement |
7,220 | 4,960 | ||||||
|
|
|
|
|
|||||
| Total assets and liabilities subject to an MA |
$ | — | $ | — | ||||
|
|
|
|
|
|||||
| Conservative Allocation I |
||||||||
| Derivative Financial Instruments: |
||||||||
| Financial futures contracts |
$ | 40 | $ | — | ||||
|
|
|
|
|
|||||
| Total derivative assets and liabilities in the Statements of Assets and Liabilities |
40 | — | ||||||
| Derivatives not subject to an MA or similar agreement |
40 | — | ||||||
|
|
|
|
|
|||||
| Total assets and liabilities subject to an MA |
$ | — | $ | — | ||||
|
|
|
|
|
|||||
| Balanced Allocation I |
||||||||
| Derivative Financial Instruments: |
||||||||
| Financial futures contracts |
$ | 3,991 | $ | 800 | ||||
|
|
|
|
|
|||||
| Total derivative assets and liabilities in the Statements of Assets and Liabilities |
3,991 | 800 | ||||||
| Derivatives not subject to an MA or similar agreement |
3,991 | 800 | ||||||
|
|
|
|
|
|||||
| Total assets and liabilities subject to an MA |
$ | — | $ | — | ||||
|
|
|
|
|
|||||
| Growth Allocation I |
||||||||
| Derivative Financial Instruments: |
||||||||
| Financial futures contracts |
$ | 2,375 | $ | 800 | ||||
|
|
|
|
|
|||||
| Total derivative assets and liabilities in the Statements of Assets and Liabilities |
2,375 | 800 | ||||||
| Derivatives not subject to an MA or similar agreement |
2,375 | 800 | ||||||
|
|
|
|
|
|||||
| Total assets and liabilities subject to an MA |
$ | — | $ | — | ||||
|
|
|
|
|
|||||
| Aggressive Allocation I |
||||||||
| Derivative Financial Instruments: |
||||||||
| Financial futures contracts |
$ | 1,415 | $ | 960 | ||||
|
|
|
|
|
|||||
| Total derivative assets and liabilities in the Statements of Assets and Liabilities |
1,415 | 960 | ||||||
| Derivatives not subject to an MA or similar agreement |
1,415 | 960 | ||||||
|
|
|
|
|
|||||
| Total assets and liabilities subject to an MA |
$ | — | $ | — | ||||
|
|
|
|
|
|||||
217
Table of Contents
| Fund | Assets | Liabilities | ||||||
| Low-Duration Bond |
||||||||
| Derivative Financial Instruments: |
||||||||
| Financial futures contracts |
$ | 37,533 | $ | 73,476 | ||||
| Forward foreign exchange contracts |
590,242 | 971,466 | ||||||
| Options |
— | 558 | ||||||
| Swaps |
426,777 | 1,051,175 | ||||||
|
|
|
|
|
|||||
| Total derivative assets and liabilities in the Statements of Assets and Liabilities |
1,054,552 | 2,096,675 | ||||||
| Derivatives not subject to an MA or similar agreement |
281,494 | 386,361 | ||||||
|
|
|
|
|
|||||
| Total assets and liabilities subject to an MA |
$ | 773,058 | $ | 1,710,314 | ||||
|
|
|
|
|
|||||
| Medium-Duration Bond |
||||||||
| Derivative Financial Instruments: |
||||||||
| Financial futures contracts |
$ | 26,588 | $ | 10,816 | ||||
| Forward foreign exchange contracts |
518,976 | 607,698 | ||||||
| Options |
360,886 | 561,232 | ||||||
| Swaps |
1,625,877 | 1,214,263 | ||||||
|
|
|
|
|
|||||
| Total derivative assets and liabilities in the Statements of Assets and Liabilities |
2,532,327 | 2,394,009 | ||||||
| Derivatives not subject to an MA or similar agreement |
997,917 | 1,119,664 | ||||||
|
|
|
|
|
|||||
| Total assets and liabilities subject to an MA |
$ | 1,534,410 | $ | 1,274,345 | ||||
|
|
|
|
|
|||||
| Global Bond |
||||||||
| Derivative Financial Instruments: |
||||||||
| Financial futures contracts |
$ | — | $ | 9,339 | ||||
| Forward foreign exchange contracts |
383,611 | 417,172 | ||||||
|
|
|
|
|
|||||
| Total derivative assets and liabilities in the Statements of Assets and Liabilities |
383,611 | 426,511 | ||||||
| Derivatives not subject to an MA or similar agreement |
— | 9,339 | ||||||
|
|
|
|
|
|||||
| Total assets and liabilities subject to an MA |
$ | 383,611 | $ | 417,172 | ||||
|
|
|
|
|
|||||
| Defensive Market Strategies |
||||||||
| Derivative Financial Instruments: |
||||||||
| Financial futures contracts |
$ | 3,700 | $ | — | ||||
| Forward foreign exchange contracts |
21 | 47,086 | ||||||
| Options |
— | 195,590 | ||||||
|
|
|
|
|
|||||
| Total derivative assets and liabilities in the Statements of Assets and Liabilities |
3,721 | 242,676 | ||||||
| Derivatives not subject to an MA or similar agreement |
3,721 | 242,676 | ||||||
|
|
|
|
|
|||||
| Total assets and liabilities subject to an MA |
$ | — | $ | — | ||||
|
|
|
|
|
|||||
| Equity Index |
||||||||
| Derivative Financial Instruments: |
||||||||
| Financial futures contracts |
$ | 3,076 | $ | — | ||||
|
|
|
|
|
|||||
| Total derivative assets and liabilities in the Statements of Assets and Liabilities |
3,076 | — | ||||||
| Derivatives not subject to an MA or similar agreement |
3,076 | — | ||||||
|
|
|
|
|
|||||
| Total assets and liabilities subject to an MA |
$ | — | $ | — | ||||
|
|
|
|
|
|||||
| Value Equity |
||||||||
| Derivative Financial Instruments: |
||||||||
| Financial futures contracts |
$ | 8,080 | $ | — | ||||
|
|
|
|
|
|||||
| Total derivative assets and liabilities in the Statements of Assets and Liabilities |
8,080 | — | ||||||
| Derivatives not subject to an MA or similar agreement |
8,080 | — | ||||||
|
|
|
|
|
|||||
| Total assets and liabilities subject to an MA |
$ | — | $ | — | ||||
|
|
|
|
|
|||||
218
Table of Contents
| Fund | Assets | Liabilities | ||||||
| Growth Equity |
||||||||
| Derivative Financial Instruments: |
||||||||
| Financial futures contracts |
$ | 14,120 | $ | — | ||||
|
|
|
|
|
|||||
| Total derivative assets and liabilities in the Statements of Assets and Liabilities |
14,120 | — | ||||||
| Derivatives not subject to an MA or similar agreement |
14,120 | — | ||||||
|
|
|
|
|
|||||
| Total assets and liabilities subject to an MA |
$ | — | $ | — | ||||
|
|
|
|
|
|||||
| Small Cap Equity |
||||||||
| Derivative Financial Instruments: |
||||||||
| Financial futures contracts |
$ | 184,260 | $ | — | ||||
|
|
|
|
|
|||||
| Total derivative assets and liabilities in the Statements of Assets and Liabilities |
184,260 | — | ||||||
| Derivatives not subject to an MA or similar agreement |
184,260 | — | ||||||
|
|
|
|
|
|||||
| Total assets and liabilities subject to an MA |
$ | — | $ | — | ||||
|
|
|
|
|
|||||
| International Equity |
||||||||
| Derivative Financial Instruments: |
||||||||
| Financial futures contracts |
$ | 1,170,378 | $ | 193,685 | ||||
| Forward foreign exchange contracts |
2,976,493 | 2,142,193 | ||||||
|
|
|
|
|
|||||
| Total derivative assets and liabilities in the Statements of Assets and Liabilities |
4,146,871 | 2,335,878 | ||||||
| Derivatives not subject to an MA or similar agreement |
1,170,378 | 193,685 | ||||||
|
|
|
|
|
|||||
| Total assets and liabilities subject to an MA |
$ | 2,976,493 | $ | 2,142,193 | ||||
|
|
|
|
|
|||||
| Emerging Markets Equity |
||||||||
| Derivative Financial Instruments: |
||||||||
| Financial futures contracts |
$ | 76,871 | $ | 317,945 | ||||
| Forward foreign exchange contracts |
646,544 | 833,292 | ||||||
|
|
|
|
|
|||||
| Total derivative assets and liabilities in the Statements of Assets and Liabilities |
723,415 | 1,151,237 | ||||||
| Derivatives not subject to an MA or similar agreement |
76,871 | 317,945 | ||||||
|
|
|
|
|
|||||
| Total assets and liabilities subject to an MA |
$ | 646,544 | $ | 833,292 | ||||
|
|
|
|
|
|||||
| Inflation Protected Bond |
||||||||
| Derivative Financial Instruments: |
||||||||
| Financial futures contracts |
$ | 5,005 | $ | 92,513 | ||||
| Forward foreign exchange contracts |
33,283 | 307,798 | ||||||
| Options |
37,850 | 8,063 | ||||||
|
|
|
|
|
|||||
| Total derivative assets and liabilities in the Statements of Assets and Liabilities |
76,138 | 408,374 | ||||||
| Derivatives not subject to an MA or similar agreement |
42,855 | 100,576 | ||||||
|
|
|
|
|
|||||
| Total assets and liabilities subject to an MA |
$ | 33,283 | $ | 307,798 | ||||
|
|
|
|
|
|||||
| Real Estate Securities |
||||||||
| Derivative Financial Instruments: |
||||||||
| Financial futures contracts |
$ | 27,470 | $ | — | ||||
|
|
|
|
|
|||||
| Total derivative assets and liabilities in the Statements of Assets and Liabilities |
27,470 | — | ||||||
| Derivatives not subject to an MA or similar agreement |
27,470 | — | ||||||
|
|
|
|
|
|||||
| Total assets and liabilities subject to an MA |
$ | — | $ | — | ||||
|
|
|
|
|
|||||
219
Table of Contents
At June 30, 2014, derivative assets and liabilities by counterparty net of amounts available for offset under an MA and net of the related collateral (received)/pledged by the Trust are as follows:
| Fund/Sub-adviser/Counterparty | Derivative Assets Subject to an MA |
Derivative Liabilities Subject to an MA |
Value of Derivatives Subject to an MA |
Collateral (Received)/ Pledged |
Net Exposure | |||||||||||||||
| Low-Duration Bond |
||||||||||||||||||||
| Sub-adviser A |
||||||||||||||||||||
| Other Counterparties* |
$ | 358,428 | $ | (508,628 | ) | $ | (150,200 | ) | $ | — | $ | (150,200 | ) | |||||||
|
|
|
|
|
|
|
|
|
|
|
|||||||||||
| Sub-adviser B |
||||||||||||||||||||
| GSC |
7,206 | (723,640 | ) | (716,434 | ) | — | (716,434 | ) | ||||||||||||
| Other Counterparties* |
407,424 | (478,046 | ) | (70,622 | ) | — | (70,622 | ) | ||||||||||||
|
|
|
|
|
|
|
|
|
|
|
|||||||||||
| 414,630 | (1,201,686 | ) | (787,056 | ) | — | (787,056 | ) | |||||||||||||
|
|
|
|
|
|
|
|
|
|
|
|||||||||||
| Total Derivatives |
$ | 773,058 | $ | (1,710,314 | ) | $ | (937,256 | ) | $ | — | $ | (937,256 | ) | |||||||
|
|
|
|
|
|
|
|
|
|
|
|||||||||||
| Medium-Duration Bond |
||||||||||||||||||||
| Sub-adviser A |
||||||||||||||||||||
| Other Counterparties* |
$ | 335,789 | $ | (335,788 | ) | $ | 1 | $ | 5,119 | $ | 5,120 | |||||||||
|
|
|
|
|
|
|
|
|
|
|
|||||||||||
| Sub-adviser B |
||||||||||||||||||||
| Other Counterparties* |
944,005 | (849,083 | ) | 94,922 | — | 94,922 | ||||||||||||||
|
|
|
|
|
|
|
|
|
|
|
|||||||||||
| Sub-adviser C |
||||||||||||||||||||
| Other Counterparties* |
254,616 | (89,474 | ) | 165,142 | — | 165,142 | ||||||||||||||
|
|
|
|
|
|
|
|
|
|
|
|||||||||||
| Total Derivatives |
$ | 1,534,410 | $ | (1,274,345 | ) | $ | 260,065 | $ | 5,119 | $ | 265,184 | |||||||||
|
|
|
|
|
|
|
|
|
|
|
|||||||||||
| Global Bond |
||||||||||||||||||||
| Sub-adviser A |
||||||||||||||||||||
| Other Counterparties* |
$ | 383,611 | $ | (417,172 | ) | $ | (33,561 | ) | $ | — | $ | (33,561 | ) | |||||||
|
|
|
|
|
|
|
|
|
|
|
|||||||||||
| International Equity |
||||||||||||||||||||
| Sub-adviser A |
||||||||||||||||||||
| Other Counterparties* |
$ | 2,976,493 | $ | (2,054,976 | ) | $ | 921,517 | $ | (921,517 | ) | $ | — | ||||||||
|
|
|
|
|
|
|
|
|
|
|
|||||||||||
| Sub-adviser B |
||||||||||||||||||||
| Other Counterparties* |
— | (87,217 | ) | (87,217 | ) | — | (87,217 | ) | ||||||||||||
|
|
|
|
|
|
|
|
|
|
|
|||||||||||
| Total Derivatives |
$ | 2,976,493 | $ | (2,142,193 | ) | $ | 834,300 | $ | (921,517 | ) | $ | (87,217 | ) | |||||||
|
|
|
|
|
|
|
|
|
|
|
|||||||||||
| Emerging Markets Equity |
||||||||||||||||||||
| Sub-adviser A |
||||||||||||||||||||
| Other Counterparties* |
$ | 646,544 | $ | (833,292 | ) | $ | (186,748 | ) | $ | 186,748 | $ | — | ||||||||
|
|
|
|
|
|
|
|
|
|
|
|||||||||||
| Inflation Protected Bond |
||||||||||||||||||||
| Sub-adviser A |
||||||||||||||||||||
| UBS |
$ | 22,528 | $ | (163,206 | ) | $ | (140,678 | ) | $ | — | $ | (140,678 | ) | |||||||
| Other Counterparties* |
10,755 | (144,592 | ) | (133,837 | ) | — | (133,837 | ) | ||||||||||||
|
|
|
|
|
|
|
|
|
|
|
|||||||||||
| Total Derivatives |
$ | 33,283 | $ | (307,798 | ) | $ | (274,515 | ) | $ | — | $ | (274,515 | ) | |||||||
|
|
|
|
|
|
|
|
|
|
|
|||||||||||
| * | Other Counterparties represent amounts that are held with counterparties where the absolute value of the total is less than 0.05% of the net assets of the respective Fund. Those holdings are deemed immaterial to the respective Fund and are listed collectively. |
Additional information about master netting arrangements can be found in the Repurchase Agreements and Securities Lending sections of the Notes to Financial Statements.
220
Table of Contents
Derivative Holdings Categorized by Risk Exposure
FASB “Derivatives and Hedging” also requires all companies to disclose information intended to enable financial statement users to understand how and why the entity uses derivative instruments, how derivatives are accounted for, and how derivative instruments affect the entity’s financial position, results of operations, and cash flows.
| Location on the Statements of Assets and Liabilities | ||||
| Derivative Type |
Asset Derivatives |
Liability Derivatives | ||
| Interest rate contracts |
Investments in securities of unaffiliated issuers, at value | Options written at value | ||
| Receivables: Variation margin* | Payables: Variation margin* | |||
| Unrealized appreciation on swap agreements | Unrealized depreciation on swap agreements | |||
| Foreign exchange contracts |
Investments in securities of unaffiliated issuers, at value | Options written at value | ||
| Unrealized appreciation on foreign currency exchange contracts | Unrealized depreciation on foreign currency exchange contracts | |||
| Credit contracts |
Unrealized appreciation on swap agreements | Unrealized depreciation on swap agreements | ||
| Equity contracts |
Investments in securities of unaffiliated issuers, at value | Options written at value | ||
| Receivables: Variation margin* | Payables: Variation margin* | |||
| * | The variation margin shown on the Statements of Assets and Liabilities is the daily change in the unrealized appreciation (depreciation) for open futures and exchange traded swap contracts.The variation margin presented below is the cumulative change in unrealized appreciation (depreciation) from the date the contract was opened until June 30, 2014. |
| Asset Derivative Value | ||||||||||||||||||||
| Fund | Total
Value at 06/30/14 |
Interest Rate Contracts |
Foreign Exchange Contracts |
Credit Contracts |
Equity Contracts |
|||||||||||||||
| MyDestination 2005 Futures |
$ | 8,762 | $ | — | $ | — | $ | — | $ | 8,762 | ||||||||||
|
|
|
|
|
|
|
|
|
|
|
|||||||||||
| MyDestination 2015 Futures |
$ | 46,717 | $ | 3,419 | $ | — | $ | — | $ | 43,298 | ||||||||||
|
|
|
|
|
|
|
|
|
|
|
|||||||||||
| MyDestination 2025 Futures |
$ | 69,168 | $ | 4,120 | $ | — | $ | — | $ | 65,048 | ||||||||||
|
|
|
|
|
|
|
|
|
|
|
|||||||||||
| MyDestination 2035 Futures |
$ | 58,163 | $ | 1,892 | $ | — | $ | — | $ | 56,271 | ||||||||||
|
|
|
|
|
|
|
|
|
|
|
|||||||||||
| MyDestination 2045 Futures |
$ | 43,327 | $ | 360 | $ | — | $ | — | $ | 42,967 | ||||||||||
|
|
|
|
|
|
|
|
|
|
|
|||||||||||
| MyDestination 2055 Futures |
$ | 5,840 | $ | — | $ | — | $ | — | $ | 5,840 | ||||||||||
|
|
|
|
|
|
|
|
|
|
|
|||||||||||
| Conservative Allocation Futures |
$ | 13,010 | $ | (547 | ) | $ | — | $ | — | $ | 13,557 | |||||||||
|
|
|
|
|
|
|
|
|
|
|
|||||||||||
| Balanced Allocation Futures |
$ | 169,112 | $ | 20,925 | $ | — | $ | — | $ | 148,187 | ||||||||||
|
|
|
|
|
|
|
|
|
|
|
|||||||||||
| Growth Allocation Futures |
$ | 185,556 | $ | 8,774 | $ | — | $ | — | $ | 176,782 | ||||||||||
|
|
|
|
|
|
|
|
|
|
|
|||||||||||
| Aggressive Allocation Futures |
$ | 176,839 | $ | — | $ | — | $ | — | $ | 176,839 | ||||||||||
|
|
|
|
|
|
|
|
|
|
|
|||||||||||
| Conservative Allocation I Futures |
$ | 2,702 | $ | — | $ | — | $ | — | $ | 2,702 | ||||||||||
|
|
|
|
|
|
|
|
|
|
|
|||||||||||
221
Table of Contents
| Asset Derivative Value | ||||||||||||||||||||
| Fund | Total
Value at 06/30/14 |
Interest Rate Contracts |
Foreign Exchange Contracts |
Credit Contracts |
Equity Contracts |
|||||||||||||||
| Balanced Allocation I Futures |
$ | 41,605 | $ | 4,793 | $ | — | $ | — | $ | 36,812 | ||||||||||
|
|
|
|
|
|
|
|
|
|
|
|||||||||||
| Growth Allocation I Futures |
$ | 42,052 | $ | 2,369 | $ | — | $ | — | $ | 39,683 | ||||||||||
|
|
|
|
|
|
|
|
|
|
|
|||||||||||
| Aggressive Allocation I Futures |
$ | 33,649 | $ | — | $ | — | $ | — | $ | 33,649 | ||||||||||
|
|
|
|
|
|
|
|
|
|
|
|||||||||||
| Low-Duration Bond |
||||||||||||||||||||
| Forwards |
$ | 590,242 | $ | — | $ | 590,242 | $ | — | $ | — | ||||||||||
| Futures |
204,001 | 204,001 | — | — | — | |||||||||||||||
| Swaps |
426,777 | 361,894 | — | 64,883 | — | |||||||||||||||
|
|
|
|
|
|
|
|
|
|
|
|||||||||||
| Totals |
$ | 1,221,020 | $ | 565,895 | $ | 590,242 | $ | 64,883 | $ | — | ||||||||||
|
|
|
|
|
|
|
|
|
|
|
|||||||||||
| Medium-Duration Bond |
||||||||||||||||||||
| Forwards |
$ | 518,976 | $ | — | $ | 518,976 | $ | — | $ | — | ||||||||||
| Futures |
254,641 | 254,641 | — | — | — | |||||||||||||||
| Purchased Options |
360,886 | 360,560 | 326 | — | — | |||||||||||||||
| Swaps |
1,625,877 | 1,082,206 | — | 543,671 | — | |||||||||||||||
|
|
|
|
|
|
|
|
|
|
|
|||||||||||
| Totals |
$ | 2,760,380 | $ | 1,697,407 | $ | 519,302 | $ | 543,671 | $ | — | ||||||||||
|
|
|
|
|
|
|
|
|
|
|
|||||||||||
| Global Bond Fund |
||||||||||||||||||||
| Forwards |
$ | 383,611 | $ | — | $ | 383,611 | $ | — | $ | — | ||||||||||
|
|
|
|
|
|
|
|
|
|
|
|||||||||||
| Totals |
$ | 383,611 | $ | — | $ | 383,611 | $ | — | $ | — | ||||||||||
|
|
|
|
|
|
|
|
|
|
|
|||||||||||
| Defensive Market Strategies |
||||||||||||||||||||
| Forwards |
$ | 21 | $ | — | $ | 21 | $ | — | $ | — | ||||||||||
| Futures |
198,923 | — | — | — | 198,923 | |||||||||||||||
|
|
|
|
|
|
|
|
|
|
|
|||||||||||
| Totals |
$ | 198,944 | $ | — | $ | 21 | $ | — | $ | 198,923 | ||||||||||
|
|
|
|
|
|
|
|
|
|
|
|||||||||||
| Equity Index Futures |
$ | 212,686 | $ | — | $ | — | $ | — | $ | 212,686 | ||||||||||
|
|
|
|
|
|
|
|
|
|
|
|||||||||||
| Value Equity Futures |
$ | 382,902 | $ | — | $ | — | $ | — | $ | 382,902 | ||||||||||
|
|
|
|
|
|
|
|
|
|
|
|||||||||||
| Growth Equity Fund Futures |
$ | 871,985 | $ | — | $ | — | $ | — | $ | 871,985 | ||||||||||
|
|
|
|
|
|
|
|
|
|
|
|||||||||||
| Small Cap Equity Futures |
$ | 674,015 | $ | — | $ | — | $ | — | $ | 674,015 | ||||||||||
|
|
|
|
|
|
|
|
|
|
|
|||||||||||
| International Equity |
||||||||||||||||||||
| Forwards |
$ | 2,976,493 | $ | — | $ | 2,976,493 | $ | — | $ | — | ||||||||||
| Futures |
(634,772 | ) | — | — | — | (634,772 | ) | |||||||||||||
|
|
|
|
|
|
|
|
|
|
|
|||||||||||
| Totals |
$ | 2,341,721 | $ | — | $ | 2,976,493 | $ | — | $ | (634,772 | ) | |||||||||
|
|
|
|
|
|
|
|
|
|
|
|||||||||||
| Emerging Markets Equity |
||||||||||||||||||||
| Forwards |
$ | 646,544 | $ | — | $ | 646,544 | $ | — | $ | — | ||||||||||
| Futures |
(192,086 | ) | — | — | — | (192,086 | ) | |||||||||||||
|
|
|
|
|
|
|
|
|
|
|
|||||||||||
| Totals |
$ | 454,458 | $ | — | $ | 646,544 | $ | — | $ | (192,086 | ) | |||||||||
|
|
|
|
|
|
|
|
|
|
|
|||||||||||
| Inflation Protected Bond |
||||||||||||||||||||
| Forwards |
$ | 33,283 | $ | — | $ | 33,283 | $ | — | $ | — | ||||||||||
| Futures |
46,813 | 46,813 | — | — | — | |||||||||||||||
| Purchased Options |
37,850 | 37,850 | — | — | — | |||||||||||||||
|
|
|
|
|
|
|
|
|
|
|
|||||||||||
| Totals |
$ | 117,946 | $ | 84,663 | $ | 33,283 | $ | — | $ | — | ||||||||||
|
|
|
|
|
|
|
|
|
|
|
|||||||||||
222
Table of Contents
| Asset Derivative Value | ||||||||||||||||||||
| Fund | Total
Value at 06/30/14 |
Interest Rate Contracts |
Foreign Exchange Contracts |
Credit Contracts |
Equity Contracts |
|||||||||||||||
| Real Estate Securities Futures |
$ | 83,557 | $ | — | $ | — | $ | — | $ | 83,557 | ||||||||||
|
|
|
|
|
|
|
|
|
|
|
|||||||||||
| Liability Derivative Value | ||||||||||||||||||||
| Fund | Total
Value at 06/30/14 |
Interest Rate Contracts |
Foreign Exchange Contracts |
Credit Contracts |
Equity Contracts |
|||||||||||||||
| Low-Duration Bond |
||||||||||||||||||||
| Forwards |
$ | 971,466 | $ | — | $ | 971,466 | $ | — | $ | — | ||||||||||
| Futures |
27,701 | 27,701 | — | — | — | |||||||||||||||
| Swaps |
1,051,175 | 327,410 | — | 723,765 | — | |||||||||||||||
| Written Options |
558 | 558 | — | — | — | |||||||||||||||
|
|
|
|
|
|
|
|
|
|
|
|||||||||||
| Totals |
$ | 2,050,900 | $ | 355,669 | $ | 971,466 | $ | 723,765 | $ | — | ||||||||||
|
|
|
|
|
|
|
|
|
|
|
|||||||||||
| Medium-Duration Bond |
||||||||||||||||||||
| Forwards |
$ | 607,698 | $ | — | $ | 607,698 | $ | — | $ | — | ||||||||||
| Futures |
616,326 | 611,312 | 5,014 | — | — | |||||||||||||||
| Swaps |
1,214,263 | 997,289 | — | 216,974 | — | |||||||||||||||
| Written Options |
561,232 | 559,524 | 1,708 | — | — | |||||||||||||||
|
|
|
|
|
|
|
|
|
|
|
|||||||||||
| Totals |
$ | 2,999,519 | $ | 2,168,125 | $ | 614,420 | $ | 216,974 | $ | — | ||||||||||
|
|
|
|
|
|
|
|
|
|
|
|||||||||||
| Global Bond Fund |
||||||||||||||||||||
| Forwards |
$ | 417,172 | $ | — | $ | 417,172 | $ | — | $ | — | ||||||||||
| Futures |
105,403 | 105,403 | — | — | — | |||||||||||||||
|
|
|
|
|
|
|
|
|
|
|
|||||||||||
| Totals |
$ | 522,575 | $ | 105,403 | $ | 417,172 | $ | — | $ | — | ||||||||||
|
|
|
|
|
|
|
|
|
|
|
|||||||||||
| Defensive Market Strategies |
||||||||||||||||||||
| Forwards |
$ | 47,086 | $ | — | $ | 47,086 | $ | — | $ | — | ||||||||||
| Written Options |
195,590 | — | — | — | 195,590 | |||||||||||||||
|
|
|
|
|
|
|
|
|
|
|
|||||||||||
| Totals |
$ | 242,676 | $ | — | $ | 47,086 | $ | — | $ | 195,590 | ||||||||||
|
|
|
|
|
|
|
|
|
|
|
|||||||||||
| International Equity |
||||||||||||||||||||
| Forwards |
$ | 2,142,193 | $ | — | $ | 2,142,193 | $ | — | $ | — | ||||||||||
| Futures |
(609,091 | ) | — | — | — | (609,091 | ) | |||||||||||||
|
|
|
|
|
|
|
|
|
|
|
|||||||||||
| Totals |
$ | 1,533,102 | $ | — | $ | 2,142,193 | $ | — | $ | (609,091 | ) | |||||||||
|
|
|
|
|
|
|
|
|
|
|
|||||||||||
| Emerging Markets Equity |
||||||||||||||||||||
| Forwards |
$ | 833,292 | $ | — | $ | 833,292 | $ | — | $ | — | ||||||||||
| Futures |
(28,009 | ) | — | — | — | (28,009 | ) | |||||||||||||
|
|
|
|
|
|
|
|
|
|
|
|||||||||||
| Totals |
$ | 805,283 | $ | — | $ | 833,292 | $ | — | $ | (28,009 | ) | |||||||||
|
|
|
|
|
|
|
|
|
|
|
|||||||||||
| Inflation Protected Bond |
||||||||||||||||||||
| Forwards |
$ | 307,798 | $ | — | $ | 307,798 | $ | — | $ | — | ||||||||||
| Futures |
162,162 | 162,162 | — | — | — | |||||||||||||||
| Written Options |
8,063 | 8,063 | — | — | — | |||||||||||||||
|
|
|
|
|
|
|
|
|
|
|
|||||||||||
| Totals |
$ | 478,023 | $ | 170,225 | $ | 307,798 | $ | — | $ | — | ||||||||||
|
|
|
|
|
|
|
|
|
|
|
|||||||||||
223
Table of Contents
| Derivative Type |
Location on the Statements of Operations | |
| Interest rate contracts |
Net realized gain (loss) from: Futures transactions | |
| Net realized gain (loss) from: Swap agreements | ||
| Net realized gain (loss) from: Option contracts written | ||
| Net realized gain (loss) from: Option contracts purchased | ||
| Net change in unrealized appreciation (depreciation) on: Futures | ||
| Net change in unrealized appreciation (depreciation) on: Swap agreements | ||
| Net change in unrealized appreciation (depreciation) on: Option contracts written | ||
| Net change in unrealized appreciation (depreciation) on: Option contracts purchased | ||
| Foreign exchange contracts |
Net realized gain (loss) from: Foreign currency transactions | |
| Net realized gain (loss) from: Futures transactions | ||
| Net realized gain (loss) from: Option contracts written | ||
| Net realized gain (loss) from: Option contracts purchased | ||
| Net change in unrealized appreciation (depreciation) on: Foreign currency translations | ||
| Net change in unrealized appreciation (depreciation) on: Futures | ||
| Net change in unrealized appreciation (depreciation) on: Option contracts purchased | ||
| Net change in unrealized appreciation (depreciation) on: Option contracts written | ||
| Credit contracts |
Net realized gain (loss) from: Swap agreements | |
| Net change in unrealized appreciation (depreciation) on: Swap agreements | ||
| Equity contracts |
Net realized gain (loss) from: Futures transactions | |
| Net realized gain (loss) from: Option contracts written | ||
| Net realized gain (loss) from: Option contracts purchased | ||
| Net change in unrealized appreciation (depreciation) on: Futures | ||
| Net change in unrealized appreciation (depreciation) on: Option contracts written | ||
| Net change in unrealized appreciation (depreciation) on: Option contracts purchased |
| Realized Gain (Loss) on Derivatives Recognized in Income | ||||||||||||||||||||
| Total
Value at 06/30/14 |
Interest Rate Contracts |
Foreign Exchange Contracts |
Credit Contracts |
Equity Contracts |
||||||||||||||||
| MyDestination 2005 Futures |
$ | 47,041 | $ | — | $ | — | $ | — | $ | 47,041 | ||||||||||
|
|
|
|
|
|
|
|
|
|
|
|||||||||||
| MyDestination 2015 Futures |
$ | 354,582 | $ | 37,649 | $ | — | $ | — | $ | 316,933 | ||||||||||
|
|
|
|
|
|
|
|
|
|
|
|||||||||||
| MyDestination 2025 Futures |
$ | 609,371 | $ | 54,017 | $ | — | $ | — | $ | 555,354 | ||||||||||
|
|
|
|
|
|
|
|
|
|
|
|||||||||||
| MyDestination 2035 Futures |
$ | 539,348 | $ | 20,173 | $ | — | $ | — | $ | 519,175 | ||||||||||
|
|
|
|
|
|
|
|
|
|
|
|||||||||||
| MyDestination 2045 Futures |
$ | 380,437 | $ | 4,049 | $ | — | $ | — | $ | 376,388 | ||||||||||
|
|
|
|
|
|
|
|
|
|
|
|||||||||||
| MyDestination 2055 Futures |
$ | 30,761 | $ | — | $ | — | $ | — | $ | 30,761 | ||||||||||
|
|
|
|
|
|
|
|
|
|
|
|||||||||||
| Conservative Allocation Futures |
$ | 116,861 | $ | 6,776 | $ | — | $ | — | $ | 110,085 | ||||||||||
|
|
|
|
|
|
|
|
|
|
|
|||||||||||
| Balanced Allocation Futures |
$ | 1,524,234 | $ | 275,653 | $ | — | $ | — | $ | 1,248,581 | ||||||||||
|
|
|
|
|
|
|
|
|
|
|
|||||||||||
| Growth Allocation Futures |
$ | 1,503,295 | $ | 115,884 | $ | — | $ | — | $ | 1,387,411 | ||||||||||
|
|
|
|
|
|
|
|
|
|
|
|||||||||||
224
Table of Contents
| Realized Gain (Loss) on Derivatives Recognized in Income | ||||||||||||||||||||
| Total
Value at 06/30/14 |
Interest Rate Contracts |
Foreign Exchange Contracts |
Credit Contracts |
Equity Contracts |
||||||||||||||||
| Aggressive Allocation Futures |
$ | 1,562,899 | $ | — | $ | — | $ | — | $ | 1,562,899 | ||||||||||
|
|
|
|
|
|
|
|
|
|
|
|||||||||||
| Conservative Allocation I Futures |
$ | 19,366 | $ | — | $ | — | $ | — | $ | 19,366 | ||||||||||
|
|
|
|
|
|
|
|
|
|
|
|||||||||||
| Balanced Allocation I Futures |
$ | 370,856 | $ | 73,382 | $ | — | $ | — | $ | 297,474 | ||||||||||
|
|
|
|
|
|
|
|
|
|
|
|||||||||||
| Growth Allocation I Futures |
$ | 338,021 | $ | 22,258 | $ | — | $ | — | $ | 315,763 | ||||||||||
|
|
|
|
|
|
|
|
|
|
|
|||||||||||
| Aggressive Allocation I Futures |
$ | 284,651 | $ | — | $ | — | $ | — | $ | 284,651 | ||||||||||
|
|
|
|
|
|
|
|
|
|
|
|||||||||||
| Low-Duration Bond |
||||||||||||||||||||
| Forwards |
$ | (364,753 | ) | $ | — | $ | (364,753 | ) | $ | — | $ | — | ||||||||
| Futures |
(736,019 | ) | (736,019 | ) | — | — | — | |||||||||||||
| Purchased Options |
19,531 | 19,531 | — | — | — | |||||||||||||||
| Swaps |
(1,070,185 | ) | (1,211,927 | ) | — | 141,742 | — | |||||||||||||
| Written Options |
386,289 | 386,289 | — | — | — | |||||||||||||||
|
|
|
|
|
|
|
|
|
|
|
|||||||||||
| Totals |
$ | (1,765,137 | ) | $ | (1,542,126 | ) | $ | (364,753 | ) | $ | 141,742 | $ | — | |||||||
|
|
|
|
|
|
|
|
|
|
|
|||||||||||
| Medium-Duration Bond |
||||||||||||||||||||
| Forwards |
$ | (392,256 | ) | $ | — | $ | (392,256 | ) | $ | — | $ | — | ||||||||
| Futures |
661,320 | 652,224 | 9,096 | — | — | |||||||||||||||
| Purchased Options |
(174,983 | ) | (80,963 | ) | (94,020 | ) | — | — | ||||||||||||
| Swaps |
(783,818 | ) | (530,902 | ) | — | (252,916 | ) | — | ||||||||||||
| Written Options |
528,754 | 528,754 | — | — | — | |||||||||||||||
|
|
|
|
|
|
|
|
|
|
|
|||||||||||
| Totals |
$ | (160,983 | ) | $ | 569,113 | $ | (477,180 | ) | $ | (252,916 | ) | $ | — | |||||||
|
|
|
|
|
|
|
|
|
|
|
|||||||||||
| Global Bond |
||||||||||||||||||||
| Forwards |
$ | (635,751 | ) | $ | — | $ | (635,751 | ) | $ | — | $ | — | ||||||||
| Futures |
80,428 | 80,428 | — | — | — | |||||||||||||||
| Purchased Options |
(197,327 | ) | — | (197,327 | ) | — | — | |||||||||||||
|
|
|
|
|
|
|
|
|
|
|
|||||||||||
| Totals |
$ | (752,650 | ) | $ | 80,428 | $ | (833,078 | ) | $ | — | $ | — | ||||||||
|
|
|
|
|
|
|
|
|
|
|
|||||||||||
| Defensive Market Strategies |
||||||||||||||||||||
| Forwards |
$ | 11,568 | $ | — | $ | 11,568 | $ | — | $ | — | ||||||||||
| Futures |
1,619,128 | — | — | — | 1,619,128 | |||||||||||||||
| Purchased Options |
(186,885 | ) | — | — | — | (186,885 | ) | |||||||||||||
| Written Options |
1,306,921 | — | — | — | 1,306,921 | |||||||||||||||
|
|
|
|
|
|
|
|
|
|
|
|||||||||||
| Totals |
$ | 2,750,732 | $ | $ | 11,568 | $ | — | $ | 2,739,164 | |||||||||||
|
|
|
|
|
|
|
|
|
|
|
|||||||||||
| Equity Index Futures |
$ | 1,050,719 | $ | — | $ | — | $ | — | $ | 1,050,719 | ||||||||||
|
|
|
|
|
|
|
|
|
|
|
|||||||||||
| Value Equity Futures |
$ | 3,733,916 | $ | — | $ | — | $ | — | $ | 3,733,916 | ||||||||||
|
|
|
|
|
|
|
|
|
|
|
|||||||||||
| Growth Equity Futures |
$ | 6,070,920 | $ | — | $ | — | $ | — | $ | 6,070,920 | ||||||||||
|
|
|
|
|
|
|
|
|
|
|
|||||||||||
225
Table of Contents
| Realized Gain (Loss) on Derivatives Recognized in Income | ||||||||||||||||||||
| Total Value at 06/30/14 |
Interest Rate Contracts |
Foreign Exchange Contracts |
Credit Contracts |
Equity Contracts |
||||||||||||||||
| Small Cap Equity |
||||||||||||||||||||
| Forwards |
$ | (39,899 | ) | $ | — | $ | (39,899 | ) | $ | — | $ | — | ||||||||
| Futures |
4,771,598 | (42,458 | ) | (3,363 | ) | — | 4,817,419 | |||||||||||||
| Purchased Options |
(23,934 | ) | (8,270 | ) | (15,664 | ) | — | — | ||||||||||||
| Written Options |
12,505 | 12,505 | — | — | — | |||||||||||||||
|
|
|
|
|
|
|
|
|
|
|
|||||||||||
| Totals |
$ | 4,720,270 | $ | (38,223 | ) | $ | (58,926 | ) | $ | — | $ | 4,817,419 | ||||||||
|
|
|
|
|
|
|
|
|
|
|
|||||||||||
| International Equity |
||||||||||||||||||||
| Forwards |
$ | 1,245,499 | $ | — | $ | 1,245,499 | $ | — | $ | — | ||||||||||
| Futures |
1,749,054 | — | — | — | 1,749,054 | |||||||||||||||
|
|
|
|
|
|
|
|
|
|
|
|||||||||||
| Totals |
$ | 2,994,553 | $ | — | $ | 1,245,499 | $ | — | $ | 1,749,054 | ||||||||||
|
|
|
|
|
|
|
|
|
|
|
|||||||||||
| Emerging Markets Equity |
||||||||||||||||||||
| Forwards |
$ | 884,308 | $ | — | $ | 884,308 | $ | — | $ | — | ||||||||||
| Futures |
2,294,247 | — | — | — | 2,294,247 | |||||||||||||||
|
|
|
|
|
|
|
|
|
|
|
|||||||||||
| Totals |
$ | 3,178,555 | $ | — | $ | 884,308 | $ | — | $ | 2,294,247 | ||||||||||
|
|
|
|
|
|
|
|
|
|
|
|||||||||||
| Inflation Protected Bond |
||||||||||||||||||||
| Forwards |
$ | (208,067 | ) | $ | — | $ | (208,067 | ) | $ | — | $ | — | ||||||||
| Futures |
(1,522,235 | ) | (1,522,235 | ) | — | — | — | |||||||||||||
| Purchased Options |
(371,011 | ) | (171,501 | ) | (199,510 | ) | — | — | ||||||||||||
| Written Options |
260,132 | 56,430 | 203,702 | — | — | |||||||||||||||
|
|
|
|
|
|
|
|
|
|
|
|||||||||||
| Totals |
$ | (1,841,181 | ) | $ | (1,637,306 | ) | $ | (203,875 | ) | $ | — | $ | — | |||||||
|
|
|
|
|
|
|
|
|
|
|
|||||||||||
| Real Estate Securities Futures |
$ | 482,832 | $ | — | $ | — | $ | — | $ | 482,832 | ||||||||||
|
|
|
|
|
|
|
|
|
|
|
|||||||||||
| Change in Unrealized Appreciation (Depreciation) on Derivatives Recognized in Income | ||||||||||||||||||||
| Total Value at 06/30/14 |
Interest Rate Contracts |
Foreign Exchange Contracts |
Credit Contracts |
Equity Contracts |
||||||||||||||||
| MyDestination 2005 Futures |
$ | (9,341 | ) | $ | — | $ | — | $ | — | $ | (9,341 | ) | ||||||||
|
|
|
|
|
|
|
|
|
|
|
|||||||||||
| MyDestination 2015 Futures |
$ | (53,783 | ) | $ | 31,192 | $ | — | $ | — | $ | (84,975 | ) | ||||||||
|
|
|
|
|
|
|
|
|
|
|
|||||||||||
| MyDestination 2025 Futures |
$ | (113,326 | ) | $ | 30,080 | $ | — | $ | — | $ | (143,406 | ) | ||||||||
|
|
|
|
|
|
|
|
|
|
|
|||||||||||
| MyDestination 2035 Futures |
$ | (102,067 | ) | $ | 18,501 | $ | — | $ | — | $ | (120,568 | ) | ||||||||
|
|
|
|
|
|
|
|
|
|
|
|||||||||||
| MyDestination 2045 Futures |
$ | (86,195 | ) | $ | 4,907 | $ | — | $ | — | $ | (91,102 | ) | ||||||||
|
|
|
|
|
|
|
|
|
|
|
|||||||||||
| MyDestination 2055 Futures |
$ | (5,022 | ) | $ | — | $ | — | $ | — | $ | (5,022 | ) | ||||||||
|
|
|
|
|
|
|
|
|
|
|
|||||||||||
| Conservative Allocation Futures |
$ | (25,181 | ) | $ | 3,233 | $ | — | $ | — | $ | (28,414 | ) | ||||||||
|
|
|
|
|
|
|
|
|
|
|
|||||||||||
| Balanced Allocation Futures |
$ | (224,031 | ) | $ | 198,492 | $ | — | $ | — | $ | (422,523 | ) | ||||||||
|
|
|
|
|
|
|
|
|
|
|
|||||||||||
| Growth Allocation Futures |
$ | (369,845 | ) | $ | 68,336 | $ | — | $ | — | $ | (438,181 | ) | ||||||||
|
|
|
|
|
|
|
|
|
|
|
|||||||||||
226
Table of Contents
| Change in Unrealized Appreciation (Depreciation) on Derivatives Recognized in Income | ||||||||||||||||||||
| Total
Value at 06/30/14 |
Interest Rate Contracts |
Foreign Exchange Contracts |
Credit Contracts |
Equity Contracts |
||||||||||||||||
| Aggressive Allocation Futures |
$ | (579,215 | ) | $ | — | $ | — | $ | — | $ | (579,215 | ) | ||||||||
|
|
|
|
|
|
|
|
|
|
|
|||||||||||
| Conservative Allocation I Futures |
$ | (4,539 | ) | $ | — | $ | — | $ | — | $ | (4,539 | ) | ||||||||
|
|
|
|
|
|
|
|
|
|
|
|||||||||||
| Balanced Allocation I Futures |
$ | (51,092 | ) | $ | 43,714 | $ | — | $ | — | $ | (94,806 | ) | ||||||||
|
|
|
|
|
|
|
|
|
|
|
|||||||||||
| Growth Allocation I Futures |
$ | (98,527 | ) | $ | 18,775 | $ | — | $ | — | $ | (117,302 | ) | ||||||||
|
|
|
|
|
|
|
|
|
|
|
|||||||||||
| Aggressive Allocation I Futures |
$ | (106,199 | ) | $ | — | $ | — | $ | — | $ | (106,199 | ) | ||||||||
|
|
|
|
|
|
|
|
|
|
|
|||||||||||
| Low-Duration Bond |
||||||||||||||||||||
| Forwards |
$ | (514,899 | ) | $ | — | $ | (514,899 | ) | $ | — | $ | — | ||||||||
| Futures |
(213,047 | ) | (213,047 | ) | — | — | — | |||||||||||||
| Purchased Options |
(155,525 | ) | (155,525 | ) | — | — | — | |||||||||||||
| Swaps |
331,301 | 610,610 | — | (279,309 | ) | — | ||||||||||||||
| Written Options |
272,340 | 272,340 | — | — | — | |||||||||||||||
|
|
|
|
|
|
|
|
|
|
|
|||||||||||
| Totals |
$ | (279,830 | ) | $ | 514,378 | $ | (514,899 | ) | $ | (279,309 | ) | $ | — | |||||||
|
|
|
|
|
|
|
|
|
|
|
|||||||||||
| Medium-Duration Bond |
||||||||||||||||||||
| Forwards |
$ | (97,183 | ) | $ | — | $ | (97,183 | ) | $ | — | $ | — | ||||||||
| Futures |
(193,386 | ) | (188,372 | ) | (5,014 | ) | — | — | ||||||||||||
| Purchased Options |
(474,760 | ) | (504,844 | ) | 30,084 | — | — | |||||||||||||
| Swaps |
378,307 | 297,790 | — | 80,517 | — | |||||||||||||||
| Written Options |
830,882 | 814,997 | 15,885 | — | — | |||||||||||||||
|
|
|
|
|
|
|
|
|
|
|
|||||||||||
| Totals |
$ | 443,860 | $ | 419,571 | $ | (56,228 | ) | $ | 80,517 | $ | — | |||||||||
|
|
|
|
|
|
|
|
|
|
|
|||||||||||
| Global Bond |
||||||||||||||||||||
| Forwards |
$ | 191,627 | $ | — | $ | 191,627 | $ | — | $ | — | ||||||||||
| Futures |
(114,552 | ) | (114,552 | ) | — | — | — | |||||||||||||
| Purchased Options |
66,172 | — | 66,172 | — | — | |||||||||||||||
|
|
|
|
|
|
|
|
|
|
|
|||||||||||
| Totals |
$ | 143,247 | $ | (114,552 | ) | $ | 257,799 | $ | — | $ | — | |||||||||
|
|
|
|
|
|
|
|
|
|
|
|||||||||||
| Defensive Market Strategies |
||||||||||||||||||||
| Forwards |
$ | (15,437 | ) | $ | — | $ | (15,437 | ) | $ | — | $ | — | ||||||||
| Futures |
(641,176 | ) | — | — | — | (641,176 | ) | |||||||||||||
| Purchased Options |
144,396 | — | — | — | 144,396 | |||||||||||||||
| Written Options |
216,998 | — | — | — | 216,998 | |||||||||||||||
|
|
|
|
|
|
|
|
|
|
|
|||||||||||
| Totals |
$ | (295,219 | ) | $ | — | $ | (15,437 | ) | $ | — | $ | (279,782 | ) | |||||||
|
|
|
|
|
|
|
|
|
|
|
|||||||||||
| Equity Index |
||||||||||||||||||||
| Futures |
$ | (215,315 | ) | $ | — | $ | — | $ | — | $ | (215,315 | ) | ||||||||
|
|
|
|
|
|
|
|
|
|
|
|||||||||||
| Value Equity |
||||||||||||||||||||
| Futures |
$ | (1,408,191 | ) | $ | — | $ | — | $ | — | $ | (1,408,191 | ) | ||||||||
|
|
|
|
|
|
|
|
|
|
|
|||||||||||
| Growth Equity |
||||||||||||||||||||
| Futures |
$ | (1,480,188 | ) | $ | — | $ | — | $ | — | $ | (1,480,188 | ) | ||||||||
|
|
|
|
|
|
|
|
|
|
|
|||||||||||
227
Table of Contents
| Change in Unrealized Appreciation (Depreciation) on Derivatives Recognized in Income | ||||||||||||||||||||
| Total Value at 06/30/14 |
Interest Rate Contracts |
Foreign Exchange Contracts |
Credit Contracts |
Equity Contracts |
||||||||||||||||
| Small Cap Equity |
||||||||||||||||||||
| Forwards |
$ | (2,961 | ) | $ | — | $ | (2,961 | ) | $ | — | $ | — | ||||||||
| Futures |
(3,687,772 | ) | (206,675 | ) | — | — | (3,481,097 | ) | ||||||||||||
| Purchased Options |
954 | (8,325 | ) | 9,279 | — | — | ||||||||||||||
| Written Options |
1,839 | 1,839 | — | — | — | |||||||||||||||
|
|
|
|
|
|
|
|
|
|
|
|||||||||||
| Totals |
$ | (3,687,940 | ) | $ | (213,161 | ) | $ | 6,318 | $ | — | $ | (3,481,097 | ) | |||||||
|
|
|
|
|
|
|
|
|
|
|
|||||||||||
| International Equity |
||||||||||||||||||||
| Forwards |
$ | 1,454,675 | $ | — | $ | 1,454,675 | $ | — | $ | — | ||||||||||
| Futures |
(3,649,325 | ) | — | — | — | (3,649,325 | ) | |||||||||||||
|
|
|
|
|
|
|
|
|
|
|
|||||||||||
| Totals |
$ | (2,194,650 | ) | $ | — | $ | 1,454,675 | $ | — | $ | (3,649,325 | ) | ||||||||
|
|
|
|
|
|
|
|
|
|
|
|||||||||||
| Emerging Markets Equity |
||||||||||||||||||||
| Forwards |
$ | (227,076 | ) | $ | — | $ | (227,076 | ) | $ | — | $ | — | ||||||||
| Futures |
(1,098,716 | ) | — | — | — | (1,098,716 | ) | |||||||||||||
|
|
|
|
|
|
|
|
|
|
|
|||||||||||
| Totals |
$ | (1,325,792 | ) | $ | — | $ | (227,076 | ) | $ | — | $ | (1,098,716 | ) | |||||||
|
|
|
|
|
|
|
|
|
|
|
|||||||||||
| Inflation Protected Bond |
||||||||||||||||||||
| Forwards |
$ | 144,608 | $ | — | $ | 144,608 | $ | — | $ | — | ||||||||||
| Futures |
(184,171 | ) | (184,171 | ) | — | — | — | |||||||||||||
| Purchased Options |
(118,334 | ) | (114,278 | ) | (4,056 | ) | — | — | ||||||||||||
| Written Options |
21,210 | 61,430 | (40,220 | ) | — | — | ||||||||||||||
|
|
|
|
|
|
|
|
|
|
|
|||||||||||
| Totals |
$ | (136,687 | ) | $ | (237,019 | ) | $ | 100,332 | $ | — | $ | — | ||||||||
|
|
|
|
|
|
|
|
|
|
|
|||||||||||
| Real Estate Securities |
||||||||||||||||||||
| Futures |
$ | (73,980 | ) | $ | — | $ | — | $ | — | $ | (73,980 | ) | ||||||||
|
|
|
|
|
|
|
|
|
|
|
|||||||||||
Volume of Derivative Transactions
The table below summarizes the average balance of derivative holdings by fund during the period ended June 30, 2014. The average balance of derivatives held is indicative of the trading volume of each Fund.
| Long Derivative Volume | ||||||||||||||||
| Forward Foreign Currency Contracts (Average Cost) |
Futures Contracts (Average Notional Value) |
Purchased Option Contracts (Average Notional Cost) |
Swap Contracts (Average Notional Amount) |
|||||||||||||
| MyDestination 2005 |
$ | — | $ | 571,608 | $ | — | $ | — | ||||||||
| MyDestination 2015 |
— | 6,253,579 | — | — | ||||||||||||
| MyDestination 2025 |
— | 9,034,573 | — | — | ||||||||||||
| MyDestination 2035 |
— | 6,611,828 | — | — | ||||||||||||
| MyDestination 2045 |
— | 4,632,100 | — | — | ||||||||||||
| MyDestination 2055 |
— | 338,014 | — | — | ||||||||||||
| Conservative Allocation |
— | 4,084,998 | — | — | ||||||||||||
| Balanced Allocation |
— | 25,642,863 | — | — | ||||||||||||
| Growth Allocation |
— | 19,823,557 | — | — | ||||||||||||
| Aggressive Allocation |
— | 17,551,464 | — | — | ||||||||||||
| Conservative Allocation I |
— | 196,973 | — | — | ||||||||||||
| Balanced Allocation I |
— | 6,294,169 | — | — | ||||||||||||
| Growth Allocation I |
— | 4,491,023 | — | — | ||||||||||||
| Aggressive Allocation I |
— | 3,249,418 | — | — | ||||||||||||
| Low-Duration Bond |
30,373,489 | 244,180,207 | 151,445 | 41,294,564 | ||||||||||||
| Medium-Duration Bond |
24,311,688 | 220,114,479 | 328,954 | 425,441,500 | ||||||||||||
| Global Bond |
20,335,725 | 3,701,757 | 63,084 | — | ||||||||||||
228
Table of Contents
| Long Derivative Volume | ||||||||||||||||
| Forward Foreign Currency Contracts (Average Cost) |
Futures Contracts (Average Notional Value) |
Purchased Option Contracts (Average Notional Cost) |
Swap
Contracts (Average Notional Amount) |
|||||||||||||
| Defensive Market Strategies |
$ | 1,792,599 | $ | 46,782,179 | $ | 61,689 | $ | — | ||||||||
| Equity Index |
— | 13,351,510 | — | — | ||||||||||||
| Value Equity |
— | 40,820,695 | — | — | ||||||||||||
| Growth Equity |
— | 60,233,522 | — | — | ||||||||||||
| Small Cap Equity |
2,360,818 | 47,550,755 | 8,114 | — | ||||||||||||
| International Equity |
271,564,922 | 142,213,971 | — | — | ||||||||||||
| Emerging Markets Equity |
89,713,325 | 38,045,655 | — | — | ||||||||||||
| Inflation Protected Bond |
8,696,187 | 53,778,312 | 123,156 | — | ||||||||||||
| Real Estate Securities |
5,243,082 | — | — | — | ||||||||||||
| Short Derivative Volume | ||||||||||||||||
| Forward Foreign Currency Contracts (Average Cost) |
Futures Contracts (Average Notional Value) |
Written Option Contracts (Average Notional Cost) |
Swap Contracts (Average Notional Amount) |
|||||||||||||
| Low-Duration Bond |
$ | 71,909,342 | $ | 115,215,222 | $ | 334,382 | $ | 38,187,879 | ||||||||
| Medium-Duration Bond |
73,232,035 | 146,107,383 | 707,425 | 4,330,141,000 | ||||||||||||
| Global Bond |
29,429,691 | 7,297,563 | — | — | ||||||||||||
| Defensive Market Strategies |
11,338,923 | — | 1,663,402 | — | ||||||||||||
| Small Cap Equity |
3,752,342 | 27,463,438 | 5,965 | — | ||||||||||||
| International Equity |
244,307,201 | 8,728,117 | — | — | ||||||||||||
| Emerging Markets Equity |
81,478,925 | 5,154,954 | — | — | ||||||||||||
| Inflation Protected Bond |
34,808,559 | 63,765,718 | 45,196 | — | ||||||||||||
k. Dividends and Distributions to Shareholders
Dividends from net investment income for the Money Market Fund are declared daily and paid monthly. Dividends from net investment income for the Bond Funds are declared and paid monthly. Dividends from net investment income, if any, for the Defensive Market Strategies Fund, Equity Index Fund, Real Estate Securities Fund, Value Equity Fund and Growth Equity Fund are declared and paid semi-annually. Dividends from net investment income, if any, for the Small Cap Equity Fund, International Equity Fund, the Asset Allocation Funds and the Date Target Funds are declared and paid annually. Net realized capital gains, if any, will be distributed at least annually by each of the Funds. Dividends and distributions to shareholders are recorded on the ex-dividend date.
l. Expenses
Expenses arising in connection with a Fund are charged directly to that Fund. Expenses common to all Funds are generally allocated to each Fund in proportion to their relative net assets. Each Class of shares bears its pro-rata portion of expenses attributable to its Class, except that each Class separately bears expenses related specifically to that Class, such as shareholder reporting, registration, transfer agent, shareholder servicing and distribution fees.
m. Security Transactions, Income and Realized Gains and Losses
Security transactions are accounted for on the date securities are purchased or sold (the trade date). Dividend income is recognized on the ex-dividend date, except certain dividends from foreign securities where the ex-date may have passed, which are recorded as soon as the Fund is informed of the ex-dividend date. Interest income is accrued daily, including the amortization of market premium and the accretion of market discount. Realized gains and losses from security transactions are on an identified cost basis.
229
Table of Contents
3. FEES AND OTHER TRANSACTIONS WITH AFFILIATES
a. Investment Advisory Fees
Pursuant to a separate investment advisory agreement, GuideStone Capital Management (“GSCM” or “Adviser”) acts as the Adviser to the Funds. As Adviser, it supervises the investments of the Funds and for such services is paid a fee. GSCM and the Trust have entered into sub-advisory agreements with various sub-advisers to manage each Select Fund’s investments. Under the general supervision of GSCM, the sub-advisers make the day-to-day investment decisions for the Select Funds, and for such services, each sub-adviser receives a fee from the Funds.
The advisory fees paid to GSCM and aggregate sub-advisory fees paid to the sub-advisers, listed at the end of this report, are computed daily based upon the net assets of each Fund. The actual advisory fees accrued and the sub-advisory fees accrued during the period ended June 30, 2014, based upon average daily net assets, were as follows:
|
Fund |
Advisory Fees | Sub- Adviser Fees | ||
| MyDestination 2005 |
0.10% | 0.00% | ||
| MyDestination 2015 |
0.10% | 0.00% | ||
| MyDestination 2025 |
0.10% | 0.00% | ||
| MyDestination 2035 |
0.10% | 0.00% | ||
| MyDestination 2045 |
0.10% | 0.00% | ||
| MyDestination 2055 |
0.10% | 0.00% | ||
| Conservative Allocation |
0.10% | 0.00% | ||
| Balanced Allocation |
0.10% | 0.00% | ||
| Growth Allocation |
0.10% | 0.00% | ||
| Aggressive Allocation |
0.10% | 0.00% | ||
| Conservative Allocation I |
0.10% | 0.00% | ||
| Balanced Allocation I |
0.10% | 0.00% | ||
| Growth Allocation I |
0.10% | 0.00% | ||
| Aggressive Allocation I |
0.10% | 0.00% | ||
| Money Market |
0.09% | 0.07% | ||
| Low-Duration Bond |
0.13% | 0.20% | ||
| Medium-Duration Bond |
0.21% | 0.21% | ||
| Extended-Duration Bond |
0.25% | 0.24% | ||
| Global Bond |
0.21% | 0.25% | ||
| Defensive Market Strategies |
0.37% | 0.37% | ||
| Equity Index |
0.13% | 0.02% | ||
| Value Equity |
0.40% | 0.23% | ||
| Growth Equity |
0.45% | 0.38% | ||
| Small Cap Equity |
0.27% | 0.62% | ||
| International Equity |
0.47% | 0.41% | ||
| Emerging Markets Equity |
0.47% | 0.78% | ||
| Inflation Protected Bond |
0.20% | 0.11% | ||
| Flexible Income |
0.25% | 0.49% | ||
| Real Assets |
0.10% | 0.00% | ||
| Real Estate Securities |
0.28% | 0.43% | ||
| Global Natural Resources Equity |
0.39% | 0.65% |
230
Table of Contents
For the period ended June 30, 2014, advisory fees (excluding sub-advisory fees) and waivers for each Fund were as follows:
| Gross Advisory Fee |
Waiver/ Reimbursements |
Net Advisory Fee (Reimbursement) |
||||||||||
| MyDestination 2005 |
$ | 43,587 | $ | (18,984 | ) | $ | 24,603 | |||||
| MyDestination 2015 |
226,464 | — | 226,464 | |||||||||
| MyDestination 2025 |
286,925 | — | 286,925 | |||||||||
| MyDestination 2035 |
154,100 | — | 154,100 | |||||||||
| MyDestination 2045 |
110,404 | 35,486 | 145,890 | |||||||||
| MyDestination 2055 |
9,262 | (42,469 | ) | (33,207 | ) | |||||||
| Conservative Allocation |
158,067 | (64,201 | ) | 93,866 | ||||||||
| Balanced Allocation |
648,175 | (45,343 | ) | 602,832 | ||||||||
| Growth Allocation |
479,757 | (41,597 | ) | 438,160 | ||||||||
| Aggressive Allocation |
432,545 | (38,215 | ) | 394,330 | ||||||||
| Conservative Allocation I |
41,043 | (20,220 | ) | 20,823 | ||||||||
| Balanced Allocation I |
192,979 | — | 192,979 | |||||||||
| Growth Allocation I |
134,485 | — | 134,485 | |||||||||
| Aggressive Allocation I |
93,189 | (116 | ) | 93,073 | ||||||||
| Money Market(1) |
606,654 | — | 606,654 | |||||||||
| Low-Duration Bond |
549,641 | (342,756 | ) | 206,885 | ||||||||
| Medium-Duration Bond |
864,361 | (437,249 | ) | 427,112 | ||||||||
| Extended-Duration Bond |
354,605 | (93,594 | ) | 261,011 | ||||||||
| Global Bond |
388,481 | (49,043 | ) | 339,438 | ||||||||
| Defensive Market Strategies |
934,146 | 173,959 | 1,108,105 | |||||||||
| Equity Index |
233,189 | (139,322 | ) | 93,867 | ||||||||
| Value Equity |
2,674,528 | (47,044 | ) | 2,627,484 | ||||||||
| Growth Equity(1) |
3,168,206 | (308,038 | ) | 2,860,168 | ||||||||
| Small Cap Equity |
752,665 | (55,691 | ) | 696,974 | ||||||||
| International Equity |
3,307,295 | (409,307 | ) | 2,897,988 | ||||||||
| Emerging Markets Equity |
698,577 | (516,185 | ) | 182,392 | ||||||||
| Inflation Protected Bond |
286,878 | (20,516 | ) | 266,362 | ||||||||
| Flexible Income |
140,255 | 14,980 | 155,235 | |||||||||
| Real Assets |
19,533 | (48,814 | ) | (29,281 | ) | |||||||
| Real Estate Securities |
340,840 | (6,258 | ) | 334,582 | ||||||||
| Global Natural Resources Equity |
547,556 | (28,254 | ) | 519,302 | ||||||||
| (1) | The Statement of Operations “Expenses waived/reimbursed net of amount recaptured” for the Money Market Fund includes shareholder servicing fee waiver and other waivers, respectively, in addition to the advisory fee waiver. |
b. Distribution and Shareholder Servicing Fees
The Board of Trustees has adopted a Shareholder Service Plan for the Investor Class of each Select Fund. Under this Plan, the Investor Class of each Select Fund is authorized to pay fees to parties that provide services for and maintain shareholder accounts. The Investor Class of each Select Fund was authorized to pay service fees of 0.24% of average daily net assets.
The Board of Trustees voluntarily agreed to waive shareholder servicing fees and/or reimburse expenses for the Investor Class of the Money Market Fund to the extent necessary to maintain a minimum daily net yield of at least 0.01%. This voluntary shareholder servicing fee waiver and expense reimbursement may be changed or terminated by the Board of Trustees at any time.
231
Table of Contents
c. Expense Limitation
GSCM has agreed, through April 30, 2015, to waive fees and reimburse expenses of the Institutional Class and Investor Class of each Fund (excluding interest, taxes, brokerage commissions, dividend expense on securities sold short and extraordinary expenses) which exceed, in the aggregate, the annual percentage rate of each Class’s average daily net assets as follows:
|
Fund |
Institutional Class | Investor Class | ||
| MyDestination 2005 |
N/A | 0.20% | ||
| MyDestination 2015 |
N/A | 0.20% | ||
| MyDestination 2025 |
N/A | 0.20% | ||
| MyDestination 2035 |
N/A | 0.20% | ||
| MyDestination 2045 |
N/A | 0.20% | ||
| MyDestination 2055 |
N/A | 0.20% | ||
| Conservative Allocation |
N/A | 0.12% | ||
| Balanced Allocation |
N/A | 0.12% | ||
| Growth Allocation |
N/A | 0.12% | ||
| Aggressive Allocation |
N/A | 0.12% | ||
| Conservative Allocation I |
0.15% | N/A | ||
| Balanced Allocation I |
0.15% | N/A | ||
| Growth Allocation I |
0.15% | N/A | ||
| Aggressive Allocation I |
0.15% | N/A | ||
| Money Market |
0.20% | 0.39% | ||
| Low-Duration Bond |
0.36% | 0.57% | ||
| Medium-Duration Bond |
0.48% | 0.63% | ||
| Extended-Duration Bond |
0.63% | 0.75% | ||
| Global Bond |
N/A | 1.02% | ||
| Defensive Market Strategies |
0.99% | 1.25% | ||
| Equity Index |
0.23% | 0.38% | ||
| Value Equity |
0.74% | 0.94% | ||
| Growth Equity |
0.88% | 1.06% | ||
| Small Cap Equity |
1.12% | 1.21% | ||
| International Equity |
0.96% | 1.20% | ||
| Emerging Markets Equity |
1.25% | 1.50% | ||
| Inflation Protected Bond |
N/A | 0.67% | ||
| Flexible Income |
N/A | 1.20% | ||
| Real Assets |
N/A | 0.12% | ||
| Real Estate Securities |
N/A | 1.29% | ||
| Global Natural Resources Equity |
N/A | 1.50% |
Each Fund in turn agrees to reimburse GSCM for any operating expenses in excess of the expense limitation paid, waived or assumed by GSCM for that Fund during the limitation period, provided GSCM would not be entitled to reimbursement for any amount that would cause operating expenses to exceed the expense limitation during the year in which the reimbursement would be made, and provided further that no amount will be reimbursed by the Fund more than three years after the year in which it was incurred or waived by GSCM.
232
Table of Contents
At June 30, 2014, the amounts subject to possible future reimbursement under the expense limitation agreement are as follows:
| Institutional Class | Investor Class | |||||||||||||||||||||||||||||||
| 2011 | 2012 | 2013 | 2014 | 2011 | 2012 | 2013 | 2014 | |||||||||||||||||||||||||
| MyDestination 2005 |
N/A | N/A | N/A | N/A | $ | 91,223 | $ | 48,296 | $ | 40,223 | $ | 18,984 | ||||||||||||||||||||
| MyDestination 2015 |
N/A | N/A | N/A | N/A | N/A | N/A | N/A | N/A | ||||||||||||||||||||||||
| MyDestination 2025 |
N/A | N/A | N/A | N/A | N/A | N/A | N/A | N/A | ||||||||||||||||||||||||
| MyDestination 2035 |
N/A | N/A | N/A | N/A | N/A | N/A | N/A | N/A | ||||||||||||||||||||||||
| MyDestination 2045 |
N/A | N/A | N/A | N/A | 38,734 | 15,118 | N/A | N/A | ||||||||||||||||||||||||
| MyDestination 2055 |
N/A | N/A | N/A | N/A | N/A | 95,601 | 87,450 | 42,469 | ||||||||||||||||||||||||
| Conservative Allocation |
N/A | N/A | N/A | N/A | 148,927 | 119,266 | 122,093 | 64,201 | ||||||||||||||||||||||||
| Balanced Allocation |
N/A | N/A | N/A | N/A | 157,363 | 117,270 | 98,366 | 45,343 | ||||||||||||||||||||||||
| Growth Allocation |
N/A | N/A | N/A | N/A | 133,967 | 104,633 | 87,577 | 41,597 | ||||||||||||||||||||||||
| Aggressive Allocation |
N/A | N/A | N/A | N/A | 129,580 | 97,258 | 79,432 | 38,215 | ||||||||||||||||||||||||
| Conservative Allocation I |
$ | 66,248 | $ | 42,753 | $ | 43,252 | $ | 20,220 | N/A | N/A | N/A | N/A | ||||||||||||||||||||
| Balanced Allocation I |
N/A | N/A | N/A | N/A | N/A | N/A | N/A | N/A | ||||||||||||||||||||||||
| Growth Allocation I |
N/A | N/A | N/A | N/A | N/A | N/A | N/A | N/A | ||||||||||||||||||||||||
| Aggressive Allocation I |
38,072 | 17,895 | 9,637 | 116 | N/A | N/A | N/A | N/A | ||||||||||||||||||||||||
| Money Market |
N/A | N/A | N/A | N/A | N/A | N/A | N/A | N/A | ||||||||||||||||||||||||
| Low-Duration Bond |
59,610 | 53,538 | 62,386 | 27,401 | 501,417 | 493,263 | 539,623 | 263,384 | ||||||||||||||||||||||||
| Medium-Duration Bond |
34,814 | 12,070 | 48,408 | 18,447 | 701,423 | 679,378 | 703,036 | 335,347 | ||||||||||||||||||||||||
| Extended-Duration Bond |
N/A | N/A | N/A | N/A | 141,631 | 82,647 | 129,150 | 79,704 | ||||||||||||||||||||||||
| Global Bond |
N/A | N/A | N/A | N/A | N/A | N/A | N/A | N/A | ||||||||||||||||||||||||
| Defensive Market Strategies |
N/A | N/A | 5,529 | N/A | N/A | N/A | N/A | N/A | ||||||||||||||||||||||||
| Equity Index |
N/A | N/A | N/A | N/A | 240,739 | 210,543 | 234,035 | 124,351 | ||||||||||||||||||||||||
| Value Equity |
N/A | N/A | N/A | N/A | 28,595 | N/A | N/A | N/A | ||||||||||||||||||||||||
| Growth Equity |
N/A | N/A | N/A | N/A | 775,619 | 544,115 | 254,800 | 237,162 | ||||||||||||||||||||||||
| Small Cap Equity |
N/A | N/A | N/A | N/A | 232,755 | 186,783 | N/A | 30,197 | ||||||||||||||||||||||||
| International Equity |
494,427 | 388,370 | 345,716 | 57,353 | 2,083,992 | 1,703,913 | 1,480,579 | 270,782 | ||||||||||||||||||||||||
| Emerging Markets Equity |
N/A | N/A | 22,538 | 84,887 | N/A | N/A | 111,351 | 411,578 | ||||||||||||||||||||||||
| Inflation Protected Bond |
N/A | N/A | N/A | N/A | N/A | N/A | N/A | N/A | ||||||||||||||||||||||||
| Flexible Income |
N/A | N/A | N/A | N/A | N/A | N/A | 292 | N/A | ||||||||||||||||||||||||
| Real Assets |
N/A | N/A | N/A | N/A | N/A | N/A | 67,124 | 48,814 | ||||||||||||||||||||||||
| Real Estate Securities |
N/A | N/A | N/A | N/A | N/A | N/A | N/A | N/A | ||||||||||||||||||||||||
| Global Natural Resources Equity |
N/A | N/A | N/A | N/A | N/A | N/A | N/A | N/A | ||||||||||||||||||||||||
During the period ended June 30, 2014, GSCM recaptured the following amounts:
| Institutional Class | Investor Class | |||||||
| MyDestination 2045 |
N/A | $ | 35,486 | |||||
| Defensive Market Strategies |
$ | 62,704 | 153,384 | |||||
| Equity Index |
220 | N/A | ||||||
| Flexible Income |
N/A | 27,963 | ||||||
d. Brokerage Service Arrangements
The Adviser directs the sub-advisers to place a certain percentage of security trades (if feasible) with designated brokers who have agreed to pay certain custody, transfer agency or other operating expenses through the use of Brokerage Service Arrangements on behalf of the Funds shown below.
| Fund |
Expenses Paid Through Brokerage Service Arrangements |
|||
| Defensive Market Strategies |
$ | 25,716 | ||
| Value Equity |
16,024 | |||
| Growth Equity |
23,694 | |||
| Small Cap Equity |
28,728 | |||
| International Equity |
13,940 | |||
233
Table of Contents
| Fund |
Expenses Paid Through Brokerage Service Arrangements |
|||
| Global Natural Resources |
9,746 | |||
e. Administrator, Transfer Agent and Distributor
For its services as Administrator, BNY Mellon Investment Servicing (US) Inc. (“BNY Mellon”) is entitled to receive fees, computed daily and paid monthly, based upon the average daily net assets of each Fund. The fees, excluding out of pocket expenses, currently range between 0.004% and 0.02% of average daily net assets. For its services as Transfer Agent, BNY Mellon receives a fee based mainly upon the number of accounts serviced. Certain minimum fees and transaction charges may apply. For the period ended June 30, 2014, BNY Mellon received $1,628,158 in aggregate fees and expenses for services rendered under the various agreements described above.
Certain employees of BNY Mellon are officers of the Funds. BNY Mellon serves as Administrator and Transfer Agent of the Funds.
Foreside Funds Distributors LLC serves as the Underwriter and does not receive any fees in its capacity as Underwriter from GuideStone Funds. The fees are paid by GSCM.
f. Investments in Affiliates
The Date Target and Asset Allocation Funds do not invest in the underlying Select Funds for the purpose of exercising management or control; however, investments made by each Date Target and Asset Allocation Fund within each of its principal investment strategies may represent a significant portion of an underlying Select Fund’s net assets. At June 30, 2014, the Date Target and Asset Allocation Funds were the owner of record of the following approximate percentages of the total outstanding shares of the underlying Select Funds as detailed below:
| Fund |
Low- Duration Bond |
Medium- Duration Bond |
Extended- Duration Bond |
Global Bond |
Defensive Market Strategies |
Value Equity |
Growth Equity |
Small Cap Equity |
Inter- national Equity |
Emerging Markets Equity |
Inflation Protected Bond |
Flexible Income |
Real Estate Securities |
Global Natural Resources Equity |
||||||||||||||||||||||||||||||||||||||||||
| MyDestination 2005 |
3.17 | % | 0.83 | % | — | 0.61 | % | 1.83 | % | 0.27 | % | 0.28 | % | 0.18 | % | 0.36 | % | 0.47 | % | 3.46 | % | 3.60 | % | 0.35 | % | 0.60 | % | |||||||||||||||||||||||||||||
| MyDestination 2015 |
5.67 | 4.97 | 1.76 | % | 5.44 | 15.88 | 2.27 | 2.31 | 1.60 | 2.93 | 4.08 | 16.01 | 17.03 | 2.97 | 3.41 | |||||||||||||||||||||||||||||||||||||||||
| MyDestination 2025 |
3.56 | 5.22 | 3.43 | 10.06 | 19.42 | 4.17 | 4.35 | 3.29 | 5.50 | 7.33 | 6.60 | 5.97 | 6.89 | 6.12 | ||||||||||||||||||||||||||||||||||||||||||
| MyDestination 2035 |
— | 1.00 | 2.35 | 6.92 | 0.38 | 3.68 | 3.81 | 3.38 | 4.96 | 6.59 | — | — | 4.23 | 3.70 | ||||||||||||||||||||||||||||||||||||||||||
| MyDestination 2045 |
— | — | 0.55 | 3.30 | — | 2.88 | 2.98 | 2.89 | 3.95 | 5.33 | — | — | 3.03 | 2.67 | ||||||||||||||||||||||||||||||||||||||||||
| MyDestination 2055 |
— | — | — | 0.27 | — | 0.27 | 0.27 | 0.27 | 0.37 | 0.48 | — | — | 0.27 | 0.24 | ||||||||||||||||||||||||||||||||||||||||||
| Conservative Allocation |
19.23 | — | — | — | 4.44 | 0.64 | 0.66 | 0.38 | 0.81 | 1.08 | 12.50 | 11.41 | 1.35 | 4.76 | ||||||||||||||||||||||||||||||||||||||||||
| Balanced Allocation |
16.24 | 18.57 | 12.61 | 27.52 | 19.87 | 7.04 | 7.00 | 4.14 | 8.82 | 12.00 | 25.31 | 32.84 | 13.73 | 27.56 | ||||||||||||||||||||||||||||||||||||||||||
| Growth Allocation |
7.21 | 8.22 | 5.66 | 12.40 | — | 10.03 | 10.28 | 6.06 | 12.79 | 17.48 | — | — | 13.30 | 21.11 | ||||||||||||||||||||||||||||||||||||||||||
| Aggressive Allocation |
— | — | — | — | — | 13.71 | 14.14 | 8.21 | 17.63 | 22.97 | — | — | — | — | ||||||||||||||||||||||||||||||||||||||||||
| Conservative Allocation I |
7.70 | — | — | — | 1.13 | 0.35 | 0.32 | 0.17 | 0.27 | 0.28 | 3.19 | 2.92 | 0.35 | 1.22 | ||||||||||||||||||||||||||||||||||||||||||
| Balanced Allocation I |
7.64 | 11.52 | 13.48 | 8.26 | 5.96 | 4.55 | 4.01 | 2.19 | 3.49 | 3.59 | 7.59 | 9.85 | 4.12 | 8.27 | ||||||||||||||||||||||||||||||||||||||||||
| Growth Allocation I |
3.20 | 4.82 | 5.72 | 3.52 | — | 6.13 | 5.56 | 3.02 | 4.78 | 4.95 | — | — | 3.77 | 5.99 | ||||||||||||||||||||||||||||||||||||||||||
| Aggressive Allocation I |
— | — | — | — | — | 6.47 | 5.91 | 3.16 | 5.09 | 5.02 | — | — | — | — | ||||||||||||||||||||||||||||||||||||||||||
| Real Assets Fund |
— | — | — | — | — | — | — | — | — | — | 5.46 | 7.13 | 2.95 | 2.95 | ||||||||||||||||||||||||||||||||||||||||||
234
Table of Contents
A summary of the Fund of Fund’s total long-term and short-term purchases and sales of the shares of the underlying Select Funds during the period ended June 30, 2014 is as follows:
| Total Value at 12/31/13 |
Total Value at 06/30/14 |
Purchases | Sales Proceeds | Dividend Income |
Distributions of Realized Gains |
|||||||||||||||||||
| MyDestination 2005 |
||||||||||||||||||||||||
| Money Market |
$ | 1,750,776 | $ | 1,695,469 | $ | 12,586,604 | $ | 12,641,911 | $ | 91 | $ | — | ||||||||||||
| Low-Duration Bond |
26,643,303 | 30,097,870 | 3,406,384 | 97,000 | 109,066 | 14,318 | ||||||||||||||||||
| Medium-Duration Bond |
9,314,107 | 9,417,137 | 103,065 | 301,000 | 83,065 | — | ||||||||||||||||||
| Global Bond |
2,303,743 | 2,381,544 | 38,804 | 66,000 | 38,804 | — | ||||||||||||||||||
| Defensive Market Strategies |
9,615,183 | 9,896,251 | 399,829 | 644,500 | 36,905 | 93,924 | ||||||||||||||||||
| Value Equity |
4,530,323 | 4,632,414 | 290,148 | 430,000 | 20,838 | 40,310 | ||||||||||||||||||
| Growth Equity |
4,515,306 | 4,684,432 | 534,895 | 480,500 | — | 63,895 | ||||||||||||||||||
| Small Cap Equity |
1,089,610 | 1,142,724 | 90,000 | 64,000 | — | — | ||||||||||||||||||
| International Equity |
5,319,158 | 5,528,684 | 419,000 | 425,000 | — | — | ||||||||||||||||||
| Emerging Markets Equity |
1,475,630 | 1,505,743 | 52,000 | 123,500 | — | — | ||||||||||||||||||
| Inflation Protected Bond |
9,885,972 | 10,683,948 | 635,827 | 272,500 | 110,827 | |||||||||||||||||||
| Flexible Income |
4,132,693 | 4,386,268 | 263,627 | 10,000 | 60,071 | 3,556 | ||||||||||||||||||
| Real Estate Securities |
830,902 | 913,654 | 13,310 | 21,000 | 6,403 | 907 | ||||||||||||||||||
| Global Natural Resources Equity |
1,650,400 | 1,819,595 | — | 86,500 | — | — | ||||||||||||||||||
|
|
|
|
|
|
|
|
|
|
|
|
|
|||||||||||||
| $ | 83,057,106 | $ | 88,785,733 | $ | 18,833,493 | $ | 15,663,411 | $ | 466,070 | $ | 216,910 | |||||||||||||
|
|
|
|
|
|
|
|
|
|
|
|
|
|||||||||||||
| MyDestination 2015 |
||||||||||||||||||||||||
| Money Market |
$ | 6,090,835 | $ | 7,249,082 | $ | 25,600,674 | $ | 24,442,427 | $ | 364 | $ | — | ||||||||||||
| Low-Duration Bond |
49,961,846 | 53,752,240 | 3,521,225 | — | 195,733 | 25,492 | ||||||||||||||||||
| Medium-Duration Bond |
51,248,345 | 56,166,510 | 3,221,761 | — | 471,761 | — | ||||||||||||||||||
| Extended-Duration Bond |
7,125,395 | 7,485,341 | 109,381 | 500,000 | 100,514 | 8,868 | ||||||||||||||||||
| Global Bond |
19,687,399 | 21,220,566 | 614,290 | — | 339,290 | — | ||||||||||||||||||
| Defensive Market Strategies |
79,140,133 | 85,818,885 | 2,584,530 | 300,000 | 320,032 | 814,498 | ||||||||||||||||||
| Value Equity |
36,830,884 | 39,222,443 | 517,737 | — | 176,437 | 341,300 | ||||||||||||||||||
| Growth Equity |
37,360,474 | 39,019,027 | 1,542,483 | 750,000 | — | 542,483 | ||||||||||||||||||
| Small Cap Equity |
9,878,392 | 10,330,202 | 225,000 | — | — | — | ||||||||||||||||||
| International Equity |
43,575,438 | 45,666,924 | 1,944,000 | 1,560,000 | — | — | ||||||||||||||||||
| Emerging Markets Equity |
11,652,513 | 13,097,131 | 560,000 | — | — | — | ||||||||||||||||||
| Inflation Protected Bond |
42,435,631 | 49,395,332 | 5,103,446 | 69,000 | 503,446 | |||||||||||||||||||
| Flexible Income |
17,072,258 | 20,739,718 | 3,663,478 | — | 249,251 | 14,227 | ||||||||||||||||||
| Real Estate Securities |
8,723,360 | 7,733,680 | 61,876 | 2,000,000 | 54,197 | 7,679 | ||||||||||||||||||
| Global Natural Resources Equity |
9,862,035 | 10,404,290 | — | 1,000,000 | — | — | ||||||||||||||||||
|
|
|
|
|
|
|
|
|
|
|
|
|
|||||||||||||
| $ | 430,644,938 | $ | 467,301,371 | $ | 49,269,881 | $ | 30,621,427 | $ | 2,411,025 | $ | 1,754,547 | |||||||||||||
|
|
|
|
|
|
|
|
|
|
|
|
|
|||||||||||||
| MyDestination 2025 |
||||||||||||||||||||||||
| Money Market |
$ | 8,386,521 | $ | 10,057,158 | $ | 41,290,902 | $ | 39,620,266 | $ | 496 | $ | — | ||||||||||||
| Low-Duration Bond |
28,603,451 | 33,761,974 | 5,000,257 | — | 119,316 | 15,549 | ||||||||||||||||||
| Medium-Duration Bond |
52,073,121 | 59,015,231 | 6,325,302 | 1,140,000 | 492,841 | — | ||||||||||||||||||
| Extended-Duration Bond |
13,006,251 | 14,536,781 | 771,502 | 624,500 | 187,714 | 16,537 | ||||||||||||||||||
| Global Bond |
36,500,550 | 39,251,709 | 2,429,393 | 1,369,000 | 629,118 | — | ||||||||||||||||||
| Defensive Market Strategies |
90,438,214 | 104,906,585 | 9,307,370 | — | 391,213 | 995,658 | ||||||||||||||||||
| Value Equity |
64,490,884 | 72,043,105 | 4,614,470 | 527,500 | 324,077 | 626,893 | ||||||||||||||||||
| Growth Equity |
64,816,050 | 73,416,514 | 8,323,629 | 1,329,500 | — | 1,004,129 | ||||||||||||||||||
235
Table of Contents
| Total Value at 12/31/13 |
Total Value at 06/30/14 |
Purchases | Sales Proceeds | Dividend Income |
Distributions of Realized Gains |
|||||||||||||||||||
| Small Cap Equity |
$ | 18,870,550 | $ | 21,260,359 | $ | 2,122,500 | $ | 231,500 | $ | — | $ | — | ||||||||||||
| International Equity |
77,069,778 | 85,676,545 | 7,171,500 | 1,670,000 | — | — | ||||||||||||||||||
| Emerging Markets Equity |
21,153,075 | 23,559,098 | 1,305,000 | 500,000 | — | — | ||||||||||||||||||
| Inflation Protected Bond |
15,858,641 | 20,365,617 | 3,925,810 | 170,000 | 206,810 | — | ||||||||||||||||||
| Flexible Income |
5,209,362 | 7,263,491 | 2,053,889 | — | 86,314 | 4,574 | ||||||||||||||||||
| Real Estate Securities |
16,051,144 | 17,946,107 | 369,083 | 250,000 | 125,764 | 17,819 | ||||||||||||||||||
| Global Natural Resources Equity |
16,286,154 | 18,693,278 | 100,000 | 240,500 | — | — | ||||||||||||||||||
|
|
|
|
|
|
|
|
|
|
|
|
|
|||||||||||||
| $ | 528,813,746 | $ | 601,753,552 | $ | 95,110,607 | $ | 47,672,766 | $ | 2,563,663 | $ | 2,681,159 | |||||||||||||
|
|
|
|
|
|
|
|
|
|
|
|
|
|||||||||||||
| MyDestination 2035 |
||||||||||||||||||||||||
| Money Market |
$ | 5,601,401 | $ | 7,194,594 | $ | 25,687,814 | $ | 24,094,621 | $ | 339 | $ | — | ||||||||||||
| Medium-Duration Bond |
8,713,362 | 11,344,483 | 2,328,179 | — | 86,679 | — | ||||||||||||||||||
| Extended-Duration Bond |
8,332,236 | 9,962,445 | 1,180,844 | 450,000 | 123,122 | 10,723 | ||||||||||||||||||
| Global Bond |
22,546,037 | 27,015,684 | 3,731,508 | 350,000 | 407,008 | — | ||||||||||||||||||
| Defensive Market Strategies |
— | 2,069,909 | 2,026,042 | — | 7,346 | 18,696 | ||||||||||||||||||
| Value Equity |
55,746,522 | 63,598,141 | 4,836,589 | — | 284,075 | 549,513 | ||||||||||||||||||
| Growth Equity |
55,765,221 | 64,277,211 | 7,855,411 | 805,500 | — | 877,411 | ||||||||||||||||||
| Small Cap Equity |
18,951,646 | 21,862,978 | 2,717,000 | 348,500 | — | — | ||||||||||||||||||
| International Equity |
68,380,341 | 77,235,477 | 6,482,000 | 350,000 | — | — | ||||||||||||||||||
| Emerging Markets Equity |
19,050,818 | 21,171,226 | 1,074,000 | 386,000 | — | — | ||||||||||||||||||
| Real Estate Securities |
9,539,390 | 11,007,479 | 546,442 | 149,500 | 76,152 | 10,790 | ||||||||||||||||||
| Global Natural Resources Equity |
9,529,671 | 11,290,099 | 638,500 | 400,000 | — | — | ||||||||||||||||||
|
|
|
|
|
|
|
|
|
|
|
|
|
|||||||||||||
| $ | 282,156,645 | $ | 328,029,726 | $ | 59,104,329 | $ | 27,334,121 | $ | 984,721 | $ | 1,467,133 | |||||||||||||
|
|
|
|
|
|
|
|
|
|
|
|
|
|||||||||||||
| MyDestination 2045 |
||||||||||||||||||||||||
| Money Market |
$ | 4,335,152 | $ | 4,629,908 | $ | 16,932,705 | $ | 16,637,949 | $ | 242 | $ | — | ||||||||||||
| Extended-Duration Bond |
2,049,390 | 2,323,005 | 84,486 | 30,000 | 29,874 | 2,612 | ||||||||||||||||||
| Global Bond |
11,296,170 | 12,863,792 | 1,285,745 | 250,000 | 199,245 | — | ||||||||||||||||||
| Value Equity |
43,786,511 | 49,735,326 | 3,582,725 | — | 222,610 | 430,615 | ||||||||||||||||||
| Growth Equity |
43,675,710 | 50,347,003 | 6,124,235 | 600,000 | — | 681,236 | ||||||||||||||||||
| Small Cap Equity |
16,131,917 | 18,674,943 | 2,086,000 | — | — | — | ||||||||||||||||||
| International Equity |
54,502,717 | 61,426,020 | 5,152,500 | 410,000 | — | — | ||||||||||||||||||
| Emerging Markets Equity |
15,188,913 | 17,125,333 | 802,500 | 27,000 | — | — | ||||||||||||||||||
| Real Estate Securities |
6,964,203 | 7,887,016 | 262,298 | 107,000 | 54,566 | 7,731 | ||||||||||||||||||
| Global Natural Resources Equity |
6,900,755 | 8,150,243 | 519,500 | 350,000 | — | — | ||||||||||||||||||
|
|
|
|
|
|
|
|
|
|
|
|
|
|||||||||||||
| $ | 204,831,438 | $ | 233,162,589 | $ | 36,832,694 | $ | 18,411,949 | $ | 506,537 | $ | 1,122,194 | |||||||||||||
|
|
|
|
|
|
|
|
|
|
|
|
|
|||||||||||||
| MyDestination 2055 |
||||||||||||||||||||||||
| Money Market |
$ | 415,075 | $ | 494,170 | $ | 4,633,839 | $ | 4,554,743 | $ | 21 | $ | — | ||||||||||||
| Global Bond |
789,543 | 1,066,392 | 248,869 | 13,000 | 15,369 | — | ||||||||||||||||||
| Value Equity |
3,407,487 | 4,577,538 | 1,064,540 | 103,000 | 20,290 | 39,249 | ||||||||||||||||||
| Growth Equity |
3,393,408 | 4,597,135 | 1,266,500 | 166,000 | — | 62,001 | ||||||||||||||||||
| Small Cap Equity |
1,280,757 | 1,744,921 | 454,500 | 35,500 | — | — | ||||||||||||||||||
| International Equity |
4,243,038 | 5,745,070 | 1,358,000 | 53,750 | — | — | ||||||||||||||||||
| Emerging Markets Equity |
1,191,035 | 1,530,046 | 348,000 | 112,750 | — | — | ||||||||||||||||||
| Real Estate Securities |
528,778 | 712,496 | 128,677 | 9,500 | 4,972 | 704 | ||||||||||||||||||
| Global Natural Resources Equity |
$ | 532,392 | $ | 718,032 | $ | 151,500 | $ | 58,000 | $ | — | $ | — | ||||||||||||
|
|
|
|
|
|
|
|
|
|
|
|
|
|||||||||||||
| $ | 15,781,513 | $ | 21,185,800 | $ | 9,654,425 | $ | 5,106,243 | $ | 40,652 | $ | 101,954 | |||||||||||||
|
|
|
|
|
|
|
|
|
|
|
|
|
|||||||||||||
236
Table of Contents
| Total Value at 12/31/13 |
Total Value at 06/30/14 |
Purchases | Sales Proceeds | Dividend Income |
Distributions of Realized Gains |
|||||||||||||||||||
| Conservative Allocation |
||||||||||||||||||||||||
| Money Market |
$ | 4,124,830 | $ | 4,769,956 | $ | 18,249,019 | $ | 17,603,893 | $ | 226 | $ | — | ||||||||||||
| Low-Duration Bond |
181,357,631 | 182,454,184 | 1,139,689 | 994,000 | 688,905 | 90,783 | ||||||||||||||||||
| Defensive Market Strategies |
24,101,563 | 23,978,831 | 317,001 | 1,693,000 | 89,421 | 227,580 | ||||||||||||||||||
| Value Equity |
11,615,696 | 11,097,977 | 146,494 | 1,190,000 | 49,923 | 96,571 | ||||||||||||||||||
| Growth Equity |
11,586,568 | 11,065,482 | 578,932 | 1,336,000 | — | 150,932 | ||||||||||||||||||
| Small Cap Equity |
2,552,633 | 2,480,839 | 96,000 | 223,000 | — | — | ||||||||||||||||||
| International Equity |
12,999,842 | 12,678,825 | 354,000 | 1,145,000 | — | — | ||||||||||||||||||
| Emerging Markets Equity |
3,476,288 | 3,464,848 | 70,000 | 320,000 | — | — | ||||||||||||||||||
| Inflation Protected Bond |
37,061,722 | 38,584,213 | 702,024 | 782,000 | 400,024 | — | ||||||||||||||||||
| Flexible Income |
14,017,375 | 13,898,034 | 204,322 | 325,000 | 192,977 | 11,345 | ||||||||||||||||||
| Real Estate Securities |
3,435,007 | 3,510,380 | 28,086 | 320,000 | 24,600 | 3,486 | ||||||||||||||||||
| Global Natural Resources Equity |
12,847,970 | 14,555,630 | 908,000 | 1,275,000 | — | — | ||||||||||||||||||
|
|
|
|
|
|
|
|
|
|
|
|
|
|||||||||||||
| $ | 319,177,125 | $ | 322,539,199 | $ | 22,793,567 | $ | 27,206,893 | $ | 1,446,076 | $ | 580,697 | |||||||||||||
|
|
|
|
|
|
|
|
|
|
|
|
|
|||||||||||||
| Balanced Allocation |
||||||||||||||||||||||||
| Money Market |
$ | 28,394,843 | $ | 29,252,191 | $ | 33,847,116 | $ | 32,989,768 | $ | 1,398 | $ | — | ||||||||||||
| Low-Duration Bond |
151,286,470 | 154,036,585 | 1,953,586 | — | 577,607 | 75,979 | ||||||||||||||||||
| Medium-Duration Bond |
203,632,561 | 210,077,018 | 1,826,099 | 2,000,000 | 1,826,099 | — | ||||||||||||||||||
| Extended-Duration Bond |
51,050,418 | 53,522,087 | 2,206,474 | 5,000,000 | 704,464 | 62,010 | ||||||||||||||||||
| Global Bond |
101,512,097 | 107,406,199 | 2,226,086 | 1,000,000 | 1,726,086 | |||||||||||||||||||
| Defensive Market Strategies |
103,700,222 | 107,347,282 | 1,419,136 | 3,340,000 | 400,314 | 1,018,822 | ||||||||||||||||||
| Value Equity |
115,385,816 | 121,502,756 | 1,603,839 | 1,300,000 | 546,566 | 1,057,273 | ||||||||||||||||||
| Growth Equity |
117,555,854 | 118,124,708 | 1,611,204 | 3,488,000 | — | 1,611,205 | ||||||||||||||||||
| Small Cap Equity |
25,883,218 | 26,771,048 | 779,000 | 500,000 | — | — | ||||||||||||||||||
| International Equity |
132,825,976 | 137,321,895 | 2,000,000 | 2,500,000 | — | — | ||||||||||||||||||
| Emerging Markets Equity |
35,939,786 | 38,533,890 | 1,500,000 | 1,500,000 | — | — | ||||||||||||||||||
| Inflation Protected Bond |
72,324,031 | 78,096,005 | 4,052,604 | 1,450,000 | 802,604 | — | ||||||||||||||||||
| Flexible Income |
38,381,452 | 39,981,571 | 1,600,661 | — | 543,861 | 31,799 | ||||||||||||||||||
| Real Estate Securities |
33,665,678 | 35,737,197 | 854,926 | 2,440,000 | 250,441 | 35,485 | ||||||||||||||||||
| Global Natural Resources Equity |
75,969,866 | 84,207,566 | 1,450,000 | 5,250,000 | — | — | ||||||||||||||||||
|
|
|
|
|
|
|
|
|
|
|
|
|
|||||||||||||
| $ | 1,287,508,288 | $ | 1,341,917,998 | $ | 58,930,731 | $ | 62,757,768 | $ | 7,379,440 | $ | 3,892,573 | |||||||||||||
|
|
|
|
|
|
|
|
|
|
|
|
|
|||||||||||||
| Growth Allocation |
||||||||||||||||||||||||
| Money Market |
$ | 19,336,501 | $ | 22,553,548 | $ | 27,716,712 | $ | 24,499,665 | $ | 1,027 | $ | — | ||||||||||||
| Low-Duration Bond |
67,509,057 | 68,355,566 | 491,354 | — | 257,450 | 33,904 | ||||||||||||||||||
| Medium-Duration Bond |
91,002,174 | 93,003,152 | 808,999 | 1,750,000 | 808,999 | — | ||||||||||||||||||
| Extended-Duration Bond |
23,302,975 | 24,024,788 | 945,089 | 2,600,000 | 317,049 | 28,040 | ||||||||||||||||||
| Global Bond |
45,723,874 | 48,386,291 | 1,223,641 | 650,000 | 773,641 | — | ||||||||||||||||||
| Value Equity |
170,602,934 | 173,161,648 | 2,285,737 | 8,130,000 | 778,947 | 1,506,790 | ||||||||||||||||||
| Growth Equity |
170,653,044 | 173,504,219 | 3,066,573 | 3,850,000 | — | 2,366,573 | ||||||||||||||||||
| Small Cap Equity |
37,525,434 | 39,167,304 | 2,230,000 | 1,500,000 | — | — | ||||||||||||||||||
| International Equity |
195,545,699 | 199,196,881 | 650,000 | 4,100,000 | — | — | ||||||||||||||||||
| Emerging Markets Equity |
52,827,873 | 56,158,992 | 2,600,000 | 3,100,000 | — | — | ||||||||||||||||||
237
Table of Contents
| Total Value at 12/31/13 |
Total Value at 06/30/14 |
Purchases | Sales Proceeds | Dividend Income |
Distributions of Realized Gains |
|||||||||||||||||||
| Real Estate Securities |
$ | 32,195,539 | $ | 34,621,358 | $ | 906,998 | $ | 2,000,000 | $ | 242,621 | $ | 34,377 | ||||||||||||
| Global Natural Resources Equity |
56,743,574 | 64,504,979 | 650,000 | 1,850,000 | — | — | ||||||||||||||||||
|
|
|
|
|
|
|
|
|
|
|
|
|
|||||||||||||
| $ | 962,968,678 | $ | 996,638,726 | $ | 43,575,103 | $ | 54,029,665 | $ | 3,179,734 | $ | 3,969,684 | |||||||||||||
|
|
|
|
|
|
|
|
|
|
|
|
|
|||||||||||||
| Aggressive Allocation |
||||||||||||||||||||||||
| Money Market |
$ | 17,878,395 | $ | 19,230,558 | $ | 26,695,694 | $ | 25,343,531 | $ | 872 | $ | — | ||||||||||||
| Value Equity |
232,579,031 | 236,630,107 | 3,133,416 | 10,650,000 | 1,067,824 | 2,065,592 | ||||||||||||||||||
| Growth Equity |
236,169,182 | 238,733,609 | 8,521,134 | 11,085,000 | — | 3,271,134 | ||||||||||||||||||
| Small Cap Equity |
51,819,192 | 53,027,670 | 1,500,000 | 1,465,000 | — | — | ||||||||||||||||||
| International Equity |
267,705,065 | 274,412,296 | 1,500,000 | 4,600,000 | — | — | ||||||||||||||||||
| Emerging Markets Equity |
72,347,121 | 73,795,304 | 2,000,000 | 5,665,000 | — | — | ||||||||||||||||||
|
|
|
|
|
|
|
|
|
|
|
|
|
|||||||||||||
| $ | 878,497,986 | $ | 895,829,544 | $ | 43,350,244 | $ | 58,808,531 | $ | 1,068,696 | $ | 5,336,726 | |||||||||||||
|
|
|
|
|
|
|
|
|
|
|
|
|
|||||||||||||
| Conservative Allocation I |
||||||||||||||||||||||||
| Money Market |
$ | 1,003,363 | $ | 1,166,186 | $ | 8,410,755 | $ | 8,247,932 | $ | 94 | $ | — | ||||||||||||
| Low-Duration Bond |
47,501,174 | 46,583,890 | 1,773,239 | 2,802,000 | 352,155 | 37,085 | ||||||||||||||||||
| Defensive Market Strategies |
6,313,658 | 6,126,813 | 189,878 | 704,000 | 27,824 | 58,054 | ||||||||||||||||||
| Value Equity |
3,040,580 | 2,834,869 | 121,840 | 420,000 | 33,589 | 52,250 | ||||||||||||||||||
| Growth Equity |
3,038,462 | 2,826,356 | 224,688 | 464,000 | — | 72,687 | ||||||||||||||||||
| Small Cap Equity |
668,463 | 635,090 | 24,000 | 72,000 | — | — | ||||||||||||||||||
| International Equity |
3,405,600 | 3,239,614 | 128,000 | 420,000 | — | — | ||||||||||||||||||
| Emerging Markets Equity |
912,549 | 887,004 | 24,000 | 112,000 | — | — | ||||||||||||||||||
| Inflation Protected Bond |
9,704,788 | 9,853,393 | 510,888 | 780,000 | 102,888 | — | ||||||||||||||||||
| Flexible Income |
3,673,259 | 3,550,665 | 157,093 | 280,000 | 50,129 | 2,964 | ||||||||||||||||||
| Real Estate Securities |
900,449 | 899,094 | 15,193 | 112,000 | 6,301 | 893 | ||||||||||||||||||
| Global Natural Resources Equity |
3,364,729 | 3,717,950 | 312,000 | 496,000 | — | — | ||||||||||||||||||
|
|
|
|
|
|
|
|
|
|
|
|
|
|||||||||||||
| $ | 83,527,074 | $ | 82,320,924 | $ | 11,891,574 | $ | 14,909,932 | $ | 572,980 | $ | 223,933 | |||||||||||||
|
|
|
|
|
|
|
|
|
|
|
|
|
|||||||||||||
| Balanced Allocation I |
||||||||||||||||||||||||
| Money Market |
$ | 7,009,585 | $ | 7,493,494 | $ | 16,448,670 | $ | 15,964,762 | $ | 610 | $ | — | ||||||||||||
| Low-Duration Bond |
45,601,127 | 46,219,516 | 1,499,585 | 988,000 | 340,083 | 35,502 | ||||||||||||||||||
| Medium-Duration Bond |
61,464,073 | 63,036,206 | 2,094,646 | 1,852,000 | 1,210,646 | — | ||||||||||||||||||
| Extended-Duration Bond |
15,414,850 | 16,050,819 | 1,438,501 | 1,772,000 | 782,330 | 64,171 | ||||||||||||||||||
| Global Bond |
30,621,300 | 32,229,562 | 1,083,997 | 872,000 | 515,997 | — | ||||||||||||||||||
| Defensive Market Strategies |
31,292,866 | 32,213,536 | 800,424 | 1,540,000 | 146,582 | 305,842 | ||||||||||||||||||
| Value Equity |
34,815,915 | 36,462,890 | 1,513,909 | 1,028,000 | 432,747 | 673,162 | ||||||||||||||||||
| Growth Equity |
35,474,776 | 35,435,839 | 1,232,983 | 1,584,000 | — | 912,983 | ||||||||||||||||||
| Small Cap Equity |
7,810,599 | 8,038,095 | 316,000 | 280,000 | — | — | ||||||||||||||||||
| International Equity |
40,093,098 | 41,246,971 | 1,116,000 | 1,508,000 | — | — | ||||||||||||||||||
| Emerging Markets Equity |
10,840,765 | 11,551,612 | 584,000 | 656,000 | — | — | ||||||||||||||||||
| Inflation Protected Bond |
21,817,397 | 23,434,865 | 1,436,355 | 768,000 | 240,355 | — | ||||||||||||||||||
| Flexible Income |
11,576,680 | 11,996,804 | 640,067 | 220,000 | 162,568 | 9,499 | ||||||||||||||||||
| Real Estate Securities |
10,155,515 | 10,725,778 | 385,975 | 908,000 | 75,305 | 10,670 | ||||||||||||||||||
| Global Natural Resources Equity |
22,917,798 | 25,270,430 | 712,000 | 1,960,000 | — | — | ||||||||||||||||||
|
|
|
|
|
|
|
|
|
|
|
|
|
|||||||||||||
| $ | 386,906,344 | $ | 401,406,417 | $ | 31,303,112 | $ | 31,900,762 | $ | 3,907,223 | $ | 2,011,829 | |||||||||||||
|
|
|
|
|
|
|
|
|
|
|
|
|
|||||||||||||
238
Table of Contents
| Total Value at 12/31/13 |
Total Value at 06/30/14 |
Purchases | Sales Proceeds | Dividend Income |
Distributions of Realized Gains |
|||||||||||||||||||
| Growth Allocation I |
||||||||||||||||||||||||
| Money Market |
$ | 5,114,024 | $ | 5,410,217 | $ | 12,468,170 | $ | 12,171,977 | $ | 420 | $ | — | ||||||||||||
| Low-Duration Bond |
18,996,085 | 19,382,516 | 689,722 | 348,000 | 142,849 | 14,873 | ||||||||||||||||||
| Medium-Duration Bond |
25,627,848 | 26,369,731 | 1,077,778 | 892,000 | 505,778 | — | ||||||||||||||||||
| Extended-Duration Bond |
6,560,575 | 6,810,666 | 603,221 | 764,000 | 331,980 | 27,241 | ||||||||||||||||||
| Global Bond |
12,867,895 | 13,717,689 | 618,054 | 356,000 | 218,054 | — | ||||||||||||||||||
| Value Equity |
47,984,403 | 49,097,713 | 2,070,669 | 2,548,000 | 583,305 | 907,364 | ||||||||||||||||||
| Growth Equity |
48,042,442 | 49,176,873 | 2,580,331 | 1,900,000 | — | 1,268,331 | ||||||||||||||||||
| Small Cap Equity |
10,554,319 | 11,108,861 | 828,000 | 544,000 | — | — | ||||||||||||||||||
| International Equity |
55,049,827 | 56,529,391 | 1,324,000 | 1,916,000 | — | — | ||||||||||||||||||
| Emerging Markets Equity |
14,866,752 | 15,908,193 | 1,060,000 | 1,112,000 | — | — | ||||||||||||||||||
| Real Estate Securities |
9,059,241 | 9,817,023 | 426,768 | 660,000 | 68,992 | 9,775 | ||||||||||||||||||
| Global Natural Resources Equity |
15,970,817 | 18,287,725 | 476,000 | 684,000 | — | — | ||||||||||||||||||
|
|
|
|
|
|
|
|
|
|
|
|
|
|||||||||||||
| $ | 270,694,228 | $ | 281,616,598 | $ | 24,222,713 | $ | 23,895,977 | $ | 1,851,378 | $ | 2,227,584 | |||||||||||||
|
|
|
|
|
|
|
|
|
|
|
|
|
|||||||||||||
| Aggressive Allocation I |
||||||||||||||||||||||||
| Money Market |
$ | 3,618,856 | $ | 3,687,894 | $ | 8,293,805 | $ | 8,224,767 | $ | 289 | $ | — | ||||||||||||
| Value Equity |
49,964,167 | 51,802,867 | 2,506,032 | 2,360,000 | 615,926 | 958,107 | ||||||||||||||||||
| Growth Equity |
50,784,861 | 52,244,819 | 3,602,119 | 2,652,000 | — | 1,350,119 | ||||||||||||||||||
| Small Cap Equity |
11,136,469 | 11,609,258 | 620,000 | 420,000 | — | — | ||||||||||||||||||
| International Equity |
57,574,864 | 60,128,490 | 1,468,000 | 1,120,000 | — | — | ||||||||||||||||||
| Emerging Markets Equity |
15,535,488 | 16,138,707 | 764,000 | 1,284,000 | — | — | ||||||||||||||||||
|
|
|
|
|
|
|
|
|
|
|
|
|
|||||||||||||
| $ | 188,614,705 | $ | 195,612,035 | $ | 17,253,956 | $ | 16,060,767 | $ | 616,215 | $ | 2,308,226 | |||||||||||||
|
|
|
|
|
|
|
|
|
|
|
|
|
|||||||||||||
| Real Assets |
||||||||||||||||||||||||
| Money Market |
$ | 377,614 | $ | 791,426 | $ | 12,399,430 | $ | 11,985,618 | $ | 40 | $ | — | ||||||||||||
| Inflation Protected Bond |
8,964,518 | 16,857,207 | 7,377,763 | 6,700 | 162,255 | — | ||||||||||||||||||
| Flexible Income |
4,619,355 | 8,684,349 | 4,064,649 | — | 95,672 | 5,203 | ||||||||||||||||||
| Real Estate Securities |
4,151,983 | 7,677,162 | 2,930,751 | 34,194 | 52,403 | 7,425 | ||||||||||||||||||
| Global Natural Resources Equity |
4,788,101 | 9,003,039 | 3,510,655 | 307,235 | — | — | ||||||||||||||||||
|
|
|
|
|
|
|
|
|
|
|
|
|
|||||||||||||
| $ | 22,901,571 | $ | 43,013,183 | $ | 30,283,248 | $ | 12,333,747 | $ | 310,370 | $ | 12,628 | |||||||||||||
|
|
|
|
|
|
|
|
|
|
|
|
|
|||||||||||||
g. Transactions with Affiliates
Advisers to Investment Companies, including GuideStone Funds, are permitted under Rule 17a-7 of the 1940 Act to purchase or sell securities directly between affiliated clients. When affecting these “cross” transactions, Rule 17a-7 imposes restrictions on how the trades are processed and reported. The specified conditions within Rule 17a-7 are outlined in procedures established by or under the direction of the Board of Trustees. The procedures have been designed to provide assurance that any purchase or sale of securities by the Fund from or to another Fund complies with Rule 17a-7 under the 1940 act. There were no security transactions with affiliates for the six months ended June 30, 2014.
For the period ended June 30, 2014, the Funds engaged in the following security transactions with affiliates:
| Purchases | Sales Proceeds |
Net Realized Loss from Sales |
||||||||||
| Low-Duration Bond |
$ | 29,090,956 | $ | 34,888,576 | $ | 97,608 | ||||||
| Medium-Duration Bond |
5,757,320 | 9,969,856 | 1,650,446 | |||||||||
| Defensive Market Strategies |
— | 932,607 | 319,968 | |||||||||
239
Table of Contents
4. SECURITIES LENDING
Through an agreement with The Northern Trust Company (“Northern Trust”) (the Funds’ custodian) the Select Funds may lend portfolio securities to certain brokers, dealers and other financial institutions that pay the Select Funds a negotiated fee. The Select Funds receive cash or U.S. government securities as collateral against the loaned securities in an amount at least equal to the market value of the loaned securities. The Funds continue to own the loaned securities and the securities remain in the investment portfolio. However, in the event of default or bankruptcy by the other party to the agreement, realization and/or retention of the collateral may be subject to legal proceedings. Cash collateral has been invested in a short-term money market fund of Northern Trust, an affiliate of the Funds, that invests in securities that satisfy the quality requirements of Rule 2a-7 and have short maturities. At June 30, 2014, the market values of loaned securities and collateral received were as follows:
| Fund |
Value of Securities Loaned |
Value of Non-cash Collateral |
Value of Cash Collateral |
Total Value of Collateral |
||||||||||||
| Low-Duration Bond |
$ | 100,892,424 | $ | 608,034 | $ | 102,504,619 | $ | 103,112,653 | ||||||||
| Medium-Duration Bond |
75,788,322 | 768,991 | 76,619,111 | 77,388,102 | ||||||||||||
| Extended-Duration Bond |
42,144,515 | 11,632,959 | 31,264,565 | 42,897,524 | ||||||||||||
| Global Bond |
74,567,749 | 1,142,217 | 76,066,484 | 77,208,701 | ||||||||||||
| Defensive Market Strategies |
74,358,611 | 725,577 | 75,859,414 | 76,584,991 | ||||||||||||
| Equity Index |
29,037,846 | 40,787 | 29,596,320 | 29,637,107 | ||||||||||||
| Value Equity |
167,163,731 | 426,521 | 171,496,313 | 171,922,834 | ||||||||||||
| Growth Equity |
188,089,507 | — | 191,433,530 | 191,433,530 | ||||||||||||
| Small Cap Equity |
179,121,179 | 1,057,758 | 183,223,771 | 184,281,529 | ||||||||||||
| International Equity |
78,616,108 | 4,130,745 | 77,202,766 | 81,333,511 | ||||||||||||
| Emerging Markets Equity |
33,884,953 | 4,069,007 | 32,018,057 | 36,087,064 | ||||||||||||
| Real Estate Securities |
37,204,254 | 479,099 | 37,954,306 | 38,433,405 | ||||||||||||
| Global Natural Resources Equity |
94,486,288 | 14,624,478 | 82,469,048 | 97,093,526 | ||||||||||||
Securities lending transactions are entered into by the Funds under a Securities Lending Authorization Agreement which permit the Funds, under certain circumstances including an event of default (such as bankruptcy or insolvency), to offset amounts payable by the Fund to the same counterparty against amounts to be received and create one single net payment due to or from the Fund.
At June 30, 2014, the securities loaned which are subject to an MA on a net payment basis are as follows:
| Fund |
Value of Securities Loaned |
Fair Value of Non-cash Collateral |
Cash Collateral (Pledged) |
Net Amount(1) | ||||||||||||
| Low-Duration Bond |
$ | 100,892,424 | $ | (608,034 | ) | $ | (100,284,390 | ) | $ | — | ||||||
| Medium-Duration Bond |
75,788,322 | (768,991 | ) | (75,019,331 | ) | — | ||||||||||
| Extended-Duration Bond |
42,144,515 | (11,632,959 | ) | (30,511,556 | ) | — | ||||||||||
| Global Bond |
74,567,749 | (1,142,217 | ) | (73,425,532 | ) | — | ||||||||||
| Defensive Market Strategies |
74,358,611 | (725,577 | ) | (73,633,034 | ) | — | ||||||||||
| Equity Index |
29,037,846 | (40,787 | ) | (28,997,059 | ) | — | ||||||||||
| Value Equity |
167,163,731 | (426,521 | ) | (166,737,210 | ) | — | ||||||||||
| Growth Equity |
188,089,507 | — | (188,089,507 | ) | — | |||||||||||
| Small Cap Equity |
179,121,179 | (1,057,758 | ) | (178,063,421 | ) | — | ||||||||||
| International Equity |
78,616,108 | (4,130,745 | ) | (74,485,363 | ) | — | ||||||||||
| Emerging Markets Equity |
33,884,953 | (4,069,007 | ) | (29,815,946 | ) | — | ||||||||||
| Real Estate Securities |
37,204,254 | (479,099 | ) | (36,725,155 | ) | — | ||||||||||
| Global Natural Resources Equity |
94,486,288 | (14,624,478 | ) | (79,861,810 | ) | — | ||||||||||
| (1) | Net amount represents the net amount receivable due from (payable to) the counterparty in the event of default. |
Additional information about master netting arrangements can be found in the Repurchase Agreements and Derivative Financial Instruments sections of the Notes to Financial Statements.
240
Table of Contents
5. INVESTMENT TRANSACTIONS
For the period ended June 30, 2014, the cost of purchases and proceeds from sales and maturities for each Fund were as follows:
| Cost of Purchases
and Proceeds from Sales and Maturities of Long-Term Securities (other than U.S. Government Obligations) |
Cost of Purchases and Proceeds from Sales and Maturities of Long-Term U.S. Government Obligations |
|||||||||||||||
| Purchases | Sale and Maturity Proceeds |
Purchases | Sale and Maturity Proceeds |
|||||||||||||
| MyDestination 2005 |
$ | 5,564,000 | $ | 3,086,000 | $ | — | $ | — | ||||||||
| MyDestination 2015 |
19,504,000 | 6,179,000 | — | — | ||||||||||||
| MyDestination 2025 |
49,750,379 | 8,052,500 | — | — | ||||||||||||
| MyDestination 2035 |
31,404,500 | 3,239,500 | — | — | ||||||||||||
| MyDestination 2045 |
18,561,500 | 1,774,000 | — | — | ||||||||||||
| MyDestination 2055 |
5,025,000 | 551,500 | — | — | ||||||||||||
| Conservative Allocation |
2,518,000 | 9,603,000 | — | — | ||||||||||||
| Balanced Allocation |
13,813,000 | 29,768,000 | — | — | ||||||||||||
| Growth Allocation |
8,710,000 | 29,530,000 | — | — | ||||||||||||
| Aggressive Allocation |
10,250,000 | 33,465,000 | — | — | ||||||||||||
| Conservative Allocation I |
2,684,000 | 6,662,000 | — | — | ||||||||||||
| Balanced Allocation I |
8,936,000 | 15,936,000 | — | — | ||||||||||||
| Growth Allocation I |
7,676,000 | 11,724,000 | — | — | ||||||||||||
| Aggressive Allocation I |
6,036,000 | 7,836,000 | — | — | ||||||||||||
| Low-Duration Bond |
604,592,333 | 516,421,642 | 1,154,301,885 | 1,119,368,909 | ||||||||||||
| Medium-Duration Bond |
1,060,637,104 | 1,112,387,006 | 829,212,714 | 804,264,452 | ||||||||||||
| Extended-Duration Bond |
16,988,229 | 31,163,064 | 19,963,872 | 8,979,780 | ||||||||||||
| Global Bond |
154,437,787 | 144,554,481 | 19,688,756 | 4,078,902 | ||||||||||||
| Defensive Market Strategies |
318,060,839 | 319,737,509 | — | — | ||||||||||||
| Equity Index |
14,852,376 | 11,250,815 | — | — | ||||||||||||
| Value Equity |
330,624,797 | 326,082,263 | — | — | ||||||||||||
| Growth Equity |
352,702,585 | 349,873,317 | — | — | ||||||||||||
| Small Cap Equity |
355,177,774 | 356,693,902 | 6,619,744 | 15,652,458 | ||||||||||||
| International Equity |
314,830,908 | 289,715,918 | — | — | ||||||||||||
| Emerging Markets Equity |
72,374,729 | 59,012,407 | — | — | ||||||||||||
| Inflation Protected Bond |
1,911,767 | 5,353,420 | 113,535,435 | 88,482,952 | ||||||||||||
| Flexible Income |
67,866,577 | 53,785,483 | — | — | ||||||||||||
| Real Assets |
21,346,300 | 348,129 | — | — | ||||||||||||
| Real Estate Securities |
145,161,668 | 151,976,072 | — | — | ||||||||||||
| Global Natural Resources Equity |
46,764,098 | 45,075,770 | — | — | ||||||||||||
241
Table of Contents
Financial Futures Contracts
Investments as of June 30, 2014, included cash and securities that were valued and pledged as collateral to cover initial margin deposits. The market value of the open futures contracts is as follows:
| Fund/Future Type |
Expiration Date | Open Long (Short) Contracts |
Notional Market Value of Contracts |
Counter- party |
Net Unrealized Appreciation (Depreciation) on Futures |
|||||||||||||||
| MyDestination 2005 Fund |
||||||||||||||||||||
| S&P 500® E-Mini |
09/2014 | 6 | $ | 585,720 | GSC | $ | 8,762 | |||||||||||||
|
|
|
|
|
|||||||||||||||||
| MyDestination 2015 Fund |
||||||||||||||||||||
| 10-Year U.S. Treasury Note |
09/2014 | 19 | $ | 2,378,266 | GSC | $ | 3,419 | |||||||||||||
| MSCI EAFE Index E-Mini |
09/2014 | 12 | 1,181,340 | GSC | 5,515 | |||||||||||||||
| MSCI Emerging Markets E-Mini |
09/2014 | 5 | 260,175 | GSC | (183 | ) | ||||||||||||||
| S&P 500® E-Mini |
09/2014 | 26 | 2,538,120 | GSC | 37,966 | |||||||||||||||
|
|
|
|
|
|||||||||||||||||
| $ | 6,357,901 | $ | 46,717 | |||||||||||||||||
|
|
|
|
|
|||||||||||||||||
| MyDestination 2025 Fund |
||||||||||||||||||||
| 10-Year U.S. Treasury Note |
09/2014 | 19 | $ | 2,378,266 | GSC | $ | 4,120 | |||||||||||||
| MSCI EAFE Index E-Mini |
09/2014 | 23 | 2,264,235 | GSC | 10,295 | |||||||||||||||
| MSCI Emerging Markets E-Mini |
09/2014 | 10 | 520,350 | GSC | (1,018 | ) | ||||||||||||||
| S&P 500® E-Mini |
09/2014 | 43 | 4,197,660 | GSC | 55,771 | |||||||||||||||
|
|
|
|
|
|||||||||||||||||
| $ | 9,360,511 | $ | 69,168 | |||||||||||||||||
|
|
|
|
|
|||||||||||||||||
| MyDestination 2035 Fund |
||||||||||||||||||||
| 10-Year U.S. Treasury Note |
09/2014 | 9 | $ | 1,126,547 | GSC | $ | 1,892 | |||||||||||||
| MSCI EAFE Index E-Mini |
09/2014 | 21 | 2,067,345 | GSC | 7,523 | |||||||||||||||
| MSCI Emerging Markets E-Mini |
09/2014 | 8 | 416,280 | GSC | (318 | ) | ||||||||||||||
| S&P 500® E-Mini |
09/2014 | 40 | 3,904,800 | GSC | 49,066 | |||||||||||||||
|
|
|
|
|
|||||||||||||||||
| $ | 7,514,972 | $ | 58,163 | |||||||||||||||||
|
|
|
|
|
|||||||||||||||||
| MyDestination 2045 Fund |
||||||||||||||||||||
| 10-Year U.S. Treasury Note |
09/2014 | 2 | $ | 250,344 | GSC | $ | 360 | |||||||||||||
| MSCI EAFE Index E-Mini |
09/2014 | 15 | 1,476,675 | GSC | 6,496 | |||||||||||||||
| MSCI Emerging Markets E-Mini |
09/2014 | 7 | 364,245 | GSC | (503 | ) | ||||||||||||||
| S&P 500® E-Mini |
09/2014 | 27 | 2,635,740 | GSC | 36,974 | |||||||||||||||
|
|
|
|
|
|||||||||||||||||
| $ | 4,727,004 | $ | 43,327 | |||||||||||||||||
|
|
|
|
|
|||||||||||||||||
| MyDestination 2055 Fund |
||||||||||||||||||||
| S&P 500® E-Mini |
09/2014 | 4 | $ | 390,480 | GSC | $ | 5,840 | |||||||||||||
|
|
|
|
|
|||||||||||||||||
| Conservative Allocation Fund |
||||||||||||||||||||
| 2-Year U.S. Treasury Note |
09/2014 | 14 | $ | 3,074,313 | GSC | $ | (547 | ) | ||||||||||||
| MSCI EAFE Index E-Mini |
09/2014 | 4 | 393,780 | GSC | 1,690 | |||||||||||||||
| MSCI Emerging Markets E-Mini |
09/2014 | 1 | 52,035 | GSC | 185 | |||||||||||||||
| S&P 500® E-Mini |
09/2014 | 8 | 780,960 | GSC | 11,682 | |||||||||||||||
|
|
|
|
|
|||||||||||||||||
| $ | 4,301,088 | $ | 13,010 | |||||||||||||||||
|
|
|
|
|
|||||||||||||||||
242
Table of Contents
| Fund/Future Type |
Expiration Date | Open Long (Short) Contracts |
Notional Market Value of Contracts |
Counter- party |
Net Unrealized Appreciation (Depreciation) on Futures |
|||||||||||||||
| Balanced Allocation Fund |
||||||||||||||||||||
| 10-Year U.S. Treasury Note |
09/2014 | 28 | $ | 3,504,813 | GSC | $ | 5,037 | |||||||||||||
| 5-Year U.S. Treasury Note |
09/2014 | 46 | 5,495,203 | GSC | (6,468 | ) | ||||||||||||||
| Long U.S. Treasury Bond |
09/2014 | 22 | 3,018,125 | GSC | 22,356 | |||||||||||||||
| MSCI EAFE Index E-Mini |
09/2014 | 47 | 4,626,915 | GSC | 19,190 | |||||||||||||||
| MSCI Emerging Markets E-Mini |
09/2014 | 23 | 1,196,805 | GSC | (2,423 | ) | ||||||||||||||
| S&P 500® E-Mini |
09/2014 | 90 | 8,785,800 | GSC | 131,420 | |||||||||||||||
|
|
|
|
|
|||||||||||||||||
| $ | 26,627,661 | $ | 169,112 | |||||||||||||||||
|
|
|
|
|
|||||||||||||||||
| Growth Allocation Fund |
||||||||||||||||||||
| 10-Year U.S. Treasury Note |
09/2014 | 12 | $ | 1,502,062 | GSC | $ | 2,159 | |||||||||||||
| 5-Year U.S. Treasury Note |
09/2014 | 18 | 2,150,297 | GSC | (2,531 | ) | ||||||||||||||
| Long U.S. Treasury Bond |
09/2014 | 9 | 1,234,688 | GSC | 9,146 | |||||||||||||||
| MSCI EAFE Index E-Mini |
09/2014 | 56 | 5,512,920 | GSC | 22,770 | |||||||||||||||
| MSCI Emerging Markets E-Mini |
09/2014 | 26 | 1,352,910 | GSC | (3,303 | ) | ||||||||||||||
| S&P 500® E-Mini |
09/2014 | 108 | 10,542,960 | GSC | 157,315 | |||||||||||||||
|
|
|
|
|
|||||||||||||||||
| $ | 22,295,837 | $ | 185,556 | |||||||||||||||||
|
|
|
|
|
|||||||||||||||||
| Aggressive Allocation Fund |
||||||||||||||||||||
| MSCI EAFE Index E-Mini |
09/2014 | 64 | $ | 6,300,480 | GSC | $ | 23,574 | |||||||||||||
| MSCI Emerging Markets E-Mini |
09/2014 | 31 | 1,613,085 | GSC | (3,888 | ) | ||||||||||||||
| S&P 500® E-Mini |
09/2014 | 121 | 11,812,020 | GSC | 157,153 | |||||||||||||||
|
|
|
|
|
|||||||||||||||||
| $ | 19,725,585 | $ | 176,839 | |||||||||||||||||
|
|
|
|
|
|||||||||||||||||
| Conservative Allocation Fund I |
||||||||||||||||||||
| S&P 500® E-Mini |
09/2014 | 2 | $ | 195,240 | GSC | $ | 2,702 | |||||||||||||
|
|
|
|
|
|||||||||||||||||
| Balanced Allocation Fund I |
||||||||||||||||||||
| 10-Year U.S. Treasury Note |
09/2014 | 7 | $ | 876,203 | GSC | $ | 1,260 | |||||||||||||
| 5-Year U.S. Treasury Note |
09/2014 | 11 | 1,314,070 | GSC | (1,547 | ) | ||||||||||||||
| Long U.S. Treasury Bond |
09/2014 | 5 | 685,938 | GSC | 5,081 | |||||||||||||||
| MSCI EAFE Index E-Mini |
09/2014 | 11 | 1,082,895 | GSC | 4,870 | |||||||||||||||
| MSCI Emerging Markets E-Mini |
09/2014 | 5 | 260,175 | GSC | (183 | ) | ||||||||||||||
| S&P 500® E-Mini |
09/2014 | 22 | 2,147,640 | GSC | 32,124 | |||||||||||||||
|
|
|
|
|
|||||||||||||||||
| $ | 6,366,921 | $ | 41,605 | |||||||||||||||||
|
|
|
|
|
|||||||||||||||||
| Growth Allocation Fund I |
||||||||||||||||||||
| 10-Year U.S. Treasury Note |
09/2014 | 2 | $ | 250,344 | GSC | $ | 1,039 | |||||||||||||
| 5-Year U.S. Treasury Note |
09/2014 | 5 | 597,304 | GSC | (703 | ) | ||||||||||||||
| Long U.S. Treasury Bond |
09/2014 | 2 | 274,375 | GSC | 2,033 | |||||||||||||||
| MSCI EAFE Index E-Mini |
09/2014 | 11 | 1,082,895 | GSC | 5,466 | |||||||||||||||
| MSCI Emerging Markets E-Mini |
09/2014 | 5 | 260,175 | GSC | (183 | ) | ||||||||||||||
| S&P 500® E-Mini |
09/2014 | 24 | 2,342,880 | GSC | 34,400 | |||||||||||||||
|
|
|
|
|
|||||||||||||||||
| $ | 4,807,973 | $ | 42,052 | |||||||||||||||||
|
|
|
|
|
|||||||||||||||||
| Aggressive Allocation Fund I |
||||||||||||||||||||
| MSCI EAFE Index E-Mini |
09/2014 | 13 | $ | 1,279,785 | GSC | $ | 4,916 | |||||||||||||
| MSCI Emerging Markets E-Mini |
09/2014 | 6 | 312,210 | GSC | (385 | ) | ||||||||||||||
| S&P 500® E-Mini |
09/2014 | 22 | 2,147,640 | GSC | 29,118 | |||||||||||||||
|
|
|
|
|
|||||||||||||||||
| $ | 3,739,635 | $ | 33,649 | |||||||||||||||||
|
|
|
|
|
|||||||||||||||||
243
Table of Contents
| Fund/Future Type |
Expiration Date | Open Long (Short) Contracts |
Notional Market Value of Contracts |
Counter- party |
Net Unrealized Appreciation (Depreciation) on Futures |
|||||||||||||||
| Low-Duration Bond Fund |
||||||||||||||||||||
| 90-Day Euro |
03/2014 | 323 | $ | 110,289,042 | CITI | $ | 150,147 | |||||||||||||
| 90-Day Euro |
03/2014 | 26 | 8,877,756 | JPM | 23,106 | |||||||||||||||
| 90-Day Euro |
03/2014 | (482 | ) | (119,084,125 | ) | CITI | (54,991 | ) | ||||||||||||
| 90-Day Euro |
09/2014 | (1 | ) | (249,400 | ) | CITI | (3,240 | ) | ||||||||||||
| 10-Year U.S. Treasury Note |
09/2014 | (185 | ) | (23,156,797 | ) | UBS | 12,545 | |||||||||||||
| 2-Year U.S. Treasury Note |
09/2014 | 228 | 50,067,375 | CITI | (22,856 | ) | ||||||||||||||
| 2-Year U.S. Treasury Note |
09/2014 | 120 | 26,351,250 | GSC | (14,196 | ) | ||||||||||||||
| 2-Year U.S. Treasury Note |
09/2014 | 31 | 6,807,406 | UBS | (2,039 | ) | ||||||||||||||
| 2-Year U.S. Treasury Note |
09/2014 | 9 | 1,976,344 | CS | 833 | |||||||||||||||
| 5-Year U.S. Treasury Note |
09/2014 | (11 | ) | (1,314,070 | ) | GSC | (3,382 | ) | ||||||||||||
| 5-Year U.S. Treasury Note |
09/2014 | (82 | ) | (9,795,797 | ) | JPM | (30,023 | ) | ||||||||||||
| 5-Year U.S. Treasury Note |
09/2014 | (101 | ) | (12,065,555 | ) | CITI | 24,569 | |||||||||||||
| 5-Year U.S. Treasury Note |
09/2014 | (217 | ) | (25,923,024 | ) | CS | 26,821 | |||||||||||||
| 90-Day Euro |
12/2014 | 1 | 249,313 | CITI | 1,997 | |||||||||||||||
| 90-Day Euro |
03/2015 | 1 | 249,112 | CITI | 2,197 | |||||||||||||||
| 90-Day Euro |
06/2015 | 132 | 32,830,050 | CS | 44,422 | |||||||||||||||
| 90-Day Euro |
06/2015 | 77 | 19,150,863 | CITI | 18,213 | |||||||||||||||
| 90-Day Euro |
09/2015 | 60 | 14,893,500 | CITI | 2,177 | |||||||||||||||
|
|
|
|
|
|||||||||||||||||
| $ | 80,153,243 | $ | 176,300 | |||||||||||||||||
|
|
|
|
|
|||||||||||||||||
| Medium-Duration Bond Fund |
||||||||||||||||||||
| 90-Day Euro |
09/2014 | 313 | $ | 77,694,425 | DEUT | $ | (6,446 | ) | ||||||||||||
| 90-Day Euro |
09/2014 | (60 | ) | (14,742,750 | ) | CITI | (34,617 | ) | ||||||||||||
| 10-Year U.S. Treasury Note |
09/2014 | 137 | 17,148,547 | DEUT | 49,081 | |||||||||||||||
| 10-Year U.S. Treasury Note |
09/2014 | (6 | ) | (751,031 | ) | CITI | (5,167 | ) | ||||||||||||
| 10-Year U.S. Treasury Note |
09/2014 | (9 | ) | (1,126,547 | ) | JPM | (8,171 | ) | ||||||||||||
| 10-Year U.S. Treasury Note |
09/2014 | (29 | ) | (3,629,984 | ) | UBS | (22,174 | ) | ||||||||||||
| 10-Year U.S. Treasury Note |
09/2014 | (123 | ) | (15,396,141 | ) | GSC | (88,462 | ) | ||||||||||||
| 2-Year U.S. Treasury Note |
09/2014 | 103 | 22,618,156 | CITI | (2,721 | ) | ||||||||||||||
| 30-Year U.S. Treasury Note |
09/2014 | 57 | 7,819,688 | DEUT | 113,064 | |||||||||||||||
| 5-Year U.S. Treasury Note |
09/2014 | 41 | 4,897,898 | CITI | 2,378 | |||||||||||||||
| 5-Year U.S. Treasury Note |
09/2014 | (260 | ) | (31,059,844 | ) | GSC | (29,220 | ) | ||||||||||||
| Euro Currency |
09/2014 | (8 | ) | (1,369,800 | ) | GSC | (5,014 | ) | ||||||||||||
| Euro-BOBL |
09/2014 | (30 | ) | (5,263,453 | ) | GSC | (6,325 | ) | ||||||||||||
| Euro-Bond |
09/2014 | (18 | ) | (3,623,415 | ) | GSC | (51,376 | ) | ||||||||||||
| Euro-OAT |
09/2014 | (11 | ) | (2,116,705 | ) | DEUT | (31,941 | ) | ||||||||||||
| Long U.S. Treasury Bond |
09/2014 | (3 | ) | (411,563 | ) | GSC | (197 | ) | ||||||||||||
| Long U.S. Treasury Bond |
09/2014 | (69 | ) | (9,465,938 | ) | CITI | (68,458 | ) | ||||||||||||
| Ultra Long U.S. Treasury Bond |
09/2014 | 54 | 8,096,625 | CITI | (5,941 | ) | ||||||||||||||
| Ultra Long U.S. Treasury Bond |
09/2014 | 30 | 4,498,125 | GSC | 43,785 | |||||||||||||||
| 90-Day Euro |
12/2015 | 95 | 23,527,938 | GSC | 24,516 | |||||||||||||||
| 90-Day Euro |
12/2015 | (161 | ) | (39,455,063 | ) | CITI | (107,098 | ) | ||||||||||||
| 90-Day Euro |
06/2016 | 43 | 10,595,200 | GSC | 36,923 | |||||||||||||||
| 90-Day Euro |
06/2016 | (123 | ) | (30,307,200 | ) | CITI | (29,312 | ) | ||||||||||||
| 90-Day Euro |
03/2017 | (104 | ) | (25,431,900 | ) | CITI | (36,493 | ) | ||||||||||||
| 90-Day Euro |
06/2018 | (92 | ) | (22,314,600 | ) | GSC | (92,299 | ) | ||||||||||||
|
|
|
|
|
|||||||||||||||||
| $ | (29,569,332 | ) | $ | (361,685 | ) | |||||||||||||||
|
|
|
|
|
|||||||||||||||||
244
Table of Contents
| Fund/Future Type |
Expiration Date | Open Long (Short) Contracts |
Notional Market Value of Contracts |
Counter- party |
Net Unrealized
Appreciation (Depreciation) on Futures |
|||||||||||||||
| Global Bond Fund |
||||||||||||||||||||
| 10-Year U.S. Treasury Note |
09/2014 | (61 | ) | $ | (7,635,484 | ) | GSC | $ | (1,526 | ) | ||||||||||
| Euro-BOBL |
09/2014 | (1 | ) | (175,449 | ) | JPM | (1,057 | ) | ||||||||||||
| Euro-Bond |
09/2014 | (36 | ) | (7,246,830 | ) | JPM | (102,820 | ) | ||||||||||||
|
|
|
|
|
|||||||||||||||||
| $ | (15,057,763 | ) | $ | (105,403 | ) | |||||||||||||||
|
|
|
|
|
|||||||||||||||||
| Defensive Market Strategies Fund |
||||||||||||||||||||
| S&P 500® E-Mini |
09/2014 | 185 | $ | 18,059,700 | GSC | $ | 198,923 | |||||||||||||
|
|
|
|
|
|||||||||||||||||
| Equity Index Fund |
||||||||||||||||||||
| S&P 500® E-Mini |
09/2014 | 156 | $ | 15,228,720 | GSC | $ | 212,686 | |||||||||||||
|
|
|
|
|
|||||||||||||||||
| Value Equity Fund |
||||||||||||||||||||
| S&P 500® E-Mini |
09/2014 | 404 | $ | 39,438,480 | GSC | $ | 382,902 | |||||||||||||
|
|
|
|
|
|||||||||||||||||
| Growth Equity Fund |
||||||||||||||||||||
| S&P 500® E-Mini |
09/2014 | 706 | $ | 68,919,720 | GSC | $ | 871,985 | |||||||||||||
|
|
|
|
|
|||||||||||||||||
| Small Cap Equity Fund |
||||||||||||||||||||
| Russell 2000® IMM-Mini |
09/2014 | 222 | $ | 26,424,660 | GSC | $ | 674,015 | |||||||||||||
|
|
|
|
|
|||||||||||||||||
| International Equity Fund |
||||||||||||||||||||
| AEX Index |
07/2014 | 228 | $ | 25,803,369 | BAR | $ | (135,062 | ) | ||||||||||||
| CAC40 Index |
07/2014 | 408 | 24,704,587 | BAR | (561,869 | ) | ||||||||||||||
| Hang Seng Index |
07/2014 | 111 | 16,544,591 | BAR | 193,257 | |||||||||||||||
| IBEX 35 |
07/2014 | 27 | 4,013,399 | BAR | (26,652 | ) | ||||||||||||||
| MSCI Singapore Index |
07/2014 | 7 | 415,992 | BAR | (672 | ) | ||||||||||||||
| OMX 30 Index |
07/2014 | (142 | ) | (2,931,790 | ) | BAR | 21,362 | |||||||||||||
| Hang Seng Index |
07/2014 | 13 | 1,937,655 | GSC | 27,931 | |||||||||||||||
| SWISS |
09/2014 | (429 | ) | (41,351,962 | ) | JPM | 520,522 | |||||||||||||
| ASX SPI 200 Index |
09/2014 | (214 | ) | (27,009,794 | ) | BAR | 34,211 | |||||||||||||
| DAX Index |
09/2014 | 68 | 22,951,048 | BAR | (221,574 | ) | ||||||||||||||
| FTSE 100 Index® |
09/2014 | 98 | 11,255,442 | BAR | (21,237 | ) | ||||||||||||||
| FTSE MIB Index |
09/2014 | (29 | ) | (4,229,680 | ) | BAR | 116,678 | |||||||||||||
| MSCI EAFE Index E-Mini |
09/2014 | 550 | 54,144,750 | GSC | 111,105 | |||||||||||||||
| S&P/TSE 60 Index |
09/2014 | (17 | ) | (2,752,055 | ) | BAR | (22,177 | ) | ||||||||||||
| TOPIX Index® |
09/2014 | (48 | ) | (5,981,936 | ) | BAR | (61,504 | ) | ||||||||||||
|
|
|
|
|
|||||||||||||||||
| $ | 77,513,616 | $ | (25,681 | ) | ||||||||||||||||
|
|
|
|
|
|||||||||||||||||
| Emerging Markets Equity Fund |
||||||||||||||||||||
| Mexican Bolsa Index |
06/2014 | (34 | ) | $ | (1,122,824 | ) | JPM | $ | (3,211 | ) | ||||||||||
| TA25 Index |
07/2014 | 39 | 1,577,810 | GSC | (16,538 | ) | ||||||||||||||
| TAIEX |
07/2014 | 8 | 497,823 | GSC | 9,794 | |||||||||||||||
| MSCI Singapore Index |
07/2014 | 2 | 118,855 | BAR | (245 | ) | ||||||||||||||
| MSCI Taiwan Index |
07/2014 | 22 | 731,280 | BAR | 11,951 | |||||||||||||||
| SGX CNX Nifty Index |
07/2014 | (136 | ) | (2,074,408 | ) | BAR | (7,766 | ) | ||||||||||||
| KLCI Index |
07/2014 | 26 | 762,551 | BAR | (3,640 | ) | ||||||||||||||
| HSCEI CHINA Index |
08/2014 | 31 | 2,048,294 | GSC | 24,883 | |||||||||||||||
| HSCEI CHINA Index |
08/2014 | 23 | 1,519,702 | BAR | 18,722 | |||||||||||||||
| MSCI Taiwan Index |
08/2014 | 28 | 930,720 | GSC | 16,879 | |||||||||||||||
| Bovespa Index |
08/2014 | 255 | 6,195,940 | GSC | (214,769 | ) | ||||||||||||||
| BIST 30 Index |
08/2014 | (105 | ) | (485,079 | ) | JPM | (1,446 | ) | ||||||||||||
| KOSPI 200 Index |
09/2014 | (31 | ) | (3,992,192 | ) | BAR | 43,287 | |||||||||||||
245
Table of Contents
| Fund/Future Type |
Expiration Date | Open Long (Short) Contracts |
Notional Market Value of Contracts |
Counter- party |
Net Unrealized
Appreciation (Depreciation) on Futures |
|||||||||||||||
| MSCI Emerging Markets E-Mini |
09/2014 | 333 | $ | 17,327,655 | GSC | $ | (42,275 | ) | ||||||||||||
| SAF Top 40 Index |
09/2014 | 26 | 1,126,300 | BAR | 3,151 | |||||||||||||||
| SET50 Index |
09/2014 | (37 | ) | (225,956 | ) | BAR | (2,854 | ) | ||||||||||||
|
|
|
|
|
|||||||||||||||||
| $ | 24,936,471 | $ | (164,077 | ) | ||||||||||||||||
|
|
|
|
|
|||||||||||||||||
| Inflation Protected Bond Fund |
||||||||||||||||||||
| 10-Year Australia Treasury Note |
09/2014 | 18 | $ | 14,808,820 | GSC | $ | 44,498 | |||||||||||||
| 10-Year Treasury Note |
09/2014 | (5 | ) | (7,188,688 | ) | BAR | (22,225 | ) | ||||||||||||
| 10-Year U.S. Treasury Note |
09/2014 | 18 | 2,253,094 | UBS | 3,350 | |||||||||||||||
| 2-Year U.S. Treasury Note |
09/2014 | (39 | ) | (8,564,156 | ) | UBS | (8,954 | ) | ||||||||||||
| 5-Year U.S. Treasury Note |
09/2014 | 8 | 955,688 | UBS | 2,263 | |||||||||||||||
| 90-Day Euro |
09/2014 | 239 | 59,606,600 | UBS | (3,298 | ) | ||||||||||||||
| Long U.S. Treasury Bond |
09/2014 | (77 | ) | (10,563,438 | ) | UBS | (95,026 | ) | ||||||||||||
| Ultra Long U.S. Treasury Bond |
09/2014 | (99 | ) | (14,843,812 | ) | UBS | (54,739 | ) | ||||||||||||
| 90-Day Euro |
06/2015 | (243 | ) | (60,437,138 | ) | UBS | 18,782 | |||||||||||||
|
|
|
|
|
|||||||||||||||||
| $ | (23,973,030 | ) | $ | (115,349 | ) | |||||||||||||||
|
|
|
|
|
|||||||||||||||||
| Real Estate Securities Fund |
||||||||||||||||||||
| S&P 500® MidCap 400 |
09/2014 | 41 | $ | 5,860,130 | GSC | $ | 83,557 | |||||||||||||
|
|
|
|
|
|||||||||||||||||
Forward Foreign Currency Contracts
As of June 30, 2014, the following Funds have forward foreign currency exchange contracts that obligate them to deliver currencies at specified future dates. The unrealized appreciation and/or depreciation on these contracts is included in the accompanying financial statements. The terms of the open contracts are as follows:
| Fund/Expiration Date |
Currency Purchased |
Amount of Currency Purchased |
Currency Sold |
Amount of Currency Sold |
Counter- party |
Net Unrealized Appreciation (Depreciation) |
||||||||||||||
| Low-Duration Bond Fund |
|
|||||||||||||||||||
| 07/02/14 |
Japanese Yen | 685,600,000 | U.S. Dollars | 6,750,789 | JPM | $ | 17,004 | |||||||||||||
| 07/02/14 |
U.S. Dollars | 17,207,103 | Euro | 12,564,000 | GSC | 3,081 | ||||||||||||||
| 07/02/14 |
Euro | 17,052,000 | U.S. Dollars | 23,175,374 | DEUT | 174,114 | ||||||||||||||
| 07/02/14 |
U.S. Dollars | 6,731,468 | Japanese Yen | 685,600,000 | JPM | (36,325 | ) | |||||||||||||
| 07/02/14 |
Norwegian Krone | 4,064,360 | Euro | 500,000 | BOA | (22,097 | ) | |||||||||||||
| 07/02/14 |
Norwegian Krone | 4,052,316 | Euro | 500,000 | DEUT | (24,060 | ) | |||||||||||||
| 07/02/14 |
U.S. Dollars | 3,773,526 | Euro | 2,765,000 | BNP | (12,619 | ) | |||||||||||||
| 07/02/14 |
U.S. Dollars | 2,333,773 | Euro | 1,723,000 | BNP | (25,550 | ) | |||||||||||||
| 07/02/14 |
Brazilian Reals | 898,851 | U.S. Dollars | 399,276 | UBS | 7,280 | ||||||||||||||
| 07/02/14 |
Euro | 500,000 | Norwegian Krone | 4,065,312 | BOA | 21,942 | ||||||||||||||
| 07/02/14 |
Euro | 500,000 | Norwegian Krone | 4,124,150 | DEUT | 12,350 | ||||||||||||||
| 07/02/14 |
U.S. Dollars | 401,541 | Brazilian Reals | 898,851 | JPM | (5,015 | ) | |||||||||||||
| 07/02/14 |
U.S. Dollars | 139,378 | Australian Dollars | 150,000 | JPM | (2,042 | ) | |||||||||||||
| 07/02/14 |
Norwegian Krone | 20,500 | U.S. Dollars | 3,337 | UBS | 5 | ||||||||||||||
| 07/08/14 |
Euro | 1,400,000 | Switzerland Francs | 1,706,711 | UBS | (7,625 | ) | |||||||||||||
| 07/08/14 |
New Zealand Dollars | 757,639 | Australian Dollars | 700,000 | DEUT | 3,185 | ||||||||||||||
| 07/08/14 |
New Zealand Dollars | 706,684 | U.S. Dollars | 600,000 | BAR | 18,246 | ||||||||||||||
| 07/08/14 |
New Zealand Dollars | 700,000 | Canadian Dollars | 642,792 | UBS | 10,129 | ||||||||||||||
| 07/08/14 |
Australian Dollars | 700,000 | U.S. Dollars | 652,515 | DEUT | 7,125 | ||||||||||||||
| 07/08/14 |
Australian Dollars | 700,000 | New Zealand Dollars | 755,028 | CS | (901 | ) | |||||||||||||
| 07/08/14 |
Canadian Dollars | 652,680 | U.S. Dollars | 600,000 | DEUT | 11,534 | ||||||||||||||
| 07/08/14 |
U.S. Dollars | 645,707 | Australian Dollars | 700,000 | DEUT | (13,933 | ) | |||||||||||||
| 07/08/14 |
Canadian Dollars | 643,674 | New Zealand Dollars | 700,000 | UBS | (9,303 | ) | |||||||||||||
246
Table of Contents
| Fund/Expiration Date |
Currency Purchased |
Amount of Currency Purchased |
Currency Sold |
Amount of Currency Sold |
Counter- party |
Net Unrealized Appreciation (Depreciation) |
||||||||||||||
| 07/08/14 |
U.S. Dollars | 600,000 | Canadian Dollars | 651,468 | DEUT | $ | (10,399 | ) | ||||||||||||
| 07/08/14 |
U.S. Dollars | 600,000 | New Zealand Dollars | 714,151 | BAR | (24,779 | ) | |||||||||||||
| 07/08/14 |
Euro | 500,000 | British Pounds | 398,904 | DEUT | 2,036 | ||||||||||||||
| 07/08/14 |
British Pounds | 406,829 | Euro | 500,000 | DEUT | 11,527 | ||||||||||||||
| 07/09/14 |
U.S. Dollars | 3,343,795 | Euro | 2,458,000 | CITI | (22,062 | ) | |||||||||||||
| 07/09/14 |
Canadian Dollars | 738,152 | British Pounds | 400,000 | DEUT | 7,094 | ||||||||||||||
| 07/09/14 |
New Zealand Dollars | 700,000 | Canadian Dollars | 654,115 | DEUT | (524 | ) | |||||||||||||
| 07/09/14 |
U.S. Dollars | 679,441 | Euro | 500,000 | CS | (5,233 | ) | |||||||||||||
| 07/09/14 |
Canadian Dollars | 643,650 | New Zealand Dollars | 700,000 | DEUT | (9,281 | ) | |||||||||||||
| 07/09/14 |
U.S. Dollars | 643,455 | Australian Dollars | 700,000 | BAR | (16,132 | ) | |||||||||||||
| 07/09/14 |
U.S. Dollars | 600,000 | Switzerland Francs | 539,646 | UBS | (8,579 | ) | |||||||||||||
| 07/09/14 |
Switzerland Francs | 533,971 | U.S. Dollars | 600,000 | UBS | 2,179 | ||||||||||||||
| 07/09/14 |
Euro | 500,000 | U.S. Dollars | 680,325 | CS | 4,349 | ||||||||||||||
| 07/09/14 |
Euro | 500,000 | British Pounds | 399,458 | BAR | 1,095 | ||||||||||||||
| 07/09/14 |
U.S. Dollars | 460,299 | British Pounds | 275,000 | HKSB | (10,298 | ) | |||||||||||||
| 07/09/14 |
British Pounds | 406,758 | Euro | 500,000 | BAR | 11,397 | ||||||||||||||
| 07/09/14 |
British Pounds | 400,000 | Canadian Dollars | 737,349 | DEUT | (6,341 | ) | |||||||||||||
| 07/10/14 |
Japanese Yen | 69,081,080 | British Pounds | 400,000 | BAR | (2,532 | ) | |||||||||||||
| 07/10/14 |
Swedish Kronor | 4,331,012 | Australian Dollars | 700,000 | CITI | (11,413 | ) | |||||||||||||
| 07/10/14 |
Swedish Kronor | 4,321,313 | U.S. Dollars | 648,376 | BNP | (1,708 | ) | |||||||||||||
| 07/10/14 |
Canadian Dollars | 709,997 | Australian Dollars | 700,000 | DEUT | 5,669 | ||||||||||||||
| 07/10/14 |
Australian Dollars | 700,000 | Swedish Kronor | 4,309,966 | BNP | 14,562 | ||||||||||||||
| 07/10/14 |
New Zealand Dollars | 700,000 | Canadian Dollars | 649,040 | DEUT | 4,187 | ||||||||||||||
| 07/10/14 |
Australian Dollars | 700,000 | Swedish Kronor | 4,428,410 | CITI | (3,162 | ) | |||||||||||||
| 07/10/14 |
Australian Dollars | 700,000 | Canadian Dollars | 715,548 | DEUT | (10,869 | ) | |||||||||||||
| 07/10/14 |
New Zealand Dollars | 659,340 | Australian Dollars | 600,000 | UBS | 11,398 | ||||||||||||||
| 07/10/14 |
U.S. Dollars | 648,376 | Australian Dollars | 700,000 | BNP | (11,157 | ) | |||||||||||||
| 07/10/14 |
Canadian Dollars | 641,575 | New Zealand Dollars | 700,000 | DEUT | (11,180 | ) | |||||||||||||
| 07/10/14 |
Australian Dollars | 600,000 | New Zealand Dollars | 660,009 | UBS | (11,983 | ) | |||||||||||||
| 07/10/14 |
British Pounds | 401,350 | Euro | 500,000 | DEUT | 2,134 | ||||||||||||||
| 07/10/14 |
British Pounds | 400,000 | Japanese Yen | 68,851,600 | BAR | 4,797 | ||||||||||||||
| 07/16/14 |
U.S. Dollars | 942,823 | Brazilian Reals | 2,142,000 | BAR | (21,772 | ) | |||||||||||||
| 07/16/14 |
Brazilian Reals | 564,000 | U.S. Dollars | 248,021 | BAR | 5,962 | ||||||||||||||
| 07/16/14 |
Brazilian Reals | 509,000 | U.S. Dollars | 223,687 | BAR | 5,528 | ||||||||||||||
| 07/16/14 |
Brazilian Reals | 384,000 | U.S. Dollars | 168,821 | BAR | 4,104 | ||||||||||||||
| 07/16/14 |
Brazilian Reals | 685,000 | U.S. Dollars | 302,428 | BAR | 6,044 | ||||||||||||||
| 07/22/14 |
New Zealand Dollars | 753,488 | Australian Dollars | 700,000 | DEUT | (618 | ) | |||||||||||||
| 07/22/14 |
British Pounds | 400,000 | Japanese Yen | 69,222,628 | DEUT | 999 | ||||||||||||||
| 07/23/14 |
U.S. Dollars | 5,122,536 | Australian Dollars | 5,476,000 | BOA | (31,480 | ) | |||||||||||||
| 07/23/14 |
U.S. Dollars | 3,998,360 | British Pounds | 2,380,000 | BAR | (73,976 | ) | |||||||||||||
| 07/23/14 |
U.S. Dollars | 1,874,145 | Euro | 1,356,000 | BAR | 17,210 | ||||||||||||||
| 07/23/14 |
New Zealand Dollars | 776,860 | Euro | 500,000 | UBS | (6,083 | ) | |||||||||||||
| 08/04/14 |
Brazilian Reals | 898,851 | U.S. Dollars | 397,889 | JPM | 4,573 | ||||||||||||||
| 08/05/14 |
U.S. Dollars | 23,178,187 | Euro | 17,052,000 | DEUT | (174,358 | ) | |||||||||||||
| 08/05/14 |
U.S. Dollars | 6,752,312 | Japanese Yen | 685,600,000 | JPM | (17,302 | ) | |||||||||||||
| 08/05/14 |
U.S. Dollars | 91,857 | Australian Dollars | 98,000 | CITI | (292 | ) | |||||||||||||
| 08/13/14 |
Norwegian Krone | 3,585,000 | U.S. Dollars | 604,281 | DEUT | (20,828 | ) | |||||||||||||
| 08/21/14 |
U.S. Dollars | 726,644 | Mexican Pesos | 9,816,593 | MSCS | (27,219 | ) | |||||||||||||
| 08/21/14 |
U.S. Dollars | 726,267 | Mexican Pesos | 9,816,593 | BNP | (27,595 | ) | |||||||||||||
| 08/25/14 |
Mexican Pesos | 4,482,000 | U.S. Dollars | 340,254 | GSC | 3,852 | ||||||||||||||
| 09/11/14 |
U.S. Dollars | 3,049,851 | British Pounds | 1,817,000 | BAR | (57,862 | ) | |||||||||||||
| 09/23/14 |
U.S. Dollars | 409,462 | Mexican Pesos | 5,340,000 | GSC | 272 | ||||||||||||||
| 10/22/14 |
U.S. Dollars | 284,020 | Mexican Pesos | 3,736,000 | BNP | (1,700 | ) | |||||||||||||
|
|
|
|||||||||||||||||||
| $ | (381,224 | ) | ||||||||||||||||||
|
|
|
|||||||||||||||||||
247
Table of Contents
| Fund/Expiration Date |
Currency Purchased |
Amount of Currency Purchased |
Currency Sold |
Amount of Currency Sold |
Counter- party |
Net Unrealized Appreciation (Depreciation) |
||||||||||||||
| Medium-Duration Bond Fund |
| |||||||||||||||||||
| 07/02/14 |
Japanese Yen | 148,600,000 | U.S. Dollars | 1,463,196 | JPM | $ | 3,685 | |||||||||||||
| 07/02/14 |
Japanese Yen | 45,800,000 | U.S. Dollars | 448,869 | CS | 3,231 | ||||||||||||||
| 07/02/14 |
U.S. Dollars | 14,980,204 | Euro | 10,938,000 | GSC | 2,683 | ||||||||||||||
| 07/02/14 |
Euro | 9,756,000 | U.S. Dollars | 13,259,380 | DEUT | 99,616 | ||||||||||||||
| 07/02/14 |
Euro | 4,378,000 | U.S. Dollars | 5,974,232 | GSC | 20,611 | ||||||||||||||
| 07/02/14 |
U.S. Dollars | 1,969,399 | Australian Dollars | 2,133,000 | BNP | (41,591 | ) | |||||||||||||
| 07/02/14 |
U.S. Dollars | 1,908,689 | Japanese Yen | 194,400,000 | JPM | (10,300 | ) | |||||||||||||
| 07/02/14 |
Australian Dollars | 1,759,000 | U.S. Dollars | 1,624,534 | JPM | 33,849 | ||||||||||||||
| 07/02/14 |
U.S. Dollars | 1,752,700 | Euro | 1,294,000 | BNP | (19,188 | ) | |||||||||||||
| 07/02/14 |
U.S. Dollars | 1,401,905 | Euro | 1,036,000 | CS | (16,701 | ) | |||||||||||||
| 07/02/14 |
U.S. Dollars | 1,170,876 | Euro | 866,000 | BNP | (14,938 | ) | |||||||||||||
| 07/02/14 |
Brazilian Reals | 952,972 | U.S. Dollars | 423,317 | UBS | 7,718 | ||||||||||||||
| 07/02/14 |
Australian Dollars | 372,790 | U.S. Dollars | 351,000 | CITI | 523 | ||||||||||||||
| 07/02/14 |
U.S. Dollars | 275,628 | Brazilian Reals | 617,378 | MLCS | (3,617 | ) | |||||||||||||
| 07/02/14 |
U.S. Dollars | 149,919 | Brazilian Reals | 335,594 | JPM | (1,872 | ) | |||||||||||||
| 07/03/14 |
U.S. Dollars | 2,870,233 | Mexican Pesos | 37,681,860 | JPM | (33,620 | ) | |||||||||||||
| 07/15/14 |
Brazilian Reals | 1,660,000 | U.S. Dollars | 720,736 | JPM | 27,037 | ||||||||||||||
| 07/18/14 |
U.S. Dollars | 1,230,634 | Brazilian Reals | 2,796,000 | RBC | (27,685 | ) | |||||||||||||
| 07/31/14 |
U.S. Dollars | 610,695 | Euro | 449,965 | WEST | (5,516 | ) | |||||||||||||
| 08/04/14 |
Brazilian Reals | 335,594 | U.S. Dollars | 148,555 | JPM | 1,707 | ||||||||||||||
| 08/04/14 |
U.S. Dollars | 150,000 | Brazilian Reals | 334,473 | BNP | 239 | ||||||||||||||
| 08/05/14 |
U.S. Dollars | 13,260,990 | Euro | 9,756,000 | DEUT | (99,756 | ) | |||||||||||||
| 08/05/14 |
U.S. Dollars | 1,463,526 | Japanese Yen | 148,600,000 | JPM | (3,750 | ) | |||||||||||||
| 08/08/14 |
U.S. Dollars | 1,435,677 | Mexican Pesos | 18,860,490 | RBC | (13,907 | ) | |||||||||||||
| 08/08/14 |
U.S. Dollars | 1,294,441 | Mexican Pesos | 16,865,787 | RBC | (1,835 | ) | |||||||||||||
| 08/08/14 |
U.S. Dollars | 1,038,602 | Mexican Pesos | 13,641,108 | SS | (9,830 | ) | |||||||||||||
| 08/13/14 |
Norwegian Krone | 1,133,000 | U.S. Dollars | 190,976 | DEUT | (6,583 | ) | |||||||||||||
| 08/14/14 |
Euro | 1,640,000 | U.S. Dollars | 2,236,386 | CITIC | 9,652 | ||||||||||||||
| 08/14/14 |
U.S. Dollars | 12,637,990 | Euro | 9,073,116 | CITIC | 212,033 | ||||||||||||||
| 08/14/14 |
U.S. Dollars | 2,981,465 | Japanese Yen | 303,288,000 | CITIC | (13,379 | ) | |||||||||||||
| 08/14/14 |
U.S. Dollars | 2,913,680 | British Pounds | 1,720,000 | GSC | (28,829 | ) | |||||||||||||
| 08/14/14 |
Polish Zloty | 2,281,561 | U.S. Dollars | 748,065 | CITIC | 3,215 | ||||||||||||||
| 08/14/14 |
U.S. Dollars | 1,892,638 | Euro | 1,380,000 | CITIC | 2,679 | ||||||||||||||
| 08/14/14 |
U.S. Dollars | 1,505,212 | Japanese Yen | 153,366,000 | BAR | (9,214 | ) | |||||||||||||
| 08/14/14 |
Euro | 1,475,687 | U.S. Dollars | 2,054,019 | UBS | (33,013 | ) | |||||||||||||
| 08/14/14 |
U.S. Dollars | 746,945 | Polish Zloty | 2,281,561 | CITIC | (4,335 | ) | |||||||||||||
| 08/14/14 |
U.S. Dollars | 719,672 | Euro | 526,000 | UBS | (704 | ) | |||||||||||||
| 09/04/14 |
U.S. Dollars | 298,545 | Mexican Pesos | 3,945,121 | BNP | (4,144 | ) | |||||||||||||
| 09/11/14 |
U.S. Dollars | 4,107,311 | British Pounds | 2,447,000 | BAR | (77,924 | ) | |||||||||||||
| 09/11/14 |
British Pounds | 2,257,886 | U.S. Dollars | 3,799,000 | GSC | 65,126 | ||||||||||||||
| 09/17/14 |
Euro | 101,000 | Norwegian Krone | 850,208 | JPM | (310 | ) | |||||||||||||
| 09/17/14 |
British Pounds | 80,941 | Euro | 101,000 | MLCS | 222 | ||||||||||||||
| 09/17/14 |
Japanese Yen | 28,054,213 | U.S. Dollars | 276,000 | MLCS | 1,089 | ||||||||||||||
| 09/17/14 |
Japanese Yen | 20,970,818 | U.S. Dollars | 207,000 | JPM | 127 | ||||||||||||||
| 09/17/14 |
Norwegian Krone | 845,582 | Euro | 101,000 | JPM | (907 | ) | |||||||||||||
| 09/17/14 |
Norwegian Krone | 826,092 | Euro | 101,000 | JPM | (4,075 | ) | |||||||||||||
| 09/17/14 |
Norwegian Krone | 822,633 | Euro | 101,000 | JPM | (4,638 | ) | |||||||||||||
| 09/17/14 |
Norwegian Krone | 821,561 | Euro | 101,000 | SS | (4,811 | ) | |||||||||||||
248
Table of Contents
| Fund/Expiration Date |
Currency Purchased |
Amount of Currency Purchased |
Currency Sold |
Amount of Currency Sold |
Counter- party |
Net Unrealized Appreciation (Depreciation) |
||||||||||||||
| 09/17/14 |
Euro | 609,984 | U.S. Dollars | 826,950 | MLCS | $ | 8,551 | |||||||||||||
| 09/17/14 |
Norwegian Krone | 424,376 | Euro | 51,000 | JPM | (881 | ) | |||||||||||||
| 09/17/14 |
U.S. Dollars | 310,264 | Swedish Kronor | 2,067,738 | MLCS | 1,045 | ||||||||||||||
| 09/17/14 |
U.S. Dollars | 310,000 | Canadian Dollars | 339,145 | RBC | (7,204 | ) | |||||||||||||
| 09/17/14 |
U.S. Dollars | 276,204 | British Pounds | 163,000 | RBS | (2,568 | ) | |||||||||||||
| 09/17/14 |
U.S. Dollars | 275,279 | Euro | 202,000 | MSCS | (1,403 | ) | |||||||||||||
| 09/17/14 |
U.S. Dollars | 274,943 | British Pounds | 162,000 | DEUT | (2,119 | ) | |||||||||||||
| 09/17/14 |
U.S. Dollars | 273,938 | Australian Dollars | 295,000 | WEST | (2,645 | ) | |||||||||||||
| 09/17/14 |
U.S. Dollars | 250,776 | Switzerland Francs | 225,193 | MLCS | (3,335 | ) | |||||||||||||
| 09/17/14 |
U.S. Dollars | 250,264 | Switzerland Francs | 224,810 | SS | (3,415 | ) | |||||||||||||
| 09/17/14 |
U.S. Dollars | 249,207 | Switzerland Francs | 223,985 | RBS | (3,542 | ) | |||||||||||||
| 09/17/14 |
U.S. Dollars | 249,201 | Switzerland Francs | 224,229 | UBS | (3,823 | ) | |||||||||||||
| 09/17/14 |
U.S. Dollars | 246,609 | Switzerland Francs | 221,772 | BNP | (3,642 | ) | |||||||||||||
| 09/17/14 |
U.S. Dollars | 231,832 | Canadian Dollars | 253,716 | MLCS | (5,471 | ) | |||||||||||||
| 09/17/14 |
U.S. Dollars | 220,495 | Switzerland Francs | 198,221 | CS | (3,182 | ) | |||||||||||||
| 09/17/14 |
U.S. Dollars | 219,624 | New Zealand Dollars | 253,000 | WMR | (1,890 | ) | |||||||||||||
| 09/17/14 |
U.S. Dollars | 174,560 | Japanese Yen | 17,800,488 | DEUT | (1,254 | ) | |||||||||||||
| 09/17/14 |
British Pounds | 171,365 | U.S. Dollars | 287,755 | MLCS | 5,323 | ||||||||||||||
| 09/17/14 |
U.S. Dollars | 171,253 | Japanese Yen | 17,445,967 | SS | (1,060 | ) | |||||||||||||
| 09/17/14 |
U.S. Dollars | 171,076 | Japanese Yen | 17,491,340 | BNP | (1,685 | ) | |||||||||||||
| 09/17/14 |
U.S. Dollars | 169,743 | Japanese Yen | 17,307,403 | UBS | (1,201 | ) | |||||||||||||
| 09/17/14 |
U.S. Dollars | 138,284 | Euro | 101,000 | BNP | (16 | ) | |||||||||||||
| 09/17/14 |
U.S. Dollars | 138,000 | Japanese Yen | 14,118,724 | SS | (1,449 | ) | |||||||||||||
| 09/17/14 |
U.S. Dollars | 134,146 | Australian Dollars | 144,310 | WEST | (1,155 | ) | |||||||||||||
| 09/17/14 |
U.S. Dollars | 133,182 | New Zealand Dollars | 157,775 | BNP | (3,917 | ) | |||||||||||||
| 09/17/14 |
U.S. Dollars | 133,086 | New Zealand Dollars | 157,775 | UBS | (4,013 | ) | |||||||||||||
| 09/17/14 |
U.S. Dollars | 130,220 | Australian Dollars | 140,066 | JPM | (1,102 | ) | |||||||||||||
| 09/17/14 |
U.S. Dollars | 130,213 | Australian Dollars | 140,066 | DEUT | (1,109 | ) | |||||||||||||
| 09/17/14 |
Euro | 101,000 | U.S. Dollars | 136,916 | MLCS | 1,425 | ||||||||||||||
| 09/17/14 |
Euro | 101,000 | Switzerland Francs | 122,873 | BNP | (312 | ) | |||||||||||||
| 09/17/14 |
New Zealand Dollars | 79,000 | U.S. Dollars | 68,145 | MLCS | 503 | ||||||||||||||
| 09/17/14 |
U.S. Dollars | 69,500 | Euro | 51,000 | MSCS | (355 | ) | |||||||||||||
| 09/17/14 |
U.S. Dollars | 68,960 | Euro | 50,553 | SS | (284 | ) | |||||||||||||
| 09/17/14 |
Euro | 51,000 | U.S. Dollars | 69,045 | BNP | 811 | ||||||||||||||
| 09/17/14 |
Euro | 51,000 | U.S. Dollars | 69,069 | MLCS | 786 | ||||||||||||||
| 09/17/14 |
Euro | 51,000 | Norwegian Krone | 425,008 | HKSB | 779 | ||||||||||||||
| 09/17/14 |
Euro | 51,000 | U.S. Dollars | 69,083 | MSCS | 773 | ||||||||||||||
| 09/17/14 |
Euro | 51,000 | U.S. Dollars | 69,315 | BAR | 540 | ||||||||||||||
| 09/17/14 |
Euro | 51,000 | British Pounds | 40,803 | HKSB | 72 | ||||||||||||||
| 09/17/14 |
Euro | 51,000 | British Pounds | 41,081 | SS | (404 | ) | |||||||||||||
| 09/17/14 |
Euro | 50,000 | Switzerland Francs | 60,812 | MLCS | (136 | ) | |||||||||||||
| 09/18/14 |
U.S. Dollars | 446,685 | Mexican Pesos | 5,909,648 | BNP | (6,306 | ) | |||||||||||||
| 09/23/14 |
U.S. Dollars | 157,037 | Mexican Pesos | 2,048,000 | GSC | 104 | ||||||||||||||
| 10/02/14 |
U.S. Dollars | 2,303,894 | Mexican Pesos | 30,465,549 | BNP | (29,185 | ) | |||||||||||||
| 10/02/14 |
U.S. Dollars | 519,833 | Mexican Pesos | 6,885,189 | BNP | (7,441 | ) | |||||||||||||
|
|
|
|||||||||||||||||||
| $ | (88,722 | ) | ||||||||||||||||||
|
|
|
|||||||||||||||||||
| Global Bond Fund |
| |||||||||||||||||||
| 07/16/14 |
Chinese Yuan Renminbi | 21,064,000 | U.S. Dollars | 3,399,338 | HSBC | $ | (10,337 | ) | ||||||||||||
| 07/25/14 |
Indonesian Rupiahs | 21,641,250,000 | U.S. Dollars | 1,857,459 | HSBC | (40,711 | ) | |||||||||||||
| 07/25/14 |
Chilean Peso | 1,037,960,000 | U.S. Dollars | 1,882,067 | DEUT | (10,543 | ) | |||||||||||||
| 07/25/14 |
Indian Rupees | 174,590,000 | U.S. Dollars | 2,847,659 | CITIC | 36,477 | ||||||||||||||
249
Table of Contents
| Fund/Expiration Date |
Currency Purchased |
Amount of Currency Purchased |
Currency Sold |
Amount of Currency Sold |
Counter- party |
Net Unrealized Appreciation (Depreciation) |
||||||||||||||
| 07/25/14 |
Indian Rupees | 111,790,000 | U.S. Dollars | 1,885,478 | CITIC | $ | (38,765 | ) | ||||||||||||
| 07/25/14 |
Indian Rupees | 51,960,000 | U.S. Dollars | 845,290 | JPM | 13,062 | ||||||||||||||
| 07/25/14 |
U.S. Dollars | 2,164,065 | Brazilian Reals | 4,949,000 | BAR | (58,331 | ) | |||||||||||||
| 07/25/14 |
Brazilian Reals | 2,140,000 | U.S. Dollars | 939,421 | BAR | 21,567 | ||||||||||||||
| 08/14/14 |
Japanese Yen | 744,255,000 | U.S. Dollars | 7,326,801 | DEUT | 22,408 | ||||||||||||||
| 08/14/14 |
Polish Zloty | 17,034,712 | U.S. Dollars | 5,546,147 | JPM | 46,119 | ||||||||||||||
| 08/14/14 |
U.S. Dollars | 9,300,001 | Euro | 6,868,096 | JPM | (106,102 | ) | |||||||||||||
| 08/14/14 |
South African Rand | 8,230,000 | U.S. Dollars | 783,034 | JPM | (15,228 | ) | |||||||||||||
| 08/14/14 |
U.S. Dollars | 5,632,426 | Euro | 4,110,000 | HSBC | 3,635 | ||||||||||||||
| 08/14/14 |
U.S. Dollars | 5,616,099 | Polish Zloty | 17,211,265 | JPM | (34,127 | ) | |||||||||||||
| 08/14/14 |
Swedish Kronor | 5,133,306 | U.S. Dollars | 786,878 | BAR | (18,998 | ) | |||||||||||||
| 08/14/14 |
U.S. Dollars | 3,572,964 | Polish Zloty | 10,854,665 | JPM | 9,524 | ||||||||||||||
| 08/14/14 |
Euro | 3,490,000 | U.S. Dollars | 4,725,764 | JPM | 53,917 | ||||||||||||||
| 08/14/14 |
U.S. Dollars | 2,517,643 | Euro | 1,808,255 | MSCS | 41,174 | ||||||||||||||
| 08/14/14 |
U.S. Dollars | 2,247,849 | Euro | 1,614,942 | UBS | 36,128 | ||||||||||||||
| 08/14/14 |
U.S. Dollars | 1,947,773 | Euro | 1,398,818 | JPM | 32,042 | ||||||||||||||
| 08/14/14 |
U.S. Dollars | 1,868,501 | Euro | 1,370,000 | JPM | (7,763 | ) | |||||||||||||
| 08/14/14 |
U.S. Dollars | 1,828,167 | Mexican Pesos | 24,000,000 | DEUT | (15,728 | ) | |||||||||||||
| 08/14/14 |
U.S. Dollars | 1,576,788 | British Pounds | 931,041 | JPM | (16,001 | ) | |||||||||||||
| 08/14/14 |
U.S. Dollars | 1,337,743 | British Pounds | 790,000 | RBC | (13,759 | ) | |||||||||||||
| 08/14/14 |
U.S. Dollars | 1,329,562 | Euro | 954,524 | CITIC | 22,307 | ||||||||||||||
| 08/14/14 |
U.S. Dollars | 1,319,159 | Euro | 947,399 | GSC | 21,662 | ||||||||||||||
| 08/14/14 |
U.S. Dollars | 1,103,244 | British Pounds | 650,000 | CS | (8,750 | ) | |||||||||||||
| 08/14/14 |
U.S. Dollars | 788,200 | Swedish Kronor | 5,130,000 | UBS | 20,814 | ||||||||||||||
| 08/14/14 |
U.S. Dollars | 774,324 | South African Rand | 8,273,340 | JPM | 2,474 | ||||||||||||||
| 08/14/14 |
U.S. Dollars | 673,541 | British Pounds | 400,000 | BAR | (10,764 | ) | |||||||||||||
| 08/14/14 |
U.S. Dollars | 596,009 | Turkish Lira | 1,280,270 | RBC | (2,487 | ) | |||||||||||||
| 08/14/14 |
U.S. Dollars | 456,723 | British Pounds | 269,710 | BAR | (4,686 | ) | |||||||||||||
| 08/14/14 |
U.S. Dollars | 338,800 | British Pounds | 200,000 | GSC | (3,352 | ) | |||||||||||||
| 08/14/14 |
U.S. Dollars | 233,723 | Australian Dollars | 249,499 | CITIC | (741 | ) | |||||||||||||
| 08/14/14 |
U.S. Dollars | 233,123 | Euro | 170,000 | JPM | 302 | ||||||||||||||
|
|
|
|||||||||||||||||||
| $ | (33,561 | ) | ||||||||||||||||||
|
|
|
|||||||||||||||||||
| Defensive Market Strategies Fund |
| |||||||||||||||||||
| 07/31/14 |
U.S. Dollars | 4,095,151 | Euro | 3,012,403 | UBS | $ | (30,229 | ) | ||||||||||||
| 07/31/14 |
Japanese Yen | 872,100 | U.S. Dollars | 8,590 | CS | 21 | ||||||||||||||
| 07/31/14 |
U.S. Dollars | 837,107 | British Pounds | 493,398 | CS | (7,074 | ) | |||||||||||||
| 07/31/14 |
U.S. Dollars | 739,398 | Switzerland Francs | 661,635 | CS | (6,895 | ) | |||||||||||||
| 07/31/14 |
U.S. Dollars | 343,937 | Japanese Yen | 35,126,250 | CS | (2,888 | ) | |||||||||||||
|
|
|
|||||||||||||||||||
| $ | (47,065 | ) | ||||||||||||||||||
|
|
|
|||||||||||||||||||
250
Table of Contents
| Fund/Expiration Date |
Currency Purchased |
Amount of Currency Purchased |
Currency Sold |
Amount of Currency Sold |
Counter- party |
Net Unrealized Appreciation (Depreciation) |
||||||||||||||
| International Equity Fund |
|
|||||||||||||||||||
| 07/31/14 |
U.S. Dollars | 5,212,154 | Australian Dollars | 5,634,000 | NT | $ | (87,217 | ) | ||||||||||||
| 09/17/14 |
Japanese Yen | 1,147,556,000 | U.S. Dollars | 11,258,334 | RBS | 75,977 | ||||||||||||||
| 09/17/14 |
Japanese Yen | 224,921,000 | U.S. Dollars | 2,207,695 | RBS | 13,830 | ||||||||||||||
| 09/17/14 |
Japanese Yen | 185,918,000 | U.S. Dollars | 1,824,962 | RBS | 11,334 | ||||||||||||||
| 09/17/14 |
Norwegian Krone | 48,834,390 | U.S. Dollars | 8,109,398 | RBS | (172,296 | ) | |||||||||||||
| 09/17/14 |
Norwegian Krone | 29,300,634 | U.S. Dollars | 4,869,804 | RBS | (107,543 | ) | |||||||||||||
| 09/17/14 |
Japanese Yen | 27,239,764 | U.S. Dollars | 265,288 | RBS | 3,757 | ||||||||||||||
| 09/17/14 |
Japanese Yen | 27,053,322 | U.S. Dollars | 265,290 | RBS | 1,913 | ||||||||||||||
| 09/17/14 |
Japanese Yen | 20,360,225 | U.S. Dollars | 198,968 | RBS | 2,128 | ||||||||||||||
| 09/17/14 |
Norwegian Krone | 18,068,724 | U.S. Dollars | 3,002,222 | RBS | (65,495 | ) | |||||||||||||
| 09/17/14 |
Japanese Yen | 15,180,689 | U.S. Dollars | 148,106 | RBS | 1,833 | ||||||||||||||
| 09/17/14 |
Norwegian Krone | 14,715,252 | U.S. Dollars | 2,438,187 | RBS | (46,503 | ) | |||||||||||||
| 09/17/14 |
U.S. Dollars | 12,945,518 | British Pounds | 7,727,607 | RBS | (270,700 | ) | |||||||||||||
| 09/17/14 |
U.S. Dollars | 12,937,011 | British Pounds | 7,727,607 | RBS | (279,208 | ) | |||||||||||||
| 09/17/14 |
U.S. Dollars | 12,928,456 | British Pounds | 7,727,607 | RBS | (287,763 | ) | |||||||||||||
| 09/17/14 |
U.S. Dollars | 12,741,965 | British Pounds | 7,582,179 | RBS | (225,534 | ) | |||||||||||||
| 09/17/14 |
British Pounds | 10,456,000 | U.S. Dollars | 17,732,084 | RBS | 150,397 | ||||||||||||||
| 09/17/14 |
Euro | 9,573,000 | U.S. Dollars | 13,029,116 | RBS | 83,115 | ||||||||||||||
| 09/17/14 |
U.S. Dollars | 9,351,481 | Japanese Yen | 956,386,000 | RBS | (94,660 | ) | |||||||||||||
| 09/17/14 |
New Zealand Dollars | 9,009,685 | U.S. Dollars | 7,524,519 | RBS | 304,493 | ||||||||||||||
| 09/17/14 |
New Zealand Dollars | 8,942,251 | U.S. Dollars | 7,524,672 | RBS | 245,744 | ||||||||||||||
| 09/17/14 |
Australian Dollars | 8,840,000 | U.S. Dollars | 8,217,807 | RBS | 70,307 | ||||||||||||||
| 09/17/14 |
New Zealand Dollars | 8,794,474 | U.S. Dollars | 7,334,722 | RBS | 307,281 | ||||||||||||||
| 09/17/14 |
New Zealand Dollars | 8,762,172 | U.S. Dollars | 7,335,121 | RBS | 278,814 | ||||||||||||||
| 09/17/14 |
New Zealand Dollars | 8,567,892 | U.S. Dollars | 7,219,186 | RBS | 225,928 | ||||||||||||||
| 09/17/14 |
New Zealand Dollars | 8,554,209 | U.S. Dollars | 7,219,178 | RBS | 214,045 | ||||||||||||||
| 09/17/14 |
Hong Kong Dollars | 7,262,000 | U.S. Dollars | 936,833 | RBS | (226 | ) | |||||||||||||
| 09/17/14 |
Australian Dollars | 6,885,974 | U.S. Dollars | 6,335,048 | RBS | 121,032 | ||||||||||||||
| 09/17/14 |
U.S. Dollars | 6,612,793 | Swedish Kronor | 43,944,000 | RBS | 41,207 | ||||||||||||||
| 09/17/14 |
U.S. Dollars | 6,431,782 | Swedish Kronor | 43,048,000 | RBS | (5,812 | ) | |||||||||||||
| 09/17/14 |
New Zealand Dollars | 6,397,612 | U.S. Dollars | 5,414,459 | RBS | 144,779 | ||||||||||||||
| 09/17/14 |
U.S. Dollars | 6,013,423 | Switzerland Francs | 5,376,000 | RBS | (52,942 | ) | |||||||||||||
| 09/17/14 |
Canadian Dollars | 5,775,000 | U.S. Dollars | 5,288,534 | RBS | 112,854 | ||||||||||||||
| 09/17/14 |
U.S. Dollars | 5,689,980 | Canadian Dollars | 6,193,000 | RBS | (102,366 | ) | |||||||||||||
| 09/17/14 |
U.S. Dollars | 5,459,843 | Swedish Kronor | 36,576,000 | RBS | (9,899 | ) | |||||||||||||
| 09/17/14 |
Australian Dollars | 4,914,000 | U.S. Dollars | 4,570,926 | RBS | 36,291 | ||||||||||||||
| 09/17/14 |
U.S. Dollars | 4,865,137 | British Pounds | 2,905,000 | RBS | (103,169 | ) | |||||||||||||
| 09/17/14 |
New Zealand Dollars | 4,767,705 | U.S. Dollars | 4,085,065 | RBS | 57,857 | ||||||||||||||
| 09/17/14 |
U.S. Dollars | 4,216,956 | Switzerland Francs | 3,773,058 | RBS | (40,623 | ) | |||||||||||||
| 09/17/14 |
U.S. Dollars | 4,101,985 | Euro | 3,024,000 | RBS | (40,017 | ) | |||||||||||||
| 09/17/14 |
U.S. Dollars | 3,983,431 | Australian Dollars | 4,262,000 | RBS | (12,490 | ) | |||||||||||||
| 09/17/14 |
Euro | 3,662,000 | U.S. Dollars | 4,978,105 | RBS | 37,772 | ||||||||||||||
| 09/17/14 |
Euro | 3,403,000 | U.S. Dollars | 4,630,462 | RBS | 30,659 | ||||||||||||||
| 09/17/14 |
U.S. Dollars | 3,355,424 | Swedish Kronor | 22,473,794 | RBS | (5,409 | ) | |||||||||||||
| 09/17/14 |
U.S. Dollars | 3,325,707 | Canadian Dollars | 3,573,000 | RBS | (16,139 | ) | |||||||||||||
| 09/17/14 |
U.S. Dollars | 3,201,433 | British Pounds | 1,880,000 | RBS | (13,856 | ) | |||||||||||||
| 09/17/14 |
U.S. Dollars | 3,178,424 | Swedish Kronor | 21,237,752 | RBS | 2,434 | ||||||||||||||
| 09/17/14 |
U.S. Dollars | 3,176,488 | Swedish Kronor | 21,207,665 | RBS | 4,997 | ||||||||||||||
| 09/17/14 |
U.S. Dollars | 3,174,372 | Swedish Kronor | 21,207,664 | RBS | 2,882 | ||||||||||||||
| 09/17/14 |
U.S. Dollars | 3,170,121 | Swedish Kronor | 21,207,664 | RBS | (1,370 | ) | |||||||||||||
| 09/17/14 |
U.S. Dollars | 3,169,155 | Swedish Kronor | 21,207,665 | RBS | (2,336 | ) | |||||||||||||
251
Table of Contents
| Fund/Expiration Date |
Currency Purchased |
Amount of Currency Purchased |
Currency Sold |
Amount of Currency Sold |
Counter- party |
Net Unrealized Appreciation (Depreciation) |
||||||||||||||
| 09/17/14 |
U.S. Dollars | 3,165,923 | Swedish Kronor | 21,049,398 | RBS | $ | 18,100 | |||||||||||||
| 09/17/14 |
U.S. Dollars | 3,156,814 | Swedish Kronor | 21,049,398 | RBS | 8,991 | ||||||||||||||
| 09/17/14 |
Danish Kroner | 2,955,000 | U.S. Dollars | 539,376 | RBS | 3,588 | ||||||||||||||
| 09/17/14 |
Euro | 2,916,105 | U.S. Dollars | 3,975,074 | RBS | 19,143 | ||||||||||||||
| 09/17/14 |
Euro | 2,916,104 | U.S. Dollars | 3,956,628 | RBS | 37,587 | ||||||||||||||
| 09/17/14 |
Euro | 2,916,104 | U.S. Dollars | 3,970,028 | RBS | 24,188 | ||||||||||||||
| 09/17/14 |
Australian Dollars | 2,905,278 | U.S. Dollars | 2,672,231 | RBS | 51,669 | ||||||||||||||
| 09/17/14 |
U.S. Dollars | 2,485,464 | Switzerland Francs | 2,223,471 | RBS | (23,537 | ) | |||||||||||||
| 09/17/14 |
U.S. Dollars | 2,480,589 | Switzerland Francs | 2,223,471 | RBS | (28,411 | ) | |||||||||||||
| 09/17/14 |
Euro | 2,474,568 | U.S. Dollars | 3,367,838 | RBS | 21,602 | ||||||||||||||
| 09/17/14 |
British Pounds | 2,447,000 | U.S. Dollars | 4,158,017 | RBS | 26,990 | ||||||||||||||
| 09/17/14 |
U.S. Dollars | 2,327,250 | Danish Kroner | 12,746,000 | RBS | (14,753 | ) | |||||||||||||
| 09/17/14 |
Euro | 2,182,119 | U.S. Dollars | 2,976,207 | RBS | 12,662 | ||||||||||||||
| 09/17/14 |
U.S. Dollars | 2,117,827 | Japanese Yen | 216,601,000 | RBS | (21,522 | ) | |||||||||||||
| 09/17/14 |
Danish Kroner | 1,953,000 | U.S. Dollars | 356,049 | RBS | 2,803 | ||||||||||||||
| 09/17/14 |
Australian Dollars | 1,936,748 | U.S. Dollars | 1,781,460 | RBS | 34,376 | ||||||||||||||
| 09/17/14 |
Euro | 1,819,000 | U.S. Dollars | 2,476,626 | RBS | 14,876 | ||||||||||||||
| 09/17/14 |
U.S. Dollars | 1,737,924 | Norwegian Krone | 10,647,000 | RBS | 7,457 | ||||||||||||||
| 09/17/14 |
Australian Dollars | 1,699,000 | U.S. Dollars | 1,565,091 | RBS | 27,839 | ||||||||||||||
| 09/17/14 |
Israeli Shekels | 1,590,862 | U.S. Dollars | 459,216 | RBS | 4,188 | ||||||||||||||
| 09/17/14 |
Israeli Shekels | 1,198,911 | U.S. Dollars | 344,752 | RBS | 4,479 | ||||||||||||||
| 09/17/14 |
Israeli Shekels | 1,198,911 | U.S. Dollars | 346,206 | RBS | 3,026 | ||||||||||||||
| 09/17/14 |
Israeli Shekels | 1,090,316 | U.S. Dollars | 315,239 | RBS | 2,360 | ||||||||||||||
| 09/17/14 |
Canadian Dollars | 968,000 | U.S. Dollars | 886,144 | RBS | 19,231 | ||||||||||||||
| 09/17/14 |
U.S. Dollars | 917,469 | Norwegian Krone | 5,527,000 | RBS | 19,160 | ||||||||||||||
| 09/17/14 |
Danish Kroner | 887,000 | U.S. Dollars | 161,430 | RBS | 1,551 | ||||||||||||||
| 09/17/14 |
Hong Kong Dollars | 690,000 | U.S. Dollars | 89,025 | RBS | (33 | ) | |||||||||||||
| 09/17/14 |
U.S. Dollars | 688,600 | Norwegian Krone | 4,230,000 | RBS | 1,094 | ||||||||||||||
| 09/17/14 |
U.S. Dollars | 581,178 | Swedish Kronor | 3,897,000 | RBS | (1,597 | ) | |||||||||||||
| 09/17/14 |
New Zealand Dollars | 517,000 | U.S. Dollars | 434,132 | RBS | 15,118 | ||||||||||||||
| 09/17/14 |
Singapore Dollars | 484,000 | U.S. Dollars | 387,200 | RBS | 975 | ||||||||||||||
| 09/17/14 |
U.S. Dollars | 457,931 | Switzerland Francs | 411,000 | RBS | (5,848 | ) | |||||||||||||
| 09/17/14 |
New Zealand Dollars | 278,000 | U.S. Dollars | 234,688 | RBS | 6,882 | ||||||||||||||
| 09/17/14 |
Australian Dollars | 258,000 | U.S. Dollars | 240,993 | RBS | 900 | ||||||||||||||
| 09/17/14 |
Hong Kong Dollars | 157,000 | U.S. Dollars | 20,256 | RBS | (7 | ) | |||||||||||||
| 09/17/14 |
Hong Kong Dollars | 151,000 | U.S. Dollars | 19,483 | RBS | (8 | ) | |||||||||||||
| 09/17/14 |
U.S. Dollars | 144,326 | New Zealand Dollars | 167,000 | RBS | (790 | ) | |||||||||||||
| 09/17/14 |
Singapore Dollars | 98,000 | U.S. Dollars | 78,007 | RBS | 590 | ||||||||||||||
| 09/17/14 |
Israeli Shekels | 94,000 | U.S. Dollars | 27,403 | RBS | (22 | ) | |||||||||||||
| 09/17/14 |
U.S. Dollars | 88,590 | Danish Kroner | 485,000 | RBS | (526 | ) | |||||||||||||
| 09/17/14 |
U.S. Dollars | 80,976 | Danish Kroner | 444,000 | RBS | (606 | ) | |||||||||||||
| 09/17/14 |
U.S. Dollars | 79,858 | Singapore Dollars | 100,000 | RBS | (344 | ) | |||||||||||||
| 09/17/14 |
U.S. Dollars | 79,150 | Singapore Dollars | 99,000 | RBS | (249 | ) | |||||||||||||
| 09/17/14 |
Israeli Shekels | 79,000 | U.S. Dollars | 22,813 | RBS | 199 | ||||||||||||||
| 09/17/14 |
U.S. Dollars | 70,832 | Hong Kong Dollars | 549,000 | RBS | 25 | ||||||||||||||
| 09/17/14 |
U.S. Dollars | 63,335 | Hong Kong Dollars | 491,000 | RBS | 9 | ||||||||||||||
| 09/17/14 |
Singapore Dollars | 60,088 | U.S. Dollars | 47,812 | RBS | 379 | ||||||||||||||
| 09/17/14 |
Singapore Dollars | 39,000 | U.S. Dollars | 31,222 | RBS | 57 | ||||||||||||||
| 09/17/14 |
Singapore Dollars | 30,306 | U.S. Dollars | 24,126 | RBS | 180 | ||||||||||||||
| 09/17/14 |
Singapore Dollars | 30,301 | U.S. Dollars | 24,126 | RBS | 176 | ||||||||||||||
| 09/17/14 |
Singapore Dollars | 30,082 | U.S. Dollars | 23,906 | RBS | 220 | ||||||||||||||
| 09/17/14 |
U.S. Dollars | 28,800 | Singapore Dollars | 36,000 | RBS | (73 | ) | |||||||||||||
252
Table of Contents
| Fund/Expiration Date |
Currency Purchased |
Amount of Currency Purchased |
Currency Sold |
Amount of Currency Sold |
Counter- party |
Net Unrealized Appreciation (Depreciation) |
||||||||||||||
| 09/17/14 |
Euro | 23,000 | U.S. Dollars | 31,363 | RBS | $ | 141 | |||||||||||||
| 09/17/14 |
U.S. Dollars | 16,401 | Israeli Shekels | 57,000 | RBS | (203 | ) | |||||||||||||
| 09/17/14 |
U.S. Dollars | 14,474 | Israeli Shekels | 50,000 | RBS | (91 | ) | |||||||||||||
| 09/17/14 |
Singapore Dollars | 6,223 | U.S. Dollars | 4,969 | RBS | 22 | ||||||||||||||
|
|
|
|||||||||||||||||||
| $ | 834,300 | |||||||||||||||||||
|
|
|
|||||||||||||||||||
| Emerging Markets Equity Fund |
| |||||||||||||||||||
| 09/17/14 |
Indonesian Rupiahs | 8,811,312,798 | U.S. Dollars | 730,744 | RBS | $ | 1,332 | |||||||||||||
| 09/17/14 |
Indonesian Rupiahs | 5,636,907,115 | U.S. Dollars | 470,330 | RBS | (1,996 | ) | |||||||||||||
| 09/17/14 |
Columbian Peso | 2,569,421,252 | U.S. Dollars | 1,337,892 | RBS | 22,880 | ||||||||||||||
| 09/17/14 |
Columbian Peso | 1,790,578,748 | U.S. Dollars | 931,380 | RBS | 16,915 | ||||||||||||||
| 09/17/14 |
South Korean Won | 1,730,000,000 | U.S. Dollars | 1,693,525 | RBS | 10,786 | ||||||||||||||
| 09/17/14 |
Columbian Peso | 1,690,000,000 | U.S. Dollars | 889,383 | RBS | 5,646 | ||||||||||||||
| 09/17/14 |
Columbian Peso | 1,590,000,000 | U.S. Dollars | 838,463 | RBS | 3,605 | ||||||||||||||
| 09/17/14 |
South Korean Won | 1,470,000,000 | U.S. Dollars | 1,429,748 | RBS | 18,424 | ||||||||||||||
| 09/17/14 |
South Korean Won | 546,103,693 | U.S. Dollars | 534,734 | RBS | 3,260 | ||||||||||||||
| 09/17/14 |
Columbian Peso | 520,000,000 | U.S. Dollars | 274,834 | RBS | 559 | ||||||||||||||
| 09/17/14 |
Columbian Peso | 440,000,000 | U.S. Dollars | 229,650 | RBS | 3,375 | ||||||||||||||
| 09/17/14 |
Chilean Peso | 380,000,000 | U.S. Dollars | 684,679 | RBS | (3,299 | ) | |||||||||||||
| 09/17/14 |
South Korean Won | 344,192,872 | U.S. Dollars | 334,119 | RBS | 4,963 | ||||||||||||||
| 09/17/14 |
South Korean Won | 344,025,054 | U.S. Dollars | 334,122 | RBS | 4,795 | ||||||||||||||
| 09/17/14 |
South Korean Won | 343,555,167 | U.S. Dollars | 334,133 | RBS | 4,321 | ||||||||||||||
| 09/17/14 |
South Korean Won | 341,608,488 | U.S. Dollars | 334,140 | RBS | 2,395 | ||||||||||||||
| 09/17/14 |
South Korean Won | 341,239,291 | U.S. Dollars | 334,162 | RBS | 2,010 | ||||||||||||||
| 09/17/14 |
Chilean Peso | 340,000,000 | U.S. Dollars | 610,384 | RBS | (728 | ) | |||||||||||||
| 09/17/14 |
South Korean Won | 318,822,435 | U.S. Dollars | 311,822 | RBS | 2,266 | ||||||||||||||
| 09/17/14 |
Hungarian Forint | 272,360,989 | U.S. Dollars | 1,210,709 | RBS | (10,096 | ) | |||||||||||||
| 09/17/14 |
Hungarian Forint | 269,334,755 | U.S. Dollars | 1,199,015 | RBS | (11,743 | ) | |||||||||||||
| 09/17/14 |
Hungarian Forint | 269,334,755 | U.S. Dollars | 1,205,185 | RBS | (17,913 | ) | |||||||||||||
| 09/17/14 |
Columbian Peso | 230,000,000 | U.S. Dollars | 120,769 | RBS | 1,040 | ||||||||||||||
| 09/17/14 |
Columbian Peso | 230,000,000 | U.S. Dollars | 120,896 | RBS | 913 | ||||||||||||||
| 09/17/14 |
Hungarian Forint | 229,185,643 | U.S. Dollars | 1,029,169 | RBS | (18,881 | ) | |||||||||||||
| 09/17/14 |
Hungarian Forint | 205,783,858 | U.S. Dollars | 913,945 | RBS | (6,816 | ) | |||||||||||||
| 09/17/14 |
South Korean Won | 202,733,000 | U.S. Dollars | 198,563 | RBS | 1,159 | ||||||||||||||
| 09/17/14 |
South Korean Won | 180,000,000 | U.S. Dollars | 175,270 | RBS | 2,057 | ||||||||||||||
| 09/17/14 |
Chilean Peso | 180,000,000 | U.S. Dollars | 323,283 | RBS | (524 | ) | |||||||||||||
| 09/17/14 |
Chilean Peso | 170,000,000 | U.S. Dollars | 305,047 | RBS | (219 | ) | |||||||||||||
| 09/17/14 |
Indian Rupees | 93,704,168 | U.S. Dollars | 1,560,176 | RBS | (32,616 | ) | |||||||||||||
| 09/17/14 |
Indian Rupees | 75,224,744 | U.S. Dollars | 1,250,723 | RBS | (24,413 | ) | |||||||||||||
| 09/17/14 |
Indian Rupees | 75,110,748 | U.S. Dollars | 1,250,491 | RBS | (26,039 | ) | |||||||||||||
| 09/17/14 |
Russian Rubles | 69,000,000 | U.S. Dollars | 2,005,465 | RBS | (12,211 | ) | |||||||||||||
| 09/17/14 |
Indian Rupees | 56,937,632 | U.S. Dollars | 948,644 | RBS | (20,450 | ) | |||||||||||||
| 09/17/14 |
Indian Rupees | 56,662,577 | U.S. Dollars | 937,967 | RBS | (14,256 | ) | |||||||||||||
| 09/17/14 |
Indian Rupees | 56,500,766 | U.S. Dollars | 938,239 | RBS | (17,166 | ) | |||||||||||||
| 09/17/14 |
Indian Rupees | 56,472,211 | U.S. Dollars | 937,843 | RBS | (17,235 | ) | |||||||||||||
| 09/17/14 |
Indian Rupees | 56,405,583 | U.S. Dollars | 938,217 | RBS | (18,695 | ) | |||||||||||||
| 09/17/14 |
Indian Rupees | 56,057,571 | U.S. Dollars | 938,045 | RBS | (24,197 | ) | |||||||||||||
| 09/17/14 |
Russian Rubles | 51,100,000 | U.S. Dollars | 1,445,194 | RBS | 30,969 | ||||||||||||||
| 09/17/14 |
Columbian Peso | 50,000,000 | U.S. Dollars | 26,337 | RBS | 143 | ||||||||||||||
| 09/17/14 |
Russian Rubles | 43,400,000 | U.S. Dollars | 1,236,075 | RBS | 17,653 | ||||||||||||||
| 09/17/14 |
Russian Rubles | 42,800,000 | U.S. Dollars | 1,208,186 | RBS | 28,209 | ||||||||||||||
| 09/17/14 |
Russian Rubles | 41,400,000 | U.S. Dollars | 1,180,690 | RBS | 15,263 | ||||||||||||||
253
Table of Contents
| Fund/Expiration Date |
Currency Purchased |
Amount of Currency Purchased |
Currency Sold |
Amount of Currency Sold |
Counter- party |
Net Unrealized Appreciation (Depreciation) |
||||||||||||||
| 09/17/14 |
Russian Rubles | 37,500,000 | U.S. Dollars | 1,087,805 | RBS | $ | (4,515 | ) | ||||||||||||
| 09/17/14 |
Russian Rubles | 36,200,000 | U.S. Dollars | 1,032,577 | RBS | 13,159 | ||||||||||||||
| 09/17/14 |
Taiwan Dollars | 23,130,496 | U.S. Dollars | 771,891 | RBS | 3,595 | ||||||||||||||
| 09/17/14 |
Czech Republic Koruna | 15,600,000 | U.S. Dollars | 775,136 | RBS | 3,821 | ||||||||||||||
| 09/17/14 |
Taiwan Dollars | 15,416,223 | U.S. Dollars | 514,818 | RBS | 2,035 | ||||||||||||||
| 09/17/14 |
Mexican Pesos | 15,400,000 | U.S. Dollars | 1,189,397 | RBS | (8,863 | ) | |||||||||||||
| 09/17/14 |
Taiwan Dollars | 14,553,484 | U.S. Dollars | 485,472 | RBS | 2,456 | ||||||||||||||
| 09/17/14 |
Taiwan Dollars | 14,047,797 | U.S. Dollars | 469,669 | RBS | 1,305 | ||||||||||||||
| 09/17/14 |
Taiwan Dollars | 11,550,000 | U.S. Dollars | 386,546 | RBS | 686 | ||||||||||||||
| 09/17/14 |
Russian Rubles | 10,100,000 | U.S. Dollars | 281,852 | RBS | 9,914 | ||||||||||||||
| 09/17/14 |
South African Rand | 9,301,019 | U.S. Dollars | 861,724 | RBS | 1,201 | ||||||||||||||
| 09/17/14 |
South African Rand | 9,301,019 | U.S. Dollars | 862,491 | RBS | 434 | ||||||||||||||
| 09/17/14 |
Hong Kong Dollars | 7,593,000 | U.S. Dollars | 979,700 | RBS | (403 | ) | |||||||||||||
| 09/17/14 |
South African Rand | 7,112,544 | U.S. Dollars | 650,070 | RBS | 9,814 | ||||||||||||||
| 09/17/14 |
Brazilian Reals | 5,792,460 | U.S. Dollars | 2,487,315 | RBS | 74,914 | ||||||||||||||
| 09/17/14 |
U.S. Dollars | 5,411,052 | Mexican Pesos | 70,446,489 | RBS | 10,761 | ||||||||||||||
| 09/17/14 |
Malaysian Ringgits | 5,082,000 | U.S. Dollars | 1,562,010 | RBS | 10,751 | ||||||||||||||
| 09/17/14 |
U.S. Dollars | 5,037,007 | Singapore Dollars | 6,330,284 | RBS | (39,970 | ) | |||||||||||||
| 09/17/14 |
South African Rand | 4,755,418 | U.S. Dollars | 436,794 | RBS | 4,402 | ||||||||||||||
| 09/17/14 |
Turkish Lira | 4,703,124 | U.S. Dollars | 2,169,238 | RBS | 14,592 | ||||||||||||||
| 09/17/14 |
Malaysian Ringgits | 4,480,000 | U.S. Dollars | 1,388,322 | RBS | (1,866 | ) | |||||||||||||
| 09/17/14 |
Russian Rubles | 4,300,000 | U.S. Dollars | 120,642 | RBS | 3,576 | ||||||||||||||
| 09/17/14 |
Brazilian Reals | 3,480,557 | U.S. Dollars | 1,493,417 | RBS | 46,168 | ||||||||||||||
| 09/17/14 |
Brazilian Reals | 3,404,340 | U.S. Dollars | 1,484,861 | RBS | 21,011 | ||||||||||||||
| 09/17/14 |
Turkish Lira | 2,977,492 | U.S. Dollars | 1,397,949 | RBS | (15,392 | ) | |||||||||||||
| 09/17/14 |
U.S. Dollars | 2,541,724 | Singapore Dollars | 3,192,233 | RBS | (18,491 | ) | |||||||||||||
| 09/17/14 |
U.S. Dollars | 2,541,688 | Singapore Dollars | 3,192,766 | RBS | (18,956 | ) | |||||||||||||
| 09/17/14 |
U.S. Dollars | 2,518,494 | Singapore Dollars | 3,169,172 | RBS | (23,226 | ) | |||||||||||||
| 09/17/14 |
Brazilian Reals | 2,337,308 | U.S. Dollars | 999,063 | RBS | 34,818 | ||||||||||||||
| 09/17/14 |
Turkish Lira | 2,329,377 | U.S. Dollars | 1,085,198 | RBS | (3,584 | ) | |||||||||||||
| 09/17/14 |
Polish Zloty | 2,310,019 | U.S. Dollars | 754,384 | RBS | 2,467 | ||||||||||||||
| 09/17/14 |
Polish Zloty | 2,310,019 | U.S. Dollars | 754,637 | RBS | 2,214 | ||||||||||||||
| 09/17/14 |
Turkish Lira | 2,307,193 | U.S. Dollars | 1,083,647 | RBS | (12,334 | ) | |||||||||||||
| 09/17/14 |
U.S. Dollars | 2,291,686 | Mexican Pesos | 30,000,000 | RBS | (8,055 | ) | |||||||||||||
| 09/17/14 |
Brazilian Reals | 2,286,497 | U.S. Dollars | 991,908 | RBS | 19,498 | ||||||||||||||
| 09/17/14 |
Polish Zloty | 2,272,150 | U.S. Dollars | 749,415 | RBS | (4,971 | ) | |||||||||||||
| 09/17/14 |
U.S. Dollars | 2,146,396 | Mexican Pesos | 27,996,511 | RBS | 237 | ||||||||||||||
| 09/17/14 |
Indian Rupees | 2,000,000 | U.S. Dollars | 33,278 | RBS | (674 | ) | |||||||||||||
| 09/17/14 |
Indian Rupees | 2,000,000 | U.S. Dollars | 33,300 | RBS | (696 | ) | |||||||||||||
| 09/17/14 |
U.S. Dollars | 1,958,146 | Chilean Peso | 1,090,981,238 | RBS | 1,902 | ||||||||||||||
| 09/17/14 |
Brazilian Reals | 1,920,000 | U.S. Dollars | 833,001 | RBS | 16,289 | ||||||||||||||
| 09/17/14 |
Turkish Lira | 1,885,686 | U.S. Dollars | 873,468 | RBS | 2,124 | ||||||||||||||
| 09/17/14 |
Brazilian Reals | 1,870,000 | U.S. Dollars | 815,034 | RBS | 12,140 | ||||||||||||||
| 09/17/14 |
Turkish Lira | 1,863,502 | U.S. Dollars | 874,986 | RBS | (9,695 | ) | |||||||||||||
| 09/17/14 |
Polish Zloty | 1,786,652 | U.S. Dollars | 586,634 | RBS | (1,258 | ) | |||||||||||||
| 09/17/14 |
Brazilian Reals | 1,770,000 | U.S. Dollars | 773,393 | RBS | 9,547 | ||||||||||||||
| 09/17/14 |
U.S. Dollars | 1,756,078 | Mexican Pesos | 23,000,000 | RBS | (7,057 | ) | |||||||||||||
| 09/17/14 |
Brazilian Reals | 1,752,981 | U.S. Dollars | 743,356 | RBS | 32,055 | ||||||||||||||
| 09/17/14 |
Polish Zloty | 1,723,047 | U.S. Dollars | 563,487 | RBS | 1,050 | ||||||||||||||
| 09/17/14 |
Polish Zloty | 1,704,113 | U.S. Dollars | 562,455 | RBS | (4,122 | ) | |||||||||||||
| 09/17/14 |
Brazilian Reals | 1,702,170 | U.S. Dollars | 740,815 | RBS | 12,121 | ||||||||||||||
| 09/17/14 |
U.S. Dollars | 1,605,449 | Chilean Peso | 892,147,976 | RBS | 5,734 | ||||||||||||||
254
Table of Contents
| Fund/Expiration Date |
Currency Purchased |
Amount of Currency Purchased |
Currency Sold |
Amount of Currency Sold |
Counter- party |
Net Unrealized Appreciation (Depreciation) |
||||||||||||||
| 09/17/14 |
U.S. Dollars | 1,521,396 | Turkish Lira | 3,270,000 | RBS | $ | 3,017 | |||||||||||||
| 09/17/14 |
U.S. Dollars | 1,474,565 | Chilean Peso | 818,235,929 | RBS | 7,381 | ||||||||||||||
| 09/17/14 |
Turkish Lira | 1,397,626 | U.S. Dollars | 649,817 | RBS | (849 | ) | |||||||||||||
| 09/17/14 |
U.S. Dollars | 1,381,367 | Russian Rubles | 49,104,146 | RBS | (37,140 | ) | |||||||||||||
| 09/17/14 |
U.S. Dollars | 1,371,738 | Mexican Pesos | 18,000,000 | RBS | (8,107 | ) | |||||||||||||
| 09/17/14 |
Hong Kong Dollars | 1,200,000 | U.S. Dollars | 154,825 | RBS | (56 | ) | |||||||||||||
| 09/17/14 |
Brazilian Reals | 1,189,687 | U.S. Dollars | 518,947 | RBS | 7,297 | ||||||||||||||
| 09/17/14 |
U.S. Dollars | 1,170,870 | Israeli Shekels | 4,056,245 | RBS | (10,677 | ) | |||||||||||||
| 09/17/14 |
Mexican Pesos | 1,158,000 | U.S. Dollars | 88,311 | RBS | 459 | ||||||||||||||
| 09/17/14 |
U.S. Dollars | 1,150,894 | Philippine Peso | 50,501,225 | RBS | (4,306 | ) | |||||||||||||
| 09/17/14 |
U.S. Dollars | 1,150,308 | Philippine Peso | 50,593,401 | RBS | (7,001 | ) | |||||||||||||
| 09/17/14 |
U.S. Dollars | 1,111,487 | Philippine Peso | 48,805,374 | RBS | (4,921 | ) | |||||||||||||
| 09/17/14 |
Mexican Pesos | 1,100,000 | U.S. Dollars | 84,026 | RBS | 298 | ||||||||||||||
| 09/17/14 |
Russian Rubles | 1,100,000 | U.S. Dollars | 31,483 | RBS | 294 | ||||||||||||||
| 09/17/14 |
U.S. Dollars | 1,019,749 | Russian Rubles | 35,795,753 | RBS | (14,309 | ) | |||||||||||||
| 09/17/14 |
U.S. Dollars | 1,012,535 | Russian Rubles | 35,712,106 | RBS | (19,107 | ) | |||||||||||||
| 09/17/14 |
U.S. Dollars | 982,335 | Chilean Peso | 545,490,619 | RBS | 4,213 | ||||||||||||||
| 09/17/14 |
U.S. Dollars | 979,249 | Chilean Peso | 545,490,619 | RBS | 1,127 | ||||||||||||||
| 09/17/14 |
U.S. Dollars | 976,794 | Chilean Peso | 545,490,619 | RBS | (1,328 | ) | |||||||||||||
| 09/17/14 |
U.S. Dollars | 949,009 | Turkish Lira | 2,080,000 | RBS | (16,810 | ) | |||||||||||||
| 09/17/14 |
U.S. Dollars | 917,526 | Brazilian Reals | 2,140,000 | RBS | (29,080 | ) | |||||||||||||
| 09/17/14 |
U.S. Dollars | 889,297 | Brazilian Reals | 2,080,000 | RBS | (30,768 | ) | |||||||||||||
| 09/17/14 |
U.S. Dollars | 882,726 | Israeli Shekels | 3,056,880 | RBS | (7,715 | ) | |||||||||||||
| 09/17/14 |
U.S. Dollars | 879,020 | Israeli Shekels | 3,056,880 | RBS | (11,421 | ) | |||||||||||||
| 09/17/14 |
U.S. Dollars | 872,057 | Mexican Pesos | 11,400,000 | RBS | (1,845 | ) | |||||||||||||
| 09/17/14 |
U.S. Dollars | 865,310 | Turkish Lira | 1,890,000 | RBS | (12,286 | ) | |||||||||||||
| 09/17/14 |
U.S. Dollars | 826,197 | Brazilian Reals | 1,910,000 | RBS | (18,671 | ) | |||||||||||||
| 09/17/14 |
U.S. Dollars | 803,769 | Israeli Shekels | 2,779,995 | RBS | (6,018 | ) | |||||||||||||
| 09/17/14 |
Thailand Baht | 800,000 | U.S. Dollars | 24,354 | RBS | 205 | ||||||||||||||
| 09/17/14 |
Thailand Baht | 800,000 | U.S. Dollars | 24,533 | RBS | 26 | ||||||||||||||
| 09/17/14 |
Hong Kong Dollars | 800,000 | U.S. Dollars | 103,209 | RBS | (30 | ) | |||||||||||||
| 09/17/14 |
Hong Kong Dollars | 800,000 | U.S. Dollars | 103,222 | RBS | (43 | ) | |||||||||||||
| 09/17/14 |
U.S. Dollars | 748,071 | Turkish Lira | 1,620,000 | RBS | (4,154 | ) | |||||||||||||
| 09/17/14 |
Thailand Baht | 700,000 | U.S. Dollars | 21,296 | RBS | 193 | ||||||||||||||
| 09/17/14 |
Thailand Baht | 700,000 | U.S. Dollars | 21,479 | RBS | 10 | ||||||||||||||
| 09/17/14 |
Thailand Baht | 700,000 | U.S. Dollars | 21,500 | RBS | (10 | ) | |||||||||||||
| 09/17/14 |
U.S. Dollars | 669,834 | Russian Rubles | 24,036,995 | RBS | (24,540 | ) | |||||||||||||
| 09/17/14 |
U.S. Dollars | 601,965 | Indian Rupees | 36,154,000 | RBS | 12,584 | ||||||||||||||
| 09/17/14 |
Hong Kong Dollars | 600,000 | U.S. Dollars | 77,415 | RBS | (31 | ) | |||||||||||||
| 09/17/14 |
Hong Kong Dollars | 600,000 | U.S. Dollars | 77,416 | RBS | (32 | ) | |||||||||||||
| 09/17/14 |
Hong Kong Dollars | 600,000 | U.S. Dollars | 77,418 | RBS | (34 | ) | |||||||||||||
| 09/17/14 |
U.S. Dollars | 592,567 | Brazilian Reals | 1,380,000 | RBS | (17,860 | ) | |||||||||||||
| 09/17/14 |
U.S. Dollars | 562,255 | South African Rand | 6,100,000 | RBS | (3,687 | ) | |||||||||||||
| 09/17/14 |
U.S. Dollars | 554,123 | Czech Republic Koruna | 11,200,000 | RBS | (5,128 | ) | |||||||||||||
| 09/17/14 |
U.S. Dollars | 530,199 | South African Rand | 5,800,000 | RBS | (7,911 | ) | |||||||||||||
| 09/17/14 |
U.S. Dollars | 523,452 | Singapore Dollars | 655,545 | RBS | (2,304 | ) | |||||||||||||
| 09/17/14 |
Chilean Peso | 510,000 | U.S. Dollars | 912 | RBS | 3 | ||||||||||||||
| 09/17/14 |
U.S. Dollars | 482,376 | South African Rand | 5,200,000 | RBS | (67 | ) | |||||||||||||
| 09/17/14 |
U.S. Dollars | 482,349 | Hungarian Forint | 109,000,000 | RBS | 1,858 | ||||||||||||||
| 09/17/14 |
U.S. Dollars | 476,586 | South African Rand | 5,200,000 | RBS | (5,857 | ) | |||||||||||||
| 09/17/14 |
U.S. Dollars | 444,631 | South African Rand | 4,800,000 | RBS | (701 | ) | |||||||||||||
| 09/17/14 |
U.S. Dollars | 443,879 | Hungarian Forint | 101,000,000 | RBS | (1,346 | ) | |||||||||||||
255
Table of Contents
| Fund/Expiration Date |
Currency Purchased |
Amount of Currency Purchased |
Currency Sold |
Amount of Currency Sold |
Counter- party |
Net Unrealized Appreciation (Depreciation) |
||||||||||||||
| 09/17/14 |
U.S. Dollars | 428,658 | Mexican Pesos | 5,600,000 | RBS | $ | (627 | ) | ||||||||||||
| 09/17/14 |
U.S. Dollars | 420,586 | South African Rand | 4,600,000 | RBS | (6,191 | ) | |||||||||||||
| 09/17/14 |
U.S. Dollars | 417,016 | Chilean Peso | 233,529,000 | RBS | (1,726 | ) | |||||||||||||
| 09/17/14 |
U.S. Dollars | 414,906 | South African Rand | 4,500,000 | RBS | (2,593 | ) | |||||||||||||
| 09/17/14 |
U.S. Dollars | 401,543 | Philippine Peso | 17,600,000 | RBS | (1,051 | ) | |||||||||||||
| 09/17/14 |
Hong Kong Dollars | 400,000 | U.S. Dollars | 51,601 | RBS | (11 | ) | |||||||||||||
| 09/17/14 |
U.S. Dollars | 395,233 | South African Rand | 4,300,000 | RBS | (3,710 | ) | |||||||||||||
| 09/17/14 |
U.S. Dollars | 368,222 | Israeli Shekels | 1,280,000 | RBS | (4,630 | ) | |||||||||||||
| 09/17/14 |
U.S. Dollars | 356,592 | Brazilian Reals | 820,000 | RBS | (6,126 | ) | |||||||||||||
| 09/17/14 |
U.S. Dollars | 349,707 | Mexican Pesos | 4,600,000 | RBS | (2,920 | ) | |||||||||||||
| 09/17/14 |
U.S. Dollars | 322,091 | South African Rand | 3,500,000 | RBS | (2,631 | ) | |||||||||||||
| 09/17/14 |
U.S. Dollars | 305,603 | Indonesian Rupiahs | 3,600,000,000 | RBS | 6,502 | ||||||||||||||
| 09/17/14 |
Thailand Baht | 300,000 | U.S. Dollars | 9,083 | RBS | 127 | ||||||||||||||
| 09/17/14 |
Thailand Baht | 300,000 | U.S. Dollars | 9,204 | RBS | 6 | ||||||||||||||
| 09/17/14 |
Hong Kong Dollars | 300,000 | U.S. Dollars | 38,696 | RBS | (4 | ) | |||||||||||||
| 09/17/14 |
Russian Rubles | 300,000 | U.S. Dollars | 8,765 | RBS | (99 | ) | |||||||||||||
| 09/17/14 |
U.S. Dollars | 282,320 | Hungarian Forint | 64,000,000 | RBS | 198 | ||||||||||||||
| 09/17/14 |
U.S. Dollars | 261,540 | Indonesian Rupiahs | 3,200,000,000 | RBS | (4,328 | ) | |||||||||||||
| 09/17/14 |
U.S. Dollars | 251,070 | South African Rand | 2,700,000 | RBS | 571 | ||||||||||||||
| 09/17/14 |
U.S. Dollars | 235,406 | Turkish Lira | 510,000 | RBS | (1,406 | ) | |||||||||||||
| 09/17/14 |
Turkish Lira | 230,000 | U.S. Dollars | 106,280 | RBS | 517 | ||||||||||||||
| 09/17/14 |
U.S. Dollars | 222,014 | Mexican Pesos | 2,900,000 | RBS | (294 | ) | |||||||||||||
| 09/17/14 |
U.S. Dollars | 217,186 | Czech Republic Koruna | 4,400,000 | RBS | (2,519 | ) | |||||||||||||
| 09/17/14 |
U.S. Dollars | 203,898 | Czech Republic Koruna | 4,100,000 | RBS | (828 | ) | |||||||||||||
| 09/17/14 |
U.S. Dollars | 203,183 | Hong Kong Dollars | 1,575,000 | RBS | 49 | ||||||||||||||
| 09/17/14 |
U.S. Dollars | 202,599 | Thailand Baht | 6,664,000 | RBS | (1,978 | ) | |||||||||||||
| 09/17/14 |
Thailand Baht | 200,000 | U.S. Dollars | 6,050 | RBS | 90 | ||||||||||||||
| 09/17/14 |
Thailand Baht | 200,000 | U.S. Dollars | 6,142 | RBS | (2 | ) | |||||||||||||
| 09/17/14 |
Thailand Baht | 200,000 | U.S. Dollars | 6,145 | RBS | (6 | ) | |||||||||||||
| 09/17/14 |
Hong Kong Dollars | 200,000 | U.S. Dollars | 25,804 | RBS | (9 | ) | |||||||||||||
| 09/17/14 |
U.S. Dollars | 194,471 | Turkish Lira | 420,000 | RBS | (551 | ) | |||||||||||||
| 09/17/14 |
U.S. Dollars | 179,664 | Philippine Peso | 7,900,000 | RBS | (1,046 | ) | |||||||||||||
| 09/17/14 |
Singapore Dollars | 170,000 | U.S. Dollars | 135,350 | RBS | 992 | ||||||||||||||
| 09/17/14 |
U.S. Dollars | 167,706 | Hong Kong Dollars | 1,300,000 | RBS | 41 | ||||||||||||||
| 09/17/14 |
U.S. Dollars | 163,718 | Turkish Lira | 350,000 | RBS | 1,201 | ||||||||||||||
| 09/17/14 |
U.S. Dollars | 160,329 | Turkish Lira | 341,000 | RBS | 1,990 | ||||||||||||||
| 09/17/14 |
U.S. Dollars | 155,231 | Malaysian Ringgits | 500,000 | RBS | 493 | ||||||||||||||
| 09/17/14 |
Peruvian Nuevos Soles | 150,000 | U.S. Dollars | 53,591 | RBS | (449 | ) | |||||||||||||
| 09/17/14 |
U.S. Dollars | 142,719 | Thailand Baht | 4,659,000 | RBS | (306 | ) | |||||||||||||
| 09/17/14 |
U.S. Dollars | 137,589 | South African Rand | 1,499,000 | RBS | (1,484 | ) | |||||||||||||
| 09/17/14 |
U.S. Dollars | 128,412 | Brazilian Reals | 294,000 | RBS | (1,635 | ) | |||||||||||||
| 09/17/14 |
U.S. Dollars | 108,376 | Indonesian Rupiahs | 1,300,000,000 | RBS | 368 | ||||||||||||||
| 09/17/14 |
U.S. Dollars | 103,995 | Singapore Dollars | 130,000 | RBS | (266 | ) | |||||||||||||
| 09/17/14 |
U.S. Dollars | 101,478 | Indonesian Rupiahs | 1,200,000,000 | RBS | 1,778 | ||||||||||||||
| 09/17/14 |
Thailand Baht | 100,000 | U.S. Dollars | 3,071 | RBS | (1 | ) | |||||||||||||
| 09/17/14 |
Hong Kong Dollars | 100,000 | U.S. Dollars | 12,901 | RBS | (4 | ) | |||||||||||||
| 09/17/14 |
U.S. Dollars | 90,309 | Hong Kong Dollars | 700,000 | RBS | 27 | ||||||||||||||
| 09/17/14 |
U.S. Dollars | 90,294 | Hong Kong Dollars | 700,000 | RBS | 12 | ||||||||||||||
| 09/17/14 |
U.S. Dollars | 79,669 | Singapore Dollars | 100,000 | RBS | (532 | ) | |||||||||||||
| 09/17/14 |
U.S. Dollars | 77,407 | Hong Kong Dollars | 600,000 | RBS | 23 | ||||||||||||||
| 09/17/14 |
U.S. Dollars | 77,399 | Hong Kong Dollars | 600,000 | RBS | 15 | ||||||||||||||
| 09/17/14 |
U.S. Dollars | 71,955 | Singapore Dollars | 90,000 | RBS | (227 | ) | |||||||||||||
256
Table of Contents
| Fund/Expiration Date |
Currency Purchased |
Amount of Currency Purchased |
Currency Sold |
Amount of Currency Sold |
Counter- party |
Net Unrealized Appreciation (Depreciation) |
||||||||||||||
| 09/17/14 |
U.S. Dollars | 68,948 | Israeli Shekels | 240,000 | RBS | $ | (962 | ) | ||||||||||||
| 09/17/14 |
U.S. Dollars | 64,508 | Hong Kong Dollars | 500,000 | RBS | 22 | ||||||||||||||
| 09/17/14 |
U.S. Dollars | 55,715 | Singapore Dollars | 70,000 | RBS | (426 | ) | |||||||||||||
| 09/17/14 |
U.S. Dollars | 51,593 | Hong Kong Dollars | 400,000 | RBS | 3 | ||||||||||||||
| 09/17/14 |
Polish Zloty | 50,000 | U.S. Dollars | 16,405 | RBS | (23 | ) | |||||||||||||
| 09/17/14 |
U.S. Dollars | 42,501 | Thailand Baht | 1,400,000 | RBS | (477 | ) | |||||||||||||
| 09/17/14 |
Singapore Dollars | 40,000 | U.S. Dollars | 31,945 | RBS | 136 | ||||||||||||||
| 09/17/14 |
U.S. Dollars | 38,705 | Hong Kong Dollars | 300,000 | RBS | 13 | ||||||||||||||
| 09/17/14 |
U.S. Dollars | 36,546 | Thailand Baht | 1,200,000 | RBS | (293 | ) | |||||||||||||
| 09/17/14 |
U.S. Dollars | 34,672 | Czech Republic Koruna | 700,000 | RBS | (281 | ) | |||||||||||||
| 09/17/14 |
U.S. Dollars | 30,525 | Mexican Pesos | 400,000 | RBS | (138 | ) | |||||||||||||
| 09/17/14 |
U.S. Dollars | 25,800 | Hong Kong Dollars | 200,000 | RBS | 5 | ||||||||||||||
| 09/17/14 |
U.S. Dollars | 24,577 | Thailand Baht | 800,000 | RBS | 18 | ||||||||||||||
| 09/17/14 |
U.S. Dollars | 24,562 | Thailand Baht | 800,000 | RBS | 3 | ||||||||||||||
| 09/17/14 |
U.S. Dollars | 21,748 | Russian Rubles | 764,000 | RBS | (322 | ) | |||||||||||||
| 09/17/14 |
Singapore Dollars | 20,000 | U.S. Dollars | 15,943 | RBS | 98 | ||||||||||||||
| 09/17/14 |
Indian Rupees | 20,000 | U.S. Dollars | 333 | RBS | (7 | ) | |||||||||||||
| 09/17/14 |
U.S. Dollars | 18,794 | Turkish Lira | 40,000 | RBS | 221 | ||||||||||||||
| 09/17/14 |
U.S. Dollars | 15,372 | Thailand Baht | 500,000 | RBS | 23 | ||||||||||||||
| 09/17/14 |
U.S. Dollars | 15,301 | Thailand Baht | 500,000 | RBS | (49 | ) | |||||||||||||
| 09/17/14 |
U.S. Dollars | 13,307 | Indonesian Rupiahs | 158,686,000 | RBS | 123 | ||||||||||||||
| 09/17/14 |
U.S. Dollars | 13,175 | Hungarian Forint | 3,000,000 | RBS | (49 | ) | |||||||||||||
| 09/17/14 |
U.S. Dollars | 12,901 | Hong Kong Dollars | 100,000 | RBS | 3 | ||||||||||||||
| 09/17/14 |
Singapore Dollars | 10,000 | U.S. Dollars | 7,996 | RBS | 24 | ||||||||||||||
| 09/17/14 |
Singapore Dollars | 10,000 | U.S. Dollars | 8,001 | RBS | 20 | ||||||||||||||
| 09/17/14 |
Singapore Dollars | 10,000 | U.S. Dollars | 8,006 | RBS | 15 | ||||||||||||||
| 09/17/14 |
Peruvian Nuevos Soles | 10,000 | U.S. Dollars | 3,529 | RBS | 14 | ||||||||||||||
| 09/17/14 |
Singapore Dollars | 10,000 | U.S. Dollars | 8,010 | RBS | 10 | ||||||||||||||
| 09/17/14 |
Peruvian Nuevos Soles | 10,000 | U.S. Dollars | 3,534 | RBS | 9 | ||||||||||||||
| 09/17/14 |
Peruvian Nuevos Soles | 10,000 | U.S. Dollars | 3,540 | RBS | 2 | ||||||||||||||
| 09/17/14 |
Peruvian Nuevos Soles | 10,000 | U.S. Dollars | 3,569 | RBS | (26 | ) | |||||||||||||
| 09/17/14 |
U.S. Dollars | 9,906 | Czech Republic Koruna | 200,000 | RBS | (81 | ) | |||||||||||||
| 09/17/14 |
U.S. Dollars | 8,703 | Brazilian Reals | 20,000 | RBS | (144 | ) | |||||||||||||
| 09/17/14 |
Mexican Pesos | 8,000 | U.S. Dollars | 611 | RBS | 2 | ||||||||||||||
| 09/17/14 |
U.S. Dollars | 7,105 | Peruvian Nuevos Soles | 20,000 | RBS | 19 | ||||||||||||||
| 09/17/14 |
Taiwan Dollars | 5,000 | U.S. Dollars | 167 | RBS | — | ||||||||||||||
| 09/17/14 |
U.S. Dollars | 4,402 | Hungarian Forint | 1,000,000 | RBS | (6 | ) | |||||||||||||
| 09/17/14 |
U.S. Dollars | 3,576 | Peruvian Nuevos Soles | 10,000 | RBS | 33 | ||||||||||||||
| 09/17/14 |
U.S. Dollars | 3,565 | Peruvian Nuevos Soles | 10,000 | RBS | 23 | ||||||||||||||
| 09/17/14 |
U.S. Dollars | 3,543 | Peruvian Nuevos Soles | 10,000 | RBS | — | ||||||||||||||
| 09/17/14 |
U.S. Dollars | 3,527 | Peruvian Nuevos Soles | 10,000 | RBS | (15 | ) | |||||||||||||
| 09/17/14 |
U.S. Dollars | 3,073 | Thailand Baht | 100,000 | RBS | 3 | ||||||||||||||
| 09/17/14 |
U.S. Dollars | 3,065 | Thailand Baht | 100,000 | RBS | (4 | ) | |||||||||||||
| 09/17/14 |
U.S. Dollars | 1,098 | South African Rand | 12,000 | RBS | (15 | ) | |||||||||||||
| 09/17/14 |
U.S. Dollars | 1,095 | Indonesian Rupiahs | 13,091,000 | RBS | 7 | ||||||||||||||
| 09/17/14 |
U.S. Dollars | 912 | Russian Rubles | 32,000 | RBS | (12 | ) | |||||||||||||
|
|
|
|||||||||||||||||||
| $ | (186,748 | ) | ||||||||||||||||||
|
|
|
|||||||||||||||||||
| Inflation Protected Bond Fund |
| |||||||||||||||||||
| 07/07/14 |
U.S. Dollars | 18,788,096 | Euro | 13,835,000 | UBS | $ | (156,682 | ) | ||||||||||||
| 07/23/14 |
Mexican Pesos | 36,553,026 | U.S. Dollars | 2,803,973 | BOA | 8,555 | ||||||||||||||
| 07/23/14 |
U.S. Dollars | 2,810,845 | Mexican Pesos | 36,585,000 | DEUT | (4,143 | ) | |||||||||||||
257
Table of Contents
| Fund/Expiration Date |
Currency Purchased |
Amount of Currency Purchased |
Currency Sold |
Amount of Currency Sold |
Counter- party |
Net Unrealized Appreciation (Depreciation) |
||||||||||||||
| 07/23/14 |
U.S. Dollars | 1,897,741 | Australian Dollars | 2,070,000 | BAR | $ | (50,545 | ) | ||||||||||||
| 07/23/14 |
U.S. Dollars | 888,530 | New Zealand Dollars | 1,032,000 | BOA | (12,975 | ) | |||||||||||||
| 09/12/14 |
U.S. Dollars | 609,548 | Euro | 445,000 | DEUT | 39 | ||||||||||||||
| 09/12/14 |
Norwegian Krone | 12,977,578 | Australian Dollars | 2,307,621 | JPM | (54,635 | ) | |||||||||||||
| 09/12/14 |
Australian Dollars | 2,285,000 | Norwegian Krone | 13,084,710 | UBS | 16,003 | ||||||||||||||
| 09/12/14 |
U.S. Dollars | 1,602,920 | Euro | 1,181,539 | BAR | (15,415 | ) | |||||||||||||
| 09/12/14 |
U.S. Dollars | 1,214,736 | Japanese Yen | 123,469,489 | BAR | (4,717 | ) | |||||||||||||
|
|
|
|||||||||||||||||||
| $ | (274,515 | ) | ||||||||||||||||||
|
|
|
|||||||||||||||||||
Options Written
Transactions in options written during the period ended June 30, 2014 were as follows:
| Fund | Number of Contracts |
Premiums Received |
Notional Amount |
Premiums Received |
Total Premiums Received |
|||||||||||||||
| Low-Duration Bond |
||||||||||||||||||||
| Options written, 12/31/13 |
396 | $ | 173,943 | $ | 90,200,000 | $ | 230,869 | $ | 404,812 | |||||||||||
|
|
|
|
|
|
|
|
|
|
|
|||||||||||
| Options written |
— | — | 52,400,000 | 266,390 | 266,390 | |||||||||||||||
| Options expired |
(396 | ) | (173,943 | ) | (17,200,000 | ) | (75,225 | ) | (249,168 | ) | ||||||||||
| Options closed |
— | — | (107,900,000 | ) | (406,984 | ) | (406,984 | ) | ||||||||||||
|
|
|
|
|
|
|
|
|
|
|
|||||||||||
| Options written, 06/30/14 |
— | $ | — | $ | 17,500,000 | $ | 15,050 | $ | 15,050 | |||||||||||
|
|
|
|
|
|
|
|
|
|
|
|||||||||||
| Medium-Duration Bond |
||||||||||||||||||||
| Options written, 12/31/13 |
412 | $ | 180,759 | $ | 107,500,000 | $ | 276,212 | $ | 456,971 | |||||||||||
|
|
|
|
|
|
|
|
|
|
|
|||||||||||
| Options written |
1,340 | 361,431 | 259,300,000 | 927,861 | 1,289,292 | |||||||||||||||
| Options expired |
(1,011 | ) | (313,437 | ) | (84,600,000 | ) | (87,141 | ) | (400,578 | ) | ||||||||||
| Options closed |
(468 | ) | (130,737 | ) | (103,400,000 | ) | (128,452 | ) | (259,189 | ) | ||||||||||
|
|
|
|
|
|
|
|
|
|
|
|||||||||||
| Options written, 06/30/14 |
273 | $ | 98,016 | $ | 178,800,000 | $ | 988,480 | $ | 1,086,496 | |||||||||||
|
|
|
|
|
|
|
|
|
|
|
|||||||||||
| Defensive Market Strategies |
||||||||||||||||||||
| Options written, 12/31/13 |
688 | $ | 32,881 | $ | — | $ | — | $ | 32,881 | |||||||||||
|
|
|
|
|
|
|
|
|
|
|
|||||||||||
| Options written |
2,561 | 1,999,218 | — | — | 1,999,218 | |||||||||||||||
| Options expired |
(2,297 | ) | (1,365,787 | ) | — | — | (1,365,787 | ) | ||||||||||||
| Options closed |
(332 | ) | (224,283 | ) | — | — | (224,283 | ) | ||||||||||||
|
|
|
|
|
|
|
|
|
|
|
|||||||||||
| Options written, 06/30/14 |
620 | $ | 442,029 | $ | — | $ | — | $ | 442,029 | |||||||||||
|
|
|
|
|
|
|
|
|
|
|
|||||||||||
| Small Cap Equity |
||||||||||||||||||||
| Options written, 12/31/13 |
13 | $ | 3,973 | $ | — | $ | — | $ | 3,973 | |||||||||||
|
|
|
|
|
|
|
|
|
|
|
|||||||||||
| Options written |
83 | 19,277 | — | — | 19,277 | |||||||||||||||
| Options expired |
(7 | ) | (1,837 | ) | — | — | (1,837 | ) | ||||||||||||
| Options closed |
(89 | ) | (21,414 | ) | — | — | (21,414 | ) | ||||||||||||
|
|
|
|
|
|
|
|
|
|
|
|||||||||||
| Options written, 06/30/14 |
— | $ | — | $ | — | $ | — | $ | — | |||||||||||
|
|
|
|
|
|
|
|
|
|
|
|||||||||||
| Inflation Protected Bond |
||||||||||||||||||||
| Options written, 12/31/13 |
200 | $ | 14,660 | $ | 4,890,000 | $ | 66,923 | $ | 81,583 | |||||||||||
|
|
|
|
|
|
|
|
|
|
|
|||||||||||
| Options written |
497 | 166,887 | 10,385,000 | 75,771 | 242,658 | |||||||||||||||
| Options expired |
(178 | ) | (41,461 | ) | (15,275,000 | ) | (142,694 | ) | (184,155 | ) | ||||||||||
| Options closed |
(347 | ) | (78,434 | ) | — | — | (78,434 | ) | ||||||||||||
|
|
|
|
|
|
|
|
|
|
|
|||||||||||
| Options written, 06/30/14 |
172 | $ | 61,653 | $ | — | $ | — | $ | 61,653 | |||||||||||
|
|
|
|
|
|
|
|
|
|
|
|||||||||||
258
Table of Contents
6. CAPITAL SHARE TRANSACTIONS
Transactions in shares of capital stock were as follows:
| Six Months Ended 06/30/14 | Year Ended 12/31/13 | |||||||||||
| Institutional Class |
Investor Class |
Institutional Class |
Investor Class |
|||||||||
| MyDestination 2005 |
||||||||||||
| Shares sold |
1,138,606 | 2,390,141 | ||||||||||
| Shares reinvested |
— | 133,788 | ||||||||||
| Shares redeemed |
(906,326 | ) | (2,453,997 | ) | ||||||||
|
|
|
|
|
|||||||||
| Net increase |
232,280 | 69,932 | ||||||||||
|
|
|
|
|
|||||||||
| MyDestination 2015 |
||||||||||||
| Shares sold |
3,260,376 | 7,823,039 | ||||||||||
| Shares reinvested |
— | 1,056,637 | ||||||||||
| Shares redeemed |
(1,990,924 | ) | (3,249,231 | ) | ||||||||
|
|
|
|
|
|||||||||
| Net increase |
1,269,452 | 5,630,445 | ||||||||||
|
|
|
|
|
|||||||||
| MyDestination 2025 |
||||||||||||
| Shares sold |
4,853,898 | 11,525,044 | ||||||||||
| Shares reinvested |
— | 2,356,280 | ||||||||||
| Shares redeemed |
(956,074 | ) | (1,456,827 | ) | ||||||||
|
|
|
|
|
|||||||||
| Net increase |
3,897,824 | 12,424,497 | ||||||||||
|
|
|
|
|
|||||||||
| MyDestination 2035 |
||||||||||||
| Shares sold |
3,104,278 | 6,160,978 | ||||||||||
| Shares reinvested |
— | 1,469,835 | ||||||||||
| Shares redeemed |
(417,666 | ) | (599,267 | ) | ||||||||
|
|
|
|
|
|||||||||
| Net increase |
2,686,612 | 7,031,546 | ||||||||||
|
|
|
|
|
|||||||||
| MyDestination 2045 |
||||||||||||
| Shares sold |
1,956,107 | 4,414,752 | ||||||||||
| Shares reinvested |
— | 1,643,081 | ||||||||||
| Shares redeemed |
(354,115 | ) | (400,028 | ) | ||||||||
|
|
|
|
|
|||||||||
| Net increase |
1,601,992 | 5,657,805 | ||||||||||
|
|
|
|
|
|||||||||
| MyDestination 2055 |
||||||||||||
| Shares sold |
487,820 | 779,633 | ||||||||||
| Shares reinvested |
— | 79,228 | ||||||||||
| Shares redeemed |
(142,866 | ) | (158,031 | ) | ||||||||
|
|
|
|
|
|||||||||
| Net increase (decrease) |
344,954 | 700,830 | ||||||||||
|
|
|
|
|
|||||||||
| Conservative Allocation |
||||||||||||
| Shares sold |
1,584,154 | 3,550,322 | ||||||||||
| Shares reinvested |
— | 1,864,374 | ||||||||||
| Shares redeemed |
(2,113,537 | ) | (5,118,767 | ) | ||||||||
|
|
|
|
|
|||||||||
| Net increase (decrease) |
(529,383 | ) | 295,929 | |||||||||
|
|
|
|
|
|||||||||
259
Table of Contents
| Six Months Ended 06/30/14 | Year Ended 12/31/13 | |||||||||||||||
| Institutional Class |
Investor Class |
Institutional Class |
Investor Class |
|||||||||||||
| Balanced Allocation |
||||||||||||||||
| Shares sold |
2,420,643 | 6,124,611 | ||||||||||||||
| Shares reinvested |
— | 6,104,594 | ||||||||||||||
| Shares redeemed |
(3,618,256 | ) | (8,788,484 | ) | ||||||||||||
|
|
|
|
|
|||||||||||||
| Net increase (decrease) |
(1,197,613 | ) | 3,440,721 | |||||||||||||
|
|
|
|
|
|||||||||||||
| Growth Allocation |
||||||||||||||||
| Shares sold |
1,285,724 | 3,092,779 | ||||||||||||||
| Shares reinvested |
144 | 6,462,903 | ||||||||||||||
| Shares redeemed |
(2,598,454 | ) | (6,124,482 | ) | ||||||||||||
|
|
|
|
|
|||||||||||||
| Net increase (decrease) |
(1,312,586 | ) | 3,431,200 | |||||||||||||
|
|
|
|
|
|||||||||||||
| Aggressive Allocation |
||||||||||||||||
| Shares sold |
707,772 | 2,138,220 | ||||||||||||||
| Shares reinvested |
— | 3,947,279 | ||||||||||||||
| Shares redeemed |
(2,217,837 | ) | (5,065,859 | ) | ||||||||||||
|
|
|
|
|
|||||||||||||
| Net increase (decrease) |
(1,510,065 | ) | 1,019,640 | |||||||||||||
|
|
|
|
|
|||||||||||||
| Conservative Allocation I |
||||||||||||||||
| Shares sold |
421,858 | 1,051,991 | ||||||||||||||
| Shares reinvested |
— | 307,930 | ||||||||||||||
| Shares redeemed |
(810,449 | ) | (1,268,188 | ) | ||||||||||||
|
|
|
|
|
|||||||||||||
| Net increase (decrease) |
(388,591 | ) | 91,733 | |||||||||||||
|
|
|
|
|
|||||||||||||
| Balanced Allocation I |
||||||||||||||||
| Shares sold |
872,889 | 2,931,254 | ||||||||||||||
| Shares reinvested |
— | 1,297,121 | ||||||||||||||
| Shares redeemed |
(1,513,551 | ) | (2,315,029 | ) | ||||||||||||
|
|
|
|
|
|||||||||||||
| Net increase (decrease) |
(640,662 | ) | 1,913,346 | |||||||||||||
|
|
|
|
|
|||||||||||||
| Growth Allocation I |
||||||||||||||||
| Shares sold |
558,791 | 2,619,702 | ||||||||||||||
| Shares reinvested |
— | 769,800 | ||||||||||||||
| Shares redeemed |
(892,221 | ) | (1,488,489 | ) | ||||||||||||
|
|
|
|
|
|||||||||||||
| Net increase (decrease) |
(333,430 | ) | 1,901,013 | |||||||||||||
|
|
|
|
|
|||||||||||||
| Aggressive Allocation I |
||||||||||||||||
| Shares sold |
396,040 | 1,441,037 | ||||||||||||||
| Shares reinvested |
— | 335,244 | ||||||||||||||
| Shares redeemed |
(528,535 | ) | (988,775 | ) | ||||||||||||
|
|
|
|
|
|||||||||||||
| Net increase (decrease) |
(132,495 | ) | 787,506 | |||||||||||||
|
|
|
|
|
|||||||||||||
| Money Market |
||||||||||||||||
| Shares sold |
104,647,163 | 1,804,874,091 | 105,460,546 | 4,335,936,657 | ||||||||||||
| Shares reinvested |
9,355 | 21,436 | 38,908 | 105,203 | ||||||||||||
| Shares redeemed |
(70,407,810 | ) | (1,883,110,800 | ) | (106,106,557 | ) | (4,204,891,545 | ) | ||||||||
|
|
|
|
|
|
|
|
|
|||||||||
| Net increase (decrease) |
34,248,708 | (78,215,273 | ) | (607,103 | ) | 131,150,315 | ||||||||||
|
|
|
|
|
|
|
|
|
|||||||||
260
Table of Contents
| Six Months Ended 06/30/14 | Year Ended 12/31/13 | |||||||||||||||
| Institutional Class |
Investor Class |
Institutional Class |
Investor Class |
|||||||||||||
| Low-Duration Bond |
||||||||||||||||
| Shares sold |
1,326,979 | 2,602,301 | 2,410,812 | 7,197,509 | ||||||||||||
| Shares reinvested |
132,914 | 229,674 | 320,329 | 549,518 | ||||||||||||
| Shares redeemed |
(858,137 | ) | (1,304,352 | ) | (2,259,882 | ) | (5,397,894 | ) | ||||||||
|
|
|
|
|
|
|
|
|
|||||||||
| Net increase |
601,756 | 1,527,623 | 471,259 | 2,349,133 | ||||||||||||
|
|
|
|
|
|
|
|
|
|||||||||
| Medium-Duration Bond |
||||||||||||||||
| Shares sold |
3,831,279 | 1,715,177 | 3,728,890 | 5,082,508 | ||||||||||||
| Shares reinvested |
653,657 | 366,598 | 1,297,479 | 725,378 | ||||||||||||
| Shares redeemed |
(1,498,912 | ) | (1,622,513 | ) | (6,539,868 | ) | (6,915,624 | ) | ||||||||
|
|
|
|
|
|
|
|
|
|||||||||
| Net increase (decrease) |
2,986,024 | 459,262 | (1,513,499 | ) | (1,107,738 | ) | ||||||||||
|
|
|
|
|
|
|
|
|
|||||||||
| Extended-Duration Bond |
||||||||||||||||
| Shares sold |
1,514,313 | 1,342,350 | 1,450,978 | 1,802,684 | ||||||||||||
| Shares reinvested |
584,077 | 194,604 | 2,566,909 | 1,075,013 | ||||||||||||
| Shares redeemed |
(2,709,445 | ) | (1,690,811 | ) | (6,720,701 | ) | (10,234,291 | ) | ||||||||
|
|
|
|
|
|
|
|
|
|||||||||
| Net decrease |
(611,055 | ) | (153,857 | ) | (2,702,814 | ) | (7,356,594 | ) | ||||||||
|
|
|
|
|
|
|
|
|
|||||||||
| Global Bond |
||||||||||||||||
| Shares sold |
1,974,442 | 13,971,357 | ||||||||||||||
| Shares reinvested |
600,636 | 931,764 | ||||||||||||||
| Shares redeemed |
(1,030,821 | ) | (1,865,216 | ) | ||||||||||||
|
|
|
|
|
|||||||||||||
| Net increase |
1,544,257 | 13,037,905 | ||||||||||||||
|
|
|
|
|
|||||||||||||
| Defensive Market Strategies |
||||||||||||||||
| Shares sold |
531,295 | 3,194,412 | 661,878 | 6,381,892 | ||||||||||||
| Shares reinvested |
111,180 | 487,253 | 721,331 | 3,070,861 | ||||||||||||
| Shares redeemed |
(524,081 | ) | (1,348,411 | ) | (1,607,751 | ) | (4,528,408 | ) | ||||||||
|
|
|
|
|
|
|
|
|
|||||||||
| Net increase (decrease) |
118,394 | 2,333,254 | (224,542 | ) | 4,924,345 | |||||||||||
|
|
|
|
|
|
|
|
|
|||||||||
| Equity Index |
||||||||||||||||
| Shares sold |
1,973,099 | 887,537 | 1,131,793 | 2,256,224 | ||||||||||||
| Shares reinvested |
210,301 | 109,588 | 460,083 | 335,582 | ||||||||||||
| Shares redeemed |
(248,086 | ) | (1,511,792 | ) | (662,076 | ) | (1,537,196 | ) | ||||||||
|
|
|
|
|
|
|
|
|
|||||||||
| Net increase (decrease) |
1,935,314 | (514,667 | ) | 929,800 | 1,054,610 | |||||||||||
|
|
|
|
|
|
|
|
|
|||||||||
| Value Equity |
||||||||||||||||
| Shares sold |
1,874,287 | 1,375,784 | 2,595,246 | 4,377,712 | ||||||||||||
| Shares reinvested |
812,553 | 673,363 | 2,293,663 | 2,159,615 | ||||||||||||
| Shares redeemed |
(1,410,418 | ) | (2,619,683 | ) | (6,218,683 | ) | (12,367,991 | ) | ||||||||
|
|
|
|
|
|
|
|
|
|||||||||
| Net increase (decrease) |
1,276,422 | (570,536 | ) | (1,329,774 | ) | (5,830,664 | ) | |||||||||
|
|
|
|
|
|
|
|
|
|||||||||
| Growth Equity |
||||||||||||||||
| Shares sold |
1,565,575 | 2,346,425 | 1,209,794 | 2,482,933 | ||||||||||||
| Shares reinvested |
513,583 | 716,140 | 4,889,718 | 8,132,474 | ||||||||||||
| Shares redeemed |
(957,616 | ) | (2,751,927 | ) | (3,679,257 | ) | (9,363,004 | ) | ||||||||
|
|
|
|
|
|
|
|
|
|||||||||
| Net increase |
1,121,542 | 310,638 | 2,420,255 | 1,252,403 | ||||||||||||
|
|
|
|
|
|
|
|
|
|||||||||
261
Table of Contents
| Six Months Ended 06/30/14 | Year Ended 12/31/13 | |||||||||||||||
| Institutional Class |
Investor Class |
Institutional Class |
Investor Class |
|||||||||||||
| Small Cap Equity |
||||||||||||||||
| Shares sold |
1,111,249 | 1,478,457 | 674,645 | 3,097,274 | ||||||||||||
| Shares reinvested |
— | 180 | 2,205,035 | 4,671,768 | ||||||||||||
| Shares redeemed |
(482,392 | ) | (2,443,674 | ) | (1,346,815 | ) | (4,452,164 | ) | ||||||||
|
|
|
|
|
|
|
|
|
|||||||||
| Net increase (decrease) |
628,857 | (965,037 | ) | 1,532,865 | 3,316,878 | |||||||||||
|
|
|
|
|
|
|
|
|
|||||||||
| International Equity |
||||||||||||||||
| Shares sold |
1,321,972 | 2,642,076 | 2,527,358 | 8,472,335 | ||||||||||||
| Shares reinvested |
— | — | 497,233 | 1,031,763 | ||||||||||||
| Shares redeemed |
(1,594,735 | ) | (2,417,133 | ) | (6,818,923 | ) | (22,701,043 | ) | ||||||||
|
|
|
|
|
|
|
|
|
|||||||||
| Net increase (decrease) |
(272,763 | ) | 224,943 | (3,794,332 | ) | (13,196,945 | ) | |||||||||
|
|
|
|
|
|
|
|
|
|||||||||
| Emerging Markets Equity(1) |
||||||||||||||||
| Shares sold |
465,112 | 2,205,580 | 4,766,135 | 25,064,445 | ||||||||||||
| Shares redeemed |
(386,772 | ) | (1,322,150 | ) | (6,609 | ) | (17,379 | ) | ||||||||
|
|
|
|
|
|
|
|
|
|||||||||
| Net increase |
78,340 | 883,430 | 4,759,526 | 25,047,066 | ||||||||||||
|
|
|
|
|
|
|
|
|
|||||||||
| Inflation Protected Bond |
||||||||||||||||
| Shares sold |
2,964,283 | 14,472,849 | ||||||||||||||
| Shares reinvested |
300,744 | 256,571 | ||||||||||||||
| Shares redeemed |
(1,119,583 | ) | (5,308,242 | ) | ||||||||||||
|
|
|
|
|
|||||||||||||
| Net increase |
2,145,444 | 9,421,178 | ||||||||||||||
|
|
|
|
|
|||||||||||||
| Flexible Income(2) |
||||||||||||||||
| Shares sold |
1,216,648 | 10,983,177 | ||||||||||||||
| Shares reinvested |
167,678 | 102,640 | ||||||||||||||
| Shares redeemed |
(137,839 | ) | (229,568 | ) | ||||||||||||
|
|
|
|
|
|||||||||||||
| Net increase |
1,246,487 | 10,856,249 | ||||||||||||||
|
|
|
|
|
|||||||||||||
| Real Assets(2) |
||||||||||||||||
| Shares sold |
2,325,812 | 2,902,856 | ||||||||||||||
| Shares reinvested |
— | 26,318 | ||||||||||||||
| Shares redeemed |
(200,153 | ) | (113,145 | ) | ||||||||||||
|
|
|
|
|
|||||||||||||
| Net increase |
2,125,659 | 2,816,029 | ||||||||||||||
|
|
|
|
|
|||||||||||||
| Real Estate Securities |
||||||||||||||||
| Shares sold |
1,817,254 | 12,984,775 | ||||||||||||||
| Shares reinvested |
200,600 | 3,225,459 | ||||||||||||||
| Shares redeemed |
(2,048,019 | ) | (9,162,135 | ) | ||||||||||||
|
|
|
|
|
|||||||||||||
| Net increase (decrease) |
(30,165 | ) | 7,048,099 | |||||||||||||
|
|
|
|
|
|||||||||||||
| Global Natural Resources Equity(2) |
||||||||||||||||
| Shares sold |
1,699,163 | 26,918,280 | ||||||||||||||
| Shares reinvested |
— | 328,917 | ||||||||||||||
| Shares redeemed |
(1,376,276 | ) | (387,108 | ) | ||||||||||||
|
|
|
|
|
|||||||||||||
| Net increase |
322,887 | 26,860,089 | ||||||||||||||
|
|
|
|
|
|||||||||||||
| (1) | Inception date was October 31, 2013 |
| (2) | Inception date was July 1, 2013 |
262
Table of Contents
7. BANK BORROWINGS
The Board of Trustees approved the renewal of a credit agreement with Bank of America, N.A. dated November 29, 2013 through November 28, 2014. The agreement permits up to $50 million, collectively. Interest is charged to each Fund based on its borrowings at a rate equal to the Bank Prime plus 0.60% or the Wall Street Journal LIBOR One Month Floating Rate plus 1.00%. Each Fund also pays a facility fee equal to its pro rata share of the amount of the credit facility at a rate of 0.23% per annum.
No Funds borrowed for the period ended June 30, 2014, and there were no outstanding loans at June 30, 2014.
8. FEDERAL INCOME TAXES
Each Fund’s policy is to comply with all sections of the Internal Revenue Code of 1986, as amended, that apply to regulated investment companies and to distribute substantially all of its taxable income and capital gains to shareholders. No provision for income or excise taxes is thus required. Each Fund is treated as a separate entity for federal income tax purposes.
The Funds may be subject to taxes imposed by countries in which they invest in issuers existing or operating in such countries. Such taxes are generally based on income earned. The Funds accrue such taxes when the related income is earned. Dividend and interest income is recorded net of non-U.S. taxes paid. Gains realized by the Funds on the sale of securities in certain countries are subject to non-U.S. taxes. The Funds record a liability based on unrealized gains to provide for potential non-U.S. taxes payable upon the sale of these securities. For the period ended June 30, 2014, the Emerging Markets Equity Fund accrued non-U.S. taxes on unrealized gains of $651,235.
Management has analyzed the Funds’ tax positions and has concluded that no provision for income tax is required in the Funds’ financial statements. The Funds are not aware of any tax positions for which it is reasonably possible that the total amounts of unrecognized tax benefits will significantly change in the next twelve months. However, management’s conclusions may be subject to review and adjustment at a later date based on factors including, but not limited to new tax laws, regulations and administrative interpretations (including court decisions). Each of the Funds’ federal tax returns for the prior three fiscal years remains subject to examination by the Internal Revenue Service.
The character of distributions made during the year from net investment income or net realized gains may differ from their ultimate characterization for federal income tax purposes. Also, due to the timing of dividend distributions, the fiscal year in which amounts are distributed may differ from the year that the income or realized gains (losses) were recorded by the Funds. Income dividends and capital gain distributions are determined in accordance with federal income tax regulations, which may differ from GAAP. These differences are primarily due to differing treatments for futures and options transactions, foreign currency transactions, paydowns, losses deferred due to wash sales, straddles and investments in Passive Foreign Investment Companies (“PFIC’s”). Distributions during the year ended December 31, 2013, were characterized as follows for tax purposes:
| Fund |
Ordinary Income |
Long-Term Capital Gain |
Total Distribution |
|||||||||||||
| MyDestination 2005 |
2013 | $ | 1,430,800 | $ | — | $ | 1,430,800 | |||||||||
| 2012 | 1,578,267 | — | 1,578,267 | |||||||||||||
| MyDestination 2015 |
2013 | 11,082,375 | 507,649 | 11,590,024 | ||||||||||||
| 2012 | 7,838,073 | — | 7,838,073 | |||||||||||||
| MyDestination 2025 |
2013 | 13,816,231 | 11,772,816 | 25,589,047 | ||||||||||||
| 2012 | 7,215,597 | — | 7,215,597 | |||||||||||||
| MyDestination 2035 |
2013 | 6,111,194 | 9,769,547 | 15,880,741 | ||||||||||||
| 2012 | 2,242,099 | 879,202 | 3,121,301 | |||||||||||||
263
Table of Contents
| Fund |
Ordinary Income |
Long-Term Capital Gain |
Total Distribution |
|||||||||||||
| MyDestination 2045 |
2013 | $ | 4,505,425 | $ | 12,558,112 | $ | 17,063,537 | |||||||||
| 2012 | 1,379,906 | 660,432 | 2,040,338 | |||||||||||||
| MyDestination 2055 |
2013 | 337,035 | 689,617 | 1,026,652 | ||||||||||||
| 2012 | 118,877 | — | 118,877 | |||||||||||||
| Conservative Allocation |
2013 | 4,707,701 | 17,556,365 | 22,264,066 | ||||||||||||
| 2012 | 5,840,997 | 688,186 | 6,529,183 | |||||||||||||
| Balanced Allocation |
2013 | 27,828,660 | 53,077,462 | 80,906,122 | ||||||||||||
| 2012 | 25,943,077 | 13,284,081 | 39,227,158 | |||||||||||||
| Growth Allocation |
2013 | 19,778,720 | 71,013,455 | 90,792,175 | ||||||||||||
| 2012 | 12,093,852 | 5,913,471 | 18,007,323 | |||||||||||||
| Aggressive Allocation |
2013 | 18,059,402 | 40,374,215 | 58,433,617 | ||||||||||||
| 2012 | 7,350,220 | 9,829,880 | 17,180,100 | |||||||||||||
| Conservative Allocation I |
2013 | 2,555,600 | 476,930 | 3,032,530 | ||||||||||||
| 2012 | 2,141,071 | — | 2,141,071 | |||||||||||||
| Balanced Allocation I |
2013 | 13,881,599 | — | 13,881,599 | ||||||||||||
| 2012 | 13,614,253 | — | 13,614,253 | |||||||||||||
| Growth Allocation I |
2013 | 9,414,953 | — | 9,414,953 | ||||||||||||
| 2012 | 5,883,636 | — | 5,883,636 | |||||||||||||
| Aggressive Allocation I |
2013 | 4,675,371 | — | 4,675,371 | ||||||||||||
| 2012 | 2,288,303 | — | 2,288,303 | |||||||||||||
| Money Market |
2013 | 228,385 | — | 228,385 | ||||||||||||
| 2012 | 256,904 | — | 256,904 | |||||||||||||
| Low-Duration Bond |
2013 | 10,153,806 | — | 10,153,806 | ||||||||||||
| 2012 | 14,200,533 | 430,869 | 14,631,402 | |||||||||||||
| Medium-Duration Bond |
2013 | 19,625,346 | — | 19,625,346 | ||||||||||||
| 2012 | 36,230,589 | — | 36,230,589 | |||||||||||||
| Extended-Duration Bond |
2013 | 16,784,004 | 15,235,598 | 32,019,602 | ||||||||||||
| 2012 | 25,350,803 | 8,562,989 | 33,913,792 | |||||||||||||
| Global Bond |
2013 | 9,497,750 | — | 9,497,750 | ||||||||||||
| 2012 | 10,523,011 | — | 10,523,011 | |||||||||||||
| Defensive Market Strategies |
2013 | 24,435,473 | 18,757,192 | 43,192,665 | ||||||||||||
| 2012 | 14,722,792 | 2,364,615 | 17,087,407 | |||||||||||||
| Equity Index |
2013 | 6,219,243 | 4,196,449 | 10,415,692 | ||||||||||||
| 2012 | 5,289,625 | 2,667,155 | 7,956,780 | |||||||||||||
| Value Equity |
2013 | 25,431,349 | 40,067,680 | 65,499,029 | ||||||||||||
| 2012 | 19,346,383 | — | 19,346,383 | |||||||||||||
| Growth Equity |
2013 | 50,068,100 | 193,351,088 | 243,419,188 | ||||||||||||
| 2012 | 2,148,451 | 95,278,551 | 97,427,002 | |||||||||||||
| Small Cap Equity |
2013 | 39,689,845 | 66,847,494 | 106,537,339 | ||||||||||||
| 2012 | 3,052,762 | 22,280,774 | 25,333,536 | |||||||||||||
| International Equity |
2013 | 21,343,925 | — | 21,343,925 | ||||||||||||
| 2012 | 22,469,818 | — | 22,469,818 | |||||||||||||
| Inflation Protected Bond |
2013 | 2,068,697 | 682,106 | 2,750,803 | ||||||||||||
| 2012 | 7,052,735 | 2,263,673 | 9,316,408 | |||||||||||||
| Flexible Income |
2013 | 1,028,524 | — | 1,028,524 | ||||||||||||
| Real Assets |
2013 | 258,438 | — | 258,438 | ||||||||||||
| Real Estate Securities |
2013 | 10,582,340 | 19,896,262 | 30,478,602 | ||||||||||||
| 2012 | 2,553,245 | — | 2,553,245 | |||||||||||||
| Global Natural Resources Equity |
2013 | 3,127,024 | — | 3,127,024 | ||||||||||||
264
Table of Contents
At December 31, 2013, the components of distributable earnings on a tax basis were as follows:
| Fund |
Undistributed Ordinary Income |
Undistributed Long-Term Capital Gain/ (Capital Loss Carryforward) |
Late Year Loss Deferrals |
Net Unrealized Appreciation (Depreciation) on Investments |
||||||||||||
| MyDestination 2005 |
$ | 83,785 | $ | 1,356,949 | $ | — | $ | 2,202,178 | ||||||||
| MyDestination 2015 |
— | 10,218,241 | — | 35,242,944 | ||||||||||||
| MyDestination 2025 |
78,978 | 15,609,679 | — | 53,589,787 | ||||||||||||
| MyDestination 2035 |
68,660 | 10,599,160 | — | 38,394,452 | ||||||||||||
| MyDestination 2045 |
60,829 | 8,242,663 | — | 28,023,688 | ||||||||||||
| MyDestination 2055 |
5,263 | 636,071 | — | 1,036,090 | ||||||||||||
| Conservative Allocation |
13,257 | 3,058,599 | — | 14,498,618 | ||||||||||||
| Balanced Allocation |
107,105 | 27,634,774 | — | 129,598,801 | ||||||||||||
| Growth Allocation |
197,890 | 31,187,159 | — | 113,718,347 | ||||||||||||
| Aggressive Allocation |
291,461 | 37,793,564 | — | 151,067,455 | ||||||||||||
| Conservative Allocation I |
— | 1,154,011 | — | (2,728,184 | ) | |||||||||||
| Balanced Allocation I |
5,275,083 | (2,089,258 | ) | — | (4,171,921 | ) | ||||||||||
| Growth Allocation I |
1,464,856 | 7,330,894 | — | 6,995,407 | ||||||||||||
| Aggressive Allocation I |
4,390,854 | 3,534,218 | — | 6,771,111 | ||||||||||||
| Money Market |
47,830 | — | — | — | ||||||||||||
| Low-Duration Bond |
190,509 | 462,630 | — | (5,095,179 | ) | |||||||||||
| Medium-Duration Bond |
1,121,489 | (10,419,386 | ) | — | (154,153 | ) | ||||||||||
| Extended-Duration Bond |
154,959 | 486,133 | — | 11,717,206 | ||||||||||||
| Global Bond |
639,097 | (7,751,153 | ) | (69,959 | ) | 9,266,210 | ||||||||||
| Defensive Market Strategies |
1,418,808 | 3,727,575 | — | 44,120,637 | ||||||||||||
| Equity Index |
344,212 | 1,163,051 | — | 126,006,448 | ||||||||||||
| Value Equity |
246,220 | 14,943,180 | — | 303,141,063 | ||||||||||||
| Growth Equity |
4,112,762 | 18,877,835 | — | 382,685,592 | ||||||||||||
| Small Cap Equity |
6,278,462 | 5,659,213 | — | 100,925,709 | ||||||||||||
| International Equity |
1,717,147 | (45,022,506 | ) | — | 224,742,189 | |||||||||||
| Emerging Markets Equity |
— | 42,811 | (1,088,983 | ) | (5,898,907 | ) | ||||||||||
| Inflation Protected Bond |
30,727 | (1,141,069 | ) | — | (7,718,462 | ) | ||||||||||
| Flexible Income |
91,204 | — | — | 517,058 | ||||||||||||
| Real Assets |
310 | 315,257 | — | (933,274 | ) | |||||||||||
| Real Estate Securities |
— | 258,324 | (902,246 | ) | (8,027,391 | ) | ||||||||||
| Global Natural Resources Equity |
152,400 | — | — | (13,070,671 | ) | |||||||||||
For Federal income tax purposes, realized capital losses may be carried forward and applied against future realized capital gains.
Capital loss carryovers and their expiration dates, were as follows as of December 31, 2013:
| Expiring December 31, | 2017 | 2018 | Unlimited | Total | ||||||||||||
| Balanced Allocation I |
$ | — | $ | 2,089,258 | $ | — | $ | 2,089,258 | ||||||||
| Medium-Duration Bond |
— | — | 10,419,386 | 10,419,386 | ||||||||||||
| Global Bond |
7,751,153 | — | — | 7,751,153 | ||||||||||||
| International Equity |
45,022,506 | — | — | 45,022,506 | ||||||||||||
| Inflation Protected Bond |
— | — | 1,141,069 | 1,141,069 | ||||||||||||
Under the recently enacted Regulated Investment Company Modernization Act of 2010, Funds will be permitted to carry forward capital losses incurred in taxable years beginning after December 22, 2010, for an unlimited period. Such losses are presented in the table above under the column heading “Unlimited.” However, any losses incurred during those future taxable years will be required to be utilized prior to the losses incurred in pre-enactment taxable years. As a result of this ordering rule,
265
Table of Contents
pre-enactment capital loss carryforwards may be more likely to expire unused. Additionally, post-enactment capital losses that are carried forward will retain their character as either short-term or long-term capital losses rather than being considered all short-term losses as under previous law.
At June 30, 2014, the aggregate cost of investment securities for federal income tax purposes (excluding foreign currency, securities sold short and derivative related items) and the net unrealized appreciation from investments for those securities having an excess of value over cost and net unrealized depreciation from investments for those securities having an excess of cost over value (based on cost for federal income tax purposes) were as follows:
| Fund |
Federal Tax Cost | Net Unrealized Appreciation (Depreciation) |
Appreciated Securities |
Depreciated Securities |
||||||||||||
| MyDestination 2005 |
$ | 86,198,440 | $ | 4,314,447 | $ | 4,627,283 | $ | (312,836 | ) | |||||||
| MyDestination 2015 |
424,909,021 | 52,454,939 | 53,860,791 | (1,405,852 | ) | |||||||||||
| MyDestination 2025 |
540,945,058 | 78,936,999 | 79,389,833 | (452,834 | ) | |||||||||||
| MyDestination 2035 |
285,639,519 | 52,757,310 | 52,757,310 | — | ||||||||||||
| MyDestination 2045 |
202,686,121 | 37,960,569 | 38,005,000 | (44,431 | ) | |||||||||||
| MyDestination 2055 |
20,043,578 | 1,843,516 | 1,861,447 | (17,931 | ) | |||||||||||
| Conservative Allocation |
302,369,538 | 20,169,661 | 20,356,852 | (187,191 | ) | |||||||||||
| Balanced Allocation |
1,156,842,511 | 185,075,487 | 185,987,630 | (912,143 | ) | |||||||||||
| Growth Allocation |
841,396,477 | 155,242,249 | 156,235,965 | (993,716 | ) | |||||||||||
| Aggressive Allocation |
718,370,993 | 177,458,551 | 177,458,551 | — | ||||||||||||
| Conservative Allocation I |
83,428,670 | (1,107,746 | ) | — | (1,107,746 | ) | ||||||||||
| Balanced Allocation I |
391,637,267 | 9,769,150 | 16,757,265 | (6,988,115 | ) | |||||||||||
| Growth Allocation I |
264,413,903 | 17,202,695 | 20,081,114 | (2,878,419 | ) | |||||||||||
| Aggressive Allocation I |
182,991,713 | 12,620,322 | 12,620,322 | — | ||||||||||||
| Money Market |
1,324,955,290 | — | — | — | ||||||||||||
| Low-Duration Bond |
1,042,435,508 | 1,799,244 | 6,509,687 | (4,710,443 | ) | |||||||||||
| Medium-Duration Bond |
997,437,816 | 15,739,463 | 23,301,761 | (7,562,298 | ) | |||||||||||
| Extended-Duration Bond |
283,812,710 | 35,098,584 | 35,901,399 | (802,815 | ) | |||||||||||
| Global Bond |
436,031,329 | 24,754,911 | 26,956,372 | (2,201,461 | ) | |||||||||||
| Defensive Market Strategies |
565,223,207 | 48,404,994 | 49,492,345 | (1,087,351 | ) | |||||||||||
| Equity Index |
267,780,063 | 143,783,652 | 146,605,895 | (2,822,243 | ) | |||||||||||
| Value Equity |
1,275,590,496 | 305,851,845 | 318,551,564 | (12,699,719 | ) | |||||||||||
| Growth Equity |
1,301,928,175 | 360,667,968 | 370,621,608 | (9,953,640 | ) | |||||||||||
| Small Cap Equity |
679,574,073 | 78,369,008 | 90,091,680 | (11,722,672 | ) | |||||||||||
| International Equity |
1,396,210,629 | 221,024,744 | 254,152,181 | (33,127,437 | ) | |||||||||||
| Emerging Markets Equity |
328,808,867 | 10,310,757 | 20,501,727 | (10,190,970 | ) | |||||||||||
| Inflation Protected Bond |
303,451,597 | 5,296,672 | 13,312,577 | (8,015,905 | ) | |||||||||||
| Flexible Income |
125,583,731 | 397,416 | 709,573 | (312,157 | ) | |||||||||||
| Real Assets |
50,264,951 | 1,564,864 | 1,564,864 | — | ||||||||||||
| Real Estate Securities |
284,381,136 | 12,593,598 | 15,588,399 | (2,994,801 | ) | |||||||||||
| Global Natural Resources |
367,911,781 | 20,685,414 | 30,969,529 | (10,284,115 | ) | |||||||||||
The differences between book basis and tax-basis unrealized appreciation (depreciation) is attributable primarily to the tax deferral of losses on wash sales and investments in PFIC’s.
266
Table of Contents
At December 31, 2013, capital contributions, accumulated undistributed net investment income and accumulated net realized gain (loss) from investments have been adjusted for current period permanent book/tax differences which arose principally from differing book/tax treatments of PFICs, paydown losses, net operating losses, swaps, foreign currency transactions, distributions received from regulated investment companies, defaulted bonds, reclassifications of dividends paid and non-deductible expenses. The following amounts were reclassified within the capital accounts:
| Fund |
Paid in Capital |
Undistributed Net Investment Income |
Accumulated Net Realized Gain (Loss) on Investments, Currency Translations and Derivative Transactions |
|||||||||
| MyDestination 2005 |
$ | — | $ | 675,232 | $ | (675,232 | ) | |||||
| MyDestination 2015 |
— | 5,343,266 | (5,343,266 | ) | ||||||||
| MyDestination 2025 |
— | 7,410,221 | (7,410,221 | ) | ||||||||
| MyDestination 2035 |
— | 3,276,328 | (3,276,328 | ) | ||||||||
| MyDestination 2045 |
— | 2,620,682 | (2,620,682 | ) | ||||||||
| MyDestination 2055 |
(364 | ) | 204,135 | (203,771 | ) | |||||||
| Conservative Allocation |
— | 1,853,778 | (1,853,778 | ) | ||||||||
| Balanced Allocation |
— | 11,269,401 | (11,269,401 | ) | ||||||||
| Growth Allocation |
— | 9,189,205 | (9,189,205 | ) | ||||||||
| Aggressive Allocation |
— | 10,702,757 | (10,702,757 | ) | ||||||||
| Conservative Allocation I |
— | 590,161 | (590,161 | ) | ||||||||
| Balanced Allocation I |
— | 4,488,148 | (4,488,148 | ) | ||||||||
| Growth Allocation I |
— | 3,990,638 | (3,990,638 | ) | ||||||||
| Aggressive Allocation I |
— | 3,766,916 | (3,766,916 | ) | ||||||||
| Low-Duration Bond |
— | (230,981 | ) | 230,981 | ||||||||
| Medium-Duration Bond |
— | 1,102,045 | (1,102,045 | ) | ||||||||
| Extended-Duration Bond |
— | 731,583 | (731,583 | ) | ||||||||
| Global Bond |
— | (2,278,226 | ) | 2,278,226 | ||||||||
| Defensive Market Strategies |
(252 | ) | 310,715 | (310,463 | ) | |||||||
| Equity Index |
— | 887 | (887 | ) | ||||||||
| Value Equity |
— | 2,105 | (2,105 | ) | ||||||||
| Growth Equity |
— | 2,467,471 | (2,467,471 | ) | ||||||||
| Small Cap Equity |
— | 746,938 | (746,938 | ) | ||||||||
| International Equity |
— | (3,189,961 | ) | 3,189,961 | ||||||||
| Emerging Markets Equity |
(254,800 | ) | (989,047 | ) | 1,243,847 | |||||||
| Inflation Protected Bond |
— | 4,093 | (4,093 | ) | ||||||||
| Flexible Income |
(1,000 | ) | 5,324 | (4,324 | ) | |||||||
| Real Assets |
(1,257 | ) | 151,335 | (150,078 | ) | |||||||
| Real Estate Securities |
— | 206,469 | (206,469 | ) | ||||||||
| Global Natural Resources Equity |
(1,000 | ) | 538,812 | (537,812 | ) | |||||||
Net investment income, net realized gain (loss) on investments and net assets were not affected by these reclassifications.
9. MARKET AND CREDIT RISK
In the normal course of business, the Funds trade financial instruments and enter into financial transactions where the risk of potential loss exists due to changes in the market (market risk) or due to the failure of the other party to a transaction to perform (credit and counterparty risks).
Market Risks — A Fund’s investments in derivatives and other financial instruments expose the Fund to various risks such as, but not limited to, interest rate, foreign currency, equity and commodity risks.
267
Table of Contents
Interest rate risk is the risk that fixed income securities will decline in value because of changes in interest rates. As nominal interest rates rise, the value of certain fixed income securities held by a Fund is likely to decrease. A nominal interest rate can be described as the sum of a real interest rate and an expected inflation rate. Fixed income securities with longer durations tend to be more sensitive to changes in interest rates, usually making them more volatile than securities with shorter durations. Duration is useful primarily as a measure of the sensitivity of a fixed income’s market price to interest rate (i.e. yield) movements.
If a Fund invests directly in foreign currencies or in securities that trade in, and receive revenues in, foreign currencies, or in derivatives that provide exposure to foreign currencies, it will be subject to the risk that those currencies will decline in value relative to the base currency of the Fund, or, in the case of hedging positions, that the Fund’s base currency will decline in value relative to the currency being hedged. Currency rates in foreign countries may fluctuate significantly over short periods of time for a number of reasons, including changes in interest rates, intervention (or the failure to intervene) by U.S. or foreign governments, central banks or supranational entities such as the International Monetary Fund, or by the imposition of currency controls or other political developments in the United States or abroad. As a result, a Fund’s investments in foreign currency denominated securities may reduce the returns of the Fund.
The market values of equities, such as common stocks and preferred stocks, or equity related investments such as futures and options, may decline due to general market conditions which are not specifically related to a particular company, such as real or perceived adverse economic conditions, changes in the general outlook for corporate earnings, changes in interest or currency rates or adverse investor sentiment. Market values may also decline due to factors which affect a particular industry or industries, such as labor shortages or increased production costs and competitive conditions within an industry. Equity securities and equity related investments generally have greater market price volatility than fixed income securities.
A Fund’s investments in commodity-linked derivative instruments may subject the Fund to greater market price volatility than investments in traditional securities. The value of commodity-linked derivative instruments may be affected by changes in overall market movements, commodity index volatility, changes in interest rates, or factors affecting a particular industry or commodity, such as drought, floods, weather, livestock disease, embargoes, tariffs and international economic, political and regulatory developments.
Credit and Counterparty Risks — A Fund will be exposed to credit risk on parties with whom it trades and will also bear the risk of settlement default. A Fund minimizes concentrations of credit risk by undertaking transactions with a large number of customers and counterparties on recognized and reputable exchanges. A Fund could lose money if the issuer or guarantor of a fixed income security, or the counterparty to a derivatives contract, repurchase agreement or a loan of portfolio securities, is unable or unwilling to make timely principal and/or interest payments, or to otherwise honor its obligations. Securities are subject to varying degrees of credit risk, which are often reflected in credit ratings.
Similar to credit risk, a Fund may be exposed to counterparty risk, or the risk that an institution or other entity with which the Fund has unsettled or open transactions will default. Financial assets, which potentially expose a Fund to counterparty risk, consist principally of cash due from counterparties and investments. The investment advisers minimize counterparty risks to the Funds by performing extensive reviews of each counterparty and obtaining approval from the Counterparty Risk Committee prior to entering into transactions with a third party. All transactions in listed securities are settled/paid for upon delivery using approved counterparties. The risk of default is considered minimal, as delivery of securities sold is only made once a Fund has received payment. Payment is made on a purchase once the securities have been delivered by the counterparty. The trade will fail if either party fails to meet its obligation.
268
Table of Contents
10. SUBSEQUENT EVENTS
Subsequent events have been evaluated through the date that the financial statements were available to be issued. All subsequent events determined to be relevant and material to the financial statements have been appropriately recorded or disclosed.
On July 23, 2014, the U.S. Securities and Exchange Commission adopted amendments to money market fund regulations, which structurally change the way that certain money market funds will be required to operate. These amendments are generally not effective until sometime in 2016, but when implemented will affect the Fund’s operations and may affect the Fund’s return potential.
269
Table of Contents
Information pertaining to the Trustees and officers of the Trust is set forth below. The statement of additional information (SAI) includes additional information about the Trustees and is available without charge, upon request, by calling 1-888-GS-FUNDS (1-888-473-8637).
| Name, (DOB), Address and Position(s) with Trust |
Term of Office |
Principal Occupation(s) During Past 5 Years |
Number of |
Other Trusteeships/ Directorships Held by Trusteee | ||||
| INDEPENDENT TRUSTEES | ||||||||
| Michael R. Buster (1957) 2401 Cedar Springs Road Dallas, TX 75201-1407 Trustee |
Since 2002 | Executive Pastor, Prestonwood Baptist Church, 1989 – present. | 31 | Ouachita Baptist University – Board of Trustees Member | ||||
| Paul H. Dixon, Ed.D. (1939) 2401 Cedar Springs Road Dallas, TX 75201-1407 Trustee |
Since 2014 | Chancellor, Cedarville University, 2003 – Present | 31 | Golden Gate Baptist Theological Seminary — Board of Trustees Member; Shepherds Ministries — Board of Directors Member | ||||
| Carson L. Eddy (1943) 2401 Cedar Springs Road Dallas, TX 75201-1407 Trustee |
Since 2011 | Partner in Charge (Orlando office), Carr, Riggs & Ingram, LLC, 2007 – 2014 – Certified Public Accountants; President, Quantum Consulting Group LLC, 2000 - 2013. | 31 | N/A | ||||
| William Craig George (1958) 2401 Cedar Springs Road Dallas, TX 75201-1407 Trustee |
Since 2004 | Chief Credit Officer, CapStone Bank, 2011 – present; Executive Vice President/ Regional Credit Officer, SunTrust Bank, 1995 – 2011. | 31 | N/A | ||||
| Grady R. Hazel (1947) 2401 Cedar Springs Road Dallas, TX 75201-1407 Trustee |
Since 2011 | G400 Field Representative, American Institute of Certified Public Accountants, 2012 – present; Executive Director, Society of Louisiana CPAs, 1995 – 2012. | 31 | Neighbors Federal Credit Union — Board of Directors Member and Chairman of Audit Committee; Stonetrust Commercial Insurance Company — Board of Directors Member and Member of Audit Committee | ||||
| Joseph A. Mack (1939) 2401 Cedar Springs Road Dallas, TX 75201-1407 Trustee |
Since 2002 | Retired — Director, Office of Public Policy, South Carolina Baptist Convention, 1999 – 2011. | 31 | N/A | ||||
| Franklin R. Morgan (1943) 2401 Cedar Springs Road Dallas, TX 75201-1407 Trustee |
Since 2005 | Retired — Senior Vice President, Director of International Administration, Prudential Securities, Inc., January 1962 – May 2003. | 31 | N/A | ||||
| Kyle Tucker (1981) 2401 Cedar Springs Road Dallas, TX 75201-1407 Trustee |
Since 2013 | Vice President and Financial Advisor – CAPTRUST Financial Advisors, 2006 – Present. | 31 | N/A | ||||
| INTERESTED TRUSTEES23 | ||||||||
| Thomas G. Evans (1961) 2401 Cedar Springs Road Dallas, TX 75201-1407 Trustee |
Since 2012 | Appraiser, Manager and Owner, Encompass Financial Services, Inc., 1985 – present, President and Owner, Custom Land Management, LLC, 1984 – present; Manager, Private Partners Opportunity Fund, LLC, 2011 – present. | 31 | GuideStone Financial Resources – Board of Trustees Member, June 2010 – present; Baptist Foundation of Oklahoma, Board of Directors Member and Chairman, 2004 – present; Pioneer Spirit Foundation – Board of Trustees Member, 1993 – present; GuideStone Capital Management, LLC, Board of Directors Member, July 2011 – July 2012 | ||||
| James W. Hixson (1931) 2401 Cedar Springs Road Dallas, TX 75201-1407 Trustee |
Since 2010 | Retired | 31 | GuideStone Financial Resources – Board of Trustees Member, June 2008 – present; GuideStone Advisors – Board of Directors Member, July 2008 – present; GuideStone Financial Services – Board of Directors Member, July 2008 – present | ||||
270
Table of Contents
FUND MANAGEMENT (Continued)
| Name, (DOB), Address and Position(s) with Trust |
Term of Office |
Principal Occupation(s) During Past 5 Years |
Number of |
Other Trusteeships/ Directorships Held by Trusteee | ||||
| OFFICERS WHO ARE NOT TRUSTEES4 | ||||||||
| Ron W. Bass (1966) 2401 Cedar Springs Road Dallas, TX 75201-1407 Chief Compliance Officer and AML Officer. |
Since 2009 | Director of Broker/Dealer and RIA Compliance, GuideStone Financial Resources, June 2009 – present; Manager of Broker/Dealer and RIA Compliance, GuideStone Financial Resources, 2008 – May 2009. | N/A | N/A | ||||
| Jeffrey P. Billinger (1946) 2401 Cedar Springs Road Dallas, TX 75201-1407 Vice President and Treasurer |
Since 2000 | Vice President, Treasurer and Chief Financial Officer, GuideStone Financial Resources, 1995 – present. | N/A | N/A | ||||
| Rodric E. Cummins (1957) 2401 Cedar Springs Road Dallas, TX 75201-1407 Vice President and Investment Officer |
Since 2000 | Vice President and Chief Investment Officer, GuideStone Financial Resources, 1998 – present. | N/A | N/A | ||||
| Ronald C. Dugan, Jr. (1962) 2401 Cedar Springs Road Dallas, TX 75201-1407 Vice President and Investment Officer |
Since 2010 | Vice President and Chief Strategic Investment Officer, GuideStone Financial Resources, 2013 – present; Director of Global Investment Strategies, GuideStone Financial Resources, 2010 – 2013; Managing Director, Equities, Russell Investments, 2000 – 2010. | N/A | N/A | ||||
| John R. Jones (1953) 2401 Cedar Springs Road Dallas, TX 75201-1407 President |
Since 2000 | Executive Vice President and Chief Operating Officer, GuideStone Financial Resources, 1997 – present. | N/A | N/A | ||||
| Cherika N. Latham(1982) 2401 Cedar Springs Road Dallas, TX 75201-1407 Chief Legal Officer and Secretary |
Since 2013 | Assistant Secretary, GuideStone Financial Resources, 2008 – present. | N/A | N/A | ||||
| 1 | Each Independent Trustee serves until his or her resignation, removal or mandatory retirement. Each Interested Trustee serves until his or her resignation, removal or mandatory retirement or until he or she ceases to be a member of the board of trustees of GuideStone Financial Resources. All Trustees must retire after reaching the age of seventy-seven years or after achieving ten years of service, whichever occurs last. Officers serve at the pleasure of the Board of Trustees. |
| 2 | The Trust pays no compensation to the Trustees. The Trust reimburses the Trustees for any expenses incurred in attending meetings. The Trust does not compensate the officers for the services they provide to the Funds. |
| 3 | Messrs. Evans and Hixson are “interested persons” of the Trust as the term is defined in the Investment Company Act of 1940, due to their positions on the Board of Trustees of GuideStone Financial Resources. |
| 4 | The officers of the Trust may be deemed to be affiliates of the Adviser due to their positions with the Adviser and/or GuideStone Financial Resources. |
271
Table of Contents
PROXY VOTING
A description of the policies and procedures that GuideStone Funds uses to determine how to vote proxies relating to their portfolio securities as well as information regarding how GuideStone Funds voted proxies during the most recent 12-month period ended June 30 is available without charge by calling 1-888-GS-FUNDS (1-888-473-8637), by visiting our website at www.GuideStoneFunds.com or by visiting the SEC’s website at www.sec.gov.
FORM N-MFP
Beginning December 2009, the GuideStone Money Market Fund began filing Form N-MFP with the SEC. Form N-MFP is filed on a monthly basis by money market mutual funds and includes detailed information about a money market fund’s investments and the market-based price of its portfolio known as its “shadow NAV” or mark-to-market valuation. The portfolio holdings information is posted on our website, www.GuideStoneFunds.com within five business days after the end of the month.
QUARTERLY SCHEDULES OF INVESTMENTS
In addition to the semi-annual and annual reports that GuideStone Funds delivers to shareholders and makes available through its website, GuideStone Funds files a complete schedule of portfolio holdings with the SEC for each Fund’s first and third fiscal quarters on Form N-Q. GuideStone Funds does not deliver the schedule for the first and third fiscal quarters to shareholders; however, the schedule is posted to our website, www.GuideStoneFunds.com. You may also obtain the Form N-Q filings by accessing the SEC’s website at www.sec.gov or copy them at the SEC’s Public Reference Room in Washington, DC. Information on the operation of the SEC’s Public Reference Room may be obtained by calling the SEC at (800) 732-0330. You can also request copies of this information, upon payment of a fee for duplication, at the SEC’s email address (publicinfo@sec.gov) or by writing the Public Reference section of the SEC, Washington, DC 20549-0102.
272
Table of Contents
BOARD REVIEW OF NEW SUB-ADVISORY AGREEMENTS FOR THE DEFENSIVE MARKET STRATEGIES FUND, SMALL CAP EQUITY FUND AND GLOBAL NATURAL RESOURCES EQUITY FUND
As required by the Investment Company Act of 1940, as amended (the “1940 Act”), the Board of Trustees (the “Board”) of GuideStone Funds (the “Trust”), including all of the Trustees who are not “interested persons” of the Trust, as that term is defined in the 1940 Act (the “Independent Trustees”), considered the approval of the following new sub-advisory agreements among: (i) Parametric Portfolio Associates LLC (“Parametric”), GuideStone Capital Management, LLC (the “Adviser”) and the Trust on behalf of the Defensive Market Strategies Fund; (ii) Snow Capital Management L.P. (“Snow”), the Adviser and the Trust on behalf of the Small Cap Equity Fund; and (iii) SailingStone Capital Partners LLC (“SailingStone”), the Adviser and the Trust on behalf of the Global Natural Resources Equity Fund.
The Board approved the new sub-advisory agreements with Parametric, Snow and SailingStone for a two-year term at an in-person meeting of the Board held on February 27-28, 2014 (collectively, the “New Sub-Advisory Agreements”).
The Board’s decision to approve each of the New Sub-Advisory Agreements reflects the exercise of its business judgment to enter into new sub-advisory arrangements. In approving the New Sub-Advisory Agreements, the Board considered information provided by the Adviser and each sub-adviser with the assistance and advice of counsel to the Independent Trustees and counsel to the Trust.
The Board’s consideration of various factors and its conclusions with respect to such factors formed the basis for the Board’s determination to approve the New Sub-Advisory Agreements for Parametric, Snow and SailingStone. The factors considered by the Board included, but were not limited to: (i) the resources of each sub-adviser; (ii) the experience and expertise of each sub-adviser; (iii) the financial capability of each sub-adviser; (iv) the compliance procedures and history of each sub-adviser; (v) the performance of similarly managed funds or portfolio accounts in comparison to relevant benchmarks for each applicable Fund; (vi) the costs of the services to be provided by each sub-adviser; (vii) the amount of the contractual sub-advisory fee in comparison to similarly managed funds and any available information for each sub-adviser’s other similarly situated clients and the effect of any fee waiver and expense reimbursement arrangements; (viii) the total expenses of each applicable Fund in comparison to similarly managed funds and the use of any anticipated expense caps; (ix) to the extent available, the anticipated profitability of each sub-adviser with respect to each applicable Fund and their overall business; (x) the extent of any economies of scale and whether the fee structure reflects such economies of scale through breakpoints; (xi) the existence of any collateral benefits to be realized by each sub-adviser; and (xii) the existence of any collateral benefits to be realized by each applicable Fund resulting from a relationship with each sub-adviser. The Board also evaluated whether the approval of the New Sub-Advisory Agreements was in the best interest of each applicable Fund and its shareholders. No one factor was determinative in the Board’s consideration of the New Sub-Advisory Agreements, and each Board member may have attributed different weights to the factors considered.
The Board noted that the reason it was being asked to approve a new sub-advisory agreement with SailingStone was because the Global Natural Resources (“GNR”) Team at RS Investments Management Co. LLC (“RS Investments”) was leaving the firm to form SailingStone, a boutique registered investment advisor focused on investing in GNR equity assets. The Board noted that SailingStone was expected to acquire the existing RS Investments book of GNR business. The Board further noted that there are no anticipated changes to the GNR Strategy, investment philosophy, portfolio management team and negotiated fee structure for the Global Natural Resources Equity Fund.
The Board undertook a review of the terms of the New Sub-Advisory Agreements, and the nature, extent and quality of the services to be provided by each sub-adviser. The Adviser provided the Board with information in the form of reports about each sub-adviser prior to the meeting, which addressed the factors listed previously. The Adviser also provided additional information about each sub-adviser in a presentation made during the meeting, discussed the comprehensive screening process used to recommend each sub-adviser and responded to questions from the Board.
The Independent Trustees met separately in executive session with counsel to the Independent Trustees to discuss and consider the information presented in connection with the approval of the New Sub-Advisory Agreements, including the Board’s responsibilities and duties in approving the agreements.
273
Table of Contents
BOARD APPROVAL OF NEW SUB-ADVISORY AGREEMENTS FOR THE DEFENSIVE MARKET STRATEGIES FUND, SMALL CAP EQUITY FUND AND GLOBAL NATURAL RESOURCES EQUITY FUND
In considering the approval of the New Sub-Advisory Agreements for the Defensive Market Strategies Fund, Small Cap Equity Fund and Global Natural Resources Equity Fund, the Board took into account the materials provided prior to the meeting, including the materials that the Board had considered at its February 27-28, 2014 meeting, the presentations made during the meeting and the extensive discussions during the meeting, including the discussions the Independent Trustees had during their executive session with independent legal counsel. The Board also took into account the Investment Management Committee’s (the “Committee”) review of information related to each new sub-advisory arrangement, questions submitted by the Committee to Trust management regarding those sub-advisers, Trust management’s responses to those questions and recommendations made by the Committee. The Board considered its responsibilities with respect to reviewing and approving the terms of the New Sub-Advisory Agreements, the investment management teams at each sub-adviser, the reasonableness of the sub-advisory fees, and whether the appointment of each sub-adviser would be in the best interests of the shareholders of each applicable Fund. The Board reviewed the above factors in evaluating whether to approve the New Sub-Advisory Agreements and the materials provided to support each factor.
The Board considered the reputation, compliance history, compliance program and financial condition of Parametric, Snow and SailingStone. The Board also considered the experience of key personnel at each sub-adviser in providing investment management services to each applicable Fund; the systems and resources used by such persons to implement and manage each applicable strategy; and the ability of each sub-adviser to attract and retain capable personnel. The Board also noted the terms of the New Sub-Advisory Agreements and the responsibilities that each sub-adviser has to each applicable Fund, including the responsibility of day-to-day management and compliance with each Fund’s investment objectives and policies. The Board concluded that the Defensive Market Strategies Fund, Small Cap Equity Fund and Global Natural Resources Equity Fund were likely to benefit from the nature, extent and quality of the services with respect to each applicable sub-adviser’s experience, personnel, operations and resources.
With respect to the Defensive Market Strategies Fund, the Board examined the nature, extent and quality of the services to be provided by Parametric. The Board reviewed and discussed the performance results of the Defensive Equity Strategy and the favorable back-tested performance results of the custom strategy being proposed for the Defensive Market Strategies Fund. The Board noted that the back-tested strategy’s performance would have outperformed its benchmark (net of fees) for the one-, three-, five- and seven-year and since inception periods ended December 31, 2013. The Board noted that the strategy would add an options strategy to the Defensive Market Strategies Fund, thereby providing diversification, increased upside potential, increased income and reduced fees to the Fund’s overall sub-adviser composite. The Board also noted that Parametric’s fee schedule includes breakpoints at future specified asset levels. The Board further noted that the Adviser had been able to negotiate fees that were favorable in comparison to Parametric’s standard fee schedule.
With respect to the Small Cap Equity Fund, the Board examined the nature, extent and quality of the services to be provided by Snow. The Board noted the strategy’s favorable performance history, outpacing its benchmark in six out of the previous seven calendar years. The Board noted that the strategy would provide diversification benefits to the Fund’s overall sub-adviser composite since the strategy had high active risk and a low correlation of excess returns to the other strategies within the Small Cap Equity Fund. The Board also noted that Snow’s fee schedule includes breakpoints at future specified asset levels. The Board further noted that the Adviser had been able to negotiate fees that were favorable in comparison to Snow’s standard fee schedule.
With respect to the Global Natural Resources Equity Fund, the Board examined the nature, extent and quality of the services currently being provided by RS Investments and to be provided by SailingStone. The Board noted the experience of the GNR Team at RS Investments in providing investment management services to the Fund and the transition of those services to SailingStone. The Board noted the expected ability of SailingStone to attract and retain capable personnel, the reputation of the personnel forming SailingStone and the projected financial condition of SailingStone. The Board also noted that there are no anticipated changes to the investment strategy or portfolio management team relative to that which RS Investments has been providing to the Global Natural Resources Equity Fund. The Board further noted that the existing fee schedule with RS Investments would apply to the SailingStone relationship.
274
Table of Contents
The Board considered the Adviser’s assessment of each sub-adviser’s current/projected financial condition, as applicable. The Board noted that the Adviser, after its due diligence, felt comfortable with each sub-adviser’s financial condition.
Based on all the information presented to the Board and its consideration of relevant factors, the Board, in the exercise of its reasonable business judgment, concluded that the Defensive Market Strategies Fund, Small Cap Equity Fund and Defensive Market Strategies Fund were likely to benefit from the nature, extent and quality of each applicable sub-adviser’s services, and the Board determined to approve each of the New Sub-Advisory Agreements. The Board also determined that the approval of each of the New Sub-Advisory Agreements was in the best interests of each applicable Fund and its shareholders.
275
Table of Contents
INVESTMENT SUB-ADVISERS (Assets under management as of June 30, 2014) (Unaudited)
GuideStone Funds employs a broad array of proven investment managers for the benefit of their investors. Each manager is distinctive in its investment management process and business approach.
| Fund |
Sub-Adviser |
Firm Established |
Total
Assets Managed |
|||||||
| Money Market |
BlackRock Advisors, LLC | 1994 | $ | 4.6Tr | ||||||
| Low-Duration Bond |
BlackRock Financial Management, Inc. | 1988 | $ | 4.6Tr | ||||||
| Pacific Investment Management Company LLC (PIMCO) | 1971 | $ | 2.0Tr | |||||||
| Payden & Rygel | 1983 | $ | 83.7B | |||||||
| Medium-Duration Bond |
Goldman Sachs Asset Management, L.P. | 1984 | $ | 992.3B | ||||||
| Pacific Investment Management Company LLC (PIMCO) | 1971 | $ | 2.0Tr | |||||||
| Western Asset Management Company | 1971 | $ | 468.9B | |||||||
| Extended-Duration Bond |
Loomis, Sayles & Company, L.P. | 1926 | $ | 221.3B | ||||||
| Schroder Investment Management North America Inc. | 1804 | $ | 464.1B | |||||||
| Global Bond |
Loomis, Sayles & Company, L.P. | 1926 | $ | 221.3B | ||||||
| Western Asset Management Company | 1971 | $ | 468.9B | |||||||
| Defensive Market Strategies |
American Century Investment Management, Inc. | 1958 | $ | 145.0B | ||||||
| AQR Capital Management, LLC | 1998 | $ | 113.3B | |||||||
| Parametric Portfolio Associates LLC | 1992 | $ | 130.5B | |||||||
| Shenkman Capital Management, Inc. | 1985 | $ | 26.4B | |||||||
| Equity Index |
Northern Trust Investments, Inc. | 1889 | $ | 924.4B | ||||||
| Value Equity |
AJO, LP | 1984 | $ | 24.9B | ||||||
| Barrow, Hanley, Mewhinney & Straus, LLC | 1979 | $ | 97.5B | |||||||
| Northern Trust Investments, Inc. | 1889 | $ | 924.4B | |||||||
| TCW Investment Management Company | 1971 | $ | 141.6B | |||||||
| Growth Equity |
Brown Advisory, LLC | 1993 | $ | 45.2B | ||||||
| Columbus Circle Investors | 1975 | $ | 17.3B | |||||||
| Marsico Capital Management, LLC | 1997 | $ | 16.8B | |||||||
| Rainier Investment Management, Inc.® | 1991 | $ | 7.1B | |||||||
| Sands Capital Management, LLC | 1992 | $ | 44.6B | |||||||
| Small Cap Equity |
AJO, LP | 1984 | $ | 24.9B | ||||||
| Columbus Circle Investors | 1975 | $ | 17.3B | |||||||
| RBC Global Asset Management (U.S.) Inc. | 1983 | $ | 45.3B | |||||||
| Snow Capital Management L.P. | 1980 | $ | 3.6B | |||||||
| TimesSquare Capital Management, LLC | 2000 | $ | 19.3B | |||||||
| International Equity |
AQR Capital Management, LLC | 1998 | $ | 113.3B | ||||||
| Baillie Gifford Overseas Limited | 1983 | $ | 185.0B | |||||||
| Barrow, Hanley, Mewhinney & Strauss | 1979 | $ | 97.5B | |||||||
| MFS Institutional Advisors, Inc. | 1970 | $ | 438.5B | |||||||
| Mondrian Investment Partners Ltd. | 1990 | $ | 73.6B | |||||||
| Philadelphia International Advisors, L.P. | 1956 | $ | 2.3B | |||||||
| Emerging Markets Equity |
AQR Capital Management, LLC | 1998 | $ | 113.3B | ||||||
| Genesis Asset Managers, LLP and | 1989 | $ | 39.5B | |||||||
| Genesis Investment Management, LLP | ||||||||||
| Inflation Protected Bond |
BlackRock Financial Management, Inc. | 1988 | $ | 4.6Tr | ||||||
| Flexible Income |
Shenkman Capital Management, Inc. | 1985 | $ | 26.4B | ||||||
| Real Estate Securities |
Heitman Real Estate Securities, LLC | 1989 | $ | 30.8B | ||||||
| RREEF America L.L.C. | 1975 | $ | 48.2B | |||||||
| Global Natural Resources Equity |
SailingStone Capital Partners LLC | 2014 | $ | 8.5B | ||||||
| Van Eck Associates Corporation | 1955 | $ | 35.2B | |||||||
| Custodian for GuideStone Funds Assets |
The Northern Trust Company | 1889 | $ | 6.0Tr | ||||||
| Cash Overlay for Date Target, Asset Allocation, Fixed Income, Equity and Real Return Funds |
Parametric Portfolio Associates LLC | 1992 | $ | 130.5B | ||||||
276
Table of Contents

|
2401 Cedar Springs Road, Dallas, TX 75201-1498 1-888-GS-FUNDS • www.GuideStoneFunds.com | |
| Funds distributed by Foreside Funds Distributors LLC 400 Berwyn Park, 899 Cassatt Road, Suite 110, Berwyn, PA 19312 |
Table of Contents
| Item 2. | Code of Ethics. |
Not applicable.
| Item 3. | Audit Committee Financial Expert. |
Not applicable.
| Item 4. | Principal Accountant Fees and Services. |
Not applicable.
| Item 5. | Audit Committee of Listed Registrants. |
Not applicable.
| Item 6. | Investments. |
| (a) | Schedule of Investments in securities of unaffiliated issuers as of the close of the reporting period is included as part of the report to shareholders filed under Item 1 of this form. |
| (b) | Not applicable. |
| Item 7. | Disclosure of Proxy Voting Policies and Procedures for Closed-End Management Investment Companies. |
Not applicable.
| Item 8. | Portfolio Managers of Closed-End Management Investment Companies. |
Not applicable.
| Item 9. | Purchases of Equity Securities by Closed-End Management Investment Company and Affiliated Purchasers. |
Not applicable.
Table of Contents
| Item 10. | Submission of Matters to a Vote of Security Holders. |
There have been no material changes to the procedures by which the shareholders may recommend nominees to the registrant’s board of directors, where those changes were implemented after the registrant last provided disclosure in response to the requirements of Item 407(c)(2)(iv) of Regulation S-K (17 CFR 229.407) (as required by Item 22(b)(15) of Schedule 14A (17 CFR 240.14a-101)), or this Item.
| Item 11. | Controls and Procedures. |
| (a) | The registrant’s principal executive and principal financial officers, or persons performing similar functions, have concluded that the registrant’s disclosure controls and procedures (as defined in Rule 30a-3(c) under the Investment Company Act of 1940, as amended (the “1940 Act”) (17 CFR 270.30a-3(c))) are effective, as of a date within 90 days of the filing date of the report that includes the disclosure required by this paragraph, based on their evaluation of these controls and procedures required by Rule 30a-3(b) under the 1940 Act (17 CFR 270.30a-3(b)) and Rules 13a-15(b) or 15d-15(b) under the Securities Exchange Act of 1934, as amended (17 CFR 240.13a-15(b) or 240.15d-15(b)). |
| (b) | There were no changes in the registrant’s internal control over financial reporting (as defined in Rule 30a-3(d) under the 1940 Act (17 CFR 270.30a-3(d)) that occurred during the registrant’s second fiscal quarter of the period covered by this report that has materially affected, or is reasonably likely to materially affect, the registrant’s internal control over financial reporting. |
| Item 12. | Exhibits. |
| (a)(1) | Not applicable. |
| (a)(2) | Certifications pursuant to Rule 30a-2(a) under the 1940 Act and Section 302 of the Sarbanes-Oxley Act of 2002 are attached hereto. |
| (a)(3) | Not applicable. |
| (b) | Certifications pursuant to Rule 30a-2(b) under the 1940 Act and Section 906 of the Sarbanes-Oxley Act of 2002 are attached hereto. |
Table of Contents
SIGNATURES
Pursuant to the requirements of the Securities Exchange Act of 1934 and the Investment Company Act of 1940, the registrant has duly caused this report to be signed on its behalf by the undersigned, thereunto duly authorized.
| (Registrant) | GuideStone Funds | |
| By (Signature and Title)* | /s/ John R. Jones | |
| John R. Jones, President (principal executive officer) | ||
| Date | 09/03/14 | |
Pursuant to the requirements of the Securities Exchange Act of 1934 and the Investment Company Act of 1940, this report has been signed below by the following persons on behalf of the registrant and in the capacities and on the dates indicated.
| By (Signature and Title)* | /s/ John R. Jones | |
| John R. Jones, President (principal executive officer) | ||
| Date | 09/03/14 | |
| By (Signature and Title)* | /s/ Jeffrey P. Billinger | |
| Jeffrey P. Billinger, Vice President and Treasurer (principal financial officer) | ||
| Date | 09/03/14 | |
| * | Print the name and title of each signing officer under his or her signature. |