UNITED STATES
SECURITIES AND EXCHANGE COMMISSION
Washington, D.C. 20549
FORM
ANNUAL REPORT PURSUANT TO SECTION 13 OR 15(d) OF THE SECURITIES EXCHANGE ACT OF 1934 |
For the fiscal year ended
TRANSITION REPORT PURSUANT TO SECTION 13 OR 15(d) OF THE SECURITIES EXCHANGE ACT OF 1934 |
Commission file number:
(Exact name of registrant as specified in its charter)
(State of incorporation) | (I.R.S. Employer Identification No.) |
(Address of principal executive offices) | (Zip Code) |
(
Registrant’s telephone number, including area code
Securities registered pursuant to Section 12(b) of the Act:
Title of each class | Trading Symbol | Name of each exchange on which registered |
Securities registered pursuant to Section 12(g) of the Act: None
Indicate by check mark if the registrant is a well-known seasoned issuer, as defined in Rule 405 of the Securities Act. ☐ Yes ☒
Indicate by check mark if the registrant is not required to file reports pursuant to Section 13 or Section 15(d) of the Act. ☐ Yes ☒
Indicate by check mark whether the registrant (1) has filed all reports required to be filed by Section 13 or 15(d) of the Securities Exchange Act of 1934 during the preceding 12 months (or for such shorter period that the registrant was required to file such reports), and (2) has been subject to such filing requirements for the past 90 days.
☒
Indicate by check mark whether the registrant has submitted electronically every Interactive Data File required to be submitted pursuant to Rule 405 of Regulation S-T during the preceding 12 months (or for such shorter period that the registrant was required to submit such files).
☒
Indicate by check mark whether the registrant is a large accelerated filer, an accelerated filer, a non-accelerated filer, a smaller reporting company, or an emerging growth company. See the definitions of “large accelerated filer,” “accelerated filer”, “smaller reporting company” and “emerging growth company” in Rule 12b-2 of the Exchange Act. (Check one):
Large accelerated filer ☐ | |||
Non-accelerated filer ☐ | Smaller reporting company | ||
Emerging growth company | |||
If an emerging growth company, indicate by check mark if the registrant has elected not to use the extended transition period for complying with any new or revised financial accounting standards pursuant to Section 13(a) of the Exchange Act. ☐
Indicate by check mark whether the registrant is a shell company (as defined in Rule 12b-2 of the Act).
Indicate by check mark whether the registrant has filed a report on and attestation to its management’s assessment of the effectiveness of its internal control over financial reporting under Section 404(b) of the Sarbanes-Oxley Act (15 U.S.C. 7262(b)) by the registered public accounting firm that prepared or issued its audit report.
As of June 30, 2020, the last business day of the registrant’s most recently completed second fiscal quarter, the aggregate market value of the voting stock held by non-affiliates of the registrant was approximately $
The number of shares of common stock of the registrant outstanding as of March 1, 2021 was
Documents Incorporated by Reference: Portions of the definitive proxy statement for the 2020 Annual Meeting of Shareholders to be filed with the Securities and Exchange Commission pursuant to SEC Regulation 14A are incorporated by reference in Part III, Items 10-14.
TABLE OF CONTENTS
PART I
ITEM 1. BUSINESS
General
The Company
Sierra Bancorp (the “Company”) is a California corporation headquartered in Porterville, California, and is a registered bank holding company under federal banking laws. The Company was formed to serve as the holding company for Bank of the Sierra (the “Bank”), and has been the Bank’s sole shareholder since August 2001. The Company exists primarily for the purpose of holding the stock of the Bank and of such other subsidiaries it may acquire or establish. As of December 31, 2020, the Company’s only other subsidiaries were Sierra Statutory Trust II, Sierra Capital Trust III, and Coast Bancorp Statutory Trust II, which were formed solely to facilitate the issuance of capital trust pass-through securities (“TRUPS”). Pursuant to the Financial Accounting Standards Board (“FASB”) standard on the consolidation of variable interest entities, these trusts are not reflected on a consolidated basis in the financial statements of the Company. References herein to the “Company” include Sierra Bancorp and its consolidated subsidiary, the Bank, unless the context indicates otherwise. At December 31, 2020, the Company had consolidated assets of $3.2 billion (including gross loans of $2.5 billion), liabilities totaling $2.9 billion (including deposits of $2.6 billion), and shareholders’ equity of $343.9 million. The Company’s liabilities include $35.1 million in debt obligations due to its trust subsidiaries, related to TRUPS issued by those entities.
The Bank
Bank of the Sierra, a California state-chartered bank headquartered in Porterville, California, offers a wide range of retail and commercial banking services via branch offices located throughout California’s South San Joaquin Valley, the Central Coast, Ventura County, and neighboring communities. The Bank was incorporated in September 1977, and opened for business in January 1978 as a one-branch bank with $1.5 million in capital. Our growth in the ensuing years has largely been organic in nature but includes four whole-bank acquisitions: Sierra National Bank in 2000, Santa Clara Valley Bank in 2014, Coast National Bank in 2016, and Ojai Community Bank in October 2017. See the Recent Developments section below for details on our latest acquisitions.
Our recent business activity included the establishment of a Sacramento-area (Rocklin, CA) loan production office in 2020, the Fresno-Palm branch and the purchase of the Lompoc branch in 2018, and opening de novo branches in Bakersfield and Pismo Beach and the acquisition of the Woodlake branch in 2017. With our latest acquisitions and branching activity, the Bank now maintains administrative offices, a loan production office, and operates 40 full-service branches in the following California locations:
Porterville: | Administrative Headquarters | Main Office | West Olive Branch |
Arroyo Grande: | Arroyo Grande Office | ||
Atascadero: | Atascadero Office | ||
Bakersfield: | Bakersfield California Office | Bakersfield Riverlakes Office | Bakersfield Ming Office |
Bakersfield East Hills Office |
1
California City: | California City Office | ||
Clovis: | Clovis Office | ||
Delano: | Delano Office | ||
Dinuba: | Dinuba Office | ||
Exeter: | Exeter Office | ||
Farmersville: | Farmersville Office | ||
Fillmore: | Fillmore Office | ||
Fresno: | Fresno Palm Office | Fresno Shaw Office | Fresno Sunnyside Office |
Hanford: | Hanford Office | ||
Lindsay: | Lindsay Office | ||
Lompoc: | Lompoc Office | ||
Ojai: | Ojai Office | ||
Paso Robles: | Paso Robles Office | ||
Pismo Beach: | Pismo Beach Office | ||
Rocklin: | Loan Production Office | ||
Reedley: | Reedley Office | ||
San Luis Obispo: | San Luis Obispo Office | ||
Sanger: | Sanger Office | ||
Santa Barbara: | Santa Barbara Office |
2
Santa Clarita: | Santa Clarita Office | ||
Santa Paula: | Santa Paula Office | ||
Selma: | Selma Office | ||
Tehachapi: | Tehachapi Downtown Office | Tehachapi Old Town Office | |
Three Rivers: | Three Rivers Office | ||
Tulare: | Tulare Office | Tulare Prosperity Office | |
Ventura: | Ventura Office | ||
Visalia: | Visalia Mooney Office | Visalia Downtown Office | |
Woodlake: | Woodlake Office |
Complementing the Bank’s stand-alone offices are specialized lending units which include our Agricultural, SBA and Mortgage Warehouse lending divisions. We also have ATMs at all but one of our branch locations and seven non-branch locations. Furthermore, the Bank is a member of the Allpoint network, which provides our deposit customers with surcharge-free access to over 55,000 ATMs across the United States, Puerto Rico, Mexico, Canada, Australia and the United Kingdom, and customers have access to electronic point-of-sale payment alternatives nationwide via the Pulse network. To ensure that account access preferences are addressed for all customers, we provide the following options: an internet branch which provides the ability to open deposit accounts online; an online banking option with bill-pay and mobile banking capabilities, including mobile check deposit; online lending solutions for consumers and small businesses; a customer service center that is accessible by toll-free telephone during business hours; and an automated telephone banking system that is generally accessible 24 hours a day, seven days a week. We offer a variety of other banking products and services to complement and support our lending and deposit products, including remote deposit capture and payroll services for business customers.
Our chief products and services relate to extending loans and accepting deposits. Our lending activities cover real estate, commercial (including small business), mortgage warehouse, agricultural, and consumer loans. The bulk of our real estate loans are secured by commercial, professional office and agricultural properties, but we also offer commercial construction loans and multifamily credit facilities among other types of loans. As noted above, gross loans totaled $2.5 billion at December 31, 2020, and the percentage of our total loan and lease portfolio for each of the principal types of credit we extend was as follows: (i) loans secured by real estate (77.0%); (ii) agricultural production loans (1.8%); (iii) commercial and industrial loans and leases, including SBA loans and Paycheck Protection Program (PPP) loans (8.5%); (iv) mortgage warehouse loans (12.5%); and (v) consumer loans (0.2%). Interest, fees, and other income on real-estate secured loans, which is by far the largest segment of our portfolio, totaled $79.2 million, or 60% of net interest plus other income in 2020, and $79.8 million, or 66% of net interest plus other income in 2019.
In addition to loans, we offer a wide range of deposit products and services for individuals and businesses including checking accounts, savings accounts, money market demand accounts, time deposits, retirement accounts, and sweep accounts. The Bank’s deposit accounts are insured by the Federal Deposit Insurance Corporation (the “FDIC”) up to
3
maximum insurable amounts. We attract deposits throughout our market area via referrals from other customers, direct-mail campaigns, a customer-oriented product mix, and competitive pricing, and by offering convenient locations, drive-through banking, and various other delivery channels. We strive to retain our deposit customers by providing a consistently high level of service. At December 31, 2020, the consolidated Company had 123,200 deposit accounts totaling $2.6 billion, compared to 125,100 deposit accounts totaling $2.2 billion at December 31, 2019.
We have not engaged in any material research activities related to the development of new products or services during the last two fiscal years. However, our officers and employees are continually searching for ways to increase public convenience, enhance customer access to payment systems, and enable us to improve our competitive position. The cost to the Bank for these development, operations, and marketing activities cannot be calculated with any degree of certainty. We hold no patents or licenses (other than licenses required by bank regulatory agencies), franchises, or concessions. Our business has a modest seasonal component due to the heavy agricultural orientation of the Central Valley, but as our branch network has expanded to include more metropolitan areas, we have become less reliant on the agriculture-related base. We are not dependent on a single customer or group of related customers for a material portion of our core deposits, but our time deposit balances at December 31, 2020 include $120 million in deposits from the State of California, comprising less than 5% of total deposits. Furthermore, loan categories that could be considered to be concentrations include loans to lessors of non-residential buildings (32% of total loans); loans to facilitate real estate credit, including mortgage warehouse lending (13% of total loans); and loans in the hotel industry (9% of total loans).
Our efforts to comply with government and regulatory mandates on consumer protection and privacy, anti-terrorism, and other initiatives have resulted in significant ongoing expense to the Bank, including compliance staffing costs and other expenses associated with compliance-related software. However, as far as can be determined there has been no material effect upon our capital expenditures, earnings, or competitive position as a result of environmental regulation at the federal, state, or local level. The Company is not involved with chemicals or toxins that might have an adverse effect on the environment, thus its primary exposure to environmental legislation is through lending activities. The Company’s lending procedures include steps to identify and monitor this exposure in an effort to avoid any related loss or liability.
Recent Developments
On February 1, 2020, the Company added two new loan production teams – one in Northern California and the second one in Southern California. The Northern team is based in a newly-opened dedicated loan production office in Rocklin, located in the County of Sacramento. The Southern team is based out of our Santa Clarita Bank branch office located in Los Angeles County. These two new business development groups created an expansion of the Bank’s footprint throughout Northern and Southern California, offering business loan services not covered by a branch.
On May 18, 2018, the Company purchased most of the deposits of the Lompoc branch of Community Bank of Santa Maria, located in Santa Barbara County. The purchase also included the Lompoc branch building, the real property on which the building is located, and certain other equipment and fixed assets at their aggregate fair value of $1.7 million. The Lompoc branch is now operating as a full-service branch of Bank of the Sierra. Lompoc branch deposits totaled $38 million at the time of purchase, consisting of $32 million in non-maturity deposits and $6 million in time deposits. In accordance with GAAP, the Company recorded a $1.2 million deposit purchase premium in connection with the transaction and is amortizing that amount on a straight line basis over eight years.
Recent Accounting Pronouncements
Information on recent accounting pronouncements is contained in Note 2 to the consolidated financial statements.
Competition
The banking business in California is generally highly competitive, including in our market areas. Continued consolidation within the banking industry has heightened competition in recent periods, following on the heels of a relatively large number of FDIC-assisted takeovers of failed banks and other acquisitions of troubled financial institutions in the aftermath
4
of the Great Recession. There are also a number of unregulated companies competing for business in our markets, with financial products targeted at profitable customer segments. Many of those companies are able to compete across geographic boundaries and provide meaningful alternatives to banking products and services. These competitive trends are likely to continue.
With respect to commercial bank competitors, our business is dominated by a relatively small number of major banks that operate a large number of offices within our geographic footprint. Based on June 30, 2020 FDIC combined market share data for the 31 cities within which the Company currently maintains branches, the largest portion of deposits belongs to Wells Fargo Bank with 22.2% of total combined deposits, followed by Bank of America (16.9%), JPMorgan Chase (11.8%), and Union Bank (7.8%). Bank of the Sierra ranks sixth on the 2020 market share list with 4.6% of total deposits.
In Tulare County, however, where the Bank was originally formed, we rank first for deposit market share with 19.8% of total deposits at June 30, 2020 and had the largest number of branch locations (13, including our online branch). The larger banks noted above have, among other advantages, the ability to finance wide-ranging advertising campaigns and allocate their resources to regions of highest yield and demand. They can also offer certain services that we do not provide directly but may offer indirectly through correspondent institutions, and by virtue of their greater capitalization those banks have legal lending limits that are substantially higher than ours. For loan customers whose needs exceed our legal lending limits, we may arrange for the sale, or participation, of some of the balances to financial institutions that are not within our geographic footprint.
In addition to other banks our competitors include savings institutions, credit unions, and numerous non-banking institutions such as finance companies, leasing companies, insurance companies, brokerage firms, asset management groups, mortgage banking firms and internet companies. Innovative technologies have lowered traditional barriers of entry and enabled many of these companies to offer services that were previously considered traditional banking products, and we have witnessed increased competition from companies that circumvent the banking system by facilitating payments via the internet, mobile devices, prepaid cards, and other means.
Strong competition for deposits and loans among financial institutions and non-banks alike affects interest rates and terms on which financial products are offered to customers. Mergers between financial institutions have created additional pressures within the financial services industry to streamline operations, reduce expenses, and increase revenues in order to remain competitive. Competition is also impacted by federal and state interstate banking laws which permit banking organizations to expand into other states. The relatively large California market has been particularly attractive to out-of-state institutions.
For years we have countered rising competition by offering a broad array of products with flexibility in structure and terms that cannot always be matched by our competitors. We also offer our customers community-oriented, personalized service, and rely on local promotional activity and personal contact by our employees. As noted above, layered onto our traditional personal-contact banking philosophy are technology-driven initiatives that improve customer access and convenience.
Human Capital
As of December 31, 2020 the Company had 446 full-time and 66 part-time employees. On a full-time equivalent (“FTE”) basis staffing stood at 501 at December 31, 2020, down from 513 FTE employees at December 31, 2019.
5
At December 31, 2020, the population of our workforce was as follows:
Gender | % of Total | |
Women | 75% | |
Men | 25% | |
Ethnicity | % of Total | |
Asian | 3% | |
Black or African American | 1% | |
Hispanic or Latino | 45% | |
Native Hawaiian or Other Pacific Islander | 1% | |
Two or more races | 5% | |
White | 45% |
The Company recognizes that a diverse workforce brings fresh perspectives that can help strengthen and improve how we serve our communities.
In response to the COVID-19 pandemic the Company established remote work arrangements with staff in an effort to consider the health and safety of its employees. At December 31, 2020, the Company had 120 employees working remotely. The Company is monitoring the current environment surrounding the pandemic and is evaluating all remote work arrangements. It is anticipated that certain positions may continue with a remote work arrangement once the pandemic is over due to efficiencies gained from such arrangements. There were no known adverse effects on financial reporting systems, internal controls over financial reporting and disclosure control and procedures from the remote work arrangements.
No employees were terminated or suspended due to the COVID-19 pandemic, although certain branch positions that became vacant because of attrition were not immediately replaced due to temporary lobby closures and limited lobby hours. It is anticipated that approximately 20 staff vacancies will be filled after branches return to normal lobby hours sometime in March of 2021, although the exact timing of such cannot be currently determined with any degree of certainty.
The Company has long been committed to comprehensive and competitive compensation and benefits programs as the Company recognizes that it operates in intensely competitive environments for talent. Retention of skilled and highly trained employees is critical to the Company’s strategy of being a trusted resource to its communities and strengthening relationships with its clients through employees. Community banking is often considered a relationship banking model rather than a purely transactional banking model. The Company’s employees are critical to the Company’s ability to develop and grow relationships with its clients. Recruiting talent within the Company’s footprint has always been a fundamental strategy whenever possible and is facilitated by actively participating in and holding community job fairs. Furthering the Company’s philosophy to attract and retain a pool of talented and motivated employees who will continue to advance the purpose and contribute to the Company’s overall success, compensation and benefits programs include: equity based compensation plan, health/dental/vision insurances, supplemental insurance, life insurance, 401(K) plan, benefits under the Family Medical Leave Act, workers’ compensation, paid vacation and sick days, holiday pay, training/education, leave for bereavement, military service and jury duty.
The Company invests in its employees’ future by sponsoring and prioritizing continued education throughout its employee ranks. The Company encourages its employees to participate in educational activities, which improve or maintain their skills in their current position, as well as to enhance future opportunities at the Company. The Company's employees are notified periodically of available internal course offerings and educational seminars run by outside parties, including but not limited to the American Bankers Association and Bankers Compliance Group. Employees are also encouraged to continue their higher education at accredited colleges and universities and may receive assistance from the Company for their participation.
In order to develop a workforce that aligns with the Company’s corporate values, it regularly sponsors local community events so that its employees can better integrate themselves in communities. The Company believes that employees’ well-
6
being and personal and professional development is fostered by outreach to the communities it serves. The Company’s employees’ desire for active community involvement enables the Company to sponsor a number of local community events and initiatives, including food drives that resulted in 20,000 pounds of food and resources for local food pantries during the COVID-19 pandemic.
Regulation and Supervision
Banks and bank holding companies are heavily regulated by federal and state laws and regulations. Most banking regulations are intended primarily for the protection of depositors and the deposit insurance fund and not for the benefit of shareholders. The following is a summary of certain statutes, regulations and regulatory guidance affecting the Company and the Bank. This summary is not intended to be a complete explanation of such statutes, regulations and guidance, all of which are subject to change in the future, nor does it fully address their effects and potential effects on the Company and the Bank.
Regulation of the Company Generally
The Company is a legal entity separate and distinct from the Bank and its other subsidiaries. As a bank holding company, the Company is regulated under the Bank Holding Company Act of 1956 (the “BHC Act”), and is subject to supervision, regulation and inspection by the Federal Reserve Board. The Company is also subject to certain provisions of the California Financial Code which are applicable to bank holding companies. In addition, the Company is under the jurisdiction of the SEC and is subject to the disclosure and regulatory requirements of the Securities Act of 1933 and the Securities Exchange Act of 1934, each administered by the SEC. The Company’s common stock is listed on the NASDAQ Global Select market (“NASDAQ”) with “BSRR” as its trading symbol, and the Company is subject to the rules of NASDAQ for listed companies.
The Company is a bank holding company within the meaning of the BHC Act and is registered as such with the Federal Reserve Board. A bank holding company is required to file annual reports and other information with the Federal Reserve regarding its business operations and those of its subsidiaries. In general, the BHC Act limits the business of bank holding companies to banking, managing or controlling banks and other activities that the Federal Reserve has determined to be so closely related to banking as to be a proper incident thereto, including securities brokerage services, investment advisory services, fiduciary services, and management advisory and data processing services, among others. A bank holding company that also qualifies as and elects to become a “financial holding company” may engage in a broader range of activities that are financial in nature or complementary to a financial activity (as determined by the Federal Reserve or Treasury regulations), such as securities underwriting and dealing, insurance underwriting and agency, and making merchant banking investments. The Company has not elected to become a financial holding company but may do so at some point in the future if deemed appropriate in view of opportunities or circumstances at the time.
The BHC Act requires the prior approval of the FRB for the direct or indirect acquisition of more than five percent of the voting shares of a commercial bank or its parent holding company. Acquisitions by the Bank are subject instead to the Bank Merger Act, which requires the prior approval of an acquiring bank’s primary federal regulator for any merger with or acquisition of another bank. Acquisitions by both the Company and the Bank also require the prior approval of the California Department of Financial Protection and Innovation (the “DFPI”) pursuant to the California Financial Code.
The Company and the Bank are deemed to be “affiliates” of each other and thus are subject to Sections 23A and 23B of the Federal Reserve Act as well as related Federal Reserve Regulation W which impose both quantitative and qualitative restrictions and limitations on transactions between affiliates. The Bank is also subject to laws and regulations requiring that all extensions of credit to our executive officers, directors, principal shareholders and related parties must, among other things, be made on substantially the same terms and follow credit underwriting procedures no less stringent than those prevailing at the time for comparable transactions with persons not related to the Bank.
Under certain conditions, the Federal Reserve has the authority to restrict the payment of cash dividends by a bank holding company as an unsafe and unsound banking practice, and may require a bank holding company to obtain the approval of the Federal Reserve prior to purchasing or redeeming its own equity securities. The Federal Reserve also has the authority to regulate the debt of bank holding companies.
7
A bank holding company is required to act as a source of financial and managerial strength for its subsidiary banks and must commit resources as necessary to support such subsidiaries. The Federal Reserve may require a bank holding company to contribute additional capital to an undercapitalized subsidiary bank and may disapprove of the holding company’s payment of dividends to the shareholders in such circumstances.
Regulation of the Bank Generally
As a state chartered bank, the Bank is subject to broad federal regulation and oversight extending to all its operations by the FDIC and to state regulation by the DFPI. The Bank is also subject to certain regulations of the Federal Reserve Board.
Capital Simplification for Qualifying Community Banking Organization
The federal banking agencies published a final rule on November 13, 2019, that provided a simplified measure of capital adequacy for qualifying community banking organizations. A qualifying community banking organization that opts into the community bank leverage ratio framework and maintains a leverage ratio greater than 9 percent will be considered to have met the minimum capital requirements, the capital ratio requirements for the well capitalized category under the Prompt Corrective Action framework, and any other capital or leverage requirements to which the qualifying banking organization is subject (see below for further discussion of the requirements for well capitalized and the Prompt Corrective Action framework).
A qualifying community banking organization with a leverage ratio of greater than 9 percent may opt into the community bank leverage ratio framework if it has average consolidated total assets of less than $10 billion, has off-balance-sheet exposures of 25% or less of total consolidated assets, and has total trading assets and trading liabilities of 5 percent or less of total consolidated assets. Further, the bank must not be an advance approaches banking organization. The final rule became effective January 1, 2020 and banks that meet the qualifying criteria can elect to use the community bank leverage framework starting with the quarter ended March 31, 2020. The Company and the Bank met the criteria outlined in the final rule and opted into the community bank leverage ratio framework in the first quarter 2020.
On March 27, 2020, the Coronavirus Aid, Relief, and Economic Security Act (CARES Act) became law. Section 4012 of the CARES Act directs the agencies to issue an interim final rule providing that, for purposes of section 201 of Economic Growth, Regulatory Relief, and Consumer Protection Act (EGRRCPA), the community bank leverage ratio shall be 8 percent, and a qualifying community banking organization whose leverage ratio falls below the community bank leverage ratio requirement established under the CARES Act shall have a reasonable grace period to satisfy the requirement. Section 4012 of the CARES Act specifies that the interim final rule is effective during the period beginning on the date on which the agencies issue the interim final rule and ending on the sooner of the termination date of the national emergency concerning the coronavirus disease (COVID-19) outbreak declared by the President on March 13, 2020, under the National Emergencies Act, or December 31, 2020 (termination date). Since the statutory interim final rule could cease to be effective at any time before December 31, 2020, the agencies issued a separate interim final rule pursuant to section 201(b) of EGRRCPA that provides a graduated transition from the temporary 8-percent community bank leverage ratio requirement to the 9-percent community bank leverage ratio requirement as established under the 2019 final rule (transition interim final rule). Specifically, the transition interim final rule provides that, once the statutory interim final rule ceases to apply, the community bank leverage ratio will be 8 percent in the second quarter through fourth quarter of calendar year 2020, 8.5 percent in calendar year 2021, and 9 percent thereafter. The transition interim final rule also modifies the two-quarter grace period for a qualifying community banking organization to account for the graduated increase in the community bank leverage ratio requirement. The interim final rules do not make any changes to the other qualifying criteria in the community bank leverage ratio framework. The transition interim final rule extends the 8-percent community bank leverage ratio through December 31, 2020, in the event the statutory interim final rule terminates before December 31, 2020. Thus, even if the statutory interim final rule had terminated prior to December 31, 2020, the community bank leverage ratio would have continued to be set at 8 percent for the remainder of 2020. Section 201 of EGRRCPA requires a qualifying community banking organization to exceed the community bank leverage ratio established by the agencies in order to be considered to have met the generally applicable rule, any other applicable capital or leverage requirements, and, if applicable, the “well capitalized” capital ratio requirements, whereas section 4012 of the CARES Act requires that a qualifying community banking organization meet or exceed an 8 percent community bank leverage ratio to be considered the same.
8
Capital Adequacy Requirements
The Company and the Bank are subject to the regulations of the Federal Reserve Board and the FDIC, respectively, governing capital adequacy. These agencies have adopted risk-based capital guidelines to provide a systematic analytical framework that imposes regulatory capital requirements based on differences in risk profiles among banking organizations, considers off-balance sheet exposures in evaluating capital adequacy, and minimizes disincentives to holding liquid, low-risk assets. Capital levels, as measured by these standards, are also used to categorize financial institutions for purposes of certain prompt corrective action regulatory provisions.
Pursuant to the adoption of final rules implementing the Basel Committee on Banking Supervision’s capital guidelines for all U.S. banks and bank holding companies with more than $500 million in assets, minimum regulatory requirements for both the quantity and quality of capital held by the Company and the Bank increased effective January 1, 2015. Furthermore, a capital class known as Common Equity Tier 1 capital was established in addition to Tier 1 capital and Tier 2 capital, and most financial institutions were given the option of a one-time election to continue to exclude accumulated other comprehensive income (“AOCI”) from regulatory capital. The Company has exercised its option to exclude AOCI from regulatory capital. The final rules also increased capital requirements for certain categories of assets, including higher-risk construction and real estate loans, certain past-due or nonaccrual loans, and certain exposures related to securitizations. The final rules permanently grandfather non-qualifying capital instruments (such as trust preferred securities and cumulative perpetual preferred stock) issued before May 19, 2010 for inclusion in the Tier 1 capital of banking organizations with total consolidated assets of less than $15 billion at December 31, 2009, subject to a limit of 25% of Tier 1 capital. All of the Company’s trust preferred securities were issued prior to that date and continue to qualify as Tier 1 capital.
Our Common Equity Tier 1 capital includes common stock, additional paid-in capital, and retained earnings, less the following: disallowed goodwill and intangibles, disallowed deferred tax assets, and any insufficient additional capital to cover the deductions. Tier 1 capital is generally defined as the sum of core capital elements, less the following: goodwill and other intangible assets, accumulated other comprehensive income, disallowed deferred tax assets, and certain other deductions. The following items are defined as core capital elements: (i) common shareholders’ equity; (ii) qualifying non-cumulative perpetual preferred stock and related surplus (and, in the case of holding companies, senior perpetual preferred stock issued to the U.S. Treasury Department pursuant to the Troubled Asset Relief Program); (iii) minority interests in the equity accounts of consolidated subsidiaries; and (iv) “restricted” core capital elements (which include qualifying trust preferred securities) up to 25% of all core capital elements. Tier 2 capital includes the following supplemental capital elements: (i) allowance for loan and lease losses (but not more than 1.25% of an institution’s risk-weighted assets); (ii) perpetual preferred stock and related surplus not qualifying as core capital; (iii) hybrid capital instruments, perpetual debt and mandatory convertible debt instruments; and, (iv) term subordinated debt and intermediate-term preferred stock and related surplus. The maximum amount of Tier 2 capital is capped at 100% of Tier 1 capital.
The final rules established a regulatory minimum of 4.5% for common equity Tier 1 capital to total risk weighted assets (“Common Equity Tier 1 RBC Ratio”), a minimum of 6.0% for Tier 1 capital to total risk weighted assets (“Tier 1 Risk-Based Capital Ratio” or “Tier 1 RBC Ratio”), a minimum of 8.0% for qualifying Tier 1 plus Tier 2 capital to total risk weighted assets (“Total Risk-Based Capital Ratio” or “Total RBC Ratio”), and a minimum of 4.0% for the Leverage Ratio, which is defined as Tier 1 capital to adjusted average assets (quarterly average assets less the disallowed capital items noted above). In addition to the other minimum risk-based capital standards, the final rules also require a Common Equity Tier 1 capital conservation buffer which became fully phased in at 2.5% of risk-weighted assets beginning on January 1, 2019. Effective January 1, 2019, the buffer effectively raises the minimum required Common Equity Tier 1 RBC Ratio to 7.0%, the Tier 1 RBC Ratio to 8.5%, and the Total RBC Ratio to 10.5%. Institutions that do not maintain the required capital buffer will become subject to progressively more stringent limitations on the percentage of earnings that can be paid out in dividends or used for stock repurchases, and on the payment of discretionary bonuses to executive management.
Based on our capital levels at December 31, 2020 and 2019, the Company and the Bank met all capital adequacy requirements to which they are subject, including utilizing the Capital Simplification for Qualifying Community Bank Organization as applicable. For more information on the Company’s capital, see Part II, Item 7, Management’s Discussion and Analysis of Financial Condition and Results of Operation – Capital Resources. Risk-based capital ratio (“RBC”) requirements are discussed in greater detail in the following section.
9
Prompt Corrective Action Provisions
Federal law requires each federal banking agency to take prompt corrective action to resolve the problems of insured financial institutions, including but not limited to those that fall below one or more of the prescribed minimum capital ratios. The federal banking agencies have by regulation defined the following five capital categories: “well capitalized” (Total RBC Ratio of 10%; Tier 1 RBC Ratio of 8%; Common Equity Tier 1 RBC Ratio of 6.5%; and Leverage Ratio of 5%); “adequately capitalized” (Total RBC Ratio of 8%; Tier 1 RBC Ratio of 6%; Common Equity Tier 1 RBC Ratio of 4.5%; and Leverage Ratio of 4%); “undercapitalized” (Total RBC Ratio of less than 8%; Tier 1 RBC Ratio of less than 6%; Common Equity Tier 1 RBC Ratio of less than 4.5%; or Leverage Ratio of less than 4%); “significantly undercapitalized” (Total RBC Ratio of less than 6%; Tier 1 RBC Ratio of less than 4%; Common Equity Tier 1 RBC Ratio of less than 3%; or Leverage Ratio less than 3%); and “critically undercapitalized” (tangible equity to total assets less than or equal to 2%). A bank may be treated as though it were in the next lower capital category if, after notice and the opportunity for a hearing, the appropriate federal agency finds an unsafe or unsound condition or practice merits a downgrade, but no bank may be treated as “critically undercapitalized” unless its actual tangible equity to assets ratio warrants such treatment. As of December 31, 2020 and 2019, both the Company and the Bank qualified as well capitalized for regulatory capital purposes, including utilizing the Capital Simplification for Qualifying Community Bank Organization, as applicable.
At each successively lower capital category, an insured bank is subject to increased restrictions on its operations. For example, a bank is generally prohibited from paying management fees to any controlling persons or from making capital distributions if to do so would cause the bank to be “undercapitalized.” Asset growth and branching restrictions apply to undercapitalized banks, which are required to submit written capital restoration plans meeting specified requirements (including a guarantee by the parent holding company, if any). “Significantly undercapitalized” banks are subject to broad regulatory authority, including among other things capital directives, forced mergers, restrictions on the rates of interest they may pay on deposits, restrictions on asset growth and activities, and prohibitions on paying bonuses or increasing compensation to senior executive officers without FDIC approval. Even more severe restrictions apply to “critically undercapitalized” banks. Most importantly, except under limited circumstances, not later than 90 days after an insured bank becomes critically undercapitalized the appropriate federal banking agency is required to appoint a conservator or receiver for the bank.
In addition to measures taken under the prompt corrective action provisions, insured banks may be subject to potential actions by the federal regulators for unsafe or unsound practices in conducting their businesses or for violations of any law, rule, regulation or any condition imposed in writing by the agency or any written agreement with the agency. Enforcement actions may include the issuance of cease and desist orders, termination of insurance on deposits (in the case of a bank), the imposition of civil money penalties, the issuance of directives to increase capital, formal and informal agreements, or removal and prohibition orders against “institution-affiliated” parties.
Safety and Soundness Standards
The federal banking agencies have also adopted guidelines establishing safety and soundness standards for all insured depository institutions. Those guidelines relate to internal controls, information systems, internal audit systems, loan underwriting and documentation, compensation, and liquidity and interest rate exposure. In general, the standards are designed to assist the federal banking agencies in identifying and addressing problems at insured depository institutions before capital becomes impaired. If an institution fails to meet the requisite standards, the appropriate federal banking agency may require the institution to submit a compliance plan and could institute enforcement proceedings if an acceptable compliance plan is not submitted or followed.
The Dodd-Frank Wall Street Reform and Consumer Protection Act
Legislation and regulations enacted and implemented since 2008 in response to the U.S. economic downturn and financial industry instability continue to impact most institutions in the banking sector. Most provisions of the Dodd-Frank Wall Street Reform and Consumer Protection Act (“Dodd-Frank”), which was enacted in 2010, are now effective and have been fully implemented.
10
Some aspects of Dodd-Frank are still subject to rulemaking, making it difficult to anticipate the ultimate financial impact on the Company, its customers or the financial services industry more generally. However, many provisions of Dodd-Frank are already affecting our operations and expenses, including but not limited to changes in FDIC assessments, the permitted payment of interest on demand deposits, and enhanced compliance requirements. Some of the rules and regulations promulgated or yet to be promulgated under Dodd-Frank will apply directly only to institutions much larger than ours, but could indirectly impact smaller banks, either due to competitive influences or because certain required practices for larger institutions may subsequently become expected “best practices” for smaller institutions. We could see continued attention and resources devoted by the Company to ensure compliance with the statutory and regulatory requirements engendered by Dodd-Frank.
Tax Cuts and Jobs Act
On December 22, 2017, the Tax Cuts and Jobs Act (the “Act”) was signed into law. The Act made significant changes that impact corporate taxation, including the reduction of the maximum federal income tax rate for corporations from 35% to 21% and changes or limitations to certain tax deductions. The reduced tax rate had a favorable impact on our tax expense beginning in 2018, as our blended marginal income tax rate dropped to 29.6% in 2018 from 42.1% in 2017. The tax rate reduction also resulted in an adjustment to our deferred tax assets and liabilities to reflect their value to the Company at the lower federal tax rate of 21%, with such revaluation required in the period in which the legislation was enacted. As a result of this change, we reduced our net deferred tax asset by $2.71 million via a charge to our income tax provision in December 2017.
Deposit Insurance
The Bank’s deposits are insured up to maximum applicable limits under the Federal Deposit Insurance Act, and the Bank is subject to deposit insurance assessments to maintain the FDIC’s Deposit Insurance Fund (the “DIF”). In October 2010, the FDIC adopted a revised restoration plan to ensure that the DIF’s designated reserve ratio (“DRR”) reaches 1.35% of insured deposits by September 30, 2020, the deadline mandated by the Dodd-Frank Act. In August 2016 the FDIC announced that the DIF reserve ratio had surpassed 1.15% as of June 30, 2016 and assessment rates for most institutions were adjusted downward, but institutions with $10 billion or more in assets were assessed a quarterly surcharge which will continue until the reserve ratio reaches the statutory minimum of 1.35%. Furthermore, the restoration plan proposed an increase in the DRR to 2% of estimated insured deposits as a long-term goal for the fund. On September 30, 2018, the DIF ratio reached 1.36 percent. Because the ratio exceeded 1.35 percent, two deposit insurance assessment changes occurred under FDIC regulations: surcharges on large banks (total consolidated assets of $10 billion or more) ended, with the last surcharge on large banks being collected on December 28, 2018; and, banks with total consolidated assets of less than $10 billion were awarded credits for the portion of their assessments that contributed to the growth in the reserve ratio from 1.15 percent to 1.35 percent, to be applied when the reserve ratio is at least 1.38 percent. Bank of the Sierra received credits to reduce our FDIC assessments.
As noted above, the Dodd-Frank Act provided for a permanent increase in FDIC deposit insurance per depositor from $100,000 to $250,000 retroactive to January 1, 2008. Furthermore, effective in the second quarter of 2011, FDIC deposit insurance premium assessment rates were adjusted, and the assessment base was established as an institution’s total assets less tangible equity. We are generally unable to control the amount of premiums that we are required to pay for FDIC deposit insurance. If there are additional bank or financial institution failures or if the FDIC otherwise determines, we may be required to pay higher FDIC premiums, which could have a material adverse effect on our earnings and/or on the value of, or market for, our common stock.
In addition to DIF assessments, banks were required to pay quarterly assessments that were applied to the retirement of Financing Corporation bonds issued in the 1980’s to assist in the recovery of the savings and loan industry. The Financing Corporation bonds matured in September 2019, with a final assessment of 0.12 basis points of insured deposits in March 2019.
11
Community Reinvestment Act
The Bank is subject to certain requirements and reporting obligations involving Community Reinvestment Act (“CRA”) activities. The CRA generally requires federal banking agencies to evaluate the record of a financial institution in meeting the credit needs of its local communities, including low and moderate income neighborhoods. The CRA further requires the agencies to consider a financial institution’s efforts in meeting its community credit needs when evaluating applications for, among other things, domestic branches, mergers or acquisitions, or the formation of holding companies. In measuring a bank’s compliance with its CRA obligations, the regulators utilize a performance-based evaluation system under which CRA ratings are determined by the bank’s actual lending, service, and investment performance, rather than on the extent to which the institution conducts needs assessments, documents community outreach activities or complies with other procedural requirements. In connection with its assessment of CRA performance, the FDIC assigns a rating of “outstanding,” “satisfactory,” “needs to improve” or “substantial noncompliance.” The Bank most recently received a “needs to improve” CRA assessment rating in December 2020.
On September 21, 2020, the FDIC issued an advance notice of proposed rulemaking on updating the agency’s three-decade-old CRA regulations. The objectives of the new rules include, more effectively meeting the needs of low-to-moderate-income communities and address disparities in credit access, increasing the clarity consistency and transparency of supervisory expectations and standards regarding where activities are assessed, which activities count and how eligible activities are assessed, while minimizing data collection burden, tailoring CRA supervision based on size, business model, local market conditions, etc., updating standards to reflect changes in banking over time, including the increased use of mobile and internet delivery channels, promoting community engagement, strengthening the special treatment of minority depository institutions, and recognizing that CRA and fair lending responsibilities are mutually reinforcing. The Company intends to monitor this proposal so that our CRA efforts are in compliance with any changes to the old rules once implemented.
Privacy and Data Security
The Gramm-Leach-Bliley Act, also known as the Financial Modernization Act of 1999 (the “Financial Modernization Act”), imposed requirements on financial institutions with respect to consumer privacy. Financial institutions, however, are required to comply with state law if it is more protective of consumer privacy than the Financial Modernization Act. The Financial Modernization Act generally prohibits disclosure of consumer information to non-affiliated third parties unless the consumer has been given the opportunity to object and has not objected to such disclosure. The statute also directed federal regulators, including the Federal Reserve and the FDIC, to establish standards for the security of consumer information, and requires financial institutions to disclose their privacy policies to consumers annually.
Overdrafts
The Electronic Funds Transfer Act, as implemented by the Federal Reserve’s Regulation E, governs transfers initiated through automated teller machines (“ATMs”), point-of-sale terminals, and other electronic banking services. Regulation E prohibits financial institutions from assessing an overdraft fee for paying ATM and one-time point-of-sale debit card transactions, unless the customer affirmatively opts in to the overdraft service for those types of transactions. The opt-in provision establishes requirements for clear disclosure of fees and terms of overdraft services for ATM and one-time debit card transactions. The rule does not apply to other types of transactions, such as check, automated clearinghouse (“ACH”) and recurring debit card transactions. Additionally, in November 2010 the FDIC issued its Overdraft Guidance on automated overdraft service programs, to ensure that a bank mitigates the risks associated with offering automated overdraft payment programs and complies with all consumer protection laws and regulations.
Consumer Financial Protection and Financial Privacy
Dodd-Frank created the Consumer Finance Protection Bureau (the “CFPB”) as an independent entity with broad rulemaking, supervisory and enforcement authority over consumer financial products and services including deposit products, residential mortgages, home-equity loans and credit cards. The CFPB’s functions include investigating consumer complaints, conducting market research, rulemaking, supervising and examining bank consumer transactions, and enforcing rules related to consumer financial products and services. CFPB regulations and guidance apply to all financial
12
institutions, including the Bank, although only banks with $10 billion or more in assets are subject to examination by the CFPB. Banks with less than $10 billion in assets, including the Bank, are examined for compliance by their primary federal banking agency.
In January 2013, the CFPB issued final regulations governing consumer mortgage lending. Certain rules which became effective in January 2014 impose additional requirements on lenders, including the directive that lenders need to ensure the ability of their borrowers to repay mortgages. The CFPB also finalized a rule on escrow accounts for higher priced mortgage loans and a rule expanding the scope of the high-cost mortgage provision in the Truth in Lending Act. The CFPB also issued final rules implementing provisions of the Dodd-Frank Act that relate to mortgage servicing. In November 2013 the CFPB issued a final rule on integrated and simplified mortgage disclosures under the Truth in Lending Act and the Real Estate Settlement Procedures Act, which became effective in October 2015.
The CFPB has broad rulemaking authority for a wide range of consumer financial laws that apply to all banks, including, among other things, the authority to prohibit “unfair, deceptive or abusive” acts and practices. Abusive acts or practices are defined as those that materially interfere with a consumer’s ability to understand a term or condition of a consumer financial product or service or take unreasonable advantage of a consumer’s: (i) lack of financial savvy, (ii) inability to protect himself in the selection or use of consumer financial products or services, or (iii) reasonable reliance on a covered entity to act in the consumer’s interests.
The Bank continues to be subject to numerous other federal and state consumer protection laws that extensively govern its relationship with its customers. Those laws include the Equal Credit Opportunity Act, the Fair Credit Reporting Act, the Truth in Lending Act, the Truth in Savings Act, the Electronic Fund Transfer Act, the Expedited Funds Availability Act, the Home Mortgage Disclosure Act, the Fair Housing Act, the Real Estate Settlement Procedures Act, the Fair Debt Collection Practices Act, the Right to Financial Privacy Act, the Service Members Civil Relief Act, and respective state-law counterparts to these laws, as well as state usury laws and laws regarding unfair and deceptive acts and practices. These and other laws require disclosures including the cost of credit and terms of deposit accounts, provide substantive consumer rights, prohibit discrimination in credit transactions, regulate the use of credit report information, provide financial privacy protections, prohibit unfair, deceptive and abusive practices, restrict the Company’s ability to raise interest rates and otherwise subject the Company to substantial regulatory oversight.
In addition, as is the case with all financial institutions, the Bank is required to maintain the privacy of its customers’ non-public, personal information. Such privacy requirements direct financial institutions to: (i) provide notice to customers regarding privacy policies and practices; (ii) inform customers regarding the conditions under which their non-public personal information may be disclosed to non-affiliated third parties; and (iii) give customers an option to prevent disclosure of such information to non-affiliated third parties.
Identity Theft
Under the Fair and Accurate Credit Transactions Act (the “FACT Act”), the Bank is required to develop and implement a written Identity Theft Prevention Program to detect, prevent and mitigate identity theft “red flags” in connection with certain existing accounts or the opening of certain accounts. Under the FACT Act, the Bank is required to adopt reasonable policies and procedures to (i) identify relevant red flags for covered accounts and incorporate those red flags into the program; (ii) detect red flags that have been incorporated into the program; (iii) respond appropriately to any red flags that are detected to prevent and mitigate identity theft; and (iv) ensure the program is updated periodically, to reflect changes in risks to customers or to the safety and soundness of the financial institution or creditor from identity theft. The Bank maintains a program to meet the requirements of the FACT Act and the Bank believes it is currently in compliance with these requirements.
Interstate Banking and Branching
The Riegle-Neal Interstate Banking and Branching Efficiency Act of 1994 (the “Interstate Act”), together with Dodd-Frank, relaxed prior interstate branching restrictions under federal law by permitting, subject to regulatory approval, state and federally chartered commercial banks to establish branches in states where the laws permit banks chartered in such states to establish branches. The Interstate Act requires regulators to consult with community organizations before
13
permitting an interstate institution to close a branch in a low-income area. Federal banking agency regulations prohibit banks from using their interstate branches primarily for deposit production and the federal banking agencies have implemented a loan-to-deposit ratio screen to ensure compliance with this prohibition. Dodd-Frank effectively eliminated the prohibition under California law against interstate branching through de novo establishment of California branches. Interstate branches are subject to certain laws of the states in which they are located. The Bank presently does not have any interstate branches.
USA Patriot Act of 2001
The impact of the USA Patriot Act of 2001 (the “Patriot Act”) on financial institutions of all kinds has been significant and wide ranging. The Patriot Act substantially enhanced anti-money laundering and financial transparency laws, and required certain regulatory authorities to adopt rules that promote cooperation among financial institutions, regulators, and law enforcement entities in identifying parties that may be involved in terrorism or money laundering. Under the Patriot Act, financial institutions are subject to prohibitions regarding specified financial transactions and account relationships, as well as enhanced due diligence and “know your customer” standards in their dealings with foreign financial institutions and foreign customers. The Patriot Act also requires all financial institutions to establish anti-money laundering programs. The Bank expanded its Bank Secrecy Act compliance staff and intensified due diligence procedures concerning the opening of new accounts to fulfill the anti-money laundering requirements of the Patriot Act, and also implemented systems and procedures to identify suspicious banking activity and report any such activity to the Financial Crimes Enforcement Network.
Incentive Compensation
In June 2010, the FRB and the FDIC issued comprehensive final guidance on incentive compensation policies intended to help ensure that banking organizations do not undermine their own safety and soundness by encouraging excessive risk-taking. The guidance, which covers all employees who have the ability to materially affect the risk profile of an organization, either individually or as part of a group, is based upon the key principles that incentive compensation arrangements should (i) provide incentives that do not encourage risk-taking beyond the organization’s ability to effectively identify and manage risks, (ii) be compatible with effective internal controls and risk management, and (iii) be supported by strong corporate governance, including active and effective oversight by the organization’s board of directors. The regulatory agencies will review, as part of their regular risk-focused examination process, the incentive compensation arrangements of banking organizations, such as the Company, that are not “large, complex banking organizations.” Where appropriate, the regulatory agencies will take supervisory or enforcement action to address perceived deficiencies in an institution’s incentive compensation arrangements or related risk-management, control, and governance processes. The Company believes that it is in full compliance with the regulatory guidance on incentive compensation policies.
Sarbanes-Oxley Act of 2002
The Company is subject to the Sarbanes-Oxley Act of 2002 (“Sarbanes-Oxley”) which addresses, among other issues, corporate governance, auditing and accounting, executive compensation, and enhanced and timely disclosure of corporate information. Among other things, Sarbanes-Oxley mandates chief executive and chief financial officer certifications of periodic financial reports, additional financial disclosures concerning off-balance sheet items, and accelerated share transaction reporting for executive officers, directors and 10% shareholders. In addition, Sarbanes-Oxley increased penalties for non-compliance with the Exchange Act. SEC rules promulgated pursuant to Sarbanes-Oxley impose obligations and restrictions on auditors and audit committees intended to enhance their independence from Management, and include extensive additional disclosure, corporate governance and other related rules.
Commercial Real Estate Lending Concentrations
As a part of their regulatory oversight, the federal regulators have issued guidelines on sound risk management practices with respect to a financial institution’s concentrations in commercial real estate (“CRE”) lending activities. These guidelines were issued in response to the agencies’ concerns that rising CRE concentrations might expose institutions to unanticipated earnings and capital volatility in the event of adverse changes in the commercial real estate market. The guidelines identify certain concentration levels that, if exceeded, will expose the institution to additional supervisory
14
analysis with regard to the institution’s CRE concentration risk. The guidelines, as amended, are designed to promote appropriate levels of capital and sound loan and risk management practices for institutions with a concentration of CRE loans. In general, the guidelines, as amended, establish the following supervisory criteria as preliminary indications of possible CRE concentration risk: (1) the institution’s total construction, land development and other land loans represent 100% or more of Tier 1 risk-based capital plus allowance for loan and lease losses; or (2) total CRE loans as defined in the regulatory guidelines represent 300% or more of Tier 1 risk-based capital plus allowance for loan and lease losses, and the institution’s CRE loan portfolio has increased by 50% or more during the prior 36 month period. At December 31, 2020, the Bank’s total construction, land development and other land loans represented 36% of Tier 1 risk-based capital plus allowance for loan and lease losses. At December 31, 2020, the Bank’s total CRE loans as defined in the regulatory guidelines represented 378% of Tier 1 risk-based capital plus allowance for loan and lease losses, and the Bank’s CRE loan portfolio has increased by more than 50% during the prior 36 month period. Therefore, the Bank believes that the guidelines are applicable to it as it has a potential concentration in CRE loans. The Bank and its board of directors have discussed the guidelines and believe that the Bank’s underwriting policies, management information systems, independent credit administration process, and monitoring of real estate loan concentrations are sufficient to address the risk management of CRE under the guidelines.
Other Pending and Proposed Legislation
Other legislative and regulatory initiatives which could affect the Company, the Bank and the banking industry in general are pending, and additional initiatives may be proposed or introduced before the United States Congress, the California legislature and other governmental bodies in the future. Such proposals, if enacted, may further alter the structure, regulation and competitive relationship among financial institutions, and may subject the Bank to increased regulation, disclosure and reporting requirements. In addition, the various banking regulatory agencies often adopt new rules and regulations to implement and enforce existing legislation. It cannot be predicted whether, or in what form, any such legislation or regulations may be enacted or the extent to which the business of the Company or the Bank would be affected thereby.
Article I. ITEM 1A. RISK FACTORS
You should carefully consider the following risk factors and all other information contained in this Annual Report before making investment decisions concerning the Company’s common stock. The risks and uncertainties described below are not the only ones the Company faces. Additional risks and uncertainties not presently known to the Company, or that the Company currently believes are immaterial, may also adversely impact the Company’s business. If any of the events described in the following risk factors occur, the Company’s business, results of operations and financial condition could be materially adversely affected. In addition, the market price of the Company’s common stock could decline due to any of the events described in these risks.
Section 1.01 Risks Relating to the COVID-19 Pandemic
Our business has been and may in the future be adversely affected by volatile conditions in the financial markets and unfavorable economic conditions generally, including continued impact from the ongoing COVID-19 pandemic. National and global economies are constantly in flux, as evidenced by market volatility both recently and in years past. Future economic conditions cannot be predicted, and recurrent deterioration in the economies of the nation as a whole or in the Company’s markets could have an adverse effect, which could be material, on our business, financial condition, results of operations and future prospects, and could cause the market price of the Company’s stock to decline.
California’s San Joaquin Valley, where the Company is headquartered and has many of its branch locations, was particularly hard hit by the COVID-19 pandemic and its effect on the economy. Unemployment levels have historically been elevated in the San Joaquin Valley, including Tulare County which is our geographic center, but recessionary conditions, precipitated by the COVID-19 Great Lockdown, pushed unemployment rates to exceptionally high levels in 2020. The highest unemployment rate for Tulare County pre-pandemic was 19.3% in March 2010; the unemployment rate reached that same high of 19.3% again in April 2020. The Tulare county unemployment rate declined to 8.8% by December 2020, an uptick from the 8.1% unemployment rate for November 2020. In addition, as discussed below in connection with challenges facing the agricultural industry, the persistence of a California drought could have a significant
15
negative impact on unemployment rates in our market areas. Furthermore, a drop in oil prices like the decline experienced in recent years could also negatively impact unemployment rates, particularly in Kern County.
These conditions have impacted and are expected in the future to impact-our business, results of operations, and financial condition negatively, including through lower revenue from certain of our fee-based businesses; lower net interest income resulting from lower interest rates and increased loan delinquencies; increased provisions for credit losses; impairments on the securities we hold; and decreased demand for certain of our products and services. Additionally, our liquidity and regulatory capital could be adversely impacted by volatility and disruptions in the capital and credit markets; deposit flows; and continued client draws on lines of credit as well as our participation in the Small Business Administration Paycheck Protection Program. Our business operations may also be disrupted if significant portions of our workforce are unable to work effectively, including because of illness, quarantines, government actions, or other restrictions in connection with the pandemic. Negative impacts from the ongoing COVID-19 pandemic may include:
| ● | Collateral securing our loans may decline in value, which could increase credit losses in our loan portfolio and increase the allowance for loan and lease losses. |
| ● | Demand for our products and services may decline, and deposit balances may decrease making it difficult to grow assets and income. |
| ● | The decline in the target federal funds rate could decrease yields on our existing and new assets that exceed the decline in our cost of interest-bearing liabilities, which may reduce our net interest margin. |
| ● | Our borrowers’ actual payment performance may be worse than anticipated as loan deferrals related to the COVID-19 pandemic expire, and we may experience potential adverse impact from loan modifications and payment deferrals despite their implementation consistent with recent regulatory guidance. |
| ● | The impact of the adoption of the CECL standard in 2022, which is highly dependent on unemployment rate forecasts over the life of our loans, could significantly increase the allowance for credit losses and decrease net income. |
While governmental authorities have taken unprecedented measures to provide economic assistance to individual households and businesses, stabilize the markets, and support economic growth, the success of these measures is unknown, and they may not be sufficient to mitigate fully the negative impact of the ongoing pandemic. Further, some measures, such as a suspension of mortgage and other loan payments and foreclosures, may have a negative impact on our business, while our participation in other measures could result in reputational harm, litigation, or regulatory and government actions, proceedings, or penalties.
The extent to which the COVID-19 pandemic impacts our business, results of operations and financial condition will depend on future developments, which are highly uncertain and are difficult to predict, including, but not limited to, the duration and spread of the outbreak, its severity, the actions to contain the virus or treat its impact, and how quickly and to what extent normal economic and operating conditions can resume, particularly in California.
Our Traditional Service Delivery Channels may be Impacted by the COVID-19 Pandemic. In light of the external COVID-19 threat, the Board of Directors and senior management are continuously monitoring the situation, providing frequent communications, and making adjustments and accommodations for both external clients and our employees. For the most part, branches remain open to serve our customers and local communities, with modified hours and strict social distancing protocols in place as well as limiting most of our branches to walk-up or drive-up visits. Our customers have been encouraged to utilize branch alternatives such as our ATMs, online banking, and mobile banking application in lieu of in-branch transactions. In addition, many employees are working remotely. Travel, as well as face-to-face meeting restrictions are in effect for Bank personnel. Further, given the increase of the risk of cyber-security incidents during the pandemic, we have enhanced our cyber-security protocols. If the pandemic worsens, resurges or lasts for an extended period of time, to protect the health of the Company’s workforce and our customers, we may need to enact further precautionary measures to help minimize the risks to our employees and customers, thus potentially altering our service delivery channels and operations over a prolonged period. These changes to our traditional service delivery channels may
16
negatively impact our customers’ experience of banking with us, result in loss of service fees, and increase costs through equipment and services needed to support a remote workforce, and therefore negatively impact our financial condition and results of operation.
Section 1.02 Risks Relating to the Bank and our Business
Our business has been and may in the future be adversely affected by volatile conditions in the financial markets and unfavorable economic conditions generally. National and global economies are constantly in flux, as evidenced by market volatility both recently and in years past. Future economic conditions cannot be predicted, and recurrent deterioration in the economies of the nation as a whole or in the Company’s markets could have an adverse effect, which could be material, on our business, financial condition, results of operations and future prospects, and could cause the market price of the Company’s stock to decline.
Until the recent recession caused by COVID-19, the U.S. economy had undergone a continued and gradual expansion since 2009. Financial stress on borrowers as a result of an uncertain future economic environment could still have an unfavorable effect on the ability of the Company’s borrowers to repay their loans, which could adversely affect the Company’s business, financial condition and results of operations.
Economic conditions are currently stressed although appear relatively stable in most of our local markets. The State of California has imposed mandatory restrictions on travel and prescribed rules and protocols that have directly and indirectly impacted many sectors in our local economy. The hospitality segment which is strained due to the stay at home order in place off and on throughout 2020 and the first 25 days of 2021. Adverse developments, such as, among other things, health epidemics or pandemics (or expectations about them) like the novel coronavirus, international trade disputes, inflation risks, oil price volatility, the level of U.S. debt and global economic conditions, could depress business and/or consumer confidence levels, negatively impact real estate values, and otherwise lead to economic weakness which could have one or more of the following undesirable effects on our business:
| ● | a lack of demand for loans, or other products and services offered by us; |
| ● | a decline in the value of our loans or other assets secured by real estate; |
| ● | a decrease in deposit balances due to increased pressure on the liquidity of our customers; |
| ● | an impairment of our investment securities; or |
| ● | an increase in the number of borrowers who become delinquent, file for protection under bankruptcy laws or default on their loans or other obligations to us, which in turn could result in higher levels of nonperforming assets, net charge-offs and provisions for credit losses. |
Changes in interest rates could adversely affect our profitability, business and prospects. Net interest income, and therefore earnings, can be adversely affected by differences or changes in the interest rates on, or the repricing frequency of, our financial instruments. In a period of low-interest rates, yields on new investments or loans may be lower than existing yields or lower than yields on earning assets that have prepaid or matured. In addition, fluctuations in interest rates can affect the demand of customers for products and services, and an increase in the general level of interest rates may adversely affect the ability of certain borrowers to make variable-rate loan payments. The speed and absolute level of increase or decrease in interest rates can have a material impact on the net interest income and economic value of equity of the Bank depending on the asset liability profile at any point in time. Changes in market interest rates could have a material adverse effect on the Company’s asset quality, loan origination volume, financial condition, results of operations, and cash flows. This interest rate risk can arise from Federal Reserve Board monetary policies, as well as other economic, regulatory and competitive factors that are beyond our control.
Challenges in the agricultural industry could have an adverse effect on our customers and their ability to make payments to us, particularly in view of recent drought conditions in California and disruptions involving international trade. Difficulties experienced by the agricultural industry have led to relatively high levels of
17
nonperforming assets in previous economic cycles. This is due to the fact that a considerable portion of our borrowers are involved in, or are impacted to some extent by, the agricultural industry. While a great number of our borrowers are not directly involved in agriculture, they would likely be impacted by difficulties in the agricultural industry since many jobs in our market areas are ancillary to the regular production, processing, marketing and sale of agricultural commodities.
The markets for agricultural products can be adversely impacted by increased supply from overseas competition, a drop in consumer demand, tariffs and numerous other factors. In recent periods in particular, retaliatory tariffs levied by certain countries in response to tariffs imposed by the US Government on imports from those countries have created a high degree of uncertainty and disruption in the agricultural community in California, due to the level of goods that are exported. The ripple effect of any resulting drop in commodity prices could lower borrower income and depress collateral values. Weather patterns are also of critical importance to row crop, tree fruit, and citrus production. A degenerative cycle of weather has the potential to adversely affect agricultural industries as well as consumer purchasing power, and could lead to higher unemployment throughout the San Joaquin Valley. In recent years, the state of California experienced the worst drought in its recorded history, and it is difficult to predict if the drought will resume and how long it might last. Another looming issue that could have a major impact on the agricultural industry involves water availability and distribution rights. If the amount of water available to agriculture becomes increasingly scarce as a result of diversion to other uses, farmers may not be able to continue to produce agricultural products at a reasonable profit, which has the potential to force many out of business. Such conditions have affected and may continue to adversely affect our borrowers and, by extension, our business, and if general agricultural conditions decline our level of nonperforming assets could increase.
Another significant drop in oil prices could have an adverse impact on our customers and their ability to make payments to us, particularly in areas such as Kern County where oil production is a key economic driver. As we have experienced in the past, a drop in oil prices could lead to declines in property values and property taxes, particularly in Kern County, which is home to about three quarters of California’s oil production. The Company does not have direct exposure to oil producers, and our exposure via loans outstanding to borrowers involved in servicing oil companies totaled only $10.1 million at December 31, 2020. However, if cash flows are disrupted for our energy-related borrowers, or if other borrowers are indirectly impacted and/or non-oil property values decline, our level of nonperforming assets and loan charge-offs could increase. Furthermore, economic multipliers to a contracting oil industry include the prospects of a depressed residential housing market and a drop in commercial real estate values.
We may not be able to continue to attract and retain banking customers, and our efforts to compete may reduce our profitability. The banking business in our market areas is highly competitive with respect to virtually all products and services, which may limit our ability to attract and retain banking customers. In California generally, and in our service areas specifically, major banks dominate the commercial banking industry. Such banks have substantially greater lending limits than we have, offer certain services we cannot offer directly, and often operate with economies of scale that result in relatively low operating costs. We also compete with numerous financial and quasi-financial institutions for deposits and loans, including providers of financial services via the internet. Recent advances in technology and other changes have allowed parties to effectuate financial transactions that previously required the involvement of banks. For example, consumers can maintain funds in brokerage accounts or mutual funds that would have historically been held as bank deposits. Consumers can also complete transactions such as paying bills and transferring funds directly without the assistance of banks. The process of eliminating banks as intermediaries, known as disintermediation, could result in the loss of customer deposits and the fee income generated by those deposits. The loss of these revenue streams and access to lower cost deposits as a source of funds could have a material adverse effect on our financial condition and results of operations.
Moreover, with the large number of bank failures in the past decade, some customers continue to be concerned about the extent to which their deposits are insured by the FDIC. Customers may withdraw deposits in an effort to ensure that the amount they have on deposit with their bank is fully insured. Decreases in deposits may adversely affect our funding costs and net income. Ultimately, competition can and does increase our cost of funds, reduce loan yields and drive down our net interest margin, thereby reducing profitability. It can also make it more difficult for us to continue to increase the size of our loan portfolio and deposit base, and could cause us to rely more heavily on wholesale borrowings which are generally more expensive than retail deposits.
18
The value of the securities in our investment portfolio may be negatively affected by market disruptions, adverse credit events or fluctuations in interest rates, which could have a material adverse impact on capital levels. Our available-for-sale investment securities are reported at their estimated fair values, and fluctuations in fair values can result from changes in market interest rates, rating agency actions, issuer defaults, illiquid markets and limited investor demand, among other things. Under current accounting rules, as long as the change in the fair value of a security is not considered to be “other than temporary,” we directly increase or decrease accumulated other comprehensive income in shareholders’ equity by the amount of the change in fair value, net of the tax effect. Because of the size of our fixed income bond portfolio relative to total assets, a relatively large increase in market interest rates, in particular, could result in a material drop in fair values and, by extension, our capital. Investment securities that have an amortized cost in excess of their current fair value at the end of a reporting period are also evaluated for other-than-temporary impairment. If such impairment is indicated, the difference between the amortized cost and the fair value of those securities will be recorded as a charge in our income statement, which could also have a material adverse effect on our results of operations and capital levels.
We are exposed to the risk of environmental liabilities with respect to properties to which we obtain title. Approximately 77.0% of our loan portfolio at December 31, 2020 consisted of real estate loans. In the normal course of business we may foreclose and take title to real estate collateral, and could be subject to environmental liabilities with respect to those properties. We may be held liable to a governmental entity or to third parties for property damage, personal injury, investigation and clean-up costs incurred by these parties in connection with environmental contamination, or may be required to investigate or clean up hazardous or toxic substances, or chemical releases at a property. The costs associated with investigation or remediation activities could be substantial. In addition, if we are the owner or former owner of a contaminated site, we may be subject to common law claims by third parties based on damages and costs resulting from environmental contamination emanating from the property. These costs and claims could adversely affect our business and prospects.
Section 1.03 Risks Related to our Loans
Concentrations of real estate loans have negatively impacted our performance in the past, and could subject us to further risks in the event of another real estate recession or natural disaster. Our loan portfolio is heavily concentrated in real estate loans, particularly commercial real estate. At December 31, 2020, 77.0% of our loan portfolio consisted of real estate loans, and a sizeable portion of the remaining loan portfolio had real estate collateral as a secondary source of repayment or as an abundance of caution. Loans on commercial buildings represented approximately 74.1% of all real estate loans, while construction/development and land loans were 3.8%, loans secured by residential properties accounted for 15.2%, and loans secured by farmland were 6.9% of real estate loans. The Company’s $8.6 million balance of nonperforming assets at December 31, 2020 includes nonperforming real estate loans totaling $6.3 million, and $1.0 million in OREO.
In past recessionary periods, the residential real estate market experienced significant deflation in property values and foreclosures occurred at relatively high rates during and after the recession. While residential real estate values in our market areas appear to have stabilized, if they were to slide again, or if commercial real estate values were to decline materially, the Company could experience additional migration into nonperforming assets. An increase in nonperforming assets could have a material adverse effect on our financial condition and results of operations by reducing our income and increasing our expenses. Deterioration in real estate values might also further reduce the amount of loans the Company makes to businesses in the construction and real estate industry, which could negatively impact our organic growth prospects. Similarly, the occurrence of more natural disasters like those California has experienced recently, including fires, flooding, and earthquakes, could impair the value of the collateral we hold for real estate secured loans and negatively impact our results of operations.
Our concentration of commercial real estate, construction and land development, and commercial and industrial loans exposes us to increased lending risks. Commercial and agricultural real estate, commercial construction and land development, and commercial and industrial loans and leases (including agricultural production loans but excluding mortgage warehouse loans), which comprised approximately 75.6% of our total loan portfolio as of December 31, 2020, expose the Company to a greater risk of loss than residential real estate and consumer loans, which were a smaller percentage of the total loan portfolio. Commercial real estate and land development loans typically involve relatively large balances to a borrower or a group of related borrowers, and an adverse development with respect to a larger
19
commercial loan relationship would expose us to greater risk of loss than would issues involving a smaller residential mortgage loan or consumer loan.
Moreover, banking regulators give commercial real estate loans extremely close scrutiny due to risks relating to the cyclical nature of the real estate market and risks for lenders with high concentrations of such loans. The regulators require banks with relatively high levels of CRE loans to implement enhanced underwriting standards, internal controls, risk management policies and portfolio stress testing. If the CRE concentration risk is not properly managed, it could result in higher allowances for possible loan and lease losses. Expectations for higher capital levels have also emerged. Any required increase in our allowance for loan and lease losses could adversely affect our net income, and any requirement that we maintain higher capital levels could adversely impact financial performance measures including earnings per share and return on equity.
Repayment of our commercial loans is often dependent on the cash flows of the borrowers, which may be unpredictable, and the collateral securing these loans may fluctuate in value. At December 31, 2020, we had $253.9 million, or 10.3% of total loans, in commercial loans and leases (including SBA PPP loans, agricultural production loans but excluding mortgage warehouse loans). Commercial lending involves risks that are different from those associated with real estate lending. Real estate lending is generally considered to be collateral based lending with loan amounts based on predetermined loan to collateral values, and liquidation of the underlying real estate collateral being viewed as the primary source of repayment in the event of borrower default. Our commercial loans are primarily extended based on the cash flows of the borrowers, and secondarily on any underlying collateral provided by the borrowers. A borrower’s cash flows may be unpredictable, and collateral securing those loans may fluctuate in value. Although commercial loans are often collateralized by equipment, inventory, accounts receivable, or other business assets, the liquidation of such collateral in the event of default is often an insufficient source of repayment for a number of reasons, including uncollectible accounts receivable and obsolete or special-purpose inventories, among others.
Nonperforming assets adversely affect our results of operations and financial condition, and can take significant time to resolve. Our nonperforming loans may return to elevated levels, which would negatively impact earnings, possibly in a material way depending on the severity. We do not record interest income on non-accrual loans, thereby adversely affecting income levels. Furthermore, when we receive collateral through foreclosures and similar proceedings we are required to record the collateral at its fair market value less estimated selling costs, which may result in charges against our allowance for loan and lease losses if that value is less than the book value of the related loan. Additionally, our noninterest expense has risen materially in adverse economic cycles due to the costs of reappraising adversely classified assets, write-downs on foreclosed assets resulting from declining property values, operating costs related to foreclosed assets, legal and other costs associated with loan collections, and various other expenses that would not typically be incurred in a normal operating environment. A relatively high level of nonperforming assets also increases our risk profile and may impact the capital levels our regulators believe is appropriate in light of such risks. We have utilized various techniques such as loan sales, workouts and restructurings to manage our problem assets. Deterioration in the value of these problem assets, the underlying collateral, or in the borrowers’ performance or financial condition, could adversely affect our business, results of operations and financial condition. In addition, the resolution of nonperforming assets requires a significant commitment of time from Management and Staff, which can be detrimental to their performance of other responsibilities. There can be no assurance that we will avoid increases in nonperforming loans in the future.
We may experience loan and lease losses in excess of our allowance for such losses. We endeavor to limit the risk that borrowers might fail to repay; nevertheless, losses can and do occur. We have established an allowance for estimated loan and lease losses in our accounting records based on:
| ● | historical experience with our loans; |
| ● | our evaluation of economic conditions; |
| ● | regular reviews of the quality, mix and size of the overall loan portfolio; |
| ● | a detailed cash flow analysis for nonperforming loans; |
20
| ● | regular reviews of delinquencies; and |
| ● | the quality of the collateral underlying our loans. |
At any given date, we maintain an allowance for loan and lease losses that we believe is adequate to absorb specifically identified probable losses as well as any other losses inherent in our loan portfolio as of that date. While we strive to carefully monitor credit quality and to identify loans that may become nonperforming, at any given time there may be loans in our portfolio that could result in losses but have not been identified as nonperforming or potential problem loans. We cannot be sure that we will identify deteriorating loans before they become nonperforming assets, or that we will be able to limit losses on loans that have been so identified. Changes in economic, operating and other conditions which are beyond our control, including interest rate fluctuations, deteriorating collateral values, and changes in the financial condition of borrowers may lead to an increase in our estimate of probable losses, or could cause actual loan and lease losses to exceed our current allowance. In addition, the FDIC and the DFPI, as part of their supervisory functions, periodically review our allowance for loan and lease losses. Such agencies may require us to increase our provision for loan and lease losses or to recognize further losses based on their judgment, which may be different from that of our Management. Any such increase in the allowance required by regulators could also hurt our business.
Our use of appraisals in deciding whether to make a loan on or secured by real property does not ensure the value of the collateral. In considering whether to make a loan secured by real property, we generally require an appraisal of the property. However, an appraisal is only an estimate of the value of the property at the time the appraisal is made, and an error in fact or judgment could adversely affect the reliability of the appraisal. In addition, events occurring after the initial appraisal may cause the value of the real estate to decrease. As a result of any of these factors the value of the collateral backing a loan may be less than supposed, and if a default occurs we may not recover the entire outstanding balance of the loan via the liquidation of such collateral.
Section 1.04 Risks Related to our Management
We depend on our executive officers and key personnel to implement our business strategy, and could be harmed by the loss of their services. We believe that our continued growth and success depends in large part upon the skills of our management team and other key personnel. The competition for qualified personnel in the financial services industry is intense, and the loss of key personnel or an inability to attract, retain or motivate key personnel could adversely affect our business. If we are not able to retain our existing key personnel or attract additional qualified personnel, our business operations could be impaired.
Section 1.05 Risks Related to our Other Accounting Estimates
We may experience future goodwill impairment. In accordance with GAAP, we record assets acquired and liabilities assumed at their fair value with the excess of the purchase consideration over the net assets acquired resulting in the recognition of goodwill. We perform a goodwill evaluation at least annually to test for potential impairment. As part of our testing, we assess quantitative factors to determine whether it is more likely than not that the fair value of a reporting unit is less than its carrying amount. If we determine that the fair value of a reporting unit is less than its carrying amount using these quantitative factors, we must record a goodwill impairment charge based on that difference. Adverse conditions in our business climate, including a significant decline in future operating cash flows, a significant change in our stock price or market capitalization, or a deviation from our expected growth rate and performance may significantly affect the fair value of the Company and may trigger goodwill impairment losses, which could be materially adverse to our operating results and financial position. We cannot provide assurance that we will not be required to take an impairment charge in the future. Any impairment charge would have an adverse effect on our shareholders’ equity and financial results and could cause a decline in our stock price.
Changes in accounting standards may affect our performance. Our accounting policies and methods are fundamental to how we record and report our financial condition and results of operations. From time to time the FASB and SEC change the financial accounting and reporting standards that govern the preparation of our financial statements. These changes can be difficult to predict and can materially impact how we report and record our financial condition and results of operations. In some cases, we could be required to apply a new or revised standard retroactively, resulting in a retrospective adjustment to prior financial statements.
21
One significant pronouncement is ASU 2016-13, which was released by the FASB in 2016 and which the Company was initially required to adopt no later than January 1, 2020 (before statutory optional deferrals as described below). ASU 2016-13 included changes to the methodology for determining the amount of the allowance for credit losses, among other things. The new credit loss model is a substantial change from the previous standard in place, as it required the Company to calculate its allowance on the basis of current expected credit losses over the lifetime of its loans (commonly referred to as the “CECL” model), instead of losses inherent in the portfolio as of a point in time. Upon implementation, institutions are required to record a cumulative-effect balance sheet adjustment for financial assets carried at amortized cost for any change in the related allowance for loan and lease losses generated by the adoption of the new standard. The Company’s preliminary evaluation indicates that when adopted, the provisions of ASU 2016-13 would impact our consolidated financial statements, particularly the level of our reserve for credit losses and shareholders’ equity, which could materially affect our financial condition and future results of operations. In March 2020, the Company initially elected under Section 4014 of the CARES Act to defer the implementation of CECL until the earlier of when the national emergency related to the outbreak of COVID-19 ends or December 31, 2020. In December 2020, the Consolidated Appropriations Act, 2021 extended the deferral of implementation of CECL from December 31, 2020, to the earlier of the first day of the fiscal year, beginning after the national emergency terminates or January 1, 2022. The Company will continue to postpone implementation in order to provide additional time to assess better the impact of the COVID-19 pandemic on the expected lifetime credit losses. See Note 2 to the consolidated financial statements under “Recent Accounting Pronouncements” for additional details on ASU 2016-13 and its expected impact on the Company.
Section 1.06 Risks Related to our Growth Strategy
Growing by acquisition entails integration and certain other risks, and our financial condition and results of operations could be negatively affected if our expansion efforts are unsuccessful or we fail to manage our growth effectively. In addition to organic growth and the establishment of de novo branches, over the past several years we have engaged in expansion through acquisitions of branches and whole institutions. We may continue to pursue this growth strategy, within our current footprint and/or via geographic expansion, but there are risks associated with any such expansion. Those risks include, among others, incorrectly assessing the asset quality of a bank acquired in a particular transaction, encountering greater than anticipated costs in integrating acquired businesses, facing resistance from customers or employees, being unable to profitably deploy assets acquired in the transaction, and regulatory compliance risks. To the extent we issue capital stock in connection with additional transactions, if any, these transactions and related stock issuances may have a dilutive effect on earnings per share and share ownership.
Our earnings, financial condition, and prospects after a merger or acquisition depend in part on our ability to successfully integrate the operations of the acquired company. We may be unable to integrate operations successfully or to achieve expected cost savings. Any cost savings which are realized may be offset by losses in revenues or other charges to earnings. There also may be business disruptions that cause us to lose customers or cause customers to remove their accounts from us and move their business to competing financial institutions. In addition, our ability to grow may be limited if we cannot make acquisitions. We compete with other financial institutions with respect to potential acquisitions. We cannot predict if or when we will be able to identify and attract acquisition candidates or make acquisitions on favorable terms.
Section 1.07 Legislative and Regulatory Risks
We are subject to extensive government regulation that could limit or restrict our activities, which in turn may adversely impact our ability to increase our assets and earnings. We operate in a highly regulated environment and are subject to supervision and regulation by a number of governmental regulatory agencies, including the Federal Reserve, the DFPI and the FDIC. Regulations adopted by these agencies, which are generally intended to provide protection for depositors and customers rather than for the benefit of shareholders, govern a comprehensive range of matters relating to ownership and control of our shares, our acquisition of other companies and businesses, permissible activities for us to engage in, maintenance of adequate capital levels, and other aspects of our operations. These bank regulators possess broad authority to prevent or remedy unsafe or unsound practices or violations of law. The laws and regulations applicable to the banking industry could change at any time and we cannot predict the effects of these changes on our business, profitability or growth strategy. Increased regulation could increase our cost of compliance and adversely affect profitability.
Moreover, certain of these regulations contain significant punitive sanctions for violations, including monetary penalties, as well as imposing limitations on a bank’s ability to implement components of its business plan, such as expansion through mergers and acquisitions or the opening of new branch offices. In addition, changes in regulatory requirements may add
22
costs associated with compliance efforts. Furthermore, government policy and regulation, particularly as implemented through the Federal Reserve, significantly affect credit conditions. Negative developments in the financial industry and the impact of new legislation and regulation in response to those developments could negatively impact our business operations and adversely impact our financial performance.
Our expenses could increase as a result of increases in FDIC insurance premiums or other regulatory assessments. The FDIC charges insured financial institutions a premium to maintain the DIF at a certain level. In the event that deteriorating economic conditions increase bank failures, the FDIC ensures payments of deposits up to insured limits from the DIF. Although the Bank’s FDIC insurance assessments have not increased as a result of changes in recent periods, and could possibly even be reduced in the near term, there can be no assurance that the FDIC will not increase assessment rates in the future or that the Bank will not be subject to higher assessment rates as a result of a change in its risk category, either of which could have an adverse effect on the Bank’s earnings.
Previously enacted and potential future regulations could have a significant impact on our business, financial condition and results of operations. Dodd-Frank, which was enacted in 2010, is having a broad impact on the financial services industry, including significant regulatory and compliance changes. Many of the requirements called for in Dodd-Frank will be implemented over time, and most will be facilitated by the enactment of regulations over the course of several years. Given the uncertainty associated with the manner in which the provisions of Dodd-Frank will be implemented, the full extent to which they will impact our operations is unclear. The changes resulting from Dodd-Frank may impact the profitability of business activities, require changes to certain business practices, impose more stringent capital, liquidity and leverage requirements or otherwise adversely affect our business. In particular, the potential impact of Dodd-Frank on our operations and activities, both currently and prospectively, include, among others:
| ● | an increase in our cost of operations due to greater regulatory oversight, supervision and examination of banks and bank holding companies, and higher deposit insurance premiums; |
| ● | the limitation of our ability to expand consumer product and service offerings due to more stringent consumer protection laws and regulations; |
| ● | a negative impact on our cost of funds in a rising interest rate environment, since financial institutions can now pay interest on business checking accounts; |
| ● | a potential reduction in fee income, due to limits on interchange fees applicable to larger institutions which could ultimately lead to a competitive-driven reduction in the fees we receive; and |
| ● | a potential increase in competition due to the elimination of the remaining barriers to de novo interstate branching. |
Further, we may be required to invest significant management attention and resources to evaluate and make any changes necessary to comply with new statutory and regulatory requirements under the Dodd-Frank Act, which could negatively impact our results of operations and financial condition. We cannot predict whether there will be additional laws or reforms that would affect the U.S. financial system or financial institutions, when such changes may be adopted, how such changes may be interpreted and enforced or how such changes may affect us. However, the costs of complying with any additional laws or regulations could have a material adverse effect on our financial condition and results of operations.
Federal and state regulators periodically examine our business, and we may be required to remediate adverse examination findings. The Federal Reserve, the FDIC and the DFPI periodically examine our business, including our compliance with laws and regulations. If, as a result of an examination, a banking agency were to determine that our financial condition, capital resources, asset quality, earnings prospects, management, liquidity or other aspects of any of our operations had become unsatisfactory, or that we were in violation of any law or regulation, they may take a number of different remedial actions as they deem appropriate. These actions include the power to enjoin “unsafe or unsound” practices, to require affirmative action to correct any conditions resulting from any violation or practice, to issue an administrative order that can be judicially enforced, to direct an increase in our capital, to restrict our growth, to assess civil money penalties, to fine or remove officers and directors and, if it is concluded that such conditions cannot be
23
corrected or there is an imminent risk of loss to depositors, to terminate our deposit insurance and place us into receivership or conservatorship. Any regulatory action against us could have an adverse effect on our business, financial condition and results of operations.
We are subject to numerous laws designed to protect consumers, including the Community Reinvestment Act and fair lending laws, and failure to comply with these laws could lead to a wide variety of sanctions. The CRA, the Equal Credit Opportunity Act, the Fair Housing Act and other fair lending laws and regulations prohibit discriminatory lending practices by financial institutions. The U.S. Department of Justice, federal banking agencies and other federal agencies are responsible for enforcing these laws and regulations. A challenge to an institution’s compliance with fair lending laws and regulations, or receiving a less than satisfactory CRA rating, could result in a wide variety of sanctions, including damages and civil money penalties, injunctive relief, restrictions on mergers and acquisitions activity, restrictions on expansion and restrictions on entering new business lines. Private parties may also challenge an institution’s performance under fair lending laws in private class action litigation. Such actions could have a material adverse effect on our business, financial condition, results of operations and growth prospects. In addition, federal, state and local laws have been adopted that are intended to eliminate certain lending practices considered “predatory.” These laws prohibit practices such as steering borrowers away from more affordable products, selling unnecessary insurance to borrowers, repeatedly refinancing loans and making loans without a reasonable expectation that the borrowers will be able to repay the loans irrespective of the value of the underlying property. It is our policy not to make predatory loans, but these laws create the potential for liability with respect to our lending and loan investment activities. They increase our cost of doing business and, ultimately, may prevent us from making certain loans and cause us to reduce the average percentage rate or the points and fees on loans that we do make.
Section 1.08 Risks Related to our Common Stock
You may not be able to sell your shares at the times and in the amounts you want if the price of our stock fluctuates significantly or the trading market for our stock is not active. The market price of our common stock could be impacted by a number of factors, many of which are outside our control. Although our stock has been listed on NASDAQ for many years and our trading volume has increased in recent periods, trading in our stock does not consistently occur in high volumes and the market for our stock cannot always be characterized as active. Thin trading in our stock may exaggerate fluctuations in the stock’s value, leading to price volatility in excess of that which would occur in a more active trading market. In addition, the stock market in general is subject to fluctuations that affect the share prices and trading volumes of many companies, and these broad market fluctuations could adversely affect the market price of our common stock. Factors that could affect our common stock price in the future include but are not necessarily limited to the following:
| ● | actual or anticipated fluctuations in our operating results and financial condition; |
| ● | changes in revenue or earnings estimates or publication of research reports and recommendations by financial analysts; |
| ● | failure to meet analysts’ revenue or earnings estimates; |
| ● | speculation in the press or investment community; |
| ● | strategic actions by us or our competitors, such as acquisitions or restructurings; |
| ● | actions by shareholders; |
| ● | sales of our equity or equity-related securities, or the perception that such sales may occur; |
| ● | fluctuations in the trading volume of our common stock; |
| ● | fluctuations in the stock prices, trading volumes, and operating results of our competitors; |
| ● | market conditions in general and, in particular, for the financial services industry; |
24
| ● | proposed or adopted regulatory changes or developments; |
| ● | regulatory action against us; |
| ● | actual, anticipated or pending investigations, proceedings, or litigation that involve or affect us; and |
| ● | domestic and international economic factors unrelated to our performance. |
The stock market and, more specifically, the market for financial institution stocks, has experienced significant volatility in the past including all of 2020 and the first quarter of 2021. As a result, the market price of our common stock has at times been unpredictable and could be in the future, as well. The capital and credit markets have also experienced volatility and disruption over the past several years, at times reaching unprecedented levels. In some cases, the markets have produced downward pressure on stock prices and adversely impacted credit availability for certain issuers without regard to the issuers’ underlying financial strength.
We could pursue additional capital in the future, which may or may not be available on acceptable terms, could dilute the holders of our outstanding common stock, and may adversely affect the market price of our common stock. Our ability to raise additional capital, if needed, will depend on, among other things, conditions in the capital markets at the time, which are outside of our control, and our financial performance. Furthermore, any capital raising activity could dilute the holders of our outstanding common stock, and may adversely affect the market price of our common stock and performance measures such as return on equity and earnings per share.
Future acquisitions may dilute shareholder ownership and value, especially tangible book value per share. We periodically evaluate opportunities to acquire other financial institutions and/or bank branches, and could incorporate such acquisitions as part of our future growth strategy. Such acquisitions may involve cash, debt, and/or equity securities. Acquisitions typically involve the payment of a premium over book and market values, and, therefore, some dilution of our tangible book value per common share may occur in connection with any future acquisitions. To the extent we issue capital stock in connection with such transactions, the share ownership of our existing shareholders may be diluted.
The Company relies heavily on the payment of dividends from the Bank. Other than $12.0 million in cash available at the holding company level at December 31, 2020, the Company’s ability to meet debt service requirements and pay dividends depends on the Bank’s ability to pay dividends to the Company, as the Company has no other source of significant income. However, the Bank is subject to regulations limiting the amount of dividends it may pay. For example, the payment of dividends by the Bank is affected by the requirement to maintain adequate capital pursuant to the capital adequacy guidelines issued by the Federal Deposit Insurance Corporation. If (i) any capital requirements are increased; and/or (ii) the total risk-weighted assets of the Bank increase significantly; and/or (iii) the Bank’s income declines significantly, the Bank’s Board of Directors may decide or be required to retain a greater portion of the Bank’s earnings to achieve and maintain the required capital or asset ratios. This would reduce the amount of funds available for the payment of dividends by the Bank to the Company. Further, one or more of the Bank’s regulators could prohibit the Bank from paying dividends if, in their view, such payments would constitute unsafe or unsound banking practices. The Bank’s ability to pay dividends to the Company is also limited by the California Financial Code. Whether dividends are paid, and the frequency and amount of such dividends will also depend on the financial condition and performance of the Bank and the decision of the Bank’s Board of Directors. Information concerning the Company’s dividend policy and historical dividend practices is set forth in Item 5 below under “Dividends.” However, no assurance can be given that our future performance will justify the payment of dividends in any particular year.
Your investment may be diluted because of our ability to offer stock to others, and from the exercise of stock options. The shares of our common stock do not have preemptive rights, which means that you may not be entitled to buy additional shares if shares are offered to others in the future. We are authorized to issue up to 24,000,000 shares of common stock, and as of December 31, 2020 we had 15,388,423 shares of common stock outstanding. Except for certain limitations imposed by NASDAQ, nothing restricts our ability to offer additional shares of stock for fair value to others in the future. Any issuances of common stock would dilute our shareholders’ ownership interests and may dilute the per share book value of our common stock. Furthermore, when our directors and officers exercise in-the-money stock options or receive restricted stock units, your ownership in the Company is diluted. As of December 31, 2020, there were outstanding options
25
to purchase an aggregate of 495,489 shares of our common stock with an average exercise price of $23.67 per share. There were also 148,885 shares of restricted stock units outstanding which vest over periods ranging from 1 year to 5 years from initial issuance. At the same date there were an additional 408,515 shares available to grant under our 2017 Stock Incentive Plan.
The holders of our debentures have rights that are senior to those of our shareholders. In 2004 we issued $15,464,000 of junior subordinated debt securities due March 17, 2034, and in 2006 we issued an additional $15,464,000 of junior subordinated debt securities due September 23, 2036 in order to supplement regulatory capital. Moreover, the Coast Bancorp acquisition included $7,217,000 of junior subordinated debt securities due December 15, 2037. All of these junior subordinated debt securities are senior to the shares of our common stock. As a result, we must make interest payments on the debentures before any dividends can be paid on our common stock, and in the event of our bankruptcy, dissolution or liquidation, the holders of debt securities must be paid in full before any distributions may be made to the holders of our common stock. In addition, we have the right to defer interest payments on the junior subordinated debt securities for up to five years, during which time no dividends may be paid to holders of our common stock. In the event that the Bank is unable to pay dividends to us, we may be unable to pay the amounts due to the holders of the junior subordinated debt securities and thus would be unable to declare and pay any dividends on our common stock.
Provisions in our articles of incorporation could delay or prevent changes in control of our corporation or our management. Our articles of incorporation contain provisions for staggered terms of office for members of the board of directors; no cumulative voting in the election of directors; and the requirement that our board of directors consider the potential social and economic effects on our employees, depositors, customers and the communities we serve as well as certain other factors, when evaluating a possible tender offer, merger or other acquisition of the Company. These provisions make it more difficult for another company to acquire us, which could cause our shareholders to lose an opportunity to be paid a premium for their shares in an acquisition transaction and reduce the current and future market price of our common stock.
Shares of any preferred stock issued in the future could have dilutive and other effects on our common stock. Our Articles of Incorporation authorize us to issue 10,000,000 shares of preferred stock, none of which is presently outstanding. Although our Board of Directors has no present intention to authorize the issuance of shares of preferred stock, such shares could be authorized in the future. If such shares of preferred stock are made convertible into shares of common stock, there could be a dilutive effect on the shares of common stock then outstanding. In addition, shares of preferred stock may be provided a preference over holders of common stock upon our liquidation or with respect to the payment of dividends, in respect of voting rights, or in the redemption of our common stock. The rights, preferences, privileges and restrictions applicable to any series or preferred stock would be determined by resolution of our Board of Directors.
Section 1.09 Risks Related to the Business of Banking in General
If we are not able to successfully keep pace with technological changes in the industry, our business could be hurt. The financial services industry is constantly undergoing technological change, with the frequent introduction of new technology-driven products and services. The effective use of technology increases efficiency and enables financial institutions to better serve clients and reduce costs. Our future success depends, in part, upon our ability to respond to the needs of our clients by using technology to provide desired products and services and create additional operating efficiencies. Some of our competitors have substantially greater resources to invest in technological improvements. We may not be able to effectively implement new technology-driven products and services or be successful in marketing these products and services to our clients. Failure to keep pace with technological change in the financial services industry could have a material adverse impact on our business and, in turn, on our financial condition and results of operations.
Unauthorized disclosure of sensitive or confidential customer information, whether through a cyber-attack, other breach of our computer systems or any other means, could severely harm our business. In the normal course of business we collect, process and retain sensitive and confidential customer information. Despite the security measures we have in place, our facilities and systems may be vulnerable to cyber-attacks, security breaches, acts of vandalism, computer viruses, misplaced or lost data, programming and/or human errors, or other similar events.
In recent periods there has been a rise in fraudulent electronic activity, security breaches, and cyber-attacks, including in the banking sector. Some financial institutions have reported breaches of their websites and systems which have involved
26
sophisticated and targeted attacks intended to misappropriate sensitive or confidential information, destroy or corrupt data, disable or degrade service, disrupt operations and/or sabotage systems. These breaches can remain undetected for an extended period of time. Furthermore, our customers and employees have been, and will continue to be, targeted by parties using fraudulent e-mails and other communications that may appear to be legitimate messages sent by the Bank, in attempts to misappropriate passwords, card numbers, bank account information or other personal information or to introduce viruses or malware to personal computers. Information security risks for financial institutions have increased in part because of new technologies, mobile services and other web-based products used to conduct financial and other business transactions, as well as the increased sophistication and activities of organized crime, perpetrators of fraud, hackers, terrorists and others. The secure maintenance and transmission of confidential information, as well as the secure and reliable execution of transactions over our systems, are essential to protect us and our customers and to maintain our customers’ confidence. Despite our efforts to identify, contain and mitigate these threats through detection and response mechanisms, product improvement, the use of encryption and authentication technology, and customer and employee education, such attempted fraudulent activities directed against us, our customers, and third party service providers remain a serious issue. The pervasiveness of cyber security incidents in general and the risks of cyber-crime are complex and continue to evolve.
We also face risks related to cyber-attacks and other security breaches in connection with debit card transactions, which typically involve the transmission of sensitive information regarding our customers through various third parties. Some of these parties have in the past been the target of security breaches and cyber-attacks, and because the transactions involve third parties and environments that we do not control or secure, future security breaches or cyber-attacks affecting any of these third parties could impact us through no fault of our own, and in some cases we may have exposure and suffer losses for breaches or attacks relating to them. We also rely on third party service providers to conduct certain other aspects of our business operations, and face similar risks relating to them. While we require regular security assessments from those third parties, we cannot be sure that their information security protocols are sufficient to withstand a cyber-attack or security breach.
Any cyber-attack or other security breach involving the misappropriation or loss of Company assets or those of its customers, or unauthorized disclosure of confidential customer information, could severely damage our reputation, erode confidence in the security of our systems, products and services, expose us to the risk of litigation and liability, disrupt our operations, and have a material adverse effect on our business.
If our information systems were to experience a system failure, our business and reputation could suffer. We rely heavily on communications and information systems to conduct our business. The computer systems and network infrastructure we use could be vulnerable to unforeseen problems. Our operations are dependent upon our ability to minimize service disruptions by protecting our computer equipment, systems, and network infrastructure from physical damage due to fire, power loss, telecommunications failure or a similar catastrophic event. We have protective measures in place to prevent or limit the effect of the failure or interruption of our information systems, and will continue to upgrade our security technology and update procedures to help prevent such events. However, if such failures or interruptions were to occur, they could result in damage to our reputation, a loss of customers, increased regulatory scrutiny, or possible exposure to financial liability, any of which could have a material adverse effect on our financial condition and results of operations.
We are subject to a variety of operational risks, including reputational risk, legal risk, compliance risk, the risk of fraud or theft by employees or outsiders, and the risk of clerical or record-keeping errors, which may adversely affect our business and results of operations. If personal, non-public, confidential or proprietary customer information in our possession were to be mishandled or misused, we could suffer significant regulatory consequences, reputational damage and financial loss. This could occur, for example, if information was erroneously provided to parties who are not permitted to have the information, either by fault of our systems, employees, or counterparties, or where such information is intercepted or otherwise inappropriately taken by third parties.
Because the nature of the financial services business involves a high volume of transactions, certain errors may be repeated or compounded before they are discovered and successfully remediated. Our necessary dependence upon automated systems to record and process transactions and our large transaction volume may further increase the risk that technical flaws or employee tampering or manipulation of those systems could result in losses that are difficult to detect. We also may be subject to disruptions of our operating systems arising from events that are wholly or partially beyond our control
27
(for example, computer viruses or electrical or telecommunications outages, or natural disasters, disease pandemics or other damage to property or physical assets) which may give rise to disruption of service to customers and to financial loss or liability. We are further exposed to the risk that our external vendors may be unable to fulfill their contractual obligations (or will be subject to the same risk of fraud or operational errors by their employees) and to the risk that our (or our vendors’) business continuity and data security efforts might prove to be inadequate. The occurrence of any of these risks could result in a diminished ability to operate our business (for example, by requiring us to expend significant resources to correct the defect), as well as potential liability to clients, reputational damage and regulatory intervention, which could adversely affect our business, financial condition and results of operations, perhaps materially.
We may be adversely affected by the financial stability of other financial institutions. Our ability to engage in routine transactions could be adversely affected by the actions and liquidity of other financial institutions. Financial institutions are often interconnected as a result of trading, clearing, counterparty, or other business relationships. We have exposure to many different industries and counterparties, and routinely execute transactions with counterparties in the financial services industry, including commercial banks, brokers and dealers, investment banks, and other institutional clients. Many of these transactions expose us to credit risk in the event of a default by a counterparty or client. Even if the transactions are collateralized, credit risk could exist if the collateral held by us cannot be liquidated at prices sufficient to recover the full amount of the credit or derivative exposure due to us. Any such losses could adversely affect our business, financial condition or results of operations.
ITEM 1B. UNRESOLVED STAFF COMMENTS
Not applicable.
ITEM 2. PROPERTIES
The Company’s administrative headquarters is housed in a 37,000 square foot, three-story office building located at 86 North Main Street, Porterville, California, and our main office consists of a one-story brick building located at 90 N. Main Street, Porterville, California, adjacent to our administrative headquarters. Both of those buildings are situated on unencumbered property owned by the Company. The Company also owns unencumbered property on which 18 of our other offices are located, namely the following branches: Bakersfield Ming, California City, Dinuba, Exeter, Farmersville, Fresno Shaw, Hanford, Lindsay, Lompoc, Porterville West Olive, San Luis Obispo, Santa Paula, Tehachapi Downtown, Tehachapi Old Town, Three Rivers, Tulare, Visalia Mooney and Woodlake. The remaining branches, as well as our technology center, loan production office in Rocklin, and remote ATM locations, are leased from unrelated parties. Management believes that existing back-office facilities are adequate to accommodate the Company’s operations for the immediately foreseeable future.
ITEM 3. LEGAL PROCEEDINGS
From time to time the Company is a party to claims and legal proceedings arising in the ordinary course of business. After taking into consideration information furnished by counsel to the Company as to the current status of these claims or proceedings to which the Company is a party, Management is of the opinion that the ultimate aggregate liability represented thereby, if any, will not have a material adverse effect on the financial condition of the Company.
ITEM 4. MINE SAFETY DISCLOSURES
Not applicable.
28
PART II
ITEM 5. MARKET FOR REGISTRANT’S COMMON EQUITY, RELATED SHAREHOLDER MATTERS AND ISSUER PURCHASES OF EQUITY SECURITIES
(a) Market Information
Sierra Bancorp’s Common Stock trades on the NASDAQ Global Select Market under the symbol BSRR, and the CUSIP number for our stock is #82620P102. Trading in the Company’s Common Stock has not consistently occurred in high volumes, and such trading activity cannot always be characterized as an active trading market.
The following table summarizes trades of the Company’s Common Stock, setting forth the approximate high and low sales prices and volume of trading for the periods indicated, based upon information available via public sources:
Sale Price Of The Company's | Approximate Trading | |||||
Calendar | Common Stock | Volumes | ||||
Quarter End |
| High |
| Low |
| Shares |
March 31, 2019 | $ | 27.81 | $ | 22.68 | $ | 1,928,277 |
June 30, 2019 | 27.98 | 24.01 | 1,385,742 | |||
September 30, 2019 | 27.36 | 23.75 | 1,851,314 | |||
December 31, 2019 | 30.15 | 25.78 | 2,064,085 | |||
March 31, 2020 | 29.37 | 13.05 | 2,721,500 | |||
June 30, 2020 | 21.87 | 14.86 | 3,491,600 | |||
September 30, 2020 | 20.13 | 15.84 | 2,434,100 | |||
December 31, 2020 | 24.72 | 16.47 | 2,416,100 | |||
(b) Holders
As of January 31, 2021 there were an estimated 6,292 shareholders of the Company’s Common Stock. There were 757 registered holders of record on that date, and per Broadridge, an investor communication company, there were 5,535 beneficial holders with shares held under a street name, including “objecting beneficial owners” whose names and addresses are unavailable. Since some holders maintain multiple accounts, it is likely that the above numbers overstate the actual number of the Company’s shareholders.
(c) Dividends
The Company paid cash dividends totaling $12.2 million, or $0.80 per share in 2020 and $11.3 million, or $0.74 per share in 2019, which represents 34% of annual net earnings for 2020 and 32% for 2019. The Company’s general dividend policy is to pay cash dividends within the range of typical peer payout ratios, provided that such payments do not adversely affect the Company’s financial condition and are not overly restrictive to its growth capacity. However, in the past when many of our peers elected to suspend dividend payments, the Company’s Board determined that we should continue to pay a certain level of dividends without regard to peer payout ratios, as long as our core operating performance was adequate and policy or regulatory restrictions did not preclude such payments. That said, no assurance can be given that our financial performance in any given year will justify the continued payment of a certain level of cash dividend, or any cash dividend at all.
As a bank holding company that currently has no significant assets other than its equity interest in the Bank, the Company’s ability to declare dividends depends upon cash on hand as supplemented by dividends from the Bank. The Bank’s dividend practices in turn depend upon the Bank’s earnings, financial position, regulatory standing, ability to meet current and anticipated regulatory capital requirements, and other factors deemed relevant by the Bank’s Board of Directors. The authority of the Bank’s Board of Directors to declare cash dividends is also subject to statutory restrictions. Under California banking law, the Bank may at any time declare a dividend in an amount not to exceed the lesser of (i) its retained earnings, or (ii) its net income for the last three fiscal years reduced by distributions to the Bank’s shareholder during such
29
period. However, with the prior approval of the California Commissioner of Department of Financial Protection and Innovation, the Bank may declare a larger dividend, in an amount not exceeding the greatest of (i) the retained earnings of the Bank, (ii) the net income of the Bank for its last fiscal year, or (iii) the net income of the Bank for its current fiscal year.
The Company’s ability to pay dividends is also limited by state law. California law allows a California corporation to pay dividends if its retained earnings equal at least the amount of the proposed dividend plus any preferred dividend arrears amount. If a California corporation does not have sufficient retained earnings available for the proposed dividend, it may still pay a dividend to its shareholders if immediately after the dividend the value of the company’s assets would equal or exceed the sum of its total liabilities plus any preferred dividend arrears amount. In addition, during any period in which the Company has deferred the payment of interest otherwise due and payable on its subordinated debt securities, it may not pay any dividends or make any distributions with respect to its capital stock (see “Item 7, Management’s Discussion and Analysis of Financial Condition and Results of Operations – Capital Resources”).
(d) Securities Authorized for Issuance under Equity Compensation Plans
The following table provides information as of December 31, 2020 with respect to stock options and restricted stock units outstanding, and available under our 2017 Stock Incentive Plan and the now-terminated 2007 Stock Incentive Plan, which are our only equity compensation plans other than an employee benefit plan meeting the qualification requirements of Section 401(a) of the Internal Revenue Code:
Plan Category |
| Number of Securities to be Issued Upon Vesting of Restricted Stock Units | Number of Securities |
| Weighted-Average |
| Number of Securities | ||
Equity compensation plans approved by security holders | 148,885 | 495,489 | $ | 23.67 | 408,515 | ||||
30
(e) Performance Graph
Below is a five-year performance graph comparing the cumulative total return on the Company’s common stock to the cumulative total returns of the NASDAQ Composite Index (a broad equity market index), the SNL Bank Index, and the SNL $1 billion to $5 billion Bank Index (the latter two qualifying as peer bank indices), assuming a $100 investment on December 31, 2014 and the reinvestment of dividends.
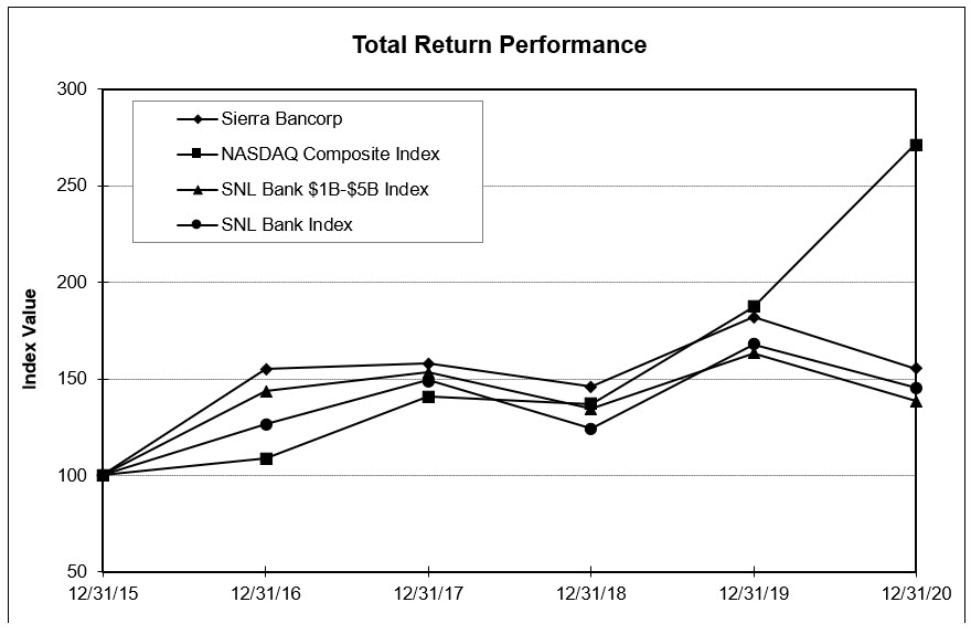
Period Ending | ||||||||||||
Index |
| 12/31/2015 |
| 12/31/2016 |
| 12/31/2017 |
| 12/31/2018 |
| 12/31/2019 |
| 12/31/2020 |
Sierra Bancorp | 100.00 | 154.87 | 157.99 | 146.24 | 182.19 | 155.42 | ||||||
NASDAQ Composite | 100.00 | 108.87 | 141.13 | 137.12 | 187.44 | 271.64 | ||||||
SNL Bank $1B-$5B | 100.00 | 143.87 | 153.37 | 134.37 | 163.35 | 138.81 | ||||||
SNL Bank | 100.00 | 126.35 | 149.21 | 124.00 | 167.93 | 145.49 | ||||||
Source: S&P Global Market Intelligence
(f) Stock Repurchases
In September 2016 the Board authorized an additional 500,000 shares of common stock for repurchase under the Company’s existing stock buyback plan initially adopted in 2003. The 2003 repurchase plan has no expiration date, but from time-to-time, the Company will authorize additional shares to be repurchased if all previous authorizations have been exhausted. At this time, the Company has 344,862 shares remaining under the 2016 additional authorization, but has currently suspended repurchasing shares. The Company may resume repurchasing shares at a later date. The authorization of shares for repurchase does not provide assurance that a specific quantity of shares will be repurchased, and the program may be suspended at any time at Management’s discretion.
31
ITEM 6. SELECTED FINANCIAL DATA
The following table presents selected historical financial information concerning the Company, which should be read in conjunction with our audited consolidated financial statements, including the related notes, and “Management’s Discussion and Analysis of Financial Condition and Results of Operations” included elsewhere herein. The selected financial data as of December 31, 2020 and 2019, and for each of the years in the three year period ended December 31, 2018, is derived from our audited consolidated financial statements and related notes which are included in this Annual Report. The selected financial data presented for earlier years is from our audited financial statements which are not included in this Annual Report. Throughout this Annual Report, information is for the consolidated Company unless otherwise stated.
32
Selected Financial Data | |||||||||||||||
(dollars in thousands, except per share data) | |||||||||||||||
As of and for the years ended December 31, | |||||||||||||||
Operating Data |
| 2020 |
| 2019 |
| 2018 |
| 2017 |
| 2016 | |||||
Interest income | $ | 110,243 | $ | 110,947 | $ | 101,638 | $ | 80,924 | $ | 68,505 | |||||
Interest expense | 5,408 | 13,578 | 9,244 | 5,223 | 3,323 | ||||||||||
Net interest income before provision for loan and lease losses | 104,835 | 97,369 | 92,394 | 75,701 | 65,182 | ||||||||||
Provision (benefit) for loan and lease losses | 8,550 | 2,550 | 4,350 | (1,140) | — | ||||||||||
Noninterest income | 26,150 | 23,477 | 21,564 | 21,779 | 19,238 | ||||||||||
Noninterest expense | 75,912 | 70,578 | 70,024 | 65,441 | 58,053 | ||||||||||
Income before income taxes | 46,523 | 47,718 | 39,584 | 33,179 | 26,367 | ||||||||||
Provision for income taxes | 11,079 | 11,757 | 9,907 | 13,640 | 8,800 | ||||||||||
Net income | 35,444 | 35,961 | 29,677 | 19,539 | 17,567 | ||||||||||
Selected Balance Sheet Summary | |||||||||||||||
Total loans and leases, net | 2,442,226 | 1,755,538 | 1,724,780 | 1,551,551 | 1,255,754 | ||||||||||
Allowance for loan and lease losses | 17,738 | 9,923 | 9,750 | 9,043 | 9,701 | ||||||||||
Securities available for sale | 543,974 | 600,799 | 560,479 | 558,329 | 530,083 | ||||||||||
Cash and due from banks | 71,417 | 80,077 | 74,132 | 70,137 | 120,442 | ||||||||||
Foreclosed assets | 971 | 800 | 1,082 | 5,481 | 2,225 | ||||||||||
Premises and equipment, net | 27,505 | 27,435 | 29,500 | 29,388 | 28,893 | ||||||||||
Total interest-earning assets | 2,989,709 | 2,370,858 | 2,286,952 | 2,118,875 | 1,827,192 | ||||||||||
Total assets | 3,220,742 | 2,593,819 | 2,522,502 | 2,340,298 | 2,032,873 | ||||||||||
Total interest-bearing liabilities | 1,898,104 | 1,558,080 | 1,561,039 | 1,417,590 | 1,277,416 | ||||||||||
Total deposits | 2,624,606 | 2,168,374 | 2,116,340 | 1,988,386 | 1,695,471 | ||||||||||
Total liabilities | 2,876,846 | 2,284,534 | 2,249,478 | 2,084,356 | 1,826,995 | ||||||||||
Total shareholders' equity | 343,896 | 309,285 | 273,024 | 255,942 | 205,878 | ||||||||||
Per Share Data | |||||||||||||||
Net income per basic share | 2.33 | 2.35 | 1.94 | 1.38 | 1.30 | ||||||||||
Net income per diluted share | 2.32 | 2.33 | 1.92 | 1.36 | 1.29 | ||||||||||
Book value | 22.35 | 20.24 | 17.84 | 16.81 | 14.94 | ||||||||||
Cash dividends | 0.80 | 0.74 | 0.64 | 0.56 | 0.48 | ||||||||||
Weighted average common shares outstanding basic | 15,216,749 | 15,311,113 | 15,261,794 | 14,172,196 | 13,530,293 | ||||||||||
Weighted average common shares outstanding diluted | 15,280,325 | 15,437,111 | 15,432,120 | 14,357,782 | 13,651,804 | ||||||||||
Key Operating Ratios: | |||||||||||||||
Performance Ratios: (1) | |||||||||||||||
Return on average equity | 10.80% | 12.23% | 11.37% | 8.82% | 8.71% | ||||||||||
Return on average assets | 1.22% | 1.40% | 1.23% | 0.93% | 0.95% | ||||||||||
Net interest spread (tax-equivalent) (4) | 3.83% | 3.90% | 4.03% | 3.90% | 3.86% | ||||||||||
Net interest margin (tax-equivalent) | 3.95% | 4.19% | 4.24% | 4.04% | 3.95% | ||||||||||
Dividend payout ratio | 34.33% | 31.49% | 32.99% | 40.61% | 36.97% | ||||||||||
Equity to assets ratio | 11.28% | 11.44% | 10.80% | 10.53% | 10.93% | ||||||||||
Efficiency ratio (tax-equivalent) | 57.18% | 57.46% | 60.79% | 65.52% | 67.23% | ||||||||||
Net loans to total Deposits at Period end | 93.05% | 80.96% | 81.50% | 78.03% | 74.07% | ||||||||||
Asset Quality Ratios: (1) | |||||||||||||||
Non-performing loans to total loans (2) | 0.31% | 0.33% | 0.30% | 0.25% | 0.50% | ||||||||||
Non-performing assets to total loans and other real estate owned (2) | 0.35% | 0.37% | 0.36% | 0.60% | 0.68% | ||||||||||
Net (recoveries) charge-offs to average loans | 0.04% | 0.14% | 0.22% | (0.04)% | 0.06% | ||||||||||
Allowance for loan and lease losses to total loans at period end | 0.72% | 0.56% | 0.57% | 0.58% | 0.77% | ||||||||||
Allowance for Loan and Lease Losses to Non-Performing Loans | 233.46% | 172.96% | 189.10% | 228.19% | 152.41% | ||||||||||
Regulatory Capital Ratios: (3) | |||||||||||||||
Common equity tier 1 capital to risk-weighted assets | NA | 13.27% | 12.61% | 12.84% | 14.09% | ||||||||||
Tier 1 capital to adjusted average assets (leverage ratio) | 10.50% | 11.91% | 11.49% | 11.32% | 11.92% | ||||||||||
Tier 1 capital to risk-weighted assets | NA | 14.98% | 14.38% | 14.79% | 16.53% | ||||||||||
Total capital to risk-weighted assets | NA | 15.48% | 14.89% | 15.32% | 17.25% | ||||||||||
| (1) | Asset quality ratios are end of period ratios. Performance ratios are based on average daily balances during the periods indicated. |
| (2) | Performing TDR’s are not included in nonperforming loans and are therefore not included in the numerators used to calculate these ratios. |
| (3) | For definitions and further information relating to regulatory capital requirements, see “Item 1, Business - Supervision and Regulation - Capital Adequacy Requirements” herein. |
| (4) | Represents the average rate earned on interest-earning assets less the average rate paid on interest-bearing liabilities. |
33
ITEM 7. MANAGEMENT’S DISCUSSION AND ANALYSIS OF FINANCIAL CONDITION AND RESULTS OF OPERATIONS
This discussion presents Management’s analysis of the Company’s financial condition as of December 31, 2020 and 2019, and the results of operations for each year in the three-year period ended December 31, 2020. The discussion should be read in conjunction with the Company’s consolidated financial statements and the notes related thereto presented elsewhere in this Form 10-K Annual Report (see Item 8 below).
Statements contained in this report or incorporated by reference that are not purely historical are forward looking statements within the meaning of Section 21E of the Securities Exchange Act of 1934 as amended, including the Company’s expectations, intentions, beliefs, or strategies regarding the future. All forward-looking statements concerning economic conditions, growth rates, income, expenses, or other values which are included in this document are based on information available to the Company on the date noted, and the Company assumes no obligation to update any such forward-looking statements. It is important to note that the Company’s actual results could materially differ from those in such forward-looking statements. Risk factors that could cause actual results to differ materially from those in forward-looking statements include but are not limited to those outlined previously in Item 1A.
Critical Accounting Policies
The Company’s financial statements are prepared in accordance with accounting principles generally accepted in the United States. The financial information and disclosures contained within those statements are significantly impacted by Management’s estimates and judgments, which are based on historical experience and incorporate various assumptions that are believed to be reasonable under current circumstances. Actual results may differ from those estimates under divergent conditions.
Critical accounting policies are those that involve the most complex and subjective decisions and assessments and have the greatest potential impact on the Company’s stated results of operations. In Management’s opinion, the Company’s critical accounting policies deal with the following areas: the establishment of an allowance for loan and lease losses, as explained in detail in Note 2 to the consolidated financial statements and in the “Provision for Loan and Lease Losses” and “Allowance for Loan and Lease Losses” sections of this discussion and analysis; the valuation of impaired loans and foreclosed assets, as discussed in Note 2 to the consolidated financial statements; income taxes and deferred tax assets and liabilities, especially with regard to the ability of the Company to recover deferred tax assets as discussed in the “Provision for Income Taxes” and “Other Assets” sections of this discussion and analysis; and goodwill and other intangible assets, which are evaluated annually for impairment and for which we have determined that no impairment exists, as discussed in Note 2 to the consolidated financial statements and in the “Other Assets” section of this discussion and analysis. Critical accounting areas are evaluated on an ongoing basis to ensure that the Company’s financial statements incorporate the most recent expectations with regard to those areas.
Overview of the Results of Operations and Financial Condition
Results of Operations Summary
The Company recognized net income of $35.4 million in 2020 relative to $36.0 million in 2019 and $29.7 million in 2018. Net income per diluted share was $2.32 in 2020, as compared to $2.33 in 2019 and $1.92 for 2018. The Company’s return on average assets and return on average equity were 1.22% and 10.80%, respectively, in 2020, as compared to 1.40% and 12.23%, respectively, in 2019 and 1.23% and 11.37%, respectively, for 2018. Our financial results have been stable over the past year despite a higher level of loan and lease loss provisioning and elevated noninterest expenses, due to a higher volume of loans, and a strong base of core deposits, combined with a higher level of nonrecurring items, as discussed in greater detail in the applicable sections below. Furthermore, the Company’s financial performance was favorably affected by a substantially lower corporate income tax rate starting in 2018. The following is a summary of the major factors that impacted the Company’s results of operations for the years presented in the consolidated financial statements.
| ● | Net interest income improved by 8% in 2020 over 2019 and 5% in 2019 over 2018, due primarily to a lower cost of interest-bearing liabilities and growth in earning assets. The increase in average earning |
34
| assets in 2020 over 2019 was due primarily to a $170.2 million increase in average balance of real estate loans, a $62.2 million increase in average balances of commercial loans, and a $87.1 million increase in average balances of mortgage warehouse loans, partially offset by decreases in other loan categories. The increase in real estate loans was organic, driven by concerted business development efforts by our loan production offices in 2020. The increase in commercial loans was due to the Company’s participation in the SBA Paycheck Protection Program (PPP) lending initiative, in order to assist our customers impacted by the COVID-19 Pandemic. The increase in average mortgage warehouse loans throughout 2020 was primarily a result of increased demand for housing and refinancing due to low rates in 2020 coupled with proactive mortgage warehouse pricing and marketing to mortgage lenders. The positive impact of average asset growth in 2020 was augmented by a 54 bps decrease in yield on interest bearing liabilities but was partially offset by a 60 basis point decline in yield on interest earning assets. The net interest margin in 2020 was 24 bps lower than 2019. |
The increase in average earning assets in 2019 over 2018 was due primarily to a $90.0 million increase in average balance of real estate loans and a $48.1 million increase in average balances of mortgage warehouse loans, partially offset by decreases in other loan categories. The increase in real estate loans was driven primarily by organic growth in late 2018 and early 2019 but were offset by paydowns in the second half of 2019. The increase in average mortgage warehouse loans in 2019 was primarily a result of proactive pricing and marketing to mortgage lenders in the lower mortgage rate cycle in 2019. The positive impact of average asset growth in 2019 was partially offset by a 5 basis point decline in net interest margin due to the lower rate environment in the second half of 2019.
Net interest income has also been impacted by nonrecurring interest items, which added $0.38 million to interest income in 2020 relative to $0.82 million in 2019 and $0.28 million in 2018.
| ● | We recorded a loan and lease loss provision of $8.6 million in 2020, as compared to $2.6 million in 2019 and $4.4 million in 2018. The 2020 provision was deemed necessary subsequent to our determination of the appropriate level for our allowance for loan and lease losses and was driven by strong loan growth in the second half of 2020 and continued uncertainty surrounding the estimated impact that COVID-19 has had on the economy and our loan customers overall. In addition, we considered the impacts of credit quality, organic growth in non-owner occupied commercial real estate loan balances, reserves required for specifically identified impaired loan balances, and downgrades of certain loans deferred under section 4013 of the CARES Act. The 2019 and 2018 provisions were deemed necessary subsequent to our determination of the appropriate level for our allowance for loan and lease losses, taking into consideration overall credit quality, growth in outstanding loan balances, and reserves required for specifically identified impaired loan balances (including reserves in 2019 for a $2.8 million loan that was placed on non-accrual status shortly before the end of the third quarter and partially charged off in the fourth quarter of 2019.) |
| ● | Noninterest income increased by $2.7 million, or 11%, in 2020, and by $1.9 million or 9%, in 2019 over 2018. The increase in 2020 was primarily due to a $1.5 million gain from the wrap up of low-income housing tax credit fund investments, a decrease of $0.9 million in low-income housing tax credit fund expenses, an increase of $0.2 million in the valuation gain of restricted equity investments owned by the Company and a $0.6 million increase in the net gain on the sale of debt securities. Fluctuations in BOLI associated with deferred compensation plans contributed $0.2 million to the increase. The increase in 2019 was primarily due to favorable fluctuation in bank-owned life insurance (“BOLI”) income associated with deferred compensation income, and a nonrecurring charge in 2018 as described below. |
| ● | Noninterest expense increased by $5.3 million, or 8%, in 2020 as compared to 2019, and increased by $0.55 million, or 1%, in 2019 over 2018. The increase in noninterest expense in 2020 was due mostly to a $4.2 million increase in salaries and benefits expense. Deposit services and other professional services also contributed to the difference. The slight increase in noninterest expense in 2019 was due mostly to other real estate owned (“OREO”) expense and directors deferred compensation expense associated with the BOLI income described above. |
35
| ● | The Company recorded income tax provisions of $11.1 million, or 24% of pre-tax income in 2020; $11.8 million, or 25% of pre-tax income in 2019; and $9.9 million, or 25% of pre-tax income in 2018. As expected, the overall tax rate remained relatively stable throughout 2020, 2019 and 2018. |
Financial Condition Summary
The Company’s assets totaled $3.2 billion at December 31, 2020 as compared to $2.6 billion at December 31, 2019. Total liabilities were $2.9 billion at December 31, 2020 as compared to $2.3 billion at the end of 2019, and shareholders’ equity totaled $343.9 million at December 31, 2020 compared to $309.3 million at December 31, 2019. The following is a summary of key balance sheet changes during 2020.
| ● | Total assets increased by $626.9 million, or 24%. The increase resulted primarily from earning asset growth including $694.5 million of loan growth (net of deferred fees), partially offset by a $56.8 million decrease in investment securities. |
| ● | Loans and leases (net of deferred fees) were up $694.5 million, or 39%. Loan growth consisted mainly of a $507.9 million increase in non-agricultural real estate loans, as well as a $118.6 million increase in mortgage warehouse lines, and $119.4 million in SBA PPP loans. |
| ● | Deposit balances reflect net growth of $456.2 million, or 21%. Deposit growth in 2020 was primarily a result of organic growth of noninterest bearing or low-cost transaction accounts, including savings accounts. The increase in brokered deposits offset the decrease in customer time deposits. |
| ● | Total capital increased by $34.6 million, or 11%, ending the year with a balance of $343.9 million. The increase in capital is due mostly to the addition of net income and capital from stock options exercised, net of dividends paid. |
IMPACT OF CORONAVIRUS DISEASE 2019 (COVID-19) PANDEMIC ON THE COMPANY’S OPERATIONS
Overview
On January 31, 2020, the United States Department of Health and Human Services declared a public health emergency with respect to the Coronavirus Disease 2019 (COVID-19). Subsequent to this date, federal, state, and local governmental agencies, regulatory agencies, and the Federal Reserve Board took actions impacting the Company including these more significant items:
| ● | On March 3, 2020, the Federal Open Market Committee (FOMC) of the Federal Reserve Board lowered the federal funds rate by 50 basis points in its first emergency move since October 2008. |
| ● | On March 4, 2020, the Governor of the state of California declared a state of emergency to help make additional resources available and formalize emergency actions to address COVID-19. |
| ● | On March 6, 2020, the Federal Financial Institutions Examination Council (FFIEC) issued guidance to financial institutions reminding them to include pandemic planning in business continuity plans. |
| ● | Starting on March 9, 2020, the Board of Governors of the Federal Reserve System, Consumer Financial Protection Bureau, Federal Deposit Insurance Corporation, National Credit Union Administration, Office of the Comptroller of the Currency, and Conference of State Bank Supervisors began issuing various Interagency Guidance Statements to encourage financial institutions to meet the financial needs of customers affected by the Coronavirus. |
| ● | On March 11, 2020, the World Health Organization declared COVID-19 a pandemic. |
36
| ● | On March 15, 2020, the FOMC of the Federal Reserve Board lowered the federal funds rate by 100 basis points in its second emergency move in two weeks, this time on a Sunday. In addition, the FOMC announced that it would let banks borrow from the discount window for up to 90 days, reduced the reserve requirement ratios to zero percent, united with five other central banks to ensure dollars are available via swap lines, and increased bond holdings by at least $700 billion. |
| ● | Effective March 20, 2020, the state of California ordered the closure of all non-essential workplaces, restricting non-essential travel, and ordering a state-wide shelter-in-place order. This was followed by extensions of these orders in April and many local municipalities in which the Company operates issued orders mandating additional requirements to protect their citizens. Although many counties in California began phased reopening plans, due to recent increases in cases effective July 13, 2020, the Governor ordered that dine-in restaurants, wineries and tasting rooms, movie theaters, family entertainment centers, zoos and museums, and cardrooms immediately close all indoor operations. Effective August 31, 2020, a new simplified, four-tier guideline was implemented for counties to reopen. Counties must remain in a tier for at least three weeks before moving to the next tier. This four-tier guideline was suspended and a state-wide shelter-in-place order was reinstated on December 3, 2020, amid surging cases in California. California returned to its four-tier system on January 25, 2021. |
| ● | On March 22, 2020, the federal financial institution regulatory agencies (the agencies) issued guidance to financial institutions to suspend the requirements to classify certain loan modifications as troubled debt restructurings (TDRs). The guidance was subsequently modified on April 7, 2020 to conform with Section 4013 of the CARES Act. Further interagency guidance for financial institutions was issued in June, August, and September 2020. |
| ● | On March 27, 2020, the CARES Act was enacted by Congress and signed into law by the President to address the impact of the COVID-19 on the economy. Among other things, the CARES Act provided banking institutions with the option of deferring the implementation of the Current Expected Credit Loss (“CECL”) accounting method under Financial Accounting Standards Board (FASB) Accounting Standards Update 2016-13 and related amendments, Financial Instruments – Credit Losses (Topic 326) until later in 2020; confirmed that certain loan modifications would not be treated as a TDR; authorized the Small Business Administration to create the Paycheck Protection Program (PPP) which allows banking institutions to offer a certain amount of forgivable loans to primarily assist with funding payroll for small businesses; and provides a temporary reduction to the minimum ratio under the Community Bank Leverage Ratio framework. |
| ● | On December 21, 2020, the Consolidated Appropriation Act, 2021 was enacted by Congress and signed into law by the President on December 27, 2020. The bill is one of the largest spending measures ever enacted surpassing the CARES Act. The pandemic relief portion of the bill includes $284 billion in forgivable loans via the PPP, extension of the suspension of TDR identification, and the extension of the temporary delay of the implementation of CECL. |
37
Impact of COVID-19 on the Company’s Operations
| ● | The Company has had an $18.1 million increase in classified assets, including $1.4 million in non-accrual loans as a result of COVID-19 due to loans modified under the Interagency Guidance that are either not expected to make all principal and interest payments in a timely manner, or have had further modifications or assistance. Further, we had charge-offs as a result of COVID-19 of less than $0.02 million. Starting in April 2020, the Company took actions to mitigate the impact on credit losses including permitting short-term payment deferrals to current customers, as well as providing bridge loans and SBA PPP loans. For further information on the principal and interest deferrals, please see the “Nonperforming Assets” section below. However, the uncertainty of national and local economic conditions had a material impact on our provision for loan and lease losses. The Company elected under Section 4014 of the CARES Act to defer the implementation of CECL until the earlier of when the national emergency related to the outbreak of COVID-19 ends or December 31, 2020. In December 2020, the Consolidated Appropriations Act, 2021, extended the deferral of implementation of CECL from December 31, 2020, to the earlier of the first day of the fiscal year, beginning after the national emergency terminates or January 1, 2022. Although this deferral will still require CECL to be implemented as of January 1, 2022, the Company believes that the deferral will provide time to better assess the impact of the COVID-19 pandemic on the expected lifetime credit losses in our loan and lease portfolio. The most significant unknown factor is how long economic activity will be impacted by COVID-19, and in turn how deeply that will impact the markets in which we operate. Therefore, more time was needed to assess the impact of this economic uncertainty and related actions taken such as the stimulus provisions of the CARES Act on the Company’s allowance for loan and lease losses under the CECL methodology. |
| ● | In addition to the expected increase in provision for loan and lease losses, the Company expects that net interest income could be adversely impacted over time given pressure on net interest margin as a result of the FOMC’s emergency rate cuts in March 2020. For example, our net interest margin for the year ended December 31, 2020, was 3.95%, compared to a net interest margin of 4.19% for the same period in 2019. New loans booked in 2020 have been at lower rates and although deposit costs have also declined, deposit costs were already low or at their floors prior to these interest rate cuts. Further, the stay-at-home order and record unemployment resulting from the COVID-19 pandemic has reduced consumer spending which has reduced our fee income, primarily from overdraft activity. |
| ● | The COVID-19 pandemic has not adversely affected our capital or financial resources as of December 31, 2020. During the year ending 2020, total shareholders’ equity increased by $34.6 million, or 11%, to $343.9 million. A large component of this was an $12.5 million increase in accumulated other comprehensive income as a result of increases in the value of our investment portfolio due to lower interest rates. If interest rates rise, this component of equity would be expected to decline. In addition, the Company earned $35.4 million in net income for the year ending 2020 and paid dividends of $12.2 million. The Company also paid a twenty-one cent per share dividend on February 12, 2021. Although presently not expected, if the Company were to incur significant credit losses as a result of COVID-19’s impact on our customers’ ability to repay loans, capital could be adversely impacted. With respect to liquidity, the Company maintains strong primary and secondary liquidity sources as further described under “Liquidity and Market Risk Management” below. |
| ● | While we do not expect COVID-19 to affect our ability to account timely for the assets on our balance sheet, this could change in future periods. Certain valuation assumptions and judgments continue to change to account for pandemic-related circumstances such as widening credit spreads. However, we do not anticipate any significant changes in methodology used to determine the fair value of assets measured in accordance with GAAP. As of December 31, 2020, our goodwill was not impaired. The Company performed a qualitative assessment of its goodwill at December 31, 2020 and concluded that it was not more likely than not that a goodwill impairment exists. The Company will continue to monitor its goodwill recorded on the balance sheet for potential impairment. In the event that we conclude that all or a portion of our goodwill is impaired, a non-cash charge for the amount of such impairment would be recorded to earnings. At December 31, 2020, we had goodwill of $27.4 million which represented 8% of total equity. |
38
The Company continues to serve its customers. Out of our 40 branch locations, four are open with limited lobby hours, while 8 branches have limited lobby hours and a drive-up or walk-up facility. 23 branches are open for drive-up or walk-up only and five branches are currently closed except by appointment. Approximately 75% of our back-office and corporate employees are working remotely and it has not adversely affected our operations. In addition, none of our internal controls have significantly changed or are expected to change as a result of the remote work arrangements other than the use of remote approvals. The Company is prepared to continue operating in this manner until it is safe to begin bringing those working remotely back to our corporate offices and branches. As a result of the on-going COVID-19 pandemic, several of our branch lobbies remained closed as described above. In February 2021, the Board of Directors of the Company decided to explore the possibility of permanently closing up to five of the branches whose lobbies were closed during the pandemic. The branches being considered for permanent closure are outside of the bank’s primary market. The total lease breakage fee is estimated to be less than $0.3 million, in addition to the acceleration of the amortization of certain leasehold improvements. Any closures would likely occur in the third quarter of 2021 after timely notices are provided to customers.
| ● | To date, the Company did not experience any challenges in implementing its business continuity plans. The Company’s Risk Management team began preparing in late January and early February with ordering of supplies such as hand sanitizer, masks and cleaning supplies, as well as laptops for those who did not have one. This enabled the Company to immediately communicate and implement plans to continue operations in our banking facilities while enabling those non-customer facing employees to immediately begin working remotely. The Company did not face any material resource constraints in implementing these plans. |
| ● | As a financial institution providing essential services, the Company expects continued demand for loans and deposits. As described above, it is expected that certain services may see declines in demand such as debit and credit card interchange given lower consumer spending. While overall net income is expected to decline, it presently is more a function of the interest rate environment than a change in overall demand for loan and deposit products. |
| ● | The Company loosened its vacation and sick-time policies to accommodate our employees who were affected by COVID-19. The Company has not had any temporary or permanent reductions in staff as a result of COVID-19. |
Results of Operations
The Company earns income from two primary sources. The first is net interest income, which is interest income generated by earning assets less interest expense on deposits and other borrowed money. The second is noninterest income, which primarily consists of customer service charges and fees but also comes from non-customer sources such as BOLI and investment gains. The majority of the Company’s noninterest expense is comprised of operating costs that facilitate offering a full range of banking services to our customers.
Net Interest Income and Net Interest Margin
Net interest income was $104.8 million in 2020 as compared to $97.4 million in 2019 and $92.4 million in 2018. This equates to increases of 8% in 2020 and 5% in 2019. The level of net interest income we recognize in any given period depends on a combination of factors including the average volume and yield for interest-earning assets, the average volume and cost of interest-bearing liabilities, and the mix of products which comprise the Company’s earning assets, deposits, and other interest-bearing liabilities. Net interest income is also impacted by the acceleration of net deferred loan fees and costs for loans paid off early (including SBA PPP loans forgiven), reversal of interest for loans placed on non-accrual status, and the recovery of interest on loans that had been on non-accrual and were paid off, sold, or returned to accrual status.
The following table shows average balances for significant balance sheet categories and the amount of interest income or interest expense associated with each category for each of the past three years. The table also displays calculated yields on
39
each major component of the Company’s investment and loan portfolios, average rates paid on each key segment of the Company’s interest-bearing liabilities, and our net interest margin for the noted periods.
Distribution, Rate & Yield | ||||||||||||||||||||||||
(dollars in thousands, except footnotes) | ||||||||||||||||||||||||
Year Ended December 31, | ||||||||||||||||||||||||
2020 | 2019 | 2018 | ||||||||||||||||||||||
Average | Income/ | Average | Average | Income/ | Average | Average | Income/ | Average | ||||||||||||||||
Assets |
| Balance(1) |
| Expense |
| Rate/Yield(2) |
| Balance(1) |
| Expense |
| Rate/Yield(2) |
| Balance(1) |
| Expense |
| Rate/Yield(2) | ||||||
Investments: | ||||||||||||||||||||||||
Federal funds sold/due from banks | $ | 25,228 | $ | 156 | 0.62% | $ | 16,346 | $ | 376 | 2.30% | $ | 13,237 | $ | 238 | 1.80% | |||||||||
Taxable | 379,024 | 8,199 | 2.16% | 423,453 | 10,139 | 2.39% | 422,848 | 9,548 | 2.26% | |||||||||||||||
Non-taxable | 216,387 | 5,707 | 3.34% | 160,787 | 4,534 | 3.57% | 140,300 | 4,060 | 2.89% | |||||||||||||||
Equity | — | — | — | — | — | — | — | — | — | |||||||||||||||
Total investments | 620,639 | 14,062 | 2.51% | 600,586 | 15,049 | 2.71% | 576,385 | 13,846 | 2.40% | |||||||||||||||
Loans and Leases: (3) | ||||||||||||||||||||||||
Real estate | 1,610,686 | 79,175 | 4.92% | 1,440,465 | 79,777 | 5.54% | 1,350,425 | 73,006 | 5.41% | |||||||||||||||
Agricultural | 47,299 | 1,887 | 3.99% | 50,042 | 2,973 | 5.94% | 52,031 | 2,980 | 5.73% | |||||||||||||||
Commercial | 179,924 | 6,738 | 3.74% | 117,679 | 5,918 | 5.03% | 124,809 | 5,969 | 4.78% | |||||||||||||||
Consumer | 6,584 | 1,069 | 16.24% | 8,497 | 1,340 | 15.77% | 9,755 | 1,251 | 12.82% | |||||||||||||||
Mortgage warehouse | 221,319 | 7,135 | 3.22% | 134,171 | 5,695 | 4.24% | 86,030 | 4,415 | 5.13% | |||||||||||||||
Other | 2,878 | 177 | 6.15% | 2,894 | 195 | 6.74% | 2,682 | 171 | 6.38% | |||||||||||||||
Total loans and leases | 2,068,690 | 96,181 | 4.65% | 1,753,748 | 95,898 | 5.47% | 1,625,732 | 87,792 | 5.40% | |||||||||||||||
Total interest earning assets (4) | 2,689,329 | 110,243 | 4.16% | 2,354,334 | 110,947 | 4.76% | 2,202,117 | 101,638 | 4.66% | |||||||||||||||
Other earning assets | 13,103 | 12,421 | 10,514 | |||||||||||||||||||||
Non-earning assets | 207,590 | 202,810 | 204,316 | |||||||||||||||||||||
Total assets | $ | 2,910,022 | $ | 2,569,565 | $ | 2,416,947 | ||||||||||||||||||
| ||||||||||||||||||||||||
Liabilities and shareholders' equity | ||||||||||||||||||||||||
Interest bearing deposits: | ||||||||||||||||||||||||
Demand deposits | $ | 121,867 | $ | 278 | 0.23% | $ | 106,849 | $ | 316 | 0.30% | $ | 119,432 | $ | 364 | 0.30% | |||||||||
NOW | 497,984 | 388 | 0.08% | 444,619 | 524 | 0.12% | 425,596 | 478 | 0.11% | |||||||||||||||
Savings accounts | 336,620 | 221 | 0.07% | 289,727 | 308 | 0.11% | 298,021 | 314 | 0.11% | |||||||||||||||
Money market | 124,755 | 128 | 0.10% | 124,625 | 181 | 0.15% | 149,024 | 146 | 0.10% | |||||||||||||||
Certificates of deposit<$100,000 | 77,119 | 326 | 0.42% | 88,792 | 1,035 | 1.17% | 81,940 | 614 | 0.75% | |||||||||||||||
Certificates of deposit>$100,000 | 359,687 | 2,361 | 0.66% | 396,465 | 7,896 | 1.99% | 310,880 | 5,039 | 1.62% | |||||||||||||||
Brokered deposits | 36,071 | 246 | 0.68% | 48,392 | 1,120 | 2.31% | 16,822 | 305 | 1.81% | |||||||||||||||
Total interest bearing deposits | 1,554,103 | 3,948 | 0.25% | 1,499,469 | 11,380 | 0.76% | 1,401,715 | 7,260 | 0.52% | |||||||||||||||
Borrowed funds: | ||||||||||||||||||||||||
Federal funds purchased | 1,918 | 4 | 0.21% | 313 | 1 | 0.32% | 22 | — | — | |||||||||||||||
Repurchase agreements | 34,614 | 137 | 0.40% | 22,090 | 88 | 0.40% | 14,332 | 57 | 0.40% | |||||||||||||||
Short term borrowings | 54,244 | 102 | 0.19% | 13,229 | 273 | 2.06% | 8,967 | 196 | 2.19% | |||||||||||||||
TRUPS | 35,031 | 1,217 | 3.47% | 34,853 | 1,836 | 5.27% | 34,673 | 1,731 | 4.99% | |||||||||||||||
Total borrowed funds | 125,807 | 1,460 | 1.16% | 70,485 | 2,198 | 3.12% | 57,994 | 1,984 | 3.42% | |||||||||||||||
Total interest bearing liabilities | 1,679,910 | 5,408 | 0.32% | 1,569,954 | 13,578 | 0.86% | 1,459,709 | 9,244 | 0.63% | |||||||||||||||
Noninterest bearing demand deposits | 862,274 | 664,061 | 665,941 | |||||||||||||||||||||
Other liabilities | 39,510 | 41,563 | 30,383 | |||||||||||||||||||||
Shareholders' equity | 328,328 | 293,987 | 260,914 | |||||||||||||||||||||
Total liabilities and shareholders' equity | $ | 2,910,022 | $ | 2,569,565 | $ | 2,416,947 | ||||||||||||||||||
| ||||||||||||||||||||||||
Interest income/interest earning assets | 4.15% | 4.76% | 4.66% | |||||||||||||||||||||
Interest expense/interest earning assets | 0.20% | 0.58% | 0.42% | |||||||||||||||||||||
Net interest income and margin(5) | $ | 104,835 | 3.95% | $ | 97,369 | 4.19% | $ | 92,394 | 4.24% | |||||||||||||||
| (1) | Average balances are obtained from the best available daily or monthly data and are net of deferred fees and related direct costs. |
| (2) | Yields and net interest margin have been computed on a tax equivalent basis. |
| (3) | Loans are gross of the allowance for possible loan and lease losses. Net loan fees have been included in the calculation of interest income. Net loan fees (costs) and loan acquisition FMV amortization were $1.9 million, $(0.4) million, and $0.8 million for the years ended December 31, 2020, 2019, and 2018 respectively. |
| (4) | Non-accrual loans are slotted by loan type and have been included in total loans for purposes of total interest earning assets. |
| (5) | Net interest margin represents net interest income as a percentage of average interest-earning assets (tax-equivalent). |
The Volume and Rate Variances table below sets forth the dollar difference for the comparative periods in interest earned or paid for each major category of interest-earning assets and interest-bearing liabilities, and the amount of such change attributable to fluctuations in average balances (volume) or differences in average interest rates. Volume variances are equal to the increase or decrease in average balances multiplied by prior period rates, and rate variances are equal to the
40
change in rates multiplied by prior period average balances. Variances attributable to both rate and volume changes, calculated by multiplying the change in rates by the change in average balances, have been allocated to the rate variance.
Volume & Rate Variances | ||||||||||||||||||
(dollars in thousands) | ||||||||||||||||||
Years Ended December 31, | ||||||||||||||||||
2020 over 2019 | 2019 over 2018 | |||||||||||||||||
Increase(decrease) due to | Increase(decrease) due to | |||||||||||||||||
Assets: |
| Volume |
| Rate |
| Net |
| Volume |
| Rate |
| Net | ||||||
Investments: | ||||||||||||||||||
Federal funds sold/due from time | $ | 204 | $ | (424) | $ | (220) | $ | 55 | $ | 83 | $ | 138 | ||||||
Taxable | (1,064) | (876) | (1,940) | 6 | 585 | 591 | ||||||||||||
Non-taxable | 1,568 | (395) | 1,173 | 593 | (119) | 474 | ||||||||||||
Equity | — | — | — | — | — | — | ||||||||||||
Total investments | 708 | (1,695) | (987) | 654 | 549 | 1,203 | ||||||||||||
| ||||||||||||||||||
Loans and leases: | ||||||||||||||||||
Real estate | 9,427 | (10,029) | (602) | 4,868 | 1,903 | 6,771 | ||||||||||||
Agricultural | (163) | (923) | (1,086) | (114) | 107 | (7) | ||||||||||||
Commercial | 3,130 | (2,310) | 820 | (341) | 290 | (51) | ||||||||||||
Consumer | (302) | 31 | (271) | (161) | 250 | 89 | ||||||||||||
Mortgage warehouse | 3,699 | (2,259) | 1,440 | 2,471 | (1,191) | 1,280 | ||||||||||||
Other | (1) | (17) | (18) | 14 | 10 | 24 | ||||||||||||
Total loans and leases | 15,790 | (15,507) | 283 | 6,737 | 1,369 | 8,106 | ||||||||||||
Total interest earning assets | $ | 16,498 | $ | (17,202) | $ | (704) | $ | 7,391 | $ | 1,918 | $ | 9,309 | ||||||
Liabilities: | ||||||||||||||||||
Interest bearing deposits: | ||||||||||||||||||
Demand | $ | 44 | $ | (82) | $ | (38) | $ | (38) | $ | (10) | $ | (48) | ||||||
NOW | 63 | (199) | (136) | 21 | 25 | 46 | ||||||||||||
Savings accounts | 50 | (137) | (87) | (9) | 3 | (6) | ||||||||||||
Money market | — | (53) | (53) | (24) | 59 | 35 | ||||||||||||
Certificates of deposit < $100,000 | (136) | (573) | (709) | 51 | 370 | 421 | ||||||||||||
Certificates of deposit > $100,000 | (732) | (4,803) | (5,535) | 1,387 | 1,470 | 2,857 | ||||||||||||
Brokered deposits | (285) | (589) | (874) | 572 | 243 | 815 | ||||||||||||
Total interest bearing deposits | (996) | (6,436) | (7,432) | 1,960 | 2,160 | 4,120 | ||||||||||||
Borrowed funds: | ||||||||||||||||||
Borrowed funds: | ||||||||||||||||||
Federal funds purchased | 5 | (2) | 3 | — | 1 | 1 | ||||||||||||
Repurchase agreements | 50 | (1) | 49 | 31 | — | 31 | ||||||||||||
Short term borrowings | 846 | (1,017) | (171) | 93 | (16) | 77 | ||||||||||||
Long term borrowings | — | — | — | — | — | — | ||||||||||||
TRUPS | 9 | (628) | (619) | 9 | 96 | 105 | ||||||||||||
Total borrowed funds | 910 | (1,648) | (738) | 133 | 81 | 214 | ||||||||||||
Total interest bearing liabilities | (86) | (8,084) | (8,170) | 2,093 | 2,241 | 4,334 | ||||||||||||
Net interest income | $ | 16,584 | $ | (9,118) | $ | 7,466 | $ | 5,298 | $ | (323) | $ | 4,975 | ||||||
Net interest income in 2020 as compared to 2019 was impacted by a favorable volume variance of $16.6 million partially offset by an unfavorable $9.1 million rate variance. For 2019 relative to 2018, net interest income reflects a favorable volume variance of $5.3 million partially offset by an unfavorable $0.3 million rate variance.
The 2020 volume variance is due mostly to increases in average balances, resulting from the organic growth in commercial real estate loans, growth in commercial loans due to our participation in the SBA PPP program and higher utilization of mortgage warehouse lines. Given the low rate environment, loan demand for our mortgage warehouse lines have increased, as demonstrated by the $3.7 million favorable volume variance. The 2019 volume variance is due mostly to increases in
41
average balances of real estate loans and mortgage warehouse lines. However, the ending balance of real estate loans ended 2019 approximately 3% lower than the balance at December 31, 2018.
The Company’s net interest margin, which is tax-equivalent net interest income as a percentage of average interest-earning assets declined by 24 basis points to 3.95% in 2020, and declined by 5 basis points to 4.19% in 2019 as compared to 2018. There was an unfavorable rate variance of $9.1 million since the weighted average yield on interest-earning assets fell by 60 basis points and the weighted average cost of interest-bearing liabilities decreased by 54 basis points. The change in the yield on interest-earning assets representing a much larger base than that of the interest-bearing liabilities. The rate variance was negatively impacted by the following factors: A shift in our earning asset mix into lower-yielding loans and investments; increased line utilization of mortgage warehouse lines; $54.3 million in average balances of low-yielding SBA PPP loans; partially offset by lower costs of time-deposits and other interest-bearing liabilities. The 2019 unfavorable rate variance is due partially to a lower rate environment in 2019, as well as a shift in the mix of earning assets to lower yielding mortgage warehouse lines and non-taxable investment securities coupled with an increase in rates paid on time deposits. Investment yields decreased in 2020 but increased in 2019 over 2018. The decrease in 2020 was due to the lower rate environment and its impact on all debt securities. Net interest margin is expected to be affected by the overall rate environment. A continued low rate environment will result in lower earning asset yields, which will be offset by the acceleration of fee income from SBA PPP loans in the near term.
The increase in 2019 over 2018 was primarily due to a continued plan to shift to higher yielding municipal bonds. Rates paid on non-maturity deposits declined in 2020 but were approximately the same for 2019 over 2018. There was a 5 basis point decrease on money market accounts in 2020 but was 5 basis points higher in 2019 over 2018. The weighted average cost of interest-bearing liabilities went down 54 bps in 2020 but was up 23 bps in 2019. Since the Federal Open Markets Committee of the Federal Reserve System kept the federal funds target rate at historical lows throughout 2020, time deposit rates in 2020 dropped 126 bps due to the relatively short duration of our time deposit portfolio. The 2019 increase was primarily because of higher rates paid on time deposits (including brokered deposits added in the last half of 2018). Overnight borrowings and adjustable-rate trust-preferred securities (“TRUPS”) are also tied to short-term rates which began lowering in the second half of 2019, but still remained higher overall in 2019 as compared to 2018 and remained low throughout 2020. During the year, adjustments to interest income occur due to the following adjustments: interest income recovered upon the resolution of nonperforming loans, the reversal of interest income when a loan is placed on non-accrual status, and accelerated fees or prepayment penalties recognized for early payoffs of loans. Such adjustments totaled $0.39 million in 2019, $0.82 million in 2019, and $0.28 million in 2018. Further, discount accretion on loans from whole-bank acquisitions enhanced our net interest margin by approximately two basis points in 2020, four basis points in 2019, and seven basis points in 2018.
Provision for Loan and Lease Losses
The Company recorded a loan and lease loss provision of $8.6 million in 2020; $2.6 million in 2019, and $4.4 million in 2018. The Company is subject to the adoption of the Current Expected Credit Loss ("CECL") accounting method under Financial Accounting Standards Board (FASB) Accounting Standards Update 2016-03 and related amendments, Financial Instruments – Credit Losses (Topic 326) in 2020. However, in March 2020, the Company elected under Section 4014 of the CARES Act to defer the implementation of CECL until the earlier of when the national emergency related to the outbreak of COVID-19 ends or December 31, 2020. In December 2020, the Consolidated Appropriations Act, 2021 extended the deferral of implementation of CECL from December 31, 2020, to the earlier of the first day of the fiscal year, beginning after the national emergency terminates or January 1, 2022. Therefore, the Company expects to implement CECL on January 1, 2022.
The Company initially elected in the first quarter of 2020 to postpone implementation and will now continue to postpone implementation in order to provide additional time to assess better the impact of the COVID-19 pandemic on the expected lifetime credit losses. At the time of the initial decision, there was a significant economic uncertainty on the local, regional, and national levels as a result of local and state stay-at-home orders, as well as relief measures provided at a national, state, and local level. Further, the Company took actions to serve our communities during the pandemic, including permitting short-term payment deferrals to current customers, as well as originating bridge loans and SBA PPP loans. It was determined that more time was needed to assess the impact of the uncertainty and related actions on the Company's allowance for loan and lease losses under the CECL methodology.
42
The growth in the provision for loan and lease losses in 2020, is due to the strong organic non-owner occupied commercial real estate loan growth generated in the second half of 2020 and the continued uncertainty surrounding the estimated impact that COVID-19 has had on the economy. The provision was also impacted by downgrades of certain loans deferred under section 4013 of the CARES Act, including 10 loans for $1.4 million placed on non-accrual at the end of the deferral period. Management evaluated its qualitative risk factors under our current incurred loss model and adjusted these factors for economic conditions, changes in the mix of the portfolio due to loans subject to a payment deferral, potential changes in collateral values due to reduced cash flows, and external factors such as government actions. In particular, the uncertainty regarding our customers' ability to repay loans could be adversely impacted by COVID-19, temporary business shut-downs, and reduced consumer and business spending.
Two separate impaired loans impacted the provision for loan and lease losses in both 2019 and 2018. In 2019, additional reserve was booked in the third quarter 2019 for a $2.8 million loan placed on nonaccrual status resulting in a $1.2 million charge-off. The provision for 2018 includes $2.4 million for a large purchased participation loan that was placed on nonaccrual status in the third quarter 2018.
With the loan and lease loss provision recorded in 2020 we were able to maintain our allowance for loan and lease losses at a level that, in Management’s judgment, is adequate to absorb probable loan and lease losses related to specifically identified impaired loans as well as probable incurred losses in the remaining loan portfolio. Specifically identifiable and quantifiable loan and lease losses are immediately charged off against the allowance. The Company recorded net loan and lease losses of $0.7 million in 2020. The Company experienced net loan and lease losses of $2.4 million in 2019, including a $1.2 million charge-off on the loan placed on nonaccrual status in the third quarter 2019 as mentioned above. The Company experienced net loan and lease losses of $3.6 million in 2018, including a $2.4 million loss on the above-referenced participation loan. The loan and lease loss provision for 2020, 2019 and 2018 has been favorably impacted by the following factors: most charge-offs were recorded against pre-established reserves, which alleviated what otherwise might have been a need for reserve replenishment; loss rates for most loan types have been declining, thus having a positive impact on general reserves required for performing loans; and, new loans booked have been underwritten using continued tighter credit standards.
The Company’s policies for monitoring the adequacy of the allowance and determining loan amounts that should be charged off, and other detailed information with regard to changes in the allowance, are discussed in Note 2 to the consolidated financial statements and below under “Allowance for Loan and Lease Losses.” The process utilized to establish an appropriate allowance for loan and lease losses can result in a high degree of variability in the Company’s loan and lease loss provision, and consequently in our net earnings.
43
Noninterest Revenue and Operating Expense
The table below sets forth the major components of the Company’s noninterest revenue and operating expense for the years indicated, along with relevant ratios:
Non-Interest Income/Expense | |||||||||||||||
(dollars in thousands) | |||||||||||||||
Year Ended December 31, | |||||||||||||||
| 2020 |
| % of Total |
| 2019 |
| % of Total |
| 2018 |
| % of Total | ||||
NONINTEREST INCOME: | |||||||||||||||
Service charges on deposit accounts | $ | 11,765 | 44.99% | $ | 12,742 | 54.28% | $ | 12,439 | 57.69% | ||||||
Checkcard fees | 7,023 | 26.86% | 6,584 | 28.04% | 5,878 | 27.26% | |||||||||
Other service charges and fees | 4,084 | 15.62% | 4,231 | 18.02% | 5,219 | 24.20% | |||||||||
Bank owned life insurance income | 2,412 | 9.22% | 2,184 | 9.30% | 591 | 2.74% | |||||||||
Gain on sale of securities | 390 | 1.49% | (198) | (0.84)% | 2 | 0.01% | |||||||||
Loss on tax credit investment | (1,189) | (4.55)% | (2,079) | (8.86)% | (2,561) | (11.88)% | |||||||||
Other | 1,665 | 6.37% | 13 | 0.06% | (4) | (0.02)% | |||||||||
Total noninterest income | 26,150 | 100.00% | 23,477 | 100.00% | 21,564 | 100.00% | |||||||||
As a % of average interest-earning assets | 0.97% | 1.00% | 0.98% | ||||||||||||
| |||||||||||||||
OTHER OPERATING EXPENSES: | |||||||||||||||
Salaries and employee benefits | 40,178 | 52.93% | 35,978 | 50.98% | 36,133 | 51.61% | |||||||||
Occupancy costs | |||||||||||||||
Furniture and equipment | 2,028 | 2.67% | 2,141 | 3.03% | 2,632 | 3.76% | |||||||||
Premises | 7,814 | 10.29% | 7,704 | 10.91% | 7,663 | 10.94% | |||||||||
Advertising and promotion costs | 1,889 | 2.49% | 2,568 | 3.64% | 2,748 | 3.92% | |||||||||
Data processing costs | 4,661 | 6.14% | 4,564 | 6.47% | 5,015 | 7.16% | |||||||||
Deposit services costs | 8,483 | 11.17% | 7,962 | 11.27% | 5,413 | 7.73% | |||||||||
Loan services costs | |||||||||||||||
Loan processing | 880 | 1.16% | 675 | 0.96% | 1,142 | 1.64% | |||||||||
Foreclosed assets | 253 | 0.33% | 35 | 0.05% | (730) | (1.04)% | |||||||||
Other operating costs | |||||||||||||||
Telephone and data communications | 1,775 | 2.34% | 1,529 | 2.17% | 1,479 | 2.11% | |||||||||
Postage and mail | 321 | 0.42% | 436 | 0.62% | 997 | 1.42% | |||||||||
Other | 1,647 | 2.17% | 1,798 | 2.55% | 1,408 | 2.01% | |||||||||
Professional services costs | |||||||||||||||
Legal and accounting | 1,989 | 2.62% | 2,072 | 2.94% | 1,932 | 2.76% | |||||||||
Acquisition costs | — | 0.00% | 22 | 0.03% | 449 | 0.64% | |||||||||
Other professional services costs | 2,990 | 3.94% | 2,492 | 3.53% | 1,956 | 2.79% | |||||||||
Stationery and supply costs | 446 | 0.59% | 318 | 0.45% | 1,387 | 1.98% | |||||||||
Sundry & tellers | 558 | 0.74% | 284 | 0.40% | 400 | 0.57% | |||||||||
Total other operating expense | $ | 75,912 | 100.00% | $ | 70,578 | 100.00% | $ | 70,024 | 100.00% | ||||||
As a % of average interest-earning assets | 2.82% | 3.00% | 3.18% | ||||||||||||
Net noninterest income as a % of average interest-earning assets | (1.85)% | (2.00)% | (2.20)% | ||||||||||||
Efficiency ratio (1) (2) | 57.18% | 57.46% | 60.79% | ||||||||||||
| (1) | Tax Equivalent |
| (2) | Noninterest expense as a percentage of the sum of net interest income and noninterest income excluding net gains (losses) from securities and bank owned life insurance income. |
44
Noninterest income improved in 2020 with a $2.7 million increase, or 11%, as compared to an increase of $1.9 million, or 9%, in 2019. Total noninterest income was 0.97% of average interest-earning assets in 2020 as compared to a ratio of 1.0% in 2019 and 0.98% in 2018. The ratio declined in 2020 due to a 14% increase in interest-earning assets.
The principal component of the Company’s noninterest revenue, service charges on deposit accounts, decreased by $1.0 million, or 8%, in 2020 as compared to 2019. The same line item declined by $0.3 million, or 2%, in 2019 over 2018. This line item is primarily driven by the volume of transaction accounts. As a percent of average transaction account balances, service charge income was 1.9% in 2020, and 1.0% in 2019 and 2018.
Checkcard fees consists of interchange fees from our customers’ use of debit cards for electronic funds transactions. This category increased by $0.4 million, or 7%, in 2020 as compared to 2019, and increased by $0.7 million, or 12%, in 2019 over 2018. The increases in 2020 and 2019 are primarily a result of growth in our deposit account base as well as increased usage of debit cards by our customers.
Other service charges and fees declined by $0.1 million, or 3%, in 2020 over 2019, and by $1.0 million, or 19%, in 2019 over 2018. The decrease in 2019, was due largely to two infrequent items occurring in 2018. In 2018, we had a $1.2 million write-up of our investment in Pacific Coast Bankers Bank (“PCBB”), due to Accounting Standards Update 2016-01 which required the Company to write the investment to fair value through earnings, as well as a $0.2 million special dividend received pursuant to our equity investment in the Federal Home Loan Bank of San Francisco (“FHLB”).
BOLI income generally fluctuates based on the market. In 2020 BOLI income increased by $0.2 million or 10%, and in 2019 BOLI income increased by $1.6 million, or 270%, over 2018. BOLI income is derived from two types of policies owned by the Company, namely “separate account” and “general account” life insurance, and the year over year variances are due in large part to fluctuations in income on separate account BOLI. The Company had $9.3 million invested in separate account BOLI at December 31, 2020, which produces income that helps offset expense accruals for deferred compensation accounts the Company maintains on behalf of certain directors and senior officers. Those accounts have returns pegged to participant-directed investment allocations that can include equity, bond, or real estate indices, and are thus subject to gains or losses which often contribute to significant fluctuations in income (and associated expense accruals). Gains on separate account BOLI totaled $1.4 million in 2020 as compared to $1.2 million in 2019, and net losses of $0.4 million in 2018. This resulted in a favorable variance of $0.2 million for 2020 as compared to 2019, and a favorable variance of $1.6 million in 2019 as compared to 2018. As noted, gains and losses on separate account BOLI are related to expense accruals or reversals associated with participant gains and losses on deferred compensation balances, thus the overall net impact on taxable income tends to be minimal. The Company’s books also reflect a net cash surrender value for general account BOLI of $43.2 million at December 31, 2020 as compared to $42.5 million at year-end 2019. General account BOLI produces income that is used to help offset expenses associated with executive salary continuation plans, director retirement plans and other employee benefits. Interest credit rates on general account BOLI do not change frequently so the income has typically been fairly consistent with $1.0 million, of general account BOLI income recorded for all three years ending December 31, 2020, 2019, and 2018.
The Company recognized a $0.4 million gain on the sale of investment securities in 2020, as compared to a $0.2 million loss in 2019 and a nominal gain in 2018. The gain in 2020 was due to a net gain on the sale of debt securities, in an effort to restructure the portfolio primarily to eliminate small residual balances and reduce potential credit risk on certain municipal holdings. The loss in 2019 was taken in order to sell several small balance and low-yielding bonds in order to replace them with fewer higher-yielding bonds. The earn back of the transaction was less than a year.
Loss on tax credit investment reflects pass-through expenses associated with our investments in low-income housing tax credit funds and other limited partnerships. Those expenses, which are netted out of revenue, decreased by $0.9 million, or 43%, in 2020 as compared to 2019. In 2019 as compared to 2018, these expenses decreased by $0.5 million, or 19%. The favorable variance in 2020 is due to the expiration of expense amortization on several funds which had reached the end of their useful tax benefit life. The largest contribution to the favorable variance in 2019, as well as the unfavorable variance in 2018 came from a $0.91 million adjustment to accelerate expense amortization on our tax credit investments, to ensure that the book value of each investment does not exceed its projected remaining tax benefits.
45
The other category, increased to $1.7 million from $0.01 million, in 2020 as compared to 2019. The primary reason for this increase is due to a $1.5 million gain from the wrap up of low-income housing tax credit fund investments and a $0.2 million valuation gain on restricted equity investments owned by the Company. There was a nominal increase in this category in 2019 as compared to 2018.
Total operating expense, or noninterest expense, increased by $5.3 million, or 8%, in 2020 as compared to 2019, and increased by $0.6 million, or 1%, in 2019 over 2018. The primary increase in 2020 was in salaries and benefits as discussed in further detail below. Although overall noninterest expense did not fluctuate significantly from 2019 to 2018, several line items fluctuated with the largest single item being deposit service costs of $2.6 million. This increase was mostly offset by several smaller changes in other line items. Noninterest expense as a percent of average interest-earning assets trended down each year. This ratio was 2.8% in 2020, 3.0% in 2019 and 3.2% in 2018.
The largest component of noninterest expense, salaries, and employee benefits, increased $4.2 million, or 12%, in 2020 as compared to 2019. The reason for this increase is due to several factors, including merit increases for employees due to annual performance evaluations, new loan production teams for the northern and southern California markets, and a focus on hiring additional senior-level staff and management. The same line item was down $0.2 million, or 0.4%, in 2019 as compared to 2018. Salary expense declined in 2019 as compared to 2018 in part due to selective staff reductions even though there was some increase to deferred compensation expenses as well as the normal annual salary increases. Components of compensation expense that can experience significant variability and are typically difficult to predict include salaries associated with successful loan originations, which are accounted for in accordance with Financial Accounting Standards Board (“FASB”) guidelines on the recognition and measurement of non-refundable fees and origination costs for lending activities, and accruals associated with employee deferred compensation plans. Loan origination salaries that were deferred from current expense for recognition over the life of related loans totaled $3.3 million in 2020, $3.7 million in 2019, and $4.2 million for 2018. Employee deferred compensation expense accruals totaled only $0.2 million in 2020, and 2019. Such deferred compensation expenses were nominal in 2018. As noted above in our discussion of BOLI income, employee deferred compensation plan accruals are related to separate account BOLI income and losses, as are directors deferred compensation accruals that are included in “other professional services,” and the net income impact of all income/expense accruals related to deferred compensation is usually minimal. Salaries and benefits were 53% of total operating expense in 2020, relative to 51% in 2019 and 52% in 2018. The number of full-time equivalent staff employed by the Company totaled 501 at the end of 2020, as compared to 513 at December 31, 2019 and 541 at December 31, 2018. Staff attrition throughout 2020, without the need for immediate replacements due to temporary branch lobby closures or limited branch lobby hours attributed to the COVID-19 pandemic, was the primary reason for the FTE decline. When branch lobbies resume normal operating hours and public access, full-time equivalent staff are expected to increase, however the exact timing of this change is not currently known. Efficiency initiatives implemented toward the end of the 2018 continuing throughout 2019 and 2020 were also drivers of the three year reduction in FTE.
Total rent and occupancy expense, including furniture and equipment costs, were about the same in 2020 as compared to 2019 and decreased by $0.5 million, or 4%, in 2019 over 2018. The decline in 2019 was primarily due to lower depreciation expenses and lower maintenance/repair costs in 2019.
Advertising and promotion costs decreased by 26% to $1.9 million in 2020 as compared to 2019, and decreased by $0.2 million, or 7%, in 2019 over 2018. The decrease in 2020 came from the cessation of special events and in-branch marketing campaigns necessitated by the COVID-19 pandemic and the stay in place orders instituted by the Governor of the state of California, at differing periods during much of 2020.
Data processing costs increased by $0.1 million, or 2%, in 2020 as compared to 2019 and decreased by $0.5 million, or 9%, in 2019 over 2018. Although as a whole the increase in 2020 was minimal, the Company did experience increases in loan management software expenses due to participation in the SBA PPP program and other costs incurred to implement remote working arrangements for staff; which was offset by lower core software provider costs and other data processing costs. The decrease in 2019 was primarily due to lower core software provider costs.
Deposit services costs increased by $0.5 million, or 7%, in 2020 as compared to 2019, and increased by $2.6 million, or 47%, in 2019 over 2018. Deposit costs have been impacted in both 2020 and 2019, by increases in debit card processing and ATM network costs due to higher customer activity levels. In 2020 we also increased our utilization of armored car
46
services to replenish ATM machines as an increased security precaution. In 2019, approximately $1.5 million of costs associated with statement printing costs that were previously recorded in other operations expenses and stationary & supplies expense were reclassified to data processing costs. The purpose of the reclassification was to better track the costs associated with producing paper statements for our customers so that we could better track progress against our strategy to lower such costs.
Loan services costs are comprised of loan processing costs, and net costs associated with foreclosed assets. Loan processing costs, which include expenses for property appraisals and inspections, loan collections, demand and foreclosure activities, loan servicing, loan sales, and other miscellaneous lending costs, increased by $0.4 million, or 60%, in 2020 as compared to 2019 and decreased by $0.5 million, or 41%, in 2018 over 2017. The increase in 2020 as well as the decrease in 2019 was due to smaller amounts in nearly every category of loan servicing. The decrease in 2019 was also due to the dramatic reduction in the amount of residential first mortgages made by the Company. Foreclosed assets costs are comprised of write-downs taken subsequent to reappraisals, OREO operating expense (including property taxes), and losses on the sale of foreclosed assets, net of rental income on OREO properties and gains on the sale of foreclosed assets. Those costs were just $0.2 million in 2020 as compared to a $0.04 million net gain in 2019 and costs of $0.7 million in 2018. These costs fluctuate based on market conditions of OREO relative to our holding value and the nature of the underlying property.
The “other operating costs” category includes telecommunications expense, postage, and other miscellaneous costs. Telecommunications expense increased by 16% to $1.8 million in 2020, as compared to $1.5 million in 2019. The increase was due to an upgrade of telecommunications circuits, as well as additional costs from work-at-home arrangements during the COVID-19 pandemic. The increased telecommunication costs in 2020, are not expected to continue at the same rate, as old duplicative circuits are removed from service. Such expense was $0.1 million, or 3%, higher in 2019 than in 2018. Postage expense decreased by $0.1 million, or 26%, in 2020 as compared to 2019 and decreased by $0.6 million or 56%, in 2019 relative to 2018. The decrease in 2020 was due to concentrated efforts to decrease our utilization of overnight mail services and increase usage of digital technologies. The significant decline in 2019 was due mostly to a reclassification of nearly the entire annual variance to deposit services costs related to paper statements as described above. The “Other” category under other operating costs decreased by $0.2 million, or 8%, in 2020 as compared to 2019 and up by $0.4 million, or 28%, in 2019 over 2018. The decrease in 2020 is due to the lack of participation in offsite conferences and training due to the COVID-19 pandemic. The increase in 2019 is due mostly to higher consulting and training costs as well as higher recruiting costs.
Total Professional Services costs increased by $0.4 million, or 9%, in 2020 as compared to 2019, as compared to a $0.3 million, or 6%, increase in 2019 as compared to 2018. Professional Services costs consists of legal and accounting, acquisition, and other professional services costs. Legal and Accounting costs decreased by $0.1 million, or 4%, in 2020 as compared to 2019, and increased by $0.1 million, or 7%, in 2019 as compared to 2018. The decrease in 2020 was due to lower internal audit costs as a result of moving some third party reviews inhouse. The increase in 2019 was mostly due to increased audit and compliance costs as a result of an enhanced risk management program. Acquisition costs, or one-time expenses directly attributable to our whole-bank and branch acquisitions, were nil in 2020, as compared to just $0.02 million in 2019 and $0.5 million in 2018. Acquisition costs are comprised primarily of termination fees for core processing contracts and certain other contracts, software conversion costs, financial advisor fees, legal costs, severance and retention amounts paid to employees of the acquired institutions, and the write-off of furniture, fixtures and equipment that were not utilized by the Company. Other professional services costs include FDIC assessments and other regulatory expenses, directors’ costs, and certain insurance costs among other things. This category increased by $0.5 million, or 20%, in 2020 as compared to 2019, and increased by $0.5 million, or 27%, in 2019 relative to 2018. The increase in 2020 is primarily from an increase in FDIC assessment expenses as we utilized all of the available small bank assessment credits after the first quarter of 2020. There was also a favorable swing in the director’s deferred compensation expense for both 2020 and 2019, which is mostly offset by higher BOLI income, as described above under the separate account BOLI. In addition, FDIC and State exam assessment expenses declined by $0.3 million in 2019 as compared to 2018.
Stationery and supply costs increased by $0.1 million, or 40%, in 2020 as compared to 2019 due primarily to specialized supplies attributed to the COVID-19 pandemic. This same category decreased by $1.1 million, or 77%, in 2019 over 2018, due to a reclassification of customer paper statement expense to deposit services costs as described above.
47
Sundry and teller costs of $0.6 million in 2020, $0.3 million in 2019, and $0.4 million in 2018 primarily reflect operational losses, including debit card disputes. These costs were $0.3 million higher in 2020 over 2019, mainly because of two large operational losses, and higher debit card losses, consistent with the higher volume of debit card transactions. In 2019 over 2018, these costs trended downward due to the implementation of new technology and education.
The Company’s tax-equivalent overhead efficiency ratio was 57.2% in 2020, 57.5% in 2019, and 60.8% in 2018. The overhead efficiency ratio represents total noninterest expense divided by the sum of fully tax-equivalent net interest and noninterest income, with the provision for loan and lease losses and investment gains/losses excluded from the equation. The ratio trended downward due to continued efforts to control costs, as well as higher income which is the denominator of the equation.
Income Taxes
Our income tax provision was $11.1 million, or 23.8% of pre-tax income in 2020 as compared to $11.8 million, or 24.6% of pre-tax income in 2019, and $9.9 million, or 25.0% of pre-tax income in 2018. The tax accrual rate was slightly lower in 2020 due to a higher proportion of non-taxable income, and approximately the same in 2019 as it was in 2018.
The Company sets aside a provision for income taxes on a monthly basis. The amount of that provision is determined by first applying the Company’s statutory income tax rates to estimated taxable income, which is pre-tax book income adjusted for permanent differences, and then subtracting available tax credits. Permanent differences include but are not limited to tax-exempt interest income, BOLI income, and certain book expenses that are not allowed as tax deductions. The Company’s investments in state, county and municipal bonds provided $5.7 million of federal tax-exempt income in 2020, $4.5 million in 2019, and $4.1 million in 2018. Moreover, in addition to life insurance proceeds of $0.07 million in 2020, net increases in the cash surrender value of bank-owned life insurance added $2.4 million to tax-exempt income in 2020; $2.2 million in 2019, and $0.6 million in 2018.
Our tax credits consist primarily of those generated by investments in low-income housing tax credit funds, and California state employment tax credits. We had a total of $3.5 million invested in low-income housing tax credit funds as of December 31, 2020 and $4.1 million as of December 31, 2019, which are included in other assets rather than in our investment portfolio. Those investments have generated substantial tax credits over the past few years, with about $0.5 million in credits available for the 2020 tax year; $0.5 million for the 2019 tax year, and $0.6 million in 2018. The credits are dependent upon the occupancy level of the housing projects and income of the tenants and cannot be projected with certainty. Furthermore, our capacity to utilize them will continue to depend on our ability to generate sufficient pre-tax income. We plan to invest in additional tax credit funds in the future, but if the economics of such transactions do not justify continued investments then the level of low-income housing tax credits will taper off in future years until they are substantially utilized by the end of 2028. That means that even if taxable income stayed at the same level through 2028, our tax accrual rate would gradually increase.
Financial Condition
Assets totaled $3.2 billion at December 31, 2020, an increase of $626.9 million, or 24%, for the year. Assets increased in 2020 primarily due to 694.5 million, or 39% increase, in net loans and leases. Deposits were up $456.2 million, or 21%. Total capital increased by $34.6 million, or 11%. The major components of the Company’s balance sheet are individually analyzed below, along with information on off-balance sheet activities and exposure.
Loan and Lease Portfolio
The Company’s loan and lease portfolio represents the single largest portion of invested assets, substantially greater than the investment portfolio or any other asset category, and the quality and diversification of the loan and lease portfolio are important considerations when reviewing the Company’s financial condition.
The Selected Financial Data table in Item 6 above reflects the amount of loans and leases outstanding at December 31 for each year from 2020 back to 2016, net of deferred fees and origination costs and the allowance for loan and lease losses. The Loan and Lease Distribution table that follows sets forth by loan type the Company’s gross loans and leases
48
outstanding, and the percentage distribution in each category at the dates indicated. The balances for each loan type include nonperforming loans, if any, but do not reflect any deferred or unamortized loan origination, extension, or commitment fees, or deferred loan origination costs. Although not reflected in the loan totals below and not currently comprising a material part of our lending activities, the Company also occasionally originates and sells, or participates out portions of, loans to non-affiliated investors.
Loan and Lease Distribution | |||||||||||||||
(dollars in thousands) | |||||||||||||||
As of December 31, | |||||||||||||||
| 2020 |
| 2019 |
| 2018 |
| 2017 |
| 2016 | ||||||
Real estate: | |||||||||||||||
1-4 family residential construction | $ | 48,565 | $ | 105,979 | $ | 105,676 | $ | 74,256 | $ | 32,417 | |||||
Other construction/land | 71,980 | 91,413 | 109,023 | 58,779 | 40,650 | ||||||||||
1-4 family - closed-end | 139,836 | 200,181 | 236,825 | 204,766 | 137,143 | ||||||||||
Equity lines | 38,075 | 49,599 | 56,320 | 62,590 | 43,443 | ||||||||||
Multi-family residential | 61,865 | 54,457 | 54,877 | 42,930 | 31,631 | ||||||||||
Commercial real estate - owner occupied | 343,199 | 343,883 | 301,324 | 263,447 | 253,535 | ||||||||||
Commercial real estate - non-owner occupied | 1,062,498 | 412,569 | 438,344 | 379,432 | 244,198 | ||||||||||
Farmland | 129,905 | 144,033 | 151,541 | 140,516 | 134,480 | ||||||||||
Total real estate | 1,895,923 | 1,402,114 | 1,453,930 | 1,226,716 | 917,497 | ||||||||||
Agricultural | 44,872 | 48,036 | 49,103 | 46,796 | 46,229 | ||||||||||
Commercial and industrial | 209,048 | 115,532 | 128,220 | 135,662 | 123,595 | ||||||||||
Mortgage warehouse lines | 307,679 | 189,103 | 91,813 | 138,020 | 163,045 | ||||||||||
Consumer loans | 5,589 | 7,780 | 8,862 | 10,626 | 12,165 | ||||||||||
Total loans and leases | $ | 2,463,111 | $ | 1,762,565 | $ | 1,731,928 | $ | 1,557,820 | $ | 1,262,531 | |||||
Percentage of Total Loans and Leases | |||||||||||||||
Real estate: | |||||||||||||||
1-4 family residential construction | 1.97% | 6.01% | 6.10% | 4.77% | 2.57% | ||||||||||
Other construction/land | 2.92% | 5.19% | 6.29% | 3.77% | 3.22% | ||||||||||
1-4 family - closed-end | 5.68% | 11.36% | 13.67% | 13.14% | 10.86% | ||||||||||
Equity lines | 1.55% | 2.81% | 3.25% | 4.02% | 3.44% | ||||||||||
Multi-family residential | 2.51% | 3.09% | 3.17% | 2.76% | 2.51% | ||||||||||
Commercial real estate - owner occupied | 13.93% | 19.51% | 17.40% | 16.91% | 20.08% | ||||||||||
Commercial real estate - non-owner occupied | 43.14% | 23.41% | 25.32% | 24.36% | 19.34% | ||||||||||
Farmland | 5.27% | 8.17% | 8.75% | 9.02% | 10.65% | ||||||||||
Total real estate | 76.97% | 79.55% | 83.95% | 78.75% | 72.67% | ||||||||||
Agricultural | 1.82% | 2.73% | 2.84% | 3.00% | 3.66% | ||||||||||
Commercial and industrial | 8.49% | 6.55% | 7.40% | 8.71% | 9.79% | ||||||||||
Mortgage warehouse lines | 12.49% | 10.73% | 5.30% | 8.86% | 12.91% | ||||||||||
Consumer loans | 0.23% | 0.44% | 0.51% | 0.68% | 0.96% | ||||||||||
| 100.00% | 100.00% | 100.00% | 100.00% | 100.00% | ||||||||||
The Company has experienced net growth in loan and lease balances in each of the last five years, despite fluctuations caused by variability in outstanding balances on mortgage warehouse lines, reductions associated with the resolution of impaired loans, weak loan demand in some years, tightened underwriting standards, and intense competition. This growth is due in part to acquisitions, including Coast National Bank in 2016 and Ojai Community Bank in 2017, as well as whole loan purchases and participations, and participation in the SBA PPP loan program in 2020. Organic loan growth has also been extremely robust in recent periods, particularly with regard to non-owner occupied commercial real estate loans.
For 2020, gross loans were up by $700.5 million, or 40%, due largely to $649.9 million of organic growth in non-agricultural real estate loans. This growth was a deliberate effort of our Northern and Southern market loan production
49
teams and was facilitated by the opening of a loan production office in Northern California (Rocklin, California) and an expansion of the loan team in Southern California.
Mortgage warehouse lines also contributed to the 2020 increase; up by $118.6 million, or 63%. Commercial and industrial loans were up by $93.5 million or 81% due to our participation in the SBA PPP loan program. Multi-family residential loans increased $7.4 million or 14%. These increases were partially offset by declines in all other loan categories. Mortgage warehouse lines increased by $97.2 million, or 106%, in 2019 primarily due to a strategy to focus on volume given the short duration of these loans. This growth strategy involved providing more competitive pricing to mortgage originators coupled with a stronger emphasis on calling efforts. The largest single decline in any other category of loans during 2019 was real estate loans of $51.8 million, or 4%, mostly due to a strategic decision to significantly reduce our activity of residential mortgages; as a result residential mortgage loan balances declined by approximately $43.4 million in 2019.
As demonstrated by the expansion of the lending teams, management remains focused on organic loan growth, however at a significantly lower rate than what was experienced in 2020. Our loan pipeline at December 31, 2020, softened due to a strategic shift to focus on further diversifying our loan mix, especially as it relates to non-owner occupied commercial real estate. No assurance can be provided with regard to future net growth in aggregate loan balances given occasional surges in prepayments, including forgiveness of PPP loans; fluctuations in mortgage warehouse lending; and maintaining concentrations in certain sectors within our risk management parameters.
As a part of their regulatory oversight, the federal regulators have issued guidelines on sound risk management practices with respect to a financial institution’s concentrations in commercial real estate (“CRE”) lending activities. These guidelines were issued in response to the agencies’ concerns that rising CRE concentrations might expose institutions to unanticipated earnings and capital volatility in the event of adverse changes in the commercial real estate market. The guidelines identify certain concentration levels that, if exceeded, will expose the institution to additional supervisory analysis with regard to the institution’s CRE concentration risk. The guidelines, as amended, are designed to promote appropriate levels of capital and sound loan and risk management practices for institutions with a concentration of CRE loans. In general, the guidelines, as amended, establish the following supervisory criteria as preliminary indications of possible CRE concentration risk: (1) the institution’s total construction, land development and other land loans represent 100% or more of Tier 1 risk-based capital plus allowance for loan and lease losses; or (2) total CRE loans as defined in the regulatory guidelines represent 300% or more of Tier 1 risk-based capital plus allowance for loan and lease losses, and the institution’s CRE loan portfolio has increased by 50% or more during the prior 36 month period. At December 31, 2020, the Bank’s total construction, land development and other land loans represented 36% of Tier 1 risk-based capital plus allowance for loan and lease losses. At December 31, 2020, the Bank’s total CRE loans as defined in the regulatory guidelines represented 378% of Tier 1 risk-based capital plus allowance for loan and lease losses, and the Bank’s CRE loan portfolio has increased by more than 50% during the prior 36 month period. Therefore, the Bank believes that the guidelines are applicable to it as it has a potential concentration in CRE loans. The Bank and its board of directors have discussed the guidelines and believe that the Bank’s underwriting policies, management information systems, independent credit administration process, and monitoring of real estate loan concentrations are sufficient to address the risk management of CRE under the guidelines.
50
Loan and Lease Maturities
The following table shows the maturity distribution for total loans and leases outstanding as of December 31, 2020, including non-accruing loans, grouped by remaining scheduled principal payments:
Loans and Lease Maturity | |||||||||||||||||||||||
(dollars in thousands) | |||||||||||||||||||||||
As of December 31, 2020 | |||||||||||||||||||||||
Three months | Floating rate: | Fixed rate: | |||||||||||||||||||||
Three months | to twelve | One to five | Over five | due after one | due after one | ||||||||||||||||||
| or less |
| months |
| years |
| years |
| Total |
| year |
| year | ||||||||||
Real estate | $ | 48,793 | $ | 38,915 | $ | 131,773 | $ | 1,676,442 | $ | 1,895,923 | $ | 899,339 | $ | 908,876 | |||||||||
Agricultural | 16,704 | 24,028 | 1,478 | 2,662 | 44,872 | 1,244 | 2,896 | ||||||||||||||||
Commercial and industrial | 9,878 | 18,713 | 152,189 | 28,268 | 209,048 | 23,799 | 156,658 | ||||||||||||||||
Mortgage warehouse lines | 70,132 | 237,547 | — | — | 307,679 | — | — | ||||||||||||||||
Consumer loans | 560 | 473 | 2,132 | 2,424 | 5,589 | 640 | 3,916 | ||||||||||||||||
Total | $ | 146,067 | $ | 319,676 | $ | 287,572 | $ | 1,709,796 | $ | 2,463,111 | $ | 925,022 | $ | 1,072,346 | |||||||||
Generally, the Company’s contractual life of loans matches the loan’s amortization period. Rates on loans longer than five years typically adjust starting before ten years and each five years thereafter. For a comprehensive discussion of the Company’s liquidity position, balance sheet repricing characteristics, and sensitivity to interest rates changes, refer to the “Liquidity and Market Risk” section of this discussion and analysis.
Off-Balance Sheet Arrangements
The Company maintains commitments to extend credit in the normal course of business, as long as there are no violations of conditions established in the outstanding contractual arrangements. Unused commitments to extend credit totaled $450 million at December 31, 2020 and $492 million at December 31, 2019, although it is not likely that all of those commitments will ultimately be drawn down. The decrease in 2020 is due in part to a higher utilization of mortgage warehouse lines in 2020. Unused commitments represented approximately 18% of gross loans outstanding at December 31, 2020 and 28% at December 31, 2019. The Company also had undrawn letters of credit issued to customers totaling $8.2 million and $8.6 million at December 31, 2020 and 209, respectively. Off-balance sheet obligations pose potential credit risk to the Company, and a $0.3 million reserve for unfunded commitments is reflected as a liability in our consolidated balance sheet at December 31, 2020, which was relatively unchanged from the previous year. The unused commitments related to mortgage warehouse are unconditionally cancellable at any time. The effect on the Company’s revenues, expenses, cash flows and liquidity from the unused portion of the commitments to provide credit cannot be reasonably predicted because there is no guarantee that the lines of credit will ever be used. However, the “Liquidity” section in this Form 10-K outlines resources available to draw upon should we be required to fund a significant portion of unused commitments.
In addition to unused commitments to provide credit, the Company is utilizing a $105 million letter of credit issued by the Federal Home Loan Bank on the Company’s behalf as security for certain deposits and to facilitate certain credit arrangements with the Company’s customers. That letter of credit is backed by loans which are pledged to the FHLB by the Company. For more information regarding the Company’s off-balance sheet arrangements, see Note 13 to the consolidated financial statements in Item 8 herein.
51
Contractual Obligations
At the end of 2020, the Company had contractual obligations for the following payments, by type and period due:
Contractual Obligations | |||||||||||||||
(dollars in thousands) | |||||||||||||||
Payments Due by Period | |||||||||||||||
Less Than | More Than | ||||||||||||||
| Total |
| 1 Year |
| 1-3 Years |
| 3-5 Years |
| 5 Years | ||||||
Subordinated debentures | $ | 35,124 | $ | — | $ | — | $ | — | $ | 35,124 | |||||
Operating leases | 9,393 | 2,130 | 2,991 | 1,660 | 2,612 | ||||||||||
Other long-term obligations | 1,439 | 34 | 66 | 18 | 1,321 | ||||||||||
Total | $ | 45,956 | $ | 2,164 | $ | 3,057 | $ | 1,678 | $ | 39,057 | |||||
Nonperforming Assets
Nonperforming assets (“NPAs”) are comprised of loans for which the Company is no longer accruing interest, and foreclosed assets which primarily consists of OREO. If the Company grants a concession to a borrower in financial difficulty, the loan falls into the category of a troubled debt restructuring (“TDR”), which may be designated as either nonperforming or performing depending on the loan’s accrual status.
The following table presents comparative data for the Company’s NPAs and performing TDRs as of the dates noted:
Nonperforming Assets and Performing TDRs | |||||||||||||||
(dollars in thousands) | |||||||||||||||
As of December 31, | |||||||||||||||
| 2020 |
| 2019 |
| 2018 |
| 2017 |
| 2016 | ||||||
Real estate: | |||||||||||||||
Other construction/land | $ | — | $ | 31 | $ | 82 | $ | 77 | $ | 558 | |||||
1-4 family - closed-end | 1,193 | 741 | 799 | 871 | 963 | ||||||||||
Equity lines | 2,403 | 480 | 408 | 922 | 1,926 | ||||||||||
Multi-family residential | — | — | — | — | — | ||||||||||
Commercial real estate - owner occupied | 1,678 | 1,440 | 605 | 236 | 1,572 | ||||||||||
Commercial real estate - non-owner occupied | 582 | 2,105 | 49 | 123 | 67 | ||||||||||
Farmland | 442 | 258 | 1,642 | 293 | 39 | ||||||||||
TOTAL REAL ESTATE | 6,298 | 5,055 | 3,585 | 2,522 | 5,125 | ||||||||||
Agricultural | 250 | — | — | — | 89 | ||||||||||
Commercial and industrial | 1,026 | 651 | 1,425 | 1,301 | 692 | ||||||||||
Consumer loans | 24 | 31 | 146 | 140 | 459 | ||||||||||
TOTAL NONPERFORMING LOANS (1) (2) | $ | 7,598 | $ | 5,737 | $ | 5,156 | $ | 3,963 | $ | 6,365 | |||||
| |||||||||||||||
Foreclosed assets | 971 | 800 | 1,082 | 5,481 | 2,225 | ||||||||||
Total nonperforming assets | $ | 8,569 | $ | 6,537 | $ | 6,238 | $ | 9,444 | $ | 8,590 | |||||
Performing TDRs (1) | $ | 11,382 | $ | 8,415 | $ | 10,920 | $ | 12,413 | $ | 14,182 | |||||
Loans deferred under CARES Act (2) | $ | 29,500 | $ | — | $ | — | $ | — | $ | — | |||||
Nonperforming loans as a % of total gross loans and leases | 0.31% | 0.33% | 0.30% | 0.25% | 0.50% | ||||||||||
Nonperforming assets as a % of total gross loans and leases and foreclosed assets | 0.35% | 0.37% | 0.36% | 0.60% | 0.68% | ||||||||||
| (1) | Performing TDRs are not included in nonperforming loans above, nor are they included in the numerators used to calculate the ratios disclosed in this table. |
| (2) | Loans deferred under the CARES act are not included in nonperforming loans above, nor are they included in the numerators used to calculate the ratios disclosed in the table. |
52
NPAs totaled $8.6 million, or 0.4% of gross loans and leases plus foreclosed assets at the end of 2020, up from $6.5 million, or 0.4% of gross loans and leases plus foreclosed assets at the end of 2019. $1.4 million of the increase in non-performing loans during 2020, was a result of 10 loans previously deferred under section 4013 of the CARES Act, that were unable to resume their scheduled payments at the end of the deferral period. NPAs were reduced by $3.2 million, or 34%, during 2018 in response to better economic conditions.
Nonperforming loans secured by real estate comprised $6.3 million of total nonperforming loans at December 31, 2020, an increase of $1.2 million, or 25%, since December 31, 2019. There were also increases of $0.4 million in commercial & industrial loans and $0.3 million in agricultural production loans. Consumer nonperforming loans were mostly unchanged during 2020. Nonperforming loan balances at December 31, 2020 include $3.9 million in TDRs and other loans that were paying as agreed, but which met the technical definition of nonperforming and were classified as such. We also had $29.5 million in loans deferred under the CARES Act, which are not treated as TDRs and were still accruing interest at December 31, 2020, and $11.4 million in loans classified as performing TDRs for which we were still accruing interest at December 31, 2020, an increase of $3.0 million, or 35%, relative to December 31, 2019. Notes 2 and 4 to the consolidated financial statements provide a more comprehensive disclosure of TDR balances and activity within recent periods.
Loan modifications not treated as TDRs were $29.5 million at December 31, 2020. Two loans for $6.3 million were extensions of loans previously modified, which had matured but needed additional time to resume payments. Of the total loans modified at year end, $14.7 million, or 50%, are hotels, and $14.0 million, or 47%, are lessors of non-residential buildings. Approximately 59% of loans currently under modification have maturities within 90 days, with the remaining 41% maturing within 180 days. All loans are well secured based on the most recent appraisal.
The balance of foreclosed assets had a carrying value of $1.0 million at December 31, 2020, comprised of 7 properties classified as OREO. At the end of 2019 foreclosed assets totaled $0.8 million, consisting of 10 properties classified as OREO and two mobile homes. All foreclosed assets are periodically evaluated and written down to their fair value less expected disposition costs, if lower than the then-current carrying value.
Allowance for Loan and Lease Losses
The allowance for loan and lease losses, a contra-asset, is established through a provision for loan and lease losses. It is maintained at a level that is considered adequate to absorb probable losses on specifically identified impaired loans, as well as probable incurred losses inherent in the remaining loan portfolio. Specifically identifiable and quantifiable losses are immediately charged off against the allowance; recoveries are generally recorded only when sufficient cash payments are received subsequent to the charge off. Note 2 to the consolidated financial statements provides a more comprehensive discussion of the accounting guidance we conform to and the methodology we use to determine an appropriate allowance for loan and lease losses, including information regarding the Company’s decision to defer implementation of Current Expected Credit Loss ("CECL") accounting method, which was further extended to the earlier of the first day of the fiscal year, beginning after the national emergency terminates or January 1, 2022, by the Consolidated Appropriations Act of 2021. It is expected that the Company’s Allowance for Credit Loss under CECL will be approximately 50% higher than the current Allowance for Loan and Lease Losses, with the initial adjustment being recorded as an adjustment to equity.
The Company’s allowance for loan and lease losses was $17.7 million, or 0.7% of gross loans at December 31, 2020, relative to $9.9 million, or 0.6% of gross loans at December 31, 2019. The increase in the allowance resulted from the addition of a $8.6 million loan and lease loss provision in 2020, less $0.7 million in net loan charge-offs. Reserves were established for losses inherent in incremental loan balances and unanticipated charge-offs in 2020. The net increase in the allowance might have been even larger if not for the following circumstances: charge-offs were recorded against pre-established reserves, which alleviated what otherwise might have been a need for reserve replenishment; all acquired loans were booked at their fair values, and thus did not initially require a loan and lease loss allowance; and loan and lease loss rates have been declining, having a positive impact on general reserves established for performing loans. The ratio of the allowance to nonperforming loans was 233% at December 31, 2020, relative to 173% at December 31, 2019, and 189% at December 31, 2018. As described above, a separate allowance of $0.3 million for potential losses inherent in unused commitments is included in other liabilities at December 31, 2020.
53
The table that follows summarizes the activity in the allowance for loan and lease losses for the periods indicated:
Allowance for Loan and Lease Losses | |||||||||||||||
(dollars in thousands) | |||||||||||||||
As of and for the years ended December 31, | |||||||||||||||
Balances: |
| 2020 |
| 2019 |
| 2018 |
| 2017 |
| 2016 | |||||
Average gross loans and leases outstanding during period | $ | 2,068,690 | $ | 1,753,748 | $ | 1,625,732 | $ | 1,318,909 | $ | 1,153,240 | |||||
Gross loans and leases held for investment | $ | 2,463,111 | $ | 1,762,565 | $ | 1,731,928 | $ | 1,557,820 | $ | 1,262,531 | |||||
| |||||||||||||||
Allowance for Loan and Lease Losses: | |||||||||||||||
Balance at beginning of period | $ | 9,923 | $ | 9,750 | $ | 9,043 | $ | 9,701 | $ | 10,423 | |||||
Provision (benefit) charged to expense | 8,550 | 2,550 | 4,350 | (1,140) | — | ||||||||||
Charge-offs | |||||||||||||||
Real estate: | |||||||||||||||
1-4 family residential construction | — | — | — | — | — | ||||||||||
Other construction/land | — | — | 4 | — | 144 | ||||||||||
1-4 family - closed-end | — | — | 5 | 7 | 97 | ||||||||||
Equity lines | — | — | 125 | 58 | 94 | ||||||||||
Multi-family residential | — | — | — | — | 50 | ||||||||||
Commercial real estate - owner occupied | — | — | — | 36 | 108 | ||||||||||
Commercial real estate - non-owner occupied | — | 1,190 | 2,341 | — | 469 | ||||||||||
Farmland | — | — | — | — | — | ||||||||||
TOTAL REAL ESTATE | — | 1,190 | 2,475 | 101 | 962 | ||||||||||
Agricultural | — | — | — | 154 | — | ||||||||||
Commercial and industrial | 436 | 1,274 | 608 | 669 | 344 | ||||||||||
Mortgage warehouse lines | — | — | — | — | — | ||||||||||
Consumer loans | 1,397 | 2,409 | 2,225 | 2,161 | 1,905 | ||||||||||
Total | 1,833 | 4,873 | 5,308 | 3,085 | 3,211 | ||||||||||
Recoveries | |||||||||||||||
Real estate: | |||||||||||||||
1-4 family residential construction | — | — | — | — | — | ||||||||||
Other construction/land | 40 | 2 | — | 5 | 467 | ||||||||||
1-4 family - closed-end | 13 | 148 | 10 | 1,959 | 15 | ||||||||||
Equity lines | 34 | 150 | 134 | 32 | 17 | ||||||||||
Multi-family residential | — | — | — | — | — | ||||||||||
Commercial real estate - owner occupied | — | — | 230 | 38 | 35 | ||||||||||
Commercial real estate - non-owner occupied | — | 347 | — | 201 | 449 | ||||||||||
Farmland | — | — | — | — | — | ||||||||||
TOTAL REAL ESTATE | 87 | 647 | 374 | 2,235 | 983 | ||||||||||
Agricultural | — | — | 22 | 5 | 14 | ||||||||||
Commercial and industrial | 129 | 690 | 148 | 310 | 477 | ||||||||||
Mortgage warehouse lines | — | — | — | — | — | ||||||||||
Consumer loans | 882 | 1,159 | 1,121 | 1,017 | 1,015 | ||||||||||
Total | 1,098 | 2,496 | 1,665 | 3,567 | 2,489 | ||||||||||
Net loan charge-offs (recoveries) | 735 | 2,377 | 3,643 | (482) | 722 | ||||||||||
Balance | $ | 17,738 | $ | 9,923 | $ | 9,750 | $ | 9,043 | $ | 9,701 | |||||
| |||||||||||||||
RATIOS | |||||||||||||||
Net loan and lease charge-offs (recoveries) to average loans and leases | 0.04% | 0.14% | 0.22% | (0.04)% | 0.06% | ||||||||||
Allowance for loan and lease losses to gross loans and leases at end of period | 0.72% | 0.56% | 0.56% | 0.58% | 0.77% | ||||||||||
Allowance for loan and lease losses to non-performing loans | 233.46% | 172.96% | 189.10% | 228.19% | 152.41% | ||||||||||
Net loan and lease charge-offs (recoveries) to allowance for loan and lease losses at end of period | 4.14% | 23.95% | 37.36% | (5.33)% | 7.44% | ||||||||||
Net loan charge-offs (recoveries) to provision (benefit) for loan and lease losses | 8.60% | 93.22% | 83.75% | 42.28% | — | ||||||||||
As shown in the table above, the Company recorded a loan and lease loss provision of $8.6 million in 2020 compared to $2.6 million in 2019, and $4.4 million in 2018. Our allowance for probable losses on specifically identified impaired loans increased $0.2 million, or 20%, during 2020, whereas it was reduced by $1.2 million, or 59%, during 2019. The allowance
54
for probable losses inherent in non-impaired loans increased by $7.6 million, or 84%, as a result of potential economic conditions, downgrades of certain loans deferred under section 4013 of the Cares Act and the continued uncertainty surrounding the estimated impact that COVID-19 has had on the economy and our loan customers, potential changes in collateral values due to reduced cash flows, and external factors such as government actions.
The “Provision for Loan and Lease Losses” section above includes additional details on our provision and its relationship to actual charge-offs.
Provided below is a summary of the allocation of the allowance for loan and lease losses for specific loan categories at the dates indicated. The allocation presented should not be viewed as an indication that charges to the allowance will be incurred in these amounts or proportions, or that the portion of the allowance allocated to a particular loan category represents the total amount available for charge-offs that may occur within that category.
Allocation of Allowance for Loan and Lease Losses | |||||||||||||||||||||||||
(dollars in thousands) | |||||||||||||||||||||||||
As of December 31, | |||||||||||||||||||||||||
2020 | 2019 | 2018 | 2017 | 2016 | |||||||||||||||||||||
| Amount |
| %Total (1) |
| Amount |
| %Total (1) |
| Amount |
| %Total (1) |
| Amount |
| %Total (1) |
| Amount |
| %Total (1) | ||||||
Real Estate | $ | 11,766 | 76.97% | $ | 5,635 | 79.55% | $ | 5,831 | 83.95% | $ | 4,786 | 78.75% | $ | 3,548 | 72.67% | ||||||||||
Agricultural | 482 | 1.82% | 193 | 2.73% | 256 | 2.84% | 208 | 3.00% | 209 | 3.66% | |||||||||||||||
Commercial and industrial (2) | 4,721 | 20.98% | 2,685 | 17.28% | 2,394 | 12.70% | 2,772 | 17.57% | 4,279 | 22.71% | |||||||||||||||
Consumer loans | 720 | 0.23% | 1,278 | 0.44% | 1,239 | 0.51% | 1,231 | 0.68% | 1,208 | 0.96% | |||||||||||||||
Unallocated | 49 | — | 132 | — | 30 | — | 46 | — | 457 | — | |||||||||||||||
Total | $ | 17,738 | 100.00% | $ | 9,923 | 100.00% | $ | 9,750 | 100.00% | $ | 9,043 | 100.00% | $ | 9,701 | 100.00% | ||||||||||
| (1) | Represents percentage of loans in category to total loans |
| (2) | Includes mortgage warehouse lines |
The Company’s allowance for loan and lease losses at December 31, 2020 represents Management’s best estimate of probable losses in the loan portfolio as of that date, but no assurance can be given that the Company will not experience substantial losses relative to the size of the allowance. Furthermore, fluctuations in credit quality, changes in economic conditions, updated accounting, or regulatory requirements, and/or other factors could induce us to augment or reduce the allowance. The Company adopted the current expected credit losses methodology on January 1, 2020, however as previously noted under the Allowance for Loan and Lease Losses section above in March 2020, the Company elected under Section 4014 of the Coronavirus Aid, Relief, and Economic Security (CARES) Act to defer the implementation of CECL until the earlier of when the national emergency related to the outbreak of COVID-19 ends or December 31, 2020. In December 2020, the Consolidated Appropriations Act 2021, extended the deferral of implementation of CECL from December 31, 2020, to the earlier of the first day of the fiscal year, beginning after the national emergency terminates or January 1, 2022. The Company initially elected in the first quarter of 2020 to postpone implementation and will now continue to postpone implementation in order to provide additional time to assess better the impact of the COVID-19 pandemic on the expected lifetime credit losses. At the time the initial decision was made, there was a significant economic uncertainty on the local, regional, and national levels as a result of local and state stay-at-home orders, as well as relief measures provided at a national, state, and local level. Further, the Company took actions to serve our communities during the pandemic, including permitting short-term payment deferrals to current customers, as well as originating bridge loans and SBA PPP loans. It was determined that more time is still needed to assess the impact of the uncertainty and related actions on the Company's allowance for loan and lease losses under the CECL methodology.
Investments
The Company’s investments can at any given time consist of debt securities and marketable equity securities (together, the “investment portfolio”), investments in the time deposits of other banks, surplus interest-earning balances in our Federal Reserve Bank (“FRB”) account, and overnight fed funds sold. Surplus FRB balances and fed funds sold to correspondent banks typically represent the temporary investment of excess liquidity. The Company’s investments serve several purposes: 1) they provide liquidity to even out cash flows from the loan and deposit activities of customers; 2) they
55
provide a source of pledged assets for securing public deposits, bankruptcy deposits and certain borrowed funds which require collateral; 3) they constitute a large base of assets with maturity and interest rate characteristics that can be changed more readily than the loan portfolio, to better match changes in the deposit base and other funding sources of the Company; 4) they are another interest-earning option for surplus funds when loan demand is light; and 5) they can provide partially tax exempt income. Aggregate investments totaled $547.5 million, or 17% of total assets at December 31, 2020, as compared to $615.3 million, or 24% of total assets at December 31, 2019.
We had no fed funds sold at the end of the reporting periods, and interest-bearing balances held primarily in our Federal Reserve Bank account totaled $3.5 million at December 31, 2020, as compared to $14.5 million at December 31, 2019. The Company’s investment securities portfolio had a book balance of $544.0 million at December 31, 2020, compared to $600.8 million at December 31, 2019, reflecting a net decrease of $56.8 million for 2020. The Company carries investments at their fair market values. We currently have the intent and ability to hold our investment securities to maturity, but the securities are all marketable and are classified as “available for sale” to allow maximum flexibility with regard to interest rate risk and liquidity management. The expected average life for bonds in our investment portfolio was 4.2 years and their average effective duration was 2.4 years at December 31, 2020, as compared to an expected average life of 4.4 years and an average effective duration of 3.2 years at year-end 2019.
The following Investment Portfolio table reflects the amortized cost and fair market values for each primary category of investment securities for the past three years:
Investment Portfolio-Available for Sale | ||||||||||||||||||
(dollars in thousands) | ||||||||||||||||||
As of December 31, | ||||||||||||||||||
2020 | 2019 | 2018 | ||||||||||||||||
| Amortized |
| Fair Market |
| Amortized |
| Fair Market |
| Amortized |
| Fair Market | |||||||
U.S. government agencies | $ | 1,725 | $ | 1,800 | $ | 12,125 | $ | 12,145 | $ | 15,553 | $ | 15,212 | ||||||
Mortgage-backed securities | 304,108 | 314,435 | 398,353 | 400,389 | 414,208 | 404,733 | ||||||||||||
State and political subdivisions | 212,011 | 227,739 | 181,900 | 188,265 | 140,181 | 140,534 | ||||||||||||
Total securities | $ | 517,844 | $ | 543,974 | $ | 592,378 | $ | 600,799 | $ | 569,942 | $ | 560,479 | ||||||
The net unrealized gain on our investment portfolio, or the amount by which aggregate fair market values exceeded the amortized cost, was $26.1 million at December 31, 2020 as compared to $8.4 million at December 31, 2019, an increase of $17.7 million. The change in 2020 was caused by lower market interest rates on fixed-rate bond values. The balance of U.S. Government agency securities in our portfolio declined by $10.3 million, or 85%, during 2020 due primarily to bond maturities and a strategy to utilize bond repayments to fund higher-yielding loans in 2020. Similarly, mortgage-backed securities decreased by $86.0 million, or 21% due to prepayments not being reinvested for the above-mentioned strategy. Municipal bond balances increased by $39.5 million, or 21%. The municipal bond purchases were mostly made in the first half of 2020. Municipal bonds purchased in recent periods have strong underlying ratings, and all municipal bonds in our portfolio undergo a detailed quarterly review for potential impairment.
Investment securities that were pledged as collateral for Federal Home Loan Bank borrowings, repurchase agreements, public deposits and other purposes as required or permitted by law totaled $232.0 million at December 31, 2020 and $234.8 million at December 31, 2019, leaving $312.0 million in unpledged debt securities at December 31, 2020 and $366.0 million at December 31, 2019. Securities that were pledged in excess of actual pledging needs and were thus available for liquidity purposes, if needed, totaled $52.9 million at December 31, 2020 and $71.0 million at December 31, 2019.
The table below groups the Company’s investment securities by their remaining time to maturity as of December 31, 2020, and provides weighted average yields for each segment. Since the actual timing of principal payments may differ from
56
contractual maturities when obligors have the right to prepay principal, maturities for mortgage-backed securities (including collateralized mortgage obligations) were determined by incorporating expected prepayments.
Maturity and Yield of Available for Sale Investment Portfolio | |||||||||||||||||||||||||
(dollars in thousands) | |||||||||||||||||||||||||
December 31, 2020 | |||||||||||||||||||||||||
Within | After One | After Five Years | After | Total | |||||||||||||||||||||
| Amount |
| Yield |
| Amount |
| Yield |
| Amount |
| Yield |
| Amount |
| Yield |
| Amount |
| Yield | ||||||
U.S. government agencies | $ | — | — | $ | 1,800 | 2.71% | $ | — | — | $ | — | — | $ | 1,800 | 2.71% | ||||||||||
Mortgage-backed securities | 26,671 | 2.30% | 280,347 | 2.18% | 7,417 | 1.93% | — | — | 314,435 | 2.18% | |||||||||||||||
State and political subdivisions | 3,857 | 4.18% | 7,932 | 4.14% | 28,745 | 3.49% | 187,205 | 3.41% | 227,739 | 3.46% | |||||||||||||||
Total securities | $ | 30,528 | $ | 290,079 | $ | 36,162 | $ | 187,205 | $ | 543,974 | |||||||||||||||
Cash and Due from Banks
Interest-earning cash balances were discussed above in the “Investments” section, but the Company also maintains a certain level of cash on hand in the normal course of business as well as non-earning deposits at other financial institutions. Our balance of cash and due from banks depends on the timing of collection of outstanding cash items (checks), the amount of cash held at our branches and our reserve requirement, among other things, and is subject to significant fluctuations in the normal course of business. While cash flows are normally predictable within limits, those limits are fairly broad and the Company manages its short-term cash position through the utilization of overnight loans to, and borrowings from, correspondent banks, including the Federal Reserve Bank and the Federal Home Loan Bank. Should a large “short” overnight position persist for any length of time, the Company typically raises money through focused retail deposit gathering efforts or by adding brokered time deposits. If a “long” position is prevalent, we will let brokered deposits or other wholesale borrowings roll off as they mature, or we might invest excess liquidity into longer-term, higher-yielding bonds. The Company’s balance of noninterest earning cash and balances due from correspondent banks totaled $67.9 million, or 2% of total assets at December 31, 2020, and $65.6 million, or 3% of total assets at December 31, 2019. The average balance of non-earning cash and due from banks, which can be used to determine trends, was $72.0 million for 2020 and 2019 and $61.4 million for 2018.
Premises and Equipment
Premises and equipment are stated on our books at cost, less accumulated depreciation, and amortization. The cost of furniture and equipment is expensed as depreciation over the estimated useful life of the related assets, and leasehold improvements are amortized over the term of the related lease or the estimated useful life of the improvements, whichever is shorter.
The following premises and equipment table reflects the original cost, accumulated depreciation and amortization, and net book value of fixed assets by major category, for the years noted:
Premises and Equipment | |||||||||||||||||||||||||||
(dollars in thousands) | |||||||||||||||||||||||||||
As of December 31, | |||||||||||||||||||||||||||
2020 | 2019 | 2018 | |||||||||||||||||||||||||
Accumulated | Accumulated | Accumulated | |||||||||||||||||||||||||
Depreciation | Depreciation | Depreciation | |||||||||||||||||||||||||
and | Net Book | and | Net Book | and | Net Book | ||||||||||||||||||||||
| Cost |
| Amortization |
| Value |
| Cost |
| Amortization |
| Value |
| Cost |
| Amortization |
| Value | ||||||||||
Land | $ | 5,751 | $ | — | $ | 5,751 | $ | 5,751 | $ | — | $ | 5,751 | $ | 5,751 | $ | — | $ | 5,751 | |||||||||
Buildings | 21,580 | 11,005 | 10,575 | 21,526 | 10,407 | 11,119 | 21,579 | 10,140 | 11,439 | ||||||||||||||||||
Furniture and equipment | 20,705 | 15,474 | 5,231 | 17,798 | 14,365 | 3,433 | 18,958 | 14,971 | 3,987 | ||||||||||||||||||
Leasehold improvements | 15,226 | 9,278 | 5,948 | 15,357 | 8,269 | 7,088 | 15,023 | 7,601 | 7,422 | ||||||||||||||||||
Construction in progress | — | — | — | 44 | — | 44 | 901 | — | 901 | ||||||||||||||||||
Total | $ | 63,262 | $ | 35,757 | $ | 27,505 | $ | 60,476 | $ | 33,041 | $ | 27,435 | $ | 62,212 | $ | 32,712 | $ | 29,500 | |||||||||
57
The net book value of the Company’s premises and equipment was 1% of total assets at both December 31, 2020, and December 31, 2019. Depreciation and amortization included in occupancy and equipment expense totaled $2.8 million in 2020 and 2019.
Other Assets
Goodwill totaled $27.4 million at December 31, 2020, unchanged for the year and other intangible assets were $4.3 million, a decrease of $1.1 million, or 20%, as a result of amortization expense recorded on core deposit intangibles. The Company’s goodwill and other intangible assets are evaluated annually for potential impairment following FASB guidelines, and based on those analytics Management has determined that no impairment exists as of December 31, 2020.
The net cash surrender value of bank-owned life insurance policies increased to $52.5 million at December 31, 2020 from $50.5 million at December 31, 2019, due to the addition of BOLI income to net cash surrender values. Refer to the “Noninterest Revenue and Operating Expense” section above for a more detailed discussion of BOLI and the income it generates.
The remainder of other assets consists primarily of right-of-use assets tied to operating leases upon the adoption of Accounting Standards Update 2016-02 (Topic 842) in 2019, accrued interest receivable, deferred taxes, investments in bank stocks, other real estate owned, prepaid assets, investments in low income housing credits, and other miscellaneous assets. The total operating lease right-of-use asset recorded on the books is $10.3 million less accumulated amortization of $3.1 million. The bank stocks include Pacific Coast Bankers Bank stock and restricted stock related to the Federal Home Loan Bank of San Francisco stock held in conjunction with our FHLB borrowings and is not deemed to be marketable or liquid. Our net deferred tax asset is evaluated as of every reporting date pursuant to FASB guidance, and we have determined that no impairment exists.
Deposits
Deposits represent another key balance sheet category impacting the Company’s net interest margin and profitability metrics. Deposits provide liquidity to fund growth in earning assets, and the Company’s net interest margin is improved to the extent that growth in deposits is concentrated in less volatile and typically less costly non-maturity deposits such as demand deposit accounts, NOW accounts, savings accounts, and money market demand accounts. Information concerning average balances and rates paid by deposit type for the past three fiscal years is contained in the Distribution, Rate, and Yield table located in the previous section under “Results of Operations–Net Interest Income and Net Interest Margin.” A
58
distribution of the Company’s deposits showing the period-end balance and percentage of total deposits by type is presented as of the dates noted in the following table:
Deposit Distribution | |||||||||||||||
(dollars in thousands) | |||||||||||||||
Year Ended December 31, | |||||||||||||||
| 2020 |
| 2019 |
| 2018 |
| 2017 |
| 2016 | ||||||
Interest bearing demand deposits | $ | 109,938 | $ | 91,212 | $ | 101,243 | $ | 118,533 | $ | 132,586 | |||||
Noninterest bearing demand deposits | 943,664 | 690,950 | 662,527 | 635,434 | 524,552 | ||||||||||
NOW | 558,407 | 458,600 | 434,483 | 405,057 | 366,238 | ||||||||||
Savings | 368,420 | 294,317 | 283,953 | 283,126 | 215,693 | ||||||||||
Money market | 131,232 | 118,933 | 123,807 | 171,611 | 119,417 | ||||||||||
CDAR's < $100,000 | — | — | — | — | 251 | ||||||||||
Customer time deposit < $100,000 | 73,046 | 81,247 | 93,156 | 82,885 | 75,633 | ||||||||||
Customer time deposits ≥ $100,000 | 339,899 | 383,115 | 367,171 | 291,740 | 261,101 | ||||||||||
Brokered deposits | 100,000 | 50,000 | 50,000 | — | — | ||||||||||
Total deposits | $ | 2,624,606 | $ | 2,168,374 | $ | 2,116,340 | $ | 1,988,386 | $ | 1,695,471 | |||||
| |||||||||||||||
Percentage of Total Deposits | |||||||||||||||
Interest bearing demand deposits | 4.19% | 4.21% | 4.78% | 5.96% | 7.82% | ||||||||||
Noninterest bearing demand deposits | 35.95% | 31.86% | 31.31% | 31.96% | 30.94% | ||||||||||
NOW | 21.28% | 21.15% | 20.53% | 20.37% | 21.60% | ||||||||||
Savings | 14.04% | 13.57% | 13.42% | 14.24% | 12.72% | ||||||||||
Money market | 5.00% | 5.48% | 5.85% | 8.63% | 7.04% | ||||||||||
CDAR's < $100,000 | — | — | — | — | 0.01% | ||||||||||
Customer Time deposit < $100,000 | 2.78% | 3.75% | 4.40% | 4.17% | 4.46% | ||||||||||
Customer Time deposits > $100,000 | 12.95% | 17.67% | 17.35% | 14.67% | 15.40% | ||||||||||
Brokered deposits | 3.81% | 2.31% | 2.36% | — | — | ||||||||||
Total | 100.00% | 100.00% | 100.00% | 100.00% | 100.00% | ||||||||||
Deposit balances reflect net growth of $456.2 million, or 21%, in 2020 and $52.0 million, or 2%, during 2019. The increase in 2020 and 2019 is primarily due to organic growth as both consumer and commercial existing customers increased their deposit account balances.
Noninterest bearing demand deposit balances were up $252.7 million, or 37%; NOW and interest bearing demand accounts increased by $118.5 million, or 22% in 2020. Overall non-maturity deposits increased by $457.6 million, or 28%, to $2.1 billion at December 31, 2020.
Management is of the opinion that a relatively high level of core customer deposits is one of the Company’s key strengths, and we continue to strive for core deposit retention and growth.
The scheduled maturity distribution of the Company’s time deposits at the end of 2020 was as follows:
Deposit Maturity Distribution | ||||||||||||||||||
(dollars in thousands) | ||||||||||||||||||
As of December 31, 2020 | ||||||||||||||||||
| Three |
| Three to |
| Six to |
| One to |
| Over |
| Total | |||||||
Time certificates of deposit < $100,000 | 143,801 | 10,623 | 13,338 | 3,852 | 1,432 | 173,046 | ||||||||||||
Other time deposits ≥ $100,000 | 197,420 | 37,595 | 50,342 | 33,942 | 20,600 | 339,899 | ||||||||||||
Total | $ | 341,221 | $ | 48,218 | $ | 63,680 | $ | 37,794 | $ | 22,032 | $ | 512,945 | ||||||
59
Other Borrowings
The Company’s non-deposit borrowings may, at any given time, include fed funds purchased from correspondent banks, borrowings from the Federal Home Loan Bank, advances from the FRB, securities sold under agreements to repurchase, and/or junior subordinated debentures. The Company uses short-term FHLB advances and fed funds purchased on uncommitted lines to support liquidity needs created by seasonal deposit flows, to temporarily satisfy funding needs from increased loan demand, and for other short-term purposes. The FHLB line is committed, but the amount of available credit depends on the level of pledged collateral.
Total non-deposit interest-bearing liabilities increased $136.5 million, or 298%, in 2020, due to increases in overnight fed funds purchased, FHLB advances, and customer repurchase agreements. These increases were primarily to fund fluctuations in our mortgage warehouse loan balances. Non-deposit interest-bearing liabilities were down by $26.7 million, or 25%, in 2019, due to decreases in FHLB borrowings, partially offset by increases in customer repurchase agreements. The Company had $100.0 million in overnight fed funds purchased, $37.9 million in overnight FHLB advances, and $5.0 million in short-term borrowings from the FHLB at December 31, 2020, as compared to $20.0 million in overnight FHLB borrowings at December 31, 2019. There were no overnight federal funds purchased from other correspondent banks or advances from the FRB on our books at December 31, 2019. Repurchase agreements totaled over $39.1 million at year-end 2020 relative to a balance of $25.7 million at year-end 2019. Repurchase agreements represent “sweep accounts”, where commercial deposit balances above a specified threshold are transferred at the close of each business day into non-deposit accounts secured by investment securities. The Company had junior subordinated debentures totaling $35.1 million at December 31, 2020 and $34.9 million December 31, 2019, in the form of long-term borrowings from trust subsidiaries formed specifically to issue trust preferred securities. The small increase resulted from the amortization of discount on junior subordinated debentures that were part of our acquisition of Coast Bancorp in 2016.
The details of the Company’s short-term borrowings are presented in the table below, for the years noted:
Short-term Borrowings | |||||||||
(dollars in thousands) | |||||||||
Year Ended December 31, | |||||||||
2020 | 2019 | 2018 | |||||||
Repurchase Agreements | |||||||||
Balance at December 31 | $ | 39,138 | $ | 25,711 | $ | 16,359 | |||
Average amount outstanding | 34,614 | 22,090 | 14,332 | ||||||
Maximum amount outstanding at any month end | 41,449 | 27,712 | 17,672 | ||||||
Average interest rate for the year | 0.40% | 0.40% | 0.40% | ||||||
| |||||||||
Fed funds purchased | |||||||||
Balance at December 31 | $ | 100,000 | $ | — | $ | — | |||
Average amount outstanding | 1,918 | 313 | 22 | ||||||
Maximum amount outstanding at any month end | 100,000 | — | 850 | ||||||
Average interest rate for the year | 0.21% | 0.32% | 0.00% | ||||||
| |||||||||
FHLB advances | |||||||||
Balance at December 31 | $ | 42,900 | $ | 20,000 | $ | 56,100 | |||
Average amount outstanding | 54,244 | 13,229 | 8,967 | ||||||
Maximum amount outstanding at any month end | 195,100 | 63,700 | 56,100 | ||||||
Average interest rate for the year | 0.19% | 2.06% | 2.19% | ||||||
Other Noninterest Bearing Liabilities
Other liabilities are principally comprised of accrued interest payable, other accrued but unpaid expenses, and certain clearing amounts. The Company’s balance of other liabilities decreased by $0.4 million, or 1%, during 2020.
60
Capital Resources
The Company had total shareholders’ equity of $343.9 million at December 31, 2020 as compared to $309.3 million at December 31, 2019. The increase of $34.6 million, or 11%, is due to $35.4 million in net income and approximately $1.5 million in additional capital related to stock options, a $12.5 million increase in our accumulated other comprehensive income, net of $12.2 million in dividends paid and $2.6 million in stock repurchased. We maintained a very strong capital position throughout the recession and in the ensuing years, and our capital remains at relatively high levels in comparison to many of our peer banks.
The federal banking agencies published a final rule on November 13, 2019, that provided a simplified measure of capital adequacy for qualifying community banking organizations. A qualifying community banking organization that opts into the community bank leverage ratio framework and maintains a leverage ratio greater than 9 percent will be considered to have met the minimum capital requirements, the capital ratio requirements for the well capitalized category under the Prompt Corrective Action framework, and any other capital or leverage requirements to which the qualifying banking organization is subject. A qualifying community banking organization with a leverage ratio of greater than 9 percent may opt into the community bank leverage ratio framework if it has average consolidated total assets of less than $10 billion, has off-balance-sheet exposures of 25% or less of total consolidated assets, and has total trading assets and trading liabilities of 5 percent or less of total consolidated assets. Further, the bank must not be an advance approaches banking organization.
The final rule became effective January 1, 2020 and banks that met the qualifying criteria were able to elect to use the community bank leverage framework starting with the quarter ended March 31, 2020. The CARES Act reduced the required community bank leverage ratio to 8% until the earlier of December 31, 2020, or the national emergency is declared over. The federal bank regulatory agencies adopted an interim final rule to implement this change from the CARES Act. The Company and the Bank meet the criteria outlined in the final rule and the interim final rule and adopted the community bank leverage ratio framework in the first quarter 2020.The Company uses a variety of measures to evaluate its capital adequacy, including the community bank leverage ratio, which the Company adopted in 2020, and risk-based capital and leverage ratios in preceding years, that are calculated separately for the Company and the Bank. Management reviews these capital measurements on a quarterly basis and takes appropriate action to help ensure that they meet or surpass established internal and external guidelines. As permitted by the regulators for financial institutions that are not deemed to be “advanced approaches” institutions, the Company has elected to opt out of the Basel III requirement to include accumulated other comprehensive income in risk-based capital.
61
The following table sets forth the Company’s and the Bank’s regulatory capital ratios at the dates indicated:
| December 31, | To Be Well Capitalized Under Prompt Corrective Action Regulations (CBLR Framework) | ||
2020 (1) | ||||
Tier 1 (Core) Capital to average total assets | ||||
Sierra Bancorp and subsidiary | 10.50% | 8.00% | ||
Bank of the Sierra | 10.12% | 8.00% | ||
2019 | ||||
Common Equity Tier 1 Capital Ratio | ||||
Sierra Bancorp and subsidiary | 13.27% | 6.50% | ||
Bank of the Sierra | 14.75% | 6.50% | ||
Tier 1 Risk-Based Capital Ratio | ||||
Sierra Bancorp and subsidiary | 14.98% | 8.00% | ||
Bank of the Sierra | 14.75% | 8.00% | ||
Total Risk-Based Capital Ratio | ||||
Sierra Bancorp and subsidiary | 15.48% | 10.00% | ||
Bank of the Sierra | 15.25% | 10.00% | ||
Tier 1 (Core) Capital to average total assets | ||||
Sierra Bancorp and subsidiary | 11.91% | 5.00% | ||
Bank of the Sierra | 11.73% | 5.00% |
| (1) | The community bank leverage ratio minimum requirement is 8% as of December 31, 2020, 8.5% for calendar year 2021, and 9% for calendar year 2022 and beyond |
At the end of 2020, as our Community Bank Leverage Ratio exceeded 8%, the Company and the Bank were both classified as “well capitalized,” the highest rating of the categories defined under the Bank Holding Company Act and the Federal Deposit Insurance Corporation Improvement Act of 1991, and our regulatory capital ratios remained above the median for peer financial institutions. Similar, under the Capital Adequacy Guidelines in 2019, the Company and the Bank were both classified as “well capitalized”. We do not foresee any circumstances that would cause the Company or the Bank to be less than “well capitalized”, although no assurance can be given that this will not occur. A more detailed table of regulatory capital ratios, which includes the capital amounts and ratios required to qualify as “well capitalized” as well as minimum capital ratios, appears in Note 15 to the Consolidated Financial Statements in Item 8 herein. For additional details on risk-based and leverage capital guidelines, requirements, and calculations and for a summary of changes to risk-based capital calculations which were recently approved by federal banking regulators, see “Item 1, Business – Supervision and Regulation – Capital Adequacy Requirements” and “Item 1, Business – Supervision and Regulation – Prompt Corrective Action Provisions” herein.
Liquidity and Market Risk Management
Liquidity
Liquidity management refers to the Company’s ability to maintain cash flows that are adequate to fund operations and meet other obligations and commitments in a timely and cost-effective manner. Detailed cash flow projections are reviewed by Management on a monthly basis, with various stress scenarios applied to assess our ability to meet liquidity needs under unusual or adverse conditions. Liquidity ratios are also calculated and reviewed on a regular basis. While
62
those ratios are merely indicators and are not measures of actual liquidity, they are closely monitored, and we are committed to maintaining adequate liquidity resources to draw upon should unexpected needs arise.
The Company, on occasion, experiences cash needs as the result of loan growth, deposit outflows, asset purchases or liability repayments. To meet short-term needs, we can borrow overnight funds from other financial institutions, draw advances via Federal Home Loan Bank lines of credit, or solicit brokered deposits if customer deposits are not immediately obtainable from local sources. Availability on lines of credit from correspondent banks and the FHLB totaled $710.4 million at December 31, 2020. The Company was also eligible to borrow approximately $58.1 million at the Federal Reserve Discount Window based on pledged assets at December 31, 2020. Furthermore, funds can be obtained by drawing down excess cash that might be available in the Company’s correspondent bank deposit accounts, or by liquidating unpledged investments or other readily saleable assets. In addition, the Company can raise immediate cash for temporary needs by selling under agreement to repurchase those investments in its portfolio which are not pledged as collateral. As of December 31, 2020, unpledged debt securities plus pledged securities in excess of current pledging requirements comprised $364.9 million of the Company’s investment balances, as compared to $437.0 million at December 31, 2019. Other sources of potential liquidity include but are not necessarily limited to any outstanding fed funds sold and vault cash. The Company has a higher level of actual balance sheet liquidity than might otherwise be the case, since we utilize a letter of credit from the FHLB rather than investment securities for certain pledging requirements. That letter of credit, which is backed by loans pledged to the FHLB by the Company, totaled $104.9 million at December 31, 2020. Management is of the opinion that available investments and other potentially liquid assets, along with standby funding sources it has arranged, are more than sufficient to meet the Company’s current and anticipated short-term liquidity needs.
Primary and Secondary Liquidity Sources | December 31, 2020 | December 31, 2019 | ||||
Cash and Due From Banks | $ | 71,417 | $ | 80,077 | ||
Unpledged Investment Securities | 311,983 | 366,012 | ||||
Excess Pledged Securities | 52,892 | 70,955 | ||||
FHLB Borrowing Availability | 535,404 | 443,200 | ||||
Unsecured Lines of Credit | 175,000 | 80,000 | ||||
Funds Available through Fed Discount Window | 58,127 | 59,198 | ||||
Totals | $ | 1,204,823 | $ | 1,099,441 |
The Company did not experience a change in its ability to access traditional funding sources due to the COVID-19 pandemic. The Company had adequate sources of cash to accommodate pandemic related cash needs such as the ability to defer $424.0 million in loans under the CARES act and to fund $128.1 million in SBA PPP loans. There were no material operational expenditures related to the COVID-19 pandemic, other than $0.1 million for software purchased to accommodate the processing of SBA PPP loans. The Company is approved to borrow from the Federal Reserve’s Paycheck Protection Program Liquidity Facility (PPPLF) for any current balances of PPP loans at the time of borrowing. Should the Company wish to draw on the PPPLF, it would be required do so prior to June 30, 2021, and will be required to pledge individual SBA PPP loans as collateral. The loans are taken as collateral at their face value. Due to the Company's liquidity at December 31, 2020, and expected liquidity in the first quarter of 2021, it has elected not to utilize the PPPLF at this time.
The Company’s net loans to assets and available investments to assets ratios were 76% and 11%, respectively, at December 31, 2020, as compared to internal policy guidelines of “less than 78%” and “greater than 3%.” Other liquidity ratios reviewed periodically by Management and the Board include net loans to total deposits and wholesale funding to total assets (including ratios and sub-limits for the various components comprising wholesale funding), which were all well within policy guidelines at December 31, 2020.
The holding company’s primary uses of funds include operating expenses incurred in the normal course of business, shareholder dividends, and stock repurchases. Its primary source of funds is dividends from the Bank since the holding company does not conduct regular banking operations. Management anticipates that the Bank will have sufficient earnings to provide dividends to the holding company to meet its funding requirements for the foreseeable future and the Bank is not subject to any regulatory restrictions for paying dividends to the holding company, other than the legal and regulatory limitations on dividend payments, as outlined in Item 5(c) Dividends in this Form 10-K.
63
Interest Rate Risk Management
Market risk arises from changes in interest rates, exchange rates, commodity prices and equity prices. The Company does not engage in the trading of financial instruments, nor does it have exposure to currency exchange rates. Our market risk exposure is primarily that of interest rate risk, and we have established policies and procedures to monitor and limit our earnings and balance sheet exposure to changes in interest rates. The principal objective of interest rate risk management is to manage the financial components of the Company’s balance sheet in a manner that will optimize the risk/reward equation for earnings and capital under a variety of interest rate scenarios.
To identify areas of potential exposure to interest rate changes, we utilize commercially available modeling software to perform monthly earnings simulations and calculate the Company’s market value of portfolio equity under varying interest rate scenarios. The model imports relevant information for the Company’s financial instruments and incorporates Management’s assumptions on pricing, duration, and optionality for anticipated new volumes. Various rate scenarios consisting of key rate and yield curve projections are then applied in order to calculate the expected effect of a given interest rate change on interest income, interest expense, and the value of the Company’s financial instruments. The rate projections can be shocked (an immediate and parallel change in all base rates, up or down), ramped (an incremental increase or decrease in rates over a specified time period), economic (based on current trends and econometric models) or stable (unchanged from current actual levels).
In addition to a stable rate scenario, which presumes that there are no changes in interest rates, we typically use at least six other interest rate scenarios in conducting our rolling 12-month net interest income simulations: upward shocks of 100, 200, 300, and 400 basis points, and downward shocks of 100, 200, and 300 basis points. Those scenarios may be supplemented, reduced in number, or otherwise adjusted as determined by Management to provide the most meaningful simulations in light of economic conditions and expectations at the time. Given the current near zero interest rate environment it is unlikely that rates could decline much further beyond the downward shock of 100 basis points, therefore the downward shock scenarios of 200 and 300 basis points are temporarily being suspended after concurrence by the Company’s Board of Directors. We currently utilize an additional upward rate shock scenario of 400 basis points. Pursuant to policy guidelines, we generally attempt to limit the projected decline in net interest income relative to the stable rate scenario to no more than 5% for a 100 basis point (bp) interest rate shock, 10% for a 200 bp shock, 15% for a 300 bp shock, and 20% for a 400 bp shock. The Company had the following estimated net interest income sensitivity profiles over one-year, without factoring in any potential negative impact on spreads resulting from competitive pressures or credit quality deterioration:
December 31, 2020 | December 31, 2019 | |||||||||||
Immediate change in Interest Rates (basis points) | % Change in Net Interest Income | $ Change in Net Interest Income | % Change in Net Interest Income | $ Change in Net Interest Income | ||||||||
+400 | (1.56)% | $ | (1,746) | 3.11% | $ | 3,193 | ||||||
+300 | (0.77)% | $ | (861) | 2.68% | $ | 2,753 | ||||||
+200 | 0.03% | $ | 38 | 1.80% | $ | 1,844 | ||||||
+100 | 0.51% | $ | 567 | 1.06% | $ | 1,085 | ||||||
Base | ||||||||||||
-100 | (7.67)% | $ | (8,583) | (4.39)% | $ | (4,505) | ||||||
Our current simulations indicate that the Company’s net interest income will remain relatively flat over the next 12 months in the up 100 and 200 basis point scenarios but declines after that in a rising rate environment, indicating that the Company is liability sensitive; furthermore, a drop in interest rates could have a substantial negative impact on earnings. For the prior year ending December 31, 2019 the simulations projected sizeable increases in net interest income in rising rate scenarios, but balance sheet changes in 2020 such as the addition of fixed-rate loans and long-term adjustable-rate loans with longer reset periods, compounded by the Company’s increase in its current overnight borrowing position have significantly diminished that effect. If there were an immediate and sustained upward adjustment of 100 basis points in interest rates, all else being equal, net interest income over the next 12 months is projected to improve by only $0.6 million, or 0.51%, relative to a stable interest rate scenario, with the favorable variance diminishing as interest rates rise higher. If interest rates were to decline by 100 basis points, however, net interest income would likely be around $8.6 million lower than in a stable interest rate scenario, for a negative variance of 7.7%.
64
In addition to the net interest income simulations shown above, we run stress scenarios for the unconsolidated Bank modeling the possibility of no balance sheet growth, the potential runoff of “surge” core deposits which flowed into the Bank in the most recent economic cycle, and unfavorable movement in deposit rates relative to yields on earning assets (i.e., higher deposit betas). When no balance sheet growth is incorporated and a stable interest rate environment is assumed, projected annual net interest income is about $3.4 million lower than in our standard simulation. However, the stressed simulations reveal that the Company’s greatest potential pressure on net interest income would result from excessive non-maturity deposit runoff and/or unfavorable deposit rate changes in rising rate scenarios.
The economic value (or “fair value”) of financial instruments on the Company’s balance sheet will also vary under the interest rate scenarios previously discussed. The difference between the projected fair value of the Company’s financial assets and the fair value of its financial liabilities is referred to as the economic value of equity (“EVE”), and changes in EVE under different interest rate scenarios are effectively a gauge of the Company’s longer-term exposure to interest rate fluctuations. Fair values for financial instruments are estimated by discounting projected cash flows (principal and interest) at anticipated replacement interest rates for each account type, while the fair value of non-financial accounts is assumed to equal their book value for all rate scenarios. An economic value simulation is a static measure utilizing balance sheet accounts at a given point in time, and the measurement can change substantially over time as the Company’s balance sheet evolves and interest rate and yield curve assumptions are updated.
The change in economic value under different interest rate scenarios depends on the characteristics of each class of financial instrument, including stated interest rates or spreads relative to current or projected market-level interest rates or spreads, the likelihood of principal prepayments, whether contractual interest rates are fixed or floating, and the average remaining time to maturity. As a general rule, fixed-rate financial assets become more valuable in declining rate scenarios and less valuable in rising rate scenarios, while fixed-rate financial liabilities gain in value as interest rates rise and lose value as interest rates decline. The longer the duration of the financial instrument, the greater the impact a rate change will have on its value. In our economic value simulations, estimated prepayments are factored in for financial instruments with stated maturity dates, and decay rates for non-maturity deposits are projected based on historical patterns and Management’s best estimates. The table below shows estimated changes in the Company’s EVE as of December 31, 2020, and 2019, under different interest rate scenarios relative to a base case of current interest rates:
December 31, 2020 | December 31, 2019 | |||||||||||
Immediate change in Interest Rates (basis points) | % Change in Fair Value of Equity | $ Change in Fair Value of Equity | % Change in Fair Value of Equity | $ Change in Fair Value of Equity | ||||||||
+400 | 32.19% | $ | 163,713 | 19.38% | $ | 106,925 | ||||||
+300 | 28.81% | $ | 146,533 | 17.47% | $ | 96,382 | ||||||
+200 | 23.69% | $ | 120,513 | 14.19% | $ | 78,265 | ||||||
+100 | 14.60% | $ | 74,251 | 8.74% | $ | 48,325 | ||||||
Base | ||||||||||||
-100 | (7.26)% | $ | (36,919) | (16.61)% | $ | (91,610) | ||||||
The table shows that our EVE will generally deteriorate in declining rate scenarios but should benefit from a parallel shift upward in the yield curve. The increase in value of the Company’s large volume of stable DDA balances is expected to outweigh the decrease in value of the fixed rate assets, causing the overall net increase in EVE in the up-shock scenarios. Our EVE deltas have increased given the relative starting points of our non-maturity deposits in the current rate environment. In other words, as the current rates are very low, the value of the non-maturity deposits is lower than it has been historically. The impact of an increase in rates has an expected greater magnitude impact on the value of such deposits.
We also run stress scenarios for the unconsolidated Bank’s EVE to simulate the possibility of slower loan prepayment speeds in the up-shock scenarios and faster prepayment speeds in the down-shock scenarios, as well as, unfavorable changes in deposit rates, and higher deposit decay rates. Model results are highly sensitive to changes in assumed decay rates for non-maturity deposits, in particular, with material unfavorable variances occurring relative to the standard simulations shown above as decay rates are increased. Furthermore, while not as extreme as the variances produced by increasing non-maturity deposit decay rates, EVE also displays a relatively high level of sensitivity to unfavorable changes in deposit rate betas in rising interest rate scenarios.
65
ITEM 7A. QUANTITATIVE AND QUALITATIVE DISCLOSURES ABOUT MARKET RISK
The information concerning quantitative and qualitative disclosures of market risk called for by Item 305 of Regulation S-K is included as part of Item 7 above. See “Management’s Discussion and Analysis of Financial Condition and Results of Operations – Liquidity and Market Risk Management”.
66
ITEM 8. FINANCIAL STATEMENTS AND SUPPLEMENTARY DATA
The following financial statements and independent auditors’ reports listed below are included herein:
67
Report of Independent Registered Public Accounting Firm
To the Board of Directors and Shareholders
Sierra Bancorp and Subsidiary
Porterville, California
Opinion on the Financial Statements and Internal Control Over Financial Reporting
We have audited the accompanying consolidated balance sheets of Sierra Bancorp and Subsidiary (the Company) as of December 31, 2020 and 2019, and the related consolidated statements of income, comprehensive income, changes in shareholders’ equity, and cash flows for each of the years in the two year period ended December 31, 2020, and the related notes (collectively referred to as the “consolidated financial statements”).
We also have audited the Company’s internal control over financial reporting as of December 31, 2020, based on criteria established in Internal Control —Integrated Framework: (2013) issued by the Committee of Sponsoring Organizations of the Treadway Commission (COSO).
In our opinion, the consolidated financial statements present fairly, in all material respects, the financial position of the Company as of December 31, 2020 and 2019, and the results of its operations and its cash flows for each of the years in the two year period ended December 31, 2020, in conformity with accounting principles generally accepted in the United States of America. Also in our opinion, the Company maintained, in all material respects, effective internal control over financial reporting as of December 31, 2020, based on criteria established in Internal Control—Integrated Framework: (2013) issued by COSO.
Basis for Opinion
The Company’s management is responsible for these consolidated financial statements, for maintaining effective internal control over financial reporting, and for its assessment of the effectiveness of internal control over financial reporting, included in the accompanying Management’s Annual Report on Internal Control over Financial Reporting. Our responsibility is to express an opinion on the Company’s consolidated financial statements and an opinion on the Company’s internal control over financial reporting based on our audits. We are a public accounting firm registered with the Public Company Accounting Oversight Board (United States) (“PCAOB”) and are required to be independent with respect to the Company in accordance with the U.S. federal securities laws and the applicable rules and regulations of the Securities and Exchange Commission and the PCAOB.
We conducted our audits in accordance with the standards of the PCAOB. Those standards require that we plan and perform the audits to obtain reasonable assurance about whether the consolidated financial statements are free of material misstatement, whether due to error or fraud, and whether effective internal control over financial reporting was maintained in all material respects.
Our audits of the financial statements included performing procedures to assess the risks of material misstatement of the financial statements, whether due to error or fraud, and performing procedures that respond to those risks. Such procedures included examining, on a test basis, evidence regarding the amounts and disclosures in the consolidated financial statements. Our audits also included evaluating the accounting principles used and significant estimates made by management, as well as evaluating the overall presentation of the consolidated financial statements. Our audit of internal control over financial reporting included obtaining an understanding of internal control over financial reporting, assessing the risk that a material weakness exists, and testing and evaluating the design and operating effectiveness of internal control based on the assessed risk. Our audits also included performing such other procedures as we considered necessary in the circumstances. We believe that our audits provide a reasonable basis for our opinions.
Definition and Limitations of Internal Control Over Financial Reporting
A company’s internal control over financial reporting is a process designed to provide reasonable assurance regarding the reliability of financial reporting and the preparation of consolidated financial statements for external purposes in accordance with accounting principles generally accepted in the United States of America. A company’s internal control over financial reporting includes those policies and procedures that (1) pertain to the maintenance of records that, in
68
reasonable detail, accurately and fairly reflect the transactions and dispositions of the assets of the company; (2) provide reasonable assurance that transactions are recorded as necessary to permit preparation of financial statements in accordance with generally accepted accounting principles, and that receipts and expenditures of the company are being made only in accordance with authorizations of management and directors of the company; and (3) provide reasonable assurance regarding prevention or timely detection of unauthorized acquisition, use, or disposition of the company’s assets that could have a material effect on the consolidated financial statements.
Because of its inherent limitations, internal control over financial reporting may not prevent or detect misstatements. Also, projections of any evaluation of effectiveness to future periods are subject to the risk that controls may become inadequate because of changes in conditions, or that the degree of compliance with the policies or procedures may deteriorate.
Critical Audit Matter
The critical audit matter communicated below is a matter arising from the current period audit of the financial statements that was communicated or required to be communicated to the audit committee and that: (1) relates to accounts or disclosures that are material to the financial statements and (2) involved especially challenging, subjective, or complex judgments. The communication of critical audit matters does not alter in any way our opinion on the financial statements, taken as a whole, and we are not, by communicating the critical audit matter below, providing separate opinions on the critical audit matter or on the accounts or disclosures to which it relates.
Allowance for Loan and Lease Losses
As discussed in Note 4 to the Company’s consolidated financial statements, the Company has a gross loan and lease portfolio of $2.4 billion and related allowance for loan and lease losses of $17.7 million as of December 31, 2020. The Company’s allowance for loan and lease losses is a material and complex estimate requiring significant management’s judgment in the evaluation of the credit quality and the estimation of inherent losses within the loan and lease portfolio. The allowance for loan and lease losses includes a general reserve which is determined based on the results of a quantitative and a qualitative analysis of all loans not measured for impairment at the reporting date.
The Company’s general reserves cover non-impaired loans and are based on historical net loss rates for each portfolio segment by call report code, adjusted for the effects of qualitative or environmental factors that are likely to cause estimated credit losses as of the evaluation date to differ from the portfolio segment’s historical loss experience. Qualitative factors include consideration of the following: changes in lending policies and procedures; changes in international, national, regional, and local economic and business conditions and developments; changes in the nature and volume of the portfolio; changes in the experience, ability and depth of lending management and staff; changes in the volume and severity of past due, nonaccrual and other adversely graded loans; changes in quality of the loan review system; changes in the value of the underlying collateral for collateral-dependent loans; concentrations of credit; and the effect of the other external factors such as competition and legal and regulatory requirements...
Auditing these complex judgments and assumptions involves especially challenging auditor judgment due to the nature and extent of audit evidence and effort required to address these matters, including the extent of specialized skill or knowledge needed.
The primary procedures we performed to address this critical audit matter included:
| ● | Testing the design and operating effectiveness of controls relating to management’s timely identification of problem loans, appropriate application of loan rating policy, consistency of application of accounting policies and appropriateness of assumptions used in the allowance for loan and lease losses calculation. |
| ● | Evaluating the reasonableness of assumptions and sources of data used by management in forming the loss factors by performing retrospective review of historic loan and lease loss experience and analyzing historical data used in developing the assumptions. |
| ● | Evaluating the appropriateness of inputs and factors that the Company used in forming the qualitative loss factors and assessing whether such inputs and factors were relevant, reliable, and reasonable for the purpose used. |
| ● | Testing the mathematical accuracy and computation of the allowance for loan and lease losses. |
| ● | Evaluating the period to period consistency with which qualitative loss factors are determined and applied. |
69
/s/ Eide Bailly LLP
We have served as the Company’s auditor since 2019.
San Ramon, California
March 12, 2021
70
Report of Independent Registered Public Accounting Firm
To the Board of Directors and Shareholders
Sierra Bancorp and Subsidiary
Porterville, California
Opinion on the Financial Statements
We have audited the accompanying consolidated statements of income and comprehensive income, changes in shareholders’ equity, and cash flows, for the year ended December 31, 2018, and the related notes (collectively referred to as the “financial statements”). In our opinion, the financial statements present fairly, in all material respects, the results of its operations and its cash flows for the year ended December 31, 2018, in conformity with accounting principles generally accepted in the United States of America.
Basis for Opinion
These financial statements are the responsibility of the entity’s management. Our responsibility is to express an opinion on these financial statements based on our audits. We are a public accounting firm registered with the Public Company Accounting Oversight Board (United States) ("PCAOB") and are required to be independent with respect to Sierra Bancorp in accordance with the U.S. federal securities laws and the applicable rules and regulations of the Securities and Exchange Commission and the PCAOB.
We conducted our audits in accordance with the standards of the PCAOB. Those standards require that we plan and perform the audit to obtain reasonable assurance about whether the financial statements are free of material misstatement, whether due to error or fraud. Our audits included performing procedures to assess the risk of material misstatement of the financial statements, whether due to error or fraud, and performing procedures that respond to those risks. Such procedures included examining, on a test basis, evidence regarding the amounts and disclosures in the financial statements. Our audits also included evaluating the accounting principles used and significant estimates made by management, as well as evaluating the overall presentation of the financial statements. We believe that our audits provide a reasonable basis for our opinion.
/s/ Vavrinek, Trine, Day & Co., LLP
We have served as the Company's auditor since 2004.
Rancho Cucamonga, California
March 14, 2019
71
SIERRA BANCORP AND SUBSIDIARY
CONSOLIDATED BALANCE SHEETS
December 31, 2020 and 2019
(dollars in thousands)
| 2020 |
| 2019 | |||
ASSETS | ||||||
Cash and due from banks | $ | | $ | | ||
Interest bearing deposits in banks | | | ||||
Cash and cash equivalents | | | ||||
Securities available-for-sale | | | ||||
Loans and leases: | ||||||
Gross loans and leases | | | ||||
Allowance for loan and lease losses | ( | ( | ||||
Deferred loan and lease (fees) costs, net | ( | | ||||
Net loans and leases | | | ||||
Foreclosed assets | | | ||||
Premises and equipment, net | | | ||||
Goodwill | | | ||||
Other intangible assets, net | | | ||||
Company owned life insurance | | | ||||
Other assets | | | ||||
$ | | $ | | |||
LIABILITIES AND SHAREHOLDERS' EQUITY | ||||||
Deposits: | ||||||
Noninterest bearing | $ | | $ | | ||
Interest bearing | | | ||||
Total deposits | | | ||||
Repurchase agreements | | | ||||
Short-term borrowings | | | ||||
Subordinated debentures, net | | | ||||
Other liabilities | | | ||||
Total liabilities | | | ||||
Commitments and contingent liabilities (Notes 6 & 13) | ||||||
Shareholders' equity | ||||||
Serial Preferred stock, | | | ||||
Additional paid-in capital | | | ||||
Retained earnings | |
| | |||
Accumulated other comprehensive gain, net of taxes of $( | | | ||||
Total shareholders' equity | | | ||||
$ | | $ | | |||
The accompanying notes are an integral part of these consolidated financial statements.
72
SIERRA BANCORP AND SUBSIDIARY
CONSOLIDATED STATEMENTS OF INCOME
Years Ended December 31, 2020, 2019 and 2018
(dollars in thousands, except per share data)
| 2020 |
| 2019 |
| 2018 | ||||
Interest and dividend income | |||||||||
Loans and leases, including fees | $ | | $ | | $ | | |||
Taxable securities | | | | ||||||
Tax-exempt securities | | | | ||||||
Federal funds sold and other | | | | ||||||
Total interest income | | | | ||||||
Interest expense | |||||||||
Deposits | | | | ||||||
Short-term borrowings | | | | ||||||
Subordinated debentures | | | | ||||||
Total interest expense | | | | ||||||
Net interest income | | | | ||||||
Provision for loan and lease losses | | | | ||||||
Net interest income after provision for loan and lease losses | | | | ||||||
Noninterest income | |||||||||
Service charges on deposits | | | | ||||||
Checkcard fees | | | | ||||||
Net gains (losses) on sale of securities available-for-sale | | ( | | ||||||
Increase in cash surrender value of life insurance | | | | ||||||
Other income | | | | ||||||
Total noninterest income | | | | ||||||
Noninterest expense | |||||||||
Salaries and employee benefits | | | | ||||||
Occupancy and equipment | | | | ||||||
Acquisition costs | — | | | ||||||
Other | | | | ||||||
Total noninterest expense | | | | ||||||
Income before income taxes | | | | ||||||
Provision for income taxes | | | | ||||||
Net income | $ | | $ | | $ | | |||
Earnings per share | |||||||||
Basic | $ | | $ | | $ | | |||
Diluted | $ | | $ | | $ | | |||
Weighted average shares outstanding, basic | | | | ||||||
Weighted average shares outstanding, diluted | | | | ||||||
The accompanying notes are an integral part of these consolidated financial statements.
73
SIERRA BANCORP AND SUBSIDIARY
CONSOLIDATED STATEMENTS OF COMPREHENSIVE INCOME
Years Ended December 31, 2020, 2019 and 2018
(dollars in thousands, except footnotes)
| 2020 |
| 2019 |
| 2018 | ||||
Net income | $ | | $ | | $ | | |||
Other comprehensive income, before tax | |||||||||
Unrealized gain (loss) on securities: | |||||||||
Unrealized holding gain (loss) arising during period | | | ( | ||||||
Reclassification adjustment for (gains) losses included in net income (1) | ( | | ( | ||||||
Other comprehensive gain (loss), before tax | | | ( | ||||||
Income tax (expense) benefit related to items of other comprehensive income | ( | ( | | ||||||
Total other comprehensive gain (loss), net of tax | | | ( | ||||||
Comprehensive income | | | | ||||||
| (1) | Amounts are included in net (gains) losses on securities available-for-sale on the Consolidated Statements of Income in noninterest income. Income tax (expense) benefit associated with the reclassification adjustment for the years ended 2020, 2019 and 2018 was $( |
The accompanying notes are an integral part of these consolidated financial statements.
74
SIERRA BANCORP AND SUBSIDIARY
CONSOLIDATED STATEMENT OF CHANGES IN SHAREHOLDERS’ EQUITY
For the Three Years Ended December 31, 2020
(dollars in thousands, except per share data)
Common Stock | |||||||||||||||||
Accumulated | |||||||||||||||||
Additional | Other | ||||||||||||||||
Paid In | Retained | Comprehensive | Shareholders' | ||||||||||||||
| Shares |
| Amount |
| Capital |
| Earnings |
| Gain (Loss) |
| Equity | ||||||
Balance, January 1, 2018 | | $ | | $ | | $ | | $ | ( | $ | | ||||||
Net Income | | | |||||||||||||||
Other comprehensive loss, net of tax | ( | ( | |||||||||||||||
Exercise of stock options | | | ( | | |||||||||||||
Stock based compensation expense | | | |||||||||||||||
Stock issued-acquisition | — | — | ( | ( | |||||||||||||
Cash dividends - $ | ( | ( | |||||||||||||||
Balance, December 31, 2018 | | | | | ( | | |||||||||||
Net Income | | | |||||||||||||||
Other comprehensive gain, net of tax | | | |||||||||||||||
Exercise of stock options | | | ( | | |||||||||||||
Stock based compensation expense | | | |||||||||||||||
Stock repurchase | ( | ( | ( | ( | |||||||||||||
Cash dividends - $ | ( | ( | |||||||||||||||
Balance, December 31, 2019 | | | | | | | |||||||||||
Net Income | | | |||||||||||||||
Other comprehensive gain, net of tax | | | |||||||||||||||
Exercise of stock options | | | ( | | |||||||||||||
Stock based compensation expense | | | | ||||||||||||||
Stock repurchase | ( | ( | ( | ( | |||||||||||||
Cash dividends - $ | ( | ( | |||||||||||||||
Balance, December 31, 2020 | | $ | | $ | | $ | | $ | | $ | | ||||||
The accompanying notes are an integral part of these consolidated financial statements.
75
SIERRA BANCORP AND SUBSIDIARY
CONSOLIDATED STATEMENTS OF CASH FLOWS
Years Ended December 31, 2020, 2019, and 2018
(dollars in thousands)
| 2020 |
| 2019 |
| 2018 | ||||
Cash flows from operating activities: | |||||||||
Net income | $ | | $ | | $ | | |||
Adjustments to reconcile net income to net cash provided by operating activities: | |||||||||
(Gain) loss on sales of securities | ( | | ( | ||||||
Loss on disposal of fixed assets | — | | | ||||||
Gain on sale of foreclosed assets | ( | ( | ( | ||||||
Writedown of foreclosed assets | | | | ||||||
Stock based compensation expense | | | | ||||||
Provision for loan and lease losses | | | | ||||||
Depreciation and amortization | | | | ||||||
Net amortization on securities premiums and discounts | | | | ||||||
Accretion of discounts for loans acquired and net deferred loan fees | ( | ( | ( | ||||||
Increase in cash surrender value of life insurance policies | ( | ( | ( | ||||||
Amortization of core deposit intangible | | | | ||||||
Increase in interest receivable and other assets | ( | ( | ( | ||||||
(Decrease) increase in other liabilities | ( | | ( | ||||||
Deferred income tax benefit | ( | ( | ( | ||||||
Increase in equity securities | ( | ( | ( | ||||||
Net amortization of partnership investment | | | | ||||||
Net cash provided by operating activities | | | | ||||||
Cash flows from investing activities: | |||||||||
Maturities and calls of securities available for sale | | | | ||||||
Proceeds from sales of securities available for sale | | | | ||||||
Purchases of securities available for sale | ( | ( | ( | ||||||
Principal paydowns on securities available for sale | | | | ||||||
Net purchases of FHLB stock | — | ( | ( | ||||||
Loan originations and payments, net | ( | ( | ( | ||||||
Purchases of premises and equipment, net | ( | ( | ( | ||||||
Proceeds from sales of fixed assets | — | | — | ||||||
Proceeds from sales of foreclosed assets | | | | ||||||
Purchase of bank owned life insurance | ( | ( | ( | ||||||
Liquidation of bank-owned life insurance | | | — | ||||||
Proceeds from BOLI death benefit | | — | — | ||||||
Net cash from bank acquisition | — | — | ( | ||||||
Net cash used in investing activities | ( | ( | ( | ||||||
Cash flows from financing activities: | |||||||||
Increase in deposits | | | | ||||||
Increase (decrease) in borrowed funds | | ( | | ||||||
Increase in repurchase agreements | | | | ||||||
Increase in fed funds purchased | | — | — | ||||||
Cash dividends paid | ( | ( | ( | ||||||
Repurchases of common stock | ( | ( | — | ||||||
Stock options exercised | | | | ||||||
Net cash provided by financing activities | | | | ||||||
(Decrease) increase in cash and due from banks | ( | | | ||||||
Cash and cash equivalents, beginning of year | | | | ||||||
Cash and cash equivalents, end of year | $ | | $ | | $ | | |||
76
SIERRA BANCORP AND SUBSIDIARY
CONSOLIDATED STATEMENTS OF CASH FLOWS
(Continued)
Years Ended December 31, 2020, 2019 and 2018
(dollars in thousands)
2020 |
| 2019 |
| 2018 | |||||
Supplemental disclosure of cash flow information: | |||||||||
Cash paid during the year for: | |||||||||
Interest | $ | | $ | | $ | | |||
Income taxes | $ | | $ | | $ | | |||
Supplemental noncash disclosures: | |||||||||
Real estate acquired through foreclosure | $ | | $ | | $ | | |||
Change in unrealized net gains (losses) on securities available-for-sale | $ | | $ | | $ | ( | |||
Operating right-of-use asset pursuant to adoption of ASU 2016-02 | $ | — | $ | | $ | — | |||
Operating lease liability pursuant to adoption of ASU 2016-02 | $ | — | $ | | $ | — | |||
The accompanying notes are an integral part of these consolidated financial statements.
77
1. THE BUSINESS OF SIERRA BANCORP
Sierra Bancorp (the “Company”) is a California corporation registered as a bank holding company under the Bank Holding Company Act of 1956, as amended, and is headquartered in Porterville, California. The Company was incorporated in November 2000 and acquired all of the outstanding shares of Bank of the Sierra (the “Bank”) in August 2001. The Company’s principal subsidiary is the Bank, and the Company exists primarily for the purpose of holding the stock of the Bank and of such other subsidiaries it may acquire or establish. The Company’s only other direct subsidiaries are Sierra Statutory Trust II, Sierra Capital Trust III and Coast Bancorp Statutory Trust II, which were formed solely to facilitate the issuance of capital trust pass-through securities.
At December 31, 2020, the Bank operated
2. SUMMARY OF SIGNIFICANT ACCOUNTING POLICIES
Consolidation and Basis of Presentation
The consolidated financial statements include the accounts of the Company and the consolidated accounts of its wholly-owned subsidiary, Bank of the Sierra. All significant intercompany balances and transactions have been eliminated. Certain reclassifications have been made to prior years’ balances to conform to classifications used in 2020. The accounting and reporting policies of the Company conform to accounting principles generally accepted in the United States of America (U.S. GAAP) and prevailing practices within the banking industry.
In accordance with U.S. GAAP, the Company’s investments in Sierra Statutory Trust II, Sierra Capital Trust III and Coast Bancorp Statutory Trust II are not consolidated and are accounted for under the equity method and included in other assets on the consolidated balance sheet. The subordinated debentures issued and guaranteed by the Company and held by the trusts are reflected on the Company’s consolidated balance sheet.
Use of Estimates
The preparation of consolidated financial statements in conformity with U.S. GAAP requires management to make estimates and assumptions based on available information. These estimates and assumptions affect the amounts reported in the financial statements and the disclosures provided, and actual results could differ.
Material estimates that are particularly susceptible to significant changes in the near-term relate to the determination of the allowance for loan and lease losses and the valuation of real estate acquired in connection with foreclosures or in satisfaction of loans. In connection with the determination of the allowances for loan and lease losses and other real estate, management obtains independent appraisals for significant properties, evaluates the overall loan portfolio characteristics and delinquencies and monitors economic conditions.
Cash Flows
For purposes of reporting cash flows, cash and cash equivalents include cash and deposits with other financial institutions with original maturities within 90 days, and federal funds sold. Net cash flows are reported for customer
78
loan and deposit transactions, interest bearing deposits in other financial institutions, and fed funds purchased and repurchase agreements.
Securities
Debt securities may be classified as held to maturity and carried at amortized cost when management has the positive ability and intent to hold them to maturity. Debt securities are classified as available for sale when they might be sold before maturity. Equity securities with readily determinable fair values are classified as available for sale. Debt securities available for sale are carried at fair value with unrealized holding gains and losses reported in other comprehensive income, net of tax.
Interest income includes amortization of purchase premium or discount. Premiums or discounts on securities are amortized on the level-yield method without anticipating prepayments. Gains and losses on sales are recorded on the trade date and determined using the specific identification method.
Management determines the appropriate classification of its investments at the time of purchase and may only change the classification in certain limited circumstances. All transfers between categories are accounted for at fair value. Although the Company currently has the intent and the ability to hold the securities in its investment portfolio to maturity, the securities are all marketable and are currently classified as “available for sale” to allow maximum flexibility with regard to interest rate risk and liquidity management.
Management evaluates securities for other-than-temporary impairment (“OTTI”) on at least a quarterly basis, and more frequently when economic or market conditions warrant such an evaluation. For securities in an unrealized loss position, management considers the extent and duration of the unrealized loss and the financial condition and near-term prospects of the issuer. Management also assesses whether it intends to sell, or it is more likely than not that it will be required to sell, a security in an unrealized loss position before recovery of its amortized cost basis. If either of the criteria regarding intent or requirement to sell is met, the entire difference between amortized cost and fair value is recognized as impairment through earnings. For debt securities that do not meet the aforementioned criteria, the amount of the impairment is split into two components as follows: 1) OTTI related to credit loss, which must be recognized in the income statement and 2) OTTI related to other factors, which is recognized in other comprehensive income. The credit loss is defined as the difference between the present value of the cash flows expected to be collected and the amortized cost basis.
FHLB Stock and Other Investments
The Bank is a member of the Federal Home Loan Bank ("FHLB") system. Members are required to own a certain amount of stock based on the level of borrowings and other factors, and may invest in additional amounts. FHLB stock is carried at cost in other assets, and periodically evaluated for impairment based on the ultimate recovery of par value. Both cash and stock dividends are reported as income. The Bank’s investment in FHLB stock was approximately $
Pursuant to the adoption of ASU
79
2020 on PCBB stock. Adjustments to the carrying value of PCBB stock were based on observable activity in the stock.
Loans Held for Sale
The Company may originate loans intended to be sold on the secondary market. Loans originated and intended for sale in the secondary market are carried at cost which approximates fair value since these loans are typically sold shortly after origination. The loan’s cost basis includes unearned deferred fees and costs, and premiums and discounts. If loans held for sale remain on our books for an extended period of time the fair value of those loans is determined using quoted secondary market prices. Net unrealized losses, if any, are recorded as a valuation allowance and charged to earnings.
Loans that might be held for sale by the Company typically consist of residential real estate loans. Loans classified as held for sale, if any, are disclosed in Note 4 to the consolidated financial statements.
Gains and losses on sales of loans are recognized at the time of sale and are calculated based on the difference between the selling price and the allocated book value of loans sold. Book value allocations are determined in accordance with U.S. GAAP. Any inherent risk of loss on loans sold is transferred to the buyer at the date of sale.
The Company has issued various representations and warranties associated with the sale of loans. These representations and warranties may require the Company to repurchase loans with underwriting deficiencies as defined per the applicable sales agreements and certain past due loans within 90 days of the sale. The Company did not experience losses during the years ended December 31, 2020, 2019, or 2018 regarding these representations and warranties.
Loans and Leases (Financing Receivables)
Our credit quality classifications of Loans and Leases include Pass, Special Mention, Substandard and Impaired. These classifications are defined in Note 4 to the consolidated financial statements.
Loans and leases that management has the intent and ability to hold for the foreseeable future or until maturity or payoff are reported at the principal balance outstanding, net of deferred loan fees and costs, purchase premiums and discounts, write-downs, and an allowance for loan and lease losses. Loan and lease origination fees, net of certain deferred origination costs, and purchase premiums and discounts are recognized in interest income as an adjustment to yield of the related loans and leases over the contractual life of the loan using both the effective interest and straight line methods without anticipating prepayments.
Interest income for all performing loans, regardless of classification (Pass, Special Mention, Substandard and Impaired), is recognized on an accrual basis, with interest accrued daily. Costs associated with successful loan originations are netted from loan origination fees, with the net amount (net deferred loan fees) amortized over the contractual life of the loan in interest income. If a loan has scheduled periodic payments, the amortization of the net deferred loan fee is calculated using the effective interest method over the contractual life of the loan. If the loan does not have scheduled payments, such as a line of credit, the net deferred loan fee is recognized as interest income on a straight line basis over the contractual life of the loan. Fees received for loan commitments are recognized as interest income over the term of the commitment. When loans are repaid, any remaining unamortized balances of deferred fees and costs are accounted for through interest income.
Generally, the Company places a loan or lease on nonaccrual status and ceases recognizing interest income when it has become delinquent more than 90 days and/or when Management determines that the repayment of principal and
80
collection of interest is unlikely. The Company may decide that it is appropriate to continue to accrue interest on certain loans more than 90 days delinquent if they are well-secured by collateral and collection is in process. When a loan is placed on nonaccrual status, any accrued but uncollected interest for the loan is reversed out of interest income in the period in which the loan’s status changed. For loans with an interest reserve, i.e., where loan proceeds are advanced to the borrower to make interest payments, all interest recognized from the inception of the loan is reversed when the loan is placed on non-accrual. Once a loan is on non-accrual status subsequent payments received from the customer are applied to principal, and no further interest income is recognized until the principal has been paid in full or until circumstances have changed such that payments are again consistently received as contractually required. Generally, loans and leases are not restored to accrual status until the obligation is brought current and has performed in accordance with the contractual terms for a reasonable period of time, and the ultimate collectability of the total contractual principal and interest is no longer in doubt.
Impaired loans are classified as either nonaccrual or accrual, depending on individual circumstances regarding the collectability of interest and principal according to the contractual terms.
Purchased Credit Impaired Loans
The Company purchases individual loans and groups of loans, some of which may show evidence of credit deterioration since origination. These purchased credit impaired (“PCI”) loans are recorded at the amount paid, since there is
Such PCI loans are accounted for individually or aggregated into pools of loans based on common risk characteristics. The Company estimates the amount and timing of expected cash flows for the loan or pool, and the expected cash flows in excess of amount paid is recorded as interest income over the remaining life of the loan or pool (accretable yield). The excess of the loan’s or pool’s contractual principal and interest over expected cash flows is not recorded (nonaccretable difference).
Over the life of the loan or pool, expected cash flows continue to be estimated. If the present value of expected cash flows is less than the carrying amount, a loss is recorded as a provision for loan and lease losses. If the present value of expected cash flows is greater than the carrying amount, it is recognized as part of future interest income
Loans Modified in a Troubled Debt Restructuring
Loans are considered to have been modified in a troubled debt restructuring (“TDR”) when due to a borrower’s financial difficulties the Company makes certain concessions to the borrower that it would not otherwise consider. Modifications may include interest rate reductions, principal or interest forgiveness, forbearance, and other actions intended to minimize economic loss and to avoid foreclosure or repossession of collateral. Generally, a non-accrual loan that has been modified in a TDR remains on non-accrual status for a period of six months to demonstrate that the borrower is able to meet the terms of the modified loan. However, performance prior to the modification, or significant events that coincide with the modification, are included in assessing whether the borrower can meet the new terms and may result in the loan being returned to accrual status at the time of loan modification or after a shorter performance period. If the borrower’s ability to meet the revised payment schedule is uncertain, the loan remains on non-accrual status.
A TDR is generally considered to be in default when it appears likely that the customer will not be able to repay all principal and interest pursuant to the terms of the restructured agreement.
81
Allowance for Loan and Lease Losses
The allowance for loan and lease losses is maintained at a level which, in management’s judgment, is adequate to absorb loan and lease losses inherent in the loan and lease portfolio. The allowance for loan and lease losses is increased by a provision for loan and lease losses, which is charged to expense, and by principal recovered on charged-off balances. It is reduced by principal charge-offs. The amount of the allowance is based on management’s evaluation of the collectability of the loan and lease portfolio, changes in its risk profile, credit concentrations, historical trends, and economic conditions. This evaluation also considers the balance of impaired loans and leases. A loan or lease is impaired when it is probable that the Company will be unable to collect all contractual principal and interest payments due in accordance with the terms of the loan or lease agreement. The impairment on certain individually identified loans or leases is measured based on the present value of expected future cash flows discounted at the original effective interest rate of the loan or lease. As a practical expedient, impairment may be measured based on the loan’s or lease’s observable market price or the fair value of collateral if the loan or lease is collateral dependent. The amount of impairment, if any, is recorded through the provision for loan and lease losses and is added to the allowance for loan and lease losses, with any changes over time recognized as additional bad debt expense in our provision for loan and lease losses. Impaired loans with homogenous characteristics, such as one-to-four family residential mortgages and consumer installment loans, may be subjected to a collective evaluation for impairment, considering delinquency and repossession statistics, historical loss experience, and other factors.
General reserves cover non-impaired loans and are based on historical net loss rates for each portfolio segment by call report code, adjusted for the effects of qualitative or environmental factors that are likely to cause estimated credit losses as of the evaluation date to differ from the portfolio segment’s historical loss experience. Qualitative factors include consideration of the following: changes in lending policies and procedures; changes in international, national, regional, and local economic and business conditions and developments; changes in the nature and volume of the portfolio; changes in the experience, ability and depth of lending management and staff; changes in the volume and severity of past due, nonaccrual and other adversely graded loans; changes in quality of the loan review system; changes in the value of the underlying collateral for collateral-dependent loans; concentrations of credit; and the effect of the other external factors such as competition and legal and regulatory requirements.
Most of the Company’s business activity is with customers located in California within the Southern Central San Joaquin Valley; in the corridor stretching between Santa Paula and Santa Clarita in Southern California, and on the Central Coast. Therefore the Company’s exposure to credit risk is significantly affected by changes in the economy in those regions. The Company considers this concentration of credit risk when assessing and assigning qualitative factors in the allowance for loan and lease losses. Portfolio segments identified by the Company include Agricultural, Commercial and Industrial, Real Estate, Small Business Administration, and Consumer loans. Relevant risk characteristics for these portfolio segments generally include debt service coverage, loan-to-value ratios and financial performance on non-consumer loans; and credit scores, debt-to-income ratios, collateral type and loan-to-value ratios for consumer loans.
Though management believes the allowance for loan and lease losses to be adequate, ultimate losses may vary from their estimates. However, estimates are reviewed periodically, and as adjustments become necessary they are reported in earnings during the periods they become known. In addition, the FDIC and the California Department of Financial Protection and Innovation, as an integral part of their examination processes, review the allowance for loan and lease losses. These agencies may require additions to the allowance for loan and lease losses based on their judgment about information available at the time of their examinations.
82
Reserve for Off-Balance Sheet Commitments
In addition to the exposure to credit loss from outstanding loans, the Company is also exposed to credit loss from certain off-balance sheet commitments such as unused commitments from revolving lines of credit, mortgage warehouse lines of credit, construction loans and commercial and standby letters of credit. Because the available funds have not yet been disbursed on these commitments the estimated losses are not included in the calculation of the ALLL. The reserve for off-balance sheet commitments is an estimated loss contingency which is included in other liabilities on the Consolidated Balance Sheets. The adjustments to the reserve for off-balance sheet commitments are reported within noninterest expense. This reserve is for estimated losses that could occur when the Company is contractually obligated to make a payment under these instruments and must seek repayment from a party that may not be as financially sound in the current period as it was when the commitment was originally made.
Premises and Equipment
Land is carried at cost. Premises and equipment are stated at cost less accumulated depreciation. Depreciation is computed using the straight-line method over the estimated useful lives of the assets. The useful lives of premises range between to
Impairment of long-lived assets is evaluated by management based upon an event or changes in circumstances surrounding the underlying assets which indicate long-lived assets may be impaired.
Foreclosed Assets
Foreclosed assets include real estate and other property acquired in full or partial settlement of loan obligations. Upon acquisition, any excess of the recorded investment in the loan balance over the appraised fair market value, net of estimated selling costs, is charged against the allowance for loan and lease losses. A valuation allowance for losses on foreclosed assets is maintained to provide for subsequent declines in value. The allowance is established through a provision for losses on foreclosed assets which is included in other noninterest expense. Subsequent gains or losses on sales or write-downs resulting from permanent impairments are recorded in other noninterest expense as incurred. Operating costs after acquisition are expensed.
The Company had
Goodwill and Other Intangible Assets
The Company acquired Sierra National Bank in 2000, Santa Clara Valley Bank in 2014, Coast National Bank in 2016, and Ojai Community Bank and the Woodlake Branch of Citizen’s Business Bank in 2017. Goodwill resulting from business combinations after January 1, 2009 is generally determined as the excess of the fair value of the consideration transferred, plus the fair value of any noncontrolling interests in the acquiree, over the fair value of the net assets acquired and liabilities assumed as of the acquisition date.
83
Goodwill and intangible assets acquired in a purchase business combination and determined to have an indefinite useful life are not amortized, but are tested for impairment at least annually or more frequently if events and circumstances exist which indicate that an impairment test should be performed. The Company selected December 31, 2020 as the date to perform the annual impairment test for 2020. Goodwill is the only intangible asset with an indefinite life on our balance sheet. There was
Intangible assets with definite useful lives are amortized over their estimated useful lives to their estimated residual values. The Company’s other intangible assets consist solely of core deposit intangible assets (CDI’s) arising from the acquisitions of Santa Clara Valley Bank, Coast National Bank, a Citizen’s Business Bank Porterville branch deposit portfolio, Ojai Community Bank, the Woodlake Branch of Citizen’s Business Bank and the Lompoc branch of Santa Maria Community Bank. All of the CDI’s are being amortized on a straight-line basis over
Loan Commitments and Related Financial Instruments
Financial instruments include off-balance sheet credit instruments, such as commitments to make loans and commercial letters of credit, issued to meet customer financing needs. The face amount for these items represents the exposure to loss, before considering customer collateral or ability to repay. Such financial instruments are recorded when they are funded. Details regarding these commitments and financial instruments are discussed in detail in Note 13 to the consolidated financial statements.
Income Taxes
The Company files its income taxes on a consolidated basis with its subsidiary. The allocation of income tax expense represents each entity’s proportionate share of the consolidated provision for income taxes.
Income tax expense is the total of the current year income tax due or refundable and the change in deferred tax assets and liabilities. Deferred tax assets and liabilities are the expected future tax amounts for the temporary differences between carrying amounts and tax basis of assets and liabilities, computed using enacted tax rates. A valuation allowance, if needed, reduces deferred tax assets to the amount expected to be realized.
A tax position is recognized as a benefit only if it is “more likely than not” that the tax position would be sustained in a tax examination, with a tax examination being presumed to occur. The amount recognized is the largest amount of tax benefit that is greater than 50% likely to be realized on examination. For tax positions not meeting the “more likely than not” test, no tax benefit is recorded. We have determined that as of December 31, 2020 all tax positions taken to date are highly certain and, accordingly, no accounting adjustment has been made to the financial statements.
The Company recognizes interest and penalties related to uncertain tax positions as part of income tax expense.
Salary Continuation Agreements and Directors’ Retirement Plan
The Company has entered into agreements to provide members of the Board of Directors and certain key executives, or their designated beneficiaries, with annual benefits for up to fifteen years after retirement or death. The Company accrues for these future benefits from the effective date of the plan until the director’s or executive’s expected retirement date in a systematic and rational manner. At the consolidated balance sheet date, the amount of accrued
84
benefits equals the then present value of the benefits expected to be provided to the director or employee, any beneficiaries, and covered dependents in exchange for the director’s or employee’s services to that date.
Comprehensive Income
Comprehensive income consists of net income and other comprehensive income. Other comprehensive income includes fluctuations in unrealized gains and losses on securities available for sale, net of an adjustment for the effects of realized gains and losses and any applicable tax. Comprehensive income is a more inclusive financial reporting methodology that includes disclosure of other comprehensive income that historically has not been recognized in the calculation of net income. Unrealized gains and losses on the Company’s available for sale securities, net of tax, are included in other comprehensive income after adjusting for the effects of realized gains and losses. Total comprehensive income and the components of accumulated other comprehensive income (loss) are presented in the consolidated statements of comprehensive income.
Stock-Based Compensation
At December 31, 2020, the Company had one stock-based compensation plan, the Sierra Bancorp 2017 Stock Incentive Plan (the “2017 Plan”), which was adopted by the Company’s Board of Directors on March 16, 2017 and approved by the Company’s shareholders on May 24, 2017. The 2017 Plan replaced the Company’s 2007 Stock Incentive Plan (the “2007” Plan), which expired by its own terms on March 15, 2017. Options to purchase shares granted under the 2007 Plan that remained outstanding were unaffected by that plan’s termination. The 2017 Plan covers
Compensation cost and director’s expense is recognized for stock options and restricted stock awards issued to employees and directors and is recognized over the required service period, generally defined as the vesting period. The Company is using the Black-Scholes model to estimate the fair value of stock options, while the market price of the Company’s common stock at the date of grant is used for restricted stock awards. The “multiple option” approach for stock options is used to allocate the resulting valuation to actual expense for current period. Expected volatility is based on historical volatility of the Company’s common stock. The Company uses historical data to estimate stock option exercise and post-vesting termination behavior. The expected term of stock options granted is based on historical data and represents the period of time that options granted are expected to be outstanding subsequent to vesting, which takes into account that the options are not transferable. The risk-free interest rate for
85
the expected term of the stock option is based on the U.S. Treasury yield curve in effect at the time of the grant. The fair value of each stock option is estimated on the date of grant using the following assumptions:
Years Ended December 31, | ||||||
2020 | 2019 | 2018 | ||||
Dividend yield | ||||||
Expected Volatility | ||||||
Risk-free interest rate | ||||||
Expected option life | ||||||
Revenue Recognition
Revenue from contracts with customers subject to ASC 606 comprises the noninterest income earned by the Company in exchange for services provided to customers. Income associated with customer contracts generally involve transaction prices that are fixed and performance obligations which are satisfied as services are rendered. In most cases recognition occurs within a single financial reporting period as there is little or no judgement involved in the timing of revenues. We generally act in a principal capacity, on our own behalf, in most of our contracts with customers. In such transactions, we recognize revenue and the related costs to provide our services on a gross basis in our financial statements. Service Charges on Deposit Accounts comprise charges on retail and business accounts. Business customers can earn credits depending on account type and deposit balances maintained with the Company, which may be used to offset fees. Fees and credits are based on predetermined, agreed-upon rates. In some cases, we act in an agent capacity, deriving revenue through assisting other entities in transactions with our customers. In such transactions, we recognize revenue and those related costs to provide services on a gross basis in our financial statements. Debit card interchange income is derived from our customers’ use of various interchange and ATM/debit card networks which are the primary sources of revenue generated in an agent capacity.
Recent Accounting Pronouncements
In January 2016 the FASB issued ASU 2016-01, Financial Instruments–Overall: Recognition and Measurement of Financial Assets and Financial Liabilities. This guidance addresses certain aspects of recognition, measurement, presentation and disclosure of financial instruments. Among other things, the guidance in this ASU (i) requires equity investments, with certain exceptions, to be measured at fair value with changes in fair value recognized in net income, (ii) simplifies the impairment assessment of equity investments without readily determinable fair values by requiring a qualitative assessment to identify impairment, (iii) eliminates the requirement for public entities to disclose the methods and significant assumptions used to estimate the fair value that is required to be disclosed for financial instruments measured at amortized cost on the balance sheet, (iv) requires public business entities to use the exit price notion when measuring the fair value of financial instruments for disclosure purposes, (v) requires an entity to present separately in other comprehensive income the portion of the change in fair value of a liability resulting from a change in the instrument-specific credit risk when the entity has elected to measure the liability at fair value in accordance with the fair value option for financial instruments, (vi) requires separate presentation of financial assets and financial liabilities by measurement category and form of financial asset on the balance sheet or in the accompanying notes to the financial statements, and (vii) clarifies that an entity should evaluate the need for a valuation allowance on a deferred tax asset related to available-for-sale securities. This amendment is effective for fiscal years beginning after December 15, 2017, including interim periods within those fiscal years. Entities are required to apply the amendment by means of a cumulative-effect adjustment as of the beginning of the fiscal year of adoption, except for the amendment related to equity securities without readily determinable fair values which should be applied prospectively to equity investments that exist as of the date of adoption. The Company adopted ASU
86
values and noninterest revenue for $
In February 25, 2016, the FASB issued Accounting Standards Update , Leases (Topic 842). The new standard was issued to increase the transparency and comparability around lease obligations. Previously unrecorded off-balance sheet obligations will now be brought more prominently to light by bringing lease liabilities onto the balance sheet, accompanied by enhanced qualitative and quantitative disclosures in the notes to the financial statements. This Update is generally effective for public business entities in fiscal years beginning after December 15, 2018, including interim periods within those fiscal years. The Company has several lease agreements, including
In September 2016 the FASB issued ASU 2016-13, Financial Instruments – Credit Losses (Topic 326): Measurement of Credit Losses on Financial Instruments, which eliminates the probable initial recognition threshold for credit losses in current U.S. GAAP, and instead requires an organization to record a current estimate of all expected credit losses over the contractual term, adjusted by expected prepayments, for financial assets carried at amortized cost. This is commonly referred to as the current expected credit losses (“CECL”) methodology. Expected credit losses for financial assets held at the reporting date will be estimated for the contractual term of the financial asset, adjusted by prepayments, based on historical experience, current conditions, and reasonable and supportable forecasts of future economic conditions. Another change from existing U.S. GAAP involves the treatment of purchased credit deteriorated assets, which are more broadly defined than purchased credit impaired assets in current accounting standards. When such assets are purchased, institutions will estimate and record an allowance for credit losses, in contrast to acquired loans not identified as purchased credit deteriorated for which the allowance will be established through a charge to credit loss expense. Furthermore, ASU 2016-13 updates the measurement of credit losses on available-for-sale debt securities, by mandating that institutions record credit losses on available-for-sale debt securities through an allowance for credit losses rather than the current practice of writing down securities for other-than-temporary impairment. ASU 2016-13 will also require the enhancement of financial statement disclosures regarding estimates used in calculating credit losses. ASU
87
inputs, assumptions and methodologies within its CECL estimation process during 2021 as we prepare for implementation on January 1, 2022.
In January 2017 the FASB issued ASU
In March 2017 the FASB issued ASU 2017-08, Receivables – Nonrefundable Fees and Other Costs (Subtopic 310-20): Premium Amortization on Purchased Callable Debt Securities. The amendments in this update shorten the amortization period for certain callable debt securities held at a premium, by requiring the premium to be amortized to the earliest call date. Under prior guidance, the premium on a callable debt security was generally amortized as an adjustment to yield over the contractual life of the instrument, and any unamortized premium was recorded as a loss in earnings upon the debtor’s exercise of a call provision. Under ASU 2017-08, because the premium is amortized to the earliest call date, entities no longer recognize a loss in earnings if a debt security is called prior to the contractual maturity date. The amendments did not require an accounting change for securities held at a discount; discounts will continue to be amortized as an adjustment to yield over the contractual life of the debt instrument. ASU 2017-08 became effective for public business entities, including the Company, for fiscal years, and interim periods within those fiscal years, beginning after December 15, 2018. ASU 2017-08, required entities to use a modified retrospective approach, with the cumulative-effect adjustment recognized to retained earnings at the beginning of the period of adoption. Entities are also required to provide disclosures about a change in accounting principle in the period of adoption. The Company
In August 2018 the FASB issued ASU 2018-13, Fair Value Measurement (Topic 820): Disclosure Framework – Changes to the Disclosure Requirements for Fair Value Measurement, as part of its disclosure framework project. Pursuant to this guidance, disclosures that will no longer be required include the following: transfers between Level 1 and Level 2 of the fair value hierarchy; transfers in and out of Level 3 for nonpublic entities, as well as purchases and issuances and the Level 3 roll forward; a company’s policy for determining when transfers between any of the three levels have occurred; the valuation processes used for Level 3 measurements; and, the changes in unrealized gains or losses presented in earnings for Level 3 instruments held at the balance sheet date for nonpublic entities. The following are additional disclosure requirements: for public entities, the changes in unrealized gains and losses for the period included in other comprehensive income for recurring Level 3 instruments held at the balance sheet date; for public entities, the range and weighted average of significant unobservable inputs used for Level 3 measurements, although for certain unobservable inputs the entity will be allowed to disclose other quantitative information in place of the weighted average to the extent that it would be a more reasonable and rational method to reflect the distribution of unobservable inputs; for nonpublic entities, some form of quantitative information about significant unobservable inputs used in Level 3 fair value measurements; and, for certain investments in entities that calculate the net asset value, disclosures will be required about the timing of liquidation and redemption restrictions lapsing if the latter has been communicated to the reporting entity. The guidance also clarifies that the Level 3 measurement uncertainty disclosure should communicate information about the uncertainty at the balance sheet date. ASU 2018-13 is effective for all entities in fiscal years beginning after December 15, 2019, including interim
88
periods. In addition, an entity may
In May 2019, the FASB issued ASU 2019-05, Financial Instruments—Credit Losses (Topic 326), which provides transition relief for entities adopting ASU 2016-13. ASU 2019-05 amends ASU 2016-13 to allow companies to irrevocably elect, upon adoption of ASU 2016-13, the fair value option on financial instruments that (1) were previously recorded at amortized cost and (2) are within the scope of ASC 326-20 if the instruments are eligible for the fair value option under ASC 825-10. An entity will apply the amendments in this update through a cumulative-effect adjustment to retained earnings as of the beginning of the first reporting period in which the guidance is effective (that is, a modified-retrospective approach). A prospective transition approach is required for debt securities for which an other-than-temporary impairment had been recognized before the effective date, in order to maintain the same amortized cost basis before and after the effective date of this update. Amounts previously recognized in accumulated other comprehensive income as of the date of adoption that relate to improvements in cash flows expected to be collected should continue to be accreted into income over the remaining life of the asset. Recoveries of amounts previously written off relating to improvements in cash flows after the date of adoption should be recorded in earnings when received. The fair value option election does not apply to held-to-maturity debt securities. Entities are required to make this election on an instrument-by-instrument basis. For public business entities that are SEC filers, including the Company, the amendments in ASU 2019-05 are effective for fiscal years beginning after December 15, 2019, including interim periods within those fiscal years. The Company
On March 22, 2020, a statement was issued by our banking regulators and titled the “Interagency Statement on Loan Modifications and Reporting for Financial Institutions Working with Customers Affected by the Coronavirus” (the “Interagency Statement”) that encourages financial institutions to work prudently with borrowers who are or may be unable to meet their contractual payment obligations due to the effects of COVID-19. Additionally, Section 4013 of the CARES Act, that passed on March 27, 2020, further provides that a qualified loan modification is exempt by law from classification as a troubled debt restructuring (“TDR”) as defined by GAAP, from the period beginning March 1, 2020 until the earlier of December 31, 2020 or the date that is 60 days after the date on which the national emergency concerning the COVID-19 outbreak declared by the President of the United States under the National Emergencies Act (50 U.S.C. 1601 et seq.) terminates. The Interagency Statement was subsequently revised in April 2020 to clarify the interaction of the original guidance with Section 4013 of the CARES Act, as well as setting forth the banking regulators’ views on consumer protection considerations. In accordance with such guidance, we processed short-term modifications for
89
3. SECURITIES AVAILABLE-FOR-SALE
The amortized cost and fair value of the securities available-for-sale are as follows (dollars in thousands):
December 31, 2020 | ||||||||||||
| Amortized |
| Gross |
| Gross |
| Fair Value | |||||
U.S. government agencies | $ | | $ | | $ | — | $ | | ||||
Mortgage-backed securities | | | ( | | ||||||||
State and political subdivisions | | | — | | ||||||||
Total securities | $ | | $ | | $ | ( | $ | | ||||
December 31, 2019 | ||||||||||||
| Amortized |
| Gross |
| Gross |
| Fair Value | |||||
U.S. government agencies | $ | | $ | | $ | ( | $ | | ||||
Mortgage-backed securities | | | ( | | ||||||||
State and political subdivisions | | | ( | | ||||||||
Total securities | $ | | $ | | $ | ( | $ | | ||||
For the years ended December 31, 2020, 2019, and 2018, proceeds from sales of securities available-for-sale were $
Gross gains and losses from the sales and calls of securities for the years ended were as follows (dollars in thousands):
December 31, | |||||||||
| 2020 |
| 2019 |
| 2018 | ||||
Gross gains on sales and calls of securities | $ | | $ | | $ | | |||
Gross losses on sales and calls of securities | ( | ( | ( | ||||||
Net gains (losses) on sales and calls of securities | $ | | $ | ( | $ | | |||
The Company has reviewed all sectors and securities in the portfolio for impairment. During the year ended December 31, 2020 the Company realized gains through earnings from the sale and call of
90
At December 31, 2020 and 2019, the Company had
December 31, 2020 | ||||||||||||
Less than twelve months | Twelve months or longer | |||||||||||
| Gross |
| Fair Value |
| Gross |
| Fair Value | |||||
U.S. government agencies | $ | — | $ | — | $ | — | $ | — | ||||
Mortgage-backed securities | ( | | — | — | ||||||||
State and political subdivisions | — | — | — | — | ||||||||
Total | $ | ( | $ | | $ | — | $ | — | ||||
December 31, 2019 | ||||||||||||
Less than twelve months | Twelve months or longer | |||||||||||
| Gross |
| Fair Value |
| Gross |
| Fair Value | |||||
U.S. government agencies | $ | ( | $ | | $ | ( | $ | | ||||
Mortgage-backed securities | ( | | ( | | ||||||||
State and political subdivisions | ( | | — | — | ||||||||
Total | $ | ( | $ | | $ | ( | $ | | ||||
The Company has concluded as of December 31, 2020 that all remaining securities, currently in an unrealized loss position, are not other-than-temporarily-impaired. This assessment was based on the following factors: 1) the Company has the ability to hold the securities, 2) the Company does not intend to sell the securities, 3) the Company does not anticipate it will be required to sell the securities before recovery, 4) and the Company expects to eventually recover the entire amortized cost basis of the securities.
The amortized cost and estimated fair value of securities available-for-sale at December 31, 2020 by contractual maturity are shown below. Expected maturities will differ from contractual maturities because the issuers of the securities may have the right to call or prepay obligations with or without penalties (dollars in thousands):
| Amortized Cost |
| Fair Value | |||
Maturing within one year | $ | | $ | | ||
Maturing after one year through five years | | | ||||
Maturing after five years through ten years | | | ||||
Maturing after ten years | | | ||||
Mortgage-backed securities | | | ||||
Collateralized mortgage obligations | | | ||||
$ | | $ | | |||
Securities available-for-sale with amortized costs totaling $
Securities available-for-sale with amortized costs totaling $
91
At December 31, 2020, the Company’s investment portfolio included securities issued by 282 different government municipalities and agencies located within 29 states with a fair value of $
The Company’s investments in bonds issued by states, municipalities and political subdivisions are evaluated in accordance with Supervision and Regulation Letter 12-15 (SR 12-15) issued by the Board of Governors of the Federal Reserve System, “Investing in Securities without Reliance on Nationally Recognized Statistical Rating Organization Ratings”, and other regulatory guidance. Credit ratings are considered in our analysis only as a guide to the historical default rate associated with similarly-rated bonds. There have been no significant differences in our internal analyses compared with the ratings assigned by the third party credit rating agencies.
The following table summarizes the amortized cost and fair values of general obligation and revenue bonds in the Company’s investment securities portfolio at the indicated dates, identifying the state in which the issuing municipality or agency operates for our largest geographic concentrations (dollars in thousands):
December 31, 2020 | December 31, 2019 | |||||||||||
General obligation bonds |
| Amortized Cost |
| Fair Value |
| Amortized Cost |
| Fair Value | ||||
State of Issuance: | ||||||||||||
Texas | $ | | $ | | $ | | $ | | ||||
California | | | | | ||||||||
Washington | | | | | ||||||||
Other (21 and 24 states, respectively) | | | | | ||||||||
Total general obligation bonds | | | | | ||||||||
Revenue bonds | ||||||||||||
State of Issuance: | ||||||||||||
Texas | | | | | ||||||||
Washington | | | | | ||||||||
California | | | | | ||||||||
Other (14 and 13 states, respectively) | | | | | ||||||||
Total revenue bonds | | | | | ||||||||
Total obligations of states and political subdivisions | $ | | $ | | $ | | $ | | ||||
92
The following table summarizes the amortized cost and fair value of revenue bonds in the Company’s investment securities portfolio at the indicated dates, identifying the revenue source of repayment for our largest source concentrations (dollars in thousands):
December 31, 2020 | December 31, 2019 | |||||||||||
Revenue bonds |
| Amortized Cost |
| Fair Value |
| Amortized Cost |
| Fair Value | ||||
Revenue Source: | ||||||||||||
Water | $ | | $ | | $ | | $ | | ||||
Sewer | | | | | ||||||||
Sales tax | | | | | ||||||||
Lease | | | | | ||||||||
Other (8 and 9 sources, respectively) | | | | | ||||||||
Total revenue bonds | $ | | $ | | $ | | $ | | ||||
4. LOANS AND LEASES
The composition of the loan and lease portfolio is as follows (dollars in thousands):
December 31, | ||||||
| 2020 |
| 2019 | |||
Real estate: | ||||||
Secured by commercial and professional office properties, including construction and development | $ | | $ | | ||
Secured by residential properties | | | ||||
Secured by farm land | | | ||||
Total real estate loans | | | ||||
Agricultural | | | ||||
Commercial and industrial | | | ||||
Mortgage warehouse lines | | | ||||
Consumer | | | ||||
Total loans | | | ||||
Deferred loan and lease origination (fee) cost, net | ( | | ||||
Allowance for loan and lease losses | ( | ( | ||||
Loans, net | $ | | $ | | ||
The Company monitors the credit quality of loans on a continuous basis using the regulatory and accounting classifications of pass, special mention, substandard and impaired to characterize and qualify the associated credit risk. Loans classified as “loss” are immediately charged-off. The Company uses the following definitions of risk classifications:
Pass – Loans listed as pass include larger non-homogeneous loans not meeting the risk rating definitions below and smaller, homogeneous loans not assessed on an individual basis.
Special Mention – Loans classified as special mention have the potential weakness that deserves management’s close attention. If left uncorrected, these potential weaknesses may result in deterioration of the repayment prospects for the loan or of the institution’s credit position at some future date.
93
Substandard – Loans classified as substandard are those loans with clear and well-defined weaknesses such as a highly leveraged position, unfavorable financial operating results and/or trends, or uncertain repayment sources or poor financial condition, which may jeopardize ultimate recoverability of the debt.
Impaired – A loan is considered impaired, when, based on current information and events, it is probable that the Company will be unable to collect all amounts due according to the contractual terms of the loan agreement. Additionally, all loans classified as troubled debt restructurings are considered impaired.
Credit quality classifications as of December 31, 2020 were as follows (dollars in thousands):
| Pass |
| Special |
| Substandard |
| Impaired |
| Total | ||||||
Real estate: | |||||||||||||||
1-4 family residential construction | $ | | $ | | $ | | $ | | $ | | |||||
Other construction/land | | | | | | ||||||||||
1-4 family - closed-end | | | | | | ||||||||||
Equity lines | | | | | | ||||||||||
Multi-family residential | | | | | | ||||||||||
Commercial real estate owner occupied | | | | | | ||||||||||
Commercial real estate non-owner occupied | | | | | | ||||||||||
Farmland | | | | | | ||||||||||
Total real estate | | | | | | ||||||||||
Agricultural | | | | | | ||||||||||
Commercial and industrial | | | | | | ||||||||||
Mortgage warehouse lines | | | | | | ||||||||||
Consumer loans | | | | | | ||||||||||
Total gross loans and leases | $ | | $ | | $ | | $ | | $ | | |||||
94
Credit quality classifications as of December 31, 2019 were as follows (dollars in thousands):
| Pass |
| Special |
| Substandard |
| Impaired |
| Total | ||||||
Real estate: | |||||||||||||||
1-4 family residential construction | $ | | $ | | $ | | $ | | $ | | |||||
Other construction/land | | | | | | ||||||||||
1-4 family - closed-end | | | | | | ||||||||||
Equity lines | | | | | | ||||||||||
Multi-family residential | | | | | | ||||||||||
Commercial real estate owner occupied | | | | | | ||||||||||
Commercial real estate non-owner occupied | | | | | | ||||||||||
Farmland | | | | | | ||||||||||
Total real estate | | | | | | ||||||||||
Agricultural | | | | | | ||||||||||
Commercial and industrial | | | | | | ||||||||||
Mortgage warehouse lines | | | | | | ||||||||||
Consumer loans | | | | | | ||||||||||
Total gross loans and leases | $ | | $ | | $ | | $ | | $ | | |||||
Loans may or may not be collateralized, and collection efforts are continuously pursued. Loans or leases may be restructured by management when a borrower has experienced some change in financial status causing an inability to meet the original repayment terms and where the Company believes the borrower will eventually overcome those circumstances and make full restitution. Loans and leases are charged off when they are deemed to be uncollectible, while recoveries are generally recorded only when cash payments are received subsequent to the charge-off.
The following tables present the activity in the allowance for loan and lease losses and the recorded investment in loans and impairment method by portfolio segment for each of the years ending December 31, 2020, 2019, and 2018 (dollars in thousands):
Commercial and | ||||||||||||||||||
| Real Estate |
| Agricultural |
| Industrial (1) |
| Consumer |
| Unallocated |
| Total | |||||||
Allowance for credit losses: | ||||||||||||||||||
Balance, December 31, 2017 | $ | | | | | | | |||||||||||
Charge-offs | ( | | ( | ( | | ( | ||||||||||||
Recoveries | | | | | | | ||||||||||||
Provision | | | | | ( | | ||||||||||||
Balance, December 31, 2018 | | | | | | | ||||||||||||
Charge-offs | ( | | ( | ( | | ( | ||||||||||||
Recoveries | | | | | | | ||||||||||||
Provision | | ( | | | | | ||||||||||||
Balance, December 31, 2019 | | | | | | | ||||||||||||
Charge-offs | | | ( | ( | | ( | ||||||||||||
Recoveries | | | | | | | ||||||||||||
Provision | | | | ( | ( | | ||||||||||||
Balance, December 31, 2020 | $ | | $ | | $ | | $ | | $ | | $ | | ||||||
| (1) | Includes mortgage warehouse lines |
95
Loans evaluated for impairment:
December 31, 2020 | December 31, 2019 | December 31, 2018 | ||||||||||||||||
| Individually |
| Collectively |
| Individually |
| Collectively |
| Individually |
| Collectively | |||||||
Real estate | $ | | $ | | $ | | $ | | $ | | $ | | ||||||
Agricultural | | | | | | | ||||||||||||
Commercial and industrial (1) | | | | | | | ||||||||||||
Consumer | | | | | | | ||||||||||||
Total loans | $ | | $ | | $ | | $ | | $ | | $ | | ||||||
| (1) | Includes mortgage warehouse lines |
96
Reserves based on method of evaluation for impairment:
December 31, 2020 | December 31, 2019 | December 31, 2018 | ||||||||||||||||
| Specific |
| General |
| Specific |
| General |
| Specific |
| General | |||||||
Real estate | $ | | $ | | $ | | $ | | $ | | $ | | ||||||
Agricultural | | | | | | | ||||||||||||
Commercial and industrial (1) | | | | | | | ||||||||||||
Consumer | | | | | | | ||||||||||||
Unallocated | — | | — | | — | | ||||||||||||
Total loan and lease loss reserves | $ | | $ | | $ | | $ | | $ | | $ | | ||||||
| (1) | Includes mortgage warehouse lines |
The following tables present the recorded investment in nonaccrual loans and loans past due over 30 days as of December 31, 2020 and December 31, 2019 (dollars in thousands, except footnotes):
December 31, 2020 | 30-59 Days | 60-89 Days | 90 Days Or | Total Financing | Non-Accrual | ||||||||||||||||
| Past Due |
| Past Due |
| Due(2) |
| Total Past Due |
| Current |
| Receivables |
| Loans(1) | ||||||||
Real Estate: | |||||||||||||||||||||
1-4 family residential construction | $ | | $ | | $ | | $ | | $ | | $ | | $ | | |||||||
Other construction/land | | | | | | | | ||||||||||||||
1-4 family - closed-end | | | | | | | | ||||||||||||||
Equity lines | | | | | | | | ||||||||||||||
Multi-family residential | | | | | | | | ||||||||||||||
Commercial real estate owner occupied | | | | | | | | ||||||||||||||
Commercial real estate non-owner occupied | | | | | | | | ||||||||||||||
Farmland | | | | | | | | ||||||||||||||
Total real estate loans | | | | | | | | ||||||||||||||
| |||||||||||||||||||||
Agricultural | | | | | | | | ||||||||||||||
Commercial and industrial | | | | | | | | ||||||||||||||
Mortgage warehouse lines | | | | | | | | ||||||||||||||
Consumer loans | | | | | | | | ||||||||||||||
Total gross loans and leases | $ | | $ | | $ | | $ | | $ | | $ | | $ | | |||||||
| (1) | Included in Total Financing Receivables |
| (2) | As of December 31, 2020 there were |
97
December 31, 2019 | 30-59 Days | 60-89 Days | 90 Days Or | Total Financing | Non-Accrual | ||||||||||||||||
| Past Due |
| Past Due |
| Due(2) |
| Total Past Due |
| Current |
| Receivables |
| Loans(1) | ||||||||
Real Estate: | |||||||||||||||||||||
1-4 family residential construction | $ | | $ | | $ | | $ | | $ | | $ | | $ | | |||||||
Other construction/land | | | | | | | | ||||||||||||||
1-4 family - closed-end | | | | | | | | ||||||||||||||
Equity lines | | | | | | | | ||||||||||||||
Multi-family residential | | | | | | | | ||||||||||||||
Commercial real estate owner occupied | | | | | | | | ||||||||||||||
Commercial real estate non-owner occupied | | | | | | | | ||||||||||||||
Farmland | | | | | | | | ||||||||||||||
Total real estate loans | | | | | | | | ||||||||||||||
| |||||||||||||||||||||
Agricultural | | | | | | | | ||||||||||||||
Commercial and industrial | | | | | | | | ||||||||||||||
Mortgage warehouse lines | | | | | | | | ||||||||||||||
Consumer loans | | | | | | | | ||||||||||||||
Total gross loans and leases | $ | | $ | | $ | | $ | | $ | | $ | | $ | | |||||||
| (1) | Included in Total Financing Receivables |
| (2) | As of December 31, 2019 there were |
Generally, the Company places a loan or lease on nonaccrual status and ceases recognizing interest income when it has become delinquent more than 90 days and/or when Management determines that the repayment of principal and collection of interest is unlikely. The Company may decide that it is appropriate to continue to accrue interest on certain loans more than 90 days delinquent if they are well-secured by collateral and collection is in process. When a loan is placed on nonaccrual status, any accrued but uncollected interest for the loan is reversed out of interest income in the period in which the loan’s status changed. Subsequent payments received from the customer are applied to principal, and no further interest income is recognized until the principal has been paid in full or until circumstances have changed such that payments are again consistently received as contractually required. As of December 31, 2020 there were
98
Individually impaired loans as of December 31, 2020, December 31, 2019 and December 31, 2018 were as follows (dollars in thousands):
December 31, 2020 | |||||||||||||||
Unpaid Principal | Recorded | Average Recorded | Interest Income | ||||||||||||
| Balance(1) |
| Investment(2) |
| Related Allowance |
| Investment |
| Recognized(3) | ||||||
With an Allowance Recorded | |||||||||||||||
Real estate: | |||||||||||||||
1-4 family residential construction | $ | | $ | | $ | | $ | | $ | | |||||
Other construction/land | | | | | | ||||||||||
1-4 family - closed-end | | | | | | ||||||||||
Equity lines | | | | | | ||||||||||
Multifamily residential | | | | | | ||||||||||
Commercial real estate - owner occupied | | | | | | ||||||||||
Commercial real estate - non-owner occupied | | | | | | ||||||||||
Farmland | | | | | | ||||||||||
Total real estate | | | | | | ||||||||||
Agricultural | | | | | | ||||||||||
Commercial and industrial | | | | | | ||||||||||
Consumer loans | | | | | | ||||||||||
| | | | | | ||||||||||
With no Related Allowance Recorded | |||||||||||||||
Real estate: | |||||||||||||||
1-4 family residential construction | $ | | $ | | $ | — | $ | | $ | | |||||
Other construction/land | | | — | | | ||||||||||
1-4 family - closed-end | | | — | | | ||||||||||
Equity lines | | | — | | | ||||||||||
Multifamily residential | | | — | | | ||||||||||
Commercial real estate - owner occupied | | | — | | | ||||||||||
Commercial real estate - non-owner occupied | | | — | | | ||||||||||
Farmland | | | — | | | ||||||||||
Total real estate | | | — | | | ||||||||||
Agricultural | | | — | | | ||||||||||
Commercial and industrial | | | — | | | ||||||||||
Consumer loans | | | — | | | ||||||||||
| | | — | | | ||||||||||
Total | $ | | $ | | $ | | $ | | $ | | |||||
| (1) | Contractual principal balance due from customer. |
| (2) | Principal balance on Company’s books, less any direct charge offs. |
| (3) | Interest income is recognized on performing balances on a regular accrual basis. |
99
December 31, 2019 | |||||||||||||||
Unpaid Principal | Recorded | Average Recorded | Interest Income | ||||||||||||
| Balance(1) |
| Investment(2) |
| Related Allowance |
| Investment |
| Recognized(3) | ||||||
With an Allowance Recorded | |||||||||||||||
Real estate: | |||||||||||||||
1-4 family residential construction | $ | | $ | | $ | | $ | | $ | | |||||
Other construction/land | | | | | | ||||||||||
1-4 family - closed-end | | | | | | ||||||||||
Equity lines | | | | | | ||||||||||
Multifamily residential | | | | | | ||||||||||
Commercial real estate- owner occupied | | | | | | ||||||||||
Commercial real estate- non-owner occupied | | | | | | ||||||||||
Farmland | | | | | | ||||||||||
Total real estate | | | | | | ||||||||||
Agricultural | | | | | | ||||||||||
Commercial and industrial | | | | | | ||||||||||
Consumer loans | | | | | | ||||||||||
| | | | | | ||||||||||
With no Related Allowance Recorded | |||||||||||||||
Real estate: | |||||||||||||||
1-4 family residential construction | $ | | $ | | $ | — | $ | | $ | | |||||
Other construction/land | | | — | | | ||||||||||
1-4 family - closed-end | | | — | | | ||||||||||
Equity Lines | | | — | | | ||||||||||
Multifamily residential | | | — | | | ||||||||||
Commercial real estate- owner occupied | | | — | | | ||||||||||
Commercial real estate- non-owner occupied | | | — | | | ||||||||||
Farmland | | | — | | | ||||||||||
Total real estate | | | — | | | ||||||||||
Agricultural | | | — | | | ||||||||||
Commercial and industrial | | | — | | | ||||||||||
Consumer loans | | | — | | | ||||||||||
| | | — | | | ||||||||||
Total | $ | | $ | | $ | | $ | | $ | | |||||
| (1) | Contractual principal balance due from customer. |
| (2) | Principal balance on Company’s books, less any direct charge offs. |
| (3) | Interest income is recognized on performing balances on a regular accrual basis. |
100
December 31, 2018 | |||||||||||||||
| |||||||||||||||
Unpaid Principal | Recorded | Average Recorded | Interest Income | ||||||||||||
| Balance(1) |
| Investment(2) |
| Related Allowance |
| Investment |
| Recognized(3) | ||||||
With an Allowance Recorded | |||||||||||||||
Real estate: | |||||||||||||||
1-4 family residential construction | $ | — | $ | — | $ | | $ | — | $ | — | |||||
Other construction/land | | | | | | ||||||||||
1-4 family - closed-end | | | | | | ||||||||||
Equity lines | | | | | | ||||||||||
Multifamily residential | | | | | | ||||||||||
Commercial real estate- owner occupied | | | | | | ||||||||||
Commercial real estate- non-owner occupied | | | | | | ||||||||||
Farmland | — | — | | — | — | ||||||||||
Total real estate | | | | | | ||||||||||
Agricultural | | | | | — | ||||||||||
Commercial and industrial | | | | | | ||||||||||
Consumer loans | | | | | | ||||||||||
| | | | | | ||||||||||
With no Related Allowance Recorded | |||||||||||||||
Real estate: | |||||||||||||||
1-4 family residential construction | $ | — | $ | — | $ | — | $ | — | $ | — | |||||
Other construction/land | | | — | | — | ||||||||||
1-4 family - closed-end | | | — | | | ||||||||||
Equity Lines | | | — | | — | ||||||||||
Multifamily residential | — | — | — | — | — | ||||||||||
Commercial real estate- owner occupied | | | — | | — | ||||||||||
Commercial real estate- non-owner occupied | — | — | — | — | — | ||||||||||
Farmland | | | — | | — | ||||||||||
Total real estate | | | — | | | ||||||||||
Agricultural | — | — | — | — | — | ||||||||||
Commercial and industrial | | | — | | — | ||||||||||
Consumer loans | | | — | | | ||||||||||
| | | — | | | ||||||||||
Total | $ | | $ | | $ | | $ | | $ | | |||||
| (1) | Contractual principal balance due from customer. |
| (2) | Principal balance on Company’s books, less any direct charge offs. |
| (3) | Interest income is recognized on performing balances on a regular accrual basis. |
101
Included in loans above are troubled debt restructurings that were classified as impaired. The Company had $
Additional commitments to existing customers with restructured loans totaled $
Interest income recognized on impaired loans was $
The following is a summary of interest income from non-accrual loans in the portfolio at year-end that was not recognized (dollars in thousands):
Years Ended December 31, | |||||||||
Non accrual loans |
| 2020 |
| 2019 |
| 2018 | |||
Interest that would have been recorded under the loans’ original terms | $ | | $ | | $ | | |||
Less gross interest recorded | | | | ||||||
Foregone interest | $ | | $ | | $ | | |||
Certain loans have been pledged to secure short-term borrowing arrangements (see Note 10). These loans totaled $
Salaries and employee benefits totaling $
During the periods ended December 31, 2020 and 2019, the terms of certain loans were modified as troubled debt restructurings. Types of modifications applied to these loans include a reduction of the stated interest rate, a modification of term, an agreement to collect only interest rather than principal and interest for a specified period, or any combination thereof.
102
The following tables present troubled debt restructurings by type of modification during the period ending December 31, 2020, December 31, 2019 and December 31, 2018 (dollars in thousands):
December 31, 2020 | Rate | Term | Interest Only | Rate & Term | Term & Interest | |||||||||||||
| Modification |
| Modification |
| Modification |
| Modification |
| Modification | Total | ||||||||
Troubled debt restructurings | ||||||||||||||||||
Real estate: | ||||||||||||||||||
Other construction/land | $ | | $ | | $ | | $ | | $ | | $ | | ||||||
1-4 family - closed-end | | | | | | | ||||||||||||
Equity lines | | | | | | | ||||||||||||
Multi-family residential | | | | | | | ||||||||||||
Commercial real estate owner occupied | | | | | | | ||||||||||||
Commercial real estate non-owner occupied | | | | | | | ||||||||||||
Farmland | | | | | | | ||||||||||||
Total real estate loans | | | | | | | ||||||||||||
| ||||||||||||||||||
Agricultural | | | | | | | ||||||||||||
Commercial and industrial | | | | | | | ||||||||||||
Consumer loans | | | | | | | ||||||||||||
| $ | | $ | | $ | | $ | | $ | | $ | | ||||||
December 31, 2019 | Rate | Term | Interest Only | Rate & Term | Term & Interest | |||||||||||||
| Modification |
| Modification |
| Modification |
| Modification |
| Modification | Total | ||||||||
Troubled debt restructurings | ||||||||||||||||||
Real estate: | ||||||||||||||||||
Other construction/land | $ | | $ | | $ | | $ | | $ | | $ | | ||||||
1-4 family - closed-end | | | | | | | ||||||||||||
Equity lines | | | | | | | ||||||||||||
Multi-family residential | | | | | | | ||||||||||||
Commercial real estate owner occupied | | | | | | | ||||||||||||
Commercial real estate non-owner occupied | | | | | | | ||||||||||||
Farmland | | | | | | | ||||||||||||
Total real estate loans | | | | | | | ||||||||||||
| ||||||||||||||||||
Agricultural | | | | | | | ||||||||||||
Commercial and industrial | | | | | | | ||||||||||||
Consumer loans | | | | | | | ||||||||||||
| $ | | $ | | $ | | $ | | $ | | $ | | ||||||
103
December 31, 2018 | Rate | Term | Interest Only | Rate & Term | Term & Interest | |||||||||||||
| Modification |
| Modification |
| Modification |
| Modification |
| Modification | Total | ||||||||
Troubled debt restructurings | ||||||||||||||||||
Real estate: | ||||||||||||||||||
Other construction/land | $ | | $ | | $ | | $ | | $ | | $ | | ||||||
1-4 family - closed-end | | | | | | | ||||||||||||
Equity lines | | | | | | | ||||||||||||
Multi-family residential | | | | | | | ||||||||||||
Commercial real estate owner occupied | | | | | | | ||||||||||||
Commercial real estate non-owner occupied | | | | | | | ||||||||||||
Farmland | | | | | | | ||||||||||||
Total real estate loans | | | | | | | ||||||||||||
| ||||||||||||||||||
Agricultural | | | | | | | ||||||||||||
Commercial and industrial | | | | | | | ||||||||||||
Consumer loans | | | | | | | ||||||||||||
| $ | | $ | | $ | | $ | | $ | | $ | | ||||||
The following tables present loans by class modified as troubled debt restructurings including any subsequent defaults during the period ending December 31, 2020, December 31, 2019 and December 31, 2018 (dollars in thousands):
Pre-Modification | Post-Modification | ||||||||||
Outstanding | Outstanding | ||||||||||
Number of | Recorded | Recorded | Reserve | ||||||||
December 31, 2020 |
| Loans |
| Investment |
| Investment |
| Difference(1) | |||
Real estate: | |||||||||||
Other construction/land | | $ | | $ | | $ | | ||||
1-4 family - closed-end | | | | | |||||||
Equity lines | | | | | |||||||
Multi-family residential | | | | | |||||||
Commercial real estate - owner occupied | | | | | |||||||
Commercial real estate - non-owner occupied | | | | | |||||||
Farmland | | | | | |||||||
Total real estate loans | | | | ||||||||
| |||||||||||
Agricultural | | | | | |||||||
Commercial and industrial | | | | | |||||||
Consumer loans | | | | | |||||||
$ | | $ | | $ | | ||||||
| (1) | This represents the increase or (decrease) in the allowance for loans and lease losses reserve for these credits measured as the difference between the specific post-modification impairment reserve and the pre-modification reserve calculated under our general allowance for loan and lease loss methodology. |
104
Pre-Modification | Post-Modification | ||||||||||
Outstanding | Outstanding | ||||||||||
Number of | Recorded | Recorded | Reserve | ||||||||
December 31, 2019 |
| Loans |
| Investment |
| Investment |
| Difference(1) | |||
Real estate: | |||||||||||
Other construction/land | | $ | | $ | | $ | | ||||
1-4 family - closed-end | | | | | |||||||
Equity lines | | | | | |||||||
Multi-family residential | | | | | |||||||
Commercial real estate - owner occupied | | | | | |||||||
Commercial real estate - non-owner occupied | | | | | |||||||
Farmland | | | | | |||||||
Total real estate loans | | | | ||||||||
| |||||||||||
Agricultural | | | | | |||||||
Commercial and industrial | | | | ( | |||||||
Consumer loans | | | | ( | |||||||
$ | | $ | | $ | ( | ||||||
| (1) | This represents the increase or (decrease) in the allowance for loans and lease losses reserve for these credits measured as the difference between the specific post-modification impairment reserve and the pre-modification reserve calculated under our general allowance for loan and lease loss methodology. |
Pre-Modification | Post-Modification | ||||||||||
Outstanding | Outstanding | ||||||||||
Number of | Recorded | Recorded | Reserve | ||||||||
December 31, 2018 |
| Loans |
| Investment |
| Investment |
| Difference(1) | |||
Real estate: | |||||||||||
Other construction/land | | $ | | $ | | $ | | ||||
1-4 family - closed-end | | | | | |||||||
Equity lines | | | | | |||||||
Multi-family residential | | | | | |||||||
Commercial real estate - owner occupied | | | | | |||||||
Commercial real estate - non-owner occupied | | | | | |||||||
Farmland | | | | | |||||||
Total real estate loans | | | | ||||||||
| |||||||||||
Agricultural | | | | | |||||||
Commercial and industrial | | | | | |||||||
Consumer loans | | | | | |||||||
$ | | $ | | $ | | ||||||
| (1) | This represents the increase or (decrease) in the allowance for loans and lease losses reserve for these credits measured as the difference between the specific post-modification impairment reserve and the pre-modification reserve calculated under our general allowance for loan and lease loss methodology. |
In the tables above, there were no TDRs that subsequently defaulted necessitating an increase in the allowance for loan and lease losses for the years ended December 31, 2020, 2019 and 2018. The total allowance for loan and lease
105
losses specifically allocated to the balances that were classified as TDRs during the year ended December 31, 2020 and 2019 is $
Purchased Credit Impaired Loans
The Company has purchased loans from past acquisitions, some of which have shown evidence of credit deterioration since origination and it was probable at acquisition that all contractually required payments would not be collected. The carrying amount and unpaid principal balance of those loans are as follows (dollars in thousands):
December 31, 2020 | ||||||
| Unpaid Principal Balance |
| Carrying Value | |||
Real estate secured | $ | | $ | — | ||
Commercial and industrial | — | — | ||||
Consumer | — | — | ||||
Total purchased credit impaired loans | $ | | $ | — | ||
December 31, 2019 | ||||||
| Unpaid Principal Balance |
| Carrying Value | |||
Real estate secured | $ | | $ | — | ||
Commercial and industrial | — | — | ||||
Consumer | — | — | ||||
Total purchased credit impaired loans | $ | | $ | — | ||
For those purchased credit impaired loans disclosed above, the Company did not increase the allowance for loan and lease losses during 2020, 2019 and 2018. There is no accretable yield, or income expected to be collected on these purchased credit impaired loans. During the years ended December 31, 2020 and 2019, there were
5. PREMISES AND EQUIPMENT
Premises and equipment at cost consisted of the following (dollars in thousands):
December 31, | ||||||
| 2020 |
| 2019 | |||
Land | $ | | $ | | ||
Buildings and improvements | | | ||||
Furniture, fixtures and equipment | | | ||||
Leasehold improvements | | | ||||
| | |||||
Less accumulated depreciation and amortization | | | ||||
Construction in progress | — | | ||||
$ | | $ | | |||
Depreciation and amortization included in occupancy and equipment expense totaled $
106
6. OPERATING LEASES
On January 1, 2019, we adopted a new accounting standard which required the recognition of certain operating leases on our balance sheet as lease right-of-use assets (reported as a component of other assets) and related lease liabilities (reported as a component of other liabilities). See Note 2–Summary of Significant Accounting Policies. The Company leases space under non-cancelable operating leases for
There were no sale and leaseback transactions, leveraged leases, or lease transactions with related parties during the years ending December 31, 2020 and 2019.
At December 31, 2020, the Company’s right-of-use assets and operating lease liabilities were $
Future undiscounted lease payments for operating leases with initial terms of one year or more as of December 31, 2020 are as follows (dollars in thousands):
Year Ending December 31, | |||
2021 |
| $ | |
2022 | | ||
2023 | | ||
2024 | | ||
2025 | | ||
Thereafter | | ||
Total undiscounted lease payments | $ | | |
Less: imputed interest | ( | ||
Net lease liabilities | $ | |
The Company generally has options to renew its facilities leases after the initial leases expire. The renewal options range from to
107
7. GOODWILL AND INTANGIBLE ASSETS
Goodwill
The rollforward of goodwill for each of the preceding three years is included in the table below (dollars in thousands):
Years Ended December 31, | |||||||||
| 2020 |
| 2019 |
| 2018 | ||||
Balance at January 1 | $ | | $ | | $ | | |||
Acquired goodwill | | | | ||||||
Impairment | | | | ||||||
Balance at December 31 | $ | | $ | | $ | | |||
Impairment exists when a reporting unit’s carrying value of goodwill exceeds its fair value. Bank of the Sierra (the “Bank”) is the only subsidiary of the Company that meets the materiality criteria necessary to be deemed an operating segment, and because the Company exists primarily for the purpose of holding the stock of the Bank we have determined that only
Acquired Intangible Assets
Acquired intangible assets were as follows at year-end (dollars in thousands):
Years Ended December 31, | ||||||||||||
2020 | 2019 | |||||||||||
| Gross |
| Accumulated |
| Gross |
| Accumulated | |||||
Core deposit intangibles | $ | | $ | | $ | | $ | | ||||
Aggregate amortization expense was $
Estimated amortization expense for each of the next five years and thereafter (dollars in thousands):
2021 |
| $ | |
2022 | | ||
2023 | | ||
2024 | | ||
2025 | | ||
Thereafter | | ||
$ | |
108
8. OTHER ASSETS
Other assets consisted of the following (dollars in thousands):
December 31, | ||||||
| 2020 |
| 2019 | |||
Accrued interest receivable | $ | | $ | | ||
Deferred tax assets | | | ||||
Investment in qualified affordable housing projects | | | ||||
Investment in limited partnerships | | | ||||
Federal Home Loan Bank stock, at cost | | | ||||
Other | | | ||||
$ | | $ | | |||
The Company has invested in limited partnerships that operate qualified affordable housing projects to receive tax benefits in the form of tax deductions from operating losses and tax credits. The Company accounts for these investments under the cost method and management analyzes these investments annually for potential impairment. The Company had $
The Company holds certain equity investments that are not readily marketable securities and thus are classified as “other assets” on the Company’s balance sheet. These include investments in Pacific Coast Bankers Bancshares, California Economic Development Lending Initiative, and the Federal Home Loan Bank (“FHLB”). The largest of these is the Company’s $
9. DEPOSITS
Interest-bearing deposits consisted of the following (dollars in thousands):
December 31, | ||||||
| 2020 |
| 2019 | |||
Interest bearing demand deposits | $ | | $ | | ||
NOW | | | ||||
Savings | | | ||||
Money market | | | ||||
Time, under $250,000 | | | ||||
Time, $250,000 or more | | | ||||
$ | | $ | | |||
109
Aggregate annual maturities of time deposits were as follows (dollars in thousands):
Year Ending December 31, | |||
2021 |
| $ | |
2022 | | ||
2023 | | ||
2024 | | ||
2025 | | ||
Thereafter | | ||
$ | |
Interest expense recognized on interest-bearing deposits consisted of the following (dollars in thousands):
Year Ended December 31, | |||||||||
| 2020 |
| 2019 |
| 2018 | ||||
Interest bearing demand deposits | $ | | $ | | $ | | |||
NOW | | | | ||||||
Savings | | | | ||||||
Money market | | | | ||||||
Time deposits | | | | ||||||
Brokered Deposits | | | | ||||||
$ | | $ | | $ | | ||||
10. OTHER BORROWING ARRANGEMENTS
At year end, short-term borrowings consisted of the following (dollars in thousands):
2020 | 2019 | |||||||||||||||||||||||||
| Average |
| Amount |
| Average |
| Maximum |
| Weighted |
| Average |
| Amount |
| Average |
| Maximum |
| Weighted | |||||||
As of December 31: | ||||||||||||||||||||||||||
Repurchase agreements | $ | | $ | | $ | | $ | | $ | | $ | | ||||||||||||||
Short term borrowings | | | | | | | ||||||||||||||||||||
$ | | $ | | $ | | $ | | $ | | $ | | |||||||||||||||
Each FHLB advance is payable at its maturity date, with a prepayment penalty for fixed rate advances. The advances were collateralized by $
The Company had
The Company had
The Company had unsecured lines of credit with its correspondent banks which, in the aggregate, amounted to $
110
market conditions. There was $
11. INCOME TAXES
The provision for income taxes follows (dollars in thousands):
Year Ended December 31, | |||||||||
| 2020 |
| 2019 |
| 2018 | ||||
Federal: | |||||||||
Current | $ | | $ | | $ | | |||
Deferred | ( | ( | | ||||||
| | | |||||||
State: | |||||||||
Current | | | | ||||||
Deferred | ( | | | ||||||
| | | |||||||
$ | | $ | | $ | | ||||
The components of the net deferred tax asset, included in other assets, are as follows (dollars in thousands):
December 31, | ||||||
| 2020 |
| 2019 | |||
Deferred tax assets: | ||||||
Allowance for loan and lease losses | $ | | $ | | ||
Foreclosed assets | | | ||||
Deferred compensation | | | ||||
Accrued reserves | | | ||||
Non accrual loans | | | ||||
Lease liability | | | ||||
Loan fair value adjustment | | | ||||
Capital losses carried forward | | | ||||
Net operating losses | | | ||||
State income tax deduction | | | ||||
Other | | | ||||
Total deferred tax assets | | | ||||
Deferred tax liabilities: | ||||||
Deferred loan costs | ( | ( | ||||
Right-of-use asset | ( | ( | ||||
Intangibles | ( | ( | ||||
Premises and equipment | ( | ( | ||||
Net unrealized gain on securities available-for-sale | ( | ( | ||||
Other | ( | ( | ||||
Total deferred tax liabilities | ( | ( | ||||
Net deferred tax assets | $ | | $ | | ||
111
The expense for income taxes differs from amounts computed by applying the statutory Federal income tax rates to income before income taxes. The significant items comprising these differences consisted of the following (dollars in thousands):
Year Ended December 31, | |||||||||
| 2020 |
| 2019 |
| 2018 | ||||
Income tax expense at federal statutory rate | $ | | $ | | $ | | |||
Increase (decrease) resulting from: | |||||||||
State franchise tax expense, net of federal tax effect | | | | ||||||
Tax exempt municipal income | ( | ( | ( | ||||||
Affordable housing tax credits | ( | ( | ( | ||||||
Excess tax benefit of stock-based compensation | ( | ( | ( | ||||||
Other | ( | ( | ( | ||||||
| | | |||||||
Effective tax rate | |||||||||
The Company is subject to federal income tax and income tax of the state of California. Our federal income tax returns for the years ended December 31, 2017, 2018 and 2019 are open to audit by the federal authorities and our California state tax returns for the years ended December 31, 2016, 2017, 2018 and 2019 are open to audit by the state authorities.
The Company has net operating loss carry forwards of approximately $
There were
12. SUBORDINATED DEBENTURES
Sierra Statutory Trust II (“Trust II”), Sierra Capital Trust III (“Trust III”), and Coast Bancorp Statutory Trust II (“Trust IV”), (collectively, the “Trusts”) exist solely for the purpose of issuing trust preferred securities fully and unconditionally guaranteed by the Company. For financial reporting purposes, the Trusts are not consolidated and the Floating Rate Junior Subordinated Deferrable Interest Debentures (the “Subordinated Debentures”) held by the Trusts and issued and guaranteed by the Company are reflected in the Company’s consolidated balance sheet in accordance with provisions of ASC Topic 810. Under applicable regulatory guidance, the amount of trust preferred securities that is eligible as Tier 1 capital is limited to twenty-five percent of the Company’s Tier 1 capital on a pro forma basis. At December 31, 2020, all $
During the first quarter of 2004, Sierra Statutory Trust II issued
112
2034, bear a current interest rate of
Those Subordinated Debentures are currently redeemable by the Company, subject to receipt by the Company of prior approval from the Federal Reserve Bank, on any March 17th, June 17th, September 17th, or December 17th. The redemption price is par plus accrued and unpaid interest, except in the case of redemption under a special event which is defined in the debenture.
The TRUPS II are subject to mandatory redemption to the extent of any early redemption of the related Subordinated Debentures and upon maturity of the Subordinated Debentures on
Trust II has the option to defer payment of the distributions for a period of up to
During the second quarter of 2006, Sierra Capital Trust III issued
Those Subordinated Debentures are redeemable by the Company, subject to receipt by the Company of prior approval from the Federal Reserve Bank, on any March 23rd, June 23rd, September 23rd, or December 23rd. The redemption price is par plus accrued and unpaid interest, except in the case of redemption under a special event which is defined in the debenture. The TRUPS III are subject to mandatory redemption to the extent of any early redemption of the related Subordinated Debentures and upon maturity of the Subordinated Debentures on September 23, 2036.
Trust III has the option to defer payment of the distributions for a period of up to
During the third quarter of 2016, the Company acquired Coast Bancorp Statutory Trust II, which had issued
Those Subordinated Debentures are currently redeemable by the Company, subject to receipt by the Company of prior approval from the Federal Reserve Bank, on any March 15th, June 15th, September 15th, or December 15th. The
113
redemption price is par plus accrued and unpaid interest, except in the case of redemption under a special event which is defined in the debenture.
The TRUPS IV are subject to mandatory redemption to the extent of any early redemption of the related Subordinated Debentures and upon maturity of the Subordinated Debentures on December 15, 2037.
Coast Bancorp Statutory Trust II has the option to defer payment of the distributions for a period of up to
13. COMMITMENTS AND CONTINGENCIES
Letter of Credit
The Company holds two letters of credit with the Federal Home Loan Bank of San Francisco totaling $
Federal Reserve Requirements
Banks are normally required to maintain reserves with the Federal Reserve Bank equal to a specified percentage of their reservable deposits less vault cash. The Federal Reserve Bank has temporarily eliminated the reserve requirement in response to the COVID-19 pandemic, in an effort to free up available cash for lending purposes. There were
Financial Instruments with Off-Balance-Sheet Risk
The Company is a party to financial instruments with off-balance-sheet risk in the normal course of business. These financial instruments consist of commitments to extend credit and standby letters of credit. These instruments involve, to varying degrees, elements of credit and interest rate risk in excess of the amount recognized in the consolidated balance sheet.
The Company’s exposure to credit loss in the event of nonperformance by the other party for commitments to extend credit and letters of credit is represented by the contractual amount of those instruments. The Company uses the same credit policies in making commitments and letters of credit as it does for loans included on the balance sheet.
The following financial instruments represent off-balance-sheet credit risk (dollars in thousands):
December 31, | ||||||
| 2020 |
| 2019 | |||
Fixed-rate commitments to extend credit | $ | | $ | | ||
Variable-rate commitments to extend credit | $ | | $ | | ||
Standby letters of credit | $ | | $ | | ||
114
Commitments to extend credit consist primarily of the unused or unfunded portions of the following: home equity lines of credit; commercial real estate construction loans, where disbursements are made over the course of construction; commercial revolving lines of credit; mortgage warehouse lines of credit; unsecured personal lines of credit; and formalized (disclosed) deposit account overdraft lines. Commitments generally have fixed expiration dates or other termination clauses and may require payment of a fee. Since many of the commitments are expected to expire without being drawn upon, the total commitment amounts do not necessarily represent future cash requirements. Commitments to extend credit are made at both fixed and variable rates of interest as stated in the table above. Standby letters of credit are generally unsecured and are issued by the Company to guarantee the performance of a customer to a third party, while commercial letters of credit represent the Company’s commitment to pay a third party on behalf of a customer upon fulfillment of contractual requirements. The credit risk involved in issuing letters of credit is essentially the same as that involved in extending loans to customers.
Concentration in Real Estate Lending
At December 31, 2020, in management’s judgment the Company had, a concentration of loans secured by real estate. At that date, approximately
Concentration by Geographic Location
The Company extends commercial, real estate mortgage, real estate construction and consumer loans to customers primarily in the South Central San Joaquin Valley of California, specifically Tulare, Fresno, Kern, Kings and Madera counties; the Southern California corridor between Santa Paula and Santa Clarita in the counties of Ventura and Los Angeles; and the Coastal counties of San Luis Obispo, Ventura and Santa Barbara. The ability of a substantial portion of the Company’s customers to honor their contracts is dependent on the economy in these areas. Although the Company’s loan portfolio is diversified, there is a relationship in those regions between the local agricultural economy and the economic performance of loans made to non-agricultural customers.
Contingencies
The Company is subject to legal proceedings and claims which arise in the ordinary course of business. In the opinion of management, the amount of ultimate liability with respect to such actions, of which the Company is aware, will not materially affect the consolidated financial position or results of operations of the Company.
14. SHAREHOLDERS’ EQUITY
Share Repurchase Plan
At December 31, 2020, the Company had a stock repurchase plan which has no expiration date. During the year ended December 31, 2020, the Company repurchased
115
Earnings Per Share
A reconciliation of the numerators and denominators of the basic and diluted earnings per share computations is as follows:
For the Years Ended December 31, | |||||||||
| 2020 |
| 2019 |
| 2018 | ||||
Basic Earnings Per Share | |||||||||
Net income (dollars in thousands) | $ | | $ | | $ | | |||
Weighted average shares outstanding | | | | ||||||
Basic earnings per share | $ | | $ | | $ | | |||
Diluted Earnings Per Share | |||||||||
Net income (dollars in thousands) | $ | | $ | | $ | | |||
Weighted average shares outstanding | | | | ||||||
Effect of dilutive stock options | | | | ||||||
Weighted average shares outstanding | | | | ||||||
Diluted earnings per share | $ | | $ | | $ | | |||
Stock options for
Stock Options
On March 16, 2017 the Company’s Board of Directors approved and adopted the 2017 Stock Incentive Plan (the “2017 Plan”), which became effective May 24, 2017 pursuant to the approval of the Company’s shareholders. The 2017 Plan replaced the Company’s 2007 Stock Incentive Plan (the “2007 Plan”), which expired by its own terms on March 15, 2017. Options to purchase
All options granted under the and 2007 Plans have been or will be granted at an exercise price of not less than
116
A summary of the Company’s stock option activity follows (shares in thousands, except exercise price):
2020 | 2019 | 2018 | ||||||||||||||||
| Shares |
| Weighted Average |
| Aggregate |
| Shares |
| Weighted Average |
| Shares |
| Weighted Average | |||||
Outstanding, | ||||||||||||||||||
beginning of year | | $ | | | $ | | | $ | | |||||||||
Exercised | ( | $ | | ( | $ | | ( | $ | | |||||||||
Granted | | $ | | | $ | | | $ | | |||||||||
Canceled | ( | $ | | ( | $ | | ( | $ | | |||||||||
Expired | ( | $ | | — | $ | — | — | $ | — | |||||||||
Outstanding, end of year | | $ | | $ | | | $ | | | $ | | |||||||
Exercisable, end of year (2) | | $ | | $ | | | $ | | | $ | | |||||||
| (1) | The aggregate intrinsic value of stock option in the table above represents the total pre-tax intrinsic value (the amount by which the current market value of the underlying stock exceeds the exercise price of the option) that would have been received by the option holders had all option holders exercised their options on December 31, 2020. This amount changes based on changes in the market value of the Company’s stock. |
| (2) | The weighted average remaining contractual life of stock options outstanding and exercisable on December 31, 2020 was |
Information related to stock options during each year follows (dollars in thousands, except per share data):
| 2020 |
| 2019 |
| 2018 | ||||
Weighted-average grant-date fair value per share | $ | | $ | | $ | | |||
Total intrinsic value of stock options exercised | $ | | $ | | $ | | |||
Total fair value of stock options vested | $ | | $ | | $ | | |||
$
The Company is using the Black-Scholes model to value stock options. In accordance with U.S. GAAP, charges of $
Unamortized compensation expense associated with unvested stock options outstanding at December 31, 2020 was $
Restricted Stock Grants
The Company’s restricted stock awards are time-vested, non-transferrable shares of common stock and are available to be granted to the Company’s employees and directors. The vesting period of restricted stock awards is determined at the time the awards are issued, and different awards may have different vesting terms; provided, however, that no installment of any restricted stock award shall become vested less than one year from the grant date. Restricted stock awards are valued utilizing the fair value of the Company’s stock at the grant date. During the year ending 2020,
117
A summary of the Company’s nonvested shares for the year follows (shares in thousands, except grant date fair value):
Nonvested Shares | Shares | Weighted Average Grant-Date Fair Value | |||
Nonvested at January 1, 2020 | — | $ | — | ||
Granted | | | |||
Vested | — | — | |||
Forfeited | — | — | |||
Nonvested at December 31, 2020 | | $ | |
15. REGULATORY MATTERS
The Company and the Bank are subject to regulatory capital requirements administered by the Board of Governors of the Federal Reserve System and the FDIC. Capital adequacy guidelines and, additionally for banks, prompt corrective action regulations, involve quantitative measures of assets, liabilities, and certain off balance sheet items calculated under regulatory accounting practices. Capital amounts and classifications are also subject to qualitative judgments by regulators. Failure to meet capital requirements can initiate regulatory action.
The net unrealized gain or loss on available for sale securities is not included in computing regulatory capital. Management believes as of December 31, 2020, the Company and Bank meet all capital adequacy requirements to which they are subject.
Prompt corrective action regulations provide five classifications: well capitalized, adequately capitalized, undercapitalized , significantly undercapitalized , and critically undercapitalized, although these terms are not used to represent overall financial condition. If adequately capitalized, regulatory approval is required to accept brokered deposits. If undercapitalized, capital distributions are limited, as is asset growth and expansion, and capital restoration plans are required. At year-end December 31, 2020 and 2019, notification from the FDIC categorized the Bank as well capitalized under the regulatory framework for prompt corrective action. There are no conditions or events since that notification that management believes have changed the Bank's categorization.
In 2019, the federal banking agencies jointly issued a final rule that provides for an optional, simplified measure of capital adequacy, the community bank leverage ratio framework (CBLR framework), for qualifying community banking organizations, consistent with Section 201 of the Economic Growth, Regulatory Relief, and Consumer Protection Act. The final rule became effective on January 1, 2020 and was elected by the Bank at that time. In April 2020, the federal banking agencies issued an interim final rule that makes temporary changes to the CBLR framework, pursuant to section 4012 of the Coronavirus Aid, Relief, and Economic Security (CARES) Act, and a second interim final rule that provides a graduated increase in the community bank leverage ratio requirement after the expiration of the temporary changes implemented pursuant to section 4012 of the CARES Act.
The community bank leverage ratio removes the requirement for qualifying banking organizations to calculate and report risk-based capital but rather only requires a Tier 1 to average assets (leverage) ratio. Qualifying banking
118
organizations that elect to use the community bank leverage ratio framework and that maintain a leverage ratio of greater than required minimums will be considered to have satisfied the generally applicable risk based and leverage capital requirements in the agencies' capital rules (generally applicable rule) and, if applicable, will be considered to have met the well capitalized ratio requirements for purposes of section 38 of the Federal Deposit Insurance Act. Under the interim final rules the community bank leverage ratio minimum requirement is 8% as of December 31, 2020, 8.5% for calendar year 2021, and 9% for calendar year 2022 and beyond. The interim rule allows for a two-quarter grace period to correct a ratio that falls below the required amount, provided that the bank maintains a leverage ratio of
Under the final rule, an eligible banking organization can opt out of the CBLR framework and revert back to the risk-weighting framework without restriction. As of December 31, 2020, both the Company and Bank were qualifying community banking organizations as defined by the federal banking agencies and elected to measure capital adequacy under the CBLR framework.
Actual and required capital amounts (in thousands) and ratios are presented below at year end.
Actual | To Be Well Capitalized Under Prompt Corrective Action Regulations (CBLR Framework) | |||||||||
2020 |
| Capital Amount |
| Ratio |
| Capital Amount |
| Ratio | ||
Tier 1 (Core) Capital to average total assets | ||||||||||
Sierra Bancorp and subsidiary | $ | | $ | | ||||||
Bank of the Sierra | $ | | $ | | ||||||
Actual | Required for Capital Adequacy Purposes | To Be Well Capitalized Under Prompt Corrective Action Regulations | |||||||||||||
2019 |
| Capital Amount |
| Ratio |
| Capital Amount |
| Ratio | Capital Amount |
| Ratio | ||||
Common Equity Tier 1 Capital Ratio | |||||||||||||||
Sierra Bancorp and subsidiary | $ | | $ | | $ | | |||||||||
Bank of the Sierra | | | | ||||||||||||
Tier 1 Risk-Based Capital Ratio | |||||||||||||||
Sierra Bancorp and subsidiary | $ | | $ | | $ | | |||||||||
Bank of the Sierra | | | | ||||||||||||
Total Risk-Based Capital Ratio | |||||||||||||||
Sierra Bancorp and subsidiary | $ | | $ | | $ | | |||||||||
Bank of the Sierra | | | | ||||||||||||
Tier 1 (Core) Capital to average total assets | |||||||||||||||
Sierra Bancorp and subsidiary | $ | | $ | | $ | | |||||||||
Bank of the Sierra | | | | ||||||||||||
119
Dividend Restrictions
The Company’s ability to pay cash dividends is dependent on dividends paid to it by the Bank, and is also limited by state corporation law. California law allows a California corporation to pay dividends if the company’s retained earnings equal at least the amount of the proposed dividend plus any preferred dividend arrears amount.
Dividends from the Bank to the Company are restricted under California law to the lesser of the Bank’s retained earnings or the Bank’s net income for the latest three fiscal years, less dividends previously declared during that period, or, with the approval of the Department of Financial Protection and Innovation, to the greater of the retained earnings of the Bank, the net income of the Bank for its last fiscal year, or the net income of the Bank for its current fiscal year. As of December 31, 2020, the maximum amount available for dividend distribution under this restriction was approximately $
16. BENEFIT PLANS
Salary Continuation Agreements, Directors’ Retirement and Officer Supplemental Life Insurance Plans
The Company has entered into salary continuation agreements with its executive officers, and has established retirement plans for qualifying members of the Board of Directors. The plans provide for annual benefits for up to
In connection with these plans the Company has purchased, or acquired through merger, single premium life insurance policies with cash surrender values totaling $
Officer and Director Deferred Compensation Plan
The Company has established a deferred compensation plan for certain members of the management group and a deferred fee plan for directors for the purpose of providing the opportunity for participants to defer compensation. The Company bears the costs for the plan’s administration and the interest earned on participant deferrals. The related administrative expense was not material for the years ended December 31, 2020, 2019 and 2018. In connection with this plan, life insurance policies with cash surrender values totaling $
401(k) Savings Plan
The 401(k) savings plan (the “Plan”) allows participants to defer, on a pre-tax basis, up to
120
make a discretionary contribution to match a specified percentage of the first
17. NONINTEREST INCOME
The major grouping of noninterest revenue on the consolidated income statements includes several specific items: service charges on deposit accounts, gains on the sale of loans, credit card fees, check card fees, the net gain (loss) on sales and calls of investment securities available for sale, and the net increase (decrease) in the cash surrender value of life insurance.
Noninterest income also includes one general category of “other income” of which the following are major components (dollars in thousands):
Year Ended December 31, | |||||||||
| 2020 |
| 2019 |
| 2018 | ||||
Included in other income: | |||||||||
Amortization of limited partnerships | $ | ( | $ | ( | $ | ( | |||
Dividends on equity investments | | | | ||||||
Unrealized gains recognized on equity investments | | | | ||||||
Other | | | | ||||||
Total other noninterest income | $ | | $ | | $ | | |||
18. OTHER NONINTEREST EXPENSE
Other noninterest expense consisted of the following (dollars in thousands):
Year Ended December 31, | |||||||||
| 2020 |
| 2019 |
| 2018 | ||||
Legal, audit and professional | $ | | $ | | $ | | |||
Data processing | | | | ||||||
Advertising and promotional | | | | ||||||
Deposit services | | | | ||||||
Stationery and supplies | | | | ||||||
Telephone and data communication | | | | ||||||
Loan and credit card processing | | | | ||||||
Foreclosed assets expense (income), net | | | ( | ||||||
Postage | | | | ||||||
Other | | | | ||||||
Assessments | | | | ||||||
Total other noninterest expense | $ | | $ | | $ | | |||
19. RELATED PARTY TRANSACTIONS
During the normal course of business, the Bank enters into loans with related parties, including executive officers and directors. These loans are made with substantially the same terms, including rates and collateral, as loans to
121
unrelated parties. The following is a summary of the aggregate activity involving related party borrowers (dollars in thousands):
Year Ended December 31, | |||||||||
| 2020 |
| 2019 |
| 2018 | ||||
Balance, beginning of year | $ | | $ | | $ | | |||
Disbursements | | | | ||||||
Amounts repaid | ( | ( | ( | ||||||
Balance, end of year | $ | | $ | | $ | | |||
Undisbursed commitments to related parties | $ | | $ | | $ | | |||
Deposits from related parties held by the Bank at December 31, 2020 and 2019 amounted to $
20. FAIR VALUE
Fair value is defined by U.S. GAAP as the exchange price that would be received for an asset or paid to transfer a liability (an exit price) in the principal or most advantageous market for the asset or liability in an orderly transaction between market participants on the measurement date. U.S. GAAP also establishes a fair value hierarchy which requires an entity to maximize the use of observable inputs and minimize the use of unobservable inputs when measuring fair value. The standard describes three levels of inputs that may be used to measure fair value:
| ● | Level 1: Quoted prices (unadjusted) for identical assets or liabilities in active markets that the entity has the ability to access as of the measurement date. |
| ● | Level 2: Significant observable inputs other than Level 1 prices, such as quoted prices for similar assets or liabilities, quoted prices in markets that are not active, and other inputs that are observable or can be corroborated by observable market data. |
| ● | Level 3: Significant unobservable inputs that reflect a company’s own assumptions about the factors that market participants would use in pricing an asset or liability. |
The Company used the following methods and significant assumptions to estimate fair values for each category of financial asset noted below:
Securities: The fair values of securities available for sale are determined by obtaining quoted prices on nationally recognized securities exchanges or by matrix pricing, which is a mathematical technique used widely in the industry to value debt securities by relying on their relationship to other benchmark quoted securities.
Collateral-dependent impaired loans: A specific loss allowance is created for collateral dependent impaired loans, representing the difference between the face value of the loan and the current appraised value of its associated collateral, less estimated disposition costs.
Foreclosed assets: Repossessed real estate (OREO) and other assets are carried at the lower of cost or fair value. Fair value is the appraised value less expected selling costs for OREO and some other assets such as mobile homes, and for all other assets fair value is represented by the estimated sales proceeds as determined using reasonably available sources. Foreclosed assets for which appraisals can be feasibly obtained are periodically measured for impairment using updated appraisals. Fair values for other foreclosed assets are
122
adjusted as necessary, subsequent to a periodic re-evaluation of expected cash flows and the timing of resolution. If impairment is determined to exist, the book value of a foreclosed asset is immediately written down to its estimated impaired value through the income statement, thus the carrying amount is equal to the fair value and there is no valuation allowance.
Assets and liabilities measured at fair value on a recurring basis are summarized below (dollars in thousands):
Fair Value Measurements at December 31, 2020, using | |||||||||||||||
| Quoted Prices in |
| Significant |
| Significant |
| Total |
| Realized | ||||||
Securities: | |||||||||||||||
U.S. government agencies | $ | | $ | | $ | | $ | | $ | | |||||
Mortgage-backed securities | | | | | | ||||||||||
State and political subdivisions | | | | | | ||||||||||
Total available-for-sale securities | $ | | $ | | $ | | $ | | $ | | |||||
Fair Value Measurements at December 31, 2019, using | |||||||||||||||
| Quoted Prices in |
| Significant |
| Significant |
| Total |
| Realized | ||||||
Securities: | |||||||||||||||
U.S. government agencies | $ | | $ | | $ | | $ | | $ | | |||||
Mortgage-backed securities | | | | | | ||||||||||
State and political subdivisions | | | | | | ||||||||||
Total available-for-sale securities | $ | | $ | | $ | | $ | | $ | | |||||
Assets and liabilities measured at fair market value on a non-recurring basis are summarized below (dollars in thousands):
Year Ended December 31, 2020 | ||||||||||||
| Quoted Prices in |
| Significant |
| Significant |
| Total | |||||
Collateral dependent impaired loans | $ | | $ | | $ | | $ | | ||||
Foreclosed assets | $ | | $ | | $ | | $ | | ||||
Year Ended December 31, 2019 | ||||||||||||
| Quoted Prices in |
| Significant |
| Significant |
| Total | |||||
Collateral dependent impaired loans | $ | | $ | | $ | | $ | | ||||
Foreclosed assets | $ | | $ | | $ | | $ | | ||||
21. DISCLOSURES ABOUT FAIR VALUE OF FINANCIAL INSTRUMENTS
Disclosures include estimated fair values for financial instruments for which it is practicable to estimate fair value. These estimates are made as of the respective balance sheet dates based on relevant market data and information
123
about the financial instruments. These estimates do not reflect any premium or discount that could result from offering the Company’s entire holdings of a particular financial instrument for sale at one time, nor do they attempt to estimate the value of anticipated future business related to the instruments. In addition, the tax ramifications related to the realization of unrealized gains and losses can have a significant effect on fair value estimates and have not been considered in any of these estimates.
Because no market exists for a significant portion of the Company’s financial instruments, fair value estimates are based on judgments regarding current economic conditions, risk characteristics of various financial instruments and other factors. These estimates are subjective in nature and involve uncertainties and matters of significant judgment and therefore cannot be determined with precision. Changes in assumptions could significantly affect the fair values presented. The following methods and assumptions were used by the Company to estimate the fair value of its financial instruments at December 31, 2020 and 2019:
Cash and cash equivalents, and fed funds sold: For cash and cash equivalents and fed funds sold, the carrying amount is estimated to be fair value.
Securities: The fair values of investment securities are determined by obtaining quoted prices on nationally recognized securities exchanges or by matrix pricing, which is a mathematical technique used widely in the industry to value debt securities by relying on their relationship to other benchmark quoted securities when quoted prices for specific securities are not readily available.
Loans and leases: Fair values of loans, excluding loans held for sale, are based on the exit price notion set forth by ASU 2016-01 effective January 1, 2018 and estimated using discounted cash flow analyses. The estimation of fair values of loans results in a Level 3 classification as it requires various assumptions and considerable judgement to incorporate factors relevant when selling loans to market participants, such as funding costs, return requirements of likely buyers and performance expectations of the loans given the current market environment and quality of loans.
Loans held for sale: Since loans designated by the Company as held-for-sale are typically sold shortly after making the decision to sell them, realized gains or losses are usually recognized within the same period and fluctuations in fair values are thus not relevant for reporting purposes. If held-for-sale loans stay on our books for an extended period of time, the fair value of those loans is determined using quoted secondary-market prices.
Deposits: Fair values for non-maturity deposits are equal to the amount payable on demand at the reporting date, which is the carrying amount. Fair values for fixed-rate certificates of deposit are estimated using a cash flow analysis, discounted at interest rates being offered at each reporting date by the Bank for certificates with similar remaining maturities.
Short-term borrowings: The carrying amounts approximate fair values for federal funds purchased, overnight FHLB advances, borrowings under repurchase agreements, and other short-term borrowings maturing within ninety days of the reporting dates. Fair values of other short-term borrowings are estimated by discounting projected cash flows at the Company’s current incremental borrowing rates for similar types of borrowing arrangements.
Long-term borrowings: The fair values of the Company’s long-term borrowings are estimated using projected cash flows discounted at the Company’s current incremental borrowing rates for similar types of borrowing arrangements.
Subordinated debentures: The fair values of subordinated debentures are determined based on the current market value for like instruments of a similar maturity and structure.
124
Carrying amount and estimated fair values of financial instruments were as follows (dollars in thousands):
Year Ended December 31, 2020 | |||||||||||||||
Estimated Fair Value | |||||||||||||||
| Carrying |
| Quoted Prices in |
| Significant |
| Significant |
| Total | ||||||
Financial Assets: | |||||||||||||||
Cash and cash equivalents | $ | | $ | | $ | | $ | | $ | | |||||
Securities available for sale | | | | | | ||||||||||
Loans and leases held for investment | | | | | | ||||||||||
Collateral dependent impaired loans | | | | | | ||||||||||
| |||||||||||||||
Financial Liabilities: | |||||||||||||||
Deposits: | |||||||||||||||
Noninterest bearing | $ | | $ | | $ | | $ | | $ | | |||||
Interest bearing | | | | | | ||||||||||
Fed funds purchased and repurchase agreements | | | | | | ||||||||||
Short-term borrowings | | | | | | ||||||||||
Subordinated debentures | | | | | | ||||||||||
| Notional | ||
Off-balance-sheet financial instruments: | |||
Commitments to extend credit | $ | | |
Standby letters of credit | | ||
125
Carrying amount and estimated fair values of financial instruments were as follows (dollars in thousands):
Year Ended December 31, 2019 | |||||||||||||||
Estimated Fair Value | |||||||||||||||
| Carrying |
| Quoted Prices in |
| Significant |
| Significant |
| Total | ||||||
Financial Assets: | |||||||||||||||
Cash and cash equivalents | $ | | $ | | $ | | $ | | $ | | |||||
Securities available for sale | | | | | | ||||||||||
Loans and leases held for investment | | | | | | ||||||||||
Collateral dependent impaired loans | | | | | | ||||||||||
| |||||||||||||||
Financial Liabilities: | |||||||||||||||
Deposits: | |||||||||||||||
Noninterest bearing | $ | | $ | | $ | | $ | | $ | | |||||
Interest bearing | | | | | | ||||||||||
Fed funds purchased and repurchase agreements | | | | | | ||||||||||
Short-term borrowings | | | | | | ||||||||||
Subordinated debentures | | | | | | ||||||||||
| Notional | ||
Off-balance-sheet financial instruments: | |||
Commitments to extend credit | $ | | |
Standby letters of credit | | ||
22. QUALIFIED AFFORDABLE HOUSING PROJECT INVESTMENTS
The Company invests in qualified affordable housing projects. At December 31, 2020 and 2019, the balance of the investment for qualified affordable housing projects totaled $
During the years ended December 31, 2020, 2019 and 2018, the Company recognized amortization expense on these investments of $
Additionally, during the years ended December 31, 2020 and 2019, the Company recognized tax credits and other benefits from its investment in affordable housing tax credits of $
126
23. REVENUE FROM CONTRACTS WITH CUSTOMERS
All of the Company’s revenue from contracts with customers in the scope of ASC 606 is recognized within Noninterest Income. The following table presents the Company’s sources of Noninterest Income for the twelve months ended December 31, 2020 and 2019. Items outside the scope of ASC 606 are noted as such.
Year Ended December 31, | ||||||
| 2020 |
| 2019 | |||
Noninterest income | ||||||
Service charges on deposits | ||||||
Returned item and overdraft fees | $ | | $ | | ||
Other service charges on deposits | | | ||||
Debit card interchange income | | | ||||
Loss on limited partnerships(1) | ( | ( | ||||
Dividends on equity investments(1) | | | ||||
Unrealized gains recognized on equity investments(1) | | | ||||
Net gains (losses) on sale of securities(1) | | ( | ||||
Other(1) | | | ||||
Total noninterest income | $ | | $ | | ||
Noninterest expense | ||||||
Salaries and employee benefits(1) | $ | | $ | | ||
Occupancy expense(1) | | | ||||
Gains on sale or OREO | ( | ( | ||||
Other(1) | | | ||||
Total noninterest expense | $ | | $ | | ||
| (1) | Not within the scope of ASC 606. Revenue streams are not related to contracts with customers and are accounted for on an accrual basis under other provisions of GAAP. |
127
24. PARENT ONLY CONDENSED FINANCIAL STATEMENTS
BALANCE SHEETS
Years Ended December 31, 2020 and 2019
(dollars in thousands)
| 2020 |
| 2019 | |||
ASSETS | ||||||
Cash and due from banks | $ | | $ | | ||
Investments in bank subsidiary | | | ||||
Investment in trust subsidiaries | | | ||||
Other assets | | | ||||
| $ | | $ | | ||
| ||||||
LIABILITIES AND SHAREHOLDERS' EQUITY | ||||||
Liabilities: | ||||||
Other liabilities | $ | | $ | | ||
Subordinated debentures | | | ||||
Total liabilities | | | ||||
Shareholders' equity: | ||||||
Common stock | | | ||||
Retained earnings | | | ||||
Accumulated other comprehensive gain, net of taxes | | | ||||
Total shareholders' equity | | | ||||
| $ | | $ | | ||
STATEMENTS OF INCOME
Years Ended December 31, 2020, 2019 and 2018
(dollars in thousands)
| 2020 |
| 2019 |
| 2018 | ||||
Income: | |||||||||
Dividend from subsidiary | $ | | $ | | $ | | |||
Gain on sale of securities | | | | ||||||
Other operating income | | | | ||||||
Total income | | | | ||||||
Expense | |||||||||
Salaries and employee benefits | | | | ||||||
Other expenses | | | | ||||||
Total expenses | | | | ||||||
Income before income taxes | | | | ||||||
Income tax benefit | ( | ( | ( | ||||||
Income before equity in undistributed income of subsidiary | | | | ||||||
Equity in undistributed income of subsidiary | | | | ||||||
Net income | $ | | $ | | $ | | |||
128
STATEMENTS OF CASH FLOWS
Years Ended December 31, 2020, 2019 and 2018
(dollars in thousands)
| 2020 |
| 2019 |
| 2018 | ||||
Cash flows from operating activities: | |||||||||
Net income | $ | | $ | | $ | | |||
Adjustments to reconcile net income to net cash provided by operating activities: | |||||||||
Undistributed net income of subsidiary | ( | ( | ( | ||||||
Decrease in other assets | | | | ||||||
(Decrease) increase in other liabilities | ( | ( | | ||||||
Net cash provided by operating activities | | | | ||||||
| |||||||||
Cash flows from investing activities: | |||||||||
Cash paid in acquisitions, net | | | ( | ||||||
Net cash used by investing activities | | | ( | ||||||
| |||||||||
Cash flows from financing activities: | |||||||||
Stock options exercised | | | | ||||||
Repurchase of common stock | ( | ( | | ||||||
Dividends paid | ( | ( | ( | ||||||
Net cash used in financing activities | ( | ( | ( | ||||||
Net decrease (increase) in cash and cash equivalents | | | ( | ||||||
Cash and cash equivalents, beginning of year | | | | ||||||
Cash and cash equivalents, end of year | $ | | $ | | $ | | |||
25. CONDENSED QUARTERLY RESULTS OF OPERATIONS (UNAUDITED)
The following table sets forth the Company’s unaudited results of operations for the four quarters of 2020 and 2019. In management’s opinion, the results of operations reflect all adjustments (which include only recurring adjustments) necessary to present fairly the condensed results for such periods (dollars in thousands, except per share data).
2020 Quarter Ended | ||||||||||||
| December 31, |
| September 30, |
| June 30, |
| March 31, | |||||
Interest income | $ | | $ | | $ | | $ | | ||||
Interest expense | | | | | ||||||||
Net interest income | | | | | ||||||||
Provision for loan and lease losses | | | | | ||||||||
Noninterest income | | | | | ||||||||
Noninterest expense | | | | | ||||||||
Net income before taxes | | | | | ||||||||
Provision for taxes | | | | | ||||||||
Net income | $ | | $ | | $ | | $ | | ||||
| ||||||||||||
Diluted earnings per share | $ | | $ | | $ | | $ | | ||||
Cash dividend per share | $ | | $ | | $ | | $ | | ||||
129
2019 Quarter Ended | ||||||||||||
| December 31, |
| September 30, |
| June 30, |
| March 31, | |||||
Interest income | $ | | $ | | $ | | $ | | ||||
Interest expense | | | | | ||||||||
Net interest income | | | | | ||||||||
Provision for loan and lease losses | | | | | ||||||||
Noninterest income | | | | | ||||||||
Noninterest expense | | | | | ||||||||
Net income before taxes | | | | | ||||||||
Provision for taxes | | | | | ||||||||
Net income | $ | | $ | | $ | | $ | | ||||
| ||||||||||||
Diluted earnings per share | $ | | $ | | $ | | $ | | ||||
Cash dividend per share | $ | | $ | | $ | | $ | | ||||
130
ITEM 9. CHANGES IN AND DISAGREEMENTS WITH ACCOUNTANTS ON ACCOUNTING AND FINANCIAL DISCLOSURE
Not applicable.
ITEM 9A. CONTROLS AND PROCEDURES
Evaluation of Disclosure Controls and Procedures
The Company’s Chief Executive Officer and its Chief Financial Officer, after evaluating the effectiveness of the Company’s disclosure controls and procedures (as defined in Exchange Act Rules 13(a)–15(e) as of the end of the period covered by this report (the “Evaluation Date”) have concluded that as of the Evaluation Date, the Company’s disclosure controls and procedures were adequate and effective to ensure that material information relating to the Company and its consolidated subsidiaries would be made known to them by others within those entities, particularly during the period in which this annual report was being prepared.
Disclosure controls and procedures are designed to ensure that information required to be disclosed by us in the reports that we file or submit under the Exchange Act is accumulated and communicated to our Management, including our Chief Executive Officer and Chief Financial Officer, as appropriate to allow timely decisions regarding required disclosure, and that such information is recorded, processed, summarized, and reported within the time periods specified by the SEC.
Management’s Report on Internal Control over Financial Reporting
Management of the Company is responsible for the preparation, integrity, and reliability of the consolidated financial statements and related financial information contained in this annual report. The consolidated financial statements of the Company have been prepared in accordance with accounting principles generally accepted in the United States of America and, as such, include some amounts that are based on judgments and estimates of Management.
Management has established and is responsible for maintaining effective internal control over financial reporting. The Company’s internal control over financial reporting includes those policies and procedures that:
| (i) | pertain to the maintenance of records that, in reasonable detail, accurately and fairly reflect the transactions and dispositions of the assets of the Company; |
| (ii) | provide reasonable assurance that transactions are recorded as necessary to permit preparation of financial statements in accordance with generally accepted accounting principles, and that receipts and expenditures of the Company are being made only in accordance with authorizations of Management and directors of the Company; and |
| (iii) | provide reasonable assurance regarding prevention or timely detection of unauthorized acquisition, use or disposition of the Company’s assets that could have a material effect on the financial statements. |
There are inherent limitations in the effectiveness of any internal control, including the possibility of human error and the circumvention or overriding of controls. Accordingly, even effective internal control can provide only reasonable assurance with respect to financial statement preparation. Further, because of changes in conditions, the effectiveness of internal control may vary over time. The system contains monitoring mechanisms, and actions are taken to correct deficiencies identified.
Management assessed the effectiveness of the Company’s internal control over financial reporting as of December 31, 2020. This assessment was based on criteria established in Internal Control – Integrated Framework (2013) issued by the Committee of Sponsoring Organizations of the Treadway Commission. This assessment included controls over the preparation of regulatory financial statements in accordance with the Federal Financial Institutions Examination Council’s Instructions for Preparation of Consolidated Reports of Condition and Income, and in accordance with the Board of
131
Governors of the Federal Reserve System’s Instructions for Preparation of Financial Statements for Bank Holding Companies (Consolidated and Parent Company Only). Based on this assessment, Management believes that the Company maintained effective internal control over financial reporting as of December 31, 2020.
Management is responsible for compliance with the federal and state laws and regulations concerning dividend restrictions and federal laws and regulations concerning loans to insiders designated by the FDIC as safety and soundness laws and regulations. Management assessed compliance by the Company’s insured financial institution, Bank of the Sierra, with the designated laws and regulations relating to safety and soundness. Based on this assessment, Management believes that Bank of the Sierra complied, in all significant respects, with the designated laws and regulations related to safety and soundness for the year ended December 31, 2020.
Our assessment of the effectiveness of the Company’s internal control over financial reporting as of December 31, 2020 has been audited by Eide Bailly, an independent registered public accounting firm, as stated in their report appearing above in Item 8, Financial Statements and Supplementary Data.
Changes in Internal Control
There were no significant changes in the Company’s internal control over financial reporting or in other factors in the fourth quarter of 2020 that have materially affected, or are reasonably likely to materially affect, the Company’s internal control over financial reporting.
ITEM 9B. OTHER INFORMATION.
None.
132
PART III
ITEM 10. DIRECTORS, EXECUTIVE OFFICERS AND CORPORATE GOVERNANCE
The information required to be furnished pursuant to this item with respect to Directors and Executive Officers of the Company will be set forth under the caption “Election of Directors” in the Company’s proxy statement for the 2021 Annual Meeting of Shareholders (the “Proxy Statement”), which the Company will file with the SEC within 120 days after the close of the Company’s 2020 fiscal year in accordance with SEC Regulation 14A under the Securities Exchange Act of 1934. Such information is hereby incorporated by reference.
The information required to be furnished pursuant to this item with respect to compliance with Section 16(a) of the Exchange Act will be set forth under the caption “Section 16(a) Beneficial Ownership Reporting Compliance” in the Proxy Statement, and is incorporated herein by reference.
The information required to be furnished pursuant to this item with respect to the Company’s Code of Ethics and corporate governance matters will be set forth under the caption “Corporate Governance” in the Proxy Statement, and is incorporated herein by reference.
ITEM 11. EXECUTIVE COMPENSATION
The information required to be furnished pursuant to this item will be set forth under the captions “Executive Officer and Director Compensation” and “Compensation Discussion and Analysis” in the Proxy Statement, and is incorporated herein by reference.
ITEM 12. SECURITY OWNERSHIP OF CERTAIN BENEFICIAL OWNERS AND MANAGEMENT AND RELATED SHAREHOLDER MATTERS
Securities Authorized for Issuance under Equity Compensation Plans
The information required by Item 12 with respect to securities authorized for issuance under equity compensation plans is set forth under “Item 5 – Market for Registrant’s Common Equity and Issuer Repurchases of Equity Securities” above.
Other Information Concerning Security Ownership of Certain Beneficial Owners and Management
The remainder of the information required by Item 12 will be set forth under the captions “Security Ownership of Certain Beneficial Owners and Management” and “Election of Directors” in the Proxy Statement, and is incorporated herein by reference.
ITEM 13. CERTAIN RELATIONSHIPS AND RELATED TRANSACTIONS AND DIRECTOR INDEPENDENCE
The information required to be furnished pursuant to this item will be set forth under the captions “Related Party Transactions” and “Corporate Governance – Director Independence” in the Proxy Statement, and is incorporated herein by reference.
ITEM 14. PRINCIPAL ACCOUNTING FEES AND SERVICES
The information required to be furnished pursuant to this item will be set forth under the caption “Ratification of Appointment of Independent Registered Public Accounting Firm – Fees” in the Proxy Statement, and is incorporated herein by reference.
133
PART IV
ITEM 15. EXHIBITS, FINANCIAL STATEMENT SCHEDULES, AND REPORTS ON FORM 8-K
| (a) | Exhibits |
134
101.DEF | XBRL Taxonomy Extension Definition Linkbase Document | |
101.LAB | XBRL Taxonomy Extension Label Linkbase Document | |
101.PRE | XBRL Taxonomy Extension Presentation Linkbase Document |
| (1) | Original agreement filed as an exhibit to the Form 8-K filed with the SEC on April 25, 2017 and incorporated herein by reference, and amendments thereto filed as appendices to the proxy statement/prospectus included in the Form S-4/A filed with the SEC on July 24, 2017 and incorporated herein by reference. |
| (2) | Filed as Exhibit 3.1 to the Form 10-Q filed with the SEC on August 7, 2009 and incorporated herein by reference. |
| (3) | Filed as an Exhibit to the Form 8-K filed with the SEC on February 21, 2007 and incorporated herein by reference. |
| (4) | Filed as Exhibit 10.5 to the Form 10-Q filed with the SEC on May 15, 2003 and incorporated herein by reference. |
| (5) | Filed as an Exhibit to the Form 8-K filed with the SEC on August 11, 2005 and incorporated herein by reference. |
| (6) | Filed as Exhibits 10.10, 10.18 through 10.20, and 10.22 to the Form 10-K filed with the SEC on March 15, 2006 and incorporated herein by reference. |
| (7) | Filed as Exhibits 10.9 and 10.10 to the Form 10-Q filed with the SEC on May 14, 2004 and incorporated herein by reference. |
| (8) | Filed as Exhibits 10.26 and 10.27 to the Form 10-Q filed with the SEC on August 9, 2006 and incorporated herein by reference. |
| (9) | Filed as Exhibit 10.20 to the Form 10-K filed with the SEC on March 15, 2007 and incorporated herein by reference. |
| (10) | Filed as Exhibits 10.1 through 10.3 to the Form 8-K filed with the SEC on January 8, 2007 and incorporated herein by reference. |
| (11) | Filed as Exhibit 10.23 to the Form 10-K filed with the SEC on March 13, 2014 and incorporated herein by reference. |
| (12) | Filed as Exhibit 10.24 to the Form 10-Q filed with the SEC on May 7, 2015 and incorporated herein by reference. |
| (13) | Filed as Exhibits 10.1 through 10.3 to the Form 8-K filed with the SEC on July 11, 2016 and incorporated herein by reference. |
| (14) | Filed as Exhibit 10.1 to the Form 8-K filed with the SEC on March 17, 2017 and incorporated herein by reference. |
| (15) | Filed as Exhibits 99.1, 99.3 and 99.4 to the Form 8-K filed with the SEC on December 28, 2018 and incorporated by reference. |
| (16) | Filed as Exhibit 99.2 to the Form 8-K filed with the SEC on March 18, 2019 and incorporated by reference. |
| (17) | Filed as Exhibit 99.1 to the Form 8-K filed with the SEC on November 11, 2019 and incorporated by reference. |
| (18) | Filed as Exhibit 99.1 to the Form 8-K filed with the SEC on January 21, 2020 and incorporated by reference. |
* Indicates management contract or compensatory plan or arrangement.
| (b) | Financial Statement Schedules |
Schedules to the financial statements are omitted because the required information is not applicable or because the required information is presented in the Company’s Consolidated Financial Statements or related notes.
ITEM 16. FORM 10-K SUMMARY
Not Applicable.
135
SIGNATURES
Pursuant to the requirements of Section 13 or 15(d) of the Securities and Exchange Act of 1934, the Registrant has duly caused this report to be signed on its behalf by the undersigned, thereunto duly authorized.
Dated: March 12, 2021 | SIERRA BANCORP, | |
a California corporation | ||
By: | /s/ Kevin J. McPhaill | |
Kevin J. McPhaill | ||
President & | ||
Chief Executive Officer | ||
(Principal Executive Officer) | ||
By: | /s/ Christopher G. Treece | |
Christopher G. Treece | ||
Executive Vice President & | ||
Chief Financial Officer | ||
(Principal Financial Officer) | ||
136
Pursuant to the requirements of the Securities Exchange Act of 1934, this report has been signed below by the following persons on behalf of the registrant and in the capacities and on the dates indicated.
Signature | Title | Date | ||
/s/ Susan M. Abundis | Director | March 12, 2021 | ||
Susan M. Abundis | ||||
/s/ Albert L. Berra | Director | March 12, 2021 | ||
Albert L. Berra | ||||
/s/ Julie Castle | Director | March 12, 2021 | ||
Julie Castle | ||||
/s/ Vonn R. Christenson | Director | March 12, 2021 | ||
Vonn R. Christenson | ||||
/s/ Laurence S. Dutto, PhD | Director | March 12, 2021 | ||
Laurence S. Dutto, PhD | ||||
/s/ Robb Evans | Director | March 12, 2021 | ||
Robb Evans | ||||
/s/ James C. Holly | Vice Chairman of the Board | March 12, 2021 | ||
James C. Holly | ||||
/s/ Kevin J. McPhaill | President, Chief Executive | March 12, 2021 | ||
Kevin J. McPhaill | Officer & Director | |||
(Principal Executive Officer) | ||||
/s/ Lynda B. Scearcy | Director | March 12, 2021 | ||
Lynda B. Scearcy | ||||
/s/ Morris A. Tharp | Chairman of the Board | March 12, 2021 | ||
Morris A. Tharp | ||||
/s/ Gordon T. Woods | Director | March 12, 2021 | ||
Gordon T. Woods | ||||
/s/ Christopher G. Treece | Executive Vice President & | March 12, 2021 | ||
Christopher G. Treece | Chief Financial Officer | |||
(Principal Financial Officer) | ||||
/s/ Cindy L. Dabney | Senior Vice President & | March 12, 2021 | ||
Cindy L. Dabney | Chief Accounting Officer | |||
(Principal Accounting Officer) |
137