UNITED STATES
SECURITIES AND EXCHANGE COMMISSION
Washington, D.C. 20549
FORM
(Mark One)
|
|
ANNUAL REPORT PURSUANT TO SECTION 13 OR 15(d) OF THE SECURITIES EXCHANGE ACT OF 1934 |
For the fiscal year ended
OR
|
|
TRANSITION REPORT PURSUANT TO SECTION 13 OR 15(d) OF THE SECURITIES EXCHANGE ACT OF 1934 |
For the transition period from to
Commission file number
(Exact name of registrant as specified in its charter)
|
|
|
|
|
(State or other jurisdiction of incorporation or organization) |
|
(IRS Employer Identification No.) |
|
|
|
|
|
|
|
|
|
(Address of principal executive offices) |
|
(Zip Code) |
Registrant’s telephone number, including area code:
(
Securities registered pursuant to Section 12(b) of the Act:
|
Title of each class |
|
Trading Symbol |
|
Name of each exchange on which registered |
|
|
|
|
|
|
Securities registered pursuant to Section 12(g) of the Act:
None
Indicate by check mark if the registrant is a well-known seasoned issuer, as defined in Rule 405 of the Securities Act.
Indicate by check mark if the registrant is not required to file reports pursuant to Section 13 or Section 15(d) of the Act. Yes ☐
Indicate by check mark whether the registrant (1) has filed all reports required to be filed by Section 13 or 15(d) of the Securities Exchange Act of 1934 during the preceding 12 months (or for such shorter period that the registrant was required to file such reports), and (2) has been subject to such filing requirements for the past 90 days.
Indicate by check mark whether the registrant has submitted electronically every Interactive Data File required to be submitted pursuant to Rule 405 of Regulation S-T (§ 232.405 of this chapter) during the preceding 12 months (or for such shorter period that the registrant was required to submit such files).
Indicate by check mark whether the registrant is a large accelerated filer, an accelerated filer, a non-accelerated filer, smaller reporting company, or an emerging growth company. See the definitions of “large accelerated filer,” “accelerated filer,” “smaller reporting company,” and “emerging growth company” in Rule 12b-2 of the Exchange Act.
|
|
☒ |
Accelerated filer |
☐ |
|
|
|
|
|
|
Non-accelerated filer |
☐ |
Smaller reporting company |
|
|
|
|
|
|
|
Emerging growth company |
|
If an emerging growth company, indicate by check mark if the registrant has elected not to use the extended transition period for complying with any new or revised financial accounting standards provided pursuant to Section 13(a) of the Exchange Act. ☐
Indicate by check mark whether the registrant has filed a report on and attestation to its management’s assessment of the effectiveness of its internal control over financial reporting under Section 404(b) of the Sarbanes-Oxley Act (15 U.S.C. 7262(b)) by the registered public accounting firm that prepared or issued its audit report.
Indicate by check mark whether the registrant is a shell company (as defined in Rule 12b-2 of the Exchange Act). Yes
The aggregate market value of the voting and non-voting common equity held by non-affiliates of the registrant, based on the closing price of the shares of common stock on the New York Stock Exchange on July 11, 2020, was $
The number of shares of the registrant’s Common Stock outstanding as of February 18, 2021 was
DOCUMENTS INCORPORATED BY REFERENCE
FORM 10-K REPORT
TABLE OF CONTENTS
|
|
|
Page |
|
|
PART I |
|
|
Item 1. |
4 |
|
|
Item 1A. |
13 |
|
|
Item 1B. |
20 |
|
|
Item 2. |
21 |
|
|
Item 3. |
21 |
|
|
Item 4. |
21 |
|
|
|
|
|
|
|
PART II |
|
|
Item 5. |
22 |
|
|
Item 6. |
24 |
|
|
Item 7. |
Management’s Discussion and Analysis of Financial Condition and Results of Operations |
26 |
|
Item 7A. |
43 |
|
|
Item 8. |
43 |
|
|
Item 9. |
Changes in and Disagreements with Accountants on Accounting and Financial Disclosure |
43 |
|
Item 9A. |
43 |
|
|
Item 9B. |
44 |
|
|
|
|
|
|
|
PART III |
|
|
Item 10. |
45 |
|
|
Item 11. |
45 |
|
|
Item 12. |
Security Ownership of Certain Beneficial Owners and Management and Related Stockholder Matters |
45 |
|
Item 13. |
Certain Relationships and Related Transactions, and Director Independence |
45 |
|
Item 14. |
45 |
|
|
|
|
|
|
|
PART IV |
|
|
Item 15. |
46 |
|
|
Item 16. |
50 |
|
|
|
51 |
1
Forward-Looking Statements
Statements contained in this filing and certain other written or oral statements made from time to time by Flowers Foods, Inc. (the “company”, “Flowers Foods”, “Flowers”, “us”, “we”, or “our”) and its representatives that are not historical facts are forward-looking statements as defined in the Private Securities Litigation Reform Act of 1995. Forward-looking statements relate to current expectations regarding our future financial condition and results of operations and the ultimate impact of the novel strain of coronavirus (“COVID-19”) on our business, results of operations and financial condition and are often identified by the use of words and phrases such as “anticipate,” “believe,” “continue,” “could,” “estimate,” “expect,” “intend,” “may,” “plan,” “predict,” “project,” “should,” “will,” “would,” “is likely to,” “is expected to” or “will continue,” or the negative of these terms or other comparable terminology. These forward-looking statements are based upon assumptions we believe are reasonable.
Forward-looking statements are based on current information and are subject to risks and uncertainties that could cause our actual results to differ materially from those projected. Certain factors that may cause actual results, performance, liquidity, and achievements to differ materially from those projected are discussed in this Annual Report on Form 10-K (the “Form 10-K”) and may include, but are not limited to:
|
|
• |
unexpected changes in any of the following: (i) general economic and business conditions; (ii) the competitive setting in which we operate, including advertising or promotional strategies by us or our competitors, as well as changes in consumer demand; (iii) interest rates and other terms available to us on our borrowings; (iv) energy and raw materials costs and availability and hedging counter-party risks; (v) relationships with or increased costs related to our employees and third-party service providers; (vi) laws and regulations (including environmental and health-related issues); and (vii) accounting standards or tax rates in the markets in which we operate; |
|
|
• |
the ultimate impact of the COVID-19 outbreak and measures taken in response thereto on our business, results of operations and financial condition, which are highly uncertain and are difficult to predict; |
|
|
• |
the loss or financial instability of any significant customer(s), including as a result of product recalls or safety concerns related to our products; |
|
|
• |
changes in consumer behavior, trends and preferences, including health and whole grain trends, and the movement toward more inexpensive store branded products; |
|
|
• |
the level of success we achieve in developing and introducing new products and entering new markets; |
|
|
• |
our ability to implement new technology and customer requirements as required; |
|
|
• |
our ability to operate existing, and any new, manufacturing lines according to schedule; |
|
|
• |
our ability to execute our business strategies which may involve, among other things, (i) the integration of acquisitions or the acquisition or disposition of assets at presently targeted values, (ii) the deployment of new systems and technology, and (iii) an enhanced organizational structure; |
|
|
• |
consolidation within the baking industry and related industries; |
|
|
• |
changes in pricing, customer and consumer reaction to pricing actions, and the pricing environment among competitors within the industry; |
|
|
• |
disruptions in our direct-store-delivery distribution model, including litigation or an adverse ruling by a court or regulatory or governmental body that could affect the independent contractor classifications of the independent distributors; |
|
|
• |
increasing legal complexity and legal proceedings that we are or may become subject to; |
|
|
• |
increases in employee and employee-related costs; |
|
|
• |
the credit, business, and legal risks associated with independent distributors and customers, which operate in the highly competitive retail food and foodservice industries; |
|
|
• |
any business disruptions due to political instability, pandemics, armed hostilities, incidents of terrorism, natural disasters, labor strikes or work stoppages, technological breakdowns, product contamination, product recalls or safety concerns related to our products, or the responses to or repercussions from any of these or similar events or conditions and our ability to insure against such events; |
2
|
|
• |
the failure of our information technology (“IT”) systems to perform adequately, including any interruptions, intrusions or security breaches of such systems or risks associated with the planned implementation of a new enterprise resource planning (“ERP”) system; and |
|
|
• |
regulation and legislation related to climate change that could affect our ability to procure our commodity needs or that necessitate additional unplanned capital expenditures. |
The foregoing list of important factors does not include all such factors, nor necessarily present them in order of importance. In addition, you should consult other disclosures made by the company (such as in our other filings with the Securities and Exchange Commission (“SEC”) or in company press releases) for other factors that may cause actual results to differ materially from those projected by the company. Refer to Part I, Item 1A., Risk Factors, of this Form 10-K for additional information regarding factors that could affect the company’s results of operations, financial condition and liquidity.
We caution you not to place undue reliance on forward-looking statements, as they speak only as of the date made and are inherently uncertain. The company undertakes no obligation to publicly revise or update such statements, except as required by law. You are advised, however, to consult any further public disclosures by the company (such as in our filings with the SEC or in company press releases) on related subjects.
We own or have rights to trademarks or trade names that we use in connection with the operation of our business, including our corporate names, logos and website names. In addition, we own or have the rights to copyrights, trade secrets and other proprietary rights that protect the content of our products and the formulations for such products. Solely for convenience, some of the trademarks, trade names and copyrights referred to in this Form 10-K are listed without the ©, ® and ™ symbols, but we will assert, to the fullest extent under applicable law, our rights to our trademarks, trade names and copyrights.
3
PART I
|
Item 1. |
Business |
The Company
Flowers Foods, Inc. (which we reference to herein as “we,” “our,” “us,” the “company,” “Flowers” or “Flowers Foods”), founded in 1919 as a Georgia corporation and headquartered in Thomasville, Georgia, is currently the second-largest producer and marketer of packaged bakery foods in the United States (“U.S.”). Our principal products include breads, buns, rolls, snack cakes, and tortillas and are sold under a variety of brand names, including Nature’s Own, Dave’s Killer Bread (“DKB”), Wonder, Canyon Bakehouse, Tastykake, and Mrs. Freshley’s. Our brands are among the best known in the baking industry. Many of our brands have a major presence in the product categories in which they compete.
Flowers’ strategic priorities include developing our team, focusing on our brands, prioritizing our margins, and proactively seeking out smart, disciplined acquisitions and are described further in the following section. We believe executing on our strategic priorities will drive future growth and margin expansion and deliver meaningful shareholder value over time.
COVID-19
On March 11, 2020, the World Health Organization declared the novel strain of coronavirus (COVID-19) a global pandemic and recommended containment and mitigation measures worldwide, which has led to adverse impacts on the U.S. and global economies. Due to the drastic change in consumer buying patterns as a result of the COVID-19 pandemic, we have experienced a favorable shift in sales mix to our branded retail products resulting in significant growth in income from operations in Fiscal 2020 as compared to Fiscal 2019. If, in future periods, there is a shift in mix away from our branded retail products to store branded and non-retail products, we expect that our results of operations, including our net sales, earnings and cash flows, could be negatively impacted.
In recognition and support of our frontline workers, we paid a total of $12.3 million in appreciation bonuses to eligible hourly and non-exempt employees, leased labor, and contract workers in Fiscal 2020. These appreciation bonuses are in addition to the company’s annual bonus program.
On April 14, 2020, we temporarily ceased production at our Tucker, Georgia bakery and on July 9, 2020, we temporarily ceased production at our Savannah, Georgia bakery. Both closures were due to an increase in the number of confirmed COVID-19 cases at these bakeries and the related increase in number of workers self-quarantining. Production resumed at the Tucker bakery on April 27, 2020 and at the Savannah Bakery on July 17, 2020. While our other bakeries were able to assist with meeting production needs in these instances, the closure of several of our bakeries across the country at one time or in close succession could negatively impact our ability to meet our production requirements.
While the ultimate health and economic impact of the COVID-19 pandemic remains highly uncertain, we expect that our business operations and results of operations, including our net sales, earnings and cash flows, will continue to be impacted by decreases in foodservice and other non-retail outlets sales. Foodservice sales are likely to remain under pressure until the restaurant industry returns to more normal operations. We cannot predict the timing and speed of the foodservice industry recovery, and any delay in the recovery could significantly impact our future results. We continue to actively monitor the collectability of our trade accounts receivables, particularly our foodservice customers. We may incur losses in the future if these customers are forced into financial distress or bankruptcy and cannot pay us or their other suppliers on a timely basis or at all.
We continue to actively monitor the global outbreak and spread of COVID-19 and are taking steps to mitigate the potential risks to us posed by its spread and related circumstances and impacts. We are focused on navigating these challenges presented by the COVID-19 global pandemic through the implementation of additional procedures at each of our locations to comply with U.S. Centers for Disease Control and Prevention (CDC) recommendations. These procedures and actions include, but are not limited to, monitoring the symptoms of all team members and essential visitors entering our facilities, requiring face coverings, maintaining (where possible) six feet of distance, conducting enhanced cleaning and sanitizing of common areas and frequently touched surfaces, performing additional decontamination of work areas and equipment if there is a confirmed or presumptive case of COVID-19 at a facility, and other considerations. Certain non-production employees have also been working remotely to mitigate contact between personnel. Non-essential travel and non-essential visitors bans also were implemented to reduce potential exposure. We are considering the options available to us under the Families First Coronavirus Response Act (“FFCRA Act”), the Coronavirus Aid, Relief, and Economic Security Act (“CARES Act”), and the Consolidated Appropriations Act (“CCA Act”). As of the beginning of the second quarter of Fiscal 2020, we began taking advantage of deferrals of certain payroll tax payments in accordance with the CARES Act. In addition, we continue to evaluate the impact of certain tax credits that are available under these Acts. We have also availed ourselves of the deferral of federal income tax payments made available under an emergency declaration on March 13, 2020. The evolving COVID-19 pandemic could continue to impact our results of operations and liquidity; the operations of our suppliers,
4
vendors, and customers; and our employees as a result of health concerns, quarantines, facility closures, and travel and logistics restrictions.
Strategic Initiatives
In June 2016, the company launched Project Centennial, a comprehensive business and operational review. We identified opportunities to enhance revenue growth, streamline operations, improve efficiencies, and make investments that strengthen our competitive position and improve margins over the long term. We began Project Centennial with an evaluation of our brands, product mix, and organizational structure. On May 3, 2017, the company announced an enhanced organizational structure designed to provide greater focus on the company’s long-term strategic objectives, emphasize brand growth and innovation in line with a national branded food company, drive enhanced accountability, and reduce costs. The new organizational structure established two business units (“BUs”) - Fresh Packaged Bread and Snacking/Specialty - and realigned key leadership roles. The new structure also provided for centralized marketing, sales, supply chain, shared services/administrative, and corporate strategy functions, each with clearly defined roles and responsibilities. On July 17, 2020, the company implemented additional organizational structure changes designed to increase focus on brand growth, product innovation, and improving underperforming bakeries. As part of this realignment, the two BUs were combined into one single function that is responsible for all of our brands.
Project Centennial marked a significant shift in mindset from a sales and operations focused enterprise to a brand focused packaged foods company. Strategic priorities developed as part of Project Centennial were designed to improve margins and profitably grow revenue over time. These priorities included: reducing costs to fuel growth, developing leading capabilities, reinvigorating core business, and capitalizing on product adjacencies.
Today, we are a brand focused company dedicated to the consumer and committed to growing our most profitable brands through innovation, market expansion, and prudent mergers and acquisitions (“M&A”). Based on insights gained from the completion of Project Centennial, we have redefined our strategic priorities and our long-term goals which are as follows:
Strategic Priorities:
|
|
• |
Develop team: Capabilities to build brands and create value. |
|
|
• |
Focus on brands: Enhance relevancy and expand presence. Invest in our brands to align with consumers to maximize our return on investment. |
|
|
• |
Prioritize margins: Optimize the portfolio and supply chain. |
|
|
• |
Smart M&A: Disciplined approach to acquisitions in the grain-based foods arena that enhance our branded portfolio and margin profile. |
Long-term Goals:
|
|
• |
Grow sales by 1% to 2% annually (excluding any future acquisitions). |
|
|
• |
Grow EBITDA by 4% to 6% annually (excluding any future acquisitions) (The company defines EBITDA as earnings before interest, taxes, depreciation and amortization.). |
|
|
• |
Grow earnings per share by 7% to 9% annually. |
The key to our success in achieving our goals is our talented and dedicated team. We recognize the importance of investing in our people as further discussed in the “Human Capital Resources” section below, which details how we attract, retain, and develop our team. Additionally, we recognize the importance of realigning people and responsibilities in successfully implementing our long-term strategies. This realignment can take the form of organizational changes or providing crucial tools, including investments in our information systems. During Fiscal 2020, we implemented organizational changes to better align the team to our new strategies, hired new team members with unique expertise and insight, and created the transformation office. The transformation office is a cross-functional team responsible for over-overseeing the implementation of our strategic priorities, including our digital and ERP initiative, which is discussed in more detail under the “Digital Strategy Initiative” section below.
A major focus of our long-term strategy is to evolve our sales portfolio to higher margin, value-added branded retail products that we expect will drive top line growth and improve overall profitability. We expect an optimized portfolio will drive share gains by targeting growth segments with new, innovative products. We have established clear roles for the brands and product lines within our portfolio to enable more targeted decision-making on brand investment. Over the past several years, we have completed brand rationalization initiatives resulting in a more streamlined brand and product assortment, reduced brand portfolio complexity, and
5
increased efficiency. In Fiscal 2020, our sales mix shifted to more profitable branded retail products due to increases in at-home dining resulting from COVID-19, which led to increased sales and operating income, further illustrating the potential of an optimized portfolio.
As we implement our targeted sales portfolio strategy, the flexibility of our production and distribution systems allows us to pivot capacity to meet this changing demand. As an example, in Fiscal 2020, we repurposed bakery assets at our Lynchburg, Virginia facility, converting it to an all-organic bakery to meet rising demand for our DKB products and to better serve east coast markets with fresher product and reduce distribution costs. Additionally, we believe our flexible bakery system has been crucial in navigating demand changes caused by the pandemic as we have been able to quickly shift production to high demand products and adjust distribution where needed. We are continuing to optimize our distribution system by reducing network complexity through depot consolidation and reducing transport miles.
M&A has always been, and we expect will continue to be, an important part of our long-term growth strategy. We employ a disciplined approach to M&A, seeking out candidates primarily in the grain-based foods arena that will enhance our branded portfolio, extend our geographic presence, are a strong cultural fit, and add enhanced capabilities to our company. We believe our strong balance sheet and cash flow generation will enable us to execute our M&A strategy.
Digital Strategy Initiative
We have launched a digital strategy initiative to transform our information systems and processes. This includes upgrading our information system to a more robust platform and is expected to improve data management and efficiencies while automating many of our processes. The primary goals of this new strategic initiative are: (1) enable more agility in our business model, empowering the organization by fundamentally redesigning core business processes and our ways of working; (2) embed digital capabilities where it matters and transform the way we engage with our consumers, our customers and our employees; and (3) modernize and simplify our application and configuration landscape to remove existing roadblocks and support new ways of working with the new ERP system becoming a key enabler of our business strategies. We completed the initial planning and road mapping phase of this multi-year project as of the end of Fiscal 2020 and transitioned into the design phase in early Fiscal 2021. We expect this initiative will require significant capital investment and expense over the next several years. See Item 1A., Risk Factors, “We may experience difficulties in designing and implementing our new ERP system.”
Segment
Since the beginning of Fiscal 2019, we have managed our business as one operating segment. As discussed above, due to the organizational structure changes implemented under Project Centennial, the company concluded it has one operating segment based on the nature of the products the company sells, its intertwined production and distribution model, the internal management structure and information that is regularly reviewed by the chief executive officer (“CEO”), who is the chief operating decision maker, for the purpose of assessing performance and allocating resources. Beginning with the first quarter of Fiscal 2019, the comparative periods have been presented on a consolidated basis due to the change to a single operating segment. See Note 2, Summary of Significant Accounting Policies, of Notes to Consolidated Financial Statements of this Form 10-K for more detailed financial information about our operating segment.
6
Brands & Products
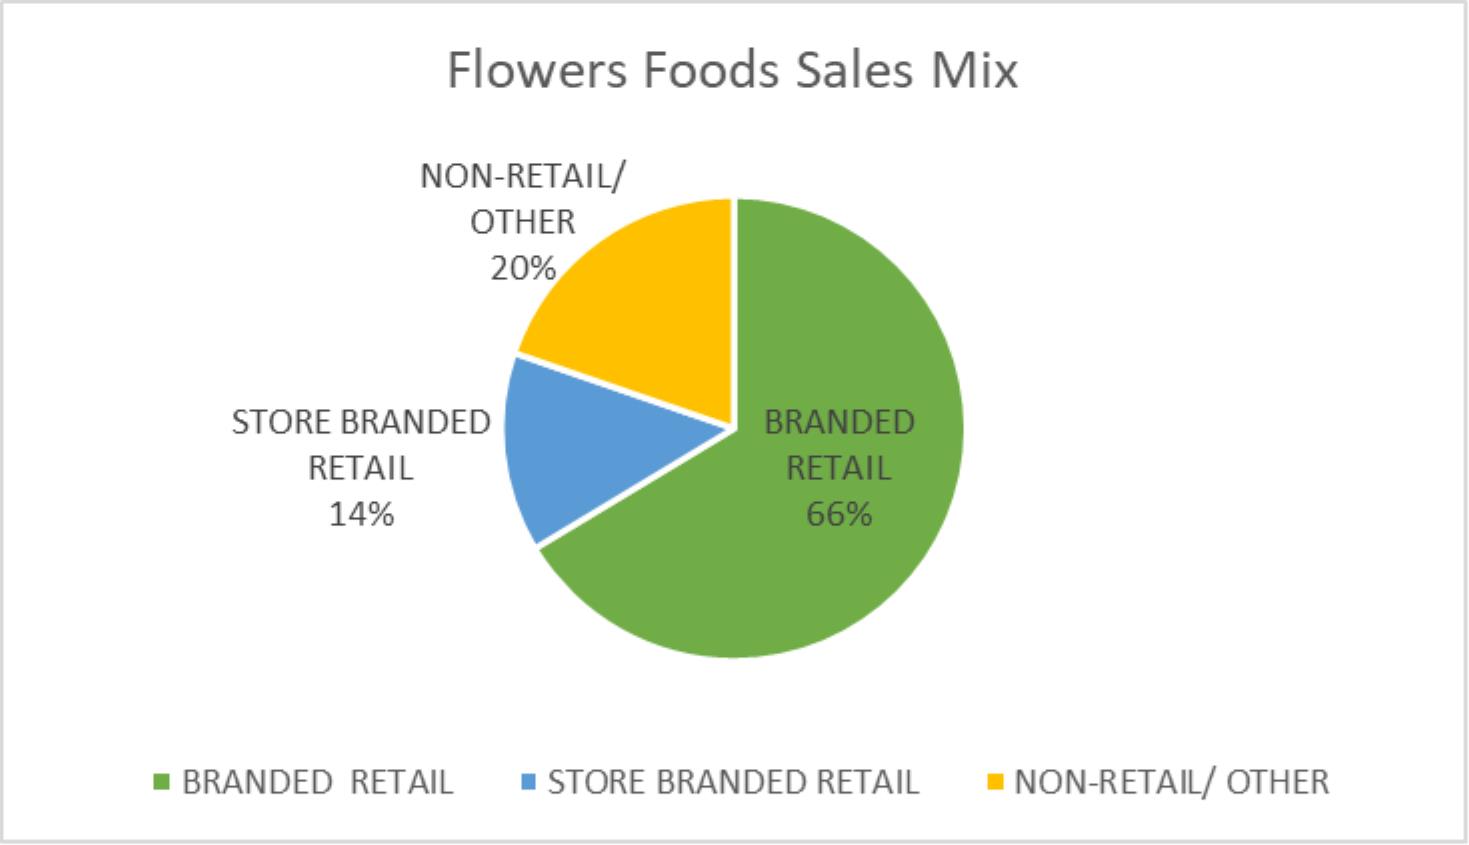
We report our sales as branded retail, store branded retail, or non-retail and other. The non-retail and other category includes foodservice, restaurant, institutional, vending, thrift stores, and contract manufacturing. The chart below presents our Fiscal 2020 sales by sales category (source: internal sales data warehouse (“SDW”); amounts may not compute due to rounding).
Our brands are some of the best-known in the U.S. fresh packaged bread industry and hold leading market positions in the categories in which they compete. We believe having a well-diversified portfolio of brands allows us to be more competitive in the marketplace and appeal to a broader range of consumers. Our principal products are breads, buns, rolls, snack cakes, and tortillas. The table below presents the major brands within our diversified brand portfolio:
|
Strategic Positioning |
|
Key Brands |
|
Mainstream |
|
Nature's Own, Wonder, Tastykake |
|
Organic |
|
Dave's Killer Bread |
|
Gluten Free |
|
Canyon Bakehouse |
Brand Highlights
|
|
• |
Nature’s Own is the best-selling loaf bread in the U.S. Nature’s Own sales, at retail, were $1.3 billion for Fiscal 2020. |
|
|
• |
Nature’s Own Honey Wheat is the #1 Universal Product Code (“UPC”) based on dollars and units in the U.S. Nature’s Own Butterbread is the #3 UPC based on dollars and units. (Source: IRI Total US MultiOutlet+C-Store L52 Weeks Ending 12/27/20) |
|
|
• |
DKB is the #1 selling organic brand in the U.S. and the company’s #2 brand, with the top-selling organic brand in four different segments (Loaf, Bagels, Breakfast Bread, and English Muffins). (Source: IRI Total US MultiOutlet+C-Store L52 Weeks Ending 12/27/20) DKB’s sales, at retail, were $807 million for Fiscal 2020. |
|
|
• |
Canyon Bakehouse, acquired at the end of Fiscal 2018, is the #1 selling gluten-free bread brand in the U.S. (Source: IRI Total US MultiOutlet+C-Store L52 Weeks Ending 12/27/20) Canyon Bakehouse’s sales, at retail, were $121 million for Fiscal 2020. |
|
|
• |
Wonder, celebrating its 100th anniversary, enjoys 98% brand awareness (Source: Kantar Brand Health Tracking Study - Q4 2020) and is the #2 selling brand in the white loaf segment. Wonder’s sales, at retail, were $469 million for Fiscal 2020 (Source: IRI Total US MultiOutlet+C-Store L52 Weeks Ending 12/27/20) |
7
Our brands and products are sold through various channels throughout the U.S. The table below presents our sales by channel for Fiscal 2020 (source: internal SDW; amounts may not compute due to rounding).

* All Other includes thrift store, vending, and retail distributor sales.
Marketing
We support our key brands with an advertising and marketing effort that targets consumers through electronic and in-store coupons, social media (such as Facebook and Twitter), digital media (including e-newsletters to consumers), websites (our brand sites and third-party sites), event and sports marketing, on-package promotional offers and sweepstakes, and print advertising. When appropriate, we may join other sponsors with promotional tie-ins. We often focus our marketing efforts on specific products and holidays, such as hamburger and hot dog bun sales during Memorial Day, the Fourth of July, and Labor Day, and snack cakes for specific seasons. Additionally, we have and are continuing to make marketing investments to target e-commerce sales as consumers shift to more online shopping alternatives, such as grocery delivery sites, retailer websites and apps, among others.
Customers
Our top 10 customers in Fiscal 2020 accounted for 53.6% of sales. During Fiscal 2020, our largest customer, Walmart/Sam’s Club, represented 21.2% of the company’s sales. The loss of, or a material negative change in our relationship with, Walmart/Sam’s Club or any other major customer could have a material adverse effect on our business. Walmart/Sam’s Club was the only customer to account for 10.0% or more of our sales during Fiscal 2020, 2019, and 2018.
Fresh baked foods’ customers include mass merchandisers, supermarkets and other retailers, restaurants, quick-serve chains, food wholesalers, institutions, dollar stores, and vending companies. We also sell returned and surplus product through a system of thrift stores. The company currently operates 246 such stores and reported sales of $71.9 million during Fiscal 2020 from these outlets.
We also (1) supply national and regional restaurants, institutions and foodservice distributors, and retail in-store bakeries with breads and rolls; (2) sell packaged bakery products to wholesale distributors for ultimate sale to a wide variety of food outlets; and (3) sell packaged snack cakes primarily to customers who distribute them nationwide through multiple channels of distribution, including mass merchandisers, supermarkets, vending outlets and convenience stores. In certain circumstances, we enter into co-packing arrangements with retail customers or other food companies, some of which are competitors. While we service public health care, military commissaries, and prisons, among other governmental institutions, we do not have any material government contracts.
Distribution
We distribute our products through a direct-store-delivery (“DSD”) distribution system and a warehouse delivery system. The DSD distribution system involves aggregating order levels and delivering products from bakeries to independent distributors for sale
8
and direct delivery to customer stores. The independent distributors are responsible for ordering products, stocking shelves, maintaining special displays, and developing and maintaining good customer relations to ensure adequate inventory and removing unsold goods. The warehouse delivery system involves primarily delivering our products to customers’ warehouses.
The company has sold the majority of the distribution rights for territories to independent distributors under long-term financing arrangements. Independent distributors, highly motivated by financial incentives from their distribution rights ownership, strive to increase sales by offering outstanding service and merchandising. Independent distributors have the opportunity to benefit directly from the enhanced value of their distribution rights resulting from higher branded sales volume.
Our DSD distribution system is comprised of three types of territories: (1) independent distributor-owned and operated territories (independent distributors own the rights to distribute certain brands of our fresh packaged bakery foods in defined geographic markets); (2) distribution rights that are classified as available for sale in the Consolidated Balance Sheets; and (3) other company operated territories. The table below presents the approximate number of territories used by the company as of January 2, 2021:
|
Type of territory |
|
Number of territories |
|
|
|
Independent distributor-owned and operated territories |
|
|
5,498 |
|
|
Territories classified as available for sale |
|
|
366 |
|
|
Other company operated territories |
|
|
96 |
|
|
Total territories |
|
|
5,960 |
|
Our warehouse distribution system delivers a portion of our packaged bakery snack products from a central distribution facility located near our Crossville, Tennessee snack cake bakery. We believe this centralized distribution system allows us to achieve both production and distribution efficiencies. Products coming from different bakeries are then cross-docked and shipped directly to customers’ warehouses nationwide. Our frozen bread and roll products are shipped to various outside freezer facilities for distribution to our customers.
Intellectual Property
We own a number of trademarks, trade names, patents, and licenses. The company also sells products under franchised and licensed trademarks and trade names which we do not own pursuant to contractual arrangements. We consider all of our trademarks and trade names important to our business since we use them to build strong brand awareness and consumer loyalty.
Raw Materials
Our primary baking ingredients are flour, sweeteners, shortening, yeast and water. We also purchase organic and gluten-free ingredients. We also use paper products, such as corrugated cardboard, films and plastics to package our bakery foods. We strive to maintain diversified sources for all of our baking ingredients and packaging products. In addition, we are dependent on natural gas or propane as fuel for firing our ovens.
Commodities, such as our baking ingredients, periodically experience price fluctuations. The cost of these inputs may fluctuate widely due to government policy and regulation, weather conditions, domestic and international demand, or other unforeseen circumstances. We enter into forward purchase agreements and other derivative financial instruments in an effort to manage the impact of such volatility in raw material prices, but some organic and specialty ingredients do not offer the same hedging opportunities to reduce the impact of price volatility. Any decrease in the supply available under these agreements and instruments could increase the effective price of these raw materials to us and significantly impact our earnings.
Regulations
As a producer and marketer of food items, our operations are subject to regulation by various federal governmental agencies, including the U.S. Food and Drug Administration, the U.S. Department of Agriculture, the U.S. Federal Trade Commission, the U.S. Environmental Protection Agency, the U.S. Department of Commerce, and the U.S. Department of Labor (the “DOL”). We also are subject to the regulations of various state agencies, with respect to production processes, product quality, packaging, labeling, storage, distribution, labor, and local regulations regarding the licensing of bakeries and the enforcement of state standards and facility inspections. Under various statutes and regulations, these federal and state agencies prescribe requirements and establish standards for quality, purity, and labeling. Failure to comply with one or more regulatory requirements could result in a variety of sanctions, including monetary fines or compulsory withdrawal of products from store shelves.
9
Advertising of our businesses is subject to regulation by the Federal Trade Commission, and we are subject to certain health and safety regulations, including those issued under the Occupational Safety and Health Act.
The cost of compliance with such laws and regulations has not had a material adverse effect on the company’s business. We believe we are currently in substantial compliance with all material federal, state and local laws and regulations affecting the company and its properties.
Our operations, like those of similar businesses, are subject to various federal, state and local laws and regulations with respect to environmental matters, including air and water quality and underground fuel storage tanks, as well as other regulations intended to protect public health and the environment. The company is not a party to any material proceedings arising under these laws and regulations. We believe compliance with existing environmental laws and regulations will not materially affect the Consolidated Financial Statements or the competitive position of the company. The company is currently in substantial compliance with all material environmental laws and regulations affecting the company and its properties.
Competitive Overview
The U.S. market for fresh and frozen bakery products is estimated at $37.6 billion at retail. This category is intensely competitive and has continued to experience consolidation. From a national standpoint, Flowers Foods is currently the second-largest company in the U.S. fresh baking industry based on market share as presented in the following chart (amounts may not compute due to rounding). (Source: IRI Flowers custom database, 52 weeks ending 12-27-20; Flowers private label sales from SDW):
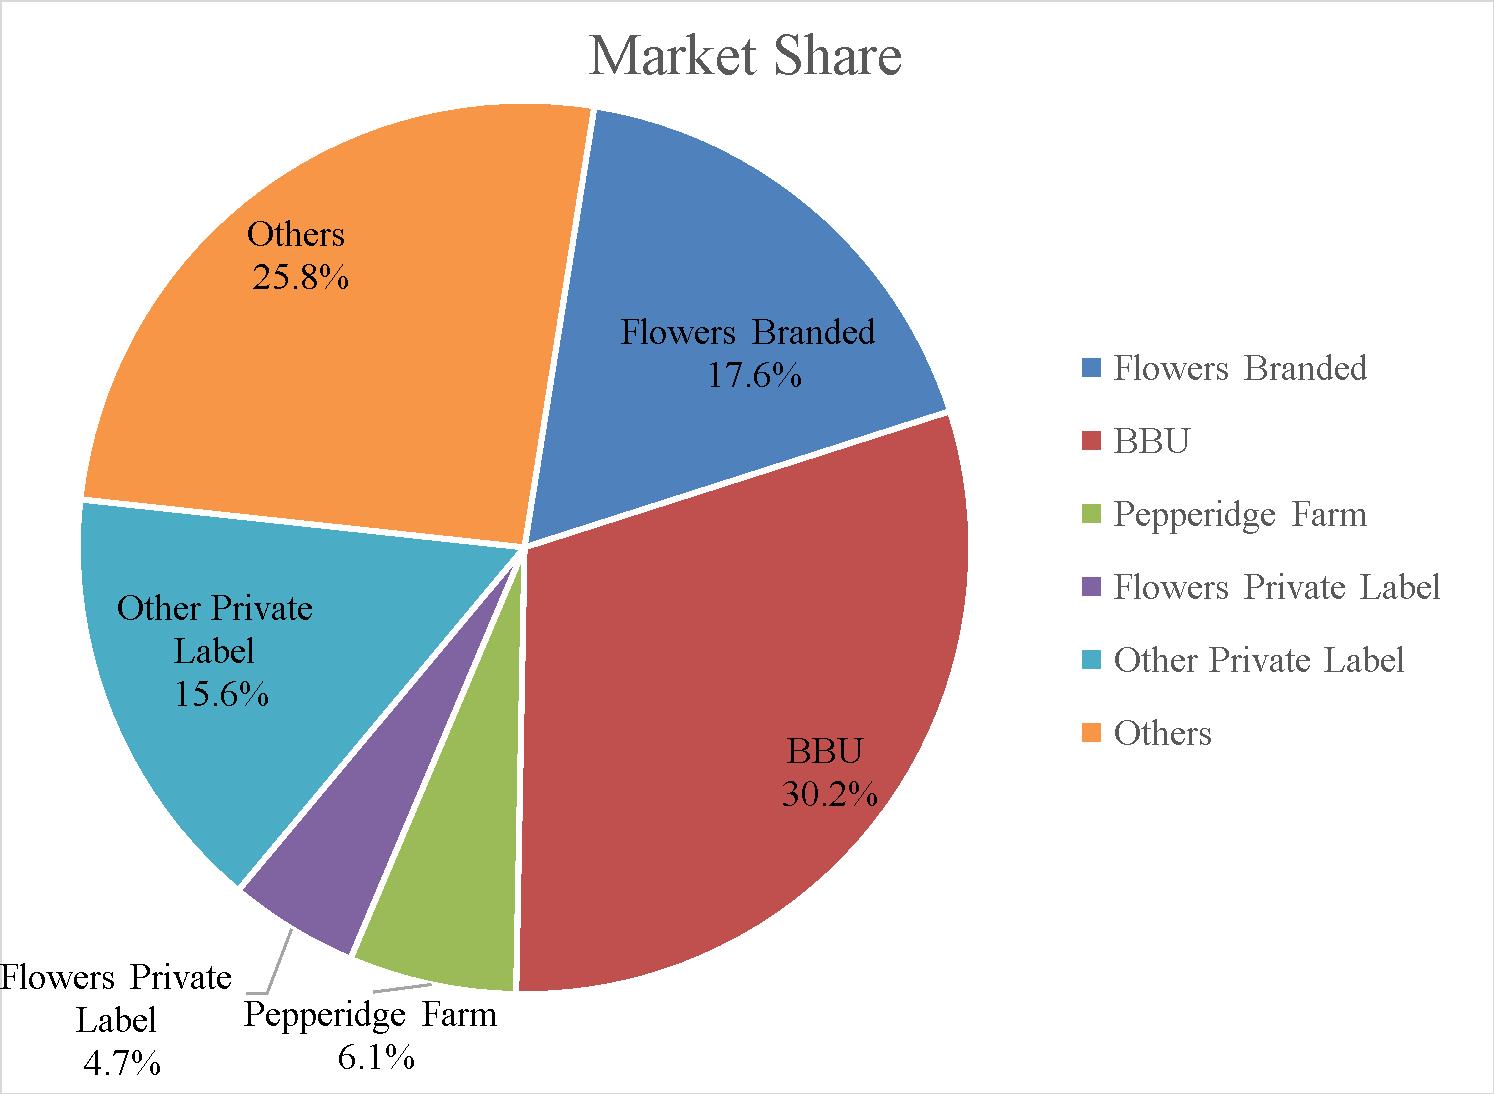
The current competitive landscape for breads and rolls in the U.S. baking industry consists of Bimbo Bakeries USA (BBU), Flowers Foods, and Campbell Soup Company, under the Pepperidge Farm brand, along with a number of smaller independent regional bakers, local bakeries, and retailer-owned bakeries.
Some of these smaller regional bakers do not enjoy the competitive advantages of larger operations, including greater brand awareness and economies of scale in purchasing, distribution, production, IT, advertising and marketing. However, size alone is not sufficient to ensure success in our industry. The company faces significant competition from regional and independent bakeries in certain geographic areas.
Competition in the baking industry continues to be driven by a number of factors, including the ability to serve retail and foodservice customers, generational changes in family-owned businesses, and competitors’ promotional efforts on branded bread and store brands. Competition typically is based on the ability to target changing consumer preferences, product availability (including through e-commerce channels), product quality, brand loyalty, price, and effective promotions. Customer service, including frequent deliveries to keep store shelves well-stocked, is also a competitive factor.
10
The company also faces competition from store brands that are produced either by us or our competitors. Store brands (also known as “private label”) have been offered by food retailers for decades. With the growth of mass merchandisers like Walmart and the ongoing consolidation of regional supermarkets into larger operations, store brands have become a significant competitor to the company in those areas where the company does not have the contract to produce the store brand. The store brand share of retail fresh packaged bread in the U.S. accounts for approximately 20% of the dollar sales and approximately 30% of unit sales, though its share has steadily declined over the past six years.
Human Capital Resources
As of January 2, 2021, Flowers and its subsidiaries had approximately 9,200 employees located throughout the U.S. and approximately 4,200 long-term leased employees. Approximately 1,070 employees are covered by collective bargaining agreements and there are no material outstanding labor disputes.
Supporting our people is a foundational value for Flowers. We believe company success depends on our ability to attract, develop, and retain key personnel whose skills, experience and industry knowledge benefit our operations and performance. The company’s Board of Directors (the “Board”), Board committees, and management oversee various employee initiatives including compensation and benefits programs, succession planning, and leadership development and diversity and inclusion.
Flowers aims to attract a qualified workforce through an inclusive and accessible recruiting process that utilizes online recruiting platforms, campus outreach, apprenticeships, internships, and job fairs. Flowers also seeks to retain team members by offering competitive wages, benefits, and training opportunities, as well as promoting a safe and healthy workplace.
Flowers supports and develops our employees through company-wide training and development programs intended to build and strengthen employees’ leadership and professional skills, including various management development programs, and provides career planning tools. Additionally, we regularly conduct anonymous surveys to seek feedback from our team members on a variety of topics, including, but not limited to, confidence in company leadership, competitiveness of our compensation and benefits package, career growth opportunities and how we can make our company an employer of choice. The results are shared with our team members and reviewed by senior leadership, who seek to analyze areas of opportunity and prioritize actions and activities in response to the feedback to drive meaningful change in our overall employee experience.
Diversity, Equity and Inclusion
At Flowers, we believe diversity broadens our perspective as a company and enriches our employees and partners, as well as the communities in which we live. To further develop our diversity, equity and inclusion strategy, Flowers has partnered with a nationally recognized consulting firm to aid in the development of a comprehensive strategy to ensure we are continuing to foster a work environment that values all people.
Health and Safety
The safety of our team members is a top priority. We strive to provide a safe working environment, and have policies, procedures, and training programs to ensure employees and associates understand and meet safety guidelines. We are currently developing a safety management system that will guide our teams towards a comprehensive, performance-based safety culture that is intended to provide the desired quality of life our employees, associates and their families strive for as we journey toward safety excellence.
Second Chance Employer
While Flowers’ hiring practices have never required job candidates to share criminal background information, since acquiring DKB in 2015, the company has been encouraging its subsidiaries to work with local agencies to find qualified individuals within this candidate pool. Currently, seven of our bakeries are active Second Chance Employers, including our DKB bakery in Milwaukie, Oregon. The Dave’s Killer Bread Foundation was established in 2015 to inspire other businesses to become Second Chance Employers. The majority of the directors serving on the foundation’s board are executives of DKB and Flowers Foods.
11
Total Rewards
We have a demonstrated history of investing in our workforce by providing competitive wages and benefits. Our benefits package includes:
|
|
• |
comprehensive health insurance coverage to employees working 30 hours or more each week; |
|
|
• |
parental leave to all new parents for birth, adoption or foster placement; |
|
|
• |
short-term disability to provide wage protection for up to six months; |
|
|
• |
a tuition reimbursement program; and |
|
|
• |
a 401(k) plan with generous company match. |
Additionally, we believe that because employees drive our success, they should share in that success. In addition to competitive wages and benefits, when annual company goals are met, eligible team members at all levels are rewarded with a bonus. Furthermore, in Fiscal 2020, in recognition and support of our frontline workers, we paid a total of $12.3 million in appreciation bonuses to eligible hourly and non-exempt employees, leased labor, and contract workers. These appreciation bonuses are in addition to the company’s annual bonus program.
Sustainability
Sustainability is core to our strategy and how we connect with consumers and grow our company. Our leading brands and delicious bakery foods are made with a commitment to operating efficiently, reducing waste, and sourcing ingredients responsibly.
As part of that strategy, we recognize our responsibility to uphold the company’s founding values, which for more than 100 years, have centered on working ethically, responsibly, and with integrity. We also look for ways to make a positive difference at work and in our communities. By collaborating with stakeholders, including team members, business partners, suppliers, and customers, we are working to become a more sustainable company.
We integrate environmental, social and governance objectives into our decision making to deliver long-term value. In doing so, we consider guidance by our stakeholders and third-party frameworks, including the Sustainability Accounting Standards Board (SASB).
Other Available Information
Throughout this Form 10-K, we incorporate by reference information from parts of other documents filed with the SEC. The SEC allows us to disclose important information by referring to it in this manner, and you should review this information in addition to the information contained in this report.
Our annual report on Form 10-K, quarterly reports on Form 10-Q, current reports on Form 8-K, and proxy statement for the annual shareholders’ meeting, as well as any amendments to those reports, are available free of charge through our website as soon as reasonably practicable after we file them with the SEC. You can learn more about us by reviewing our SEC filings on our website at www.flowersfoods.com in the “REPORTS & FILINGS” section of the “INVESTORS” tab. The SEC also maintains a website at www.sec.gov that contains reports, proxy statements and other information about SEC registrants, including the company. Except as otherwise expressly set forth herein, the information contained on our website is neither included nor incorporated by reference herein.
The following corporate governance documents may be obtained free of charge through our website in the “CORPORATE GOVERNANCE” section of the “INVESTORS” tab or by sending a written request to Flowers Foods, Inc., 1919 Flowers Circle, Thomasville, GA 31757, Attention: Investor Relations.
|
|
• |
Finance Committee Charter |
|
|
• |
Audit Committee Charter |
|
|
• |
Nominating/Corporate Governance Committee Charter |
|
|
• |
Compensation Committee Charter |
|
|
• |
Flowers Foods, Inc. Employee Code of Conduct |
|
|
• |
Code of Business Conduct and Ethics for Officers and Members of the Board of Directors |
12
|
|
• |
Disclosure Policy |
|
|
• |
Stock Ownership Guidelines |
|
|
• |
Corporate Governance Guidelines |
|
Item 1A. |
Risk Factors |
You should carefully consider the risks described below, together with all of the other information included in this report, in considering our business and prospects. The risks and uncertainties described below are not the only ones facing us. These risk factors are not listed in any order of significance. Additional risks and uncertainties not presently known to us, or that we currently deem insignificant, may also impair our business operations. The occurrence of any of the following risks could harm our business, financial condition, liquidity, or results of operations.
Operational Risks
The extent to which the outbreak of the novel strain of coronavirus (COVID-19) and measures taken in response thereto impact our business, results of operations and financial condition will depend on future developments, which are highly uncertain and are difficult to predict.
COVID-19 has spread throughout the world, including the U.S., and has resulted in governmental and other regulatory authorities throughout the U.S. implementing numerous measures to try to contain the virus, such as travel bans and restrictions, quarantines, shelter-in-place orders, and shutdowns. These measures have impacted and may further impact the consumer, our workforce and operations, as well as the workforce, operations and financial prospects of our customers, vendors and suppliers. There is considerable uncertainty regarding such measures and potential future measures, such as restrictions on our access to our manufacturing facilities or on our support operations or workforce, or similar limitations for our customers, vendors and suppliers. The spread of COVID-19 has caused us to modify our business practices (including temporary bakery closures and restricting production at certain bakeries, restricting employee travel, developing social distancing plans for our employees, and cancelling physical participation in meetings, events and conferences), and we may take further actions as may be required by governmental and other regulatory authorities or as we determine are in the best interests of our employees, customers, vendors and suppliers. We can provide no assurance that such measures will be sufficient to mitigate the risks posed by the virus or will otherwise be satisfactory to governmental authorities.
COVID-19 has had, and will continue to have, a widespread and broad-reaching effect on the economy and our business. Some of the impacts our business has experienced, is experiencing or may experience as a result of COVID-19 include, but are not limited to, the following:
|
|
• |
We have experienced a favorable shift in sales mix to our branded retail products due to the change in consumer buying patterns as a result of the COVID-19 pandemic, which has positively impacted our business operations, including our sales, operating income and cash flows, and if there is a shift in mix away from our branded retail products to store branded and non-retail products, we expect that our results of operations, including our net sales, earnings and cash flows, could be negatively impacted; |
|
|
• |
Many of our foodservice customers have closed or restricted operations, which has adversely impacted our revenues from these customers, and has impacted, and could continue to impact, our ability to collect payment from these customers; |
|
|
• |
Consumer fears about contracting the disease have altered preferences and spending habits, including significant increases in purchases of fresh and frozen breads during the pendency of quarantines, shelter-in-place orders and other shutdowns; and these trends may not continue or may pull forward demand for our products from future periods, which could negatively affect our performance in future periods if consumers were to purchase fewer products from us; |
|
|
• |
We have experienced, and may experience in the future, temporary facility closures or partial shutdowns in response to government mandates in certain jurisdictions in which we operate and in response to positive diagnoses for COVID-19 in certain facilities for the safety of our employees; |
|
|
• |
Our distribution networks, including our DSD distribution system and our warehouse delivery system, where we manage our inventory, or the operations of our logistics and other service providers may be disrupted, temporarily closed or experience worker shortages; |
|
|
• |
Disruptions to our suppliers that supply our ingredients, packaging, and other materials necessary to produce, distribute, and sell our products may affect the ability of our suppliers to fulfill their obligations to us and may cause disruptions to our operations; and |
|
|
• |
We also implemented a work from home policy for many of our corporate employees, which may negatively impact productivity and cause other disruptions to our business. |
13
The extent to which the spread of COVID-19 impacts our business, results of operations and financial condition will depend on future developments, which are highly uncertain and are difficult to predict, including, but not limited to, the duration and spread of the outbreak, its severity, the actions to contain the virus or treat its impact, and how quickly and to what extent normal economic and operating conditions can resume. Even after the COVID-19 outbreak has subsided, we may continue to experience materially adverse impacts to our business as a result of the virus’s global economic impact, including the availability of credit, adverse impacts on our liquidity and any recession that has occurred or may occur in the future. Any of these events could exacerbate the other risks and uncertainties described herein, or in other reports filed with the SEC from time to time, and could materially adversely affect our business, results of operations and financial condition.
Economic conditions may negatively impact demand for our products, which could adversely impact our sales and operating profit.
The willingness of our customers and consumers to purchase our products may depend in part on economic conditions. Worsening economic conditions or future challenges to economic growth could have a negative impact on consumer demand, which could adversely affect our business. Deterioration of national and global economic conditions could cause consumers to shift purchases to more generic, lower-priced, or other value offerings, or consumers may forego certain purchases altogether during economic downturns and could result in decreased demand in the foodservice business. This economic uncertainty may increase pressure to reduce the prices of some of our products, limit our ability to increase or maintain prices, and reduce sales of higher margin products or shift our product mix to low-margin products.
In addition, changes in tax or interest rates, whether due to recession, financial and credit market disruptions or other reasons, could negatively impact us. In this regard, the U.K. Financial Conduct Authority announced on July 27, 2017 that it intends to stop persuading or compelling banks to submit rates for the calibration of the London Interbank Offered Rate (“LIBOR”) by the end of 2021. On November 30, 2020, ICE Benchmark Administration, the administrator of LIBOR, announced plans to cease publication of USD LIBOR on December 31, 2021 for only the one week and two-month tenors, and on June 30, 2023 for all other tenors. Certain of our variable rate debt and credit facility (as defined below) and hedging relationships use LIBOR as a benchmark for establishing interest rates. While we expect to have replaced or renegotiated these agreements by the end of 2021, we plan to incur additional indebtedness and/or negotiate new terms that will rely on alternative rates. The future of LIBOR is uncertain. Any legal or regulatory changes made in response to LIBOR’s future discontinuance may result in, among other things, a sudden or prolonged increase or decrease in LIBOR, a delay in or cessation of the publication of LIBOR, or changes in the rules or methodologies underpinning LIBOR. In addition, no consensus exists as to what rate or rates may become acceptable alternatives to LIBOR and any such rates may be impossible or impracticable to determine. The Alternative Reference Rates Committee, a group of market participants convened by the Federal Reserve Board and the Federal Reserve Bank of New York, has identified the Secured Overnight Financing Rate (“SOFR”) as the recommend alternative to LIBOR. The selection of SOFR as the alternative reference rate, however, currently presents certain market concerns and its acceptance as a LIBOR alternative is uncertain. We are evaluating the potential impact of the transition from LIBOR. While we do not expect that the transition from LIBOR and risks related thereto will have a material adverse effect on our financing costs, the size and scope of its impact on our financing costs is still uncertain at this time. If any of these events occurs, or if economic conditions become unfavorable, our financing costs, sales and profitability could be adversely affected.
A disruption in the operation of our DSD distribution system could negatively affect our results of operations, financial condition and cash flows.
A material negative change in our relationship with the independent distributors, litigation or one or more adverse rulings by courts or regulatory or governmental bodies in any of the jurisdictions in which we operate regarding our independent distributorship model, including actions or decisions that could affect the independent contractor classifications of the independent distributors, or an adverse judgment against the company for actions taken by the independent distributors, could materially and negatively affect our financial condition, results of operations and cash flows.
The costs of maintaining and enhancing the value and awareness of our brands are increasing, which could have an adverse impact on our revenues and profitability.
We rely on the success of our well-recognized brand names and we intend to maintain our strong brand recognition by continuing to devote resources to advertising, marketing and other brand building efforts. Brand value could diminish significantly due to several factors, including consumer perception that we have acted in an irresponsible manner, adverse publicity about our products (whether or not valid), our failure to maintain the quality of our products, the failure of our products to deliver consistently positive consumer experiences, or the products becoming unavailable to consumers. In addition, failure to comply with local or other laws and regulations could also hurt our reputation. Our marketing investments may not prove successful in maintaining or increasing our market share. If we are not able to successfully maintain our brand recognition or were to suffer damage to our reputation or loss of consumer confidence in our products for any of these reasons, our revenues and profitability could be adversely affected.
14
We rely on several large customers for a significant portion of sales and the loss of one of our large customers could adversely affect our business, financial condition or results of operations.
We have several large customers that account for a significant portion of sales, and the loss of one of our large customers could adversely affect our financial condition and results of operations. Our top ten customers accounted for 53.6% of sales during Fiscal 2020. Our largest customer, Walmart/Sam’s Club, accounted for 21.2% of sales during this period. These customers do not typically enter long-term sales contracts, and instead make purchase decisions based on a combination of price, product quality, consumer demand, and customer service performance. At any time, they may use more of their shelf space, including space currently used for our products, for store branded products or for products from other suppliers. Additionally, our customers may face financial or other difficulties that may impact their operations and their purchases from us. Disputes with significant suppliers could also adversely affect our ability to supply products to our customers. If our sales to one or more of these customers are reduced, this reduction may adversely affect our business, financial condition or results of operations.
Our inability to execute our business strategy could adversely affect our business.
We employ various operating strategies to maintain our position as one of the nation’s leading producers and marketers of bakery products available to customers through multiple channels of distribution. In particular, we initiated under Project Centennial, among other things, (i) the integration of acquisitions or the acquisition or disposition of assets at presently targeted values, (ii) the deployment of new systems and technology, and (iii) an enhanced organizational structure. Our focus on our long-term goals dedicated to the consumer and committed to growing our most profitable brands is dependent on our success in achieving our strategic priorities: (i) develop team; (ii) brands focus; (iii) prioritize margins; and (iv) smart M&A activity. These and related demands on our resources may divert the organization’s attention from other business issues. Our success is partly dependent upon properly executing, and realizing cost savings or other benefits from, these often-complex initiatives. Any failure to implement our initiatives could adversely affect our ability to grow margins. If we are unsuccessful in implementing or executing one or more of our business strategies, our business could be adversely affected.
We may be adversely impacted by the failure to successfully execute acquisitions and divestitures and integrate acquired operations.
From time to time, the company undertakes acquisitions or divestitures. The success of any acquisition or divestiture depends on the company’s ability to identify opportunities that help us meet our strategic objectives, consummate a transaction on favorable contractual terms, and achieve expected returns and other financial benefits.
Acquisitions, including future acquisitions, require us to efficiently integrate the acquired business or businesses, which involves a significant degree of difficulty, including the following:
|
|
• |
integrating the operations and business cultures of the acquired businesses while carrying on the ongoing operations of the businesses we operated prior to the acquisitions; |
|
|
• |
managing a significantly larger company than before consummation of the acquisitions; |
|
|
• |
the possibility of faulty assumptions underlying our expectations regarding the prospects of the acquired businesses; |
|
|
• |
coordinating a greater number of diverse businesses and businesses located in a greater number of geographic locations; |
|
|
• |
attracting and retaining the necessary personnel associated with the acquisitions; |
|
|
• |
creating uniform standards, controls, procedures, policies and information systems and controlling the costs associated with such matters; and |
|
|
• |
expectations about the performance of acquired trademarks and brands and the fair value of such trademarks and brands. |
Divestitures have operational risks that may include impairment charges. Divestitures also present unique financial and operational risks, including diverting management attention from the existing core business, separating personnel and financial data and other systems, and adversely affecting existing business relationships with suppliers and customers.
In situations where acquisitions or divestitures are not successfully implemented or completed, or the expected benefits of such acquisitions or divestitures are not otherwise realized, the company’s business or financial results could be negatively impacted.
15
Disruption in our supply chain or distribution capabilities from political instability, armed hostilities, incidents of terrorism, natural disasters, weather, inferior product or ingredient supply, or labor strikes could have an adverse effect on our business, financial condition and results of operations.
Our ability to make, move and sell products is critical to our success. Damage or disruption to our manufacturing or distribution capabilities, or the manufacturing or distribution capabilities of our suppliers, due to weather, natural disaster, fire or explosion, terrorism, pandemics, inferior product or ingredient supply, labor strikes or work stoppages, or adverse outcomes in litigation involving our independent distributor model, could impair our ability to make, move or sell our products. Moreover, terrorist activity, armed conflict, political instability or natural disasters that may occur within or outside the U.S. may disrupt manufacturing, labor, and other business operations. Failure to take adequate steps to mitigate the likelihood or potential impact of such events and disruption to our manufacturing or distribution capabilities, or to effectively manage such events if they occur, could adversely affect our business, financial conditions and results of operations.
The third-party vendor management processes may not be appropriately designed to reduce risks related to the delivery of goods, supplies and services.
As part of a concerted effort to achieve cost savings and efficiencies, we have entered into agreements with third-party vendors for the delivery of goods, supplies and services, including IT services. If we do not select quality vendors, appropriately review vendor contracts and monitor these vendors’ performance (including their ability to protect our customer, consumer or other confidential data), or if any of these third-parties do not perform according to the terms of the agreements, we may not be able to achieve the expected cost savings, we may have to incur additional costs to correct errors made by such third-party vendors or our reputation could be harmed by any failure to perform.
Increases in employee and employee-related costs could have adverse effects on our profitability.
Health care and workers’ compensation costs are increasing and will likely continue to do so. Any substantial increase in these costs may have an adverse impact on our profitability. The company records the liabilities related to its benefit plans based on actuarial valuations, which include key assumptions determined by management. Material changes in benefit plan liabilities may occur in the future due to changes in these assumptions. Future annual amounts could be impacted by various factors, such as changes in the number of plan participants, changes in the discount rate, changes in the expected long-term rate of return, changes in the level of contributions to the plan, and other factors. In addition, legislation or regulations involving labor and employment and employee benefit plans (including employee health care benefits and costs) may impact our operational results.
Technology Risks
We may be adversely impacted if our IT systems fail to perform adequately, including with respect to cybersecurity issues.
The efficient operation of our business depends on our IT systems. We rely on our IT systems to effectively manage our business data, communications, supply chain, order entry and fulfillment, and other business processes. The failure of our IT systems (including those provided to us by third-parties) to perform as we anticipate could disrupt our business and could result in billing, collecting and ordering errors, processing inefficiencies, and the loss of sales and customers, causing our business and results of operations to suffer.
In addition, our IT systems (including those provided to us by third parties) may be vulnerable to damage or interruption from circumstances beyond our control, including fire, natural disasters, systems failures, security breaches or intrusions (including theft of customer, consumer or other confidential data), and viruses. If we are unable to prevent physical and electronic break-ins, cyber-attacks and other information security breaches, we may suffer financial and reputational damage, be subject to litigation or incur remediation costs or penalties because of the unauthorized disclosure of confidential information belonging to us or to our partners, customers, suppliers or employees.
We may experience difficulties in designing and implementing our new ERP system.
We are in the midst of implementing a new ERP system, which will replace our existing financial and operating systems. The ERP system will be designed to accurately maintain our financial records, enhance our operational functionality and provide timely information to our management team related to the operations of the business. The design and implementation of this new ERP system requires an investment of significant personnel and financial resources, including substantial expenditures for outside consultants, system hardware and software in addition to other expenses in connection with the transformation of our organizational structure and financial and operating processes. We may not be able to implement the ERP system successfully without experiencing delays, increased costs and other difficulties, including potential design defects, miscalculations, testing requirements, and the diversion of management’s attention from day-to-day business operations. If we are unable to implement the new ERP system as planned, the
16
effectiveness of our internal control over financial reporting could be adversely affected, our ability to assess those controls adequately could be delayed, and our financial condition, results of operations and cash flows could be negatively impacted.
Industry Risks
Increases in costs and/or shortages of raw materials, fuels and utilities could adversely impact our profitability.
Raw materials, such as flour, sweeteners, shortening, yeast, and water, which are used in our bakery products, are subject to price fluctuations. The cost of these inputs may fluctuate widely due to foreign and domestic government policies and regulations, weather conditions, domestic and international demand, or other unforeseen circumstances. Any substantial change in the prices or availability of raw materials may have an adverse impact on our profitability. We enter into forward purchase agreements and other derivative financial instruments from time to time to manage the impact of such volatility in raw materials prices; however, these strategies may not be adequate to overcome increases in market prices or availability. Our failure to enter into hedging or fixed price arrangements or any decrease in the availability or increase in the cost of these agreements and instruments could increase the price of these raw materials and significantly affect our earnings.
In addition, we are dependent upon natural gas or propane for firing ovens. The independent distributors and third-party transportation companies are dependent upon gasoline and diesel for their vehicles. The cost of fuel may fluctuate widely due to economic and political conditions, government policy and regulation, war, or other unforeseen circumstances. Substantial future increases in prices for, or shortages of, these fuels could have a material adverse effect on our profitability, financial condition or results of operations. There can be no assurance that we can cover these potential cost increases through future pricing actions. Also, as a result of these pricing actions, consumers could purchase less or move from purchasing higher-margin products to lower-margin products.
Competition could adversely impact revenues and profitability.
The U.S. bakery industry is highly competitive. Our principal competitors in these categories all have substantial financial, marketing, and other resources. In most product categories, we compete not only with other widely advertised branded products, but also with store branded products that are generally sold at lower prices. Competition is based on product availability, product quality, price, effective promotions, and the ability to target changing consumer preferences. Substantial growth in e-commerce has encouraged the entry of new competitors and business models, intensifying competition by simplifying distribution and lowering barriers to entry. The expanding presence of e-commerce retailers has impacted, and may continue to impact, consumer preferences and market dynamics, which in turn may negatively affect our sales or profits. We experience price pressure from time to time due to competitors’ promotional activity and other pricing efforts. This pricing pressure is particularly strong during adverse economic periods. Increased competition could result in reduced sales, margins, profits and market share.
Product removals, damaged product or safety concerns could adversely impact our results of operations.
We may be required to recall certain of our products should they be mislabeled, contaminated, spoiled, tampered with or damaged. We may become involved in lawsuits and legal proceedings alleging that the consumption of any of our products causes or caused injury, illness or death. Any such product removal, damaged product or an adverse result in any litigation related to such a product removal or damaged product could have a material adverse effect on our operating and financial results in future periods, depending on the costs of the product removal from the market, the destruction of product inventory, diversion of management time and attention, contractual and other claims made by customers that we supply, loss of key customers, competitive reaction and consumer attitudes. Even if a product liability, consumer fraud or other claim is unsuccessful or without merit, the negative publicity surrounding such assertions regarding our products could adversely affect our reputation and brand image. We also could be adversely affected if our customers or consumers in our principal markets lose confidence in the safety and quality of our products.
During Fiscal 2018, 2019, and 2020, we have been required, and may be required in future periods, to remove certain of our products from the market should they be mislabeled, contaminated, spoiled, tampered with or damaged, including as a result of inferior ingredients provided by any of our suppliers.
Consolidation in the retail and foodservice industries could adversely affect our sales and profitability.
We expect consolidations among our retail and foodservice customers to continue. If this trend continues and our retail and foodservice customers continue to grow larger due to consolidation in their respective industries, they may demand lower pricing and increased promotional programs. In addition, these pressures may restrict our ability to increase prices, including in response to commodity and other cost increases. Our margins and profits could decrease if a reduction in prices or increased costs are not counterbalanced with increased sales volume.
17
Inability to anticipate or respond to changes in consumer preferences may result in decreased demand for our products, which could have an adverse impact on our future growth and operating results.
Our success depends in part on our ability to respond to current market trends and to anticipate the tastes and dietary habits of consumers, including concerns of consumers regarding health and wellness, obesity, product attributes, ingredients, and packaging. Similarly, demand for our products could be negatively affected by consumer concerns or perceptions regarding the health effects of specific ingredients such as, but not limited to, sodium, trans fats, sugar, processed wheat, or other product ingredients or attributes. Introduction of new products and product extensions requires significant development and marketing investment. If we fail to anticipate, identify, or react to changes in consumer preferences, or if we fail to introduce new and improved products on a timely basis, we could experience reduced demand for our products, which could cause our sales, profitability, and our operating results to suffer.
Our large customers may impose requirements on us that may adversely affect our results of operations.
From time to time, our large customers may re-evaluate or refine their business practices and impose new or revised requirements on us, the distributors, and the customers’ other suppliers. The growth of large mass merchandisers, supercenters and dollar stores, together with changes in consumer shopping patterns, have produced large, sophisticated customers with increased buying power and negotiating strength. Current trends among retailers and foodservice customers include fostering high levels of competition among suppliers, demanding new products or increased promotional programs, requiring suppliers to maintain or reduce product prices, reducing shelf space for our products, and requiring product delivery with shorter lead times. These business changes may involve inventory practices, logistics, or other aspects of the customer-supplier relationship. Compliance with requirements imposed by large customers may be costly and may have an adverse effect on our margins and profitability. However, if we fail to meet a large customer’s demands, we could lose that customer’s business, which also could adversely affect our sales and results of operations.
Legal and Regulatory Risks
Government regulation could adversely impact our results of operations and financial condition.
As a producer and marketer of food items, our production processes, product quality, packaging, labeling, storage, and distribution, and the safety of food products and the health and safety of our employees, are subject to regulation by various federal, state and local government entities and agencies. In addition, the marketing and labeling of food products has come under increased scrutiny in recent years, and the food industry has been subject to an increasing number of legal proceedings and claims relating to alleged false or deceptive marketing and labeling under federal, state or local laws or regulations. Uncertainty regarding labeling standards has led to customer confusions and legal challenges.
In addition, our operations are subject to extensive and increasingly stringent regulations administered by the Environmental Protection Agency related to the discharge of materials into the environment and the handling and disposition of wastes. Failure to comply with these regulations can have serious consequences, including civil and administrative penalties and negative publicity. Changes in applicable laws or regulations or evolving interpretations thereof, including increased government regulations to limit carbon dioxide and other greenhouse gas emissions as a result of concern over climate change, may result in increased compliance costs, capital expenditures, and other financial obligations for us, which could affect our profitability or impede the production or distribution of our products, and affect our sales.
Compliance with federal, state and local laws and regulations is costly and time consuming. Failure to comply with, or violations of, applicable laws and the regulatory requirements of one or more of these entities and agencies could subject us to civil remedies, including fines, injunctions, recalls or seizures, as well as potential criminal sanctions, any of which could result in increased operating costs and adversely affect our results of operations and financial condition. Legal proceedings or claims related to our marketing could damage our reputation and/or adversely affect our business or financial results.
Climate change, or legal, regulatory, or market measures to address climate change, may negatively affect our business and operations.
There is growing concern that carbon dioxide and other greenhouse gases in the atmosphere may have an adverse impact on global temperatures, weather patterns, and the frequency and severity of extreme weather and natural disasters. In the event that such climate change has a negative effect on agricultural productivity, we may be subject to decreased availability or less favorable pricing for certain commodities that are necessary for our products, such as corn and wheat. Adverse weather conditions and natural disasters can reduce crop size and crop quality, which in turn could reduce our supplies of raw materials, lower recoveries of usable raw materials, increase the prices of our raw materials, increase our cost of transporting and storing raw materials, or disrupt our production schedules.
18
We may also be subjected to decreased availability or less favorable pricing for water as a result of such change, which could impact our production and distribution operations. In addition, natural disasters and extreme weather conditions may disrupt the productivity of our facilities or the operation of our supply chain. The increasing concern over climate change also may result in more regional, federal, and/or global legal and regulatory requirements to reduce or mitigate the effects of greenhouse gases. In the event that such regulation is enacted and is more aggressive than the sustainability measures that we are currently undertaking to monitor our emissions and improve our energy efficiency, we may experience significant increases in our costs of operation and delivery. In particular, increasing regulation of fuel emissions could substantially increase the distribution and supply chain costs associated with our products. As a result, climate change could negatively affect our business and operations.
We are subject to increasing legal complexity and could be party to litigation that may adversely affect our business.
Increasing legal complexity may continue to affect our operations and results in material ways. We are or could be subject to legal proceedings that may adversely affect our business, including class actions, administrative proceedings, government investigations, securities laws, employment and personal injury claims, disputes with current or former suppliers, claims by current or former distributors, and intellectual property claims (including claims that we infringed another party’s trademarks, copyrights, or patents). Inconsistent standards imposed by governmental authorities can adversely affect our business and increase our exposure to litigation. Litigation involving our independent distributor model and the independent contractor classification of the independent distributors, as well as litigation related to disclosure made by us in connection therewith, if determined adversely, could increase costs, negatively impact our business prospects and the business prospects of our distributors and subject us to incremental liability for their actions. We are also subject to the legal and compliance risks associated with privacy, data collection, protection and management, in particular as it relates to information we collect when we provide products to customers.
Executive Offices
The address and telephone number of our principal executive offices are 1919 Flowers Circle, Thomasville, Georgia 31757, (229) 226-9110.
Information about our Executive Officers
The following table sets forth certain information regarding the persons who currently serve as the executive officers of Flowers Foods.
EXECUTIVE OFFICERS
|
Name, Age and Office |
|
Business Experience |
|
|
|
|
|
A.Ryals McMullian Age 51 President and Chief Executive Officer |
|
Mr. McMullian was elected CEO in May 2019. Previously, he served as COO from July 2018 until May 2019. Mr. McMullian served as chief strategy officer from May 2017 to July 2018, and as vice president of mergers and acquisitions and deputy general counsel from 2015 until 2017. Mr. McMullian served as vice president and associate general counsel from 2011 until 2015 and as associate general counsel from 2003, when he joined the company, until 2011. |
|
|
|
|
|
R. Steve Kinsey Age 60 Chief Financial Officer and |
|
Mr. Kinsey was named chief financial officer (“CFO”) and chief accounting officer (“CAO”) in April 2020. Previously, he served as executive vice president and CFO and chief administrative officer from May 2017 to April 2020. Mr. Kinsey served as executive vice president and CFO from 2008 until 2017, and as senior vice president and CFO from 2007 to 2008. Prior to those appointments, Mr. Kinsey served in various accounting roles since joining the company in 1989. |
|
|
|
|
|
Bradley K. Alexander Age 62 Chief Operating Officer |
|
Mr. Alexander was named COO in May 2019. Previously, he served as president of the Fresh Packaged Bread Business Unit from May 2017 to May 2019, as executive vice president and COO of Flowers Foods from July 2014 to May 2017, and as president of Flowers Bakeries from July 2008 to July 2014. Mr. Alexander joined the company in 1981. |
|
|
|
|
|
Robert L. Benton, Jr. Age 63 Executive Vice President of Network Optimization |
|
Mr. Benton was named executive vice president of network optimization in November 2019. He previously served as chief supply chain officer from May 2017 until November 2019. Mr. Benton served as senior vice president and chief manufacturing officer from January 2015 to May 2017 and as senior vice president of manufacturing and operations support from March 2011 until January 2015. Prior to that, he held various manufacturing positions since joining the company in 1980. |
19
|
Name, Age and Office |
|
Business Experience |
|
|
|
|
|
Brad Cashaw Age 57 Chief Supply Chain Officer |
|
Mr. Cashaw joined Flowers as chief supply chain officer (“CSCO”) in September 2020. Before joining Flowers, Mr. Cashaw served as executive vice president and CSCO at Dean Foods, a dairy product manufacturing company, from March 2016 to September 2019. Prior to that, he was vice president, integrated supply chain for the cheese and dairy division at Kraft Foods Group from October 2013 to August 2015. Mr. Cashaw also held production and supply chain roles at the Kellogg Company and PepsiCo. |
|
|
|
|
|
Mark Chaffin Age 50 Chief Information Officer |
|
Mr. Chaffin was named chief information officer (“CIO”) in February 2020 after serving four months in an interim capacity. Prior to joining Flowers, Mr. Chaffin was a partner in the Southeast practice of Fortium Partners, a provider of technology leadership services, from 2019 until joining Flowers. He also served as CIO at sgsco, a global package and brand design and marketing company, from 2015 to 2019 and as CIO for Acosta Sales and Marketing from 2007 to 2015. |
|
|
|
|
|
H. Mark Courtney Age 60 Chief Brand Officer
|
|
Mr. Courtney was named chief brand officer in July 2020. He previously served as president of the Fresh Packaged Bread Business Unit from May 2019 to July 2020, senior vice president of retail accounts from May 2017 to May 2019, and senior vice president of sales from June 2008 to May 2017. Prior to that, Mr. Courtney served in various sales positions since joining the company in 1983. |
|
|
|
|
|
Debo Mukherjee Age 53 Chief Marketing Officer |
|
Mr. Mukherjee joined Flowers as chief marketing officer in October 2017. Before joining Flowers, Mr. Mukherjee was founder and owner of Intacta Consulting Group, LLC, a marketing consulting firm, from 2015 to 2019. Prior to that, he served as CEO of Redco Foods, Inc. from 2011 to 2015. He also held marketing roles at Mars Inc., Unilever, H.J. Heinz Co. and The Hershey Company. |
|
|
|
|
|
David M. Roach Age 51 President, Cake Operations
|
|
Mr. Roach was named president of cake operations in July 2020. He previously served as president of the Snacking/Specialty Business Unit from May 2017 to July 2020 and as senior vice president of organics from September 2015 until May 2017. Mr. Roach served in various sales and management positions since joining the company in 1992. |
|
|
|
|
|
Tonja Taylor Age 61 Chief Human Resources Officer |
|
Ms. Taylor was named chief human resources officer in May 2017. She served as senior vice president of human resources from September 2013 until May 2017 and as vice president of human resources from June 2008 until September 2013. Prior to these appointments, Ms. Taylor held various human resources positions since joining the company in 1999. |
|
|
|
|
|
Stephanie B. Tillman Age 50 Chief Legal Counsel |
|
Ms. Tillman was named chief legal counsel effective January 2020. Previously, she served as vice president, chief compliance officer, and deputy general counsel from April 2011 to January 2020. Prior to that, Ms. Tillman served in various roles in the legal department since joining the company in 1995. |
|
|
|
|
|
Heeth Varnedoe IV Age 54 Chief Transformation Officer |
|
Mr. Varnedoe was named chief transformation officer in December 2020. Previously, he served as senior vice president of DSD Regions/Sales from 2017 until 2020, as president of Flowers’ Phoenix, Arizona bakery from 2016 to 2017, as vice president of national accounts from 2013 to 2016, and as director of DSD cake sales in 2012. Mr. Varnedoe joined Flowers in 1990 and held a number of positions before leaving the company in 2000 to pursue other business interests. He rejoined Flowers in 2012. |
|
|
|
|
|
D. Keith Wheeler Age 57 Chief Sales Officer |
|
Mr. Wheeler was named chief sales officer in May 2017. Previously, he served as president of Flowers Bakeries from July 2014 until May 2017. Prior to that, Mr. Wheeler served in various leadership roles, including regional senior vice president, regional controller, and bakery president. He joined the company in 1988. |
|
|
|
|
|
Item 1B. |
Unresolved Staff Comments. |
None
20
|
Item 2. |
Properties |
The company currently operates 46 bakeries, of which 44 are owned and two are leased. We believe our properties are in good condition, well maintained, and sufficient for our present operations. Our production plant locations are:
|
State |
|
City |
|
State |
|
City |
|
Alabama |
|
Birmingham |
|
Kentucky |
|
London |
|
Alabama |
|
Montgomery |
|
Louisiana |
|
Baton Rouge |
|
Alabama |
|
Tuscaloosa |
|
Louisiana |
|
Lafayette |
|
Arizona |
|
Mesa |
|
Louisiana |
|
New Orleans |
|
Arizona |
|
Phoenix |
|
Maine |
|
Lewiston (2 locations) |
|
Arizona |
|
Tolleson |
|
Nevada |
|
Henderson |
|
Arkansas |
|
Batesville |
|
North Carolina |
|
Goldsboro |
|
Arkansas |
|
Texarkana |
|
North Carolina |
|
Jamestown |
|
California |
|
Modesto (Leased) |
|
North Carolina |
|
Newton |
|
Colorado |
|
Johnstown |
|
Oregon |
|
Milwaukie |
|
Florida |
|
Bradenton |
|
Pennsylvania |
|
Oxford |
|
Florida |
|
Jacksonville |
|
Pennsylvania |
|
Philadelphia (Leased) |
|
Florida |
|
Lakeland |
|
Tennessee |
|
Cleveland |
|
Florida |
|
Miami |
|
Tennessee |
|
Crossville |
|
Georgia |
|
Atlanta |
|
Tennessee |
|
Knoxville |
|
Georgia |
|
Savannah |
|
Texas |
|
Denton |
|
Georgia |
|
Suwanee |
|
Texas |
|
El Paso |
|
Georgia |
|
Thomasville |
|
Texas |
|
Houston (2 locations) |
|
Georgia |
|
Tucker |
|
Texas |
|
San Antonio |
|
Georgia |
|
Villa Rica |
|
Texas |
|
Tyler |
|
Kansas |
|
Lenexa |
|
Virginia |
|
Lynchburg |
|
Kentucky |
|
Bardstown |
|
Virginia |
|
Norfolk |
In Thomasville, Georgia, the company leases properties that house shared services functions and our IT group and owns several properties for our corporate offices. The company also houses an additional shared services center at its Phoenix, Arizona bakery.
|
Item 3. |
Legal Proceedings |
For a description of all material pending legal proceedings, See Note 23, Commitments and Contingencies, of Notes to Consolidated Financial Statements of this Form 10-K.
|
Item 4. |
Mine Safety Disclosures |
Not Applicable
21
PART II
|
Item 5. |
Market for the Registrant’s Common Equity, Related Stockholder Matters and Issuer Purchases of Equity Securities |
Market Information
Shares of the company’s common stock are quoted on the New York Stock Exchange (the “NYSE”) under the symbol “FLO.”
Holders
As of February 18, 2021, there were approximately 3,385 holders of record of the company’s common stock.
Dividends
The payment of dividends is subject to the discretion of the company’s Board. The Board bases its decisions regarding dividends on, among other things, general business conditions, our financial results, contractual, legal and regulatory restrictions regarding dividend payments and any other factors the Board may consider relevant.
Securities Authorized for Issuance Under Equity Compensation Plans
The following chart sets forth the amounts of securities authorized for issuance under the company’s compensation plans as of January 2, 2021.
|
|
|
Number of Securities to be Issued Upon Exercise of Outstanding Options, Warrants and Rights |
|
|
Weighted Average Exercise Price of Outstanding Options, Warrants and Rights |
|
|
Number of Securities Remaining Available for Future Issuance Under Equity Compensation Plans (Excluding Securities Reflected in Column(a)) |
|
|||
|
Plan Category |
|
(a) |
|
|
(b) |
|
|
(c) |
|
|||
|
Equity compensation plans approved by security holders |
|
|
— |
|
|
$ |
— |
|
|
|
4,231,031 |
|
|
Equity compensation plans not approved by security holders |
|
|
— |
|
|
|
— |
|
|
|
— |
|
|
Total |
|
|
— |
|
|
$ |
— |
|
|
|
4,231,031 |
|
Under the company’s 2014 Omnibus Equity and Incentive Compensation Plan (the “Omnibus Plan”), the Board is authorized to grant a variety of stock-based awards, including stock options, restricted stock and deferred stock, to its directors and certain of its employees. The number of securities set forth in column (c) above reflects securities available for issuance as stock options, restricted stock and deferred stock under the company’s compensation plans. The number of shares originally available under the Omnibus Plan is 8,000,000 shares. The Omnibus Plan replaced the Flowers Foods’ 2001 Equity and Performance Incentive Plan, as amended and restated as of April 1, 2009 (“EPIP”), the Stock Appreciation Rights Plan, and the Annual Executive Bonus Plan. As a result, no additional shares will be issued under the EPIP. See Note 19, Stock-Based Compensation, of Notes to Consolidated Financial Statements of this Form 10-K for additional information on equity compensation plans.
Purchases of Equity Securities by the Issuer
The company did not purchase any shares of its common stock during the fourth quarter of Fiscal 2020.
22
Stock Performance Graph
The chart below is a comparison of the cumulative total return (assuming the reinvestment of all dividends paid) of our common stock, Standard & Poor’s 500 Index, Standard & Poor’s 500 Packaged Foods and Meats Index, and Standard & Poor’s MidCap 400 Index for the period January 2, 2016 through January 2, 2021 the last day of our 2020 fiscal year.

|
|
|
January 2, 2016 |
|
|
December 31, 2016 |
|
|
December 30, 2017 |
|
|
December 29, 2018 |
|
|
December 28, 2019 |
|
|
January 2, 2021 |
|
||||||
|
FLOWERS FOODS INC |
|
|
100.00 |
|
|
|
96.54 |
|
|
|
96.75 |
|
|
|
94.92 |
|
|
|
116.75 |
|
|
|
125.77 |
|
|
S&P 500 INDEX |
|
|
100.00 |
|
|
|
111.96 |
|
|
|
136.40 |
|
|
|
129.31 |
|
|
|
171.94 |
|
|
|
203.04 |
|
|
S&P 500 PACKAGED FOODS & MEAT INDEX |
|
|
100.00 |
|
|
|
109.14 |
|
|
|
110.61 |
|
|
|
89.65 |
|
|
|
117.35 |
|
|
|
122.82 |
|
|
S&P MIDCAP 400 INDEX |
|
|
100.00 |
|
|
|
120.74 |
|
|
|
140.35 |
|
|
|
123.53 |
|
|
|
157.40 |
|
|
|
179.00 |
|
Companies in the S&P 500 Index, the S&P 500 Packaged Foods and Meats Index, and the S&P MidCap 400 Index are weighted by market capitalization and indexed to $100 at January 2, 2016. Flowers Foods’ share price is also indexed to $100 at January 2, 2016.
23
|
Item 6. |
Selected Financial Data |
The selected consolidated historical financial data presented below as of and for the fiscal years 2020, 2019, 2018, 2017, and 2016 have been derived from the audited Consolidated Financial Statements of the company. The results of operations presented below are not necessarily indicative of results that may be expected for any future period and should be read in conjunction with Management’s Discussion and Analysis of Financial Condition and Results of Operations, and our Consolidated Financial Statements and the accompanying Notes to Consolidated Financial Statements included in this Form 10-K (amounts in thousands, except per share data).
|
|
|
For Fiscal Year |
|
|||||||||||||||||
|
|
|
Fiscal 2020 |
|
|
Fiscal 2019 |
|
|
Fiscal 2018 |
|
|
Fiscal 2017 |
|
|
Fiscal 2016 |
|
|||||
|
|
|
53 Weeks |
|
|
52 Weeks |
|
|
52 Weeks |
|
|
52 Weeks |
|
|
52 Weeks |
|
|||||
|
Statement of Income Data: |
|
|
|
|
|
|
|
|
|
|
|
|
|
|
|
|
|
|
|
|
|
Sales |
|
$ |
4,387,991 |
|
|
$ |
4,123,974 |
|
|
$ |
3,951,852 |
|
|
$ |
3,920,733 |
|
|
$ |
3,926,885 |
|
|
Net income |
|
$ |
152,318 |
|
|
$ |
164,538 |
|
|
$ |
157,160 |
|
|
$ |
150,120 |
|
|
$ |
163,776 |
|
|
Net income attributable to Flowers Foods, Inc. common shareholders per basic share |
|
$ |
0.72 |
|
|
$ |
0.78 |
|
|
$ |
0.74 |
|
|
$ |
0.72 |
|
|
$ |
0.79 |
|
|
Net income attributable to Flowers Foods, Inc. common shareholders per diluted share |
|
$ |
0.72 |
|
|
$ |
0.78 |
|
|
$ |
0.74 |
|
|
$ |
0.71 |
|
|
$ |
0.78 |
|
|
Cash dividends per common share |
|
$ |
0.7900 |
|
|
$ |
0.7500 |
|
|
$ |
0.7100 |
|
|
$ |
0.6700 |
|
|
$ |
0.6250 |
|
|
Balance Sheet Data: |
|
|
|
|
|
|
|
|
|
|
|
|
|
|
|
|
|
|
|
|
|
Total assets |
|
$ |
3,323,023 |
|
|
$ |
3,177,776 |
|
|
$ |
2,845,537 |
|
|
$ |
2,659,724 |
|
|
$ |
2,761,068 |
|
|
Long-term debt and right-of-use lease liabilities |
|
$ |
1,253,957 |
|
|
$ |
1,206,299 |
|
|
$ |
990,640 |
|
|
$ |
820,141 |
|
|
$ |
946,667 |
|
Notes to the Selected Financial Data table for additional context
|
1. |
Fiscal 2020 includes the impact of the following items which affect comparability (amounts in thousands): |
|
Items presented separately on the Consolidated Statements of Income |
|
First Quarter |
|
|
Second Quarter |
|
|
Third Quarter |
|
|
Fourth Quarter |
|
|
Fiscal 2020 |
|
|
Footnote |
|||||
|
Loss on inferior ingredients |
|
$ |
— |
|
|
$ |
— |
|
|
$ |
— |
|
|
$ |
107 |
|
|
$ |
107 |
|
|
Note 4 |
|
Restructuring and related impairment charges |
|
$ |
— |
|
|
$ |
10,535 |
|
|
$ |
20,100 |
|
|
$ |
4,848 |
|
|
$ |
35,483 |
|
|
Note 5 |
|
Pension plan settlement and curtailment loss (gain) |
|
$ |
116,207 |
|
|
$ |
— |
|
|
$ |
(7,153 |
) |
|
$ |
(297 |
) |
|
$ |
108,757 |
|
|
Note 21 |
|
2. |
Fiscal 2020 also includes consulting costs for ERP Road Mapping (as defined below) of $4.4 million, Project Centennial consulting costs of $15.5 million, legal settlement charges of $7.3 million, and a lease termination gain of $4.1 million, all of which are recognized in the selling, distribution and administrative expenses line item on the Consolidated Statements of Income during Fiscal 2020. Additionally, Fiscal 2020 includes 53 weeks. |
|
3. |
Fiscal 2019 includes the impact of the following items which affect comparability (amounts in thousands): |
|
Items presented separately on the Consolidated Statements of Income |
|
First Quarter |
|
|
Second Quarter |
|
|
Third Quarter |
|
|
Fourth Quarter |
|
|
Fiscal 2019 |
|
|
Footnote |
|||||
|
(Recovery) loss on inferior ingredients |
|
$ |
(413 |
) |
|
$ |
— |
|
|
$ |
— |
|
|
$ |
376 |
|
|
$ |
(37 |
) |
|
Note 4 |
|
Restructuring and related impairment charges |
|
$ |
718 |
|
|
$ |
2,047 |
|
|
$ |
3,277 |
|
|
$ |
17,482 |
|
|
$ |
23,524 |
|
|
Note 5 |
The company adopted Accounting Standard Update (“ASU”) No. 2016-02 Leases (ASC Topic 842, the “new standard”) that requires companies to recognize lease liabilities and a right-of-use asset for virtually all leases on the balance sheet. The company adopted this standard at the beginning of our Fiscal 2019 using the modified retrospective transition method. The impact at adoption was an increase to assets of $387.3 million and an increase to liabilities of $391.9 million.
|
4. |
Fiscal 2019 also includes legal settlement charges of $28.0 million recognized in the selling, distribution and administrative expenses line item on the Consolidated Statements of Income during Fiscal 2019. |
24
|
5. |
Fiscal 2018 includes the impact of the following items which affect comparability (amounts in thousands): |
|
Items presented separately on the Consolidated Statements of Income |
|
Fiscal 2018 |
|
|
Footnote |
|
|
Loss on inferior ingredients |
|
$ |
3,212 |
|
|
Note 4 |
|
Restructuring and related impairment charges |
|
$ |
9,767 |
|
|
Note 5 |
|
Multi-employer pension plan withdrawal costs |
|
$ |
2,322 |
|
|
Note 21 |
|
Pension plan settlement loss |
|
$ |
7,781 |
|
|
Note 21 |
|
Impairment of assets |
|
$ |
5,999 |
|
|
Note 2 |
The company purchased Canyon Bakehouse, LLC (“Canyon”) on December 14, 2018. See Note 10, Acquisition, of Notes to Consolidated Financial Statements of this Form 10-K, for more detailed disclosures for the acquisition. Its results of operations for the period from December 14, 2018 through December 29, 2018 were excluded due to immateriality and were reported in the first quarter of Fiscal 2019.
|
6. |
Fiscal 2018 also includes the impact of $21.5 million of legal settlements, $4.5 million in acquisition-related costs, and $9.7 million of Project Centennial costs all of which are recognized in the selling, distribution and administrative expenses line item on the Consolidated Statements of Income during Fiscal 2018. |
|
7. |
Fiscal 2017 includes the impact of the $28.9 million gain on divestiture of the non-core mix manufacturing business, $104.1 million of restructuring an related impairment charges, $18.3 million of multi-employer pension plan withdrawal costs, a $4.6 million pension plan settlement loss, a $48.2 million income tax benefit as a result of tax reform, and $37.3 million of Project Centennial consulting costs. |
|
8. |
Fiscal 2016 includes the impact of a $6.6 million pension plan settlement loss, $24.9 million of impairment charges, $10.5 million of legal settlements (including $0.3 million of related tax liabilities) which affect comparability, the issuance of our $400.0 million senior notes due 2026, and $1.9 million of debt issuance costs recognized as interest expense (for a loss on extinguishment of debt) at the time we paid off $367.5 million of outstanding indebtedness under two of our term loans. |
25
|
Item 7. |
Management’s Discussion and Analysis of Financial Condition and Results of Operations |
The following discussion should be read in conjunction with Item 1., Business, and the Consolidated Financial Statements and accompanying Notes to Consolidated Financial Statements included in this Form 10-K. The following information contains forward-looking statements which involve certain risks and uncertainties. See Forward-Looking Statements at the beginning of this Form 10-K.
Management’s Discussion and Analysis of Financial Condition and Results of Operations (“MD&A”) is segregated into four sections, including:
|
|
• |
Executive overview — provides a summary of our operating performance and cash flows, industry trends, and our strategic initiatives. |
|
|
• |
Critical accounting estimates — describes the accounting areas where management makes critical estimates to report our financial condition and results of operations. |
|
|
• |
Results of operations — an analysis of the company’s consolidated results of operations for Fiscal 2020 compared to Fiscal 2019 as presented in the Consolidated Financial Statements. Refer to the Annual Report on Form 10-K for the fiscal year ended December 28, 2019 for a discussion of the results of operations for Fiscal 2019 compared to Fiscal 2018. |
|
|
• |
Liquidity, capital resources and financial position — an analysis of cash flow, contractual obligations, and certain other matters affecting the company’s financial position. |
MATTERS AFFECTING COMPARABILITY
Detailed below are expense (recovery) items affecting comparability that will provide additional context while reading this discussion:
|
|
|
Fiscal 2020 |
|
|
Fiscal 2019 |
|
|
Footnote |
||
|
|
|
53 weeks |
|
|
52 weeks |
|
|
Disclosure |
||
|
|
|
(Amounts in thousands) |
|
|
|
|||||
|
Project Centennial consulting costs |
|
$ |
15,548 |
|
|
$ |
784 |
|
|
Note 5 |
|
ERP Road Mapping consulting costs |
|
|
4,363 |
|
|
|
— |
|
|
|
|
Restructuring and related impairment charges |
|
|
35,483 |
|
|
|
23,524 |
|
|
Note 5 |
|
Loss (recovery) on inferior ingredients |
|
|
107 |
|
|
|
(37 |
) |
|
Note 4 |
|
Non-restructuring lease termination gain |
|
|
(4,066 |
) |
|
|
— |
|
|
Note 2 |
|
Pension plan settlement and curtailment loss |
|
|
108,757 |
|
|
|
— |
|
|
Note 21 |
|
Acquisition-related costs |
|
|
— |
|
|
|
22 |
|
|
Note 10 |
|
Legal settlements |
|
|
7,250 |
|
|
|
28,014 |
|
|
Note 23 |
|
Other pension plan termination costs |
|
|
133 |
|
|
|
— |
|
|
|
|
Executive retirement agreement |
|
|
— |
|
|
|
763 |
|
|
|
|
|
|
$ |
167,575 |
|
|
$ |
53,070 |
|
|
|
Project Centennial consulting costs. During the second quarter of Fiscal 2016, we launched Project Centennial, an enterprise-wide business and operational review. Key initiatives of the project are outlined in Item 1., Business, of this Form 10-K. As of the end of Fiscal 2016, we had completed the diagnostic phase and as of the end of Fiscal 2020, we have completed the implementation phase of Project Centennial. Consulting costs associated with the project in Fiscal 2020 and 2019 were $15.5 million and $0.8 million, respectively. Costs incurred in Fiscal 2020 primarily related to further refining our organizational structure, portfolio and supply chain optimization initiatives, and improving our cake operations. In Fiscal 2019, costs were primarily related to the portfolio and supply chain network optimization initiatives. These consulting costs are reflected in the selling, distribution and administrative expenses line item of the Consolidated Statements of Income.
Consulting costs for planning the upgrade of our ERP platform and the broader digital strategy initiative. As discussed further in Item 1., Business, of this Form 10-K, we began planning for the upgrade of our ERP platform and other system related enhancements (the “ERP Road Mapping”) during the third quarter of Fiscal 2020. Consulting costs incurred in Fiscal 2020 associated with these activities were $4.4 million and are reflected in the selling, distribution and administrative expenses line item of the Consolidated Statements of Income. We completed the initial road mapping activities in the fourth quarter of Fiscal 2020 and transitioned to the design phase of the project. We currently expect significant consulting and infrastructure costs related to this multi-year project although we cannot estimate these costs at this time.
26
Restructuring and related impairment charges associated with Project Centennial. The following table details charges recorded in Fiscal 2020 and 2019 (amounts in thousands):
|
|
|
Fiscal 2020 |
|
|
Fiscal 2019 |
|
||
|
|
|
(Amounts in thousands) |
|
|||||
|
Employee termination benefits and other cash charges |
|
$ |
7,779 |
|
|
$ |
3,295 |
|
|
Property, plant, equipment and spare parts impairments, net of gain on sale |
|
|
7,110 |
|
|
|
4,830 |
|
|
Lease termination and lease impairment charges |
|
|
13,474 |
|
|
|
— |
|
|
Brand rationalization impairments |
|
|
7,120 |
|
|
|
15,399 |
|
|
|
|
$ |
35,483 |
|
|
$ |
23,524 |
|
Fiscal 2020 Charges
The company continues to evaluate its organizational structure in an effort to increase its focus on brand growth and product innovation and to improve underperforming bakeries, as discussed further in Item 1., Business, of this Form 10-K. The organizational structure changes resulted in employee termination benefits charges in Fiscal 2020 related to a voluntary employee separation plan (the “VSIP”) of $2.6 million and an involuntary reduction-in-force plan of $5.3 million. The VSIP and reduction-in-force plans together eliminated approximately 250 positions across different departments and job levels and all remaining payments related to the plans were paid in early Fiscal 2021.
During Fiscal 2020, the company sold three closed bakeries that were included in assets held for sale and certain idle equipment at other bakeries, resulting in the recognition of $5.7 million of impairment charges. Additionally, the company recognized property, plant, and equipment impairment charges of $0.6 million for manufacturing line and distribution depot closures and an office building the company has decided to sell, and $0.7 million for spare parts related to equipment the company no longer intends to use.
In order to optimize our distribution network, we vacated certain distribution depots during the third quarter, some of which are owned and others that are leased. These actions resulted in the recognition of lease termination charges and lease impairment charges totaling $13.5 million and are anticipated to reduce lease costs and generate overall efficiency savings.
Additionally, in order to optimize sales and production of our organic products, the company decided to cease using the Alpine Valley brand, a finite-lived trademark, resulting in a $4.6 million impairment charge in the second quarter. The company decided to cease using one of its regional brands and recognized a $1.3 million impairment charge in the fourth quarter. Additionally, ingredient and packaging impairments of $1.2 million were recognized as a result of brand rationalization initiatives.
Fiscal 2019 Charges
In Fiscal 2019, we closed our Opelika, Alabama bakery and recorded asset impairment charges with respect to the property, plant, equipment, and spare parts totaling $3.9 million and severance costs of $1.5 million. Additionally, we recorded $1.8 million of asset impairment charges for a closed bakery included in assets held for sale and for other manufacturing line closures, and severance and relocation costs of $1.8 million related to transitioning to the new organizational structure. Also, during Fiscal 2019, we recorded a gain on sale of $0.8 million related to a facility that had been previously impaired in a prior year. In the fourth quarter of Fiscal 2019, we completed a brand rationalization study which resulted in $15.4 million of impairment charges for certain trademarks that we either no longer intend to use or plan to use on a more limited basis.
Loss (recovery) on inferior ingredients. In Fiscal 2020, we incurred costs of $1.3 million related to receiving inferior ingredients used in the production of certain of our gluten-free products and an adjustment to previously recorded inferior yeast costs, and received a $1.2 million reimbursement for the direct costs associated with receiving inferior yeast in a prior year. We also received a reimbursement of $3.9 million for indirect losses associated with receiving inferior yeast in a prior year and this amount is included in the selling, distribution, and administrative expenses line item of the Consolidated Statements of Income.
In Fiscal 2019, we incurred costs of $1.8 million related to receiving inferior ingredients and co-manufactured products, and received reimbursements totaling $1.8 million for a portion of previously incurred costs.
Non-restructuring lease termination gain. In Fiscal 2020, due to a change in the contractual terms with a transportation entity that transports a significant portion of our fresh bakery products to allow for substitution of assets, among other changes to the terms, a reassessment of the embedded lease accounting treatment was triggered. Based our analysis, we determined the contracts associated with the transportation entity no longer qualify for embedded lease treatment and, in unwinding these leases, the company recognized a noncash gain of $4.1 million in the selling, distribution and administrative expenses line item of the Consolidated Statements of Income.
27
Pension plan settlement loss. On September 28, 2018, the Board approved a resolution to terminate the Flowers Foods, Inc. Retirement Plan No. 1 (“Plan No. 1”), effective December 31, 2018. In the first quarter of Fiscal 2020, the company distributed a portion of the pension plan assets to participants as lump sum payments and transferred the remaining obligations and assets to an insurance company in the form of a nonparticipating group annuity contract. No cash contributions were required in Fiscal 2020 to support this transaction. In Fiscal 2020, the company recognized $108.8 million of non-cash pension termination charges, comprised of a settlement charge of $104.5 million and a curtailment loss of $4.3 million, and an additional $0.1 million of cash charges for other pension termination charges in our Consolidated Statements of Income.
Legal settlements. In Fiscal 2020 and 2019, we reached agreements to settle distributor-related litigation in the aggregate amount of $7.3 million and $29.3 million, respectively, including plaintiffs’ attorney fees and the company’s FICA obligations. We recorded a benefit of $1.3 million in Fiscal 2019 related to an adjustment of a prior year settlement based on the final amount paid. All amounts related to legal settlements are recorded in the selling, distribution and administrative expenses line item of the Consolidated Statements of Income. At January 2, 2021, $11.9 million of settlements were accrued, of which $8.7 million was paid in January of Fiscal 2021.
Executive retirement agreement. On February 15, 2019, Allen Shiver, president and chief executive officer of the company and member of the Board, notified the company he would be retiring from these positions effective May 23, 2019. In connection with Mr. Shiver’s retirement, the company and Mr. Shiver entered into a retirement agreement and general release, as a part of the agreement, Mr. Shiver was paid $1.3 million upon his retirement, which was expensed in the first quarter of Fiscal 2019. Additionally, upon his retirement in the second quarter of Fiscal 2019, we recognized a benefit of $0.6 million related to the forfeiture of his unvested long-term incentive stock awards. These amounts are reflected in the selling, distribution, and administrative expenses line item of the Consolidated Statements of Income.
Additional Items Impacting Comparability
Reporting Periods. The company operates on a 52-53 week fiscal year ending the Saturday nearest December 31. Fiscal 2020 consisted of 53 weeks and Fiscal 2019 consisted of 52 weeks. Fiscal 2021 will consist of 52 weeks.
COVID-19. On March 11, 2020, the World Health Organization declared the novel strain of coronavirus (COVID-19) a global pandemic and recommended containment and mitigation measures worldwide, which has led to adverse impacts on the U.S. and global economies. Due to the drastic change in consumer buying patterns as a result of the COVID-19 pandemic, we experienced a favorable shift in sales mix to our branded retail products resulting in significant growth in income from operations in Fiscal 2020 as compared Fiscal 2019. For additional details on the impact of the COVID-19 pandemic to our business operations and results of operations, see the “Executive Overview – Impact of COVID-19 on Our Business,” “Results of Operations” and “Liquidity and Capital Resources” sections below.
Conversion of our Lynchburg, Virginia bakery to organic production — During Fiscal 2020, we converted our Lynchburg, Virginia bakery to an all-organic production facility. The converted facility increases production capacity for our DKB products, allowing the company to better serve east coast markets with fresher product and reduce distribution costs. We incurred start-up costs related to the conversion of approximately $5.1 million in Fiscal 2020 and these costs are included in materials, supplies, labor and other production costs in our Consolidated Statements of Income. The bakery resumed production at the end of the third quarter of Fiscal 2020.
Canyon Bakehouse LLC acquisition. On December 14, 2018, we completed the acquisition of Canyon, a privately held, gluten-free baking company in Johnstown, Colorado, for $205.2 million total consideration. Canyon operates one production facility in Johnstown, Colorado. The Canyon Bakehouse brand is the #1 gluten-free bread loaf brand in the U.S. We funded the purchase price of the Canyon acquisition with cash on hand and borrowings under our accounts receivable securitization facility (the “AR facility”) and incurred acquisition-related expenses of $4.5 million. Canyon’s results of operations for the period from December 14, 2018 through December 29, 2018 were excluded from our consolidated results for Fiscal 2018 due to immateriality and were reported in our first quarter of Fiscal 2019. Prior to the acquisition, Canyon’s sales were distributed frozen through natural, specialty, grocery, and mass retailers around the country and this has and will continue. In addition to frozen distribution, we began distributing fresh Canyon branded products via our DSD distribution system during the first quarter of Fiscal 2019. In January of Fiscal 2020, we paid $5.0 million to the prior owner related to the contingent consideration recorded as part of the acquisition.
28
Product recall. On July 9, 2019, we issued a voluntary product recall for certain hamburger and hot dog buns and other bakery products due to the potential presence of small pieces of hard plastic that may have been introduced during production. The products recalled were distributed to retail customers under a variety of brand names in 18 states. We are not currently aware of any confirmed injuries or illnesses. We incurred costs related to lost production time, scrapped inventory, and product removal, among other costs, of approximately $0.5 million and $0.3 million during the second and third quarters of Fiscal 2019, respectively.
EXECUTIVE OVERVIEW
We are the second-largest producer and marketer of packaged bakery foods in the U.S. with Fiscal 2020 sales of $4.4 billion. We operate in the highly competitive fresh bakery market and our product offerings include fresh breads, buns, rolls, snack cakes and tortillas, as well as frozen breads and rolls.
We operate 46 plants in 18 states that produce a wide range of breads, buns, rolls, snack cakes, and tortillas. See Item 1., Business, of this Form 10-K for information regarding our customers and brands, business strategies, strengths and core competencies, and competition and risks.
Impact of COVID-19 on Our Business:
The COVID-19 pandemic significantly impacted our business operations and results of operations during Fiscal 2020, as further described under “Results of Operations” and “Liquidity and Capital Resources” below. The resulting dramatic changes in consumer buying patterns has led to a significant rise in demand for our branded retail products due to increases in at-home dining, but sales through our non-retail category, which includes foodservice, restaurant, institutional, vending, thrift stores, and contract manufacturing, have declined substantially during the pandemic. In recognition and support of our frontline workers, we paid $12.3 million in appreciation bonuses to eligible hourly and non-exempt employees, leased labor, and contract workers in Fiscal 2020. These appreciation bonuses are in addition to the company’s annual bonus program, in which all Flowers employees participate. Although sales of our branded retail products have moderated as the pandemic has continued, we cannot currently estimate when or if they will return to levels prior to the pandemic.
On April 14, 2020, we temporarily ceased production at our Tucker, Georgia bakery and on July 9, 2020, we temporarily ceased production at our Savannah, Georgia bakery. Both closures were due to an increase in the number of confirmed COVID-19 cases at these bakeries and the related increase in number of workers self-quarantining. Production resumed at the Tucker bakery on April 27, 2020 and at the Savannah Bakery on July 17, 2020. While our other bakeries have been able to assist with meeting production needs in these instances, the closure of several of our bakeries across the country at one time or in close succession could negatively impact our ability to meet our production requirements in the future.
While the ultimate health and economic impact of the COVID-19 pandemic is highly uncertain, we expect that our business operations and results of operations, including our net sales, earnings and cash flows, will continue to be impacted by decreases in foodservice and other non-retail outlets sales. Foodservice sales are likely to remain under pressure until the restaurant industry returns to more normal operations. We cannot predict the timing and speed of the foodservice industry recovery, and any delay in the recovery could significantly impact our future results. We continue to actively monitor the collectability of our trade accounts receivables, including our foodservice customers in particular. We may incur losses in the future if these customers are forced into financial distress or bankruptcy and cannot pay us or their other suppliers on a timely basis or at all.
We continue to actively monitor the global outbreak and spread of COVID-19 and are taking steps to mitigate the potential risks to us posed by its spread and related circumstances and impacts. We are focused on navigating the challenges presented by the COVID-19 global pandemic through the implementation of additional procedures at each of our locations to comply with U.S. Centers for Disease Control and Prevention (CDC) recommendations. These procedures and actions include, but are not limited to, monitoring the symptoms of all team members and essential visitors entering our facilities requiring face coverings, maintaining (where possible) six feet of distance, conducting enhanced cleaning and sanitizing of common areas and frequently touched surfaces, performing additional decontamination of work areas and equipment if there is a confirmed or presumptive case of COVID-19 at a facility, and other considerations. Certain non-production employees have also been working remotely to mitigate contact between personnel. Non-essential travel and non-essential visitor bans also were implemented to reduce potential exposure. We are considering the options available to us under the FFCRA Act, the CARES Act, and the CCA Act. As of the beginning of the second quarter of Fiscal 2020, we began taking advantage of deferrals of certain payroll tax payments in accordance with the CARES Act. In addition, we continue to evaluate the impact of certain tax credits that are available under these Acts. We have also availed ourselves of the deferral of federal income tax payments made available under an emergency declaration on March 13, 2020. The evolving COVID-19 pandemic could continue to impact our results of operations and liquidity; the operations of our suppliers, vendors, and customers; and our employees as a result of health concerns, quarantines, facility closures, and travel and logistics restrictions.
29
Summary of Operating Results, Cash Flows and Financial Condition:
Sales increased 6.4% in Fiscal 2020 compared to Fiscal 2019 primarily due to a positive shift in mix resulting from much higher demand for our branded retail products due to increased at-home dining as a result of the COVID-19 pandemic combined with improved promotional efficiency, fewer product returns, and the benefit of the additional week. Partially offsetting the increase were substantial declines in our non-retail sales which have been negatively impacted by lower foodservice sales due to restaurant closings or limited capacity restrictions experienced by these customers during the ongoing pandemic, and to a lesser extent declines in our store branded retail sales.
Net income was $152.3 million for Fiscal 2020, a decrease of 7.4% as compared to the prior year, primarily due to recognizing non-cash pension plan settlement and curtailment charges of $108.8 million in connection with the termination of Plan No. 1, partially offset by a much more favorable sales mix, mainly resulting from the COVID-19 pandemic, decreased ingredient and packaging costs and legal settlement charges, the reimbursement of prior year losses resulting from receipt of inferior ingredients, and the impact of the additional week. Increased workforce-related incentive costs, including appreciation bonuses paid to frontline workers, restructuring and related impairment charges, and consulting costs, combined with start-up costs for the Lynchburg, Virginia bakery conversion, also contributed to the decrease in net income year over year.
In Fiscal 2020, we generated net cash flows from operations of $454.5 million and invested $97.9 million in capital expenditures. Additionally, we paid $167.3 million in dividends to our shareholders and increased our total indebtedness by $92.5 million. During the first quarter of Fiscal 2020, we borrowed an additional amount under our senior unsecured revolving credit facility (the “credit facility”) in order to ensure future liquidity in response to the uncertainty caused by the COVID-19 pandemic on global financial markets and economies. Although we do not have any presently anticipated need for this additional liquidity, our cash and cash equivalents as of January 2, 2021 was $307.5 million. In Fiscal 2020, we amended the AR facility to extend the maturity date to September 27, 2022.
In Fiscal 2019, we generated net cash flows from operations of $367.0 million and invested $103.7 million in capital expenditures. We decreased our total indebtedness by $114.3 million and paid $160.0 million in dividends to our shareholders in Fiscal 2019.
Critical Accounting Estimates
The company’s discussion and analysis of its results of operations and financial condition are based upon the Consolidated Financial Statements of the company, which have been prepared in accordance with generally accepted accounting principles in the U.S. (“GAAP”). The preparation of these financial statements requires the company to make estimates and assumptions that affect the reported amounts of assets, liabilities, revenues and expenses, and related disclosure of contingent assets and liabilities at the date of the financial statements and the reported amounts of the revenues, expenses, and cash flows during the reporting period. On an ongoing basis, the company evaluates its estimates, including those related to customer programs and incentives, bad debts, raw materials, inventories, long-lived assets, leased assets, intangible assets, income taxes, restructuring, pensions and other post-retirement benefits, and contingencies and litigation. The company bases its estimates on historical experience and on various other assumptions that are believed to be reasonable under the circumstances, the results of which form the basis for making judgments about the carrying values of assets and liabilities that are not readily apparent from other sources. Actual results may differ from these estimates.
30
The selection and disclosure of the company’s critical accounting estimates have been discussed with the company’s audit committee. Note 2, Summary of Significant Accounting Policies, of Notes to Consolidated Financial Statements of this Form 10-K includes a summary of the significant accounting policies and methods used in the preparation of the Consolidated Financial Statements. The following table lists, in no particular order of importance, areas of critical assumptions and estimates used in the preparation of the Consolidated Financial Statements. Additional detail can be found in the following notes:
|
Critical Accounting Estimate |
|
Note |
|
|
|
Revenue recognition |
|
|
— |
|
|
Derivative financial instruments |
|
|
11 |
|
|
Long-lived assets |
|
|
— |
|
|
Goodwill and other intangible assets |
|
|
9 |
|
|
Leases |
|
|
14 |
|
|
Self-insurance reserves |
|
|
23 |
|
|
Income tax expense (benefit) and accruals |
|
|
22 |
|
|
Postretirement plans |
|
|
21 |
|
|
Stock-based compensation |
|
|
19 |
|
|
Commitments and contingencies |
|
|
23 |
|
Revenue Recognition. Revenue is recognized when obligations under the terms of a contract with our customers are satisfied. Revenue is measured as the amount of consideration we expect to receive in exchange for transferring goods or providing services. The company records both direct and estimated reductions to gross revenue for customer programs and incentive offerings at the time the incentive is offered or at the time of revenue recognition for the underlying transaction that results in progress by the customer towards earning the incentive. These allowances include price promotion discounts, coupons, customer rebates, cooperative advertising, and product returns. Consideration payable to a customer is recognized at the time control transfers and is a reduction to revenue. The recognition of costs for promotion programs involves the use of judgment related to performance and redemption estimates. Estimates are made based on historical experience and other factors. Price promotion discount expense is recorded as a reduction to gross sales when the discounted product is sold to the customer.
Derivative Financial Instruments. The company’s cost of primary raw materials is highly correlated to certain commodities markets. Raw materials, such as our baking ingredients, experience price fluctuations. If actual market conditions become significantly different than those anticipated, raw material prices could increase significantly, adversely affecting our results of operations. We enter into forward purchase agreements and other derivative financial instruments qualifying for hedge accounting to manage the impact of volatility in raw material prices. The company measures the fair value of its derivative portfolio using fair value as the price that would be received to sell an asset or paid to transfer a liability in the principal market for that asset or liability. When quoted market prices for identical assets or liabilities are not available, the company bases fair value on internally developed models that use current market observable inputs, such as exchange-quoted futures prices and yield curves.
Valuation of Long-Lived Assets, Goodwill and Other Intangible Assets. The company records an impairment charge to property, plant and equipment, goodwill and intangible assets in accordance with applicable accounting standards when, based on certain indicators of impairment, it believes such assets have experienced a decline in value that is other than temporary. Future adverse changes in market conditions or poor operating results of these underlying assets could result in losses or an inability to recover the carrying value of the asset that may not be reflected in the asset’s current carrying value, thereby possibly requiring impairment charges in the future. Impairment charges recorded in Fiscal 2020 and 2019 are discussed above in the “Matters Affecting Comparability” section.
Flowers has concluded it has one operating segment based on the nature of products that Flowers sells, an intertwined production and distribution model, the internal management structure and information that is regularly reviewed by the CEO, who is the chief operating decision maker, for the purpose of assessing performance and allocating resources. The company also determined we have one reporting unit. We completed our transition to the current structure and began managing our business as one operating segment as of the beginning of Fiscal 2019.
The company evaluates the recoverability of the carrying value of its goodwill on an annual basis or at a time when events occur that indicate the carrying value of the goodwill may be impaired. As discussed above, beginning in Fiscal 2019, we changed to a single reporting unit and reassessed the recoverability of goodwill at that time and determined there was no impairment. We have elected not to perform the qualitative approach, but instead perform a quantitative analysis by comparing the fair value of the reporting unit with which the goodwill is associated to the carrying amount of the reporting unit. If the fair value is less than the carrying value, the goodwill is written down to the extent the carrying amount exceeds the fair value.
Our annual evaluation of goodwill impairment requires management judgment and the use of estimates and assumptions to determine the fair value of our reporting unit. Fair value is estimated using standard valuation methodologies incorporating market participant considerations and management’s assumptions on revenue, revenue growth rates, operating margins, discount rates, and EBITDA (defined as earnings before interest, taxes, depreciation and amortization). Our estimates can significantly affect the outcome
31
of the test. We perform the fair value assessment using the income and market approach. Changes in our forecasted operating results and other assumptions could materially affect these estimates. This test is performed in the fourth quarter of each fiscal year unless circumstances require this analysis to be completed sooner. The income approach is tested using a sensitivity analysis to changes in the discount rate and yield a sufficient buffer to significant variances in our estimates. The estimated fair value of our reporting unit exceeded its carrying value in excess of $4.0 billion in Fiscal 2020. Based on management’s evaluation, no impairment charges relating to goodwill were recorded for Fiscal 2020 and 2019.
In connection with acquisitions, the company has acquired trademarks, customer lists, and non-compete agreements, a portion of which are amortizable. The company evaluates these assets whenever events or changes in circumstances indicate that the carrying amount of the asset may not be recoverable. The undiscounted future cash flows of each intangible asset are compared to the carrying amount, and if less than the carrying value, the intangible asset is written down to the extent the carrying amount exceeds the fair value. The fair value is computed using the same approach described above for goodwill and includes the same risks and estimates. The fair value of the trademarks could be less than our carrying value if any of our four material assumptions in our fair value analysis: (a) weighted average cost of capital; (b) long-term sales growth rates; (c) forecasted operating margins; and (d) market multiples do not meet our expectations, thereby requiring us to record an asset impairment. We use the multi-period excess earnings and relief from royalty methods to value these intangibles. The method used for impairment testing purposes is consistent with the valuation method employed at acquisition of the intangible asset. Impairment charges recorded in Fiscal 2020 and 2019 related to amortizable intangible assets totaled $5.9 million and $15.4 million, respectively, and are discussed above in the “Matters Affecting Comparability” section.
As of January 2, 2021, the company also owns a trademark acquired through an acquisition with a carrying value of $127.1 million that is an indefinite-lived intangible asset not subject to amortization. The company evaluates the recoverability of intangible assets not subject to amortization by comparing the fair value to the carrying value on an annual basis or at a time when events occur that indicate the carrying value may be impaired. In addition, the assets are evaluated to determine whether events and circumstances continue to support an indefinite life. The fair value is compared to the carrying value of the intangible asset, and if less than the carrying value, the intangible asset is written down to fair value. There are certain inherent risks included in our expectations about the performance of acquired trademarks and brands. If we are unable to implement our growth strategies for these acquired intangible assets as expected, it could adversely impact the carrying value of the brands. The fair value of the trademarks could be less than our carrying value if any of our four material assumptions in our fair value analysis: (a) weighted average cost of capital; (b) long-term sales growth rates; (c) forecasted operating margins; and (d) market multiples do not meet our expectations, thereby requiring us to record an asset impairment. As of the end of Fiscal 2019, the company determined a trademark with a carrying value of $79.5 million was no longer deemed to have an indefinite life and began amortizing this trademark in Fiscal 2020 over its remaining useful life of 33 years.
Leases. The company’s leases consist of the following types of assets: two bakeries, corporate office space, warehouses, bakery equipment, transportation, and IT equipment. The company uses the applicable incremental borrowing rate at lease commencement to perform the lease classification tests on lease components and to measure the lease liabilities and right-of-use assets in situations when discount rates implicit in leases cannot be readily determined.
Self-Insurance Reserves. We are self-insured for various levels of general liability, auto liability, workers’ compensation, and employee medical and dental coverage. Insurance reserves are calculated on a combination of an undiscounted basis based on actual claims data and estimates of incurred but not reported claims developed utilizing historical claims trends. Projected settlements of incurred but not reported claims are estimated based on pending claims, historical trends, industry trends related to expected losses and actual reported losses, and key assumptions, including loss development factors and expected loss rates. Though the company does not expect them to do so, actual settlements and claims could differ materially from those estimated. Material differences in actual settlements and claims could have an adverse effect on our financial condition and results of operations.
Income Tax Expense and Accruals. The annual tax rate is based on our income, statutory tax rates, and tax planning opportunities available to us in the various jurisdictions in which we operate. Changes in statutory rates and tax laws in jurisdictions in which we operate may have a material effect on the annual tax rate. The effect of these changes, if any, would be recognized as a discrete item upon enactment.
Deferred income taxes arise from temporary differences between the tax and financial statement recognition of revenues and expenses. Deferred tax assets and liabilities are measured based on the enacted tax rates that will apply in the years in which the temporary differences are expected to be recovered or paid.
Our income tax expense, deferred tax assets and liabilities, and reserve for uncertain tax benefits reflect our best assessment of future taxes to be paid in the jurisdictions in which we operate. The company records a valuation allowance to reduce its deferred tax assets if we believe it is more likely than not that some or all of the deferred assets will not be realized. While the company considers future taxable income and ongoing prudent and feasible tax strategies in assessing the need for a valuation allowance, if these estimates and assumptions change in the future, the company may be required to adjust its valuation allowance, which could result in a charge to, or an increase in, income in the period such determination is made.
32
Periodically, we face audits from federal and state tax authorities, which can result in challenges regarding the timing and amount of income or deductions. We provide reserves for potential exposures when we consider it more likely than not that a taxing authority may take a sustainable position on a matter contrary to our position. We evaluate these reserves on a quarterly basis to ensure that they have been appropriately adjusted for events, including audit settlements that may impact the ultimate payment of such potential exposures. While the ultimate outcome of audits cannot be predicted with certainty, we do not currently believe that current or future audits will have a material adverse effect on our consolidated financial condition or results of operations. The company is no longer subject to federal examination for years prior to Fiscal 2017.
Postretirement Plans. The company records pension costs and benefit obligations related to its defined benefit plans based on actuarial valuations. These valuations reflect key assumptions determined by management, including the discount rate, expected long-term rate of return on plan assets and mortality. Material changes in pension costs and in benefit obligations may occur in the future due to experience that is different than assumed and changes in these assumptions.
The company sponsors an ongoing defined benefit pension plan for union employees (“Plan No. 2”) and a frozen nonqualified plan covering former Tasty executives.
We use a spot rate approach (“granular method”) to estimate the service cost and interest cost components of benefit cost by applying the specific spot rates along the yield curve to the relevant projected cash flows, as we believe this provides the best estimate of service and interest costs.
The pension plan’s investment committee, which consists of certain members of management, establishes investment guidelines and regularly monitors the performance of the plan’s assets. The investment committee is responsible for executing these strategies and investing the pension assets in accordance with ERISA and fiduciary standards. The investment objective of the pension plan is to preserve the plan’s capital and maximize investment earnings within acceptable levels of risk and volatility. The investment committee meets on a regular basis with its investment advisors to review the performance of the plan’s assets. Based upon performance and other measures and recommendations from its investment advisors, the investment committee rebalances the plan’s assets to the targeted allocation when considered appropriate. The asset allocation for Plan No. 2 as of December 31, 2020 is equal to 0-80% equity securities, 20-100% fixed-income securities, and 0-10% short-term investments and cash. For the details of our pension plan assets, see Note 21, Postretirement Plans, of Notes to Consolidated Financial Statements of this Form 10-K.
In developing the expected long-term rate of return on plan assets at each measurement date, the company considers the plan assets’ historical actual returns, targeted asset allocations, and the anticipated future economic environment and long-term performance of the individual asset classes, based on the company’s investment strategy. While appropriate consideration is given to recent and historical investment performance, the assumption represents management’s best estimate of the long-term prospective return. Further, pension costs do not include an explicit expense assumption, and therefore the return on assets rate reflects the long-term expected return, net of expenses. Based on these factors, the long-term rate of return assumption for Plan No. 2 was set at 7.1% for Fiscal 2020 and 5.7% for Fiscal 2021.
The company utilizes the Society of Actuaries’ (“SOA”) published mortality tables and improvement scales in developing their best estimates of mortality. In October 2019, the SOA published its final report on their “standard” mortality table (“Pri-2012”) and released its annual update to the mortality improvement scale (“MP-2020”). For purposes of measuring pension benefit obligations of Plan No. 2, the company used a blue color adjustment to the Pri-2012 base table and a projection scale of MP-2020. No other collar adjustments are applied for any other plans. In addition, contingent annuitant mortality rates are applied for surviving spouses after the death of the original retiree.
The company determines the fair value of substantially all of its plans’ assets utilizing market quotes rather than developing “smoothed” values, “market related” values, or other modeling techniques. Plan asset gains or losses in a given year are included with other actuarial gains and losses due to remeasurement of the plans’ projected benefit obligations (“PBO”). If the total unrecognized gain or loss exceeds 10% of the larger of (i) the PBO or (ii) the market value of plan assets, the excess of the total unrecognized gain or loss is amortized over the expected average remaining service period of active covered employees (or average future lifetime of participants if the plan is inactive or frozen). Prior service cost or credit, which represents the effect on plan liabilities due to plan amendments, is amortized over the average remaining service period of active covered employees (or average future lifetime if the plan is inactive or frozen).
In Fiscal 2021, the company does not expect to make any cash contributions to Plan No. 2 and expects to pay $0.3 million in nonqualified pension benefits from corporate assets.
Stock-based compensation. Stock-based compensation expense for all share-based payment awards granted is determined based on the grant date fair value. The company recognizes these compensation costs net of an estimated forfeiture rate, and
33
recognizes compensation cost only for those shares expected to vest on a straight-line basis over the requisite service period of the award, which is generally the vesting term of the share-based payment award.
We grant performance stock awards that separately have a market and performance condition. The expense computed for the total shareholder return shares (“TSR”) is fixed and recognized on a straight-line basis over the vesting period. The expense computed for the return on invested capital (“ROIC”) shares can change depending on the expected attainment of performance condition goals. The expense for the ROIC shares can be within a range of 0% to 125% of the target. There is a possibility that this expense component will change in subsequent quarters depending on how the company performs relative to the ROIC target. Additionally, there are time-based stock awards that vest over a period of three years. See Note 19, Stock-Based Compensation, of Notes to Consolidated Financial Statements of this Form 10-K for additional information. In early Fiscal 2021, the company granted stock awards to certain employees and stock-based compensation expense is expected to increase approximately $7.0 million to $9.0 million as compared to Fiscal 2020.
Commitments and contingencies. The company and its subsidiaries from time to time are parties to, or targets of, lawsuits, claims, investigations and proceedings, including personal injury, commercial, contract, environmental, antitrust, product liability, health and safety and employment matters, including lawsuits related to the independent distributors, which are being handled and defended in the ordinary course of business. Loss contingencies are recorded at the time it is probable an asset is impaired or a liability has been incurred and the amount can be reasonably estimated. For litigation claims, the company considers the degree of probability of an unfavorable outcome and the ability to make a reasonable estimate of the loss. Losses are recorded in selling, distribution and administrative expenses line item of the Consolidated Statements of Income.
Results of Operations
Consolidated Results - Fiscal 2020 compared to Fiscal 2019
The company’s results of operations, expressed as a percentage of sales, are set forth below for Fiscal 2020 and Fiscal 2019:
|
|
|
|
|
|
|
|
|
|
|
Percentage of Sales |
|
|
Increase (Decrease) |
|
||||||||||
|
|
|
Fiscal 2020 |
|
|
Fiscal 2019 |
|
|
Fiscal 2020 |
|
|
Fiscal 2019 |
|
|
Dollars |
|
|
% |
|
||||||
|
|
|
53 weeks |
|
|
52 weeks |
|
|
53 weeks |
|
|
52 weeks |
|
|
|
|
|
|
|
|
|
||||
|
|
|
(Amounts in thousands, except percentages) |
|
|||||||||||||||||||||
|
Sales |
|
$ |
4,387,991 |
|
|
$ |
4,123,974 |
|
|
|
100.0 |
|
|
|
100.0 |
|
|
$ |
264,017 |
|
|
|
6.4 |
|
|
Materials, supplies, labor and other production costs (exclusive of depreciation and amortization shown separately below) |
|
|
2,196,142 |
|
|
|
2,155,709 |
|
|
|
50.0 |
|
|
|
52.3 |
|
|
|
40,433 |
|
|
|
1.9 |
|
|
Selling, distribution and administrative expenses |
|
|
1,693,387 |
|
|
|
1,575,122 |
|
|
|
38.6 |
|
|
|
38.2 |
|
|
|
118,265 |
|
|
|
7.5 |
|
|
Loss (recovery) on inferior ingredients |
|
|
107 |
|
|
|
(37 |
) |
|
|
0.0 |
|
|
|
(0.0 |
) |
|
|
144 |
|
|
NM |
|
|
|
Restructuring and related impairment charges |
|
|
35,483 |
|
|
|
23,524 |
|
|
|
0.8 |
|
|
|
0.6 |
|
|
|
11,959 |
|
|
NM |
|
|
|
Depreciation and amortization |
|
|
141,384 |
|
|
|
144,228 |
|
|
|
3.2 |
|
|
|
3.5 |
|
|
|
(2,844 |
) |
|
|
(2.0 |
) |
|
Income from operations |
|
|
321,488 |
|
|
|
225,428 |
|
|
|
7.3 |
|
|
|
5.5 |
|
|
|
96,060 |
|
|
|
42.6 |
|
|
Other components of net periodic pension and postretirement benefits (credit) expense |
|
|
(74 |
) |
|
|
2,248 |
|
|
|
(0.0 |
) |
|
|
0.1 |
|
|
|
(2,322 |
) |
|
NM |
|
|
|
Pension plan settlement and curtailment loss |
|
|
108,757 |
|
|
|
— |
|
|
|
2.5 |
|
|
|
— |
|
|
|
108,757 |
|
|
NM |
|
|
|
Interest expense, net |
|
|
12,094 |
|
|
|
11,097 |
|
|
|
0.3 |
|
|
|
0.3 |
|
|
|
997 |
|
|
|
9.0 |
|
|
Income tax expense |
|
|
48,393 |
|
|
|
47,545 |
|
|
|
1.1 |
|
|
|
1.2 |
|
|
|
848 |
|
|
|
1.8 |
|
|
Net income |
|
$ |
152,318 |
|
|
$ |
164,538 |
|
|
|
3.5 |
|
|
|
4.0 |
|
|
$ |
(12,220 |
) |
|
|
(7.4 |
) |
|
Comprehensive income |
|
$ |
264,762 |
|
|
$ |
167,689 |
|
|
|
6.0 |
|
|
|
4.1 |
|
|
$ |
97,073 |
|
|
|
57.9 |
|
NM – the computation is not meaningful
Percentages may not add due to rounding.
34
Sales (dollars in thousands)
|
|
|
Fiscal 2020 |
|
|
Fiscal 2019 |
|
|
|
|
|
||||||||||
|
|
|
53 weeks |
|
|
52 weeks |
|
|
|
|
|
||||||||||
|
|
|
$ |
|
|
% |
|
|
$ |
|
|
% |
|
|
% Change |
|
|||||
|
|
|
(Amounts in thousands) |
|
|
|
|
|
|
(Amounts in thousands) |
|
|
|
|
|
|
|
|
|
||
|
Branded retail |
|
$ |
2,912,096 |
|
|
|
66.4 |
|
|
$ |
2,478,669 |
|
|
|
60.1 |
|
|
|
17.5 |
|
|
Store branded retail |
|
|
609,887 |
|
|
|
13.9 |
|
|
|
647,056 |
|
|
|
15.7 |
|
|
|
(5.7 |
) |
|
Non-retail and other |
|
|
866,008 |
|
|
|
19.7 |
|
|
|
998,249 |
|
|
|
24.2 |
|
|
|
(13.2 |
) |
|
Total |
|
$ |
4,387,991 |
|
|
|
100.0 |
|
|
$ |
4,123,974 |
|
|
|
100.0 |
|
|
|
6.4 |
|
(The table above presents certain sales by category that have been reclassified from amounts previously reported.)
The change in sales was attributable to the following:
|
Percentage point change in sales attributed to: |
|
Favorable (Unfavorable) |
|
|
|
Pricing/mix |
|
|
7.5 |
|
|
Volume |
|
|
(2.9 |
) |
|
Week 53 |
|
|
1.8 |
|
|
Total percentage change in sales |
|
|
6.4 |
|
Sales significantly increased year over year primarily due to a substantial rise in demand for our branded retail products as at-home dining has increased as a result of the ongoing COVID-19 pandemic which began in the U.S. in mid-March of 2020. This increase resulted in a positive shift in mix from the non-retail and other sales and store branded retail sales categories to the branded retail sales category. Fiscal 2020 sales were also positively impacted by a reduction in product returns, improved promotional efficiency, and the benefit of the additional week. Considerable volume declines for non-retail and other sales partially offset the overall increase. We expect these trends to continue while the pandemic is ongoing, although branded retail sales growth could continue to moderate as away-from-home dining returns to more normal levels.
Branded retail sales increased significantly due to the increased demand caused by the COVID-19 pandemic. In Fiscal 2020, sales of our leading brands, Nature’s Own, DKB, and Wonder, all achieved double-digit sales growth. Although not as impactful, sales of Canyon Bakehouse gluten-free products also experienced double-digit sales growth year over year. In order to quickly meet heightened customer and consumer demand for traditional branded loaf breads and buns at the start of the pandemic, we streamlined our product offerings and focused production on certain high-demand items. Although the panic-buying and stock-up shopping patterns we experienced in the first few months of the pandemic have abated, the shift to at-home consumption remained elevated through the end of Fiscal 2020 and continued to favorably impact sales of our branded retail products. Additionally, reduced product returns, growth from recently introduced products, improved promotional efficiency, and the benefit of the additional week in the current year contributed to the branded retail sales gains. We introduced Nature’s Own Perfectly Crafted brioche bread and dinner rolls in Fiscal 2019 and brioche buns in Fiscal 2020 and DKB organic English muffins in Fiscal 2019 and organic buns in Fiscal 2020, among other newly introduced branded items.
Store branded retail sales decreased due to volume declines for store branded breads, buns, and rolls as consumers shifted to branded retail products. The increase in e-commerce sales contributed to the shift from store branded to branded retail sales. Additionally, lost store branded breakfast bread business in the second half of the prior year contributed to the decrease, partially offset by the benefit of the additional week in the current year.
As discussed above, significant volume losses drove the considerable decrease in non-retail and other sales, with our foodservice customers experiencing the greatest declines, partially offset by the benefit of the additional week. At the onset of the pandemic in the U.S., business was disrupted for most of our non-retail customers, most significantly foodservice customers, and many had to close or greatly reduce their operations. Although many of our foodservice customers have been able to reopen, they have been subject to capacity restrictions and other limiting factors, which has negatively impacted our non-retail sales. Additionally, sales through convenience stores, vending outlets, and schools and other institutions have experienced significant declines as a result of the pandemic. We expect these trends to continue while the pandemic is ongoing.
35
Materials, Supplies, Labor, and Other Production Costs (exclusive of depreciation and amortization shown separately; as a percent of sales)
|
Line item component |
|
Fiscal 2020 % of sales |
|
|
Fiscal 2019 % of sales |
|
|
Change as a % of sales |
|
|||
|
Ingredients and packaging |
|
|
27.4 |
|
|
|
29.3 |
|
|
|
(1.9 |
) |
|
Workforce-related costs |
|
|
15.1 |
|
|
|
15.2 |
|
|
|
(0.1 |
) |
|
Other |
|
|
7.5 |
|
|
|
7.8 |
|
|
|
(0.3 |
) |
|
Total |
|
|
50.0 |
|
|
|
52.3 |
|
|
|
(2.3 |
) |
Overall, costs decreased considerably year over year as a percent of sales largely from the positive shift in mix from non-retail and store branded retail products to branded retail products caused mostly by the COVID-19 pandemic. Substantial declines in product returns also contributed to the lower costs. Partially offsetting these items were $8.2 million of appreciation bonuses paid to frontline workers and $5.1 million of start-up costs incurred for the conversion of our Lynchburg, Virginia plant to an organic bakery. The conversion began in the first quarter of Fiscal 2020 and the bakery resumed production at the end of the third quarter. Ingredient and packaging costs were significantly lower as percent of sales due to the positive shift in mix and the decrease in product returns, both discussed above, as well as lower production volumes in the current year. Also, lower prices for organic and non-organic flour, gluten, bread bags, and corrugated packaging contributed to the improvement, partially offset by higher yeast and sweetener prices and reduced outside purchases of product.
Raw materials, such as our baking ingredients, periodically experience price fluctuations. The cost of these inputs may fluctuate significantly due to government policy and regulation, weather conditions, domestic and international demand, or other unforeseen circumstances. We enter into forward purchase agreements and other derivative financial instruments in an effort to manage the impact of such volatility in raw material prices, but some organic and specialty ingredients do not offer the same hedging opportunities to reduce the impact of price volatility. Any decrease in the availability of these agreements could increase the effective price of these raw materials to us and significantly affect our earnings. We currently anticipate ingredient costs to be higher in Fiscal 2021 relative to Fiscal 2020.
Selling, Distribution and Administrative Expenses (as a percent of sales)
|
Line item component |
|
Fiscal 2020 % of sales |
|
|
Fiscal 2019 % of sales |
|
|
Change as a % of sales |
|
|||
|
Workforce-related costs |
|
|
11.5 |
|
|
|
11.0 |
|
|
|
0.5 |
|
|
Distributor distribution fees |
|
|
15.3 |
|
|
|
14.7 |
|
|
|
0.6 |
|
|
Other |
|
|
11.8 |
|
|
|
12.5 |
|
|
|
(0.7 |
) |
|
Total |
|
|
38.6 |
|
|
|
38.2 |
|
|
|
0.4 |
|
Workforce-related costs increased as a percent of sales compared to the prior year primarily due to higher workforce-related incentive costs, including $4.1 million of appreciation bonuses paid to frontline workers as a result of the COVID-19 pandemic, partially offset by a more favorable sales mix. These appreciation bonuses are in addition to the company’s annual bonus program, in which all Flowers employees participate.
Distributor distribution fees increased considerably as a percent of sales due to the shift in sales mix, which resulted in a larger portion of our sales being made through IDPs.
Decreases in legal settlements, reduced transportation costs, a non-restructuring lease termination gain of $4.1 million, and a $3.9 million reimbursement of indirect losses associated with receiving inferior yeast in a prior year primarily resulted in the decrease in the Other line item in the table above. These items were partially offset by higher consulting costs associated with Project Centennial and the ERP Road Mapping initiatives and greater investments in marketing to support brand growth which are also included in the Other line item above. For additional details regarding the non-restructuring lease termination gain, the Project Centennial and ERP Road Mapping consulting costs, and the reimbursement related to inferior ingredients, see the “Matters Affecting Comparability” section above.
Project Centennial consulting costs increased $14.8 million and the ERP Road Mapping consulting costs were $4.4 million in the current year. Project Centennial was completed in Fiscal 2020. For Fiscal 2021 and over the next several years, we anticipate incurring significant consulting costs associated with implementing the digital strategy initiative, which includes the upgrade of our ERP system, and is further discussed in Item 1., Business, of this Form 10-K. Legal settlements recorded in the current year were $7.3 million as compared to prior year settlements of $28.0 million (inclusive of a $1.3 million benefit related to an adjustment of a prior year settlement based on the final amount paid). See Note 23, Commitments and Contingencies, of Notes to Consolidated Financial Statements of this Form 10-K for
36
additional information regarding legal settlements. Lower fuel costs, the shift in sales mix to more branded retail sales, and distribution optimization initiatives we have implemented contributed to the improvement in transportation costs.
Loss (Recovery) on Inferior Ingredients and Restructuring and Related Impairment Charges
Refer to the discussion in the “Matters Affecting Comparability” section above regarding these items.
Depreciation and Amortization Expense
Depreciation and amortization expense decreased as a percent of sales primarily due to sales increases combined with assets becoming fully depreciated in the current year and fewer assets being placed into service.
Income from Operations
The growth in income from operations year over year as a percent of sales resulted largely from positive shifts in mix resulting from the increase in at-home dining caused by the COVID-19 pandemic and lower ingredient and packaging costs, partially offset by increased restructuring and related impairment charges in the current year as well as higher selling, distribution, and administrative expenses, as discussed above.
Pension Plan Settlement and Curtailment Loss
We recognized $108.8 million of non-cash pension plan settlement and curtailment charges in the current year composed of a settlement charge of $104.5 million and a curtailment loss of $4.3 million as discussed in the “Matters Affecting Comparability” section above.
Net Interest Expense
Net interest expense for the current year was relatively consistent with the prior year as a percent of sales.
Income Tax Expense
The effective tax rate for Fiscal 2020 was 24.1% compared to 22.4% in the prior year. The increase in the rate year over year was primarily due to state taxes, the reduced windfalls on the vesting of stock-based compensation awards in the current year and more executive compensation subject to the limitations of I.R.C. Section 162(m).
For the current year, the primary differences in the effective rate and statutory rate related to state income taxes. The CARES Act did not have a material impact on the effective tax rate for Fiscal 2020 and there is no anticipated material impact on the effective tax rate in future periods. The primary differences in the effective rate and statutory rate for the prior year were state income taxes and windfalls on stock-based compensation.
As discussed above, we have also availed ourselves of the deferral of federal income tax payments made available under an emergency declaration issued on March 13, 2020.
In 2019, the most significant difference in the effective rate and the statutory rate related to state income taxes.
Comprehensive Income
The increase in comprehensive income year over year resulted primarily from recognizing the pension plan settlement and curtailment loss in earnings in conjunction with the termination of Plan No. 1 and changes in the fair value of derivatives, net of the decrease in net earnings.
LIQUIDITY, CAPITAL RESOURCES AND FINANCIAL POSITION
Strategy
We believe our ability to consistently generate cash flows from operating activities to meet our liquidity needs is one of our key financial strengths. The COVID-19 pandemic may continue to significantly impact the economy and our ability to generate future cash flows. In particular, if the foodservice industry is slow to recover, our future cash flows could be negatively impacted.
37
We strive to maintain a conservative financial position as we believe it allows us flexibility to make investments and acquisitions and is a strategic competitive advantage. Currently, our liquidity needs arise primarily from working capital requirements, capital expenditures, and obligated debt repayments. We believe we currently have access to available funds and financing sources to meet our short and long-term capital requirements. The company’s strategy for use of its excess cash flows includes:
|
|
• |
implementing our strategic priorities, including our digital strategy initiatives; |
|
|
• |
paying dividends to our shareholders; |
|
|
• |
maintaining a conservative financial position; |
|
|
• |
making strategic acquisitions; and |
|
|
• |
repurchasing shares of our common stock. |
The situation surrounding COVID-19 remains fluid and its future impact on the company’s business, results of operations, liquidity or capital resources cannot be reasonably estimated with any degree of certainty. We believe the fundamentals of the company remain strong and that we have sufficient liquidity on hand to continue business operations during the pandemic. The company had total available liquidity of $808.2 million as of January 2, 2021 consisting of cash on hand and the available balances under our credit facility and AR facility.
In light of the potential risks associated with the pandemic, the company has taken actions to safeguard its capital position. During the first quarter of Fiscal 2020, we borrowed an additional $200.0 million under our credit facility. We borrowed this additional amount out of an abundance of caution to ensure future liquidity given the significant impact on global financial markets and economies as a result of the COVID-19 outbreak. If the company experienced a significant reduction in revenues, the company would have additional alternatives to maintain liquidity, including amounts available on our debt facilities, capital expenditure reductions, adjustments to its capital allocation policy, and cost reductions. Subsequent to the first quarter of Fiscal 2020, we made net debt repayments totaling $111.3 million. Although we do not currently anticipate a need, we also believe that we could access the capital markets to raise additional funds.
The company leases certain property and equipment under various financing and operating lease arrangements. Most of the operating leases provide the company with the option, after the initial lease term, to purchase the property at the then fair value, renew the lease at the then fair value, or return the property. The financing leases provide the company with the option to purchase the property at a fixed price at the end of the lease term. The company believes the use of leases as a financing alternative places the company in a more favorable position to fulfill its long-term strategy for the use of its cash flow. See Note 14, Leases, of Notes to Consolidated Financial Statements of this Form 10-K for detailed financial information regarding the company’s lease arrangements.
Key items impacting our liquidity, capital resources and financial position in Fiscal 2020 and 2019:
Fiscal 2020:
|
|
• |
We generated $454.5 million of net cash from operating activities. |
|
|
• |
We paid dividends to our shareholders of $167.3 million. |
|
|
• |
We increased our total debt outstanding $92.5 million. |
|
|
• |
We invested in our business through capital expenditures of $97.9 million. |
|
|
• |
We incurred Project Centennial implementation costs, including restructuring cash payments of $12.0 million and non-restructuring consulting costs of $15.5 million. |
|
|
• |
We incurred ERP Road Mapping consulting costs of $4.4 million. |
Fiscal 2019:
|
|
• |
We generated $367.0 million of net cash from operating activities. |
|
|
• |
We paid dividends to our shareholders of $160.0 million. |
|
|
• |
We decreased our total debt outstanding $114.3 million. |
|
|
• |
We invested in our business through capital expenditures of $103.7 million. |
|
|
• |
We incurred Project Centennial implementation costs, including restructuring cash payments of $2.1 million and non-restructuring consulting costs of $0.8 million. |
38
Liquidity Discussion
Flowers Foods’ cash and cash equivalents were $307.5 million at January 2, 2021 and $11.0 million at December 28, 2019. The cash and cash equivalents were derived from the activities presented in the table below (amounts in thousands):
|
Cash flow component |
|
Fiscal 2020 |
|
|
Fiscal 2019 |
|
||
|
Cash flows provided by operating activities |
|
$ |
454,464 |
|
|
$ |
366,952 |
|
|
Cash disbursed for investing activities |
|
|
(73,992 |
) |
|
|
(97,093 |
) |
|
Cash disbursed for financing activities |
|
|
(84,040 |
) |
|
|
(284,121 |
) |
|
Total change in cash |
|
$ |
296,432 |
|
|
$ |
(14,262 |
) |
Cash Flows Provided by Operating Activities. Net cash provided by operating activities included the following items for non-cash adjustments to net income (amounts in thousands):
|
|
|
Fiscal 2020 |
|
|
Fiscal 2019 |
|
||
|
Depreciation and amortization |
|
$ |
141,384 |
|
|
$ |
144,228 |
|
|
Restructuring and related impairment charges |
|
|
23,627 |
|
|
|
21,062 |
|
|
Stock-based compensation |
|
|
12,855 |
|
|
|
7,430 |
|
|
Deferred income taxes |
|
|
(31,154 |
) |
|
|
18,609 |
|
|
Pension and postretirement plans expense (including settlement and curtailment losses) |
|
|
109,823 |
|
|
|
3,234 |
|
|
Other non-cash |
|
|
16,696 |
|
|
|
9,243 |
|
|
Net non-cash adjustment to net income |
|
$ |
273,231 |
|
|
$ |
203,806 |
|
|
|
• |
Refer to the Restructuring and related impairment charges discussion in the “Matters Affecting Comparability” section above regarding these items. |
|
|
• |
The change in stock-based compensation from Fiscal 2019 to Fiscal 2020 was due to an increase in the number of stock grants outstanding in the current year as compared to the prior year. |
|
|
• |
For Fiscal 2020 and Fiscal 2019, the changes in deferred income taxes resulted from changes in temporary differences year over year, including the impact of the termination of Plan No. 1. |
|
|
• |
Changes in pension and postretirement plan (benefit) expense were primarily due to the settlement and curtailment loss of $108.8 million recognized in Fiscal 2020 in conjunction with the termination of Plan No. 1. |
|
|
• |
Other non-cash items include non-cash interest expense for the amortization of debt discounts and deferred financing costs and gains or losses on the sale of assets. |
Net cash for working capital requirements and pension contributions included the following items (amounts in thousands):
|
|
|
Fiscal 2020 |
|
|
Fiscal 2019 |
|
||
|
Changes in accounts receivable, net |
|
$ |
(25,021 |
) |
|
$ |
(7,809 |
) |
|
Changes in inventories, net |
|
|
(1,771 |
) |
|
|
(4,774 |
) |
|
Changes in hedging activities, net |
|
|
15,829 |
|
|
|
10,289 |
|
|
Changes in other assets and accrued liabilities, net |
|
|
53,250 |
|
|
|
17,557 |
|
|
Changes in accounts payable |
|
|
(5,772 |
) |
|
|
(14,155 |
) |
|
Qualified pension plan contributions |
|
|
(7,600 |
) |
|
|
(2,500 |
) |
|
Net changes in working capital and pension contributions |
|
$ |
28,915 |
|
|
$ |
(1,392 |
) |
|
|
• |
The change in accounts receivable primarily resulted from sales increases in Fiscal 2020 as compared to Fiscal 2019. |
|
|
• |
Hedging activities change from market movements that affect the fair value and required collateral of positions and the timing and recognition of deferred gains or losses. These changes will occur as part of our hedging program. |
|
|
• |
The change in other assets and accrued liabilities primarily resulted from changes in employee compensation accruals, legal settlement accruals, income tax receivables, hedge margin and payroll tax deferrals under the CARES Act. In Fiscal 2020 and 2019, we paid $12.0 million and $2.1 million, respectively, of restructuring-related cash charges. We paid $24.5 million of legal settlements in Fiscal 2020, of which $20.9 million had been accrued for in prior years, and paid $7.9 million in Fiscal 2019, all of which had been accrued for in prior years. We anticipate making payments of approximately $64.4 million, including our share of employment taxes, in performance-based cash awards under our bonus plans in the |
39
|
|
first quarter of Fiscal 2021. During Fiscal 2020 and 2019, the company paid $18.6 million and $7.9 million, respectively, including our share of employment taxes, in performance-based cash awards under the company’s bonus plan. The increase in performance-based cash awards expected to be paid in Fiscal 2021 resulted from improved financial performance in Fiscal 2020. An additional $0.2 million and $1.2 million was paid during Fiscal 2020 and 2019, respectively, for our share of employment taxes on the vesting of the performance-contingent restricted stock awards in each respective year. |
|
|
• |
During Fiscal 2020 and 2019, we made voluntary contributions to our qualified defined benefit pension plans of $7.6 million and $2.5 million, respectively. We do not expect to make any cash contributions to our pension plans in Fiscal 2021, however, we do expect to pay $0.3 million in nonqualified pension benefits from corporate assets. The company believes its cash flow and balance sheet will allow it to fund future pension needs without adversely affecting the business strategy of the company. |
Cash Flows Disbursed for Investing Activities. The table below presents net cash disbursed for investing activities for Fiscal 2020 and 2019 (amounts in thousands):
|
|
|
Fiscal 2020 |
|
|
Fiscal 2019 |
|
||
|
Purchase of property, plant, and equipment |
|
$ |
(97,929 |
) |
|
$ |
(103,685 |
) |
|
Principal payments from notes receivable, net of repurchases of independent distributor territories |
|
|
18,379 |
|
|
|
3,824 |
|
|
Proceeds from sale of property, plant and equipment |
|
|
5,368 |
|
|
|
2,649 |
|
|
Other |
|
|
190 |
|
|
|
119 |
|
|
Net cash disbursed for investing activities |
|
$ |
(73,992 |
) |
|
$ |
(97,093 |
) |
|
|
• |
The company currently estimates capital expenditures of approximately $140.0 million to $150.0 million (inclusive of expenditures for the ERP upgrade and related digital strategy initiatives) in Fiscal 2021. |
Cash Flows Disbursed for Financing Activities. The table below presents net cash provided by (disbursed for) financing activities for Fiscal 2020 and 2019 (amounts in thousands):
|
|
|
Fiscal 2020 |
|
|
Fiscal 2019 |
|
||
|
Dividends paid, including dividends on share-based payment awards |
|
$ |
(167,270 |
) |
|
$ |
(159,987 |
) |
|
Payment of contingent consideration |
|
|
(4,700 |
) |
|
|
— |
|
|
Payment of financing fees |
|
|
(206 |
) |
|
|
(110 |
) |
|
Stock repurchases |
|
|
(783 |
) |
|
|
(7,054 |
) |
|
Change in bank overdrafts |
|
|
3,134 |
|
|
|
3,217 |
|
|
Net change in debt obligations |
|
|
92,500 |
|
|
|
(114,250 |
) |
|
Payments on financing leases |
|
|
(6,715 |
) |
|
|
(5,937 |
) |
|
Net cash disbursed for financing activities |
|
$ |
(84,040 |
) |
|
$ |
(284,121 |
) |
|
|
• |
Our annual dividend rate increased from $0.76 per share in Fiscal 2019 to $0.80 per share in Fiscal 2020. While there are no requirements to increase our dividend rate, we have shown a recent historical trend to do so. We anticipate funding future dividend payments from cash flows from operations. |
|
|
• |
The payment for contingent consideration was made to satisfy the contingent consideration liability recorded in the Canyon acquisition. |
|
|
• |
Stock repurchase decisions are made based on our stock price, our belief of relative value, and our cash projections at any given time. See Note 18, Stockholders’ Equity, of Notes to Consolidated Financial Statements of this Form 10-K for additional information. |
|
|
• |
Net debt obligations increased in Fiscal 2020 primarily due to increasing our available liquidity in response to uncertainty in global markets and economies caused by the pandemic, net of repayments we made during the year. |
40
Capital Structure
Long-term debt and right-of-use lease obligations and stockholders’ equity were as follows at January 2, 2021 and December 28, 2019. For a detailed description of our debt and right-of-use lease obligations and information regarding our distributor arrangements, deferred compensation, and guarantees and indemnification obligations, see Note 14, Leases, and Note 15, Debt and Other Commitments, of Notes to Consolidated Financial Statements of this Form 10-K:
|
|
|
Interest Rate at |
|
|
Final |
|
Balance at |
|
|
Fixed or |
||||||
|
|
|
January 2, 2021 |
|
|
Maturity |
|
January 2, 2021 |
|
|
December 28, 2019 |
|
|
Variable Rate |
|||
|
|
|
|
|
|
|
|
|
(Amounts in thousands) |
|
|
|
|||||
|
2026 senior notes |
|
3.50% |
|
|
2026 |
|
$ |
396,705 |
|
|
$ |
396,122 |
|
|
Fixed Rate |
|
|
2022 senior notes |
|
4.38% |
|
|
2022 |
|
|
399,398 |
|
|
|
398,906 |
|
|
Fixed Rate |
|
|
Credit facility |
|
1.15% |
|
|
2022 |
|
|
50,000 |
|
|
|
41,750 |
|
|
Variable Rate |
|
|
AR facility |
|
1.25% |
|
|
2022 |
|
|
114,000 |
|
|
|
26,000 |
|
|
Variable Rate |
|
|
Right-of-use lease obligations |
|
|
|
|
|
2036 |
|
|
345,762 |
|
|
|
404,503 |
|
|
|
|
Other notes payable |
|
|
|
|
|
|
|
|
— |
|
|
|
3,730 |
|
|
|
|
|
|
|
|
|
|
|
|
|
1,305,865 |
|
|
|
1,271,011 |
|
|
|
|
Current maturities of long-term debt and right-of-use lease obligations |
|
|
|
|
|
|
|
|
51,908 |
|
|
|
64,712 |
|
|
|
|
Long-term debt and right-of-use lease obligations |
|
|
|
|
|
|
|
$ |
1,253,957 |
|
|
$ |
1,206,299 |
|
|
|
Total stockholders’ equity was as follows at January 2, 2021 and December 28, 2019:
|
|
|
Balance at |
|
|||||
|
|
|
January 2, 2021 |
|
|
December 28, 2019 |
|
||
|
|
|
(Amounts in thousands) |
|
|||||
|
Total stockholders' equity |
|
$ |
1,372,994 |
|
|
$ |
1,263,430 |
|
The AR facility and credit facility are generally used for short term liquidity needs. The company has historically entered into amendments and extensions approximately one year prior to the maturity of the AR facility and the credit facility. The following table details the amounts available under the AR facility and credit facility and the highest and lowest balances outstanding under these arrangements during Fiscal 2020:
|
|
|
Amount Available |
|
|
Highest |
|
Lowest |
|
|||
|
|
|
for Withdrawal at |
|
|
Balance in |
|
Balance in |
|
|||
|
Facility |
|
January 2, 2021 |
|
|
Fiscal 2020 |
|
Fiscal 2020 |
|
|||
|
|
|
(Amounts in thousands) |
|
||||||||
|
AR facility |
|
$ |
59,100 |
|
|
$ |
154,000 |
|
$ |
19,000 |
|
|
Credit facility (1) |
|
|
441,600 |
|
|
$ |
235,000 |
|
$ |
10,000 |
|
|
|
|
$ |
500,700 |
|
|
|
|
|
|
|
|
|
(1) |
Amount excludes a provision in the agreement which allows the company to request an additional $200.0 million in additional revolving commitments. |
Amounts outstanding under the credit facility can vary daily. Changes in the gross borrowings and repayments can be caused by cash flow activity from operations, capital expenditures, acquisitions, dividends, share repurchases, and tax payments, as well as derivative transactions which are part of the company’s overall risk management strategy as discussed in Note 11, Derivative Financial Instruments, of Notes to Consolidated Financial Statements of this Form 10-K. During Fiscal 2020, the company borrowed $272.6 million in revolving borrowings under the credit facility and repaid $264.4 million in revolving borrowings. The amount available under the credit facility is reduced by $8.4 million for letters of credit.
The AR facility and the credit facility are variable rate debt. In periods of rising interest rates, the cost of using the AR facility and the credit facility will become more expensive and increase our interest expense. Therefore, borrowings under these facilities provide us the greatest direct exposure to rising rates. In addition, if interest rates do increase, it will make the cost of funds more expensive.
Restrictive financial covenants for our borrowings include such ratios as a minimum interest coverage ratio and a maximum leverage ratio. Our debt may also contain certain customary representations and warranties, affirmative and negative covenants, and
41
events of default. The company believes that, given its current cash position, its cash flow from operating activities and its available credit capacity, it can comply with the current terms of the debt agreements and can meet its presently foreseeable financial requirements. As of January 2, 2021 and December 28, 2019, the company was in compliance with all restrictive covenants under our debt agreements.
Special Purpose Entities. At January 2, 2021 and December 28, 2019, the company did not have any relationships with unconsolidated entities or financial partnerships, such as entities often referred to as structured finance or special purpose entities, which are established to facilitate off-balance sheet arrangements or other contractually narrow or limited purposes.
Contractual Obligations and Commitments. The following table summarizes the company’s contractual obligations and commitments at January 2, 2021 and the effect such obligations are expected to have on its liquidity and cash flow in the indicated future periods:
|
|
|
Payments Due by Fiscal Year |
|
|||||||||||||||||
|
|
|
(Amounts in thousands) |
|
|||||||||||||||||
|
|
|
Total |
|
|
2021 |
|
|
2022-2023 |
|
|
2024-2025 |
|
|
2026 and Beyond |
|
|||||
|
Contractual Obligations: |
|
|
|
|
|
|
|
|
|
|
|
|
|
|
|
|
|
|
|
|
|
Long-term debt |
|
$ |
964,000 |
|
|
$ |
— |
|
|
$ |
564,000 |
|
|
$ |
— |
|
|
$ |
400,000 |
|
|
Interest payments (1) |
|
|
121,200 |
|
|
|
34,500 |
|
|
|
28,900 |
|
|
|
28,900 |
|
|
|
28,900 |
|
|
Financing right-of-use leases (2) |
|
|
5,644 |
|
|
|
1,907 |
|
|
|
3,635 |
|
|
|
102 |
|
|
|
— |
|
|
Operating right-of-use leases (2) |
|
|
414,736 |
|
|
|
63,044 |
|
|
|
98,544 |
|
|
|
76,067 |
|
|
|
177,081 |
|
|
Pension and postretirement contributions and payments (3) |
|
|
30,932 |
|
|
|
4,889 |
|
|
|
7,032 |
|
|
|
6,226 |
|
|
|
12,785 |
|
|
Deferred compensation plan obligations (4) |
|
|
18,308 |
|
|
|
1,634 |
|
|
|
2,996 |
|
|
|
2,615 |
|
|
|
11,063 |
|
|
Purchase obligations (5) |
|
|
379,437 |
|
|
|
379,437 |
|
|
|
— |
|
|
|
— |
|
|
|
— |
|
|
Total contractual cash obligations |
|
$ |
1,934,257 |
|
|
$ |
485,411 |
|
|
$ |
705,107 |
|
|
$ |
113,910 |
|
|
$ |
629,829 |
|
|
|
|
Amounts Expiring by Fiscal Year |
|
|||||||||||||||||
|
|
|
(Amounts in thousands) |
|
|||||||||||||||||
|
|
|
Total |
|
|
Less than 1 Year |
|
|
1-3 Years |
|
|
4-5 Years |
|
|
More than 5 Years |
|
|||||
|
Commitments: |
|
|
|
|
|
|
|
|
|
|
|
|
|
|
|
|
|
|
|
|
|
Standby letters of credit (6) |
|
$ |
19,064 |
|
|
$ |
10,814 |
|
|
$ |
— |
|
|
$ |
— |
|
|
$ |
8,250 |
|
|
Total commitments |
|
$ |
19,064 |
|
|
$ |
10,814 |
|
|
$ |
— |
|
|
$ |
— |
|
|
$ |
8,250 |
|
|
(1) |
Amounts outstanding under our credit facility at January 2, 2021 were not included since payments into and out of the credit facility change daily. The AR facility interest rate is based on the actual rate at January 2, 2021. Interest on the senior notes and other notes payable is based on the stated rate and excludes the amortization of debt discount and debt issuance costs. |
|
(2) |
Includes the computed interest portion of the payments based on the incremental borrowing rate. |
|
(3) |
Includes the expected benefit payments for postretirement plans from Fiscal 2021 through Fiscal 2030. These future postretirement plan payments are not recorded on the Consolidated Balance Sheets but will be recorded as these payments are incurred in the Consolidated Statements of Income. The company completed the termination of Plan No. 1 in Fiscal 2020. The company does not expect to make any cash contributions to Plan No. 2 in Fiscal 2021. |
|
(4) |
These are unsecured general obligations to pay the deferred compensation of, and our contributions to, participants in the executive deferred compensation plan. This liability is recorded on the Consolidated Balance Sheets as either a current or long-term liability. |
|
(5) |
Represents the company’s various ingredient and packaging purchasing commitments. This item is not recorded on the Consolidated Balance Sheets. |
|
(6) |
These letters of credit are for the benefit of certain insurance companies related to workers’ compensation liabilities recorded by the company as of January 2, 2021 and certain lessors and energy vendors. Such amounts are not recorded on the Consolidated Balance Sheets, but $8.4 million of this total reduces the availability of funds under the credit facility. |
In the event the company ceases to utilize the independent distribution form of doing business or exits a geographic market, the company is contractually required to purchase the distribution rights from the independent distributor. These potential commitments are excluded from the table above because they cannot be known at this time.
42
Stock Repurchase Plan. The Board has approved a plan that currently authorizes share repurchases of up to 74.6 million shares of the company’s common stock. At the close of the company’s fourth quarter on January 2, 2021, 6.2 million shares remained under the existing authorization. Under the plan, the company may repurchase its common stock in open market or privately negotiated transactions or under an accelerated repurchase program at such times and at such prices as determined to be in the company’s best interest. These purchases may be commenced or suspended without prior notice depending on then-existing business or market conditions and other factors. During Fiscal 2020, 0.04 million shares of the company’s common stock were repurchased under the plan at a cost of $0.8 million and during Fiscal 2019, 0.3 million shares were repurchased under the plan at a cost of $7.1 million. From the inception of the plan through January 2, 2021, 68.4 million shares, at a cost of $643.4 million, have been repurchased. There were no repurchases of the company’s common stock during the fourth quarter of Fiscal 2020.
New Accounting Pronouncements Not Yet Adopted
See Note 3, Recent Accounting Pronouncements, of Notes to Consolidated Financial Statements of this Form 10-K regarding this information.
|
Item 7A. |
Quantitative and Qualitative Disclosures About Market Risk |
The company uses derivative financial instruments as part of an overall strategy to manage market risk. The company uses forwards, futures, swaps, and option contracts to hedge existing or future exposure to changes in interest rates and commodity prices. The company does not enter into these derivative financial instruments for trading or speculative purposes. If actual market conditions are less favorable than those anticipated, interest rates and commodity prices could increase significantly, adversely affecting our interest costs and the margins from the sale of our products.
Commodity Price Risk
The company enters into commodity forward, futures, option, and swap contracts for wheat and, to a lesser extent, other commodities in an effort to provide a predictable and consistent commodity price and thereby reduce the impact of market volatility in its raw material and packaging prices. As of January 2, 2021, the company’s hedge portfolio contained commodity derivatives with a fair value of $17.3 million and is based on quoted market prices. Approximately $16.7 million relates to instruments that will be utilized in Fiscal 2021 and $0.6 million that will be utilized in Fiscal 2022.
A sensitivity analysis has been prepared to quantify the company’s potential exposure to commodity price risk with respect to its derivative portfolio. Based on the company’s derivative portfolio as of January 2, 2021, a hypothetical ten percent change in commodity prices would increase or decrease the fair value of the derivative portfolio by $10.1 million. The analysis disregards changes in the exposures inherent in the underlying hedged items; however, the company expects that any increase or decrease in the fair value of the portfolio would be substantially offset by increases or decreases in raw material and packaging prices.
|
Item 8. |
Financial Statements and Supplementary Data |
Refer to the Index to Consolidated Financial Statements and the Financial Statement Schedule for the required information.
|
Item 9. |
Changes in and Disagreements with Accountants on Accounting and Financial Disclosure |
None.
|
Item 9A. |
Controls and Procedures |
Management’s Evaluation of Disclosure Controls and Procedures:
We have established and maintain a system of disclosure controls and procedures that are designed to ensure that material information relating to the company, which is required to be timely disclosed by us in reports that we file or submit under the Securities Exchange Act of 1934 (“Exchange Act”), is accumulated and communicated to management in a timely fashion and is recorded, processed, summarized and reported within the time periods specified by the SEC’s rules and forms. An evaluation of the effectiveness of the design and operation of our disclosure controls and procedures (as defined in Rule 13a-15(e) under the Exchange Act) was performed as of the end of the period covered by this annual report. This evaluation was performed under the supervision and with the participation of management, including our CEO and our CFO and CAO.
Based upon that evaluation, our CEO and our CFO and CAO have concluded that these disclosure controls and procedures were effective as of the end of the period covered by this annual report.
43
Management’s Report on Internal Control Over Financial Reporting:
Our management is responsible for establishing and maintaining adequate internal control over financial reporting, as such term is defined in Rule 13a-15(f) under the Exchange Act. Under the supervision and with the participation of our management, including our CEO and our CFO and CAO, we conducted an evaluation of the effectiveness of our internal control over financial reporting based on the framework in “Internal Control — Integrated Framework (2013)” issued by the Committee of Sponsoring Organizations of the Treadway Commission. Based on our evaluation our management concluded that our internal control over financial reporting was effective as of January 2, 2021.
The effectiveness of our internal control over financial reporting as of January 2, 2021 has been audited by PricewaterhouseCoopers LLP, an independent registered public accounting firm, as stated in its report which is included herein.
Changes in Internal Control Over Financial Reporting:
There were no changes in our internal control over financial reporting that occurred during our last fiscal quarter that have materially affected, or are reasonably likely to materially affect, our internal control over financial reporting.
|
Item 9B. |
Other Information |
None.
44
PART III
|
Item 10. |
Directors, Executive Officers and Corporate Governance |
The information required by this item with respect to directors of the company is incorporated herein by reference to the information set forth under the captions “Proposal I Election of Directors”, “Directors and Corporate Governance — Directors”, “Directors and Corporate Governance — Corporate Governance — The Board of Directors and Committees of the Board of Directors”, “Directors and Corporate Governance — Corporate Governance — Relationships Among Certain Directors”, “Audit Committee Report” and “Section 16(a) Beneficial Ownership Reporting Compliance” in the company’s definitive proxy statement for the 2021 Annual Meeting of Shareholders expected to be filed with the SEC in April (the “proxy”). The information required by this item with respect to executive officers of the company is set forth in Part I of this Form 10-K.
We have adopted the Flowers Foods, Inc. Code of Business Conduct and Ethics for Officers and Members of the Board of Directors (the “Code of Business Conduct and Ethics”), which applies to all of our directors and executive officers. The Code of Business Conduct and Ethics is publicly available on our website at www.flowersfoods.com in the “CORPORATE GOVERNANCE” section of the “INVESTORS” tab. If we make any substantive amendments to our Code of Business Conduct and Ethics or we grant any waiver, including any implicit waiver, from a provision of the Code of Business Conduct and Ethics, that applies to any of our directors or executive officers, including our principal executive officer and our principal financial officer and principal accounting officer, we intend to disclose the nature of the amendment or waiver on our website at the same location. Alternatively, we may elect to disclose the amendment or waiver in a current report on Form 8-K filed with the SEC.
Our President and CEO certified to the NYSE on June 22, 2020 pursuant to Section 303A.12 of the NYSE’s listing standards, that he was not aware of any violation by Flowers Foods of the NYSE’s corporate governance listing standards as of that date.
|
Item 11. |
Executive Compensation |
The information required by this item is incorporated herein by reference to the information set forth under the caption “Executive Compensation” in the proxy.
|
Item 12. |
Security Ownership of Certain Beneficial Owners and Management and Related Stockholder Matters |
See Item 5 of this Form 10-K for information regarding Securities Authorized for Issuance under Equity Compensation Plans. The remaining information required by this item is incorporated herein by reference to the information set forth under the caption “Security Ownership of Certain Beneficial Owners and Management” in the proxy.
|
Item 13. |
Certain Relationships and Related Transactions, and Director Independence |
The information required by this item is incorporated herein by reference to the information set forth under the caption “Directors and Corporate Governance — Corporate Governance — Determination of Independence” and “Transactions with Management and Others” in the proxy.
|
Item 14. |
Principal Accounting Fees and Services |
The information required by this item is incorporated herein by reference to the information set forth under the caption “Proposal III Ratification of Appointment of Independent Registered Public Accounting Firm — Fiscal 2020 and Fiscal 2019 Audit Firm Fee Summary” in the proxy.
45
PART IV
|
Item 15. |
Exhibits and Financial Statement Schedules |
|
(a) |
List of documents filed as part of this report. |
|
|
1. |
Financial Statements of the Registrant |
Report of Independent Registered Public Accounting Firm.
Consolidated Balance Sheets at January 2, 2021 and December 28, 2019.
Consolidated Statements of Income for Fiscal 2020, Fiscal 2019, and Fiscal 2018.
Consolidated Statements of Comprehensive Income for Fiscal 2020, Fiscal 2019, and Fiscal 2018.
Consolidated Statements of Changes in Stockholders’ Equity for Fiscal 2020, Fiscal 2019, and Fiscal 2018.
Consolidated Statements of Cash Flows for Fiscal 2020, Fiscal 2019, and Fiscal 2018.
Notes to Consolidated Financial Statements.
|
|
2. |
Exhibits. The following documents are filed as exhibits hereto: |
46
EXHIBIT INDEX
|
Exhibit |
|
|
|
|
|
No |
|
|
|
Name of Exhibit |
|
2.1 |
|
— |
|
|
|
2.2 |
|
— |
|
|
|
2.3 |
|
— |
|
|
|
2.4 |
|
— |
|
|
|
2.5 |
|
— |
|
|
|
2.6 |
|
— |
|
|
|
3.1 |
|
— |
|
|
|
3.2 |
|
— |
|
|
|
4.1 |
|
— |
|
|
|
4.2 |
|
— |
|
|
|
4.3 |
|
— |
|
|
|
4.4 |
|
— |
|
|
|
4.5 |
|
— |
|
|
|
4.6 |
|
— |
|
|
|
4.7 |
|
— |
|
|
|
4.8 |
* |
— |
|
|
|
10.1 |
|
— |
|
|
|
10.2 |
|
— |
|
47
|
Exhibit |
|
|
|
|
|
No |
|
|
|
Name of Exhibit |
|
10.3 |
|
— |
|
|
|
10.4 |
|
— |
|
|
|
10.5 |
|
— |
|
|
|
10.6 |
|
— |
|
|
|
10.7 |
|
— |
|
|
|
10.08 |
|
— |
|
|
|
10.09 |
|
— |
|
|
|
10.10 |
|
— |
|
|
|
10.11 |
|
— |
|
|
|
10.12 |
|
— |
|
|
|
10.13 |
|
— |
|
|
|
10.14 |
|
— |
|
48
|
Exhibit |
|
|
|
|
|
No |
|
|
|
Name of Exhibit |
|
10.15 |
|
— |
|
|
|
10.16 |
|
— |
|
|
|
10.17 |
+ |
— |
|
|
|
10.18 |
+ |
— |
|
|
|
10.19 |
+ |
— |
|
|
|
10.20 |
+ |
— |
|
|
|
10.21 |
+ |
— |
|
|
|
10.22 |
+ |
— |
|
|
|
10.23 |
+ |
— |
|
|
|
10.24 |
+ |
— |
|
|
|
10.25 |
+ |
— |
|
|
|
10.26 |
+ |
— |
|
|
|
10.27 |
+ |
— |
|
|
|
10.28 |
+ |
— |
|
|
|
10.29 |
+* |
— |
|
|
|
10.30 |
+* |
— |
|
|
|
21 |
* |
— |
|
|
|
23 |
* |
— |
|
Consent of Independent Registered Public Accounting Firm, PricewaterhouseCoopers LLP |
|
31.1 |
* |
— |
|
Certification of Chief Executive Officer pursuant to Section 302 of the Sarbanes-Oxley Act of 2002. |
|
31.2 |
* |
— |
|
49
|
Exhibit |
|
|
|
|
|
No |
|
|
|
Name of Exhibit |
|
32 |
* |
— |
|
|
|
101.INS |
* |
— |
|
Inline XBRL Instance Document. |
|
101.SCH |
* |
— |
|
Inline XBRL Taxonomy Extension Schema Linkbase. |
|
101.CAL |
* |
— |
|
Inline XBRL Taxonomy Extension Calculation Linkbase. |
|
101.DEF |
* |
— |
|
Inline XBRL Taxonomy Extension Definition Linkbase. |
|
101.LAB |
* |
— |
|
Inline XBRL Taxonomy Extension Label Linkbase. |
|
101.PRE |
* |
— |
|
Inline XBRL Taxonomy Extension Presentation Linkbase. |
|
104 |
|
— |
|
The cover page from Flowers Foods’ Annual Report on Form 10-K for the fiscal year ended January 2, 2021 has been formatted in Inline XBRL. |
|
* |
Filed herewith |
|
+ |
Management contract or compensatory plan or arrangement |
|
Item 16. |
Form 10-K Summary |
The company has elected not to provide summary information.
50
SIGNATURES
Pursuant to the requirements of Section 13 or 15(d) of the Securities Exchange Act of 1934, Flowers Foods, Inc. has duly caused this Form 10-K to be signed on its behalf by the undersigned, thereunto duly authorized on this 24th day of February, 2021.
|
|
|
FLOWERS FOODS, INC. |
|
|
|
|
|
|
|
/s/ A. RYALS MCMULLIAN |
|
|
|
A. Ryals McMullian |
|
|
|
President and |
|
|
|
Chief Executive Officer |
|
|
|
|
|
|
|
/s/ R. STEVE KINSEY |
|
|
|
R. Steve Kinsey |
|
|
|
Chief Financial Officer and Chief Accounting Officer |
|
|
|
|
51
Pursuant to the requirements of the Securities Exchange Act of 1934, this Form 10-K has been signed below by the following persons on behalf of Flowers Foods, Inc. and in the capacities and on the dates indicated.
|
Signature |
|
Title |
|
Date |
|
|
|
|
|
|
|
/s/ A. RYALS MCMULLIAN |
|
President and Chief Executive Officer and Director |
|
February 24, 2021 |
|
A. Ryals McMullian |
|
|
||
|
|
|
|
|
|
|
/s/ R. STEVE KINSEY |
|
Chief Financial Officer and Chief Accounting Officer |
|
February 24, 2021 |
|
R. Steve Kinsey |
|
|
||
|
|
|
|
|
|
|
/s/ GEORGE E. DEESE |
|
Chairman |
|
February 24, 2021 |
|
George E. Deese |
|
|
||
|
|
|
|
|
|
|
/s/ EDWARD J. CASEY, JR |
|
Director |
|
February 24, 2021 |
|
Edward J. Casey, Jr. |
|
|
||
|
|
|
|
|
|
|
/s/ THOMAS C. CHUBB III |
|
Director |
|
February 24, 2021 |
|
Thomas C. Chubb III |
|
|
||
|
|
|
|
|
|
|
/s/ RHONDA O. GASS |
|
Director |
|
February 24, 2021 |
|
Rhonda O. Gass |
|
|
||
|
|
|
|
|
|
|
/s/ BENJAMIN H. GRISWOLD IV |
|
Director |
|
February 24, 2021 |
|
Benjamin H. Griswold IV |
|
|
||
|
|
|
|
|
|
|
/s/ MARGARET G. LEWIS |
|
Director |
|
February 24, 2021 |
|
Margaret G. Lewis |
|
|
||
|
|
||||
|
/s/ W. JAMESON MCFADDEN |
|
Director |
|
February 24, 2021 |
|
W. Jameson McFadden |
|
|
|
|
|
|
|
|
|
|
|
/s/ JAMES T. SPEAR |
|
Director |
|
February 24, 2021 |
|
James T. Spear |
|
|
||
|
|
|
|
|
|
|
/s/ MELVIN T. STITH, PH.D. |
|
Director |
|
February 24, 2021 |
|
Melvin T. Stith, Ph.D. |
|
|
||
|
|
|
|
|
|
|
/s/ TERRY S. THOMAS |
|
Director |
|
February 24, 2021 |
|
Terry S. Thomas |
|
|
|
|
|
|
|
|
|
|
|
/s/ C. MARTIN WOOD III |
|
Director |
|
February 24, 2021 |
|
C. Martin Wood III |
|
|
||
52
FLOWERS FOODS, INC. AND SUBSIDIARIES
INDEX TO CONSOLIDATED FINANCIAL STATEMENTS
F-1
Report of Independent Registered Public Accounting Firm
To the Board of Directors and Stockholders of Flowers Foods, Inc.
Opinions on the Financial Statements and Internal Control over Financial Reporting
We have audited the accompanying consolidated balance sheets of Flowers Foods, Inc. and its subsidiaries (the “Company”) as of January 2, 2021 and December 28, 2019, and the related consolidated statements of income, of comprehensive income, of changes in stockholders’ equity and of cash flows for each of the three years in the period ended January 2, 2021, including the related notes (collectively referred to as the “consolidated financial statements”). We also have audited the Company's internal control over financial reporting as of January 2, 2021, based on criteria established in Internal Control - Integrated Framework (2013) issued by the Committee of Sponsoring Organizations of the Treadway Commission (COSO).
In our opinion, the consolidated financial statements referred to above present fairly, in all material respects, the financial position of the Company as of January 2, 2021 and December 28, 2019, and the results of its operations and its cash flows for each of the three years in the period ended January 2, 2021 in conformity with accounting principles generally accepted in the United States of America. Also in our opinion, the Company maintained, in all material respects, effective internal control over financial reporting as of January 2, 2021, based on criteria established in Internal Control - Integrated Framework (2013) issued by the COSO.
Change in Accounting Principle
As discussed in Note 2 to the consolidated financial statements, the Company changed the manner in which it accounts for leases in 2019.
Basis for Opinions
The Company's management is responsible for these consolidated financial statements, for maintaining effective internal control over financial reporting, and for its assessment of the effectiveness of internal control over financial reporting, included in Management’s Report on Internal Control Over Financial Reporting appearing under Item 9A. Our responsibility is to express opinions on the Company’s consolidated financial statements and on the Company's internal control over financial reporting based on our audits. We are a public accounting firm registered with the Public Company Accounting Oversight Board (United States) (PCAOB) and are required to be independent with respect to the Company in accordance with the U.S. federal securities laws and the applicable rules and regulations of the Securities and Exchange Commission and the PCAOB.
We conducted our audits in accordance with the standards of the PCAOB. Those standards require that we plan and perform the audits to obtain reasonable assurance about whether the consolidated financial statements are free of material misstatement, whether due to error or fraud, and whether effective internal control over financial reporting was maintained in all material respects.
Our audits of the consolidated financial statements included performing procedures to assess the risks of material misstatement of the consolidated financial statements, whether due to error or fraud, and performing procedures that respond to those risks. Such procedures included examining, on a test basis, evidence regarding the amounts and disclosures in the consolidated financial statements. Our audits also included evaluating the accounting principles used and significant estimates made by management, as well as evaluating the overall presentation of the consolidated financial statements. Our audit of internal control over financial reporting included obtaining an understanding of internal control over financial reporting, assessing the risk that a material weakness exists, and testing and evaluating the design and operating effectiveness of internal control based on the assessed risk. Our audits also included performing such other procedures as we considered necessary in the circumstances. We believe that our audits provide a reasonable basis for our opinions.
Definition and Limitations of Internal Control over Financial Reporting
A company’s internal control over financial reporting is a process designed to provide reasonable assurance regarding the reliability of financial reporting and the preparation of financial statements for external purposes in accordance with generally accepted accounting principles. A company’s internal control over financial reporting includes those policies and procedures that (i) pertain to the maintenance of records that, in reasonable detail, accurately and fairly reflect the transactions and dispositions of the assets of the company; (ii) provide reasonable assurance that transactions are recorded as necessary to permit preparation of financial statements in accordance with generally accepted accounting principles, and that receipts and expenditures of the company are being made only in accordance with authorizations of management and directors of the company; and (iii) provide reasonable assurance regarding prevention or timely detection of unauthorized acquisition, use, or disposition of the company’s assets that could have a material effect on the financial statements.
F-2
Because of its inherent limitations, internal control over financial reporting may not prevent or detect misstatements. Also, projections of any evaluation of effectiveness to future periods are subject to the risk that controls may become inadequate because of changes in conditions, or that the degree of compliance with the policies or procedures may deteriorate.
Critical Audit Matters
The critical audit matter communicated below is a matter arising from the current period audit of the consolidated financial statements that was communicated or required to be communicated to the audit committee and that (i) relates to accounts or disclosures that are material to the consolidated financial statements and (ii) involved our especially challenging, subjective, or complex judgments. The communication of critical audit matters does not alter in any way our opinion on the consolidated financial statements, taken as a whole, and we are not, by communicating the critical audit matter below, providing a separate opinion on the critical audit matter or on the accounts or disclosures to which it relates.
Workers’ Compensation Reserves
As described in Note 2 to the consolidated financial statements, the Company is self-insured for various levels of general liability, including workers’ compensation. As of January 2, 2021, self-insurance reserves totaled approximately $29.4 million, of which workers’ compensation reserves represent a portion of the total balance. Management estimates workers’ compensation reserves based on actual claim data and estimates of incurred but not reported claims developed utilizing historical claim trends, and projected settlements of incurred but not reported claims are estimated based on pending claims, historical trends and industry trends related to expected losses and actual reported losses and key assumptions, including loss development factors and expected loss rates.
The principal considerations for our determination that performing procedures relating to workers’ compensation reserves is a critical audit matter are (i) the significant judgment by management when developing the estimated workers’ compensation reserves; (ii) a high degree of auditor judgment and subjectivity in performing procedures and in evaluating audit evidence relating to the estimated workers’ compensation reserves and management’s significant assumptions related to loss development factors and expected loss rates; and (iii) the audit effort involved the use of professionals with specialized skill and knowledge.
Addressing the matter involved performing procedures and evaluating audit evidence in connection with forming our overall opinion on the consolidated financial statements. These procedures included testing the effectiveness of controls relating to management’s estimate of workers’ compensation reserves, including controls over the development of significant assumptions related to the determination of the loss development factors and expected loss rates. These procedures also included, among others, obtaining and evaluating the Company’s workers’ compensation plan documents and testing management’s process for estimating the workers’ compensation reserves. Testing management’s process included (i) evaluating the reasonableness of significant assumptions, including the loss development factors and expected loss rates used by management to estimate workers’ compensation reserves, (ii) testing the completeness and accuracy of incurred and paid claims data used in management’s workers’ compensation reserves and (iii) using professionals with specialized skill and knowledge to assist in evaluating the appropriateness of the actuarial valuation methods and the reasonableness of loss development factors and expected loss rates.
/s/ PricewaterhouseCoopers LLP
Atlanta, Georgia
February 24, 2021
We have served as the Company’s auditor since at least 1969. We have not been able to determine the specific year we began serving as auditor of the Company.
F-3
FLOWERS FOODS, INC. AND SUBSIDIARIES
CONSOLIDATED BALANCE SHEETS
|
|
|
January 2, 2021 |
|
|
December 28, 2019 |
|
||
|
|
|
(Amounts in thousands, except share data) |
|
|||||
|
ASSETS |
|
|
|
|
|
|
|
|
|
Current assets: |
|
|
|
|
|
|
|
|
|
Cash and cash equivalents |
|
$ |
|
|
|
$ |
|
|
|
Accounts and notes receivable, net of allowances of $ |
|
|
|
|
|
|
|
|
|
Inventories: |
|
|
|
|
|
|
|
|
|
Raw materials |
|
|
|
|
|
|
|
|
|
Packaging materials |
|
|
|
|
|
|
|
|
|
Finished goods |
|
|
|
|
|
|
|
|
|
|
|
|
|
|
|
|
|
|
|
Spare parts and supplies |
|
|
|
|
|
|
|
|
|
Other |
|
|
|
|
|
|
|
|
|
Total current assets |
|
|
|
|
|
|
|
|
|
Property, plant and equipment: |
|
|
|
|
|
|
|
|
|
Land |
|
|
|
|
|
|
|
|
|
Buildings |
|
|
|
|
|
|
|
|
|
Machinery and equipment |
|
|
|
|
|
|
|
|
|
Furniture, fixtures and transportation equipment |
|
|
|
|
|
|
|
|
|
Construction in progress |
|
|
|
|
|
|
|
|
|
|
|
|
|
|
|
|
|
|
|
Less: accumulated depreciation |
|
|
( |
) |
|
|
( |
) |
|
|
|
|
|
|
|
|
|
|
|
Financing lease right-of-use assets |
|
|
|
|
|
|
|
|
|
Operating lease right-of-use assets |
|
|
|
|
|
|
|
|
|
Notes receivable from independent distributor partners |
|
|
|
|
|
|
|
|
|
Assets held for sale |
|
|
|
|
|
|
|
|
|
Other assets |
|
|
|
|
|
|
|
|
|
Goodwill |
|
|
|
|
|
|
|
|
|
Other intangible assets, net |
|
|
|
|
|
|
|
|
|
Total assets |
|
$ |
|
|
|
$ |
|
|
|
LIABILITIES AND STOCKHOLDERS’ EQUITY |
|
|
|
|
|
|
|
|
|
Current liabilities: |
|
|
|
|
|
|
|
|
|
Current maturities of long-term debt |
|
$ |
— |
|
|
$ |
|
|
|
Current maturities of financing leases |
|
|
|
|
|
|
|
|
|
Current maturities of operating leases |
|
|
|
|
|
|
|
|
|
Current postretirement/post-employment obligations |
|
|
|
|
|
|
|
|
|
Accounts payable |
|
|
|
|
|
|
|
|
|
Other accrued liabilities |
|
|
|
|
|
|
|
|
|
Total current liabilities |
|
|
|
|
|
|
|
|
|
Long-term debt and right-of-use lease liabilities: |
|
|
|
|
|
|
|
|
|
Noncurrent long-term debt |
|
|
|
|
|
|
|
|
|
Noncurrent financing lease obligations |
|
|
|
|
|
|
|
|
|
Noncurrent operating lease obligations |
|
|
|
|
|
|
|
|
|
Total long-term debt and right-of-use lease liabilities |
|
|
|
|
|
|
|
|
|
Other liabilities: |
|
|
|
|
|
|
|
|
|
Post-retirement/post-employment obligations |
|
|
|
|
|
|
|
|
|
Deferred taxes |
|
|
|
|
|
|
|
|
|
Other long-term liabilities |
|
|
|
|
|
|
|
|
|
Total other long-term liabilities |
|
|
|
|
|
|
|
|
|
Commitments and contingencies |
|
|
|
|
|
|
|
|
|
Stockholders’ equity: |
|
|
|
|
|
|
|
|
|
Preferred stock — $ |
|
|
|
|
|
|
|
|
|
Preferred stock — $ |
|
|
|
|
|
|
|
|
|
Common stock — $ |
|
|
|
|
|
|
|
|
|
Treasury stock — |
|
|
( |
) |
|
|
( |
) |
|
Capital in excess of par value |
|
|
|
|
|
|
|
|
|
Retained earnings |
|
|
|
|
|
|
|
|
|
Accumulated other comprehensive income (loss) |
|
|
|
|
|
|
( |
) |
|
Total stockholders’ equity |
|
|
|
|
|
|
|
|
|
Total liabilities and stockholders’ equity |
|
$ |
|
|
|
$ |
|
|
See Accompanying Notes to Consolidated Financial Statements
F-4
FLOWERS FOODS, INC. AND SUBSIDIARIES
CONSOLIDATED STATEMENTS OF INCOME
|
|
|
Fiscal 2020 |
|
|
Fiscal 2019 |
|
|
Fiscal 2018 |
|
|||
|
|
|
53 weeks |
|
|
52 weeks |
|
|
52 weeks |
|
|||
|
|
|
(Amounts in thousands, except per share data) |
|
|||||||||
|
Sales |
|
$ |
|
|
|
$ |
|
|
|
$ |
|
|
|
Materials, supplies, labor and other production costs (exclusive of depreciation and amortization shown separately below) |
|
|
|
|
|
|
|
|
|
|
|
|
|
Selling, distribution and administrative expenses |
|
|
|
|
|
|
|
|
|
|
|
|
|
Depreciation and amortization |
|
|
|
|
|
|
|
|
|
|
|
|
|
Restructuring and related impairment charges |
|
|
|
|
|
|
|
|
|
|
|
|
|
Loss (recovery) on inferior ingredients |
|
|
|
|
|
|
( |
) |
|
|
|
|
|
Multi-employer pension plan withdrawal costs |
|
|
— |
|
|
|
— |
|
|
|
|
|
|
Impairment of assets |
|
|
— |
|
|
|
— |
|
|
|
|
|
|
Income from operations |
|
|
|
|
|
|
|
|
|
|
|
|
|
Interest expense |
|
|
|
|
|
|
|
|
|
|
|
|
|
Interest income |
|
|
( |
) |
|
|
( |
) |
|
|
( |
) |
|
Pension plan settlement and curtailment loss |
|
|
|
|
|
|
— |
|
|
|
|
|
|
Other components of net periodic pension and postretirement benefits (credit) expense |
|
|
( |
) |
|
|
|
|
|
|
( |
) |
|
Income before income taxes |
|
|
|
|
|
|
|
|
|
|
|
|
|
Income tax expense |
|
|
|
|
|
|
|
|
|
|
|
|
|
Net income |
|
$ |
|
|
|
$ |
|
|
|
$ |
|
|
|
Net income per common share: |
|
|
|
|
|
|
|
|
|
|
|
|
|
Basic: |
|
|
|
|
|
|
|
|
|
|
|
|
|
Net income per common share |
|
$ |
|
|
|
$ |
|
|
|
$ |
|
|
|
Weighted average shares outstanding |
|
|
|
|
|
|
|
|
|
|
|
|
|
Diluted: |
|
|
|
|
|
|
|
|
|
|
|
|
|
Net income per common share |
|
$ |
|
|
|
$ |
|
|
|
$ |
|
|
|
Weighted average shares outstanding |
|
|
|
|
|
|
|
|
|
|
|
|
|
Cash dividends paid per common share |
|
$ |
|
|
|
$ |
|
|
|
$ |
|
|
See Accompanying Notes to Consolidated Financial Statements
F-5
FLOWERS FOODS, INC. AND SUBSIDIARIES
CONSOLIDATED STATEMENTS OF COMPREHENSIVE INCOME
|
|
|
Fiscal 2020 |
|
|
Fiscal 2019 |
|
|
Fiscal 2018 |
|
|||
|
|
|
53 weeks |
|
|
52 weeks |
|
|
52 weeks |
|
|||
|
|
|
(Amounts in thousands) |
|
|||||||||
|
Net income |
|
$ |
|
|
|
$ |
|
|
|
$ |
|
|
|
Other comprehensive income, net of tax: |
|
|
|
|
|
|
|
|
|
|
|
|
|
Pension and postretirement plans: |
|
|
|
|
|
|
|
|
|
|
|
|
|
Settlement and curtailment loss |
|
|
|
|
|
|
— |
|
|
|
|
|
|
Net actuarial gain (loss) for the period |
|
|
|
|
|
|
( |
) |
|
|
( |
) |
|
Amortization of prior service cost included in net income |
|
|
|
|
|
|
|
|
|
|
|
|
|
Amortization of actuarial loss included in net income |
|
|
|
|
|
|
|
|
|
|
|
|
|
Pension and postretirement plans, net of tax |
|
|
|
|
|
|
( |
) |
|
|
( |
) |
|
Derivative instruments: |
|
|
|
|
|
|
|
|
|
|
|
|
|
Gain on effective portion of derivatives |
|
|
|
|
|
|
|
|
|
|
|
|
|
(Gain) loss reclassified to net income |
|
|
|
|
|
|
( |
) |
|
|
|
|
|
Derivative instruments, net of tax |
|
|
|
|
|
|
|
|
|
|
|
|
|
Other comprehensive income (loss), net of tax |
|
|
|
|
|
|
|
|
|
|
( |
) |
|
Comprehensive income |
|
$ |
|
|
|
$ |
|
|
|
$ |
|
|
See Accompanying Notes to Consolidated Financial Statements
F-6
FLOWERS FOODS, INC. AND SUBSIDIARIES
CONSOLIDATED STATEMENTS OF CHANGES IN STOCKHOLDERS’ EQUITY
|
|
|
Common Stock |
|
|
Capital |
|
|
|
|
|
|
Accumulated Other |
|
|
Treasury Stock |
|
|
|
|
|
||||||||||||
|
|
|
Number of Shares Issued |
|
|
Par Value |
|
|
in Excess of Par Value |
|
|
Retained Earnings |
|
|
Comprehensive Loss |
|
|
Number of Shares |
|
|
Cost |
|
|
Total |
|
||||||||
|
|
|
(Amounts in thousands, except share data) |
|
|||||||||||||||||||||||||||||
|
Balances at December 30, 2017 |
|
|
|
|
|
$ |
|
|
|
$ |
|
|
|
$ |
|
|
|
$ |
( |
) |
|
|
( |
) |
|
$ |
( |
) |
|
|
|
|
|
Net income |
|
|
|
|
|
|
|
|
|
|
|
|
|
|
|
|
|
|
|
|
|
|
|
|
|
|
|
|
|
|
|
|
|
Derivative instruments, net of tax |
|
|
|
|
|
|
|
|
|
|
|
|
|
|
|
|
|
|
|
|
|
|
|
|
|
|
|
|
|
|
|
|
|
Pension and postretirement plans, net of tax |
|
|
|
|
|
|
|
|
|
|
|
|
|
|
|
|
|
|
( |
) |
|
|
|
|
|
|
|
|
|
|
( |
) |
|
Stock repurchases |
|
|
|
|
|
|
|
|
|
|
|
|
|
|
|
|
|
|
|
|
|
|
( |
) |
|
|
( |
) |
|
|
( |
) |
|
Exercise of stock options |
|
|
|
|
|
|
|
|
|
|
( |
) |
|
|
|
|
|
|
|
|
|
|
|
|
|
|
|
|
|
|
|
|
|
Issuance of deferred stock awards |
|
|
|
|
|
|
|
|
|
|
( |
) |
|
|
|
|
|
|
|
|
|
|
|
|
|
|
|
|
|
|
— |
|
|
Amortization of share-based compensation awards |
|
|
|
|
|
|
|
|
|
|
|
|
|
|
|
|
|
|
|
|
|
|
|
|
|
|
|
|
|
|
|
|
|
Performance-contingent restricted stock awards issued (Note 19) |
|
|
|
|
|
|
|
|
|
|
( |
) |
|
|
|
|
|
|
|
|
|
|
|
|
|
|
|
|
|
|
— |
|
|
Issuance of deferred compensation |
|
|
|
|
|
|
|
|
|
|
( |
) |
|
|
|
|
|
|
|
|
|
|
|
|
|
|
|
|
|
|
— |
|
|
Reclassification of stranded income tax effects to retained earnings (Note 2) |
|
|
|
|
|
|
|
|
|
|
|
|
|
|
|
|
|
|
( |
) |
|
|
|
|
|
|
|
|
|
|
— |
|
|
Dividends paid on vested performance-contingent restricted stock and deferred share awards |
|
|
|
|
|
|
|
|
|
|
|
|
|
|
( |
) |
|
|
|
|
|
|
|
|
|
|
|
|
|
|
( |
) |
|
Dividends paid — $ |
|
|
|
|
|
|
|
|
|
|
|
|
|
|
( |
) |
|
|
|
|
|
|
|
|
|
|
|
|
|
|
( |
) |
|
Balances at December 29, 2018 |
|
|
|
|
|
$ |
|
|
|
$ |
|
|
|
$ |
|
|
|
$ |
( |
) |
|
$ |
( |
) |
|
$ |
( |
) |
|
$ |
|
|
|
Net income |
|
|
|
|
|
|
|
|
|
|
|
|
|
|
|
|
|
|
|
|
|
|
|
|
|
|
|
|
|
|
|
|
|
Derivative instruments, net of tax (Note 11) |
|
|
|
|
|
|
|
|
|
|
|
|
|
|
|
|
|
|
|
|
|
|
|
|
|
|
|
|
|
|
|
|
|
Pension and postretirement plans, net of tax (Note 21) |
|
|
|
|
|
|
|
|
|
|
|
|
|
|
|
|
|
|
( |
) |
|
|
|
|
|
|
|
|
|
|
( |
) |
|
Stock repurchases |
|
|
|
|
|
|
|
|
|
|
|
|
|
|
|
|
|
|
|
|
|
|
( |
) |
|
|
( |
) |
|
|
( |
) |
|
Issuance of deferred stock awards |
|
|
|
|
|
|
|
|
|
|
( |
) |
|
|
|
|
|
|
|
|
|
|
|
|
|
|
|
|
|
|
— |
|
|
Amortization of share-based compensation awards |
|
|
|
|
|
|
|
|
|
|
|
|
|
|
|
|
|
|
|
|
|
|
|
|
|
|
|
|
|
|
|
|
|
Performance-contingent restricted stock awards issued (Note 19) |
|
|
|
|
|
|
|
|
|
|
( |
) |
|
|
|
|
|
|
|
|
|
|
|
|
|
|
|
|
|
|
— |
|
|
Issuance of deferred compensation |
|
|
|
|
|
|
|
|
|
|
( |
) |
|
|
|
|
|
|
|
|
|
|
|
|
|
|
|
|
|
|
— |
|
|
Cumulative effect adjustment for adoption of lease standard, net of tax (Note 3) |
|
|
|
|
|
|
|
|
|
|
|
|
|
|
( |
) |
|
|
|
|
|
|
|
|
|
|
|
|
|
|
( |
) |
|
Dividends paid on vested performance-contingent restricted stock and deferred share awards |
|
|
|
|
|
|
|
|
|
|
|
|
|
|
( |
) |
|
|
|
|
|
|
|
|
|
|
|
|
|
|
( |
) |
|
Dividends paid — $ |
|
|
|
|
|
|
|
|
|
|
|
|
|
|
( |
) |
|
|
|
|
|
|
|
|
|
|
|
|
|
|
( |
) |
|
Balances at December 28, 2019 |
|
|
|
|
|
$ |
|
|
|
$ |
|
|
|
$ |
|
|
|
$ |
( |
) |
|
|
( |
) |
|
$ |
( |
) |
|
$ |
|
|
|
Net income |
|
|
|
|
|
|
|
|
|
|
|
|
|
|
|
|
|
|
|
|
|
|
|
|
|
|
|
|
|
|
|
|
|
Derivative instruments, net of tax (Note 11) |
|
|
|
|
|
|
|
|
|
|
|
|
|
|
|
|
|
|
|
|
|
|
|
|
|
|
|
|
|
|
|
|
|
Pension and postretirement plans, net of tax (Note 21) |
|
|
|
|
|
|
|
|
|
|
|
|
|
|
|
|
|
|
|
|
|
|
|
|
|
|
|
|
|
|
|
|
|
Stock repurchases |
|
|
|
|
|
|
|
|
|
|
|
|
|
|
|
|
|
|
|
|
|
|
( |
) |
|
|
( |
) |
|
|
( |
) |
|
Issuance of deferred stock awards |
|
|
|
|
|
|
|
|
|
|
( |
) |
|
|
|
|
|
|
|
|
|
|
|
|
|
|
|
|
|
|
— |
|
|
Amortization of share-based compensation awards |
|
|
|
|
|
|
|
|
|
|
|
|
|
|
|
|
|
|
|
|
|
|
|
|
|
|
|
|
|
|
|
|
|
Time-based restricted stock awards issued (Note 19) |
|
|
|
|
|
|
|
|
|
|
( |
) |
|
|
|
|
|
|
|
|
|
|
|
|
|
|
|
|
|
|
— |
|
|
Issuance of deferred compensation |
|
|
|
|
|
|
|
|
|
|
( |
) |
|
|
|
|
|
|
|
|
|
|
|
|
|
|
|
|
|
|
— |
|
|
Dividends paid on vested share-based payments awards |
|
|
|
|
|
|
|
|
|
|
|
|
|
|
( |
) |
|
|
|
|
|
|
|
|
|
|
|
|
|
|
( |
) |
|
Dividends paid — $ |
|
|
|
|
|
|
|
|
|
|
|
|
|
|
( |
) |
|
|
|
|
|
|
|
|
|
|
|
|
|
|
( |
) |
|
Balances at January 2, 2021 |
|
|
|
|
|
$ |
|
|
|
$ |
|
|
|
$ |
|
|
|
$ |
|
|
|
|
( |
) |
|
$ |
( |
) |
|
$ |
|
|
See Accompanying Notes to Consolidated Financial Statements
F-7
FLOWERS FOODS, INC. AND SUBSIDIARIES
CONSOLIDATED STATEMENTS OF CASH FLOWS
|
|
|
Fiscal 2020 |
|
|
Fiscal 2019 |
|
|
Fiscal 2018 |
|
|||
|
|
|
53 weeks |
|
|
52 weeks |
|
|
52 weeks |
|
|||
|
|
|
(Amounts in thousands) |
|
|||||||||
|
Cash flows provided by (disbursed for) operating activities: |
|
|
|
|
|
|
|
|
|
|
|
|
|
Net income |
|
$ |
|
|
|
$ |
|
|
|
$ |
|
|
|
Adjustments to reconcile net income to net cash provided by operating activities: |
|
|
|
|
|
|
|
|
|
|
|
|
|
Restructuring and related impairment charges |
|
|
|
|
|
|
|
|
|
|
|
|
|
Depreciation and amortization |
|
|
|
|
|
|
|
|
|
|
|
|
|
Impairment of assets |
|
|
— |
|
|
|
— |
|
|
|
|
|
|
Stock-based compensation |
|
|
|
|
|
|
|
|
|
|
|
|
|
Loss (gain) reclassified from accumulated other comprehensive income to net income |
|
|
|
|
|
|
( |
) |
|
|
|
|
|
Deferred income taxes |
|
|
( |
) |
|
|
|
|
|
|
|
|
|
Provision for inventory obsolescence |
|
|
|
|
|
|
|
|
|
|
|
|
|
Allowances for accounts receivable |
|
|
|
|
|
|
|
|
|
|
|
|
|
Pension and postretirement plans expense |
|
|
|
|
|
|
|
|
|
|
|
|
|
Other |
|
|
( |
) |
|
|
|
|
|
|
( |
) |
|
Qualified pension plan contributions |
|
|
( |
) |
|
|
( |
) |
|
|
( |
) |
|
Changes in operating assets and liabilities, net of acquisitions and disposals: |
|
|
|
|
|
|
|
|
|
|
|
|
|
Accounts receivable, net |
|
|
( |
) |
|
|
( |
) |
|
|
( |
) |
|
Inventories, net |
|
|
( |
) |
|
|
( |
) |
|
|
( |
) |
|
Hedging activities, net |
|
|
|
|
|
|
|
|
|
|
|
|
|
Accounts payable |
|
|
( |
) |
|
|
( |
) |
|
|
|
|
|
Other assets and accrued liabilities |
|
|
|
|
|
|
|
|
|
|
( |
) |
|
Net cash provided by operating activities |
|
|
|
|
|
|
|
|
|
|
|
|
|
Cash flows provided by (disbursed for) investing activities: |
|
|
|
|
|
|
|
|
|
|
|
|
|
Purchases of property, plant and equipment |
|
|
( |
) |
|
|
( |
) |
|
|
( |
) |
|
Repurchase of independent distributor territories |
|
|
( |
) |
|
|
( |
) |
|
|
( |
) |
|
Cash paid at issuance of notes receivable |
|
|
( |
) |
|
|
( |
) |
|
|
( |
) |
|
Principal payments from notes receivable |
|
|
|
|
|
|
|
|
|
|
|
|
|
Acquisition of businesses, net of cash acquired |
|
|
— |
|
|
|
— |
|
|
|
( |
) |
|
Proceeds from sales of property, plant and equipment |
|
|
|
|
|
|
|
|
|
|
|
|
|
Other investing activities |
|
|
|
|
|
|
|
|
|
|
|
|
|
Net cash disbursed for investing activities |
|
|
( |
) |
|
|
( |
) |
|
|
( |
) |
|
Cash flows provided by (disbursed for) financing activities: |
|
|
|
|
|
|
|
|
|
|
|
|
|
Dividends paid, including dividends on share-based payment awards |
|
|
( |
) |
|
|
( |
) |
|
|
( |
) |
|
Exercise of stock options |
|
|
— |
|
|
|
— |
|
|
|
|
|
|
Contingent consideration |
|
|
( |
) |
|
|
— |
|
|
|
— |
|
|
Payments for debt issuance costs |
|
|
( |
) |
|
|
( |
) |
|
|
( |
) |
|
Stock repurchases |
|
|
( |
) |
|
|
( |
) |
|
|
( |
) |
|
Change in bank overdrafts |
|
|
|
|
|
|
|
|
|
|
|
|
|
Proceeds from debt borrowings |
|
|
|
|
|
|
|
|
|
|
|
|
|
Debt obligation payments |
|
|
( |
) |
|
|
( |
) |
|
|
( |
) |
|
Payments on financing leases |
|
|
( |
) |
|
|
( |
) |
|
|
— |
|
|
Net cash (disbursed for) provided by financing activities |
|
|
( |
) |
|
|
( |
) |
|
|
|
|
|
Net increase (decrease) in cash and cash equivalents |
|
|
|
|
|
|
( |
) |
|
|
|
|
|
Cash and cash equivalents at beginning of period |
|
|
|
|
|
|
|
|
|
|
|
|
|
Cash and cash equivalents at end of period |
|
$ |
|
|
|
$ |
|
|
|
$ |
|
|
|
Schedule of non-cash investing and financing activities: |
|
|
|
|
|
|
|
|
|
|
|
|
|
Issuance of executive deferred compensation plan common stock |
|
$ |
|
|
|
$ |
|
|
|
$ |
|
|
|
Capital lease obligations |
|
$ |
— |
|
|
$ |
— |
|
|
$ |
|
|
|
Right-of-use assets obtained in exchange for new financing lease liabilities |
|
$ |
|
|
|
$ |
|
|
|
$ |
— |
|
|
Right-of-use assets obtained in exchange for new operating lease liabilities |
|
$ |
|
|
|
$ |
|
|
|
$ |
— |
|
|
Issuance of notes receivable on new distribution territories, net |
|
$ |
|
|
|
$ |
|
|
|
$ |
|
|
|
Distributor routes sold with deferred gains, net |
|
$ |
|
|
|
$ |
|
|
|
$ |
|
|
|
Purchase of property, plant and equipment included in accounts payable |
|
$ |
|
|
|
$ |
|
|
|
$ |
|
|
|
Supplemental disclosures of cash flow information: |
|
|
|
|
|
|
|
|
|
|
|
|
|
Cash paid during the period for: |
|
|
|
|
|
|
|
|
|
|
|
|
|
Interest |
|
$ |
|
|
|
$ |
|
|
|
$ |
|
|
|
Income taxes paid, net of refunds of $ |
|
$ |
|
|
|
$ |
|
|
|
$ |
|
|
See Accompanying Notes to Consolidated Financial Statements
F-8
FLOWERS FOODS, INC. AND SUBSIDIARIES
NOTES TO CONSOLIDATED FINANCIAL STATEMENTS
|
Note 1. |
Basis of Presentation |
General. The accompanying Consolidated Financial Statements of Flowers Foods, Inc. (the “company”, “Flowers Foods”, “Flowers”, “us”, “we”, or “our”) have been prepared by the company’s management in accordance with generally accepted accounting principles in the United States of America (“GAAP”).
Reporting Segment.
|
Note 2. |
Summary of Significant Accounting Policies |
Basis of Consolidation. The Consolidated Financial Statements include the accounts of the company and its wholly-owned subsidiaries. Intercompany transactions and balances are eliminated in consolidation.
Use of Estimates. The preparation of financial statements in conformity with GAAP requires management to make estimates and assumptions that affect the reported amounts of assets and liabilities and disclosure of contingent assets and liabilities at the date of the financial statements and the reported amounts of revenues and expenses during the reporting period. Actual results could differ from those estimates.
Fiscal Year End. The company operates on a 52-53 week fiscal year ending the Saturday nearest December 31. Fiscal 2020 consisted of 53 weeks. Fiscal 2019 and Fiscal 2018 consisted of 52 weeks. Fiscal 2021 will consist of 52 weeks.
Revenue Recognition. Revenue is recognized when obligations under the terms of a contract with our customers are satisfied. Revenue is measured as the amount of consideration we expect to receive in exchange for transferring goods or providing services. The company records both direct and estimated reductions to gross revenue for customer programs and incentive offerings at the time the incentive is offered or at the time of revenue recognition for the underlying transaction that results in progress by the customer towards earning the incentive. These allowances include price promotion discounts, coupons, customer rebates, cooperative advertising, and product returns. Consideration payable to a customer is recognized at the time control transfers and is a reduction to revenue. The recognition of costs for promotion programs involves the use of judgment related to performance and redemption estimates. Estimates are made based on historical experience and other factors. Price promotion discount expense is recorded as a reduction to gross sales when the discounted product is sold to the customer.
Shipping and handling costs associated with outbound freight after control over a product has transferred to a customer are accounted for as a fulfillment cost and are included in our selling, distribution, and administration expenses line item on the Consolidated Statements of Income.
The company’s production facilities deliver products to independent distributor partners (“IDP” or “IDPs”), who sell and deliver those products to outlets of retail accounts that are within the IDPs’ defined geographic territory. The IDPs sell products using either scan-based trading (“SBT”) technology, authorized charge tickets, or cash sales.
SBT technology allows the retailer to take ownership of our products when the consumer purchases the products rather than at the time they are delivered to the retailer. Control of the inventory does not transfer upon delivery to the retailer because the company controls the risks and rights until the product is scanned at the reseller’s register. Each of the company’s products is considered distinct because the resellers expect each item to be a performance obligation. The company’s performance obligations are satisfied at the point in time when the end consumer purchases the product because each product is considered a separate performance obligation. Consequently, revenue is recognized at a point in time for each scanned item. The company has concluded that we are the principal.
In Fiscal 2020, 2019, and 2018, the company recorded $
SBT is utilized primarily in certain national and regional retail accounts (“SBT Outlet”). Generally, revenue is not recognized by the company upon delivery of our products by the company to the IDP or upon delivery of our products by the IDP to an SBT Outlet, but when our products are purchased by the end consumer. Product inventory in the SBT Outlet is reflected as inventory on the Consolidated Balance Sheets.
F-9
The IDP performs a physical inventory of products at each SBT Outlet weekly and reports the results to the company. The inventory data submitted by the IDP for each SBT Outlet is compared with the product delivery data. Product delivered to a SBT Outlet that is not recorded as inventory in the product delivery data has been purchased by the consumer/customer of the SBT Outlet and is recorded as sales revenue by the company.
Non-SBT sales are classified as either authorized charge sales or cash sales. The company provides marketing support to the IDP for authorized charge sales but does not provide marketing support to the IDP for cash sales. Marketing support includes providing a dedicated account representative, resolving complaints, and accepting responsibility for product quality which collectively define how to manage the relationship. Revenue is recognized at a point in time for non-SBT sales.
The company retains inventory risk, establishes negotiated special pricing, and fulfills the contractual obligations for authorized charge sales. The company is the principal, the IDP is the agent, and the reseller is the customer. Revenue is recognized for authorized charge sales when the product is delivered to the customer because the company has satisfied its performance obligations.
Cash sales occur when the IDP is the end customer. The IDP maintains accounts receivable, inventory and fulfillment risk for cash sales. The IDP also controls pricing for the resale of cash sale products. The company is the principal and the IDP is the customer, and an agent relationship does not exist. The discount paid to the IDP for cash sales is recorded as a reduction to revenue. Revenue is recognized for cash sales when the company’s products are delivered to the IDP because the company has satisfied its performance obligations.
Certain sales are under contracts and include a formal ordering system. Orders are placed primarily using purchase orders (“PO”) or electronic data interchange information. Each PO, together with the applicable master supply agreement, is determined to be a separate contract. Product is delivered via contract carriers engaged by either the company or the customer with shipping terms provided in the PO.
Each unit sold, for all product categories, is a separate performance obligation. Each unit is considered distinct because the customer can benefit from each unit by selling each one separately to the end consumer. Additionally, each unit is separately identifiable in the PO. Products are delivered either freight-on-board (“FOB”) shipping or destination. The company’s right to payment is at the time our products are obtained from our warehouse for FOB shipping deliveries. The right to payment for FOB destination deliveries occurs after the products are delivered to the customer. Revenue is recognized at a point in time when control transfers. The company pays commissions to brokers who obtain contracts with customers. Commissions are paid on the total value of the contract, which is determined at contract inception and is based on expected future activity. Broker commissions will not extend beyond a one-year term because each product is considered a separate order in the PO.
The company recognizes the incremental costs of obtaining contracts as an expense when incurred if the amortization period of the assets that the company otherwise would have recognized is one year or less. These costs are included in our selling, distribution, and administrative expenses line item on the Consolidated Statements of Income.
The company disaggregates revenue by sales channel. Our sales channels are branded retail, store branded retail, and non-retail and other. The non-retail and other channel includes foodservice, restaurants, institutional, vending, thrift stores, and contract manufacturing. The company does not disaggregate revenue by geographic region, customer type, or contract type. All revenues are recognized at a point in time.
|
|
|
Fiscal 2020 |
|
|
Fiscal 2019 |
|
|
Fiscal 2018 |
|
|||
|
Branded retail |
|
$ |
|
|
|
$ |
|
|
|
$ |
|
|
|
Store branded retail |
|
|
|
|
|
|
|
|
|
|
|
|
|
Non-retail and other |
|
|
|
|
|
|
|
|
|
|
|
|
|
Total |
|
$ |
|
|
|
$ |
|
|
|
$ |
|
|
Cash and Cash Equivalents. The company considers deposits in banks, certificates of deposits, and short-term investments with original maturities of three months or less to be cash and cash equivalents.
F-10
Accounts and Notes Receivable. Accounts and notes receivable consist of trade receivables, current portions of distributor notes receivable, and miscellaneous receivables. The company recognizes an allowance for credit losses related to its accounts and notes receivable to present the net amount expected to be collected as of the balance sheet date. The company estimates this allowance based on historical data such as days sales outstanding trends, previous write-offs of balances, and weekly reviews of aged trial balances, among others. Accounts and notes receivable balances are written off when deemed uncollectible and are recognized as a deduction from the allowance for credit losses. Expected recoveries, not to exceed the amount previously written off, are considered in determining the reserve balance at the balance sheet date.
|
|
|
Beginning Balance |
|
|
Charged to Expense |
|
|
Write-Offs and Other |
|
|
Ending Balance |
|
||||
|
Fiscal 2020 |
|
$ |
|
|
|
$ |
|
|
|
$ |
|
|
|
$ |
|
|
|
Fiscal 2019 |
|
$ |
|
|
|
$ |
|
|
|
$ |
|
|
|
$ |
|
|
|
Fiscal 2018 |
|
$ |
|
|
|
$ |
|
|
|
$ |
|
|
|
$ |
|
|
Activity in the allowance for trade accounts receivable credit losses for Fiscal 2020 was as follows (amounts in thousands):
|
Balances at December 28, 2019 |
|
$ |
|
|
|
Amounts charged to expense |
|
|
|
|
|
Write-offs |
|
|
( |
) |
|
Recoveries and other |
|
|
|
|
|
Balances at January 2, 2021 |
|
$ |
|
|
The amounts charged to expense for bad debts in the table above, along with other non-trade accounts receivable amounts, are reported as adjustments to reconcile net income to net cash provided by operating activities in the Consolidated Statements of Cash Flows. The write-offs represent the amounts that are used to reduce the gross accounts and notes receivable at the time the balance due from the customer is written-off. Walmart/Sam’s Club is our only customer with a balance greater than 10% of outstanding trade receivables. Their percentage of trade receivables was
Concentration of Credit Risk. The company performs periodic credit evaluations and grants credit to customers, who are primarily in the grocery and foodservice markets, and generally does not require collateral. Our top 10 customers in Fiscal 2020, 2019, and 2018 accounted for
|
|
|
Percent of Sales |
|
|
|
Fiscal 2020 |
|
|
|
% |
|
Fiscal 2019 |
|
|
|
% |
|
Fiscal 2018 |
|
|
|
% |
Walmart/Sam’s Club is the only customer to account for greater than 10% of the company’s sales.
Inventories. Inventories at January 2, 2021 and December 28, 2019 are valued at net realizable value. Costs for raw materials and packaging are recorded at moving average cost. Finished goods inventories are valued at average costs.
The company will write down inventory to net realizable value for estimated unmarketable inventory equal to the difference between the cost of the inventory and the estimated net realizable value for situations when the inventory is impaired by damage, deterioration, or obsolescence.
Activity in the inventory reserve allowance is as follows (amounts in thousands):
|
|
|
Beginning Balance |
|
|
Charged to Expense |
|
|
Write-Offs and Other |
|
|
Ending Balance |
|
||||
|
Fiscal 2020 |
|
$ |
|
|
|
$ |
|
|
|
$ |
|
|
|
$ |
|
|
|
Fiscal 2019 |
|
$ |
|
|
|
$ |
|
|
|
$ |
|
|
|
$ |
|
|
|
Fiscal 2018 |
|
$ |
|
|
|
$ |
|
|
|
$ |
|
|
|
$ |
|
|
F-11
The amounts charged to expense for inventory loss in the table above are reported as adjustments to reconcile net income to net cash provided by operating activities in the Consolidated Statements of Cash Flows. The write-offs and other column represents the amounts that are used to reduce gross inventories.
Spare Parts and Supplies. The company maintains inventories of spare parts and supplies, which are used for repairs and maintenance of its machinery and equipment. These spare parts and supplies allow the company to react quickly in the event of a mechanical breakdown. These parts are valued using the moving average method and are expensed as the part is used. Periodic physical inventories of the parts are performed, and the value of the parts is adjusted for any obsolescence or difference from the physical inventory count.
Assets Held for Sale. Assets to be sold are classified as held for sale in the period all the required criteria are met. The company generally has three types of assets classified as held for sale. These include distribution rights, plants and depots/warehouses, and other equipment. See Note 8, Assets Held for Sale, for these amounts by classification.
Though under no obligation to do so, the company repurchases distribution rights from and sells distribution rights to IDPs from time to time. At the time the company purchases distribution rights from an IDP, the fair value purchase price of the distribution right is recorded as “Assets Held for Sale”. Upon the sale of the distribution rights to a new IDP, the new distributor franchisee/owner may choose how he/she desires to finance the purchase of the business. If the new distributor chooses to use optional financing via a company-related entity, a note receivable of up to
Property, Plant and Equipment and Depreciation. Property, plant and equipment is stated at cost. Depreciation expense is computed using the straight-line method over the estimated useful lives of the depreciable assets. Prior to the adoption of the ASU No. 2016-02 Leases (ASC Topic 842, the “new standard”), certain equipment held under capital leases of $
The table below presents the range of estimated useful lives by property, plant and equipment class.
|
|
|
Useful life term (years) |
||
|
Asset Class |
|
Low |
|
High |
|
Buildings |
|
|
|
|
|
Machinery and equipment |
|
|
|
|
|
Furniture, fixtures and transportation equipment |
|
|
|
|
Property recorded as leasehold improvements is amortized over the shorter of the lease term or the estimated useful life of the leased property.
Depreciation expense, excluding amortization of right-of-use financing leases, for Fiscal 2020, 2019, and 2018 was as follows (amounts in thousands):
|
|
|
Depreciation expense |
|
|
|
Fiscal 2020 |
|
$ |
|
|
|
Fiscal 2019 |
|
$ |
|
|
|
Fiscal 2018 |
|
$ |
|
|
F-12
The company had
Leases. At the beginning of our Fiscal 2019, the company adopted the new standard using the modified retrospective transition method, which required companies to recognize lease liabilities and a right-of-use asset for virtually all leases on the balance sheet. The impact at adoption was an increase to assets of $
The company’s leases consist of the following types of assets: bakeries, corporate office space, warehouses, bakery equipment, transportation equipment, and IT equipment (debt is discussed separately in Note 15, Debt and Other Commitments).
Real estate and equipment contracts occasionally contain multiple lease and non-lease components. Generally, non-lease components represent maintenance and utility related charges, and are primarily minor to the overall value of applicable contracts. These contracts also contain fixed payments with stated rent escalation clauses or fixed payments based on an index such as CPI. Additionally, some contracts contain tenant improvement allowances, rent holidays, lease premiums, and contingent rent provisions (which are treated as variable lease payments). Building and/or office space leases generally require the company to pay for common area maintenance (CAM), insurance, and taxes that are not included in the base rental payments, with the majority of these leases treated as net leases, and the remainder treated as gross or modified gross leases.
The lease term for real estate leases primarily ranges from
These contracts may contain renewal options for periods of
These contracts may also contain right of first offer purchase options, along with expansion options that are not reasonably certain of exercise.
For these real estate contracts, the company’s exclusive use of specified real estate for a specific term and for consideration resulted in the company treating these contracts as leases under the new standard.
For those contracts that contain leases of buildings and land, the company has elected to not separate land components from leases of specified property, plant, and equipment, as it was determined to have no effect on lease classification for any lease component, and the amounts recognized for the land lease components would have been immaterial.
These contracts may also contain end-term purchase options, whereby, the company may purchase the assets for stated pricing at the lesser of fair market value or a percentage of original asset cost. Yet, these purchase options were determined to not be reasonably certain of exercise or occurrence as of January 2, 2021.
The company’s ability to make those decisions that most effect the economic benefits derived from the use of the equipment, accompanied by receiving substantially all outputs and utility from the use of the equipment resulted in the company accounting for these contracts as leases.
These leases are classified as operating leases under the new standard because real estate leases do not transfer ownership at the end of the lease term, assets are not of such a specialized nature that real estate would not have alternative uses to lessors at the end of the lease term, lease terms do not represent a major part of the total useful life of real estate, and the present value of lease payments do not represent substantially all the fair value of leased assets at commencement.
F-13
Short-term leases
The company has also entered into short-term leases of certain real estate assets, along with IT equipment, and various equipment used for short-term bakery needs through equipment placement or service contracts that require purchase of consumables. These leases extend for periods of one to
Therefore, the company recognizes lease payments from these short-term leases and variable payments on the Consolidated Statements of Income in the period in which obligation for those payments have been incurred.
Modifications and reassessments
During Fiscal 2020 and Fiscal 2019, the company elected certain renewal options that were not previously certain of exercise. Election of these renewal options resulted in reassessment of lease terms for the applicable leases.
The company included the renewal periods in measurement of lease terms for the applicable leases. Given that rental payments in the renewal periods were fixed, the company also remeasured the lease payments, and reallocated remaining contract consideration to the lease components within the applicable real estate leases. Although the triggering events did not result in changes to lease classification (i.e., all remained operating leases), they did affect the measurement of lease liabilities, right-of-use assets (“ROU assets”), and amounts recognized as lease expense for the applicable real estate leases.
Other significant judgments and assumptions
For all classes of assets, the company primarily used our incremental borrowing rates (“IBR”) to perform lease classification tests and measure lease liabilities because discount rates implicit in the company’s leases were not readily determinable.
Embedded leases
The company maintains a transportation agreement with an entity that transports a portion of the company’s fresh bakery products from the company’s production facilities to outlying distribution centers. The company concluded that this agreement contained embedded leases for the trucks and trailers used to satisfy the service provider’s obligations to the company through December 31, 2020. On December 31, 2020, a re-measurement event occurred, and a conclusion was reached that these no longer met the requirements of an embedded lease due to a change in the contractual terms to allow for the substitution of assets, among other changes to the terms. As a result, on January 2, 2021, there were
During Fiscal 2020 and Fiscal 2019, the company entered into embedded leases for IT equipment that, as of January 2, 2021, were $
See Note 14, Leases, for our lease quantitative disclosures.
Segment. The company has
Impairment of Long-Lived Held and Used Assets. The company determines whether there has been an impairment of long-lived held and used assets when indicators of potential impairment are present. We consider historical performance and future estimated results in our evaluation of impairment. If facts and circumstances indicate that the cost of any long-lived held and used assets may be impaired, an evaluation of recoverability would be performed. If an evaluation is required, the estimated future gross, undiscounted cash flows associated with the asset would be compared to the asset’s carrying amount to determine if a write-down to market value is required.
F-14
Total impairments (inclusive of property, plant and equipment, notes receivable, spare parts, and ROU assets), and the line item to which each item is recorded in our Consolidated Statements of Income, are presented below (amounts in thousands):
|
Impairment of assets line item |
|
Fiscal 2020 |
|
|
Fiscal 2019 |
|
|
Fiscal 2018 |
|
|||
|
Property, plant and equipment |
|
$ |
— |
|
|
$ |
— |
|
|
$ |
|
|
|
Notes receivable |
|
|
— |
|
|
|
— |
|
|
|
|
|
|
Impairment of assets |
|
$ |
— |
|
|
$ |
— |
|
|
$ |
|
|
|
|
|
|
|
|
|
|
|
|
|
|
|
|
|
Restructuring and related impairment charges line item |
|
Fiscal 2020 |
|
|
Fiscal 2019 |
|
|
Fiscal 2018 |
|
|||
|
Plant closings |
|
$ |
|
|
|
$ |
|
|
|
$ |
|
|
|
Line and distribution depot closings |
|
|
|
|
|
|
|
|
|
|
|
|
|
Spare parts |
|
|
|
|
|
|
|
|
|
|
|
|
|
Lease impairment charges |
|
|
|
|
|
|
— |
|
|
|
— |
|
|
Impairment of assets |
|
$ |
|
|
|
$ |
|
|
|
$ |
|
|
Fiscal 2020
During Fiscal 2020, the company sold
Additionally, in order to optimize our distribution network, we vacated certain distribution depots during Fiscal 2020, some of which are owned and others that were leased.
Fiscal 2019
The company recognized impairment charges during the first quarter of Fiscal 2019 related to manufacturing line closures of $
The company sold the closed plant in Winston-Salem, North Carolina during the third quarter of fiscal 2019, at which time an additional $
Fiscal 2018
A property, plant and equipment impairment was recognized in the impairment of assets line item on the Consolidated Statements of Income in the fourth quarter of Fiscal 2018 when a construction in progress asset was not ultimately placed into service.
On November 6, 2018, the company announced the closure of a bakery in Brattleboro, Vermont. The bakery was closed during the fourth quarter of Fiscal 2018 and consisted of a $
See Note 5, Restructuring Activities, for details.
Impairment of Other Intangible Assets. The company accounts for other intangible assets recognized in a purchase business combination at fair value. These intangible assets can be either finite or indefinite-lived depending on the facts and circumstances at acquisition.
Finite-lived intangible assets are reviewed for impairment when facts and circumstances indicate that the cost of any finite-lived intangible asset may be impaired. This recoverability test is based on an undiscounted cash flows expected to result from the
F-15
company’s use and eventual disposition of the asset. If these cash flows are sufficient to recover the carrying value over the useful life there is no impairment. Amortization of finite-lived intangible assets occurs over their estimated useful lives. The amortization periods, at origination, range from
Identifiable intangible assets that are determined to have an indefinite useful economic life are not amortized. Indefinite-lived intangible assets are tested for impairment, at least annually, using a one-step fair value-based approach or when certain indicators of potential impairment are present. We have elected not to perform the qualitative approach. We also reassess the indefinite-lived classification to determine if it is appropriate to reclassify these assets as finite-lived assets that will require amortization. We consider historical performance and future estimated results in our evaluation of impairment. If facts and circumstances indicate that the cost of any indefinite-lived intangible assets may be impaired, an evaluation of the fair value of the asset is compared to its carrying amount. If the carrying amount exceeds the fair value, an impairment charge is recorded for the difference.
We use the multi-period excess earnings and relief from royalty methods to value these indefinite-lived intangible assets. Fair value is estimated using the future gross, discounted cash flows associated with the asset using the following five material assumptions: (a) discount rate; (b) long-term sales growth rates; (c) forecasted operating margins (not applicable to the relief from royalty method), (d) assumed royalty rate; and (e) market multiples. The method used for impairment testing purposes is consistent with the valuation method employed at acquisition of the intangible asset. These indefinite-lived intangible assets are trademarks acquired in a purchase business combination.
In order to optimize sales and production of our organic products, the company decided to cease using the Alpine Valley finite-lived trademark, resulting in a $
During Fiscal 2019, the company recorded impairment charges of $
The company evaluates useful lives for finite-lived intangible assets to determine if facts or circumstances arise that may impact the estimates of useful lives assigned and the remaining amortization duration. Indefinite-lived intangible assets that are determined to have a finite useful life are tested for impairment as an indefinite-lived intangible asset prior to commencing amortization. We determined that an indefinite-lived asset should be reclassified to finite-lived with an attribution period covering our estimate of the assets’ useful life. These intangible assets were assigned a useful life ranging from
Future adverse changes in market conditions or poor operating results of underlying intangible assets could result in losses or an inability to recover the carrying value of the intangible assets that may not be reflected in the assets’ current carrying values, thereby possibly requiring an impairment charge in the future. See Note 9, Goodwill and Other Intangible Assets, for additional disclosure.
Goodwill. The company accounts for goodwill in a purchase business combination as the excess of the cost over the fair value of net assets acquired. The company tests goodwill for impairment on an annual basis (or an interim basis if a triggering event occurs that indicates the fair value of our single reporting unit may be below its carrying value) using a one-step method. We have elected not to perform the qualitative approach. The company conducts this review during the fourth quarter of each Fiscal year absent any triggering events. We use the following four material assumptions in our fair value analysis: (a) weighted average cost of capital; (b) long-term sales growth rates; (c) forecasted operating margins; and (d) market multiples.
Derivative Financial Instruments. The disclosure requirements for derivatives and hedging provide investors with an enhanced understanding of: (a) how and why an entity uses derivative instruments and related hedged items, (b) how the entity accounts for derivative instruments and related hedged items, and (c) how derivative instruments and related hedged items affect an entity’s financial position, financial performance, and cash flows. Further, qualitative disclosures are required that explain the company’s objectives and strategies for using derivative instruments and related hedged items, as well as quantitative disclosures about the fair value of and gains and losses on derivative instruments and related hedged items, and disclosures about credit-risk-related contingent features in derivative instruments and related hedged items.
F-16
The company’s objectives in using commodity derivatives are to add stability to materials, supplies, labor, and other production costs and to manage its exposure to certain commodity price movements. To accomplish this objective, the company uses commodity futures as part of its commodity risk management strategy. The company’s commodity risk management programs include hedging price risk for wheat, soybean oil, corn, and natural gas primarily using futures contracts. Commodity futures designated as cash flow hedges involve fixing the price on a fixed volume of a commodity on a specified date. The commodity futures are given up to third parties near maturity to price the physical goods (e.g. flour, sweetener, corn, etc.) required as part of the company’s production.
As required, the company records all derivatives on the Consolidated Balance Sheets at fair value. The accounting for changes in the fair value of derivatives depends on the intended use of the derivative, whether the company has elected to designate a derivative in a hedging relationship and apply hedge accounting and whether the hedging relationship has satisfied the criteria necessary to apply hedge accounting. Derivatives designated and qualifying as a hedge of the exposure to variability in expected future cash flows, or other types of forecasted transactions, are considered cash flow hedges. Hedge accounting generally provides for the matching of the timing of gain or loss recognition on the hedged item with the earnings effect of the hedged forecasted transactions in a cash flow hedge. The company may enter into derivative contracts that are intended to economically hedge certain of its risks, even though hedge accounting does not apply, or the company elects not to apply hedge accounting.
For derivatives designated and that qualify as cash flow hedges of commodity price risk, the gain or loss on the derivative is recorded in accumulated other comprehensive income (loss) (“AOCI”) and subsequently reclassified in the period during which the hedged transaction affects earnings within the same income statement line item as the earnings effect of the hedged transaction. All our commodity derivatives at January 2, 2021 qualified for hedge accounting. See Note 11, Derivative Financial Instruments, for additional disclosure.
The company routinely transfers amounts from AOCI to earnings as transactions for which cash flow hedges were held occur and impact earnings. Significant situations which do not routinely occur that could cause transfers from AOCI to earnings are the cancellation of a forecasted transaction for which a derivative was held as a hedge or a significant and material reduction in volume used of a hedged ingredient such that the company is over hedged and must discontinue hedge accounting. During Fiscal 2020, 2019, and 2018 there were no discontinued hedge positions.
The impact to earnings is included in our materials, supplies, labor and other production costs (exclusive of depreciation and amortization shown separately) line item. Changes in the fair value of the asset or liability are recorded as either a current or long-term asset or liability depending on the underlying fair value. Amounts reclassified to earnings for the commodity cash flow hedges are presented as an adjustment to reconcile net income to net cash provided by operating activities on the Consolidated Statements of Cash Flows. See Note 11, Derivative Financial Instruments, for additional disclosure.
Treasury Stock. The company records acquisitions of its common stock for treasury at cost. Differences between the proceeds for reissuances of treasury stock and average cost are credited or charged to capital in excess of par value to the extent of prior credits and thereafter to retained earnings. See Note 18, Stockholders’ Equity, for additional disclosure.
Stock-Based Compensation. Stock-based compensation expense for all share-based payment awards granted is determined based on the grant date fair value. The company recognizes compensation costs only for those shares expected to vest on a straight-line basis over the requisite service period of the award, which is generally the vesting term of the share-based payment award. The shares issued for exercises and at vesting of the awards are issued from treasury stock. Forfeitures are recognized as they occur. Shares issued at vesting are recorded as reissuances of treasury stock. See Note 19, Stock-Based Compensation, for additional disclosure. Stock-based compensation expense is primarily included in selling, distribution and administrative expense in the Consolidated Statements of Income.
Cloud computing arrangements (“CCA”). If a CCA includes a software license, the arrangement is within the scope of the internal-use software guidance. If the CCA does not include a software license (i.e. is hosted), the arrangement is a service contract and the fees for the CCA are recorded as an operating expense. Capitalized implementation costs are amortized over the term of the associated hosted CCA service on a straight-line basis. Amortization begins at the time any component of the hosted CCA service is ready for use. Capitalized implementation costs are presented on the Consolidated Balance Sheets as an other asset. Amortization charges are presented in the selling, distribution, and administrative expenses line on the Consolidated Statements of Income.
Software Development Costs. The company expenses internal and external software development costs incurred in the preliminary project stage, and, thereafter, capitalizes costs incurred in developing or obtaining internally used software. Certain costs, such as maintenance and training, are expensed as incurred. Capitalized costs are amortized over a period of
F-17
are subject to impairment evaluation. An impairment could be triggered if the company determines that the underlying software under review will no longer be used. The net balance of capitalized software development costs included in plant, property and equipment was $
Income Taxes. The company accounts for income taxes using the asset and liability method and recognizes deferred tax assets and liabilities for the expected future tax consequences of events that have been included in the financial statements. Under this method, deferred tax assets and liabilities are determined based on the temporary differences between the financial statement and tax basis of assets and liabilities using enacted tax rates in effect for the year in which the differences are expected to reverse. The effect of a change in tax rates on deferred tax assets and liabilities is recognized in income as a discrete item in the period that includes the enactment date.
On December 22, 2017, the former President of the United States signed into law the Tax Cuts and Jobs Act (the “Act”). The legislation significantly changed the U.S. tax law including a reduction to the corporate income tax rate from a maximum of
The company records a valuation allowance to reduce its deferred tax assets to the amount that is more likely than not to be realized. The company has considered carryback, future taxable income, and prudent and feasible tax planning strategies in assessing the need for the valuation allowance. In the event the company was to determine that it would be more likely than not able to realize its deferred tax assets in the future in excess of its net recorded amount, an adjustment to the valuation allowance would increase income in the period such a determination was made. Likewise, should the company determine that it would not more likely than not be able to realize all or part of its net deferred tax assets in the future, an adjustment to the valuation allowance would decrease income in the period such determination was made.
The company releases the income tax effect from AOCI in the period that the underlying transaction impacts earnings. We adopted new accounting requirements that provide the option to reclassify stranded income tax effects resulting from the Act from AOCI to retained earnings. We elected to reclassify the stranded income tax effects resulting from the Act of $
The company recognizes a tax benefit from an uncertain tax position when it is more likely than not that the position will be sustained upon examination, including resolution of any related appeals or litigation process. Interest related to unrecognized tax benefits is recorded within the interest expense line in the accompanying Consolidated Statements of Income. See Note 22, Income Taxes, for additional disclosure.
The deductions column in the table below presents the amounts reduced in the deferred tax asset valuation allowance that were recorded to, and included as part of, deferred tax expense. The additions column represents amounts that increased the allowance.
Activity in the deferred tax asset valuation allowance is as follows (amounts in thousands):
|
|
|
Beginning Balance |
|
|
Deductions |
|
|
Additions |
|
|
Ending Balance |
|
||||
|
Fiscal 2020 |
|
$ |
|
|
|
$ |
|
|
|
$ |
|
|
|
$ |
|
|
|
Fiscal 2019 |
|
$ |
|
|
|
$ |
|
|
|
$ |
|
|
|
$ |
|
|
|
Fiscal 2018 |
|
$ |
|
|
|
$ |
|
|
|
$ |
|
|
|
$ |
|
|
F-18
Self-Insurance Reserves. The company is self-insured for various levels of general liability, auto liability, workers’ compensation, and employee medical and dental coverage. Insurance reserves are calculated based on a combination of an undiscounted basis based on actual claim data and estimates of incurred but not reported claims developed utilizing historical claim trends. Projected settlements of incurred but not reported claims are estimated based on pending claims, historical trends and industry trends related to expected losses and actual reported losses, and key assumptions, including loss development factors and expected loss rates.
Net Income Per Common Share. Basic net income per share is computed by dividing net income by the weighted average common shares outstanding for the period. Diluted net income per share is computed by dividing net income by the weighted average common and common equivalent shares outstanding for the period. Common stock equivalents consist of the incremental shares associated with the company’s stock compensation plans, as determined under the treasury stock method. The performance contingent restricted stock awards do not contain a non-forfeitable right to dividend equivalents and are included in the computation for diluted net income per share. Fully vested shares which have a deferral period extending beyond the vesting date are included in the computation for basic net income per share. See Note 20, Earnings Per Share, for additional disclosure.
Variable Interest Entities. The incorporated IDPs are not voting interest entities since the company has no direct interest in each entity; however, they qualify as variable interest entities (“VIEs”). The IDPs who are formed as sole proprietorships are excluded from the VIE accounting analysis because sole proprietorships are not within scope for determination of VIE status. The company typically finances the incorporated IDP and enters into a contract with the incorporated IDP to supply product at a discount for distribution in the IDPs’ territory. The combination of the company’s loans to the incorporated IDP and the ongoing supply arrangements with the incorporated IDP provides a level of protection to the equity owners of the various distributorships that would not otherwise be available. However, the company is not considered to be the primary beneficiary of the VIEs. See Note 16, Variable Interest Entities, for additional disclosure of these VIEs.
The company also maintains a transportation agreement with an entity that transports a significant portion of the company’s fresh bakery products from the company’s production facilities to outlying distribution centers. The company represents a significant portion of the entity’s revenue. The company reconsidered its relationship with the entity because the entity was sold, and the company has concluded the entity no longer qualifies as a VIE beginning in the second quarter of Fiscal 2019. Previously, this entity qualified as a VIE, but the company determined it was not the primary beneficiary of the VIE. See Note 16, Variable Interest Entities, for additional disclosure of these VIEs.
Postretirement Plans. The company records pension costs and benefit obligations related to its defined benefit plans based on actuarial valuations. These valuations reflect key assumptions determined by management, including the discount rate, expected long-term rate of return on plan assets and mortality. Material changes in pension costs and in benefit obligations may occur in the future due to experience that is different than assumed and changes in these assumptions. See Note 21, Postretirement Plans, for additional disclosure.
Pension Plan Assets. The finance committee of the Board of Directors delegated its fiduciary and other responsibilities with respect to the Company’s retirement plans’ investment strategies to the investment committee. The investment committee, which consists of certain members of management, establishes investment guidelines and strategies and regularly monitors the performance of the plans’ assets. The investment committee is responsible for executing these strategies and investing the pension assets in accordance with ERISA and fiduciary standards. The investment objective of the pension plans is to preserve the plans’ capital and maximize investment earnings within acceptable levels of risk and volatility. The investment committee meets on a regular basis with its investment advisors to review the performance of the plans’ assets. Based upon performance and other measures and recommendations from its investment advisors, the investment committee rebalances the plans’ assets to the targeted allocation when considered appropriate.
Fair Value of Financial Instruments. On September 28, 2016, the company issued $
F-19
Research and Development Costs. The company recorded research and development costs of $
Other Comprehensive Income (Loss)(“OCI”). The company reports comprehensive income in two separate but consecutive financial statements. See Note 6, Accumulated Other Comprehensive Income (Loss), for additional required disclosures.
|
Note 3. |
Recent Accounting Pronouncements |
Pronouncements adopted during Fiscal 2020
In June 2016, the Financial Accounting Standards Board (“FASB”) issued guidance that effects loans, debt securities, trade receivables, net investments in leases, off-balance sheet credit exposures, reinsurance receivables, and any other financial assets not excluded from the scope that have the contractual right to receive cash. Additional guidance for this topic was issued in April 2019. The new standard requires earlier recognition of credit losses. The company adopted the new standard as of
In January 2017, the FASB issued guidance to simplify the accounting for goodwill impairment. The guidance removed Step 2 of the goodwill impairment test, which requires a hypothetical purchase price allocation. A goodwill impairment is now the amount by which a reporting unit’s carrying value exceeds its fair value, not to exceed the carrying amount of goodwill. Companies still have the option to perform a qualitative assessment to determine if a quantitative impairment test is necessary. The company adopted the new standard as of
In August 2018, the FASB issued guidance to modify the disclosure requirements for employers that sponsor defined benefit pension or other postretirement plans. Disclosures were removed for the amounts in accumulated other comprehensive income (“AOCI”) expected to be recognized as components of net periodic benefit cost over the next fiscal year, the amount and timing of assets expected to be returned to the employer, certain related party disclosures, and the effects of a one-percentage-point change in the assumed health care cost trend rates. Additional disclosures include the weighted average interest crediting rate for plans with promised crediting interest rates and an explanation of the reasons for significant gains and losses related to the benefit obligation for the period. The company adopted the new standard as of
Accounting pronouncements not yet adopted
In December 2019, the FASB issued guidance which removes certain exceptions for investments, intraperiod allocations and interim calculations, and adds guidance to reduce complexity in accounting for income taxes. This guidance will be effective for us in our Fiscal 2021, with the option to early adopt at any time prior to the effective date. Accounting for franchise taxes will require adoption on a retrospective or modified retrospective basis through a cumulative-effect adjustment to retained earnings as of the beginning of the fiscal year of adoption. All other applicable provisions will require adoption on a retrospective, modified retrospective, or prospective basis, as required by this guidance. We do not anticipate that the adoption of this guidance will have a material impact on our financial statements and disclosures.
In March 2020, the FASB issued new accounting rules that provide optional expedients and exceptions for applying generally accepted accounting principles to contracts, hedging relationships, and other transactions affected by reference rate reform. The amendments in this standard can be applied anytime between the first quarter of 2020 and the fourth quarter of 2022. The company is currently in the process of evaluating the impact of adoption of the new rules on the company’s financial condition, results of operations, cash flows and disclosures.
We have reviewed other recently issued accounting pronouncements and concluded that either they are not applicable to our business or no material effect is expected upon future adoption.
F-20
|
Note 4. |
Product Recall and Loss (Recovery) on Inferior Ingredients |
Product Recalls
Fiscal 2019
On July 9, 2019, the company issued a voluntary product recall for certain hamburger and hot dog buns and other bakery products due to the potential presence of small pieces of hard plastic that may have been introduced during production. The products recalled were distributed to retail customers under a variety of brand names in
Loss (Recovery) on inferior ingredients
During Fiscal 2020, the company received ingredient shipments containing gluten which were used to produce our gluten-free products. The company issued a voluntary product recall due to the potential presence of gluten in certain products. The products recalled were distributed to retail customers in
In June 2018, the company received from a supplier several shipments of inferior yeast, which reduced product quality and disrupted production and distribution of foodservice and retail bread and buns at several of the company’s bakeries during the second quarter. While the supplier confirmed that the inferior yeast used in the baking process was safe for consumption, customers and consumers reported instances of unsatisfactory product attributes, primarily involving smell and taste. Costs associated with inferior yeast were reclassified from material, supplies, labor and other production costs and selling, distribution and administrative expenses to the ‘Loss (recovery) on inferior ingredients’ line item in our Consolidated Statements of Income.
In addition, the company incurred costs associated with inferior whey during the third quarter of Fiscal 2018. A voluntary recall was issued on July 18, 2018 due to the potential of tainted whey. Costs associated with inferior whey were reclassified from material, supplies, labor and other production costs to the ‘Loss (recovery) on inferior ingredients’ line item in our Consolidated Statements of Income.
During the fourth quarter of Fiscal 2020, the company received a $
|
|
|
Fiscal 2020 |
|
|
Fiscal 2019 |
|
|
Fiscal 2018 |
|
|||
|
Expense recognized |
|
$ |
|
|
|
$ |
|
|
|
$ |
|
|
|
Recoveries recognized |
|
|
( |
) |
|
|
( |
) |
|
|
( |
) |
|
Total (recovery) loss on inferior ingredients |
|
$ |
|
|
|
$ |
( |
) |
|
$ |
|
|
|
Note 5. |
Restructuring Activities |
In Fiscal 2016, we announced the launch of Project Centennial, a comprehensive business and operational review. We identified opportunities to enhance revenue growth, streamline operations, improve efficiencies, and make investments that strengthen our competitive position and improve margins over the long term. We began Project Centennial with an evaluation of our brands, product mix, and organizational structure. Most importantly, Project Centennial marked a significant shift in mindset from a sales and operations focused enterprise to a brand focused, consumer focused packaged foods company. Strategic priorities developed as part of Project Centennial were designed to improve margins and profitably grow revenue over time. These priorities included: reducing costs to fuel growth, developing leading capabilities, reinvigorating core business, and capitalizing on product adjacencies.
The company operated under an organizational structure established with
F-21
Today, we have an organization dedicated to the consumer and we have refined our strategic priorities as further described below. We are hyper-focused on growing our brands and committed to real innovation to drive growth, with a renewed sense of passion about cost management. We have updated the strategic priorities to include the following:
Develop team: Capabilities to build brands and create value.
Focus on brands: Enhance relevancy and expand presence. This objective is to invest in our brands to align brands to consumers to maximize our return on investment. We expect to incur significant incremental marketing costs annually for brand development. These costs will not be restructuring and will be recognized as incurred.
Prioritize margins: Optimize the portfolio and supply chain.
Smart M&A: Disciplined approach to acquisitions in baked foods that enhance our branded portfolio and margin profile.
Unless otherwise noted, restructuring related costs are recorded in the restructuring and related impairments line item on our Consolidated Statements of Income.
The table below presents the components of costs associated with Project Centennial (amounts in thousands):
|
|
|
Fiscal 2020 |
|
|
Fiscal 2019 |
|
|
Fiscal 2018 |
|
|||
|
Restructuring and related impairment charges: |
|
|
|
|
|
|
|
|
|
|
|
|
|
Reorganization costs |
|
$ |
— |
|
|
$ |
|
|
|
$ |
|
|
|
Lease termination charges |
|
|
|
|
|
|
— |
|
|
|
— |
|
|
Impairment charges, net of gain on sale |
|
|
|
|
|
|
|
|
|
|
|
|
|
Employee termination benefits (credits) |
|
|
|
|
|
|
|
|
|
|
( |
) |
|
Restructuring and related impairment charges (1) |
|
|
|
|
|
|
|
|
|
|
|
|
|
Project Centennial implementation costs (2) |
|
|
|
|
|
|
|
|
|
|
|
|
|
Total Project Centennial restructuring and implementation costs |
|
$ |
|
|
|
$ |
|
|
|
$ |
|
|
|
(1) |
Presented on our Consolidated Statements of Income. |
|
(2) |
|
The table below details the restructuring impairments (inclusive of property, plant and equipment, ingredient and packaging, and spare parts and intangible assets) that were recognized during Fiscal 2020, 2019, and 2018 (amounts in thousands):
|
|
|
Fiscal 2020 |
|
|
Fiscal 2019 |
|
|
Fiscal 2018 |
|
|||
|
Plant closure costs |
|
$ |
|
|
|
$ |
|
|
|
$ |
|
|
|
Line and distribution depot closure costs |
|
|
|
|
|
|
|
|
|
|
|
|
|
Spare parts |
|
|
|
|
|
|
|
|
|
|
|
|
|
Brand rationalization study impairments |
|
|
|
|
|
|
|
|
|
|
|
|
|
Lease impairment charges |
|
|
|
|
|
|
— |
|
|
|
— |
|
|
Gain on sale |
|
|
— |
|
|
|
( |
) |
|
|
— |
|
|
Total restructuring impairment of assets |
|
$ |
|
|
|
$ |
|
|
|
$ |
|
|
Fiscal 2020
In order to optimize sales and production of our organic products, the company decided to cease using the Alpine Valley finite-lived trademark, resulting in a $
During Fiscal 2020, the company sold
F-22
charges. Additionally, the company recognized property, plant, and equipment impairment charges of $
In order to optimize our distribution network, we vacated certain distribution depots during Fiscal 2020, some of which are owned and others that were leased. This resulted in the recognition of lease impairment charges totaling $
During Fiscal 2020, the company incurred $
Fiscal 2019
We began relocating certain employees during the third quarter of Fiscal 2017 as we transition to the enhanced organizational structure. Reorganization costs of $
The company recognized an impairment charge of $
Fiscal 2018
On November 6, 2018, the company announced the closure of a bakery in Brattleboro, Vermont. The bakery was closed during the fourth quarter of Fiscal 2018 and consisted of a $
Employee termination benefits in Fiscal 2018 were primarily for severance related to the bakery closure discussed above, net of an adjustment to the VSIP charge recognized in Fiscal 2017.
The table below presents the components of, and changes in, our restructuring accruals (amounts in thousands):
|
|
|
VSIP |
|
|
RIF |
|
|
Employee termination benefits(1) |
|
|
Reorganization costs(2) |
|
|
Distribution Network Optimization |
|
|
Total |
|
||||||
|
Liability balance at December 30, 2017 |
|
$ |
|
|
|
$ |
— |
|
|
$ |
|
|
|
$ |
— |
|
|
$ |
— |
|
|
$ |
|
|
|
Charges |
|
|
( |
) |
|
|
— |
|
|
|
|
|
|
|
|
|
|
|
— |
|
|
|
|
|
|
Cash payments |
|
|
( |
) |
|
|
— |
|
|
|
( |
) |
|
|
( |
) |
|
|
— |
|
|
|
( |
) |
|
Liability balance (3) at December 29, 2018 |
|
$ |
|
|
|
$ |
— |
|
|
$ |
|
|
|
$ |
— |
|
|
$ |
— |
|
|
$ |
|
|
|
Charges |
|
|
— |
|
|
|
— |
|
|
|
|
|
|
|
|
|
|
|
— |
|
|
|
|
|
|
Cash payments |
|
|
— |
|
|
|
— |
|
|
|
( |
) |
|
|
( |
) |
|
|
— |
|
|
|
( |
) |
|
Liability balance (3) at December 28, 2019 |
|
$ |
|
|
|
$ |
— |
|
|
$ |
|
|
|
$ |
— |
|
|
$ |
— |
|
|
$ |
|
|
|
Charges |
|
|
|
|
|
|
|
|
|
|
( |
) |
|
|
— |
|
|
|
|
|
|
|
|
|
|
Cash payments |
|
|
( |
) |
|
|
( |
) |
|
|
( |
) |
|
|
— |
|
|
|
( |
) |
|
|
( |
) |
|
Liability balance (3) at January 2, 2021 |
|
$ |
|
|
|
$ |
|
|
|
$ |
— |
|
|
$ |
— |
|
|
$ |
— |
|
|
$ |
|
|
|
(1) |
Employee termination benefits not related to the VSIP. |
|
(2) |
Reorganization costs include employee relocation expenses. |
|
(3) |
|
During Fiscal 2018, we paid $
F-23
|
Note 6. |
Accumulated Other Comprehensive Income (Loss) |
The company’s total comprehensive loss presently consists of net income, adjustments for our derivative financial instruments accounted for as cash flow hedges, and various pension and other postretirement benefit related items.
During Fiscal 2020, 2019, and 2018, reclassifications out of AOCI were as follows (amounts in thousands):
|
|
|
Amount Reclassified from AOCI |
|
|
Affected Line Item in the Statement |
|||||||||
|
Details about AOCI Components (Note 2) |
|
Fiscal 2020 |
|
|
Fiscal 2019 |
|
|
Fiscal 2018 |
|
|
Where Net Income is Presented |
|||
|
Derivative instruments: |
|
|
|
|
|
|
|
|
|
|
|
|
|
|
|
Interest rate contracts |
|
$ |
( |
) |
|
$ |
( |
) |
|
$ |
( |
) |
|
Interest expense |
|
Commodity contracts |
|
|
( |
) |
|
|
|
|
|
|
( |
) |
|
Cost of sales, Note 3, below |
|
Total before tax |
|
$ |
( |
) |
|
$ |
|
|
|
$ |
( |
) |
|
Total before tax |
|
Tax benefit (expense) |
|
|
|
|
|
|
( |
) |
|
|
|
|
|
Tax benefit |
|
Total net of tax |
|
$ |
( |
) |
|
$ |
|
|
|
$ |
( |
) |
|
Net of tax |
|
Pension and postretirement plans: |
|
|
|
|
|
|
|
|
|
|
|
|
|
|
|
Prior-service credits |
|
$ |
( |
) |
|
$ |
( |
) |
|
$ |
( |
) |
|
Note 1, below |
|
Settlement loss |
|
|
( |
) |
|
|
— |
|
|
|
( |
) |
|
Note 1, below |
|
Actuarial losses |
|
|
( |
) |
|
|
( |
) |
|
|
( |
) |
|
Note 1, below |
|
Total before tax |
|
$ |
( |
) |
|
$ |
( |
) |
|
$ |
( |
) |
|
Total before tax |
|
Tax benefit |
|
|
|
|
|
|
|
|
|
|
|
|
|
Tax benefit |
|
Total net of tax |
|
$ |
( |
) |
|
$ |
( |
) |
|
$ |
( |
) |
|
Net of tax benefit |
|
Total reclassifications from AOCI |
|
$ |
( |
) |
|
$ |
( |
) |
|
$ |
( |
) |
|
Net of tax benefit |
|
|
Note 1: |
|
|
|
Note 2: |
|
|
|
Note 3: |
|
During Fiscal 2020, 2019, and 2018, amounts recognized in AOCI, exclusive of reclassifications, were as follows (amounts in thousands):
|
|
|
Amount of Gain (Loss) Recognized in AOCI |
|
|||||||||
|
AOCI component |
|
Fiscal 2020 |
|
|
Fiscal 2019 |
|
|
Fiscal 2018 |
|
|||
|
Derivative instruments: |
|
|
|
|
|
|
|
|
|
|
|
|
|
Commodity contracts |
|
$ |
|
|
|
$ |
|
|
|
$ |
|
|
|
Total before tax |
|
$ |
|
|
|
$ |
|
|
|
$ |
|
|
|
Tax (expense) |
|
|
( |
) |
|
|
( |
) |
|
|
( |
) |
|
Total net of tax |
|
$ |
|
|
|
$ |
|
|
|
$ |
|
|
|
Pension and postretirement plans: |
|
|
|
|
|
|
|
|
|
|
|
|
|
Current year actuarial loss |
|
$ |
|
|
|
$ |
( |
) |
|
$ |
( |
) |
|
Total before tax |
|
$ |
|
|
|
$ |
( |
) |
|
$ |
( |
) |
|
Tax benefit (expense) |
|
|
( |
) |
|
|
|
|
|
|
|
|
|
Total net of tax |
|
$ |
|
|
|
$ |
( |
) |
|
$ |
( |
) |
|
Total recognized in AOCI |
|
$ |
|
|
|
$ |
|
|
|
$ |
( |
) |
During Fiscal 2020, changes to AOCI, net of income tax, by component were as follows (amounts in thousands):
|
|
|
Cash Flow Hedge Items |
|
|
Defined Benefit Pension Plan Items |
|
|
Total |
|
|||
|
AOCI at December 28, 2019 |
|
$ |
|
|
|
$ |
( |
) |
|
$ |
( |
) |
|
Other comprehensive gain before reclassifications |
|
|
|
|
|
|
|
|
|
|
|
|
|
Reclassified to earnings from AOCI |
|
|
|
|
|
|
|
|
|
|
|
|
|
AOCI at January 2, 2021 |
|
$ |
|
|
|
$ |
( |
) |
|
$ |
|
|
F-24
During Fiscal 2019, changes to AOCI, net of income tax, by component were as follows (amounts in thousands):
|
|
|
Cash Flow Hedge Items |
|
|
Defined Benefit Pension Plan Items |
|
|
Total |
|
|||
|
AOCI at December 29, 2018 |
|
$ |
( |
) |
|
$ |
( |
) |
|
$ |
( |
) |
|
Other comprehensive loss (gain) before reclassifications |
|
|
|
|
|
|
( |
) |
|
|
|
|
|
Reclassified to earnings from AOCI |
|
|
( |
) |
|
|
|
|
|
|
|
|
|
AOCI at December 28, 2019 |
|
$ |
|
|
|
$ |
( |
) |
|
$ |
( |
) |
Amounts reclassified out of AOCI to net income that relate to commodity contracts are presented as an adjustment to reconcile net income to net cash provided by operating activities on the Consolidated Statements of Cash Flows.
|
|
|
Fiscal 2020 |
|
|
Fiscal 2019 |
|
|
Fiscal 2018 |
|
|||
|
Gross (loss) gain reclassified from AOCI into income |
|
$ |
( |
) |
|
$ |
|
|
|
$ |
( |
) |
|
Tax benefit (expense) |
|
|
|
|
|
|
( |
) |
|
|
|
|
|
Net of tax |
|
$ |
( |
) |
|
$ |
|
|
|
$ |
( |
) |
|
Note 7. |
Notes Receivable from IDPs |
The company provides direct financing to certain IDPs for the purchase of the IDPs’ distribution rights and records the notes receivable on the Consolidated Balance Sheets. The distribution rights are financed for up to
|
|
|
Interest income |
|
|
|
Fiscal 2020 |
|
$ |
|
|
|
Fiscal 2019 |
|
$ |
|
|
|
Fiscal 2018 |
|
$ |
|
|
The notes receivable are collateralized by the IDPs’ distribution rights. Additional details are included in Note 17, Fair Value of Financial Instruments.
|
Note 8. |
Assets Held for Sale |
The company repurchases distribution rights from IDPs in circumstances when the company decides to exit a territory or, in some cases, when the IDP elects to terminate its relationship with the company. In most distributor agreements, if the company decides to exit a territory or stop using the independent distribution model in a territory, the company is contractually required to purchase the distribution rights from the IDP. In the event an IDP terminates its relationship with the company, the company, although not legally obligated, may repurchase and operate those distribution rights as a company-owned territory. The IDPs may also sell their distribution rights to another person or entity. Distribution rights purchased from IDPs and operated as company-owned territories are recorded on the Consolidated Balance Sheets in the line item “Assets Held for Sale” while the company actively seeks another IDP to purchase the distribution rights for the territory. Distribution rights held for sale and operated by the company are sold to IDPs at fair market value pursuant to the terms of a distributor agreement. There are multiple versions of the distributor agreement in place at any given time and the terms of such distributor agreements vary.
During the first quarter of Fiscal 2020,
The company sold a closed plant in Winston-Salem, North Carolina, which was reclassified to assets held for sale in fiscal 2017, during the third quarter of Fiscal 2019. The company received $
F-25
The gain on sale is recognized in the restructuring and related impairment charges line item on the Consolidated Statements of Income.
Additional assets recorded in assets held for sale are for property, plant and equipment. The carrying values of assets held for sale are not amortized and are evaluated for impairment as required.
|
|
|
January 2, 2021 |
|
|
December 28, 2019 |
|
||
|
Distribution rights |
|
$ |
|
|
|
$ |
|
|
|
Property, plant and equipment |
|
|
|
|
|
|
|
|
|
Total assets held for sale |
|
$ |
|
|
|
$ |
|
|
|
Note 9. |
Goodwill and Other Intangible Assets |
The table below summarizes our goodwill and other intangible assets at January 2, 2021 and December 28, 2019, respectively, each of which is explained in additional detail below (amounts in thousands):
|
|
|
January 2, 2021 |
|
|
December 28, 2019 |
|
||
|
Goodwill |
|
$ |
|
|
|
$ |
|
|
|
Amortizable intangible assets, net of amortization |
|
|
|
|
|
|
|
|
|
Indefinite-lived intangible assets |
|
|
|
|
|
|
|
|
|
Total goodwill and other intangible assets |
|
$ |
|
|
|
$ |
|
|
The changes in the carrying amount of goodwill during Fiscal 2019 and Fiscal 2020, are as follows (amounts in thousands):
|
|
|
Total |
|
|
|
Balance as of December 29, 2018 |
|
$ |
|
|
|
Change in goodwill related to acquisition |
|
|
( |
) |
|
Balance as of December 28, 2019 |
|
$ |
|
|
|
Change in goodwill related to acquisition |
|
|
— |
|
|
Balance as of January 2, 2021 |
|
$ |
|
|
Goodwill decreased $
Goodwill was
As of January 2, 2021 and December 28, 2019, the company had the following amounts related to amortizable intangible assets (amounts in thousands):
|
|
|
January 2, 2021 |
|
|
December 28, 2019 |
|
||||||||||||||||||
|
Asset |
|
Cost |
|
|
Accumulated Amortization |
|
|
Net Value |
|
|
Cost |
|
|
Accumulated Amortization |
|
|
Net Value |
|
||||||
|
Trademarks |
|
$ |
|
|
|
$ |
|
|
|
$ |
|
|
|
$ |
|
|
|
$ |
|
|
|
$ |
|
|
|
Customer relationships |
|
|
|
|
|
|
|
|
|
|
|
|
|
|
|
|
|
|
|
|
|
|
|
|
|
Non-compete agreements |
|
|
|
|
|
|
|
|
|
|
|
|
|
|
|
|
|
|
|
|
|
|
|
|
|
Distributor relationships |
|
|
|
|
|
|
|
|
|
|
|
|
|
|
|
|
|
|
|
|
|
|
|
|
|
Distributor routes held and used |
|
|
|
|
|
|
|
|
|
|
|
|
|
|
— |
|
|
|
— |
|
|
|
— |
|
|
Total |
|
$ |
|
|
|
$ |
|
|
|
$ |
|
|
|
$ |
|
|
|
$ |
|
|
|
$ |
|
|
As of January 2, 2021 and December 28, 2019, there was $
F-26
Fiscal 2020 restructuring and related impairment charges
In order to optimize sales and production of our organic products, the company decided to cease using the Alpine Valley finite-lived trademark, resulting in a $
Fiscal 2019 restructuring and related impairment charges
During Fiscal 2019, the company recognized intangible asset impairments of $
Fiscal 2018 restructuring and related impairment charges
There were
Amortization expense
Amortization expense for Fiscal 2020, 2019, and 2018 was as follows (amounts in thousands):
|
|
|
Amortization expense |
|
|
|
Fiscal 2020 |
|
$ |
|
|
|
Fiscal 2019 |
|
$ |
|
|
|
Fiscal 2018 |
|
$ |
|
|
Estimated amortization of intangibles for Fiscal 2021 and the next four years thereafter is as follows (amounts in thousands):
|
Fiscal year |
|
Amortization of Intangibles |
|
|
|
2021 |
|
$ |
|
|
|
2022 |
|
$ |
|
|
|
2023 |
|
$ |
|
|
|
2024 |
|
$ |
|
|
|
2025 |
|
$ |
|
|
|
Note 10. |
Acquisition |
On
F-27
During Fiscal 2018, the company incurred $
|
Fair value of consideration transferred: |
|
|
|
|
|
Cash consideration paid |
|
$ |
|
|
|
Working capital adjustments |
|
|
|
|
|
Contingent consideration |
|
|
|
|
|
Total consideration |
|
$ |
|
|
|
Recognized amounts of identifiable assets acquired and liabilities assumed: |
|
|
|
|
|
Property, plant, and equipment |
|
$ |
|
|
|
Identifiable intangible assets |
|
|
|
|
|
Financial assets |
|
|
|
|
|
Net recognized amounts of identifiable assets acquired |
|
|
|
|
|
Goodwill |
|
$ |
|
|
Property, plant and equipment in the table above includes real property and machinery and equipment
The following table presents the acquired intangible assets subject to amortization (amounts in thousands, except amortization periods):
|
|
|
Total |
|
|
Weighted average amortization years |
|
|
Attribution Method |
||
|
Trademarks |
|
$ |
|
|
|
|
|
|
|
|
|
Customer relationships |
|
|
|
|
|
|
|
|
|
|
|
Noncompete agreements |
|
|
|
|
|
|
|
|
|
|
|
|
|
$ |
|
|
|
|
|
|
|
|
The fair value of trade receivables was $
Acquisition pro formas
We determined that the consolidated results of operations for Canyon were immaterial in the aggregate and the pro forma financial statements were not required for Fiscal 2018.
|
Note 11. |
Derivative Financial Instruments |
The company measures the fair value of its derivative portfolio by using the price that would be received to sell an asset or paid to transfer a liability in the principal market for that asset or liability. These measurements are classified into a hierarchy by the inputs used to perform the fair value calculation as follows:
Level 1: Fair value based on unadjusted quoted prices for identical assets or liabilities at the measurement date
Level 2: Modeled fair value with model inputs other than quoted prices included within Level 1 that are observable for the asset or liability, either directly or indirectly
Level 3: Modeled fair value with unobservable model inputs that are used to estimate the fair value of the asset or liability
Commodity Price Risk
The company enters into commodity derivatives, designated as cash-flow hedges of existing or future exposure to changes in commodity prices. The company’s primary raw materials are flour, sweeteners, yeast, and shortening, along with pulp, paper, and petroleum-based packaging products. Natural gas, which is used as oven fuel, is also an important commodity used for production.
F-28
As of January 2, 2021, the company’s commodity hedge portfolio contained derivatives which are recorded in the following accounts with fair values measured as indicated (amounts in thousands):
|
|
|
Level 1 |
|
|
Level 2 |
|
|
Level 3 |
|
|
Total |
|
||||
|
Assets: |
|
|
|
|
|
|
|
|
|
|
|
|
|
|
|
|
|
Other current assets |
|
$ |
|
|
|
$ |
— |
|
|
$ |
— |
|
|
$ |
|
|
|
Other long-term assets |
|
|
|
|
|
|
— |
|
|
|
— |
|
|
|
|
|
|
Total |
|
$ |
|
|
|
$ |
— |
|
|
$ |
— |
|
|
$ |
|
|
|
Liabilities: |
|
|
|
|
|
|
|
|
|
|
|
|
|
|
|
|
|
Other current liabilities |
|
$ |
( |
) |
|
$ |
— |
|
|
$ |
— |
|
|
$ |
( |
) |
|
Other long-term liabilities |
|
|
( |
) |
|
|
— |
|
|
|
— |
|
|
|
( |
) |
|
Total |
|
$ |
( |
) |
|
$ |
— |
|
|
$ |
— |
|
|
$ |
( |
) |
|
Net Fair Value |
|
$ |
|
|
|
$ |
— |
|
|
$ |
— |
|
|
$ |
|
|
As of December 28, 2019, the company’s commodity hedge portfolio contained derivatives which are recorded in the following accounts with fair values measured as indicated (amounts in thousands):
|
|
|
Level 1 |
|
|
Level 2 |
|
|
Level 3 |
|
|
Total |
|
||||
|
Assets: |
|
|
|
|
|
|
|
|
|
|
|
|
|
|
|
|
|
Other current assets |
|
$ |
|
|
|
$ |
— |
|
|
$ |
— |
|
|
$ |
|
|
|
Other long-term assets |
|
|
|
|
|
|
— |
|
|
|
— |
|
|
|
|
|
|
Total |
|
$ |
|
|
|
$ |
— |
|
|
$ |
— |
|
|
$ |
|
|
|
Liabilities: |
|
|
|
|
|
|
|
|
|
|
|
|
|
|
|
|
|
Other current liabilities |
|
$ |
( |
) |
|
$ |
— |
|
|
$ |
— |
|
|
$ |
( |
) |
|
Other long-term liabilities |
|
|
( |
) |
|
|
— |
|
|
|
— |
|
|
|
( |
) |
|
Total |
|
|
( |
) |
|
|
— |
|
|
|
— |
|
|
|
( |
) |
|
Net Fair Value |
|
$ |
|
|
|
$ |
— |
|
|
$ |
— |
|
|
$ |
|
|
The positions held in the portfolio are used to hedge economic exposure to changes in various raw materials and production input prices and effectively fixes the price, or limits increases in prices, for a period of time extending into Fiscal 2022. These instruments are designated as cash-flow hedges. See Note 2, Summary of Significant Accounting Policies, for the accounting treatment of these hedged transactions.
Interest Rate Risk
The company previously entered into treasury rate locks at the time we executed the 2022 and 2026 notes. These rate locks were designated as a cash flow hedge and the fair value at termination was deferred in AOCI. The deferred amount reported in AOCI is being reclassified to interest expense as interest payments are made on the related notes through the maturity date.
Derivative Assets and Liabilities
The company had the following derivative instruments recorded on the Consolidated Balance Sheets, all of which are utilized for the risk management purposes detailed above (amounts in thousands):
|
|
|
Derivative Assets |
|
|||||||||
|
|
|
January 2, 2021 |
|
|
December 28, 2019 |
|
||||||
|
Derivatives Designated as Hedging Instruments |
|
Balance Sheet Location |
|
Fair Value |
|
|
Balance Sheet Location |
|
Fair Value |
|
||
|
Commodity contracts |
|
Other current assets |
|
$ |
|
|
|
Other current assets |
|
$ |
|
|
|
Commodity contracts |
|
Other long-term assets |
|
|
|
|
|
Other long-term assets |
|
|
|
|
|
Total |
|
|
|
$ |
|
|
|
|
|
$ |
|
|
|
|
|
Derivative Liabilities |
|
|||||||||
|
|
|
January 2, 2021 |
|
|
December 28, 2019 |
|
||||||
|
Derivatives Designated as Hedging Instruments |
|
Balance Sheet Location |
|
Fair Value |
|
|
Balance Sheet Location |
|
Fair Value |
|
||
|
Commodity contracts |
|
Other current liabilities |
|
$ |
|
|
|
Other current liabilities |
|
$ |
|
|
|
Commodity contracts |
|
Other long-term liabilities |
|
|
|
|
|
Other long-term liabilities |
|
|
|
|
|
Total |
|
|
|
$ |
|
|
|
|
|
$ |
|
|
F-29
Derivative AOCI transactions
The company had the following derivative instruments for deferred gains and (losses) on closed contracts and the effective portion for changes in fair value recorded in AOCI (no amounts were excluded from the effectiveness test), all of which are utilized for the risk management purposes detailed above (amounts in thousands and net of tax):
|
|
|
Amount of Gain or (Loss) Recognized in OCI on Derivatives (Effective Portion) (Net of tax) |
|
|||||||||
|
Derivatives in Cash Flow Hedging Relationships |
|
Fiscal 2020 |
|
|
Fiscal 2019 |
|
|
Fiscal 2018 |
|
|||
|
Commodity contracts |
|
$ |
|
|
|
$ |
|
|
|
$ |
|
|
|
Total |
|
$ |
|
|
|
$ |
|
|
|
$ |
|
|
|
|
|
Amount of Gain or (Loss) Reclassified from AOCI into Income (Effective Portion)(Net of tax) |
|
|
Location of Gain or (Loss) Reclassified from AOCI into Income |
|||||||||
|
Derivatives in Cash Flow Hedging Relationships |
|
Fiscal 2020 |
|
|
Fiscal 2019 |
|
|
Fiscal 2018 |
|
|
(Effective Portion) |
|||
|
Interest rate contracts |
|
$ |
( |
) |
|
$ |
( |
) |
|
$ |
( |
) |
|
Interest (expense) income |
|
Commodity contracts |
|
|
( |
) |
|
|
|
|
|
|
( |
) |
|
Production costs (1) |
|
Total |
|
$ |
( |
) |
|
$ |
|
|
|
$ |
( |
) |
|
|
|
1. |
|
The balance (credit or (debit) balance) in AOCI related to commodity price risk and interest rate risk derivative transactions that are closed or will expire over the next three years are as follows (amounts in thousands and net of tax) at January 2, 2021:
|
|
|
Commodity Price Risk Derivatives |
|
|
Interest Rate Risk Derivatives |
|
|
Totals |
|
|||
|
Closed contracts |
|
$ |
( |
) |
|
$ |
|
|
|
$ |
|
|
|
Expiring in 2021 |
|
|
|
|
|
|
— |
|
|
|
|
|
|
Expiring in 2022 |
|
|
|
|
|
|
— |
|
|
|
|
|
|
Total |
|
$ |
|
|
|
$ |
|
|
|
$ |
|
|
See Note 2, Summary of Significant Accounting Policies, for the accounting treatment of OCI for these hedged transactions.
Derivative transactions notional amounts
As of January 2, 2021, the company had entered into the following financial contracts to hedge commodity risks (amounts in thousands):
|
Derivatives in Cash Flow Hedging Relationships |
|
Notional amount |
|
|
|
Wheat contracts |
|
$ |
|
|
|
Soybean oil contracts |
|
|
|
|
|
Natural gas contracts |
|
|
|
|
|
Corn contracts |
|
|
|
|
|
Total |
|
$ |
|
|
The company’s derivative instruments contained no credit-risk-related contingent features at January 2, 2021. As of January 2, 2021 and December 28, 2019, the company had $
F-30
|
Note 12. |
Other Current and Non-Current Assets |
Other current assets consist of (amounts in thousands):
|
|
|
January 2, 2021 |
|
|
December 28, 2019 |
|
||
|
Prepaid assets |
|
$ |
|
|
|
$ |
|
|
|
Recovery from legal settlement in principle |
|
|
— |
|
|
|
|
|
|
Fair value of derivative instruments |
|
|
|
|
|
|
|
|
|
Collateral to counterparties for derivative positions |
|
|
|
|
|
|
|
|
|
Income taxes receivable |
|
|
|
|
|
|
|
|
|
Other |
|
|
|
|
|
|
|
|
|
Total |
|
$ |
|
|
|
$ |
|
|
The recovery from legal settlement in principle represents funds in the amount of $
Other non-current assets consist of (amounts in thousands):
|
|
|
January 2, 2021 |
|
|
December 28, 2019 |
|
||
|
Unamortized financing fees |
|
$ |
|
|
|
$ |
|
|
|
Investments |
|
|
|
|
|
|
|
|
|
Fair value of derivative instruments |
|
|
|
|
|
|
|
|
|
Deposits |
|
|
|
|
|
|
|
|
|
Unamortized cloud computing arrangement costs |
|
|
|
|
|
|
|
|
|
Other |
|
|
|
|
|
|
|
|
|
Total |
|
$ |
|
|
|
$ |
|
|
|
Note 13. |
Other Accrued Liabilities and Other Long-Term Liabilities |
Other accrued liabilities consist of (amounts in thousands):
|
|
|
January 2, 2021 |
|
|
December 28, 2019 |
|
||
|
Employee compensation |
|
$ |
|
|
|
$ |
|
|
|
VSIP and RIF liabilities |
|
|
|
|
|
|
|
|
|
Employee vacation |
|
|
|
|
|
|
|
|
|
Employee bonus |
|
|
|
|
|
|
|
|
|
Fair value of derivative instruments |
|
|
|
|
|
|
|
|
|
Self-insurance reserves |
|
|
|
|
|
|
|
|
|
Bank overdraft |
|
|
|
|
|
|
|
|
|
Accrued interest |
|
|
|
|
|
|
|
|
|
Accrued taxes |
|
|
|
|
|
|
|
|
|
Accrued legal costs |
|
|
|
|
|
|
|
|
|
Accrued advertising |
|
|
|
|
|
|
|
|
|
Accrued legal settlements |
|
|
|
|
|
|
|
|
|
Accrued short term deferred income |
|
|
|
|
|
|
|
|
|
Accrued utilities |
|
|
|
|
|
|
|
|
|
Contingent acquisition consideration |
|
|
— |
|
|
|
|
|
|
Collateral from counterparties for derivative positions |
|
|
|
|
|
|
|
|
|
Other |
|
|
|
|
|
|
|
|
|
Total |
|
$ |
|
|
|
$ |
|
|
The contingent acquisition consideration was ultimately earned during Fiscal 2019 and was paid at the beginning of Fiscal 2020.
F-31
Other long-term liabilities consist of (amounts in thousands):
|
|
|
January 2, 2021 |
|
|
December 28, 2019 |
|
||
|
Deferred income |
|
$ |
|
|
|
$ |
|
|
|
Deferred compensation |
|
|
|
|
|
|
|
|
|
Fair value of derivative instruments |
|
|
|
|
|
|
|
|
|
Other deferred credits |
|
|
|
|
|
|
|
|
|
Deferred payroll taxes under the CARES Act |
|
|
|
|
|
|
— |
|
|
Other |
|
|
|
|
|
|
|
|
|
Total |
|
$ |
|
|
|
$ |
|
|
|
Note 14. |
Leases |
Qualitative disclosures about our leases, including the significant policy elections, can be found in Note 2, Summary of Significant Accounting Policies. The quantitative disclosures are presented below.
Lease costs incurred by lease type, and/or type of payment for Fiscal 2020 and Fiscal 2019 were as follows (in thousands):
|
|
|
Fiscal 2020 |
|
|
Fiscal 2019 |
|
||
|
Lease cost: |
|
|
|
|
|
|
|
|
|
Amortization of right-of-use assets |
|
$ |
|
|
|
$ |
|
|
|
Interest on lease liabilities |
|
|
|
|
|
|
|
|
|
Operating lease cost |
|
|
|
|
|
|
|
|
|
Short-term lease cost |
|
|
|
|
|
|
|
|
|
Variable lease cost |
|
|
|
|
|
|
|
|
|
Total lease cost |
|
$ |
|
|
|
$ |
|
|
Other supplemental quantitative disclosures as of, and for, Fiscal 2020 and Fiscal 2019 were as follows (in thousands):
|
|
|
Fiscal 2020 |
|
|
Fiscal 2019 |
|
||
|
Cash paid for amounts included in the measurement of lease liabilities: |
|
|
|
|
|
|
|
|
|
Operating cash flows from financing leases |
|
$ |
|
|
|
$ |
|
|
|
Operating cash flows from operating leases |
|
$ |
|
|
|
$ |
|
|
|
Financing cash flows from financing leases |
|
$ |
|
|
|
$ |
|
|
|
Right-of-use assets obtained in exchange for new financing lease liabilities |
|
$ |
|
|
|
$ |
|
|
|
Right-of-use assets obtained in exchange for new operating lease liabilities |
|
$ |
|
|
|
$ |
|
|
|
Weighted-average remaining lease term (years): |
|
|
|
|
|
|
|
|
|
Financing leases |
|
|
|
|
|
|
|
|
|
Operating leases |
|
|
|
|
|
|
|
|
|
Weighted-average IBR (percentage): |
|
|
|
|
|
|
|
|
|
Financing leases |
|
|
|
|
|
|
|
|
|
Operating leases |
|
|
|
|
|
|
|
|
F-32
Estimated undiscounted future lease payments under non-cancelable operating leases and financing leases, along with a reconciliation of the undiscounted cash flows to operating and financing lease liabilities, respectively, as of January 2, 2021 (in thousands) were as follows:
|
|
|
Operating lease liabilities |
|
|
Financing lease liabilities |
|
||
|
2021 |
|
$ |
|
|
|
$ |
|
|
|
2022 |
|
|
|
|
|
|
|
|
|
2023 |
|
|
|
|
|
|
|
|
|
2024 |
|
|
|
|
|
|
|
|
|
2025 |
|
|
|
|
|
|
|
|
|
Thereafter |
|
|
|
|
|
|
— |
|
|
Total minimum lease payments |
|
|
|
|
|
|
|
|
|
Less: amount of lease payments representing interest |
|
|
( |
) |
|
|
( |
) |
|
Present value of future minimum lease payments |
|
|
|
|
|
|
|
|
|
Less: current obligations under leases |
|
|
( |
) |
|
|
( |
) |
|
Long-term lease obligations |
|
$ |
|
|
|
$ |
|
|
The following table details lease modifications and renewals and lease impairments (amounts in thousands):
|
|
|
Fiscal 2020 |
|
|
Fiscal 2019 |
|
||
|
Lease modifications and renewals |
|
$ |
|
|
|
$ |
|
|
|
Lease impairments |
|
$ |
|
|
|
$ |
— |
|
|
Lease terminations |
|
$ |
|
|
|
$ |
|
|
Lease disclosures prior to adoption of the new standard
Rent expense for all operating leases for fiscal 2018 was as follows (amounts in thousands):
|
|
|
Rent expense |
|
|
|
Fiscal 2018 |
|
$ |
|
|
|
Note 15. |
Debt and Other Commitments |
Long-term debt, including capital lease obligations, consisted of the following at January 2, 2021 and December 28, 2019:
|
|
|
Interest Rate at January 2, 2021 |
|
|
Final Maturity |
|
January 2, 2021 |
|
|
December 28, 2019 |
|
|||
|
|
|
|
|
|
|
|
|
(Amounts in thousands) |
|
|||||
|
Unsecured credit facility |
|
|
|
|
|
|
$ |
|
|
|
$ |
|
|
|
|
|
|
|
|
|
|
|
|
|
|
|
|
|
|
|
|
|
|
|
|
|
|
|
|
|
|
|
|
|
|
|
|
Accounts receivable securitization facility |
|
|
|
|
|
|
|
|
|
|
|
|
|
|
|
Other notes payable |
|
|
|
|
|
|
|
|
— |
|
|
|
|
|
|
|
|
|
|
|
|
|
|
|
|
|
|
|
|
|
|
Current maturities of long-term debt |
|
|
|
|
|
|
|
|
— |
|
|
|
( |
) |
|
Long-term debt |
|
|
|
|
|
|
|
$ |
|
|
|
$ |
|
|
Bank overdrafts occur when checks have been issued but have not been presented to the bank for payment. Certain of our banks allow us to delay funding of issued checks until the checks are presented for payment. The delay in funding results in a temporary source of financing from the bank. The activity related to bank overdrafts is shown as a financing activity in our Consolidated Statements of Cash Flows. Bank overdrafts are included in other current liabilities on our Consolidated Balance Sheets. As of January 2, 2021 and December 28, 2019, the bank overdraft balance was $
The company also had standby letters of credit (“LOCs”) outstanding of $
F-33
2026 Notes, Accounts Receivable Securitization Facility, 2022 Notes, and Credit Facility
2026 Notes. On September 28, 2016, the company issued $
The face value of the 2026 notes is $
|
Total fees for 2026 notes |
|
Amount at Issuance |
|
|
|
Debt discount |
|
$ |
|
|
|
Underwriting, legal, and other fees |
|
|
|
|
|
Total fees |
|
$ |
|
|
Accounts Receivable Securitization Facility. On July 17, 2013, the company entered into an accounts receivable securitization facility (the “AR facility”). The company has amended the AR facility eight times since execution, most recently on September 23, 2020. These amendments include provisions which (i) increased the revolving commitments under the AR facility to $
Under the AR facility, a wholly-owned, bankruptcy-remote subsidiary purchases, on an ongoing basis, substantially all trade receivables. As borrowings are made under the AR facility, the subsidiary pledges the receivables as collateral. In the event of liquidation of the subsidiary, its creditors would be entitled to satisfy their claims from the subsidiary’s pledged receivables prior to distributions of collections to the company. We include the subsidiary in our Consolidated Financial Statements. The AR facility contains certain customary representations and warranties, affirmative and negative covenants, and events of default. Restrictive covenants require adherence to company credit and collections policies, depository account control agreements, and certain other customary restrictions including limitations to consolidations, mergers, and liens.
Optional principal repayments may be made at any time without premium or penalty. Interest is due two days after our reporting periods end in arrears on the outstanding borrowings and is computed as the cost of funds rate plus an applicable margin of
F-34
The table below presents the borrowings and repayments under the AR facility during Fiscal 2020:
|
|
|
Amount (thousands) |
|
|
|
Balance as of December 28, 2019 |
|
$ |
|
|
|
Borrowings |
|
|
|
|
|
Payments |
|
|
( |
) |
|
Balance as of January 2, 2021 |
|
$ |
|
|
The table below presents the net amount available for working capital and general corporate purposes under the AR facility as of January 2, 2021:
|
|
|
Amount (thousands) |
|
|
|
Gross amount available |
|
$ |
|
|
|
Outstanding |
|
|
( |
) |
|
Available for withdrawal |
|
$ |
|
|
Amounts available for withdrawal under the AR facility are determined as the lesser of the total commitments and a formula derived amount based on qualifying trade receivables.
|
|
|
Amount (thousands) |
|
|
|
High balance |
|
$ |
|
|
|
Low balance |
|
$ |
|
|
2022 Notes. On April 3, 2012, the company issued $
The face value of the notes is $
Credit Facility. On November 29, 2017 the company entered into the sixth amendment to its amended and restated credit agreement, dated as of October 24, 2003, with the lenders party thereto and Deutsche Bank AG New York Branch, as administrative agent, the swingline lender and issuing lender. The amendment, among other things (i) extends the maturity date of the existing credit agreement to
F-35
The credit facility is a , $
The company paid additional financing costs of $
Amounts outstanding under the credit facility vary daily. Changes in the gross borrowings and repayments can be caused by cash flow activity from operations, capital expenditures, acquisitions, dividends, share repurchases, and tax payments, as well as derivative transactions which are part of the company’s overall risk management strategy as discussed in Note 11, Derivative Financial Instruments.
|
|
|
Amount (thousands) |
|
|
|
Balance as of December 28, 2019 |
|
$ |
|
|
|
Borrowings |
|
|
|
|
|
Payments |
|
|
( |
) |
|
Balance as of January 2, 2021 |
|
$ |
|
|
The table below presents the net amount available under the credit facility as of January 2, 2021:
|
|
|
Amount (thousands) |
|
|
|
Gross amount available |
|
$ |
|
|
|
Outstanding |
|
|
( |
) |
|
Letters of credit |
|
|
( |
) |
|
Available for withdrawal |
|
$ |
|
|
The table below presents the highest and lowest outstanding balance under the credit facility during Fiscal 2020:
|
|
|
Amount (thousands) |
|
|
|
High balance |
|
$ |
|
|
|
Low balance |
|
$ |
|
|
Aggregate debt maturities.
|
2021 |
|
$ |
— |
|
|
2022 |
|
|
|
|
|
2023 |
|
|
— |
|
|
2024 |
|
|
— |
|
|
2025 |
|
|
— |
|
|
Thereafter |
|
|
|
|
|
Total |
|
$ |
|
|
F-36
Debt issuance costs and debt discount.
|
|
|
Face Value |
|
|
Debt issuance costs and debt discount |
|
|
Net carrying value |
|
|||
|
2026 notes |
|
$ |
|
|
|
$ |
|
|
|
$ |
|
|
|
2022 notes |
|
|
|
|
|
|
|
|
|
|
|
|
|
Total |
|
$ |
|
|
|
$ |
|
|
|
$ |
|
|
The table below reconciles the debt issuance costs and debt discounts to the net carrying value of each of our debt obligations (excluding line-of-credit arrangements) at December 28, 2019 (amounts in thousands):
|
|
|
Face Value |
|
|
Debt issuance costs and debt discount |
|
|
Net carrying value |
|
|||
|
2026 notes |
|
$ |
|
|
|
$ |
|
|
|
$ |
|
|
|
2022 notes |
|
|
|
|
|
|
|
|
|
|
|
|
|
Other notes payable |
|
|
|
|
|
|
|
|
|
|
|
|
|
Total |
|
$ |
|
|
|
$ |
|
|
|
$ |
|
|
Deferred Compensation
The Executive Deferred Compensation Plan (“EDCP”) consists of unsecured general obligations of the company to pay the deferred compensation of, and our contributions to, participants in the EDCP. The obligations will rank equally with our other unsecured and unsubordinated indebtedness payable from the company’s general assets.
The company’s directors and certain key members of management are eligible to participate in the EDCP. Directors may elect to defer all or any portion of their annual retainer fee and meeting fees. Deferral elections by directors must be made prior to the beginning of each year and are thereafter irrevocable. Eligible employees may elect to defer up to
The amounts outstanding at January 2, 2021 and December 28, 2019 were as follows (amounts in thousands):
|
|
|
January 2, 2021 |
|
|
December 28, 2019 |
|
||
|
Deferral elections outstanding |
|
$ |
|
|
|
$ |
|
|
|
Current portion of deferral elections |
|
|
( |
) |
|
|
( |
) |
|
Long-term portion of deferral elections |
|
$ |
|
|
|
$ |
|
|
Guarantees and Indemnification Obligations
The company has provided various representations, warranties, and other standard indemnifications in various agreements with customers, suppliers, and other parties as well as in agreements to sell business assets or lease facilities. In general, these provisions indemnify the counterparty for matters such as breaches of representations and warranties, certain environmental conditions and tax matters, and, in the context of sales of business assets, any liabilities arising prior to the closing of the transactions. Non-performance under a contract could trigger an obligation of the company. The ultimate effect on future financial results is not subject to reasonable estimation because considerable uncertainty exists as to the final outcome of any potential claims.
No material guarantees or indemnifications have been entered into by the company through January 2, 2021.
F-37
|
Note 16. |
Variable Interest Entities |
Transportation agreement variable interest entity (the “VIE”) analysis
The company maintains a transportation agreement with an entity that transports a significant portion of the company’s fresh bakery products from the company’s production facilities to outlying distribution centers. As of December 29, 2018, this entity qualified as a VIE, but the company determined it was not the primary beneficiary of the VIE because the company did not (i) have the ability to direct the significant activities of the VIE and (ii) provide any implicit or explicit guarantees or other financial support to the VIE for specific return or performance benchmarks. In addition, we did not provide, nor did we intend to provide, financial or other support to the entity.
The company reconsidered its relationship with the entity because the entity was sold, and the company has concluded the entity no longer qualifies as a VIE beginning in the second quarter of Fiscal 2019.
Distribution rights agreement VIE analysis
The incorporated IDPs qualify as VIEs. The IDPs who are formed as sole proprietorships are excluded from the following VIE accounting analysis and discussion.
Incorporated IDPs acquire distribution rights and enter into a contract with the company to sell the company’s products in the IDPs’ defined geographic territory. The incorporated IDPs have the option to finance the acquisition of their distribution rights with the company. They can also pay cash or obtain external financing at the time they acquire the distribution rights. The combination of the company’s loans to the incorporated IDPs and the ongoing distributor arrangements with the incorporated IDPs provide a level of funding to the equity owners of the various incorporated IDPs that would not otherwise be available. As of January 2, 2021 and December 28, 2019, there was $
The company is not considered to be the primary beneficiary of the VIEs because the company does not (i) have the ability to direct the significant activities of the VIEs that would affect their ability to operate their respective businesses and (ii) provide any implicit or explicit guarantees or other financial support to the VIEs, other than the financing described above, for specific return or performance benchmarks. The activities controlled by the incorporated IDPs that are deemed to most significantly impact the ultimate success of the incorporated IDP entities relate to those decisions inherent in operating the distribution business in the territory, including acquiring trucks and trailers, managing fuel costs, employee matters and other strategic decisions. In addition, we do not provide, nor do we intend to provide, financial or other support to the IDP. The IDPs are responsible for the operations of their respective territories.
The company’s maximum contractual exposure to loss for the incorporated IDP relates to the distributor rights note receivable for the portion of the territory the incorporated IDPs financed at the time they acquired the distribution rights. The incorporated IDPs remit payment on their distributor rights note receivable each week during the settlement process of their weekly activity. The company will operate a territory on behalf of an incorporated IDP in situations where the IDP has abandoned its distribution rights. Any remaining balance outstanding on the distribution rights notes receivable is relieved once the distribution rights have been sold on the IDPs behalf. The company’s collateral from the territory distribution rights mitigates the potential losses.
|
Note 17. |
Fair Value of Financial Instruments |
The carrying value of cash and cash equivalents, accounts receivable, and short-term debt approximates fair value because of the short-term maturity of the instruments. Notes receivable are entered into in connection with the purchase of distribution rights by IDPs. These notes receivable are recorded in the Consolidated Balance Sheets at carrying value, which represents the closest approximation of fair value. Fair value is defined as the price that would be received to sell an asset or paid to transfer a liability in an orderly transaction between market participants at the measurement date. As a result, the appropriate interest rate that should be used to estimate the fair value of the distribution rights notes is the prevailing market rate at which similar loans would be made to IDPs with similar credit ratings and for the same maturities. However, the company financed approximately
F-38
At January 2, 2021 and December 28, 2019, respectively, the carrying value of the distribution rights notes receivable was as follows (amounts in thousands):
|
|
|
January 2, 2021 |
|
|
December 28, 2019 |
|
||
|
Distribution rights notes receivable |
|
$ |
|
|
|
$ |
|
|
|
Current portion recorded in accounts and notes receivable, net |
|
|
( |
) |
|
|
( |
) |
|
Long-term portion of distribution rights notes receivable |
|
$ |
|
|
|
$ |
|
|
At January 2, 2021 and December 28, 2019, the company has evaluated the collectability of the distribution rights notes receivable and determined that a reserve is not necessary. Payments on these notes are collected by the company weekly in conjunction with the IDP settlement process.
The fair value of the company’s variable rate debt at January 2, 2021 approximates the recorded value. The fair value of the company’s notes, as discussed in Note 15, Debt and Other Commitments, are estimated using yields obtained from independent pricing sources for similar types of borrowing arrangements and are considered a Level 2 valuation.
|
|
|
Carrying Value |
|
|
Fair Value |
|
|
Level |
||
|
|
|
$ |
|
|
|
$ |
|
|
|
2 |
|
|
|
$ |
|
|
|
$ |
|
|
|
2 |
For fair value disclosure information about our derivative assets and liabilities see Note 11, Derivative Financial Instruments. For fair value disclosure information about our pension plan net assets see Note 21, Postretirement Plans.
|
Note 18. |
Stockholders’ Equity |
Flowers Foods’ articles of incorporation provide that its authorized capital consist of
Common Stock
The holders of Flowers Foods common stock are entitled to
Preferred Stock
The Board of Directors has the authority to issue up to 1,000,000 shares of preferred stock in one or more series and to fix the designations, relative powers, preferences, rights, qualifications, limitations, and restrictions of all shares of each such series, including without limitation, dividend rates, conversion rights, voting rights, redemption and sinking fund provisions, liquidation preferences, and the number of shares constituting each such series, without any further vote or action by the holders of our common stock. Although the Board of Directors does not presently intend to do so, it could issue shares of preferred stock, with rights that could adversely affect the voting power and other rights of holders of our common stock without obtaining the approval of our shareholders. In addition, the issuance of preferred shares could delay or prevent a change in control of the company without further action by our shareholders.
F-39
Stock Repurchase Plan
Our Board of Directors has approved a plan (on December 19, 2002) that currently authorizes share repurchases of up to
The table below presents the shares repurchased under the Stock Repurchase Plan during our Fiscal 2020 (amounts in thousands except shares purchased):
|
Fiscal 2020 Quarter |
|
Total Number of Shares Purchased |
|
|
Total Cost of Shares Purchased |
|
||
|
For the quarter ended April 18, 2020 |
|
|
|
|
|
$ |
|
|
|
For the quarter ended July 11, 2020 |
|
|
— |
|
|
$ |
— |
|
|
For the quarter ended October 3, 2020 |
|
|
— |
|
|
$ |
— |
|
|
For the quarter ended January 2, 2021 |
|
|
— |
|
|
$ |
— |
|
|
Total |
|
|
|
|
|
$ |
|
|
As of January 2, 2021,
Dividends
During Fiscal 2020, 2019, and 2018, the company paid the following dividends, excluding dividends on vested stock-based compensation awards discussed in Note 19, Stock-Based Compensation, below (amounts in thousands except per share data):
|
|
|
Dividends paid |
|
|
Dividends paid per share |
|
||
|
Fiscal 2020 |
|
$ |
|
|
|
$ |
|
|
|
Fiscal 2019 |
|
$ |
|
|
|
$ |
|
|
|
Fiscal 2018 |
|
$ |
|
|
|
$ |
|
|
|
Note 19. |
Stock-Based Compensation |
On March 5, 2014, our Board of Directors approved and adopted the 2014 Omnibus Equity and Incentive Compensation Plan (“Omnibus Plan”). The Omnibus Plan was approved by our shareholders on May 21, 2014. The Omnibus Plan authorizes the compensation committee of the Board of Directors to provide equity-based compensation in the form of stock options, stock appreciation rights, restricted stock, restricted stock units, performance shares, performance units, dividend equivalents and other awards for the purpose of providing our officers, key employees, and non-employee directors’ incentives and rewards for performance. The Omnibus Plan replaced the Flowers Foods’ 2001 Equity and Performance Incentive Plan, as amended and restated as of April 1, 2009 (“EPIP”), the Stock Appreciation Rights Plan, and the Annual Executive Bonus Plan. All outstanding equity awards that were made under the EPIP will continue to be governed by the EPIP; however, all equity awards granted after May 21, 2014 are governed by the Omnibus Plan.
The EPIP authorized the compensation committee of the Board of Directors to make awards of options to purchase our common stock, restricted stock, performance stock and units and deferred stock. The company’s officers, key employees and non-employee directors (whose grants are generally approved by the full Board of Directors) were eligible to receive awards under the EPIP. Over the life of the EPIP, the company issued options, restricted stock and deferred stock.
The following is a summary of stock options, restricted stock, and deferred stock outstanding under the plans described above. Information relating to the company’s stock appreciation rights, which were issued under a separate stock appreciation right plan, is also described below. There were
Stock Options
The company issued nonqualified stock options (“NQSOs”) during Fiscal 2011 and prior that have all been fully exercised. Fiscal 2018 was the last year NQSOs were exercised.
F-40
The stock option activity for Fiscal 2018 pursuant to the EPIP is set forth below (amounts in thousands, except price data):
|
|
|
Fiscal 2018 |
|
|||||
|
|
|
Options |
|
|
Weighted Average Exercise Price |
|
||
|
Outstanding at beginning of year |
|
|
|
|
|
$ |
|
|
|
Exercised |
|
|
( |
) |
|
$ |
|
|
|
Outstanding at end of year |
|
|
— |
|
|
$ |
— |
|
|
Exercisable at end of year |
|
|
— |
|
|
|
|
|
The cash received, the windfall tax benefits, and intrinsic value from stock option exercises for Fiscal 2019 and 2018 are set forth below (amounts in thousands):
|
|
|
Fiscal 2018 |
|
|
|
Cash received from option exercises |
|
$ |
|
|
|
Cash tax windfall benefit, net |
|
$ |
|
|
|
Intrinsic value of stock options exercised |
|
$ |
|
|
Performance-Contingent Restricted Stock Awards
Performance-Contingent Total Shareholder Return Shares (“TSR Shares”)
Since 2012, certain key employees have been granted performance-contingent restricted stock under the EPIP and the Omnibus Plan in the form of TSR Shares. Awards granted prior to Fiscal 2019 vested approximately
|
Percentile |
|
Payout as % of Target |
|
|
|
90th |
|
|
|
% |
|
70th |
|
|
|
% |
|
50th |
|
|
|
% |
|
30th |
|
|
|
% |
|
Below 30th |
|
|
|
% |
For performance between the levels described above, the degree of vesting is interpolated on a linear basis.
|
Award |
|
Fiscal year vested |
|
Payout (%) |
|
|
|
2016 award |
|
Fiscal 2018 |
|
|
|
|
|
2017 award |
|
Fiscal 2019 |
|
|
|
|
The TSR shares vest immediately if the grantee dies or becomes disabled. However, if the grantee retires at age 65 (or age 55 with at least 10 years of service with the company) or later, on the normal vesting date the grantee will receive a pro-rated number of shares based upon the retirement date and measured at the actual performance for the entire performance period. In addition, if the company undergoes a change in control, the TSR shares will immediately vest at the target level, provided that if 12 months of the performance period have been completed, vesting will be determined based on Company TSR as of the date of the change in control without application of four-quarter averaging. During the vesting period, the grantee has none of the rights of a shareholder. Dividends declared during the vesting period will accrue and will be paid at vesting on the shares that ultimately vest. The fair value estimate was determined using a Monte Carlo simulation model, which utilizes multiple input variables to estimate the probability of the company achieving the market condition discussed above.
F-41
On May 23, 2019, the company’s CEO received an award of TSR Shares that brings his total grant equal to the CEO’s target award (“promotion award”). This grant is measured under the same guidelines as the December 30, 2018 grant of TSR Shares described above. The company’s former CEO forfeited
The following performance-contingent TSR Shares have been granted under the Omnibus Plan and have service period remaining (amounts in thousands, except price data):
|
Grant Date |
|
Shares Granted |
|
|
Vesting Date |
|
Fair Value per Share |
|
||
|
12/30/2018 |
|
|
|
|
|
|
|
$ |
|
|
|
5/23/2019 |
|
|
|
|
|
|
|
$ |
|
|
|
7/14/2019 |
|
|
|
|
|
|
|
$ |
|
|
|
10/6/2019 |
|
|
|
|
|
|
|
$ |
|
|
|
12/29/2019 |
|
|
|
|
|
|
|
$ |
|
|
|
4/19/2020 |
|
|
|
|
|
|
|
$ |
|
|
|
07/12/2020 |
|
|
|
|
|
|
|
$ |
|
|
|
10/4/2020 |
|
|
|
|
|
|
|
$ |
|
|
As of January 2, 2021, there was $
Performance-Contingent Return on Invested Capital Shares (“ROIC Shares”)
Since 2012, certain key employees have been granted performance-contingent restricted stock under the EPIP and the Omnibus Plan in the form of ROIC Shares. Awards granted prior to Fiscal 2019 vested approximately
|
|
• |
|
|
|
• |
ROIC above WACC by |
|
|
• |
ROIC above WACC by |
|
|
• |
ROIC above WACC by |
For performance between the levels described above, the degree of vesting is interpolated on a linear basis.
|
Award |
|
Fiscal year vested |
|
Payout (%) |
|
|
|
2016 award |
|
Fiscal 2018 |
|
|
|
|
|
2017 award |
|
Fiscal 2019 |
|
|
|
|
The ROIC Shares vest immediately if the grantee dies or becomes disabled. However, if the grantee retires at age 65 (or age 55 with at least 10 years of service with the company) or later, on the normal vesting date the grantee will receive a pro-rated number of shares based upon the retirement date and actual performance for the entire performance period. In addition, if the company undergoes a change in control, the ROIC Shares will immediately vest at the target level. During the vesting period, the grantee has none of the rights of a shareholder. Dividends declared during the vesting period will accrue and will be paid at vesting on the shares that ultimately vest. The fair value of this type of award is equal to the stock price on the grant date. Since these awards have a performance condition feature the expense associated with these awards may change depending on the expected ROI Target attained at each reporting period. The expected ROI Target for expense calculations at January 2, 2021 was
F-42
On May 23, 2019, the company’s CEO received a promotion award of ROIC Shares. This grant is measured under the same guidelines as the December 30, 2018 grant of ROIC Shares described above. The company’s former CEO forfeited
The following performance-contingent ROIC Shares have been granted under the Omnibus Plan and have service period remaining (amounts in thousands, except price data):
|
Grant Date |
|
Shares Granted |
|
|
Vesting Date |
|
Fair Value per Share |
|
||
|
12/30/2018 |
|
|
|
|
|
|
|
$ |
|
|
|
5/23/2019 |
|
|
|
|
|
|
|
$ |
|
|
|
7/14/2019 |
|
|
|
|
|
|
|
$ |
|
|
|
10/6/2019 |
|
|
|
|
|
|
|
$ |
|
|
|
12/29/2019 |
|
|
|
|
|
|
|
$ |
|
|
|
4/19/2020 |
|
|
|
|
|
|
|
$ |
|
|
|
07/12/2020 |
|
|
|
|
|
|
|
$ |
|
|
|
10/4/2020 |
|
|
|
|
|
|
|
$ |
|
|
As of January 2, 2021, there was $
Performance-Contingent Restricted Stock Summary
The table below presents the TSR Modifier share adjustment, ROIC Modifier share adjustment, accumulated dividends on vested shares, and the tax windfall/shortfall at vesting of the performance-contingent restricted stock awards (amounts in thousands except for share data):
|
Award granted |
|
Fiscal year vested |
|
TSR Modifier increase/(decrease) shares |
|
|
ROIC Modifier (decrease) shares |
|
|
Dividends at vesting (thousands) |
|
|
Tax benefit/(expense) |
|
|
Fair value at vesting |
|
|||||
|
2017 |
|
2019 |
|
|
|
|
|
|
( |
) |
|
$ |
|
|
|
$ |
|
|
|
$ |
|
|
|
2016 |
|
2018 |
|
|
( |
) |
|
|
( |
) |
|
$ |
|
|
|
$ |
( |
) |
|
$ |
|
|
A summary of the status of all of the company’s nonvested shares for performance-contingent restricted stock (including the TSR Shares and the ROIC Shares) for Fiscal 2020, 2019, and 2018 is set forth below (amounts in thousands, except price data):
|
|
|
Fiscal 2020 |
|
|
Fiscal 2019 |
|
|
Fiscal 2018 |
|
|||||||||||||||
|
|
|
Number of Shares |
|
|
Weighted Average Fair Value |
|
|
Number of Shares |
|
|
Weighted Average Fair Value |
|
|
Number of Shares |
|
|
Weighted Average Fair Value |
|
||||||
|
Balance at beginning of year |
|
|
|
|
|
$ |
|
|
|
|
|
|
|
$ |
|
|
|
|
|
|
|
$ |
|
|
|
Initial grant |
|
|
|
|
|
$ |
|
|
|
|
|
|
|
$ |
|
|
|
|
— |
|
|
$ |
— |
|
|
Vested |
|
|
— |
|
|
$ |
— |
|
|
|
( |
) |
|
$ |
|
|
|
|
( |
) |
|
$ |
|
|
|
Grant reduction for not achieving the ROIC modifier |
|
|
— |
|
|
$ |
— |
|
|
|
( |
) |
|
$ |
|
|
|
|
( |
) |
|
$ |
|
|
|
Grant increase (reduction) for not achieving the TSR modifier |
|
|
— |
|
|
$ |
— |
|
|
|
|
|
|
$ |
|
|
|
|
( |
) |
|
$ |
|
|
|
Forfeitures |
|
|
( |
) |
|
$ |
|
|
|
|
( |
) |
|
$ |
|
|
|
|
( |
) |
|
$ |
|
|
|
Balance at end of year |
|
|
|
|
|
$ |
|
|
|
|
|
|
|
$ |
|
|
|
|
|
|
|
$ |
|
|
As of January 2, 2021, there was $
Time-Based Restricted Stock Units
Certain key employees have been granted time-based restricted stock units (“TBRSU Shares”). These awards vest on the each year in equal installments over a period beginning in Fiscal 2020. Dividends earned on shares are held by the company during the vesting period and paid in cash when the awards vest and shares are distributed.
F-43
On May 23, 2019, the company’s CEO was granted TBRSU Shares of approximately $
The following TBRSU Shares have been granted under the Omnibus Plan and have service periods remaining (amounts in thousands, except price data):
|
Grant Date |
|
Shares Granted |
|
|
Vesting Date |
|
Fair Value per Share |
|
||
|
12/30/2018 |
|
|
|
|
|
Equally over 3 years |
|
$ |
|
|
|
5/23/2019 |
|
|
|
|
|
|
|
$ |
|
|
|
12/29/2019 |
|
|
|
|
|
Equally over 3 years |
|
$ |
|
|
The TBRSU Shares activity for Fiscal 2020 and Fiscal 2019 is set forth below (amounts in thousands, except price data):
|
|
|
Fiscal 2020 |
|
|
Fiscal 2019 |
|
||||||||||
|
|
|
Number of Shares |
|
|
Weighted Average Fair Value |
|
|
Number of Shares |
|
|
Weighted Average Fair Value |
|
||||
|
Nonvested shares at beginning of year |
|
|
|
|
|
$ |
|
|
|
|
— |
|
|
$ |
— |
|
|
Granted |
|
|
|
|
|
$ |
|
|
|
|
|
|
|
$ |
|
|
|
Vested |
|
|
( |
) |
|
$ |
|
|
|
|
|
|
|
|
|
|
|
Forfeitures |
|
|
( |
) |
|
$ |
|
|
|
|
( |
) |
|
$ |
|
|
|
Nonvested shares at end of year |
|
|
|
|
|
$ |
|
|
|
|
|
|
|
$ |
|
|
Deferred Stock
Non-employee directors may convert their annual board retainers into deferred stock equal in value to
Non-employee directors also receive annual grants of deferred stock. This deferred stock vests over
Compensation expense is recorded on deferred stock over the vesting period.
The deferred and restricted stock activity for Fiscal 2020, 2019, and 2018 is set forth below (amounts in thousands, except price data):
|
|
|
Fiscal 2020 |
|
|
Fiscal 2019 |
|
|
Fiscal 2018 |
|
|||||||||||||||
|
|
|
Number of Shares |
|
|
Weighted Average Fair Value |
|
|
Number of Shares |
|
|
Weighted Average Fair Value |
|
|
Number of Shares |
|
|
Weighted Average Fair Value |
|
||||||
|
Nonvested shares at beginning of year |
|
|
|
|
|
$ |
|
|
|
|
|
|
|
$ |
|
|
|
|
|
|
|
$ |
|
|
|
Granted |
|
|
|
|
|
$ |
|
|
|
|
|
|
|
$ |
|
|
|
|
|
|
|
$ |
|
|
|
Vested |
|
|
( |
) |
|
$ |
|
|
|
|
( |
) |
|
$ |
|
|
|
|
( |
) |
|
$ |
|
|
|
Nonvested shares at end of year |
|
|
|
|
|
$ |
|
|
|
|
|
|
|
$ |
|
|
|
|
|
|
|
$ |
|
|
|
Vested and deferred shares at end of year |
|
|
|
|
|
|
|
|
|
|
|
|
|
|
|
|
|
|
|
|
|
|
|
|
F-44
As of January 2, 2021, there was $
Share-Based Payments Compensation Expense Summary
The following table summarizes the company’s stock-based compensation expense, all of which was recognized in selling, distribution, and administration expense, for Fiscal 2020, 2019, and 2018 (amounts in thousands):
|
|
|
Fiscal 2020 |
|
|
Fiscal 2019 |
|
|
Fiscal 2018 |
|
|||
|
Performance-contingent restricted stock awards |
|
$ |
|
|
|
$ |
|
|
|
$ |
|
|
|
TBRSU shares |
|
|
|
|
|
|
|
|
|
|
— |
|
|
Deferred stock awards |
|
|
|
|
|
|
|
|
|
|
|
|
|
Total stock-based compensation expense |
|
$ |
|
|
|
$ |
|
|
|
$ |
|
|
|
Note 20. |
Earnings Per Share |
The following is a reconciliation of net income and weighted average shares for calculating basic and diluted earnings per common share for Fiscal 2020, 2019, and 2018 (amounts in thousands, except per share data):
|
|
|
Fiscal 2020 |
|
|
Fiscal 2019 |
|
|
Fiscal 2018 |
|
|||
|
Net income |
|
$ |
|
|
|
$ |
|
|
|
$ |
|
|
|
Basic Earnings Per Common Share: |
|
|
|
|
|
|
|
|
|
|
|
|
|
Basic weighted average shares outstanding per common share |
|
|
|
|
|
|
|
|
|
|
|
|
|
Basic earnings per common share |
|
$ |
|
|
|
$ |
|
|
|
$ |
|
|
|
Diluted Earnings Per Common Share: |
|
|
|
|
|
|
|
|
|
|
|
|
|
Basic weighted average shares outstanding per common share |
|
|
|
|
|
|
|
|
|
|
|
|
|
Add: Shares of common stock assumed issued upon exercise of stock options, vesting of performance-contingent restricted stock and deferred stock |
|
|
|
|
|
|
|
|
|
|
|
|
|
Diluted weighted average shares outstanding per common share |
|
|
|
|
|
|
|
|
|
|
|
|
|
Diluted earnings per common share |
|
$ |
|
|
|
$ |
|
|
|
$ |
|
|
There were
|
Note 21. |
Postretirement Plans |
The following summarizes the company’s balance sheet related pension and other postretirement benefit plan accounts at January 2, 2021 and December 28, 2019 (amounts in thousands):
|
|
|
January 2, 2021 |
|
|
December 28, 2019 |
|
||
|
Current benefit liability |
|
$ |
|
|
|
$ |
|
|
|
Noncurrent benefit liability |
|
$ |
|
|
|
$ |
|
|
|
AOCI, net of tax |
|
$ |
( |
) |
|
$ |
( |
) |
The company made a contribution of $
F-45
Pension Plans
The company has trusteed, noncontributory defined benefit pension plans covering certain current and former employees. Benefits under the company’s largest pension plan were fully terminated and transferred to an insurance company in the form of a nonparticipating group annuity contract during the first quarter of Fiscal 2020.
The company recognizes settlement accounting charges, which accelerates recognition of a plan’s unrecognized net gain or loss, when the ongoing lump sum payments from the plan exceed the sum of the plan’s service cost and interest cost. During the first quarter of Fiscal 2018, the company determined it was probable a settlement would occur and paid lump sums that exceeded that threshold and, as a result, the company recorded settlement charges in each quarter of Fiscal 2018. There were
The company uses a calendar year end for the measurement date since the plans are based on a calendar year and because it approximates the company’s Fiscal year end. As of December 31, 2020 and December 31, 2019, the assets of the qualified plans included certificates of deposit, marketable equity securities, mutual funds, corporate and government debt securities, other diversifying strategies and annuity contracts. The company expects pension cost of approximately $
The net periodic pension cost (income) for the company’s pension plans includes the following components for Fiscal 2020, 2019, and 2018 (amounts in thousands):
|
|
|
Fiscal 2020 |
|
|
Fiscal 2019 |
|
|
Fiscal 2018 |
|
|||
|
Service cost |
|
$ |
|
|
|
$ |
|
|
|
$ |
|
|
|
Interest cost |
|
|
|
|
|
|
|
|
|
|
|
|
|
Expected return on plan assets |
|
|
( |
) |
|
|
( |
) |
|
|
( |
) |
|
Settlement loss |
|
|
|
|
|
|
— |
|
|
|
|
|
|
Curtailment loss |
|
|
|
|
|
|
— |
|
|
|
— |
|
|
Amortization: |
|
|
|
|
|
|
|
|
|
|
|
|
|
Prior service cost |
|
|
|
|
|
|
|
|
|
|
|
|
|
Actuarial loss |
|
|
|
|
|
|
|
|
|
|
|
|
|
Net periodic pension cost (income) |
|
|
|
|
|
|
|
|
|
|
|
|
|
Other changes in plan assets and benefit obligations recognized in OCI: |
|
|
|
|
|
|
|
|
|
|
|
|
|
Current year actuarial (gain) loss |
|
|
( |
) |
|
|
|
|
|
|
|
|
|
Settlement loss |
|
|
( |
) |
|
|
— |
|
|
|
( |
) |
|
Curtailment loss |
|
|
( |
) |
|
|
— |
|
|
|
— |
|
|
Amortization of prior service cost |
|
|
( |
) |
|
|
( |
) |
|
|
( |
) |
|
Amortization of actuarial loss |
|
|
( |
) |
|
|
( |
) |
|
|
( |
) |
|
Total recognized in OCI |
|
|
( |
) |
|
|
|
|
|
|
|
|
|
Total recognized in net periodic (benefit) cost and OCI |
|
$ |
( |
) |
|
$ |
|
|
|
$ |
|
|
Actual return on plan assets for Fiscal 2020, 2019, and 2018 was $
F-46
|
|
|
January 2, 2021 |
|
|
December 28, 2019 |
|
||
|
Change in benefit obligation: |
|
|
|
|
|
|
|
|
|
Benefit obligation at beginning of year |
|
$ |
|
|
|
$ |
|
|
|
Service cost |
|
|
|
|
|
|
|
|
|
Interest cost |
|
|
|
|
|
|
|
|
|
Actuarial loss (gain) |
|
|
( |
) |
|
|
|
|
|
Benefits paid |
|
|
( |
) |
|
|
( |
) |
|
Settlements |
|
|
( |
) |
|
|
— |
|
|
Benefit obligation at end of year |
|
$ |
|
|
|
$ |
|
|
|
Change in plan assets: |
|
|
|
|
|
|
|
|
|
Fair value of plan assets at beginning of year |
|
$ |
|
|
|
$ |
|
|
|
Actual return on plan assets |
|
|
|
|
|
|
|
|
|
Employer contribution |
|
|
|
|
|
|
|
|
|
Benefits paid |
|
|
( |
) |
|
|
( |
) |
|
Transfer payments |
|
|
( |
) |
|
|
— |
|
|
Settlements |
|
|
( |
) |
|
|
— |
|
|
Fair value of plan assets at end of year |
|
$ |
|
|
|
$ |
|
|
|
Funded status, end of year: |
|
|
|
|
|
|
|
|
|
Fair value of plan assets |
|
$ |
34,750 |
|
|
$ |
360,675 |
|
|
Benefit obligations |
|
|
(37,650 |
) |
|
|
(396,906 |
) |
|
Unfunded status and amount recognized at end of year |
|
$ |
( |
) |
|
$ |
( |
) |
|
Amounts recognized in the balance sheet: |
|
|
|
|
|
|
|
|
|
Current liability |
|
|
( |
) |
|
|
( |
) |
|
Noncurrent liability |
|
|
( |
) |
|
|
( |
) |
|
Amount recognized at end of year |
|
$ |
( |
) |
|
$ |
( |
) |
|
Amounts recognized in AOCI: |
|
|
|
|
|
|
|
|
|
Net actuarial loss before taxes |
|
$ |
|
|
|
$ |
|
|
|
Prior service cost before taxes |
|
|
|
|
|
|
|
|
|
Amount recognized at end of year |
|
$ |
|
|
|
$ |
|
|
|
|
|
|
|
|
|
|
|
|
|
Accumulated benefit obligation at end of year |
|
$ |
|
|
|
$ |
|
|
The actuarial gain/(loss) on defined benefit obligations of the employer due to experience, including any assumption changes, different from assumed, and the reasons for such (gain)/loss, can be found in the table below for Fiscal 2020 and 2019 (amounts in thousands).
|
|
|
Amount of (Gain)/Loss on Defined Benefit Obligation |
|
|
Reasons for (Gain)/Loss |
|
|
Fiscal 2020 (1) |
|
$ |
|
|
|
|
|
Fiscal 2019 |
|
$ |
|
|
|
Loss from decrease in general level of interest rates used to measure defined benefit plan obligations (approximately |
|
(1) |
|
F-47
Assumptions used in accounting for the company’s pension plans at each of the respective fiscal years ending are as follows:
|
|
|
Fiscal 2020 |
|
|
Fiscal 2019 |
|
|
Fiscal 2018 |
|
|||
|
Weighted average assumptions used to determine benefit obligations: |
|
|
|
|
|
|
|
|
|
|
|
|
|
Measurement date |
|
|
|
|
|
|
|
|
|
|||
|
Discount rate |
|
|
|
% |
|
|
|
% |
|
|
|
% |
|
Rate of compensation increase |
|
|
|
% |
|
|
|
% |
|
|
|
% |
|
Weighted average assumptions used to determine net periodic benefit cost/(income): |
|
|
|
|
|
|
|
|
|
|
|
|
|
Measurement date |
|
|
|
|
|
|
|
|
|
|||
|
Discount rate |
|
|
|
% |
|
|
|
% |
|
|
|
% |
|
Expected return on plan assets |
|
|
|
% |
|
|
|
% |
|
|
|
% |
|
Rate of compensation increase |
|
|
|
% |
|
|
|
% |
|
|
|
% |
In developing the expected long-term rate of return on plan assets at each measurement date, the company considers the plan assets’ historical actual returns, targeted asset allocations, and the anticipated future economic environment and long-term performance of individual asset classes, based on the company’s investment strategy. While appropriate consideration is given to recent and historical investment performance, the assumption represents management’s best estimate of the long-term prospective return. Further, pension costs do not include an explicit expense assumption, and therefore the return on assets rate reflects the long-term expected return, net of expenses.
Based on these factors the expected long-term rate of return assumption for Plan No. 2 was set at
Plan Assets
The investment committee, which consists of certain members of management, establishes investment guidelines and strategies and regularly monitors the performance of the plans’ assets. The investment committee is responsible for executing these strategies and investing the pension assets in accordance with ERISA and fiduciary standards. The investment objective of the pension plans is to preserve the plans’ capital and maximize investment earnings within acceptable levels of risk and volatility. The investment committee meets on a regular basis with its investment advisors to review the performance of the plans’ assets. Based upon performance and other measures and recommendations from its investment advisors, the investment committee rebalances the plans’ assets to the targeted allocation when considered appropriate.
|
|
|
Fair value of Pension Plan Assets as of December 31, 2020 |
|
|||||||||||||
|
Asset Class |
|
Quoted prices in active markets for identical assets (Level 1) |
|
|
Significant Observable Inputs (Level 2) |
|
|
Significant Unobservable Inputs (Level 3) |
|
|
Total |
|
||||
|
Short term investments and cash |
|
$ |
|
|
|
$ |
— |
|
|
$ |
— |
|
|
$ |
|
|
|
Common stocks: |
|
|
|
|
|
|
|
|
|
|
|
|
|
|
|
|
|
International common stocks |
|
|
|
|
|
|
— |
|
|
|
— |
|
|
|
|
|
|
U.S. common stocks |
|
|
|
|
|
|
— |
|
|
|
— |
|
|
|
|
|
|
Fixed income securities: |
|
|
|
|
|
|
|
|
|
|
|
|
|
|
|
|
|
U.S. government bonds |
|
|
|
|
|
|
— |
|
|
|
— |
|
|
|
|
|
|
U.S. government agency bonds |
|
|
— |
|
|
|
— |
|
|
|
— |
|
|
|
— |
|
|
U.S. corporate bonds |
|
|
|
|
|
|
— |
|
|
|
— |
|
|
|
|
|
|
Pending transactions(*) |
|
|
— |
|
|
|
— |
|
|
|
— |
|
|
|
( |
) |
|
Accrued (expenses) income(*) |
|
|
— |
|
|
|
— |
|
|
|
— |
|
|
|
( |
) |
|
Total |
|
$ |
|
|
|
$ |
— |
|
|
$ |
— |
|
|
$ |
|
|
F-48
|
|
|
Fair value of Pension Plan Assets as of December 31, 2019 |
|
|||||||||||||
|
Asset Class |
|
Quoted prices in active markets for identical assets (Level 1) |
|
|
Significant Observable Inputs (Level 2) |
|
|
Significant Unobservable Inputs (Level 3) |
|
|
Total |
|
||||
|
Short term investments and cash |
|
$ |
|
|
|
$ |
|
|
|
$ |
— |
|
|
$ |
|
|
|
Common stocks: |
|
|
|
|
|
|
|
|
|
|
|
|
|
|
|
|
|
International common stocks |
|
|
|
|
|
|
— |
|
|
|
— |
|
|
|
|
|
|
U.S. common stocks |
|
|
|
|
|
|
— |
|
|
|
— |
|
|
|
|
|
|
Fixed income securities: |
|
|
|
|
|
|
|
|
|
|
|
|
|
|
|
|
|
U.S. government bonds |
|
|
|
|
|
|
— |
|
|
|
— |
|
|
|
|
|
|
U.S. government agency bonds |
|
|
— |
|
|
|
|
|
|
|
— |
|
|
|
|
|
|
U.S. corporate bonds |
|
|
— |
|
|
|
|
|
|
|
— |
|
|
|
|
|
|
International corporate bonds |
|
|
— |
|
|
|
|
|
|
|
— |
|
|
|
|
|
|
Pending transactions(*) |
|
|
— |
|
|
|
— |
|
|
|
— |
|
|
|
( |
) |
|
Other assets and (liabilities)(*) |
|
|
— |
|
|
|
— |
|
|
|
— |
|
|
|
( |
) |
|
Accrued (expenses) income(*) |
|
|
— |
|
|
|
— |
|
|
|
— |
|
|
|
|
|
|
Total |
|
$ |
|
|
|
$ |
|
|
|
$ |
— |
|
|
$ |
|
|
|
(*) |
|
The company’s investment policy includes various guidelines and procedures designed to ensure the plan’s assets are invested in a manner necessary to meet expected future benefits earned by participants. The investment guidelines consider a broad range of economic conditions.
The plan asset allocation as of the measurement dates December 31, 2020 and December 31, 2019, and target asset allocations for Fiscal 2021 are as follows for Plan No. 2:
|
|
|
Target Allocation |
|
Percentage of Plan Assets at the Measurement Date (As percent) |
|
|||||
|
Asset Category |
|
2021 |
|
2020 |
|
|
2019 |
|
||
|
Equity securities |
|
|
|
|
|
|
|
|
|
|
|
Fixed income securities |
|
|
|
|
|
|
|
|
|
|
|
Short term investments and cash |
|
|
|
|
|
|
|
|
|
|
|
Total |
|
|
|
|
|
|
|
|
|
|
The objectives of the target allocations are to maintain investment portfolios that diversify risk through prudent asset allocation parameters, achieve asset returns that meet or exceed the plans’ actuarial assumptions, and achieve asset returns that are competitive with like institutions employing similar investment strategies.
Cash Flows
Company contributions to qualified and nonqualified plans are as follows (amounts in thousands):
|
Year |
|
Required |
|
|
Discretionary |
|
|
Total |
|
|||
|
2020 |
|
$ |
|
|
|
$ |
|
|
|
$ |
|
|
|
2019 |
|
$ |
|
|
|
$ |
|
|
|
$ |
|
|
|
2018 |
|
$ |
|
|
|
$ |
|
|
|
$ |
|
|
All contributions are made in cash. The required contributions made during Fiscal 2020 include $
F-49
Benefit Payments
The following are benefits paid under the plans (including settlements) during Fiscal 2020, 2019, and 2018 and expected to be paid from Fiscal 2021 through Fiscal 2030. Estimated future payments include qualified pension benefits that will be paid from the plans’ assets and nonqualified pension benefits that will be paid from corporate assets (amounts in thousands):
|
Year |
|
Pension Benefits |
|
|
|
|
2018 |
|
$ |
|
|
* |
|
2019 |
|
$ |
|
|
^ |
|
2020 |
|
$ |
|
|
+ |
|
Estimated Future Payments: |
|
|
|
|
|
|
2021 |
|
$ |
|
|
|
|
2022 |
|
$ |
|
|
|
|
2023 |
|
$ |
|
|
|
|
2024 |
|
$ |
|
|
|
|
2025 |
|
$ |
|
|
|
|
2025 – 2030 |
|
$ |
|
|
|
|
* |
|
|
^ |
|
|
+ |
|
Postretirement Benefit Plans
The company sponsors postretirement benefit plans that provide health care and life insurance benefits to retirees who meet certain eligibility requirements. Generally, this includes employees with at least
The company delivers retiree medical and dental benefits for Medicare eligible retirees through a health-care reimbursement account. The company no longer sponsors a medical plan for Medicare eligible retirees and does not file for a Medicare Part D subsidy.
The net periodic benefit (income) cost for the company’s postretirement benefit plans includes the following components for Fiscal 2020, 2019, and 2018 (amounts in thousands):
|
|
|
Fiscal 2020 |
|
|
Fiscal 2019 |
|
|
Fiscal 2018 |
|
|||
|
Service cost |
|
$ |
|
|
|
$ |
|
|
|
$ |
|
|
|
Interest cost |
|
|
|
|
|
|
|
|
|
|
|
|
|
Amortization: |
|
|
|
|
|
|
|
|
|
|
|
|
|
Prior service credit |
|
|
( |
) |
|
|
( |
) |
|
|
( |
) |
|
Actuarial gain |
|
|
( |
) |
|
|
( |
) |
|
|
( |
) |
|
Total net periodic benefit cost (income) |
|
|
|
|
|
|
|
|
|
|
( |
) |
|
Other changes in plan assets and benefit obligations recognized in OCI: |
|
|
|
|
|
|
|
|
|
|
|
|
|
Current year actuarial loss (gain) |
|
|
|
|
|
|
( |
) |
|
|
|
|
|
Amortization of actuarial gain |
|
|
|
|
|
|
|
|
|
|
|
|
|
Amortization of prior service credit |
|
|
|
|
|
|
|
|
|
|
|
|
|
Total recognized in OCI |
|
|
|
|
|
|
( |
) |
|
|
|
|
|
Total recognized in net periodic benefit cost and OCI |
|
$ |
|
|
|
$ |
|
|
|
$ |
|
|
F-50
The unfunded status and the amounts recognized in the Consolidated Balance Sheets for the company’s postretirement benefit plans are as follows (amounts in thousands):
|
|
|
January 2, 2021 |
|
|
December 28, 2019 |
|
||
|
Change in benefit obligation: |
|
|
|
|
|
|
|
|
|
Benefit obligation at beginning of year |
|
$ |
|
|
|
$ |
|
|
|
Service cost |
|
|
|
|
|
|
|
|
|
Interest cost |
|
|
|
|
|
|
|
|
|
Participant contributions |
|
|
|
|
|
|
|
|
|
Actuarial loss (gain) |
|
|
|
|
|
|
( |
) |
|
Benefits paid |
|
|
( |
) |
|
|
( |
) |
|
Benefit obligation at end of year |
|
$ |
|
|
|
$ |
|
|
|
Change in plan assets: |
|
|
|
|
|
|
|
|
|
Fair value of plan assets at beginning of year |
|
$ |
— |
|
|
$ |
— |
|
|
Employer contributions |
|
|
|
|
|
|
|
|
|
Participant contributions |
|
|
|
|
|
|
|
|
|
Benefits paid |
|
|
( |
) |
|
|
( |
) |
|
Fair value of plan assets at end of year |
|
$ |
— |
|
|
$ |
— |
|
|
Funded status, end of year: |
|
|
|
|
|
|
|
|
|
Fair value of plan assets |
|
$ |
— |
|
|
$ |
— |
|
|
Benefit obligations |
|
|
(8,023 |
) |
|
|
(7,477 |
) |
|
Unfunded status and amount recognized at end of year |
|
$ |
( |
) |
|
$ |
( |
) |
|
Amounts recognized in the balance sheet: |
|
|
|
|
|
|
|
|
|
Current liability |
|
$ |
( |
) |
|
$ |
( |
) |
|
Noncurrent liability |
|
|
( |
) |
|
|
( |
) |
|
Amount recognized at end of year |
|
$ |
( |
) |
|
$ |
( |
) |
|
Amounts recognized in AOCI: |
|
|
|
|
|
|
|
|
|
Net actuarial gain before taxes |
|
$ |
( |
) |
|
$ |
( |
) |
|
Prior service credit before taxes |
|
|
( |
) |
|
|
( |
) |
|
Amounts recognized in AOCI |
|
$ |
( |
) |
|
$ |
( |
) |
Assumptions used in accounting for the company’s postretirement benefit plans at each of the respective fiscal years ending are as follows:
|
|
|
Fiscal 2020 |
|
|
Fiscal 2019 |
|
|
Fiscal 2018 |
|
|||
|
Weighted average assumptions used to determine benefit obligations: |
|
|
|
|
|
|
|
|
|
|
|
|
|
Measurement date |
|
|
|
|
|
|
|
|
|
|||
|
Discount rate |
|
|
|
% |
|
|
|
% |
|
|
|
% |
|
Health care cost trend rate used to determine benefit obligations: |
|
|
|
|
|
|
|
|
|
|
|
|
|
Initial rate |
|
|
|
% |
|
|
|
% |
|
|
|
% |
|
Ultimate rate |
|
|
|
% |
|
|
|
% |
|
|
|
% |
|
Year trend reaches the ultimate rate |
|
|
|
|
|
|
|
|
|
|||
|
Weighted average assumptions used to determine net periodic cost: |
|
|
|
|
|
|
|
|
|
|
|
|
|
Measurement date |
|
|
|
|
|
|
|
|
|
|||
|
Discount rate |
|
|
|
% |
|
|
|
% |
|
|
|
% |
|
Health care cost trend rate used to determine net periodic cost: |
|
|
|
|
|
|
|
|
|
|
|
|
|
Initial rate |
|
|
|
% |
|
|
|
% |
|
|
|
% |
|
Ultimate rate |
|
|
|
% |
|
|
|
% |
|
|
|
% |
|
Year trend reaches the ultimate rate |
|
|
|
|
|
|
|
|
|
|||
F-51
Cash Flows
Company contributions to postretirement plans are as follows (amounts in thousands):
|
Year |
|
Employer Net Contribution |
|
|
|
2018 |
|
$ |
|
|
|
2019 |
|
$ |
|
|
|
2020 |
|
$ |
|
|
|
2021 (Expected) |
|
$ |
|
|
The table above reflects only the company’s share of the benefit cost. Since the company no longer receives reimbursement for Medicare Part D subsidies, the entire $
Benefit Payments
The following are benefits paid by the company during Fiscal 2020, 2019, and 2018 and expected to be paid from Fiscal 2021 through Fiscal 2030. All benefits are expected to be paid from the company’s assets (amounts in thousands):
|
|
|
Postretirement benefits |
|
|
|
Year |
|
Employer gross contribution |
|
|
|
2018 |
|
$ |
|
|
|
2019 |
|
$ |
|
|
|
2020 |
|
$ |
|
|
|
Estimated Future Payments: |
|
|
|
|
|
2021 |
|
$ |
|
|
|
2022 |
|
$ |
|
|
|
2023 |
|
$ |
|
|
|
2024 |
|
$ |
|
|
|
2025 |
|
$ |
|
|
|
2026 – 2030 |
|
$ |
|
|
Multiemployer Plans
The company contributes to various multiemployer pension plans. Benefits provided under the multiemployer pension plans are generally based on years of service and employee age. Expense under these plans was $
The company contributes to several multiemployer defined benefit pension plans under the terms of collective-bargaining agreements that cover various union-represented employees. The risks of participating in these multiemployer plans are different from single-employer plans. Assets contributed to the multiemployer plan by one employer may be used to provide benefits to employees of other participating employers. If a participating employer stops contributing to the plan, the unfunded obligations of the plan may be borne by the remaining participating employers. If we choose to stop participating in some of these multiemployer plans, we may be required to pay those plans an amount based on the underfunded status of the plan, referred to as a withdrawal liability. None of the contributions to the pension funds was in excess of
On August 18, 2017, the union participants of the Bakery and Confectionary Union and Industry International Pension Fund (the “MEPP Fund”) at our Lakeland, Florida plant voted to withdraw from the MEPP Fund in the most recent collective bargaining agreement. The withdrawal was effective, and the union participants were eligible to participate in the 401(k) plan, on November 1, 2017. During the third quarter of Fiscal 2017, the company recorded a liability of $
F-52
withdrawal liability may be incurred in the event of a mass withdrawal, as defined by statute following our complete withdrawal. Transition payments, including related tax payments, were made on
The company’s participation in these multiemployer plans for Fiscal 2020 is outlined in the table below. The EIN/Pension Plan Number column provides the Employer Identification Number (“EIN”) and the three-digit plan number, if applicable. Unless otherwise noted, the most recent PPA zone status available in 2020 and 2019 is for the plan’s year-end at December 31, 2020 and December 31, 2019, respectively. The zone status is based on information that the company received from the plan and is certified by the plan’s actuary. Among other factors, plans in the red zone are generally less than 65 percent funded, plans in the yellow zone are less than 80 percent funded, and plans in the green zone are at least 80 percent funded. The FIP/RP Status Pending/Implemented column indicates plans for which a financial improvement plan (“FIP”) or a rehabilitation plan (“RP”) is either pending or has been implemented. The last column lists the expiration date(s) of the collective-bargaining agreements to which the plans are subject. Finally, there have been no significant changes that affect the comparability of contributions.
In December 2014, the Consolidated and Further Continuing Appropriations Act of 2015 (the “2015 Appropriations Act”) was signed into law and materially amended the PPA funding rules. In general, the PPA funding rules were made more flexible in order to make more manageable the steps necessary for multi-employer plans to become or remain economically viable in the future. While in previous years we have been informed that several of the multi-employer pension plans to which our subsidiaries contribute have been labeled with a “critical” or “endangered” status as defined by the PPA, the changes made by the 2015 Appropriations Act will materially impact, on a going forward basis, these prior funding status assessments. In any event, it is unclear at this time what impact, if any, the 2015 Appropriations Act will have on our future obligations to the multi-employer pension plans in which we participate.
|
|
|
|
|
|
|
|
|
Pension Protection Act |
|
|
|
Contributions (Amounts in |
|
|
|
|
|
|||||||||||
|
|
|
|
|
|
|
|
|
Zone Status |
|
|
|
thousands) |
|
|
|
|
Expiration Date of |
|||||||||||
|
|
|
|
|
Pension |
|
|
|
|
|
|
FIP/RP Status |
|
2020 |
|
|
2019 |
|
|
2018 |
|
|
Surcharge |
|
Collective Bargaining |
||||
|
Pension Fund |
|
EIN |
|
Plan No. |
|
|
2020 |
|
2019 |
|
Pending/Implemented |
|
($) |
|
|
($) |
|
|
($) |
|
|
Imposed |
|
Agreement |
||||
|
IAM National Pension Fund |
|
|
|
|
|
|
|
|
|
|
|
|
|
|
|
|
|
|
|
|
|
|
|
|
|
|
|
|
|
Retail, Wholesale and Department Store International Union and Industry Pension Fund |
|
|
|
|
|
|
|
|
|
|
|
|
|
|
|
|
|
|
|
|
|
|
|
|
|
|
|
|
|
Western Conference of Teamsters Pension Trust |
|
|
|
|
|
|
|
|
|
|
|
|
|
|
|
|
|
|
|
|
|
|
|
|
|
|
|
|
|
BC&T International Pension Fund* |
|
|
|
|
|
|
|
* |
|
* |
|
* |
|
|
— |
|
|
|
— |
|
|
|
|
|
|
* |
|
* |
|
* |
|
401(k) Retirement Savings Plans
The Flowers Foods 401(k) Retirement Savings Plan covers substantially all of the company’s employees who have completed certain service requirements.
|
Contributions by fiscal year |
|
Defined contribution plans expense |
|
|
|
Fiscal 2020 |
|
$ |
|
|
|
Fiscal 2019 |
|
$ |
|
|
|
Fiscal 2018 |
|
$ |
|
|
|
Note 22. |
Income Taxes |
In conjunction with federal tax reform enacted on December 22, 2017, the SEC provided guidance which allowed subsequent income tax adjustments during and up to a one-year measurement period, with the requirement that the accounting be completed in a period not to exceed one year from the date of enactment. Fiscal 2018 income tax expense includes a tax benefit of $
F-53
The company’s provision for income tax expense (benefit) consists of the following for Fiscal 2020, 2019, and 2018 (amounts in thousands):
|
|
|
Fiscal 2020 |
|
|
Fiscal 2019 |
|
|
Fiscal 2018 |
|
|||
|
Current Taxes: |
|
|
|
|
|
|
|
|
|
|
|
|
|
Federal |
|
$ |
|
|
|
$ |
|
|
|
$ |
|
|
|
State |
|
|
|
|
|
|
|
|
|
|
|
|
|
|
|
|
|
|
|
|
|
|
|
|
|
|
|
Deferred Taxes: |
|
|
|
|
|
|
|
|
|
|
|
|
|
Federal |
|
|
( |
) |
|
|
|
|
|
|
|
|
|
State |
|
|
( |
) |
|
|
|
|
|
|
( |
) |
|
|
|
|
( |
) |
|
|
|
|
|
|
|
|
|
Income tax expense |
|
$ |
|
|
|
$ |
|
|
|
$ |
|
|
|
|
|
Fiscal 2020 |
|
|
Fiscal 2019 |
|
|
Fiscal 2018 |
|
|||
|
Tax at U.S. federal income tax rate |
|
$ |
|
|
|
$ |
|
|
|
$ |
|
|
|
State income taxes, net of federal income tax benefit |
|
|
|
|
|
|
|
|
|
|
|
|
|
Tax reform impact |
|
|
— |
|
|
|
— |
|
|
|
( |
) |
|
Net share-based payments (windfalls) shortfalls |
|
|
( |
) |
|
|
( |
) |
|
|
|
|
|
Other |
|
|
( |
) |
|
|
( |
) |
|
|
( |
) |
|
Income tax expense (benefit) |
|
$ |
|
|
|
$ |
|
|
|
$ |
|
|
In Fiscal 2020 and 2019, the most significant difference in the effective rate and the statutory rate was state income taxes. In 2018, the most significant differences in the effective rate and the statutory rate were state income taxes and benefits to adjust the estimated provisional benefit recorded in Fiscal 2017 for tax rate changes enacted in December 2017.
|
|
|
January 2, 2021 |
|
|
December 28, 2019 |
|
||
|
Self-insurance |
|
$ |
|
|
|
$ |
|
|
|
Compensation and employee benefits |
|
|
|
|
|
|
|
|
|
Deferred income |
|
|
|
|
|
|
|
|
|
Loss and credit carryforwards |
|
|
|
|
|
|
|
|
|
Equity-based compensation |
|
|
|
|
|
|
|
|
|
Legal accrual |
|
|
|
|
|
|
|
|
|
Deferred payroll tax under CARES act |
|
|
|
|
|
|
— |
|
|
Pension and postretirement benefits |
|
|
|
|
|
|
|
|
|
Financing and operating lease right-of-use liabilities |
|
|
|
|
|
|
|
|
|
Other |
|
|
|
|
|
|
|
|
|
Valuation allowance |
|
|
( |
) |
|
|
( |
) |
|
Deferred tax assets |
|
|
|
|
|
|
|
|
|
Depreciation |
|
|
( |
) |
|
|
( |
) |
|
Intangibles |
|
|
( |
) |
|
|
( |
) |
|
Financing and operating lease right-of-use assets |
|
|
( |
) |
|
|
( |
) |
|
Hedging |
|
|
( |
) |
|
|
( |
) |
|
Other |
|
|
( |
) |
|
|
( |
) |
|
Deferred tax liabilities |
|
|
( |
) |
|
|
( |
) |
|
Net deferred tax liability |
|
$ |
( |
) |
|
$ |
( |
) |
F-54
The company has a deferred tax asset of $
There are
The company accrues interest expense and penalties related to income tax liabilities as a component of income before taxes. No accrual of penalties is reflected on the company’s balance sheet as the company believes the accrual of penalties is not necessary based upon the merits of its income tax positions. The company had
The company defines the federal jurisdiction as well as various state jurisdictions as “major” jurisdictions. The company is no longer subject to federal examinations for years prior to 2017, and with limited exceptions, for years prior to 2016 in state jurisdictions.
The following is a reconciliation of the total amounts of unrecognized tax benefits for Fiscal 2020, 2019, and 2018 (amounts in thousands):
|
|
|
Fiscal 2020 |
|
|
Fiscal 2019 |
|
|
Fiscal 2018 |
|
|||
|
Unrecognized tax benefit at beginning of fiscal year |
|
$ |
|
|
|
$ |
|
|
|
$ |
|
|
|
Lapses of statutes of limitations |
|
|
( |
) |
|
|
( |
) |
|
|
( |
) |
|
Unrecognized tax benefit at end of fiscal year |
|
$ |
— |
|
|
$ |
|
|
|
$ |
|
|
At this time, we do not anticipate significant changes to the amount of gross unrecognized tax benefits over the next twelve months.
|
Note 23. |
Commitments and Contingencies |
Self-insurance reserves and other commitments and contingencies
The company has recorded current liabilities of $
In the event the company ceases to utilize the independent distributor model or exits a geographic market, the company is contractually required in some situations to purchase the distribution rights from the independent distributor. The company expects to continue operating under this model and has concluded that the possibility of a loss is remote.
The company’s facilities are subject to various federal, state and local laws and regulations regarding the discharge of material into the environment and the protection of the environment in other ways. The company is not a party to any material proceedings arising under these regulations. The company believes that compliance with existing environmental laws and regulations will not materially affect the consolidated financial condition, results of operations, cash flows or the competitive position of the company. The company believes it is currently in substantial compliance with all material environmental regulations affecting the company and its properties. In August 2016, the U.S. Department of Labor (the “Department”) notified the company that it was scheduled for a compliance review under the Fair Labor Standards Act. On November 5, 2018, the company was advised by the Department that the compliance review has been closed.
F-55
Litigation
The company and its subsidiaries from time to time are parties to, or targets of, lawsuits, claims, investigations and proceedings, including personal injury, commercial, contract, environmental, antitrust, product liability, health and safety and employment matters, which are being handled and defended in the ordinary course of business. While the company is unable to predict the outcome of these matters, it believes, based upon currently available facts, that it is remote that the ultimate resolution of any such pending matters will have a material adverse effect on its overall financial condition, results of operations or cash flows in the future. However, adverse developments could negatively impact earnings in a particular future fiscal period.
At this time, the company is defending
|
Case Name |
|
Case No. |
|
Venue |
|
Date Filed |
|
Status |
|
Noll v. Flowers Foods, Inc., Lepage Bakeries Park Street, LLC, and CK Sales Co., LLC |
|
1:15-cv-00493 |
|
U.S. District Court District of Maine |
|
|
|
On January 15, 2019, the Court denied defendants’ motion to decertify the FLSA class and granted Plaintiff’s motion to certify under Federal Rule of Civil Procedure 23 a state law class of distributors who operated in the state of Maine. On August 3, 2020, the Court reconsidered its January 15, 2019 order and decertified the FLSA collective action. |
|
Richard et al. v. Flowers Foods, Inc., Flowers Baking Co. of Lafayette, LLC, Flowers Baking Co. of Baton Rouge, LLC, Flowers Baking Co. of Tyler, LLC and Flowers Baking Co. of New Orleans, LLC |
|
6:15-cv-02557 |
|
U.S. District Court Western District of Louisiana |
|
|
|
|
|
Medrano v. Flowers Foods, Inc. and Flowers Baking Co. of El Paso, LLC |
|
1:16-cv-00350 |
|
U.S. District Court District of New Mexico |
|
|
|
|
|
Martins v. Flowers Foods, Inc., Flowers Baking Co. of Bradenton, LLC and Flowers Baking Co. of Villa Rica, LLC |
|
8:16-cv-03145 |
|
U.S. District Court Middle District of Florida |
|
|
|
|
|
Caddick et al. v. Tasty Baking Co. |
|
2:19-cv-02106 |
|
U.S. District Court Eastern District of Pennsylvania |
|
|
|
On October 9, 2020, and later amended on December 1, 2020, the parties reached an agreement in principal to settle this matter and a companion case pending in the U.S. District Court for the District of New Jersey (Bertino v. Tasty Baking Co., No. 1:20-cv-03752) for a payment of $ |
|
|
|
|
|
|
|
|
|
|
|
|
|
|
|
|
|
|
|
|
The company and/or its respective subsidiaries contests the allegations and are vigorously defending all of these lawsuits. Given the stage of the complaints and the claims and issues presented, except for lawsuits disclosed herein that have reached a settlement or
F-56
agreement in principle, the company cannot reasonably estimate at this time the possible loss or range of loss that may arise from the unresolved lawsuits.
During the last three fiscal years, the company has settled, and the appropriate court has approved, the following collective and/or class action lawsuits filed by distributors alleging that such distributors were misclassified as independent contractors. In each of these settlements, in addition to the monetary terms noted below, the settlements also included certain non-economic terms intended to strengthen and enhance the independent contractor model:
|
Case Name |
|
Case No. |
|
Venue |
|
Date Filed |
|
Comments |
|
|
Rosinbaum et al. v. Flowers Foods, Inc. and Franklin Baking Co., LLC |
|
7:16-cv-00233 |
|
U.S. District Court Eastern District of North Carolina |
|
|
|
On December 29, 2020, the Court dismissed this lawsuit and approved an agreement to settle this matter for $ |
|
|
Carr et al. v. Flowers Foods, Inc. and Flowers Baking Co. of Oxford, Inc. |
|
2:15-cv-06391 |
|
U.S. District Court Eastern District of Pennsylvania |
|
|
|
On September 29, 2020, the Court dismissed this lawsuit and approved an agreement to settle this matter and the Boulange matter (see below) for a payment of $ |
|
|
Boulange v. Flowers Foods, Inc. and Flowers Baking Co. of Oxford, Inc. |
|
2:16-cv-02581 |
|
U.S. District Court Eastern District of Pennsylvania |
|
|
|
This matter was consolidated with the Carr litigation described immediately above. |
|
|
Neff et al. v. Flowers Foods, Inc., Lepage Bakeries Park Street, LLC, and CK Sales Co., LLC |
|
5:15-cv-00254 |
|
U.S. District Court District of Vermont |
|
|
|
On November 13, 2020, the court dismissed this lawsuit following a October 22, 2020 order approving an agreement to settle this matter for a payment of $ |
F-57
|
Coyle v. Flowers Foods, Inc. and Holsum Bakery, Inc. |
|
2:15-cv-01372 |
|
U.S. District Court District of Arizona |
|
|
|
On March 23, 2018, the court dismissed this lawsuit and approved an agreement to settle this matter for $ |
|
McCurley v. Flowers Foods, Inc. and Derst Baking Co., LLC |
|
5:16-cv-00194 |
|
U.S. District Court District of South Carolina |
|
|
|
On September 10, 2018, the court approved the parties’ agreement to settle this matter for a payment of $ |
|
Zapata et al. v. Flowers Foods, Inc. and Flowers Baking Co. of Houston, LLC (the “Zapata litigation”) |
|
4:16-cv-00676 |
|
U.S. District Court Southern District of Texas |
|
|
|
On September 12, 2018, the court dismissed the Zapata litigation and the Rodriguez litigation (defined below) and approved an agreement to settle both matters for $ |
|
Rodriguez et al. v. Flowers Foods, Inc. and Flowers Baking Co. of Houston, LLC (the “Rodriguez litigation”) |
|
4:16-cv-00245 |
|
U.S. District Court Southern District of Texas |
|
|
|
See the Zapata litigation discussion immediately above. |
F-58
|
Schucker et al. v. Flowers Foods, Inc., Lepage Bakeries Park St., LLC, and C.K. Sales Co., LLC |
|
1:16-cv-03439 |
|
U.S. District Court Southern District of New York |
|
|
|
On September 5, 2018, the court dismissed this lawsuit and approved an agreement to settle this matter for approximately $ |
|
Green et al. v. Flowers Foods, Inc. et al. |
|
1:19-cv-01021 |
|
U.S. District Court Western District of Tennessee |
|
|
|
* |
|
* |
On September 7, 2018, the company negotiated a global settlement to resolve 12 pending collective action lawsuits against the company for a payment in the amount of $ |
On August 12, 2016, a class action complaint was filed in the U.S. District Court for the Southern District of New York by Chris B. Hendley (the “Hendley complaint”) against the company and certain senior members of management (collectively, the “defendants”). On August 17, 2016, another class action complaint was filed in the U.S. District Court for the Southern District of New York by Scott Dovell, II (the “Dovell complaint” and together with the Hendley complaint, the “complaints”) against the defendants. Plaintiffs in the complaints are securities holders that acquired company securities between February 7, 2013 and August 10, 2016. The complaints generally allege that the defendants made materially false and/or misleading statements and/or failed to disclose that (1) the company’s labor practices were not in compliance with applicable federal laws and regulations; (2) such non-compliance exposed the company to legal liability and/or negative regulatory action; and (3) as a result, the defendants’ statements about the company’s business, operations, and prospects were false and misleading and/or lacked a reasonable basis. The counts of the complaints are asserted against the defendants pursuant to Sections 10(b) and 20(a) of the Exchange Act and Rule 10b-5 under the Exchange Act. The complaints seek (1) class certification under the Federal Rules of Civil Procedure, (2) compensatory damages in favor of the plaintiffs and all other class members against the defendants, jointly and severally, for all damages sustained as a result of wrongdoing, in an amount to be proven at trial, including interest, and (3) awarding plaintiffs and the class their reasonable costs and expenses incurred in the actions, including counsel and expert fees. On October 21, 2016, the U.S. District Court for the Southern District of New York consolidated the complaints into one action captioned “In re Flowers Foods, Inc. Securities Litigation” (the “consolidated securities action”), appointed Walter Matthews as lead plaintiff (“lead plaintiff”), and appointed Glancy Prongay & Murray LLP and Johnson & Weaver, LLP as co-lead counsel for the putative class. On November 21, 2016, the court granted defendants’ and lead plaintiff’s joint motion to transfer the consolidated securities action to the U.S. District Court for the Middle District of Georgia. Lead plaintiff filed his Consolidated Class Action Complaint on January 12, 2017, raising the same counts and general allegations and seeking the same relief as the Dovell and Hendley complaints. On March 13, 2017, the defendants filed a motion to dismiss the lawsuit which was granted in part and denied in part on March 23, 2018. The court dismissed certain allegedly false or misleading statements as nonactionable under federal securities laws and will allow others to proceed to fact discovery. On July 23, 2018, lead plaintiff filed his motion for class certification. The defendants filed their memorandum of law in opposition to class certification on October 5, 2018. The court scheduled a hearing on the class certification motion for February 28, 2019. On May 10, 2019, the parties filed a notice of settlement informing the court that a settlement in principle of the case had been reached. On July 12, 2019, lead plaintiff and Plaintiff Chris B. Hendley filed an unopposed motion for (1) preliminary approval of the class action settlement; (2) certification of the settlement class; and (3) approval of notice to the settlement class. On July 12, 2019, lead plaintiff
F-59
and Plaintiff Chris B. Hendley filed an unopposed motion for (1) preliminary approval of the class action settlement; (2) certification of the settlement class; and (3) approval of notice to the settlement class. Also, on July 12, 2019, the parties entered into a Stipulation and Agreement of Settlement (the “Stipulation”), which (along with its exhibits) sets forth in detail the settlement terms, which include releases of the claims asserted against the defendants. The settlement is for $
On June 8, 2018, a verified shareholder derivative complaint was filed in the U.S. District Court for the Middle District of Georgia by William D. Wrigley, derivatively on behalf of the company (the “Wrigley complaint”), against certain current and former directors and officers of the company. On June 14, 2018, a related verified shareholder derivative complaint was filed in the U.S. District Court for the Middle District of Georgia by Stephen Goldberger, derivatively on behalf of the company (the “Goldberger complaint” and together with the Wrigley complaint, the “federal derivative complaints”), against the same current and former directors and officers of the company. The federal derivative complaints allege, among other things, breaches of fiduciary duties and violations of federal securities laws relating to the company’s labor practices, and seek unspecified damages, disgorgement, and other relief. On June 27, 2018, these federal derivative actions were consolidated and stayed until the earlier of (1) an order from the court on any summary judgment motions that may be filed in the consolidated federal securities action, or (2) notification that there has been a settlement reached in the consolidated federal securities action, or until otherwise agreed to by the parties.
On June 21, 2018, two verified shareholder derivative complaints were filed in the Superior Court of Thomas County, State of Georgia, by Margaret Cicchini Family Trust and Frank Garnier, separately, derivatively on behalf of the company (together, the “state derivative complaints”), against certain current and former directors and officers of the company. The state derivative complaints allege, among other things, breaches of fiduciary duties relating to the company’s labor practices, and seek unspecified damages, disgorgement, and other relief. On July 12, 2018, these state derivative actions were consolidated and stayed until the earlier of (1) an order from the court on any summary judgment motions that may be filed in the consolidated federal securities action, or (2) notification that there has been a settlement reached in the consolidated federal securities action, or until otherwise agreed to by the parties.
On September 26, 2019, the parties to the consolidated federal derivative action filed a Notice of Settlement in Principle and Joint Status Report. On September 30, 2019, the court entered an order staying all deadlines and proceedings, except those that are settlement-related, and ordered the parties to file the settlement documents no later than October 28, 2019. On October 28, 2019, the parties executed a stipulation of settlement, which the plaintiffs filed with the court along with a motion for preliminary approval of the settlement. The settlement terms include certain governance reforms, releases of the claims asserted against the defendants, and the payment by the company’s insurer of $
The company and/or its respective subsidiaries are vigorously defending these lawsuits. Given the stage of the complaints and the claims and issues presented, the company cannot reasonably estimate at this time the possible loss or range of loss, if any, that may arise from the unresolved lawsuits.
See Note 15, Debt and Other Commitments, for additional information on the company’s commitments.
F-60
|
Note 24. |
Unaudited Quarterly Financial Information |
Results of operations for each of the four quarters in the respective fiscal years are as follows. For Fiscal 2020, first quarter consisted of sixteen weeks, second and third quarters twelve weeks, and fourth quarter thirteen weeks. For Fiscal 2019, each quarter represents a period of twelve weeks, except the first quarter, which includes sixteen weeks (amounts in thousands, except per share data):
|
|
|
|
|
First Quarter |
|
|
Second Quarter |
|
|
Third Quarter |
|
|
Fourth Quarter |
|
||||
|
Sales |
|
2020 |
|
$ |
|
|
|
$ |
|
|
|
$ |
|
|
|
$ |
|
|
|
|
|
2019 |
|
$ |
|
|
|
$ |
|
|
|
$ |
|
|
|
$ |
|
|
|
Materials, supplies, labor and other production costs (exclusive of depreciation and amortization shown separately)* |
|
2020 |
|
$ |
|
|
|
$ |
|
|
|
$ |
|
|
|
$ |
|
|
|
|
|
2019 |
|
$ |
|
|
|
$ |
|
|
|
$ |
|
|
|
$ |
|
|
|
Net (loss) income |
|
2020 |
|
$ |
( |
) |
|
$ |
|
|
|
$ |
|
|
|
$ |
|
|
|
|
|
2019 |
|
$ |
|
|
|
$ |
|
|
|
$ |
|
|
|
$ |
|
|
|
Basic net (loss) income per share |
|
2020 |
|
$ |
( |
) |
|
$ |
|
|
|
$ |
|
|
|
$ |
|
|
|
|
|
2019 |
|
$ |
|
|
|
$ |
|
|
|
$ |
|
|
|
$ |
|
|
|
Diluted net (loss) income per share |
|
2020 |
|
$ |
( |
) |
|
$ |
|
|
|
$ |
|
|
|
$ |
|
|
|
|
|
2019 |
|
$ |
|
|
|
$ |
|
|
|
$ |
|
|
|
$ |
|
|
|
* |
|
The table below presents financial results that impact comparability, by quarter, for Fiscal 2020 (amounts in thousands):
|
Items presented separately on the Consolidated Statements of Income |
|
First Quarter |
|
|
Second Quarter |
|
|
Third Quarter |
|
|
Fourth Quarter |
|
|
Fiscal 2020 |
|
|
Footnote |
|||||
|
Loss on inferior ingredients |
|
$ |
— |
|
|
$ |
— |
|
|
$ |
— |
|
|
$ |
|
|
|
$ |
|
|
|
Note 4 |
|
Restructuring and related impairment charges |
|
$ |
— |
|
|
$ |
|
|
|
$ |
|
|
|
$ |
|
|
|
$ |
|
|
|
Note 5 |
|
Pension plan settlement and curtailment loss (gain) |
|
$ |
|
|
|
$ |
— |
|
|
$ |
( |
) |
|
$ |
( |
) |
|
$ |
|
|
|
Note 21 |
The table below presents financial results that impact comparability, by quarter, for Fiscal 2019 (amounts in thousands):
|
Items presented separately on the Consolidated Statements of Income |
|
First Quarter |
|
|
Second Quarter |
|
|
Third Quarter |
|
|
Fourth Quarter |
|
|
Fiscal 2019 |
|
|
Footnote |
|||||
|
(Recovery) loss on inferior ingredients |
|
$ |
( |
) |
|
$ |
— |
|
|
$ |
— |
|
|
$ |
|
|
|
$ |
( |
) |
|
Note 4 |
|
Restructuring and related impairment charges |
|
$ |
|
|
|
$ |
|
|
|
$ |
|
|
|
$ |
|
|
|
$ |
|
|
|
Note 5 |
|
Note 25. |
Subsequent Events |
The company has evaluated subsequent events since January 2, 2021, the date of these financial statements. We believe there were no material events or transactions discovered during this evaluation that requires recognition or disclosure in the financial statements other than the items discussed below.
Dividend. On
F-61