http://fasb.org/us-gaap/2023#DebtSecuritiesAvailableForSaleExcludingAccruedInteresthttp://fasb.org/us-gaap/2023#DebtSecuritiesAvailableForSaleExcludingAccruedInteresthttp://principal.com/20231231#OperatingExpensesIncludingDeferredAcquisitionCostsCapitalizationAndAmortizationhttp://principal.com/20231231#OperatingExpensesIncludingDeferredAcquisitionCostsCapitalizationAndAmortizationhttp://principal.com/20231231#OperatingExpensesIncludingDeferredAcquisitionCostsCapitalizationAndAmortizationhttp://principal.com/20231231#OperatingExpensesIncludingDeferredAcquisitionCostsCapitalizationAndAmortizationhttp://principal.com/20231231#OperatingExpensesIncludingDeferredAcquisitionCostsCapitalizationAndAmortizationhttp://principal.com/20231231#OperatingExpensesIncludingDeferredAcquisitionCostsCapitalizationAndAmortizationhttp://principal.com/20231231#OperatingExpensesIncludingDeferredAcquisitionCostsCapitalizationAndAmortizationhttp://principal.com/20231231#OperatingExpensesIncludingDeferredAcquisitionCostsCapitalizationAndAmortizationhttp://principal.com/20231231#OperatingExpensesIncludingDeferredAcquisitionCostsCapitalizationAndAmortizationhttp://principal.com/20231231#OperatingExpensesIncludingDeferredAcquisitionCostsCapitalizationAndAmortizationhttp://principal.com/20231231#OperatingExpensesIncludingDeferredAcquisitionCostsCapitalizationAndAmortizationhttp://principal.com/20231231#OperatingExpensesIncludingDeferredAcquisitionCostsCapitalizationAndAmortizationhttp://principal.com/20231231#OperatingExpensesIncludingDeferredAcquisitionCostsCapitalizationAndAmortizationhttp://principal.com/20231231#OperatingExpensesIncludingDeferredAcquisitionCostsCapitalizationAndAmortizationhttp://principal.com/20231231#OperatingExpensesIncludingDeferredAcquisitionCostsCapitalizationAndAmortizationhttp://principal.com/20231231#OperatingExpensesIncludingDeferredAcquisitionCostsCapitalizationAndAmortizationhttp://principal.com/20231231#OperatingExpensesIncludingDeferredAcquisitionCostsCapitalizationAndAmortizationhttp://principal.com/20231231#OperatingExpensesIncludingDeferredAcquisitionCostsCapitalizationAndAmortizationhttp://principal.com/20231231#OperatingExpensesIncludingDeferredAcquisitionCostsCapitalizationAndAmortizationhttp://principal.com/20231231#OperatingExpensesIncludingDeferredAcquisitionCostsCapitalizationAndAmortizationhttp://principal.com/20231231#OperatingExpensesIncludingDeferredAcquisitionCostsCapitalizationAndAmortizationhttp://principal.com/20231231#OperatingExpensesIncludingDeferredAcquisitionCostsCapitalizationAndAmortizationhttp://principal.com/20231231#OperatingExpensesIncludingDeferredAcquisitionCostsCapitalizationAndAmortizationhttp://principal.com/20231231#OperatingExpensesIncludingDeferredAcquisitionCostsCapitalizationAndAmortizationhttp://fasb.org/us-gaap/2023#GainLossOnInvestments http://principal.com/20231231#ChangeInFairValueOfFundsWithheldEmbeddedDerivativehttp://principal.com/20231231#OtherComprehensiveIncomeAvailableForSaleSecuritiesPeriodIncreaseDecreaseNetOfTax http://principal.com/20231231#OtherComprehensiveIncomeDerivativesPeriodIncreaseDecreaseNetOfTaxhttp://fasb.org/us-gaap/2023#GainLossOnInvestments http://principal.com/20231231#ChangeInFairValueOfFundsWithheldEmbeddedDerivativehttp://principal.com/20231231#OtherComprehensiveIncomeAvailableForSaleSecuritiesPeriodIncreaseDecreaseNetOfTax http://principal.com/20231231#OtherComprehensiveIncomeDerivativesPeriodIncreaseDecreaseNetOfTaxhttp://fasb.org/us-gaap/2023#GainLossOnInvestments http://principal.com/20231231#ChangeInFairValueOfFundsWithheldEmbeddedDerivativehttp://principal.com/20231231#OtherComprehensiveIncomeAvailableForSaleSecuritiesPeriodIncreaseDecreaseNetOfTax http://principal.com/20231231#OtherComprehensiveIncomeDerivativesPeriodIncreaseDecreaseNetOfTaxhttp://fasb.org/us-gaap/2023#GainLossOnInvestments http://principal.com/20231231#ChangeInFairValueOfFundsWithheldEmbeddedDerivativehttp://principal.com/20231231#OtherComprehensiveIncomeAvailableForSaleSecuritiesPeriodIncreaseDecreaseNetOfTax http://principal.com/20231231#OtherComprehensiveIncomeDerivativesPeriodIncreaseDecreaseNetOfTaxhttp://fasb.org/us-gaap/2023#GainLossOnInvestments http://principal.com/20231231#ChangeInFairValueOfFundsWithheldEmbeddedDerivativehttp://principal.com/20231231#OtherComprehensiveIncomeAvailableForSaleSecuritiesPeriodIncreaseDecreaseNetOfTax http://principal.com/20231231#OtherComprehensiveIncomeDerivativesPeriodIncreaseDecreaseNetOfTaxhttp://fasb.org/us-gaap/2023#GainLossOnInvestments http://principal.com/20231231#ChangeInFairValueOfFundsWithheldEmbeddedDerivativehttp://principal.com/20231231#OtherComprehensiveIncomeAvailableForSaleSecuritiesPeriodIncreaseDecreaseNetOfTax http://principal.com/20231231#OtherComprehensiveIncomeDerivativesPeriodIncreaseDecreaseNetOfTaxhttp://fasb.org/us-gaap/2023#GainLossOnInvestments http://principal.com/20231231#ChangeInFairValueOfFundsWithheldEmbeddedDerivativehttp://principal.com/20231231#OtherComprehensiveIncomeAvailableForSaleSecuritiesPeriodIncreaseDecreaseNetOfTax http://principal.com/20231231#OtherComprehensiveIncomeDerivativesPeriodIncreaseDecreaseNetOfTaxhttp://fasb.org/us-gaap/2023#GainLossOnInvestments http://principal.com/20231231#ChangeInFairValueOfFundsWithheldEmbeddedDerivativehttp://principal.com/20231231#OtherComprehensiveIncomeAvailableForSaleSecuritiesPeriodIncreaseDecreaseNetOfTax http://principal.com/20231231#OtherComprehensiveIncomeDerivativesPeriodIncreaseDecreaseNetOfTaxhttp://fasb.org/us-gaap/2023#GainLossOnInvestments http://principal.com/20231231#ChangeInFairValueOfFundsWithheldEmbeddedDerivativehttp://principal.com/20231231#OtherComprehensiveIncomeAvailableForSaleSecuritiesPeriodIncreaseDecreaseNetOfTax http://principal.com/20231231#OtherComprehensiveIncomeDerivativesPeriodIncreaseDecreaseNetOfTaxhttp://fasb.org/us-gaap/2023#PropertyPlantAndEquipmentAndFinanceLeaseRightOfUseAssetAfterAccumulatedDepreciationAndAmortizationhttp://fasb.org/us-gaap/2023#PropertyPlantAndEquipmentAndFinanceLeaseRightOfUseAssetAfterAccumulatedDepreciationAndAmortizationhttp://fasb.org/us-gaap/2023#OtherLiabilitieshttp://fasb.org/us-gaap/2023#OtherLiabilities0001126328--12-312023FYfalsehttp://fasb.org/us-gaap/2023#NonqualifiedPlanMemberhttp://fasb.org/us-gaap/2023#NonqualifiedPlanMemberhttp://fasb.org/us-gaap/2023#PolicyholderBenefitsAndClaimsIncurredNethttp://fasb.org/us-gaap/2023#PolicyholderBenefitsAndClaimsIncurredNethttp://fasb.org/us-gaap/2023#DebtSecuritiesAvailableForSaleExcludingAccruedInteresthttp://fasb.org/us-gaap/2023#DebtSecuritiesAvailableForSaleExcludingAccruedInteresthttp://fasb.org/us-gaap/2023#PolicyholderBenefitsAndClaimsIncurredNet0.0605http://fasb.org/us-gaap/2023#QualifiedPlanMemberhttp://fasb.org/us-gaap/2023#QualifiedPlanMemberhttp://fasb.org/us-gaap/2023#QualifiedPlanMemberhttp://fasb.org/us-gaap/2023#PropertyPlantAndEquipmentAndFinanceLeaseRightOfUseAssetAfterAccumulatedDepreciationAndAmortizationhttp://fasb.org/us-gaap/2023#PropertyPlantAndEquipmentAndFinanceLeaseRightOfUseAssetAfterAccumulatedDepreciationAndAmortizationhttp://fasb.org/us-gaap/2023#OtherLiabilitieshttp://fasb.org/us-gaap/2023#OtherLiabilitieshttp://fasb.org/us-gaap/2023#ValuationTechniqueDiscountedCashFlowMemberhttp://fasb.org/us-gaap/2023#ValuationTechniqueDiscountedCashFlowMemberhttp://fasb.org/us-gaap/2023#ValuationTechniqueDiscountedCashFlowMemberhttp://fasb.org/us-gaap/2023#ValuationTechniqueDiscountedCashFlowMemberhttp://fasb.org/us-gaap/2023#ValuationTechniqueDiscountedCashFlowMemberhttp://fasb.org/us-gaap/2023#ValuationTechniqueDiscountedCashFlowMemberhttp://fasb.org/us-gaap/2023#ValuationTechniqueDiscountedCashFlowMemberhttp://fasb.org/us-gaap/2023#ValuationTechniqueDiscountedCashFlowMemberP0YP0Y62320000047569000001580200000falsefalsefalsefalsefalsefalse0001126328us-gaap:TreasuryStockCommonMember2023-01-012023-12-310001126328us-gaap:TreasuryStockCommonMember2022-01-012022-12-310001126328us-gaap:TreasuryStockCommonMember2021-01-012021-12-310001126328pfg:TradingSecuritiesMemberus-gaap:DebtSecuritiesMember2023-12-310001126328pfg:AvailableForSaleSecurityMemberus-gaap:USTreasuryAndGovernmentMember2023-12-310001126328pfg:AvailableForSaleSecurityMemberus-gaap:USStatesAndPoliticalSubdivisionsMember2023-12-310001126328pfg:AvailableForSaleSecurityMemberus-gaap:ResidentialMortgageBackedSecuritiesMember2023-12-310001126328pfg:AvailableForSaleSecurityMemberus-gaap:RedeemablePreferredStockMember2023-12-310001126328pfg:AvailableForSaleSecurityMemberus-gaap:PublicUtilityBondsMember2023-12-310001126328pfg:AvailableForSaleSecurityMemberus-gaap:OtherDebtSecuritiesMember2023-12-310001126328pfg:AvailableForSaleSecurityMemberus-gaap:ForeignGovernmentDebtSecuritiesMember2023-12-310001126328pfg:AvailableForSaleSecurityMemberus-gaap:DebtSecuritiesMember2023-12-310001126328pfg:AvailableForSaleSecurityMemberus-gaap:CommercialMortgageBackedSecuritiesMember2023-12-310001126328pfg:AvailableForSaleSecurityMemberus-gaap:CollateralizedDebtObligationsMember2023-12-310001126328pfg:AvailableForSaleSecurityMemberus-gaap:AllOtherCorporateBondsMember2023-12-310001126328us-gaap:RealEstateInvestmentMember2023-12-310001126328us-gaap:RealEstateAcquiredInSatisfactionOfDebtMember2023-12-310001126328us-gaap:PolicyLoansMember2023-12-310001126328us-gaap:OtherLongTermInvestmentsMember2023-12-310001126328us-gaap:NonredeemablePreferredStockMember2023-12-310001126328us-gaap:IndustrialMiscellaneousAndAllOthersMember2023-12-310001126328us-gaap:EquitySecuritiesMember2023-12-310001126328us-gaap:BanksTrustAndInsuranceEquitiesMember2023-12-310001126328pfg:OtherCorporateEquitiesMember2023-12-310001126328pfg:MortgageLoansMember2023-12-310001126328us-gaap:TreasuryStockCommonMember2023-12-310001126328us-gaap:RetainedEarningsMember2023-12-310001126328us-gaap:NoncontrollingInterestMember2023-12-310001126328us-gaap:AdditionalPaidInCapitalMember2023-12-310001126328us-gaap:TreasuryStockCommonMember2022-12-310001126328us-gaap:RetainedEarningsMember2022-12-310001126328us-gaap:NoncontrollingInterestMember2022-12-310001126328us-gaap:AdditionalPaidInCapitalMember2022-12-310001126328us-gaap:TreasuryStockCommonMember2021-12-310001126328us-gaap:RetainedEarningsMember2021-12-310001126328us-gaap:NoncontrollingInterestMember2021-12-310001126328us-gaap:AdditionalPaidInCapitalMember2021-12-310001126328srt:CumulativeEffectPeriodOfAdoptionAdjustmentMemberus-gaap:AccountingStandardsUpdate201812Memberus-gaap:RetainedEarningsMember2020-12-310001126328srt:CumulativeEffectPeriodOfAdoptionAdjustmentMemberus-gaap:AccountingStandardsUpdate201812Memberus-gaap:AccumulatedOtherComprehensiveIncomeMember2020-12-310001126328us-gaap:TreasuryStockCommonMember2020-12-310001126328us-gaap:RetainedEarningsMember2020-12-310001126328us-gaap:NoncontrollingInterestMember2020-12-310001126328us-gaap:AdditionalPaidInCapitalMember2020-12-310001126328us-gaap:AociMarketRiskBenefitInstrumentSpecificCreditRiskIncludingNoncontrollingInterestMember2023-12-310001126328us-gaap:AociLiabilityForFuturePolicyBenefitIncludingNoncontrollingInterestMember2023-12-310001126328us-gaap:AccumulatedTranslationAdjustmentMember2023-12-310001126328us-gaap:AccumulatedOtherComprehensiveIncomeMember2023-12-310001126328us-gaap:AccumulatedGainLossNetCashFlowHedgeParentMember2023-12-310001126328us-gaap:AccumulatedDefinedBenefitPlansAdjustmentMember2023-12-310001126328us-gaap:AociMarketRiskBenefitInstrumentSpecificCreditRiskIncludingNoncontrollingInterestMember2022-12-310001126328us-gaap:AociLiabilityForFuturePolicyBenefitIncludingNoncontrollingInterestMember2022-12-310001126328us-gaap:AccumulatedTranslationAdjustmentMember2022-12-310001126328us-gaap:AccumulatedOtherComprehensiveIncomeMember2022-12-310001126328us-gaap:AccumulatedGainLossNetCashFlowHedgeParentMember2022-12-310001126328us-gaap:AccumulatedDefinedBenefitPlansAdjustmentMember2022-12-310001126328srt:CumulativeEffectPeriodOfAdoptionAdjustmentMemberus-gaap:AccountingStandardsUpdate201613Memberus-gaap:AociMarketRiskBenefitInstrumentSpecificCreditRiskIncludingNoncontrollingInterestMember2021-12-310001126328srt:CumulativeEffectPeriodOfAdoptionAdjustmentMemberus-gaap:AccountingStandardsUpdate201613Memberus-gaap:AociLiabilityForFuturePolicyBenefitIncludingNoncontrollingInterestMember2021-12-310001126328srt:CumulativeEffectPeriodOfAdoptionAdjustmentMemberus-gaap:AccountingStandardsUpdate201613Memberus-gaap:AccumulatedTranslationAdjustmentMember2021-12-310001126328srt:CumulativeEffectPeriodOfAdoptionAdjustmentMemberus-gaap:AccountingStandardsUpdate201613Memberus-gaap:AccumulatedOtherComprehensiveIncomeMember2021-12-310001126328srt:CumulativeEffectPeriodOfAdoptionAdjustmentMemberus-gaap:AccountingStandardsUpdate201613Memberus-gaap:AccumulatedNetUnrealizedInvestmentGainLossMember2021-12-310001126328srt:CumulativeEffectPeriodOfAdoptionAdjustmentMemberus-gaap:AccountingStandardsUpdate201613Memberus-gaap:AccumulatedGainLossNetCashFlowHedgeParentMember2021-12-310001126328us-gaap:AociMarketRiskBenefitInstrumentSpecificCreditRiskIncludingNoncontrollingInterestMember2021-12-310001126328us-gaap:AociLiabilityForFuturePolicyBenefitIncludingNoncontrollingInterestMember2021-12-310001126328us-gaap:AccumulatedTranslationAdjustmentMember2021-12-310001126328us-gaap:AccumulatedOtherComprehensiveIncomeMember2021-12-310001126328us-gaap:AccumulatedGainLossNetCashFlowHedgeParentMember2021-12-310001126328us-gaap:AccumulatedDefinedBenefitPlansAdjustmentMember2021-12-310001126328us-gaap:AccumulatedTranslationAdjustmentMember2020-12-310001126328us-gaap:AccumulatedOtherComprehensiveIncomeMember2020-12-310001126328us-gaap:AccumulatedNetUnrealizedInvestmentGainLossMember2020-12-310001126328us-gaap:AccumulatedGainLossNetCashFlowHedgeParentMember2020-12-310001126328us-gaap:AccumulatedDefinedBenefitPlansAdjustmentMember2020-12-310001126328pfg:SubsidiariesPrincipalLifeInsuranceCompanyMember2023-12-310001126328pfg:LongTermDisabilityGroupLifeWaiverMember2022-01-012022-12-310001126328pfg:LongTermDisabilityGroupLifeWaiverMember2021-01-012021-12-310001126328pfg:LongTermDisabilityGroupLifeWaiverMemberus-gaap:ShortDurationInsuranceContractsAccidentYear2018Member2023-12-310001126328pfg:LongTermDisabilityGroupLifeWaiverMemberus-gaap:ShortDurationInsuranceContractsAccidentYear2017Member2023-12-310001126328pfg:LongTermDisabilityGroupLifeWaiverMemberus-gaap:ShortdurationInsuranceContractsAccidentYear2016Member2023-12-310001126328pfg:LongTermDisabilityGroupLifeWaiverMemberus-gaap:ShortdurationInsuranceContractsAccidentYear2015Member2023-12-310001126328pfg:LongTermDisabilityGroupLifeWaiverMemberus-gaap:ShortdurationInsuranceContractsAccidentYear2014Member2023-12-310001126328pfg:LongTermDisabilityGroupLifeWaiverMemberus-gaap:ShortDurationInsuranceContractAccidentYear2023Member2023-12-310001126328pfg:LongTermDisabilityGroupLifeWaiverMemberus-gaap:ShortDurationInsuranceContractAccidentYear2022Member2023-12-310001126328pfg:LongTermDisabilityGroupLifeWaiverMemberus-gaap:ShortDurationInsuranceContractAccidentYear2021Member2023-12-310001126328pfg:LongTermDisabilityGroupLifeWaiverMemberus-gaap:ShortDurationInsuranceContractAccidentYear2020Member2023-12-310001126328pfg:LongTermDisabilityGroupLifeWaiverMemberus-gaap:ShortDurationInsuranceContractAccidentYear2019Member2023-12-310001126328pfg:GroupLifeMemberus-gaap:ShortDurationInsuranceContractAccidentYear2023Member2023-12-310001126328pfg:GroupLifeMemberus-gaap:ShortDurationInsuranceContractAccidentYear2022Member2023-12-310001126328pfg:DentalVisionShortTermDisabilityCriticalIllnessAccidentHospitalIndemnityAndPfmlMemberus-gaap:ShortDurationInsuranceContractAccidentYear2023Member2023-12-310001126328pfg:DentalVisionShortTermDisabilityCriticalIllnessAccidentHospitalIndemnityAndPfmlMemberus-gaap:ShortDurationInsuranceContractAccidentYear2022Member2023-12-310001126328pfg:LongTermDisabilityGroupLifeWaiverMemberus-gaap:ShortDurationInsuranceContractsAccidentYear2018Member2022-12-310001126328pfg:LongTermDisabilityGroupLifeWaiverMemberus-gaap:ShortDurationInsuranceContractsAccidentYear2017Member2022-12-310001126328pfg:LongTermDisabilityGroupLifeWaiverMemberus-gaap:ShortdurationInsuranceContractsAccidentYear2016Member2022-12-310001126328pfg:LongTermDisabilityGroupLifeWaiverMemberus-gaap:ShortdurationInsuranceContractsAccidentYear2015Member2022-12-310001126328pfg:LongTermDisabilityGroupLifeWaiverMemberus-gaap:ShortdurationInsuranceContractsAccidentYear2014Member2022-12-310001126328pfg:LongTermDisabilityGroupLifeWaiverMemberus-gaap:ShortDurationInsuranceContractAccidentYear2022Member2022-12-310001126328pfg:LongTermDisabilityGroupLifeWaiverMemberus-gaap:ShortDurationInsuranceContractAccidentYear2021Member2022-12-310001126328pfg:LongTermDisabilityGroupLifeWaiverMemberus-gaap:ShortDurationInsuranceContractAccidentYear2020Member2022-12-310001126328pfg:LongTermDisabilityGroupLifeWaiverMemberus-gaap:ShortDurationInsuranceContractAccidentYear2019Member2022-12-310001126328pfg:GroupLifeMemberus-gaap:ShortDurationInsuranceContractAccidentYear2022Member2022-12-310001126328pfg:DentalVisionShortTermDisabilityCriticalIllnessAccidentHospitalIndemnityAndPfmlMemberus-gaap:ShortDurationInsuranceContractAccidentYear2022Member2022-12-310001126328pfg:LongTermDisabilityGroupLifeWaiverMemberus-gaap:ShortDurationInsuranceContractsAccidentYear2018Member2021-12-310001126328pfg:LongTermDisabilityGroupLifeWaiverMemberus-gaap:ShortDurationInsuranceContractsAccidentYear2017Member2021-12-310001126328pfg:LongTermDisabilityGroupLifeWaiverMemberus-gaap:ShortdurationInsuranceContractsAccidentYear2016Member2021-12-310001126328pfg:LongTermDisabilityGroupLifeWaiverMemberus-gaap:ShortdurationInsuranceContractsAccidentYear2015Member2021-12-310001126328pfg:LongTermDisabilityGroupLifeWaiverMemberus-gaap:ShortdurationInsuranceContractsAccidentYear2014Member2021-12-310001126328pfg:LongTermDisabilityGroupLifeWaiverMemberus-gaap:ShortDurationInsuranceContractAccidentYear2021Member2021-12-310001126328pfg:LongTermDisabilityGroupLifeWaiverMemberus-gaap:ShortDurationInsuranceContractAccidentYear2020Member2021-12-310001126328pfg:LongTermDisabilityGroupLifeWaiverMemberus-gaap:ShortDurationInsuranceContractAccidentYear2019Member2021-12-310001126328pfg:LongTermDisabilityGroupLifeWaiverMemberus-gaap:ShortDurationInsuranceContractsAccidentYear2018Member2020-12-310001126328pfg:LongTermDisabilityGroupLifeWaiverMemberus-gaap:ShortDurationInsuranceContractsAccidentYear2017Member2020-12-310001126328pfg:LongTermDisabilityGroupLifeWaiverMemberus-gaap:ShortdurationInsuranceContractsAccidentYear2016Member2020-12-310001126328pfg:LongTermDisabilityGroupLifeWaiverMemberus-gaap:ShortdurationInsuranceContractsAccidentYear2015Member2020-12-310001126328pfg:LongTermDisabilityGroupLifeWaiverMemberus-gaap:ShortdurationInsuranceContractsAccidentYear2014Member2020-12-310001126328pfg:LongTermDisabilityGroupLifeWaiverMemberus-gaap:ShortDurationInsuranceContractAccidentYear2020Member2020-12-310001126328pfg:LongTermDisabilityGroupLifeWaiverMemberus-gaap:ShortDurationInsuranceContractAccidentYear2019Member2020-12-310001126328pfg:LongTermDisabilityGroupLifeWaiverMemberus-gaap:ShortDurationInsuranceContractsAccidentYear2018Member2019-12-310001126328pfg:LongTermDisabilityGroupLifeWaiverMemberus-gaap:ShortDurationInsuranceContractsAccidentYear2017Member2019-12-310001126328pfg:LongTermDisabilityGroupLifeWaiverMemberus-gaap:ShortdurationInsuranceContractsAccidentYear2016Member2019-12-310001126328pfg:LongTermDisabilityGroupLifeWaiverMemberus-gaap:ShortdurationInsuranceContractsAccidentYear2015Member2019-12-310001126328pfg:LongTermDisabilityGroupLifeWaiverMemberus-gaap:ShortdurationInsuranceContractsAccidentYear2014Member2019-12-310001126328pfg:LongTermDisabilityGroupLifeWaiverMemberus-gaap:ShortDurationInsuranceContractAccidentYear2019Member2019-12-310001126328pfg:LongTermDisabilityGroupLifeWaiverMemberus-gaap:ShortDurationInsuranceContractsAccidentYear2018Member2018-12-310001126328pfg:LongTermDisabilityGroupLifeWaiverMemberus-gaap:ShortDurationInsuranceContractsAccidentYear2017Member2018-12-310001126328pfg:LongTermDisabilityGroupLifeWaiverMemberus-gaap:ShortdurationInsuranceContractsAccidentYear2016Member2018-12-310001126328pfg:LongTermDisabilityGroupLifeWaiverMemberus-gaap:ShortdurationInsuranceContractsAccidentYear2015Member2018-12-310001126328pfg:LongTermDisabilityGroupLifeWaiverMemberus-gaap:ShortdurationInsuranceContractsAccidentYear2014Member2018-12-310001126328pfg:LongTermDisabilityGroupLifeWaiverMemberus-gaap:ShortDurationInsuranceContractsAccidentYear2017Member2017-12-310001126328pfg:LongTermDisabilityGroupLifeWaiverMemberus-gaap:ShortdurationInsuranceContractsAccidentYear2016Member2017-12-310001126328pfg:LongTermDisabilityGroupLifeWaiverMemberus-gaap:ShortdurationInsuranceContractsAccidentYear2015Member2017-12-310001126328pfg:LongTermDisabilityGroupLifeWaiverMemberus-gaap:ShortdurationInsuranceContractsAccidentYear2014Member2017-12-310001126328pfg:LongTermDisabilityGroupLifeWaiverMemberus-gaap:ShortdurationInsuranceContractsAccidentYear2016Member2016-12-310001126328pfg:LongTermDisabilityGroupLifeWaiverMemberus-gaap:ShortdurationInsuranceContractsAccidentYear2015Member2016-12-310001126328pfg:LongTermDisabilityGroupLifeWaiverMemberus-gaap:ShortdurationInsuranceContractsAccidentYear2014Member2016-12-310001126328pfg:LongTermDisabilityGroupLifeWaiverMemberus-gaap:ShortdurationInsuranceContractsAccidentYear2015Member2015-12-310001126328pfg:LongTermDisabilityGroupLifeWaiverMemberus-gaap:ShortdurationInsuranceContractsAccidentYear2014Member2015-12-310001126328pfg:LongTermDisabilityGroupLifeWaiverMemberus-gaap:ShortdurationInsuranceContractsAccidentYear2014Member2014-12-310001126328pfg:LongTermDisabilityGroupLifeWaiverMember2023-01-012023-12-310001126328pfg:GroupLifeMember2023-01-012023-12-310001126328pfg:DentalVisionShortTermDisabilityCriticalIllnessAccidentHospitalIndemnityAndPfmlMember2023-01-012023-12-310001126328pfg:LongTermDisabilityGroupLifeWaiverMembersrt:MinimumMember2023-12-310001126328pfg:LongTermDisabilityGroupLifeWaiverMembersrt:MaximumMember2023-12-310001126328pfg:LongTermDisabilityGroupLifeWaiverMembersrt:MinimumMember2022-12-310001126328pfg:LongTermDisabilityGroupLifeWaiverMembersrt:MaximumMember2022-12-310001126328pfg:DentalVisionShortTermDisabilityCriticalIllnessAccidentHospitalIndemnityAndPfmlMember2023-12-310001126328pfg:LongTermDisabilityGroupLifeWaiverMember2022-12-310001126328pfg:GroupLifeMember2022-12-310001126328pfg:DentalVisionShortTermDisabilityCriticalIllnessAccidentHospitalIndemnityAndPfmlMember2022-12-310001126328us-gaap:CommonStockMember2023-12-310001126328us-gaap:CommonStockMember2022-12-310001126328us-gaap:CommonStockMember2021-12-310001126328us-gaap:CommonStockMember2020-12-310001126328us-gaap:EmployeeStockOptionMemberpfg:ExercisePriceTotalRangeMember2023-01-012023-12-310001126328us-gaap:EmployeeStockOptionMemberpfg:ExercisePriceRange5Member2023-01-012023-12-310001126328us-gaap:EmployeeStockOptionMemberpfg:ExercisePriceRange4Member2023-01-012023-12-310001126328us-gaap:EmployeeStockOptionMemberpfg:ExercisePriceRange3Member2023-01-012023-12-310001126328us-gaap:EmployeeStockOptionMemberpfg:ExercisePriceRange2Member2023-01-012023-12-310001126328us-gaap:EmployeeStockOptionMemberpfg:ExercisePriceRange1Member2023-01-012023-12-310001126328us-gaap:EmployeeStockOptionMemberpfg:ExercisePriceTotalRangeMember2023-12-310001126328us-gaap:EmployeeStockOptionMemberpfg:ExercisePriceRange5Member2023-12-310001126328us-gaap:EmployeeStockOptionMemberpfg:ExercisePriceRange4Member2023-12-310001126328us-gaap:EmployeeStockOptionMemberpfg:ExercisePriceRange3Member2023-12-310001126328us-gaap:EmployeeStockOptionMemberpfg:ExercisePriceRange2Member2023-12-310001126328us-gaap:EmployeeStockOptionMemberpfg:ExercisePriceRange1Member2023-12-310001126328us-gaap:EmployeeStockOptionMember2022-12-310001126328pfg:StockBasedCompensationPlans2014StockIncentivePlanAmendedAndRestated2010StockIncentivePlanStockIncentivePlanMember2022-01-012022-12-310001126328pfg:StockBasedCompensationPlans2014StockIncentivePlanAmendedAndRestated2010StockIncentivePlanStockIncentivePlanMember2021-01-012021-12-310001126328pfg:StockBasedCompensationPlans2021StockIncentivePlanMember2023-12-310001126328pfg:StockBasedCompensationPlans2014StockIncentivePlanAmendedAndRestated2010StockIncentivePlanStockIncentivePlanMember2023-01-012023-12-310001126328us-gaap:RestrictedStockUnitsRSUMember2022-12-310001126328us-gaap:PerformanceSharesMember2022-12-310001126328us-gaap:RestrictedStockUnitsRSUMemberpfg:StockBasedCompensationPlans2021StockIncentivePlan2020DirectorsStockPlan2014DirectorsStockPlanAnd2005DirectorsStockPlanMember2023-01-012023-12-310001126328us-gaap:RestrictedStockUnitsRSUMemberpfg:StockBasedCompensationPlans2014StockIncentivePlanAmendedAndRestated2010StockIncentivePlanStockIncentivePlanMember2023-01-012023-12-310001126328pfg:SegmentPrincipalAssetManagementMemberpfg:SubsegmentPrincipalInternationalMember2023-12-310001126328pfg:SegmentPrincipalAssetManagementMemberpfg:SubsegmentPrincipalInternationalMember2022-12-310001126328pfg:PensionMembersrt:LatinAmericaMemberpfg:SegmentPrincipalAssetManagementMemberpfg:SubsegmentPrincipalInternationalMember2021-12-310001126328pfg:GroupRetirementContractsProductMemberpfg:SegmentRetirementAndIncomeSolutionsMember2021-12-310001126328pfg:PensionMembersrt:LatinAmericaMemberpfg:SegmentPrincipalAssetManagementMemberpfg:SubsegmentPrincipalInternationalMember2023-12-310001126328pfg:GroupRetirementContractsProductMemberpfg:SegmentRetirementAndIncomeSolutionsMember2023-12-310001126328pfg:PensionMembersrt:LatinAmericaMemberpfg:SegmentPrincipalAssetManagementMemberpfg:SubsegmentPrincipalInternationalMember2022-12-310001126328pfg:GroupRetirementContractsProductMemberpfg:SegmentRetirementAndIncomeSolutionsMember2022-12-310001126328pfg:UnearnedRevenueLiabilityMember2023-01-012023-12-310001126328pfg:MarketRiskBenefitNetAmountAtRiskMember2023-01-012023-12-310001126328pfg:LiabilityForFuturePolicyBenefitsMember2023-01-012023-12-310001126328pfg:DeferredPolicyAcquisitionCostsMember2023-01-012023-12-310001126328us-gaap:USTreasuryAndGovernmentMemberus-gaap:SeparateAccountDebtSecurityMember2023-12-310001126328us-gaap:USStatesAndPoliticalSubdivisionsMemberus-gaap:SeparateAccountDebtSecurityMember2023-12-310001126328us-gaap:ResidentialMortgageBackedSecuritiesMemberus-gaap:SeparateAccountDebtSecurityMember2023-12-310001126328us-gaap:OtherDebtSecuritiesMemberus-gaap:SeparateAccountDebtSecurityMember2023-12-310001126328us-gaap:ForeignGovernmentDebtSecuritiesMemberus-gaap:SeparateAccountDebtSecurityMember2023-12-310001126328us-gaap:CorporateDebtSecuritiesMemberus-gaap:SeparateAccountDebtSecurityMember2023-12-310001126328us-gaap:CommercialMortgageBackedSecuritiesMemberus-gaap:SeparateAccountDebtSecurityMember2023-12-310001126328us-gaap:SeparateAccountRealEstateMember2023-12-310001126328us-gaap:SeparateAccountEquitySecurityMember2023-12-310001126328us-gaap:SeparateAccountDebtSecurityMember2023-12-310001126328us-gaap:SeparateAccountCashAndCashEquivalentsMember2023-12-310001126328pfg:SeparateAccountOtherInvestmentsMember2023-12-310001126328pfg:SeparateAccountOtherAssetsMember2023-12-310001126328us-gaap:USTreasuryAndGovernmentMemberus-gaap:SeparateAccountDebtSecurityMember2022-12-310001126328us-gaap:USStatesAndPoliticalSubdivisionsMemberus-gaap:SeparateAccountDebtSecurityMember2022-12-310001126328us-gaap:ResidentialMortgageBackedSecuritiesMemberus-gaap:SeparateAccountDebtSecurityMember2022-12-310001126328us-gaap:OtherDebtSecuritiesMemberus-gaap:SeparateAccountDebtSecurityMember2022-12-310001126328us-gaap:ForeignGovernmentDebtSecuritiesMemberus-gaap:SeparateAccountDebtSecurityMember2022-12-310001126328us-gaap:CorporateDebtSecuritiesMemberus-gaap:SeparateAccountDebtSecurityMember2022-12-310001126328us-gaap:CommercialMortgageBackedSecuritiesMemberus-gaap:SeparateAccountDebtSecurityMember2022-12-310001126328us-gaap:SeparateAccountRealEstateMember2022-12-310001126328us-gaap:SeparateAccountEquitySecurityMember2022-12-310001126328us-gaap:SeparateAccountDebtSecurityMember2022-12-310001126328us-gaap:SeparateAccountCashAndCashEquivalentsMember2022-12-310001126328pfg:SeparateAccountOtherInvestmentsMember2022-12-310001126328pfg:SeparateAccountOtherAssetsMember2022-12-310001126328us-gaap:OperatingSegmentsMemberus-gaap:ManagementServiceMemberpfg:SegmentPrincipalAssetManagementMemberpfg:SubsegmentPrincipalInternationalMember2023-01-012023-12-310001126328us-gaap:OperatingSegmentsMemberus-gaap:ManagementServiceMemberpfg:SegmentPrincipalAssetManagementMemberpfg:SubsegmentPrincipalGlobalInvestorsMember2023-01-012023-12-310001126328us-gaap:OperatingSegmentsMemberus-gaap:FinancialServiceOtherMemberpfg:SegmentPrincipalAssetManagementMemberpfg:SubsegmentPrincipalInternationalMember2023-01-012023-12-310001126328us-gaap:OperatingSegmentsMemberus-gaap:FinancialServiceOtherMemberpfg:SegmentPrincipalAssetManagementMemberpfg:SubsegmentPrincipalGlobalInvestorsMember2023-01-012023-12-310001126328us-gaap:OperatingSegmentsMemberus-gaap:AdministrativeServiceMemberpfg:SegmentBenefitsAndProtectionMemberpfg:SubsegmentSpecialtyBenefitsMember2023-01-012023-12-310001126328us-gaap:OperatingSegmentsMemberus-gaap:AdministrativeServiceMemberpfg:SegmentBenefitsAndProtectionMemberpfg:SubsegmentLifeInsuranceMember2023-01-012023-12-310001126328us-gaap:OperatingSegmentsMembersrt:LatinAmericaMemberpfg:SegmentPrincipalAssetManagementMemberpfg:SubsegmentPrincipalInternationalMember2023-01-012023-12-310001126328us-gaap:OperatingSegmentsMembersrt:AsiaMemberpfg:SegmentPrincipalAssetManagementMemberpfg:SubsegmentPrincipalInternationalMember2023-01-012023-12-310001126328us-gaap:OperatingSegmentsMemberpfg:SubsegmentGeographicalAreaEliminationsMemberpfg:SegmentPrincipalAssetManagementMemberpfg:SubsegmentPrincipalInternationalMember2023-01-012023-12-310001126328us-gaap:OperatingSegmentsMemberpfg:CommissionIncomeMemberpfg:SegmentBenefitsAndProtectionMemberpfg:SubsegmentLifeInsuranceMember2023-01-012023-12-310001126328us-gaap:OperatingSegmentsMemberus-gaap:FinancialServiceOtherMemberpfg:SegmentRetirementAndIncomeSolutionsMember2023-01-012023-12-310001126328us-gaap:OperatingSegmentsMemberus-gaap:FinancialServiceOtherMemberpfg:SegmentCorporateMember2023-01-012023-12-310001126328us-gaap:OperatingSegmentsMemberus-gaap:DepositAccountMemberpfg:SegmentRetirementAndIncomeSolutionsMember2023-01-012023-12-310001126328us-gaap:OperatingSegmentsMemberus-gaap:AdministrativeServiceMemberpfg:SegmentRetirementAndIncomeSolutionsMember2023-01-012023-12-310001126328us-gaap:OperatingSegmentsMemberpfg:SegmentPrincipalAssetManagementMemberpfg:SubsegmentPrincipalAssetManagementEliminationsMember2023-01-012023-12-310001126328us-gaap:OperatingSegmentsMemberpfg:ProductsAndServicesEliminationsMemberpfg:SegmentCorporateMember2023-01-012023-12-310001126328us-gaap:OperatingSegmentsMemberpfg:CommissionIncomeMemberpfg:SegmentRetirementAndIncomeSolutionsMember2023-01-012023-12-310001126328us-gaap:OperatingSegmentsMemberpfg:CommissionIncomeMemberpfg:SegmentCorporateMember2023-01-012023-12-310001126328us-gaap:OperatingSegmentsMemberus-gaap:ManagementServiceMemberpfg:SegmentPrincipalAssetManagementMemberpfg:SubsegmentPrincipalInternationalMember2022-01-012022-12-310001126328us-gaap:OperatingSegmentsMemberus-gaap:ManagementServiceMemberpfg:SegmentPrincipalAssetManagementMemberpfg:SubsegmentPrincipalGlobalInvestorsMember2022-01-012022-12-310001126328us-gaap:OperatingSegmentsMemberus-gaap:FinancialServiceOtherMemberpfg:SegmentPrincipalAssetManagementMemberpfg:SubsegmentPrincipalInternationalMember2022-01-012022-12-310001126328us-gaap:OperatingSegmentsMemberus-gaap:FinancialServiceOtherMemberpfg:SegmentPrincipalAssetManagementMemberpfg:SubsegmentPrincipalGlobalInvestorsMember2022-01-012022-12-310001126328us-gaap:OperatingSegmentsMemberus-gaap:AdministrativeServiceMemberpfg:SegmentBenefitsAndProtectionMemberpfg:SubsegmentSpecialtyBenefitsMember2022-01-012022-12-310001126328us-gaap:OperatingSegmentsMemberus-gaap:AdministrativeServiceMemberpfg:SegmentBenefitsAndProtectionMemberpfg:SubsegmentLifeInsuranceMember2022-01-012022-12-310001126328us-gaap:OperatingSegmentsMembersrt:LatinAmericaMemberpfg:SegmentPrincipalAssetManagementMemberpfg:SubsegmentPrincipalInternationalMember2022-01-012022-12-310001126328us-gaap:OperatingSegmentsMembersrt:AsiaMemberpfg:SegmentPrincipalAssetManagementMemberpfg:SubsegmentPrincipalInternationalMember2022-01-012022-12-310001126328us-gaap:OperatingSegmentsMemberpfg:SubsegmentGeographicalAreaEliminationsMemberpfg:SegmentPrincipalAssetManagementMemberpfg:SubsegmentPrincipalInternationalMember2022-01-012022-12-310001126328us-gaap:OperatingSegmentsMemberpfg:CommissionIncomeMemberpfg:SegmentBenefitsAndProtectionMemberpfg:SubsegmentLifeInsuranceMember2022-01-012022-12-310001126328us-gaap:OperatingSegmentsMemberus-gaap:FinancialServiceOtherMemberpfg:SegmentRetirementAndIncomeSolutionsMember2022-01-012022-12-310001126328us-gaap:OperatingSegmentsMemberus-gaap:FinancialServiceOtherMemberpfg:SegmentCorporateMember2022-01-012022-12-310001126328us-gaap:OperatingSegmentsMemberus-gaap:DepositAccountMemberpfg:SegmentRetirementAndIncomeSolutionsMember2022-01-012022-12-310001126328us-gaap:OperatingSegmentsMemberus-gaap:AdministrativeServiceMemberpfg:SegmentRetirementAndIncomeSolutionsMember2022-01-012022-12-310001126328us-gaap:OperatingSegmentsMemberpfg:SegmentPrincipalAssetManagementMemberpfg:SubsegmentPrincipalAssetManagementEliminationsMember2022-01-012022-12-310001126328us-gaap:OperatingSegmentsMemberpfg:ProductsAndServicesEliminationsMemberpfg:SegmentCorporateMember2022-01-012022-12-310001126328us-gaap:OperatingSegmentsMemberpfg:CommissionIncomeMemberpfg:SegmentRetirementAndIncomeSolutionsMember2022-01-012022-12-310001126328us-gaap:OperatingSegmentsMemberpfg:CommissionIncomeMemberpfg:SegmentCorporateMember2022-01-012022-12-310001126328us-gaap:OperatingSegmentsMemberus-gaap:ManagementServiceMemberpfg:SegmentPrincipalAssetManagementMemberpfg:SubsegmentPrincipalInternationalMember2021-01-012021-12-310001126328us-gaap:OperatingSegmentsMemberus-gaap:ManagementServiceMemberpfg:SegmentPrincipalAssetManagementMemberpfg:SubsegmentPrincipalGlobalInvestorsMember2021-01-012021-12-310001126328us-gaap:OperatingSegmentsMemberus-gaap:FinancialServiceOtherMemberpfg:SegmentPrincipalAssetManagementMemberpfg:SubsegmentPrincipalInternationalMember2021-01-012021-12-310001126328us-gaap:OperatingSegmentsMemberus-gaap:FinancialServiceOtherMemberpfg:SegmentPrincipalAssetManagementMemberpfg:SubsegmentPrincipalGlobalInvestorsMember2021-01-012021-12-310001126328us-gaap:OperatingSegmentsMemberus-gaap:AdministrativeServiceMemberpfg:SegmentBenefitsAndProtectionMemberpfg:SubsegmentSpecialtyBenefitsMember2021-01-012021-12-310001126328us-gaap:OperatingSegmentsMemberus-gaap:AdministrativeServiceMemberpfg:SegmentBenefitsAndProtectionMemberpfg:SubsegmentLifeInsuranceMember2021-01-012021-12-310001126328us-gaap:OperatingSegmentsMembersrt:LatinAmericaMemberpfg:SegmentPrincipalAssetManagementMemberpfg:SubsegmentPrincipalInternationalMember2021-01-012021-12-310001126328us-gaap:OperatingSegmentsMembersrt:AsiaMemberpfg:SegmentPrincipalAssetManagementMemberpfg:SubsegmentPrincipalInternationalMember2021-01-012021-12-310001126328us-gaap:OperatingSegmentsMemberpfg:SubsegmentGeographicalAreaEliminationsMemberpfg:SegmentPrincipalAssetManagementMemberpfg:SubsegmentPrincipalInternationalMember2021-01-012021-12-310001126328us-gaap:OperatingSegmentsMemberpfg:CommissionIncomeMemberpfg:SegmentBenefitsAndProtectionMemberpfg:SubsegmentLifeInsuranceMember2021-01-012021-12-310001126328us-gaap:OperatingSegmentsMemberus-gaap:FinancialServiceOtherMemberpfg:SegmentRetirementAndIncomeSolutionsMember2021-01-012021-12-310001126328us-gaap:OperatingSegmentsMemberus-gaap:FinancialServiceOtherMemberpfg:SegmentCorporateMember2021-01-012021-12-310001126328us-gaap:OperatingSegmentsMemberus-gaap:DepositAccountMemberpfg:SegmentRetirementAndIncomeSolutionsMember2021-01-012021-12-310001126328us-gaap:OperatingSegmentsMemberus-gaap:AdministrativeServiceMemberpfg:SegmentRetirementAndIncomeSolutionsMember2021-01-012021-12-310001126328us-gaap:OperatingSegmentsMemberpfg:SegmentPrincipalAssetManagementMemberpfg:SubsegmentPrincipalAssetManagementEliminationsMember2021-01-012021-12-310001126328us-gaap:OperatingSegmentsMemberpfg:ProductsAndServicesEliminationsMemberpfg:SegmentCorporateMember2021-01-012021-12-310001126328us-gaap:OperatingSegmentsMemberpfg:CommissionIncomeMemberpfg:SegmentRetirementAndIncomeSolutionsMember2021-01-012021-12-310001126328us-gaap:OperatingSegmentsMemberpfg:CommissionIncomeMemberpfg:SegmentCorporateMember2021-01-012021-12-310001126328pfg:NotesPayable6.05PercentDue2036Memberus-gaap:SeniorNotesMember2016-10-012016-12-310001126328pfg:NotesPayable7.875PercentDue2014Memberus-gaap:SeniorNotesMember2012-09-052012-09-050001126328pfg:OperatingExpensesMemberus-gaap:AccumulatedDefinedBenefitPlansAdjustmentIncludingPortionAttributableToNoncontrollingInterestMember2023-01-012023-12-310001126328pfg:NetRealizedCapitalGainsLossesMemberus-gaap:AccumulatedNetInvestmentGainLossIncludingPortionAttributableToNoncontrollingInterestMember2023-01-012023-12-310001126328us-gaap:AccumulatedNetGainLossFromCashFlowHedgesIncludingPortionAttributableToNoncontrollingInterestMember2023-01-012023-12-310001126328pfg:OperatingExpensesMemberus-gaap:AccumulatedDefinedBenefitPlansAdjustmentIncludingPortionAttributableToNoncontrollingInterestMember2022-01-012022-12-310001126328pfg:NetRealizedCapitalGainsLossesMemberus-gaap:AccumulatedNetInvestmentGainLossIncludingPortionAttributableToNoncontrollingInterestMember2022-01-012022-12-310001126328pfg:OperatingExpensesMemberus-gaap:AccumulatedDefinedBenefitPlansAdjustmentIncludingPortionAttributableToNoncontrollingInterestMember2021-01-012021-12-310001126328pfg:NetRealizedCapitalGainsLossesMemberus-gaap:AccumulatedNetInvestmentGainLossIncludingPortionAttributableToNoncontrollingInterestMember2021-01-012021-12-310001126328pfg:NetRealizedCapitalGainsLossesMemberus-gaap:AccumulatedForeignCurrencyAdjustmentIncludingPortionAttributableToNoncontrollingInterestMember2021-01-012021-12-310001126328us-gaap:IntersegmentEliminationMemberpfg:SegmentCorporateMember2023-12-310001126328us-gaap:IntersegmentEliminationMemberpfg:SegmentCorporateMember2022-12-310001126328us-gaap:UniversalLifeMembersrt:MinimumMemberpfg:PolicyholderAccountBalanceGuaranteedMinimumCreditingRateRangeFrom0401AndGreaterMemberpfg:SegmentBenefitsAndProtectionMemberpfg:SubsegmentLifeInsuranceMember2023-12-310001126328us-gaap:UniversalLifeMembersrt:MinimumMemberpfg:PolicyholderAccountBalanceGuaranteedMinimumCreditingRateRangeFrom0301To0400Memberpfg:SegmentBenefitsAndProtectionMemberpfg:SubsegmentLifeInsuranceMember2023-12-310001126328us-gaap:UniversalLifeMembersrt:MinimumMemberpfg:PolicyholderAccountBalanceGuaranteedMinimumCreditingRateRangeFrom0201To0300Memberpfg:SegmentBenefitsAndProtectionMemberpfg:SubsegmentLifeInsuranceMember2023-12-310001126328us-gaap:UniversalLifeMembersrt:MinimumMemberpfg:PolicyholderAccountBalanceGuaranteedMinimumCreditingRateRangeFrom0101To0200Memberpfg:SegmentBenefitsAndProtectionMemberpfg:SubsegmentLifeInsuranceMember2023-12-310001126328us-gaap:UniversalLifeMembersrt:MaximumMemberpfg:PolicyholderAccountBalanceGuaranteedMinimumCreditingRateRangeUpTo0100Memberpfg:SegmentBenefitsAndProtectionMemberpfg:SubsegmentLifeInsuranceMember2023-12-310001126328us-gaap:UniversalLifeMembersrt:MaximumMemberpfg:PolicyholderAccountBalanceGuaranteedMinimumCreditingRateRangeFrom0301To0400Memberpfg:SegmentBenefitsAndProtectionMemberpfg:SubsegmentLifeInsuranceMember2023-12-310001126328us-gaap:UniversalLifeMembersrt:MaximumMemberpfg:PolicyholderAccountBalanceGuaranteedMinimumCreditingRateRangeFrom0201To0300Memberpfg:SegmentBenefitsAndProtectionMemberpfg:SubsegmentLifeInsuranceMember2023-12-310001126328us-gaap:UniversalLifeMembersrt:MaximumMemberpfg:PolicyholderAccountBalanceGuaranteedMinimumCreditingRateRangeFrom0101To0200Memberpfg:SegmentBenefitsAndProtectionMemberpfg:SubsegmentLifeInsuranceMember2023-12-310001126328us-gaap:VariableAnnuityMembersrt:MinimumMemberpfg:PolicyholderAccountBalanceGuaranteedMinimumCreditingRateRangeFrom0401AndGreaterMemberpfg:SegmentRetirementAndIncomeSolutionsMember2023-12-310001126328us-gaap:VariableAnnuityMembersrt:MinimumMemberpfg:PolicyholderAccountBalanceGuaranteedMinimumCreditingRateRangeFrom0301To0400Memberpfg:SegmentRetirementAndIncomeSolutionsMember2023-12-310001126328us-gaap:VariableAnnuityMembersrt:MinimumMemberpfg:PolicyholderAccountBalanceGuaranteedMinimumCreditingRateRangeFrom0201To0300Memberpfg:SegmentRetirementAndIncomeSolutionsMember2023-12-310001126328us-gaap:VariableAnnuityMembersrt:MinimumMemberpfg:PolicyholderAccountBalanceGuaranteedMinimumCreditingRateRangeFrom0101To0200Memberpfg:SegmentRetirementAndIncomeSolutionsMember2023-12-310001126328us-gaap:VariableAnnuityMembersrt:MaximumMemberpfg:PolicyholderAccountBalanceGuaranteedMinimumCreditingRateRangeUpTo0100Memberpfg:SegmentRetirementAndIncomeSolutionsMember2023-12-310001126328us-gaap:VariableAnnuityMembersrt:MaximumMemberpfg:PolicyholderAccountBalanceGuaranteedMinimumCreditingRateRangeFrom0301To0400Memberpfg:SegmentRetirementAndIncomeSolutionsMember2023-12-310001126328us-gaap:VariableAnnuityMembersrt:MaximumMemberpfg:PolicyholderAccountBalanceGuaranteedMinimumCreditingRateRangeFrom0201To0300Memberpfg:SegmentRetirementAndIncomeSolutionsMember2023-12-310001126328us-gaap:VariableAnnuityMembersrt:MaximumMemberpfg:PolicyholderAccountBalanceGuaranteedMinimumCreditingRateRangeFrom0101To0200Memberpfg:SegmentRetirementAndIncomeSolutionsMember2023-12-310001126328us-gaap:DeferredFixedAnnuityMembersrt:MinimumMemberpfg:PolicyholderAccountBalanceGuaranteedMinimumCreditingRateRangeFrom0401AndGreaterMemberpfg:SegmentRetirementAndIncomeSolutionsMember2023-12-310001126328us-gaap:DeferredFixedAnnuityMembersrt:MinimumMemberpfg:PolicyholderAccountBalanceGuaranteedMinimumCreditingRateRangeFrom0301To0400Memberpfg:SegmentRetirementAndIncomeSolutionsMember2023-12-310001126328us-gaap:DeferredFixedAnnuityMembersrt:MinimumMemberpfg:PolicyholderAccountBalanceGuaranteedMinimumCreditingRateRangeFrom0201To0300Memberpfg:SegmentRetirementAndIncomeSolutionsMember2023-12-310001126328us-gaap:DeferredFixedAnnuityMembersrt:MinimumMemberpfg:PolicyholderAccountBalanceGuaranteedMinimumCreditingRateRangeFrom0101To0200Memberpfg:SegmentRetirementAndIncomeSolutionsMember2023-12-310001126328us-gaap:DeferredFixedAnnuityMembersrt:MaximumMemberpfg:PolicyholderAccountBalanceGuaranteedMinimumCreditingRateRangeUpTo0100Memberpfg:SegmentRetirementAndIncomeSolutionsMember2023-12-310001126328us-gaap:DeferredFixedAnnuityMembersrt:MaximumMemberpfg:PolicyholderAccountBalanceGuaranteedMinimumCreditingRateRangeFrom0301To0400Memberpfg:SegmentRetirementAndIncomeSolutionsMember2023-12-310001126328us-gaap:DeferredFixedAnnuityMembersrt:MaximumMemberpfg:PolicyholderAccountBalanceGuaranteedMinimumCreditingRateRangeFrom0201To0300Memberpfg:SegmentRetirementAndIncomeSolutionsMember2023-12-310001126328us-gaap:DeferredFixedAnnuityMembersrt:MaximumMemberpfg:PolicyholderAccountBalanceGuaranteedMinimumCreditingRateRangeFrom0101To0200Memberpfg:SegmentRetirementAndIncomeSolutionsMember2023-12-310001126328pfg:WorkplaceSavingsAndRetirementSolutionsMembersrt:MinimumMemberpfg:PolicyholderAccountBalanceGuaranteedMinimumCreditingRateRangeFrom0401AndGreaterMemberpfg:SegmentRetirementAndIncomeSolutionsMember2023-12-310001126328pfg:WorkplaceSavingsAndRetirementSolutionsMembersrt:MinimumMemberpfg:PolicyholderAccountBalanceGuaranteedMinimumCreditingRateRangeFrom0301To0400Memberpfg:SegmentRetirementAndIncomeSolutionsMember2023-12-310001126328pfg:WorkplaceSavingsAndRetirementSolutionsMembersrt:MinimumMemberpfg:PolicyholderAccountBalanceGuaranteedMinimumCreditingRateRangeFrom0201To0300Memberpfg:SegmentRetirementAndIncomeSolutionsMember2023-12-310001126328pfg:WorkplaceSavingsAndRetirementSolutionsMembersrt:MinimumMemberpfg:PolicyholderAccountBalanceGuaranteedMinimumCreditingRateRangeFrom0101To0200Memberpfg:SegmentRetirementAndIncomeSolutionsMember2023-12-310001126328pfg:WorkplaceSavingsAndRetirementSolutionsMembersrt:MaximumMemberpfg:PolicyholderAccountBalanceGuaranteedMinimumCreditingRateRangeUpTo0100Memberpfg:SegmentRetirementAndIncomeSolutionsMember2023-12-310001126328pfg:WorkplaceSavingsAndRetirementSolutionsMembersrt:MaximumMemberpfg:PolicyholderAccountBalanceGuaranteedMinimumCreditingRateRangeFrom0301To0400Memberpfg:SegmentRetirementAndIncomeSolutionsMember2023-12-310001126328pfg:WorkplaceSavingsAndRetirementSolutionsMembersrt:MaximumMemberpfg:PolicyholderAccountBalanceGuaranteedMinimumCreditingRateRangeFrom0201To0300Memberpfg:SegmentRetirementAndIncomeSolutionsMember2023-12-310001126328pfg:WorkplaceSavingsAndRetirementSolutionsMembersrt:MaximumMemberpfg:PolicyholderAccountBalanceGuaranteedMinimumCreditingRateRangeFrom0101To0200Memberpfg:SegmentRetirementAndIncomeSolutionsMember2023-12-310001126328us-gaap:UniversalLifeMembersrt:MinimumMemberpfg:PolicyholderAccountBalanceGuaranteedMinimumCreditingRateRangeFrom0401AndGreaterMemberpfg:SegmentBenefitsAndProtectionMemberpfg:SubsegmentLifeInsuranceMember2022-12-310001126328us-gaap:UniversalLifeMembersrt:MinimumMemberpfg:PolicyholderAccountBalanceGuaranteedMinimumCreditingRateRangeFrom0301To0400Memberpfg:SegmentBenefitsAndProtectionMemberpfg:SubsegmentLifeInsuranceMember2022-12-310001126328us-gaap:UniversalLifeMembersrt:MinimumMemberpfg:PolicyholderAccountBalanceGuaranteedMinimumCreditingRateRangeFrom0201To0300Memberpfg:SegmentBenefitsAndProtectionMemberpfg:SubsegmentLifeInsuranceMember2022-12-310001126328us-gaap:UniversalLifeMembersrt:MinimumMemberpfg:PolicyholderAccountBalanceGuaranteedMinimumCreditingRateRangeFrom0101To0200Memberpfg:SegmentBenefitsAndProtectionMemberpfg:SubsegmentLifeInsuranceMember2022-12-310001126328us-gaap:UniversalLifeMembersrt:MaximumMemberpfg:PolicyholderAccountBalanceGuaranteedMinimumCreditingRateRangeUpTo0100Memberpfg:SegmentBenefitsAndProtectionMemberpfg:SubsegmentLifeInsuranceMember2022-12-310001126328us-gaap:UniversalLifeMembersrt:MaximumMemberpfg:PolicyholderAccountBalanceGuaranteedMinimumCreditingRateRangeFrom0301To0400Memberpfg:SegmentBenefitsAndProtectionMemberpfg:SubsegmentLifeInsuranceMember2022-12-310001126328us-gaap:UniversalLifeMembersrt:MaximumMemberpfg:PolicyholderAccountBalanceGuaranteedMinimumCreditingRateRangeFrom0201To0300Memberpfg:SegmentBenefitsAndProtectionMemberpfg:SubsegmentLifeInsuranceMember2022-12-310001126328us-gaap:UniversalLifeMembersrt:MaximumMemberpfg:PolicyholderAccountBalanceGuaranteedMinimumCreditingRateRangeFrom0101To0200Memberpfg:SegmentBenefitsAndProtectionMemberpfg:SubsegmentLifeInsuranceMember2022-12-310001126328us-gaap:VariableAnnuityMembersrt:MinimumMemberpfg:PolicyholderAccountBalanceGuaranteedMinimumCreditingRateRangeFrom0401AndGreaterMemberpfg:SegmentRetirementAndIncomeSolutionsMember2022-12-310001126328us-gaap:VariableAnnuityMembersrt:MinimumMemberpfg:PolicyholderAccountBalanceGuaranteedMinimumCreditingRateRangeFrom0301To0400Memberpfg:SegmentRetirementAndIncomeSolutionsMember2022-12-310001126328us-gaap:VariableAnnuityMembersrt:MinimumMemberpfg:PolicyholderAccountBalanceGuaranteedMinimumCreditingRateRangeFrom0201To0300Memberpfg:SegmentRetirementAndIncomeSolutionsMember2022-12-310001126328us-gaap:VariableAnnuityMembersrt:MinimumMemberpfg:PolicyholderAccountBalanceGuaranteedMinimumCreditingRateRangeFrom0101To0200Memberpfg:SegmentRetirementAndIncomeSolutionsMember2022-12-310001126328us-gaap:VariableAnnuityMembersrt:MaximumMemberpfg:PolicyholderAccountBalanceGuaranteedMinimumCreditingRateRangeUpTo0100Memberpfg:SegmentRetirementAndIncomeSolutionsMember2022-12-310001126328us-gaap:VariableAnnuityMembersrt:MaximumMemberpfg:PolicyholderAccountBalanceGuaranteedMinimumCreditingRateRangeFrom0301To0400Memberpfg:SegmentRetirementAndIncomeSolutionsMember2022-12-310001126328us-gaap:VariableAnnuityMembersrt:MaximumMemberpfg:PolicyholderAccountBalanceGuaranteedMinimumCreditingRateRangeFrom0201To0300Memberpfg:SegmentRetirementAndIncomeSolutionsMember2022-12-310001126328us-gaap:VariableAnnuityMembersrt:MaximumMemberpfg:PolicyholderAccountBalanceGuaranteedMinimumCreditingRateRangeFrom0101To0200Memberpfg:SegmentRetirementAndIncomeSolutionsMember2022-12-310001126328us-gaap:DeferredFixedAnnuityMembersrt:MinimumMemberpfg:PolicyholderAccountBalanceGuaranteedMinimumCreditingRateRangeFrom0401AndGreaterMemberpfg:SegmentRetirementAndIncomeSolutionsMember2022-12-310001126328us-gaap:DeferredFixedAnnuityMembersrt:MinimumMemberpfg:PolicyholderAccountBalanceGuaranteedMinimumCreditingRateRangeFrom0301To0400Memberpfg:SegmentRetirementAndIncomeSolutionsMember2022-12-310001126328us-gaap:DeferredFixedAnnuityMembersrt:MinimumMemberpfg:PolicyholderAccountBalanceGuaranteedMinimumCreditingRateRangeFrom0201To0300Memberpfg:SegmentRetirementAndIncomeSolutionsMember2022-12-310001126328us-gaap:DeferredFixedAnnuityMembersrt:MinimumMemberpfg:PolicyholderAccountBalanceGuaranteedMinimumCreditingRateRangeFrom0101To0200Memberpfg:SegmentRetirementAndIncomeSolutionsMember2022-12-310001126328us-gaap:DeferredFixedAnnuityMembersrt:MaximumMemberpfg:PolicyholderAccountBalanceGuaranteedMinimumCreditingRateRangeUpTo0100Memberpfg:SegmentRetirementAndIncomeSolutionsMember2022-12-310001126328us-gaap:DeferredFixedAnnuityMembersrt:MaximumMemberpfg:PolicyholderAccountBalanceGuaranteedMinimumCreditingRateRangeFrom0301To0400Memberpfg:SegmentRetirementAndIncomeSolutionsMember2022-12-310001126328us-gaap:DeferredFixedAnnuityMembersrt:MaximumMemberpfg:PolicyholderAccountBalanceGuaranteedMinimumCreditingRateRangeFrom0201To0300Memberpfg:SegmentRetirementAndIncomeSolutionsMember2022-12-310001126328us-gaap:DeferredFixedAnnuityMembersrt:MaximumMemberpfg:PolicyholderAccountBalanceGuaranteedMinimumCreditingRateRangeFrom0101To0200Memberpfg:SegmentRetirementAndIncomeSolutionsMember2022-12-310001126328pfg:WorkplaceSavingsAndRetirementSolutionsMembersrt:MinimumMemberpfg:PolicyholderAccountBalanceGuaranteedMinimumCreditingRateRangeFrom0401AndGreaterMemberpfg:SegmentRetirementAndIncomeSolutionsMember2022-12-310001126328pfg:WorkplaceSavingsAndRetirementSolutionsMembersrt:MinimumMemberpfg:PolicyholderAccountBalanceGuaranteedMinimumCreditingRateRangeFrom0301To0400Memberpfg:SegmentRetirementAndIncomeSolutionsMember2022-12-310001126328pfg:WorkplaceSavingsAndRetirementSolutionsMembersrt:MinimumMemberpfg:PolicyholderAccountBalanceGuaranteedMinimumCreditingRateRangeFrom0201To0300Memberpfg:SegmentRetirementAndIncomeSolutionsMember2022-12-310001126328pfg:WorkplaceSavingsAndRetirementSolutionsMembersrt:MinimumMemberpfg:PolicyholderAccountBalanceGuaranteedMinimumCreditingRateRangeFrom0101To0200Memberpfg:SegmentRetirementAndIncomeSolutionsMember2022-12-310001126328pfg:WorkplaceSavingsAndRetirementSolutionsMembersrt:MaximumMemberpfg:PolicyholderAccountBalanceGuaranteedMinimumCreditingRateRangeUpTo0100Memberpfg:SegmentRetirementAndIncomeSolutionsMember2022-12-310001126328pfg:WorkplaceSavingsAndRetirementSolutionsMembersrt:MaximumMemberpfg:PolicyholderAccountBalanceGuaranteedMinimumCreditingRateRangeFrom0301To0400Memberpfg:SegmentRetirementAndIncomeSolutionsMember2022-12-310001126328pfg:WorkplaceSavingsAndRetirementSolutionsMembersrt:MaximumMemberpfg:PolicyholderAccountBalanceGuaranteedMinimumCreditingRateRangeFrom0201To0300Memberpfg:SegmentRetirementAndIncomeSolutionsMember2022-12-310001126328pfg:WorkplaceSavingsAndRetirementSolutionsMembersrt:MaximumMemberpfg:PolicyholderAccountBalanceGuaranteedMinimumCreditingRateRangeFrom0101To0200Memberpfg:SegmentRetirementAndIncomeSolutionsMember2022-12-310001126328pfg:SubsegmentIndividualLifeInsuranceMember2023-01-012023-12-310001126328pfg:SubsegmentIndividualLifeInsuranceMember2022-01-012022-12-310001126328pfg:SubsegmentIndividualLifeInsuranceMember2021-01-012021-12-310001126328srt:ParentCompanyMembersrt:ReportableLegalEntitiesMembersrt:AffiliatedEntityMember2023-12-310001126328srt:ParentCompanyMembersrt:ReportableLegalEntitiesMembersrt:AffiliatedEntityMember2022-12-310001126328us-gaap:ForeignExchangeContractMemberus-gaap:NetInvestmentHedgingMember2023-01-012023-12-310001126328us-gaap:NetInvestmentHedgingMember2023-01-012023-12-310001126328us-gaap:ForeignExchangeContractMemberus-gaap:NetInvestmentHedgingMember2022-01-012022-12-310001126328us-gaap:NetInvestmentHedgingMember2022-01-012022-12-310001126328us-gaap:ForeignExchangeContractMemberus-gaap:NetInvestmentHedgingMember2021-01-012021-12-310001126328us-gaap:NetInvestmentHedgingMember2021-01-012021-12-310001126328pfg:InvestmentContractMemberus-gaap:InterestRateContractMember2023-01-012023-12-310001126328pfg:FixedMaturitiesSecuritiesAvailableForSaleMemberus-gaap:InterestRateContractMember2023-01-012023-12-310001126328pfg:FixedMaturitiesSecuritiesAvailableForSaleMemberus-gaap:ForeignExchangeContractMember2023-01-012023-12-310001126328pfg:InvestmentContractMemberus-gaap:InterestRateContractMember2022-01-012022-12-310001126328pfg:FixedMaturitiesSecuritiesAvailableForSaleMemberus-gaap:InterestRateContractMember2022-01-012022-12-310001126328pfg:FixedMaturitiesSecuritiesAvailableForSaleMemberus-gaap:ForeignExchangeContractMember2022-01-012022-12-310001126328pfg:InvestmentContractMemberus-gaap:InterestRateContractMember2021-01-012021-12-310001126328pfg:FixedMaturitiesSecuritiesAvailableForSaleMemberus-gaap:ForeignExchangeContractMember2021-01-012021-12-310001126328us-gaap:AccumulatedForeignCurrencyAdjustmentIncludingPortionAttributableToNoncontrollingInterestMember2023-01-012023-12-310001126328us-gaap:AccumulatedForeignCurrencyAdjustmentAttributableToNoncontrollingInterestMember2023-01-012023-12-310001126328us-gaap:AccumulatedForeignCurrencyAdjustmentIncludingPortionAttributableToNoncontrollingInterestMember2022-01-012022-12-310001126328us-gaap:AccumulatedDefinedBenefitPlansAdjustmentIncludingPortionAttributableToNoncontrollingInterestMember2023-01-012023-12-310001126328us-gaap:AccumulatedDefinedBenefitPlansAdjustmentIncludingPortionAttributableToNoncontrollingInterestMember2022-01-012022-12-310001126328us-gaap:AccumulatedForeignCurrencyAdjustmentIncludingPortionAttributableToNoncontrollingInterestMember2021-01-012021-12-310001126328us-gaap:AccumulatedDefinedBenefitPlansAdjustmentIncludingPortionAttributableToNoncontrollingInterestMember2021-01-012021-12-310001126328us-gaap:AociMarketRiskBenefitInstrumentSpecificCreditRiskIncludingNoncontrollingInterestMember2023-01-012023-12-310001126328us-gaap:AociLiabilityForFuturePolicyBenefitIncludingNoncontrollingInterestMember2023-01-012023-12-310001126328us-gaap:AccumulatedTranslationAdjustmentMember2023-01-012023-12-310001126328us-gaap:AccumulatedNetUnrealizedInvestmentGainLossMember2023-01-012023-12-310001126328us-gaap:AccumulatedGainLossNetCashFlowHedgeParentMember2023-01-012023-12-310001126328us-gaap:AccumulatedDefinedBenefitPlansAdjustmentMember2023-01-012023-12-310001126328us-gaap:AociMarketRiskBenefitInstrumentSpecificCreditRiskIncludingNoncontrollingInterestMember2022-01-012022-12-310001126328us-gaap:AociLiabilityForFuturePolicyBenefitIncludingNoncontrollingInterestMember2022-01-012022-12-310001126328us-gaap:AccumulatedTranslationAdjustmentMember2022-01-012022-12-310001126328us-gaap:AccumulatedDefinedBenefitPlansAdjustmentMember2022-01-012022-12-310001126328us-gaap:AociMarketRiskBenefitInstrumentSpecificCreditRiskIncludingNoncontrollingInterestMember2021-01-012021-12-310001126328us-gaap:AociLiabilityForFuturePolicyBenefitIncludingNoncontrollingInterestMember2021-01-012021-12-310001126328us-gaap:AccumulatedTranslationAdjustmentMember2021-01-012021-12-310001126328us-gaap:AccumulatedNetUnrealizedInvestmentGainLossMember2021-01-012021-12-310001126328us-gaap:AccumulatedGainLossNetCashFlowHedgeParentMember2021-01-012021-12-310001126328us-gaap:AccumulatedDefinedBenefitPlansAdjustmentMember2021-01-012021-12-310001126328us-gaap:AssetPledgedAsCollateralMemberus-gaap:FederalHomeLoanBankAdvancesMember2023-12-310001126328us-gaap:AssetPledgedAsCollateralMemberus-gaap:FederalHomeLoanBankAdvancesMember2022-12-310001126328pfg:GuaranteedPensionMembersrt:ScenarioPreviouslyReportedMembersrt:AsiaMemberpfg:SegmentPrincipalAssetManagementMemberpfg:SubsegmentPrincipalInternationalMember2020-12-310001126328us-gaap:VariableAnnuityMemberpfg:MarketRiskBenefitsRetainedEarningsAdjustmentForValuationOfContractsAsMrbsMemberpfg:SegmentRetirementAndIncomeSolutionsMember2020-12-310001126328us-gaap:VariableAnnuityMemberpfg:MarketRiskBenefitsCumulativeEffectOfChangesInNonperformanceRiskBetweenOriginalContractIssueDateAndTransitionDateMemberpfg:SegmentRetirementAndIncomeSolutionsMember2020-12-310001126328pfg:MarketRiskBenefitsRetainedEarningsAdjustmentForValuationOfContractsAsMrbsMember2020-12-310001126328pfg:MarketRiskBenefitsCumulativeEffectOfChangesInNonperformanceRiskBetweenOriginalContractIssueDateAndTransitionDateMember2020-12-310001126328pfg:GuaranteedPensionMembersrt:WeightedAverageMembersrt:AsiaMemberus-gaap:MeasurementInputPriceVolatilityMemberpfg:SegmentPrincipalAssetManagementMemberpfg:SubsegmentPrincipalInternationalMember2023-12-310001126328pfg:GuaranteedPensionMembersrt:WeightedAverageMembersrt:AsiaMemberus-gaap:MeasurementInputLapseRateMemberpfg:SegmentPrincipalAssetManagementMemberpfg:SubsegmentPrincipalInternationalMember2023-12-310001126328pfg:GuaranteedPensionMembersrt:WeightedAverageMembersrt:AsiaMemberpfg:MeasurementInputNonPerformanceRiskMemberpfg:SegmentPrincipalAssetManagementMemberpfg:SubsegmentPrincipalInternationalMember2023-12-310001126328pfg:GuaranteedPensionMembersrt:WeightedAverageMembersrt:AsiaMemberpfg:MeasurementInputLongDurationInterestRateMemberpfg:SegmentPrincipalAssetManagementMemberpfg:SubsegmentPrincipalInternationalMember2023-12-310001126328pfg:GuaranteedPensionMembersrt:MinimumMembersrt:AsiaMemberus-gaap:MeasurementInputPriceVolatilityMemberpfg:SegmentPrincipalAssetManagementMemberpfg:SubsegmentPrincipalInternationalMember2023-12-310001126328pfg:GuaranteedPensionMembersrt:MinimumMembersrt:AsiaMemberus-gaap:MeasurementInputLapseRateMemberpfg:SegmentPrincipalAssetManagementMemberpfg:SubsegmentPrincipalInternationalMember2023-12-310001126328pfg:GuaranteedPensionMembersrt:MinimumMembersrt:AsiaMemberpfg:MeasurementInputNonPerformanceRiskMemberpfg:SegmentPrincipalAssetManagementMemberpfg:SubsegmentPrincipalInternationalMember2023-12-310001126328pfg:GuaranteedPensionMembersrt:MinimumMembersrt:AsiaMemberpfg:MeasurementInputLongDurationInterestRateMemberpfg:SegmentPrincipalAssetManagementMemberpfg:SubsegmentPrincipalInternationalMember2023-12-310001126328pfg:GuaranteedPensionMembersrt:MaximumMembersrt:AsiaMemberus-gaap:MeasurementInputPriceVolatilityMemberpfg:SegmentPrincipalAssetManagementMemberpfg:SubsegmentPrincipalInternationalMember2023-12-310001126328pfg:GuaranteedPensionMembersrt:MaximumMembersrt:AsiaMemberus-gaap:MeasurementInputLapseRateMemberpfg:SegmentPrincipalAssetManagementMemberpfg:SubsegmentPrincipalInternationalMember2023-12-310001126328pfg:GuaranteedPensionMembersrt:MaximumMembersrt:AsiaMemberpfg:MeasurementInputNonPerformanceRiskMemberpfg:SegmentPrincipalAssetManagementMemberpfg:SubsegmentPrincipalInternationalMember2023-12-310001126328pfg:GuaranteedPensionMembersrt:MaximumMembersrt:AsiaMemberpfg:MeasurementInputLongDurationInterestRateMemberpfg:SegmentPrincipalAssetManagementMemberpfg:SubsegmentPrincipalInternationalMember2023-12-310001126328us-gaap:VariableAnnuityMembersrt:WeightedAverageMemberus-gaap:MeasurementInputPriceVolatilityMemberpfg:SegmentRetirementAndIncomeSolutionsMember2023-12-310001126328us-gaap:VariableAnnuityMembersrt:WeightedAverageMemberus-gaap:MeasurementInputLapseRateMemberpfg:SegmentRetirementAndIncomeSolutionsMember2023-12-310001126328us-gaap:VariableAnnuityMembersrt:WeightedAverageMemberpfg:MeasurementInputNonPerformanceRiskMemberpfg:SegmentRetirementAndIncomeSolutionsMember2023-12-310001126328us-gaap:VariableAnnuityMembersrt:WeightedAverageMemberpfg:MeasurementInputLongDurationInterestRateMemberpfg:SegmentRetirementAndIncomeSolutionsMember2023-12-310001126328us-gaap:VariableAnnuityMembersrt:MinimumMemberus-gaap:MeasurementInputPriceVolatilityMemberpfg:SegmentRetirementAndIncomeSolutionsMember2023-12-310001126328us-gaap:VariableAnnuityMembersrt:MinimumMemberus-gaap:MeasurementInputLapseRateMemberpfg:SegmentRetirementAndIncomeSolutionsMember2023-12-310001126328us-gaap:VariableAnnuityMembersrt:MinimumMemberpfg:MeasurementInputNonPerformanceRiskMemberpfg:SegmentRetirementAndIncomeSolutionsMember2023-12-310001126328us-gaap:VariableAnnuityMembersrt:MinimumMemberpfg:MeasurementInputLongDurationInterestRateMemberpfg:SegmentRetirementAndIncomeSolutionsMember2023-12-310001126328us-gaap:VariableAnnuityMembersrt:MaximumMemberus-gaap:MeasurementInputPriceVolatilityMemberpfg:SegmentRetirementAndIncomeSolutionsMember2023-12-310001126328us-gaap:VariableAnnuityMembersrt:MaximumMemberus-gaap:MeasurementInputLapseRateMemberpfg:SegmentRetirementAndIncomeSolutionsMember2023-12-310001126328us-gaap:VariableAnnuityMembersrt:MaximumMemberpfg:MeasurementInputNonPerformanceRiskMemberpfg:SegmentRetirementAndIncomeSolutionsMember2023-12-310001126328us-gaap:VariableAnnuityMembersrt:MaximumMemberpfg:MeasurementInputLongDurationInterestRateMemberpfg:SegmentRetirementAndIncomeSolutionsMember2023-12-310001126328pfg:GuaranteedPensionMembersrt:WeightedAverageMembersrt:AsiaMemberus-gaap:MeasurementInputPriceVolatilityMemberpfg:SegmentPrincipalAssetManagementMemberpfg:SubsegmentPrincipalInternationalMember2022-12-310001126328pfg:GuaranteedPensionMembersrt:WeightedAverageMembersrt:AsiaMemberus-gaap:MeasurementInputLapseRateMemberpfg:SegmentPrincipalAssetManagementMemberpfg:SubsegmentPrincipalInternationalMember2022-12-310001126328pfg:GuaranteedPensionMembersrt:WeightedAverageMembersrt:AsiaMemberpfg:MeasurementInputNonPerformanceRiskMemberpfg:SegmentPrincipalAssetManagementMemberpfg:SubsegmentPrincipalInternationalMember2022-12-310001126328pfg:GuaranteedPensionMembersrt:WeightedAverageMembersrt:AsiaMemberpfg:MeasurementInputLongDurationInterestRateMemberpfg:SegmentPrincipalAssetManagementMemberpfg:SubsegmentPrincipalInternationalMember2022-12-310001126328pfg:GuaranteedPensionMembersrt:MinimumMembersrt:AsiaMemberus-gaap:MeasurementInputPriceVolatilityMemberpfg:SegmentPrincipalAssetManagementMemberpfg:SubsegmentPrincipalInternationalMember2022-12-310001126328pfg:GuaranteedPensionMembersrt:MinimumMembersrt:AsiaMemberus-gaap:MeasurementInputLapseRateMemberpfg:SegmentPrincipalAssetManagementMemberpfg:SubsegmentPrincipalInternationalMember2022-12-310001126328pfg:GuaranteedPensionMembersrt:MinimumMembersrt:AsiaMemberpfg:MeasurementInputNonPerformanceRiskMemberpfg:SegmentPrincipalAssetManagementMemberpfg:SubsegmentPrincipalInternationalMember2022-12-310001126328pfg:GuaranteedPensionMembersrt:MinimumMembersrt:AsiaMemberpfg:MeasurementInputLongDurationInterestRateMemberpfg:SegmentPrincipalAssetManagementMemberpfg:SubsegmentPrincipalInternationalMember2022-12-310001126328pfg:GuaranteedPensionMembersrt:MaximumMembersrt:AsiaMemberus-gaap:MeasurementInputPriceVolatilityMemberpfg:SegmentPrincipalAssetManagementMemberpfg:SubsegmentPrincipalInternationalMember2022-12-310001126328pfg:GuaranteedPensionMembersrt:MaximumMembersrt:AsiaMemberus-gaap:MeasurementInputLapseRateMemberpfg:SegmentPrincipalAssetManagementMemberpfg:SubsegmentPrincipalInternationalMember2022-12-310001126328pfg:GuaranteedPensionMembersrt:MaximumMembersrt:AsiaMemberpfg:MeasurementInputNonPerformanceRiskMemberpfg:SegmentPrincipalAssetManagementMemberpfg:SubsegmentPrincipalInternationalMember2022-12-310001126328pfg:GuaranteedPensionMembersrt:MaximumMembersrt:AsiaMemberpfg:MeasurementInputLongDurationInterestRateMemberpfg:SegmentPrincipalAssetManagementMemberpfg:SubsegmentPrincipalInternationalMember2022-12-310001126328us-gaap:VariableAnnuityMembersrt:WeightedAverageMemberus-gaap:MeasurementInputPriceVolatilityMemberpfg:SegmentRetirementAndIncomeSolutionsMember2022-12-310001126328us-gaap:VariableAnnuityMembersrt:WeightedAverageMemberus-gaap:MeasurementInputLapseRateMemberpfg:SegmentRetirementAndIncomeSolutionsMember2022-12-310001126328us-gaap:VariableAnnuityMembersrt:WeightedAverageMemberpfg:MeasurementInputNonPerformanceRiskMemberpfg:SegmentRetirementAndIncomeSolutionsMember2022-12-310001126328us-gaap:VariableAnnuityMembersrt:WeightedAverageMemberpfg:MeasurementInputLongDurationInterestRateMemberpfg:SegmentRetirementAndIncomeSolutionsMember2022-12-310001126328us-gaap:VariableAnnuityMembersrt:MinimumMemberus-gaap:MeasurementInputPriceVolatilityMemberpfg:SegmentRetirementAndIncomeSolutionsMember2022-12-310001126328us-gaap:VariableAnnuityMembersrt:MinimumMemberus-gaap:MeasurementInputLapseRateMemberpfg:SegmentRetirementAndIncomeSolutionsMember2022-12-310001126328us-gaap:VariableAnnuityMembersrt:MinimumMemberpfg:MeasurementInputNonPerformanceRiskMemberpfg:SegmentRetirementAndIncomeSolutionsMember2022-12-310001126328us-gaap:VariableAnnuityMembersrt:MinimumMemberpfg:MeasurementInputLongDurationInterestRateMemberpfg:SegmentRetirementAndIncomeSolutionsMember2022-12-310001126328us-gaap:VariableAnnuityMembersrt:MaximumMemberus-gaap:MeasurementInputPriceVolatilityMemberpfg:SegmentRetirementAndIncomeSolutionsMember2022-12-310001126328us-gaap:VariableAnnuityMembersrt:MaximumMemberus-gaap:MeasurementInputLapseRateMemberpfg:SegmentRetirementAndIncomeSolutionsMember2022-12-310001126328us-gaap:VariableAnnuityMembersrt:MaximumMemberpfg:MeasurementInputNonPerformanceRiskMemberpfg:SegmentRetirementAndIncomeSolutionsMember2022-12-310001126328us-gaap:VariableAnnuityMembersrt:MaximumMemberpfg:MeasurementInputLongDurationInterestRateMemberpfg:SegmentRetirementAndIncomeSolutionsMember2022-12-310001126328pfg:PrincipalLifeInsuranceCompanyConsolidatedMemberpfg:CreditFacilityMaturingOctober2027Member2023-12-310001126328pfg:PrincipalInternationalChileMemberpfg:UnsecuredLineOfCreditMember2023-12-310001126328pfg:OtherShortTermBorrowingsMemberpfg:UncollateralizedDebtMember2023-12-310001126328pfg:PrincipalLifeInsuranceCompanyConsolidatedMemberpfg:CreditFacilityMaturingOctober2027Member2022-12-310001126328pfg:PrincipalInternationalChileMemberpfg:UnsecuredLineOfCreditMember2022-12-310001126328us-gaap:FixedAnnuityMembersrt:ScenarioPreviouslyReportedMembersrt:LatinAmericaMemberpfg:SegmentPrincipalAssetManagementMemberpfg:SubsegmentPrincipalInternationalMember2020-12-310001126328us-gaap:FixedAnnuityMemberpfg:AociGainLossReversalAdjustmentLdtiMembersrt:LatinAmericaMemberpfg:SegmentPrincipalAssetManagementMemberpfg:SubsegmentPrincipalInternationalMember2020-12-310001126328us-gaap:FixedAnnuityMemberpfg:AociGainLossRemeasurementAdjustmentDiscountRateMembersrt:LatinAmericaMemberpfg:SegmentPrincipalAssetManagementMemberpfg:SubsegmentPrincipalInternationalMember2020-12-310001126328us-gaap:FixedAnnuityMemberpfg:AdjustmentFromEffectOfModifiedRetrospectiveApplicationLdtiMembersrt:LatinAmericaMemberpfg:SegmentPrincipalAssetManagementMemberpfg:SubsegmentPrincipalInternationalMember2020-12-310001126328us-gaap:TermLifeInsuranceMemberpfg:AociGainLossRemeasurementAdjustmentDiscountRateMemberpfg:SegmentBenefitsAndProtectionMemberpfg:SubsegmentLifeInsuranceMember2020-12-310001126328us-gaap:TermLifeInsuranceMemberpfg:AdjustmentFromEffectOfModifiedRetrospectiveApplicationLdtiMemberpfg:SegmentBenefitsAndProtectionMemberpfg:SubsegmentLifeInsuranceMember2020-12-310001126328pfg:IndividualDisabilityMemberpfg:AociGainLossReversalAdjustmentLdtiMemberpfg:SegmentBenefitsAndProtectionMemberpfg:SubsegmentSpecialtyBenefitsMember2020-12-310001126328pfg:IndividualDisabilityMemberpfg:AociGainLossRemeasurementAdjustmentDiscountRateMemberpfg:SegmentBenefitsAndProtectionMemberpfg:SubsegmentSpecialtyBenefitsMember2020-12-310001126328pfg:IndividualDisabilityMemberpfg:AdjustmentFromEffectOfModifiedRetrospectiveApplicationLdtiMemberpfg:SegmentBenefitsAndProtectionMemberpfg:SubsegmentSpecialtyBenefitsMember2020-12-310001126328us-gaap:FixedAnnuityMembersrt:ScenarioPreviouslyReportedMemberpfg:SegmentRetirementAndIncomeSolutionsMember2020-12-310001126328us-gaap:FixedAnnuityMemberpfg:AociGainLossReversalAdjustmentLdtiMemberpfg:SegmentRetirementAndIncomeSolutionsMember2020-12-310001126328us-gaap:FixedAnnuityMemberpfg:AociGainLossRemeasurementAdjustmentDiscountRateMemberpfg:SegmentRetirementAndIncomeSolutionsMember2020-12-310001126328us-gaap:FixedAnnuityMemberpfg:AdjustmentFromEffectOfModifiedRetrospectiveApplicationLdtiMemberpfg:SegmentRetirementAndIncomeSolutionsMember2020-12-310001126328pfg:PensionRiskTransferMembersrt:ScenarioPreviouslyReportedMemberpfg:SegmentRetirementAndIncomeSolutionsMember2020-12-310001126328pfg:PensionRiskTransferMemberpfg:AociGainLossReversalAdjustmentLdtiMemberpfg:SegmentRetirementAndIncomeSolutionsMember2020-12-310001126328pfg:PensionRiskTransferMemberpfg:AociGainLossRemeasurementAdjustmentDiscountRateMemberpfg:SegmentRetirementAndIncomeSolutionsMember2020-12-310001126328pfg:LongTermCareInsuranceMembersrt:ScenarioPreviouslyReportedMemberpfg:SegmentCorporateMember2020-12-310001126328pfg:LongTermCareInsuranceMemberpfg:AociGainLossRemeasurementAdjustmentDiscountRateMemberpfg:SegmentCorporateMember2020-12-310001126328pfg:LongTermCareInsuranceMemberpfg:AdjustmentFromEffectOfModifiedRetrospectiveApplicationLdtiMemberpfg:SegmentCorporateMember2020-12-310001126328pfg:AociGainLossReversalAdjustmentLdtiMemberpfg:SegmentRetirementAndIncomeSolutionsMember2020-12-310001126328pfg:AociGainLossReversalAdjustmentLdtiMemberpfg:SegmentBenefitsAndProtectionMember2020-12-310001126328pfg:AociGainLossRemeasurementAdjustmentDiscountRateMemberpfg:SegmentRetirementAndIncomeSolutionsMember2020-12-310001126328pfg:AociGainLossRemeasurementAdjustmentDiscountRateMemberpfg:SegmentBenefitsAndProtectionMember2020-12-310001126328pfg:AdjustmentFromEffectOfModifiedRetrospectiveApplicationLdtiMemberpfg:SegmentRetirementAndIncomeSolutionsMember2020-12-310001126328pfg:AdjustmentFromEffectOfModifiedRetrospectiveApplicationLdtiMemberpfg:SegmentBenefitsAndProtectionMember2020-12-310001126328pfg:AociGainLossReversalAdjustmentLdtiMember2020-12-310001126328pfg:AociGainLossRemeasurementAdjustmentDiscountRateMember2020-12-310001126328pfg:AdjustmentFromEffectOfModifiedRetrospectiveApplicationLdtiMember2020-12-310001126328us-gaap:FixedAnnuityMemberpfg:SegmentRetirementAndIncomeSolutionsMember2021-01-012021-12-310001126328pfg:LongTermCareInsuranceMemberpfg:SegmentCorporateMember2021-01-012021-12-310001126328us-gaap:ConsumerPortfolioSegmentMember2022-12-310001126328pfg:WMAdvisorsMember2023-12-310001126328pfg:WMAdvisorsMember2022-12-310001126328pfg:InvestmentContractMember2022-12-310001126328pfg:FixedMaturitiesSecuritiesAvailableForSaleMember2021-12-310001126328pfg:GuaranteesToUnconsolidatedTrustsUnderContingentFundingAgreementsMember2023-12-310001126328pfg:GuaranteesToThirdPartiesPrimarilyRelatedToFormerSubsidiariesAndJointVenturesMember2023-12-310001126328pfg:SegmentRetirementAndIncomeSolutionsMember2021-12-310001126328pfg:SegmentPrincipalAssetManagementMember2021-12-310001126328pfg:SegmentBenefitsAndProtectionMember2021-12-310001126328us-gaap:ForeignExchangeContractMemberus-gaap:CashFlowHedgingMemberus-gaap:ReclassificationOutOfAccumulatedOtherComprehensiveIncomeMember2023-01-012023-12-310001126328us-gaap:ForeignExchangeContractMemberus-gaap:CashFlowHedgingMemberus-gaap:ReclassificationOutOfAccumulatedOtherComprehensiveIncomeMember2022-01-012022-12-310001126328us-gaap:ForeignExchangeContractMemberus-gaap:CashFlowHedgingMemberus-gaap:ReclassificationOutOfAccumulatedOtherComprehensiveIncomeMember2021-01-012021-12-310001126328us-gaap:InterestRateContractMemberus-gaap:CashFlowHedgingMemberpfg:NetRealizedCapitalGainsLossesMember2023-01-012023-12-310001126328us-gaap:InterestRateContractMemberus-gaap:CashFlowHedgingMemberpfg:NetRealizedCapitalGainsLossesMember2022-01-012022-12-310001126328us-gaap:InterestRateContractMemberus-gaap:CashFlowHedgingMemberpfg:NetRealizedCapitalGainsLossesMember2021-01-012021-12-310001126328us-gaap:FairValueHedgingMemberpfg:NetInvestmentIncomeLossMember2023-01-012023-12-310001126328us-gaap:FairValueHedgingMemberpfg:BenefitsClaimsAndSettlementExpensesMember2023-01-012023-12-310001126328us-gaap:CashFlowHedgingMemberpfg:NetRealizedCapitalGainsLossesMember2023-01-012023-12-310001126328us-gaap:CashFlowHedgingMemberpfg:NetInvestmentIncomeLossMember2023-01-012023-12-310001126328us-gaap:CashFlowHedgingMemberpfg:BenefitsClaimsAndSettlementExpensesMember2023-01-012023-12-310001126328us-gaap:CashFlowHedgingMemberpfg:NetRealizedCapitalGainsLossesMember2022-01-012022-12-310001126328us-gaap:CashFlowHedgingMemberpfg:NetInvestmentIncomeLossMember2022-01-012022-12-310001126328us-gaap:CashFlowHedgingMemberpfg:BenefitsClaimsAndSettlementExpensesMember2022-01-012022-12-310001126328us-gaap:CashFlowHedgingMemberpfg:NetRealizedCapitalGainsLossesMember2021-01-012021-12-310001126328us-gaap:CashFlowHedgingMemberpfg:NetInvestmentIncomeLossMember2021-01-012021-12-310001126328us-gaap:CashFlowHedgingMemberpfg:BenefitsClaimsAndSettlementExpensesMember2021-01-012021-12-310001126328us-gaap:OtherInvestmentsMember2023-12-310001126328us-gaap:EquitySecuritiesMember2023-12-310001126328pfg:MortgageLoansMember2023-12-310001126328pfg:FixedMaturitiesTradingMember2023-12-310001126328pfg:FixedMaturitiesSecuritiesAvailableForSaleMember2023-12-310001126328pfg:AssetsCashAndCashEquivalentsMember2023-12-310001126328pfg:AccruedInterestIncomeReceivableMember2023-12-310001126328us-gaap:OtherInvestmentsMember2022-12-310001126328us-gaap:EquitySecuritiesMember2022-12-310001126328pfg:MortgageLoansMember2022-12-310001126328pfg:FixedMaturitiesTradingMember2022-12-310001126328pfg:FixedMaturitiesSecuritiesAvailableForSaleMember2022-12-310001126328pfg:AssetsCashAndCashEquivalentsMember2022-12-310001126328pfg:AccruedInterestIncomeReceivableMember2022-12-310001126328pfg:ReinsuranceRecoverablesMember2023-01-012023-12-310001126328us-gaap:ResidentialMortgageMemberus-gaap:FinancingReceivablesEqualToGreaterThan90DaysPastDueMember2023-12-310001126328us-gaap:ResidentialMortgageMemberus-gaap:FinancingReceivables60To89DaysPastDueMember2023-12-310001126328us-gaap:ResidentialMortgageMemberus-gaap:FinancingReceivables30To59DaysPastDueMember2023-12-310001126328us-gaap:ResidentialMortgageMemberus-gaap:FinancialAssetPastDueMember2023-12-310001126328us-gaap:ResidentialMortgageMemberus-gaap:FinancialAssetNotPastDueMember2023-12-310001126328us-gaap:ConsumerPortfolioSegmentMemberus-gaap:FinancingReceivablesEqualToGreaterThan90DaysPastDueMember2023-12-310001126328us-gaap:ConsumerPortfolioSegmentMemberus-gaap:FinancingReceivables60To89DaysPastDueMember2023-12-310001126328us-gaap:ConsumerPortfolioSegmentMemberus-gaap:FinancingReceivables30To59DaysPastDueMember2023-12-310001126328us-gaap:ConsumerPortfolioSegmentMemberus-gaap:FinancialAssetPastDueMember2023-12-310001126328us-gaap:ConsumerPortfolioSegmentMemberus-gaap:FinancialAssetNotPastDueMember2023-12-310001126328us-gaap:CommercialRealEstatePortfolioSegmentMemberus-gaap:FinancingReceivablesEqualToGreaterThan90DaysPastDueMember2023-12-310001126328us-gaap:CommercialRealEstatePortfolioSegmentMemberus-gaap:FinancingReceivables60To89DaysPastDueMember2023-12-310001126328us-gaap:CommercialRealEstatePortfolioSegmentMemberus-gaap:FinancingReceivables30To59DaysPastDueMember2023-12-310001126328us-gaap:CommercialRealEstatePortfolioSegmentMemberus-gaap:FinancialAssetPastDueMember2023-12-310001126328us-gaap:CommercialRealEstatePortfolioSegmentMemberus-gaap:FinancialAssetNotPastDueMember2023-12-310001126328pfg:StandardPoorsBPlusAndBelowRatingMemberus-gaap:CommercialRealEstatePortfolioSegmentMember2023-12-310001126328pfg:StandardPoorsBBPlusThruBBMinusRatingMemberus-gaap:CommercialRealEstatePortfolioSegmentMember2023-12-310001126328pfg:StandardPoorsBBBPlusThruBBBMinusRatingMemberus-gaap:CommercialRealEstatePortfolioSegmentMember2023-12-310001126328pfg:StandardPoorsAMinusAndAboveRatingMemberus-gaap:CommercialRealEstatePortfolioSegmentMember2023-12-310001126328pfg:PerformingMemberus-gaap:ResidentialMortgageMember2023-12-310001126328pfg:PerformingMemberus-gaap:ConsumerPortfolioSegmentMember2023-12-310001126328pfg:NonperformingMemberus-gaap:ResidentialMortgageMember2023-12-310001126328pfg:NonperformingMemberus-gaap:ConsumerPortfolioSegmentMember2023-12-310001126328us-gaap:ConsumerPortfolioSegmentMember2023-12-310001126328us-gaap:ResidentialMortgageMemberus-gaap:FinancingReceivablesEqualToGreaterThan90DaysPastDueMember2022-12-310001126328us-gaap:ResidentialMortgageMemberus-gaap:FinancingReceivables60To89DaysPastDueMember2022-12-310001126328us-gaap:ResidentialMortgageMemberus-gaap:FinancingReceivables30To59DaysPastDueMember2022-12-310001126328us-gaap:ResidentialMortgageMemberus-gaap:FinancialAssetPastDueMember2022-12-310001126328us-gaap:ResidentialMortgageMemberus-gaap:FinancialAssetNotPastDueMember2022-12-310001126328us-gaap:CommercialRealEstatePortfolioSegmentMemberus-gaap:FinancingReceivablesEqualToGreaterThan90DaysPastDueMember2022-12-310001126328us-gaap:CommercialRealEstatePortfolioSegmentMemberus-gaap:FinancingReceivables60To89DaysPastDueMember2022-12-310001126328us-gaap:CommercialRealEstatePortfolioSegmentMemberus-gaap:FinancingReceivables30To59DaysPastDueMember2022-12-310001126328us-gaap:CommercialRealEstatePortfolioSegmentMemberus-gaap:FinancialAssetPastDueMember2022-12-310001126328us-gaap:CommercialRealEstatePortfolioSegmentMemberus-gaap:FinancialAssetNotPastDueMember2022-12-310001126328us-gaap:ResidentialMortgageMember2022-01-012022-12-310001126328us-gaap:ResidentialMortgageMember2021-01-012021-12-310001126328us-gaap:CommercialRealEstatePortfolioSegmentMember2021-01-012021-12-310001126328pfg:ReinsuranceRecoverablesMember2023-12-310001126328pfg:ReinsuranceRecoverablesMember2022-12-310001126328pfg:ReinsuranceRecoverablesMember2021-12-310001126328us-gaap:ResidentialMortgageMember2020-12-310001126328us-gaap:CommercialRealEstatePortfolioSegmentMember2020-12-310001126328pfg:ReinsuranceRecoverablesMember2020-12-310001126328us-gaap:AssetPledgedAsCollateralWithRightMember2023-12-310001126328us-gaap:AssetPledgedAsCollateralWithRightMember2022-12-310001126328pfg:CertainOtherLoansOfConsolidatedVariableInterestEntityMember2023-01-012023-12-310001126328us-gaap:EquityMethodInvestmentsMember2021-01-012021-12-310001126328us-gaap:FairValueMeasurementsRecurringMember2020-12-310001126328pfg:InvestmentAndUniversalLifeContractsMemberus-gaap:FairValueMeasurementsRecurringMember2023-12-310001126328pfg:InvestmentAndUniversalLifeContractsMemberus-gaap:FairValueMeasurementsRecurringMember2022-12-310001126328pfg:InvestmentAndUniversalLifeContractsMemberus-gaap:FairValueMeasurementsRecurringMember2021-12-310001126328pfg:InvestmentAndUniversalLifeContractsMemberus-gaap:FairValueMeasurementsRecurringMember2020-12-310001126328us-gaap:USStatesAndPoliticalSubdivisionsMemberus-gaap:FairValueMeasurementsRecurringMemberpfg:AvailableForSaleSecurityMember2023-12-310001126328us-gaap:OtherDebtSecuritiesMemberus-gaap:FairValueMeasurementsRecurringMemberpfg:AvailableForSaleSecurityMember2023-12-310001126328us-gaap:DebtSecuritiesMemberus-gaap:FairValueMeasurementsRecurringMemberpfg:AvailableForSaleSecurityMember2023-12-310001126328us-gaap:CorporateDebtSecuritiesMemberus-gaap:FairValueMeasurementsRecurringMemberpfg:AvailableForSaleSecurityMember2023-12-310001126328us-gaap:CommercialMortgageBackedSecuritiesMemberus-gaap:FairValueMeasurementsRecurringMemberpfg:AvailableForSaleSecurityMember2023-12-310001126328us-gaap:CollateralizedDebtObligationsMemberus-gaap:FairValueMeasurementsRecurringMemberpfg:AvailableForSaleSecurityMember2023-12-310001126328us-gaap:FixedMaturitiesMemberus-gaap:FairValueMeasurementsRecurringMember2023-12-310001126328pfg:SeparateAccountAssetsMemberus-gaap:FairValueMeasurementsRecurringMember2023-12-310001126328pfg:InvestmentsOtherMemberus-gaap:FairValueMeasurementsRecurringMember2023-12-310001126328pfg:FundsWithheldPayableEmbeddedDerivativeMemberus-gaap:FairValueMeasurementsRecurringMember2023-12-310001126328us-gaap:USStatesAndPoliticalSubdivisionsMemberus-gaap:FairValueMeasurementsRecurringMemberpfg:AvailableForSaleSecurityMember2022-12-310001126328us-gaap:OtherDebtSecuritiesMemberus-gaap:FairValueMeasurementsRecurringMemberpfg:AvailableForSaleSecurityMember2022-12-310001126328us-gaap:DebtSecuritiesMemberus-gaap:FairValueMeasurementsRecurringMemberpfg:AvailableForSaleSecurityMember2022-12-310001126328us-gaap:CorporateDebtSecuritiesMemberus-gaap:FairValueMeasurementsRecurringMemberpfg:AvailableForSaleSecurityMember2022-12-310001126328us-gaap:CommercialMortgageBackedSecuritiesMemberus-gaap:FairValueMeasurementsRecurringMemberpfg:AvailableForSaleSecurityMember2022-12-310001126328us-gaap:CollateralizedDebtObligationsMemberus-gaap:FairValueMeasurementsRecurringMemberpfg:AvailableForSaleSecurityMember2022-12-310001126328us-gaap:FixedMaturitiesMemberus-gaap:FairValueMeasurementsRecurringMember2022-12-310001126328pfg:SeparateAccountAssetsMemberus-gaap:FairValueMeasurementsRecurringMember2022-12-310001126328pfg:InvestmentsOtherMemberus-gaap:FairValueMeasurementsRecurringMember2022-12-310001126328pfg:FundsWithheldPayableEmbeddedDerivativeMemberus-gaap:FairValueMeasurementsRecurringMember2022-12-310001126328us-gaap:USStatesAndPoliticalSubdivisionsMemberus-gaap:FairValueMeasurementsRecurringMemberpfg:AvailableForSaleSecurityMember2021-12-310001126328us-gaap:OtherDebtSecuritiesMemberus-gaap:FairValueMeasurementsRecurringMemberpfg:AvailableForSaleSecurityMember2021-12-310001126328us-gaap:DebtSecuritiesMemberus-gaap:FairValueMeasurementsRecurringMemberpfg:AvailableForSaleSecurityMember2021-12-310001126328us-gaap:CorporateDebtSecuritiesMemberus-gaap:FairValueMeasurementsRecurringMemberpfg:AvailableForSaleSecurityMember2021-12-310001126328us-gaap:CommercialMortgageBackedSecuritiesMemberus-gaap:FairValueMeasurementsRecurringMemberpfg:AvailableForSaleSecurityMember2021-12-310001126328us-gaap:CollateralizedDebtObligationsMemberus-gaap:FairValueMeasurementsRecurringMemberpfg:AvailableForSaleSecurityMember2021-12-310001126328us-gaap:FixedMaturitiesMemberus-gaap:FairValueMeasurementsRecurringMember2021-12-310001126328pfg:SeparateAccountAssetsMemberus-gaap:FairValueMeasurementsRecurringMember2021-12-310001126328pfg:InvestmentsOtherMemberus-gaap:FairValueMeasurementsRecurringMember2021-12-310001126328us-gaap:OtherDebtSecuritiesMemberus-gaap:FairValueMeasurementsRecurringMemberpfg:AvailableForSaleSecurityMember2020-12-310001126328us-gaap:DebtSecuritiesMemberus-gaap:FairValueMeasurementsRecurringMemberpfg:AvailableForSaleSecurityMember2020-12-310001126328us-gaap:CorporateDebtSecuritiesMemberus-gaap:FairValueMeasurementsRecurringMemberpfg:AvailableForSaleSecurityMember2020-12-310001126328us-gaap:CommercialMortgageBackedSecuritiesMemberus-gaap:FairValueMeasurementsRecurringMemberpfg:AvailableForSaleSecurityMember2020-12-310001126328us-gaap:CollateralizedDebtObligationsMemberus-gaap:FairValueMeasurementsRecurringMemberpfg:AvailableForSaleSecurityMember2020-12-310001126328pfg:SeparateAccountAssetsMemberus-gaap:FairValueMeasurementsRecurringMember2020-12-310001126328pfg:InvestmentsOtherMemberus-gaap:FairValueMeasurementsRecurringMember2020-12-310001126328us-gaap:CommercialMortgageBackedSecuritiesMemberus-gaap:FairValueMeasurementsRecurringMemberpfg:AvailableForSaleSecurityMember2023-01-012023-12-310001126328us-gaap:FixedMaturitiesMemberus-gaap:FairValueMeasurementsRecurringMember2021-01-012021-12-310001126328pfg:InvestmentsOtherMemberus-gaap:FairValueMeasurementsRecurringMember2022-01-012022-12-310001126328us-gaap:FixedMaturitiesMemberus-gaap:FairValueMeasurementsRecurringMember2023-01-012023-12-310001126328us-gaap:FixedMaturitiesMemberus-gaap:FairValueMeasurementsRecurringMember2022-01-012022-12-310001126328us-gaap:FairValueMeasuredAtNetAssetValuePerShareMember2023-12-310001126328us-gaap:FairValueMeasuredAtNetAssetValuePerShareMember2022-12-310001126328pfg:EquityMethodInvestmentsNetInvestmentInUnconsolidatedEntitiesMember2023-12-310001126328pfg:EquityMethodInvestmentsNetInvestmentInUnconsolidatedEntitiesMember2022-12-310001126328us-gaap:EmployeeStockOptionMember2022-01-012022-12-310001126328us-gaap:EmployeeStockOptionMember2021-01-012021-12-310001126328us-gaap:EmployeeStockOptionMember2023-01-012023-12-310001126328us-gaap:RestrictedStockUnitsRSUMember2023-12-310001126328us-gaap:PerformanceSharesMember2023-12-310001126328us-gaap:EmployeeStockOptionMember2023-12-310001126328us-gaap:FairValueInputsLevel3Memberpfg:InvestmentAndUniversalLifeContractsMemberus-gaap:FairValueMeasurementsRecurringMember2023-12-310001126328us-gaap:FairValueInputsLevel3Memberpfg:InvestmentAndUniversalLifeContractsMemberus-gaap:FairValueMeasurementsRecurringMember2022-12-310001126328srt:WeightedAverageMemberus-gaap:FairValueInputsLevel3Memberpfg:InvestmentAndUniversalLifeContractsMemberus-gaap:FairValueMeasurementsRecurringMemberus-gaap:MeasurementInputPriceVolatilityMemberus-gaap:ValuationTechniqueDiscountedCashFlowMember2023-12-310001126328srt:WeightedAverageMemberus-gaap:FairValueInputsLevel3Memberpfg:InvestmentAndUniversalLifeContractsMemberus-gaap:FairValueMeasurementsRecurringMemberus-gaap:MeasurementInputLapseRateMemberus-gaap:ValuationTechniqueDiscountedCashFlowMember2023-12-310001126328srt:WeightedAverageMemberus-gaap:FairValueInputsLevel3Memberpfg:InvestmentAndUniversalLifeContractsMemberus-gaap:FairValueMeasurementsRecurringMemberpfg:MeasurementInputNonPerformanceRiskMemberus-gaap:ValuationTechniqueDiscountedCashFlowMember2023-12-310001126328srt:WeightedAverageMemberus-gaap:FairValueInputsLevel3Memberpfg:InvestmentAndUniversalLifeContractsMemberus-gaap:FairValueMeasurementsRecurringMemberpfg:MeasurementInputLongDurationInterestRateMemberus-gaap:ValuationTechniqueDiscountedCashFlowMember2023-12-310001126328srt:MinimumMemberus-gaap:FairValueInputsLevel3Memberpfg:InvestmentAndUniversalLifeContractsMemberus-gaap:FairValueMeasurementsRecurringMemberus-gaap:MeasurementInputPriceVolatilityMemberus-gaap:ValuationTechniqueDiscountedCashFlowMember2023-12-310001126328srt:MinimumMemberus-gaap:FairValueInputsLevel3Memberpfg:InvestmentAndUniversalLifeContractsMemberus-gaap:FairValueMeasurementsRecurringMemberus-gaap:MeasurementInputLapseRateMemberus-gaap:ValuationTechniqueDiscountedCashFlowMember2023-12-310001126328srt:MinimumMemberus-gaap:FairValueInputsLevel3Memberpfg:InvestmentAndUniversalLifeContractsMemberus-gaap:FairValueMeasurementsRecurringMemberpfg:MeasurementInputNonPerformanceRiskMemberus-gaap:ValuationTechniqueDiscountedCashFlowMember2023-12-310001126328srt:MinimumMemberus-gaap:FairValueInputsLevel3Memberpfg:InvestmentAndUniversalLifeContractsMemberus-gaap:FairValueMeasurementsRecurringMemberpfg:MeasurementInputLongDurationInterestRateMemberus-gaap:ValuationTechniqueDiscountedCashFlowMember2023-12-310001126328srt:MaximumMemberus-gaap:FairValueInputsLevel3Memberpfg:InvestmentAndUniversalLifeContractsMemberus-gaap:FairValueMeasurementsRecurringMemberus-gaap:MeasurementInputPriceVolatilityMemberus-gaap:ValuationTechniqueDiscountedCashFlowMember2023-12-310001126328srt:MaximumMemberus-gaap:FairValueInputsLevel3Memberpfg:InvestmentAndUniversalLifeContractsMemberus-gaap:FairValueMeasurementsRecurringMemberus-gaap:MeasurementInputLapseRateMemberus-gaap:ValuationTechniqueDiscountedCashFlowMember2023-12-310001126328srt:MaximumMemberus-gaap:FairValueInputsLevel3Memberpfg:InvestmentAndUniversalLifeContractsMemberus-gaap:FairValueMeasurementsRecurringMemberpfg:MeasurementInputNonPerformanceRiskMemberus-gaap:ValuationTechniqueDiscountedCashFlowMember2023-12-310001126328srt:MaximumMemberus-gaap:FairValueInputsLevel3Memberpfg:InvestmentAndUniversalLifeContractsMemberus-gaap:FairValueMeasurementsRecurringMemberpfg:MeasurementInputLongDurationInterestRateMemberus-gaap:ValuationTechniqueDiscountedCashFlowMember2023-12-310001126328srt:WeightedAverageMemberus-gaap:FairValueInputsLevel3Memberpfg:InvestmentAndUniversalLifeContractsMemberus-gaap:FairValueMeasurementsRecurringMemberus-gaap:MeasurementInputPriceVolatilityMemberus-gaap:ValuationTechniqueDiscountedCashFlowMember2022-12-310001126328srt:WeightedAverageMemberus-gaap:FairValueInputsLevel3Memberpfg:InvestmentAndUniversalLifeContractsMemberus-gaap:FairValueMeasurementsRecurringMemberus-gaap:MeasurementInputLapseRateMemberus-gaap:ValuationTechniqueDiscountedCashFlowMember2022-12-310001126328srt:WeightedAverageMemberus-gaap:FairValueInputsLevel3Memberpfg:InvestmentAndUniversalLifeContractsMemberus-gaap:FairValueMeasurementsRecurringMemberpfg:MeasurementInputNonPerformanceRiskMemberus-gaap:ValuationTechniqueDiscountedCashFlowMember2022-12-310001126328srt:MinimumMemberus-gaap:FairValueInputsLevel3Memberpfg:InvestmentAndUniversalLifeContractsMemberus-gaap:FairValueMeasurementsRecurringMemberus-gaap:MeasurementInputPriceVolatilityMemberus-gaap:ValuationTechniqueDiscountedCashFlowMember2022-12-310001126328srt:MinimumMemberus-gaap:FairValueInputsLevel3Memberpfg:InvestmentAndUniversalLifeContractsMemberus-gaap:FairValueMeasurementsRecurringMemberpfg:MeasurementInputLongDurationInterestRateMemberus-gaap:ValuationTechniqueDiscountedCashFlowMember2022-12-310001126328srt:MaximumMemberus-gaap:FairValueInputsLevel3Memberpfg:InvestmentAndUniversalLifeContractsMemberus-gaap:FairValueMeasurementsRecurringMemberus-gaap:MeasurementInputPriceVolatilityMemberus-gaap:ValuationTechniqueDiscountedCashFlowMember2022-12-310001126328srt:MaximumMemberus-gaap:FairValueInputsLevel3Memberpfg:InvestmentAndUniversalLifeContractsMemberus-gaap:FairValueMeasurementsRecurringMemberpfg:MeasurementInputLongDurationInterestRateMemberus-gaap:ValuationTechniqueDiscountedCashFlowMember2022-12-310001126328us-gaap:FairValueInputsLevel3Memberpfg:InvestmentAndUniversalLifeContractsMemberus-gaap:FairValueMeasurementsRecurringMemberus-gaap:MeasurementInputLapseRateMemberus-gaap:ValuationTechniqueDiscountedCashFlowMember2022-12-310001126328us-gaap:FairValueInputsLevel3Memberpfg:InvestmentAndUniversalLifeContractsMemberus-gaap:FairValueMeasurementsRecurringMemberpfg:MeasurementInputNonPerformanceRiskMemberus-gaap:ValuationTechniqueDiscountedCashFlowMember2022-12-310001126328pfg:SegmentPrincipalAssetManagementMemberpfg:SubsegmentPrincipalInternationalMember2023-01-012023-12-310001126328pfg:SegmentPrincipalAssetManagementMemberpfg:SubsegmentPrincipalGlobalInvestorsMember2023-01-012023-12-310001126328pfg:SegmentBenefitsAndProtectionMemberpfg:SubsegmentLifeInsuranceMember2023-01-012023-12-310001126328pfg:StandardPoorsBBPlusThruBBMinusRatingMember2023-12-310001126328pfg:StandardPoorsBBBPlusThruBBBMinusRatingMember2023-12-310001126328pfg:StandardPoorsAMinusAndAboveRatingMember2023-12-310001126328pfg:StandardPoorsBPlusAndBelowRatingMember2022-12-310001126328us-gaap:FinanceLeasesPortfolioSegmentMember2023-12-310001126328us-gaap:FinanceLeasesPortfolioSegmentMember2022-12-310001126328us-gaap:FinanceLeasesPortfolioSegmentMember2021-12-310001126328us-gaap:FinanceLeasesPortfolioSegmentMember2020-12-310001126328us-gaap:SingleStockFutureMember2023-12-310001126328us-gaap:EmbeddedDerivativeFinancialInstrumentsMember2023-12-310001126328pfg:InterestRateFutureMember2023-12-310001126328us-gaap:SingleStockFutureMember2022-12-310001126328us-gaap:EmbeddedDerivativeFinancialInstrumentsMember2022-12-310001126328pfg:InterestRateFutureMember2022-12-310001126328us-gaap:OtherContractMember2023-01-012023-12-310001126328us-gaap:InterestRateContractMember2023-01-012023-12-310001126328us-gaap:ForeignExchangeContractMember2023-01-012023-12-310001126328us-gaap:EquityContractMember2023-01-012023-12-310001126328us-gaap:CreditRiskContractMember2023-01-012023-12-310001126328us-gaap:OtherContractMember2022-01-012022-12-310001126328us-gaap:InterestRateContractMember2022-01-012022-12-310001126328us-gaap:ForeignExchangeContractMember2022-01-012022-12-310001126328us-gaap:EquityContractMember2022-01-012022-12-310001126328us-gaap:CreditRiskContractMember2022-01-012022-12-310001126328us-gaap:OtherContractMember2021-01-012021-12-310001126328us-gaap:InterestRateContractMember2021-01-012021-12-310001126328us-gaap:ForeignExchangeContractMember2021-01-012021-12-310001126328us-gaap:EquityContractMember2021-01-012021-12-310001126328us-gaap:CreditRiskContractMember2021-01-012021-12-310001126328pfg:SegmentCorporateMember2023-01-012023-12-310001126328pfg:SegmentCorporateMember2022-01-012022-12-310001126328pfg:SegmentCorporateMember2021-01-012021-12-310001126328us-gaap:QualifiedPlanMemberpfg:DefinedContributionPlanGeneralParticipantMember2023-01-012023-12-310001126328us-gaap:NonqualifiedPlanMemberpfg:DefinedContributionPlanGrandfatheredChoiceParticipantMember2023-01-012023-12-310001126328us-gaap:NonqualifiedPlanMemberpfg:DefinedContributionPlanGeneralParticipantMember2023-01-012023-12-310001126328srt:MinimumMemberus-gaap:FixedIncomeSecuritiesMemberus-gaap:PensionPlansDefinedBenefitMember2023-12-310001126328srt:MinimumMemberus-gaap:DefinedBenefitPlanEquitySecuritiesMemberus-gaap:PensionPlansDefinedBenefitMember2023-12-310001126328srt:MinimumMemberpfg:PrivateInvestmentsMemberus-gaap:PensionPlansDefinedBenefitMember2023-12-310001126328srt:MaximumMemberus-gaap:FixedIncomeSecuritiesMemberus-gaap:PensionPlansDefinedBenefitMember2023-12-310001126328srt:MaximumMemberus-gaap:DefinedBenefitPlanEquitySecuritiesMemberus-gaap:PensionPlansDefinedBenefitMember2023-12-310001126328srt:MaximumMemberpfg:PrivateInvestmentsMemberus-gaap:PensionPlansDefinedBenefitMember2023-12-310001126328us-gaap:USTreasuryAndGovernmentMemberus-gaap:FairValueInputsLevel1Memberpfg:SingleClientSeparateAccountInvestmentsMemberus-gaap:PensionPlansDefinedBenefitMember2023-12-310001126328us-gaap:USStatesAndPoliticalSubdivisionsMemberus-gaap:FairValueInputsLevel2Memberpfg:SingleClientSeparateAccountInvestmentsMemberus-gaap:PensionPlansDefinedBenefitMember2023-12-310001126328us-gaap:FixedIncomeSecuritiesMemberus-gaap:FairValueInputsLevel2Memberpfg:PooledSeparateAccountInvestmentsMemberus-gaap:PensionPlansDefinedBenefitMember2023-12-310001126328us-gaap:DefinedBenefitPlanRealEstateMemberus-gaap:FairValueInputsLevel2Memberpfg:PooledSeparateAccountInvestmentsMemberus-gaap:PensionPlansDefinedBenefitMember2023-12-310001126328us-gaap:DefinedBenefitPlanEquitySecuritiesUsLargeCapMemberus-gaap:FairValueInputsLevel2Memberpfg:PooledSeparateAccountInvestmentsMemberus-gaap:PensionPlansDefinedBenefitMember2023-12-310001126328us-gaap:DefinedBenefitPlanEquitySecuritiesNonUsMemberus-gaap:FairValueInputsLevel2Memberpfg:PooledSeparateAccountInvestmentsMemberus-gaap:PensionPlansDefinedBenefitMember2023-12-310001126328us-gaap:CorporateDebtSecuritiesMemberus-gaap:FairValueInputsLevel2Memberpfg:SingleClientSeparateAccountInvestmentsMemberus-gaap:PensionPlansDefinedBenefitMember2023-12-310001126328pfg:SingleClientSeparateAccountsInvestedInPooledSeparateAccountMemberus-gaap:FairValueInputsLevel2Memberpfg:SingleClientSeparateAccountInvestmentsMemberus-gaap:PensionPlansDefinedBenefitMember2023-12-310001126328pfg:OtherPlanAssetsMemberus-gaap:FairValueInputsLevel2Memberpfg:SingleClientSeparateAccountInvestmentsMemberus-gaap:PensionPlansDefinedBenefitMember2023-12-310001126328pfg:DefinedBenefitPlanEquitySecuritiesUsSmallMidCapMemberus-gaap:FairValueInputsLevel2Memberpfg:PooledSeparateAccountInvestmentsMemberus-gaap:PensionPlansDefinedBenefitMember2023-12-310001126328pfg:BalancedAssetAllocationPortfoliosMemberus-gaap:FairValueInputsLevel2Memberpfg:PooledSeparateAccountInvestmentsMemberus-gaap:PensionPlansDefinedBenefitMember2023-12-310001126328us-gaap:USTreasuryAndGovernmentMemberpfg:SingleClientSeparateAccountInvestmentsMemberus-gaap:PensionPlansDefinedBenefitMember2023-12-310001126328us-gaap:USStatesAndPoliticalSubdivisionsMemberpfg:SingleClientSeparateAccountInvestmentsMemberus-gaap:PensionPlansDefinedBenefitMember2023-12-310001126328us-gaap:FixedIncomeSecuritiesMemberus-gaap:FairValueInputsLevel1Memberus-gaap:OtherPostretirementBenefitPlansDefinedBenefitMember2023-12-310001126328us-gaap:FixedIncomeSecuritiesMemberpfg:PooledSeparateAccountInvestmentsMemberus-gaap:PensionPlansDefinedBenefitMember2023-12-310001126328us-gaap:DefinedBenefitPlanRealEstateMemberpfg:PooledSeparateAccountInvestmentsMemberus-gaap:PensionPlansDefinedBenefitMember2023-12-310001126328us-gaap:DefinedBenefitPlanEquitySecuritiesUsMemberus-gaap:FairValueInputsLevel1Memberus-gaap:OtherPostretirementBenefitPlansDefinedBenefitMember2023-12-310001126328us-gaap:DefinedBenefitPlanEquitySecuritiesUsLargeCapMemberpfg:PooledSeparateAccountInvestmentsMemberus-gaap:PensionPlansDefinedBenefitMember2023-12-310001126328us-gaap:DefinedBenefitPlanEquitySecuritiesNonUsMemberus-gaap:FairValueInputsLevel1Memberus-gaap:OtherPostretirementBenefitPlansDefinedBenefitMember2023-12-310001126328us-gaap:DefinedBenefitPlanEquitySecuritiesNonUsMemberpfg:PooledSeparateAccountInvestmentsMemberus-gaap:PensionPlansDefinedBenefitMember2023-12-310001126328us-gaap:DefinedBenefitPlanCashAndCashEquivalentsMemberus-gaap:FairValueInputsLevel1Memberus-gaap:OtherPostretirementBenefitPlansDefinedBenefitMember2023-12-310001126328us-gaap:CorporateDebtSecuritiesMemberpfg:SingleClientSeparateAccountInvestmentsMemberus-gaap:PensionPlansDefinedBenefitMember2023-12-310001126328pfg:SingleClientSeparateAccountsInvestedInPooledSeparateAccountMemberpfg:SingleClientSeparateAccountInvestmentsMemberus-gaap:PensionPlansDefinedBenefitMember2023-12-310001126328pfg:OtherPlanAssetsMemberpfg:SingleClientSeparateAccountInvestmentsMemberus-gaap:PensionPlansDefinedBenefitMember2023-12-310001126328pfg:DefinedBenefitPlanEquitySecuritiesUsSmallMidCapMemberpfg:PooledSeparateAccountInvestmentsMemberus-gaap:PensionPlansDefinedBenefitMember2023-12-310001126328pfg:BalancedAssetAllocationPortfoliosMemberpfg:PooledSeparateAccountInvestmentsMemberus-gaap:PensionPlansDefinedBenefitMember2023-12-310001126328us-gaap:FixedIncomeSecuritiesMemberus-gaap:OtherPostretirementBenefitPlansDefinedBenefitMember2023-12-310001126328us-gaap:FairValueInputsLevel2Memberus-gaap:PensionPlansDefinedBenefitMember2023-12-310001126328us-gaap:FairValueInputsLevel1Memberus-gaap:PensionPlansDefinedBenefitMember2023-12-310001126328us-gaap:FairValueInputsLevel1Memberus-gaap:OtherPostretirementBenefitPlansDefinedBenefitMember2023-12-310001126328us-gaap:DefinedBenefitPlanEquitySecuritiesUsMemberus-gaap:OtherPostretirementBenefitPlansDefinedBenefitMember2023-12-310001126328us-gaap:DefinedBenefitPlanEquitySecuritiesNonUsMemberus-gaap:OtherPostretirementBenefitPlansDefinedBenefitMember2023-12-310001126328us-gaap:DefinedBenefitPlanCashAndCashEquivalentsMemberus-gaap:OtherPostretirementBenefitPlansDefinedBenefitMember2023-12-310001126328us-gaap:USTreasuryAndGovernmentMemberus-gaap:FairValueInputsLevel1Memberpfg:SingleClientSeparateAccountInvestmentsMemberus-gaap:PensionPlansDefinedBenefitMember2022-12-310001126328us-gaap:USStatesAndPoliticalSubdivisionsMemberus-gaap:FairValueInputsLevel2Memberpfg:SingleClientSeparateAccountInvestmentsMemberus-gaap:PensionPlansDefinedBenefitMember2022-12-310001126328us-gaap:OtherDebtSecuritiesMemberus-gaap:FairValueInputsLevel2Memberpfg:SingleClientSeparateAccountInvestmentsMemberus-gaap:PensionPlansDefinedBenefitMember2022-12-310001126328us-gaap:HedgeFundsMemberus-gaap:FairValueMeasuredAtNetAssetValuePerShareMemberpfg:SingleClientSeparateAccountInvestmentsMemberus-gaap:PensionPlansDefinedBenefitMember2022-12-310001126328us-gaap:DefinedBenefitPlanRealEstateMemberus-gaap:FairValueInputsLevel2Memberpfg:PooledSeparateAccountInvestmentsMemberus-gaap:PensionPlansDefinedBenefitMember2022-12-310001126328us-gaap:DefinedBenefitPlanEquitySecuritiesUsLargeCapMemberus-gaap:FairValueInputsLevel2Memberpfg:PooledSeparateAccountInvestmentsMemberus-gaap:PensionPlansDefinedBenefitMember2022-12-310001126328us-gaap:DefinedBenefitPlanEquitySecuritiesNonUsMemberus-gaap:FairValueInputsLevel2Memberpfg:PooledSeparateAccountInvestmentsMemberus-gaap:PensionPlansDefinedBenefitMember2022-12-310001126328us-gaap:CorporateDebtSecuritiesMemberus-gaap:FairValueInputsLevel2Memberpfg:SingleClientSeparateAccountInvestmentsMemberus-gaap:PensionPlansDefinedBenefitMember2022-12-310001126328us-gaap:CommercialMortgageBackedSecuritiesMemberus-gaap:FairValueInputsLevel2Memberpfg:SingleClientSeparateAccountInvestmentsMemberus-gaap:PensionPlansDefinedBenefitMember2022-12-310001126328pfg:SingleClientSeparateAccountsInvestedInPooledSeparateAccountMemberus-gaap:FairValueInputsLevel2Memberpfg:SingleClientSeparateAccountInvestmentsMemberus-gaap:PensionPlansDefinedBenefitMember2022-12-310001126328pfg:OtherPlanAssetsMemberus-gaap:FairValueInputsLevel2Memberpfg:SingleClientSeparateAccountInvestmentsMemberus-gaap:PensionPlansDefinedBenefitMember2022-12-310001126328pfg:DefinedBenefitPlanEquitySecuritiesUsSmallMidCapMemberus-gaap:FairValueInputsLevel2Memberpfg:PooledSeparateAccountInvestmentsMemberus-gaap:PensionPlansDefinedBenefitMember2022-12-310001126328pfg:BalancedAssetAllocationPortfoliosMemberus-gaap:FairValueInputsLevel2Memberpfg:PooledSeparateAccountInvestmentsMemberus-gaap:PensionPlansDefinedBenefitMember2022-12-310001126328us-gaap:USTreasuryAndGovernmentMemberpfg:SingleClientSeparateAccountInvestmentsMemberus-gaap:PensionPlansDefinedBenefitMember2022-12-310001126328us-gaap:USStatesAndPoliticalSubdivisionsMemberpfg:SingleClientSeparateAccountInvestmentsMemberus-gaap:PensionPlansDefinedBenefitMember2022-12-310001126328us-gaap:OtherDebtSecuritiesMemberpfg:SingleClientSeparateAccountInvestmentsMemberus-gaap:PensionPlansDefinedBenefitMember2022-12-310001126328us-gaap:HedgeFundsMemberpfg:SingleClientSeparateAccountInvestmentsMemberus-gaap:PensionPlansDefinedBenefitMember2022-12-310001126328us-gaap:FixedIncomeSecuritiesMemberus-gaap:FairValueInputsLevel1Memberus-gaap:OtherPostretirementBenefitPlansDefinedBenefitMember2022-12-310001126328us-gaap:DefinedBenefitPlanRealEstateMemberpfg:PooledSeparateAccountInvestmentsMemberus-gaap:PensionPlansDefinedBenefitMember2022-12-310001126328us-gaap:DefinedBenefitPlanEquitySecuritiesUsMemberus-gaap:FairValueInputsLevel1Memberus-gaap:OtherPostretirementBenefitPlansDefinedBenefitMember2022-12-310001126328us-gaap:DefinedBenefitPlanEquitySecuritiesUsLargeCapMemberpfg:PooledSeparateAccountInvestmentsMemberus-gaap:PensionPlansDefinedBenefitMember2022-12-310001126328us-gaap:DefinedBenefitPlanEquitySecuritiesNonUsMemberus-gaap:FairValueInputsLevel1Memberus-gaap:OtherPostretirementBenefitPlansDefinedBenefitMember2022-12-310001126328us-gaap:DefinedBenefitPlanEquitySecuritiesNonUsMemberpfg:PooledSeparateAccountInvestmentsMemberus-gaap:PensionPlansDefinedBenefitMember2022-12-310001126328us-gaap:DefinedBenefitPlanCashAndCashEquivalentsMemberus-gaap:FairValueInputsLevel1Memberus-gaap:OtherPostretirementBenefitPlansDefinedBenefitMember2022-12-310001126328us-gaap:CorporateDebtSecuritiesMemberpfg:SingleClientSeparateAccountInvestmentsMemberus-gaap:PensionPlansDefinedBenefitMember2022-12-310001126328us-gaap:CommercialMortgageBackedSecuritiesMemberpfg:SingleClientSeparateAccountInvestmentsMemberus-gaap:PensionPlansDefinedBenefitMember2022-12-310001126328pfg:SingleClientSeparateAccountsInvestedInPooledSeparateAccountMemberpfg:SingleClientSeparateAccountInvestmentsMemberus-gaap:PensionPlansDefinedBenefitMember2022-12-310001126328pfg:OtherPlanAssetsMemberpfg:SingleClientSeparateAccountInvestmentsMemberus-gaap:PensionPlansDefinedBenefitMember2022-12-310001126328pfg:DefinedBenefitPlanEquitySecuritiesUsSmallMidCapMemberpfg:PooledSeparateAccountInvestmentsMemberus-gaap:PensionPlansDefinedBenefitMember2022-12-310001126328pfg:BalancedAssetAllocationPortfoliosMemberpfg:PooledSeparateAccountInvestmentsMemberus-gaap:PensionPlansDefinedBenefitMember2022-12-310001126328us-gaap:FixedIncomeSecuritiesMemberus-gaap:OtherPostretirementBenefitPlansDefinedBenefitMember2022-12-310001126328us-gaap:FairValueMeasuredAtNetAssetValuePerShareMemberus-gaap:PensionPlansDefinedBenefitMember2022-12-310001126328us-gaap:FairValueInputsLevel2Memberus-gaap:PensionPlansDefinedBenefitMember2022-12-310001126328us-gaap:FairValueInputsLevel1Memberus-gaap:PensionPlansDefinedBenefitMember2022-12-310001126328us-gaap:FairValueInputsLevel1Memberus-gaap:OtherPostretirementBenefitPlansDefinedBenefitMember2022-12-310001126328us-gaap:DefinedBenefitPlanEquitySecuritiesUsMemberus-gaap:OtherPostretirementBenefitPlansDefinedBenefitMember2022-12-310001126328us-gaap:DefinedBenefitPlanEquitySecuritiesNonUsMemberus-gaap:OtherPostretirementBenefitPlansDefinedBenefitMember2022-12-310001126328us-gaap:DefinedBenefitPlanCashAndCashEquivalentsMemberus-gaap:OtherPostretirementBenefitPlansDefinedBenefitMember2022-12-310001126328srt:MaximumMemberus-gaap:PensionPlansDefinedBenefitMember2023-12-310001126328us-gaap:PensionPlansDefinedBenefitMember2021-12-310001126328us-gaap:OtherPostretirementBenefitPlansDefinedBenefitMember2021-12-310001126328pfg:PensionPlansDefinedBenefitCashBalanceBenefitMember2023-01-012023-12-310001126328pfg:PensionPlansDefinedBenefitCashBalanceBenefitMember2022-01-012022-12-310001126328pfg:PensionPlansDefinedBenefitTraditionalBenefitMember2021-01-012021-12-310001126328pfg:PensionPlansDefinedBenefitCashBalanceBenefitMember2021-01-012021-12-310001126328pfg:Post65MedicalPlansMember2023-01-012023-12-310001126328pfg:HomeOfficeAndAgentPre65MedicalLifePlanMember2023-01-012023-12-310001126328us-gaap:PensionPlansDefinedBenefitMember2021-01-012021-12-310001126328us-gaap:OtherPostretirementBenefitPlansDefinedBenefitMember2021-01-012021-12-310001126328us-gaap:QualifiedPlanMemberus-gaap:PensionPlansDefinedBenefitMember2023-12-310001126328us-gaap:NonqualifiedPlanMemberus-gaap:PensionPlansDefinedBenefitMember2023-12-310001126328us-gaap:QualifiedPlanMemberus-gaap:PensionPlansDefinedBenefitMember2022-12-310001126328us-gaap:NonqualifiedPlanMemberus-gaap:PensionPlansDefinedBenefitMember2022-12-310001126328us-gaap:AccountingStandardsUpdate201812Member2023-01-012023-12-310001126328pfg:PensionRiskTransferMemberpfg:SegmentRetirementAndIncomeSolutionsMember2021-01-012021-12-310001126328pfg:InvestmentOnlyMemberpfg:SegmentRetirementAndIncomeSolutionsMember2023-12-310001126328us-gaap:OtherShortdurationInsuranceProductLineMember2023-12-310001126328pfg:InvestmentOnlyMemberpfg:SegmentRetirementAndIncomeSolutionsMember2022-12-310001126328us-gaap:OtherShortdurationInsuranceProductLineMember2022-12-310001126328us-gaap:ParticipatingLifeInsurancePolicyMemberpfg:SegmentBenefitsAndProtectionMemberpfg:SubsegmentLifeInsuranceMember2021-12-310001126328us-gaap:DeferredFixedAnnuityMemberpfg:SegmentRetirementAndIncomeSolutionsMember2021-12-310001126328pfg:WorkplaceSavingsAndRetirementSolutionsMemberpfg:SegmentRetirementAndIncomeSolutionsMember2021-12-310001126328pfg:InvestmentOnlyMemberpfg:SegmentRetirementAndIncomeSolutionsMember2021-12-310001126328us-gaap:ParticipatingLifeInsurancePolicyMemberpfg:AociGainLossReversalAdjustmentLdtiMemberus-gaap:AccountingStandardsUpdate201812Memberpfg:SegmentBenefitsAndProtectionMemberpfg:SubsegmentLifeInsuranceMember2020-12-310001126328us-gaap:VariableAnnuityMemberpfg:AociGainLossReversalAdjustmentLdtiMemberus-gaap:AccountingStandardsUpdate201812Memberpfg:SegmentRetirementAndIncomeSolutionsMember2020-12-310001126328us-gaap:TermLifeInsuranceMembersrt:ScenarioPreviouslyReportedMemberpfg:SegmentBenefitsAndProtectionMemberpfg:SubsegmentLifeInsuranceMember2020-12-310001126328us-gaap:ParticipatingLifeInsurancePolicyMembersrt:ScenarioPreviouslyReportedMemberpfg:SegmentBenefitsAndProtectionMemberpfg:SubsegmentLifeInsuranceMember2020-12-310001126328us-gaap:DeferredFixedAnnuityMemberpfg:AociGainLossReversalAdjustmentLdtiMemberus-gaap:AccountingStandardsUpdate201812Memberpfg:SegmentRetirementAndIncomeSolutionsMember2020-12-310001126328pfg:WorkplaceSavingsAndRetirementSolutionsMemberpfg:AociGainLossReversalAdjustmentLdtiMemberus-gaap:AccountingStandardsUpdate201812Memberpfg:SegmentRetirementAndIncomeSolutionsMember2020-12-310001126328pfg:IndividualDisabilityMembersrt:ScenarioPreviouslyReportedMemberpfg:SegmentBenefitsAndProtectionMemberpfg:SubsegmentSpecialtyBenefitsMember2020-12-310001126328us-gaap:VariableAnnuityMembersrt:ScenarioPreviouslyReportedMemberpfg:SegmentRetirementAndIncomeSolutionsMember2020-12-310001126328us-gaap:ParticipatingLifeInsurancePolicyMemberpfg:SegmentBenefitsAndProtectionMemberpfg:SubsegmentLifeInsuranceMember2020-12-310001126328us-gaap:DeferredFixedAnnuityMembersrt:ScenarioPreviouslyReportedMemberpfg:SegmentRetirementAndIncomeSolutionsMember2020-12-310001126328pfg:WorkplaceSavingsAndRetirementSolutionsMembersrt:ScenarioPreviouslyReportedMemberpfg:SegmentRetirementAndIncomeSolutionsMember2020-12-310001126328pfg:InvestmentOnlyMembersrt:ScenarioPreviouslyReportedMemberpfg:SegmentRetirementAndIncomeSolutionsMember2020-12-310001126328pfg:AociGainLossReversalAdjustmentLdtiMemberus-gaap:AccountingStandardsUpdate201812Memberpfg:SegmentRetirementAndIncomeSolutionsMember2020-12-310001126328pfg:AociGainLossReversalAdjustmentLdtiMemberus-gaap:AccountingStandardsUpdate201812Memberpfg:SegmentBenefitsAndProtectionMember2020-12-310001126328us-gaap:DeferredFixedAnnuityMemberpfg:SegmentRetirementAndIncomeSolutionsMember2020-12-310001126328srt:ScenarioPreviouslyReportedMemberpfg:SegmentRetirementAndIncomeSolutionsMember2020-12-310001126328srt:ScenarioPreviouslyReportedMemberpfg:SegmentBenefitsAndProtectionMember2020-12-310001126328pfg:WorkplaceSavingsAndRetirementSolutionsMemberpfg:SegmentRetirementAndIncomeSolutionsMember2020-12-310001126328pfg:InvestmentOnlyMemberpfg:SegmentRetirementAndIncomeSolutionsMember2020-12-310001126328pfg:AociGainLossReversalAdjustmentLdtiMemberus-gaap:AccountingStandardsUpdate201812Member2020-12-310001126328srt:ScenarioPreviouslyReportedMember2020-12-310001126328pfg:SegmentRetirementAndIncomeSolutionsMember2020-12-310001126328pfg:SegmentBenefitsAndProtectionMember2020-12-310001126328us-gaap:ParticipatingLifeInsurancePolicyMemberpfg:SegmentBenefitsAndProtectionMemberpfg:SubsegmentLifeInsuranceMember2023-01-012023-12-310001126328pfg:InvestmentOnlyMemberpfg:SegmentRetirementAndIncomeSolutionsMember2023-01-012023-12-310001126328pfg:LongDurationAndShortDurationInsuranceMember2023-01-012023-12-310001126328us-gaap:ParticipatingLifeInsurancePolicyMemberpfg:SegmentBenefitsAndProtectionMemberpfg:SubsegmentLifeInsuranceMember2022-01-012022-12-310001126328pfg:InvestmentOnlyMemberpfg:SegmentRetirementAndIncomeSolutionsMember2022-01-012022-12-310001126328pfg:SegmentBenefitsAndProtectionMember2022-01-012022-12-310001126328pfg:LongDurationAndShortDurationInsuranceMember2022-01-012022-12-310001126328us-gaap:TermLifeInsuranceMemberpfg:SegmentBenefitsAndProtectionMemberpfg:SubsegmentLifeInsuranceMember2021-01-012021-12-310001126328us-gaap:ParticipatingLifeInsurancePolicyMemberpfg:SegmentBenefitsAndProtectionMemberpfg:SubsegmentLifeInsuranceMember2021-01-012021-12-310001126328pfg:IndividualDisabilityMemberpfg:SegmentBenefitsAndProtectionMemberpfg:SubsegmentSpecialtyBenefitsMember2021-01-012021-12-310001126328us-gaap:VariableAnnuityMemberpfg:SegmentRetirementAndIncomeSolutionsMember2021-01-012021-12-310001126328us-gaap:DeferredFixedAnnuityMemberpfg:SegmentRetirementAndIncomeSolutionsMember2021-01-012021-12-310001126328pfg:WorkplaceSavingsAndRetirementSolutionsMemberpfg:SegmentRetirementAndIncomeSolutionsMember2021-01-012021-12-310001126328pfg:InvestmentOnlyMemberpfg:SegmentRetirementAndIncomeSolutionsMember2021-01-012021-12-310001126328pfg:SegmentBenefitsAndProtectionMember2021-01-012021-12-310001126328pfg:LongDurationAndShortDurationInsuranceMember2021-01-012021-12-310001126328us-gaap:StateAndLocalJurisdictionMember2023-12-310001126328us-gaap:ForeignCountryMember2023-12-310001126328us-gaap:StateAndLocalJurisdictionMember2022-12-310001126328us-gaap:ForeignCountryMember2022-12-310001126328srt:WeightedAverageMemberus-gaap:DebtSecuritiesMemberus-gaap:FairValueInputsLevel3Memberus-gaap:FairValueMeasurementsRecurringMemberpfg:TradingSecuritiesMemberus-gaap:MeasurementInputDiscountRateMemberus-gaap:ValuationTechniqueDiscountedCashFlowMember2023-12-310001126328srt:MinimumMemberus-gaap:DebtSecuritiesMemberus-gaap:FairValueInputsLevel3Memberus-gaap:FairValueMeasurementsRecurringMemberpfg:TradingSecuritiesMemberus-gaap:MeasurementInputDiscountRateMemberus-gaap:ValuationTechniqueDiscountedCashFlowMember2023-12-310001126328srt:MaximumMemberus-gaap:DebtSecuritiesMemberus-gaap:FairValueInputsLevel3Memberus-gaap:FairValueMeasurementsRecurringMemberpfg:TradingSecuritiesMemberus-gaap:MeasurementInputDiscountRateMemberus-gaap:ValuationTechniqueDiscountedCashFlowMember2023-12-310001126328srt:WeightedAverageMemberus-gaap:OtherDebtSecuritiesMemberus-gaap:FairValueInputsLevel3Memberus-gaap:FairValueMeasurementsRecurringMemberpfg:AvailableForSaleSecurityMemberus-gaap:MeasurementInputDiscountRateMemberus-gaap:ValuationTechniqueDiscountedCashFlowMember2023-12-310001126328srt:WeightedAverageMemberus-gaap:OtherDebtSecuritiesMemberus-gaap:FairValueInputsLevel3Memberus-gaap:FairValueMeasurementsRecurringMemberpfg:AvailableForSaleSecurityMemberus-gaap:MeasurementInputDiscountForLackOfMarketabilityMemberus-gaap:ValuationTechniqueDiscountedCashFlowMember2023-12-310001126328srt:WeightedAverageMemberus-gaap:OtherDebtSecuritiesMemberus-gaap:FairValueInputsLevel3Memberus-gaap:FairValueMeasurementsRecurringMemberpfg:AvailableForSaleSecurityMemberus-gaap:MeasurementInputComparabilityAdjustmentMemberus-gaap:ValuationTechniqueDiscountedCashFlowMember2023-12-310001126328srt:WeightedAverageMemberus-gaap:CorporateDebtSecuritiesMemberus-gaap:FairValueInputsLevel3Memberus-gaap:FairValueMeasurementsRecurringMemberpfg:AvailableForSaleSecurityMemberus-gaap:MeasurementInputEbitdaMultipleMemberus-gaap:ValuationTechniqueDiscountedCashFlowMember2023-12-310001126328srt:WeightedAverageMemberus-gaap:CorporateDebtSecuritiesMemberus-gaap:FairValueInputsLevel3Memberus-gaap:FairValueMeasurementsRecurringMemberpfg:AvailableForSaleSecurityMemberus-gaap:MeasurementInputDiscountRateMemberus-gaap:ValuationTechniqueDiscountedCashFlowMember2023-12-310001126328srt:WeightedAverageMemberus-gaap:CorporateDebtSecuritiesMemberus-gaap:FairValueInputsLevel3Memberus-gaap:FairValueMeasurementsRecurringMemberpfg:AvailableForSaleSecurityMemberus-gaap:MeasurementInputDiscountForLackOfMarketabilityMemberus-gaap:ValuationTechniqueDiscountedCashFlowMember2023-12-310001126328srt:WeightedAverageMemberus-gaap:CorporateDebtSecuritiesMemberus-gaap:FairValueInputsLevel3Memberus-gaap:FairValueMeasurementsRecurringMemberpfg:AvailableForSaleSecurityMemberus-gaap:MeasurementInputComparabilityAdjustmentMemberus-gaap:ValuationTechniqueDiscountedCashFlowMember2023-12-310001126328srt:WeightedAverageMemberus-gaap:CollateralizedDebtObligationsMemberus-gaap:FairValueInputsLevel3Memberus-gaap:FairValueMeasurementsRecurringMemberpfg:AvailableForSaleSecurityMemberus-gaap:MeasurementInputDiscountRateMemberus-gaap:ValuationTechniqueDiscountedCashFlowMember2023-12-310001126328srt:WeightedAverageMemberus-gaap:CollateralizedDebtObligationsMemberus-gaap:FairValueInputsLevel3Memberus-gaap:FairValueMeasurementsRecurringMemberpfg:AvailableForSaleSecurityMemberus-gaap:MeasurementInputComparabilityAdjustmentMemberus-gaap:ValuationTechniqueDiscountedCashFlowMember2023-12-310001126328srt:MinimumMemberus-gaap:OtherDebtSecuritiesMemberus-gaap:FairValueInputsLevel3Memberus-gaap:FairValueMeasurementsRecurringMemberpfg:AvailableForSaleSecurityMemberus-gaap:MeasurementInputDiscountRateMemberus-gaap:ValuationTechniqueDiscountedCashFlowMember2023-12-310001126328srt:MinimumMemberus-gaap:OtherDebtSecuritiesMemberus-gaap:FairValueInputsLevel3Memberus-gaap:FairValueMeasurementsRecurringMemberpfg:AvailableForSaleSecurityMemberus-gaap:MeasurementInputDiscountForLackOfMarketabilityMemberus-gaap:ValuationTechniqueDiscountedCashFlowMember2023-12-310001126328srt:MinimumMemberus-gaap:OtherDebtSecuritiesMemberus-gaap:FairValueInputsLevel3Memberus-gaap:FairValueMeasurementsRecurringMemberpfg:AvailableForSaleSecurityMemberus-gaap:MeasurementInputComparabilityAdjustmentMemberus-gaap:ValuationTechniqueDiscountedCashFlowMember2023-12-310001126328srt:MinimumMemberus-gaap:CorporateDebtSecuritiesMemberus-gaap:FairValueInputsLevel3Memberus-gaap:FairValueMeasurementsRecurringMemberpfg:AvailableForSaleSecurityMemberus-gaap:MeasurementInputDiscountRateMemberus-gaap:ValuationTechniqueDiscountedCashFlowMember2023-12-310001126328srt:MinimumMemberus-gaap:CorporateDebtSecuritiesMemberus-gaap:FairValueInputsLevel3Memberus-gaap:FairValueMeasurementsRecurringMemberpfg:AvailableForSaleSecurityMemberus-gaap:MeasurementInputDiscountForLackOfMarketabilityMemberus-gaap:ValuationTechniqueDiscountedCashFlowMember2023-12-310001126328srt:MinimumMemberus-gaap:CorporateDebtSecuritiesMemberus-gaap:FairValueInputsLevel3Memberus-gaap:FairValueMeasurementsRecurringMemberpfg:AvailableForSaleSecurityMemberus-gaap:MeasurementInputComparabilityAdjustmentMemberus-gaap:ValuationTechniqueDiscountedCashFlowMember2023-12-310001126328srt:MaximumMemberus-gaap:OtherDebtSecuritiesMemberus-gaap:FairValueInputsLevel3Memberus-gaap:FairValueMeasurementsRecurringMemberpfg:AvailableForSaleSecurityMemberus-gaap:MeasurementInputDiscountRateMemberus-gaap:ValuationTechniqueDiscountedCashFlowMember2023-12-310001126328srt:MaximumMemberus-gaap:OtherDebtSecuritiesMemberus-gaap:FairValueInputsLevel3Memberus-gaap:FairValueMeasurementsRecurringMemberpfg:AvailableForSaleSecurityMemberus-gaap:MeasurementInputDiscountForLackOfMarketabilityMemberus-gaap:ValuationTechniqueDiscountedCashFlowMember2023-12-310001126328srt:MaximumMemberus-gaap:OtherDebtSecuritiesMemberus-gaap:FairValueInputsLevel3Memberus-gaap:FairValueMeasurementsRecurringMemberpfg:AvailableForSaleSecurityMemberus-gaap:MeasurementInputComparabilityAdjustmentMemberus-gaap:ValuationTechniqueDiscountedCashFlowMember2023-12-310001126328srt:MaximumMemberus-gaap:CorporateDebtSecuritiesMemberus-gaap:FairValueInputsLevel3Memberus-gaap:FairValueMeasurementsRecurringMemberpfg:AvailableForSaleSecurityMemberus-gaap:MeasurementInputDiscountRateMemberus-gaap:ValuationTechniqueDiscountedCashFlowMember2023-12-310001126328srt:MaximumMemberus-gaap:CorporateDebtSecuritiesMemberus-gaap:FairValueInputsLevel3Memberus-gaap:FairValueMeasurementsRecurringMemberpfg:AvailableForSaleSecurityMemberus-gaap:MeasurementInputDiscountForLackOfMarketabilityMemberus-gaap:ValuationTechniqueDiscountedCashFlowMember2023-12-310001126328srt:MaximumMemberus-gaap:CorporateDebtSecuritiesMemberus-gaap:FairValueInputsLevel3Memberus-gaap:FairValueMeasurementsRecurringMemberpfg:AvailableForSaleSecurityMemberus-gaap:MeasurementInputComparabilityAdjustmentMemberus-gaap:ValuationTechniqueDiscountedCashFlowMember2023-12-310001126328us-gaap:CorporateDebtSecuritiesMemberus-gaap:FairValueInputsLevel3Memberus-gaap:FairValueMeasurementsRecurringMemberpfg:AvailableForSaleSecurityMemberus-gaap:MeasurementInputEbitdaMultipleMemberus-gaap:ValuationTechniqueDiscountedCashFlowMember2023-12-310001126328us-gaap:CollateralizedDebtObligationsMemberus-gaap:FairValueInputsLevel3Memberus-gaap:FairValueMeasurementsRecurringMemberpfg:AvailableForSaleSecurityMemberus-gaap:MeasurementInputDiscountRateMemberus-gaap:ValuationTechniqueDiscountedCashFlowMember2023-12-310001126328us-gaap:CollateralizedDebtObligationsMemberus-gaap:FairValueInputsLevel3Memberus-gaap:FairValueMeasurementsRecurringMemberpfg:AvailableForSaleSecurityMemberus-gaap:MeasurementInputComparabilityAdjustmentMemberus-gaap:ValuationTechniqueDiscountedCashFlowMember2023-12-310001126328srt:WeightedAverageMemberus-gaap:OtherDebtSecuritiesMemberus-gaap:FairValueInputsLevel3Memberus-gaap:FairValueMeasurementsRecurringMemberpfg:AvailableForSaleSecurityMemberus-gaap:MeasurementInputDiscountRateMemberus-gaap:ValuationTechniqueDiscountedCashFlowMember2022-12-310001126328srt:WeightedAverageMemberus-gaap:OtherDebtSecuritiesMemberus-gaap:FairValueInputsLevel3Memberus-gaap:FairValueMeasurementsRecurringMemberpfg:AvailableForSaleSecurityMemberus-gaap:MeasurementInputDiscountForLackOfMarketabilityMemberus-gaap:ValuationTechniqueDiscountedCashFlowMember2022-12-310001126328srt:WeightedAverageMemberus-gaap:OtherDebtSecuritiesMemberus-gaap:FairValueInputsLevel3Memberus-gaap:FairValueMeasurementsRecurringMemberpfg:AvailableForSaleSecurityMemberus-gaap:MeasurementInputComparabilityAdjustmentMemberus-gaap:ValuationTechniqueDiscountedCashFlowMember2022-12-310001126328srt:WeightedAverageMemberus-gaap:DebtSecuritiesMemberus-gaap:FairValueInputsLevel3Memberus-gaap:FairValueMeasurementsRecurringMemberpfg:TradingSecuritiesMemberus-gaap:MeasurementInputDiscountRateMemberus-gaap:ValuationTechniqueDiscountedCashFlowMember2022-12-310001126328srt:WeightedAverageMemberus-gaap:CorporateDebtSecuritiesMemberus-gaap:FairValueInputsLevel3Memberus-gaap:FairValueMeasurementsRecurringMemberpfg:AvailableForSaleSecurityMemberus-gaap:MeasurementInputDiscountRateMemberus-gaap:ValuationTechniqueDiscountedCashFlowMember2022-12-310001126328srt:WeightedAverageMemberus-gaap:CorporateDebtSecuritiesMemberus-gaap:FairValueInputsLevel3Memberus-gaap:FairValueMeasurementsRecurringMemberpfg:AvailableForSaleSecurityMemberus-gaap:MeasurementInputDiscountForLackOfMarketabilityMemberus-gaap:ValuationTechniqueDiscountedCashFlowMember2022-12-310001126328srt:WeightedAverageMemberus-gaap:CorporateDebtSecuritiesMemberus-gaap:FairValueInputsLevel3Memberus-gaap:FairValueMeasurementsRecurringMemberpfg:AvailableForSaleSecurityMemberus-gaap:MeasurementInputComparabilityAdjustmentMemberus-gaap:ValuationTechniqueDiscountedCashFlowMember2022-12-310001126328srt:WeightedAverageMemberus-gaap:CollateralizedDebtObligationsMemberus-gaap:FairValueInputsLevel3Memberus-gaap:FairValueMeasurementsRecurringMemberpfg:AvailableForSaleSecurityMemberus-gaap:MeasurementInputDiscountRateMemberus-gaap:ValuationTechniqueDiscountedCashFlowMember2022-12-310001126328srt:WeightedAverageMemberus-gaap:CollateralizedDebtObligationsMemberus-gaap:FairValueInputsLevel3Memberus-gaap:FairValueMeasurementsRecurringMemberpfg:AvailableForSaleSecurityMemberus-gaap:MeasurementInputComparabilityAdjustmentMemberus-gaap:ValuationTechniqueDiscountedCashFlowMember2022-12-310001126328srt:MinimumMemberus-gaap:OtherDebtSecuritiesMemberus-gaap:FairValueInputsLevel3Memberus-gaap:FairValueMeasurementsRecurringMemberpfg:AvailableForSaleSecurityMemberus-gaap:MeasurementInputDiscountRateMemberus-gaap:ValuationTechniqueDiscountedCashFlowMember2022-12-310001126328srt:MinimumMemberus-gaap:OtherDebtSecuritiesMemberus-gaap:FairValueInputsLevel3Memberus-gaap:FairValueMeasurementsRecurringMemberpfg:AvailableForSaleSecurityMemberus-gaap:MeasurementInputDiscountForLackOfMarketabilityMemberus-gaap:ValuationTechniqueDiscountedCashFlowMember2022-12-310001126328srt:MinimumMemberus-gaap:OtherDebtSecuritiesMemberus-gaap:FairValueInputsLevel3Memberus-gaap:FairValueMeasurementsRecurringMemberpfg:AvailableForSaleSecurityMemberus-gaap:MeasurementInputComparabilityAdjustmentMemberus-gaap:ValuationTechniqueDiscountedCashFlowMember2022-12-310001126328srt:MinimumMemberus-gaap:DebtSecuritiesMemberus-gaap:FairValueInputsLevel3Memberus-gaap:FairValueMeasurementsRecurringMemberpfg:TradingSecuritiesMemberus-gaap:MeasurementInputDiscountRateMemberus-gaap:ValuationTechniqueDiscountedCashFlowMember2022-12-310001126328srt:MinimumMemberus-gaap:CorporateDebtSecuritiesMemberus-gaap:FairValueInputsLevel3Memberus-gaap:FairValueMeasurementsRecurringMemberpfg:AvailableForSaleSecurityMemberus-gaap:MeasurementInputDiscountRateMemberus-gaap:ValuationTechniqueDiscountedCashFlowMember2022-12-310001126328srt:MinimumMemberus-gaap:CorporateDebtSecuritiesMemberus-gaap:FairValueInputsLevel3Memberus-gaap:FairValueMeasurementsRecurringMemberpfg:AvailableForSaleSecurityMemberus-gaap:MeasurementInputDiscountForLackOfMarketabilityMemberus-gaap:ValuationTechniqueDiscountedCashFlowMember2022-12-310001126328srt:MinimumMemberus-gaap:CorporateDebtSecuritiesMemberus-gaap:FairValueInputsLevel3Memberus-gaap:FairValueMeasurementsRecurringMemberpfg:AvailableForSaleSecurityMemberus-gaap:MeasurementInputComparabilityAdjustmentMemberus-gaap:ValuationTechniqueDiscountedCashFlowMember2022-12-310001126328srt:MaximumMemberus-gaap:OtherDebtSecuritiesMemberus-gaap:FairValueInputsLevel3Memberus-gaap:FairValueMeasurementsRecurringMemberpfg:AvailableForSaleSecurityMemberus-gaap:MeasurementInputDiscountRateMemberus-gaap:ValuationTechniqueDiscountedCashFlowMember2022-12-310001126328srt:MaximumMemberus-gaap:OtherDebtSecuritiesMemberus-gaap:FairValueInputsLevel3Memberus-gaap:FairValueMeasurementsRecurringMemberpfg:AvailableForSaleSecurityMemberus-gaap:MeasurementInputDiscountForLackOfMarketabilityMemberus-gaap:ValuationTechniqueDiscountedCashFlowMember2022-12-310001126328srt:MaximumMemberus-gaap:OtherDebtSecuritiesMemberus-gaap:FairValueInputsLevel3Memberus-gaap:FairValueMeasurementsRecurringMemberpfg:AvailableForSaleSecurityMemberus-gaap:MeasurementInputComparabilityAdjustmentMemberus-gaap:ValuationTechniqueDiscountedCashFlowMember2022-12-310001126328srt:MaximumMemberus-gaap:DebtSecuritiesMemberus-gaap:FairValueInputsLevel3Memberus-gaap:FairValueMeasurementsRecurringMemberpfg:TradingSecuritiesMemberus-gaap:MeasurementInputDiscountRateMemberus-gaap:ValuationTechniqueDiscountedCashFlowMember2022-12-310001126328srt:MaximumMemberus-gaap:CorporateDebtSecuritiesMemberus-gaap:FairValueInputsLevel3Memberus-gaap:FairValueMeasurementsRecurringMemberpfg:AvailableForSaleSecurityMemberus-gaap:MeasurementInputDiscountRateMemberus-gaap:ValuationTechniqueDiscountedCashFlowMember2022-12-310001126328srt:MaximumMemberus-gaap:CorporateDebtSecuritiesMemberus-gaap:FairValueInputsLevel3Memberus-gaap:FairValueMeasurementsRecurringMemberpfg:AvailableForSaleSecurityMemberus-gaap:MeasurementInputDiscountForLackOfMarketabilityMemberus-gaap:ValuationTechniqueDiscountedCashFlowMember2022-12-310001126328srt:MaximumMemberus-gaap:CorporateDebtSecuritiesMemberus-gaap:FairValueInputsLevel3Memberus-gaap:FairValueMeasurementsRecurringMemberpfg:AvailableForSaleSecurityMemberus-gaap:MeasurementInputComparabilityAdjustmentMemberus-gaap:ValuationTechniqueDiscountedCashFlowMember2022-12-310001126328us-gaap:CollateralizedDebtObligationsMemberus-gaap:FairValueInputsLevel3Memberus-gaap:FairValueMeasurementsRecurringMemberpfg:AvailableForSaleSecurityMemberus-gaap:MeasurementInputDiscountRateMemberus-gaap:ValuationTechniqueDiscountedCashFlowMember2022-12-310001126328us-gaap:CollateralizedDebtObligationsMemberus-gaap:FairValueInputsLevel3Memberus-gaap:FairValueMeasurementsRecurringMemberpfg:AvailableForSaleSecurityMemberus-gaap:MeasurementInputComparabilityAdjustmentMemberus-gaap:ValuationTechniqueDiscountedCashFlowMember2022-12-310001126328srt:WeightedAverageMemberus-gaap:FairValueInputsLevel3Memberpfg:InvestmentAndUniversalLifeContractsMemberus-gaap:FairValueMeasurementsRecurringMemberpfg:MeasurementInputLongDurationInterestRateMemberus-gaap:ValuationTechniqueDiscountedCashFlowMember2022-12-310001126328us-gaap:CommercialMortgageBackedSecuritiesMember2022-01-012022-12-310001126328us-gaap:CollateralizedDebtObligationsMember2021-01-012021-12-310001126328us-gaap:OtherDebtSecuritiesMember2021-01-012021-12-310001126328us-gaap:CommercialMortgageBackedSecuritiesMember2021-01-012021-12-310001126328us-gaap:FairValueInputsLevel3Memberus-gaap:FairValueMeasurementsRecurringMemberus-gaap:USStatesAndPoliticalSubdivisionsMember2023-12-310001126328us-gaap:FairValueInputsLevel3Memberus-gaap:FairValueMeasurementsRecurringMemberus-gaap:OtherDebtSecuritiesMember2023-12-310001126328us-gaap:FairValueInputsLevel3Memberus-gaap:FairValueMeasurementsRecurringMemberus-gaap:CorporateDebtSecuritiesMember2023-12-310001126328us-gaap:FairValueInputsLevel3Memberus-gaap:FairValueMeasurementsRecurringMemberus-gaap:CommercialMortgageBackedSecuritiesMember2023-12-310001126328us-gaap:FairValueInputsLevel3Memberus-gaap:FairValueMeasurementsRecurringMemberus-gaap:CollateralizedDebtObligationsMember2023-12-310001126328us-gaap:FairValueInputsLevel2Memberus-gaap:FairValueMeasurementsRecurringMemberus-gaap:USTreasuryAndGovernmentMember2023-12-310001126328us-gaap:FairValueInputsLevel2Memberus-gaap:FairValueMeasurementsRecurringMemberus-gaap:USStatesAndPoliticalSubdivisionsMember2023-12-310001126328us-gaap:FairValueInputsLevel2Memberus-gaap:FairValueMeasurementsRecurringMemberus-gaap:ResidentialMortgageBackedSecuritiesMember2023-12-310001126328us-gaap:FairValueInputsLevel2Memberus-gaap:FairValueMeasurementsRecurringMemberus-gaap:OtherDebtSecuritiesMember2023-12-310001126328us-gaap:FairValueInputsLevel2Memberus-gaap:FairValueMeasurementsRecurringMemberus-gaap:ForeignGovernmentDebtSecuritiesMember2023-12-310001126328us-gaap:FairValueInputsLevel2Memberus-gaap:FairValueMeasurementsRecurringMemberus-gaap:CorporateDebtSecuritiesMember2023-12-310001126328us-gaap:FairValueInputsLevel2Memberus-gaap:FairValueMeasurementsRecurringMemberus-gaap:CommercialMortgageBackedSecuritiesMember2023-12-310001126328us-gaap:FairValueInputsLevel2Memberus-gaap:FairValueMeasurementsRecurringMemberus-gaap:CollateralizedDebtObligationsMember2023-12-310001126328us-gaap:FairValueInputsLevel1Memberus-gaap:FairValueMeasurementsRecurringMemberus-gaap:USTreasuryAndGovernmentMember2023-12-310001126328us-gaap:FairValueInputsLevel1Memberus-gaap:FairValueMeasurementsRecurringMemberus-gaap:ForeignGovernmentDebtSecuritiesMember2023-12-310001126328us-gaap:FairValueInputsLevel1Memberus-gaap:FairValueMeasurementsRecurringMemberus-gaap:CorporateDebtSecuritiesMember2023-12-310001126328us-gaap:FairValueMeasurementsRecurringMemberus-gaap:USTreasuryAndGovernmentMember2023-12-310001126328us-gaap:FairValueMeasurementsRecurringMemberus-gaap:USStatesAndPoliticalSubdivisionsMember2023-12-310001126328us-gaap:FairValueMeasurementsRecurringMemberus-gaap:ResidentialMortgageBackedSecuritiesMember2023-12-310001126328us-gaap:FairValueMeasurementsRecurringMemberus-gaap:OtherDebtSecuritiesMember2023-12-310001126328us-gaap:FairValueMeasurementsRecurringMemberus-gaap:ForeignGovernmentDebtSecuritiesMember2023-12-310001126328us-gaap:FairValueMeasurementsRecurringMemberus-gaap:CorporateDebtSecuritiesMember2023-12-310001126328us-gaap:FairValueMeasurementsRecurringMemberus-gaap:CommercialMortgageBackedSecuritiesMember2023-12-310001126328us-gaap:FairValueMeasurementsRecurringMemberus-gaap:CollateralizedDebtObligationsMember2023-12-310001126328us-gaap:FairValueInputsLevel3Memberus-gaap:FairValueMeasurementsRecurringMemberus-gaap:USStatesAndPoliticalSubdivisionsMember2022-12-310001126328us-gaap:FairValueInputsLevel3Memberus-gaap:FairValueMeasurementsRecurringMemberus-gaap:OtherDebtSecuritiesMember2022-12-310001126328us-gaap:FairValueInputsLevel3Memberus-gaap:FairValueMeasurementsRecurringMemberus-gaap:CorporateDebtSecuritiesMember2022-12-310001126328us-gaap:FairValueInputsLevel3Memberus-gaap:FairValueMeasurementsRecurringMemberus-gaap:CommercialMortgageBackedSecuritiesMember2022-12-310001126328us-gaap:FairValueInputsLevel3Memberus-gaap:FairValueMeasurementsRecurringMemberus-gaap:CollateralizedDebtObligationsMember2022-12-310001126328us-gaap:FairValueInputsLevel2Memberus-gaap:FairValueMeasurementsRecurringMemberus-gaap:USTreasuryAndGovernmentMember2022-12-310001126328us-gaap:FairValueInputsLevel2Memberus-gaap:FairValueMeasurementsRecurringMemberus-gaap:USStatesAndPoliticalSubdivisionsMember2022-12-310001126328us-gaap:FairValueInputsLevel2Memberus-gaap:FairValueMeasurementsRecurringMemberus-gaap:ResidentialMortgageBackedSecuritiesMember2022-12-310001126328us-gaap:FairValueInputsLevel2Memberus-gaap:FairValueMeasurementsRecurringMemberus-gaap:OtherDebtSecuritiesMember2022-12-310001126328us-gaap:FairValueInputsLevel2Memberus-gaap:FairValueMeasurementsRecurringMemberus-gaap:ForeignGovernmentDebtSecuritiesMember2022-12-310001126328us-gaap:FairValueInputsLevel2Memberus-gaap:FairValueMeasurementsRecurringMemberus-gaap:CorporateDebtSecuritiesMember2022-12-310001126328us-gaap:FairValueInputsLevel2Memberus-gaap:FairValueMeasurementsRecurringMemberus-gaap:CommercialMortgageBackedSecuritiesMember2022-12-310001126328us-gaap:FairValueInputsLevel2Memberus-gaap:FairValueMeasurementsRecurringMemberus-gaap:CollateralizedDebtObligationsMember2022-12-310001126328us-gaap:FairValueInputsLevel1Memberus-gaap:FairValueMeasurementsRecurringMemberus-gaap:USTreasuryAndGovernmentMember2022-12-310001126328us-gaap:FairValueInputsLevel1Memberus-gaap:FairValueMeasurementsRecurringMemberus-gaap:ForeignGovernmentDebtSecuritiesMember2022-12-310001126328us-gaap:FairValueInputsLevel1Memberus-gaap:FairValueMeasurementsRecurringMemberus-gaap:CorporateDebtSecuritiesMember2022-12-310001126328us-gaap:FairValueMeasurementsRecurringMemberus-gaap:USTreasuryAndGovernmentMember2022-12-310001126328us-gaap:FairValueMeasurementsRecurringMemberus-gaap:USStatesAndPoliticalSubdivisionsMember2022-12-310001126328us-gaap:FairValueMeasurementsRecurringMemberus-gaap:ResidentialMortgageBackedSecuritiesMember2022-12-310001126328us-gaap:FairValueMeasurementsRecurringMemberus-gaap:OtherDebtSecuritiesMember2022-12-310001126328us-gaap:FairValueMeasurementsRecurringMemberus-gaap:ForeignGovernmentDebtSecuritiesMember2022-12-310001126328us-gaap:FairValueMeasurementsRecurringMemberus-gaap:CorporateDebtSecuritiesMember2022-12-310001126328us-gaap:FairValueMeasurementsRecurringMemberus-gaap:CommercialMortgageBackedSecuritiesMember2022-12-310001126328us-gaap:FairValueMeasurementsRecurringMemberus-gaap:CollateralizedDebtObligationsMember2022-12-310001126328us-gaap:OtherDebtSecuritiesMember2021-12-310001126328us-gaap:CorporateDebtSecuritiesMember2021-12-310001126328us-gaap:CommercialMortgageBackedSecuritiesMember2021-12-310001126328us-gaap:CorporateDebtSecuritiesMember2020-12-310001126328us-gaap:CommercialMortgageBackedSecuritiesMember2020-12-310001126328us-gaap:CollateralizedDebtObligationsMember2020-12-310001126328us-gaap:CorporateDebtSecuritiesMember2023-01-012023-12-310001126328pfg:PrincipalInternationalChileMembersrt:MaximumMemberpfg:UnsecuredLineOfCreditMember2022-01-012023-12-310001126328srt:MaximumMemberpfg:MortgagesAndNotesPayableMemberus-gaap:NonrecourseMember2023-12-310001126328pfg:NotesPayable3.125PercentDue2023Memberus-gaap:SeniorNotesMember2023-03-080001126328pfg:Delaware2048TrustMemberpfg:SeniorNotesDue2048Memberpfg:ContingentFundingAgreement30YearMember2018-03-080001126328pfg:Delaware2028TrustMemberpfg:SeniorNotesDue2028Memberpfg:ContingentFundingAgreement10YearMember2018-03-080001126328pfg:NotesPayable5.5PercentDue2053Memberus-gaap:SeniorNotesMember2023-03-080001126328pfg:NotesPayable5.375PercentDue2023Memberus-gaap:SeniorNotesMember2023-03-080001126328us-gaap:SeniorNotesMember2023-03-080001126328pfg:NotesPayable2.125PercentDue2030Memberus-gaap:SeniorNotesMember2020-08-030001126328pfg:NotesPayable2.125PercentDue2030Memberus-gaap:SeniorNotesMember2020-06-120001126328pfg:NotesPayable3.7PercentDue2029Memberus-gaap:SeniorNotesMember2019-05-070001126328pfg:NotesPayable4.3PercentDue2046Memberus-gaap:SeniorNotesMember2016-11-100001126328pfg:NotesPayable3.1PercentDue2026Memberus-gaap:SeniorNotesMember2016-11-100001126328pfg:NotesPayable3.1PercentDue2026AndNotesPayable4.3PercentDue2046Memberus-gaap:SeniorNotesMember2016-11-100001126328pfg:NotesPayable4.7PercentDue2055Memberus-gaap:JuniorSubordinatedDebtMember2015-05-070001126328pfg:NotesPayable3.4PercentDue2025Memberus-gaap:SeniorNotesMember2015-05-070001126328pfg:NotesPayable4.35PercentDue2043Memberus-gaap:SeniorNotesMember2012-11-160001126328pfg:NotesPayable3.125PercentDue2023Memberus-gaap:SeniorNotesMember2012-11-160001126328pfg:NotesPayable1.85PercentDue2017Memberus-gaap:SeniorNotesMember2012-11-160001126328pfg:NotesPayable1.85PercentDue2017And3.125PercentDue2023And4.35PercentDue2043Memberus-gaap:SeniorNotesMember2012-11-160001126328pfg:NotesPayable4.625PercentDue2042Memberus-gaap:SeniorNotesMember2012-09-050001126328pfg:NotesPayable6.05PercentDue2036IssuedDecember2006Memberus-gaap:SeniorNotesMember2006-12-050001126328pfg:NotesPayable6.05PercentDue2036IssuedOctober2006Memberus-gaap:SeniorNotesMember2006-10-160001126328pfg:NotesPayable6.05PercentDue2036Member2023-12-310001126328pfg:NotesPayable5.5PercentDue2053Member2023-12-310001126328pfg:NotesPayable5.375PercentDue2023Member2023-12-310001126328pfg:NotesPayable4.625PercentDue2042Member2023-12-310001126328pfg:NotesPayable4.3PercentDue2046Member2023-12-310001126328pfg:NotesPayable4.35PercentDue2043Member2023-12-310001126328pfg:NotesPayable3.7PercentDue2029Member2023-12-310001126328pfg:NotesPayable3.4PercentDue2025Member2023-12-310001126328pfg:NotesPayable3.1PercentDue2026Member2023-12-310001126328pfg:NotesPayable2.125PercentDue2030Member2023-12-310001126328pfg:NotesPayable6.05PercentDue2036Member2022-12-310001126328pfg:NotesPayable4.625PercentDue2042Member2022-12-310001126328pfg:NotesPayable4.3PercentDue2046Member2022-12-310001126328pfg:NotesPayable4.35PercentDue2043Member2022-12-310001126328pfg:NotesPayable3.7PercentDue2029Member2022-12-310001126328pfg:NotesPayable3.4PercentDue2025Member2022-12-310001126328pfg:NotesPayable3.1PercentDue2026Member2022-12-310001126328pfg:NotesPayable3.125PercentDue2023Member2022-12-310001126328pfg:NotesPayable2.125PercentDue2030Member2022-12-310001126328pfg:FloatingRateNotesPayableDue2055Member2022-12-310001126328pfg:NotesPayable4.7PercentDue2055Memberus-gaap:JuniorSubordinatedDebtMember2015-05-072015-05-070001126328pfg:FiveLargestCededReinsurersMemberpfg:NetCededReinsuranceRecoverablesMemberus-gaap:ReinsurerConcentrationRiskMember2023-01-012023-12-310001126328pfg:FiveLargestCededReinsurersMemberpfg:NetCededReinsuranceRecoverablesMemberus-gaap:ReinsurerConcentrationRiskMember2022-01-012022-12-310001126328us-gaap:CommonStockMember2023-01-012023-12-310001126328us-gaap:CommonStockMember2022-01-012022-12-310001126328us-gaap:CommonStockMember2021-01-012021-12-310001126328us-gaap:ForeignExchangeContractMemberus-gaap:FairValueHedgingMemberpfg:NetRealizedCapitalGainsLossesMember2023-01-012023-12-310001126328us-gaap:AccidentAndHealthInsuranceSegmentMember2023-01-012023-12-310001126328us-gaap:AccidentAndHealthInsuranceSegmentMember2022-01-012022-12-310001126328us-gaap:AccidentAndHealthInsuranceSegmentMember2021-01-012021-12-310001126328srt:ParentCompanyMembersrt:ReportableLegalEntitiesMember2021-12-310001126328srt:ParentCompanyMembersrt:ReportableLegalEntitiesMember2020-12-310001126328us-gaap:USTreasuryAndGovernmentMember2023-12-310001126328us-gaap:USStatesAndPoliticalSubdivisionsMember2023-12-310001126328us-gaap:ResidentialMortgageBackedSecuritiesMember2023-12-310001126328us-gaap:OtherDebtSecuritiesMember2023-12-310001126328us-gaap:ForeignGovernmentDebtSecuritiesMember2023-12-310001126328us-gaap:CorporateDebtSecuritiesMember2023-12-310001126328us-gaap:CommercialMortgageBackedSecuritiesMember2023-12-310001126328us-gaap:CollateralizedDebtObligationsMember2023-12-310001126328us-gaap:USTreasuryAndGovernmentMember2022-12-310001126328us-gaap:USStatesAndPoliticalSubdivisionsMember2022-12-310001126328us-gaap:ResidentialMortgageBackedSecuritiesMember2022-12-310001126328us-gaap:OtherDebtSecuritiesMember2022-12-310001126328us-gaap:ForeignGovernmentDebtSecuritiesMember2022-12-310001126328us-gaap:CorporateDebtSecuritiesMember2022-12-310001126328us-gaap:CommercialMortgageBackedSecuritiesMember2022-12-310001126328us-gaap:CollateralizedDebtObligationsMember2022-12-310001126328us-gaap:LifeAndAnnuityInsuranceProductLineMember2023-01-012023-12-310001126328us-gaap:LifeAndAnnuityInsuranceProductLineMember2022-01-012022-12-310001126328us-gaap:LifeAndAnnuityInsuranceProductLineMember2021-01-012021-12-310001126328us-gaap:OtherDebtSecuritiesMemberus-gaap:FairValueInputsLevel3Memberus-gaap:FairValueMeasurementsRecurringMemberpfg:AvailableForSaleSecurityMember2023-12-310001126328us-gaap:DebtSecuritiesMemberus-gaap:FairValueInputsLevel3Memberus-gaap:FairValueMeasurementsRecurringMemberpfg:TradingSecuritiesMember2023-12-310001126328us-gaap:CorporateDebtSecuritiesMemberus-gaap:FairValueInputsLevel3Memberus-gaap:FairValueMeasurementsRecurringMemberpfg:AvailableForSaleSecurityMember2023-12-310001126328us-gaap:CollateralizedDebtObligationsMemberus-gaap:FairValueInputsLevel3Memberus-gaap:FairValueMeasurementsRecurringMemberpfg:AvailableForSaleSecurityMember2023-12-310001126328pfg:SeparateAccountAssetsMemberus-gaap:FairValueInputsLevel3Memberus-gaap:FairValueMeasurementsRecurringMember2023-12-310001126328pfg:InvestmentsOtherMemberus-gaap:FairValueInputsLevel3Memberus-gaap:FairValueMeasurementsRecurringMember2023-12-310001126328us-gaap:OtherDebtSecuritiesMemberus-gaap:FairValueInputsLevel3Memberus-gaap:FairValueMeasurementsRecurringMemberpfg:AvailableForSaleSecurityMember2022-12-310001126328us-gaap:DebtSecuritiesMemberus-gaap:FairValueInputsLevel3Memberus-gaap:FairValueMeasurementsRecurringMemberpfg:TradingSecuritiesMember2022-12-310001126328us-gaap:CorporateDebtSecuritiesMemberus-gaap:FairValueInputsLevel3Memberus-gaap:FairValueMeasurementsRecurringMemberpfg:AvailableForSaleSecurityMember2022-12-310001126328us-gaap:CollateralizedDebtObligationsMemberus-gaap:FairValueInputsLevel3Memberus-gaap:FairValueMeasurementsRecurringMemberpfg:AvailableForSaleSecurityMember2022-12-310001126328pfg:SeparateAccountAssetsMemberus-gaap:FairValueInputsLevel3Memberus-gaap:FairValueMeasurementsRecurringMember2022-12-310001126328us-gaap:VariableInterestEntityNotPrimaryBeneficiaryMemberpfg:TradingSecuritiesMemberus-gaap:ResidentialMortgageBackedSecuritiesMember2023-12-310001126328us-gaap:VariableInterestEntityNotPrimaryBeneficiaryMemberpfg:TradingSecuritiesMemberus-gaap:OtherDebtSecuritiesMember2023-12-310001126328us-gaap:VariableInterestEntityNotPrimaryBeneficiaryMemberpfg:TradingSecuritiesMemberus-gaap:CommercialMortgageBackedSecuritiesMember2023-12-310001126328us-gaap:VariableInterestEntityNotPrimaryBeneficiaryMemberpfg:TradingSecuritiesMemberus-gaap:CollateralizedDebtObligationsMember2023-12-310001126328us-gaap:VariableInterestEntityNotPrimaryBeneficiaryMemberpfg:AvailableForSaleSecurityMemberus-gaap:ResidentialMortgageBackedSecuritiesMember2023-12-310001126328us-gaap:VariableInterestEntityNotPrimaryBeneficiaryMemberpfg:AvailableForSaleSecurityMemberus-gaap:OtherDebtSecuritiesMember2023-12-310001126328us-gaap:VariableInterestEntityNotPrimaryBeneficiaryMemberpfg:AvailableForSaleSecurityMemberus-gaap:CorporateDebtSecuritiesMember2023-12-310001126328us-gaap:VariableInterestEntityNotPrimaryBeneficiaryMemberpfg:AvailableForSaleSecurityMemberus-gaap:CommercialMortgageBackedSecuritiesMember2023-12-310001126328us-gaap:VariableInterestEntityNotPrimaryBeneficiaryMemberpfg:AvailableForSaleSecurityMemberus-gaap:CollateralizedDebtObligationsMember2023-12-310001126328us-gaap:VariableInterestEntityNotPrimaryBeneficiaryMemberus-gaap:EquitySecuritiesMember2023-12-310001126328us-gaap:EquityMethodInvestmentNonconsolidatedInvesteeOrGroupOfInvesteesMember2023-12-310001126328pfg:VariableInterestEntityPrimaryBeneficiarySponsoredInvestmentFundsMember2023-12-310001126328pfg:VariableInterestEntityPrimaryBeneficiaryResidentialMortgageLoansMember2023-12-310001126328pfg:VariableInterestEntityPrimaryBeneficiaryRealEstateMember2023-12-310001126328pfg:VariableInterestEntityPrimaryBeneficiaryMandatoryRetirementSavingsMember2023-12-310001126328pfg:VariableInterestEntityPrimaryBeneficiaryAssetBackedLimitedPartnershipMember2023-12-310001126328us-gaap:VariableInterestEntityNotPrimaryBeneficiaryMemberpfg:TradingSecuritiesMemberus-gaap:ResidentialMortgageBackedSecuritiesMember2022-12-310001126328us-gaap:VariableInterestEntityNotPrimaryBeneficiaryMemberpfg:TradingSecuritiesMemberus-gaap:OtherDebtSecuritiesMember2022-12-310001126328us-gaap:VariableInterestEntityNotPrimaryBeneficiaryMemberpfg:TradingSecuritiesMemberus-gaap:CommercialMortgageBackedSecuritiesMember2022-12-310001126328us-gaap:VariableInterestEntityNotPrimaryBeneficiaryMemberpfg:TradingSecuritiesMemberus-gaap:CollateralizedDebtObligationsMember2022-12-310001126328us-gaap:VariableInterestEntityNotPrimaryBeneficiaryMemberpfg:AvailableForSaleSecurityMemberus-gaap:ResidentialMortgageBackedSecuritiesMember2022-12-310001126328us-gaap:VariableInterestEntityNotPrimaryBeneficiaryMemberpfg:AvailableForSaleSecurityMemberus-gaap:OtherDebtSecuritiesMember2022-12-310001126328us-gaap:VariableInterestEntityNotPrimaryBeneficiaryMemberpfg:AvailableForSaleSecurityMemberus-gaap:CorporateDebtSecuritiesMember2022-12-310001126328us-gaap:VariableInterestEntityNotPrimaryBeneficiaryMemberpfg:AvailableForSaleSecurityMemberus-gaap:CommercialMortgageBackedSecuritiesMember2022-12-310001126328us-gaap:VariableInterestEntityNotPrimaryBeneficiaryMemberpfg:AvailableForSaleSecurityMemberus-gaap:CollateralizedDebtObligationsMember2022-12-310001126328us-gaap:VariableInterestEntityNotPrimaryBeneficiaryMemberus-gaap:EquitySecuritiesMember2022-12-310001126328us-gaap:EquityMethodInvestmentNonconsolidatedInvesteeOrGroupOfInvesteesMember2022-12-310001126328pfg:VariableInterestEntityPrimaryBeneficiarySponsoredInvestmentFundsMember2022-12-310001126328pfg:VariableInterestEntityPrimaryBeneficiaryResidentialMortgageLoansMember2022-12-310001126328pfg:VariableInterestEntityPrimaryBeneficiaryRealEstateMember2022-12-310001126328pfg:VariableInterestEntityPrimaryBeneficiaryMandatoryRetirementSavingsMember2022-12-310001126328pfg:GuaranteedPensionMembersrt:AsiaMemberpfg:SegmentPrincipalAssetManagementMemberpfg:SubsegmentPrincipalInternationalMember2023-12-310001126328pfg:GuaranteedPensionMembersrt:AsiaMemberpfg:SegmentPrincipalAssetManagementMemberpfg:SubsegmentPrincipalInternationalMember2022-12-310001126328pfg:GuaranteedPensionMembersrt:AsiaMemberpfg:SegmentPrincipalAssetManagementMemberpfg:SubsegmentPrincipalInternationalMember2021-12-310001126328us-gaap:VariableAnnuityMemberpfg:SegmentRetirementAndIncomeSolutionsMember2021-12-310001126328pfg:GuaranteedPensionMembersrt:AsiaMemberpfg:SegmentPrincipalAssetManagementMemberpfg:SubsegmentPrincipalInternationalMember2020-12-310001126328us-gaap:VariableAnnuityMemberpfg:SegmentRetirementAndIncomeSolutionsMember2020-12-310001126328us-gaap:FixedAnnuityMembersrt:LatinAmericaMemberpfg:SegmentPrincipalAssetManagementMemberpfg:SubsegmentPrincipalInternationalMember2023-12-310001126328pfg:PensionRiskTransferMemberpfg:SegmentRetirementAndIncomeSolutionsMember2023-12-310001126328us-gaap:FixedAnnuityMembersrt:LatinAmericaMemberpfg:SegmentPrincipalAssetManagementMemberpfg:SubsegmentPrincipalInternationalMember2022-12-310001126328pfg:PensionRiskTransferMemberpfg:SegmentRetirementAndIncomeSolutionsMember2022-12-310001126328us-gaap:FixedAnnuityMembersrt:LatinAmericaMemberpfg:SegmentPrincipalAssetManagementMemberpfg:SubsegmentPrincipalInternationalMember2021-12-310001126328us-gaap:FixedAnnuityMemberpfg:SegmentRetirementAndIncomeSolutionsMember2021-12-310001126328pfg:PensionRiskTransferMemberpfg:SegmentRetirementAndIncomeSolutionsMember2021-12-310001126328us-gaap:FixedAnnuityMembersrt:LatinAmericaMemberpfg:SegmentPrincipalAssetManagementMemberpfg:SubsegmentPrincipalInternationalMember2020-12-310001126328us-gaap:FixedAnnuityMemberpfg:SegmentRetirementAndIncomeSolutionsMember2020-12-310001126328pfg:PensionRiskTransferMemberpfg:SegmentRetirementAndIncomeSolutionsMember2020-12-310001126328us-gaap:PensionPlansDefinedBenefitMember2022-01-012022-12-310001126328srt:CumulativeEffectPeriodOfAdoptionAdjustmentMemberpfg:MarketRiskBenefitsCumulativeEffectOfChangesInNonperformanceRiskBetweenOriginalContractIssueDateAndTransitionDateMemberpfg:MarketRiskBenefitsMember2020-12-310001126328srt:CumulativeEffectPeriodOfAdoptionAdjustmentMemberpfg:CostOfReinsuranceAssetLiabilityAdjustmentOfUnrealizedLossInAociMemberpfg:CostOfReinsuranceAssetLiabilityMember2020-12-310001126328srt:CumulativeEffectPeriodOfAdoptionAdjustmentMemberpfg:AociGainLossReversalAdjustmentLdtiMemberpfg:ReinsuranceRecoverablesMember2020-12-310001126328srt:CumulativeEffectPeriodOfAdoptionAdjustmentMemberpfg:AociGainLossReversalAdjustmentLdtiMemberpfg:LiabilityForFuturePolicyBenefitsMember2020-12-310001126328srt:CumulativeEffectPeriodOfAdoptionAdjustmentMemberpfg:AociGainLossReversalAdjustmentLdtiMemberpfg:DacAndOtherActuarialBalancesMember2020-12-310001126328srt:CumulativeEffectPeriodOfAdoptionAdjustmentMemberpfg:AociGainLossRemeasurementAdjustmentDiscountRateMemberpfg:ReinsuranceRecoverablesMember2020-12-310001126328srt:CumulativeEffectPeriodOfAdoptionAdjustmentMemberpfg:AociGainLossRemeasurementAdjustmentDiscountRateMemberpfg:LiabilityForFuturePolicyBenefitsMember2020-12-310001126328pfg:August2022AcceleratedShareRepurchaseProgramMemberus-gaap:CommonStockMember2022-08-160001126328pfg:AcceleratedShareRepurchaseProgramMarch2022Memberus-gaap:CommonStockMember2022-03-310001126328srt:MaximumMemberus-gaap:JuniorSubordinatedDebtMember2015-05-072015-05-070001126328us-gaap:VariableInterestEntityNotPrimaryBeneficiaryMemberpfg:OtherLimitedPartnershipAndFundInterestsMember2023-12-310001126328us-gaap:VariableInterestEntityNotPrimaryBeneficiaryMemberpfg:OtherLimitedPartnershipAndFundInterestsMember2022-12-310001126328pfg:SegmentBenefitsAndProtectionMember2023-01-012023-12-310001126328us-gaap:OtherLongdurationInsuranceProductLineMember2023-12-310001126328us-gaap:OtherLongdurationInsuranceProductLineMember2022-12-310001126328us-gaap:UniversalLifeMemberpfg:SegmentBenefitsAndProtectionMemberpfg:SubsegmentLifeInsuranceMember2021-12-310001126328us-gaap:UniversalLifeMemberpfg:AociGainLossReversalAdjustmentLdtiMemberus-gaap:AccountingStandardsUpdate201812Memberpfg:SegmentBenefitsAndProtectionMemberpfg:SubsegmentLifeInsuranceMember2020-12-310001126328us-gaap:UniversalLifeMembersrt:ScenarioPreviouslyReportedMemberpfg:SegmentBenefitsAndProtectionMemberpfg:SubsegmentLifeInsuranceMember2020-12-310001126328pfg:AociGainLossReversalAdjustmentLdtiMemberus-gaap:AccountingStandardsUpdate201812Memberpfg:SegmentBenefitsAndProtectionMemberpfg:SubsegmentLifeInsuranceMember2020-12-310001126328us-gaap:UniversalLifeMemberpfg:SegmentBenefitsAndProtectionMemberpfg:SubsegmentLifeInsuranceMember2020-12-310001126328srt:ScenarioPreviouslyReportedMemberpfg:SegmentBenefitsAndProtectionMemberpfg:SubsegmentLifeInsuranceMember2020-12-310001126328pfg:SegmentBenefitsAndProtectionMemberpfg:SubsegmentLifeInsuranceMember2020-12-310001126328us-gaap:CommonStockMember2024-02-012024-02-290001126328us-gaap:CommonStockMember2022-01-012022-01-310001126328us-gaap:CommonStockMember2021-06-012021-06-300001126328us-gaap:CommonStockMember2020-02-012020-02-290001126328pfg:ContingentFundingAgreementMember2018-03-080001126328us-gaap:RetainedEarningsMember2023-01-012023-12-310001126328us-gaap:RetainedEarningsMember2022-01-012022-12-310001126328us-gaap:RetainedEarningsMember2021-01-012021-12-310001126328pfg:StockBasedCompensationPlansMember2023-01-012023-12-310001126328pfg:StockBasedCompensationPlansMember2022-01-012022-12-310001126328pfg:StockBasedCompensationPlansMember2021-01-012021-12-310001126328pfg:StockBasedCompensationDirectorsStockPlanStockIncentivePlanAmendedAndRestatedStockIncentivePlanDirectorsStockPlanMember2023-12-310001126328pfg:GroupRetirementContractsProductMemberpfg:SegmentRetirementAndIncomeSolutionsMember2023-01-012023-12-310001126328pfg:GroupRetirementContractsProductMemberpfg:SegmentRetirementAndIncomeSolutionsMember2022-01-012022-12-310001126328pfg:PensionMembersrt:LatinAmericaMemberpfg:SegmentPrincipalAssetManagementMemberpfg:SubsegmentPrincipalInternationalMember2023-01-012023-12-310001126328pfg:PensionMembersrt:LatinAmericaMemberpfg:SegmentPrincipalAssetManagementMemberpfg:SubsegmentPrincipalInternationalMember2022-01-012022-12-310001126328srt:WeightedAverageMemberpfg:SeparateAccountAssetsMemberus-gaap:FairValueInputsLevel3Memberus-gaap:FairValueMeasurementsRecurringMemberus-gaap:MeasurementInputLongTermRevenueGrowthRateMemberpfg:DiscountedCashFlowRealEstateMember2023-12-310001126328srt:WeightedAverageMemberpfg:SeparateAccountAssetsMemberus-gaap:FairValueInputsLevel3Memberus-gaap:FairValueMeasurementsRecurringMemberus-gaap:MeasurementInputDiscountRateMemberpfg:DiscountedCashFlowRealEstateMember2023-12-310001126328srt:WeightedAverageMemberpfg:SeparateAccountAssetsMemberus-gaap:FairValueInputsLevel3Memberus-gaap:FairValueMeasurementsRecurringMemberpfg:MeasurementInputTerminalCapitalizationRateMemberpfg:DiscountedCashFlowRealEstateMember2023-12-310001126328srt:WeightedAverageMemberpfg:SeparateAccountAssetsMemberus-gaap:FairValueInputsLevel3Memberus-gaap:FairValueMeasurementsRecurringMemberpfg:MeasurementInputMarketInterestRateMemberpfg:DiscountedCashFlowRealEstateDebtMember2023-12-310001126328srt:WeightedAverageMemberpfg:SeparateAccountAssetsMemberus-gaap:FairValueInputsLevel3Memberus-gaap:FairValueMeasurementsRecurringMemberpfg:MeasurementInputLoanToValueRatioMemberpfg:DiscountedCashFlowRealEstateDebtMember2023-12-310001126328srt:MinimumMemberpfg:SeparateAccountAssetsMemberus-gaap:FairValueInputsLevel3Memberus-gaap:FairValueMeasurementsRecurringMemberus-gaap:MeasurementInputLongTermRevenueGrowthRateMemberpfg:DiscountedCashFlowRealEstateMember2023-12-310001126328srt:MinimumMemberpfg:SeparateAccountAssetsMemberus-gaap:FairValueInputsLevel3Memberus-gaap:FairValueMeasurementsRecurringMemberus-gaap:MeasurementInputDiscountRateMemberpfg:DiscountedCashFlowRealEstateMember2023-12-310001126328srt:MinimumMemberpfg:SeparateAccountAssetsMemberus-gaap:FairValueInputsLevel3Memberus-gaap:FairValueMeasurementsRecurringMemberpfg:MeasurementInputTerminalCapitalizationRateMemberpfg:DiscountedCashFlowRealEstateMember2023-12-310001126328srt:MinimumMemberpfg:SeparateAccountAssetsMemberus-gaap:FairValueInputsLevel3Memberus-gaap:FairValueMeasurementsRecurringMemberpfg:MeasurementInputMarketInterestRateMemberpfg:DiscountedCashFlowRealEstateDebtMember2023-12-310001126328srt:MinimumMemberpfg:SeparateAccountAssetsMemberus-gaap:FairValueInputsLevel3Memberus-gaap:FairValueMeasurementsRecurringMemberpfg:MeasurementInputLoanToValueRatioMemberpfg:DiscountedCashFlowRealEstateDebtMember2023-12-310001126328srt:MaximumMemberpfg:SeparateAccountAssetsMemberus-gaap:FairValueInputsLevel3Memberus-gaap:FairValueMeasurementsRecurringMemberus-gaap:MeasurementInputLongTermRevenueGrowthRateMemberpfg:DiscountedCashFlowRealEstateMember2023-12-310001126328srt:MaximumMemberpfg:SeparateAccountAssetsMemberus-gaap:FairValueInputsLevel3Memberus-gaap:FairValueMeasurementsRecurringMemberus-gaap:MeasurementInputDiscountRateMemberpfg:DiscountedCashFlowRealEstateMember2023-12-310001126328srt:MaximumMemberpfg:SeparateAccountAssetsMemberus-gaap:FairValueInputsLevel3Memberus-gaap:FairValueMeasurementsRecurringMemberpfg:MeasurementInputTerminalCapitalizationRateMemberpfg:DiscountedCashFlowRealEstateMember2023-12-310001126328srt:MaximumMemberpfg:SeparateAccountAssetsMemberus-gaap:FairValueInputsLevel3Memberus-gaap:FairValueMeasurementsRecurringMemberpfg:MeasurementInputMarketInterestRateMemberpfg:DiscountedCashFlowRealEstateDebtMember2023-12-310001126328srt:MaximumMemberpfg:SeparateAccountAssetsMemberus-gaap:FairValueInputsLevel3Memberus-gaap:FairValueMeasurementsRecurringMemberpfg:MeasurementInputLoanToValueRatioMemberpfg:DiscountedCashFlowRealEstateDebtMember2023-12-310001126328srt:WeightedAverageMemberpfg:SeparateAccountAssetsMemberus-gaap:FairValueInputsLevel3Memberus-gaap:FairValueMeasurementsRecurringMemberus-gaap:MeasurementInputLongTermRevenueGrowthRateMemberpfg:DiscountedCashFlowRealEstateMember2022-12-310001126328srt:WeightedAverageMemberpfg:SeparateAccountAssetsMemberus-gaap:FairValueInputsLevel3Memberus-gaap:FairValueMeasurementsRecurringMemberus-gaap:MeasurementInputDiscountRateMemberpfg:DiscountedCashFlowRealEstateMember2022-12-310001126328srt:WeightedAverageMemberpfg:SeparateAccountAssetsMemberus-gaap:FairValueInputsLevel3Memberus-gaap:FairValueMeasurementsRecurringMemberpfg:MeasurementInputTerminalCapitalizationRateMemberpfg:DiscountedCashFlowRealEstateMember2022-12-310001126328srt:WeightedAverageMemberpfg:SeparateAccountAssetsMemberus-gaap:FairValueInputsLevel3Memberus-gaap:FairValueMeasurementsRecurringMemberpfg:MeasurementInputMarketInterestRateMemberpfg:DiscountedCashFlowRealEstateDebtMember2022-12-310001126328srt:WeightedAverageMemberpfg:SeparateAccountAssetsMemberus-gaap:FairValueInputsLevel3Memberus-gaap:FairValueMeasurementsRecurringMemberpfg:MeasurementInputLoanToValueRatioMemberpfg:DiscountedCashFlowRealEstateDebtMember2022-12-310001126328srt:MinimumMemberpfg:SeparateAccountAssetsMemberus-gaap:FairValueInputsLevel3Memberus-gaap:FairValueMeasurementsRecurringMemberus-gaap:MeasurementInputLongTermRevenueGrowthRateMemberpfg:DiscountedCashFlowRealEstateMember2022-12-310001126328srt:MinimumMemberpfg:SeparateAccountAssetsMemberus-gaap:FairValueInputsLevel3Memberus-gaap:FairValueMeasurementsRecurringMemberus-gaap:MeasurementInputDiscountRateMemberpfg:DiscountedCashFlowRealEstateMember2022-12-310001126328srt:MinimumMemberpfg:SeparateAccountAssetsMemberus-gaap:FairValueInputsLevel3Memberus-gaap:FairValueMeasurementsRecurringMemberpfg:MeasurementInputTerminalCapitalizationRateMemberpfg:DiscountedCashFlowRealEstateMember2022-12-310001126328srt:MinimumMemberpfg:SeparateAccountAssetsMemberus-gaap:FairValueInputsLevel3Memberus-gaap:FairValueMeasurementsRecurringMemberpfg:MeasurementInputMarketInterestRateMemberpfg:DiscountedCashFlowRealEstateDebtMember2022-12-310001126328srt:MinimumMemberpfg:SeparateAccountAssetsMemberus-gaap:FairValueInputsLevel3Memberus-gaap:FairValueMeasurementsRecurringMemberpfg:MeasurementInputLoanToValueRatioMemberpfg:DiscountedCashFlowRealEstateDebtMember2022-12-310001126328srt:MaximumMemberpfg:SeparateAccountAssetsMemberus-gaap:FairValueInputsLevel3Memberus-gaap:FairValueMeasurementsRecurringMemberus-gaap:MeasurementInputLongTermRevenueGrowthRateMemberpfg:DiscountedCashFlowRealEstateMember2022-12-310001126328srt:MaximumMemberpfg:SeparateAccountAssetsMemberus-gaap:FairValueInputsLevel3Memberus-gaap:FairValueMeasurementsRecurringMemberus-gaap:MeasurementInputDiscountRateMemberpfg:DiscountedCashFlowRealEstateMember2022-12-310001126328srt:MaximumMemberpfg:SeparateAccountAssetsMemberus-gaap:FairValueInputsLevel3Memberus-gaap:FairValueMeasurementsRecurringMemberpfg:MeasurementInputTerminalCapitalizationRateMemberpfg:DiscountedCashFlowRealEstateMember2022-12-310001126328srt:MaximumMemberpfg:SeparateAccountAssetsMemberus-gaap:FairValueInputsLevel3Memberus-gaap:FairValueMeasurementsRecurringMemberpfg:MeasurementInputMarketInterestRateMemberpfg:DiscountedCashFlowRealEstateDebtMember2022-12-310001126328srt:MaximumMemberpfg:SeparateAccountAssetsMemberus-gaap:FairValueInputsLevel3Memberus-gaap:FairValueMeasurementsRecurringMemberpfg:MeasurementInputLoanToValueRatioMemberpfg:DiscountedCashFlowRealEstateDebtMember2022-12-310001126328srt:CumulativeEffectPeriodOfAdoptionAdjustmentMemberpfg:MarketRiskBenefitsRetainedEarningsAdjustmentForValuationOfContractsAsMrbsMemberpfg:MarketRiskBenefitsMember2020-12-310001126328srt:CumulativeEffectPeriodOfAdoptionAdjustmentMemberpfg:MarketRiskBenefitsReclassificationOfNonperformanceRiskChangesBetweenRetainedEarningsAndAociMemberpfg:MarketRiskBenefitsMember2020-12-310001126328srt:CumulativeEffectPeriodOfAdoptionAdjustmentMemberpfg:MarketRiskBenefitsAdjustmentsToHostContractForDifferencesBetweenPreviousCarryingAmountAndMeasurementOfMrbMemberpfg:MarketRiskBenefitsMember2020-12-310001126328srt:CumulativeEffectPeriodOfAdoptionAdjustmentMemberpfg:InvestmentInEquityMethodSubsidiaryImpactedByLdtiMemberus-gaap:OtherInvestmentsMember2020-12-310001126328srt:CumulativeEffectPeriodOfAdoptionAdjustmentMemberpfg:CostOfReinsuranceAssetLiabilityCumulativeEffectOfAmortizationBasisChangeMemberpfg:CostOfReinsuranceAssetLiabilityMember2020-12-310001126328srt:CumulativeEffectPeriodOfAdoptionAdjustmentMemberpfg:AdjustmentFromEffectOfModifiedRetrospectiveApplicationLdtiMemberpfg:ReinsuranceRecoverablesMember2020-12-310001126328srt:CumulativeEffectPeriodOfAdoptionAdjustmentMemberpfg:AdjustmentFromEffectOfModifiedRetrospectiveApplicationLdtiMemberpfg:LiabilityForFuturePolicyBenefitsMember2020-12-310001126328pfg:LongTermDisabilityGroupLifeWaiverMember2023-12-310001126328pfg:GroupLifeMember2023-12-310001126328pfg:Delaware2048TrustMember2018-03-082018-03-080001126328pfg:Delaware2028TrustMember2018-03-082018-03-080001126328us-gaap:UniversalLifeMemberus-gaap:PolicyholderAccountBalanceAtGuaranteedMinimumCreditingRateMemberpfg:PolicyholderAccountBalanceGuaranteedMinimumCreditingRateRangeFrom0401AndGreaterMemberpfg:SegmentBenefitsAndProtectionMemberpfg:SubsegmentLifeInsuranceMember2023-12-310001126328us-gaap:UniversalLifeMemberus-gaap:PolicyholderAccountBalanceAtGuaranteedMinimumCreditingRateMemberpfg:PolicyholderAccountBalanceGuaranteedMinimumCreditingRateRangeFrom0301To0400Memberpfg:SegmentBenefitsAndProtectionMemberpfg:SubsegmentLifeInsuranceMember2023-12-310001126328us-gaap:UniversalLifeMemberus-gaap:PolicyholderAccountBalanceAtGuaranteedMinimumCreditingRateMemberpfg:PolicyholderAccountBalanceGuaranteedMinimumCreditingRateRangeFrom0201To0300Memberpfg:SegmentBenefitsAndProtectionMemberpfg:SubsegmentLifeInsuranceMember2023-12-310001126328us-gaap:UniversalLifeMemberus-gaap:PolicyholderAccountBalanceAtGuaranteedMinimumCreditingRateMemberpfg:PolicyholderAccountBalanceGuaranteedMinimumCreditingRateRangeFrom0101To0200Memberpfg:SegmentBenefitsAndProtectionMemberpfg:SubsegmentLifeInsuranceMember2023-12-310001126328us-gaap:UniversalLifeMemberus-gaap:PolicyholderAccountBalanceAboveGuaranteedMinimumCreditingRateRangeFrom0001To0050Memberpfg:PolicyholderAccountBalanceGuaranteedMinimumCreditingRateRangeFrom0401AndGreaterMemberpfg:SegmentBenefitsAndProtectionMemberpfg:SubsegmentLifeInsuranceMember2023-12-310001126328us-gaap:UniversalLifeMemberus-gaap:PolicyholderAccountBalanceAboveGuaranteedMinimumCreditingRateRangeFrom0001To0050Memberpfg:PolicyholderAccountBalanceGuaranteedMinimumCreditingRateRangeFrom0301To0400Memberpfg:SegmentBenefitsAndProtectionMemberpfg:SubsegmentLifeInsuranceMember2023-12-310001126328us-gaap:UniversalLifeMemberus-gaap:PolicyholderAccountBalanceAboveGuaranteedMinimumCreditingRateRangeFrom0001To0050Memberpfg:PolicyholderAccountBalanceGuaranteedMinimumCreditingRateRangeFrom0201To0300Memberpfg:SegmentBenefitsAndProtectionMemberpfg:SubsegmentLifeInsuranceMember2023-12-310001126328us-gaap:UniversalLifeMemberpfg:PolicyholderAccountBalanceAboveGuaranteedMinimumCreditingRateRangeFrom0201AndGreaterMemberpfg:PolicyholderAccountBalanceGuaranteedMinimumCreditingRateRangeUpTo0100Memberpfg:SegmentBenefitsAndProtectionMemberpfg:SubsegmentLifeInsuranceMember2023-12-310001126328us-gaap:UniversalLifeMemberpfg:PolicyholderAccountBalanceAboveGuaranteedMinimumCreditingRateRangeFrom0201AndGreaterMemberpfg:PolicyholderAccountBalanceGuaranteedMinimumCreditingRateRangeFrom0301To0400Memberpfg:SegmentBenefitsAndProtectionMemberpfg:SubsegmentLifeInsuranceMember2023-12-310001126328us-gaap:UniversalLifeMemberpfg:PolicyholderAccountBalanceAboveGuaranteedMinimumCreditingRateRangeFrom0201AndGreaterMemberpfg:PolicyholderAccountBalanceGuaranteedMinimumCreditingRateRangeFrom0201To0300Memberpfg:SegmentBenefitsAndProtectionMemberpfg:SubsegmentLifeInsuranceMember2023-12-310001126328us-gaap:UniversalLifeMemberpfg:PolicyholderAccountBalanceAboveGuaranteedMinimumCreditingRateRangeFrom0201AndGreaterMemberpfg:PolicyholderAccountBalanceGuaranteedMinimumCreditingRateRangeFrom0101To0200Memberpfg:SegmentBenefitsAndProtectionMemberpfg:SubsegmentLifeInsuranceMember2023-12-310001126328us-gaap:UniversalLifeMemberpfg:PolicyholderAccountBalanceAboveGuaranteedMinimumCreditingRateRangeFrom0101To0200Memberpfg:PolicyholderAccountBalanceGuaranteedMinimumCreditingRateRangeUpTo0100Memberpfg:SegmentBenefitsAndProtectionMemberpfg:SubsegmentLifeInsuranceMember2023-12-310001126328us-gaap:UniversalLifeMemberpfg:PolicyholderAccountBalanceAboveGuaranteedMinimumCreditingRateRangeFrom0101To0200Memberpfg:PolicyholderAccountBalanceGuaranteedMinimumCreditingRateRangeFrom0401AndGreaterMemberpfg:SegmentBenefitsAndProtectionMemberpfg:SubsegmentLifeInsuranceMember2023-12-310001126328us-gaap:UniversalLifeMemberpfg:PolicyholderAccountBalanceAboveGuaranteedMinimumCreditingRateRangeFrom0101To0200Memberpfg:PolicyholderAccountBalanceGuaranteedMinimumCreditingRateRangeFrom0301To0400Memberpfg:SegmentBenefitsAndProtectionMemberpfg:SubsegmentLifeInsuranceMember2023-12-310001126328us-gaap:UniversalLifeMemberpfg:PolicyholderAccountBalanceAboveGuaranteedMinimumCreditingRateRangeFrom0101To0200Memberpfg:PolicyholderAccountBalanceGuaranteedMinimumCreditingRateRangeFrom0201To0300Memberpfg:SegmentBenefitsAndProtectionMemberpfg:SubsegmentLifeInsuranceMember2023-12-310001126328us-gaap:UniversalLifeMemberpfg:PolicyholderAccountBalanceAboveGuaranteedMinimumCreditingRateRangeFrom0101To0200Memberpfg:PolicyholderAccountBalanceGuaranteedMinimumCreditingRateRangeFrom0101To0200Memberpfg:SegmentBenefitsAndProtectionMemberpfg:SubsegmentLifeInsuranceMember2023-12-310001126328us-gaap:UniversalLifeMemberpfg:PolicyholderAccountBalanceAboveGuaranteedMinimumCreditingRateRangeFrom0051To0100Memberpfg:PolicyholderAccountBalanceGuaranteedMinimumCreditingRateRangeUpTo0100Memberpfg:SegmentBenefitsAndProtectionMemberpfg:SubsegmentLifeInsuranceMember2023-12-310001126328us-gaap:UniversalLifeMemberpfg:PolicyholderAccountBalanceAboveGuaranteedMinimumCreditingRateRangeFrom0051To0100Memberpfg:PolicyholderAccountBalanceGuaranteedMinimumCreditingRateRangeFrom0401AndGreaterMemberpfg:SegmentBenefitsAndProtectionMemberpfg:SubsegmentLifeInsuranceMember2023-12-310001126328us-gaap:UniversalLifeMemberpfg:PolicyholderAccountBalanceAboveGuaranteedMinimumCreditingRateRangeFrom0051To0100Memberpfg:PolicyholderAccountBalanceGuaranteedMinimumCreditingRateRangeFrom0301To0400Memberpfg:SegmentBenefitsAndProtectionMemberpfg:SubsegmentLifeInsuranceMember2023-12-310001126328us-gaap:UniversalLifeMemberpfg:PolicyholderAccountBalanceAboveGuaranteedMinimumCreditingRateRangeFrom0051To0100Memberpfg:PolicyholderAccountBalanceGuaranteedMinimumCreditingRateRangeFrom0201To0300Memberpfg:SegmentBenefitsAndProtectionMemberpfg:SubsegmentLifeInsuranceMember2023-12-310001126328us-gaap:UniversalLifeMemberpfg:PolicyholderAccountBalanceAboveGuaranteedMinimumCreditingRateRangeFrom0051To0100Memberpfg:PolicyholderAccountBalanceGuaranteedMinimumCreditingRateRangeFrom0101To0200Memberpfg:SegmentBenefitsAndProtectionMemberpfg:SubsegmentLifeInsuranceMember2023-12-310001126328us-gaap:VariableAnnuityMemberus-gaap:PolicyholderAccountBalanceAtGuaranteedMinimumCreditingRateMemberpfg:PolicyholderAccountBalanceGuaranteedMinimumCreditingRateRangeUpTo0100Memberpfg:SegmentRetirementAndIncomeSolutionsMember2023-12-310001126328us-gaap:VariableAnnuityMemberus-gaap:PolicyholderAccountBalanceAtGuaranteedMinimumCreditingRateMemberpfg:PolicyholderAccountBalanceGuaranteedMinimumCreditingRateRangeFrom0201To0300Memberpfg:SegmentRetirementAndIncomeSolutionsMember2023-12-310001126328us-gaap:VariableAnnuityMemberus-gaap:PolicyholderAccountBalanceAtGuaranteedMinimumCreditingRateMemberpfg:PolicyholderAccountBalanceGuaranteedMinimumCreditingRateRangeFrom0101To0200Memberpfg:SegmentRetirementAndIncomeSolutionsMember2023-12-310001126328us-gaap:UniversalLifeMemberus-gaap:PolicyholderAccountBalanceAtGuaranteedMinimumCreditingRateMemberpfg:SegmentBenefitsAndProtectionMemberpfg:SubsegmentLifeInsuranceMember2023-12-310001126328us-gaap:UniversalLifeMemberus-gaap:PolicyholderAccountBalanceAboveGuaranteedMinimumCreditingRateRangeFrom0001To0050Memberpfg:SegmentBenefitsAndProtectionMemberpfg:SubsegmentLifeInsuranceMember2023-12-310001126328us-gaap:UniversalLifeMemberpfg:PolicyholderAccountBalanceGuaranteedMinimumCreditingRateRangeUpTo0100Memberpfg:SegmentBenefitsAndProtectionMemberpfg:SubsegmentLifeInsuranceMember2023-12-310001126328us-gaap:UniversalLifeMemberpfg:PolicyholderAccountBalanceGuaranteedMinimumCreditingRateRangeFrom0401AndGreaterMemberpfg:SegmentBenefitsAndProtectionMemberpfg:SubsegmentLifeInsuranceMember2023-12-310001126328us-gaap:UniversalLifeMemberpfg:PolicyholderAccountBalanceGuaranteedMinimumCreditingRateRangeFrom0301To0400Memberpfg:SegmentBenefitsAndProtectionMemberpfg:SubsegmentLifeInsuranceMember2023-12-310001126328us-gaap:UniversalLifeMemberpfg:PolicyholderAccountBalanceGuaranteedMinimumCreditingRateRangeFrom0201To0300Memberpfg:SegmentBenefitsAndProtectionMemberpfg:SubsegmentLifeInsuranceMember2023-12-310001126328us-gaap:UniversalLifeMemberpfg:PolicyholderAccountBalanceGuaranteedMinimumCreditingRateRangeFrom0101To0200Memberpfg:SegmentBenefitsAndProtectionMemberpfg:SubsegmentLifeInsuranceMember2023-12-310001126328us-gaap:UniversalLifeMemberpfg:PolicyholderAccountBalanceAboveGuaranteedMinimumCreditingRateRangeFrom0201AndGreaterMemberpfg:SegmentBenefitsAndProtectionMemberpfg:SubsegmentLifeInsuranceMember2023-12-310001126328us-gaap:UniversalLifeMemberpfg:PolicyholderAccountBalanceAboveGuaranteedMinimumCreditingRateRangeFrom0101To0200Memberpfg:SegmentBenefitsAndProtectionMemberpfg:SubsegmentLifeInsuranceMember2023-12-310001126328us-gaap:UniversalLifeMemberpfg:PolicyholderAccountBalanceAboveGuaranteedMinimumCreditingRateRangeFrom0051To0100Memberpfg:SegmentBenefitsAndProtectionMemberpfg:SubsegmentLifeInsuranceMember2023-12-310001126328us-gaap:DeferredFixedAnnuityMemberus-gaap:PolicyholderAccountBalanceAtGuaranteedMinimumCreditingRateMemberpfg:PolicyholderAccountBalanceGuaranteedMinimumCreditingRateRangeUpTo0100Memberpfg:SegmentRetirementAndIncomeSolutionsMember2023-12-310001126328us-gaap:DeferredFixedAnnuityMemberus-gaap:PolicyholderAccountBalanceAtGuaranteedMinimumCreditingRateMemberpfg:PolicyholderAccountBalanceGuaranteedMinimumCreditingRateRangeFrom0301To0400Memberpfg:SegmentRetirementAndIncomeSolutionsMember2023-12-310001126328us-gaap:DeferredFixedAnnuityMemberus-gaap:PolicyholderAccountBalanceAtGuaranteedMinimumCreditingRateMemberpfg:PolicyholderAccountBalanceGuaranteedMinimumCreditingRateRangeFrom0201To0300Memberpfg:SegmentRetirementAndIncomeSolutionsMember2023-12-310001126328us-gaap:DeferredFixedAnnuityMemberus-gaap:PolicyholderAccountBalanceAtGuaranteedMinimumCreditingRateMemberpfg:PolicyholderAccountBalanceGuaranteedMinimumCreditingRateRangeFrom0101To0200Memberpfg:SegmentRetirementAndIncomeSolutionsMember2023-12-310001126328us-gaap:DeferredFixedAnnuityMemberus-gaap:PolicyholderAccountBalanceAboveGuaranteedMinimumCreditingRateRangeFrom0001To0050Memberpfg:PolicyholderAccountBalanceGuaranteedMinimumCreditingRateRangeUpTo0100Memberpfg:SegmentRetirementAndIncomeSolutionsMember2023-12-310001126328us-gaap:DeferredFixedAnnuityMemberus-gaap:PolicyholderAccountBalanceAboveGuaranteedMinimumCreditingRateRangeFrom0001To0050Memberpfg:PolicyholderAccountBalanceGuaranteedMinimumCreditingRateRangeFrom0101To0200Memberpfg:SegmentRetirementAndIncomeSolutionsMember2023-12-310001126328us-gaap:DeferredFixedAnnuityMemberpfg:PolicyholderAccountBalanceAboveGuaranteedMinimumCreditingRateRangeFrom0201AndGreaterMemberpfg:PolicyholderAccountBalanceGuaranteedMinimumCreditingRateRangeUpTo0100Memberpfg:SegmentRetirementAndIncomeSolutionsMember2023-12-310001126328us-gaap:DeferredFixedAnnuityMemberpfg:PolicyholderAccountBalanceAboveGuaranteedMinimumCreditingRateRangeFrom0201AndGreaterMemberpfg:PolicyholderAccountBalanceGuaranteedMinimumCreditingRateRangeFrom0101To0200Memberpfg:SegmentRetirementAndIncomeSolutionsMember2023-12-310001126328us-gaap:DeferredFixedAnnuityMemberpfg:PolicyholderAccountBalanceAboveGuaranteedMinimumCreditingRateRangeFrom0101To0200Memberpfg:PolicyholderAccountBalanceGuaranteedMinimumCreditingRateRangeUpTo0100Memberpfg:SegmentRetirementAndIncomeSolutionsMember2023-12-310001126328us-gaap:DeferredFixedAnnuityMemberpfg:PolicyholderAccountBalanceAboveGuaranteedMinimumCreditingRateRangeFrom0101To0200Memberpfg:PolicyholderAccountBalanceGuaranteedMinimumCreditingRateRangeFrom0101To0200Memberpfg:SegmentRetirementAndIncomeSolutionsMember2023-12-310001126328us-gaap:DeferredFixedAnnuityMemberpfg:PolicyholderAccountBalanceAboveGuaranteedMinimumCreditingRateRangeFrom0051To0100Memberpfg:PolicyholderAccountBalanceGuaranteedMinimumCreditingRateRangeUpTo0100Memberpfg:SegmentRetirementAndIncomeSolutionsMember2023-12-310001126328us-gaap:DeferredFixedAnnuityMemberpfg:PolicyholderAccountBalanceAboveGuaranteedMinimumCreditingRateRangeFrom0051To0100Memberpfg:PolicyholderAccountBalanceGuaranteedMinimumCreditingRateRangeFrom0101To0200Memberpfg:SegmentRetirementAndIncomeSolutionsMember2023-12-310001126328pfg:WorkplaceSavingsAndRetirementSolutionsMemberus-gaap:PolicyholderAccountBalanceAtGuaranteedMinimumCreditingRateMemberpfg:PolicyholderAccountBalanceGuaranteedMinimumCreditingRateRangeFrom0401AndGreaterMemberpfg:SegmentRetirementAndIncomeSolutionsMember2023-12-310001126328pfg:WorkplaceSavingsAndRetirementSolutionsMemberus-gaap:PolicyholderAccountBalanceAtGuaranteedMinimumCreditingRateMemberpfg:PolicyholderAccountBalanceGuaranteedMinimumCreditingRateRangeFrom0301To0400Memberpfg:SegmentRetirementAndIncomeSolutionsMember2023-12-310001126328pfg:WorkplaceSavingsAndRetirementSolutionsMemberus-gaap:PolicyholderAccountBalanceAtGuaranteedMinimumCreditingRateMemberpfg:PolicyholderAccountBalanceGuaranteedMinimumCreditingRateRangeFrom0201To0300Memberpfg:SegmentRetirementAndIncomeSolutionsMember2023-12-310001126328pfg:WorkplaceSavingsAndRetirementSolutionsMemberus-gaap:PolicyholderAccountBalanceAtGuaranteedMinimumCreditingRateMemberpfg:PolicyholderAccountBalanceGuaranteedMinimumCreditingRateRangeFrom0101To0200Memberpfg:SegmentRetirementAndIncomeSolutionsMember2023-12-310001126328pfg:WorkplaceSavingsAndRetirementSolutionsMemberus-gaap:PolicyholderAccountBalanceAboveGuaranteedMinimumCreditingRateRangeFrom0001To0050Memberpfg:PolicyholderAccountBalanceGuaranteedMinimumCreditingRateRangeUpTo0100Memberpfg:SegmentRetirementAndIncomeSolutionsMember2023-12-310001126328pfg:WorkplaceSavingsAndRetirementSolutionsMemberus-gaap:PolicyholderAccountBalanceAboveGuaranteedMinimumCreditingRateRangeFrom0001To0050Memberpfg:PolicyholderAccountBalanceGuaranteedMinimumCreditingRateRangeFrom0201To0300Memberpfg:SegmentRetirementAndIncomeSolutionsMember2023-12-310001126328pfg:WorkplaceSavingsAndRetirementSolutionsMemberus-gaap:PolicyholderAccountBalanceAboveGuaranteedMinimumCreditingRateRangeFrom0001To0050Memberpfg:PolicyholderAccountBalanceGuaranteedMinimumCreditingRateRangeFrom0101To0200Memberpfg:SegmentRetirementAndIncomeSolutionsMember2023-12-310001126328pfg:WorkplaceSavingsAndRetirementSolutionsMemberpfg:PolicyholderAccountBalanceAboveGuaranteedMinimumCreditingRateRangeFrom0201AndGreaterMemberpfg:PolicyholderAccountBalanceGuaranteedMinimumCreditingRateRangeUpTo0100Memberpfg:SegmentRetirementAndIncomeSolutionsMember2023-12-310001126328pfg:WorkplaceSavingsAndRetirementSolutionsMemberpfg:PolicyholderAccountBalanceAboveGuaranteedMinimumCreditingRateRangeFrom0201AndGreaterMemberpfg:PolicyholderAccountBalanceGuaranteedMinimumCreditingRateRangeFrom0201To0300Memberpfg:SegmentRetirementAndIncomeSolutionsMember2023-12-310001126328pfg:WorkplaceSavingsAndRetirementSolutionsMemberpfg:PolicyholderAccountBalanceAboveGuaranteedMinimumCreditingRateRangeFrom0201AndGreaterMemberpfg:PolicyholderAccountBalanceGuaranteedMinimumCreditingRateRangeFrom0101To0200Memberpfg:SegmentRetirementAndIncomeSolutionsMember2023-12-310001126328pfg:WorkplaceSavingsAndRetirementSolutionsMemberpfg:PolicyholderAccountBalanceAboveGuaranteedMinimumCreditingRateRangeFrom0101To0200Memberpfg:PolicyholderAccountBalanceGuaranteedMinimumCreditingRateRangeUpTo0100Memberpfg:SegmentRetirementAndIncomeSolutionsMember2023-12-310001126328pfg:WorkplaceSavingsAndRetirementSolutionsMemberpfg:PolicyholderAccountBalanceAboveGuaranteedMinimumCreditingRateRangeFrom0101To0200Memberpfg:PolicyholderAccountBalanceGuaranteedMinimumCreditingRateRangeFrom0201To0300Memberpfg:SegmentRetirementAndIncomeSolutionsMember2023-12-310001126328pfg:WorkplaceSavingsAndRetirementSolutionsMemberpfg:PolicyholderAccountBalanceAboveGuaranteedMinimumCreditingRateRangeFrom0051To0100Memberpfg:PolicyholderAccountBalanceGuaranteedMinimumCreditingRateRangeUpTo0100Memberpfg:SegmentRetirementAndIncomeSolutionsMember2023-12-310001126328pfg:WorkplaceSavingsAndRetirementSolutionsMemberpfg:PolicyholderAccountBalanceAboveGuaranteedMinimumCreditingRateRangeFrom0051To0100Memberpfg:PolicyholderAccountBalanceGuaranteedMinimumCreditingRateRangeFrom0201To0300Memberpfg:SegmentRetirementAndIncomeSolutionsMember2023-12-310001126328pfg:WorkplaceSavingsAndRetirementSolutionsMemberpfg:PolicyholderAccountBalanceAboveGuaranteedMinimumCreditingRateRangeFrom0051To0100Memberpfg:PolicyholderAccountBalanceGuaranteedMinimumCreditingRateRangeFrom0101To0200Memberpfg:SegmentRetirementAndIncomeSolutionsMember2023-12-310001126328us-gaap:VariableAnnuityMemberus-gaap:PolicyholderAccountBalanceAtGuaranteedMinimumCreditingRateMemberpfg:SegmentRetirementAndIncomeSolutionsMember2023-12-310001126328us-gaap:VariableAnnuityMemberpfg:PolicyholderAccountBalanceGuaranteedMinimumCreditingRateRangeUpTo0100Memberpfg:SegmentRetirementAndIncomeSolutionsMember2023-12-310001126328us-gaap:VariableAnnuityMemberpfg:PolicyholderAccountBalanceGuaranteedMinimumCreditingRateRangeFrom0201To0300Memberpfg:SegmentRetirementAndIncomeSolutionsMember2023-12-310001126328us-gaap:VariableAnnuityMemberpfg:PolicyholderAccountBalanceGuaranteedMinimumCreditingRateRangeFrom0101To0200Memberpfg:SegmentRetirementAndIncomeSolutionsMember2023-12-310001126328us-gaap:DeferredFixedAnnuityMemberus-gaap:PolicyholderAccountBalanceAtGuaranteedMinimumCreditingRateMemberpfg:SegmentRetirementAndIncomeSolutionsMember2023-12-310001126328us-gaap:DeferredFixedAnnuityMemberus-gaap:PolicyholderAccountBalanceAboveGuaranteedMinimumCreditingRateRangeFrom0001To0050Memberpfg:SegmentRetirementAndIncomeSolutionsMember2023-12-310001126328us-gaap:DeferredFixedAnnuityMemberpfg:PolicyholderAccountBalanceGuaranteedMinimumCreditingRateRangeUpTo0100Memberpfg:SegmentRetirementAndIncomeSolutionsMember2023-12-310001126328us-gaap:DeferredFixedAnnuityMemberpfg:PolicyholderAccountBalanceGuaranteedMinimumCreditingRateRangeFrom0301To0400Memberpfg:SegmentRetirementAndIncomeSolutionsMember2023-12-310001126328us-gaap:DeferredFixedAnnuityMemberpfg:PolicyholderAccountBalanceGuaranteedMinimumCreditingRateRangeFrom0201To0300Memberpfg:SegmentRetirementAndIncomeSolutionsMember2023-12-310001126328us-gaap:DeferredFixedAnnuityMemberpfg:PolicyholderAccountBalanceGuaranteedMinimumCreditingRateRangeFrom0101To0200Memberpfg:SegmentRetirementAndIncomeSolutionsMember2023-12-310001126328us-gaap:DeferredFixedAnnuityMemberpfg:PolicyholderAccountBalanceAboveGuaranteedMinimumCreditingRateRangeFrom0201AndGreaterMemberpfg:SegmentRetirementAndIncomeSolutionsMember2023-12-310001126328us-gaap:DeferredFixedAnnuityMemberpfg:PolicyholderAccountBalanceAboveGuaranteedMinimumCreditingRateRangeFrom0101To0200Memberpfg:SegmentRetirementAndIncomeSolutionsMember2023-12-310001126328us-gaap:DeferredFixedAnnuityMemberpfg:PolicyholderAccountBalanceAboveGuaranteedMinimumCreditingRateRangeFrom0051To0100Memberpfg:SegmentRetirementAndIncomeSolutionsMember2023-12-310001126328pfg:WorkplaceSavingsAndRetirementSolutionsMemberus-gaap:PolicyholderAccountBalanceAtGuaranteedMinimumCreditingRateMemberpfg:SegmentRetirementAndIncomeSolutionsMember2023-12-310001126328pfg:WorkplaceSavingsAndRetirementSolutionsMemberus-gaap:PolicyholderAccountBalanceAboveGuaranteedMinimumCreditingRateRangeFrom0001To0050Memberpfg:SegmentRetirementAndIncomeSolutionsMember2023-12-310001126328pfg:WorkplaceSavingsAndRetirementSolutionsMemberpfg:PolicyholderAccountBalanceGuaranteedMinimumCreditingRateRangeUpTo0100Memberpfg:SegmentRetirementAndIncomeSolutionsMember2023-12-310001126328pfg:WorkplaceSavingsAndRetirementSolutionsMemberpfg:PolicyholderAccountBalanceGuaranteedMinimumCreditingRateRangeFrom0401AndGreaterMemberpfg:SegmentRetirementAndIncomeSolutionsMember2023-12-310001126328pfg:WorkplaceSavingsAndRetirementSolutionsMemberpfg:PolicyholderAccountBalanceGuaranteedMinimumCreditingRateRangeFrom0301To0400Memberpfg:SegmentRetirementAndIncomeSolutionsMember2023-12-310001126328pfg:WorkplaceSavingsAndRetirementSolutionsMemberpfg:PolicyholderAccountBalanceGuaranteedMinimumCreditingRateRangeFrom0201To0300Memberpfg:SegmentRetirementAndIncomeSolutionsMember2023-12-310001126328pfg:WorkplaceSavingsAndRetirementSolutionsMemberpfg:PolicyholderAccountBalanceGuaranteedMinimumCreditingRateRangeFrom0101To0200Memberpfg:SegmentRetirementAndIncomeSolutionsMember2023-12-310001126328pfg:WorkplaceSavingsAndRetirementSolutionsMemberpfg:PolicyholderAccountBalanceAboveGuaranteedMinimumCreditingRateRangeFrom0201AndGreaterMemberpfg:SegmentRetirementAndIncomeSolutionsMember2023-12-310001126328pfg:WorkplaceSavingsAndRetirementSolutionsMemberpfg:PolicyholderAccountBalanceAboveGuaranteedMinimumCreditingRateRangeFrom0101To0200Memberpfg:SegmentRetirementAndIncomeSolutionsMember2023-12-310001126328pfg:WorkplaceSavingsAndRetirementSolutionsMemberpfg:PolicyholderAccountBalanceAboveGuaranteedMinimumCreditingRateRangeFrom0051To0100Memberpfg:SegmentRetirementAndIncomeSolutionsMember2023-12-310001126328us-gaap:VariableAnnuityMemberpfg:SegmentRetirementAndIncomeSolutionsMember2023-12-310001126328us-gaap:DeferredFixedAnnuityMemberpfg:SegmentRetirementAndIncomeSolutionsMember2023-12-310001126328pfg:WorkplaceSavingsAndRetirementSolutionsMemberpfg:SegmentRetirementAndIncomeSolutionsMember2023-12-310001126328us-gaap:UniversalLifeMemberus-gaap:PolicyholderAccountBalanceAtGuaranteedMinimumCreditingRateMemberpfg:PolicyholderAccountBalanceGuaranteedMinimumCreditingRateRangeFrom0401AndGreaterMemberpfg:SegmentBenefitsAndProtectionMemberpfg:SubsegmentLifeInsuranceMember2022-12-310001126328us-gaap:UniversalLifeMemberus-gaap:PolicyholderAccountBalanceAtGuaranteedMinimumCreditingRateMemberpfg:PolicyholderAccountBalanceGuaranteedMinimumCreditingRateRangeFrom0301To0400Memberpfg:SegmentBenefitsAndProtectionMemberpfg:SubsegmentLifeInsuranceMember2022-12-310001126328us-gaap:UniversalLifeMemberus-gaap:PolicyholderAccountBalanceAtGuaranteedMinimumCreditingRateMemberpfg:PolicyholderAccountBalanceGuaranteedMinimumCreditingRateRangeFrom0201To0300Memberpfg:SegmentBenefitsAndProtectionMemberpfg:SubsegmentLifeInsuranceMember2022-12-310001126328us-gaap:UniversalLifeMemberus-gaap:PolicyholderAccountBalanceAtGuaranteedMinimumCreditingRateMemberpfg:PolicyholderAccountBalanceGuaranteedMinimumCreditingRateRangeFrom0101To0200Memberpfg:SegmentBenefitsAndProtectionMemberpfg:SubsegmentLifeInsuranceMember2022-12-310001126328us-gaap:UniversalLifeMemberus-gaap:PolicyholderAccountBalanceAboveGuaranteedMinimumCreditingRateRangeFrom0001To0050Memberpfg:PolicyholderAccountBalanceGuaranteedMinimumCreditingRateRangeUpTo0100Memberpfg:SegmentBenefitsAndProtectionMemberpfg:SubsegmentLifeInsuranceMember2022-12-310001126328us-gaap:UniversalLifeMemberus-gaap:PolicyholderAccountBalanceAboveGuaranteedMinimumCreditingRateRangeFrom0001To0050Memberpfg:PolicyholderAccountBalanceGuaranteedMinimumCreditingRateRangeFrom0401AndGreaterMemberpfg:SegmentBenefitsAndProtectionMemberpfg:SubsegmentLifeInsuranceMember2022-12-310001126328us-gaap:UniversalLifeMemberus-gaap:PolicyholderAccountBalanceAboveGuaranteedMinimumCreditingRateRangeFrom0001To0050Memberpfg:PolicyholderAccountBalanceGuaranteedMinimumCreditingRateRangeFrom0301To0400Memberpfg:SegmentBenefitsAndProtectionMemberpfg:SubsegmentLifeInsuranceMember2022-12-310001126328us-gaap:UniversalLifeMemberus-gaap:PolicyholderAccountBalanceAboveGuaranteedMinimumCreditingRateRangeFrom0001To0050Memberpfg:PolicyholderAccountBalanceGuaranteedMinimumCreditingRateRangeFrom0201To0300Memberpfg:SegmentBenefitsAndProtectionMemberpfg:SubsegmentLifeInsuranceMember2022-12-310001126328us-gaap:UniversalLifeMemberpfg:PolicyholderAccountBalanceAboveGuaranteedMinimumCreditingRateRangeFrom0201AndGreaterMemberpfg:PolicyholderAccountBalanceGuaranteedMinimumCreditingRateRangeUpTo0100Memberpfg:SegmentBenefitsAndProtectionMemberpfg:SubsegmentLifeInsuranceMember2022-12-310001126328us-gaap:UniversalLifeMemberpfg:PolicyholderAccountBalanceAboveGuaranteedMinimumCreditingRateRangeFrom0201AndGreaterMemberpfg:PolicyholderAccountBalanceGuaranteedMinimumCreditingRateRangeFrom0301To0400Memberpfg:SegmentBenefitsAndProtectionMemberpfg:SubsegmentLifeInsuranceMember2022-12-310001126328us-gaap:UniversalLifeMemberpfg:PolicyholderAccountBalanceAboveGuaranteedMinimumCreditingRateRangeFrom0201AndGreaterMemberpfg:PolicyholderAccountBalanceGuaranteedMinimumCreditingRateRangeFrom0201To0300Memberpfg:SegmentBenefitsAndProtectionMemberpfg:SubsegmentLifeInsuranceMember2022-12-310001126328us-gaap:UniversalLifeMemberpfg:PolicyholderAccountBalanceAboveGuaranteedMinimumCreditingRateRangeFrom0201AndGreaterMemberpfg:PolicyholderAccountBalanceGuaranteedMinimumCreditingRateRangeFrom0101To0200Memberpfg:SegmentBenefitsAndProtectionMemberpfg:SubsegmentLifeInsuranceMember2022-12-310001126328us-gaap:UniversalLifeMemberpfg:PolicyholderAccountBalanceAboveGuaranteedMinimumCreditingRateRangeFrom0101To0200Memberpfg:PolicyholderAccountBalanceGuaranteedMinimumCreditingRateRangeFrom0401AndGreaterMemberpfg:SegmentBenefitsAndProtectionMemberpfg:SubsegmentLifeInsuranceMember2022-12-310001126328us-gaap:UniversalLifeMemberpfg:PolicyholderAccountBalanceAboveGuaranteedMinimumCreditingRateRangeFrom0101To0200Memberpfg:PolicyholderAccountBalanceGuaranteedMinimumCreditingRateRangeFrom0301To0400Memberpfg:SegmentBenefitsAndProtectionMemberpfg:SubsegmentLifeInsuranceMember2022-12-310001126328us-gaap:UniversalLifeMemberpfg:PolicyholderAccountBalanceAboveGuaranteedMinimumCreditingRateRangeFrom0101To0200Memberpfg:PolicyholderAccountBalanceGuaranteedMinimumCreditingRateRangeFrom0201To0300Memberpfg:SegmentBenefitsAndProtectionMemberpfg:SubsegmentLifeInsuranceMember2022-12-310001126328us-gaap:UniversalLifeMemberpfg:PolicyholderAccountBalanceAboveGuaranteedMinimumCreditingRateRangeFrom0101To0200Memberpfg:PolicyholderAccountBalanceGuaranteedMinimumCreditingRateRangeFrom0101To0200Memberpfg:SegmentBenefitsAndProtectionMemberpfg:SubsegmentLifeInsuranceMember2022-12-310001126328us-gaap:UniversalLifeMemberpfg:PolicyholderAccountBalanceAboveGuaranteedMinimumCreditingRateRangeFrom0051To0100Memberpfg:PolicyholderAccountBalanceGuaranteedMinimumCreditingRateRangeUpTo0100Memberpfg:SegmentBenefitsAndProtectionMemberpfg:SubsegmentLifeInsuranceMember2022-12-310001126328us-gaap:UniversalLifeMemberpfg:PolicyholderAccountBalanceAboveGuaranteedMinimumCreditingRateRangeFrom0051To0100Memberpfg:PolicyholderAccountBalanceGuaranteedMinimumCreditingRateRangeFrom0401AndGreaterMemberpfg:SegmentBenefitsAndProtectionMemberpfg:SubsegmentLifeInsuranceMember2022-12-310001126328us-gaap:UniversalLifeMemberpfg:PolicyholderAccountBalanceAboveGuaranteedMinimumCreditingRateRangeFrom0051To0100Memberpfg:PolicyholderAccountBalanceGuaranteedMinimumCreditingRateRangeFrom0301To0400Memberpfg:SegmentBenefitsAndProtectionMemberpfg:SubsegmentLifeInsuranceMember2022-12-310001126328us-gaap:UniversalLifeMemberpfg:PolicyholderAccountBalanceAboveGuaranteedMinimumCreditingRateRangeFrom0051To0100Memberpfg:PolicyholderAccountBalanceGuaranteedMinimumCreditingRateRangeFrom0201To0300Memberpfg:SegmentBenefitsAndProtectionMemberpfg:SubsegmentLifeInsuranceMember2022-12-310001126328us-gaap:UniversalLifeMemberpfg:PolicyholderAccountBalanceAboveGuaranteedMinimumCreditingRateRangeFrom0051To0100Memberpfg:PolicyholderAccountBalanceGuaranteedMinimumCreditingRateRangeFrom0101To0200Memberpfg:SegmentBenefitsAndProtectionMemberpfg:SubsegmentLifeInsuranceMember2022-12-310001126328us-gaap:VariableAnnuityMemberus-gaap:PolicyholderAccountBalanceAtGuaranteedMinimumCreditingRateMemberpfg:PolicyholderAccountBalanceGuaranteedMinimumCreditingRateRangeUpTo0100Memberpfg:SegmentRetirementAndIncomeSolutionsMember2022-12-310001126328us-gaap:VariableAnnuityMemberus-gaap:PolicyholderAccountBalanceAtGuaranteedMinimumCreditingRateMemberpfg:PolicyholderAccountBalanceGuaranteedMinimumCreditingRateRangeFrom0201To0300Memberpfg:SegmentRetirementAndIncomeSolutionsMember2022-12-310001126328us-gaap:VariableAnnuityMemberus-gaap:PolicyholderAccountBalanceAtGuaranteedMinimumCreditingRateMemberpfg:PolicyholderAccountBalanceGuaranteedMinimumCreditingRateRangeFrom0101To0200Memberpfg:SegmentRetirementAndIncomeSolutionsMember2022-12-310001126328us-gaap:UniversalLifeMemberus-gaap:PolicyholderAccountBalanceAtGuaranteedMinimumCreditingRateMemberpfg:SegmentBenefitsAndProtectionMemberpfg:SubsegmentLifeInsuranceMember2022-12-310001126328us-gaap:UniversalLifeMemberus-gaap:PolicyholderAccountBalanceAboveGuaranteedMinimumCreditingRateRangeFrom0001To0050Memberpfg:SegmentBenefitsAndProtectionMemberpfg:SubsegmentLifeInsuranceMember2022-12-310001126328us-gaap:UniversalLifeMemberpfg:PolicyholderAccountBalanceGuaranteedMinimumCreditingRateRangeUpTo0100Memberpfg:SegmentBenefitsAndProtectionMemberpfg:SubsegmentLifeInsuranceMember2022-12-310001126328us-gaap:UniversalLifeMemberpfg:PolicyholderAccountBalanceGuaranteedMinimumCreditingRateRangeFrom0401AndGreaterMemberpfg:SegmentBenefitsAndProtectionMemberpfg:SubsegmentLifeInsuranceMember2022-12-310001126328us-gaap:UniversalLifeMemberpfg:PolicyholderAccountBalanceGuaranteedMinimumCreditingRateRangeFrom0301To0400Memberpfg:SegmentBenefitsAndProtectionMemberpfg:SubsegmentLifeInsuranceMember2022-12-310001126328us-gaap:UniversalLifeMemberpfg:PolicyholderAccountBalanceGuaranteedMinimumCreditingRateRangeFrom0201To0300Memberpfg:SegmentBenefitsAndProtectionMemberpfg:SubsegmentLifeInsuranceMember2022-12-310001126328us-gaap:UniversalLifeMemberpfg:PolicyholderAccountBalanceGuaranteedMinimumCreditingRateRangeFrom0101To0200Memberpfg:SegmentBenefitsAndProtectionMemberpfg:SubsegmentLifeInsuranceMember2022-12-310001126328us-gaap:UniversalLifeMemberpfg:PolicyholderAccountBalanceAboveGuaranteedMinimumCreditingRateRangeFrom0201AndGreaterMemberpfg:SegmentBenefitsAndProtectionMemberpfg:SubsegmentLifeInsuranceMember2022-12-310001126328us-gaap:UniversalLifeMemberpfg:PolicyholderAccountBalanceAboveGuaranteedMinimumCreditingRateRangeFrom0101To0200Memberpfg:SegmentBenefitsAndProtectionMemberpfg:SubsegmentLifeInsuranceMember2022-12-310001126328us-gaap:UniversalLifeMemberpfg:PolicyholderAccountBalanceAboveGuaranteedMinimumCreditingRateRangeFrom0051To0100Memberpfg:SegmentBenefitsAndProtectionMemberpfg:SubsegmentLifeInsuranceMember2022-12-310001126328us-gaap:DeferredFixedAnnuityMemberus-gaap:PolicyholderAccountBalanceAtGuaranteedMinimumCreditingRateMemberpfg:PolicyholderAccountBalanceGuaranteedMinimumCreditingRateRangeUpTo0100Memberpfg:SegmentRetirementAndIncomeSolutionsMember2022-12-310001126328us-gaap:DeferredFixedAnnuityMemberus-gaap:PolicyholderAccountBalanceAtGuaranteedMinimumCreditingRateMemberpfg:PolicyholderAccountBalanceGuaranteedMinimumCreditingRateRangeFrom0301To0400Memberpfg:SegmentRetirementAndIncomeSolutionsMember2022-12-310001126328us-gaap:DeferredFixedAnnuityMemberus-gaap:PolicyholderAccountBalanceAtGuaranteedMinimumCreditingRateMemberpfg:PolicyholderAccountBalanceGuaranteedMinimumCreditingRateRangeFrom0201To0300Memberpfg:SegmentRetirementAndIncomeSolutionsMember2022-12-310001126328us-gaap:DeferredFixedAnnuityMemberus-gaap:PolicyholderAccountBalanceAtGuaranteedMinimumCreditingRateMemberpfg:PolicyholderAccountBalanceGuaranteedMinimumCreditingRateRangeFrom0101To0200Memberpfg:SegmentRetirementAndIncomeSolutionsMember2022-12-310001126328us-gaap:DeferredFixedAnnuityMemberus-gaap:PolicyholderAccountBalanceAboveGuaranteedMinimumCreditingRateRangeFrom0001To0050Memberpfg:PolicyholderAccountBalanceGuaranteedMinimumCreditingRateRangeUpTo0100Memberpfg:SegmentRetirementAndIncomeSolutionsMember2022-12-310001126328us-gaap:DeferredFixedAnnuityMemberus-gaap:PolicyholderAccountBalanceAboveGuaranteedMinimumCreditingRateRangeFrom0001To0050Memberpfg:PolicyholderAccountBalanceGuaranteedMinimumCreditingRateRangeFrom0101To0200Memberpfg:SegmentRetirementAndIncomeSolutionsMember2022-12-310001126328us-gaap:DeferredFixedAnnuityMemberpfg:PolicyholderAccountBalanceAboveGuaranteedMinimumCreditingRateRangeFrom0201AndGreaterMemberpfg:PolicyholderAccountBalanceGuaranteedMinimumCreditingRateRangeUpTo0100Memberpfg:SegmentRetirementAndIncomeSolutionsMember2022-12-310001126328us-gaap:DeferredFixedAnnuityMemberpfg:PolicyholderAccountBalanceAboveGuaranteedMinimumCreditingRateRangeFrom0201AndGreaterMemberpfg:PolicyholderAccountBalanceGuaranteedMinimumCreditingRateRangeFrom0101To0200Memberpfg:SegmentRetirementAndIncomeSolutionsMember2022-12-310001126328us-gaap:DeferredFixedAnnuityMemberpfg:PolicyholderAccountBalanceAboveGuaranteedMinimumCreditingRateRangeFrom0101To0200Memberpfg:PolicyholderAccountBalanceGuaranteedMinimumCreditingRateRangeUpTo0100Memberpfg:SegmentRetirementAndIncomeSolutionsMember2022-12-310001126328us-gaap:DeferredFixedAnnuityMemberpfg:PolicyholderAccountBalanceAboveGuaranteedMinimumCreditingRateRangeFrom0101To0200Memberpfg:PolicyholderAccountBalanceGuaranteedMinimumCreditingRateRangeFrom0101To0200Memberpfg:SegmentRetirementAndIncomeSolutionsMember2022-12-310001126328us-gaap:DeferredFixedAnnuityMemberpfg:PolicyholderAccountBalanceAboveGuaranteedMinimumCreditingRateRangeFrom0051To0100Memberpfg:PolicyholderAccountBalanceGuaranteedMinimumCreditingRateRangeUpTo0100Memberpfg:SegmentRetirementAndIncomeSolutionsMember2022-12-310001126328us-gaap:DeferredFixedAnnuityMemberpfg:PolicyholderAccountBalanceAboveGuaranteedMinimumCreditingRateRangeFrom0051To0100Memberpfg:PolicyholderAccountBalanceGuaranteedMinimumCreditingRateRangeFrom0101To0200Memberpfg:SegmentRetirementAndIncomeSolutionsMember2022-12-310001126328pfg:WorkplaceSavingsAndRetirementSolutionsMemberus-gaap:PolicyholderAccountBalanceAtGuaranteedMinimumCreditingRateMemberpfg:PolicyholderAccountBalanceGuaranteedMinimumCreditingRateRangeUpTo0100Memberpfg:SegmentRetirementAndIncomeSolutionsMember2022-12-310001126328pfg:WorkplaceSavingsAndRetirementSolutionsMemberus-gaap:PolicyholderAccountBalanceAtGuaranteedMinimumCreditingRateMemberpfg:PolicyholderAccountBalanceGuaranteedMinimumCreditingRateRangeFrom0401AndGreaterMemberpfg:SegmentRetirementAndIncomeSolutionsMember2022-12-310001126328pfg:WorkplaceSavingsAndRetirementSolutionsMemberus-gaap:PolicyholderAccountBalanceAtGuaranteedMinimumCreditingRateMemberpfg:PolicyholderAccountBalanceGuaranteedMinimumCreditingRateRangeFrom0301To0400Memberpfg:SegmentRetirementAndIncomeSolutionsMember2022-12-310001126328pfg:WorkplaceSavingsAndRetirementSolutionsMemberus-gaap:PolicyholderAccountBalanceAtGuaranteedMinimumCreditingRateMemberpfg:PolicyholderAccountBalanceGuaranteedMinimumCreditingRateRangeFrom0201To0300Memberpfg:SegmentRetirementAndIncomeSolutionsMember2022-12-310001126328pfg:WorkplaceSavingsAndRetirementSolutionsMemberus-gaap:PolicyholderAccountBalanceAboveGuaranteedMinimumCreditingRateRangeFrom0001To0050Memberpfg:PolicyholderAccountBalanceGuaranteedMinimumCreditingRateRangeUpTo0100Memberpfg:SegmentRetirementAndIncomeSolutionsMember2022-12-310001126328pfg:WorkplaceSavingsAndRetirementSolutionsMemberus-gaap:PolicyholderAccountBalanceAboveGuaranteedMinimumCreditingRateRangeFrom0001To0050Memberpfg:PolicyholderAccountBalanceGuaranteedMinimumCreditingRateRangeFrom0201To0300Memberpfg:SegmentRetirementAndIncomeSolutionsMember2022-12-310001126328pfg:WorkplaceSavingsAndRetirementSolutionsMemberus-gaap:PolicyholderAccountBalanceAboveGuaranteedMinimumCreditingRateRangeFrom0001To0050Memberpfg:PolicyholderAccountBalanceGuaranteedMinimumCreditingRateRangeFrom0101To0200Memberpfg:SegmentRetirementAndIncomeSolutionsMember2022-12-310001126328pfg:WorkplaceSavingsAndRetirementSolutionsMemberpfg:PolicyholderAccountBalanceAboveGuaranteedMinimumCreditingRateRangeFrom0201AndGreaterMemberpfg:PolicyholderAccountBalanceGuaranteedMinimumCreditingRateRangeUpTo0100Memberpfg:SegmentRetirementAndIncomeSolutionsMember2022-12-310001126328pfg:WorkplaceSavingsAndRetirementSolutionsMemberpfg:PolicyholderAccountBalanceAboveGuaranteedMinimumCreditingRateRangeFrom0201AndGreaterMemberpfg:PolicyholderAccountBalanceGuaranteedMinimumCreditingRateRangeFrom0101To0200Memberpfg:SegmentRetirementAndIncomeSolutionsMember2022-12-310001126328pfg:WorkplaceSavingsAndRetirementSolutionsMemberpfg:PolicyholderAccountBalanceAboveGuaranteedMinimumCreditingRateRangeFrom0101To0200Memberpfg:PolicyholderAccountBalanceGuaranteedMinimumCreditingRateRangeUpTo0100Memberpfg:SegmentRetirementAndIncomeSolutionsMember2022-12-310001126328pfg:WorkplaceSavingsAndRetirementSolutionsMemberpfg:PolicyholderAccountBalanceAboveGuaranteedMinimumCreditingRateRangeFrom0101To0200Memberpfg:PolicyholderAccountBalanceGuaranteedMinimumCreditingRateRangeFrom0201To0300Memberpfg:SegmentRetirementAndIncomeSolutionsMember2022-12-310001126328pfg:WorkplaceSavingsAndRetirementSolutionsMemberpfg:PolicyholderAccountBalanceAboveGuaranteedMinimumCreditingRateRangeFrom0101To0200Memberpfg:PolicyholderAccountBalanceGuaranteedMinimumCreditingRateRangeFrom0101To0200Memberpfg:SegmentRetirementAndIncomeSolutionsMember2022-12-310001126328pfg:WorkplaceSavingsAndRetirementSolutionsMemberpfg:PolicyholderAccountBalanceAboveGuaranteedMinimumCreditingRateRangeFrom0051To0100Memberpfg:PolicyholderAccountBalanceGuaranteedMinimumCreditingRateRangeUpTo0100Memberpfg:SegmentRetirementAndIncomeSolutionsMember2022-12-310001126328pfg:WorkplaceSavingsAndRetirementSolutionsMemberpfg:PolicyholderAccountBalanceAboveGuaranteedMinimumCreditingRateRangeFrom0051To0100Memberpfg:PolicyholderAccountBalanceGuaranteedMinimumCreditingRateRangeFrom0101To0200Memberpfg:SegmentRetirementAndIncomeSolutionsMember2022-12-310001126328us-gaap:VariableAnnuityMemberus-gaap:PolicyholderAccountBalanceAtGuaranteedMinimumCreditingRateMemberpfg:SegmentRetirementAndIncomeSolutionsMember2022-12-310001126328us-gaap:VariableAnnuityMemberpfg:PolicyholderAccountBalanceGuaranteedMinimumCreditingRateRangeUpTo0100Memberpfg:SegmentRetirementAndIncomeSolutionsMember2022-12-310001126328us-gaap:VariableAnnuityMemberpfg:PolicyholderAccountBalanceGuaranteedMinimumCreditingRateRangeFrom0201To0300Memberpfg:SegmentRetirementAndIncomeSolutionsMember2022-12-310001126328us-gaap:VariableAnnuityMemberpfg:PolicyholderAccountBalanceGuaranteedMinimumCreditingRateRangeFrom0101To0200Memberpfg:SegmentRetirementAndIncomeSolutionsMember2022-12-310001126328us-gaap:DeferredFixedAnnuityMemberus-gaap:PolicyholderAccountBalanceAtGuaranteedMinimumCreditingRateMemberpfg:SegmentRetirementAndIncomeSolutionsMember2022-12-310001126328us-gaap:DeferredFixedAnnuityMemberus-gaap:PolicyholderAccountBalanceAboveGuaranteedMinimumCreditingRateRangeFrom0001To0050Memberpfg:SegmentRetirementAndIncomeSolutionsMember2022-12-310001126328us-gaap:DeferredFixedAnnuityMemberpfg:PolicyholderAccountBalanceGuaranteedMinimumCreditingRateRangeUpTo0100Memberpfg:SegmentRetirementAndIncomeSolutionsMember2022-12-310001126328us-gaap:DeferredFixedAnnuityMemberpfg:PolicyholderAccountBalanceGuaranteedMinimumCreditingRateRangeFrom0301To0400Memberpfg:SegmentRetirementAndIncomeSolutionsMember2022-12-310001126328us-gaap:DeferredFixedAnnuityMemberpfg:PolicyholderAccountBalanceGuaranteedMinimumCreditingRateRangeFrom0201To0300Memberpfg:SegmentRetirementAndIncomeSolutionsMember2022-12-310001126328us-gaap:DeferredFixedAnnuityMemberpfg:PolicyholderAccountBalanceGuaranteedMinimumCreditingRateRangeFrom0101To0200Memberpfg:SegmentRetirementAndIncomeSolutionsMember2022-12-310001126328us-gaap:DeferredFixedAnnuityMemberpfg:PolicyholderAccountBalanceAboveGuaranteedMinimumCreditingRateRangeFrom0201AndGreaterMemberpfg:SegmentRetirementAndIncomeSolutionsMember2022-12-310001126328us-gaap:DeferredFixedAnnuityMemberpfg:PolicyholderAccountBalanceAboveGuaranteedMinimumCreditingRateRangeFrom0101To0200Memberpfg:SegmentRetirementAndIncomeSolutionsMember2022-12-310001126328us-gaap:DeferredFixedAnnuityMemberpfg:PolicyholderAccountBalanceAboveGuaranteedMinimumCreditingRateRangeFrom0051To0100Memberpfg:SegmentRetirementAndIncomeSolutionsMember2022-12-310001126328pfg:WorkplaceSavingsAndRetirementSolutionsMemberus-gaap:PolicyholderAccountBalanceAtGuaranteedMinimumCreditingRateMemberpfg:SegmentRetirementAndIncomeSolutionsMember2022-12-310001126328pfg:WorkplaceSavingsAndRetirementSolutionsMemberus-gaap:PolicyholderAccountBalanceAboveGuaranteedMinimumCreditingRateRangeFrom0001To0050Memberpfg:SegmentRetirementAndIncomeSolutionsMember2022-12-310001126328pfg:WorkplaceSavingsAndRetirementSolutionsMemberpfg:PolicyholderAccountBalanceGuaranteedMinimumCreditingRateRangeUpTo0100Memberpfg:SegmentRetirementAndIncomeSolutionsMember2022-12-310001126328pfg:WorkplaceSavingsAndRetirementSolutionsMemberpfg:PolicyholderAccountBalanceGuaranteedMinimumCreditingRateRangeFrom0401AndGreaterMemberpfg:SegmentRetirementAndIncomeSolutionsMember2022-12-310001126328pfg:WorkplaceSavingsAndRetirementSolutionsMemberpfg:PolicyholderAccountBalanceGuaranteedMinimumCreditingRateRangeFrom0301To0400Memberpfg:SegmentRetirementAndIncomeSolutionsMember2022-12-310001126328pfg:WorkplaceSavingsAndRetirementSolutionsMemberpfg:PolicyholderAccountBalanceGuaranteedMinimumCreditingRateRangeFrom0201To0300Memberpfg:SegmentRetirementAndIncomeSolutionsMember2022-12-310001126328pfg:WorkplaceSavingsAndRetirementSolutionsMemberpfg:PolicyholderAccountBalanceGuaranteedMinimumCreditingRateRangeFrom0101To0200Memberpfg:SegmentRetirementAndIncomeSolutionsMember2022-12-310001126328pfg:WorkplaceSavingsAndRetirementSolutionsMemberpfg:PolicyholderAccountBalanceAboveGuaranteedMinimumCreditingRateRangeFrom0201AndGreaterMemberpfg:SegmentRetirementAndIncomeSolutionsMember2022-12-310001126328pfg:WorkplaceSavingsAndRetirementSolutionsMemberpfg:PolicyholderAccountBalanceAboveGuaranteedMinimumCreditingRateRangeFrom0101To0200Memberpfg:SegmentRetirementAndIncomeSolutionsMember2022-12-310001126328pfg:WorkplaceSavingsAndRetirementSolutionsMemberpfg:PolicyholderAccountBalanceAboveGuaranteedMinimumCreditingRateRangeFrom0051To0100Memberpfg:SegmentRetirementAndIncomeSolutionsMember2022-12-310001126328us-gaap:VariableAnnuityMemberpfg:SegmentRetirementAndIncomeSolutionsMember2022-12-310001126328us-gaap:DeferredFixedAnnuityMemberpfg:SegmentRetirementAndIncomeSolutionsMember2022-12-310001126328pfg:WorkplaceSavingsAndRetirementSolutionsMemberpfg:SegmentRetirementAndIncomeSolutionsMember2022-12-310001126328us-gaap:InterestRateContractMemberus-gaap:CashFlowHedgingMemberus-gaap:ReclassificationOutOfAccumulatedOtherComprehensiveIncomeMember2023-01-012023-12-310001126328us-gaap:InterestRateContractMemberus-gaap:CashFlowHedgingMemberus-gaap:ReclassificationOutOfAccumulatedOtherComprehensiveIncomeMember2022-01-012022-12-310001126328us-gaap:InterestRateContractMemberus-gaap:CashFlowHedgingMemberus-gaap:ReclassificationOutOfAccumulatedOtherComprehensiveIncomeMember2021-01-012021-12-310001126328us-gaap:DeferredFixedAnnuityMemberpfg:SegmentRetirementAndIncomeSolutionsMember2023-01-012023-12-310001126328pfg:WorkplaceSavingsAndRetirementSolutionsMemberpfg:SegmentRetirementAndIncomeSolutionsMember2023-01-012023-12-310001126328us-gaap:DeferredFixedAnnuityMemberpfg:SegmentRetirementAndIncomeSolutionsMember2022-01-012022-12-310001126328pfg:WorkplaceSavingsAndRetirementSolutionsMemberpfg:SegmentRetirementAndIncomeSolutionsMember2022-01-012022-12-310001126328us-gaap:InterestRateContractMemberus-gaap:FairValueHedgingMemberpfg:NetInvestmentIncomeLossMember2023-01-012023-12-310001126328us-gaap:InterestRateContractMemberus-gaap:FairValueHedgingMemberpfg:BenefitsClaimsAndSettlementExpensesMember2023-01-012023-12-310001126328us-gaap:InterestRateContractMemberus-gaap:CashFlowHedgingMemberpfg:BenefitsClaimsAndSettlementExpensesMember2023-01-012023-12-310001126328us-gaap:ForeignExchangeContractMemberus-gaap:FairValueHedgingMemberpfg:NetInvestmentIncomeLossMember2023-01-012023-12-310001126328us-gaap:ForeignExchangeContractMemberus-gaap:CashFlowHedgingMemberpfg:NetInvestmentIncomeLossMember2023-01-012023-12-310001126328us-gaap:InterestRateContractMemberus-gaap:FairValueHedgingMemberpfg:NetInvestmentIncomeLossMember2022-01-012022-12-310001126328us-gaap:InterestRateContractMemberus-gaap:CashFlowHedgingMemberpfg:BenefitsClaimsAndSettlementExpensesMember2022-01-012022-12-310001126328us-gaap:ForeignExchangeContractMemberus-gaap:CashFlowHedgingMemberpfg:NetInvestmentIncomeLossMember2022-01-012022-12-310001126328us-gaap:InterestRateContractMemberus-gaap:FairValueHedgingMemberpfg:NetInvestmentIncomeLossMember2021-01-012021-12-310001126328us-gaap:InterestRateContractMemberus-gaap:CashFlowHedgingMemberpfg:BenefitsClaimsAndSettlementExpensesMember2021-01-012021-12-310001126328us-gaap:ForeignExchangeContractMemberus-gaap:CashFlowHedgingMemberpfg:NetInvestmentIncomeLossMember2021-01-012021-12-310001126328pfg:Delaware2028TrustMemberpfg:ContingentFundingAgreement10YearMember2018-03-082018-03-080001126328srt:RetailSiteMemberus-gaap:CommercialRealEstatePortfolioSegmentMember2023-12-310001126328srt:OtherPropertyMemberus-gaap:CommercialRealEstatePortfolioSegmentMember2023-12-310001126328srt:OfficeBuildingMemberus-gaap:CommercialRealEstatePortfolioSegmentMember2023-12-310001126328srt:IndustrialPropertyMemberus-gaap:CommercialRealEstatePortfolioSegmentMember2023-12-310001126328srt:HotelMemberus-gaap:CommercialRealEstatePortfolioSegmentMember2023-12-310001126328srt:ApartmentBuildingMemberus-gaap:CommercialRealEstatePortfolioSegmentMember2023-12-310001126328pfg:WestSouthCentralMemberus-gaap:CommercialRealEstatePortfolioSegmentMember2023-12-310001126328pfg:WestNorthCentralMemberus-gaap:CommercialRealEstatePortfolioSegmentMember2023-12-310001126328pfg:SouthAtlanticMemberus-gaap:CommercialRealEstatePortfolioSegmentMember2023-12-310001126328pfg:PacificMemberus-gaap:CommercialRealEstatePortfolioSegmentMember2023-12-310001126328pfg:NewEnglandMemberus-gaap:CommercialRealEstatePortfolioSegmentMember2023-12-310001126328pfg:MountainMemberus-gaap:CommercialRealEstatePortfolioSegmentMember2023-12-310001126328pfg:MiddleAtlanticMemberus-gaap:CommercialRealEstatePortfolioSegmentMember2023-12-310001126328pfg:InternationalMemberus-gaap:CommercialRealEstatePortfolioSegmentMember2023-12-310001126328pfg:EastSouthCentralMemberus-gaap:CommercialRealEstatePortfolioSegmentMember2023-12-310001126328pfg:EastNorthCentralMemberus-gaap:CommercialRealEstatePortfolioSegmentMember2023-12-310001126328srt:RetailSiteMemberus-gaap:CommercialRealEstatePortfolioSegmentMember2022-12-310001126328srt:OtherPropertyMemberus-gaap:CommercialRealEstatePortfolioSegmentMember2022-12-310001126328srt:OfficeBuildingMemberus-gaap:CommercialRealEstatePortfolioSegmentMember2022-12-310001126328srt:IndustrialPropertyMemberus-gaap:CommercialRealEstatePortfolioSegmentMember2022-12-310001126328srt:HotelMemberus-gaap:CommercialRealEstatePortfolioSegmentMember2022-12-310001126328srt:ApartmentBuildingMemberus-gaap:CommercialRealEstatePortfolioSegmentMember2022-12-310001126328pfg:WestSouthCentralMemberus-gaap:CommercialRealEstatePortfolioSegmentMember2022-12-310001126328pfg:WestNorthCentralMemberus-gaap:CommercialRealEstatePortfolioSegmentMember2022-12-310001126328pfg:SouthAtlanticMemberus-gaap:CommercialRealEstatePortfolioSegmentMember2022-12-310001126328pfg:PacificMemberus-gaap:CommercialRealEstatePortfolioSegmentMember2022-12-310001126328pfg:NewEnglandMemberus-gaap:CommercialRealEstatePortfolioSegmentMember2022-12-310001126328pfg:MountainMemberus-gaap:CommercialRealEstatePortfolioSegmentMember2022-12-310001126328pfg:MiddleAtlanticMemberus-gaap:CommercialRealEstatePortfolioSegmentMember2022-12-310001126328pfg:InternationalMemberus-gaap:CommercialRealEstatePortfolioSegmentMember2022-12-310001126328pfg:EastSouthCentralMemberus-gaap:CommercialRealEstatePortfolioSegmentMember2022-12-310001126328pfg:EastNorthCentralMemberus-gaap:CommercialRealEstatePortfolioSegmentMember2022-12-310001126328pfg:Delaware2048TrustMemberpfg:ContingentFundingAgreement30YearMember2018-03-082018-03-080001126328pfg:SubsegmentIndividualLifeInsuranceMember2023-12-310001126328pfg:SubsegmentIndividualLifeInsuranceMember2022-12-310001126328pfg:SubsegmentIndividualLifeInsuranceMember2021-12-310001126328srt:WeightedAverageMemberpfg:InvestmentsOtherMemberus-gaap:FairValueInputsLevel3Memberus-gaap:FairValueMeasurementsRecurringMemberus-gaap:MeasurementInputLossSeverityMemberus-gaap:ValuationTechniqueDiscountedCashFlowMember2023-12-310001126328srt:WeightedAverageMemberpfg:InvestmentsOtherMemberus-gaap:FairValueInputsLevel3Memberus-gaap:FairValueMeasurementsRecurringMemberus-gaap:MeasurementInputDiscountRateMemberus-gaap:ValuationTechniqueDiscountedCashFlowMember2023-12-310001126328srt:WeightedAverageMemberpfg:InvestmentsOtherMemberus-gaap:FairValueInputsLevel3Memberus-gaap:FairValueMeasurementsRecurringMemberus-gaap:MeasurementInputDefaultRateMemberus-gaap:ValuationTechniqueDiscountedCashFlowMember2023-12-310001126328srt:MinimumMemberpfg:InvestmentsOtherMemberus-gaap:FairValueInputsLevel3Memberus-gaap:FairValueMeasurementsRecurringMemberus-gaap:MeasurementInputLossSeverityMemberus-gaap:ValuationTechniqueDiscountedCashFlowMember2023-12-310001126328srt:MinimumMemberpfg:InvestmentsOtherMemberus-gaap:FairValueInputsLevel3Memberus-gaap:FairValueMeasurementsRecurringMemberus-gaap:MeasurementInputDiscountRateMemberus-gaap:ValuationTechniqueDiscountedCashFlowMember2023-12-310001126328srt:MinimumMemberpfg:InvestmentsOtherMemberus-gaap:FairValueInputsLevel3Memberus-gaap:FairValueMeasurementsRecurringMemberus-gaap:MeasurementInputDefaultRateMemberus-gaap:ValuationTechniqueDiscountedCashFlowMember2023-12-310001126328srt:MaximumMemberpfg:InvestmentsOtherMemberus-gaap:FairValueInputsLevel3Memberus-gaap:FairValueMeasurementsRecurringMemberus-gaap:MeasurementInputLossSeverityMemberus-gaap:ValuationTechniqueDiscountedCashFlowMember2023-12-310001126328srt:MaximumMemberpfg:InvestmentsOtherMemberus-gaap:FairValueInputsLevel3Memberus-gaap:FairValueMeasurementsRecurringMemberus-gaap:MeasurementInputDiscountRateMemberus-gaap:ValuationTechniqueDiscountedCashFlowMember2023-12-310001126328srt:MaximumMemberpfg:InvestmentsOtherMemberus-gaap:FairValueInputsLevel3Memberus-gaap:FairValueMeasurementsRecurringMemberus-gaap:MeasurementInputDefaultRateMemberus-gaap:ValuationTechniqueDiscountedCashFlowMember2023-12-310001126328us-gaap:AccumulatedOtherComprehensiveIncomeMember2023-01-012023-12-310001126328us-gaap:AccumulatedOtherComprehensiveIncomeMember2021-01-012021-12-310001126328srt:ParentCompanyMembersrt:ReportableLegalEntitiesMember2023-12-310001126328srt:ParentCompanyMembersrt:ReportableLegalEntitiesMember2022-12-310001126328us-gaap:OperatingSegmentsMemberpfg:SegmentPrincipalAssetManagementMemberpfg:SubsegmentEliminationsMember2023-01-012023-12-310001126328us-gaap:OperatingSegmentsMemberpfg:SegmentBenefitsAndProtectionMemberpfg:SubsegmentEliminationsMember2023-01-012023-12-310001126328us-gaap:OperatingSegmentsMemberpfg:SegmentPrincipalAssetManagementMember2023-01-012023-12-310001126328us-gaap:OperatingSegmentsMemberpfg:SegmentBenefitsAndProtectionMember2023-01-012023-12-310001126328us-gaap:OperatingSegmentsMemberpfg:SegmentPrincipalAssetManagementMemberpfg:SubsegmentEliminationsMember2022-01-012022-12-310001126328us-gaap:OperatingSegmentsMemberpfg:SegmentBenefitsAndProtectionMemberpfg:SubsegmentEliminationsMember2022-01-012022-12-310001126328us-gaap:OperatingSegmentsMemberpfg:SegmentPrincipalAssetManagementMember2022-01-012022-12-310001126328us-gaap:OperatingSegmentsMemberpfg:SegmentBenefitsAndProtectionMember2022-01-012022-12-310001126328us-gaap:OperatingSegmentsMemberpfg:SegmentPrincipalAssetManagementMemberpfg:SubsegmentEliminationsMember2021-01-012021-12-310001126328us-gaap:OperatingSegmentsMemberpfg:SegmentBenefitsAndProtectionMemberpfg:SubsegmentEliminationsMember2021-01-012021-12-310001126328us-gaap:OperatingSegmentsMemberpfg:SegmentPrincipalAssetManagementMember2021-01-012021-12-310001126328us-gaap:OperatingSegmentsMemberpfg:SegmentBenefitsAndProtectionMember2021-01-012021-12-310001126328us-gaap:OperatingSegmentsMember2021-01-012021-12-310001126328us-gaap:DomesticCountryMember2023-12-310001126328us-gaap:DomesticCountryMember2022-12-310001126328pfg:FiveLargestCededReinsurersMemberpfg:NetCededReinsuranceRecoverablesMemberus-gaap:ReinsurerConcentrationRiskMember2023-12-310001126328pfg:FiveLargestCededReinsurersMemberpfg:NetCededReinsuranceRecoverablesMemberus-gaap:ReinsurerConcentrationRiskMember2022-12-310001126328pfg:ContingentFundingAgreementMember2018-03-082018-03-080001126328pfg:GuaranteedPensionMembersrt:AsiaMemberpfg:SegmentPrincipalAssetManagementMemberpfg:SubsegmentPrincipalInternationalMember2023-01-012023-12-310001126328us-gaap:VariableAnnuityMemberpfg:SegmentRetirementAndIncomeSolutionsMember2023-01-012023-12-310001126328pfg:GuaranteedPensionMembersrt:AsiaMemberpfg:SegmentPrincipalAssetManagementMemberpfg:SubsegmentPrincipalInternationalMember2022-01-012022-12-310001126328us-gaap:VariableAnnuityMemberpfg:SegmentRetirementAndIncomeSolutionsMember2022-01-012022-12-310001126328pfg:GuaranteedPensionMembersrt:AsiaMemberpfg:SegmentPrincipalAssetManagementMemberpfg:SubsegmentPrincipalInternationalMember2021-01-012021-12-310001126328pfg:IndividualDisabilityMemberpfg:SegmentBenefitsAndProtectionMemberpfg:SubsegmentSpecialtyBenefitsMember2023-12-310001126328us-gaap:FixedAnnuityMemberpfg:SegmentRetirementAndIncomeSolutionsMember2023-12-310001126328pfg:LongTermCareInsuranceMemberpfg:SegmentCorporateMember2023-12-310001126328pfg:IndividualDisabilityMemberpfg:SegmentBenefitsAndProtectionMemberpfg:SubsegmentSpecialtyBenefitsMember2022-12-310001126328us-gaap:FixedAnnuityMemberpfg:SegmentRetirementAndIncomeSolutionsMember2022-12-310001126328pfg:LongTermCareInsuranceMemberpfg:SegmentCorporateMember2022-12-310001126328us-gaap:TermLifeInsuranceMemberpfg:SegmentBenefitsAndProtectionMemberpfg:SubsegmentLifeInsuranceMember2021-12-310001126328pfg:IndividualDisabilityMemberpfg:SegmentBenefitsAndProtectionMemberpfg:SubsegmentSpecialtyBenefitsMember2021-12-310001126328pfg:LongTermCareInsuranceMemberpfg:SegmentCorporateMember2021-12-310001126328us-gaap:TermLifeInsuranceMemberpfg:SegmentBenefitsAndProtectionMemberpfg:SubsegmentLifeInsuranceMember2020-12-310001126328pfg:IndividualDisabilityMemberpfg:SegmentBenefitsAndProtectionMemberpfg:SubsegmentSpecialtyBenefitsMember2020-12-310001126328pfg:LongTermCareInsuranceMemberpfg:SegmentCorporateMember2020-12-310001126328us-gaap:TermLifeInsuranceMemberpfg:SegmentBenefitsAndProtectionMemberpfg:SubsegmentLifeInsuranceMember2023-01-012023-12-310001126328pfg:IndividualDisabilityMemberpfg:SegmentBenefitsAndProtectionMemberpfg:SubsegmentSpecialtyBenefitsMember2023-01-012023-12-310001126328us-gaap:FixedAnnuityMemberpfg:SegmentRetirementAndIncomeSolutionsMember2023-01-012023-12-310001126328pfg:PensionRiskTransferMemberpfg:SegmentRetirementAndIncomeSolutionsMember2023-01-012023-12-310001126328pfg:LongTermCareInsuranceMemberpfg:SegmentCorporateMember2023-01-012023-12-310001126328us-gaap:TermLifeInsuranceMemberpfg:SegmentBenefitsAndProtectionMemberpfg:SubsegmentLifeInsuranceMember2022-01-012022-12-310001126328pfg:IndividualDisabilityMemberpfg:SegmentBenefitsAndProtectionMemberpfg:SubsegmentSpecialtyBenefitsMember2022-01-012022-12-310001126328us-gaap:FixedAnnuityMemberpfg:SegmentRetirementAndIncomeSolutionsMember2022-01-012022-12-310001126328pfg:PensionRiskTransferMemberpfg:SegmentRetirementAndIncomeSolutionsMember2022-01-012022-12-310001126328pfg:LongTermCareInsuranceMemberpfg:SegmentCorporateMember2022-01-012022-12-310001126328us-gaap:FixedAnnuityMembersrt:LatinAmericaMemberpfg:SegmentPrincipalAssetManagementMemberpfg:SubsegmentPrincipalInternationalMember2023-01-012023-12-310001126328us-gaap:FixedAnnuityMembersrt:LatinAmericaMemberpfg:SegmentPrincipalAssetManagementMemberpfg:SubsegmentPrincipalInternationalMember2022-01-012022-12-310001126328us-gaap:FixedAnnuityMembersrt:LatinAmericaMemberpfg:SegmentPrincipalAssetManagementMemberpfg:SubsegmentPrincipalInternationalMember2021-01-012021-12-310001126328us-gaap:TermLifeInsuranceMemberpfg:SegmentBenefitsAndProtectionMemberpfg:SubsegmentSpecialtyBenefitsMember2023-07-012023-09-300001126328pfg:IndividualDisabilityMemberpfg:SegmentBenefitsAndProtectionMemberpfg:SubsegmentSpecialtyBenefitsMember2023-07-012023-09-300001126328pfg:IndividualDisabilityMemberpfg:SegmentBenefitsAndProtectionMemberpfg:SubsegmentSpecialtyBenefitsMember2022-07-012022-09-300001126328pfg:MortgagesAndNotesPayableMemberus-gaap:NonrecourseMember2023-12-310001126328pfg:MortgagesAndNotesPayableMemberus-gaap:NonrecourseMember2022-12-310001126328us-gaap:FairValueInputsLevel3Memberus-gaap:EstimateOfFairValueFairValueDisclosureMember2023-12-310001126328us-gaap:FairValueInputsLevel3Memberus-gaap:EstimateOfFairValueFairValueDisclosureMember2022-12-310001126328us-gaap:RestrictedStockUnitsRSUMember2023-01-012023-12-310001126328us-gaap:PerformanceSharesMember2023-01-012023-12-310001126328us-gaap:RestrictedStockUnitsRSUMember2022-01-012022-12-310001126328us-gaap:PerformanceSharesMember2022-01-012022-12-310001126328us-gaap:RestrictedStockUnitsRSUMember2021-01-012021-12-310001126328us-gaap:PerformanceSharesMember2021-01-012021-12-310001126328pfg:SegmentRetirementAndIncomeSolutionsMember2023-01-012023-12-310001126328pfg:SegmentPrincipalAssetManagementMember2023-01-012023-12-310001126328pfg:SegmentRetirementAndIncomeSolutionsMember2022-01-012022-12-310001126328pfg:SegmentPrincipalAssetManagementMember2022-01-012022-12-310001126328pfg:SegmentRetirementAndIncomeSolutionsMember2021-01-012021-12-310001126328pfg:SegmentPrincipalAssetManagementMember2021-01-012021-12-310001126328us-gaap:InterestRateSwapMember2023-01-012023-12-310001126328pfg:InvestmentContractMember2023-12-310001126328pfg:FixedMaturitiesSecuritiesAvailableForSaleMember2023-12-310001126328pfg:FixedMaturitiesSecuritiesAvailableForSaleMember2022-12-310001126328pfg:TalcottLifeAndAnnuityReMemberus-gaap:OtherInvestmentsMember2023-01-012023-12-310001126328pfg:TalcottLifeAndAnnuityReMemberpfg:AssetsCashAndCashEquivalentsMember2023-01-012023-12-310001126328pfg:TalcottLifeAndAnnuityReMemberpfg:AssetsCashAndCashEquivalentsMember2022-01-012022-12-310001126328pfg:TradingSecuritiesMemberus-gaap:DebtSecuritiesMember2023-01-012023-12-310001126328pfg:AvailableForSaleSecurityMemberus-gaap:DebtSecuritiesMember2023-01-012023-12-310001126328us-gaap:PolicyLoansMember2023-01-012023-12-310001126328us-gaap:EquitySecuritiesMember2023-01-012023-12-310001126328us-gaap:DerivativeMember2023-01-012023-12-310001126328us-gaap:CashAndCashEquivalentsMember2023-01-012023-12-310001126328pfg:OtherInvestmentTypesMember2023-01-012023-12-310001126328pfg:MortgageLoansMember2023-01-012023-12-310001126328pfg:InvestmentsInRealEstateMember2023-01-012023-12-310001126328pfg:TradingSecuritiesMemberus-gaap:DebtSecuritiesMember2022-01-012022-12-310001126328pfg:AvailableForSaleSecurityMemberus-gaap:DebtSecuritiesMember2022-01-012022-12-310001126328us-gaap:PolicyLoansMember2022-01-012022-12-310001126328us-gaap:EquitySecuritiesMember2022-01-012022-12-310001126328us-gaap:DerivativeMember2022-01-012022-12-310001126328us-gaap:CashAndCashEquivalentsMember2022-01-012022-12-310001126328pfg:OtherInvestmentTypesMember2022-01-012022-12-310001126328pfg:MortgageLoansMember2022-01-012022-12-310001126328pfg:InvestmentsInRealEstateMember2022-01-012022-12-310001126328pfg:TradingSecuritiesMemberus-gaap:DebtSecuritiesMember2021-01-012021-12-310001126328pfg:AvailableForSaleSecurityMemberus-gaap:DebtSecuritiesMember2021-01-012021-12-310001126328us-gaap:PolicyLoansMember2021-01-012021-12-310001126328us-gaap:EquitySecuritiesMember2021-01-012021-12-310001126328us-gaap:DerivativeMember2021-01-012021-12-310001126328us-gaap:CashAndCashEquivalentsMember2021-01-012021-12-310001126328pfg:OtherInvestmentTypesMember2021-01-012021-12-310001126328pfg:MortgageLoansMember2021-01-012021-12-310001126328pfg:InvestmentsInRealEstateMember2021-01-012021-12-310001126328pfg:TalcottLifeAndAnnuityReMemberus-gaap:EquitySecuritiesMember2023-01-012023-12-310001126328pfg:TalcottLifeAndAnnuityReMemberus-gaap:DerivativeMember2023-01-012023-12-310001126328pfg:TalcottLifeAndAnnuityReMemberpfg:MortgageLoansMember2023-01-012023-12-310001126328pfg:TalcottLifeAndAnnuityReMemberpfg:FixedMaturitiesTradingMember2023-01-012023-12-310001126328pfg:TalcottLifeAndAnnuityReMemberpfg:FixedMaturitiesSecuritiesAvailableForSaleMember2023-01-012023-12-310001126328pfg:TalcottLifeAndAnnuityReMember2023-01-012023-12-310001126328pfg:TalcottLifeAndAnnuityReMemberus-gaap:OtherInvestmentsMember2022-01-012022-12-310001126328pfg:TalcottLifeAndAnnuityReMemberus-gaap:EquitySecuritiesMember2022-01-012022-12-310001126328pfg:TalcottLifeAndAnnuityReMemberus-gaap:DerivativeMember2022-01-012022-12-310001126328pfg:TalcottLifeAndAnnuityReMemberpfg:MortgageLoansMember2022-01-012022-12-310001126328pfg:TalcottLifeAndAnnuityReMemberpfg:FixedMaturitiesTradingMember2022-01-012022-12-310001126328pfg:TalcottLifeAndAnnuityReMemberpfg:FixedMaturitiesSecuritiesAvailableForSaleMember2022-01-012022-12-310001126328pfg:TalcottLifeAndAnnuityReMember2022-01-012022-12-310001126328pfg:NetOtherAssetsAndLiabilitiesMember2023-12-310001126328pfg:NetOtherAssetsAndLiabilitiesMember2022-12-310001126328pfg:PrincipalLifeInsuranceCompanyConsolidatedMember2023-01-012023-12-310001126328pfg:PrincipalLifeInsuranceCompanyConsolidatedMemberpfg:FundingAgreement2011ProgramMember2011-12-310001126328pfg:PrincipalLifeInsuranceCompanyConsolidatedMemberpfg:FundingAgreement2001ProgramMember2001-12-310001126328pfg:PrincipalLifeInsuranceCompanyConsolidatedMemberpfg:FundingAgreement1998ProgramMember1998-12-310001126328pfg:PrincipalLifeInsuranceCompanyConsolidatedMemberpfg:FundingAgreement2011ProgramMember2023-11-300001126328pfg:PrincipalLifeInsuranceCompanyConsolidatedMemberpfg:FundingAgreement2011ProgramMember2021-02-280001126328pfg:PrincipalLifeInsuranceCompanyConsolidatedMemberpfg:FundingAgreement2011ProgramMember2017-11-300001126328pfg:PrincipalLifeInsuranceCompanyConsolidatedMemberpfg:FundingAgreement2011ProgramMember2015-06-300001126328pfg:PrincipalLifeInsuranceCompanyConsolidatedMemberpfg:FundingAgreementsFederalHomeLoanBankDesMoinesMember2023-12-310001126328pfg:PrincipalLifeInsuranceCompanyConsolidatedMemberpfg:FundingAgreement2011ProgramMember2023-12-310001126328pfg:PrincipalLifeInsuranceCompanyConsolidatedMemberpfg:FundingAgreement2001ProgramMember2023-12-310001126328pfg:PrincipalLifeInsuranceCompanyConsolidatedMemberpfg:FundingAgreement1998ProgramMember2023-12-310001126328pfg:PrincipalLifeInsuranceCompanyConsolidatedMemberpfg:FundingAgreementsFederalHomeLoanBankDesMoinesMember2022-12-310001126328pfg:PrincipalLifeInsuranceCompanyConsolidatedMemberpfg:FundingAgreement2011ProgramMember2022-12-310001126328pfg:PrincipalLifeInsuranceCompanyConsolidatedMemberpfg:FundingAgreement2001ProgramMember2022-12-310001126328pfg:PrincipalLifeInsuranceCompanyConsolidatedMemberpfg:FundingAgreement1998ProgramMember2022-12-310001126328us-gaap:AssetPledgedAsCollateralMember2023-12-310001126328us-gaap:AssetPledgedAsCollateralMember2022-12-310001126328us-gaap:OtherIntangibleAssetsMember2023-01-012023-12-310001126328us-gaap:OtherIntangibleAssetsMember2022-01-012022-12-310001126328us-gaap:CommercialRealEstatePortfolioSegmentMember2022-01-012022-12-310001126328pfg:StandardPoorsBPlusAndBelowRatingMemberus-gaap:CommercialRealEstatePortfolioSegmentMember2022-12-310001126328pfg:StandardPoorsBBPlusThruBBMinusRatingMemberus-gaap:CommercialRealEstatePortfolioSegmentMember2022-12-310001126328pfg:StandardPoorsBBBPlusThruBBBMinusRatingMemberus-gaap:CommercialRealEstatePortfolioSegmentMember2022-12-310001126328pfg:StandardPoorsAMinusAndAboveRatingMemberus-gaap:CommercialRealEstatePortfolioSegmentMember2022-12-310001126328pfg:PerformingMemberus-gaap:ResidentialMortgageMember2022-12-310001126328pfg:NonperformingMemberus-gaap:ResidentialMortgageMember2022-12-310001126328us-gaap:CommercialRealEstatePortfolioSegmentMember2023-12-310001126328us-gaap:CommercialRealEstatePortfolioSegmentMember2022-12-310001126328us-gaap:ResidentialMortgageMember2021-12-310001126328us-gaap:CommercialRealEstatePortfolioSegmentMember2021-12-310001126328us-gaap:ResidentialMortgageMember2023-12-310001126328us-gaap:ResidentialMortgageMember2022-12-310001126328us-gaap:FinancingReceivablesEqualToGreaterThan90DaysPastDueMember2023-12-310001126328us-gaap:FinancingReceivables60To89DaysPastDueMember2023-12-310001126328us-gaap:FinancingReceivables30To59DaysPastDueMember2023-12-310001126328us-gaap:FinancialAssetPastDueMember2023-12-310001126328us-gaap:FinancialAssetNotPastDueMember2023-12-310001126328us-gaap:FinancingReceivablesEqualToGreaterThan90DaysPastDueMember2022-12-310001126328us-gaap:FinancingReceivables60To89DaysPastDueMember2022-12-310001126328us-gaap:FinancingReceivables30To59DaysPastDueMember2022-12-310001126328us-gaap:FinancialAssetPastDueMember2022-12-310001126328us-gaap:FinancialAssetNotPastDueMember2022-12-310001126328pfg:OtherFinancingReceivablesMember2023-12-310001126328pfg:OtherFinancingReceivablesMember2022-12-310001126328pfg:OtherFinancingReceivablesMember2021-12-3100011263282021-12-3100011263282020-12-310001126328us-gaap:OperatingSegmentsMemberpfg:SegmentPrincipalAssetManagementMemberpfg:SubsegmentPrincipalInternationalMember2023-01-012023-12-310001126328us-gaap:OperatingSegmentsMemberpfg:SegmentPrincipalAssetManagementMemberpfg:SubsegmentPrincipalGlobalInvestorsMember2023-01-012023-12-310001126328us-gaap:OperatingSegmentsMemberpfg:SegmentBenefitsAndProtectionMemberpfg:SubsegmentSpecialtyBenefitsMember2023-01-012023-12-310001126328us-gaap:OperatingSegmentsMemberpfg:SegmentBenefitsAndProtectionMemberpfg:SubsegmentLifeInsuranceMember2023-01-012023-12-310001126328us-gaap:OperatingSegmentsMemberpfg:SegmentRetirementAndIncomeSolutionsMember2023-01-012023-12-310001126328us-gaap:OperatingSegmentsMemberpfg:SegmentCorporateMember2023-01-012023-12-310001126328us-gaap:OperatingSegmentsMemberpfg:SegmentPrincipalAssetManagementMemberpfg:SubsegmentPrincipalInternationalMember2022-01-012022-12-310001126328us-gaap:OperatingSegmentsMemberpfg:SegmentPrincipalAssetManagementMemberpfg:SubsegmentPrincipalGlobalInvestorsMember2022-01-012022-12-310001126328us-gaap:OperatingSegmentsMemberpfg:SegmentBenefitsAndProtectionMemberpfg:SubsegmentSpecialtyBenefitsMember2022-01-012022-12-310001126328us-gaap:OperatingSegmentsMemberpfg:SegmentBenefitsAndProtectionMemberpfg:SubsegmentLifeInsuranceMember2022-01-012022-12-310001126328us-gaap:OperatingSegmentsMemberpfg:SegmentRetirementAndIncomeSolutionsMember2022-01-012022-12-310001126328us-gaap:OperatingSegmentsMemberpfg:SegmentCorporateMember2022-01-012022-12-310001126328us-gaap:OperatingSegmentsMemberpfg:SegmentPrincipalAssetManagementMemberpfg:SubsegmentPrincipalInternationalMember2021-01-012021-12-310001126328us-gaap:OperatingSegmentsMemberpfg:SegmentPrincipalAssetManagementMemberpfg:SubsegmentPrincipalGlobalInvestorsMember2021-01-012021-12-310001126328us-gaap:OperatingSegmentsMemberpfg:SegmentBenefitsAndProtectionMemberpfg:SubsegmentSpecialtyBenefitsMember2021-01-012021-12-310001126328us-gaap:OperatingSegmentsMemberpfg:SegmentBenefitsAndProtectionMemberpfg:SubsegmentLifeInsuranceMember2021-01-012021-12-310001126328us-gaap:OperatingSegmentsMemberpfg:SegmentRetirementAndIncomeSolutionsMember2021-01-012021-12-310001126328us-gaap:OperatingSegmentsMemberpfg:SegmentCorporateMember2021-01-012021-12-310001126328pfg:CertainOtherLoansOfConsolidatedVariableInterestEntityMember2023-12-310001126328us-gaap:FairValueMeasurementsRecurringMember2023-01-012023-12-310001126328us-gaap:FairValueMeasurementsRecurringMember2021-01-012021-12-310001126328us-gaap:FairValueMeasurementsRecurringMember2022-01-012022-12-310001126328pfg:FundsWithheldPayableEmbeddedDerivativeMemberus-gaap:FairValueMeasurementsRecurringMember2023-01-012023-12-310001126328pfg:FundsWithheldPayableEmbeddedDerivativeMemberus-gaap:FairValueMeasurementsRecurringMember2022-01-012022-12-310001126328pfg:InvestmentAndUniversalLifeContractsMemberus-gaap:FairValueMeasurementsRecurringMember2023-01-012023-12-310001126328pfg:InvestmentAndUniversalLifeContractsMemberus-gaap:FairValueMeasurementsRecurringMember2022-01-012022-12-310001126328pfg:InvestmentAndUniversalLifeContractsMemberus-gaap:FairValueMeasurementsRecurringMember2021-01-012021-12-310001126328us-gaap:USStatesAndPoliticalSubdivisionsMemberus-gaap:FairValueMeasurementsRecurringMemberpfg:AvailableForSaleSecurityMember2023-01-012023-12-310001126328us-gaap:FixedMaturitiesMemberus-gaap:FairValueMeasurementsRecurringMemberpfg:TradingSecuritiesMember2023-01-012023-12-310001126328pfg:SeparateAccountAssetsMemberus-gaap:FairValueMeasurementsRecurringMember2023-01-012023-12-310001126328pfg:InvestmentsOtherMemberus-gaap:FairValueMeasurementsRecurringMember2023-01-012023-12-310001126328us-gaap:FixedMaturitiesMemberus-gaap:FairValueMeasurementsRecurringMemberpfg:TradingSecuritiesMember2022-01-012022-12-310001126328pfg:SeparateAccountAssetsMemberus-gaap:FairValueMeasurementsRecurringMember2022-01-012022-12-310001126328us-gaap:CommercialMortgageBackedSecuritiesMemberus-gaap:FairValueMeasurementsRecurringMemberpfg:AvailableForSaleSecurityMember2021-01-012021-12-310001126328pfg:SeparateAccountAssetsMemberus-gaap:FairValueMeasurementsRecurringMember2021-01-012021-12-310001126328pfg:InvestmentsOtherMemberus-gaap:FairValueMeasurementsRecurringMember2021-01-012021-12-310001126328us-gaap:CollateralizedDebtObligationsMemberus-gaap:FairValueMeasurementsRecurringMemberpfg:AvailableForSaleSecurityMember2023-01-012023-12-310001126328us-gaap:OtherDebtSecuritiesMemberus-gaap:FairValueMeasurementsRecurringMemberpfg:AvailableForSaleSecurityMember2022-01-012022-12-310001126328us-gaap:CommercialMortgageBackedSecuritiesMemberus-gaap:FairValueMeasurementsRecurringMemberpfg:AvailableForSaleSecurityMember2022-01-012022-12-310001126328us-gaap:CollateralizedDebtObligationsMemberus-gaap:FairValueMeasurementsRecurringMemberpfg:AvailableForSaleSecurityMember2022-01-012022-12-310001126328us-gaap:OtherDebtSecuritiesMemberus-gaap:FairValueMeasurementsRecurringMemberpfg:AvailableForSaleSecurityMember2023-01-012023-12-310001126328us-gaap:DebtSecuritiesMemberus-gaap:FairValueMeasurementsRecurringMemberpfg:AvailableForSaleSecurityMember2023-01-012023-12-310001126328us-gaap:CorporateDebtSecuritiesMemberus-gaap:FairValueMeasurementsRecurringMemberpfg:AvailableForSaleSecurityMember2023-01-012023-12-310001126328us-gaap:USStatesAndPoliticalSubdivisionsMemberus-gaap:FairValueMeasurementsRecurringMemberpfg:AvailableForSaleSecurityMember2022-01-012022-12-310001126328us-gaap:DebtSecuritiesMemberus-gaap:FairValueMeasurementsRecurringMemberpfg:TradingSecuritiesMember2022-01-012022-12-310001126328us-gaap:DebtSecuritiesMemberus-gaap:FairValueMeasurementsRecurringMemberpfg:AvailableForSaleSecurityMember2022-01-012022-12-310001126328us-gaap:CorporateDebtSecuritiesMemberus-gaap:FairValueMeasurementsRecurringMemberpfg:AvailableForSaleSecurityMember2022-01-012022-12-310001126328us-gaap:USStatesAndPoliticalSubdivisionsMemberus-gaap:FairValueMeasurementsRecurringMemberpfg:AvailableForSaleSecurityMember2021-01-012021-12-310001126328us-gaap:OtherDebtSecuritiesMemberus-gaap:FairValueMeasurementsRecurringMemberpfg:AvailableForSaleSecurityMember2021-01-012021-12-310001126328us-gaap:DebtSecuritiesMemberus-gaap:FairValueMeasurementsRecurringMemberpfg:AvailableForSaleSecurityMember2021-01-012021-12-310001126328us-gaap:CorporateDebtSecuritiesMemberus-gaap:FairValueMeasurementsRecurringMemberpfg:AvailableForSaleSecurityMember2021-01-012021-12-310001126328us-gaap:CollateralizedDebtObligationsMemberus-gaap:FairValueMeasurementsRecurringMemberpfg:AvailableForSaleSecurityMember2021-01-012021-12-310001126328us-gaap:FairValueMeasuredAtNetAssetValuePerShareMemberus-gaap:FairValueMeasurementsRecurringMember2023-12-310001126328us-gaap:FairValueInputsLevel1Memberus-gaap:FairValueMeasurementsRecurringMember2023-12-310001126328us-gaap:FairValueMeasuredAtNetAssetValuePerShareMemberus-gaap:FairValueMeasurementsRecurringMember2022-12-310001126328us-gaap:FairValueInputsLevel1Memberus-gaap:FairValueMeasurementsRecurringMember2022-12-310001126328us-gaap:EquityMethodInvestmentNonconsolidatedInvesteeOrGroupOfInvesteesMember2023-01-012023-12-310001126328us-gaap:EquityMethodInvestmentNonconsolidatedInvesteeOrGroupOfInvesteesMember2022-01-012022-12-310001126328us-gaap:EquityMethodInvestmentNonconsolidatedInvesteeOrGroupOfInvesteesMember2021-01-012021-12-310001126328pfg:EmployeeStockPurchasePlanMember2023-12-310001126328srt:ParentCompanyMembersrt:ReportableLegalEntitiesMember2023-01-012023-12-310001126328srt:ParentCompanyMembersrt:ReportableLegalEntitiesMember2022-01-012022-12-310001126328srt:ParentCompanyMembersrt:ReportableLegalEntitiesMember2021-01-012021-12-310001126328pfg:SubsidiariesPrincipalLifeInsuranceCompanyMember2023-01-012023-12-310001126328pfg:StandardPoorsBBPlusThruBBMinusRatingMember2022-12-310001126328pfg:StandardPoorsBBBPlusThruBBBMinusRatingMember2022-12-310001126328pfg:StandardPoorsAMinusAndAboveRatingMember2022-12-310001126328us-gaap:FinanceLeasesPortfolioSegmentMember2023-01-012023-12-310001126328us-gaap:FinanceLeasesPortfolioSegmentMember2022-01-012022-12-310001126328us-gaap:FinanceLeasesPortfolioSegmentMember2021-01-012021-12-310001126328us-gaap:OtherContractMemberus-gaap:NotDesignatedAsHedgingInstrumentEconomicHedgeMember2023-12-310001126328us-gaap:InterestRateContractMemberus-gaap:NotDesignatedAsHedgingInstrumentEconomicHedgeMember2023-12-310001126328us-gaap:InterestRateContractMemberus-gaap:DesignatedAsHedgingInstrumentMember2023-12-310001126328us-gaap:ForeignExchangeContractMemberus-gaap:NotDesignatedAsHedgingInstrumentEconomicHedgeMember2023-12-310001126328us-gaap:ForeignExchangeContractMemberus-gaap:DesignatedAsHedgingInstrumentMember2023-12-310001126328us-gaap:EquityContractMemberus-gaap:NotDesignatedAsHedgingInstrumentEconomicHedgeMember2023-12-310001126328us-gaap:CreditRiskContractMemberus-gaap:NotDesignatedAsHedgingInstrumentEconomicHedgeMember2023-12-310001126328us-gaap:NotDesignatedAsHedgingInstrumentEconomicHedgeMember2023-12-310001126328us-gaap:DesignatedAsHedgingInstrumentMember2023-12-310001126328us-gaap:OtherContractMemberus-gaap:NotDesignatedAsHedgingInstrumentEconomicHedgeMember2022-12-310001126328us-gaap:InterestRateContractMemberus-gaap:NotDesignatedAsHedgingInstrumentEconomicHedgeMember2022-12-310001126328us-gaap:InterestRateContractMemberus-gaap:DesignatedAsHedgingInstrumentMember2022-12-310001126328us-gaap:ForeignExchangeContractMemberus-gaap:NotDesignatedAsHedgingInstrumentEconomicHedgeMember2022-12-310001126328us-gaap:ForeignExchangeContractMemberus-gaap:DesignatedAsHedgingInstrumentMember2022-12-310001126328us-gaap:EquityContractMemberus-gaap:NotDesignatedAsHedgingInstrumentEconomicHedgeMember2022-12-310001126328us-gaap:CreditRiskContractMemberus-gaap:NotDesignatedAsHedgingInstrumentEconomicHedgeMember2022-12-310001126328us-gaap:NotDesignatedAsHedgingInstrumentEconomicHedgeMember2022-12-310001126328us-gaap:DesignatedAsHedgingInstrumentMember2022-12-310001126328us-gaap:FairValueInputsLevel2Memberus-gaap:FairValueMeasurementsRecurringMember2023-12-310001126328us-gaap:FairValueInputsLevel2Memberus-gaap:FairValueMeasurementsRecurringMember2022-12-310001126328us-gaap:FairValueInputsLevel3Memberus-gaap:FairValueMeasurementsRecurringMember2023-12-310001126328us-gaap:FairValueMeasurementsRecurringMember2023-12-310001126328us-gaap:FairValueInputsLevel3Memberus-gaap:FairValueMeasurementsRecurringMember2022-12-310001126328us-gaap:FairValueMeasurementsRecurringMember2022-12-310001126328us-gaap:StockOptionMember2023-12-310001126328us-gaap:InterestRateSwapMember2023-12-310001126328us-gaap:ForeignExchangeForwardMember2023-12-310001126328us-gaap:CurrencySwapMember2023-12-310001126328us-gaap:CreditDefaultSwapMember2023-12-310001126328pfg:InterestRateOptionsMember2023-12-310001126328pfg:InterestRateForwardsMember2023-12-310001126328us-gaap:StockOptionMember2022-12-310001126328us-gaap:InterestRateSwapMember2022-12-310001126328us-gaap:ForeignExchangeForwardMember2022-12-310001126328us-gaap:CurrencySwapMember2022-12-310001126328us-gaap:CreditDefaultSwapMember2022-12-310001126328pfg:InterestRateOptionsMember2022-12-310001126328pfg:InterestRateForwardsMember2022-12-310001126328us-gaap:QualifiedPlanMemberpfg:DefinedContributionPlanGrandfatheredChoiceParticipantMember2023-01-012023-12-310001126328us-gaap:QualifiedPlanMemberus-gaap:PensionPlansDefinedBenefitMember2023-01-012023-12-310001126328us-gaap:NonqualifiedPlanMemberus-gaap:PensionPlansDefinedBenefitMember2023-01-012023-12-310001126328us-gaap:QualifiedPlanMemberus-gaap:PensionPlansDefinedBenefitMember2022-01-012022-12-310001126328us-gaap:NonqualifiedPlanMemberus-gaap:PensionPlansDefinedBenefitMember2022-01-012022-12-310001126328us-gaap:QualifiedPlanMemberus-gaap:PensionPlansDefinedBenefitMember2021-01-012021-12-310001126328us-gaap:NonqualifiedPlanMemberus-gaap:PensionPlansDefinedBenefitMember2021-01-012021-12-310001126328us-gaap:OtherPostretirementBenefitPlansDefinedBenefitMember2023-01-012023-12-310001126328us-gaap:OtherPostretirementBenefitPlansDefinedBenefitMember2022-01-012022-12-310001126328us-gaap:PensionPlansDefinedBenefitMember2023-12-310001126328us-gaap:PensionPlansDefinedBenefitMember2022-12-310001126328us-gaap:OtherPostretirementBenefitPlansDefinedBenefitMember2023-12-310001126328us-gaap:OtherPostretirementBenefitPlansDefinedBenefitMember2022-12-310001126328us-gaap:PensionPlansDefinedBenefitMember2023-01-012023-12-310001126328us-gaap:TermLifeInsuranceMemberpfg:SegmentBenefitsAndProtectionMemberpfg:SubsegmentLifeInsuranceMember2023-12-310001126328us-gaap:ParticipatingLifeInsurancePolicyMemberpfg:SegmentBenefitsAndProtectionMemberpfg:SubsegmentLifeInsuranceMember2023-12-310001126328us-gaap:TermLifeInsuranceMemberpfg:SegmentBenefitsAndProtectionMemberpfg:SubsegmentLifeInsuranceMember2022-12-310001126328us-gaap:ParticipatingLifeInsurancePolicyMemberpfg:SegmentBenefitsAndProtectionMemberpfg:SubsegmentLifeInsuranceMember2022-12-310001126328pfg:PrincipalLifeInsuranceCompanyConsolidatedMemberus-gaap:USStatesAndPoliticalSubdivisionsMember2023-12-310001126328pfg:PrincipalLifeInsuranceCompanyConsolidatedMemberus-gaap:MortgageBackedSecuritiesMember2023-12-310001126328pfg:PrincipalLifeInsuranceCompanyConsolidatedMemberus-gaap:CorporateDebtSecuritiesMember2023-12-310001126328pfg:PrincipalLifeInsuranceCompanyConsolidatedMemberus-gaap:CommercialMortgageBackedSecuritiesMember2023-12-310001126328pfg:PrincipalLifeInsuranceCompanyConsolidatedMemberus-gaap:USStatesAndPoliticalSubdivisionsMember2022-12-310001126328pfg:PrincipalLifeInsuranceCompanyConsolidatedMemberus-gaap:MortgageBackedSecuritiesMember2022-12-310001126328pfg:PrincipalLifeInsuranceCompanyConsolidatedMemberus-gaap:CorporateDebtSecuritiesMember2022-12-310001126328pfg:PrincipalLifeInsuranceCompanyConsolidatedMemberus-gaap:CommercialMortgageBackedSecuritiesMember2022-12-310001126328pfg:PrincipalLifeInsuranceCompanyConsolidatedMember2023-12-310001126328pfg:PrincipalLifeInsuranceCompanyConsolidatedMember2022-12-310001126328us-gaap:CorporateDebtSecuritiesMember2022-01-012022-12-310001126328us-gaap:CorporateDebtSecuritiesMember2021-01-012021-12-310001126328srt:MinimumMemberpfg:MortgagesAndNotesPayableMemberus-gaap:NonrecourseMember2023-12-310001126328srt:MinimumMemberpfg:MortgagesAndNotesPayableMemberus-gaap:NonrecourseMember2022-12-310001126328srt:MaximumMemberpfg:MortgagesAndNotesPayableMemberus-gaap:NonrecourseMember2022-12-310001126328us-gaap:ResidentialMortgageMember2023-01-012023-12-310001126328us-gaap:CommercialRealEstatePortfolioSegmentMember2023-01-012023-12-310001126328pfg:NonperformingMemberus-gaap:ResidentialMortgageMember2023-01-012023-12-310001126328srt:StandardPoorsBBRatingMemberpfg:SingleNameCreditDefaultSwapsMemberus-gaap:CorporateDebtSecuritiesMember2023-01-012023-12-310001126328srt:StandardPoorsBBBRatingMemberpfg:SingleNameCreditDefaultSwapsMemberus-gaap:CorporateDebtSecuritiesMember2023-01-012023-12-310001126328srt:StandardPoorsARatingMemberpfg:SingleNameCreditDefaultSwapsMemberus-gaap:SovereignDebtMember2023-01-012023-12-310001126328srt:StandardPoorsARatingMemberpfg:SingleNameCreditDefaultSwapsMemberus-gaap:CorporateDebtSecuritiesMember2023-01-012023-12-310001126328pfg:SingleNameCreditDefaultSwapsMember2023-01-012023-12-310001126328srt:StandardPoorsBBRatingMemberpfg:SingleNameCreditDefaultSwapsMemberus-gaap:CorporateDebtSecuritiesMember2022-01-012022-12-310001126328srt:StandardPoorsBBBRatingMemberpfg:SingleNameCreditDefaultSwapsMemberus-gaap:CorporateDebtSecuritiesMember2022-01-012022-12-310001126328srt:StandardPoorsARatingMemberpfg:SingleNameCreditDefaultSwapsMemberus-gaap:SovereignDebtMember2022-01-012022-12-310001126328srt:StandardPoorsARatingMemberpfg:SingleNameCreditDefaultSwapsMemberus-gaap:CorporateDebtSecuritiesMember2022-01-012022-12-310001126328pfg:SingleNameCreditDefaultSwapsMember2022-01-012022-12-310001126328srt:StandardPoorsBBRatingMemberpfg:SingleNameCreditDefaultSwapsMemberus-gaap:CorporateDebtSecuritiesMember2023-12-310001126328srt:StandardPoorsBBBRatingMemberpfg:SingleNameCreditDefaultSwapsMemberus-gaap:CorporateDebtSecuritiesMember2023-12-310001126328srt:StandardPoorsARatingMemberpfg:SingleNameCreditDefaultSwapsMemberus-gaap:SovereignDebtMember2023-12-310001126328srt:StandardPoorsARatingMemberpfg:SingleNameCreditDefaultSwapsMemberus-gaap:CorporateDebtSecuritiesMember2023-12-310001126328pfg:SingleNameCreditDefaultSwapsMember2023-12-310001126328srt:StandardPoorsBBRatingMemberpfg:SingleNameCreditDefaultSwapsMemberus-gaap:CorporateDebtSecuritiesMember2022-12-310001126328srt:StandardPoorsBBBRatingMemberpfg:SingleNameCreditDefaultSwapsMemberus-gaap:CorporateDebtSecuritiesMember2022-12-310001126328srt:StandardPoorsARatingMemberpfg:SingleNameCreditDefaultSwapsMemberus-gaap:SovereignDebtMember2022-12-310001126328srt:StandardPoorsARatingMemberpfg:SingleNameCreditDefaultSwapsMemberus-gaap:CorporateDebtSecuritiesMember2022-12-310001126328pfg:SingleNameCreditDefaultSwapsMember2022-12-310001126328us-gaap:VariableInterestEntityPrimaryBeneficiaryMember2023-12-310001126328us-gaap:VariableInterestEntityPrimaryBeneficiaryMember2022-12-310001126328srt:CumulativeEffectPeriodOfAdoptionAdjustmentMemberus-gaap:AccountingStandardsUpdate201812Member2020-12-310001126328pfg:SegmentRetirementAndIncomeSolutionsMember2023-12-310001126328pfg:SegmentPrincipalAssetManagementMember2023-12-310001126328pfg:SegmentCorporateMember2023-12-310001126328pfg:SegmentBenefitsAndProtectionMember2023-12-310001126328pfg:SegmentRetirementAndIncomeSolutionsMember2022-12-310001126328pfg:SegmentPrincipalAssetManagementMember2022-12-310001126328pfg:SegmentCorporateMember2022-12-310001126328pfg:SegmentBenefitsAndProtectionMember2022-12-310001126328us-gaap:DerivativeFinancialInstrumentsAssetsMember2023-12-310001126328pfg:ReverseRepurchaseAgreementMember2023-12-310001126328us-gaap:DerivativeFinancialInstrumentsAssetsMember2022-12-310001126328pfg:ReverseRepurchaseAgreementMember2022-12-310001126328us-gaap:DerivativeFinancialInstrumentsLiabilitiesMember2023-12-310001126328us-gaap:DerivativeFinancialInstrumentsLiabilitiesMember2022-12-310001126328pfg:ReclassificationActuarialBalanceRecohortingUlsgBusinessMember2022-01-012022-12-310001126328pfg:EmployeeStockPurchasePlanMember2023-01-012023-12-310001126328pfg:EmployeeStockPurchasePlanMember2022-01-012022-12-310001126328pfg:EmployeeStockPurchasePlanMember2021-01-012021-12-310001126328us-gaap:FairValueInputsLevel2Memberus-gaap:EstimateOfFairValueFairValueDisclosureMember2023-12-310001126328us-gaap:FairValueInputsLevel1Memberus-gaap:EstimateOfFairValueFairValueDisclosureMember2023-12-310001126328us-gaap:EstimateOfFairValueFairValueDisclosureMember2023-12-310001126328us-gaap:CarryingReportedAmountFairValueDisclosureMember2023-12-310001126328us-gaap:FairValueInputsLevel2Memberus-gaap:EstimateOfFairValueFairValueDisclosureMember2022-12-310001126328us-gaap:FairValueInputsLevel1Memberus-gaap:EstimateOfFairValueFairValueDisclosureMember2022-12-310001126328us-gaap:EstimateOfFairValueFairValueDisclosureMember2022-12-310001126328us-gaap:CarryingReportedAmountFairValueDisclosureMember2022-12-310001126328us-gaap:MaterialReconcilingItemsMember2021-01-012021-12-310001126328us-gaap:CommercialPaperMember2023-12-310001126328us-gaap:CommercialPaperMember2022-12-310001126328us-gaap:VariableInterestEntityNotPrimaryBeneficiaryMember2023-12-310001126328us-gaap:AccumulatedNetUnrealizedInvestmentGainLossMember2023-12-310001126328us-gaap:AccumulatedNetUnrealizedInvestmentGainLossMember2022-12-310001126328us-gaap:AccumulatedNetUnrealizedInvestmentGainLossMember2021-12-310001126328us-gaap:OperatingSegmentsMember2023-01-012023-12-310001126328us-gaap:MaterialReconcilingItemsMember2023-01-012023-12-310001126328us-gaap:OperatingSegmentsMember2022-01-012022-12-310001126328us-gaap:MaterialReconcilingItemsMember2022-01-012022-12-310001126328us-gaap:NoncontrollingInterestMember2023-01-012023-12-310001126328us-gaap:AdditionalPaidInCapitalMember2023-01-012023-12-310001126328us-gaap:NoncontrollingInterestMember2022-01-012022-12-310001126328us-gaap:AdditionalPaidInCapitalMember2022-01-012022-12-310001126328us-gaap:NoncontrollingInterestMember2021-01-012021-12-310001126328us-gaap:AdditionalPaidInCapitalMember2021-01-012021-12-3100011263282021-01-012021-12-310001126328us-gaap:AccumulatedOtherComprehensiveIncomeMember2022-01-012022-12-310001126328us-gaap:AccumulatedNetUnrealizedInvestmentGainLossMember2022-01-012022-12-310001126328us-gaap:AccumulatedGainLossNetCashFlowHedgeParentMember2022-01-012022-12-3100011263282022-01-012022-12-310001126328us-gaap:AccumulatedGainLossCashFlowHedgeIncludingNoncontrollingInterestMember2021-01-012021-12-310001126328us-gaap:AccumulatedNetInvestmentGainLossIncludingPortionAttributableToNoncontrollingInterestMember2023-01-012023-12-310001126328us-gaap:AccumulatedGainLossCashFlowHedgeIncludingNoncontrollingInterestMember2023-01-012023-12-310001126328us-gaap:AccumulatedNetInvestmentGainLossIncludingPortionAttributableToNoncontrollingInterestMember2022-01-012022-12-310001126328us-gaap:AccumulatedGainLossCashFlowHedgeIncludingNoncontrollingInterestMember2022-01-012022-12-310001126328us-gaap:AccumulatedNetInvestmentGainLossIncludingPortionAttributableToNoncontrollingInterestMember2021-01-012021-12-3100011263282023-12-3100011263282022-12-310001126328us-gaap:UniversalLifeMemberpfg:SegmentBenefitsAndProtectionMemberpfg:SubsegmentLifeInsuranceMember2023-12-310001126328us-gaap:UniversalLifeMemberpfg:SegmentBenefitsAndProtectionMemberpfg:SubsegmentLifeInsuranceMember2022-12-310001126328us-gaap:UniversalLifeMemberpfg:SegmentBenefitsAndProtectionMemberpfg:SubsegmentLifeInsuranceMember2023-01-012023-12-310001126328us-gaap:UniversalLifeMemberpfg:SegmentBenefitsAndProtectionMemberpfg:SubsegmentLifeInsuranceMember2022-01-012022-12-310001126328us-gaap:UniversalLifeMemberpfg:SegmentBenefitsAndProtectionMemberpfg:SubsegmentLifeInsuranceMember2021-01-012021-12-310001126328us-gaap:UniversalLifeMemberpfg:SegmentBenefitsAndProtectionMemberpfg:SubsegmentLifeInsuranceMember2023-07-012023-09-300001126328pfg:August2022AcceleratedShareRepurchaseProgramMemberus-gaap:CommonStockMember2022-09-012022-09-300001126328pfg:August2022AcceleratedShareRepurchaseProgramMemberus-gaap:CommonStockMember2022-08-012022-08-310001126328pfg:AcceleratedShareRepurchaseProgramMarch2022Memberus-gaap:CommonStockMember2022-06-012022-06-300001126328pfg:AcceleratedShareRepurchaseProgramMarch2022Memberus-gaap:CommonStockMember2022-03-012022-03-3100011263282023-10-012023-12-3100011263282023-06-3000011263282024-02-0200011263282023-01-012023-12-31xbrli:sharesiso4217:USDxbrli:pureiso4217:USDxbrli:sharespfg:contractpfg:itempfg:securitypfg:claim

Table of Contents

UNITED STATES
SECURITIES AND EXCHANGE COMMISSION

Washington, D.C. 20549

FORM 10-K

ANNUAL REPORT PURSUANT TO SECTION 13 OR 15(d) OF THE SECURITIES EXCHANGE ACT OF 1934

For the fiscal year ended December 31, 2023

OR

TRANSITION REPORT PURSUANT TO SECTION 13 OR 15(d) OF THE SECURITIES EXCHANGE ACT OF 1934

For the transition period from    to   

Commission file number 1-16725

PRINCIPAL FINANCIAL GROUP, INC.

(Exact name of Registrant as specified in its charter)

Delaware
(State or other jurisdiction of
incorporation or organization)

711 High Street,
Des Moines, Iowa 50392
(Address of principal executive offices)

42-1520346
(I.R.S. Employer
Identification Number)

(515) 247-5111
(Registrant’s telephone number, including area code)

Securities registered pursuant to Section 12(b) of the Act:

Title of each class
Common Stock, par value $0.01

Trading symbol(s)
PFG

Name of each exchange on which registered
Nasdaq Global Select Market

Indicate by check mark if the registrant is a well-known seasoned issuer, as defined in Rule 405 of the Securities Act. Yes No

Indicate by check mark if the registrant is not required to file reports pursuant to Section 13 or Section 15(d) of the Exchange Act. Yes  No

Indicate by check mark whether the Registrant (1) has filed all reports required to be filed by Section 13 or 15(d) of the Securities Exchange Act of 1934 during the preceding 12 months (or for such shorter period that the Registrant was required to file such reports) and (2) has been subject to such filing requirements for the past 90 days. Yes  No 

Indicate by check mark whether the registrant has submitted electronically every Interactive Data File required to be submitted pursuant to Rule 405 of Regulation S-T (§ 232.405 of this chapter) during the preceding 12 months (or for such shorter period that the registrant was required to submit such files). Yes  No 

Indicate by check mark whether the Registrant is a large accelerated filer, an accelerated filer, a non-accelerated filer, smaller reporting company or an emerging growth company. See the definitions of “large accelerated filer,” “accelerated filer,” “smaller reporting company” and “emerging growth company” in Rule 12b-2 of the Exchange Act.

Large accelerated filer

Accelerated filer

Non-accelerated filer

Smaller reporting company

Emerging growth company

If an emerging growth company, indicate by check mark if the registrant has elected not to use the extended transition period for complying with any new or revised financial accounting standards provided pursuant to Section 13(a) of the Exchange Act.

Indicate by check mark whether the registrant has filed a report on and attestation to its management’s assessment of the effectiveness of its internal control over financial reporting under Section 404(b) of the Sarbanes-Oxley Act (15 U.S.C. 7262(b)) by the registered public accounting firm that prepared or issued its audit report.

If securities are registered pursuant to Section 12(b) of the Act, indicate by check mark whether the financial statements of the registrant included in the filing reflect the correction of an error to previously issued financial statements.

Indicate by check mark whether any of those error corrections are restatements that required recovery analysis of incentive-based compensation received by any of the registrant’s executive officers during the relevant recovery period pursuant to §240.10D-1(b).

Indicate by check mark whether the registrant is a shell company (as defined in Rule 12b-2 of the Exchange Act.) Yes No

As of February 2, 2024, there were outstanding 235,868,487 shares of Common Stock, $0.01 par value per share of the Registrant.

The aggregate market value of the shares of the Registrant’s common equity held by non-affiliates of the Registrant was approximately $18.7 billion based on the closing price of $75.84 per share of Common Stock on June 30, 2023.

Documents Incorporated by Reference

The information required to be furnished pursuant to Part III of this Form 10-K is set forth in, and is hereby incorporated by reference herein from, the Registrant’s definitive proxy statement for the annual meeting of stockholders to be held on May 21, 2024, to be filed by the Registrant with the United States Securities and Exchange Commission pursuant to Regulation 14A not later than 120 days after the year ended December 31, 2023.

Table of Contents

PRINCIPAL FINANCIAL GROUP, INC.

TABLE OF CONTENTS

PART I


4

Item 1.

Business

4

Item 1A.

Risk Factors

20

Item 1B.

Unresolved Staff Comments

38

Item 1C.

Cybersecurity

38

Item 2.

Properties

39

Item 3.

Legal Proceedings

40

Information about our Executive Officers

40

PART II

41

Item 5.

Market for Registrant’s Common Equity, Related Stockholder Matters and Issuer Purchases of Equity Securities

41

Item 7.

Management’s Discussion and Analysis of Financial Condition and Results of Operations

42

Item 7A.

Quantitative and Qualitative Disclosures About Market Risk

77

Item 8.

Financial Statements and Supplementary Data

83

Report of Independent Registered Public Accounting Firm on Internal Control Over Financial Reporting

84

Report of Independent Registered Public Accounting Firm

85

Consolidated Statements of Financial Position

88

Consolidated Statements of Operations

89

Consolidated Statements of Comprehensive Income

90

Consolidated Statements of Stockholders’ Equity

91

Consolidated Statements of Cash Flows

92

Notes to Consolidated Financial Statements

93

Item 9.

Changes in and Disagreements with Accountants on Accounting and Financial Disclosure

247

Item 9A.

Controls and Procedures

247

Item 9B.

Other Information

247

PART III

248

Item 10.

Directors, Executive Officers and Corporate Governance

248

Item 11.

Executive Compensation

248

Item 12.

Security Ownership of Certain Beneficial Owners and Management and Related Stockholder Matters

248

Item 13.

Certain Relationships and Related Transactions, and Director Independence

249

Item 14.

Principal Accounting Fees and Services

249

PART IV

250

Item 15.

Exhibits and Financial Statement Schedules

250

Signatures

254

Schedule I — Summary of Investments — Other Than Investments in Related Parties

255

Schedule II — Condensed Financial Information of Registrant (Parent Only)

256

Schedule III — Supplementary Insurance Information

260

Schedule IV — Reinsurance

262

2

Table of Contents

NOTE CONCERNING FORWARD-LOOKING STATEMENTS

This Annual Report on Form 10-K, including the Management’s Discussion and Analysis of Financial Condition and Results of Operations, contains statements that constitute forward-looking statements within the meaning of the Private Securities Litigation Reform Act of 1995, including statements relating to trends in operations and financial results and the business and the products of the Registrant and its subsidiaries, as well as other statements including words such as “anticipate,” “believe,” “plan,” “estimate,” “expect,” “intend” and other similar expressions. Forward-looking statements are made based upon management’s current expectations and beliefs concerning future developments and their potential effects on us. Such forward-looking statements are not guarantees of future performance.

Actual results may differ materially from those included in the forward-looking statements as a result of risks and uncertainties. Those risks and uncertainties include, but are not limited to, the risk factors listed in Item 1A. “Risk Factors.”

3

Table of Contents

PART I

Item 1. Business

Principal Financial Group, Inc. (“PFG”) is a leader in global financial services offering businesses, individuals and institutional clients a wide range of financial products and services, including retirement, asset management and workplace benefits and protection solutions through our diverse family of financial services companies. We had $1,578.7 billion in assets under administration (“AUA”), including $694.5 billion in assets under management (“AUM”) as of December 31, 2023.

Our global asset management businesses serve a broad range of institutional, retirement, high net worth, and retail investors worldwide. Our focused investment teams provide diverse, long-term investment capabilities including equity, fixed income, real estate, and other alternative investments, as well as fund offerings. Our international asset management and accumulation businesses focus on the opportunities created as aging populations around the world drive increased demand for retirement accumulation, retirement asset management and retirement income management solutions.

In the U.S., we offer a broad array of retirement and employee benefit and insurance solutions to meet the needs of the business owner and their employees. We are a leading provider of defined contribution plans, nonqualified plans, defined benefit plans and pension risk transfer services. We are also a leading employee stock ownership plan (“ESOP”) consultant. In addition, we are one of the largest providers of specialty benefits and insurance solutions for business owners and their employees. We believe small and medium-sized businesses are an underserved market, offering attractive growth opportunities in the retirement and employee benefit markets.

Our Reportable Segments

We organize our businesses into the following reportable segments:

Retirement and Income Solutions;
Principal Asset Management and
Benefits and Protection.

We also have a Corporate segment, which consists of the assets and activities that have not been allocated to any other segment.

See Item 8. “Financial Statements and Supplementary Data, Notes to Consolidated Financial Statements, Note 20, Segment Information” for financial results of our segments.

Talcott Reinsurance Transaction

During 2022, we closed a coinsurance with funds withheld reinsurance transaction with Talcott Life &Annuity Re, Ltd. (“Talcott Life & Annuity Re”), a limited liability company organized under the laws of the Cayman Islands and an affiliate of Talcott Resolution Life, Inc., a subsidiary of Sixth Street, pursuant to which we ceded our in-force U.S. retail fixed annuity and universal life insurance with secondary guarantee (“ULSG”) blocks of business (the “Talcott Reinsurance Transaction”). See Item 8. “Financial Statements and Supplementary Data, Notes to Consolidated Financial Statements, Note 12, Reinsurance, for further details.

Retirement and Income Solutions Segment

Our asset accumulation activities in the U.S. date back to the 1940s when we first began providing pension plan products and services. We offer a comprehensive portfolio of products and services for retirement savings along with select products for retirement income:

To businesses of all sizes, we offer products and services for defined contribution plans, including 401(k) and 403(b) plans; defined benefit plans; nonqualified executive benefit plans; stock services, including ESOPs and equity compensation; and pension risk transfer services;
To large institutional clients, we also offer investment only products, including guaranteed investment contracts (“GICs”);
To employees of businesses and other individuals, we offer the ability to accumulate savings and provide an income stream for retirement and other purposes through mutual funds, individual variable annuities, registered index-linked annuities (“RILAs”) and bank products; and
To non-retirement businesses, we offer trust and custody services.

4

Table of Contents

Workplace Savings and Retirement Solutions (“WSRS”)

We offer a wide variety of investment and administrative products and services for defined contribution plans, including 401(k) and 403(b) plans; defined benefit plans; nonqualified executive benefit plans and stock services, including ESOPs and equity compensation.

Products

WSRS products respond to the needs of plan sponsors seeking both administrative and investment services for defined contribution plans or defined benefit plans. The investment component of both the defined contribution and defined benefit plans may be in the form of a guaranteed account, separate account, a mutual fund offering or a collective investment trust. In addition, defined contribution plan sponsors may also offer their own employer securities as an investment option under the plan.

We deliver both administrative and investment services to our defined contribution plan and defined benefit plan customers through annuity contracts, collective investment trusts and mutual funds. Group annuity contracts and collective investment trusts used to fund qualified plans are not required to be registered with the United States Securities and Exchange Commission (“SEC”). Our mutual fund service platform is called Principal Advantage. It is a qualified plan service package based on our series mutual fund, Principal Funds, Inc. (“PFI”). We offer investments covering the full range of stable value, equity, fixed income, real estate and international investment options managed by our Principal Asset Management segment as well as third party asset managers. In addition, WSRS offers plan sponsors trust services through an affiliated trust company.

As of December 31, 2023, we provided WSRS products to (a) over 40,000 defined contribution plans including $462.9 billion in assets and covering approximately 11.1 million eligible plan participants, and (b) to over 1,700 defined benefit plans, including $17.9 billion in assets and covering over 418,000 eligible plan participants. As of December 31, 2023, approximately 32% of our WSRS account values were managed by our Principal Asset Management segment, 63% were managed entirely by the third party asset managers that were not under contract to sub-advise a PFG product, 2% were sub-advised and 3% represented employer securities.

Markets and Distribution

We offer our WSRS products and services to plans, including qualified and nonqualified defined contribution plans and defined benefit plans. These products and services are offered to businesses of all sizes including plans sponsored by small and mid-sized businesses, which we believe remains underpenetrated, and large institutional clients. We distribute our WSRS products and services nationally, primarily through a captive retirement services sales force. As of December 31, 2023, 88 retirement services sales representatives in 14 offices, operating as a wholesale distribution network, maintained relationships with over 11,000 independent advisors, consultants and agents. Retirement services sales representatives are an integral part of the sales process alongside the referring consultant or independent advisor. We compensate retirement services sales representatives through a blend of salary and production-based incentives. We administer, on behalf of the plan, commission or fee payments to independent advisors, consultants and agents.

As of December 31, 2023, we had a staff of over 320 service and education specialists located across the U.S. These specialists play a key role in the ongoing servicing of plans by providing local services to our customers, such as reviewing plan performance, investment options and plan design; communicating the customers’ needs and feedback to us and helping employees understand the benefits of their plans. The following summarizes our distribution channels:

We distribute our annuity-based products through intermediaries who are primarily state licensed individuals.
Principal Advantage platform is targeted at defined contribution plans through broker-dealer distribution channels. Principal Advantage gives us access to Financial Industry Regulatory Authority (“FINRA”) registered distributors who are not traditional sellers of annuity-based products and broadens opportunities for us in the investment advisor and broker-dealer distribution channels.
Through our Retire Secure strategy we provide financial education and other assistance to individual investors who are participants/members of employer-based accumulation solutions to help them achieve financial security.

We believe our approach to WSRS plan services distribution, which gives us a targeted sales and service presence, along with our offering of PrincipalÒ Total Retirement Solutions differentiates us from many of our competitors. We have also established a number of marketing and distribution relationships to increase the sales of our products and services.

5

Table of Contents

Individual Variable Annuities and RILAs

Individual variable annuities and RILAs, which are savings vehicles through which the customer makes one or more deposits of varying amounts and intervals, are offered to individuals.

Products

Our individual variable deferred annuities provide customers with the flexibility to allocate their deposits to mutual funds managed by the Principal Asset Management segment or unaffiliated third party asset managers, with variable and guaranteed options. Generally speaking, the customers bear the investment risk for the variable options and have the right to allocate their assets among various separate mutual funds. The value of the annuity fluctuates in accordance with the experience of the mutual funds chosen by the customer. Customers have the option to allocate all or a portion of their account to our guaranteed option, in which case we credit interest at rates we determine, subject to contractual minimums. As of December 31, 2023, of our $9.4 billion variable annuity account balances invested in mutual funds, 91% was allocated to mutual funds managed by the Principal Asset Management segment and our guaranteed option. The remaining balance was allocated to mutual funds managed by unaffiliated third party asset managers.

Customers may elect a living benefit guarantee (commonly known in the industry as a guaranteed minimum withdrawal benefit, or “GMWB”). We bear the GMWB investment risk. Our goal is to hedge the GMWB investment risk through the use of sophisticated risk management techniques. As of December 31, 2023, $6.5 billion of the $9.3 billion of variable annuity separate account values had the GMWB rider. Our major source of revenue from individual variable annuities is mortality and expense fees we charge to the customer, generally determined as a percentage of the market value of the assets held in a separate investment sub-account. Account balances of variable annuity contracts with the GMWB rider were invested in separate account investment options as follows:


December 31, 2023


December 31, 2022


(in millions)

Balanced funds

$

6,272.4

$

5,995.7

Equity funds


140.1


123.7

Bond funds


59.0


61.0

Money market funds


12.6


12.0

Specialty funds


0.7


0.7

Total

$

6,484.8

$

6,193.1

Percent of total variable annuity separate account values


70

%  


71

%

In the second quarter of 2023, we began offering a new RILA, which provides policyholders with index-linked investment options and a fixed interest investment option, with different available term lengths. The index-linked investment options include protection against negative index performance through floor or buffer rates.

Markets and Distribution

Our target markets for individual variable annuities and RILAs include owners, executives and employees of small and medium-sized businesses and individuals seeking to accumulate and/or eventually receive distributions of assets for retirement. We market variable annuities and RILAs to individuals for both qualified and nonqualified retirement savings.

We sell our individual variable annuity products primarily through our affiliated financial representatives, including Principal Connection, who collectively accounted for 85%, 87% and 86% of annuity sales for the years ended December 31, 2023, 2022 and 2021, respectively. The remaining sales were made primarily through unaffiliated broker-dealer firms. Principal Connection is our direct distribution channel for retail financial services products to individuals. Principal Connection’s services are available by phone, email or mail.

Investment Only

Products

The two primary products for which we provide investment only services are GICs and funding agreements.

GICs and funding agreements pay a specified rate of return. The rate of return can be a floating rate based on an external market index or a fixed rate. Our investment only products contain provisions disallowing or limiting early surrenders, including penalties for early surrenders and minimum notice requirements.

6

Table of Contents

Deposits to investment only products are predominantly in the form of single payments. As a result, the level of new deposits can fluctuate from one fiscal quarter to another. The amounts earned by us are derived in part from the difference between the investment income earned by us and the amount credited to the customer. The Principal Asset Management segment manages the assets supporting the contractual promises.

Markets and Distribution

Funding agreements are issued directly to non-qualified institutions, the Federal Home Loan Bank of Des Moines (“FHLB Des Moines”) and unconsolidated special purpose entities. As part of our funding agreement-backed note programs, U.S. and foreign institutional investors purchase debt obligations from the special purpose entity which, in turn, purchases the funding agreement from us with terms similar to those of the debt obligations. The strength of this market is dependent on debt capital market conditions. As a result, our sales through this channel can vary widely from one quarter to another.

Pension Risk Transfer

Products

Pension risk transfer products respond primarily to the needs of pension plan sponsors in the form of single premium group annuities, which are immediate or deferred annuities that provide a current or future specific income amount, fully guaranteed by us. The majority of our business originates from defined benefit plans that are being terminated. In these situations, the plan sponsor transfers all its obligations under the plan to an insurer by paying a single premium. Generally, plan sponsors restrict their purchases to insurance companies with superior or excellent financial quality ratings because the Department of Labor (“DOL”) has mandated that annuities be purchased only from the “safest available” insurers.

Since premium received from pension risk transfer products is generally in the form of single payments, the level of premiums can fluctuate depending on the number of large-scale annuity sales in a particular quarter. The Principal Asset Management segment manages the assets supporting pension risk transfer account values.

Markets and Distribution

Our primary distribution channel for pension risk transfer products is comprised of several specialized home office sales consultants working through consultants and brokers that specialize in this type of business. Our sales consultants also make sales directly to institutions. Our nationally dispersed retirement services sales representatives act as a secondary distribution channel for these products.

Banking Services

Principal Bank is a U.S. federal savings bank that was formed in February 1998. As of December 31, 2023, Principal Bank had nearly 708,000 customers and approximately $8.2 billion in assets. Principal Bank operates under a limited purpose charter and may only accept deposits held in a fiduciary capacity; however, it may not hold demand deposits. It also may not own commercial loans or originate loans.

Products

Individual retirement accounts (“IRAs”) are provided by Principal Bank, primarily funded by retirement savings rolled over from qualified retirement plans. Principal Bank offers Federal Deposit Insurance Corporation (“FDIC”) insured cash solutions for customers in the form of savings accounts, money market accounts and certificates of deposit. The deposit products provide a relatively stable source of funding and liquidity for Principal Bank and are backed by purchases of investment securities and residential mortgage loans. In addition, Principal Bank serves as a trustee or custodian for institutional customers and facilitates cash sweep services for its affiliates and their customers through the Principal Deposit Sweep program.

Markets and Distribution

Principal Bank offers products and services primarily to participants rolling out of qualified retirement plans largely serviced by affiliates of PFG. Principal Bank services customers by telephone, mail and internet and offers digital advice services through its subsidiary, Principal Advised Services, LLC.

7

Table of Contents

Individual Fixed Annuities

In 2021, we ceased sales of individual fixed annuity products, and in 2022, we reinsured the block of business existing as of January 1, 2022, with Talcott Life & Annuity Re as part of the Talcott Reinsurance Transaction. Annuitizations from existing products occurring after this date are not reinsured.

Principal Asset Management Segment

Our Principal Asset Management segment provides global investment solutions to institutional, retirement, retail and high net worth investors in the U.S. and select emerging markets.

Principal Global Investors

Our Principal Global Investors operations manages assets for sophisticated investors around the world using focused investment teams that provide diverse investment capabilities including equity, fixed income, real estate and other alternative investments. We also have experience in asset allocation, stable value management and other structured investment strategies. We focus on providing services to our other segments in addition to our retail mutual fund and third party institutional clients. We maintain offices in Australia, Brazil, China, France, Germany, Hong Kong, Ireland, Italy, Japan, South Korea, Luxembourg, the Netherlands, Portugal, Singapore, Spain, Sweden, Switzerland, the United Arab Emirates, the United Kingdom and the United States.

We deliver our products and services through our network of focused investment teams including Principal Global Equities; Principal Global Fixed Income (including Finisterre emerging market debt teams); Aligned Investors; Principal Real Estate Investors, LLC; Principal Real Estate Europe Limited; Spectrum Asset Management, Inc.; Post Advisory Group, LLC; Principal Dynamic Growth; Edge Asset Management; Claritas Administração de Recursos Ltda. (“Claritas”); Origin Asset Management Limited Liability Partnership and Principal Asset Allocation. The Principal Global Investors focused investment teams managed $499.5 billion in assets as of December 31, 2023.

We have been providing mutual funds to customers since 1969. We offer mutual funds to individuals, businesses and institutional investors for use within variable life contracts, variable annuity contracts and employer-sponsored pension plans; as a rollover investment option and for general investment purposes. As of December 31, 2023, as reported by Morningstar, we ranked 19th in terms of U.S. mutual fund AUM and 40th in terms of exchange traded fund AUM.

We also maintain various other domestic and global fund platforms, separately managed accounts and segregated accounts for some larger institutional and retail investors.

Our products and services are provided for a fee as defined by client mandates. Our fees are generally driven by AUM.

Focused Investment Teams

Our focused investment team strategy is diversified across the following primary asset classes and service delivery options.

Equity Investments. As of December 31, 2023, Principal Global Equities, Aligned Investors and Principal Real Estate Investors, LLC along with Principal Dynamic Growth, Edge Asset Management, Origin Asset Management Limited Liability Partnership and Claritas managed $232.7 billion in global equity assets. Our equity capabilities encompass large-cap stocks, mid-cap stocks, small-cap stocks and real estate investment trusts in developed and emerging markets worldwide.

Fixed Income Investments. As of December 31, 2023, Principal Global Fixed Income and Principal Real Estate Investors, LLC along with Spectrum Asset Management, Inc. and Post Advisory Group, LLC managed $192.3 billion in global fixed income assets. Collectively, our experience in fixed income management spans multiple economic and credit market cycles and encompasses all major fixed income security types and sectors, including commercial mortgage-backed securities (“CMBS”). Our research and risk management capabilities in worldwide debt markets provide a strong foundation for broadly diversified “multi-sector” portfolios, tailored to specific client objectives.

Real Estate and Other Alternative Investments. We offer products and services through other alternative asset classes including managing private real estate equity through Principal Real Estate Investors, LLC and Principal Real Estate Europe Limited; managing commercial mortgages and bridge/mezzanine loans through Principal Real Estate Investors, LLC and managing real estate and timber investments through Claritas. As of December 31, 2023, we managed $74.5 billion in alternative asset classes.

Principal Asset Allocation. Principal Asset Allocation is a specialized asset allocation investment team offering multi-asset and/or multi-manager portfolio construction services that aim to deliver reliable, risk-adjusted investment outcomes to individual investors, institutional investors and participants in employer-sponsored plans.

8

Table of Contents

Products and Services

Products offered by the Principal Global Investors operations include individually managed accounts, separately managed accounts for high net worth individuals and several fund platforms for retail and institutional investors, as described below.

Principal Funds, Inc. PFI is a series mutual fund that offers investment options for defined contribution plans, individuals, institutional investors, adviser fee-based programs and other retirement plan clients. We report the results for this fund in the Retirement and Income Solutions segment or Principal Global Investors operations based on the distribution channel associated with the AUM.

Principal Variable Contracts Funds, Inc. Principal Variable Contracts Funds, Inc. is a series mutual fund that provides investment options for variable annuity and variable life insurance contracts issued by the Principal Life Insurance Company (“Principal Life”) and other insurance companies not affiliated with Principal Life. AUM backing our variable annuity contracts is reported in the Retirement and Income Solutions segment. AUM backing our variable life insurance contracts is reported in the Benefits and Protection segment.

Other Principal Global Investors Funds. Principal Global Investors maintains various fund platforms including Qualifying Investor Alternative Investment Fund and Undertaking for Collective Investment in Transferable Securities (“UCITS”) funds domiciled in Dublin, collective investment trusts, exchange traded funds and other focused investment team sponsored funds. These funds are generally managed by our focused investment teams.

Markets and Distribution

To effectively reach and cater to a diverse range of investors, we employ a multi-channel distribution strategy. Our Global Institutional Advisory Services and Global Wealth Advisory Services teams, relationship managers and client service professionals collaborate with consultants and directly interact with investors to acquire and retain institutional, retail and other investors. These teams are organized into three geographic groups: U.S./Europe clients, Asia Pacific/Middle East clients and Latin America clients. Additionally, we leverage partnerships with independent broker-dealers to further broaden our distribution reach. With a global presence spanning over 80 countries, we are committed to serving a wide range of clients with diverse investment needs.

Principal International

Principal International has operations in Latin America and Asia. We focus on locations with growing middle classes and affluent segments, favorable demographics and increasing long-term savings, ideally with defined contribution retirement markets. We also focus on markets with relevant size where we have competitive advantages. We entered these locations through acquisitions, start-up operations and joint ventures.

The activities of our Principal International operations reflect our efforts to provide long-term savings and retirement solutions to individuals in the locations in which we operate as well as asset management services for institutional clients. We offer pension accumulation products and services, mutual funds, asset management, income annuities and life insurance accumulation products.

Markets, Products and Distribution

Latin America

Brazil. We offer pension accumulation, income annuity, and life insurance accumulation products through a co-managed joint venture, Brasilprev Seguros e Previdencia S.A. (“Brasilprev”). We owned 25.005% of the economic interest and 50.01% of the voting shares as of December 31, 2023. The partner is Banco do Brasil (“Banco”), which had 3,984 Brazilian branches as of September 30, 2023.

Brasilprev has the exclusive distribution rights of its pension accumulation and income annuity products through the Banco network until October 2032. Our joint venture provides products for the retirement needs of individuals and employers. Banco’s employees sell these products directly to individual clients through its bank branches and digital channels. In addition, our joint venture reaches corporate clients through two wholesale distribution channels: (1) a network of independent brokers who sell to the public and (2) Banco’s corporate account executives who sell to existing and prospective corporate clients. As of December 31, 2023, Brasilprev had $82.4 billion of AUM.

We also distribute pension and other protection products through a digital insurance brokerage company, Ciclic Corretora de Seguros S.A. (“Ciclic”). Our partner is BB Corretora De Seguros e Administradora De Bens S.A. (a subsidiary of Banco). We owned 25.005% of the economic and 50.01% of the voting shares of Ciclic as of December 31, 2023.

9

Table of Contents

Chile. We offer a complete array of pension accumulation and income annuity solutions. We also offer mutual fund, asset management services and life insurance accumulation products. Our subsidiaries in Chile had $42.3 billion of AUM as of December 31, 2023.

We offer mandatory employee-funded pension and voluntary savings plans through Administradora de Fondos de Pensiones Cuprum S.A. (“Cuprum”). We owned 97.97% of Cuprum as of December 31, 2023, and the rest is publicly floated. Cuprum’s products are sold through digital means and via a proprietary sales network of approximately 800 sales employees as of December 31, 2023.

We offer income annuity and life insurance accumulation solutions through Principal Compañía de Seguros de Vida Chile S.A., our wholly owned life insurance company. The annuity products are distributed directly by our sales teams and through a network of brokers and independent agents. Life insurance accumulation products are offered to individuals through brokers and financial advisors and through digital means.

We offer voluntary savings plans, mutual funds, and asset management solutions through Principal Administradora General de Fondos S.A., our wholly owned mutual fund company. Products are distributed to retail and institutional clients through digital means (we launched an open architecture service platform that provides support to financial advisors) as well as through our proprietary sales force, financial advisors, brokerage houses and alliances with financial institutions.

Mexico. We offer pension accumulation, mutual funds and asset management services through our wholly owned companies with $22.0 billion of AUM as of December 31, 2023.

We offer mandatory and voluntary pension plans through Principal Afore, S.A. de C.V., Principal Grupo Financiero. We manage and administer individual retirement accounts under the mandatory privatized social security system for formal employees in Mexico. As of December 31, 2023, we had approximately 2.6 million individual retirement accounts. We distribute products and services through a proprietary sales force of approximately 294 sales representatives as of December 31, 2023, as well as independent brokers who sell directly to individuals.

We offer mutual funds and asset management services through Principal Fondos de Inversión, S.A. de C.V., Operadora de Fondos de Inversión, Principal Grupo Financiero. We distribute products and services through a sales force of approximately 34 employees as of December 31, 2023, and through distribution agreements with other financial entities. We offer both domestic and international products, typically sold directly to institutional and retail clients. We work in close collaboration with our Principal Global Investors operations for both international products and for the institutional segment.

Asia

China. We offer mutual funds and asset management services to individuals and institutions through a joint venture, CCB Principal Asset Management Co., Ltd. (“CCB PAM”). We owned 25% of CCB PAM as of December 31, 2023. China Construction Bank (“CCB”) is the majority partner with 65% ownership. China Huadian Capital Holdings owns 10%. CCB PAM distributes its mutual funds through CCB and third-party distributors such as banks, securities brokers and e-channels. CCB provides widespread distribution support for the joint venture via its extensive network of approximately 14,400 bank branches as of December 31, 2022, and brand awareness activities. Although not included in our reported AUM, CCB PAM had $151.2 billion of AUM as of December 31, 2023.

We offer entrust, account services and investment management for individual and group retirement security products through a joint venture, CCB Pension Management Co., Ltd. (“CCBP”). We owned 17.647% of CCBP as of December 31, 2023. China Construction Bank is the majority partner with 70% ownership. The Social Security Fund of China owns 12.353%. Although not included in our reported AUM, CCBP had $77.5 billion of AUM as of December 31, 2023.

Hong Kong Special Administrative Region.We offer both pension saving and mutual fund products to corporate and individual clients through wholly owned companies with $10.9 billion in AUM as of December 31, 2023.

We offer two types of pension saving schemes, Mandatory Provident Fund and Occupational Retirement Schemes Ordinance, which we distribute through third party intermediaries such as insurance companies, independent financial advisors, brokers, and employee benefit consultants. Our most significant partnership is with AXA Hong Kong with whom we have a 15-year distribution partnership through 2030. We serviced approximately 655,000 accounts as of December 31, 2023. To help Hong Kong customers save for retirement beyond the mandatory pension schemes, Principal also offers mutual funds to retail customers through third party intermediaries, the most significant being banks.

10

Table of Contents

Southeast Asia. We offer mutual funds, asset management services and retirement solutions through our joint ventures in Malaysia, Principal Asset Management Berhad (“PAM”) and Principal Islamic Asset Management Sdn. Bhd. (“PIAM”). The partner is CIMB Group (“CIMB”), a leading ASEAN universal bank that has strong presence in the region. The joint ventures had $22.4 billion of AUM as of December 31, 2023.

PAM offers conventional and Islamic mutual funds, retirement solutions through the branches of CIMB (approximately 600 bank branches throughout ASEAN and beyond as of September 30, 2023) and through its agency sales force of 1,950 agents selling to retail customers as of December 31, 2023. PAM also distributes its mutual funds and retirement solutions through third party institutions including banks, security houses and digital platforms such as digital wallet and online marketplaces. PAM has subsidiaries in Singapore (Principal Asset Management (S) Pte. Ltd.), Indonesia (PT Principal Asset Management) and Thailand (Principal Asset Management Company Limited).

PIAM offers Islamic asset management services to clients across Southeast Asia and the Middle East. PIAM also offers Islamic mutual funds in Southeast Asia, the Middle East and Europe via Principal Global Investors’ UCITS platform in Dublin.

Benefits and Protection Segment

Our Benefits and Protection segment activities date back to 1879 when we first began selling individual life insurance products. We expanded our offering to include group insurance products in the 1940s and have continued to expand our product portfolio over time. We are uniquely positioned to protect businesses through our broad set of solutions, our expertise and the experiences we offer.

We protect their employees by offering a comprehensive set of employee benefits that helps recruit and retain talent including nonqualified deferred compensation, employer paid and voluntary group benefits, and guaranteed standard issue life and individual disability insurance.
We protect their business in the event of a death, disability or resignation of a key employee or future change in management through business owner solutions and disability solutions.
We protect business owners and their personal needs by helping maintain their lifestyle through life or disability insurance and building and protecting their retirement savings.

We organize our operations into two divisions: Specialty Benefits and Life Insurance. However, we share key resources in our core areas such as strategic leadership, distribution, operations and marketing.

Specialty Benefits

Specialty Benefits, which includes group dental, vision, life, critical illness, accident, hospital indemnity, paid family and medical leave (“PFML”), disability insurance and individual disability insurance, is an important component of the employee benefit offering primarily at small and medium-sized businesses.

Products and Services

Group Dental and Vision Insurance. Our plans provide partial reimbursement for dental and vision expenses. As of December 31, 2023, we had over 117,000 group dental and vision insurance policies in force covering over 2.9 million employees. According to Life Insurance and Market Research Association (“LIMRA”), we were the 4th largest group dental insurer in terms of number of contracts/employer groups in force in 2022. In addition to indemnity and preferred provider organization dental offered on both an employer paid and voluntary basis, we offer a prepaid dental plan in Arizona through our Employers Dental Services, Inc. subsidiary. We also offer a discount dental product nationally. Our indemnity vision and our managed care vision products are offered on both an employer paid and voluntary basis.

Group Life and Other Insurance. Our group life insurance provides coverage to employees and their dependents for a specified period. As of December 31, 2023, we had over 95,000 group policies providing nearly $178 billion of group life insurance in force covering approximately 3.0 million employee lives. According to LIMRA, in 2022, we were ranked 1st in the U.S. in terms of the number of group life insurance contracts in force. We currently sell traditional group life insurance that does not provide for accumulation of cash values on both an employer paid and voluntary basis. Our group life insurance business remains focused on the traditional, annually renewable term product. Group term life and group universal life accounted for 99% and 1%, respectively, of our total group life insurance in force as of December 31, 2023. We no longer market group universal life insurance to new employer groups.

11

Table of Contents

Group Disability Insurance. Our group disability insurance provides a benefit to insured employees who become disabled. In most instances, this benefit is in the form of a monthly income. Our group disability products include both short-term and long-term disability, offered on both an employer paid and voluntary basis. As of December 31, 2023, long-term disability represented 59% of total group disability premium, while short-term disability represented 41% of total group disability premium. We also provide disability management services, called rehabilitation services, to assist individuals in returning to work as quickly as possible following disability. We work with disability claimants to improve the approval rate of Social Security benefits, thereby reducing payment of benefits by the amount of Social Security payments received. As of December 31, 2023, we served approximately 2.2 million employee lives through over 67,000 contracts. According to LIMRA, our group short-term disability business was ranked 4th and our group long-term disability business was ranked 3rd in the U.S. as of December 31, 2022, in terms of number of contracts/employer groups in force. We also offer voluntary critical illness insurance, which provides a lump-sum benefit to pay for additional expenses associated with common critical illnesses; voluntary accident insurance, which pays a lump sum benefit when covered injuries occur because of an accident; and hospital indemnity insurance, which provides a lump sum benefit associated with hospitalization. In 2021, we began selling PFML on a limited basis, which provides paid time off to care for specified family needs or an employee’s own serious health condition. As of December 31, 2023, we have sold PFML in three states. We plan to expand to other states in the future.

Individual Disability Insurance. Individual disability insurance has been sold since the early 1950s. Our individual disability insurance products provide income protection to the insured member and/or business in the event of disability. In most instances, this benefit is in the form of a monthly income. In addition to income replacement, we offer products to pay business-related costs such as overhead expenses for a disabled business owner, buy-out costs for business owners purchasing a disabled owner’s interest in the business, expenditures for replacement of a key person and business loan payments. We also offer a product to protect retirement savings in the event of disability. As of December 31, 2023, we served approximately 220,000 individual disability policyholders. According to LIMRA, our individual disability business was ranked 4th in the U.S. in terms of premium in force in the non-cancellable segment of the market and 4th overall, as of December 31, 2022.

Fee-for-Service. We offer administration of group dental, disability and vision benefits on a fee-for-service basis.

Life Insurance

We specialize in providing solutions primarily for small to medium-sized businesses to protect against risk and loss, assist with succession planning and wealth transfer and to build and protect wealth for retirement. We also provide solutions to meet the personal needs of business owners, executives and key employees. As of September 30, 2021, we narrowed our focus to the business market and ceased sales to the retail consumer market. In 2022, we reinsured our ULSG block of business with Talcott Life & Annuity Re as part of the Talcott Reinsurance Transaction. Our U.S. operations administered approximately 722,000 individual life insurance policies with over $539.0 billion of individual life insurance in force as of December 31, 2023.

Products and Services

Our Business Owner Solutions platform as well as our nonqualified deferred compensation offering combines administration and consulting to service our clients’ needs. We focus on the business and personal insurance needs of owners, executives and key employees primarily of small and medium-sized businesses with an emphasis on providing insurance solutions for nonqualified executive benefits. We no longer market our products to retail customers. We offer a variety of individual life insurance products, both interest sensitive (including universal life, variable universal life and indexed universal life insurance) and traditional.

Interest Sensitive. Interest sensitive includes universal life (“UL”), variable universal life and indexed universal life insurance products; however, we no longer market universal life insurance with lifetime secondary guarantee provisions. These products offer the policyholder the option of adjusting both the premium and the death benefit amounts of the insurance contract. Universal life insurance typically includes a cash value account that accumulates at a credited interest rate based on the investment returns of the block of business. Variable universal life insurance is credited with the investment returns of the various investment options selected by the policyholder. Indexed universal life is credited with investment returns tied to an external index, subject to a contractual minimum and maximum. For the year ended December 31, 2023, interest sensitive products represented 18% of individual life insurance in force and generated 75% of individual life insurance annualized first year premium sales.

12

Table of Contents

After a deduction for policy level expenses, we credit net deposits to an account maintained for the policyholder. For universal life contracts, the entire account balance is invested in the general account. Interest is credited to the policyholder’s account based on the earnings on general account investments, subject to contractual minimums. For variable universal life contracts, the policyholder may allocate the account balance among our general account and a variety of separate accounts underlying the contract. Interest is credited on amounts allocated to the general account in the same manner as for universal life. Net investment performance on separate accounts is allocated directly to the policyholder accounts; the policyholder bears the investment risk. For indexed universal life, the policyholder may allocate the account balance among our general account and two index accounts. Interest is credited on amounts allocated to the general account in the same manner as for universal life. Net investment performance on the index accounts is allocated directly to the policyholder accounts, subject to the contractual minimum and maximum. Some of our interest sensitive contracts contain what are commonly referred to as “secondary” or “no-lapse” guarantee provisions. These no-lapse guarantees keep the contract in force, even if the policyholder’s account balance is insufficient to cover all of the contract charges, provided that the policyholder has continually paid a specified minimum premium.

Traditional Life Insurance. Traditional life insurance includes term, whole and adjustable life insurance products; however, we no longer market whole and adjustable life insurance products. Term insurance products provide a guaranteed death benefit for a specified period of time in return for the payment of a fixed premium. Term life insurance products represented 80% of individual life insurance in force as of December 31, 2023, and 25% of our individual life insurance annualized first year premium sales for the year ended December 31, 2023. Whole life policies provide a guaranteed death benefit and a cash surrender value in return for payment of fixed premiums. Adjustable life insurance products provide a guaranteed benefit in return for the payment of a fixed premium while allowing the policyholder to set the coverage period, premium and face amount combination.

Benefits and Protection Markets and Distribution

For each of our products, administration and distribution channels are customized to meet customer needs and expectations for that product.

We market our group insurance products primarily to small and medium-sized businesses, through brokers and consultants. We sell our group insurance products in all 50 states and the District of Columbia. We continually adapt our products and pricing to meet local market conditions and to comply with state and federal legislation. We market our fee-for-service capabilities to employers that self-insure their employees’ dental, disability and vision benefits. We market our fee-for-service businesses in all 50 states and the District of Columbia.

The group insurance market continues to see a shift to voluntary/worksite products due to various pressures on employers. In keeping with this market change, which shifts the funding of such products from the employer to the employee, we continue to place an enhanced focus on our voluntary benefits platform. We believe the voluntary/worksite market presents growth opportunities and we will continue to develop strategies to capitalize on this expanding market.

As of December 31, 2023, we had 141 sales representatives and 176 service representatives in 26 local markets. Our sales representatives accounted for 100% of our group insurance sales for the year ended December 31, 2023. The service representatives play a key role in servicing the case by providing local, responsive services to our customers and their brokers, such as renewing contracts, revising plans, solving administrative issues and communicating the customers’ needs and feedback to us.

We sell our individual life and individual disability insurance products in all 50 states and the District of Columbia, primarily targeting owners, executives and key employees of small and medium-sized businesses. In 2023, small and medium-sized business sales represented 100% of individual life sales and 70% of individual disability sales for the year ended December 31, 2023. Our life insurance sales efforts focus on the Nonqualified Deferred Compensation and the Business Solutions market. This strategy offers solutions to address business owner financial challenges such as exiting the business, business transition, retaining key employees and retirement planning. Key employees also have needs to supplement retirement income, survivor income and business protection. We believe the Business Owner Solutions segment offers growth opportunities and we will continue to develop strategies to capitalize on this expanding market.

We distribute our individual life and individual disability insurance products through our affiliated financial representatives and independent brokers, as well as other marketing and distribution alliances. To meet the needs of the various marketing channels, particularly the independent brokers, we employ wholesale distributors — Regional Vice Presidents for nonqualified, business solutions and individual disability.

13

Table of Contents

Corporate Segment

Our Corporate segment manages the assets representing capital that has not been allocated to any other segment. Financial results of the Corporate segment primarily reflect our financing activities (including financing costs), income on capital not allocated to other segments, inter-segment eliminations, income tax risks and certain income, expenses and other adjustments not allocated to the segments based on the nature of such items. Results of Principal Securities, Inc., our retail broker-dealer and registered investment advisor, and our exited group medical and long-term care insurance businesses are reported in this segment.

Competition

Competition is based on several factors including customer segments, product types and features, external peer comparisons, go-to-market strategies, compensation structure, price, performance, capital markets, capital liquidity and financial strength ratings. We compete with many financial services companies, such as banks, mutual funds, institutional trust companies, broker-dealers, insurers, recordkeepers, asset managers and wealth managers. Some of these companies may offer a broader array of products, more competitive pricing, greater diversity of distribution sources, better brand recognition or, with respect to insurers, higher financial strength ratings. Some may have greater financial resources with which to compete or have better investment performance at various times. We distinguish ourselves from our competitors through three positional advantages:

our favored customer access through valuable distribution relationships;
our ability to integrate solutions and services; and
our focus on high growth markets.

Ratings

Insurance companies are assigned financial strength ratings by rating agencies based upon factors relevant to policyholders. Financial strength ratings are generally defined as opinions as to an insurer’s financial strength and ability to meet ongoing obligations to policyholders. Information about ratings provides both industry participants and insurance consumers meaningful insights on specific insurance companies. Higher ratings generally indicate financial stability and a stronger ability to pay claims.

Principal Life and Principal National Life Insurance Company (“PNLIC”) have been assigned the following insurer financial strength ratings:

Rating Agency


Financial Strength Rating


Rating Structure


A.M. Best Company, Inc.

A+ (“Superior”) with a stable outlook

Second highest of 13 rating levels

Fitch Ratings Ltd.

AA− (“Very Strong”) with a stable outlook

Fourth highest of 19 rating levels

Moody’s Investors Service

A1 (“Good”) with a stable outlook

Fifth highest of 21 rating levels

S&P Global Ratings

A+ (“Strong”) with a stable outlook

Fifth highest of 20 rating levels

A.M. Best Company, Inc. (“A.M. Best”) ratings for insurance companies range from “A++” to “S”. A.M. Best indicates that “A++” and “A+” ratings are assigned to those companies that in A.M. Best’s opinion have superior ability to meet ongoing insurance obligations. Fitch Ratings Ltd. (“Fitch”) ratings for insurance companies range from “AAA” to “C”. Fitch “AA” ratings indicate very strong capacity to meet policyholder and contract obligations. Moody’s Investors Service (“Moody’s”) ratings for insurance companies range from “Aaa” to “C”. Moody’s indicates that “A” ratings are assigned to those companies that offer good financial security. S&P Global Ratings (“S&P”) has ratings that range from “AAA” to “D” for insurance companies. S&P indicates that “A” ratings are assigned to those companies that have strong financial security characteristics. In evaluating a company’s financial and operating performance, these rating agencies review its profitability, leverage and liquidity, as well as its book of business, the adequacy and soundness of its reinsurance, the quality and estimated market value of its assets, the adequacy of its policy reserves, the soundness of its risk management programs, the experience and competency of its management and other factors.

We believe our strong ratings are an important factor in marketing our products to our distributors and customers, as ratings information is broadly disseminated and generally used throughout the industry. Our ratings reflect each rating agency’s opinion of our financial strength, operating performance and ability to meet our obligations to policyholders and are not evaluations directed toward the protection of investors. Such ratings are neither a rating of securities nor a recommendation to buy, hold or sell any security, including our common stock. For more information on ratings, see Item 7. “Management’s Discussion and Analysis of Financial Condition and Results of Operations – Liquidity and Capital Resources – Financial Strength and Credit Ratings.”

14

Table of Contents

Regulation

Our businesses are subject to regulation and supervision by U.S. federal, state and broker dealer regulatory authorities as well as non-U.S. regulatory authorities for our operations and customers outside the U.S. Our businesses are also subject to U.S. federal, state and local tax laws as well as tax laws for jurisdictions outside the U.S. As we continue to expand our global footprint, we are subject to laws and regulations of jurisdictions where we register and sell products, even if we do not have a physical operating presence.

PFG, our parent holding company, is not licensed as an insurer, investment advisor, broker-dealer, bank or other regulated entity. However, because it is the holding company for our collective operations, it is subject to regulation in connection with our regulated entities, including as an insurance holding company. We are subject to legal and regulatory requirements applicable to public companies, including public reporting and disclosure, securities trading, accounting and financial reporting and corporate governance.

U.S. Insurance Laws and Regulations

We are subject to the insurance holding company laws in the states where our insurance companies are domiciled. Principal Life and PNLIC are domiciled in Iowa and their principal insurance regulatory authority is the Insurance Division of the Department of Commerce of the State of Iowa. Our other U.S. insurance companies are principally regulated by the insurance departments of the states in which they are domiciled. These laws generally require each insurance company directly or indirectly owned by the holding company to register with the insurance department in the insurance company’s state of domicile and to furnish financial and other information about the operations of the companies within the holding company system. Transactions affecting the insurers in the holding company system must be fair and at arm’s length. Most states have insurance laws that require regulatory approval of a direct or indirect change in control of an insurer or an insurer’s holding company and laws that require prior notification to state insurance departments of a change in control of a non-domiciliary insurance company doing business in that state.

Annually, our U.S. insurance companies must submit an opinion from a board-appointed qualified actuary to state insurance regulators, where licensed, on whether the statutory assets backing statutory reserves are sufficient to meet contractual obligations and related expenses of the insurer. If such an opinion cannot be rendered noting the sufficiency of assets, the insurance company must set up additional statutory reserves drawing from available statutory surplus until such an opinion can be given.

State insurance departments have broad administrative powers over the insurance business, including insurance company licensing and examination, agent licensing, establishment of reserve requirements and solvency standards, premium rate regulation, admittance of assets to statutory surplus, policy form approval, unfair trade and claims practices regulation and other matters. State insurance statutes also typically place restrictions and limitations on the amount of dividends or other distributions payable by insurance company subsidiaries to their parent companies. See Item 7. “Management’s Discussion and Analysis of Financial Condition and Results of Operations — Liquidity and Capital Resources” for further details.

In order to enhance the regulation of insurer solvency, the National Association of Insurance Commissioners (“NAIC”) has established risk-based capital (“RBC”) standards. The standards require life insurers to submit a report to state regulators on an annual basis regarding their RBC based upon categories of risk including the following: asset risk, insurance risk, interest rate risk and business and operational risk. As of December 31, 2023, the statutory surplus of each of our U.S. life insurance companies exceeded the minimum RBC requirements.

The following authorities regularly make inquiries and conduct examinations or investigations regarding our compliance with applicable laws and regulations:

state and federal insurance regulatory authorities;
state and federal securities regulatory authorities;
federal agencies, such as the DOL;
state law enforcement agencies and
state attorneys general.

Each state has insurance guaranty association laws under which insurers doing business in a state can be assessed, up to prescribed limits, in order to cover contractual benefit obligations of insolvent insurance companies. The guaranty associations levy assessments on each member insurer in a jurisdiction on the basis of the proportionate share of the premiums written by such insurer in the lines of business in which the insolvent insurer is engaged. Some jurisdictions permit the member insurers to recover the assessments paid through full or partial premium tax offsets.

15

Table of Contents

U.S. Executive Orders

The President of the United States manages the operations of the Executive branch of Government through Executive orders. As a U.S.-based business, we are subject to certain Executive orders that could affect our business, operations, regional footprint, risk management strategies and investments and increase our costs of compliance.

Securities Regulation

Insurance and investment products that require registration with the SEC, such as variable annuities, RILA, variable life insurance and some funding agreements that constitute securities and mutual fund products are subject to securities laws and regulations, including U.S. state securities regulation as well as U.S. federal regulation under the SEC, FINRA and other regulatory authorities. These regulations affect investment advice, sales and related activities for these products and the compliance oversight construct.

We also have entities that are registered as investment advisers with the SEC under, and are therefore subject to, the Investment Advisers Act of 1940.

Employee Retirement Income Security Act

As we provide products and services for U.S. and Puerto Rico employee benefit plans, we are subject to regulation under the Employee Retirement Income Security Act (“ERISA”). ERISA provisions include reporting and disclosure requirements and standards of conduct.

Banking Regulation

Principal Bank, a wholly owned subsidiary, is a U.S. federal savings bank regulated by the Office of the Comptroller of the Currency. Principal Bank’s depositors are insured by the FDIC up to specified limits, making Principal Bank subject to certain of the FDIC’s regulations.

Trust Regulation

Delaware Charter Guarantee & Trust Company conducting business as Principal Trust Company, a wholly owned subsidiary, is a Delaware state chartered trust company regulated by the State of Delaware Office of the State Bank Commissioner. Principal Trust Company is subject to Delaware banking and trust law.

Principal Global Investors Trust Company, a wholly owned subsidiary, is an Oregon state registered banking corporation with trust powers regulated by the State of Oregon Division of Financial Regulations. Principal Global Investors Trust Company is subject to Oregon banking regulations.

Environmental Regulation

As we own and operate real property, we are subject to U.S. federal, state and local environmental laws, as well as international environmental laws and could be subject to environmental liabilities and costs associated with required remediation of our properties. We routinely have environmental assessments performed for real estate being acquired or used as collateral for commercial mortgages we use for investment.

Regulation of International Businesses

Our international businesses are supervised by regulatory authorities in the jurisdictions in which they operate, including regulation and supervision by insurance, securities, tax and privacy regulatory authorities. The purpose of these regulations is similar to the U.S., to protect our customers and the overall financial system. Regulations such as the revised Markets in Financial Instruments Directive, local sanctions directives and the European Union (“EU”) General Data Protection Regulation (“GDPR”) have a global impact on our businesses.

16

Table of Contents

Risk Management

Like all financial services companies, we are exposed to a wide variety of financial, operational and other risks, as described in Item 1A. “Risk Factors.” We have formalized our enterprise risk management approach to enable us to have the right people, culture, tools, knowledge, information, processes and controls in place to effectively identify, measure, monitor, communicate and manage risks within established limits and risk tolerances. Enterprise Risk Management is a key component of our business model at Principal. It helps us:

Identify and successfully manage those risks that present profitable growth opportunities and avoid those that don’t.
Balance the sometimes-competing demands of our various constituencies; meet our customer obligations, satisfy regulatory requirements and optimize shareholder returns relative to the risks we take.

We utilize an integrated risk management framework to help us identify, assess, monitor, report, manage and aggregate our material risks within established risk appetites and risk tolerances. The framework delivers important perspective that is used in strategic and tactical decision making and is adaptable to changes in our businesses and in the external environments in which we operate. Our approach also requires a commitment to continuous improvement and ongoing validation.

Our governance structure includes Board of Directors (“Board”) oversight, internal risk committees, an enterprise risk management function and embedded risk professionals in our business units and functional areas. The Board and its committees, which include Audit Committee, Finance Committee, Human Resources Committee and Nominating and Governance Committee, provide oversight no less frequently than quarterly, addressing relevant aspects of our risk profile.

Our internal risk committees meet on a regular and frequent basis to discuss various issues and review profile status. Each business unit has its own committee that is responsible for oversight of the material risks within the unit or area. These committees may include corporate leaders. We also have internal committees that provide oversight around a certain risk or group of related risks across the organization. This matrix approach helps us maintain comprehensive risk coverage and preserve an integrated view of risks. The Enterprise Risk Management Committee, comprised of members from the Executive Management Group (“EMG”), exercises enterprise-wide oversight for our most significant risk profiles.

The business units and functional areas have primary responsibility for identifying, assessing, monitoring, reporting and managing their own risks. Our Chief Enterprise Risk Management Officer and supporting staff (independent of the business units) work closely with the dedicated risk professionals in the business units to provide objective oversight, framework enablement and aggregated risk analysis. This results in a model where risk management can be closer to actual risks while also facilitating effective oversight and consolidation at the enterprise level.

Internal Audit provides independent, risk-based and objective assurance and advice designed to add value and improve our operations. It helps us accomplish our objectives by bringing a systematic, disciplined approach to evaluate and improve the effectiveness of risk management, internal control and governance processes; and by promoting continuous improvement. The Chief Internal Auditor reports functionally to the Board Audit Committee and administratively to our Chief Risk Officer.

Risk appetites, tolerances and limits have been established from an enterprise-wide and business unit perspective for specific risk categories, where appropriate. We monitor a variety of risk metrics on an ongoing basis and take the appropriate steps to manage our established risk appetites and tolerances. Quarterly risk reporting provides a feedback loop between business units, functional areas, our internal risk committees and the enterprise risk management function. This reporting also includes perspectives on emerging risk. To the extent potentially significant business activities or operational initiatives are considered, analysis of the possible impact on our risk profile takes place. This analysis includes, but is not limited to, the capital implications; the impact on near term and long-term earnings; the ability to meet our targets with respect to return on equity, liquidity, debt/capital, cash coverage, business risk and operational risk; and the impact to our reputation.

Human Capital

As of December 31, 2023, we employed approximately 19,800 people across the globe. Our employees work from many locations across multiple businesses and are united behind a common purpose: to help more people and businesses around the globe gain greater access to financial security. We start by listening to our customers to understand their needs, goals and barriers. From there, we leverage our global expertise to provide the guidance, products and experiences to create opportunities for more people to save, invest and protect their financial futures. Our purpose serves as a foundation for attracting, retaining and developing a workforce motivated by quality employment and purposeful work.

17

Table of Contents

In 2023, our commitment to enabling high performing teams remained strong. We continued to attract, retain and develop the top talent needed to deliver on our enterprise strategy. Our talent initiatives focus on fostering a community that cares, enabling a tailored approach to life and work, providing meaningful work and granting access to boundless opportunities across the enterprise. Because of the employee value proposition offered, we are confident in our ability to build teams with the diverse, global talent necessary to succeed.

We invest in the development of our employees in a variety of ways, including through experiential learning, growth assignments, relationships with colleagues, formal programming and just-in-time resources. We have an enterprise learning platform that allows us to curate learning content that aligns with enterprise priorities to ensure employees have the skills necessary to contribute to our success now and into the future. These investments also make certain that our employees can develop the skills most critical to their current and future career aspirations. We continue to pilot new programs, such as our Career Development Network, that create the space for employees to learn new skills and navigate their career. Additional targeted development opportunities exist for leaders and employees identified as high potential talent.

We know a diverse workforce and inclusive culture make us stronger and remain committed to providing a work environment where every employee feels welcomed, respected and has an opportunity to thrive. We are committed to providing our leaders across the globe with regular implicit bias and inclusive leadership training, with the goal of establishing better-connected teams and enabling thoughtful decision-making. As of December 31, 2023, we had eight employee resource groups (“ERGs”), comprised of employees motivated to listen, reflect and provide cultural insights. Our ERGs play an integral role in creating an inclusive workplace. In 2023, our global mentoring program entered its fourth year, enabling colleagues from around the world to build relationships, encourage and educate each other. In addition, we held our second Global Inclusion Summit, at which senior executives and employees hosted sessions on a variety of inclusion-related topics.

Internally, we measure the progress of our diversity, equity and inclusion efforts in multiple ways, including through our U.S. Diversity Index comprised of predominantly objective metrics across our U.S. workforce. We also survey employees about their sense of belonging and report the results through our Global People Inclusion Index. The results of our U.S. Diversity Index and Global People Inclusion Index help us to measure company-wide performance. On an annual basis we partner with an external consultant to conduct a global pay equity study; we believe the results of this study place us in a best-in-class category as compared to financial services industry peers.

In 2023, we also continued to receive external recognition. We were included by Forbes in its lists of Best Employers for Women (July 2023) and Best Employers for Diversity (April 2023). We earned a perfect score on the Disability: IN Disability Equality Index (July 2023) and 90% on the Human Rights Campaign Foundation’s 2023 Corporate Equality Index (November 2023), the latter of which resulted in the designation of a Best Place to Work for LGBTQ+ Equality. In addition, we participated in the Bloomberg Gender Equality Index, which resulted in recognition on the national Diversity MBA Media’s list “50 Out Front; Best Places to Work for Women and Diverse Managers.” On top of these inclusion-focused accolades, we have recently been recognized as one of Newsweek’s America’s Greatest Workplaces (July 2023), by IDG’s Computerworld as one of its 100 Best Places to Work in IT (November 2023), and by Pensions & Investments as one of the Best Places to Work in Money Management (December 2023).

We continuously strive to evolve our human capital policies and processes. To better understand and improve upon talent trends, we use an enterprise people scorecard, where we report employee data and insights on retention, learning, hiring, engagement and productivity. In 2023 we provided company-wide exit surveys to departing employees and their leaders, enabling us to better understand turnover trends and rationales. Leaders conducted proactive employee stay conversations and quarterly performance check-ins. In addition, we actively monitored our Engagement Index, which is a clear indicator of employee engagement across the organization. These tools allowed us to gather insights and create actions to manage turnover, including tailored development opportunities and compensation increases for roles in high demand. Our customer focus, commitment to ethical practices, continuous learning opportunities and inclusive environment drive a strong culture where employees can thrive.

The following table provides retention data for our employee workforce as of December 31, 2023.


Global


U.S.


Average tenure, continuous years of service (1)


8.5


11.1

Annual turnover rate


16.8

%  

10.2

%

(1)Continuous years of service represents the number of years employed by us in the most recent employment period.

18

Table of Contents

Our competitive total rewards offerings are also critical components of our employee value proposition. The programs for the broader employee population include our employee stock purchase plan and our annual incentive program. For select roles, we offer a long-term incentive plan, which is a stock-based compensation plan. Critical talent and high performing employees are eligible to receive stock awards under our discretionary stock program. Retirement programming for U.S. employees includes eligibility for our 401(k) plan, with a robust company match. Additionally, employees outside our asset management business are eligible to participate in a cash balance defined benefit plan. Outside of the U.S., retirement programming varies by country but commonly exceeds statutory requirements. We also offer employees a comprehensive suite of health and welfare benefits, designed to support them through all stages of their career and life. We put a special emphasis on employee wellbeing by offering a wide range of programming aimed at improving overall health, including a state-of-the-art wellness center at our global headquarters and gym reimbursement at other locations.

In addition to providing competitive total rewards, we provide our global workforce a myriad of opportunities to support their communities and causes that are important to them. We encourage in-person and virtual volunteerism through our volunteer time off policy. As an example of this, at the Community Learning Center housed at our global headquarters in Des Moines, Iowa, employees have ready access to a variety of volunteer opportunities, including the ability to mentor students, provide professional development coaching and teach future ready job skills like coding. A generous Dollars for Doers program provides employees a microgrant credit based on volunteer hours they record in our Corporate Social Responsibility platform, enabling employees to contribute earned credits to any nonprofit they choose. We also offer a giving program through which we provide a 50% match on employee monetary contributions, with the company match going directly to the organization to which an employee has donated.

The following tables provide demographic data for our employee workforce as of December 31, 2023. The Employees category represents our entire employee workforce, including Management, Senior Management and members of our EMG. The Management category includes all people leaders who have at least one direct report, excluding Senior Management and EMG members. The Senior Management category is comprised of Senior Vice Presidents and employees with equivalent titles, excluding EMG members. Our EMG includes our Chief Executive Officer and primarily our Chief Executive Officer’s direct reports.

Global

Senior


Employees


Management


Management


EMG

Female


54

%  

47

%  

29

%  

38

%

Male

46


53

71


62

U.S. (1)


Senior


Employees


Management


Management


EMG

American Indian or Alaska Native

< 1

%

< 1

%

8

%

%

Asian


5

3

8

17

Black


5


2


8

Latino


4


2

8


Native Hawaiian or other Pacific Islander

< 1

< 1

Two or more races

2

1

White


84


92

76


75

All other races

< 1

(1)

Reporting on ethnic and racial diversity is more nuanced, and in many cases, not disclosed outside the U.S. As of December 31, 2023, approximately 7,700 Employees, approximately 1,100 people in Management, 1 person in Senior Management and 1 EMG member were based outside the U.S.

The following table provides demographic data for the Directors on the Board as of December 31, 2023.


Board


Female

42

%

Male


58

Black


17

%

Latino


17

White


66

19

Table of Contents

Internet Website

Our internet website can be found at www.principal.com. We make available free of charge, on or through our internet website, access to our annual report on Form 10-K, quarterly reports on Form 10-Q, current reports on Form 8-K and amendments to those reports filed or furnished pursuant to Section 13(a) or 15(d) of the Securities Exchange Act of 1934 as soon as reasonably practicable after such material is filed with or furnished to the SEC. These reports are also available on the SEC’s website at www.sec.gov. Also available free of charge on our internet website is our code of business conduct and ethics, corporate governance guidelines and charters for the Audit, Finance, Human Resources and Nominating and Governance committees of the Board. Also see Item 10. “Directors, Executive Officers and Corporate Governance.”

Item 1A. Risk Factors

Summary of Risk Factors

This section provides a summary of the risks that may impact our performance in the future. For details of our various risk factors and their impacts, see “Risk Factors Discussion.”

Our risk factors are organized into the following categories: 1) Risks relating to economic conditions, market conditions and investments, 2) Risks relating to estimates, assumptions and valuations, 3) Risks relating to laws, regulations and taxation, 4) Risks relating to our business and 5) General risks.

Risks relating to economic conditions, market conditions and investments

In general, economic and market conditions can cause variability in the following factors: demand for our products and services, short-term and long-term interest rates, inflation and deflation, equity returns, credit spreads, liquidity of investments, level of premiums and deposits, level of delinquencies and defaults, level of claims, level of surrenders and withdrawals and foreign exchange rates. The net effect of this variability can include reductions in business volumes or AUM, reductions in revenues, additional operating expenses, reductions or volatility in net income, inability to meet liquidity needs, inability to access capital and increased cost of capital.

Risks relating to estimates, assumptions and valuations

We use financial models to price our products, calculate reserves and other actuarial balances, value our investments and determine the amount of allowances or impairments taken on our investments. These models include the use of methodologies, assumptions and estimates. If actual experience is different than our models, our financial results could be impacted. This could impact the timing of our net income or adversely affect our results of operations and financial condition.

Risks relating to laws, regulations and taxation

Many different regulatory bodies govern our company. We are required to comply with securities laws; insurance regulations; employee benefit plan regulations; financial services regulations; U.S. and international tax regulations; environmental, social and governance (“ESG”) requirements; and cybersecurity and privacy regulations. Complying with the various regulations can increase our cost of doing business, limit our available capital or impact how we do business. We could also face potential fines or reputational risk if we do not comply. In addition, changes in tax laws can reduce sales of certain tax-advantaged products or increase our operating expenses. Changes in accounting standards may adversely impact reported results of operations and financial condition. Litigation and tax audits can increase costs and create adverse publicity.

Risks relating to our business

Business risks include risks associated with competition, products, fraud, external business partner relationships and acquisitions. In general, the risks related to our business can cause variability in the following factors: demand for our products and services, level of premiums and deposits, level of claims and level of surrenders and withdrawals. The net effect of this variability can include reductions in business volumes, disruptions in business operations, reductions in revenues, increased claims or operating expenses, reduced economic activity, reductions or volatility in net income or adverse effects on our results of operations and financial condition.

20

Table of Contents

General risks

These risks are of a general nature and include the risk of catastrophic event; the risk of global climate change; the risk of technological and societal changes; reputational risk; intellectual property risk; risks associated with attracting, developing and retaining qualified employees; the risk of interruptions in information technology, infrastructure or other systems; loss of key vendor relationships and risks associated with our enterprise risk management framework. General risks can result in reductions in business volumes, reductions in revenues, additional operating expenses, reductions or volatility in net income, or adverse effects on our results of operations and financial condition.

Risk Factors Discussion

In the discussion below, when providing details related to our investment portfolio, we have excluded discussion of investments held as part of a coinsurance with funds withheld agreement. We believe the details of the composition of our investment portfolio excluding the funds withheld are most relevant to an understanding of our risks that are pertinent to investors because all funds withheld assets support obligations and liabilities relating to the Talcott Reinsurance Transaction.

Risks relating to economic conditions, market conditions and investments

Adverse capital and credit market conditions may significantly affect our ability to meet liquidity needs, as well as our access to capital and cost of capital.

Our results of operations, financial condition, cash flows and capital position could be materially adversely affected by volatility, uncertainty and disruption in the capital and credit markets.

We maintain a level of cash and securities which, combined with expected cash inflows from investments and operations, is believed adequate to meet anticipated short-term and long-term benefit and expense payment obligations. However, withdrawal and surrender levels may differ from anticipated levels for a variety of reasons, such as changes in economic conditions or changes in our claims paying ability and financial strength ratings. For additional information regarding our exposure to interest rate risk and the impact of a downgrade in our financial strength ratings, see risk factors entitled “Changes in interest rates or credit spreads or a prolonged low interest rate environment may adversely affect our results of operations, financial condition and liquidity, and our net income can vary from period to period” and “A downgrade in our financial strength or credit ratings may increase policy surrenders and withdrawals, reduce new sales, terminate relationships with distributors, impact existing liabilities and increase our cost of capital, any of which could adversely affect our profitability and financial condition.” In addition, mark-to-market adjustments on our investments and derivative instruments may lead to fluctuations in our reported capital. Volatility, uncertainty or disruptions in the capital or credit markets may result in the need for additional capital to maintain a targeted level of U.S. statutory capital relative to the NAIC’s RBC requirements. In the event our current internal sources of liquidity do not satisfy our needs, we may have to seek additional financing and, in such case, we may not be able to successfully obtain additional financing on favorable terms or at all. The availability of additional financing will depend on a variety of factors such as market conditions, the general availability of credit, the volume of trading activities, the overall availability of credit to the financial services industry, our credit ratings and credit capacity, as well as customers’ or lenders’ perception of our long- or short-term financial prospects. Similarly, our access to funds may be impaired if regulatory authorities or rating agencies take negative actions against us.

Disruptions, uncertainty or volatility in the capital and credit markets may limit our access to capital required to operate our business, most significantly our insurance operations. Such market conditions may limit our ability to replace, in a timely manner, maturing liabilities; satisfy statutory capital requirements; fund redemption requests on insurance or other financial products; generate fee income and market-related revenue to meet liquidity needs and access the capital necessary to grow our business. As such, we may be forced to delay raising capital, issue shorter tenor securities than we prefer, utilize available internal resources or bear an unattractive cost of capital, which could decrease our profitability and significantly reduce our financial flexibility and liquidity.

In addition, we maintain credit facilities with various financial institutions as a potential source of excess liquidity. These facilities are in place to bridge timing in cash flows to minimize the cost of meeting our obligations, particularly during periods when alternative sources of liquidity are limited. Our ability to borrow funds under these facilities is conditioned on our satisfaction of covenants and other requirements contained in the facilities. Our failure to comply with these covenants, or the failure of lenders to fund their lending commitments, would restrict our ability to access these credit facilities and, consequently, could limit our flexibility in meeting our cash flow needs.

For further discussion on liquidity risk management, see Item 7. “Management’s Discussion and Analysis of Financial Condition and Results of Operations — Liquidity and Capital Resources.”

21

Table of Contents

Conditions in the global capital markets, including the equity, bond or real estate markets, and the economy generally may materially and adversely affect our business and results of operations.

Our results of operations are materially affected by conditions in the global capital markets and the economy generally, both in the U.S. and elsewhere around the world. Continued adverse economic conditions may result in a decline in our AUM, AUA and revenues and erosion of our profit margins. In addition, in the event of extreme prolonged market events and economic downturns, we could incur significant losses. Even in the absence of a market downturn, we are exposed to substantial risk of loss due to market volatility.

Because the revenues of our asset accumulation and management businesses are largely based on the value of AUM and AUA, a decline in domestic and global equity, bond or real estate markets will decrease our revenues. Turmoil in these markets could lead investors to withdraw from these markets, decrease their rates of investment or refrain from making new investments, which may reduce our AUM, AUA, revenues and net income.

For further discussion on equity risk management, see Item 7A. “Quantitative and Qualitative Disclosures About Market Risk - Equity Risk.”

Factors such as consumer spending, business investment, government spending, the volatility and strength of the capital markets, investor and consumer confidence, foreign currency exchange rates, inflation levels and our ability to manage inflation risk effectively all affect the business and economic environment and, ultimately, the amount and profitability of our business. In an economic downturn characterized by higher unemployment, lower family income, lower corporate earnings, lower business investment, negative investor sentiment and lower consumer spending, the demand for our financial and insurance products could be adversely affected. In addition, we may experience an elevated incidence of claims and lapses or surrenders of policies. Our policyholders may choose to defer paying insurance premiums or stop paying insurance premiums altogether. In addition, reductions in employment levels of our existing employer customers may result in a reduction in membership levels and premium income for our specialty benefits products. Participants within the retirement plans for which we provide administrative services may elect to reduce or stop their payroll deferrals to these plans, which would reduce AUM, AUA and revenues. In addition, reductions in employment levels may result in a decline in employee deposits into retirement plans. Adverse changes in the economy could affect net income negatively and could have a material adverse effect on our business, results of operations and financial condition.

An economic downturn may also lead to weakening of foreign currencies against the U.S. dollar, which would adversely affect the translation of segment pre-tax operating earnings and equity of our international operations into our consolidated financial statements. For further discussion on foreign currency exchange risk, see Item 7A. “Quantitative and Qualitative Disclosures About Market Risk — Foreign Currency Risk.”

Changes in interest rates or credit spreads or a prolonged low interest rate environment may adversely affect our results of operations, financial condition and liquidity, and our net income can vary from period to period.

During periods of declining interest rates or prolonged low interest rates, the interest rates we earn on our assets may be lower than the rates assumed in pricing our products, thereby reducing our profitability. For some of our products, such as GICs and funding agreements, we are unable to lower the rate we credit to customers in response to the lower return we will earn on our investments. In addition, guaranteed minimum interest rates on our life insurance and annuity products may constrain our ability to lower the rate we credit to customers. Declining interest rates may also lead to a reduction in revenues related to our trust and custody business. Declining interest rates may result in increases in our reserves and other actuarial balances, potentially reducing net income or other comprehensive income (“OCI”). During periods of declining interest rates, borrowers may prepay or redeem mortgages and bonds that we own, which would force us to reinvest the proceeds at lower interest rates. Furthermore, declining interest rates may reduce the rate of policyholder surrenders and withdrawals on our life insurance and annuity products, thus increasing the duration of the liabilities and creating asset and liability duration mismatches. Low interest rates may also increase the cost of hedging certain product features or riders. Declining interest rates or a prolonged low interest rate environment may also result in changes to the discount rate used for valuing our pension, and other postretirement employee benefit (“OPEB”) obligations, which could negatively impact our results of operations and financial condition. In addition, certain statutory capital and reserve requirements are based on formulas or models that consider interest rates and a prolonged period of low interest rates may increase the statutory capital we are required to hold as well as the amount of assets we must maintain to support statutory reserves. Declining interest rates may cause a decrease in the value of market risk benefit (“MRB”) assets and an increase in the value of MRB liabilities and other liabilities held at fair value on our consolidated statements of financial position, potentially reducing net income or OCI.

22

Table of Contents

Increases in market interest rates may also adversely affect our results of operations, financial condition and liquidity. During periods of increasing market interest rates, we may offer higher crediting rates on our insurance and annuity products to keep these products competitive. Because returns on our portfolio of invested assets may not increase as quickly as current interest rates, we may have to accept lower spreads, thus reducing our profitability. Rapidly rising interest rates may also result in an increase in policy surrenders, withdrawals and requests for policy loans as customers seek to achieve higher returns. In addition, rising interest rates may cause a decrease in the value of financial assets held at fair value on our consolidated statements of financial position. We may be required to sell assets to raise the cash necessary to respond to an increase in surrenders, withdrawals and loans, thereby realizing capital losses on the assets sold. An increase in policy surrenders and withdrawals may also require us to accelerate amortization of our deferred acquisition cost (“DAC”) asset relating to these products. Rising interest rates may also cause a decline in the value of the fixed income assets we manage, resulting in a reduction in our fee revenue in the short term. In addition, a significant increase in interest rates may cause a reduction in the fair value of intangible assets in our reporting units, potentially leading to an impairment of goodwill or other intangible assets.

For further discussion about interest rate risk management, see Item 7A. “Quantitative and Qualitative Disclosures About Market Risk – Interest Rate Risk.”

Our exposure to credit spreads primarily relates to market price variability and reinvestment risk associated with changes in credit spreads. A widening of credit spreads would cause unrealized losses in our investment portfolio, would increase losses associated with credit-based derivatives we have sold that do not qualify or have not been designated for hedge accounting where we assume credit exposure and, if issuer credit spreads increase as a result of fundamental credit deterioration, would likely result in higher allowances. Credit spread tightening will reduce net investment income associated with new purchases of fixed maturities. Credit spread tightening may also cause an increase in the reported value of certain liabilities that are valued using a discount rate that reflects our own credit spread. In addition, market volatility may make it difficult to value certain of our securities if trading becomes less frequent. As such, valuations may include assumptions or estimates that may have significant period-to-period changes from market volatility, which could have a material adverse effect on our results of operations or financial condition.

Our investment portfolio is subject to several risks that may diminish the value of our invested assets and the investment returns credited to customers, which could reduce our sales, revenues, AUM and net income.

An increase in defaults or write-downs on our fixed maturities portfolio may reduce our profitability.

We are subject to the risk that the issuers of the fixed maturities we own will default on principal and interest payments. As of December 31, 2023, our U.S. investment operations held $47.8 billion of fixed maturities, or 66% of total U.S. invested assets, of which approximately 6% were below investment grade, and $109.3 million, or 0.1% of our total fixed maturities, were classified as either “problem,” “potential problem” or “restructured.” See Item 7. “Management’s Discussion and Analysis of Financial Condition and Results of Operations — Investments — U.S. Investment Operations — Fixed Maturities.”

As of December 31, 2023, the international investment operations of our fully consolidated subsidiaries held $2.8 billion of fixed maturities, or 41%, of total international invested assets, of which 3% are government bonds. Some non-government bonds have been rated on the basis of the issuer’s country credit rating. However, the ratings relationship between national ratings and global ratings is not linear with the U.S. The starting point for national ratings differs by country, which makes the assessment of credit quality more difficult. See Item 7. “Management’s Discussion and Analysis of Financial Condition and Results of Operations — Investments — International Investment Operations.” An increase in defaults on our fixed maturities portfolio could harm our financial strength and reduce our profitability.

An increased rate of delinquency and defaults on our commercial mortgage loans, including balloon maturities with and without amortizing payments, may adversely affect our profitability.

Our commercial mortgage loan portfolio faces both delinquency and default risk. Commercial mortgage loans of $14.1 billion represented 18% of our total invested assets as of December 31, 2023. As of December 31, 2023, there were no loans in the process of foreclosure in our commercial mortgage loan portfolio. The performance of our commercial mortgage loan investments, however, may fluctuate in the future. An increase in the delinquency rate of, and defaults under, our commercial mortgage loan portfolio could harm our financial strength and decrease our profitability.

23

Table of Contents

As of December 31, 2023, approximately $11.7 billion, or 85%, of our U.S. investment operations commercial mortgage loans before valuation allowance had balloon payment maturities. A balloon maturity is a loan with all or a meaningful portion of the loan amount due at the maturity of the loan. The default rate on commercial mortgage loans with balloon payment maturities has historically been higher than commercial mortgage loans with a fully amortizing loan structure. Since a significant portion of the principal is repaid at maturity, the amount of loss on a default is generally greater than fully amortizing commercial mortgage loans. An increase in defaults on balloon maturity loans as a result of the foregoing factors could harm our financial strength and decrease our profitability.

Mark-to-market adjustments on equity securities, trading securities and derivative instruments may reduce our profitability or cause volatility in our net income.

Our investment portfolio includes equity securities, trading securities and derivative instruments that are reported at fair value on the consolidated statements of financial position with changes in fair value reported in net income. Mark-to-market adjustments on these investments may reduce our profitability or cause our net income to vary from period to period. We anticipate that acquisition and investment activities may increase the number and magnitude of these investments in the future.

We may have difficulty selling our privately placed fixed maturities, mortgage loans and real estate investments because they are less liquid than our publicly traded fixed maturities.

We hold certain investments that may be less liquid than our publicly traded fixed maturities, such as privately placed fixed maturities, mortgage loans and real estate investments. These asset classes represented approximately 40% of the value of our total invested assets as of December 31, 2023.

If we require significant amounts of cash on short notice, we may have difficulty selling these investments in a timely manner, be forced to sell them for less than we otherwise would have been able to realize or both. The reported value of our relatively illiquid types of investments, our investments in the asset classes described above and, at times, our high quality, generally liquid asset classes, do not necessarily reflect the lowest possible price for the asset. If we were forced to sell certain of our assets in the current market, there can be no assurance we will be able to sell them for the prices at which we have recorded them, and we may be forced to sell them at significantly lower prices.

The impairment of derivative counterparties could adversely affect us.

We use derivative instruments to hedge various risks we face in our businesses. See Item 7A. “Quantitative and Qualitative Disclosures About Market Risk.” We enter into a variety of derivative instruments with a number of counterparties in the financial services industry, including brokers and dealers, commercial banks, investment banks, clearinghouses, exchanges and other institutions. For transactions where we are in-the-money, we are exposed to credit risk in the event of default of our counterparty. We establish collateral agreements with nominal thresholds for a large majority of our counterparties to limit our exposure. However, our credit risk may be exacerbated when the collateral held by us cannot be realized or is liquidated at prices not sufficient to recover the full amount of the derivative exposure. With regard to our derivative exposure, we have over-collateralization requirements on the portion of collateral we hold, based on the risk profile of the assets posted as collateral. We also have exposure to these financial institutions in the form of unsecured debt instruments and equity investments. Such losses or impairments to the carrying value of these assets may materially and adversely affect our business and results of operations.

24

Table of Contents

Our requirements to post collateral or make payments related to declines in market value of specified assets may adversely affect our liquidity and expose us to counterparty credit risk.

Many of our derivative transactions with financial and other institutions specify the circumstances under which the parties are required to post collateral. We are also required to post collateral in connection with funding agreements with the FHLB Des Moines, reinsurance agreements, and various other transactions. The amount of collateral we may be required to post under these agreements may increase under certain circumstances, which could adversely affect our liquidity. In addition, under the terms of some of our transactions we may be required to make payment to our counterparties related to any decline in the market value of the specified assets. Such payments could have an adverse effect on our liquidity. Furthermore, with respect to any such payments, we will have unsecured risk to the counterparty as these amounts are not required to be segregated from the counterparty’s other funds, are not held in a third party custodial account and are not required to be paid to us by the counterparty until the termination of the transaction.

Environmental liability exposure may result from our commercial mortgage loan portfolio and real estate investments.

Liability under environmental protection laws resulting from our commercial mortgage loan portfolio and real estate investments may harm our financial strength and reduce our profitability. Under the laws of several states and other jurisdictions, contamination of a property may give rise to a lien on the property to secure recovery of the costs of cleanup. In some states, this kind of lien has priority over the lien of an existing mortgage against the property, which would impair our ability to foreclose on that property should the related loan be in default. In addition, under the laws of some states and under the U.S. Comprehensive Environmental Response, Compensation and Liability Act of 1980, we may be liable for costs of addressing releases or threatened releases of hazardous substances that require remedy at a property securing a mortgage loan held by us, if our agents or employees have become sufficiently involved in the hazardous waste aspects of the operations of the related obligor on that loan, regardless of whether or not the environmental damage or threat was caused by the obligor. We also may face this liability after foreclosing on a property securing a mortgage loan held by us. This may harm our financial strength and decrease our profitability.

Regional concentration of our commercial mortgage loan portfolio in California may subject us to losses attributable to economic downturns or catastrophes in that state.

Commercial mortgage lending in the state of California accounted for 25%, or $3.4 billion, of our U.S. investment operations commercial mortgage loan portfolio before valuation allowance as of December 31, 2023. Due to this concentration of commercial mortgage loans in California, we are exposed to potential losses resulting from the risk of an economic downturn in California as well as to catastrophes, including but not limited to earthquakes, that may affect the region. While we generally do not require earthquake insurance for properties on which we make commercial mortgage loans, we do take into account property specific engineering reports, construction type and geographical concentration by fault lines in our investment underwriting guidelines. If economic conditions in California deteriorate or catastrophes occur, we may in the future experience delinquencies or defaults on the portion of our commercial mortgage loan portfolio located in California, which may harm our financial strength and reduce our profitability.

Gross unrealized losses may be realized or result in future credit losses, resulting in a reduction in our net income.

Fixed maturities that are classified as available-for-sale (“AFS”) are reported on the consolidated statements of financial position at fair value. Unrealized gains or losses on AFS securities, excluding those in fair value hedging relationships, are recognized as a component of accumulated other comprehensive income (“AOCI”) and are, therefore, excluded from net income. Our U.S. investment operations had gross unrealized losses on fixed maturities of $4,022.0 million pre-tax as of December 31, 2023, and the component of gross unrealized losses for securities in a continuous unrealized loss position for over twelve months and for which an allowance for credit loss has not been recorded was $3,915.9 million pre-tax. The accumulated change in fair value of the AFS securities is recognized in net income when the gain or loss is realized upon the sale of the asset or in the event that the decline in fair value requires an allowance for credit loss. Realized losses or credit losses may have a material adverse impact on our net income in a particular quarterly or annual period.

25

Table of Contents

Fluctuations in foreign currency exchange rates could adversely impact our profitability and financial condition.

We are exposed to foreign currency risk in our international operations. Principal International sells products denominated in various local currencies and generally invests the associated assets in local currencies. For diversification purposes, assets backing the products may be partially invested in non-local currencies. In our U.S. operations, we also issue foreign currency-denominated funding agreements to nonqualified investors in the institutional market or invest in foreign currency-denominated investments. The associated foreign currency exchange risk in each instance is hedged or managed to specific risk tolerances. Although our investment and hedging strategies limit the effect of currency exchange rate fluctuation on operating results, weakening of foreign currencies against the U.S. dollar would adversely affect the translation of the results of our international operations into our consolidated financial statements. For further discussion on foreign currency exchange risk, see Item 7A. “Quantitative and Qualitative Disclosures About Market Risk — Foreign Currency Risk.”

Risks relating to estimates, assumptions and valuations

Our valuation of investments and the determinations of the amount of allowances and impairments taken on our investments may include methodologies, estimations and assumptions that are subject to differing interpretations and, if changed, could materially adversely affect our results of operations or financial condition.

Fixed maturities, equity securities and derivatives represent most assets and liabilities reported at fair value on our consolidated statements of financial position, excluding separate account assets and market risk benefit assets and liabilities. Fair value is defined as the price that would be received to sell an asset or paid to transfer a liability in an orderly transaction between market participants at the measurement date (an exit price). Fair value estimates are made based on available market information and judgments about the financial instrument at a specific point in time. Considerable judgment is often required to develop estimates of fair value, and the use of different assumptions or valuation methodologies may have a material effect on the estimated fair value amounts.

For additional information on our valuation methodology, see Item 8. “Financial Statements and Supplementary Data, Notes to Consolidated Financial Statements, Note 18, Fair Value Measurements.”

During periods of market disruption including periods of significantly rising or high interest rates, rapidly widening credit spreads or illiquidity, it may be difficult to value certain securities, for example collateralized mortgage obligations and collateralized debt obligations, if trading becomes less frequent and/or market data becomes less observable. There may be certain asset classes that were in active markets with significant observable data that become illiquid due to the current financial environment. In such cases, the valuation process may require more subjectivity and management judgment. As such, valuations may include inputs and assumptions that are less observable or require greater estimation as well as valuation methods that require greater estimation, which could result in values that are different from the value at which the investments may be ultimately sold. Further, rapidly changing credit and equity market conditions could materially impact the valuation of securities as reported within our consolidated financial statements and the period-to-period changes in value could vary significantly. Decreases in value may have a material adverse effect on our results of operations or financial condition.

The determination of the amount of allowances and impairments varies by investment type and is based upon our periodic evaluation and assessment of known and inherent risks associated with the respective asset class. Such evaluations and assessments require significant judgment and are revised as conditions change and new information becomes available. Additional impairments may need to be taken or allowances provided for in the future, and the ultimate loss may exceed management’s current loss estimates.

Additionally, our management considers a wide range of factors about the instrument issuer and uses its best judgment in evaluating the cause of the decline in the estimated fair value of the instrument and in assessing the prospects for recovery. Inherent in management’s evaluation of the instrument are assumptions and estimates about the operations of the issuer and its future earnings potential. For further information regarding our impairment and allowance methodologies, see Item 7. “Management’s Discussion and Analysis of Financial Condition and Results of Operations — Investments — U.S. Investment Operations” under the captions “Fixed Maturities” and “Mortgage Loans” and Item 7. “Management’s Discussion and Analysis of Financial Condition and Results of Operations — Critical Accounting Policies and Estimates — Valuation and Allowance for Credit Loss of Fixed Income Investments.”

26

Table of Contents

Any impairments of or valuation allowances against our deferred tax assets could adversely affect our results of operations and financial condition.

Deferred tax liabilities and assets are determined based on the difference between the financial statement and tax bases of assets and liabilities using enacted tax rates expected to be in effect during the years in which the basis differences reverse. We are required to evaluate the recoverability of our deferred tax assets each quarter and establish a valuation allowance, if necessary, to reduce our deferred tax assets to an amount that is more−likely−than−not to be realizable. In determining the need for a valuation allowance, we consider many factors, including future reversals of existing taxable temporary differences, future taxable income exclusive of reversing temporary differences and carryforwards, taxable income in prior carryback years and implementation of any feasible and prudent tax planning strategies management would employ to realize the tax benefit.

Inherent in the provision for income taxes are estimates regarding the deductibility of certain items, the timing of income and expense recognition and the current or future realization of operating losses, capital losses, certain tax credits and future enacted changes in applicable tax rates as well as the tax base. In the event these estimates differ from our prior estimates due to the receipt of new information, we may be required to significantly change the provision for income taxes recorded in the consolidated financial statements. Any such change could significantly affect the amounts reported in the consolidated financial statements in the year these estimates change. A further significant decline in value of assets incorporated into our tax planning strategies could lead to an increase of our valuation allowance on deferred tax assets having an adverse effect on current and future results.

For additional information, see Item 7. “Management’s Discussion and Analysis of Financial Condition and Results of Operations — Critical Accounting Policies and Estimates — Income Taxes.”

We may face losses on our insurance and annuity products if our actual experience differs significantly from our pricing and reserving assumptions.

The profitability of our insurance and annuity products depends significantly upon the extent to which our actual experience is consistent with the assumptions used in setting prices for our products and establishing liabilities for future insurance and annuity policy benefits and claims. The premiums we charge and the liabilities we hold for future policy benefits are based on assumptions reflecting several factors, including the amount of premiums we will receive in the future, rate of return on assets we purchase with premiums received, expected claims, mortality, morbidity, lapse rates and expenses. However, due to the nature of the underlying risks and the high degree of uncertainty associated with the determination of the liabilities for unpaid policy benefits and claims, we cannot precisely determine the amounts we will ultimately pay to settle these liabilities, the timing of such payments, or whether the assets supporting the liabilities, together with any future premiums, will be sufficient to satisfy the liabilities. As a result, we may experience volatility in the level of our profitability and our reserves from period to period. To the extent that actual experience is less favorable than our underlying assumptions, we may have to update our assumptions and increase our liabilities, which may harm our financial strength and reduce our profitability.

Our results of operations may also be adversely impacted if our actual investment earnings differ from our pricing and reserve assumptions. Changes in economic conditions may lead to changes in market interest rates or changes in our investment strategies, either of which could cause our actual investment earnings to differ from our pricing and reserve assumptions.

For additional information on our insurance reserves, see Item 7. “Management’s Discussion and Analysis of Financial Condition and Results of Operations — Critical Accounting Policies and Estimates — Insurance Reserves.”

The pattern of amortizing our DAC asset and other actuarial balances may change, impacting both the level of our DAC asset and other actuarial balances and the timing of our net income.

Amortization of our DAC asset and other actuarial balances depends on several assumptions, including but not limited to, mortality and policy lapse. Due to the uncertainty associated with establishing these assumptions, we cannot, with precision, determine the exact pattern of amortization. To the extent actual experience emerges less favorably than expected, the amortization pattern of our DAC asset and other actuarial balances may be adjusted, which may impact the timing of our net income.

For additional information, see Item 8. “Financial Statements and Supplementary Data, Notes to Consolidated Financial Statements, Note 7, Deferred Acquisition Costs and Other Actuarial Balances.”

27

Table of Contents

Risks relating to laws, regulations and taxation

Changes in laws or regulations may reduce our profitability or impact how we do business.

Our businesses are subject to comprehensive regulation and supervision throughout the U.S. and in the international markets in which we operate. We are also impacted by federal legislation and administrative policies in areas such as securities laws, employee benefit plan regulations, financial services regulations, U.S. federal taxation and international taxation. Changes in laws or regulations or the interpretation thereof could significantly increase our compliance costs and reduce our profitability. Failure to comply with applicable regulations may expose us to significant penalties, the suspension or revocation of licenses to conduct business and reputational damage.

Changes in insurance regulations may reduce our profitability.

Our insurance subsidiaries are subject to extensive supervision and regulation. In particular, in the U.S., the laws of the various states establish insurance departments with broad powers to supervise and regulate insurance companies. The supervision and regulation relate to numerous aspects of our business and financial condition, including insurance company laws that apply to PFG and to various transactions between our insurance companies and subsidiaries and other affiliates. The primary purpose of insurance regulation is to protect policyholders, not stockholders or creditors.

State insurance regulators, federal regulators and the NAIC continually reexamine existing laws and regulations and may impose changes in the future. New interpretations of existing laws and the passage of new legislation may harm our ability to sell new policies, increase our claims exposure on policies we issued previously and adversely affect our profitability and financial strength.

State insurance guaranty associations have the right to assess insurance companies doing business in their state for funds to help pay the obligations of insolvent insurance companies to policyholders and claimants. Because the amount and timing of an assessment is beyond our control, the liabilities we have established for these potential assessments may not be adequate. In addition, regulators may change their interpretation or application of existing laws and regulations.

The NAIC regularly reviews and updates its U.S. statutory reserve and RBC requirements. Changes to these requirements may increase the amount of reserves and capital our U.S. insurance companies are required to hold and may adversely impact Principal Life’s ability to pay dividends or other distributions to its parent. See Item 7. “Management’s Discussion and Analysis of Financial Condition and Results of Operations — Liquidity and Capital Resources” for a discussion of regulatory restrictions on Principal Life’s ability to pay dividends or other distributions. In addition, changes in statutory reserve or RBC requirements may adversely impact our financial strength ratings. See the risk factor entitled “A downgrade in our financial strength or credit ratings may increase policy surrenders and withdrawals, reduce new sales, terminate relationships with distributors, impact existing liabilities and increase our cost of capital, any of which could adversely affect our profitability and financial condition” for a discussion of risks relating to our financial strength ratings.

The NAIC continues to implement a principle-based reserving (“PBR”) approach to valuation of life insurance and annuities. In recent years, the PBR framework has been implemented for life insurance and variable annuities. Regulators plan to implement PBR for non-variable annuities in the next few years. The ultimate financial impact of these changes is uncertain, but they could result in more volatile and less predictable reserve and capital levels for these products.

We have implemented, or may implement at any time, reinsurance transactions utilizing affiliated and unaffiliated reinsurers to reinsure or finance a portion of the reserves for certain products. Our ability to enter new reinsurance or reserve financing transactions will continue to be dependent on the cost and forms of transactions available in the market and our ability to obtain required regulatory approvals. For additional information regarding our use of affiliated reinsurance transactions, see Item 8. “Financial Statements and Supplementary Data, Notes to Consolidated Financial Statements, Note 19, Statutory Insurance Financial Information.”

The NAIC is pursuing a variety of reforms to its RBC framework, which could increase our capital requirements for our U.S. insurance businesses.

The NAIC has adopted a group capital calculation. This calculation is not intended to be a regulatory capital requirement, but it will be used by regulators in their supervisory process and could create an additional data point for regulators to consider in evaluating our capital position.

Our international insurance businesses are also subject to comprehensive regulation and supervision from central and/or local governmental authorities in each country in which we operate. New interpretations of existing laws and regulations or the adoption of new laws and regulations may harm our international businesses, increase the cost of compliance and reduce our profitability in those businesses.

28

Table of Contents

The International Association of Insurance Supervisors has adopted its common framework for the supervision of Internationally Active Insurance Groups (“IAIGs”). We currently are not designated as an IAIG. If we were so designated in the future, we may be subject to supervision and capital requirements beyond those applicable to any competitors without those designations. These international frameworks may influence the regulatory capital requirements in the jurisdictions in which we operate, potentially leading to an increase in our capital requirements.

Changes in federal, state and international securities laws may reduce our profitability.

Our asset management and accumulation and life insurance businesses are subject to various levels of regulation under federal, state and international securities laws. For example, insurance and investment products such as variable annuities, RILA, variable life insurance, mutual fund products and some funding agreements that constitute securities are subject to securities laws and regulations, including state securities regulation as well as federal regulation under the SEC, FINRA and other regulatory authorities. These laws and regulations are primarily intended to protect investors in the securities markets or investment advisory or brokerage clients and generally grant supervisory agencies and self-regulatory organizations broad administrative powers, including the power to limit or restrict the conduct of business for failure to comply with such laws and regulations. In addition, we are subject to local laws and regulations in the global jurisdictions in which we offer or provide asset management services and products. Changes to these laws or regulations, or the interpretation thereof, that restrict the conduct of our business could significantly increase our compliance costs and reduce our profitability.

Changes in employee benefit regulations may reduce our profitability.

We provide products and services to certain employee benefit plans that are subject to ERISA or the Internal Revenue Code of 1986, as amended. The U.S. Congress has, from time to time, considered legislation relating to changes in ERISA to permit application of state law remedies, such as consequential and punitive damages, in lawsuits for wrongful denial of benefits, which, if adopted, could increase our liability for damages in future litigation. In addition, reductions in contribution levels to defined contribution plans may decrease our profitability.

On October 31, 2023, the DOL proposed a new regulation redefining what it means to provide investment advice as a fiduciary. The DOL also proposed changes to several of its prohibited transaction exemptions relating to fiduciary investment advice. Similarly, some states may change their insurance and securities laws and/or regulations to address personalized investment advice. New states may adopt an updated NAIC model regulation, which made best interest enhancements to its existing annuity suitability model. Continuing related state fiduciary or “best interest” legislation and/or regulation could occur in 2024.

Financial services regulatory reform may reduce our profitability, impact how we do business or limit our ability to engage in certain capital expenditures.

On July 21, 2010, the Dodd-Frank Act became law. The Act made extensive changes to the laws regulating financial services firms and required various federal agencies to adopt a broad range of new implementation rules and regulations, including those surrounding the use of derivatives. Some aspects of Dodd-Frank continue to be implemented, and there are some efforts to eliminate or adjust certain elements of the law. Uncertainty remains regarding the continued implementation of and potential adjustments to Dodd-Frank and it is uncertain whether changes to Dodd-Frank will result in a material effect on our business operations.

Changes in cybersecurity or privacy regulations may increase our compliance costs, limit our ability to gain insight from data and lead to increased scrutiny.

We collect, process, store, share, disclose and use personal information from and about our customers, employees plan participants and website, mobile and application users. Any actual or perceived failure by us or our service providers to comply with our privacy policies, privacy-related obligations to customers, employees or third parties, data disclosure consent obligations and data protection obligations may result in governmental enforcement actions, litigation or public statements critical of us. Such actual or perceived failures could also cause our customers, suppliers and employees to lose trust in us, which may have an adverse effect on our business. See the risk factor entitled “Loss of key vendor relationships or failure of a vendor to protect information of our customers or employees could adversely affect our business or result in losses” for further discussion of third party impacts.

Restrictions on data collection and use may limit opportunities to gain business insights useful to running our business and offering innovative products and services.

29

Table of Contents

We are subject to numerous federal, state and international regulations regarding the privacy and security of personal information. These laws vary widely by jurisdiction. The laws and regulations that affect our business include, but are not limited to the EU GDPR, U.S. federal, state and local data protection laws such as the New York Department of Financial Services Part 500 cybersecurity requirements for financial services companies, the California Consumer Privacy Act and California Privacy Rights Act, China’s Cybersecurity Law and the China Personal Information Protection Law. Regulations such as these, which are designed to protect privacy and prevent misuse of personal information, are complex and change frequently. The public, consumer and privacy advocates, legislatures and regulators are increasingly concerned about the collection, use, sharing and cross-border transfer of personal data, especially personal information that may be deemed sensitive, such as U.S. Social Security Numbers, other federal identifiers (non-U.S.), financial information, behavioral data, biometric data and health data. Additional legislative or regulatory action in the United States and globally could further regulate our collection, use, sharing and other processing of personal data. Changes in existing cybersecurity and privacy regulations or the enactment of new regulations may increase our compliance costs and failure to comply with these regulations may lead to reputational damage, fines or civil damages and increased regulatory scrutiny and oversight.

Our financial results may be adversely impacted by environmental, social and governance requirements.

Our financial and operational results could be impacted by emerging risk and changes to the regulatory landscape in areas like ESG requirements. While we closely monitor and respond to topics like social, environmental, and demographic changes that include longer lifespans, income and wealth inequalities, environmental challenges and opportunities to expand global access to the financial system across all segments of the population, updated and changing regulatory and societal environment requirements could impact financial and operational results.

Changes and uncertainty in U.S. and non-U.S. legislation, policy or regulation regarding climate risk management or other ESG practices may result in higher regulatory costs, compliance costs and increased capital expenditures. Changes in regulations may also impact market conditions and our financial results, leading to realized or unrealized losses and decreased revenues. Actual or perceived failure to adequately address ESG expectations of our various stakeholders (which continue to evolve and may, at times, be in conflict) could lead to a tarnished reputation, loss of customers and clients and could negatively impact our access to capital.

Changes in tax laws could increase our tax costs and reduce sales of our insurance, annuity and investment products.

Many of the insurance, annuity and investment products we issue receive favorable tax treatment under current U.S. federal income tax laws. Changes in U.S. federal income tax laws could reduce or eliminate the tax advantages of certain of our products, thus making these products less attractive to our customers. This may lead to a reduction in sales and deposits, which may adversely impact our profitability.

In addition, we benefit from certain tax items, including but not limited to, dividends received deductions, tax credits (such as foreign tax credits), tax-exempt bond interest and insurance reserve deductions. From time to time, the U.S. Congress, as well as foreign, state and local governments, consider legislative changes that could reduce or eliminate the benefits associated with these and other tax items. The Organisation for Economic Co-operation and Development has released proposed policies around base erosion and profit shifting and modernizing global tax systems originally designed to only account for physical presence. Our profitability could be negatively impacted as legislation is adopted by participating countries. We continue to evaluate the impact potential tax reform proposals may have on our future results of operations and financial condition.

On August 16, 2022, the Inflation Reduction Act of 2022 (“IRA 2022”) was enacted by the U.S. government. IRA 2022 contains several provisions, including the implementation of a new corporate alternative minimum tax (“CAMT”) and an excise tax on stock repurchases by certain corporations, which became effective January 1, 2023. Uncertainty remains regarding the continued implementation of and potential adjustments to IRA 2022 and until regulations are finalized it remains uncertain as to whether IRA 2022 will result in a material effect on our business operations, profitability, or our ability to engage in certain capital expenditures.

For a further discussion of tax matters, see Item 8. “Financial Statements and Supplementary Data, Notes to Consolidated Financial Statements, Note 14, Income Taxes.”

30

Table of Contents

Our ability to pay stockholder dividends, make share repurchases and meet our obligations may be constrained by the limitations on dividends or other distributions Iowa insurance laws impose on Principal Life.

We are an insurance holding company whose assets include all of the outstanding shares of the common stock of Principal Life and other subsidiaries. Our ability to pay dividends to our stockholders, make share repurchases and meet our obligations, including paying operating expenses and any debt service, depends upon the receipt of dividends or other distributions from Principal Life. Iowa insurance laws impose limitations on the ability of Principal Life to pay dividends or make other distributions to its parent. Any inability of Principal Life to pay dividends or make other distributions in the future may cause us to be unable to pay dividends to our stockholders and meet our other obligations. See Item 7. “Management’s Discussion and Analysis of Financial Condition and Results of Operations — Liquidity and Capital Resources” for a discussion of regulatory restrictions on Principal Life’s ability to pay dividends or make other distributions.

Changes in accounting standards may adversely affect our reported results of operations and financial condition.

Our consolidated financial statements are prepared in conformity with U.S. generally accepted accounting principles (“U.S. GAAP”). From time to time, we are required to adopt new or revised accounting standards issued by the Financial Accounting Standards Board. The required adoption of future accounting standards may adversely affect our reported results of operations and financial condition and may result in significant incremental costs associated with initial implementation and ongoing compliance. For a discussion of the impact of accounting pronouncements issued but not yet implemented, see Item 8. “Financial Statements and Supplementary Data, Notes to Consolidated Financial Statements, Note 1, Nature of Operations and Significant Accounting Policies”.

Litigation and regulatory investigations may affect our financial strength or reduce our profitability.

We are regularly involved in litigation, both as a defendant and as a plaintiff, but primarily as a defendant. Litigation naming us as a defendant ordinarily arises out of our business operations as a provider of asset management and accumulation products and services, Life Insurance and Specialty Benefits products and services, and our investment activities. We are, from time to time, also involved in various governmental, regulatory and administrative proceedings and inquiries.

Legal liability or adverse publicity with respect to current or future legal or regulatory actions, whether or not involving us, may affect our financial strength or reduce our profitability. For further discussion on litigation and regulatory investigation risk, see Item 8. “Financial Statements and Supplementary Data, Notes to Consolidated Financial Statements, Note 16, Contingencies, Guarantees, Indemnifications and Leases” under the caption, “Litigation and Regulatory Contingencies” and Item 8. “Financial Statements and Supplementary Data, Notes to Consolidated Financial Statements, Note 14, Income Taxes” under the caption “Other Tax Information.”

From time to time, we may become subject to tax audits, tax litigation or similar proceedings, and as a result we may owe additional taxes, interest and penalties in amounts that may be material.

We are subject to income taxes in the United States as well as many other jurisdictions. In determining our provisions for income taxes and our accounting for tax-related matters in general, we are required to exercise judgment. We regularly make estimates where the ultimate tax determination is uncertain. The final determination of any tax audit, appeal of the decision of a taxing authority, tax litigation or similar proceedings may be materially different from that reflected in our historical financial statements. The assessment of additional taxes, interest and penalties could be materially adverse to our current and future results of operations and financial condition.

Applicable laws and our certificate of incorporation and by-laws may discourage takeovers and business combinations that some stockholders might consider in their best interests.

State laws and our certificate of incorporation and by-laws may delay, defer, prevent, or render more difficult a takeover attempt that some stockholders might consider in their best interests. For instance, they may prevent our stockholders from receiving the benefit from any premium to the market price of our common stock offered by a bidder in a takeover context. Even in the absence of a takeover attempt, the existence of these provisions may adversely affect the prevailing market price of our common stock if they are viewed as discouraging takeover attempts in the future.

State laws and our certificate of incorporation and by-laws may also make it difficult for stockholders to replace or remove our management. These provisions may facilitate management entrenchment, which may delay, defer or prevent a change in our control, which may not be in the best interests of our stockholders.

31

Table of Contents

The following provisions, included in our certificate of incorporation and by-laws, may also have anti-takeover effects and may delay, defer or prevent a takeover attempt that some stockholders might consider in their best interests. In particular, our certificate of incorporation and by-laws:

permit our Board to issue one or more series of preferred stock;
divide our Board into three classes;
limit the ability of stockholders to remove directors;
prohibit stockholders from filling vacancies on our Board;
prohibit stockholders from calling special meetings of stockholders;
impose advance notice requirements for stockholder proposals and nominations of directors to be considered at stockholder meetings and
require the approval of at least 75% of the voting power of our outstanding common stock for the amendment of our by-laws and provisions of our certificate of incorporation governing:
the classified board,
the director’s discretion in determining what he or she reasonably believes to be in the best interests of PFG,
the liability of directors,
the removal of directors by shareholders,
the prohibition on stockholder actions by written consent and
the supermajority voting requirements.

In addition, Section 203 of the General Corporation Law of the State of Delaware may limit the ability of an “interested stockholder” to engage in business combinations with us. An interested stockholder is defined to include persons owning 15% or more of our outstanding voting stock.

Risks relating to our business

Competition, including from companies that may have greater financial resources, broader arrays of products, higher ratings and stronger financial performance, may impair our ability to retain existing customers, attract new customers and maintain our profitability.

We compete with many financial services companies, many of which may have advantages over us in one or more of the competitive factors described in Item 1. “Business, Competition.”

Retirement and Income Solutions segment and Principal Asset Management segment primarily compete with asset managers, wealth managers, banks, mutual funds, institutional trust companies, broker-dealers, recordkeepers and insurers. Our ability to increase and retain AUM is directly related to the quality of our recordkeeping system and services and the performance of our investments as measured against market averages and the performance of our competitors. Even when securities prices are generally rising, performance can be affected by investment styles.

Benefits and Protection segment primarily competes with other insurance companies. In the event competitors charge lower premiums or fees for substantially similar products, we may face pressure to lower our prices to attract and retain customers and distributors. Reductions in the premiums and fees we charge may adversely affect our revenues and profitability.

32

Table of Contents

A downgrade in our financial strength or credit ratings may increase policy surrenders and withdrawals, reduce new sales, terminate relationships with distributors, impact existing liabilities and increase our cost of capital, any of which could adversely affect our profitability and financial condition.

A.M. Best, Fitch, Moody’s and S&P publish financial strength ratings on U.S. life insurance companies as well as some of our international insurance companies. These ratings indicate the applicable rating agency’s opinion regarding an insurance company’s ability to meet contractholder and policyholder obligations. These rating agencies also assign credit ratings on non-life insurance entities, such as PFG and Principal Financial Services, Inc. (“PFS”). Credit ratings indicate the applicable rating agency’s opinion regarding a debt issuer’s ability to meet the terms of debt obligations in a timely manner and are important factors in overall funding profile and ability to access external capital.

Ratings are important factors in establishing the competitive position of insurance companies and maintaining public confidence in products being offered. Our ratings could be downgraded at any time without advance notice by any rating agency. A ratings downgrade, or the potential for such a downgrade, could, among other things:

materially increase the number of surrenders for all or a portion of the net cash values by the owners of policies and contracts we have issued, and materially increase the number of withdrawals by policyholders of cash values from their policies;
result in the termination of our relationships with broker-dealers, banks, agents, wholesalers and other distributors of our products and services;
reduce new sales, particularly with respect to pension risk transfer products and general account GICs and funding agreements purchased by pension plans and other institutions;
cause some of our existing liabilities to be subject to acceleration, additional collateral support, changes in terms, or creation of additional financial obligations; and
increase our cost of capital and limit our access to the capital markets.

Any of these consequences could adversely affect our profitability and financial condition.

For further discussion on financial strength and credit ratings outlook, see Item 7. “Management’s Discussion and Analysis of Financial Condition and Results of Operations — Liquidity and Capital Resources.”

Client terminations or withdrawals or changes in investor preferences may lead to a reduction in revenues for our asset management and accumulation businesses.

Revenues from our asset management and accumulation products are primarily fee-based. Our asset-based fees are typically calculated as a percentage of the market value of AUM. Our asset management and accumulation clients may elect to terminate their relationship with us or withdraw funds, generally on short notice. Client terminations and withdrawals may be driven by a variety of factors, including economic conditions, investment performance, investor preferences or changes in our reputation in the marketplace. Significant terminations or withdrawals may reduce our AUM, thus adversely affecting our revenues and profitability.

In addition, fee levels can vary significantly among different types of investments. We generally earn higher fees on liquid alternatives and equity investments vs. fixed income investments and on actively managed investments vs. indexed or passive investment strategies. Therefore, our fee revenue is impacted by both the value and the composition of our AUM. Investor preferences with respect to asset classes and investment strategies may shift over time due to market conditions, tax law changes, regulatory changes and various other factors. Changes in the composition of our AUM may adversely affect our revenues and profitability.

33

Table of Contents

Guarantees within certain of our products that protect policyholders may decrease our net income or increase the volatility of our results of operations or financial position under U.S. GAAP if our hedging or risk management strategies prove ineffective or insufficient.

Certain of our variable annuity products include guaranteed minimum death benefits and/or guaranteed minimum withdrawal benefits. We use derivative instruments to attempt to mitigate changes in the exposure related to interest rate, equity market and volatility movements, and the volatility of net income associated with the liabilities for such products. However, we remain liable for the guaranteed benefits in the event that derivative counterparties are unable or unwilling to pay. The liability exposure and volatility of net income or OCI may also be influenced by changes in market credit spreads reflecting our own creditworthiness, for which we do not attempt to hedge. In addition, we are subject to the risk that hedging and other management procedures prove ineffective or that unanticipated policyholder behavior or mortality, combined with adverse market events, produces economic losses beyond the scope of the risk management techniques employed. These, individually or collectively, may have a material adverse effect on our net income, financial condition or liquidity. We are also subject to the risk that the cost of hedging these guaranteed minimum benefits increases as implied volatilities increase and/or interest rates decrease, resulting in a reduction to net income.

Our international businesses face political, legal, operational and other risks that could reduce our profitability in those businesses.

Our international businesses face political, legal, operational and other risks that we do not face in our operations in the U.S. We face the risk of discriminatory regulation, nationalization or expropriation of assets, price controls and exchange controls or other restrictions that prevent us from transferring funds from these operations out of the locations in which they operate or converting local currencies we hold into U.S. dollars or other currencies. Our international businesses could also be negatively impacted by rising geopolitical tension, competing legal requirements and increased strategic competition between the U.S. and other countries, such as China. In addition, our international businesses face the risk of political instability and social unrest, which heightens our risks as those may lead to disruptions to those businesses and to local financial markets and commerce and reduced economic activity in the countries in which we operate. Some of our international businesses are, and are likely to continue to be, in emerging or potentially volatile markets. For example, in Chile, a new government proposal to reform the mandatory pension system implies potential changes for fund managers and participants. A complex political environment creates uncertainty regarding the ultimate outcome of the lengthy legislative process toward reform. In addition, we rely on local staff, including local sales forces, in those locations where there is a risk and we may encounter labor problems with local staff, especially in locations where workers’ associations and trade unions are strong.

Laws in some countries may require more stringent data security such as requiring the processing and storage of their citizens’ personal information to remain in-country. This may result in higher compliance and technology expenses, as well as the suboptimization of business processes.

We face risks arising from fraudulent activities.

Our policyholders may submit fraudulent requests for claim payments. This can result in higher claims expense and higher operational expenses associated with preventing and detecting fraudulent claim requests and other fraudulent activities.

We face risks arising from our participation in joint ventures.

We participate in joint ventures, primarily in our international businesses and real estate investment operations. In these joint ventures, we lack complete management and operational control over the operations, and our joint venture partners may have objectives that are not fully aligned with our interests. These factors may limit our ability to take action to protect or increase the value of our investment in the joint venture.

34

Table of Contents

We may need to fund deficiencies in our Closed Block assets.

In connection with its conversion in 1998 into a stock life insurance company, Principal Life established an accounting mechanism, known as a “Closed Block” for the benefit of participating ordinary life insurance policies that had a dividend scale in force on July 1, 1998. We allocated assets to the Closed Block as of July 1, 1998, in an amount such that we expected the cash flows, together with anticipated revenues from the policies in the Closed Block, to be sufficient to support the Closed Block business, including payment of claims, certain direct expenses, charges and taxes and to provide for the continuation of aggregate dividend scales in accordance with the 1997 policy dividend scales if the experience underlying such scales continued, and to allow for appropriate adjustments in such scales if the experience changed. We will continue to pay guaranteed benefits under the policies included in the Closed Block, in accordance with their terms. The Closed Block assets, cash flows generated by the Closed Block assets and anticipated revenues from policies included in the Closed Block may not be sufficient to provide for the benefits guaranteed under these policies. If they are not sufficient, we must fund the shortfall. Even if they are sufficient, we may choose for business reasons to support dividend payments on policies in the Closed Block with our general account funds.

The Closed Block assets, cash flows generated by the Closed Block assets and anticipated revenues from policies in the Closed Block will benefit only the holders of those policies. In addition, to the extent these amounts are greater than the amounts estimated at the time we funded the Closed Block, dividends payable in respect of the policies included in the Closed Block may be greater than they would have been in the absence of a Closed Block. Any excess net income will be available for distribution over time to Closed Block policyholders but will not be available to our stockholders. See Item 8. “Financial Statements and Supplementary Data, Notes to Consolidated Financial Statements, Note 6, Closed Block” for further details.

Our reinsurers could default on their obligations or increase their rates, which could adversely impact our net income and financial condition.

We cede life, annuity, disability, medical and long-term care insurance to other insurance companies through reinsurance. See Item 8. “Financial Statements and Supplementary Data, Notes to Consolidated Financial Statements, Note 12, Reinsurance.” See Item 1. “Business,” for information about the Talcott Reinsurance Transaction. The collectability of reinsurance recoverables is largely dependent on the solvency of the individual insurers. We remain liable to the policyholder, even if the reinsurer defaults on its obligations with respect to the ceded business. In addition, a reinsurer’s insolvency may cause us to lose our reserve credits on the ceded business, in which case we would be required to establish additional reserves.

The premium rates we charge are based, in part, on the assumption that reinsurance will be available at a certain cost. Most of our reinsurance contracts contain provisions that limit the reinsurer’s ability to increase rates on in-force business; however, some do not. If a reinsurer raises the rates it charges on a block of in-force business, our profitability may be negatively impacted if we are not able to pass the increased costs on to the customer. If reinsurers raise the rates they charge on new business, we may be forced to raise the premiums we charge, which could have a negative impact on our competitive position.

We face risks arising from future acquisitions of businesses.

We have acquired businesses in the past and expect to continue to do so in the future. We face a number of risks arising from future acquisition transactions, including difficulties in integrating the acquired business into our operations, difficulties in assimilating and retaining employees and intermediaries, difficulties in retaining the existing customers of the acquired entity, unforeseen liabilities that arise in connection with the acquired business, unfavorable market conditions that could negatively impact our growth expectations for the acquired business and sustained declines in the equity market that could reduce the AUM and fee revenues for certain acquired businesses. These risks may prevent us from realizing the expected benefits from future acquisitions and could result in the impairment of goodwill and/or intangible assets recognized at the time of acquisition.

For additional information on our goodwill and other intangible assets, see Item 7. “Management’s Discussion and Analysis of Financial Condition and Results of Operations — Critical Accounting Policies and Estimates — Goodwill and Other Intangible Assets.”

We face risks in administering the Talcott Reinsurance Transaction.

We have a coinsurance with funds withheld reinsurance transaction with Talcott Life & Annuity Re, a limited liability company organized under the laws of the Cayman Islands and an affiliate of Talcott Resolution Life, Inc., a subsidiary of Sixth Street, pursuant to which we ceded our in-force U.S. retail fixed annuity and ULSG blocks of business. We face a number of on-going risks, including managing the relationships under reinsurance agreements, managing a smaller portfolio of general account assets and managing relationships with our distribution channels. These risks may prevent us from realizing the expected benefits from the Talcott Reinsurance Transaction and could result in the recapture of the ceded business upon the occurrence and continuation of certain events and higher costs related to managing the reinsured blocks of business.

35

Table of Contents

General risks

A pandemic, terrorist attack, military action or other catastrophic event could adversely affect our operations, net income or financial condition.

The occurrence of pandemic disease, man-made disasters such as terrorist attacks and military actions, and natural disasters could adversely affect our operations, net income or financial condition. For example, our mortality and morbidity experience could be adversely impacted by a catastrophic event. In addition, a severe catastrophic event may cause significant volatility in global financial markets, disruptions to commerce and reduced economic activity. Ongoing economic disruptions may lead to declines and volatility in interest rates or equity prices, either of which could adversely affect our results of operations and financial condition. The resulting macroeconomic conditions could adversely affect our cash flows, as well as the value and liquidity of our invested assets. We may also experience operational disruptions if our employees or third party service providers are unable or unwilling to work due to a catastrophic event.

Our financial results may be adversely impacted by global climate changes.

Atmospheric concentrations of carbon dioxide and other greenhouse gases have increased dramatically since the industrial revolution, resulting in a gradual increase in global average temperatures and an increase in the frequency and severity of natural disasters. These trends are expected to continue in the future and have the potential to impact nearly all sectors of the economy. We cannot predict the long-term impacts of climate change, but we will continue to monitor new developments in the future.

Potential impacts may include the following:

Changes in temperatures and air quality may adversely impact our mortality and morbidity rates. For example, increases in the level of pollution and airborne allergens may cause an increase in upper respiratory and cardiovascular diseases, leading to increased claims in our insurance businesses. However, the risk of increased mortality on our life insurance business may be partly offset by our payout annuity business, where an increase in mortality results in a decrease in benefit payments.
Climate change may impact asset prices, as well as general economic conditions. For example, rising sea levels may lead to decreases in real estate values in coastal areas. Additionally, government policies to slow climate change (e.g., setting limits on carbon emissions) may have an adverse impact on sectors such as utilities, transportation and manufacturing. Changes in asset prices may impact the value of our fixed income, real estate and commercial mortgage investments. We manage our investment risks by maintaining a well-diversified portfolio, both geographically and by sector. We also monitor our investments on an ongoing basis, allowing us to adjust our exposure to sectors and/or geographical areas that face severe risks due to climate change.
We maintain extensive business continuity and disaster recovery planning programs, including scenario planning and assessments. Nonetheless, a natural disaster that affects one of our office locations, or the office of a key service provider, could disrupt our operations and pose a threat to the safety of our employees.

Technological and societal changes may disrupt our business model and impair our ability to retain existing customers, attract new customers and maintain our profitability.

Technological advances, innovation in the financial services industry and societal changes may impact our business model and competitive position. These changes may lead to significant changes in the marketing, distribution, underwriting and pricing of financial services products. In addition, technological and societal changes may lead to changes in customers’ preferences as to how they want to interact with us and the types of products they want to buy. We may need to change our distribution channels, our customer service model or our product offerings to accommodate evolving customer preferences. Implementing these changes may require significant expenditures. To the extent our competitors are more successful than us at adapting to technological changes and evolving customer preferences, our competitive position and profitability may be adversely impacted.

Advances in medical technology may also adversely impact our profitability. Increases in the availability and accuracy of genetic testing may increase our exposure to anti-selection risk. In addition, medical advances may lead to increased longevity. As a result, we may be required to pay annuity benefits over a longer period of time than we had projected, thereby reducing the profitability of our annuity products.

36

Table of Contents

Damage to our reputation may adversely affect our revenues and profitability.

Our continued success is dependent upon our ability to earn and maintain the trust and confidence of customers, distributors, employees and other stakeholders. Damage to our reputation may arise from a variety of sources including, but not limited to, litigation or regulatory actions, compliance failures, employee misconduct, conduct of third parties working on our behalf, cybersecurity incidents or other fraudulent activities, unfavorable press coverage and unfavorable comments on social media. Adverse developments within our industry may also, by association, negatively impact our reputation or result in greater regulatory or legislative scrutiny. Any damage to our reputation could adversely affect our ability to attract and retain customers, distributors and employees, potentially leading to a reduction in our revenues and profitability.

We may not be able to protect our intellectual property and may be subject to infringement claims.

We rely on a combination of contractual rights and copyright, trademark, patent and trade secret laws to establish and protect our intellectual property. Third parties may infringe or misappropriate our intellectual property. We may have to litigate to enforce and protect our copyrights, trademarks, patents, trade secrets and know-how or to determine their scope, validity or enforceability, which represents a diversion of resources that may be significant in amount and may not prove successful. The loss of intellectual property protection or the inability to secure or enforce the protection of our intellectual property assets could have a material adverse effect on our business and our ability to compete.

We also may be subject to costly litigation in the event another party alleges our operations or activities infringe upon such other party’s intellectual property rights. Third parties may have, or may eventually be issued, patents or other protections that could be infringed by our products, methods, processes or services or could otherwise limit our ability to offer certain product features. Any party that holds such a patent could make a claim of infringement against us. We may also be subject to claims by third parties for breach of copyright, trademark, license usage rights or misappropriation of trade secret rights. Any such claims and any resulting litigation could result in significant liability for damages. If we were found to have infringed or misappropriated a third party patent or other intellectual property rights, we could incur substantial liability, and in some circumstances could be enjoined from providing certain products or services to our customers or utilizing and benefiting from certain methods, processes, copyrights, trademarks, trade secrets or licenses, or alternatively could be required to enter into costly licensing arrangements with third parties, all of which could have a material adverse effect on our business, results of operations and financial condition.

If we are unable to attract, develop and retain qualified employees and sales representatives and develop new distribution sources, our results of operations, financial condition and sales of our products may be adversely impacted.

Our continued success is largely dependent on our ability to attract, develop and retain qualified employees. We face intense competition in attracting and retaining key employees, including investment, marketing, finance, actuarial, data analytics, information security, technology, client service and other professionals. If we are unable to attract, develop and retain qualified employees, our results of operations and financial condition may be adversely impacted.

We distribute our asset accumulation, asset management, Life Insurance and Specialty Benefits products and services through a variety of distribution channels, including our own internal digital channels, sales representatives, independent brokers, banks, broker-dealers and other third party marketing organizations. We must attract and retain sales representatives to sell our products and digital professionals to build and enhance our customers’ digital experience. Strong competition exists among financial services companies for these roles. We compete with other financial services companies for sales representatives primarily on the basis of our financial position, support services and compensation and product features. If we are unable to attract and retain sufficient sales representatives to sell our products, our ability to compete and revenues from new sales would suffer.

Our ability to increase and retain AUM is directly related to the performance of our investments as measured against market averages and the performance of our competitors. If we are unable to attract and retain qualified portfolio managers, we may face reduced sales and increased cash outflows in our asset accumulation and asset management businesses.

37

Table of Contents

Interruptions in information technology, infrastructure or other internal or external systems used for our business operations, or a failure to maintain the confidentiality, integrity or availability of data residing on such systems, could disrupt our business, damage our reputation and adversely impact our profitability.

We rely on external infrastructure, proprietary information technology and third party systems and services to conduct business, including customer service, marketing and sales activities, customer relationship management, producing financial statements and technology/data centers. In addition, we store and process confidential and proprietary business information on both company-owned and third party and/or vendor managed systems, including cloud service providers. We increasingly rely on the internet in order to conduct business and may be adversely impacted by outages in critical infrastructure such as electric grids, undersea cables, satellites or other communications used by us or our third parties.

Financial services companies are regularly targeted by cyber criminals, and face various cybersecurity risks, resulting in unauthorized access, theft of funds, extortion, disruption or degradation of service or other damage. These attacks may take a variety of forms, including web application attacks, denial of service attacks, ransomware, malware, and social engineering, including phishing. We may also be adversely impacted by successful cyberattacks of partners, vendors and others in our supply chain with whom we conduct business or share information. Information security incidents may also occur due to the failure to control access to, and use of, sensitive systems or information by our workforce. The tactics and techniques used by cyber criminals to obtain unauthorized access, or otherwise impact our business negatively change frequently, and we, and our supply chain partners, may be unable to anticipate their schemes to implement preventative measures. The failure of our controls (such as policies, procedures, monitoring, software testing, incident response, and backup plans) designed to prevent, or limit the effect of, failure, inadvertent use or abuse could result in disruptions, reputational damage, legal liability, regulatory actions, remediation costs and competitive disadvantage.

Loss of key vendor relationships or failure of a vendor to protect information of our customers or employees could adversely affect our business or result in losses.

We rely on services and products provided by many vendors in the United States and abroad. These include, for example, vendors of computer hardware and software and vendors of services. In the event that one or more of our vendors suffers a bankruptcy or otherwise becomes unable to continue to provide products or services or fails to protect personal information of our customers or employees, we may suffer operational impairments, reputational damage and financial losses.

Our enterprise risk management framework may not be fully effective in identifying or mitigating all the risks to which we are exposed.

We utilize an integrated risk management framework, which is designed to manage material risks within established risk appetites and risk tolerances. Nonetheless, our policies and procedures may not be fully effective in identifying or mitigating every risk to which we are exposed. Many of our methods for managing and mitigating risk rely on models and assumptions that are based, in part, on observed historical data. As a result, these methods, models or assumptions may not accurately predict future exposures, which may be significantly greater than our historical measures indicate. We may be exposed to unanticipated risks as a result of changes in market conditions, new products or new business strategies, catastrophes or other unforeseen circumstances. If our risk management framework proves ineffective, we may suffer unexpected losses, which may adversely affect our results of operations and financial condition.

Item 1B. Unresolved Staff Comments

None.

Item 1C. Cybersecurity

Risk management is an essential component of our culture and business model. Guarding against the specific risks posed by cybersecurity threats has been and will continue to be very dynamic in nature, requiring that we remain agile and aware of internal and external changes. We recognize that cybersecurity threats can be among the most critical risks facing large companies. As a result, cybersecurity is treated as a Board-level matter and overseen by the Board. However, both the Board and management have an integral role in the identification, assessment and management of cybersecurity risk.

38

Table of Contents

The Board oversees management’s execution and performance of its risk management responsibilities, which includes cybersecurity threats. The Board receives at least one cybersecurity report every quarter from our Chief Information Officer, our Chief Information Security Officer, our Chief Risk Officer or other professionals. The Board also reviews and approves the business resiliency and information security programs intended to guard against cybersecurity and related risks. Lastly, the Board receives input on cybersecurity issues from external entities such as our independent auditor, regulators and consultants. Each of these steps further the Board’s efforts to ensure we have established and are proactively maintaining an enterprise-wide cybersecurity risk program with appropriate policies, practices and controls designed to ensure resiliency in the face of emerging threats.

Management holds relevant expertise in assessing and managing cybersecurity threats. Numerous members of management and employees across the information security and risk functions hold nationally recognized designations or certifications, including the Certified Information Systems Security Professional designation, Global Information Assurance Certifications or Amazon Web Services Cloud Certifications. We also provide role-based security training to workers with assigned information security-related roles and responsibilities. This includes topics on social engineering tactics and other general threats posed for system compromise and data loss. The initiatives and processes discussed further below also contribute to the expertise and experience of management.

The framework for our overall process for managing risk encompasses the management of risks posed by cybersecurity threats and is discussed further in Item 1. “Business, Risk Management.” As a general matter, we take a proactive approach to assessing and monitoring cybersecurity-specific risks that is oriented around monitoring emerging external threats, ensuring controls are in place to identify and manage risk within our technology environment and creating a culture of vigilance across the organization.

We test for and resolve weaknesses and vulnerabilities within our systems and applications by using network and infrastructure vulnerability testing and adversary emulation, also known as red teaming, and hire a third party to do the same at least once a year. We also undergo a third party maturity assessment of our information security program every two years and a third party enterprise penetration test annually. We leverage external resources to help define information security and technology standards for our environment.

Our cybersecurity controls are monitored and refined based on learnings from regular red team engagements and analysis by threat hunters. All cyber defense operations are enriched through a dedicated cybersecurity threat intelligence function. We collaborate with information security peers across the industry to maximize threat intelligence. Our threat intelligence program helps create awareness and understanding of potential cybersecurity threats and adversaries. We proactively assess potential risks presented by new services or systems integrated with our network or data and ensure appropriate controls are applied under such circumstances. We perform due diligence and monitor third party relationships based on risk profile to assess the suitability of their cybersecurity controls and protocols for the business operations or services for which they are engaged.

Our awareness and training program creates a risk-aware culture to ensure employees understand cybersecurity threats and are accountable for completing required training. We have empowered and conditioned our global workforce to recognize and resist phishing attempts with our simulated phishing program. At least quarterly, our employees are presented with simulated phishing scenarios that deliver hands-on experience and on-the-spot education opportunities. All engineers and employees holding equivalent roles who are involved in software development also receive mandated secure software development training.

We have an enterprise incident management plan that provides a framework for preparing for, managing and responding to cybersecurity incidents that may arise. The plan ensures stakeholders across the organization are identified who have the appropriate experience, training and expertise in incident management, and that the organization is well positioned to address incidents. For example, we carry out cybersecurity incident response exercises to develop widespread familiarity and experience in responding to cybersecurity incidents.

No risks from any known cybersecurity incidents have materially affected or are reasonably likely to materially affect our business strategy, results of operations or financial condition. For further discussion related to how cybersecurity risks may impact our performance in the future, see Item 1A. “Risk Factors.”

Item 2. Properties

As of December 31, 2023, we owned properties in our home office complex in Des Moines, Iowa, and leased space for various offices located throughout the U.S. and internationally. We believe that our owned and leased properties are suitable and adequate for our current business operations.

39

Table of Contents

Item 3. Legal Proceedings

Disclosure concerning legal proceedings can be found in Item 8. “Financial Statements and Supplementary Data, Notes to Consolidated Financial Statements, Note 16, Contingencies, Guarantees, Indemnifications and Leases” under the caption, “Litigation and Regulatory Contingencies” and Item 8. “Financial Statements and Supplementary Data, Notes to Consolidated Financial Statements, Note 14, Income Taxes” under the caption, “Other Tax Information,” which are incorporated here by this reference.

Information about our Executive Officers

The following information is furnished with respect to our executive officers, each of whom is elected by and serves at the pleasure of the Board.

Vivek Agrawal, 56, has been Executive Vice President and Chief Growth Officer of the Company and Principal Life since March 2023. Prior to joining the Company and Principal Life, he was a senior partner at McKinsey & Company, where he led consulting practices in both the United States and Asia and contributed to the growth of top-tier asset management, retirement, wealth management and insurance organizations.

Kamal Bhatia, 52, has been the President and Chief Executive Officer of Principal Asset Management of the Company and Principal Life since February 10, 2024, and President and Chief Executive Officer of Principal Funds since August 2019. Prior to his current position, he was the Global Head of Investments for Principal Asset Management from 2023 to February 10, 2024, and Chief Operating Officer of Principal Asset Management from 2020 to 2023. Previously, he held leadership roles at OC Private Capital, OppenheimerFunds, TIAA, Mellon Asset Management and Citigroup.

Thomas Cheong, 55, has been Executive Vice President of the Company since January 2021 and President, Principal Asia of the Company since March 2019. Thomas is from Singapore and is located in our Hong Kong office. Prior to his current position, he was Senior Vice President of the Company from 2019 to 2020 and served as Vice President, Head of North Asia of the Company from 2015 to 2019. Previously, he held several leadership roles in various Asia markets at Manulife Financial Corporation and Prudential UK.

Amy Friedrich, 53, has been President of Benefits and Protection since May 2017. Prior to her current position, she was Senior Vice President of the Specialty Benefits division of U.S. Insurance Solutions from 2015 to 2017 and Vice President of Specialty Benefits from 2008 to 2015.

Patrick Halter, 64, was President and Chief Executive Officer of Principal Asset Management of the Company and Principal Life from November 2022 until February 10, 2024. He is serving in an interim role of Division President of Principal Asset Management beginning on February 10, 2024, until his retirement from the Company and Principal Life on April 2, 2024. Previously, he was President of Global Asset Management of the Company and Principal Life from 2020 to 2022, Chief Executive Officer for Principal Global Investors from 2018 to 2022 and held leadership roles in Principal Global Investors and Principal Real Estate Investors.

Daniel Houston, 62, has been a director of the Company and Principal Life and President and Chief Executive Officer of the Company and Principal Life since August 2015. Prior to his current position, he held the same positions except was Chief Operating Officer (and not Chief Executive Officer) from 2014 to 2015. Previously, he served as President, Retirement, Insurance and Financial Services of the Company and Principal Life from 2010 to 2014 and held several leadership roles in Retirement and Income Solutions of the Company and Principal Life.

Kathleen Kay, 61, has been Executive Vice President of the Company and Principal Life since March 2022 and Chief Information Officer of the Company and Principal Life since May 2020. Prior to her current position, she was Senior Vice President of the Company and Principal Life from 2020 to 2022. Previously, she was Senior Vice President and Chief Information Officer of Pacific Gas & Electric Company from 2015 to 2020, Enterprise Chief Technology Officer at SunTrust from 2012 to 2015 and held leadership roles at Comerica Bank and OnStar of General Motors.

Natalie Lamarque, 47, has been Executive Vice President and General Counsel of the Company and Principal Life since July 2022 and Secretary of the Company and Principal Life since October 2022. Prior to her current position, she was with New York Life Insurance Company in various roles, including General Counsel from 2020 to 2022 and Deputy General Counsel from 2019 to 2020, both while a Senior Vice President; Vice President in Corporate Compliance from 2016 to 2019; and Associate General Counsel from 2014 to 2016. Previously, she served as an Assistant U.S. Attorney in the Criminal Division of the U.S. Attorney’s Office of the Southern District of New York and worked as an attorney at Debevoise & Plimpton LLP.

Christopher Littlefield, 57, has been President, Retirement and Income Solutions since March 2022. Prior to his current position, he was Executive Vice President and General Counsel of the Company and Principal Life from 2020 to 2022 and Secretary of the Company and Principal Life from 2020 to 2022. Previously, he served as President and Chief Executive Officer of Fidelity & Guaranty Life Insurance Holdings from 2014 to 2018 and held several leadership roles at Aviva USA Corporation and AmerUS Group Co.

40

Table of Contents

Kenneth McCullum, 59, has been Executive Vice President and Chief Risk Officer of the Company and Principal Life since April 2023. Prior to his current position, he was Senior Vice President and Chief Risk Officer from 2020 to 2023 and Vice President and Chief Actuary from 2015 to 2020. Previously, he served as Executive Vice President responsible for business development and in force management at Delaware Life Insurance Company from 2013 to 2015 and held several leadership roles at Sun Life Financial and the Hartford.

Deanna Strable-Soethout, 55, has been Executive Vice President and Chief Financial Officer of the Company and Principal Life since February 2017. Prior to her current position, she was Executive Vice President of the Company and Principal Life from 2016 to 2017 and President, U.S. Insurance Solutions of the Company and Principal Life from 2015 to 2017. Previously, she served as Senior Vice President of the Company and Principal Life from 2006 to 2015.

PART II

Item 5. Market for Registrant’s Common Equity, Related Stockholder Matters and Issuer Purchases of Equity Securities

Our common stock began trading on the New York Stock Exchange under the symbol “PFG” on October 23, 2001. Prior to such date, there was no established public trading market for our common stock. Effective December 15, 2017, we changed our listing to the Nasdaq Global Select Market and continue trading under the symbol “PFG”. On February 2, 2024, there were 210,544 stockholders of record of our common stock.

We have historically paid cash dividends on our common stock. Future dividend decisions will be based on and affected by a number of factors, including our results and financial requirements and the impact of regulatory restrictions. See Item 7. “Management’s Discussion and Analysis of Financial Condition and Results of Operations — Liquidity and Capital Resources” for a discussion of regulatory restrictions on Principal Life’s ability to pay dividends or make other distributions.

The following table presents the amount of our share purchase activity for the periods indicated:


Total number


of shares

Maximum dollar


purchased as

value of shares that


Total number

Average

part of publicly

may yet be purchased


of shares

price paid

announced

under the programs


Period

purchased (1)

per share

programs

(in millions) (2)


January 1, 2023 - January 31, 2023


673,543

$

87.99


673,543

$

930.0

February 1, 2023 - February 28, 2023


907,130

$

89.61


580,602

$

877.7

March 1, 2023 - March 31, 2023


547,054

$

87.06

449,119

$

838.8

April 1, 2023 - April 30, 2023


728,248

$

74.84

725,154

$

784.5

May 1, 2023 - May 31, 2023


606,186

$

70.92

599,336

$

742.0

June 1, 2023 - June 30, 2023


48,442

$

68.35

47,680

$

738.7

July 1, 2023 - July 31, 2023


665,447

$

79.91

665,447

$

685.6

August 1, 2023 - August 31, 2023


1,284,889

$

78.13

1,281,566

$

585.4

September 1, 2023 - September 30, 2023


617,532

$

76.35

615,920

$

538.4

October 1, 2023 - October 31, 2023


1,869,450

$

69.08

1,868,044

$

409.4

November 1, 2023 - November 30, 2023


636,388

$

68.93


636,388

$

365.5

December 1, 2023 - December 31, 2023


997,020

$

77.96


995,694

$

287.9

Total


9,581,329


9,138,493


(1)Includes the number of shares of common stock utilized to execute certain stock incentive awards and shares purchased as part of publicly announced programs.
(2)In January 2022, our Board authorized a share repurchase program of up to $1.6 billion of our outstanding common stock, which has no expiration. In February 2024, our Board authorized a share repurchase program of up to $1.5 billion of our outstanding common stock, which has no expiration and is in addition to the $287.9 million that remained available under our existing share repurchase authorization as of December 31, 2023.

41

Table of Contents

Item 7. Management’s Discussion and Analysis of Financial Condition and Results of Operations

The following analysis discusses our financial condition as of December 31, 2023, compared with December 31, 2022, our consolidated results of operations for the years ended December 31, 2023, 2022 and 2021, and, where appropriate, factors that may affect our future financial performance. The discussion should be read in conjunction with our audited consolidated financial statements and the related notes to the financial statements and the other financial information included elsewhere in this Form 10-K. On January 1, 2023, we adopted the guidance commonly referred to as long-duration targeted improvements (“LDTI”). Results for 2022 and 2021 are also presented under the new LDTI guidance in this Form 10-K.

Forward-Looking Information

Our narrative analysis below contains forward-looking statements intended to enhance the reader’s ability to assess our future financial performance. Forward-looking statements include, but are not limited to, statements that represent our beliefs concerning future operations, strategies, financial results or other developments, and contain words and phrases such as “anticipate,” “believe,” “plan,” “estimate,” “expect,” “intend” and similar expressions. Forward-looking statements are made based upon management’s current expectations and beliefs concerning future developments and their potential effects on us. Such forward-looking statements are not guarantees of future performance.

Actual results may differ materially from those included in the forward-looking statements as a result of risks and uncertainties. Those risks and uncertainties include, but are not limited to, the risk factors listed in Item 1A. “Risk Factors.”

Overview

We provide financial products and services through the following reportable segments:

Retirement and Income Solutions;
Principal Asset Management and
Benefits and Protection.

We also have a Corporate segment, which consists of the assets and activities that have not been allocated to any other segment. See Item 1. “Business” for a description of our reportable segments.

Economic Factors and Trends

Positive market performance led to an increase in account values in our Retirement and Income Solutions segment in 2023. Since account values are the base by which this business generates revenues, market performance volatility may impact our revenues in future quarters.

Positive market performance led to an increase in AUM managed by our Principal Global Investors operations in 2023. Since AUM is the base by which this business generates revenues, market performance volatility may impact our revenues in future quarters. Also included in revenues are borrower fees, transaction fees and performance fees, which can fluctuate between years. In our Principal International operations, local currency AUM is a key indicator of earnings growth. AUM and revenues were positively impacted by foreign currency fluctuations in 2023.

In our Benefits and Protection segment, premium and fee growth is a key indicator of earnings growth. Higher levels of unemployment may impact new sales in our businesses and reduce in-group growth in our Specialty Benefits business in the short-term.

Profitability

Our profitability depends in large part upon our amount of AUM and our ability to:

manage the difference between the investment income we earn and the interest we credit to policyholders;
generate fee revenues by providing trust and custody, administrative and investment management services;
price our insurance products at a level that enables us to earn a margin over the cost of providing benefits and the related expenses;
manage our investment portfolio to maximize investment returns and minimize risks such as interest rate changes or defaults or impairments of invested assets;

42

Table of Contents

effectively hedge fluctuations in foreign currency to U.S. dollar exchange rates on certain transactions and
manage our operating expenses.

Critical Accounting Policies and Estimates

The increasing complexity of the business environment and applicable authoritative accounting guidance requires us to closely monitor our accounting policies. Our significant accounting policies are described in Item 8. “Financial Statements and Supplementary Data, Notes to Consolidated Financial Statements, Note 1, Nature of Operations and Significant Accounting Policies.” We have identified critical accounting policies that are complex and require significant judgment and estimates about matters that are inherently uncertain. A summary of our critical accounting policies is intended to enhance the reader’s ability to assess our financial condition and results of operations and the potential volatility due to changes in estimates and changes in guidance. The identification, selection and disclosure of critical accounting policies and estimates have been discussed with the Board Audit Committee.

Valuation and Allowance for Credit Loss of Fixed Income Investments

Fixed Maturities. Fixed maturities include bonds, asset-backed securities (“ABS”), redeemable preferred stock and certain non-redeemable preferred securities. We classify our fixed maturities as either AFS or trading and, accordingly, carry them at fair value in the consolidated statements of financial position. Volatility in net income can result from changes in fair value of fixed maturities classified as trading. Volatility in other comprehensive income can result from changes in fair value of fixed maturities classified as AFS.

We measure the fair value of our financial assets and liabilities based on assumptions used by market participants in pricing the asset or liability, which may include inherent risk, restrictions on the sale or use of an asset, or nonperformance risk, including our own credit risk. For additional details concerning the methodologies, assumptions and inputs utilized see Item 8. “Financial Statements and Supplementary Data, Notes to Consolidated Financial Statements, Note 18, Fair Value Measurements” under the caption, “Determination of Fair Value.”

The fair values of our public fixed maturities are primarily based on market prices from third party pricing vendors. We have regular interactions with these vendors to ensure we understand their pricing methodologies and to confirm they are utilizing observable market information. In addition, 15% of our invested asset portfolio as of December 31, 2023, was invested in privately placed fixed maturities with no readily available market quotes to determine the fair market value. The majority of these assets are valued using a matrix pricing valuation approach that utilizes observable market inputs. In the matrix approach, securities are grouped into pricing categories that vary by sector, rating and average life. Each pricing category is assigned a risk spread based on observable public market data. The expected cash flows of the security are then discounted back at the current Treasury curve plus the appropriate risk spread. Although the matrix valuation approach provides a fair valuation of each pricing category, the valuation of an individual security within each pricing category may be impacted by company specific factors. This excludes privately placed securities subject to Rule 144A of the Securities Act of 1933 that are primarily based on market prices from third party pricing vendors, similar to public fixed maturities.

If we are unable to price a fixed maturity security using prices from third party pricing vendors or other sources specific to the asset class, we may obtain a broker quote or utilize an internal pricing model specific to the asset utilizing relevant market information, to the extent available and where at least one significant unobservable input is utilized. In addition, there may be certain securities managed by external managers where we obtain the valuation from the external manager when we are unable to obtain prices from third party pricing vendors or other sources. These are reflected in Level 3 in the fair value hierarchy and can include fixed maturities across all asset classes. As of December 31, 2023, approximately 3% of our total fixed maturities were Level 3 securities valued using internal pricing models. See Item 8. “Financial Statements and Supplementary Data, Notes to Consolidated Financial Statements, Note 18, Fair Value Measurements” for further discussion.

The $1,517.5 million decrease in net unrealized losses from U.S. investment operations for the year ended December 31, 2023, can primarily be attributed to a tightening of credit spreads. For additional information about interest rate risk see Item 7A. “Quantitative and Qualitative Disclosures About Market Risk.”

We have a process in place to identify fixed maturity securities that could potentially require an allowance for credit loss. This process involves monitoring market events that could impact issuers’ credit ratings, business climate, management changes, litigation and government actions and other similar factors. This process also involves monitoring late payments, pricing levels, downgrades by rating agencies, key financial ratios, financial statements, revenue forecasts and cash flow projections as indicators of credit issues.

43

Table of Contents

Each reporting period, all securities in an unrealized loss position are reviewed to determine whether a decline in value is due to credit. Relevant facts and circumstances considered include: (1) the extent the fair value is below cost; (2) the reasons for the decline in value; (3) the financial position and access to capital of the issuer, including the current and future impact of any specific events and (4) for structured securities, the adequacy of the expected cash flows. To the extent we determine an unrealized loss is due to credit, an allowance for credit loss is recognized through a reduction to net income. See Item 8. “Financial Statements and Supplementary Data, Notes to Consolidated Financial Statements, Note 4, Investments” under the caption, “Allowance for Credit Loss” for further discussion.

A number of significant risks and uncertainties are inherent in the process of monitoring credit losses and determining the allowance for credit loss. These risks and uncertainties include: (1) the risk that our assessment of an issuer’s ability to meet all of its contractual obligations will change based on changes in the credit characteristics of that issuer; (2) the risk that the economic outlook will be worse than expected or have more of an impact on the issuer than anticipated; (3) the risk that our investment professionals are making decisions based on fraudulent or misstated information in the financial statements provided by issuers and (4) the risk that new information obtained by us or changes in other facts and circumstances lead us to change our intent to not sell the security prior to recovery of its amortized cost. Any of these situations could result in a charge to net income in a future period. As of December 31, 2023, we had $48,178.6 million in AFS fixed maturities with gross unrealized losses totaling $5,872.9 million. Included in the gross unrealized losses are losses attributable to both movements in market interest rates as well as movement in credit spreads.

For more detailed information concerning allowances for credit loss, see Item 8. “Financial Statements and Supplementary Data, Notes to Consolidated Financial Statements, Note 4, Investments” under the caption, “Allowance for Credit Loss.”

Mortgage Loans. Mortgage loans consist primarily of commercial mortgage loans on real estate. Commercial mortgage loans on real estate are generally reported at cost adjusted for amortization of premiums and accrual of discounts, computed using the interest method and net of valuation allowances. We establish a valuation allowance for the risk of credit losses inherent in our mortgage loans, which is maintained at a level believed adequate by management to absorb estimated expected credit losses. The valuation allowance is based on amortized cost excluding accrued interest receivable and includes reserves for pools of financing receivables with similar risk characteristics. Amounts on loans deemed to be uncollectible are charged off and removed from the valuation allowance. The change in the valuation allowance provision is included in net realized capital gains (losses) on our consolidated statements of operations.

For more detailed information concerning mortgage loan valuation allowances, see Item 8. “Financial Statements and Supplementary Data, Notes to Consolidated Financial Statements, Note 4, Investments” under the caption, “Financing Receivables Valuation Allowance.”

Derivatives

We use derivatives primarily to hedge or reduce exposure to market risks. The fair values of exchange-traded derivatives are determined through quoted market prices. Exchange-traded derivatives include futures that are settled daily, which reduces their fair value in the consolidated statements of financial position. The fair values of privately negotiated contracts, which are usually referred to as over-the-counter (“OTC”) derivatives, that are cleared through centralized clearinghouses are determined through market prices published by the clearinghouses. Variation margin associated with OTC cleared derivatives is settled daily, which reduces their fair value in the consolidated statements of financial position. The fair values of non-cleared OTC derivatives are determined using either pricing valuation models that utilize market observable inputs or broker quotes. On an absolute fair value basis as of December 31, 2023, the majority of our OTC derivative assets and liabilities were valued using pricing valuation models using market observable data with less than 1% using broker quotes. See Item 8. “Financial Statements and Supplementary Data, Notes to Consolidated Financial Statements, Note 18, Fair Value Measurements” for further discussion. The fair values of our derivative instruments can be impacted by changes in interest rates, foreign exchange rates, credit spreads, equity indices and volatility, as well as other contributing factors. For additional information see Item 7A. “Quantitative and Qualitative Disclosures About Market Risk.”

We also issue certain annuity, universal life and other contracts that include embedded derivatives that have been bifurcated from the host contract. They are valued using a combination of historical data and actuarial judgment. See Item 8. “Financial Statements and Supplementary Data, Notes to Consolidated Financial Statements, Note 18, Fair Value Measurements” for further discussion. We include our assumption for own nonperformance risk in the valuation of these embedded derivatives. As our credit spreads widen or tighten, the fair value of the embedded derivative liabilities decrease or increase, leading to an increase or decrease in net income. If the current market credit spreads reflecting our own creditworthiness move to zero (tighten), the reduction to net income would be approximately $4.9 million, net of income taxes, based on December 31, 2023, reported amounts. In addition, the policyholder behavior assumptions used in the valuation of embedded derivatives include risk margins, which increase the fair value of the embedded derivative liabilities.

44

Table of Contents

We have entered into coinsurance with funds withheld reinsurance arrangements. For funds withheld agreements the economic benefit of the assets flow to reinsurance counterparties, however, we retain legal ownership of the assets within the funds withheld account. Therefore, the assets held under funds withheld agreements are included on our consolidated statements of financial position, with a corresponding funds withheld payable. The funds withheld payable also includes an embedded derivative that has been bifurcated from the host contract. The fair value of the embedded derivative is based on the change in the fair value of the underlying funds withheld investments using the valuation methods and assumptions described for our investments held.

The accounting for derivatives is complex and interpretations of the applicable accounting standards continue to evolve. Judgment is applied in determining the availability and application of hedge accounting designations and the appropriate accounting treatment. Judgment and estimates are used to determine the fair value of some of our derivatives. Volatility in net income can result from changes in fair value of derivatives that do not qualify or are not designated for hedge accounting and changes in fair value of embedded derivatives.

Market Risk Benefits

MRBs are contracts or contract features that provide protection to the policyholder from capital market risk such as equity, interest rate or foreign exchange risk and expose us to other-than-nominal capital market risk. We have certain annuity and other investment contracts that have GMWB and GMDB riders or a guarantee on the minimum account balance under certain qualifying events. These MRBs have been bifurcated from the host contract and are measured at fair value. The change in fair value is recognized in net income, with the exception of the change in fair value related to our own nonperformance risk, which is recognized in OCI. We use various derivative instruments to hedge against changes in fair value of MRBs related to market risk.

MRBs are valued using a combination of historical data and actuarial judgment. See Item 8. “Financial Statements and Supplementary Data, Notes to Consolidated Financial Statements, Note 11, Market Risk Benefits and Note 18, Fair Value Measurements” for further discussion. We include our assumption for own nonperformance risk in the valuation of these MRBs, which is based on the current market credit spreads for debt-like instruments we have issued and are available in the market. As our credit spreads widen or tighten, the fair value of MRB assets increase or decrease and the fair value of MRB liabilities decrease or increase, leading to an increase or decrease in OCI, respectively. If the current market credit spreads reflecting our own creditworthiness move to zero (tighten), the reduction to OCI would be approximately $113.1 million, net of income taxes, based on December 31, 2023, reported amounts. In addition, the policyholder behavior assumptions used in the valuation of MRBs include risk margins, which decrease the fair value of MRB assets and increase the fair value of MRB liabilities.

Goodwill and Other Intangible Assets

Goodwill and other intangible assets with indefinite lives are not amortized. Intangibles with finite lives are amortized over their estimated useful lives. We formally conduct our annual goodwill and other intangible asset impairment testing during the third quarter or more frequently if events or circumstances change that would more-likely-than-not create an impairment. Goodwill is tested at the reporting unit level, which is one level below the operating segment.

Annual goodwill impairment testing consists of qualitative or quantitative assessments. In the qualitative assessment, we assess relevant events and circumstances that could affect the significant inputs used to determine the fair value of the reporting unit. If when reviewing the qualitative factors it is determined it is more-likely-than-not that the fair value of a reporting unit is less than its carrying amount, a quantitative impairment test is performed.

The determination of fair value for our reporting units is primarily based on an income approach whereby we use discounted cash flows for each reporting unit. We apply significant judgment to our discounted cash flow models when determining the estimated fair value of our reporting units. The valuation methodologies utilized are subject to key judgments and assumptions that are sensitive to change. Estimates of fair value are inherently uncertain and represent only management’s reasonable expectation regarding future developments. These estimates and the judgments and assumptions upon which the estimates are based will in all likelihood differ in some responses from actual future results.

The key inputs, judgments and assumptions necessary in determining estimated fair value include:

weighted average cost of capital
long-term growth rate
corporate income tax rate
AUM growth rate

45

Table of Contents

net revenue growth rate
business margins on AUM and net revenue

For reporting units that performed a qualitative test of goodwill, we concluded the estimated fair values of all such reporting units were in excess of their carrying values and, therefore, goodwill was not impaired. Similarly, for reporting units that performed a quantitative test of goodwill, the estimated fair values of all such reporting units were in excess of their carrying values and, therefore, goodwill was not impaired.

For information about our goodwill and other intangible assets, see Item 8. “Financial Statements and Supplementary Data, Notes to Consolidated Financial Statements, Note 1, Nature of Operations and Significant Accounting Policies,” and “Note 2, Goodwill and Other Intangible Assets.”

Sensitivities. In connection with our annual impairment testing process, we performed a sensitivity analysis for goodwill impairment with respect to each of our reporting units and determined that a hypothetical 10% decline in the fair value would not result in an impairment of goodwill for any reporting unit. We cannot predict certain future events that might adversely affect the reported value of goodwill and other intangible assets that totaled $1,608.5 million and $1,469.8 million, respectively, as of December 31, 2023. Such events include, but are not limited to, strategic decisions made in response to economic and competitive conditions, the impact of the economic environment on our customer base, interest rate movements, declines in the equity markets, the legal environment in which the businesses operate or a material negative change in our relationships with significant customers.

Insurance Reserves

Reserves are liabilities representing estimates of the amounts that will come due, at some point in the future, to or on behalf of our policyholders. U.S. GAAP, allowing for some degree of managerial judgment, provides guidance for establishing reserves.

Future policy benefits and claims include reserves for individual traditional and group life insurance, disability, medical and long-term care insurance and individual and group annuities that provide periodic income payments. These reserves are computed using assumptions of mortality, interest, morbidity and lapse. These assumptions are based on our experience, industry results, emerging trends and future expectations.

For long-duration insurance contracts, reserves for individual and group annuities are generally equal to the present value of expected future policy benefit payments, while the reserves for non-participating term life insurance, individual disability income contracts and individual and group long-term care contracts is generally equal to the present value of expected future policy benefits less the present value of expected net premiums. Issue-year cohorts are used for the reserve calculation and assumptions are periodically reviewed and updated. Separate cohorts are used for the calculation of ceded reserves. An interest accretion rate is determined for an identified cohort and remains unchanged after the issue year. Reserves are remeasured as of each reporting date to reflect the current upper-medium grade fixed income instruments yields, with the impact reported in OCI. If the current upper-medium grade yields decrease 100 basis points, the reduction in OCI would be approximately $2.3 billion, net of income taxes, based on December 31, 2023, reported amounts.

Reserves for participating life insurance contracts are based on the net level premium reserve for death and endowment policy benefits. This net level premium reserve is calculated based on dividend fund interest rates and mortality rates guaranteed in calculating the cash surrender values described in the contract.

For short-duration contracts, significant changes in experience or assumptions may require us to provide for expected future losses on a product by establishing premium deficiency reserves. Our reserve levels are reviewed throughout the year using internal analysis including, among other things, experience studies, claim development analysis and annual loss recognition analysis. To the extent experience indicates potential loss recognition, we recognize losses on certain lines of business. The ultimate accuracy of the assumptions on these insurance products cannot be determined until the obligation of the entire block of business on which the assumptions were made is extinguished. Short-term variances of actual results from the assumptions used in the computation of the reserves are reflected in current period net income and can impact quarter-to-quarter net income.

46

Table of Contents

Future policy benefits and claims also include reserves for incurred but unreported disability, medical, dental, vision, critical illness, accident, hospital indemnity, PFML and life insurance claims. We recognize claims costs in the period the service was provided to our policyholders. However, claims costs incurred in a particular period are not known with certainty until after we receive, process and pay the claims. We determine the amount of this liability using actuarial methods based on historical claim payment patterns as well as emerging cost trends, where applicable, to determine our estimate of claim liabilities. We also look back to assess how our prior periods’ estimates developed. To the extent appropriate, changes in such development are recorded as a change to current period claim expense. Historically, the amount of the claim reserve adjustment made in subsequent reporting periods for prior period estimates have been within a reasonable range given our normal claim fluctuations.

Future policy benefits and claims also include benefit reserves that are established for universal life-type contracts that provide benefit features that are expected to produce gains in early years followed by losses in later years. The liabilities are accrued in relation to estimated contract assessments.

See Item 8. “Financial Statements and Supplementary Data, Notes to Consolidated Financial Statements, Note 10, Future Policy Benefits and Claims” for further discussion.

We periodically review and update actuarial assumptions that are used to project cash flows that are used to compute reserves. For more information see ‘‘Transactions Affecting Comparability of Results of Operations — Actuarial Assumption Updates.”

Benefit Plans

The reported expense and liability associated with pension and OPEB plans requires the use of assumptions. Numerous assumptions are made regarding the discount rate, expected long-term rate of return on plan assets, turnover, expected compensation increases, health care claim costs, health care cost trends, retirement rates and mortality. The discount rate and the expected return on plan assets have the most significant impact on the level of expense.

The assumed discount rate is determined by projecting future benefit payments inherent in the Projected Benefit Obligation and discounting those cash flows using a spot yield curve for high quality corporate bonds. Our assumed discount rates were 4.90% for our pension plans and 4.80% for our OPEB plans as of December 31, 2023. Typically, a 0.25% decrease in the discount rate would increase the pension benefits Projected Benefit Obligation by approximately $96.4 million and increase the Net Periodic Pension Cost (“NPPC”) by approximately $7.2 million. Typically, a 0.25% decrease in the discount rate would increase the OPEB accumulated postretirement benefit obligation by approximately $1.3 million and would have a nominal impact on the Net Periodic Benefit Cost (“NPBC”). Typically, a 0.25% increase in the discount rate would result in decreases in benefit obligations and changes in expenses at a level generally commensurate with those noted above.

The assumed long-term rate of return on plan assets is set at the long-term rate expected to be earned based on the long-term investment policy of the plans and the various classes of the invested funds. Historical and future expected returns of multiple asset classes were analyzed to develop a risk-free real rate of return and risk premiums for each asset class. The overall long-term rate for each asset class was developed by combining a long-term inflation component, the real risk-free rate of return and the associated risk premium. A weighted average rate was developed based on long-term returns for each asset class, the plan’s target asset allocation policy and the tax structure of the trusts. For the 2023 NPPC and 2023 NPBC, a 6.20% and 5.05% weighted average long-term rate of return was used, respectively. For the 2024 NPPC and 2024 NPBC, a 6.10% and 4.65% weighted average long-term rate of return assumption, respectively, will be used. Typically, a 0.25% decrease in the assumed long-term rate of return would increase the NPPC by approximately $7.0 million and the NPBC by approximately $0.2 million. Typically, a 0.25% increase in this rate would result in a decrease to expense at the same levels. The assumed return on plan assets is based on the fair market value of plan assets as of December 31, 2023.

The compensation increase assumption is generally set at a rate consistent with current and expected long-term compensation and salary policy, including inflation.

For pension costs, actuarial gains and losses are amortized using a straight-line amortization method over the average remaining service period of plan participants, which is approximately 10 years. For OPEB costs, actuarial gains and losses are amortized using a straight-line amortization method over the average future lifetime of the remaining covered group of retirees, which is approximately 14 years. The qualified pension plan does not utilize the allowable corridor, while the nonqualified pension plan and OPEB plans utilize the 10% corridor. Prior service costs are amortized on a weighted average basis over approximately 4 years for pension costs and 4 years for OPEB costs. See Item 8. “Financial Statements and Supplementary Data, Notes to Consolidated Financial Statements, Note 15, Employee and Agent Benefits” for further discussion.

47

Table of Contents

Income Taxes

We provide for income taxes based on our estimate of the liability for taxes due. Our tax accounting represents management’s best estimate of various events and transactions, such as completion of tax audits or establishment of, or changes to, a valuation allowance associated with certain deferred tax assets, which could affect our estimates and effective income tax rate in a particular quarter or annual period. Deferred tax liabilities and assets are determined based on the difference between the financial statement and tax bases of assets and liabilities using enacted tax rates expected to be in effect during the years in which the basis differences reverse. We are required to evaluate the recoverability of our deferred tax assets each quarter and establish a valuation allowance, if necessary, to reduce our deferred tax assets to an amount that is more-likely-than-not to be realizable. In determining the need for a valuation allowance, we consider many factors, including future reversals of existing taxable temporary differences, future taxable income exclusive of reversing temporary differences and carryforwards, taxable income in prior carryback years and implementation of any feasible and prudent tax planning strategies management would employ to realize the tax benefit.

Deferred income taxes (including federal, state and foreign withholding) have not been provided on approximately $1,362.6 million of accumulated but undistributed earnings from operations of foreign subsidiaries as of December 31, 2023. We do not record deferred income taxes on foreign earnings not expected to be distributed to the U.S. We apply an exception to the general rule, which under U.S. GAAP otherwise requires the recording of deferred income taxes on the anticipated repatriation of foreign earnings as recognized for financial reporting purposes. The exception permits us to not record a deferred income tax liability on foreign earnings we expect to be indefinitely reinvested in our foreign operations. The related deferred income taxes will be recorded in the period it becomes apparent we can no longer positively assert some or all the undistributed earnings will remain invested into the foreseeable future.

Inherent in the provision for income taxes are estimates and our expectations regarding the deductibility of certain items, the timing of income and expense recognition, future performance and the current or future realization of operating losses, capital losses and certain tax credits. We regularly evaluate the capital needs of our domestic and foreign operations considering all available information, including operating and capital plans, regulatory capital requirements, parent company financing and cash flow needs, as well as tax laws applicable to our domestic and foreign subsidiaries. In the event these estimates differ from our prior estimates due to the receipt of new information, we may be required to significantly change the provision for income taxes recorded in the consolidated financial statements. Any such change could significantly affect the amounts reported in the consolidated financial statements in the year these estimates change. A significant decline in value of financial assets could lead to establishment of a valuation allowance on deferred tax assets having an adverse effect on current and future results. In management’s judgment, total deferred income tax assets are more-likely-than-not to be realized.

In addition, the amount of income taxes paid is subject to audits in the U.S. as well as various state and foreign jurisdictions. Tax benefits are recognized for book purposes when the more-likely-than-not threshold is met with regard to the validity of an uncertain tax position. Once this threshold is met, for each uncertain tax position we recognize in earnings the largest amount of benefit that is greater than 50% likely of being realized upon ultimate settlement with the Internal Revenue Service or other income taxing authorities for audits ongoing or not yet commenced.

We had $223.8 million of current income tax payables associated with outstanding audit issues as of December 31, 2023. We believe there are adequate defenses against, or sufficient provisions for, the contested issues, but final resolution of contested issues could take several years while legal remedies are pursued. Consequently, we do not anticipate the ultimate resolution of audits ongoing or not yet commenced to have a material impact on our net income.

See Item 8. “Financial Statements and Supplementary Data, Notes to Consolidated Financial Statements, Note 14, Income Taxes” for further discussion.

Transactions Affecting Comparability of Results of Operations

Acquisition

China Pension Joint Venture. On December 28, 2022, we finalized the acquisition of a 17.647% interest in CCB Pension Management Co., Ltd. (“CCBP”), China Construction Bank’s pension business with the Social Security Fund of China. CCBP is the first and only asset manager to be permitted to run all types of pension investment portfolios within the country. The joint venture investment is reported using the equity method within the Principal Asset Management segment.

48

Table of Contents

Other

Actuarial Assumption Updates. We periodically review and update actuarial assumptions that are inputs to the models for the liability for future policy benefits for traditional limited-payment long-duration contracts and other actuarial balances. Assumption updates and model refinements made during the third quarter resulted in a change in cash flow assumptions that increased (decreased) consolidated net income attributable to Principal Financial Group, Inc. by $(9.7) million, $51.2 million and $(44.4) million for the years ended December 31, 2023, 2022 and 2021, respectively.

The following table presents the increase (decrease) to pre-tax operating earnings for each segment.


For the year ended December 31,


2023

2022

2021


(in millions)

Retirement and Income Solutions


$

53.4

$

1.8


$

(96.6)

Benefits and Protection

9.8

61.2

3.4

Talcott Reinsurance Transaction. During the second quarter of 2022, we closed a coinsurance with funds withheld reinsurance transaction with Talcott Life & Annuity Re, a limited liability company organized under the laws of the Cayman Islands and an affiliate of Talcott Resolution Life, Inc., a subsidiary of Sixth Street, pursuant to which we ceded our in-force U.S. retail fixed annuity and ULSG blocks of business. The economics of the Talcott Reinsurance Transaction were effective as of January 1, 2022.

Other Factors Affecting Comparability

Fluctuations in Foreign Currency to U.S. Dollar Exchange Rates

Fluctuations in foreign currency to U.S. dollar exchange rates for locations in which we have operations can affect reported financial results. In years when foreign currencies weaken against the U.S. dollar, translating foreign currencies into U.S. dollars results in fewer U.S. dollars to be reported. When foreign currencies strengthen, translating foreign currencies into U.S. dollars results in more U.S. dollars to be reported.

Foreign currency exchange rate fluctuations create variances in our financial statement line items. The most significant impact occurs within our Principal International operations where pre-tax operating earnings were positively impacted $6.8 million and negatively impacted $17.1 million for the years ended December 31, 2023 and 2022, respectively, as a result of fluctuations in foreign currency to U.S. dollar exchange rates. These impacts were calculated by comparing (a) the difference between current year results and prior year results to (b) the difference between current year results and prior year results translated using current year exchange rates for both periods. We use this approach to calculate the impact of exchange rates on all revenue and expense line items. For a discussion of our approaches to managing foreign currency exchange rate risk, see Item 7A “Quantitative and Qualitative Disclosures About Market Risk — Foreign Currency Risk.”

Effects of Inflation

The impact of inflation has not had a material effect on our annual consolidated results of operations over the past three years. However, we may be materially affected by inflation in the future.

Variable Investment Income

Variable investment income includes certain types of investment returns such as prepayment fees and income (loss) from certain elements of our other alternative asset classes, including results of value-add real estate sales activity. Due to its unpredictable nature, variable investment income may or may not be material to our financial results for a given reporting period and may create variances when comparing different reporting periods. For additional information, see “Investment Results.”

Recent Accounting Changes

For recent accounting changes, see Item 8. “Financial Statements and Supplementary Data, Notes to Consolidated Financial Statements, Note 1, Nature of Operations and Significant Accounting Policies” under the captions, “Recent Accounting Pronouncements” and “Adoption of Targeted Improvements to the Accounting for Long-Duration Insurance Contracts Guidance.”

49

Table of Contents

Results of Operations

The following table presents summary consolidated financial information for the years indicated:

For the year ended December 31,

Increase (decrease)


2023


2022


2021


2023 vs. 2022


2022 vs. 2021

(in millions)

Revenues:


Premiums and other considerations

$

6,470.9

$

5,339.7

$

4,841.5

$

1,131.2

$

498.2

Fees and other revenues


4,095.9


4,137.8


5,041.3


(41.9)


(903.5)

Net investment income


4,091.9


3,838.5


4,429.6


253.4


(591.1)

Net realized capital gains (losses)


(72.2)


(182.1)


115.4


109.9


(297.5)

Net realized capital gains on funds withheld assets

165.0

749.4

(584.4)

749.4

Change in fair value of funds withheld embedded derivative

(1,085.7)

3,652.8

(4,738.5)

3,652.8

Total revenues


13,665.8


17,536.1


14,427.8


(3,870.3)


3,108.3

Expenses:


Benefits, claims and settlement expenses


7,788.2


6,631.3


7,258.2


1,156.9


(626.9)

Liability for future policy benefits remeasurement gain


(51.6)


(264.5)


(4.4)


212.9


(260.1)

Market risk benefit remeasurement loss

29.1

125.3

98.3

(96.2)

27.0

Dividends to policyholders

89.2

94.8

94.8

(5.6)

Operating expenses


5,072.1


4,962.2


5,070.0


109.9


(107.8)

Total expenses


12,927.0


11,549.1


12,516.9


1,377.9


(967.8)

Income before income taxes


738.8


5,987.0


1,910.9


(5,248.2)


4,076.1

Income taxes


68.7


1,189.5


283.9


(1,120.8)


905.6

Net income


670.1


4,797.5


1,627.0


(4,127.4)


3,170.5

Net income attributable to noncontrolling interest


46.9


40.6


46.8


6.3


(6.2)

Net income attributable to Principal Financial Group, Inc.

$

623.2

$

4,756.9

$

1,580.2

$

(4,133.7)

$

3,176.7

Year Ended December 31, 2023 Compared to Year Ended December 31, 2022

Net Income Attributable to Principal Financial Group, Inc.

Net income attributable to Principal Financial Group, Inc. decreased primarily due to the change in fair value of the funds withheld embedded derivative.

Total Revenues

Premiums and other considerations increased $975.3 million for the Retirement and Income Solutions segment primarily due to higher sales of single premium group annuities with life contingencies. The single premium group annuity product, which is typically used to fund defined benefit plan terminations, can generate large premiums from very few customers and therefore premiums tend to vary from period to period.

Fees and other revenues decreased for the Principal Asset Management segment due to $62.7 million lower management fee revenue as a result of decreased average AUM managed by our Principal Global Investors operations and $35.4 million lower performance fee revenue for our Principal Global Investors operations primarily in our real estate business. These decreases were partially offset by $22.0 million foreign currency tailwinds for our Principal International operations in the Principal Asset Management segment and a $21.1 million increase to fees and other revenues for the Benefits and Protection segment primarily due to growth in the Life Insurance business.

For net investment income and net realized capital gains (losses) variance information, see “Investments — Investment Results” under the captions “Net Investment Income” and “Net Realized Capital Gains (Losses),” respectively.

Net realized capital gains on funds withheld assets decreased due to lower net gains on sales of funds withheld assets as a result of lower sales in 2023 resulting from less portfolio re-positioning by the external reinsurer.

The change in the fair value of the funds withheld embedded derivative resulted in a loss in 2023 due primarily to a tightening of credit spreads as compared to a gain in 2022 due primarily to increased interest rates.

Total Expenses

Benefits, claims and settlement expenses increased $1,325.4 million for the Retirement and Income Solutions segment primarily due to an increase in reserves, stemming from higher sales of single premium group annuities with life contingencies.

50

Table of Contents

Liability for future policy benefits remeasurement gain decreased primarily due to re-cohorting in the UL business in 2022 within the Benefits and Protection segment with no corresponding activity in 2023. See Item 1. “Financial Statements, Notes to Consolidated Financial Statements, Note 1, Nature of Operations and Significant Accounting Policies - Actuarial Balance Re-Cohorting” for further discussion.

The market risk benefit remeasurement loss decreased primarily due to a $226.0 million favorable impact from periodic and final settlements for derivatives used to hedge MRBs. This change was partially offset by a $129.9 million unfavorable impact from the change in fair value of the MRB asset (liability), excluding impacts of nonperformance risk, primarily driven by changes in market movements. See Item 8. “Financial Statements and Supplementary Data, Notes to Consolidated Financial Statements, Note 11, Market Risk Benefits” for further information on market effects.

Operating expenses increased primarily due to a $122.6 million increase in compensation costs and a $105.6 million increase in amounts credited to employee accounts in a nonqualified defined contribution pension plan. These increases were partially offset by $160.5 million in strategic review costs and impacts related to the exited business incurred in 2022 with no corresponding activity in 2023.

Income Taxes

The effective income tax rate decreased to 9% for the year ended December 31, 2023 from 20% for the year ended December 31, 2022 primarily due to a decrease in pre-tax income with no proportionate change in permanent tax differences. See Item 8. “Financial Statements and Supplementary Data, Notes to Consolidated Financial Statements, Note 14, Income Taxes” under the caption, “Effective Income Tax Rate” for further discussion.

Year Ended December 31, 2022 Compared to Year Ended December 31, 2021

Net Income Attributable to Principal Financial Group, Inc.

Net income attributable to Principal Financial Group, Inc. increased primarily due to the change in the fair value of the funds withheld embedded derivative.

Total Revenues

Premiums and other considerations increased for the Benefits and Protection segment primarily due to a $274.7 million increase from growth in the Specialty Benefits business and a $201.9 million increase in premiums in the Life Insurance business primarily related to the retrocession of ceded premiums as a result of the Talcott Reinsurance Transaction in 2022.

Fees and other revenues decreased $559.1 million for the Benefits and Protection segment primarily due to the Talcott Reinsurance Transaction. Fees and other revenues decreased $142.3 million for the Retirement and Income Solutions segment primarily resulting from declining financial markets. Fees and other revenues decreased for the Principal Asset Management segment largely due to $79.4 million lower management fee revenue as a result of decreased average AUM managed by our Principal Global Investors operations.

For net investment income and net realized capital gains (losses) variance information, see “Investments — Investment Results” under the captions “Net Investment Income” and “Net Realized Capital Gains (Losses),” respectively.

Net realized capital gains on funds withheld assets increased as a result of the sale of funds withheld assets associated with the Talcott Reinsurance Transaction in 2022.

The change in the fair value of the funds withheld embedded derivative increased due to an increase in interest rates following the establishment of the funds withheld payable associated with the Talcott Reinsurance Transaction in 2022.

Total Expenses

Benefits, claims and settlement expenses decreased $515.6 million for the Benefits and Protection segment primarily due to the Talcott Reinsurance Transaction. Benefits, claims and settlement expenses decreased $219.2 million for the Retirement and Income Solutions segment primarily due to a decrease in reserves, stemming from the impact of our exited retail fixed annuity business.

Liability for future policy benefits remeasurement gain increased primarily due to a $201.1 million benefit from re-cohorting in the UL business in 2022 within the Benefits and Protection segment with no corresponding activity in 2021 and a $43.3 million favorable effect of changes in cash flow assumptions for the Benefits and Protection segment driven by actuarial assumption updates and model refinements. See Item 1. “Financial Statements, Notes to Consolidated Financial Statements, Note 1, Nature of Operations and Significant Accounting Policies - Actuarial Balance Re-Cohorting” for further discussion.

51

Table of Contents

The market risk benefit remeasurement loss increased primarily due to a $199.1 million unfavorable impact from periodic and final settlements for derivatives used to hedge MRBs. This change was partially offset by a $172.0 million favorable impact from the change in fair value of the MRB asset (liability), excluding impacts of nonperformance risk, primarily driven by changes in market movements. See Item 8. “Financial Statements and Supplementary Data, Notes to Consolidated Financial Statements, Note 11, Market Risk Benefits” for further information on market effects.

Operating expenses decreased primarily due to $157.0 million of lower incentive compensation costs and a $139.5 million decrease in amounts credited to employee accounts in a nonqualified defined contribution pension plan. These decreases were partially offset by $160.5 million in strategic review costs and impacts related to the exited business incurred in 2022 with no corresponding activity in 2021.

Income Taxes

The effective income tax rate increased to 20% for the year ended December 31, 2022, from 15% for the year ended December 31, 2021, primarily due to a 3% impact related to a decrease of available foreign tax credits on the U.S. taxation of international operations and a 2% impact of an increase in pre-tax income with no proportionate increase in permanent tax differences. See Item 8. “Financial Statements and Supplementary Data, Notes to Consolidated Financial Statements, Note 14, Income Taxes” under the caption, “Effective Income Tax Rate” for further discussion.

Results of Operations by Segment

For results of operations by segment see Item 8. “Financial Statements and Supplementary Data, Notes to Consolidated Financial Statements, Note 20, Segment Information.” Beginning in 2022, segment pre-tax operating earnings excludes amounts associated with our exited U.S. retail fixed annuity and ULSG businesses, including strategic review costs and impacts, amortization of reinsurance gain (loss), other impacts of reinsured businesses, net realized capital gains (losses) on funds withheld assets and the change in fair value of the funds withheld embedded derivative.

Retirement and Income Solutions Segment

Retirement and Income Solutions Trends

Several key factors impact revenue and earnings growth in the Retirement and Income Solutions segment. These factors include: the ability of our distribution channels to generate new sales and retain existing business; pricing decisions that take account of competitive conditions, persistency, investment returns, mortality trends, and operating expense levels; investment management performance; equity market returns and interest rate changes. Profitability ultimately depends on our ability to price products and invest assets at a level that enables us to earn a margin over the cost of providing benefits and the expense of acquiring and administering those products.

Net revenue and average monthly account values are key metrics used to understand Retirement and Income Solutions earnings growth. Net revenue, which is used only at the segment level, is defined as operating revenues less benefits, claims and settlement expenses; liability for future policy benefits remeasurement (gain) loss; market risk benefit remeasurement (gain) loss and dividends to policyholders. Net revenue is impacted by: (1) changes in the equity markets and interest rates and (2) the difference between investment income earned on the underlying general account assets and the interest rate credited to the contracts. Average monthly account values include the net balances that customers have accumulated within their account, along with future policy benefits for retirement payout products. Average monthly account values are primarily impacted by net customer cash flows and credit market performance.

The following table presents the Retirement and Income Solutions segment net revenue for the years indicated:

For the year ended December 31,

Increase (decrease)


2023


2022


2021


2023 vs. 2022


2022 vs. 2021

Net revenue (in millions)

$

2,690.3

$

2,616.5

$

2,792.3

$

73.8

$

(175.8)

Average monthly account values (in billions)

$

476.5

$

477.2

$

459.9

$

(0.7)

$

17.3

52

Table of Contents

Retirement and Income Solutions Segment Summary Financial Data

The following table presents certain summary financial data relating to the Retirement and Income Solutions segment for the years indicated:

For the year ended December 31,

Increase (decrease)


2023


2022


2021


2023 vs. 2022


2022 vs. 2021

(in millions)

Operating revenues:

Premiums and other considerations

$

2,935.0

$

1,959.7

$

1,883.6

$

975.3

$

76.1

Fees and other revenues


1,675.0


1,665.4


1,817.0


9.6


(151.6)

Net investment income


2,640.2


2,274.1


2,728.8


366.1


(454.7)

Total operating revenues


7,250.2


5,899.2


6,429.4


1,351.0


(530.2)

Expenses:


Benefits, claims and settlement expenses, including dividends to policyholders


4,624.2


3,290.7


3,547.0


1,333.5


(256.3)

Liability for future policy benefits remeasurement gain

(68.0)

(11.1)

(3.8)

(56.9)

(7.3)

Market risk benefit remeasurement loss

3.7

3.1

93.9

0.6

(90.8)

Operating expenses


1,638.9


1,657.4


1,819.7


(18.5)


(162.3)

Total expenses


6,198.8


4,940.1


5,456.8


1,258.7


(516.7)

Pre-tax operating earnings

$

1,051.4

$

959.1

$

972.6

$

92.3

$

(13.5)

Year Ended December 31, 2023 Compared to Year Ended December 31, 2022

Pre-Tax Operating Earnings

Pre-tax operating earnings increased primarily due to an increase in net revenue and a decrease in operating expenses as described below.

Net Revenue

Net revenue increased $83.4 million primarily due to the rising interest rate environment and a $51.6 million impact associated with actuarial assumption updates and model refinements, which were more favorable in 2023 compared to 2022. These increases were partially offset by a $63.6 million decrease in variable investment income.

Operating Expenses

Operating expenses decreased primarily due to a $13.9 million decrease associated with the integration of the IRT business of Wells Fargo Bank, N.A., which was completed in the second quarter of 2022.

Year Ended December 31, 2022 Compared to Year Ended December 31, 2021

Pre-Tax Operating Earnings

Pre-tax operating earnings decreased due to a decrease in our net revenue partially offset by a decrease in operating expenses as described below.

Net Revenue

Net revenue decreased primarily due to a $285.6 million decrease associated with the impacts of our exited retail fixed annuity business, a $152.7 million decrease in fee revenue primarily resulting from declining financial markets and a $149.9 million decrease in variable investment income. These decreases were partially offset by a $229.0 million increase associated with higher net yields, a $133.8 million impact associated with actuarial assumption updates and model refinements, which were favorable in 2022 compared to unfavorable in 2021 and a $46.0 million increase in revenue from our Principal Deposit Sweep program resulting from growth in the business.

Operating Expenses

Operating expenses decreased primarily due to a $75.1 million impact from our exited retail fixed annuity business and a $67.6 million decrease associated with the integration of the IRT business of Wells Fargo Bank, N.A., which was completed in the second quarter of 2022.

53

Table of Contents

Principal Asset Management Segment

Principal Global Investors AUM

AUM is the base by which we generate management fee revenues. Market performance and net cash flow are the two main drivers of AUM growth. Market performance reflects equity, fixed income, real estate and other alternative investment performance. Net cash flow reflects client deposits and withdrawals. The fee levels on these client deposits and withdrawals are increasingly becoming the more important factor to revenue growth and will vary widely based on business and/or product mix.

Our overall AUM increased $34.8 billion in 2023 driven by positive market performance. We continue to expand our global presence and believe we are well positioned to capture changing market conditions and client needs.

The following table provides a summary of AUM managed by Principal Global Investors by the business area that sourced or generated the AUM. Principal Global Investors sourced represents institutional and fund platform AUM sourced by Principal Global Investors’ distribution teams. General account represents general account assets of domestic insurance companies and other balance sheet assets. Other affiliated sources represents AUM sourced by other PFG businesses (e.g., separate account assets). The amounts include assets managed by Principal Global Investors on behalf of Principal International, which are also reported in the Principal International AUM table below.


December 31, 2023


December 31, 2022


December 31, 2021


(in billions)


Principal Global Investors sourced

$

255.0

$

241.6

$

275.9

General account


67.4

63.2


98.1

Other affiliated sources


177.1

159.9


172.5

Total AUM

$

499.5

$

464.7

$

546.5

The following table presents the AUM rollforward for assets managed by Principal Global Investors for the periods indicated. The amounts include assets managed by Principal Global Investors on behalf of Principal International, which are also reported in the Principal International AUM table below.

For the year ended December 31,


2023


2022


2021

(in billions)

AUM, beginning of period

$

464.7

$

546.5

$

502.1

Net cash flow


(10.6)


4.4


(0.5)

Market performance

45.8

(81.1)

53.3

Operations acquired (1)


18.6


Operations disposed (2)


(0.2)


(23.1)


(1.2)

Other (3) 


(0.2)


(0.6)


(7.2)

AUM, end of period

$

499.5

$

464.7

$

546.5

(1)

Includes the integration of Institutional Asset Advisory, which is associated with our IRT business, in 2022.

(2)

$23.1 billion of Principal Global Investors managed AUM was transferred to third parties per the Talcott Reinsurance Transaction in 2022.

(3)

2021 includes the removal of $4.7 billion of AUM due to an internal definition change relating to AUM and AUA.

Principal International AUM

AUM is generally a key indicator of earnings growth for Principal International, as AUM is the base by which we can generate local currency profits. The Cuprum business in Chile differs in that the majority of fees are collected with each deposit by the mandatory retirement customers, based on a capped salary level, as opposed to asset levels. Net customer cash flow and market performance are the two main drivers of local currency AUM growth. Net customer cash flow reflects our ability to attract and retain client deposits. Market performance reflects the investment returns on our underlying AUM. Our financial results are also impacted by fluctuations of the foreign currency to U.S. dollar exchange rates for the locations in which we have business. AUM of our foreign subsidiaries is translated into U.S. dollar equivalents at the end of the reporting period using the spot foreign exchange rates. Revenue and expenses for our foreign subsidiaries are translated into U.S. dollar equivalents at the average foreign exchange rates for the reporting period.

54

Table of Contents

The following table presents the Principal International AUM rollforward for the periods indicated. The amounts include assets managed by Principal Global Investors on behalf of Principal International, which are also reported in the Principal Global Investors AUM table above, as well as assets managed by other managers.

For the year ended December 31,


2023


2022


2021

(in billions)

AUM, beginning of period

$

156.5

$

152.1

$

165.2

Net cash flow


2.1


(0.8)


2.0

Market performance


15.3


2.7


4.3

Operations disposed (1)


(0.2)


(1.2)

Effect of exchange rates


7.0


2.8


(13.7)

Other (2)


(0.3)


(0.3)


(4.5)

AUM, end of period

$

180.4

$

156.5

$

152.1

(1)During 2021, we exited our retail investment and retirement business in India.
(2)Includes Chile hardship withdrawals of $2.8 billion for the year ended December 31, 2021. Also includes the 2021 removal of $1.7 billion of distribution only AUM since it has no impact on the Principal International’s future management fee revenues.

Principal Asset Management Segment Summary Financial Data

The following table presents certain summary financial data relating to the Principal Asset Management segment for the periods indicated:

For the year ended December 31,

Increase (decrease)

2023


2022


2021

2023 vs. 2022

2022 vs. 2021

(in millions)

Operating revenues:


Premiums and other considerations

$

29.0

$

77.7

$

127.5

$

(48.7)

$

(49.8)

Fees and other revenues


2,018.9


2,108.9


2,294.3


(90.0)


(185.4)

Net investment income


734.4


994.7


771.2


(260.3)


223.5

Total operating revenues


2,782.3


3,181.3


3,193.0


(399.0)


(11.7)

Expenses:


Benefits, claims and settlement expenses


422.9


758.9


599.6


(336.0)


159.3

Liability for future policy benefits remeasurement (gain) loss

0.9

(4.7)

(4.9)

5.6

0.2

Operating expenses


1,534.2


1,516.5


1,552.2


17.7


(35.7)

Total expenses


1,958.0


2,270.7


2,146.9


(312.7)


123.8

Pre‑tax operating earnings attributable to noncontrolling interest


6.6


7.9


10.0


(1.3)


(2.1)

Pre‑tax operating earnings

$

817.7

$

902.7

$

1,036.1

$

(85.0)

$

(133.4)

Year Ended December 31, 2023 Compared to Year Ended December 31, 2022

Pre-Tax Operating Earnings

Pre-tax operating earnings decreased in our Principal Global Investors operations primarily due to $62.7 million lower management fee revenue as a result of decreased average AUM and $35.4 million lower performance fee revenue primarily in our real estate business.

Year Ended December 31, 2022 Compared to Year Ended December 31, 2021

Pre-Tax Operating Earnings

Pre-tax operating earnings decreased in our Principal Global Investors operations primarily due to $79.4 million lower management fee revenue as a result of decreased average AUM and a $28.3 million increase in non-variable staff costs. Pre-tax operating earnings decreased in our Principal International operations primarily due to $27.3 million of unfavorable relative market performance on our required regulatory investments.

55

Table of Contents

Benefits and Protection Segment

Benefits and Protection Segment Summary Financial Data

Premium and fees are a key metric for growth in the Benefits and Protection segment. We receive premiums on our specialty benefits insurance products as well as our traditional life insurance products. Fees are generated from our universal life, variable universal life and indexed universal life insurance products. We use several reinsurance programs to help manage the mortality and morbidity risk. Premium and fees are reported net of reinsurance premiums.

The following table presents the Benefits and Protection segment premium and fees for the years indicated:

For the year ended December 31,

Increase (decrease)

2023


2022


2021

2023 vs. 2022

2022 vs. 2021

(in millions)

Specialty Benefits


$

3,055.0


$

2,804.8


$

2,530.3


$

250.2


$

274.5

Life Insurance


922.2


922.5


1,279.6


(0.3)


(357.1)

The following table presents certain summary financial data relating to the Benefits and Protection segment for the years indicated:

For the year ended December 31,

Increase (decrease)

2023


2022


2021

2023 vs. 2022

2022 vs. 2021

(in millions)

Operating revenues:


Premiums and other considerations

$

3,534.1

$

3,306.5

$

2,830.4

$

227.6

$

476.1

Fees and other revenues


441.3


420.2


979.3


21.1


(559.1)

Net investment income


575.9


576.1


982.7


(0.2)


(406.6)

Total operating revenues


4,551.3


4,302.8


4,792.4


248.5


(489.6)

Expenses:


Benefits, claims and settlement expenses 


2,576.3


2,453.4


3,065.1


122.9


(611.7)

Dividends to policyholders

89.0

94.6

94.6

(5.6)

Liability for future policy benefits remeasurement (gain) loss


16.0


(43.8)


4.3


59.8


(48.1)

Operating expenses


1,332.4


1,228.3


1,261.5


104.1


(33.2)

Total expenses


4,013.7


3,732.5


4,425.5


281.2


(693.0)

Pre‑tax operating earnings

$

537.6

$

570.3

$

366.9

$

(32.7)

$

203.4

Year Ended December 31, 2023 Compared to Year Ended December 31, 2022

Pre-Tax Operating Earnings

Pre-tax operating earnings in our Specialty Benefits business increased $32.4 million due to growth in the business. Pre-tax operating earnings in our Life Insurance business decreased $35.6 million due to lower investment income ($17.8 million resulting from the impacts of 2022 reserve financing transactions and $17.8 million from lower variable investment income) and $12.0 million due to unfavorable actuarial assumption updates in 2023 compared to favorable impacts in 2022.

Operating Revenues

Premiums and fees in our Specialty Benefits business increased $250.2 million primarily due to growth in business.

Total Expenses

Benefits, claims and settlement expenses in our Specialty Benefits business increased $154.3 million from growth in the business, offset by $41.2 million from improved claims experience and $29.8 million in lower COVID-19 claims. Benefits, claims and settlement expenses in our Life Insurance business increased $42.7 million from mark-to-mark changes on options associated with our indexed universal life insurance.

Liability for future policy benefits remeasurement (gain) loss changed due to less favorable actuarial assumption updates and model refinements in 2023 compared to favorable in 2022.  

Operating expenses increased primarily due to growth in the business.

56

Table of Contents

Year Ended December 31, 2022 Compared to Year Ended December 31, 2021

Pre-Tax Operating Earnings

Pre-tax operating earnings increased in our Specialty Benefits business due to $57.2 million in more favorable actuarial assumption updates and model refinements in 2022 compared to 2021, $55.4 million in lower COVID-19 claims in 2022 compared to 2021, $30.6 million due to growth in the business and $21.5 million from strong expense management.

Operating Revenues

Premium and fees in our Specialty Benefits business increased $274.5 million from growth in the business. Premium and fees decreased in our Life Insurance business $365.7 million primarily due to the impact of our exited ULSG business.

Net investment income in our Life Insurance business decreased $325.9 million primarily due to the impact of our exited ULSG business and $40.7 million due to lower variable investment income.

Total Expenses

Benefits, claims and settlement expenses in our Specialty Benefits business increased $174.3 million from growth in the business, partially offset by $55.4 million in lower COVID-19 claims and $51.1 million from improved claims experience. Benefits, claims and settlement expenses in our Life Insurance business decreased $604.9 million primarily due to the impact of our exited ULSG business, $27.0 million from mark-to-market changes on options associated with our indexed universal life insurance and $24.3 million due to lower COVID-19 claims.

Liability for future policy benefits remeasurement (gain) loss in our Specialty Benefits business changed $52.5 million due to more favorable actuarial assumption updates and model refinements in 2022 compared to 2021.

Operating expenses in our Specialty Benefits business increased $86.3 million primarily due to growth in the business, offset by $21.5 million from expense management. Operating expenses in our Life insurance business decreased $95.7 million primarily associated with the impact of our exited ULSG business.

Corporate Segment

Corporate Segment Summary Financial Data

The following table presents certain summary financial data relating to the Corporate segment for the years indicated:

For the year ended December 31,

Increase (decrease)

2023


2022


2021

2023 vs. 2022

2022 vs. 2021

(in millions)

Total operating revenues


$

76.4


$

17.1


$

27.9


$

59.3


$

(10.8)

Total expenses


453.6


424.3


372.4


29.3


51.9

Pre‑tax operating earnings attributable to noncontrolling interest


19.6


62.2


23.5


(42.6)


38.7

Pre-tax operating losses

$

(396.8)

$

(469.4)

$

(368.0)

$

72.6

$

(101.4)

Year Ended December 31, 2023 Compared to Year Ended December 31, 2022

Pre-Tax Operating Losses

Pre-tax operating losses decreased primarily due to higher net investment income largely resulting from mark-to-market gains on investments in 2023 relative to mark-to-market losses in 2022.

Year Ended December 31, 2022 Compared to Year Ended December 31, 2021

Pre-Tax Operating Losses

Pre-tax operating losses increased primarily due to lower net investment income largely resulting from mark-to-market losses on investments in 2022 relative to mark-to-market gains in 2021.

57

Table of Contents

Liquidity and Capital Resources

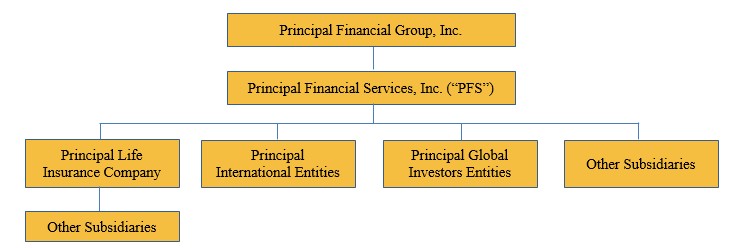
Liquidity and capital resources represent the overall strength of a company and its ability to generate strong cash flows, borrow funds at a competitive rate and raise new capital to meet operating and growth needs. We are monitoring our liquidity closely and feel confident in our ability to meet all long-term obligations to customers, policyholders and debt holders. Our sources of strength include our laddered long-term debt maturities with the next maturity occurring in 2025, access to revolving credit facility and contingent funding arrangements, a strong risk-based capital position and our available cash and liquid assets. Our legal entity structure has an impact on our ability to meet cash flow needs as an organization. Following is a simplified organizational structure.

Graphic

Liquidity

Our liquidity requirements have been and will continue to be met by funds from consolidated operations as well as the issuance of commercial paper, common stock, debt or other capital securities and borrowings from credit facilities. We believe the cash flows from these sources are sufficient to satisfy the current liquidity requirements of our operations, including reasonably foreseeable contingencies.

We maintain a level of cash and securities which, combined with expected cash inflows from investments and operations, we believe to be adequate to meet anticipated short-term and long-term payment obligations. We will continue our prudent capital management practice of regularly exploring options available to us to maximize capital flexibility, including accessing the capital markets and careful attention to and management of expenses.

We perform rigorous liquidity stress testing to ensure our asset portfolio includes sufficient high quality liquid assets that could be utilized to bolster our liquidity position under increasingly stressed market conditions. These assets could be utilized as collateral for secured borrowing transactions with various third parties or by selling the securities in the open market if needed.

We also manage liquidity risk by limiting the sales of liabilities with features such as puts or other options that can be exercised at inopportune times. For example, as of December 31, 2023, approximately $14.8 billion, or 99%, of our institutional guaranteed investment contracts and funding agreements cannot be redeemed by contractholders prior to maturity. Our individual annuity liabilities also contain surrender charges and other provisions limiting early surrenders.

The following table summarizes the withdrawal characteristics of our domestic general account investment contracts as of December 31, 2023.


Contractholder funds,


net of reinsurance

Percentage

(in millions)


Not subject to discretionary withdrawal

$

15,746.6


57.2

%

Subject to discretionary withdrawal with adjustments:


Specified surrender charges


7,084.7


25.8

Market value adjustments


4,666.1


17.0

Subject to discretionary withdrawal without adjustments


0.7


Total domestic investment contracts

$

27,498.1


100.0

%

58

Table of Contents

Universal life insurance and certain traditional life insurance policies are also subject to discretionary withdrawals by policyholders. However, life insurance policies tend to be less susceptible to withdrawal than our investment contracts because policyholders may be subject to a new underwriting process in order to obtain a new life insurance policy. In addition, our life insurance liabilities include surrender charges to discourage early surrenders.

We had the following short-term credit available with various financial institutions as of December 31, 2023:


Financing


Amount


Obligor/Applicant

structure

Maturity

Capacity

outstanding (3)


(in millions)

Principal Life (1)


Credit facility


October 2027

$

800.0

$

Principal International Chile (2)


Unsecured lines of credit


130.9


58.6

Other short-term borrowings


Uncollateralized debt


2.5


2.5

Total


$

933.4

$

61.1

(1)The credit facility is supported by sixteen banks.
(2)The unsecured lines of credit can be used for repurchase agreements or other borrowings. Each line has a maturity of less than one year.
(3)The amount outstanding is reported in short-term debt on the consolidated statements of financial position.

The revolving credit facility is committed and available for general corporate purposes. The credit facility also provides 100% back-stop support for our commercial paper program, of which we had no outstanding balances as of December 31, 2023 and December 31, 2022. Most of the banks supporting the credit facility have other relationships with us. Due to the financial strength and the strong relationships we have with these providers, we are comfortable we have very low risk the financial institutions would be unable or unwilling to fund this facility.

The Holding Companies: PFG and PFS. The principal sources of funds available to our parent holding company, PFG, are dividends from subsidiaries as well as its ability to borrow funds at competitive rates and raise capital to meet operating and growth needs. These funds are used by PFG to meet its obligations, which include the payment of dividends on common stock, debt service and the repurchase of stock. The declaration and payment of common stock dividends is subject to the discretion of our Board and will depend on our overall financial condition, results of operations, capital levels, cash requirements, future prospects, receipt of dividends or other distributions from Principal Life (as described below), risk management considerations and other factors deemed relevant by the Board. No significant restrictions limit the payment of dividends by PFG, except those generally applicable to corporations incorporated in Delaware.

Dividends or other distributions from Principal Life, our primary subsidiary, are limited by Iowa law. Under Iowa law, Principal Life may pay dividends or make other distributions only from the earned surplus arising from its business and must receive the prior approval of the Commissioner of Insurance of the State of Iowa (the “Commissioner”) to pay stockholder dividends or make any other distribution if such distribution would exceed certain statutory limitations. Iowa law gives the Commissioner discretion to disapprove requests for distributions in excess of these limitations. Extraordinary dividends include those made, together with dividends and other distributions, within the preceding twelve months that exceed the greater of (i) 10% of statutory policyholder surplus as of the previous year-end or (ii) the statutory net gain from operations from the previous calendar year, not to exceed earned surplus. Based on statutory results for the year ended December 31, 2023, the ordinary stockholder dividend limitation for Principal Life is approximately $1,497.8 million in 2024.

Total stockholder dividends paid by Principal Life to its parent in 2023 were $1,200.0 million, all of which was extraordinary and approved by the Commissioner. As of December 31, 2023, we had $2,631.3 million of cash and liquid assets held in our holding companies and other subsidiaries, which is available for corporate purposes. Corporate balances held in foreign holding companies meet the indefinite reinvestment exception (see Item 8. “Financial Statements and Supplementary Data, Notes to Consolidated Financial Statements, Note 10, Income Taxes”).

In 2022, total stockholder dividends paid by Principal Life to its parent were $1,425.0 million, all of which was extraordinary and approved by the Commissioner.

In 2021, total stockholder dividends paid by Principal Life to its parent were $1,250.0 million, $950.0 million of which was extraordinary and approved by the Commissioner.

59

Table of Contents

Operations. Our primary consolidated cash flow sources are premiums from insurance products, pension and annuity deposits, asset management fee revenues, administrative services fee revenues, income from investments and proceeds from the sales or maturity of investments. Cash outflows consist primarily of payment of benefits to policyholders and beneficiaries, income and other taxes, current operating expenses, payment of dividends to policyholders, payments in connection with investments acquired, payments made to acquire subsidiaries, payments relating to policy and contract surrenders, withdrawals, policy loans, interest payments and repayment of short-term debt and long-term debt. Our investment strategies are generally intended to provide adequate funds to pay benefits without forced sales of investments. For a discussion of our investment objectives and strategies, see “Investments.”

Cash Flows. Cash flow activity, as reported in our consolidated statements of cash flows, provides relevant information regarding our sources and uses of cash. The following discussion of our operating, investing and financing portions of the cash flows excludes cash flows attributable to the separate accounts.

Net cash provided by operating activities was $3,792.4 million, $3,172.9 million and $3,254.4 million for the years ended December 31, 2023, 2022 and 2021, respectively. Our insurance business typically generates positive cash flows from operating activities, as premiums collected from our insurance products and income received from our investments exceed acquisition costs, benefits paid, redemptions and operating expenses. These positive cash flows are then invested to support the obligations of our insurance and investment products and required capital supporting these products. Our cash flows from operating activities are affected by the timing of premiums, fees and investment income received and benefits and expenses paid. The increase in cash provided by operating activities in 2023 compared to 2022 was primarily due to fluctuations in receivables and payables associated with the timing of settlements, and net sales of fixed maturity trading securities in 2023 as compared to net purchases in 2022. The decrease in cash provided by operating activities in 2022 compared to 2021 was primarily due to fluctuations in receivables and payables associated with the timing of settlements.

Net cash provided by (used in) investing activities was $(1,346.9) million, $1,058.5 million and $(5,693.7) million for the years ended December 31, 2023, 2022 and 2021, respectively. The increase in cash used in investing activities in 2023 compared to 2022 was due to net purchases of available-for sale securities in 2023 compared to net sales and maturities of available-for sale securities in 2022, our 2023 settlement for our acquisition of an interest in CCB Pension Management Co., Ltd., and net purchases of real estate in 2023 compared to net sales of real estate in 2022. These were partially offset by lower net acquisitions and originations of mortgage loans. The 2022 portfolio changes are due in part to the Talcott Reinsurance Transaction and the associated funds withheld portfolio activity. The increase in cash provided by investing activities in 2022 compared to 2021 was due to net sales and maturities of available-for sale securities in 2022 compared to net purchases of available-for sale securities in 2021 and decreased net purchases of mortgage loans. The portfolio changes are due in part to the Talcott Reinsurance Transaction and the associated funds withheld portfolio activity during 2022.

Net cash provided by (used in) financing activities was $(2,585.8) million, $(1,715.4) million and $1,921.5 million for the years ended December 31, 2023, 2022 and 2021, respectively. The increase in cash used in financing activities in 2023 compared to 2022 was due to a decrease in banking operation deposits due to interest rate changes and outflows to higher rate alternatives and net investment contract withdrawals, most pronounced in large market cases. The increase in cash used was partially offset by decreased share repurchases due to the accelerated share repurchase program in 2022. The increase in cash used in financing activities in 2022 compared to 2021 was due to a lower net increase in banking operation deposits and increased share repurchases primarily related to our accelerated share repurchase programs. Additionally, we paid off $300.0 million of long-term debt that matured during 2022.

Guarantors and Issuers of Guaranteed Securities. PFG has issued certain notes pursuant to transactions registered under the Securities Act of 1933. Such notes include all currently outstanding senior notes and junior subordinated notes, which are subordinated to all our senior debt (collectively, the “registered notes”). For additional information on the senior notes and junior subordinated notes, see Item 8. “Financial Statements and Supplementary Data, Notes to Consolidated Financial Statements, Note 13, Debt.”

PFS, a wholly owned subsidiary of PFG, has guaranteed each of the registered notes on a full and unconditional basis. The full and unconditional guarantees require PFS to satisfy the obligations of the guaranteed security immediately, if and when PFG has failed to make a scheduled payment thereunder. If PFS does not make such payment, any holder of the guaranteed security may immediately bring suit directly against PFS for payment of amounts due and payable. No other subsidiary of PFG has guaranteed any of the registered notes.

60

Table of Contents

Summary financial information is presented below on a combined basis for PFG and PFS (the “obligor group”) and transactions between the obligor group have been eliminated. The summary financial information excludes subsidiaries that are not issuers or guarantors. Any investments by the obligor group in other subsidiaries have been excluded.


December 31, 2023


December 31, 2022


(in millions)

Summary Statements of Financial Position Information:


Total investments

$

471.7

$

320.7

Cash and cash equivalents


603.6


952.0

Goodwill


618.5


618.5

Other intangibles


419.3


447.4

Other assets


344.4


385.4

Due from non-obligor subsidiaries


59.5


47.7

Total assets


2,529.0


2,789.5

Long-term debt


3,927.9


3,929.2

Other liabilities


406.3


584.6

Due to non-obligor subsidiaries


821.6


793.9

Total liabilities


5,266.6


5,371.1


For the year ended


For the year ended


December 31, 2023


December 31, 2022


(in millions)

Summary Statements of Operations Information:


Total revenues

$

61.8

$

(7.5)

Total expenses


509.6


524.2

Net loss


(414.9)


(462.1)

Shelf Registration. On February 27, 2023, our shelf registration statement was filed with the SEC and became effective. The shelf registration replaced the shelf registration that had been in effect since April 2020. Under our current shelf registration, we have the ability to issue, in unlimited amounts, unsecured senior debt securities or subordinated debt securities, junior subordinated debt, preferred stock, common stock, warrants, depositary shares, purchase contracts and purchase units of PFG. Our wholly owned subsidiary, PFS, may guarantee, fully and unconditionally or otherwise, our obligations with respect to any non-convertible securities, other than common stock, described in the shelf registration. For information on senior notes issued from our shelf registration, see Item 8. “Financial Statements and Supplementary Data, Notes to Consolidated Financial Statements, Note 13, Debt.”

Short-Term Debt. For short-term debt information, see “Liquidity” and Item 8. “Financial Statements and Supplementary Data, Notes to Consolidated Financial Statements, Note 13, Debt.”

Long-Term Debt. For long-term debt information, see Item 8. “Financial Statements and Supplementary Data, Notes to Consolidated Financial Statements, Note 13, Debt.”

Contingent Funding Agreements for Senior Debt Issuance. For information on the contingent funding agreements, see Item 8. “Financial Statements and Supplementary Data, Notes to Consolidated Financial Statements, Note 13, Debt” under the caption “Contingent Funding Agreements for Senior Debt Issuance.”

Stockholders’ Equity. Proceeds from the issuance of our common stock were $57.8 million, $181.7 million and $86.7 million in 2023, 2022 and 2021, respectively.

The following table summarizes our return of capital to common stockholders.

For the year ended December 31,

2023

2022

2021

($ in millions)

Dividends to stockholders


$

625.5


$

642.3


$

654.1

Repurchase of common stock


748.8


1,661.1


937.2

Total cash returned to stockholders

$

1,374.3

$

2,303.4

$

1,591.3

Number of shares repurchased


9,581,329


23,061,204


14,620,652

In March 2022, we entered into an accelerated share repurchase program with a third party financial institution to repurchase $700.0 million of common stock. This program closed in June 2022. In August 2022, we entered into an accelerated share repurchase program with a third party financial institution to repurchase $400.0 million of common stock. This program closed in September 2022.

61

Table of Contents

In February 2024, our Board authorized a share repurchase program of up to $1.5 billion of our outstanding common stock, which has no expiration. See Item 5. “Market for Registrant’s Common Equity, Related Stockholder Matters and Issuer Purchases of Equity Securities,” for information about our share repurchase authorizations. For additional stockholders’ equity information, see Item 8. “Financial Statements and Supplementary Data, Notes to Consolidated Financial Statements, Note 17, Stockholders’ Equity.”

Capitalization

The following table summarizes our capital structure:


December 31, 2023


December 31, 2022


($ in millions)


Debt:

Short-term debt

$

61.1

$

80.7

Long-term debt


3,930.9


3,997.0

Total debt


3,992.0


4,077.7

Total stockholders’ equity attributable to PFG


10,916.0


9,976.7

Total capitalization

$

14,908.0

$

14,054.4

Debt to equity


37

%  


41

%

Debt to capitalization


27

%  


29

%

Pension and OPEB Plan Funding

We have defined benefit pension plans covering substantially all of our U.S. employees and certain agents. See Item 8. “Financial Statements and Supplementary Data, Notes to Consolidated Financial Statements, Note 11, Employee and Agent Benefits” for a complete discussion of these plans and their effect on the consolidated financial statements.

We report the net funded status of our pension and OPEB plans in the consolidated statements of financial position. The net funded status represents the difference between the fair value of plan assets and the projected benefit obligation for pension and OPEB plans. The measurement of the net funded status can vary based upon the fluctuations in the fair value of the plan assets and the actuarial assumptions used for the plans as discussed below. The net underfunded status of the pension and OPEB obligation was $449.9 million pre-tax and $459.7 million pre-tax as of December 31, 2023 and 2022, respectively. Nonqualified pension plan assets are not included as part of the funding status mentioned above. The nonqualified pension plan assets are held in Rabbi trusts for the benefit of all nonqualified plan participants. The assets held in a Rabbi trust are available to satisfy the claims of general creditors only in the event of bankruptcy. Therefore, these assets are fully consolidated in our consolidated statements of financial position and are not reflected in our funded status as they do not qualify as plan assets under U.S. GAAP. The market value of assets held in these trusts was $342.2 million and $336.7 million as of December 31, 2023 and 2022, respectively.

Our funding policy for the qualified pension plan is to fund the plan annually in an amount at least equal to the minimum annual contributions required under ERISA and, generally, not greater than the maximum amount that can be deducted for U.S. federal income tax purposes. We do not anticipate contributions will be needed in 2024 to satisfy the minimum funding requirements of ERISA for our qualified pension plan. We are unable to estimate the amount that may be contributed, but it is possible that we may fund the plans in 2024 up to $75.0 million. This includes funding for both our qualified and nonqualified pension plans. We may contribute to our other postretirement benefit plans in 2024 pending future analysis.

Effective January 1, 2021, $656.5 million of assets in excess of the expected liability to cover the postretirement medical benefits for retirees were re-designated for non-retiree benefits. The elections were made pursuant to plan provisions which provide for assets in excess of 125% of expected liabilities to fund other benefits covered under the plans. As of December 31, 2023, $308.6 million of re-designated assets remained for non-retiree benefits.

Contractual Obligations and Contractual Commitments

We have contractual obligations identified within Item 8. “Financial Statements and Supplementary Data, Notes to Consolidated Financial Statements; Note 9, Contractholder Funds, Note 10, Future Policy Benefits and Claims, Note 12, Reinsurance, Note 13, Debt and Note 16, Contingencies, Guarantees, Indemnifications and Leases.” As of December 31, 2023, we had no unique material cash requirements from known contractual and other obligations.

We have made commitments to fund certain limited partnerships and other funds. As of December 31, 2023, the amount of unfunded commitments was $1,536.2 million. We are only required to fund additional equity under these commitments when called upon to do so by the partnership or fund; therefore, these commitments are not liabilities on our consolidated statements of financial position.

62

Table of Contents

Off-Balance Sheet Arrangements

Variable Interest Entities. We have relationships with various types of special purpose entities and other entities where we have a variable interest as described in Item 8. “Financial Statements and Supplementary Data, Notes to Consolidated Financial Statements, Note 3, Variable Interest Entities.” We have made commitments to fund certain limited partnerships, as previously discussed in “Contractual Obligations and Contractual Commitments”, some of which are classified as unconsolidated variable interest entities.

Guarantees and Indemnifications. As of December 31, 2023, no significant changes to guarantees and indemnifications have occurred since December 31, 2022. For guarantee and indemnification information, see Item 8. “Financial Statements and Supplementary Data, Notes to Consolidated Financial Statements, Note 16, Contingencies, Guarantees, Indemnifications and Leases” under the caption, “Guarantees and Indemnifications.”

Financial Strength and Credit Ratings

Our ratings are influenced by the relative ratings of our peers/competitors as well as many other factors including our operating and financial performance, capital levels, asset quality, liquidity, asset/liability management, overall portfolio mix, financial leverage (i.e., debt), risk exposures, operating leverage and other factors.

We have had no significant changes or actions in ratings and rating outlooks that have occurred from January 1, 2023, through the date of this filing.

The following table summarizes our significant financial strength and debt ratings from the major independent rating organizations. A rating is not a recommendation to buy, sell or hold securities. Such a rating may be subject to revision or withdrawal at any time by the assigning rating agency. Each rating should be evaluated independently of any other rating.


A.M. Best


Fitch


Moody’s


S&P

Last review date

March 2023

June 2023

January 2022

April 2023

Current outlook

Stable

Stable

Stable

Stable

Principal Financial Group


Senior Unsecured Debt


a


A-


Baa1


A-

Junior Subordinated Debt


a-


Baa2


BBB

Long-Term Issuer Default Rating


A


Principal Life Insurance Company


Insurer Financial Strength


A+


AA-


A1


A+

Issuer Credit Rating


aa


Commercial Paper


AMB-1+


P-1


A-1+

Principal National Life Insurance Company


Insurer Financial Strength


A+


AA-


A1


A+

Impacts of Income Taxes

For income tax information, see Item 8. “Financial Statements and Supplementary Data, Notes to Consolidated Financial Statements, Note 14, Income Taxes.”

Fair Value Measurement

Fair value is defined as the price that would be received to sell an asset or paid to transfer a liability in an orderly transaction between market participants at the measurement date (an exit price). The fair value hierarchy prioritizes the inputs to valuation techniques used to measure fair value into three levels. The fair value hierarchy gives the highest priority (Level 1) to unadjusted quoted prices in active markets for identical assets or liabilities and gives the lowest priority (Level 3) to unobservable inputs. The level in the fair value hierarchy within which the fair value measurement in its entirety falls is determined based on the lowest level input that is significant to the fair value measurement in its entirety considering factors specific to the asset or liability. See Item 8. “Financial Statements and Supplementary Data, Notes to Consolidated Financial Statements, Note 18, Fair Value Measurements” for further details, including a reconciliation of changes in Level 3 fair value measurements.

As of December 31, 2023, 46% of our net assets (liabilities) were Level 1, 51% were Level 2 and 3% were Level 3. Excluding separate account assets as of December 31, 2023, 3% of our net assets (liabilities) were Level 1, 88% were Level 2 and 9% were Level 3.

As of December 31, 2022, 43% of our net assets (liabilities) were Level 1, 54% were Level 2 and 3% were Level 3. Excluding separate account assets as of December 31, 2022, 4% of our net assets (liabilities) were Level 1, 88% were Level 2 and 8% were Level 3.

63

Table of Contents

Changes in Level 3 Fair Value Measurements

Net assets (liabilities) measured at fair value on a recurring basis using significant unobservable inputs (Level 3) as of December 31, 2023, were $7,447.8 million as compared to $6,842.2 million as of December 31, 2022. The increase was primarily related to net purchases and transfers into Level 3 for certain fixed maturities, available-for-sale, partially offset by a decrease in the funds withheld payable embedded derivative net asset.

Net assets (liabilities) measured at fair value on a recurring basis using significant unobservable inputs (Level 3) as of December 31, 2022, were $6,842.2 million as compared to $1,142.4 million as of December 31, 2021. The increase was primarily related to an increase in the funds withheld payable embedded derivative net asset, an increase in manually priced private corporate credit securities and a reduction of the market risk benefit net liability.

Investments

We had total consolidated assets as of December 31, 2023, of $305,046.7 million, of which $98,320.4 million were invested assets. A portion of our invested assets represent funds withheld backing reserves as part of a coinsurance with funds withheld reinsurance agreement. The funds withheld assets and associated net investment income and net realized capital gains (losses) are not included in the discussions below as the investment risk is passed to the reinsurer. See Item 8. “Financial Statements and Supplementary Data, Notes to Consolidated Financial Statements, Note 12, Reinsurance” for more information on the funds withheld assets. The rest of our total consolidated assets are comprised primarily of separate account assets for which we do not bear investment risk; therefore, the discussion and financial information below does not include such assets.

Overall Composition of Invested Assets

Invested assets as of December 31, 2023, were predominantly high quality and broadly diversified across asset class, individual credit, industry and geographic location. Asset allocation is determined based on cash flow and the risk/return requirements of our products. As shown in the following table, the major categories of invested assets are fixed maturities and mortgage loans.

December 31, 2023

Investments

excluding

Funds


funds withheld


withheld


Total

(in millions)

Fixed maturities


$

50,605.0


$

15,904.3

$

66,509.3

Equity securities


1,477.8


0.3


1,478.1

Mortgage loans


17,756.9


2,385.9


20,142.8

Real estate


2,345.3


2,345.3

Policy loans


809.3


809.3

Other investments


6,414.2


621.4


7,035.6

Total invested assets


79,408.5


18,911.9


98,320.4

Cash and cash equivalents


3,889.3


818.4


4,707.7

Total invested assets and cash

$

83,297.8

$

19,730.3

$

103,028.1


December 31, 2022

Investments 

excluding 

Funds 


funds withheld


withheld


Total


(in millions)

Fixed maturities

$

47,856.3

$

15,794.3

$

63,650.6

Equity securities


1,697.6


11.0


1,708.6

Mortgage loans


17,819.0


2,810.8


20,629.8

Real estate


2,239.7


2,239.7

Policy loans


784.7


784.7

Other investments


5,942.2


179.8


6,122.0

Total invested assets


76,339.5


18,795.9


95,135.4

Cash and cash equivalents


3,085.1


1,762.9


4,848.0

Total invested assets and cash

$

79,424.6

$

20,558.8

$

99,983.4

64

Table of Contents

Investment Results

Net Investment Income

The following table presents the yield and investment income, excluding net realized capital gains and losses, for our invested assets for the years indicated. We calculate annualized yields using a simple average of asset classes at the beginning and end of the reporting period. The yields for available-for-sale fixed maturities are calculated using amortized cost. All other yields are calculated using carrying amounts.

For the year ended December 31,

Increase (decrease)

2023

2022

2021

2023 vs. 2022

2022 vs. 2021

Yield

Amount

Yield (1)

Amount

Yield

Amount

Yield


Amount

Yield


Amount


($ in millions)

Fixed maturities


4.8

%  

$

2,552.2


4.1

%  

$

2,137.1


3.9

%  

$

2,785.6


0.7

%  

$

415.1


0.2

%  

$

(648.5)

Equity securities


4.2


66.3


0.4


8.9


2.6


57.7


3.8


57.4


(2.2)


(48.8)

Mortgage loans - commercial


4.0


561.6


3.9


542.7


4.1


653.5


0.1


18.9


(0.2)


(110.8)

Mortgage loans - residential


5.3


200.1


6.4


229.0


5.2


136.7


(1.1)


(28.9)


1.2


92.3

Real estate


7.7


177.2


12.9


277.7


10.0


194.4


(5.2)


(100.5)


2.9


83.3

Policy loans


5.2


41.3


4.7


36.5


5.0


38.8


0.5


4.8


(0.3)


(2.3)

Cash and cash equivalents


5.6


196.6


2.1


57.4


0.2


4.3


3.5


139.2


1.9


53.1

Other investments


8.7


534.7


12.0


689.0


12.3


673.7


(3.3)


(154.3)


(0.3)


15.3

Total


5.1


4,330.0


4.8


3,978.3


4.4


4,544.7


0.3


351.7


0.4


(566.4)

Investment expenses


(0.3)


(238.1)


(0.2)


(139.8)


(0.1)


(115.1)


(0.1)


(98.3)


(0.1)


(24.7)

Net investment income


4.8

%  

$

4,091.9


4.6

%  

$

3,838.5


4.3

%  

$

4,429.6


0.2

%  

$

253.4


0.3

%  

$

(591.1)

(1)The 2022 yield is calculated using beginning balances adjusted for the Talcott Reinsurance Transaction.

Year Ended December 31, 2023 Compared to Year Ended December 31, 2022

Net investment income increased primarily due to higher yields and average invested assets in fixed maturities and cash and due to foreign currency tailwinds. These increases were partially offset by lower income associated with derivatives in fair value hedges, lower value-add real estate sales in our U.S. operations and lower inflation-based investment returns on Latin America average invested assets.

Year Ended December 31, 2022 Compared to Year Ended December 31, 2021

Net investment income decreased primarily due to impacts of the Talcott Reinsurance Transaction in 2022 partially offset by higher inflation-based investment returns on our Latin America average invested assets and cash.

Net Realized Capital Gains (Losses)

The following table presents the contributors to net realized capital gains and losses for the periods indicated. The amounts below do not include net realized capital gains (losses) on funds withheld assets that are not passed to the reinsurer, which are separately reported on the consolidated statements of operations.

For the year ended December 31,

Increase (decrease)


2023


2022


2021


2023 vs. 2022


2022 vs. 2021

(in millions)

Fixed maturities, available-for-sale – credit losses, including credit sales (1)

$

(43.8)

$

(27.1)

$

(45.2)

$

(16.7)

$

18.1

Commercial mortgage loans ̶ credit losses


(58.4)


(31.2)


(1.3)


(27.2)


(29.9)

Other ̶ credit gains (losses)


(0.1)


(3.1)


7.7


3.0


(10.8)

Fixed maturities, available-for-sale and trading – noncredit


(81.3)


(145.2)


7.9


63.9


(153.1)

Derivatives and related hedge activities


(21.7)


260.1


(1.6)


(281.8)


261.7

Other gains (losses)


133.1


(235.6)


147.9


368.7


(383.5)

Net realized capital gains (losses) (2)

$

(72.2)

$

(182.1)

$

115.4

$

109.9

$

(297.5)

(1)Includes credit sales, adjustments to the credit loss valuation allowance, write-offs and recoveries on available-for-sale securities.
(2)Net realized capital gains (losses) can be volatile due to credit losses from invested assets, mark-to-market adjustments of certain invested assets and our decision to sell invested assets.

65

Table of Contents

Year Ended December 31, 2023 Compared to Year Ended December 31, 2022

Net realized capital losses decreased primarily due to reduced non-credit losses on available-for-sale fixed maturities, gains versus losses on equity securities and sponsored investment funds due to equity market improvement, and increased gains on equity real estate sales. These decreases were partially offset by losses versus gains on interest rate derivatives not designated as hedging instruments due to changes in interest rates, increased losses from strengthening commercial mortgage loan reserves and increased losses on residential whole loan trust deconsolidations.

Year Ended December 31, 2022 Compared to Year Ended December 31, 2021

Net realized capital losses increased primarily due to losses on equity securities and sponsored investment funds due to equity market declines, non-credit losses on available-for-sale fixed maturities and losses on a residential whole loan trust deconsolidation. These were partially offset by increased gains on interest rate swaps not designated as hedging instruments due to changes in interest rates, gains versus losses on currency derivatives and increased gains on real estate asset swaps.

U.S. Investment Operations

In the following sections, we provide details about U.S. Investment Operations, excluding investments held as part of the coinsurance with funds withheld agreement. We believe the details of the composition of our investment portfolio excluding the funds withheld are most relevant to an understanding of our operations that are pertinent to investors because all funds withheld assets support obligations and liabilities relating to the Talcott Reinsurance Transaction. Guidelines are in place to ensure the investment risk associated with these fund withheld assets are appropriately managed. See Footnote 12, Reinsurance, for further information on the funds withheld assets.

Of our invested assets, $72,520.1 million were held by our U.S. operations as of December 31, 2023. Our U.S. invested assets are managed primarily by Principal Global Investors. Our Investment Committee, appointed by our Board, is responsible for establishing investment policies and monitoring risk limits and tolerances. Our primary investment objective is to maximize after-tax returns consistent with acceptable risk parameters. We seek to protect customers’ benefits by optimizing the risk/return relationship on an ongoing basis, through asset/liability matching, reducing credit risk, avoiding high levels of investments that may be redeemed by the issuer, maintaining sufficiently liquid investments and avoiding undue asset concentrations through diversification. We are exposed to two primary sources of investment risk:

credit risk, relating to the uncertainty associated with the continued ability of an obligor to make timely payments of principal and interest and
interest rate risk, relating to the market price and/or cash flow variability associated with changes in market yield curves.

Our ability to manage credit risk is essential to our business and our profitability. We devote considerable resources to the credit analysis of each new investment. We manage credit risk through industry, issuer and asset class diversification.

A dedicated committee, comprised of senior investment professional staff members, approves the credit rating for the fixed maturities we purchase. We have teams of security analysts, organized by industry and asset class, that analyze and monitor these investments. Investments held in the portfolio are monitored on a continuous basis with a formal review annually or more frequently if material events affect the issuer. The analysis includes both fundamental and technical factors. The fundamental analysis encompasses both quantitative and qualitative analysis of the issuer. The qualitative analysis includes an assessment of both accounting and management aggressiveness of the issuer. In addition, technical indicators such as stock price volatility and credit default swap levels are monitored. We regularly review our investments to determine whether we should re-rate them, employing the following criteria:

material changes in the issuer’s revenues, margins, capital structure or collateral values;
significant management or organizational changes;
significant changes regarding the issuer’s industry;
debt service coverage or cash flow ratios that fall below industry-specific thresholds;
violation of financial covenants and
other business factors that relate to the issuer.

66

Table of Contents

We purchase credit default swaps to hedge certain credit exposures in our investment portfolio. We economically hedged credit exposure in our portfolio by purchasing credit default swaps with a notional amount of $85.0 million and $130.0 million as of December 31, 2023 and December 31, 2022, respectively. We sell credit default swaps to offer credit protection to investors when entering into synthetic replicating transactions. When selling credit protection, if there is an event of default by the referenced name, we are obligated to pay the counterparty the referenced amount of the contract and receive in return the referenced security. For further information on credit derivatives sold, see Item 8. “Financial Statements and Supplementary Data, Notes to Consolidated Financial Statements, Note 5, Derivative Financial Instruments” under the caption, “Credit Derivatives Sold.”

Our use of derivatives exposes us to counterparty risk, or the risk that the counterparty fails to perform the terms of the derivative contract. We actively manage this risk by:

obtaining approval of all new counterparties by the Investment Committee;
establishing exposure limits that take into account non-derivative exposure we have with the counterparty as well as derivative exposure;
performing similar credit analysis prior to approval on each derivatives counterparty that we do when lending money on a long-term basis;
diversifying our risk across numerous approved counterparties;
implementing credit support annex (collateral) agreements (“CSAs”) for over-the-counter derivative transactions or similar agreements with a majority of our counterparties to further limit counterparty exposures, which provide for netting of exposures;
limiting exposure to A credit or better for over-the-counter derivative counterparties without CSAs;
conducting stress-test analysis to determine the maximum exposure created during the life of a prospective transaction;
daily monitoring of counterparty credit ratings, exposures and associated collateral levels and
trading mandatorily cleared contracts through centralized clearinghouses.

We manage our exposure on a net basis, whereby we net positive and negative exposures for each counterparty with agreements in place. For further information on derivative exposure, see Item 8. “Financial Statements and Supplementary Data, Notes to Consolidated Financial Statements, Note 4, Investments” under the caption, “Balance Sheet Offsetting.”

A dedicated risk management team is responsible for centralized monitoring of the commercial mortgage loan portfolio. We apply a variety of guidelines to minimize credit risk in our commercial mortgage loan portfolio. When considering new commercial mortgage loans, we review the cash flow fundamentals of the property, make a physical assessment of the underlying commercial real estate, conduct a comprehensive market analysis and compare against industry lending practices. We use a proprietary risk rating model to evaluate all new and substantially all existing loans within the portfolio. The proprietary risk model is designed to stress projected cash flows under simulated economic and market downturns. Our lending guidelines are typically 75% or less loan-to-value ratio and a debt service coverage ratio of at least 1.2 times. We analyze investments outside of these guidelines based on cash flow quality, tenancy and other factors. The following table presents loan-to-value and debt service coverage ratios for our brick and mortar commercial mortgage loans:

Weighted average loantovalue ratio

Debt service coverage ratio


December 31, 2023


December 31, 2022


December 31, 2023


December 31, 2022


New mortgages


50

%  

50

%  

1.4

x

2.3

x

Entire mortgage portfolio


49

%  

46

%  

2.5

x

2.5

x

We also seek to manage call or prepayment risk arising from changes in interest rates. We assess and price for call or prepayment risks in all of our investments and monitor these risks in accordance with asset/liability management policies.

The amortized cost and weighted average yield, calculated using amortized cost, of non-structured fixed maturity securities that will be callable at the option of the issuer, excluding securities with a make-whole provision, were $2,159.0 million and 4.0%, respectively, as of December 31, 2023, and $2,539.0 million and 3.9%, respectively, as of December 31, 2022. In addition, the amortized cost and weighted average yield of RMBS, residential collateralized mortgage obligations, and asset-backed securities - home equity with material prepayment risk were $6,959.0 million and 3.7%, respectively, as of December 31, 2023, and $5,546.1 million and 2.9%, respectively, as of December 31, 2022.

67

Table of Contents

Our investment decisions and objectives are a function of the underlying risks and product profiles of each primary business operation. In addition, we diversify our product portfolio offerings to include products that contain features that will protect us against fluctuations in interest rates. Those features include adjustable crediting rates, policy surrender charges and market value adjustments on liquidations. For further information on our management of interest rate risk, see Item 7A “Quantitative and Qualitative Disclosures About Market Risk – Interest Rate Risk.”

Overall Composition of U.S. Invested Assets

As shown in the following table, the major categories of U.S. invested assets are fixed maturities and mortgage loans.

December 31, 2023

December 31, 2022


Carrying amount


% of total


Carrying amount


% of total


($ in millions)


Fixed maturities

$

47,802.3

66

%  

$

44,745.4

65

%

Equity securities


667.9


1


532.2


1

Mortgage loans

16,792.1

23

16,866.3

25

Real estate


2,343.4


3


2,237.4


3

Policy loans


793.2


1


770.2


1

Other investments


4,121.2


6


3,745.7


5

Total invested assets


72,520.1


100

%  


68,897.2


100

%

Cash and cash equivalents


3,668.8


2,894.5


Total invested assets and cash

$

76,188.9

$

71,791.7


Fixed Maturities

Fixed maturities include bonds, ABS, redeemable preferred stock and certain non-redeemable preferred securities.

Fixed maturities were diversified by category of issuer, as shown in the following table for the years indicated.

December 31, 2023

December 31, 2022


Carrying amount

Percent of total

Carrying amount

Percent of total


($ in millions)


U.S. government and agencies


$

1,231.9


3

%  

$

1,432.4


3

%

Non-U.S. governments


378.5


1


400.0


1

States and political subdivisions


5,143.7


11


4,544.9


10

Corporate - public


13,690.1


29


15,661.4


35

Corporate - private


11,258.2


24


9,144.4


20

Residential mortgage-backed pass-through securities


3,061.8


5


2,172.3


5

Commercial mortgage-backed securities


3,854.5


8


3,861.9


9

Residential collateralized mortgage obligations


3,214.8


7


2,666.9


6

Asset-backed securities


5,968.8


12


4,861.2


11

Total fixed maturities

$

47,802.3


100

%  

$

44,745.4


100

%

We believe it is desirable to hold residential mortgage-backed pass-through securities due to their credit quality and liquidity as well as portfolio diversification characteristics. Our portfolio is comprised of Government National Mortgage Association, Federal National Mortgage Association and Federal Home Loan Mortgage Corporation pass-through securities. In addition, our residential collateralized mortgage obligation portfolio offers structural features that allow cash flows to be matched to our liabilities.

We purchase CMBS to diversify the overall credit risks of the fixed maturities portfolio and to provide attractive returns. The primary risks in holding CMBS are structural and credit risks. Structural risks include the security’s priority in the issuer’s capital structure, the adequacy of and ability to realize proceeds from the collateral and the potential for prepayments. Credit risks involve collateral and issuer/servicer risk where collateral and servicer performance may deteriorate. CMBS are predominantly comprised of large pool securitizations that are diverse by property type, borrower and geographic dispersion. The risks to any CMBS deal are determined by the credit quality of the underlying loans and how those loans perform over time. Another key risk is the vintage of the underlying loans and the state of the markets during a particular vintage.

Similar to CMBS, we purchase ABS for diversification and to provide attractive returns. The primary risks in holding ABS are also structural and credit risks, which are similar to those noted above for CMBS. Our ABS portfolio is diversified by type of asset, issuer, and vintage. We actively monitor holdings of ABS to recognize adverse changes in the risk profile of each security. Prepayments in the ABS portfolio are, in general, insensitive to changes in interest rates or are insulated from such changes by call protection features. In the event we are subject to prepayment risk, we monitor the factors that impact the level of prepayment and prepayment speed for those ABS. In addition, we hold a diverse class of securities, which limits our exposure to any one security.

68

Table of Contents

The international exposure held in our U.S. operation’s fixed maturities portfolio was 14% of total fixed maturities as of both December 31, 2023 and December 31, 2022. It is comprised of corporate and foreign government fixed maturities.

December 31, 2023

December 31, 2022


(in millions)


European Union


$

1,826.8


$

1,547.7

Australia/New Zealand


1,389.6


1,283.4

United Kingdom


1,147.7


1,167.4

Latin America


995.6


1,023.3

Asia-Pacific


530.2


584.7

Middle East and Africa


451.3


424.5

Europe, non-European Union


258.1


302.5

Other


115.1


137.3

Total

$

6,714.4

$

6,470.8

International fixed maturities exposure is determined by the country of risk of the obligor entity. All international fixed maturities held by our U.S. operations are either denominated in U.S. dollars or have been swapped into U.S. dollar equivalents. Our international investments are analyzed internally by country and industry credit investment professionals. We control concentrations using issuer and country level exposure benchmarks, which are based on the credit quality of the issuer and the country. Our investment policy limits total international fixed maturities investments and we are within those internal limits. Exposure to Canada is not included in our international exposure. As of December 31, 2023 and December 31, 2022, our investments in Canada totaled $958.0 million and $982.9 million, respectively.

Fixed Maturities Credit Concentrations. One aspect of managing credit risk is through industry, issuer and asset class diversification. Our credit concentrations are managed to established limits. The top 10 exposures comprised 4.8% of single-name credit fixed maturity exposures as of both December 31, 2023 and December 31, 2022.

Fixed Maturities Valuation and Credit Quality. Valuation techniques for the fixed maturities portfolio vary by security type and the availability of market data. The use of different pricing techniques and their assumptions could produce different financial results. See Item 8. “Financial Statements and Supplementary Data, Notes to Consolidated Financial Statements, Note 18, Fair Value Measurements” for further details regarding our pricing methodology. Once prices are determined, they are reviewed by pricing analysts for reasonableness based on asset class and observable market data. Investment analysts who are familiar with specific securities review prices for reasonableness through direct interaction with external sources, review of recent trade activity or use of internal models. All fixed maturities placed on the “watch list” are periodically analyzed by investment analysts. These analysts periodically meet with the Chief Investment Officer and the Portfolio Managers to determine reasonableness of the analysts’ prices. The valuation of bonds for which a credit loss exists and there is no quoted price is typically based on relative value analysis and the present value of the future cash flows expected to be received. Although we believe these values reasonably reflect the fair value of those securities, the key assumptions about risk premiums, performance of underlying collateral (if any) and other market factors involve qualitative and unobservable inputs.

The Securities Valuation Office (“SVO”) of the NAIC monitors the bond investments of insurers for regulatory capital and reporting purposes and, when required, assigns securities to one of six categories referred to as NAIC designations. Although NAIC designations are not produced to aid the investment decision making process, NAIC designations may serve as a reasonable proxy for Nationally Recognized Statistical Rating Organizations’ (“NRSRO”) credit ratings for certain bonds. For most corporate bonds, NAIC designations 1 and 2 include bonds generally considered investment grade by such rating organizations. Bonds are considered investment grade when rated ‘‘Baa3’’ or higher by Moody’s, or ‘‘BBB-’’ or higher by S&P. NAIC designations 3 through 6 include bonds generally referred to as below investment grade. Bonds are considered below investment grade when rated ‘‘Ba1’’ or lower by Moody’s, or ‘‘BB+’’ or lower by S&P.

For loan-backed and structured securities, as defined by the NAIC, the NAIC designation is not always a reasonable indication of an NRSRO rating as described below. For CMBS and non-agency RMBS, Blackrock Solutions undertakes the modeling of those NAIC designations. This may result in a final designation being higher or lower than the NRSRO credit rating.

69

Table of Contents

The following table presents our total fixed maturities by NAIC designation as of the years indicated as well as the percentage, based on fair value, that each designation comprises.

December 31, 2023

December 31, 2022


Percent of

Percent of


Amortized

Carrying

carrying

Amortized

Carrying

carrying


NAIC designation

cost

 amount

amount

 cost

amount

amount


($ in millions)

1


$

34,601.1


$

32,078.6


67

%  

$

32,398.0


$

29,011.9


65

%

2


13,624.2


12,749.5


27


14,143.5


12,735.3


28

3


2,727.3


2,615.1


5


2,871.9


2,656.1


6

4


354.1


327.4


1


357.0


312.1


1

5


9.1


7.5


15.3


14.5


6


31.1


24.2


20.2


15.5


Total fixed maturities

$

51,346.9

$

47,802.3


100

%  

$

49,805.9

$

44,745.4


100

%

Fixed maturities included 39 securities with an amortized cost of $433.3 million, gross gains of $21.5 million, gross losses of $3.9 million, valuation allowance of $0.0 million and a carrying amount of $450.9 million as of December 31, 2023, that were still pending a review and assignment of a designation by the SVO or NRSRO ratings to be assigned. Due to the timing of when fixed maturities are purchased, legal documents are filed and the review by the SVO is completed, or NRSRO ratings that have expired or been withdrawn, we will always have securities in our portfolio that are unrated over a reporting period. In these instances, an equivalent designation is assigned based on our fixed income analyst’s assessment.

Commercial Mortgage-Backed Securities. As of December 31, 2023, based on amortized cost, 96% of our CMBS portfolio had an NAIC designation of 1.

The following table presents our exposure by credit quality based on NAIC designations for our CMBS portfolio as of the years indicated.

December 31, 2023

December 31, 2022


Amortized

Carrying

Amortized

Carrying


NAIC designation


cost


amount


cost


amount


(in millions)

1


$

4,207.2


$

3,732.2


$

4,340.6


$

3,801.5

2


156.1


118.5


70.8


55.8

3


2.9


2.2


2.2


1.9

4


3.0


1.3


3.9


2.4

5


6


0.6


0.3


0.6


0.3

Total (1)

$

4,369.8

$

3,854.5

$

4,418.1

$

3,861.9

(1)The CMBS portfolio included agency CMBS with a $546.5 million amortized cost and a $518.2 million carrying amount as of December 31, 2023, and a $508.4 million amortized cost and a $473.0 million carrying amount as of December 31, 2022.

Fixed Maturities Watch List. We monitor any decline in the credit quality of fixed maturities through the designation of “problem securities,” “potential problem securities” and “restructured securities”. We define problem securities in our fixed maturity portfolio as securities: (i) with principal and/or interest payments in default or where default is perceived to be imminent in the near term, or (ii) issued by a company that went into bankruptcy subsequent to the acquisition of such securities. We define potential problem securities in our fixed maturity portfolio as securities included on an internal “watch list” for which management has concerns as to the ability of the issuer to comply with the present debt payment terms and which may result in the security becoming a problem or being restructured. The decision whether to classify a performing fixed maturity security as a potential problem involves significant subjective judgments by our management as to the likely future industry conditions and developments with respect to the issuer. We define restructured securities in our fixed maturity portfolio as securities where a concession has been granted to the borrower related to the borrower’s financial difficulties that would not have otherwise been considered. We determine that restructures should occur in those instances where greater economic value will be realized under the new terms than through liquidation or other disposition and may involve a change in contractual cash flows. If the present value of the restructured cash flows is less than the current cost of the asset being restructured, a realized capital loss is recorded in net income and a new cost basis is established.

70

Table of Contents

The following table presents the total carrying amount of our fixed maturities portfolio, as well as its problem, potential problem and restructured fixed maturities for the years indicated.

December 31, 2023

December 31, 2022


($ in millions)


Total fixed maturities


$

47,802.3


$

44,745.4

Problem fixed maturities (1)

$

42.6

$

20.9

Potential problem fixed maturities


66.7


21.8

Total problem, potential problem and restructured fixed maturities

$

109.3

$

42.7

Total problem, potential problem and restructured fixed maturities as a percent of total fixed maturities


0.23

%  


0.10

%

(1)The problem fixed maturities carrying amount is net of the credit loss valuation allowance.

Fixed Maturities Credit Losses. Each reporting period, a group of individuals including the Chief Investment Officer, our Portfolio Managers, the assigned analysts and representatives from Investment Accounting review all securities to determine whether a credit loss exists. The analysis focuses on each issuer’s ability to service its debts in a timely fashion. Formal documentation of the analysis and our decision is prepared and approved by management. For additional details regarding our process to identify and evaluate securities with credit losses, see Item 8. “Financial Statements and Supplementary Data, Notes to Consolidated Financial Statements, Note 4, Investments” under the caption “Allowance for Credit Loss.”

We would not consider a security with unrealized losses to have a decline in value due to credit when it is not our intent to sell the security, it is not more likely than not that we would be required to sell the security before recovery of the amortized cost, which may be maturity, and we expect to recover the amortized cost basis. However, we do sell securities under certain circumstances, such as when we have evidence of a change in the issuer’s creditworthiness, when we anticipate poor relative future performance of securities, when a change in regulatory requirements modifies what constitutes a permissible investment or the maximum level of investments held or when there is an increase in capital requirements or a change in risk weights of debt securities. Sales generate both gains and losses.

A number of significant risks and uncertainties are inherent in the process of monitoring credit losses and determining the allowance for credit loss. These risks and uncertainties include: (1) the risk that our assessment of an issuer’s ability to meet all of its contractual obligations will change based on changes in the credit characteristics of that issuer, (2) the risk that the economic outlook will be worse than expected or have more of an impact on the issuer than anticipated, (3) the risk that our investment professionals are making decisions based on fraudulent or misstated information in the financial statements provided by issuers and (4) the risk that new information obtained by us or changes in other facts and circumstances lead us to change our intent to not sell the security prior to recovery of its amortized cost. Any of these situations could result in a charge to net income in a future period.

The net realized loss relating to the change in the allowance for credit loss and credit related sales of fixed maturities was $48.9 million, $29.7 million and $34.7 million for the years ended December 31, 2023, 2022 and 2021, respectively.

71

Table of Contents

Fixed Maturities Available-for-Sale

The following tables present our fixed maturities available-for-sale by industry category, as of the years indicated.

December 31, 2023


Gross


Gross


Allowance


Amortized

unrealized

unrealized

for credit

Carrying

cost

gains

losses

loss

amount


(in millions)

Finance — Banking

$

1,885.8

$

8.2

$

151.9

$

$

1,742.1

Finance — Brokerage


674.1


5.4


58.3


621.2

Finance — Finance Companies


377.6


1.9


43.1


336.4

Finance — Financial Other


1,435.9


12.8


123.3


1,325.4

Finance — Insurance


1,759.4


29.0


152.3


1,636.1

Finance — Real estate investment trusts (“REITs”)


1,729.3


0.3


175.7


1,553.9

Industrial — Basic Industry


1,203.9


22.8


85.5


1,141.2

Industrial — Capital Goods


1,350.1


17.1


101.5


1,265.7

Industrial — Communications


2,261.1


58.0


149.3


2,169.8

Industrial — Consumer Cyclical


1,129.8


6.4


85.7


1,050.5

Industrial — Consumer Non-Cyclical


2,929.8


23.7


188.1


1.6


2,763.8

Industrial — Energy


1,869.7


57.1


113.5


1,813.3

Industrial — Other


767.6


7.5


33.0


742.1

Industrial — Technology


1,357.5


12.4


107.5


1,262.4

Industrial — Transportation


1,771.2


24.2


123.2


1,672.2

Utility — Electric


2,898.6


27.9


279.3


2,647.2

Utility — Natural Gas


423.3


5.2


49.5


379.0

Utility — Other


270.4


2.9


29.2


244.1

Government guaranteed


271.7


15.9


14.5


273.1

Total corporate securities


26,366.8


338.7


2,064.4


1.6


24,639.5

Residential mortgage-backed pass-through securities


3,187.8


25.1


161.4


3,051.5

Commercial mortgage-backed securities


4,316.7


515.3


3,801.4

Residential collateralized mortgage obligations


3,598.6


13.8


410.1


0.1


3,202.2

Asset-backed securities — Home equity (1)


139.0


2.9


4.3


137.6

Asset-backed securities — All other


2,209.6


13.6


76.2


2,147.0

Collateralized debt obligations — Credit


16.6


4.9


11.7

Collateralized debt obligations — Loans


3,669.6


6.1


20.3


3,655.4

Total mortgage-backed and other asset-backed securities


17,137.9


61.5


1,192.5


0.1


16,006.8

U.S. government and agencies


1,257.9


19.3


73.0


1,204.2

States and political subdivisions


5,748.6


42.6


651.3


5,139.9

Non-U.S. governments


400.3


17.0


40.8


376.5

Total fixed maturities, available-for-sale

$

50,911.5

$

479.1

$

4,022.0

$

1.7

$

47,366.9

(1)This exposure is all related to sub-prime mortgage loans.

72

Table of Contents

December 31, 2022


Gross


Gross


Allowance


Amortized

unrealized

unrealized

for credit

Carrying

cost

gains

losses

loss

amount


(in millions)

Finance — Banking

$

2,396.8

$

3.7

$

234.6

$

$

2,165.9

Finance — Brokerage


667.3


1.6


88.4


580.5

Finance — Finance Companies


338.6


61.9


276.7

Finance — Financial Other


1,120.5


1.5


162.6


959.4

Finance — Insurance


1,882.8


27.2


190.9


1,719.1

Finance — REITs


1,785.4


0.4


237.6


1,548.2

Industrial — Basic Industry


1,220.6


10.6


116.7


1,114.5

Industrial — Capital Goods


1,518.7


5.5


158.5


1,365.7

Industrial — Communications


2,286.8


47.4


219.1


2,115.1

Industrial — Consumer Cyclical


1,216.9


5.5


135.0


1,087.4

Industrial — Consumer Non-Cyclical


3,329.2


15.4


292.9


3,051.7

Industrial — Energy


1,872.0


39.9


159.2


1,752.7

Industrial — Other


807.9


0.7


65.9


742.7

Industrial — Technology


1,392.8


2.6


153.1


1,242.3

Industrial — Transportation


1,637.0


5.4


176.2


1,466.2

Utility — Electric


2,886.8


17.8


382.2


2,522.4

Utility — Natural Gas


389.3


0.7


58.9


331.1

Utility — Other


359.8


66.3


293.5

Government guaranteed


171.8


10.3


13.3


168.8

Total corporate securities


27,281.0


196.2


2,973.3


24,503.9

Residential mortgage-backed pass-through securities


2,348.8


5.8


187.6


2,167.0

Commercial mortgage-backed securities


4,334.7


556.2


3,778.5

Residential collateralized mortgage obligations


3,113.8


2.6


451.8


0.1

2,664.5

Asset-backed securities — Home equity (1)


73.5


1.6


2.9


72.2

Asset-backed securities — All other


1,662.1


125.2


1,536.9

Collateralized debt obligations — Credit


16.8


5.2


11.6

Collateralized debt obligations — CMBS


0.3


0.3

Collateralized debt obligations — Loans


3,264.7


1.1


108.9


3,156.9

Total mortgage-backed and other asset-backed securities


14,814.4


11.4


1,437.8


0.1

13,387.9

U.S. government and agencies


1,443.9


0.1


90.2


1,353.8

States and political subdivisions


5,281.8


9.8


751.4


4,540.2

Non-U.S. governments


423.0


18.8


44.0


397.8

Total fixed maturities, available-for-sale

$

49,244.1

$

236.3

$

5,296.7

$

0.1

$

44,183.6

(1)This exposure is all related to sub-prime mortgage loans.

Of the $4,022.0 million in gross unrealized losses as of December 31, 2023, $13.9 million in losses were attributed to securities scheduled to mature in one year or less, $238.3 million attributed to securities scheduled to mature between one to five years, $662.9 million attributed to securities scheduled to mature between five to ten years, $1,914.4 million attributed to securities scheduled to mature after ten years and $1,192.5 million related to mortgage-backed and other ABS that are not classified by maturity year. As of December 31, 2023, we were in a $3,542.9 million net unrealized loss position as compared to a $5,060.4 million net unrealized loss position as of December 31, 2022. The $1,517.5 million decrease in net unrealized loss for the year ended December 31, 2023, can be attributed to a tightening of credit spreads.

Fixed Maturities Available-For-Sale Unrealized Losses. We believe our long-term fixed maturities portfolio is well diversified among industry types and between publicly traded and privately placed securities. Each year, we direct the majority of our net cash inflows into investment grade fixed maturities. Our current policy is to limit the percentage of fixed maturities invested in below investment grade assets to 15%.

We invest in privately placed fixed maturities to enhance the overall value of the portfolio, increase diversification and obtain higher yields than are possible with comparable quality public market securities. Generally, private placements provide broader access to management information, strengthened negotiated protective covenants, call protection features and, where applicable, a higher level of collateral. They are, however, generally not freely tradable because of restrictions imposed by U.S. federal and state securities laws and illiquid trading markets.

73

Table of Contents

The following table presents our fixed maturities available-for-sale by investment grade and below investment grade as of the years indicated.

December 31, 2023

December 31, 2022


Gross


Gross


Allowance


Gross


Gross


Allowance


Amortized

unrealized

unrealized

for credit

Carrying

Amortized

unrealized

unrealized

for credit

Carrying


cost

gains

losses

loss

amount

cost

gains

losses

loss

amount


(in millions)


Investment grade:


Public

$

37,197.9

$

324.9

$

3,077.1

$

$

34,445.7

$

37,338.9

$

217.2

$

3,951.8

$

0.1

$

33,604.2

Private


10,738.5


137.7


782.7


10,093.5


8,752.7


11.2


1,070.8


7,693.1

Below investment grade:


Public


1,352.1


6.2


139.1


1,219.2


1,728.2


5.5


245.3


1,488.4

Private


1,623.0


10.3


23.1


1.7


1,608.5


1,424.3


2.4


28.8


1,397.9

Total fixed maturities, available-for-sale

$

50,911.5

$

479.1

$

4,022.0

$

1.7

$

47,366.9

$

49,244.1

$

236.3

$

5,296.7

$

0.1

$

44,183.6

Included in the public category as of December 31, 2023 and December 31, 2022, were $12,017.4 million and $10,829.2 million, respectively, of securities subject to certain holding periods and resale restrictions pursuant to Rule 144A of the Securities Act of 1933.

The following tables present the fair value and the gross unrealized losses on our fixed maturities available-for-sale for which an allowance for credit loss has not been recorded by investment category and length of time that individual securities have been in a continuous unrealized loss position as of December 31, 2023 and December 31, 2022, respectively.


December 31, 2023

Less than

Greater than or

twelve months

equal to twelve months

Total

Gross

Gross

Gross

Fair

unrealized

Fair

unrealized

Fair

unrealized


value


losses


value


losses


value


losses


(in millions)

Fixed maturities, available-for-sale (1):

U.S. government and agencies

$

316.4

$

3.1

$

672.5

$

69.8

$

988.9

$

72.9

Non-U.S. governments


37.4


1.0


208.8


39.8


246.2


40.8

States and political subdivisions


563.6


18.2


3,622.4


633.0


4,186.0


651.2

Corporate


1,968.7


57.8


16,294.4


2,005.4


18,263.1


2,063.2

Residential mortgage-backed pass-through securities


633.0


4.9


1,272.1


157.4


1,905.1


162.3

Commercial mortgage-backed securities


246.1


3.6


3,319.7


510.8


3,565.8


514.4

Collateralized debt obligations (2)


357.0


1.4


2,039.6


23.9


2,396.6


25.3

Other debt obligations


806.1


14.7


3,281.9


475.8


4,088.0


490.5

Total fixed maturities, available-for-sale

$

4,928.3

$

104.7

$

30,711.4

$

3,915.9

$

35,639.7

$

4,020.6

(1)Fair value and gross unrealized losses are excluded for available-for-sale securities for which an allowance for credit loss has been recorded.
(2)Primarily consists of collateralized loan obligations backed by secured corporate loans.


December 31, 2022

Less than

Greater than or

twelve months

equal to twelve months

Total

Gross

Gross

Gross

Fair

unrealized

Fair

unrealized

Fair

unrealized


value


losses


value


losses


value


losses


(in millions)

Fixed maturities, available-for-sale (1):


U.S. government and agencies

$

1,142.3

$

48.4

$

181.5

$

41.8

$

1,323.8

$

90.2

Non-U.S. governments


253.1


38.1


17.2


6.1


270.3


44.2

States and political subdivisions


3,703.9


625.8


382.6


125.6


4,086.5


751.4

Corporate


18,548.4


2,352.8


2,407.8


620.4


20,956.2


2,973.2

Residential mortgage-backed pass-through securities


1,149.9


88.7


573.5


104.5


1,723.4


193.2

Commercial mortgage-backed securities


2,720.5


352.4


986.6


201.8


3,707.1


554.2

Collateralized debt obligations (2)


1,813.1


63.9


1,207.2


50.1


3,020.3


114.0

Other debt obligations


1,976.3


197.6


1,895.6


377.0


3,871.9


574.6

Total fixed maturities, available-for-sale

$

31,307.5

$

3,767.7

$

7,652.0

$

1,527.3

$

38,959.5

$

5,295.0

(1)Fair value and gross unrealized losses are excluded for available-for-sale securities for which an allowance for credit loss has been recorded.
(2)Primarily consists of collateralized loan obligations backed by secured corporate loans.

74

Table of Contents

Mortgage Loans

Mortgage loans consist of commercial mortgage loans on real estate and residential mortgage loans. For further details about residential mortgage loans, see Item 8. “Financial Statements and Supplementary Data, Notes to Consolidated Financial Statements, Note 4, Investments” under the caption, “Financing Receivables.”

Commercial Mortgage Loans. We generally report commercial mortgage loans on real estate at cost adjusted for amortization of premiums and accrual of discounts, computed using the interest method and net of valuation allowances.

Commercial mortgage loans play an important role in our investment strategy by:

providing strong risk-adjusted relative value in comparison to other investment alternatives;
enhancing total returns and
providing strategic portfolio diversification.

As a result, we have focused on constructing a high quality portfolio of mortgages. Our portfolio is generally comprised of mortgages originated with conservative loan-to-value ratios, high debt service coverages and general purpose property types with a strong credit tenancy.

Our commercial mortgage loan portfolio consists primarily of non-recourse, fixed rate mortgages on fully or near fully leased properties. The mortgage portfolio is comprised primarily of office properties, apartments, well anchored retail properties and general-purpose industrial properties.

Our commercial mortgage loan portfolio is diversified by geography and specific collateral property type. Commercial mortgage lending in the state of California accounted for 25% and 26% of our commercial mortgage loan portfolio before valuation allowance as of December 31, 2023 and December 31, 2022, respectively. We are, therefore, exposed to potential losses resulting from the risk of catastrophes, such as earthquakes, that may affect the region. Like other lenders, we generally do not require earthquake insurance for properties on which we make commercial mortgage loans. With respect to California properties, however, we obtain an engineering report specific to each property. The report assesses the building’s design specifications, whether it has been upgraded to meet seismic building codes and the maximum loss that is likely to result from a variety of different seismic events. We also obtain a report that assesses, by building and geographic fault lines, the amount of loss our commercial mortgage loan portfolio might suffer under a variety of seismic events.

The typical borrower in our commercial mortgage loan portfolio is a single purpose entity or single asset entity. As of December 31, 2023 and December 31, 2022, the total number of commercial mortgage loans outstanding were 596 and 656, of which 38% and 43% were for loans with principal balances less than $10.0 million as of December 31, 2023 and December 31, 2022, respectively. The average loan size of our commercial mortgage portfolio was $22.9 million and $20.7 million as of December 31, 2023 and December 31, 2022, respectively.

Commercial Mortgage Loan Credit Monitoring. For further details on monitoring and management of our commercial mortgage loan portfolio, see Item 8. “Financial Statements and Supplementary Data, Notes to Consolidated Financial Statements, Note 4, Investments” under the caption, “Financing Receivables Credit Monitoring.”

We categorize loans that are 60 days or more delinquent, loans in process of foreclosure and loans with borrowers or credit tenants in bankruptcy that are delinquent as “problem” loans. We categorize loans that are delinquent less than 60 days where the default is expected to be cured and loans with borrowers or credit tenants in bankruptcy that are current as “potential problem” loans. The decision whether to classify a loan delinquent less than 60 days as a potential problem involves significant subjective judgments by management as to the likely future economic conditions and developments with respect to the borrower. We categorize loans for which the original note rate has been reduced below market and loans for which the principal has been reduced as “restructured” loans. We also consider loans that are refinanced more than one year beyond the original maturity or call date at below market rates as restructured.

75

Table of Contents

We had two potential problem commercial mortgage loans with a carrying amount of $95.4 million for which we had a valuation allowance of $11.9 million as of December 31, 2023. We also had two restructured problem commercial mortgage loans with a carrying amount of $92.7 million for which we had a valuation allowance of $34.1 million and one delinquent problem commercial mortgage loan with a carrying amount of $7.9 million for which we had a valuation allowance of $7.9 million as of December 31, 2023. We also had one restructured problem commercial mortgage loan with a carrying amount of $35.5 million for which we had a valuation allowance of $20.0 million and one delinquent problem commercial mortgage loan with a carrying amount of $8.3 million for which we had a valuation allowance of $8.3 million as of December 31, 2022.


December 31, 2023


December 31, 2022


($ in millions)


Total commercial mortgage loans

$

13,544.9

$

13,487.5

Potential problem commercial mortgage loans

$

83.5

$

Restructured problem commercial mortgage loans

58.6


15.5

Total problem, potential problem and restructured commercial mortgage loans

$

142.1

$

15.5

Total problem, potential problem and restructured commercial mortgage loans as a percent of total commercial mortgage loans


1.05

%  


0.11

%

Commercial Mortgage Loan Valuation Allowance. We establish the commercial mortgage loan valuation allowance at levels considered adequate to absorb estimated expected credit losses within the portfolio. For further details on the commercial mortgage loan valuation allowance, see Item 8. “Financial Statements and Supplementary Data, Notes to Consolidated Financial Statements, Note 4, Investments” under the caption, “Financing Receivables Valuation Allowance.”  

Real Estate

Real estate consists primarily of commercial equity real estate. As of December 31, 2023 and December 31, 2022, the carrying amount of our equity real estate investment was $2,343.4 million and $2,237.4 million, respectively. Our commercial equity real estate is held in the form of wholly owned real estate, real estate acquired upon foreclosure of commercial mortgage loans and majority owned interests in real estate joint ventures.

Equity real estate is categorized as either “real estate held for investment” or “real estate held for sale.” The carrying value of real estate held for investment is generally adjusted for impairments whenever events or changes in circumstances indicate the carrying amount of the asset may not be recoverable. Such impairment adjustments are recorded as net realized capital losses in our consolidated results of operations. No such impairment adjustments were recorded for the year ended December 31, 2023 or for the year ended December 31, 2022.

Once we identify a real estate property to be sold and it is probable that it will be sold, we classify the property as held for sale. We establish a valuation allowance subject to periodic revisions, if necessary, to adjust the carrying value of the property to reflect the lower of its current carrying value or the fair value, less associated selling costs. The valuation allowance did not change for the year ended December 31, 2023 or for the year ended December 31, 2022.

We use research, both internal and external, to recommend appropriate product and geographic allocations and changes to the equity real estate portfolio. We monitor product, geographic and industry diversification separately and together to determine the most appropriate mix.

Equity real estate is distributed across geographic regions of the country. As of December 31, 2023, our largest equity real estate portfolio concentration was in the Pacific (46%) region of the United States. By property type, our largest concentrations were in Apartments (34%) and Industrial (29%) as of December 31, 2023.

Other Investments

Our other investments totaled $4,121.2 million as of December 31, 2023, compared to $3,745.7 million as of December 31, 2022. Other investments include interests in unconsolidated entities, which include real estate properties owned jointly with venture partners and operated by the partners; sponsored investment funds; the cash surrender value of company owned and trust owned life insurance; derivative assets and other investments.

76

Table of Contents

International Investment Operations

Of our invested assets, $6,888.4 million were held by our Principal International operations as of December 31, 2023. The assets are primarily managed by the local Principal International affiliate. Due to the regulatory constraints in each location, each company maintains its own investment policies. As shown in the following table, the major category of international invested assets is fixed maturities. The following table excludes invested assets of the separate accounts.

December 31, 2023

December 31, 2022


Carrying


Percent


Carrying


Percent


amount


of total


amount


of total


($ in millions)

Fixed maturities

$

2,802.7

41

%  

$

3,110.9

42

%

Equity securities


809.9


12


1,165.4


16

Mortgage loans


964.8


14


952.7


13

Real estate


1.9


2.3


Policy loans


16.1


14.5


Other investments:


Direct financing leases


649.2


9


664.4


9

Investment in unconsolidated operating entities


1,190.0


17


1,092.3


14

Derivative assets and other investments


453.8


7


439.8


6

Total invested assets


6,888.4


100

%  


7,442.3


100

%

Cash and cash equivalents


220.5


190.6


Total invested assets and cash

$

7,108.9

$

7,632.9


Regulations in certain locations require investment in the funds we manage. These required regulatory investments are classified as equity securities within our consolidated statements of financial position, with all mark-to-market changes reflected in net investment income. Our investment is primarily dictated by client activity and all investment performance is retained by us.

Item 7A Quantitative and Qualitative Disclosures About Market Risk

Market Risk Exposures and Risk Management

Market risk is the risk we will incur losses due to adverse fluctuations in market rates and prices. Our primary market risk exposures are to interest rates, equity markets and foreign currency exchange rates. The active management of market risk is an integral part of our operations. We manage our overall market risk exposure within established risk tolerance ranges using several approaches, including:

rebalancing our existing asset or liability portfolios;
controlling the risk structure of newly acquired assets and liabilities and
using derivative instruments to modify the market risk characteristics of existing assets or liabilities or assets expected to be purchased.

Interest Rate Risk

Interest rate risk is the risk of economic losses due to adverse changes in interest rates. Interest rate risk arises primarily from our holdings in interest sensitive assets and liabilities. Changes in interest rates impact numerous aspects of our operations, including but not limited to:

yield on our invested assets;
rate of interest we credit to contractholder account balances;
timing of cash flows on assets and liabilities containing embedded prepayment options;
cost of hedging our GMWB rider;
discount rate used in valuing our liability for future policy benefits for long-duration insurance and annuity contracts;
discount rate used in valuing our pension and OPEB obligations;
statutory reserve and capital requirements;
asset-based fees earned on the fixed income assets we manage;

77

Table of Contents

interest expense on our long-term borrowings;
fair value of intangible assets in our reporting units and
fair value of financial assets and liabilities held at fair value on our consolidated statements of financial position.

Lower interest rates generally result in lower profitability in the long-term. Conversely, higher interest rates generally result in higher profitability in the long-term. However, an increase in market interest rates may cause a decline in the value of financial assets held at fair value on our consolidated statements of financial position.

Impact of Changes in Long-Term Interest Rate Assumptions

We use long-term interest rate assumptions to calculate MRBs, certain reserves and benefit plan obligations in accordance with U.S. GAAP. In setting these assumptions, we consider a variety of factors, including historical experience, emerging trends and future expectations. We evaluate our assumptions on at least an annual basis. Due to the long-term nature of our assumptions, we generally do not revise our assumptions in response to short-term fluctuations in market interest rates. However, we will consider revising our assumptions if a significant change occurs in the factors noted above.

A reduction in our long-term interest rate assumptions may result in increases in MRB liabilities and certain reserves.

Impact of Changes in Interest Rates

Changes in interest rates or a sustained low interest rate environment may result in the following impacts, which would impact our financial position and results of operations:

Impact of Falling Interest Rates or Sustained Low Interest Rates

Impact of Rising Interest Rates

Adverse Impacts:

Positive Impacts:

A reduction in investment income, which may be partially offset by a reduction in the interest we credit on contractholder account balances; however, our ability to lower crediting rates may be constrained by guaranteed minimum interest rates and competitive pressures

An increase in investment income, which may be partially or fully offset by an increase in the interest we credit on contractholder account balances

An increase in the cost of hedging our GMWB rider

A decrease in the cost of hedging our GMWB rider

An increase in MRB liabilities and certain reserves

A decrease in MRB liabilities and certain reserves

A reduction in the discount rate used to measure reserves for long-duration insurance and annuity contracts, leading to an increase in our reserves

An increase in the discount rate used to measure reserves for long-duration insurance and annuity contracts, leading to a decrease in our reserves

A reduction in the discount rate used in valuing our pension and OPEB obligations, leading to an increase in our Projected Benefit Obligation, Net Periodic Pension Cost, Accumulated Postretirement Benefit Obligation and Net Periodic Benefit Cost

An increase in the discount rate used in valuing our pension and OPEB obligations, leading to a decrease in our Projected Benefit Obligation, Net Periodic Pension Cost, Accumulated Postretirement Benefit Obligation and Net Periodic Benefit Cost

An increase in statutory capital we are required to hold as well as the amount of assets we must maintain to support statutory reserves

A decrease in statutory capital we are required to hold as well as the amount of assets we must maintain to support statutory reserves

An increase in prepayments or redemptions on mortgages and bonds we own, which would force us to reinvest the proceeds at lower interest rates

A decrease in prepayments or redemptions on mortgages and bonds we own, which would reduce our opportunity to reinvest the proceeds at higher interest rates

An increase in the value of the fixed income assets we manage, resulting in an increase in our fee revenue in the short-term

A decrease in the value of the fixed income assets we manage, resulting in a decrease in our fee revenue in the short-term

A decrease in the interest expense on our long-term borrowings, to the extent the borrowings have adjustable rates or we are able to refinance our obligations at lower interest rates

An increase in the interest expense on our long-term borrowings, to the extent the borrowings have adjustable rates or we refinance our obligations at higher interest rates

An increase in the fair value of certain financial assets held at fair value on our consolidated statements of financial position

A decrease in the fair value of certain financial assets held at fair value on our consolidated statements of financial position, as discussed below

A reduction in the fair value of intangible assets in our reporting units, potentially leading to an impairment of goodwill or other intangible assets

We estimate a hypothetical 100 basis point immediate, parallel decrease in U.S. interest rates would impact segment pre-tax operating earnings between (1)% and 1% over the next twelve months. This estimate reflects the impact of routine management actions in response to changes in interest rates, such as reducing the interest rates we credit on contractholder account balances, but does not reflect the impact of other actions management may consider, such as curtailing sales of certain products.

78

Table of Contents

The selection of a 100 basis point immediate, parallel decrease in U.S. interest rates should not be construed as a prediction by us of future market events, but rather as an illustration of the impact of such an event. Our exposure will change as a result of ongoing portfolio transactions in response to new business, management’s assessment of changing market conditions and changes in our mix of business.

If market rates increase rapidly, policy surrenders, withdrawals and requests for policy loans may increase as customers seek to achieve higher returns. Excess lapses may result in an acceleration of amortization for our DAC and other actuarial balances. We may be required to sell assets to raise the cash necessary to respond to such surrenders, withdrawals and loans, thereby realizing capital losses on the assets sold.

Guaranteed Minimum Interest Rate Exposure. The following table provides detail on the differences between the interest rates being credited to contractholders as of December 31, 2023, and the respective guaranteed minimum interest rates (“GMIRs”). Amounts for contracts without significant fee revenues such as GICs, funding agreements, retail fixed income annuities and guaranteed pension contracts are excluded. Additionally, amounts for contracts that are reinsured as part of the Talcott Reinsurance Transaction are also excluded. Account values are broken down by GMIR level within the Retirement and Income Solutions and Benefits and Protection segments.

Account values (1)


Excess of crediting rates over GMIR:

Up to 0.50%

0.51% to 1.00%

1.01% to 2.00%

2.01% or more


At GMIR


above GMIR


above GMIR


above GMIR


above GMIR


Total

($ in millions)

Guaranteed minimum interest rate


Retirement and Income Solutions


Up to 1.00%

$

22.6

$

3.3

$

101.8

$

1,006.0

$

312.8

$

1,446.5

1.01% ‑ 2.00%


5,139.6


3.8


1,153.1


874.6


7,171.1

2.01% ‑ 3.00%


630.6


0.1


0.8


59.1


1,701.2


2,391.8

3.01% ‑ 4.00%


7.4


7.4

4.01% and above

16.9

16.9

Subtotal


5,817.1


7.2


1,255.7


1,065.1


2,888.6


11,033.7

Benefits and Protection


Up to 1.00%


16.1


1.0


2.4


19.5

1.01% ‑ 2.00%


4.6


415.4


420.0

2.01% ‑ 3.00%


7.0


9.9


119.5


350.6


3.0


490.0

3.01% ‑ 4.00%


1,606.6


48.0


37.5


32.5


3.2


1,727.8

4.01% and above


40.5


3.9


8.3


1.5


54.2

Subtotal


1,654.1


61.8


181.4


390.2


424.0


2,711.5

Total

$

7,471.2

$

69.0

$

1,437.1

$

1,455.3

$

3,312.6

$

13,745.2

Percentage of total


54.4

%  

0.4

%  

10.5

%  

10.6

%  

24.1

%  


100.0

%

(1)Includes only the account values, net of the account values with associated policy loans, for products with GMIRs and discretionary crediting rates, excluding amounts for contracts that are reinsured as part of the Talcott Reinsurance Transaction.

Impact of Rising Interest Rates on the Fair Value of Financial Assets. An increase in market interest rates may cause a decline in the value of financial assets held at fair value on our consolidated statements of financial position. Although changes in the fair value of our financial assets due to changes in interest rates may impact the amount of equity reported in our consolidated statements of financial position, these changes will not cause an economic gain or loss unless we sell investments, terminate derivative positions, record an allowance for credit loss, or determine a derivative instrument is no longer an effective hedge.

79

Table of Contents

We estimate a hypothetical 100 basis point immediate, parallel increase in interest rates would reduce the net reported fair value of our financial assets and derivatives by $2,670.3 million as of December 31, 2023, compared to$2,446.9 million as of December 31, 2022. This estimate only reflects the change in fair value for financial assets and derivatives reported at fair value on our consolidated statements of financial position. Assets and liabilities not reported at fair value on our consolidated statements of financial position – including mortgage loans, liabilities relating to insurance contracts, investment contracts, debt and bank deposits – are excluded from this sensitivity analysis. We believe the excluded liability items would economically serve as a partial offset to the net interest rate risk of the financial instruments included in the sensitivity analysis. Separate account assets and liabilities are also excluded from this estimate, as any interest rate risk is borne by the holder of the separate account. Assets backing reserves as part of a coinsurance with funds withheld agreement are excluded from this estimate, as any interest rate risk is passed to the reinsurer. For more information on fair value measurements, see Item 8. “Financial Statements and Supplementary Data, Notes to Consolidated Financial Statements, Note 18, Fair Value Measurements.”

Our selection of a 100 basis point immediate, parallel increase in interest rates is a hypothetical rate scenario we use to demonstrate potential risk. While a 100 basis point immediate, parallel increase does not represent our view of future market changes, it is a near term reasonably possible hypothetical change that illustrates the potential impact of such events. While this sensitivity analysis provides a representation of interest rate sensitivity, it is based on our portfolio exposures at a point in time and may not be representative of future market results. These exposures will change as a result of ongoing portfolio transactions in response to new business, management’s assessment of changing market conditions and available investment opportunities.

Our net estimated potential loss in fair value as of December 31, 2023, increased $223.4 million from December 31, 2022, primarily due to an increase in the fair value of our assets.

Interest Rate Risk Management

We manage interest rate risk through the use of an integrated risk management framework. This helps us identify, assess, monitor, report and manage our risks within established limits and risk tolerances. Our internal risk committees monitor and discuss our risk profile and identify necessary actions to mitigate impacts from interest rate risk.

The product designs within our business units result in a variety of different interest rate risk profiles. Therefore, our business units use a variety of different approaches for managing their asset and liability interest rate risks.

Retirement Business Stable Cash Flows — For stable and predictable cash flow liabilities, such as pension risk transfer, WSRS, and investment only, we use investment strategy and hedges to tightly align the cash flow run off of these asset and liability cash flows. Immunization analysis is also utilized in the management of interest rate risk.
U.S. Insurance Stable Cash Flows — Our insurance businesses in many instances contain long-term guarantees with stable and predictable liability cash flows and recurring premiums. We manage the interest rate risk through investment strategy, product crediting rates and analyzing duration and embedded value sensitivity.
Principal International — Our international businesses operate within local regulations and financial market conditions (e.g., derivative markets, assets available) to achieve similar asset and liability cash flow management objectives. In locations with a limited availability of long-dated assets and derivative markets, the duration gap is managed to risk tolerances specific to each location.

We also limit our exposure to interest rate risk through our business mix and strategy. We have intentionally limited our exposure to specific products where investment margins are critical to the product’s profitability, and we continue to emphasize the sale of products that generate revenues in the form of fees for service or premiums for insurance coverage and expose us to minimal interest rate risk.

Prepayment risk is controlled by limiting our exposure to investments that are prepayable without penalty prior to maturity at the option of the issuer. We also require additional yield on these investments to compensate for the risk the issuer will exercise such option. Prepayment risk is also controlled by limiting the sales of liabilities with features such as puts or other options that can be exercised at inopportune times. We manage the interest rate risk associated with our long-term borrowings by monitoring the interest rate environment and evaluating refinancing opportunities as maturity dates approach.

80

Table of Contents

The plan fiduciaries use a Dynamic Asset Allocation strategy for our qualified defined benefit pension plan, which strategically allocates an increasing portion of the assets of the pension plan to fixed income securities as the funding status improves. The intended purpose of using the Dynamic Asset Allocation strategy is that the expected change in the value of the plan assets and the change in pension benefit obligation due to market movements are more likely to have more correlation versus a static allocation of assets between categories. For more information see Item 7. “Management’s Discussion and Analysis of Financial Condition and Results of Operations — Critical Accounting Policies and Estimates — Benefit Plans” and Item 8. “Financial Statements and Supplementary Data, Notes to Consolidated Financial Statements, Note 15, Employee and Agent Benefits.”

Use of Derivatives to Manage Interest Rate Risk. We use or have used various derivative financial instruments to manage our exposure to fluctuations in interest rates, including interest rate swaps, interest rate options, to be announced (“TBA”) forwards, bond forwards, treasury forwards, swaptions and futures. We use interest rate swaps, treasury forwards and futures contracts to hedge against changes in the value of the GMWB MRB. We use interest rate swaps and have used TBA forwards primarily to more closely match the interest rate characteristics of assets and liabilities. They can be used to change the sensitivity to the interest rate of specific assets and liabilities as well as an entire portfolio. We use bond forwards to fix the purchase price of a bond at a specified date in the future. We use interest rate options to manage prepayment risks in our assets and minimum guaranteed interest rates and lapse risks in our liabilities. We have purchased swaptions to hedge interest rate exposure for certain assets and liabilities.

Foreign Currency Risk

Foreign currency risk is the risk we will incur economic losses due to adverse fluctuations in foreign currency exchange rates. This risk arises from foreign currency-denominated funding agreements issued to nonqualified institutional investors in the international market, foreign currency-denominated fixed maturity and equity securities, and our international operations, including expected cash flows and potential acquisition and divestiture activity.

We estimate as of December 31, 2023, a 10% immediate unfavorable change in each of the foreign currency exchange rates to which we are exposed would result in no material change to the net fair value of our foreign currency-denominated instruments identified above because we effectively hedge foreign currency-denominated instruments to minimize exchange rate impacts, which is consistent with our estimate as of December 31, 2022. However, fluctuations in foreign currency exchange rates do affect the translation of segment pre-tax operating earnings and equity of our international operations into our consolidated financial statements.

For our Principal International operations, we estimate a 10% immediate unfavorable change in each of the foreign currency exchange rates to which we were exposed would have resulted in a $285.0 million, or 10.0%, reduction in the total equity excluding noncontrolling interests of our international operations as of December 31, 2023, as compared to an estimated $258.5 million, or 10.0%, reduction as of December 31, 2022. We estimate a 10% unfavorable change in the average foreign currency exchange rates to which we were exposed through our international operations would have resulted in a $37.5 million, or 12.0%, reduction in segment pre-tax operating earnings of our international operations for the year ended December 31, 2023, as compared to an estimated $36.8 million, or 12.0%, reduction for the year ended December 31, 2022.

The selection of a 10% immediate unfavorable change in all currency exchange rates should not be construed as a prediction by us of future market events, but rather as an illustration of the potential impact of such an event. These exposures will change as a result of a change in the size and mix of our foreign operations.

Use of Derivatives to Manage Foreign Currency Risk. The foreign currency risk on funding agreements and fixed maturities in our U.S. operations is mitigated by using currency swaps that swap the foreign currency interest and principal payments to our functional currency. We did not have currency swap agreements associated with foreign-denominated liabilities as of December 31, 2023 and December 31, 2022. The notional amount of our currency swap agreements associated with foreign-denominated fixed maturities was $1,888.5 million and $1,389.8 million as of December 31, 2023 and December 31, 2022, respectively.

With regard to our international operations, in order to enhance the diversification of our investment portfolios we may invest in bonds denominated in a currency that is different than the currency of our liabilities. We use foreign exchange derivatives to economically hedge the currency mismatch. Our Principal International operations had currency swaps with a notional amount of $217.3 million and $244.9 million as of December 31, 2023 and December 31, 2022, respectively. Our Principal International operations also utilized currency forwards with a notional amount of $711.9 million and $672.5 million as of December 31, 2023 and December 31, 2022, respectively.

We use currency forwards to hedge currency risk associated with expected cash flows in our foreign operations. We held currency forwards with a notional of $265.5 million and $388.5 million as of December 31, 2023 and December 31, 2022, respectively.

81

Table of Contents

Additionally, we use currency forwards to hedge net equity investments in our foreign operations, including certain sponsored investment funds. We held currency forwards with a notional amount of $31.0 million and $30.1 million as of December 31, 2023 and December 31, 2022, respectively.

We also use currency forwards to hedge certain foreign-denominated investments in our domestic operations. We held currency forwards with a notional amount of $54.1 million and $32.0 million as of December 31, 2023 and December 31, 2022, respectively.

Equity Risk

Equity risk is the risk we will incur economic losses due to adverse fluctuations in equity markets. As of December 31, 2023 and December 31, 2022, the fair value of our equity securities was $1,478.1 million and $1,708.6 million, respectively. We estimate a 10% decline in the prices of the equity securities would result in a decline in fair value of our equity securities of $147.8 million as of December 31, 2023, as compared to a decline in fair value of our equity securities of $170.9 million as of December 31, 2022.

We are also exposed to the risk that asset-based fees decrease as a result of declines in assets under management due to changes in investment prices and the risk that asset management fees calculated by reference to performance could be lower.

We also have equity risk associated with (1) universal life contracts that credit interest to customers based on changes in an external equity index; (2) variable annuity contracts that have a GMWB rider that allows the customer to make withdrawals of a specified annual amount, either for a fixed number of years or for the lifetime of the customer, even if the account value is reduced to zero; (3) variable annuity contracts that have a GMDB that allows the death benefit to be paid, even if the account value has fallen below the GMDB amount; (4) SEC-registered annuity contracts with returns linked to an external equity index and (5) investment contracts in which the return is subject to minimum contractual guarantees. We are also subject to equity risk based upon the assets that support our employee benefit plans. For further discussion of equity risk associated with these plans, see Item 7. “Management’s Discussion and Analysis of Financial Condition and Results of Operations — Critical Accounting Policies and Estimates — Benefit Plans.”

We estimate an immediate 10% decline in the S&P 500 index, followed by a 2% per quarter increase would reduce our annual segment pre-tax operating earnings by approximately 5% to 8% over the next twelve months. The selection of a 10% unfavorable change in the S&P 500 index should not be construed as a prediction by us of future market events, but rather as an illustration of the potential impact of such an event. Our exposure will change as a result of changes in our mix of business.

Separate and distinct from our equity risk associated with a decline in the S&P index, we also have equity risk associated with certain domestic alternative investments. These investments are comprised of several asset categories (including hedge funds, private equity, infrastructure and direct lending) that provide an attractive asset match to our long-dated liabilities and create diversification benefits to our fixed income investments. The risk profile of these investments is actively monitored by our Investment Committee and our corporate risk management function. Changes in the value of these investments will impact earnings. We estimate an immediate 10% decline in the value of those assets, followed by a 2% per quarter increase would reduce our annual segment pre-tax operating earnings by less than 8%. The selection of a 10% unfavorable change in the value of those assets should not be construed as a prediction of future market events, but rather as an illustration of the potential impact of such a decline in value of those assets.

Use of Derivatives to Manage Equity Risk. We economically hedge the universal life products, where the interest credited is linked to an external equity index, by purchasing options that match the product’s profile or selling options to offset existing exposures. We economically hedge RILA exposure using options and futures. We economically hedge the GMWB rider MRB exposure, which includes interest rate risk and equity risk, using futures, options, treasury forwards and interest rate swaps with notional amounts of $8,600.5 million and $8,950.4 million as of December 31, 2023, and December 31, 2022, respectively. The fair value of both MRBs and associated hedging instruments are sensitive to financial market conditions and the variance related to the change in fair value of these items for a given period is largely dependent on market conditions at the end of the period.

82

Table of Contents

Item 8. Financial Statements and Supplementary Data

Report of Independent Registered Public Accounting Firm on Internal Control Over Financial Reporting

84

Report of Independent Registered Public Accounting Firm (PCAOB ID: 42)

85

Audited Consolidated Financial Statements

Consolidated Statements of Financial Position

88

Consolidated Statements of Operations

89

Consolidated Statements of Comprehensive Income

90

Consolidated Statements of Stockholders’ Equity

91

Consolidated Statements of Cash Flows

92

Notes to Consolidated Financial Statements

93

119

120

124

143

153

155

158

161

167

181

184

187

191

194

206

209

214

231

231

237

241

246

83

Table of Contents

Report of Independent Registered Public Accounting Firm

To the Stockholders and the Board of Directors of Principal Financial Group, Inc.

Opinion on Internal Control Over Financial Reporting

We have audited Principal Financial Group, Inc.’s internal control over financial reporting as of December 31, 2023, based on criteria established in Internal Control—Integrated Framework issued by the Committee of Sponsoring Organizations of the Treadway Commission (2013 framework) (the COSO criteria). In our opinion, Principal Financial Group, Inc. (the Company) maintained, in all material respects, effective internal control over financial reporting as of December 31, 2023, based on the COSO criteria.

We also have audited, in accordance with the standards of the Public Company Accounting Oversight Board (United States) (PCAOB), the consolidated statements of financial position of the Company as of December 31, 2023 and 2022, the related consolidated statements of operations, comprehensive income, stockholders’ equity and cash flows for each of the three years in the period ended December 31, 2023, and the related notes and financial statement schedules listed in the Index at Item 15(a) and our report dated February 20, 2024 expressed an unqualified opinion thereon.

Basis for Opinion

The Company’s management is responsible for maintaining effective internal control over financial reporting and for its assessment of the effectiveness of internal control over financial reporting included in the accompanying Management’s Report on Internal Control Over Financial Reporting. Our responsibility is to express an opinion on the Company’s internal control over financial reporting based on our audit. We are a public accounting firm registered with the PCAOB and are required to be independent with respect to the Company in accordance with the U.S. federal securities laws and the applicable rules and regulations of the Securities and Exchange Commission and the PCAOB.

We conducted our audit in accordance with the standards of the PCAOB. Those standards require that we plan and perform the audit to obtain reasonable assurance about whether effective internal control over financial reporting was maintained in all material respects.

Our audit included obtaining an understanding of internal control over financial reporting, assessing the risk that a material weakness exists, testing and evaluating the design and operating effectiveness of internal control based on the assessed risk, and performing such other procedures as we considered necessary in the circumstances. We believe that our audit provides a reasonable basis for our opinion.

Definition and Limitations of Internal Control Over Financial Reporting

A company’s internal control over financial reporting is a process designed to provide reasonable assurance regarding the reliability of financial reporting and the preparation of financial statements for external purposes in accordance with generally accepted accounting principles. A company’s internal control over financial reporting includes those policies and procedures that (1) pertain to the maintenance of records that, in reasonable detail, accurately and fairly reflect the transactions and dispositions of the assets of the company; (2) provide reasonable assurance that transactions are recorded as necessary to permit preparation of financial statements in accordance with generally accepted accounting principles, and that receipts and expenditures of the company are being made only in accordance with authorizations of management and directors of the company; and (3) provide reasonable assurance regarding prevention or timely detection of unauthorized acquisition, use, or disposition of the company’s assets that could have a material effect on the financial statements.

Because of its inherent limitations, internal control over financial reporting may not prevent or detect misstatements. Also, projections of any evaluation of effectiveness to future periods are subject to the risk that controls may become inadequate because of changes in conditions, or that the degree of compliance with the policies or procedures may deteriorate.

/s/ Ernst & Young LLP

Des Moines, Iowa

February 20, 2024

84

Table of Contents

Report of Independent Registered Public Accounting Firm

To the Stockholders and the Board of Directors of Principal Financial Group, Inc.

Opinion on the Financial Statements

We have audited the accompanying consolidated statements of financial position of Principal Financial Group, Inc.(the Company) as of December 31, 2023 and 2022, the related consolidated statements of operations, comprehensive income, stockholders’ equity and cash flows for each of the three years in the period ended December 31, 2023, and the related notes and financial statement schedules listed in the Index at Item 15(a) (collectively referred to as the “consolidated financial statements”). In our opinion, the consolidated financial statements present fairly, in all material respects, the financial position of the Company at December 31, 2023 and 2022, and the results of its operations and its cash flows for each of the three years in the period ended December 31, 2023, in conformity with U.S. generally accepted accounting principles.

We also have audited, in accordance with the standards of the Public Company Accounting Oversight Board (United States) (PCAOB), the Company’s internal control over financial reporting as of December 31, 2023, based on criteria established in Internal Control—Integrated Framework issued by the Committee of Sponsoring Organizations of the Treadway Commission (2013 framework), and our report dated February 20, 2024 expressed an unqualified opinion thereon.

Adoption of ASU No. 2018-12

As discussed in Note 1 to the consolidated financial statements, the Company changed its method of accounting for long-duration contracts in each of the three years in the period ended December 31, 2023 due to the adoption of ASU No. 2018-12, Financial Services – Insurance (Topic 944), Targeted Improvements to the Accounting for Long-Duration Contracts.

Basis for Opinion

These financial statements are the responsibility of the Company’s management. Our responsibility is to express an opinion on the Company’s financial statements based on our audits. We are a public accounting firm registered with the PCAOB and are required to be independent with respect to the Company in accordance with the U.S. federal securities laws and the applicable rules and regulations of the Securities and Exchange Commission and the PCAOB.

We conducted our audits in accordance with the standards of the PCAOB. Those standards require that we plan and perform the audit to obtain reasonable assurance about whether the financial statements are free of material misstatement, whether due to error or fraud. Our audits included performing procedures to assess the risks of material misstatement of the financial statements, whether due to error or fraud, and performing procedures that respond to those risks. Such procedures included examining, on a test basis, evidence regarding the amounts and disclosures in the financial statements. Our audits also included evaluating the accounting principles used and significant estimates made by management, as well as evaluating the overall presentation of the financial statements. We believe that our audits provide a reasonable basis for our opinion.

Critical Audit Matters

The critical audit matters communicated below are matters arising from the current period audit of the financial statements that were communicated or required to be communicated to the audit committee and that: (1) relate to accounts or disclosures that are material to the financial statements and (2) involved our especially challenging, subjective or complex judgments. The communication of critical audit matters does not alter in any way our opinion on the consolidated financial statements, taken as a whole, and we are not, by communicating the critical audit matters below, providing separate opinions on the critical audit matters or on the accounts or disclosures to which they relate.

85

Table of Contents

Valuation of investments in securities

Description of the Matter

A subset of the Company’s $66.5 billion fixed-income securities portfolio exhibits higher estimation uncertainty when determining fair value. The fixed-income securities, which include bonds, asset-backed securities, redeemable preferred stock and certain non-redeemable preferred securities, are classified as either available-for-sale or trading and, accordingly, are carried at fair value in the consolidated statements of financial position. As discussed in Note 18 of the consolidated financial statements, for certain securities the Company obtains prices from third party pricing vendors, a subset of which exhibit higher estimation uncertainty given the characteristics of the security. In addition, the Company uses a matrix priced internal model to develop the fair value for a subset of corporate bonds. The fair value is developed using a risk spread which creates higher estimation uncertainty.

Auditing the fair value of the securities that exhibit higher estimation uncertainty was especially challenging because determining the fair value is complex and highly judgmental and involves using inputs and assumptions that are not directly observable in the market.

How We Addressed the Matter in Our Audit

We obtained an understanding, evaluated the design and tested the operating effectiveness of controls over management’s valuation process for the fixed income securities portfolio that exhibits higher estimation uncertainty. This included, among others, testing the review and approval process that management has in place over validating the fair value from third party pricing sources and the assumptions used in determining the fair value for matrix priced securities.

To test the fair value calculation, we utilized the support of our valuation specialists which included, among others, independently calculating a reasonable range of fair values for a sample of securities by using a cash flow model and cash flow and yield assumptions based on independently obtained information or available transaction data for similar securities. We compared these ranges to management’s estimates of fair value for the selected securities.

Liability for future policy benefits and claims

Description of the Matter

At December 31, 2023, future policy benefits and claims related to traditional and limited payment long-duration contracts totaled $46.8 billion.

The future policy benefits liability related to these products is based on estimates of how much the Company will need to pay for future benefits and the amount of fees to be collected from policyholders for these policy features. As described in Note 10, there is uncertainty inherent in estimating this liability because there is a significant amount of management judgment involved in developing certain assumptions that impact the liability balance, which include mortality rates, and lapse termination rates.

Auditing the valuation of future policy benefits liabilities related to these products was complex and required the involvement of our actuarial specialist due to the high degree of judgment used by management in setting the assumptions used in the estimate of the future policy benefits liability related to these products.

86

Table of Contents

How We Addressed the Matter in Our Audit

We obtained an understanding, evaluated the design and tested the operating effectiveness of controls over the future policy benefits liability estimation processes, including among others, controls related to the review and approval processes that management has in place for the assumptions used in the valuation of the future policy benefits liability. This included testing controls related to management’s evaluation of the need to update assumptions based on the comparison of actual company experience to previous assumptions.

We involved actuarial specialists to assist with our audit procedures which included, among others, an evaluation of the methodology applied by management with those methods used in prior periods. To assess the significant assumptions used by management, we compared the significant assumptions noted above to historical experience, industry data or management’s estimates of prospective changes in these assumptions. In addition, we performed an independent recalculation of cash flows related to the future policy benefit reserves for a sample of cohorts or contracts which we compared to the actuarial model used by management.

/s/ Ernst & Young LLP

We have served as the Company’s auditor since 1967.

Des Moines, Iowa

February 20, 2024

87

Table of Contents

Principal Financial Group, Inc.

Consolidated Statements of Financial Position

December 31, 

December 31, 


2023


2022

(As recast)

(in millions)

Assets

Fixed maturities, available-for-sale

$

65,673.1

$

62,889.9

Fixed maturities, trading (2023 and 2022 include $81.2 million and $27.8 million related to consolidated variable interest entities)

836.2


760.7

Equity securities (2023 and 2022 include $394.4 million and $740.0 million related to consolidated variable interest entities)

1,478.1


1,708.6

Mortgage loans (2023 and 2022 include $871.9 million and $1,179.7 million related to consolidated variable interest entities)

20,142.8


20,629.8

Real estate (2023 and 2022 include $779.1 million and $649.0 million related to consolidated variable interest entities)

2,345.3


2,239.7

Policy loans

809.3


784.7

Other investments (2023 and 2022 include $596.4 million and $375.9 million related to consolidated variable interest entities and $163.2 million and $0.0 million measured at fair value under the fair value option)

7,035.6


6,122.0

Total investments

98,320.4


95,135.4

Cash and cash equivalents (2023 and 2022 include $83.6 million and $32.4 million related to consolidated variable interest entities)

4,707.7


4,848.0

Accrued investment income

786.2


742.1

Reinsurance recoverable and deposit receivable

20,611.7

21,442.7

Premiums due and other receivables

3,998.8


3,933.3

Deferred acquisition costs

3,950.5


3,948.0

Market risk benefit asset

153.4

109.2

Property and equipment

938.4


996.1

Goodwill

1,608.5


1,598.2

Other intangibles

1,469.8


1,533.3

Separate account assets (2023 and 2022 include $34,688.3 million and $34,193.8 million related to consolidated variable interest entities)

167,605.6


155,375.1

Other assets

895.7


1,205.6

Total assets

$

305,046.7

$

290,867.0

Liabilities

Contractholder funds (2023 and 2022 include $0.0 million and $334.0 million related to consolidated variable interest entities)

$

41,501.1

$

42,825.3

Future policy benefits and claims

46,826.5


43,314.0

Market risk benefit liability

133.2

207.4

Other policyholder funds

916.8


911.5

Short-term debt

61.1


80.7

Long-term debt

3,930.9


3,997.0

Income taxes currently payable

11.9


19.2

Deferred income taxes

1,613.3


1,324.2

Separate account liabilities (2023 and 2022 include $34,688.3 million and $34,193.8 million related to consolidated variable interest entities)

167,605.6


155,375.1

Funds withheld payable

19,629.5

20,436.1

Other liabilities (2023 and 2022 include $87.7 million and $86.8 million related to consolidated variable interest entities)

11,606.2


12,096.7

Total liabilities

293,836.1


280,587.2

Redeemable noncontrolling interest (2023 and 2022 include $226.4 million and $235.3 million related to consolidated variable interest entities)

248.9


262.0

Stockholders’ equity

Common stock, par value $0.01 per share; 2,500,000,000 shares authorized; 492,279,405 and 489,809,564 shares issued as of 2023 and 2022; 236,438,294 and 243,549,782 shares outstanding as of 2023 and 2022

4.9


4.9

Additional paid-in capital

10,908.6


10,740.4

Retained earnings

16,683.5


16,697.3

Accumulated other comprehensive loss

(5,345.3)


(6,879.0)

Treasury stock, at cost; 255,841,111 and 246,259,782 shares as of 2023 and 2022

(11,335.7)


(10,586.9)

Total stockholders’ equity attributable to Principal Financial Group, Inc.

10,916.0


9,976.7

Noncontrolling interest

45.7


41.1

Total stockholders’ equity

10,961.7


10,017.8

Total liabilities and stockholders’ equity

$

305,046.7

$

290,867.0

See accompanying notes.

88

Table of Contents

Principal Financial Group, Inc.

Consolidated Statements of Operations


For the year ended December 31, 

2023

2022

2021

(As recast)

(As recast)

(in millions, except per share data)

Revenues

Premiums and other considerations

$

6,470.9

$

5,339.7

$

4,841.5

Fees and other revenues

4,095.9

4,137.8


5,041.3

Net investment income

4,091.9

3,838.5


4,429.6

Net realized capital gains (losses) (1)

(72.2)

(182.1)


115.4

Net realized capital gains on funds withheld assets (1)

165.0

749.4

Change in fair value of funds withheld embedded derivative

(1,085.7)

3,652.8

Total revenues

13,665.8

17,536.1


14,427.8

Expenses

Benefits, claims and settlement expenses

7,788.2

6,631.3


7,258.2

Liability for future policy benefits remeasurement gain

(51.6)

(264.5)

(4.4)

Market risk benefit remeasurement loss

29.1

125.3

98.3

Dividends to policyholders

89.2

94.8


94.8

Operating expenses

5,072.1

4,962.2


5,070.0

Total expenses

12,927.0

11,549.1


12,516.9

Income before income taxes

738.8

5,987.0


1,910.9

Income taxes

68.7

1,189.5


283.9

Net income

670.1

4,797.5


1,627.0

Net income attributable to noncontrolling interest

46.9

40.6


46.8

Net income attributable to Principal Financial Group, Inc.

$

623.2

$

4,756.9

$

1,580.2

Earnings per common share

Basic earnings per common share

$

2.58

$

18.94

$

5.87

Diluted earnings per common share

$

2.55

$

18.63

$

5.79

(1)Includes realized and unrealized gains (losses). See Note 4, Investments, for further details.

See accompanying notes.

89

Table of Contents

Principal Financial Group, Inc.

Consolidated Statements of Comprehensive Income

For the year ended December 31, 


2023


2022


2021

(As recast)

(As recast)

(in millions)

Net income

$

670.1

$

4,797.5

$

1,627.0

Other comprehensive income (loss), net:

Net unrealized gains (losses) on available-for-sale securities

1,843.1

(9,846.8)


(2,085.3)

Net unrealized gains (losses) on derivative instruments

(41.8)

(23.1)


33.4

Liability for future policy benefits discount rate remeasurement gain (loss)

(312.7)

4,778.5

2,839.7

Market risk benefit nonperformance risk gain (loss)

(30.9)

114.1

(0.4)

Foreign currency translation adjustment

73.7

(22.1)


(245.9)

Net unrecognized postretirement benefit obligation

2.4

90.6


115.8

Other comprehensive income (loss)

1,533.8

(4,908.8)


657.3

Comprehensive income (loss)

2,203.9

(111.3)


2,284.3

Comprehensive income attributable to noncontrolling interest

47.0

41.2


43.3

Comprehensive income (loss) attributable to Principal Financial Group, Inc.

$

2,156.9

$

(152.5)

$

2,241.0

See accompanying notes.

90

Table of Contents

Principal Financial Group, Inc.

Consolidated Statements of Stockholders’ Equity


Accumulated


Additional

other

Total

Common

paid-in

Retained

comprehensive

Treasury

Noncontrolling

stockholders’


stock


capital


earnings


income (loss)


stock


interest


equity

(in millions)

Balances as of January 1, 2021

$

4.8

$

10,321.6

$

11,838.0

$

2,383.1

$

(7,988.6)

$

58.4

$

16,617.3

Common stock issued


86.7


86.7

Stock-based compensation


106.1


(10.0)


0.1


96.2

Treasury stock acquired, common


(937.2)


(937.2)

Dividends to common stockholders


(654.1)


(654.1)

Distributions to noncontrolling interest


(33.7)


(33.7)

Contributions from noncontrolling interest


7.4


7.4

Purchase of subsidiary shares from noncontrolling interest (1)


(16.4)


(1.7)


(18.1)

Adjustments to redemption amount of redeemable noncontrolling interest


(3.0)


(0.1)


(3.1)

Effects of implementation of accounting change related to long-duration insurance contracts, net

(159.9)

(5,128.0)

(5,287.9)

Net income (1)


1,580.2


29.3


1,609.5

Other comprehensive income (1)


660.8


(3.3)


657.5

Balances as of December 31, 2021 (As recast)

4.8

10,495.0

12,594.2

(2,084.1)

(8,925.8)

56.4

12,140.5

Common stock issued

0.1

181.6

181.7

Stock-based compensation

102.7

(11.5)

0.4

91.6

Treasury stock acquired, common

(1,661.1)

(1,661.1)

Accelerated share repurchase

(33.9)

(33.9)

Dividends to common stockholders

(642.3)

(642.3)

Distributions to noncontrolling interest

(86.2)

(86.2)

Contributions from noncontrolling interest

7.3

7.3

Purchase of subsidiary shares from noncontrolling interest (1)

(5.7)

(2.4)

(8.1)

Adjustments to redemption amount of redeemable noncontrolling interest

0.7

(0.5)

0.2

Adjustment for reinsurance

114.5

114.5

Net income (1)

4,756.9

66.4

4,823.3

Other comprehensive loss (1)

(4,909.4)

(0.3)

(4,909.7)

Balances as of December 31, 2022 (As recast)

4.9

10,740.4

16,697.3

(6,879.0)

(10,586.9)

41.1

10,017.8

Common stock issued

57.8

57.8

Stock-based compensation

110.7

(11.5)

0.5

99.7

Treasury stock acquired, common

(748.8)

(748.8)

Dividends to common stockholders

(625.5)

(625.5)

Distributions to noncontrolling interest

(26.5)

(26.5)

Contributions from noncontrolling interest

7.6

7.6

Purchase of subsidiary shares from noncontrolling interest (1)

(1.2)

(1.2)

Adjustments to redemption amount of redeemable noncontrolling interest

0.9

0.2

1.1

Net income (1)

623.2

23.2

646.4

Other comprehensive income (1)

1,533.7

(0.4)

1,533.3

Balances as of December 31, 2023

$

4.9

$

10,908.6

$

16,683.5

$

(5,345.3)

$

(11,335.7)

$

45.7

$

10,961.7

(1)Excludes amounts attributable to redeemable noncontrolling interest. See Note 17, Stockholders’ Equity, for further details.

See accompanying notes.

91

Table of Contents

Principal Financial Group, Inc.

Consolidated Statements of Cash Flows

For the year ended December 31, 


2023


2022


2021

(As recast)

(As recast)

(in millions)

Operating activities

Net income

$

670.1

$

4,797.5

$

1,627.0

Adjustments to reconcile net income to net cash provided by operating activities:

Net realized capital (gains) losses

72.2

182.1

(115.4)

Net realized capital gains on funds withheld assets

(165.0)


(749.4)


Change in fair value of funds withheld embedded derivative

1,085.7


(3,652.8)


Depreciation and amortization expense

272.7


295.9


275.3

Amortization of deferred acquisition costs and contract costs

428.1


422.4


405.8

Additions to deferred acquisition costs and contract costs

(429.3)

(427.2)

(522.1)

Amortization of reinsurance loss

17.7

19.3

23.0

Market risk benefit remeasurement loss

29.1

125.3

98.3

Stock-based compensation

99.4

91.3

96.1

Income from equity method investments, net of dividends received

(110.2)


(111.0)


(189.8)

Changes in:

Accrued investment income

(44.1)


(46.3)


13.8

Net cash flows for trading securities and equity securities with operating intent

(56.0)


(339.5)


99.9

Premiums due and other receivables

(36.7)


(3,301.9)


8.3

Contractholder and policyholder liabilities and dividends

2,562.0


1,914.7


1,430.6

Current and deferred income taxes (benefits)

(40.5)


854.8


117.9

Real estate acquired through operating activities

(130.8)

(164.4)

(73.7)

Real estate sold through operating activities

164.8


7.9


1.8

Funds withheld, net of reinsurance recoverable and deposit receivable

(665.2)


3,038.6


(36.0)

Other assets and liabilities

214.9


341.5


9.0

Other

(146.5)


(125.9)


(15.4)

Net adjustments

3,122.3


(1,624.6)


1,627.4

Net cash provided by operating activities

3,792.4


3,172.9


3,254.4

Investing activities

Fixed maturities available-for-sale and equity securities with intent to hold:

Purchases

(11,417.0)


(19,352.6)


(16,625.5)

Sales

5,888.3


14,729.7


2,735.3

Maturities

5,190.8


6,853.7


10,960.0

Mortgage loans acquired or originated

(2,044.2)


(3,731.2)


(5,223.5)

Mortgage loans sold or repaid

2,112.0


2,614.6


2,853.2

Real estate acquired

(187.5)

(245.2)

(281.4)

Real estate sold

132.0


374.0


133.7

Net purchases of property and equipment

(102.0)


(116.3)


(129.9)

Sale of interests in subsidiaries

27.0

Net change in other investments

(919.3)


(68.2)


(142.6)

Net cash provided by (used in) investing activities

(1,346.9)

1,058.5

(5,693.7)

Financing activities

Issuance of common stock

57.8

181.7

86.7

Accelerated stock repurchase settlement


(33.9)


Acquisition of treasury stock

(740.4)


(1,661.1)


(937.2)

Payments for financing element derivatives

(42.1)


(50.6)


(39.9)

Purchase of subsidiary shares from noncontrolling interest

(2.8)


(9.2)


(24.2)

Dividends to common stockholders

(625.5)


(642.3)


(654.1)

Issuance of long-term debt

691.5


15.4


Principal repayments of long-term debt

(764.0)


(302.0)


(1.8)

Net proceeds from (repayments of) short-term borrowings

(18.5)


0.9


10.2

Investment contract deposits

8,618.9


7,346.7


9,359.8

Investment contract withdrawals

(9,422.4)


(7,647.3)


(8,801.0)

Net increase (decrease) in banking operation deposits

(338.6)


1,086.3


2,922.9

Other

0.3


0.1

Net cash provided by (used in) financing activities

(2,585.8)


(1,715.4)


1,921.5

Net increase (decrease) in cash and cash equivalents

(140.3)


2,516.0


(517.8)

Cash and cash equivalents at beginning of period

4,848.0


2,332.0


2,849.8

Cash and cash equivalents at end of period

$

4,707.7

$

4,848.0

$

2,332.0

Supplemental information:

Cash paid for interest

$

170.7

$

175.8

$

166.1

Cash paid for income taxes

68.1

142.1

109.9

Supplemental disclosure of non-cash activities:

Asset changes resulting from deconsolidation of residential whole loan securitizations:

Decrease in mortgage loans

$

(389.7)

$

(220.7)

$

Increase in fixed maturities, available-for-sale

286.2

167.6

Increase in fixed maturities, trading

10.8

Assets transferred in kind for settlement to reinsurer

(428.5)

Changes from re-designation of other postretirement employee benefits (“OPEB”) plan assets to cover non-retiree benefits:

Increases in equity securities re-designated from funded status of OPEB plan

548.1

Increases in other investments re-designated from funded status of OPEB plan

117.5

Decrease in tax receivable re-designated from funded status of OPEB plan

(9.1)

Decrease in accumulated other comprehensive income (“AOCI”) due to reclassifying excess assets out of funded status of OPEB plan

9.1

Decrease in other assets due to reclassifying excess assets out of funded status of OPEB plan

(665.6)

Assets received in kind from pension risk transfer transactions

109.5

See accompanying notes.

92

Table of Contents

Principal Financial Group, Inc.

Notes to Consolidated Financial Statements

December 31, 2023

1. Nature of Operations and Significant Accounting Policies

Description of Business

Principal Financial Group, Inc. (“PFG”) is a leader in global investment management offering businesses, individuals and institutional clients a wide range of financial products and services, including retirement, asset management and insurance through our diverse family of financial services companies.

Basis of Presentation

The accompanying consolidated financial statements include the accounts of PFG and all other entities in which we directly or indirectly have a controlling financial interest as well as those variable interest entities (“VIEs”) in which we are the primary beneficiary. The consolidated financial statements have been prepared in conformity with U.S. generally accepted accounting principles (“U.S. GAAP”). All significant intercompany accounts and transactions have been eliminated.

Uncertainties may impact our business, results of operations, financial condition and liquidity. See “Use of Estimates in the Preparation of Financial Statements” for additional details. Our estimates and assumptions could change in the future. Our results of operations and financial condition may also be impacted by other uncertainties including evolving regulatory, legislative and standard-setter accounting interpretations and guidance.

On January 1, 2023, we adopted the guidance commonly referred to as long-duration targeted improvements (“LDTI”), which updates certain requirements in the accounting for long-duration insurance and annuity contracts. The guidance was applied as of the January 1, 2021, transition date. As such, results for 2022 and 2021 have been recast and are also presented under the new LDTI guidance.

In the first quarter of 2023 we implemented changes to our organizational structure to better align businesses, distribution teams and product offerings for future growth. We integrated our global asset management and international pension businesses under one segment, Principal Asset Management. Results of our historically reported Principal Global Investors and Principal International segments are reported within this segment. Additionally, we are now reporting results for our Retirement and Income Solutions segment in total and not separated into Fee and Spread components. Finally, we updated the name of our U.S. Insurance Solutions segment to Benefits and Protection and will continue to report the results of Specialty Benefits and Life Insurance within this segment. Our segment results have been modified to reflect these changes, which did not have an impact on our consolidated financial statements. See Note 20, Segment Information, for financial results of our segments.

Certain reclassifications have been made to prior periods relating to the presentation of our loss adjustment expense (“LAE”) liability and the change in that liability to conform to the current presentation. See Note 10, Future Policy Benefits and Claims. The LAE liability was previously reported in other liabilities in the consolidated statements of financial position and the change in the liability was previously reported in operating expenses in the consolidated statements of operations. The LAE liability is now reported in future policy benefits and claims in the consolidated statements of financial position and the change in the liability is now reported in benefits, claims and settlement expenses in the consolidated statements of operations.

During the second quarter of 2022, we closed a coinsurance with funds withheld reinsurance transaction with Talcott Life &Annuity Re, Ltd. (“Talcott Life & Annuity Re”), a limited liability company organized under the laws of the Cayman Islands and an affiliate of Talcott Resolution Life, Inc., a subsidiary of Sixth Street, pursuant to which we ceded our in-force U.S. retail fixed annuity and universal life insurance with secondary guarantee (“ULSG”) blocks of business (the “Talcott Reinsurance Transaction”). The economics of the transaction were effective as of January 1, 2022. See Note 12, Reinsurance, for further details.

93

Table of Contents

Principal Financial Group, Inc.

Notes to Consolidated Financial Statements – (continued)

December 31, 2023

1. Nature of Operations and Significant Accounting Policies – (continued)

Consolidation

We have relationships with various special purpose entities and other legal entities that must be evaluated to determine if the entities meet the criteria of a VIE or a voting interest entity (“VOE”). This assessment is performed by reviewing contractual, ownership and other rights, including involvement of related parties, and requires use of judgment. First, we determine if we hold a variable interest in an entity by assessing if we have the right to receive expected losses and expected residual returns of the entity. If we hold a variable interest, then the entity is assessed to determine if it is a VIE. An entity is a VIE if the equity at risk is not sufficient to support its activities, if the equity holders lack a controlling financial interest or if the entity is structured with non-substantive voting rights. In addition to the previous criteria, if the entity is a limited partnership or similar entity, it is a VIE if the limited partners do not have the power to direct the entity’s most significant activities through substantive kick-out rights or participating rights. A VIE is evaluated to determine the primary beneficiary. The primary beneficiary of a VIE is the enterprise with (1) the power to direct the activities of a VIE that most significantly impact the entity’s economic performance and (2) the obligation to absorb losses of the entity or the right to receive benefits from the entity that could potentially be significant to the VIE. When we are the primary beneficiary, we are required to consolidate the entity in our financial statements. We reassess our involvement with VIEs on a quarterly basis. For further information about VIEs, refer to Note 3, Variable Interest Entities.

If an entity is not a VIE, it is considered a VOE. VOEs are generally consolidated if we own a greater than 50% voting interest. If we determine our involvement in an entity no longer meets the requirements for consolidation under either the VIE or VOE models, the entity is deconsolidated. Entities in which we have management influence over the operating and financing decisions but are not required to consolidate, other than investments accounted for at fair value under the fair value option, are reported using the equity method.

94

Table of Contents

Principal Financial Group, Inc.

Notes to Consolidated Financial Statements – (continued)

December 31, 2023

1. Nature of Operations and Significant Accounting Policies – (continued)

Recent Accounting Pronouncements

Description

Date of
adoption

Effect on our consolidated
financial statements or other
significant matters

Standards not yet adopted:

Improvements to reportable segments disclosures

This authoritative guidance enhances the disclosures about a public entity’s reportable segments and addresses requests from investors for additional, more detailed information about a reportable segment’s expenses.

January 1, 2025

We are currently evaluating the impact this guidance will have on our consolidated financial statements.

Improvements to income tax disclosures

This authoritative guidance provides improvements to income tax disclosures primarily related to the rate reconciliation and income taxes paid information.

January 1, 2025

We are currently evaluating the impact this guidance will have on our consolidated financial statements.

Standards adopted:

Targeted improvements to the accounting for long-duration insurance contracts

This authoritative guidance updated certain requirements in the accounting for long-duration insurance and annuity contracts.

1.
The assumptions used to calculate the liability for future policy benefits on traditional and limited-payment contracts are reviewed and updated periodically. Cash flow assumptions are reviewed at least annually and updated when necessary with the impact recognized in net income. Discount rate assumptions are prescribed as the current upper-medium grade (low credit risk) fixed income instrument yield and are updated quarterly with the impact recognized in other comprehensive income (“OCI”).
2.
MRBs, which are contracts or contract features that provide protection to the policyholder from capital market risk and expose us to other-than-nominal capital market risk, are measured at fair value. The periodic change in fair value is recognized in net income with the exception of the periodic change in fair value related to our own nonperformance risk, which is recognized in OCI.

January 1, 2023

We created a governance framework and a plan to support implementation of the standard. Our implementation and evaluation process included, but was not limited to the following:

identifying and documenting contracts and contract features in scope of the guidance;
identifying the actuarial models, systems and processes to be updated;
evaluating and selecting our systems solutions for implementing the new guidance;
building models and evaluating preliminary output as models were developed;
evaluating and finalizing our key accounting policies;
assessing the impact to our chart of accounts;
developing format and content of new disclosures;
conducting financial dry runs using model output and updated chart of accounts;
evaluating transition requirements and impacts and
establishing and documenting appropriate internal controls.

This guidance changed how we account for many of our insurance and annuity products.

95

Table of Contents

Principal Financial Group, Inc.

Notes to Consolidated Financial Statements – (continued)

December 31, 2023

1. Nature of Operations and Significant Accounting Policies – (continued)

Description

Date of
adoption

Effect on our consolidated
financial statements or other
significant matters

3.
Deferred acquisition costs (“DAC”) and other actuarial balances for all insurance and annuity contracts are amortized on a constant basis over the expected term of the related contracts.
4.
Additional disclosures are required, including disaggregated rollforwards of significant insurance liabilities and other account balances as well as disclosures about significant inputs, judgments, assumptions and methods used in measurement.

The guidance for the liability for future policy benefits for traditional and limited-payment contracts and DAC was applied on a modified retrospective basis; that is, to contracts in force as of the beginning of the earliest period presented (January 1, 2021, also referred to as the transition date) based on their existing carrying amounts. An entity could elect to apply the changes retrospectively. The guidance for market risk benefits was applied retrospectively.

The guidance did not have a material impact on our consolidated statements of operations. Further details about transition impacts of the guidance are included under the caption “Adoption of Targeted Improvements to the Accounting for Long-Duration Insurance Contracts Guidance.”

The additional disclosure requirements can be found in the following notes:

Note 7, Deferred Acquisition Costs and Other Actuarial Balances
Note 8, Separate Account Balances
Note 9, Contractholder Funds
Note 10, Future Policy Benefits and Claims
Note 11, Market Risk Benefits

Troubled debt restructurings and vintage disclosures 

This authoritative guidance eliminated the accounting requirements for Troubled Debt Restructurings (“TDRs”) by creditors and enhanced the disclosure requirements for certain loan refinancing and restructuring by creditors when a borrower is experiencing financial difficulty. The update required entities to disclose current-period gross write-offs by year of origination for financing receivables and net investments in leases. The amendments in this update were applied prospectively, except for the transition method related to the recognition and measurement of troubled debt restructurings, for which an entity had the option to apply a modified retrospective transition method. Early adoption was permitted.

January 1, 2023

This guidance did not have a material impact on our consolidated financial statements.

96

Table of Contents

Principal Financial Group, Inc.

Notes to Consolidated Financial Statements – (continued)

December 31, 2023

1. Nature of Operations and Significant Accounting Policies – (continued)

Description

Date of
adoption

Effect on our consolidated
financial statements or other
significant matters

Targeted improvements to accounting for hedging activities – portfolio layer method

This authoritative guidance is intended to further align the economics of a company’s risk management activities in its financial statements with hedge accounting requirements. The guidance expanded the current single-layer method to allow multiple hedge layers of a single closed portfolio. Non-prepayable assets can also be included in the same portfolio. This guidance also clarified the current guidance on accounting for fair value basis adjustments applicable to both a single hedged layer and multiple hedged layers. Upon adoption, the application of these hedge strategies was applied prospectively. Early adoption was permitted.

January 1, 2023

This guidance did not have a material impact on our consolidated financial statements.

Simplifying the accounting for income taxes

This authoritative guidance simplified the accounting for income taxes by removing certain exceptions, including exceptions related to the incremental approach for intraperiod tax allocation, calculating income taxes in an interim period and the recognition of deferred tax liabilities for outside basis differences. Also, the guidance clarified the accounting for franchise taxes, transactions that result in a step-up in the tax basis of goodwill and enacted changes in tax laws or rates. It specifies that an entity is not required to allocate the consolidated amount of current and deferred tax expense to a legal entity that is not subject to tax in its separate financial statements, although an entity may elect to do so. The guidance was applied based on varying transition methods defined by amendment. Early adoption was permitted.

January 1, 2021

This guidance did not have a material impact on our consolidated financial statements.

97

Table of Contents

Principal Financial Group, Inc.

Notes to Consolidated Financial Statements – (continued)

December 31, 2023

1. Nature of Operations and Significant Accounting Policies – (continued)

Description

Date of
adoption

Effect on our consolidated
financial statements or other
significant matters

Facilitation of the effects of reference rate reform on financial reporting

This authoritative guidance provided optional expedients and exceptions for contracts and hedging relationships affected by reference rate reform. An entity could elect not to apply certain modification accounting requirements to contracts affected by reference rate reform and instead account for the modified contract as a continuation of the existing contract. Also, an entity could apply optional expedients to continue hedge accounting for hedging relationships in which the critical terms changed due to reference rate reform. This guidance eased the financial reporting impacts of reference rate reform on contracts and hedging relationships and was effective until December 31, 2022. A subsequent amendment issued in December 2022 extended the relief date from December 31, 2022, to December 31, 2024, and was effective upon issuance.

March 12, 2020

We adopted the guidance upon issuance prospectively and elected the applicable optional expedients and exceptions for contracts and hedging relationships impacted by reference rate reform through December 31, 2024. The guidance did not have an impact on our consolidated financial statements upon adoption.

When we adopt new accounting standards, we have a process in place to perform a thorough review of the pronouncement, identify the financial statement and system impacts and create an implementation plan among our impacted business units to ensure we are compliant with the pronouncement on the date of adoption. This includes having effective processes and controls in place to support the reported amounts. Each of the standards listed above is in varying stages in our implementation process based on its issuance and adoption dates. We are on track to implement guidance by the respective effective dates.

Adoption of Targeted Improvements to the Accounting for Long-Duration Insurance Contracts Guidance

As mentioned above, we adopted LDTI on January 1, 2023.

For traditional and limited-payment long-duration contracts, we review and update, if necessary, assumptions used to measure cash flows for the liability for future policy benefits during the third quarter of each year, or more frequently if evidence suggests assumptions should be revised. The change in our liability estimate as a result of updating cash flow assumptions is recognized in net income. Actual cash flows are grouped into issue-year cohorts for the liability calculation and updated quarterly. Cohorts are used as the unit of account for liability measurement. Discount rate assumptions are prescribed as the current upper-medium grade (low-credit-risk) fixed-income instrument yield. The discount rate is updated quarterly at each reporting date with the impact recognized in OCI. The provision for risk of adverse deviation is eliminated, as is premium deficiency, or loss recognition, testing. We also removed unrealized gain (loss) adjustments, previously recorded in AOCI, attributable to the impact of unrealized gains and losses on premium deficiency testing.

Under LDTI, market risk benefits (“MRBs”), which are contracts or contract features that provide protection to the policyholder from capital market risk and expose us to other-than-nominal capital market risk, are measured at fair value. The periodic change in fair value is recognized in net income with the exception of the periodic change in fair value related to our own nonperformance risk, which is recognized in OCI. Certain contract features previously accounted for as an embedded derivative or as an additional liability for annuitization benefits or death or other insurance benefits are recorded as MRBs under LDTI.

98

Table of Contents

Principal Financial Group, Inc.

Notes to Consolidated Financial Statements – (continued)

December 31, 2023

1. Nature of Operations and Significant Accounting Policies – (continued)

LDTI simplified the amortization of DAC and other actuarial balances such as the unearned revenue liability and sales inducement asset for long-duration contracts. These balances were previously amortized in proportion to premiums, estimated gross profits, estimated gross margins or estimated gross revenues; however, these balances are now amortized on a constant level basis over the expected life of the related contracts. Impairment testing is no longer applicable for DAC. We also removed unrealized gain (loss) adjustments, previously recorded in AOCI, as the LDTI amortization is not impacted by investment gains and losses.

LDTI also requires disaggregated rollforwards for the liability for future policy benefits, additional liability for certain benefit features, MRBs, DAC and other actuarial balances required to be amortized on a basis consistent with DAC. Although the accounting for the additional liability for certain benefit features, separate account liabilities and contractholder funds does not change under LDTI, the guidance requires disaggregated rollforwards for those balances. Further, for certain actuarial balances, disclosures are required for the significant inputs, judgments, assumptions and methods used in measurement, including changes in those inputs, judgments and assumptions, and the effect of those changes on measurement.

The LDTI guidance is not prescriptive as to the appropriate level of aggregation for disclosures; however, amounts from different reportable segments cannot be aggregated. Factors to consider in determining the level of aggregation for disclosures include the type of coverage, geography and market or type of customer. We have identified the following levels of aggregation for LDTI disclosures. The disclosures do not include levels of aggregation for insignificant balances.

Retirement and Income Solutions:
oWorkplace savings and retirement solutions – Group annuity contracts offered to the plan sponsors of defined contribution plans or defined benefit plans
oIndividual variable annuities – Variable deferred annuities and registered index-linked annuities (“RILAs”) offered to individuals for both qualified and nonqualified retirement savings
oPension risk transfer – Single premium group annuities offered to pension plan sponsors and other institutions
oIndividual fixed deferred annuities – An exited business that offered single premium deferred annuity contracts and flexible premium deferred annuities (“FPDAs”) to individuals for both qualified and nonqualified retirement savings
oIndividual fixed income annuities – An exited business that offered single premium immediate annuities (“SPIAs”) and deferred income annuities (“DIAs”) to individuals for both qualified and nonqualified retirement savings; also includes supplementary contracts generated by annuitizations from other individual product lines
oInvestment only – Primarily guaranteed investment contracts (“GICs”) and funding agreements offered to retirement plan sponsors and other institutions
Principal Asset Management – Principal International
oLatin America:
Individual fixed income annuities – SPIAs offered to individuals
Pension – Certain retirement accumulation products where the segregated funds and associated obligation to the client are consolidated within our financial statements as separate account assets and liabilities and are only in the scope of LDTI disclosures for separate accounts
oAsia:
Guaranteed pension – Pension savings schemes offered to both employers and employees
Benefits and Protection – Specialty Benefits:
oIndividual disability – Disability insurance providing protection to individuals and/or business owners

99

Table of Contents

Principal Financial Group, Inc.

Notes to Consolidated Financial Statements – (continued)

December 31, 2023

1. Nature of Operations and Significant Accounting Policies – (continued)

Benefits and Protection – Life Insurance:
oUniversal life – Universal life, variable universal life and indexed universal life insurance products offered to individuals and/or business owners, which will be collectively referred to hereafter as “universal life” contracts; includes our exited ULSG business
oTerm life – Term life insurance products offered to individuals and/or business owners
oParticipating life – Participating life insurance contracts offered to individuals, some of which are part of a closed block of business and are only in the scope of LDTI disclosures for DAC
Corporate:
oLong-term care insurance – A closed block of long-term care insurance that is fully reinsured, which was offered on both a group and individual basis.

For the separate account liability disclosures, our Retirement and Income Solutions segment will use a Group retirement contracts level of aggregation. This consists primarily of separate account liabilities for the workplace savings and retirement solutions business as well as amounts for the investment only and pension risk transfer businesses.

Impact of Adoption

We adopted the guidance for the liability for future policy benefits for traditional and limited-payment contracts and DAC and other actuarial balances on a modified retrospective basis; that is, to contracts in force as of the beginning of the earliest period presented based on their existing carrying amounts. We adopted the guidance for MRBs and cost of reinsurance retrospectively. Results for reporting periods beginning January 1, 2021, within our consolidated financial statements are presented under the new guidance.

100

Table of Contents

Principal Financial Group, Inc.

Notes to Consolidated Financial Statements – (continued)

December 31, 2023

1. Nature of Operations and Significant Accounting Policies – (continued)

A cumulative effect adjustment of $159.9 million was recorded as a decrease to retained earnings and a cumulative effect adjustment of $5,128.0 million was recorded as a decrease to AOCI as of January 1, 2021, as shown below.


Accumulated other

Retained earnings

comprehensive income


Pre-Tax


Tax


After-Tax


Pre-Tax


Tax


After-Tax

(in millions)

DAC and other actuarial balances:


Adjustment for reversal of unrealized loss from AOCI (1) (2)

$

$

$

$

421.5

$

(88.5)

$

333.0

Cost of reinsurance asset (liability):


Cumulative effect of amortization basis change


(9.0)


1.9


(7.1)


Adjustment of unrealized loss in AOCI


16.1


(3.4)


12.7

Reinsurance recoverable:


Adjustment for reversal of unrealized gain from AOCI (2)


(45.5)


9.5


(36.0)

Adjustment under the modified retrospective approach (3)


31.4


(6.6)


24.8


Effect of remeasurement of the recoverable at the current discount rate


201.8


(42.4)


159.4

Liability for future policy benefits: