
As filed with the Securities and Exchange Commission on March 25, 2022.
UNITED STATES
SECURITIES AND EXCHANGE COMMISSION
Washington, D.C. 20549
FORM
OR
OR
OR
Commission file number
(Exact Name of Registrant as Specified in its charter)
N/A
(Translation of Registrant’s name into English)
Federative Republic of
(Jurisdiction of Incorporation or Organization)
Pinheiros –
(Address of principal executive offices)
Chief Financial and Investor Relations Officer
Telephone. (
Pinheiros –
(Name, Telephone, E-mail and/or Facsimile number and Address of Company Contact Person)
Securities registered or to be registered pursuant to Section 12(b) of the Act:
|
Title of each class
Common Shares, no par value* |
Trading Symbol
|
Name of each exchange on which registered The The New York Stock Exchange |
____________________
* Not for trading purposes, but only in connection with the registration of American Depositary Shares representing those common shares.
Securities registered or to be registered pursuant to Section 12(g) of the Act:
None
Securities for which there is a reporting obligation pursuant to Section 15(d) of the Act:
None
Indicate the number of outstanding shares of each of the issuer’s classes of capital or common stock as of the close of the period covered by the annual report:
At December 31, 2021, there were common shares (including treasury shares), with no par value, outstanding.
Indicate by check mark
if the registrant is a well-known seasoned issuer, as defined in Rule 405 of the Securities Act.
If this report is an annual
or transition report, indicate by check mark if the registrant is not required to file reports pursuant to Section 13 or 15(d) of the
Securities Exchange Act of 1934. Yes [_]
Note- Checking the box above will not relieve any registrant required to file reports pursuant to Section 13 or 15(d) of the Securities Exchange Act of 1934 from their obligations under those Sections.
Indicate by check mark
whether the registrant (1) has filed all reports required to be filed by Section 13 or 15(d) of the Securities Exchange Act of 1934 during
the preceding 12 months (or for such shorter period that the registrant was required to file such reports), and (2) has been subject to
such filing requirements for the past 90 days.
Indicate by check mark whether
the registrant has submitted electronically every Interactive Data File required to be submitted pursuant to Rule 405 of Regulation S-T
(§232.405 of this chapter) during the preceding 12 months (or for such shorter period that the registrant was required to submit
such files).
Indicate by check mark whether the registrant is a large accelerated filer, an accelerated filer, a non-accelerated filer or an emerging growth company. See definition of “large accelerated filer,” “accelerated filer,” and “emerging growth company” in Rule 12b-2 of the Exchange Act.
| Accelerated filer [_] | |
| Non-accelerated filer [_] | Emerging growth company |
If an emerging growth company that prepares its financial statements in accordance with U.S. GAAP, indicate by check mark if the registrant has elected not to use the extended transition period for complying with any new or revised financial accounting standards† provided pursuant to Section 13(a) of the Exchange Act. [_]
† The term “new or revised financial accounting standard” refers to any update issued by the Financial Accounting Standards Board to its Accounting Standards Codification after April 5, 2012.
Indicate by check mark
whether the registrant has filed a report on and attestation to its management’s assessment of the effectiveness of its internal
control over financial reporting under Section 404(b) of the Sarbanes-Oxley Act (15 U.S.C. 7262(b)) by the registered public accounting
firm that prepared or issued its audit report. [
Indicate by check mark which basis of accounting the registrant has used to prepare the financial statements included in this filing:
| [_] U.S. GAAP | [X] |
[_] Other |
If “Other” has been checked in response to the previous question, indicate by check mark which financial statement item the registrant has elected to follow.
Item 17 [_] Item 18 [_].
If this is an annual report, indicate by check mark whether the registrant is a shell company (as defined in Rule 12b-2 of the Exchange Act).
Yes [_]
TABLE OF CONTENTS
Page
| i |
| ii |
| iii |
| Table of Contents |
PART I
INTRODUCTION
Unless otherwise indicated, all references herein to (1) “BRF” are references to BRF S.A., a corporation organized under the laws of the Federative Republic of Brazil (“Brazil”), and its consolidated subsidiaries, (2) the “Company,” “we,” “us,” “our” or “our company” are references to BRF, together with its consolidated subsidiaries, and (3) “common shares” are references to the Company’s authorized and outstanding common stock, designated ordinary shares (ações ordinárias), each without par value. All references herein to the “real,” “reais” or “R$” are to the Brazilian real, the official currency of Brazil. All references to “U.S. dollars,” “dollars” or “U.S.$” are to the United States dollar. All references to “euro” or “EUR” are to euros, the official currency of the Eurozone in the European Union. All references to “TRY” are to the Turkish lira, the official currency of Turkey. All references to “SGD” are to the Singapore Dollar, the official currency of Singapore.
U.S.$ amounts are disclosed for each transaction at the amount negotiated to be settled in U.S.$ at the initiation date of the transaction.
Market data and certain industry forecasts used herein were obtained from internal surveys, market research, publicly available information and industry publications. While we believe that market research, publicly available information and industry publications we use are reliable, we have not independently verified market and industry data from third-party sources. Moreover, while we believe our internal surveys are reliable, they have not been verified by any independent source.
We prepared our annual consolidated financial statements included in this annual report in accordance with International Financial Reporting Standards (“IFRS”) as issued by the International Accounting Standards Board (“IASB”). We have made rounding adjustments to reach some of the figures included herein. As a result, numerical figures shown as totals in some tables may not be an arithmetic aggregation of the figures that preceded them.
Forward-Looking Statements
This annual report contains information that constitute forward-looking statements within the meaning of the U.S. Private Securities Litigation Reform Act of 1995. Many of the forward-looking statements contained in this annual report can be identified by the use of forward-looking words, such as “believe,” “may,” “aim,” “estimate,” “continue,” “anticipate,” “will,” “intend,” “plan,” “expect” and “potential,” among others. Forward-looking statements include information concerning our possible or assumed future results of operations, business strategies, financing plans, competitive position, industry environment, potential growth opportunities, the effects of future regulation and the effects of competition. They appear in a number of places in this annual report, principally under the captions “Item 3. Key Information—D. Risk Factors,” “Item 4. Information on the Company” and “Item 5. Operating and Financial Review and Prospects” and include statements regarding the intent, belief, projections or current expectations of the Company, its directors or its executive officers about future events and financial trends affecting our business. Many important factors, in addition to those discussed elsewhere in this annual report, could cause our actual results to differ substantially from those anticipated in our forward-looking statements.
These factors include: (i) the economic, financial, political and social effects of the coronavirus, or COVID-19, pandemic (or other pandemics, epidemics and similar crises) particularly in Brazil and to the extent that they continue to cause serious negative macroeconomic effects, thus enhancing the risks described under “Item 3. Key Information—D. Risk Factors,” (ii) general economic, political and business conditions both in Brazil and abroad, including, in Brazil, developments and the perception of risks in connection with ongoing corruption and other investigations and increasing fractious relations and infighting within the administration of President Bolsonaro, as well as policies and potential changes to address these matters or otherwise, including economic and fiscal reforms and in response to the ongoing effects of the COVID-19 pandemic, any of which may negatively affect growth prospects in the Brazilian economy as a whole, (iii) our ability to timely and efficiently implement any necessary measures in response to, or to mitigate the impacts of, the COVID-19 pandemic on our business, operations, cash flows, prospects, liquidity and financial condition, (iv) our ability to predict and efficiently react to the temporary or long-term term changes in our customers’ behavior as a result of the COVID-19 pandemic, even when the outbreak is sufficiently controlled, (v) health and food safety risks related to the food industry, including in connection with ongoing investigations and legal proceedings, (vi) more stringent trade barriers in key export markets and increased regulation of food safety and security, (vii) the risk of outbreak of animal diseases, (viii) risks related to climate change, (ix) the risk of any shortage or lack of water or other raw materials necessary for our business, (x) compliance with various laws and regulations, (xi) risks related to new product innovation, (xii) the implementation of our principal operating strategies, including through divestitures, acquisitions or joint ventures, (xiii) the cyclicality and volatility of raw materials and selling prices, including as a result of ongoing global trade disputes, (xiv) strong international and domestic competition, (xv) risks related to labor relations, (xvi) the protection of our intellectual property, (xvii) the potential unavailability of transportation and logistics services, (xviii) the risk that our insurance policies may not cover certain of our costs, (xix) our ability to recruit and retain qualified professionals, (xx) the risk of cybersecurity breaches, (xxi) risks related to our indebtedness, (xxii) risks related to the Brazilian economy and to Brazilian politics, (xxiii) interest rate fluctuations, inflation and exchange rate movements of the real in relation to the U.S. dollar and other currencies, (xxiv) the direction of our future operations, (xxv) our financial condition or results of operations, and (xxvi) other factors identified under “Item 3. Key Information—D. Risk Factors.”
| 1 |
Prospective investors are cautioned that any such forward-looking statements are not guarantees of future performance and involve risks and uncertainties, and that actual results may differ materially from those in the forward-looking statements. The accompanying information contained in this annual report on Form 20-F, including without limitation the information set forth under the heading “Item 5. Operating and Financial Review and Prospects,” identifies important factors that could cause such differences. In light of the risks, uncertainties and assumptions associated with forward-looking statements, you should not place undue reliance on any forward-looking statements. Additional risks that we may currently deem immaterial or that are not presently known to us could also cause the forward-looking events discussed in this annual report not to occur.
Our forward-looking statements speak only as of the date of this annual report or as of the date they are made, and except as otherwise required by applicable securities laws, the Company undertakes no obligation to publicly update any forward-looking statement, whether because of new information, future events or otherwise.
ITEM 1. IDENTITY OF DIRECTORS, SENIOR MANAGEMENT AND ADVISERS
Not applicable.
ITEM 2. OFFER STATISTICS AND EXPECTED TIMETABLE
Not applicable.
ITEM 3. KEY INFORMATION
| A. | [Reserved] |
| B. | Capitalization and Indebtedness |
Not applicable.
| C. | Reasons for the Offer and Use of Proceeds |
Not applicable.
| 2 |
| D. | Risk Factors |
Risks Relating to Our Business and Industry
Geopolitical and other challenges and uncertainties due to the ongoing military conflict between Russia and Ukraine could have a material adverse effect on the global economy, certain material and commodity prices and our business.
Global markets are currently operating in a period of economic uncertainty, volatility and disruption following Russia’s full-scale invasion of Ukraine on February 24, 2022. Although the length and impact of the ongoing military conflict is highly unpredictable, the conflict in Ukraine and any other geopolitical tensions could have an adverse affect on the economy and business activity globally and lead to:
| · | credit and capital market disruptions; |
| · | significant volatility in commodity prices (such as grains, fertilizer inputs and oil and gas); |
| · | increased expenses related to direct and indirect materials used in our production process (i.e., packaging, logistics and inputs, among others); |
| · | increased costs of resources (such as energy, natural gas and coal) for our operations; |
| · | slowdown or disruption of the global and local supply chain, which may lead to shortages and lack of critical materials, commodities and products in the market; |
| · | potential appreciation of the U.S. dollar; |
| · | increase in interest rates and inflation in the markets in which we operate, which may contribute to further increases in the prices of energy, oil and other commodities; and |
| · | lower or negative global growth. |
Any such event may increase our costs and adversely affect our business if we are not able to pass such increased costs onto our customers.
Additionally, Russia’s prior annexation of Crimea, recent recognition of two separatist republics in the Donetsk and Luhansk regions of Ukraine and subsequent military interventions in Ukraine have led to sanctions and other penalties being levied by the United States, European Union and other countries against Russia, Belarus, the Crimea Region of Ukraine, the so-called Donetsk People’s Republic, and the so-called Luhansk People’s Republic, including the agreement to remove certain Russian financial institutions from the Society for Worldwide Interbank Financial Telecommunication, or SWIFT, payment system. Additional potential sanctions and penalties have also been proposed and/or threatened. Russian military actions, the resulting sanctions and Russian counter measures or retaliatory actions (including cyberattacks and espionage) could adversely affect the global economy and financial markets and lead to further instability and lack of liquidity in capital markets. See “—A failure to comply with export control or economic sanctions laws and regulations could have a material adverse impact on our results of operations, financial condition and reputation.” The impact of these measures, as well as potential responses to them by Russia, is currently unknown and, while our exposure to Russia and Ukraine is limited, current and future measures could significantly and adversely affect our business, financial condition and results of operations, including, for example, cancellation and difficulty in exporting goods to Russia, potential sanctions in the marketing of our products to Russia and threats to the safety of our employees in Russia and other locations close to the conflict. Geopolitical and economic risks have also increased over the past few years as a result of trade tensions between the United States and China, Brexit, and the rise of populism. Growing tensions may lead, among others, to a deglobalization of the world economy, an increase in protectionism or barriers to immigration, a general reduction of international trade in goods and services and a reduction in the integration of financial markets, any of which could materially and adversely affect our business, financial condition and results of operations.
| 3 |
We are continuing to monitor the situation in Russia, Ukraine and globally and assess its potential impact on our business. Any of the abovementioned factors could adversely affect our business, prospects, financial condition, and operating results. The extent and duration of the military action, sanctions and resulting market disruptions are impossible to predict, but could be substantial. Any such disruptions may also magnify the impact of other risks described elsewhere in this annual report.
Our results of operations are subject to cyclicality and volatility affecting the prices of commodities, poultry and pork, which could adversely affect our entire business.
Our business is largely dependent on the cost and supply of corn, soy meal, soybeans, oil, hogs, packaging (resin, petrol), food ingredients, animal feed ingredients and other raw materials, as well as the selling prices of our poultry and pork. These prices are determined by supply and demand, which may fluctuate significantly, and other factors over which we have little or no control. These other factors include, among others, fluctuations in local and global poultry and hog production levels, environmental and conservation regulations, economic conditions, new variants of COVID-19, animal and crop diseases, cost of national and international freight and exchange rate and interest rate fluctuations. In addition, prices are also constantly affected by weather and climate events, fertilizers prices, biofuel policies, export taxes, as well as political and trade disputes around the world. Any changes in raw material prices may have major impact on our business.
Our industry, both in Brazil and abroad, is generally characterized by cyclical periods of higher prices and higher profitability, followed by overproduction, leading to periods of lower prices and lower profitability or losses. There can be no assurance that we will be able to adequately adapt to any such cyclicality or volatility, which may have an adverse effect on our operations and financial results.
Natural disasters or extreme weather, including floods, excessive cold or heat, hurricanes or other storms, as well as any interruption at our plants that may require the temporary re-allocation of plant functions to other facilities could, among other things, impair the health or growth of livestock or interfere with our operations due to power outages, damage to our production and processing facilities or disruption in transportation channels or information systems.
Health and food safety risks related to our business and the food industry could adversely affect our production and shipping processes as well as our ability to sell our products.
We are subject to risks affecting the food industry generally, including risks posed by contamination or food spoilage, evolving nutritional and health-related concerns, consumer product liability claims, product tampering and sabotage, the possible unavailability and expense of liability insurance, public perception of product safety for both the industry as a whole and also our products specifically, but not exclusively, as a result of disease outbreaks or the fear of such outbreaks, the potential cost and disruption of a product recall and possible impacts on our image and brands. Among such risks are those related to raising animals, including disease and adverse weather conditions. For example, the perceived risk of contamination of our food or related packaging by COVID-19 led to production, shipping and sales disruptions in Brazil and our export markets, particularly in China, in early 2020.
Meat can be subject to contamination during processing and distribution. In particular, processed meat may become exposed to various disease-producing pathogens, including Listeria monocytogenes, Salmonella enteritidis, Salmonella tiphimurium and E. coli O157:H7. These pathogens can also be introduced to our products during production or as a result of improper handling by third-party food processors, franchisees, distributors, foodservice providers or consumers. Spoilage, especially spoilage due to failure of temperature-controlled storage and transportation systems, is also a risk. The systems we maintain to monitor food safety risks throughout all stages of production and distribution could fail to function properly and product contamination could still occur. Failures in our systems to ensure food safety could result in harmful publicity that could cause damage to our brands, reputation and image and negatively impact sales, which could have a material adverse impact on our business, results of operations, financial condition and prospects.
On February 13, 2019, we announced a voluntary recall of approximately 164.7 metric tons of fresh chicken meat for the Brazilian domestic market and approximately 299.6 metric tons of fresh chicken meat for the international market due to a potential presence of Salmonella enteritidis. Possible future recalls may result, respectively, in increased costs and could negatively affect our brands’ reputation. In the future, a product that has been actually or allegedly contaminated could result in product withdrawals or recalls, disposal of product inventory, negative publicity, temporary plant closings, substantial cost of compliance or remediation and potentially significant product liability judgments against us. Any of these events could result in a loss of demand for our products, which may have a material adverse effect on our business, results of operations, financial condition and prospects.
| 4 |
Even if our own products are not affected by contamination, our industry may face negative publicity in certain of its markets if the products of other producers become contaminated, which could result in negative public perception about the safety of our products and reduced consumer demand for our products in the affected category. Significant lawsuits, widespread product recalls and other negative events faced by us or our competitors could result in a widespread loss of consumer confidence in the safety and quality of our products. Our sales are ultimately dependent on consumer preferences, and any actual or perceived health risks associated with our products could cause customers to lose confidence in the safety and quality of our products and have a material adverse impact on our business, results of operations, financial condition and prospects.
Outbreaks, or fears of outbreaks, of any animal diseases may lead to cancellation of orders by our customers and create adverse publicity that may have a material adverse effect on consumer demand for our products. Moreover, outbreaks of animal diseases in Brazil may result in foreign governmental action to close export markets for some or all of our products, which may result in the loss of some or all of these animals.
Our operations involve raising poultry and hogs and processing their meat, which requires us to maintain certain standards of animal health and disease control. We could be required to dispose of animals or suspend the sale or export of some of our products to customers in Brazil and abroad in the event of an outbreak of disease affecting animals, such as the following: (i) in the case of hogs and certain other animals, foot-and-mouth disease, influenza (H5N1) and African swine fever and (ii) in the case of poultry, avian influenza and Newcastle disease. In addition, if the Porcine Reproductive and Respiratory Syndrome (PRRS), which has broken out in Europe and the United States in 1990 and 1985, respectively, the Porcine Epidemic Diarrhea (PEDV), which has broken out in Europe and the United States in 2014 and 2013, respectively, or the African swine fever which broke out in China in 2018, were to break out in Brazil, we could be required to dispose of hogs. There have been outbreaks of classical swine fever in Brazil, and an occurrence of such outbreaks in the free zones where we source our hogs for production could require us to dispose the affected hogs. Disposal of poultry, hogs or other animals would preclude recovery of costs incurred in raising or purchasing these animals and result in additional expense for the disposal of such animals and loss of inventory. An outbreak of foot-and-mouth disease or other similar diseases could have an effect on livestock we own and the availability of livestock for purchase. In addition, the global effects of avian influenza or other similar diseases would impact consumer perception of certain protein products and our ability to access certain markets, which would adversely affect our results of operations and financial condition.
Chicken and other birds in some countries, particularly in Asia but also in Europe, the Americas and Africa, have on occasion become infected by highly pathogenic avian influenza in recent years. In a small number of highly publicized cases, avian influenza has been transmitted from birds to humans, resulting in illness and, at times, death. Accordingly, health authorities in many countries have taken steps to prevent outbreaks of this viral disease, including disposal of afflicted poultry flocks.
In recent years, some human cases of avian influenza and related deaths were reported, according to the World Health Organization. The cases reported were caused by the H5N1 virus. In early 2017, Chile, a neighboring country to Brazil, confirmed the occurrence of avian influenza. In 2019 and 2020, several countries within Europe, Asia and Africa reported cases of highly pathogenic avian influenza in poultry. Additionally, Mexico reported cases in 2019, the United States reported cases in 2020 and Japan, China and certain countries within Europe reported cases in 2021.
There are concerns that an outbreak of avian influenza may occur in the country in the future. Any outbreak of avian influenza in Brazil could lead to the required disposal of our poultry flocks, which would result in decreased sales in the poultry industry, prevent recovery of costs incurred in raising or purchasing poultry and result in additional expense for the disposal of poultry. In addition, any outbreak of avian influenza in Brazil would likely lead to immediate restrictions on the export of some of our products to key export markets. Preventive actions adopted by Brazilian authorities, if any, may not be effective in precluding the spread of avian influenza within Brazil.
| 5 |
Whether or not an outbreak of avian influenza occurs in Brazil, further outbreaks of avian influenza anywhere in the world could have a negative impact on the consumption of poultry in our key export markets or in Brazil, and a significant outbreak would negatively affect our results of operations and financial condition. Any outbreak could lead to the imposition of costly preventive controls on poultry imports in our export markets. Accordingly, any spread of avian influenza, or increasing concerns about this disease, may have a material and adverse effect on our company.
Pandemics or human disease outbreaks, such as the coronavirus (COVID-19), may disrupt consumption and trade patterns, supply chains and production processes, which could materially affect our operations and results of operations.
Pandemics or human disease outbreaks, such as the coronavirus (COVID-19) originated in late 2019 and declared a global pandemic by the World Health Organization on March 11, 2020, may adversely affect our business and operations. The worldwide spread of COVID-19 has triggered the implementation of significant measures by governments and private sector entities that, in turn, have disrupted consumption and trade patterns, supply chains and production processes on a global scale and specifically relating to our business, including with respect to product shipments. In addition, customers from certain regions in which we operate continue to be adversely affected, mainly by the measures of social distancing imposed from time to time by authorities and restrictions on public gatherings or interactions, which may limit the opportunity for our customers to purchase our products. The consequences of the pandemic could also result in the destabilization of commodity prices or the economies and financial markets of many countries, resulting in an economic downturn that could affect demand for our products and have a material adverse effect on our results of operations. Any deterioration in the credit cycle of our customers as a result of the pandemic or the measures implemented to address it, may adversely affect our results and cash flows in the future.
Our operations include global production and distribution facilities, and if there is an outbreak of a human disease such as COVID-19 in our facilities or the communities where we operate and distribute our products, our production, operations, employees, suppliers, customers and distribution channels could be severely impacted. Ports and other channels of entry may be closed or operate at only a portion of capacity, as workers may be prohibited or otherwise unable to report to work and means of transporting products within regions or countries may be limited for the same reason, along with the potential for transport restrictions related to travel bans. In addition, countries to which we export our products may institute bans on the importation of our products, products produced by our partners or on all or some food products from Brazil in general based on perceived COVID-19 concerns.
Since the beginning of the global pandemic, except for the Lajeado and Rio Verde plant that were briefly closed in 2020 as a result of the COVID-19 outbreak, we have generally continued to operate our plants, distribution centers, logistics, supply chain and administrative offices. However, our operations were affected by the COVID-19 pandemic through reduction of the available labor force, reduction of the productivity of our manufacturing operations, lack of raw materials and packaging, and maintenance projects due to reduced availability of third-party suppliers and may be further affected. As a result of the pandemic, we have incurred expenditures that are incremental and directly attributable to the impacts of the COVID-19 pandemic, mainly related to personnel, prevention, control, logistics and philanthropic donations in the amount of R$288,851 thousand in the year ended December 31, 2021. Other impacts on our financial position and performance that are not incremental and directly attributable to the impacts of the COVID-19 pandemic and therefore cannot be determined on a non-arbitrary basis are described further below. Currently, we are working under a hybrid system of remote work and in-office work arrangements in some of our corporate offices.
Despite having more visibility on the impact of the pandemic compared to March 2020 (beginning of the impacts of the pandemics for us), new variants, such as the recently identified Omicron, may still impact our operational performance, which may in turn adversely affect our financial position. We also recognize that unfavorable operating results may have an adverse impact on our financial metrics, such as leverage. At the same time, we may experience increases in general customer default rates in connection with the pandemic and, as a consequence, be subject to increasingly higher credit losses. The possible deterioration of the credit cycle of our customers may adversely affect our results, financial position and cash flows in the future.
| 6 |
The recent increase in volatility of market risks resulting from the COVID-19 pandemic has significantly affected the fair value of our assets and liabilities, particularly considering wide variations in foreign exchange rates. Additionally, the heightened uncertainty of projections has increased the challenge of accurately measuring certain of our assets and liabilities.
The COVID-19 pandemic also destabilized commodity prices and the economic conditions of many countries, resulting in downturns that could affect the demand for our products and have a material adverse effect on our results. The current pandemic and any future pandemics could also adversely affect consumer demand, as restrictions on public gatherings or interactions may limit the opportunity for our customers and consumers to purchase our products in certain channels. In addition, demand for our products has been affected as a result of the COVID-19 pandemic worldwide, weakening of global commercial activities, reduction of population income, and changes in consumption habits.
Climate change may negatively affect our business and results of operations.
According to the 16th Global Risks Report published by the World Economic Forum in January 2021, risks related to climate change are considered to be the most concerning for the world in the next 10 years. The 2021 United Nations Climate Change Conference (COP26) in Glasgow brought together governments, businesses and civil society to discuss the climate agenda. Nations took a range of decisions in the collective effort to limit the rise in global temperature to 1.5 degrees Celsius. New financial pledges to support developing countries in achieving this goal were made. Additionally, new rules for international carbon trading mechanisms (Article 6) agreed upon at COP26 will support adaptation funding. New agreements for market mechanisms, essentially supporting the transfer of emission reductions between countries while also incentivizing the private sector to invest in climate-friendly solutions. This set of rules lays out how countries are held accountable for delivering their climate action promises and self-set targets under their Nationally Determined Contributions (NDCs).
Having this context in mind, we take into consideration the potential effects of climate change on our operations and supply chain, and we recognize vulnerabilities associated with natural resources and agricultural products that are essential for our activities. The main risks to our business that we have identified with respect to climate change relate to the changes in temperature (global warming) and rainfall, including drought and natural disasters (such as flooding and storms), which may affect agricultural productivity, animal welfare and the availability of water and energy. These changes may adversely affect our costs and results of operations, including by raising the price of agricultural commodities as a result of long periods of drought or excessive rainfall, increasing operating costs to ensure animal welfare, increasing the risk of rationing and raising the price of electricity. We may fail to effectively implement programs or have proper environmental or sustainability certifications related to reducing our exposure to climate change, which may adversely affect our business and results of operations in the future.
We are also subject to regulatory changes, such as carbon pricing or taxation, and changes in legislation for greenhouse gas emissions at the domestic and international levels. Any such changes may increase our costs and adversely affect our results of operations.
Our operations are largely dependent on electricity, and energy-related expenses are one of our highest fixed costs. Energy costs have historically fluctuated significantly over time – with significant increases being experienced during droughts or diversion of water for other purposes as the Brazilian energy matrix is mostly supported by hydroelectric power plants – and increases in energy costs could result in reduced profits. A significant interruption in energy supply or outright loss of energy at any of our facilities could also result in a temporary disruption in production and delivery of products to customers and additional costs, materially adversely affecting our results of operations.
Any shortage or lack of water, and any failure to comply with applicable rules and regulations related to water usage and management, could materially adversely affect our business and results of operations.
In the last century, water use has grown globally. According to the United Nations Environmental Programme, water scarcity affects more than 40% of the global population and this percentage is expected to increase. Presently, 2.3 billion people around the world are living in water-stressed areas, and the same will be true of more than half the world’s population by 2050 if no action is taken. Based on projected demand, the world will face a 40% shortfall in freshwater supply within 10 years. Water is an essential resource for our businesses and is used in the production of grains and other agricultural inputs required for our production processes. The industrial use of water may also adversely affect its availability. As a result, the shortage or lack of water, including the increasing risk of droughts in the regions where we operate, represents a critical risk for our business and may materially and adversely affect our business and results of operations. We are also subject to restrictions on the volume of water that we can collect from the environment under our water usage permits, which may be lower than the actual water demands of our business in these areas. In the event we cannot collect enough water to meet our operational demands, due to restrictions under water permits or otherwise, our business and results of operations may be materially adversely affected.
| 7 |
The procedures that we have developed to reduce our water consumption and increase water reuse in order to comply with applicable rules and regulations, and to minimize our impact on the environment and the community, may prove to be ineffective or insufficient. Additionally, we assess water shortage risks in the locations where we operate in order to understand the specific impacts of our business on these regions and consequently reduce our water consumption and exposure to risks of water shortages in the applicable unit. The river basins in the region of industrial activities and the characteristics of the use of water resources are analyzed in order to understand growth in local demand and anticipate risks. The methods we employ to analyze the water vulnerability of our industrial plants, as well as our assessments of the micro and macro watersheds in the regions in which we operate and the industrial activities and characteristics of the use of water resources, may be inaccurate in understanding local water demand growth. We may also fail to accurately assess the water supply or anticipate water-related risks, and the increased industrial use of water by water intensive businesses may also adversely affect the continuing availability and quality of water in Brazil. This may result in us or our key suppliers encountering water shortages. Any of these factors may materially adversely affect our business and results of operations.
More stringent trade barriers in key export markets may negatively affect our results of operations.
Because of the growing market share of Brazilian poultry, pork and beef products in the international markets, Brazilian exporters are increasingly being affected by measures taken by importing countries to protect local producers. The competitiveness of Brazilian companies has led certain countries to establish trade barriers to limit the access of Brazilian companies to their markets. Trade barriers can consist of both tariffs and non-tariff barriers. In our industry, non-tariff barriers are of particular concern, especially sanitary and technical restrictions.
As a result of the regulators’ inquiries and the public announcement of allegations of wrongdoing involving us and other companies in the Brazilian meat industry in the context of the Carne Fraca Operation and Trapaça Operation, some export markets have been temporarily closed, and our average selling prices for some products and in some markets have decreased. For additional information, see “—Health risks related to our business and the food industry could adversely affect our ability to sell our products” and “—We have been subject to significant investigations relating to, among other things, food safety and quality control, and an adverse outcome of any of these investigations could result in penalties, fines or other forms of liability and could have a material adverse effect on our business, reputation, brand, results of operations and financial condition.”
Some countries, such as Russia and South Africa, have a history of erecting trade barriers on imports of food products. Also, the European Union has adopted a quota system for certain poultry products and prohibitive tariffs for certain products that do not have quotas in order to mitigate the effects of Brazil’s lower production costs on European producers. More recently, the European Union and the United Kingdom have been discussing or are already applying certain legislations related to sustainability that may result in trade barriers, such as the Due Diligence on Deforestation and the Carbon Tax Adjustment Mechanism. Other countries have also imposed trade barriers against our products. For example, in August 2017, the Chinese government initiated an antidumping investigation in connection with Brazilian exports of whole chicken and chicken parts, including our exports. The investigation ended in February 2019, and Brazilian exporters agreed to certain minimum export prices for sales to China. In August 2018, Iraq increased the tariff on poultry products from 10% to 60%. In addition, in 2021, the South African government has opened up an anti-dumping investigation against certain Brazilian poultry exporters (we are not being investigated), which may result in the imposition of new restrictive measures towards Brazilian exporters. The South African government decided for a 265% provisional tariff for the companies that have not applied for an individual defense, which was our case. These provisional tariffs will be applied until June 14, 2022, while this investigation is still ongoing. There can be no certainty that the local government will not impose further restriction to poultry and/or food trade. In the Middle East, Saudi Arabia, one of our main importers tried to reduce the importation by reducing the poultry shelf-life from one year to 90 days. The change in the technical rules for the validity of in natura frozen chicken and its cuts was notified to the World Trade Organization, or WTO, in May 2021, but Saudi Arabia ceased the investigation in August 2021. There are other risks for us from the sanitary perspective. For example, African swine fever in some countries in the Americas carries along with it the risk of market closures in case of an outbreak in the Brazilian territory.
| 8 |
Many developed countries use direct and indirect subsidies to enhance the competitiveness of their producers in other markets. In addition, local producers, importers and even exporters in some markets may exert political pressure on their governments to prevent some foreign producers from exporting to their market, particularly during unfavorable economic conditions, such as the COVID-19 pandemic. Any of the above restrictions could substantially affect our export volumes and, consequently, our export sales and financial performance. If new trade barriers arise in our key export markets, we may face difficulties in reallocating our products to other markets on favorable terms, and our business, financial condition and results of operations might be adversely affected.
Trade disputes between other countries also creates uncertainties that may adversely affect Brazilian exports and our operations. For instance, the United States and China engaged in a trade dispute for almost 18 months, which has affected the global economy and prices of certain of our raw materials, including corn, soy meal and soybeans. On January 1, 2020, the United States and China signed the first phase of a trade agreement expected to alleviate the tensions between the two countries. A second phase of the agreement is expected to be even more difficult to achieve. There can be no assurances that the trade dispute will be fully resolved and that the global economy (as well as prices of certain of our raw materials) will not be further affected by it. The United Sates is expected to maintain the 25% tariffs on a wide range of US$250 billion of Chinese industrial goods and components used by the U.S. manufacturing sector. Both improvements in the countries’ commercial relations and new mutually beneficial trade agreements at the expense of other countries may have a material adverse effect on our results of operations.
However, the current trade deal may not be maintained by the United States under the Biden administration, especially since it has generally been regarded unfavorably, particularly for U.S. industry. The U.S. agribusiness sector, on the other hand, has largely benefited from the agreement, with a significant increase in poultry and pork exports, the reopening of the Chinese market to U.S. poultry exports, which had been halted since 2015 due to an avian influenza outbreak, and the accreditation of over 1,000 U.S. plants. These factors have positively affected the United States’ market share of Chinese agricultural imports, which in turn has negatively affected Brazil’s market share. We cannot control whether commercial tensions between China and the United States will increase again, or whether our business will be adversely affected as a result.
In addition, in April 2018, Saudi Arabia instituted a no-stunning requirement for the animal slaughtering process. Saudi Arabia claimed that Brazilian companies’ chicken slaughtering practices violated Halal principles due to the use of an electric shock to stun the birds. We, along with other Brazilian companies, were therefore required to migrate our production processes to non-stunning slaughters in order to supply the Saudi Arabian market. We have incurred, and expect to incur, additional costs in connection with these requirements for exporting to Saudi Arabia. In January 2019, the Saudi Arabian Food and Drug Authority published a report authorizing 25 Brazilian facilities to produce chicken meat for the Saudi Arabian market, which included eight of our plants. One of our plants (Lajeado, Rio Grande do Sul), which had previously produced chicken meat for the Saudi Arabian market, was not included as an authorized plant. The continuous shifting of our production of chicken meat for Saudi Arabia to the authorized plants may result in decreased revenues and additional expenses.
In August 2019, Saudi Arabia imposed an embargo on seasoned chicken meat produced in our Kizad facility, in Abu Dhabi, which was restricted from exporting to Saudi Arabia. The embargo was a result of Saudi Arabia’s Vision 2030 Plan, announced in April 2016 as a national development plan, which included instruments to reduce the country’s dependence on oil, diversify its economy and substitute imports with local production. Saudi Arabia then expanded the embargo to the other products from our Kizad facility. In October 2019, we announced that we had executed a non-binding Memorandum of Understanding with the Saudi Arabian General Investment Authority – SAGIA regarding our construction and operation of a poultry processing plant in Saudi Arabia. We estimate that the investment amount will be around R$652,728 thousand (US$116,966 thousand, translated to reais at the exchange rate of R$5.5805 as of December 31, 2021). The development of this project is currently in the technical specification and financial modelling phase. There can be no assurance that the Saudi Arabian government will not further restrict our ability to export our products to Saudi Arabia, which may result in a material adverse impact on our business, financial condition and results of operations.
| 9 |
In February 2020, we received notification from the Saudi Food & Drug Authority, or the SFDA, regarding a report temporarily suspending two of our facilities, the Dois Vizinhos and the Francisco Beltrão plant, both located in the State of Paraná, from exporting chicken meat to Saudi Arabia. The SFDA informed us that the measure is temporary and, among other measures, requested that the Brazilian authorities provide more details about investigations carried out between 2014 and 2018 regarding alleged violations committed by us in the production of animal feed and PREMIX compound. For more information about these investigations, see “—We have been subject to significant investigations relating to, among other things, food safety and quality control, and an adverse outcome of any of these investigations could result in penalties, fines or other forms of liability and could have a material adverse effect on our business, reputation, brand, results of operations and financial condition.” Additionally, the Saudi government has been implementing, since January 2020, a previous import licenses system. In the future, this system may adversely affect our exports to the country, since it might be used by local authorities as a means to control the entry of products and thus, artificially affect demand and offer and, consequently, prices, which run counter to basic principles of international trade rules and regulations.
Further, on May 6, 2021, the SFDA notified the WTO Committee on Sanitary and Phytosanitary Measures with respect to a change of the regulation for expiration dates, consisting of a reduction of the shelf-life of in natura frozen chicken from 1 year to 3 months from the date of slaughter. In March 2021, the SFDA started a reinforced control system on imported meat, resulting in up to 3 months delays in products clearance at WTO ports and thus negatively affecting our business results. However, the SFDA withdrew the implementation of this measure.
On August 3, 2021, we became aware through a publication on the website of the General Administration of Customs of the People's Republic of China, or GACC, of the suspension of the export to China of pork meat from our Lucas do Rio Verde-MT pork plant as of that date. The alleged reason was the malfunctioning of the refrigerating system of one single pork meat container, which was later demonstrated through the transporter’s system log to be the transporter’s sole responsibility and fault. Despite evidence being sent to the Chinese authorities, the suspension has not yet been reversed. On December 16, 2021, we were also informed by MAPA and GACC of the suspension of the export to China of poultry meat from Marau under the allegation of the finding of content improper for human consumption in a batch of poultry feet. On March 4, 2022, we were informed by GACC that it was suspending, as of March 5, 2022, the export to China of poultry meat from our Lucas do Rio Verde-MT plant as well. The alleged reason for this suspension were certain nonconformities identified during a videoconference audit executed by GACC, such as the occurrences of COVID-19 infections among our employees that were not disclosed to it and the lack of disinfection tank and detections of salmonella above the maximum limit in the reception of live poultry and in the processing of poultry products.
Trade barriers may also be imposed in our key export markets as a result of the COVID-19 pandemic, for example due to outbreaks of COVID-19 in our plants and restrictions that may be imposed on our products because of these outbreaks. For more information, see “—Pandemics or human disease outbreaks, such as the coronavirus (COVID-19), may disrupt consumption and trade patterns, supply chains and production processes, which could materially affect our operations and results of operations.”
Furthermore, China announced the end of the 8% special pork import tariff, implemented in 2019, and the consequent return to the normal 12% tariff as of January 1, 2022.
Breaches, disruptions, or failures of our information technology systems, including as a result of cybersecurity attacks, could disrupt our operations and negatively impact our business and reputation.
Information technology is an important part of our business operations and we increasingly rely on information technology systems to manage business data and improve the efficiency of our production and distribution facilities and inventory management processes. We also use information technology to process financial information and results of operations for internal reporting purposes and to comply with regulatory, legal and tax requirements. In addition, we depend on information technology for digital marketing and electronic communications between our facilities, personnel, customers and suppliers. We also process personal data of our employees and customers. We depend on cryptography technology and electronic authentication programs provided by third parties to securely process the collection, storage and transmission of confidential information, including personal data.
| 10 |
Our information technology systems may be vulnerable to a variety of interruptions and cybersecurity threats and incidents. There are numerous and evolving risks related to cybersecurity and privacy, including criminal hackers, hacktivists, state-sponsored intrusions, industrial espionage, employee malfeasance and human or technological error. Computer hackers and others routinely attempt to breach the security of information technology systems and to fraudulently induce employees, customers and other third parties to disclose information or unwittingly provide access to systems or data. Successful cybersecurity attacks, breaches, employee malfeasance, or human or technological error may result in, for example, unauthorized access to, disclosure, modification, misuse, loss or destruction of data or systems, including those belonging to us, our customers or third parties; theft of sensitive, regulated or confidential data including personal information; the loss of access to critical data or systems through ransomware, destructive attacks or other means; transaction errors; business delays; and service or system disruptions. We have observed an increase in cybersecurity attacks worldwide in 2020 and 2021, and the remote working arrangements that we have implemented due to the COVID-19 pandemic have increased our dependence on information technology systems and infrastructure, and they may further expand our vulnerability to this risk. In the event of such actions, we, our customers and other third parties may be exposed to potential liability, litigation, and regulatory or other government action, the loss of existing or potential customers, loss of sales, damage to brand and reputation and other financial loss. In addition, if we are unable to prevent security breaches, we may suffer financial and reputational damage or penalties because of the unauthorized disclosure of confidential information belonging to us or to our partners, customers, consumers or suppliers. The cost and operational consequences of responding to cybersecurity incidents and implementing remediation measures may be significant and may not be covered by insurance. Our cybersecurity risk also depends on factors such as the actions, practices and investments of customers, contractors, business partners, vendors and other third parties.
Our efforts to monitor, identify, investigate, respond to and remediate security incidents, including those associated with cybersecurity attacks, may not be adequate or sufficient. The measures that we have implemented regarding technology security and disaster recovery plan may not be adequate or sufficient. There can be no assurance that these efforts and measures will be successful in preventing a cybersecurity attack, a general information security incident or a disruption of our information technology systems. The occurrence of any such events may materially adversely affect our operations, business and reputation. Furthermore, as our business and the cybersecurity landscape evolve, we may find it necessary to make significant further investments to protect our data and information technology infrastructure, which may adversely impact our financial condition and results of operations.
The regulatory environment regarding cybersecurity, privacy and data protection issues is increasingly complex and may have impacts on our business, including increased risk, costs and expanded compliance obligations. For example, on May 25, 2018, the Regulation (EU) 2016/679 of the European Parliament and of the Council of April 27, 2016 on the protection of natural persons with regard to the processing of personal data and on the free movement of such data, or the General Data Protection Regulation or GDPR, became directly applicable in all member states of the European Union. Violations of the GDPR carry financial risks due to penalties for data breach or improper processing of personal data (including a possible fine of up to 4% of total worldwide annual turnover for the preceding financial year for the most serious infringements) and may also adversely affect our reputation and our activities relying on personal data processing. The Brazilian General Data Protection Law (Lei Geral de Proteção de Dados Pessoais), or LGPD, was signed into law in August 2018 and came into effect on September 18, 2020. An increased number of data protection laws around the globe may continue to result in increased compliance costs and risks. See “—We are subject to risks associated with failure to comply with the applicable data protection laws, and we may be negatively affected by the imposition of fines and other types of sanctions.” The potential costs of compliance with or imposed by new or existing regulations and policies that are applicable to us may affect our business and could have a material adverse effect on our results of operations.
| 11 |
We are subject to risks associated with failure to comply with the applicable data protection laws, and we may be negatively affected by the imposition of fines and other types of sanctions.
We are subject to several data protection laws in the jurisdictions in which we operate including, but not limited to, the LGPD, the GDPR, Turkey’s Law on the Protection of Personal Data No. 6698 dated April 7, 2016, or the LPPD and China’s Personal Information Protection Law dated August 20, 2021, or the PIPL. We seek to make our operations compliant with those laws and enhance the security of our personal data processing activities, and while we believe our operations comply with the LGPD in Brazil, we cannot guarantee that we will not be subject to fines and other types of sanctions.
Specifically with respect to Brazil, the LGPD came into effect on September 18, 2020. The LGPD changed the way the protection of personal data is regulated in Brazil. It establishes a new legal framework to be observed in personal data processing operations and provides, among other things, for the rights of the owners of personal data, the legal bases applicable to the protection of personal data, the requirements for obtaining consent, obligations, requirements regarding security incidents, leaks and data transfers, as well as the creation of the Brazilian National Data Protection Authority, or the ANPD.
If we do not comply with the LGPD, the GDPR, the LPPD, the PIPL or any other data protection law to which we are subject, both we and our subsidiaries may be subject to sanctions, either individually or cumulatively, including warnings, obligations to disclose incidents, temporary blocking or deletion of personal data, and penalties of up to 4% of our revenue or the revenue of our group. In addition, we may be held liable for material, moral, individual, or collective damages caused by us, and may be held jointly and severally liable for material, moral, individual or collective damages caused by our subsidiaries.
Failure to protect personal data processed by us and our subsidiaries, as well as the failure to adjust to the applicable legislation, may result in significant fines for us and our subsidiaries, disclosure of any incidents in the media, the deletion of personal data from our database, and the suspension of our activities, which could adversely affect our reputation, business, results of operations and financial condition.
Increased regulation of food safety and animal welfare could increase our costs and adversely affect our results of operations.
Our manufacturing facilities and products are subject to governmental inspections and extensive regulation in the food safety area, including governmental food processing controls in all countries in which we operate. We incur significant costs in connection with our efforts to comply with applicable food safety and processing rules. Changes in government regulations relating to food safety, including as a result of the COVID-19 pandemic, or animal welfare could require us to make additional investments or incur additional costs to meet the necessary specifications for our products. Our products are often inspected outside of Brazil by foreign food safety officials, and any failure to pass those inspections could result in us being required to return all or part of a shipment to Brazil, recall certain products, dispose of all or part of a shipment or incur costs because of delays in delivering products to our customers. We have adopted various international animal welfare standards to address our customers’ expectations. Any tightening of food safety or animal welfare regulations could result in increased costs and could have a material adverse effect on our business, results of operations, financial condition and prospects.
Environmental laws and regulations require increased expenditures for compliance.
We, like other Brazilian food producers, are subject to extensive Brazilian federal, state and local environmental laws, regulations, authorizations and licenses concerning, among other things, the interference with protected areas, such as conservation units, archeological sites and permanent preservation areas, handling and disposing of waste, discharging pollutants into the air, water and soil, atmospheric emissions, noise and clean-up of contamination, all of which affect our business. Water management is especially crucial and poses many challenges to our operations. In Brazil, water use regulations impact farming operations, industrial production and hydroelectric power. Any failure to comply with any of these laws or regulations or any lack of authorizations or licenses could result in administrative and criminal penalties, such as fines, cancellation of authorizations or revocation of licenses, in addition to negative publicity and civil liability for remediation or compensation for environmental damage. Administrative penalties may include fines, the suspension of public subsidies and the temporary or permanent shutdown of activities. Criminal penalties include fines, temporary loss of rights and prison (for individual offenders) and liquidation, temporary loss of rights, fines and community service (for legal entities). For example, in April 2020, our production unit located in Rio Verde - GO had its activities suspended for a few days, due to observations raised in the water supply system by the local Federal Inspection Service.
| 12 |
In addition, if we do not comply with environmental protection legislation, we may also be subject to direct and indirect, strict and joint and several liability, being obliged to repair environmental damages, regardless of our fault. The liability of companies does not exclude individuals, offenders, principals or accessories, often times extending the liability for these acts to the members of management of these companies, who took part in decisions or omitted themselves, when they could have avoided the resulting losses. Moreover, Article 4 of the Brazilian Environmental Crimes Law (Law No. 9,605/98) provides for the piercing of the corporate veil whenever it represents an obstacle to the redress related to environmental damage. In this event, shareholders of companies become personally liable for repairing environmental damage.
We have incurred, and will continue to incur, in operating expenses and capital expenditure requirements to comply with these environmental laws and regulations. Because of the possibility of unanticipated regulatory measures or other developments, particularly as environmental laws become more stringent in Brazil, the amount and timing of future expenditures required to maintain compliance may increase from current levels and may adversely affect the availability of funds for capital expenditures and other priorities. Compliance with existing or new environmental laws and regulations, as well as obligations in agreements with public entities, may result in increased costs and expenses.
Our plants are subject to environmental and operational licensing based on their pollution potential and use of natural resources. If one of our plants is built or expanded without an environmental license, or if our environmental licenses expire, and are not timely renewed or have their request for renewal rejected by the competent environmental authority, we may incur in fines and other administrative penalties, such as suspension of operations or closing of the facilities in question, and in some cases, are subject to civil and/or criminal liabilities. Those same penalties may also be applicable in the case of a failure to fulfill the conditions of validity in the environmental licenses already held by us. Currently, some of our environmental licenses are in the renewal process, and we cannot guarantee that environmental agencies will approve our requests for renewal. Brazilian CONAMA (Conselho Nacional do Meio Ambiente) Resolution No. 237 establishes that renewal of environmental licenses must be requested at least 120 days in advance of their expiration, so that the licenses may be automatically extended until a final decision from the environmental authority is reached. In addition, the environmental agency may condition the renewal on expensive facility upgrades if there have been regulatory changes in the environmental standards that the plant is required to meet, which may result in delays, disruptions or in the denial of the license.
We are also subject to similar environmental laws and restrictions in all jurisdictions where we have plants and operations, which may require us to incur significant costs.
Deterioration of general economic and political conditions could negatively impact our business.
Our business may be adversely affected by changes in Brazilian and global economic and political conditions, which may result in increased volatility in our markets and contribute to net losses.
Global economic downturns and related instability in the international financial system have had, and may continue to have, a negative effect on economic growth in Brazil. Global economic downturns reduce the availability of liquidity and credit to fund the continuation and expansion of our business operations worldwide. While Brazil exports a diversified bundle of products to a variety of countries, a significant decline in the economic growth or demand for imports of any of Brazil’s major trading partners, such as the European Union, China or the United States, could have a material adverse impact on Brazil’s exports and balance of trade and adversely affect Brazil’s economic growth.
Furthermore, because international investors’ reactions to the events occurring in one emerging market country sometimes produce a “contagion” effect, in which an entire region or class of investment is disfavored by international investors, Brazil could be adversely affected by negative economic or financial developments in other countries. Such developments may affect the Brazilian economy in the future and, consequently, our results of operations. For example, the world has been affected by the COVID-19 pandemic, which has triggered negative global economic developments, the severity of which we cannot quantify. Accordingly, the purchasing power of the Brazilian population, as in many countries affected by the pandemic, is expected to decrease, which may reduce consumption and investments and adversely affect our business and results of operations.
| 13 |
Uncertainty as to whether the Brazilian government will implement significant reforms in public policy in the future may contribute to economic uncertainty in Brazil and to heightened volatility in the Brazilian securities markets and the securities issued by Brazilian companies. As a result, there may be high volatility in the domestic financial markets in the short term, and economic recovery in the long term may be hindered. Accordingly, improvements in the labor market and income growth may be limited, which could have an adverse effect on our operations and financial results.
On January 31, 2020, the United Kingdom announced it had officially exited the European Union, commonly referred to as Brexit, and entered a transition period. Brexit has caused and may continue to cause political and economic uncertainty, including significant volatility in global stock markets and currency exchange rate fluctuations. The effects of Brexit will depend on many factors, including any trade deals that the United Kingdom makes to retain access to European Union markets. Brexit could lead to legal uncertainty and give rise to potentially conflicting national laws and regulations as the United Kingdom determines which laws of the European Union will be replaced or replicated. There could be increased costs from re-imposition of tariffs on trade between the United Kingdom and the European Union, shipping delays because of the need for customs inspections and procedures, and temporary shortages of certain goods. In addition, trade and investment between the United Kingdom, the European Union, Brazil and other countries will be impacted by the fact that the United Kingdom operated under the European Union’s tax treaties. The United Kingdom will need to negotiate its own tax and trade treaties with countries all over the world, which could take years to complete. The potential impact of Brexit on our market share, sales, profitability and results of operations is unclear. The economic conditions in the United Kingdom, the European Union and global markets may be adversely affected by reduced growth and volatility. Also, see “—Geopolitical and other challenges and uncertainties due to the ongoing military conflict between Russia and Ukraine could have a material adverse effect on the global economy, certain material and commodity prices and our business.”
We have undertaken, in the share purchase agreement entered into with Tyson International Holding Co., not to do business or otherwise compete in the sale of poultry products for human consumption in certain jurisdictions in Europe, including the European Economic Area (EEA) and the United Kingdom. The non-compete provision has partially lapsed for certain products and channels, and in October 2020, we reached a commercial agreement with Tyson International Holding Co. to accelerate our return to the European continent and regain access to other markets through a phased removal of the non-compete restrictions between 2021 and 2024. While we aim to expand our sales to Europe and other international markets as part of our strategy and Vision 2030 Plan, continued uncertainty and market volatility could undermine those expansion plans and have a corresponding adverse effect on our operations and financial results.
Additionally, on November 7, 2020, Joseph Biden won the presidential election in the United States and assumed office as the 46th President of the United States on January 20, 2021. The U.S. president has considerable influence, which may materially and adversely affect global economy and political stability. We cannot ensure that the Biden administration will adopt policies designed to promote macroeconomic stability, fiscal discipline, as well as domestic and foreign investment; if such policies are not implemented, the trading price of securities of Brazilian issuers, including our common shares may be materially and adversely impacted. Growing economic uncertainty and news of a potentially recessive economy in the United States may also create uncertainty in the Brazilian economy. These developments, as well as potential crises and forms of political instability arising therefrom or any other yet unforeseen development, may adversely affect our business and results of operations.
In March 2021, in order to allow for payment of emergency aid for the low-income population, the Brazilian National Congress approved a constitutional amendment that changed the government budget rules. From 2022 onwards, Brazilian states, cities and municipalities that reach the indebtedness limit of 95% of their income will have their fiscal and financial incentives granted reduced by 10%. Furthermore, in December 2021, the Brazilian National Congress approved a constitutional amendment to change the rules of credit payments (precatórios) between Brazilian states, cities and municipalities. The time limit for such payments was postponed for up to fifteen years. Considering the economic and fiscal scenario in Brazil and the 2022 presidential election, we may not have an increase in federal taxes immediately but the pressure in local government will occur thus leading to taxes increase in the foreseeable future in federal and local states.
| 14 |
As in any electoral year, the political landscape in Brazil for 2022 may impose uncertainties that might negatively impact our business. We cannot guarantee that the electoral scenario will not cause difficulties in the economic recovery, including but not limited to volatility in the market, contraction in the amount of investments as well as uncertainty about the economic policies to be implemented by a new or incumbent federal administration, and regional political leadership in states.
We are subject to third party transportation and logistics risks, and we rely on a limited number of available third-party suppliers to deliver certain specialized materials that we require for our production activities.
We depend on fast and efficient transportation and logistics services to, among other things, deliver raw materials to our production facilities, deliver animal feed to our poultry and pork growers, and distribute our products. Any prolonged disruption of these services may have a material adverse impact on our business, financial condition and results of operations. For example, on May 21, 2018, a national truckers’ strike commenced in Brazil regarding increases in fuel prices. The strike materially disrupted the supply chain of various industries across the country, including the supply chain of raw materials to our production facilities and the delivery of animal feed to our poultry and pork growers, and, at its peak, led to the suspension of the operation of all our production facilities located in Brazil. Furthermore, this strike also materially affected the regular functioning of the ports from where our products are exported. We incurred increased costs in connection with the truckers’ strike and were required to dispose of certain animals as a result of the strike. There can be no assurance that the truckers will not seek to engage in any further strikes – particularly considering the recent steep rise of fuel prices in Brazil as a result of the increase of oil prices across the world and the devaluation of the Brazilian currency - and that the Brazilian federal government or any other relevant party will be able to meet the demands of the truckers in a satisfactory manner or that any such strike will not adversely affect our supply chain or the operation of our production facilities. In addition, significant increase in fuel prices and transportation service rates as well as any other reduction in the reliability or availability of transportation or logistics services, including as a result of, among other things, flooding in ports, warehouse fires, global shipping container shortages, or labor strikes, could adversely affect our ability to satisfy our supply chain requirements and deliver our products economically to our customers. Any such disruption to the transportation or logistics services that we depend on could have a material adverse impact on our results of operations and financial condition.
In addition, some of our production activities require specialized materials that we acquire from a limited number of available third-party suppliers. For example, we rely on purchases of genetic material used in our livestock breeding programs from a very small number of livestock genetics companies. If any of these suppliers is not able to supply the materials in the quantity and at the frequency that we normally acquire them, and we are not able to replace the supplier on acceptable terms or at all, we may be unable to maintain our usual level of production and sales in the affected category of product, which may have a material adverse effect on our business and operations and, consequently, on our results of operations.
We may divest or acquire businesses or enter into joint ventures, which may divert management resources or prove to be disruptive to our company.
We regularly assess and pursue opportunities to focus or generate synergies in our business through divestitures or expansions through acquisitions, joint ventures and other initiatives. We have completed several divestitures and acquisitions in recent years, including Banvit Foods SRL, OneFoods Malaysia Sdn Bhd, companies that compose the Hercosul Group, Mogiana Alimentos S.A. and joint ventures with AES Brasil Energia S.A. and Intrepid Participações S.A. For additional details on certain of these transactions, see “Item 4. Information on the Company—A. History and Development of the Company—Other Transactions.” Divestments, acquisitions, new businesses, and joint ventures, particularly those involving sizeable businesses, may present financial, managerial, operational, legal, compliance and reputational risks and uncertainties, including:
| · | challenges in realizing the anticipated benefits of the transaction; |
| 15 |
| · | difficulties with managing various macroeconomic variables and their impact on the business; |
| · | difficulties with managing commercial relationships in various countries; |
| · | diversion of management attention from existing businesses; |
| · | difficulties with integrating/carving-out personnel, especially to different managerial practices; |
| · | disruptions when integrating or carving out financial, technological and other systems; |
| · | difficulties in identifying suitable candidate businesses or consummating a transaction on terms that are favorable to us; |
| · | challenges in retaining an acquired company’s customers and key employees; |
| · | challenges related to the loss of key employees in connection with a divestment; |
| · | increased compensation expenses for newly hired employees; |
| · | exposure to unforeseen liabilities or problems of the acquired companies or joint ventures; |
| · | warranty claims and claims for damages which may be limited in content, timeframe and amount; |
| · | legal challenges, including claims for indemnification; |
| · | challenges arising from a lack of familiarity with new markets with differing commercial and social norms and customs, which may adversely impact our strategic goals or require us to adapt our marketing and sales model for specific countries; |
| · | compliance with foreign legal and regulatory systems; |
| · | difficulties in transferring capital to new jurisdictions; |
| · | challenges in receiving the necessary approvals from governments and national and international antitrust authorities, including the Administrative Council of Economic Defense (Conselho Administrativo de Defesa Econômica), or CADE; and |
| · | restrictions imposed by local regulators, which were not identified before completion of the transaction. |
The strategic benefits from our divestitures or acquisitions may not materialize in the timeframe we anticipate, or at all. In addition, we may be unable to identify, negotiate or finance future divestitures, acquisitions or other strategic initiatives successfully or on favorable terms. Any future joint ventures or acquisitions of businesses, technologies, services or products might require us to obtain additional equity or debt financing, which may not be available on favorable terms, or at all. Future divestitures, acquisitions and joint ventures may also result in unforeseen operating difficulties and expenditures, as well as strain our organizational culture.
Our failure to continuously innovate and successfully launch new products that address our clients’ needs and requirements, as well as maintain our brand image, could adversely impact our operating results.
Our financial success depends on our ability to anticipate changes in consumer preferences and dietary habits and our ability to successfully develop and launch new products and product variations that are desirable to consumers. The resources that we devote to new product development and product extensions may be insufficient and we may not be successful in developing innovative new products or our new products may not be commercially successful. For example, trends towards prioritizing health and wellness present a challenge for developing and marketing successful new lines of products to address these consumer preferences. Furthermore, a reduction in our investment in product development may negatively affect not only our ability to generate innovative solutions, but also the in-market success of any such products. Additionally, our employees working on innovation and research and development may move to one of our competitors, which would compromise our ability to deliver new and innovative products and may also result in our competitors gaining information we view as proprietary. To the extent that we are not able to effectively gauge the direction of our key markets and successfully identify, develop, manufacture and market new or improved products in these changing markets in a timely or cost-effective manner, our products, brands, financial results and competitive position may suffer, which may have a material adverse effect on our business, results of operations, financial condition and prospects.
| 16 |
We also seek to maintain and extend the image of our brands through marketing, including advertising and consumer promotions. Due to inherent risks in the marketplace associated with advertising, promotions and new product introductions, including uncertainties about trade and consumer acceptance, our marketing investments may not prove successful in maintaining or increasing our market share. A continued global focus on health and wellness, including weight management, increasing media attention on the role of food marketing and negative press coverage about our quality controls and products, including in connection with the Carne Fraca Operation and Trapaça Operation, may adversely affect our brand image or lead to stricter regulations and greater scrutiny of food marketing practices. For instance, new nutritional labeling rules for packaged foods will require us to change 100% of our packaging labels in Brazil, so that labels present on the front panel the levels that our products exceed the established daily limits of sodium, added sugars and saturated fats as well as an adjustment to our form of nutritional table.
Our success in maintaining, extending and expanding our brand image also depends on our ability to adapt to a rapidly changing media environment, including increasing reliance on social media and online dissemination of advertising campaigns. The growing use of social and digital media increases the speed and extent that information or misinformation and opinions can be shared. Negative posts or comments about us, our brands or our products on social or digital media could seriously damage our reputation and brand image. If we do not maintain or improve our brand image, then our sales, financial condition and results of operations could be materially and adversely affected.
We may experience difficulties in expanding our products or in expanding into new lines of business, industries and/or foreign markets.
We may face challenges in connection with the expansion of our products as well as our expansion into new lines of business, industries and/or new geographic regions within or outside of Brazil. In particular, as we expand into new lines of business, such as BRF Pet, we may face challenges associated with entering into a line of business in which we have limited or no experience and in which we may not be well-known. Offering new products and services or offering existing products in new industries or new geographic regions may require substantial expenditures and takes considerable time, and we may not recover our investments in new markets in a timely manner or at all. For example, we may be unable to attract customers, fail to anticipate competitive conditions or fail to adapt and tailor our services to different markets.
We have been subject to significant investigations relating to, among other things, food safety and quality control, and an adverse outcome of any of these investigations could result in penalties, fines or other forms of liability and could have a material adverse effect on our business, reputation, brand, results of operations and financial condition.
Brazilian authorities are investigating Brazil’s meat processing industry in the so-called “Carne Fraca Operation.” The investigation involves several companies in the Brazilian industry and, among other things, includes allegations relating to food safety and quality control.
On March 17, 2017, we learned of a decision issued by the 14th Federal Court of Curitiba in the State of Paraná authorizing the search and seizure of information and documents from us, and the detention of certain individuals in the context of the Carne Fraca Operation. Two of our employees were detained (both of whom have been released) and three others were identified for questioning (of which only two were questioned).
| 17 |
On April 20, 2017, based on an investigation by the Brazilian Federal Police, Brazilian federal prosecutors filed several charges against two of our former employees (one of our regional manufacturing officers and one of our corporate affairs managers). One such employee was acquitted by lower courts of all charges on September 28, 2018, while the other employee was convicted on one charge. The Brazilian federal prosecutors and one of our former employees filed an appeal, which is pending judgment by the court. See “Item 8. Financial Information—A. Consolidated Statements and Other Financial Information—Legal Proceedings” for additional information.” On January 22, 2018, the Attorney General’s Office of the Third District of the State of Goiás filed a complaint against the industrial manager of our Mineiros plant at the time of the events subject to investigation in the Carne Fraca Operation, and against the former head of quality control at our Mineiros plant, neither of whom works for us any longer. Both were charged for allegedly committing crimes against consumers, as provided in article 7, item II of Law 8,137/90. According to the complaint, laboratory tests (dripping tests) detected excessive levels of water absorbed by the chicken products collected by authorities at our Mineiros plant. The Attorney General’s Office of the Third District of the State of Goiás alleges we produced chicken products with higher quantities of water than the limits permitted by the Brazilian Ministry of Agriculture, Livestock and Food Supply (Ministério da Agricultura, Pecuária e Abastecimento, or “MAPA”), with potential damages to customers, considering they would potentially be acquiring chicken meat products with a weight lower than that indicated on the packaging, since part of the weight of the frozen chicken would consist merely of water contained therein.
On March 5, 2018, we learned of a decision issued by a federal judge of the First Federal Court of Ponta Grossa in the State of Paraná, which authorized the search and seizure of information and documents pertaining to us and certain current and former employees, as well as the temporary detention of certain individuals. In what media reports have identified as the “Trapaça Operation,” eleven of our current and former employees were temporarily detained for questioning, including former Chief Executive Officer Pedro Faria and former Vice President for Global Operations Helio Rubens. All such current and former employees were released from custody and those who are still our employees are on leave of absence. A number of our current and former employees were identified for questioning. The primary allegations in the Trapaça Operation involve alleged misconduct relating to quality violations, improper use of feed components and falsification of tests at certain BRF manufacturing plants and accredited labs.
As a result of the Trapaça Operation, on March 5, 2018, we were notified by MAPA that it immediately suspended exports from our Rio Verde/Goiás, Carambeí/Paraná and Mineiros/Goiás plants to 13 countries with specific sanitary requirements related to Salmonella spp. As a precautionary measure, MAPA also suspended exports from 10 other of our plants to the European Union on March 15, 2018. On May 14, 2018, the European Union announced the decision to suspend 12 of our production facilities in Brazil by revoking the export approval of meat products from such facilities to the European Union’s countries due to increasing pressure from domestic producers’ organizations, supposedly demanding the measure for local market protection. The European Union generally has stricter requirements related to salmonella levels and other food safety standards compared to Brazil and the international markets in which we operate. Given the import ban applied to our production facilities, we are unable to export meat from such facilities to the European Union. Our results of operations may be further adversely affected due to the need to redirect the production capacity of such facilities, originally destined for the European Union, to other markets at similar prices or margins.
In June 2018 and in May 2019, we learned of administrative proceedings commenced against us by the Brazilian Comptroller General of the Union (Controladoria-Geral da União), or CGU, which is primarily related to alleged irregularities in connection with conduct that could represent harmful acts to the public administration under the Brazilian Anti-Corruption Law and other applicable laws, as described in Carne Fraca Operation and Trapaça Operation. The CGU is an internal control body of the Brazilian federal government responsible for carrying out activities related to the defense of public property and the increase of management transparency, through actions of public audit, correction, prevention and combat of corruption, among others. These CGU administrative proceedings against us remain pending without any adverse decision against us as of December 31, 2021. At the administrative proceedings related to the Trapaça Operation, when we are subpoenaed, we intend to present our defense in this matter. At the administrative proceedings related to the Carne Fraca Operation, BRF was subpoenaed and presented its defense in September 2021, and the proceeding is currently in the investigative phase. We will continue to discuss a possible resolution of these proceedings with CGU, and to cooperate with all applicable governmental authorities. The outcome of the CGU proceedings and any other proceedings instituted by authorities may result in penalties, fines, compensation, sanctions from governmental authorities or other forms of liabilities, which may have a material adverse impact on our reputation, brand, results of operations, financial position and cash flows. Currently, any losses related to this matter cannot be estimated, and, as a result, no provision has been recorded.
| 18 |
On October 15, 2018, the Brazilian Federal Police issued a report on the investigation of the Trapaça Operation, which contained accusations against 43 people, 23 of whom are current or former BRF employees, including former Chief Executive Officer Pedro Faria, former chairman of our board of directors Abilio Diniz, and three former vice presidents. Those who are still our employees are on leave of absence. Allegations against these senior employees generally focused on communications relating to alleged dioxin contamination. Since then, the police investigation has been under review by the Brazilian Federal Prosecutor responsible for the case to determine whether to bring criminal charges. See “Item 8. Financial Information—A. Consolidated Statements and Other Financial Information—Legal Proceedings” for additional information.
On December 4, 2019, in the context of the Trapaça Operation, criminal charges were brought against former BRF employees for allegedly committing, with respect to the manufacture of animal feed and PREMIX compound (supplement added to animal feed), aggravated larceny by fraud, false representation, wrapper or container with false labelling, forgery of substance or food product, forgery of product intended for therapeutic or medicinal purposes and criminal association, at least during the period between 2012 and 2018. The complaint was received by the lower court on January 21, 2020. There was no negative decision against any of the defendants during 2021. The defendants have presented their response to the complaint. On November 4, 2020, also in the context of the Trapaça Operation, a second complaint was filed by the Federal Public Prosecutor’s Office against former and inactive employees of ours for allegedly committing aggravated larceny by fraud, false representation, selling products harmful to health and criminal association, between the years 2012 and 2017, related to the presence of Salmonella on food products. The complaint was received by the lower court on November 20, 2020 and the defendants have presented their response. These proceedings are still pending. For additional information, see “Item 8. Financial Information—A. Consolidated Statements and Other Financial Information—Legal Proceedings.”
On February 11, 2020, the SFDA temporarily suspended the export authorization of two of our plants (Dois Vizinhos, SIF 2518, and Francisco Beltrão, SIF 1985) due to the Trapaça Operation. The Saudi Arabian government agency based its decision on news reports relating to the investigations. The case has been brought by Brazil as a Specific Trade Concern, or the STC, in the 4th meeting of the WTO Committee on Sanitary and Phytosanitary Measures in November 2020. For additional information, see “—More stringent trade barriers in key export markets may negatively affect our results of operations.”
Any of these existing investigations and proceedings, as described under “Item 8. Financial Information—A. Consolidated Statements and Other Financial Information—Legal Proceedings,” or any other ongoing or future investigation or proceeding could result in penalties, fines or other forms of liability and could have a material adverse effect on our business, reputation, brand, results of operations and financial condition.
We may fail to ensure compliance with relevant anti-fraud, anti-corruption, anti-money laundering and other international laws and regulations.
We are subject to anti-fraud, anti-corruption, anti-money laundering and other international laws and regulations. We are required to comply with the laws and regulations of Brazil and various jurisdictions where we conduct operations. In particular, we are subject to the Brazilian Anti-Corruption Law nº 12,846, the U.S. Foreign Corrupt Practices Act of 1977, or FCPA and the United Kingdom Bribery Act of 2010. The FCPA prohibits providing anything of value to foreign officials for the purposes of obtaining or retaining business or securing any improper business advantage. As part of our business, we may deal with entities and employees that are considered foreign officials for purposes of the FCPA. In addition, we participate in certain public tenders and competitive bidding rounds for contracts involving public authorities in Brazil and potentially in other markets where we operate, which activities are typically subjected to heightened regulatory scrutiny and often require compliance with specific anti-fraud, anti-corruption, anti-money laundering and other international laws and regulations.
Although we have internal policies and procedures designed to ensure compliance with applicable anti-fraud, anti-corruption, anti-money laundering and other international laws and regulations, potential violations of law have been identified on occasion as part of our compliance and internal control processes. In addition, we were notified of allegations involving potential misconduct by some of our employees in the context of the Carne Fraca Operation, Trapaça Operation and other investigations. For more details, see “—We have been subject to significant investigations relating to, among other things, food safety and quality control, and an adverse outcome of any of these investigations could result in penalties, fines or other forms of liability and could have a material adverse effect on our business, reputation, brand, results of operations and financial condition,” “Item 8. Financial Information—A. Consolidated Statements and Other Financial Information—Legal Proceedings—Carne Fraca Operation” and “Item 8. Financial Information—A. Consolidated Statements and Other Financial Information—Legal Proceedings—Trapaça Operation.” As a result of the Carne Fraca Operation and Trapaça Operation and related matters, we incurred expenses in the total amount of R$9,003 thousand for the year ended December 31, 2021 and R$28,004 thousand for the year ended December 31, 2020, which negatively impacted our results of operations. Additionally, these or other proceedings may result in penalties, fines, sanctions or other forms of liability. Furthermore, any negative reflection on our image or our brand from these or other activities could have a negative impact on our results of operations, as well as our ability to achieve our growth strategy.
| 19 |
Given the size of our operations and the complexity of our production chain, there can be no assurance that our internal policies and procedures will be sufficient to prevent or detect all inappropriate or unlawful practices, including fraud or violations of law or violations of our internal policies and procedures by our employees, directors, officers, partners or any third-party agents or service providers. Furthermore, there can be no assurance that such persons will not take actions in violation of our policies and procedures (or otherwise in violation of applicable laws and regulations) for which we or they may ultimately be held responsible. Violations of anti-fraud, anti-corruption, anti-money laundering or other international laws and regulations could have a material adverse effect on our business, reputation, brand, selling prices, results of operations and financial condition, including as a result of the closure of international markets. We may be subject to one or more enforcement actions, investigations or proceedings by authorities for alleged infringement of these laws. These proceedings may result in penalties, fines, sanctions or other forms of liability. Potential negative developments in the Carne Fraca Operation, Trapaça Operation and other investigations may also negatively affect the market price of our common shares and American Depositary Receipts, or ADRs.
We are subject to antitrust and competition laws and regulations and we may fail to ensure compliance with such laws and regulations.
We are subject to antitrust and competition laws and regulations in the jurisdictions in which we operate. Consequently, we may be subject to regulatory scrutiny in certain of these jurisdictions. For instance, on March 14, 2019, the Turkish Competition Authority (“TCA”) announced a decision regarding its investigation into our Turkish subsidiary Banvit and other producers for alleged anticompetitive practices in connection with chicken meat production in Turkey. The TCA imposed an administrative fine equivalent to R$22,507 thousand (TRY30,518 thousand, translated to reais at the exchange rate of R$0.7375 as of September 30, 2019), against Banvit. The decision was confirmed on September 17, 2019, and Banvit paid the fine with a 25% discount (a benefit available under Turkish law). For additional information, see “Item 8. Financial Information—A. Consolidated Statements and Other Financial Information—Legal Proceedings—Civil, Commercial and Other Proceedings.”
There can be no assurance that our internal policies and procedures designed to ensure compliance with applicable antitrust and competition laws and regulations will be sufficient to prevent or detect all inappropriate or unlawful practices. As a result, we may be subject to one or more enforcement actions, investigations or proceedings by authorities for alleged infringement of these laws. These proceedings may result in penalties, fines, sanctions or other forms of liability and could have a material adverse effect on our business, reputation, brand, selling prices, results of operations and financial condition, including as a result of the closure of international markets. Furthermore, there can be no assurance that the introduction of new competition laws in the jurisdictions in which we operate, the interpretation of existing antitrust or competition laws, the enforcement of existing antitrust or competition laws by authorities or civil antitrust litigation by private parties, or any agreements with antitrust or competition authorities, against us or our subsidiaries will not have a material adverse impact on our business, results of operations or financial condition.
A failure to comply with export control or economic sanctions laws and regulations could have a material adverse impact on our results of operations, financial condition and reputation.
We operate on a global basis and face risks related to compliance with export control and economic sanctions laws and regulations, including those administered by the United Nations, the European Union and the United States, including the U.S. Treasury Department’s Office of Foreign Assets Control. Economic sanctions programs restrict our dealings with certain sanctioned countries, territories, individuals and entities. Economic sanctions are complex, frequently changing, and often increase in number, and may impose incremental prohibitions, fines, restrictions on dealings with additional countries, territories, individuals or entities or compliance obligations on our dealings in certain countries and territories. We have conducted, and may in the future seek to conduct, business in certain countries that are subject to sanctions under the laws of the United States, the European Union, or other countries. Although we have pursued these transactions, and intend to pursue any future transactions, in full compliance with applicable laws and regulations, we may not be successful in ensuring compliance with limitations or restrictions on business with companies in any such countries. If we are found to be in violation of applicable sanctions laws or regulations, we may face criminal or civil fines or other penalties, we may suffer reputational harm and our results of operations and financial condition may be adversely affected. Additionally, there can be no assurance that our employees, directors, officers, partners or any third parties that we do business with, including, among others, any distributors or suppliers, will not violate sanctions laws and regulations. We may ultimately be held responsible for any such violation of sanctions laws and regulations by these persons, which could result in criminal or civil fines or other penalties, have a material adverse impact on our results of operations and financial condition and damage our reputation. Also, see “—Geopolitical and other challenges and uncertainties due to the ongoing military conflict between Russia and Ukraine could have a material adverse effect on the global economy, certain material and commodity prices and our business.”
| 20 |
Political and economic risks in regions and countries where we have exposure could limit the profitability of our operations and our ability to execute our strategy in these regions.
Since we have business operations around the world, we are subject to a variety of risks that may adversely affect our financial results. In the regions where we have production and distribution activities, we are subject to the following risks, among others:
| · | political instability; |
| · | geopolitical risks and conflicts, such as war, terrorism and civil unrest; |
| · | the imposition of exchange or price controls; |
| · | the imposition of restrictions on exports of our products or imports of raw materials necessary for our production processes, including embargoes from countries where we undergo production or distribution activities; |
| · | the fluctuation of global currencies against the real; |
| · | the nationalization of our property; |
| · | political influence by local governments in communities where we operate requiring investments or other expenditures; |
| · | increases in export tax and income tax rates for our products; |
| · | increases on non-tariff barriers; |
| · | free trade agreements between countries and regions excluding Brazil; |
| · | change in regulations of the markets to which we export; |
| · | lack of transparency and/or bribery or any illegal gains’ attempted by foreign officials; and |
| · | institutional and contractual changes unilaterally imposed by governments, including controls on investments and limitations on new projects. |
| 21 |
As a result of these factors, our results of operations and financial condition in the regions where we have production and distribution activities may be adversely affected, and we may experience significant variability in our revenue from those operations. This risk may be heightened as a result of the COVID-19 pandemic, for example due to outbreaks of COVID-19 in our plants and restrictions that may be imposed on our products because of these outbreaks. For more information, see “—Pandemics or human disease outbreaks, such as the coronavirus (COVID-19), may disrupt consumption and trade patterns, supply chains and production processes, which could materially affect our operations and results of operations.” In another trade-related development in 2020, certain member states of the European Union negotiating a trade agreement with the Mercosul trade bloc, of which Brazil is the largest member, indicated that progress would slow in light of concerns over Brazilian environmental protection policies and enforcement in connection with fires in the Amazon rainforest. Such delays could undermine efforts to expand our access to European markets. Additionally, several countries in Asia currently do not tax the importation of poultry and pork meat, which increases our products’ competitiveness in these countries. However, we understand that this import tax regulation may be changing in the near future. We are unable to control any such change in import tax regulation, which may have a material adverse effect on our products’ competitiveness. The impact of these changes on our ability to deliver our planned projects and execute our strategy cannot be ascertained with any degree of certainty, and these changes may adversely affect our operations and financial results.
Additionally, specific trade deals between key markets and other competing exporting countries may negatively affect our results of operations and competitiveness. For example, the U.S.-South Korea free trade agreement will significantly reduce the import tariff of U.S. agricultural products into Korea in 2022 which may adversely impact our exports to this country.
Our external market sales are subject to a broad range of risks associated with cross-border operations.
External market sales account for a significant portion of our global net sales, and represented 44.5% of our net sales in 2021, 43.7% of our net sales in 2020 and 44.5% of our net sales in 2019. Our external market is reported within our International business segment, which comprises Islamic markets (including Turkey, North of Africa, Gulf Cooperation Council (GCC) and Malaysia), Asia, Europe, Eurasia, Africa and Americas, where we are subject to many of the same risks described herein in relation to Brazil. Furthermore, we may seek to expand sales of our products to additional international markets. Our future financial performance depends, to a significant extent, on the economic, political and social conditions in those regions as well as on our supply conditions.
Our future ability to conduct business operations in external markets could be adversely affected by factors beyond our control, such as:
| · | exchange rate and interest rate fluctuations and the impact of hyperinflation; |
| · | commodities price volatility; |
| · | deterioration in global economic conditions; |
| · | political risks, such as turmoil and instability, foreign exchange controls and uncertainty regarding government policies; |
| · | decreases in demand, particularly from large markets such as China and Saudi Arabia; |
| · | imposition of increased tariffs, anti-dumping duties or other non-tariff trade barriers; |
| · | restrictions on international trade and financial flows imposed due to balance of payments deficits; |
| · | strikes or other events affecting ports and other transport facilities; |
| · | unpredictable international border closings that restrict products, materials and people; |
| 22 |
| · | compliance with differing foreign legal and regulatory regimes; |
| · | strikes, not only of our employees, but also of port employees, truck drivers, customs agents, sanitary inspection agents and other government agents at the Brazilian ports from which we export several of our products; |
| · | access to adequate infrastructure, which could be affected by flooding or similar events; |
| · | damage to our products; |
| · | negative media exposure related to the Brazilian agriculture or meat processing industries, particularly in connection with the Carne Fraca Operation, Trapaça Operation or other investigations; and |
| · | negative preconceptions influenced by Brazil’s worsening international reputation due to deforestation and other environmental and sustainability issues. |
We face significant competition from Brazilian and foreign producers, which could adversely affect our financial performance.
We face strong competition from other Brazilian producers in both the domestic and external markets. In addition, we compete with foreign producers in our external markets. The Brazilian market for whole poultry, poultry and pork cuts is highly fragmented. Small producers, some of which operate in the informal economy, are able to offer lower prices by meeting lower quality standards. With respect to exports, we compete with other large, vertically integrated producers that have the ability to produce quality products at similarly low costs.
In addition, the size and growth potential of the Brazilian market for processed food, poultry, pork and beef, combined with Brazil’s low production costs are attractive to international competitors. The main barrier impeding these companies from entering the Brazilian market has been the need to build a comprehensive distribution network, including a network of outsourced farmers, known as outgrowers. Nevertheless, foreign competitors with significant resources could undertake to build or acquire such capabilities.
The Brazilian poultry and pork cuts markets, in particular, are highly price-competitive and sensitive to product substitution. Even if we remain a low-cost producer, with strong brands, consumers may choose to purchase other products or brands. We expect to continue to face strong competition in all of our markets and anticipate that existing or new competitors may broaden their product lines and extend their geographic scope. Any delay or failure by us in responding to product, pricing and other strategies by competitors may negatively affect our financial performance.
Our business depends on the supply of raw materials produced by farmers and integrated producers, and our performance depends on our ability to attract and retain a network of qualified farmers and integrated producers.
We are a vertically integrated producer of food products, and we depend on a large number of raw materials of animal origin, or animal byproducts, to conduct our business. A substantial portion of the animal byproducts we use to conduct our business is produced by a network of integrated farmers and producers with whom we have entered into integrated production contracts. Such integrated producers are responsible for managing and raising the poultry and pork that we, as integrators, supervise. For the year ended December 31, 2021, we acquired 4,753,364 tons of animal byproducts from our integrated producers, corresponding to 98.2% of the raw materials we used during the course of our business.
The selection and retention of farmers and producers is highly competitive, and such competition between integrators has intensified in recent years. Our integrated producers are primarily located near our industrial units, where competing integrators conduct activities similar to the activities we conduct. We may be unable to select and retain such farmers and producers, particularly as a result of greater competition, or we may be obligated to pay higher prices for such byproducts or offer greater benefits to retain such farmers and producers. Our inability to retain an adequate number of such farmers and producers may negatively impact our strategic plans and operational performance.
| 23 |
In addition, our integrated producers are mostly financed through rural credit financing that they contract directly with financial institutions. Such rural credit financing are offered in the context of financial collaboration agreements that we enter into with the respective financial institutions, which establish obligations related to: (i) selecting integrated producers suitable for obtaining financing; (ii) maintaining a sufficient payment stream to such integrated producers to amortize and settle the financial installments granted within the scope of such financial collaboration agreements; and (iii) supervising the application of the financial resources granted to such integrated producers. In exceptional cases, such as the operational suspension, sale or lease of one of the industrial units that we use to purchase the production of our integrated producers financed through such financial collaboration agreements, we may be obligated to prepay the financing obtained by our integrated producers, or we may be required to maintain a sufficient payment stream to such integrated producers to amortize and settle the financial installments until a new integrator succeeds the affected industrial unit with respect to the integrated production contracts, which may adversely affect our results.
Our performance depends on favorable labor relations with our employees, our compliance with labor laws and the safety of our facilities. Any deterioration of those relations, increases in labor costs or injuries at our facilities could adversely affect our business.
As of December 31, 2021, we had approximately 100,000 employees worldwide. Our production employees in Brazil and in countries where organized labor is prevalent are generally represented by labor unions. Upon the expiration of existing collective bargaining agreements or other collective labor agreements, we may be unable to reach new agreements with the labor unions and any such agreements may not be on terms satisfactory to us, which could result in higher payments of wages or benefits to union workers. Additionally, if we are unable to negotiate acceptable collective bargaining agreements, we may become subject to work stoppages or strikes.
Labor costs are among our most significant expenditures. Such costs represented 12.4% of our cost of sales in the year ended December 31, 2021. In the event of a review of our employee contract structure, additional operational expenses could be incurred. Additionally, in the ordinary course of business, we outsource some of our labor force, which subjects us to claims that may arise from these relationships. In the event that a significant amount of these claims results in an unfavorable outcome against us, we may be held liable for amounts higher than our provisions, which may have a material adverse effect on our business, financial and operational condition and results of operations. In addition, if the outsourced activities are deemed by the authorities as employment relationships, outsourcing may be considered illegal and the outsourced workers may be considered our employees, which would result in a significant increase in our costs and could subject us to administrative and judicial procedures by the relevant authorities and fines. We are also subject to increases in our labor costs due to Brazilian inflation and increases in health insurance costs. Material increases in our labor costs could have a material adverse effect on our business, results of operations and financial condition and prospects.
In addition, we face risks related to the safety of our facilities. If we fail to implement safety procedures or if the procedures, we implement are ineffective or are not followed by our employees or others, our employees and others may be injured, which could result in costs for the injuries and lost productivity. Any of the foregoing could have an adverse impact on our business, results of operations and reputation.
We cannot guarantee that our suppliers will not engage in irregular practices.
We cannot guarantee that our suppliers will not have issues regarding working conditions, sustainability, outsourcing of the production chain and improper safety conditions and/or corruption. If any of our suppliers engage in these practices, our reputation may be harmed and, consequently, our customers’ perception of us may be adversely affected. Also, depending on the irregularity attributed to the supplier, if it has acted for our benefit, whether exclusively or not, we may be subject to the sanctions provided for in the applicable anti-corruption law. Although we have an internal integrity system that follows the best national and international compliance practices, which is applicable to all our suppliers and busines partners; there is no assurance that we will be able to timely identify and/or prevent any such violations by our suppliers.
| 24 |
We may be liable for environmental damage caused by our suppliers.
If the companies that provide us outsourced services do not meet the requirements of the applicable legislation, we may be considered liable for the environmental damage caused by these companies.
Additionally, environmental damage in Brazil implies strict and joint liability. This means that the obligation to repair the degradation caused may affect all those who, directly or indirectly, contributed to the occurrence of environmental damage, regardless of the agents' guilt, which may adversely affect our results and activities. Also, the hiring of third parties to carry out any management of our activities, such as management of contaminated areas, renovations or final disposal of waste, does not exempt us from liability for any environmental damage caused by a supplier engaged by us. If we are held liable for any such damages, our results and image may be adversely affected.
We depend on the operating results of our subsidiaries.
In addition to having our own operations, we hold equity interests in other companies. Therefore, in addition to the results generated by our own operation, we also depend on the operating results of our subsidiaries and controlled companies. Our ability to meet our debts and other obligations depends not only on our cash flow generation, but also on the cash flow generation of our subsidiaries, controlled companies and affiliates and their ability to make cash available to us in the form of payment of interest on equity, payment of debt, dividends, among others.
Any adverse change in the financial condition or results of operations of our subsidiaries, controlled companies and affiliates could materially and adversely affect our business, financial condition or results of operations.
Also, the income tax exemption on the distribution of dividends provided for in current Brazilian legislation may be reviewed and dividends may become taxable in the future, negatively impacting us, as a holding company, given that taxes may be due on the distribution of dividends by our subsidiaries to us.
In addition to the risk factor above, subsidiaries that carry out our significant operations are subject to the same risks applicable to us.
Unfavorable outcomes in administrative and legal proceedings may reduce our liquidity and negatively affect us.
We and some members of our management are defendants in civil, administrative, regulatory, environmental, labor and tax proceedings and we are also subject to consent agreements (Termo de Ajustamento de Conduta, or TAC). Unfavorable decisions in such legal proceedings may reduce our liquidity and have a material adverse impact on our business, results of operations, financial condition and prospects. In addition, our management and employees may be subject to judicial, arbitral and/or administrative investigations, inquiries, proceedings and claims.
With regard to tax contingencies, we are currently defendants in a number of cases, which include, for example, disputes regarding the offset of tax credits and the use of tax incentives in several states that have not yet reached a final ruling in the Brazilian courts. In addition, we may face risks arising from potential impairment of input state value-added tax, or VAT, that we accumulate on exports.
As of December 31, 2021, we have R$1,517,632 thousand in provisions for contingencies, of which R$357,013 thousand are for civil and other contingencies (including administrative, regulatory and environmental), R$400,101 thousand are for tax contingencies and R$628,767 thousand are for labor contingencies. Proceedings classified as possible losses, as of December 31, 2021, totaled R$14,518,170 thousand, which could adversely affect our financial situation in the event of change in circumstances in the classification of probability of loss, due to the complexity and discretion involved in the assessment, measurement and definition of the time of recognition and disclosure of legal claims between the various spheres in which they are processed.
| 25 |
We are also currently being investigated in the Carne Fraca Operation and Trapaça Operation, and administrative proceedings commenced against us by the CGU, which may result in penalties, fines and sanctions from governmental authorities or other forms of liability. For more information about the “Carne Fraca Operation,” “Trapaça Operation” and “CGU Proceedings,” see “Item 8. Financial Information—A. Consolidated Statements and Other Financial Information—Legal Proceedings—Carne Fraca Operation” and “Item 8. Financial Information—A. Consolidated Statements and Other Financial Information—Legal Proceedings—Trapaça Operation.” We will continue to cooperate with all applicable governmental authorities, including the CVM. Any investigation from governmental authorities currently unknown to us with respect to any potentially unlawful business practice may also result in penalties, fines and sanctions or other forms of liability.
On March 12, 2018, a shareholder class action lawsuit was filed against us, some of our former managers and a current officer of ours in the U.S. Federal District Court in the Southern District of New York. On July 2, 2018, the Court appointed the City of Birmingham Retirement and Relief System lead plaintiff in the action, or the Lead Plaintiff. On December 5, 2018, the Lead Plaintiff filed an amended complaint that sought to represent all persons and entities who purchased or otherwise acquired our ADRs during the period from April 4, 2013, through and including March 2, 2018. The class action alleged, among other things, that we and certain officers or directors of ours engaged in securities fraud or other unlawful business practices related to the regulatory issues in connection with the Carne Fraca Operation and Trapaça Operation. On December 13, 2019, we and the other defendants filed a motion to dismiss. On January 21, 2020, the Lead Plaintiff filed an opposition motion, and, on February 11, 2020, we and the other defendants filed our response. While the court’s decision on the motion to dismiss was still pending, the parties reached an agreement on March 27, 2020 to settle this class action for an amount equivalent to R$204,436 thousand (US$40,000 thousand, translated to reais at the exchange rate of R$5.1109 as of March 27, 2020). The court approved this settlement on October 23, 2020.
In addition, in 2020 we received a final and unappealable judicial decision regarding the exclusion of ICMS from the tax basis of the social contributions of PIS and COFINS, which permitted us to recognize a significant amount of recoverable taxes, which are described in note 9.1 to our consolidated financial statements. For a number of procedural reasons involved in finalizing the settlements for these judgments, it could take an extended period of time for us to receive these amounts, either as compensation or through obtaining a court ordered financial obligation (precatório). In 2021, we started to use these tax credits to offset federal taxes payable and the total amount used up to December 31, 2021 was R$628,557 thousand.
In March 2020, three confidential arbitration proceedings were brought against us in the Market Arbitration Chamber (Câmara de Arbitragem do Mercado) of the B3 S.A. – Brasil, Bolsa, Balcão, or the B3 or the São Paulo Stock Exchange, in Brazil by investors that had purchased our shares traded on the B3, seeking recovery from alleged losses incurred by them, due to the price fall of our shares, during the period starting from April 4, 2013 and afterwards. In September 2020, the Chairman of the Market Arbitration Chamber of B3 decided to consolidate these three arbitrations into a single arbitration proceeding. Because this arbitration proceeding is in its initial stage, we believe the possible loss or range of losses, if any, cannot be estimated. In the event that this litigation or arbitration proceeding is decided against us, or we enter into an agreement to settle, there can be no assurance that an unfavorable outcome or settlement would not have a material adverse impact on us.
We cannot guarantee that the results of these proceedings or investigations and/or that new proceedings or new investigations will have favorable outcomes for us and our management. With respect to proceedings to which we are a party, we cannot guarantee the dimension of the impacts that the results may have on our business, financial condition and/or reputation, or that we maintain or will maintain provisions in sufficient amount to cover all liabilities that may arise from these proceedings. In addition, we cannot guarantee that any person, directly or indirectly related to us, whether shareholder, employee, officer, director, supplier, service provider, subcontractors or alike, will not be involved in legal, administrative or arbitration proceedings, investigations or police inquiries.
Our inability or failure to protect our intellectual property and any intellectual property infringement against us could have a negative impact on our operating results.
Our principal intellectual property consists of our domestic and international brands. Our ability to compete effectively depends in part on our rights to trademarks, logos and other intellectual property rights we own or license. We have not sought to register or protect every one of our trademarks in every country in which they are or may be used, which means that third parties may be able to limit or challenge our trademark rights there. Furthermore, because of the differences in foreign intellectual property or proprietary rights laws, we may not receive the same level of legal protection in every country in which we operate.
| 26 |
Litigation may be necessary to enforce our intellectual property rights, and if we do not prevail, we could suffer a material adverse impact on our business, goodwill, financial position, results of operations and cash flows. Further, third parties may allege that our intellectual property or business activities infringe their own intellectual property or proprietary rights, and any litigation in this regard would be costly, regardless of the merits. If we are unsuccessful in defending any such third-party claims, or settling such claims, we could be required to pay damages or enter into license agreements, which might not be available under favorable terms. We may also be forced to rebrand or redesign our products to avoid the infringement, which could result in significant costs in certain markets. If we are found to infringe on any third party’s intellectual property rights, we could suffer a material adverse impact on our reputation, business, financial position, results of operations and cash flows.
Damages not covered by our insurance policies might result in losses for us, which could have an adverse effect on our business.
Certain kinds of losses cannot be insured against via third-party insurance, and our insurance policies are subject to liability limits and exclusions. For example, political risks, environmental and climate events, fraud, strike, product recalls, fines and penalties, terrorism, the livestock itself, ammonia leakage, financial risks such decrease in stock prices, cybersecurity risks, sabotage, industrial espionage, natural disasters or other catastrophic events may cause damage or disruption to our operations, international commerce and the global economy, and thus could have a material adverse effect on us. Additionally, we are exposed to certain product quality risks, such as criminal contamination, avian influenza, swine fever, salmonella and other livestock diseases that can impact our operations and which are not covered under insurance. If an event that cannot be insured occurs, or the damages are higher than our policy limits, we may incur significant costs. In addition, we could be required to indemnify parties affected by such an event. Furthermore, even where we incur losses that are ultimately covered by insurance, we may incur additional expenses to mitigate the loss, such as shifting production to different facilities. These costs may not be fully covered by our insurance.
On occasion, our facilities may be affected by fires and explosions, such as the fires in our facilities in Arroio do Meio, State of Rio Grande do Sul in 2019 and the explosion that occurred in our facilities in Uberlândia, State of Minas Gerais in 2021, by flooding, such as the flooding in our facility in Bandirma, Turkey in 2018, and by collapse in our substation facility in Concordia, State of Santa Catarina in 2021, as well as by electrical damages or explosion in substations, or widespread truck driver strikes. In addition, our operations were adversely affected by the COVID-19 pandemic, and we may not be able to recover compensation for the resulting losses under our insurance policies. For more information on the effects of COVID-19 on our business, see “—Pandemics or human disease outbreaks, such as the coronavirus (COVID-19), may disrupt consumption and trade patterns, supply chains and production processes, which could materially affect our operations and results of operations.” Our business interruption insurance may not cover all of our direct and indirect costs and intangible costs in connection with disruptions to our operations. For example, the negative impacts on our business from the 2018 Brazilian truckers’ strike, including the suspension of operations at our production facilities and increased transportation and logistics costs, were not covered by any of our insurance policies. Any similar events in the future could have a material adverse effect on our business, results of operations, financial condition and prospects.
Moreover, our insurance policies may not cover legal costs in general incurred to defend ourselves against legal and administrative proceedings. We have incurred, and expect to continue to incur, significant costs in connection with the Carne Fraca Operation and the Trapaça Operation. The costs associated with these investigations and the costs of defending ourselves against legal and administrative proceedings may not be covered by our insurance policies. Furthermore, there can be no assurance that we will be able to obtain insurance coverage in the future, related to the foregoing or any other matters, on terms acceptable to us. As a result, we may incur significant additional expenses which may adversely impact our financial condition and results of operations.
| 27 |
We depend on members of our senior management and on our ability to recruit and retain qualified professionals to implement our strategy.
We depend on members of our senior management and other qualified professionals to implement our business strategies. Efforts to recruit and retain professionals may result in significant additional expenses, which could adversely affect our results. In addition, loss of key professionals may adversely affect our ability to implement our strategy, as well as expenses associated to these losses can impact our results. In 2017 and 2018, we experienced a significant number of departures of senior management, including two of our previous CEOs, our CFO, our Chief Human Resources Officer, or CHRO, our Brazil General Manager and our Vice President of Operations. However, since 2019 the stability of our Senior Staff improved significantly, with one departure in 2019 – Mr. Ivan de Souza Monteiro, Chief Financial Officer, one departure on October 9, 2020 – Mr. Rubens Pereira, who resigned as Strategy, Management and Innovation Vice President and one departure in 2021 – Mr. Neil Hamilton dos Guimarães Peixoto Junior who left the position of Quality, Research & Development Vice President. These changes, and other potential changes, in the composition of our senior management team and our board of directors may result in modifications to our business strategy and have a material adverse effect on us.
Failure to maintain adequate internal controls could adversely affect our reputation and business.
Our management is responsible for establishing and maintaining adequate internal controls over financial reporting that provide reasonable assurance of the reliability of the preparation and reporting of our financial statements for external use. Inadequate internal controls may result in our failure to meet public reporting requirements accurately and on a timely basis and harm our reputation. The internal controls over financial reporting may not prevent or detect all misstatements or fraud, regardless of the adequacy of those controls, and, therefore, we cannot assure that material weaknesses will not be identified in the future.
Part of our activities are carried out in third-party properties. If we are unable to maintain or renew our lease agreements or to enter into new agreements under conditions that are commercially adequate for us, we may be adversely affected.
Part of our activities are developed in third-party real estate properties which are subject to lease agreements.
In accordance with applicable law, generally, either party may request in a judicial lawsuit the review of the rental price after the third year of the effectiveness term of the agreement or of the last renegotiation of the rental price. A significant increase in the amount of the rent as a result of such lawsuits review could adversely affect our financial position and our operating result.
In addition, our lease agreements provide that the rents will be annually adjusted by an official inflation index. In a scenario of hyperinflation, such adjustments may adversely affect our financial results.
If, for any reason, we are unable to (i) maintain our lease agreements; (ii) enter into new agreements; or (iii) renew them under conditions that we deem appropriate, we may have our activities interrupted and/or be adversely impacted, due to (i) costs arising from the reallocation of our operations, and (ii) loss and/or decrease in revenue, including if we are not able in a timely manner to relocate our activities to suitable properties and/or take a long time to rent any such properties or if we rent them at high prices. In any such cases, our financial condition and results of operations may be adversely affected.
Failure to comply with, obtain or renew the licenses required of the real estate properties where we develop our activities may have a material adverse effect on us.
Our activities depend on several registrations, authorizations, federal, state and municipal licenses and permits, including inspection records issued by Fire Departments (Autos de Vistoria do Corpo de Bombeiros), certificates of occupancy (habite-se) of the facilities we use and operating licenses issued by the respective municipalities in order to carry out our operations. Most of these licenses have an expiration term and must be timely renewed, and may be subject to the payment of renewal fees. In addition, any irregularities or alterations to the facilities of the properties may also have an adverse effect on the maintenance of such real estate licenses. The expansion of our operations and/or changes in applicable legislation may also require new licenses, grants, authorizations, permits and/or registrations to be requested before the competent authorities.
| 28 |
We cannot assure that such licenses have been or will be obtained with respect to each property whereby we carry out our activities or that they have been or will be regularly maintained in force or timely renewed. The lack or the irregularity of our licenses could result in the imposition of infraction notices and fines by the competent authorities. If we are unable to remedy any irregularities in our licensing process in a manner that leads to an interruption or suspension of our operations or that would require us to make significant and unexpected investments, this could result in a material adverse effect on our business, financial situation, reputation and results of operations. Also, we may have to incur with unexpected costs with the reallocation of establishments, in case of the impossibility to obtain or renew any of these licenses. These scenarios may negatively affect our business.
We may face situations of conflict of interest in transactions with related parties. Non-observance of commutative conditions in these transactions may adversely affect our results of operations.
We have contracts with relevant shareholders and subsidiaries involving, for example, the purchase and sale of goods. Situations may arise in which conflicts of interest occur in the relationship between us and such related parties.
If the contracts between us and our related parties do not observe commutative conditions, our results of operations may be adversely affected. Furthermore, if the rules applicable to transactions with related parties are not complied with by us, our operations and management involved may be subject to questioning and penalties by applicable authorities and competent governmental bodies.
For more information regarding our transactions with related parties, see “Item 7. Major Shareholders and Related Party Transactions⸻ B. Related Party Transactions” and note 29 of our consolidated financial statements.
Risks Relating to Our Indebtedness
The occurrence of a change of control may result in the default, acceleration, cross-default, cross-acceleration or termination of certain of our financing agreements.
We are party to certain financing agreements containing default, acceleration, cross-default, cross-acceleration and/or termination provisions in case of a change in control. In the event of a change in control, we may not be able to timely obtain waivers of such provisions from the respective contractual counterparties.
Default, acceleration, cross-default, cross-acceleration and/or termination of a relevant number of our financing agreements may adversely affect our financial condition and may materially adversely affect us.
We have substantial indebtedness, and our leverage could negatively affect our ability to refinance our indebtedness and grow our business.
As of December 31, 2021, our total consolidated debt (comprised of loans and borrowings) was R$25,679,978 thousand, and while we have not incurred significant increases in indebtedness resulting from the COVID-19 pandemic since it was declared, an increase in our leverage could result in adverse consequences for us, including:
| · | requiring that a substantial portion of our cash flows from operations be used for the payment of principal and interest on our debt, reducing the funds available for our operations, capital expenditures or other capital needs; |
| · | limiting our flexibility in planning for, or reacting to, changes in our business and the industry in which we operate because our available cash flow after paying principal and interest on our debt might not be sufficient to make the capital and other expenditures necessary to address these changes; |
| 29 |
| · | increasing our vulnerability to general adverse economic and industry conditions because, during periods in which we experience lower earnings and cash flows, we would be required to devote a proportionally greater amount of our cash flows to paying principal and interest on debt; |
| · | increasing our expenditures due to depreciations of the Brazilian real, which can lead to an increased amount of capital needed to service indebtedness that are denominated in U.S. dollars; and |
| · | making it difficult for us to refinance our indebtedness or to refinance such indebtedness on terms favorable to us, including with respect to existing accounts receivable securitizations. |
If one or more of these consequences or limitations were to materialize, they could adversely affect our results of operations and financial position.
Our cost of funding is affected by our credit ratings and any risks may have an adverse effect on our credit ratings and our cost of funds. Any downgrade in our credit rating, would likely increase our cost of funding and adversely affect our results of operations.
Credit ratings affect the cost and other terms upon which we are able to obtain funding. Rating agencies regularly evaluate us, and their ratings of our long-term debt are based on a number of factors, including our financial strength, conditions that generally affect the meat processing industry and the economic environment in which we operate.
In view of our current credit metrics and according to the policies and guidelines set by rating agencies in order to evaluate a company’s creditworthiness, as well as other factors, our credit rating is currently rated below “investment grade” by all of the rating agencies that rate us.
We cannot assure you that those rating agencies that have a negative outlook with respect to us will revise such outlooks upward. Our failure to maintain favorable ratings and outlooks would likely increase our cost of funding and adversely affect our results of operations.
We have substantial debt that matures in each of the next several years.
As of December 31, 2021, we have R$3,203,068 thousand outstanding in principal amount of loans and borrowings that matures from January 1, 2022 through December 31, 2022, R$2,855,597 thousand outstanding in principal amount of loans and borrowings that matures from January 1, 2023 through December 31, 2023, R$2,123,239 thousand outstanding in principal amount of loans and borrowings that matures in 2024, R$1,384,398 thousand outstanding in principal amount of loans and borrowings that matures in 2025, R$3,642,778 thousand outstanding in principal amount of loans and borrowings that matures in 2026 and R$12,246,951 thousand outstanding in principal amount of loans and borrowings that matures in 2027 and thereafter.
A substantial portion of our outstanding loans and borrowings is denominated in foreign currencies, primarily U.S. dollars. As of December 31, 2021, we have R$16,343,552 thousand outstanding in principal and interest of foreign currency loans and borrowings, of which R$2,166,249 thousand is classified as short-term debt. Our U.S. dollar-denominated loans and borrowings must be serviced by funds generated from sales by our subsidiaries, the majority of which are not denominated in U.S. dollars. Consequently, when we do not generate sufficient U.S. dollar revenues to cover that debt service, we must use revenues generated in reais or other currencies to service our U.S. dollar-denominated debt. As of December 31, 2021, the real depreciated against the U.S. dollar by 6.88% compared to December 31, 2020.
Depreciation in the value of the real or any of the other currencies of the countries in which we operate, compared to the U.S. dollar, could adversely affect our ability to service our debt. Foreign currency hedge agreements may not be effective in covering these currency-related risks.
| 30 |
Any future uncertainty in the stock and credit markets could also negatively impact our ability to access additional short-term and long-term financing, which could negatively impact our liquidity and financial condition. If, in coming years:
| · | the pressures on credit return as a result of disruptions in the global stock and credit markets; |
| · | our operating results worsen significantly; |
| · | we are unable to complete any necessary divestitures of non-core assets and our cash flow or capital resources prove inadequate; or |
| · | we are unable to refinance or repay any of our outstanding debt that becomes due, which could have a material adverse effect on our consolidated business and financial condition. |
The terms of our indebtedness impose significant restrictions on us.
The instruments governing our existing indebtedness impose significant restrictions on us, and the instruments governing any indebtedness we may incur in the future may also impose the same or additional restrictions on us. The existing restrictions limit, and any future restrictions may limit, directly or indirectly, our ability, among other things, to undertake the following actions:
| · | borrow money; |
| · | make investments; |
| · | sell assets, including capital stock of subsidiaries; |
| · | guarantee indebtedness; |
| · | enter into agreements that restrict dividends or other distributions from certain subsidiaries; |
| · | enter into transactions with affiliates; |
| · | create or assume liens; and |
| · | engage in mergers or consolidations. |
Although the covenants to which we are currently subject have exceptions and qualifications, the breach of any of these covenants could result in a payment default under the terms of other existing debt obligations. Upon the occurrence of such an event of default, all amounts outstanding under the applicable debt instruments and the debt issued under other debt instruments containing cross-default or cross-acceleration provisions, together with accrued and unpaid interest, if any, might become or be declared immediately due and payable. If such indebtedness were to be accelerated, we may have insufficient funds to repay in full any such indebtedness. In addition, in connection with the entry into new financings or amendments to existing financing arrangements, our subsidiaries’ financial and operational flexibility may be further reduced as a result of the imposition of covenants that are more restrictive, the requirements for additional security and other terms.
Risks Relating to Brazil
Brazilian economic, political and other conditions, and Brazilian government policies or actions in response to these conditions, may negatively affect our business, results of operations and the market prices of our common shares and ADRs.
The Brazilian economy has historically been characterized by interventions by the Brazilian government and unstable economic cycles. The Brazilian government has often changed monetary, price controls, taxation, credit, tariff and other policies to influence the course of Brazil’s economy. Our business, results of operations, financial condition and prospects as well as the market prices of our common shares and ADRs may be adversely affected by, among others, the following factors:
| 31 |
| · | exchange rate fluctuations; |
| · | expansion or contraction of the Brazilian economy; |
| · | inflation rate fluctuations; |
| · | changes in fiscal or monetary policies; |
| · | commodities price volatility; |
| · | increases in interest rates; |
| · | exchange controls and restrictions on remittances abroad; |
| · | volatility and liquidity of domestic capital and credit markets; |
| · | natural disasters and changes in climate or weather patterns; |
| · | energy or water shortages or rationing; |
| · | changes in environmental regulation; |
| · | social and political instability, particularly in light of the upcoming the upcoming presidential election in Brazil; |
| · | strikes, not only of our employees, but also of port employees, truck drivers, other transport facilities, customs agents, sanitary inspection agents and other government agents; and |
| · | other economic, political, diplomatic and social developments in or affecting Brazil, including with respect to alleged unethical or illegal conduct of certain figures in the Brazilian government and legislators, which are currently under investigation. |
Following a two-year contraction of 3.5% in GDP both in 2015 and 2016, the Brazilian economy posted moderate increases of 1.0% and 1.1% in 2017 and 2018, respectively, and again of 1.1% in 2019. Due to the global economic downturn triggered by the COVID-19 pandemic, the Brazilian economy in 2020 contracted by 4.1% of GDP. As of December 31, 2021, the Brazilian economy showed signs of recovery as measured by its GDP, which increased 4.6% year-on-year according to IBGE, and inflation, increased to 10.06% accumulated over the last twelve months prior to December 31, 2021, from 4.52% in 2020 and 4.31% in 2019, as measured by the Extended National Consumer Price Index (Índice Nacional de Preços ao Consumidor Amplo), or IPCA, published by the Brazilian Institute of Geography and Statistics (Instituto Brasileiro de Geografia e Estatística), or IBGE. As of December 31, 2021, the SELIC, the Brazilian primary reference interest rate, increased to 9.25%, from 2.0% in 2020, and 4.5% in 2019. As of the date of this annual report, the SELIC was 11.75%. As of December 31, 2021, unemployment increased from 11.1% in 2019, to 14.2% in 2020 and decreased to 11.6% in 2021, according to the National Household Sample Survey (Pesquisa Nacional por Amostra de Domicílio) published by the IBGE.
In addition, various investigations into allegations of money laundering and corruption being conducted by the Office of the Brazilian Federal Prosecutor, including the largest such investigation, known as the “Lava Jato Operation,” have indirectly negatively impacted the Brazilian economy and political environment and are still ongoing.
| 32 |
A number of senior politicians, including current and former members of Congress and the Executive Branch, and high-ranking executive officers of major corporations and state-owned companies in Brazil were arrested, convicted of various charges relating to corruption, entered into plea agreements with federal prosecutors or have resigned or been removed from their positions as a result of these Lava Jato investigations. These individuals are alleged to have accepted bribes by means of kickbacks on contracts granted by the government to several infrastructure, oil and gas and construction companies. The profits of these kickbacks, which were not publicly disclosed, allegedly financed the political campaigns of political parties forming the previous government’s coalition that was led by former President Dilma Rousseff. These funds were also allegedly used for the personal enrichment of certain individuals. The effects of Lava Jato as well as other ongoing corruption-related investigations resulted in an adverse impact on the image and reputation of those companies that have been implicated as well as on the general market perception of the Brazilian economy, political environment and the Brazilian capital markets. We have no control over, and cannot predict, whether such investigations or allegations will lead to further political and economic instability or whether new allegations against government officials will arise in the future.
Amidst this background of political uncertainty, in August 2016, the Brazilian Senate approved the removal from office of Brazil’s then-president, Ms. Dilma Rousseff, following a legal and administrative impeachment process for infringement of budgetary laws. Mr. Michel Temer, the former vice president, who assumed the presidency of Brazil following Rousseff’s ouster, was first arrested on March 2019, having been convicted of the crimes of cartel involvement, active and passive corruption, money laundering and public auction fraud. He was released and arrested again four days later, in May 2019, and then released once again six days later. He continues to be under investigation on corruption allegations. In addition, the former president, Mr. Luiz Inácio Lula da Silva, began serving a 12-year prison sentence on corruption and money laundering charges in April 2018, but he was released from prison in November 2019 following a Federal Supreme Court ruling. The Brazilian Supreme Court has recently annulled the criminal convictions against Mr. Lula da Silva, and subsequently reinstated his political rights, which may further deepen political tensions in Brazil and enable him to run for president in the elections to take place in 2022. Historically, in election years, especially presidential elections, levels of foreign investment in the country are reduced; and political uncertainty creates greater instability and volatility in the political-economic scenario. In summary, the outcome of the 2022 presidential election and its impact on the Brazilian economy are uncertain and can adversely affect our operations and financial results. The President of Brazil has the power to determine policies and issue governmental acts related to the conduct of the Brazilian economy and, consequently, affect the operations and financial performance of companies, including ourselves. We cannot predict which policies the President elected in 2022 will adopt, much less whether such policies or changes in current policies can adversely impact us or the Brazilian economy.
The current Brazilian president, Mr. Jair Bolsonaro, a former member of the military and three-decade congressman, was elected on October 28, 2018 and took office on January 1, 2019. During his presidential campaign, the new Brazilian president was reported to favor the privatization of state-owned companies, economic liberalization and social security and tax reforms. However, there is no guarantee that certain reforms will be approved or even presented to Congress for review, which may further deteriorate the fiscal condition of Brazil and worsen the uncertainty regarding the Brazilian economic. Additionally, statements made by Mr. Bolsonaro during 2020 and 2021, such as the announcement to replace the Chief Executive Officer of Petrobras following disagreements over fuel price policies, contributed to significant market volatility in Brazil and also indicate possible deviations from his campaign promises in favor of liberal economic policies. In addition, the current minister of the economy proposed during the presidential campaign the revocation of the income tax exemption for the payment of dividends, which, if enacted, would increase the tax expenses associated with any dividend or distribution by Brazilian companies. This could impact our ability to receive, from our subsidiaries, future cash dividends or distributions net of taxes and also our ability to make distributions to our shareholders net of taxes, which could have a material adverse effect on our results of operations.
Moreover, Mr. Bolsonaro was generally a polarizing figure during his campaign for presidency, particularly in relation to certain of his social views, and we cannot predict the ways in which a divided electorate may continue to impact his presidency and the implementation of policies and reforms, all of which could have a negative impact on our business and the price of our common shares and ADRs.
In addition, Mr. Bolsonaro is under criminal investigation due to allegations by former minister of justice Sergio Moro that he had unduly interfered in the activities of the Brazilian Federal Police. According to the former minister, the president asked him to appoint certain officials to positions in the Brazilian Federal Police force. In case Mr. Bolsonaro is determined to have committed such crimes or impeachable offenses, any resulting consequences, including a potential impeachment, could have significant adverse effects on Brazil’s political and economic environment, as well as on businesses operating in Brazil, including our company.
| 33 |
Furthermore, Mr. Bolsonaro’s COVID-19 responses have been criticized in Brazil and abroad. COVID-19 disruptive effects have enhanced political uncertainty and instability in Brazil, particularly considering political discussions that culminated in the dismissal or after the resignation of highly ranked federal ministers as well as the emergence of corruption allegations against Mr. Bolsonaro. On April 27, 2021, the Brazilian Senate established a parliamentary commission of inquiry (Comissão Parlamentar de Inquérito), or CPI, to investigate the alleged mishandling of public funds assigned to combat COVID-19 effects in Brazil. The CPI’s purpose was to investigate actions and omissions by the Federal Government while fighting the pandemic, as well as the healthcare system collapse in the State of Amazonas in early 2021. The CPI’s final report, which was approved by a majority of CPI members, was presented to the Brazilian Public Prosecutor's Office (Procuradoria-Geral da República) and the Brazilian Supreme Court (Supremo Tribunal Federal) in October 2021. The report recommended the indictment of 78 individuals and 2 companies, including that of President Jair Bolsonaro for allegedly committing at least 9 crimes while handling the COVID-19 pandemic. If President Jair Bolsonaro is indicted by the Brazilian Attorney General’s Office (Advocacia-Geral da União), there may be an impeachment proceeding or trial by the Brazilian Supreme Court, which may have material adverse effects on Brazil’s political and economic environment.
Brazil is expected to continue to run a budget deficit for 2022 and the years going forward. The 2021 budget bill, which was introduced in July 2020, was approved with a deficit of R$247.1 billion. In January 2022 the Brazilian federal government approved the 2022 budget bill, also with a deficit of R$79.3 billion. We cannot predict the impact of this budget deficit on the Brazilian economy. The political and economic instability in 2020 and 2021 has negatively affected consumer confidence in Brazil. The Fundação Getúlio Vargas Consumer index presented a decrease of 3.0 points from 78.5 points in 2020 to 75.5 points in 2021.
We cannot predict which policies the Brazilian federal government may adopt or change or the effect that any such policies might have on our business or on the Brazilian economy. Any such new policies or changes to current policies may have a material adverse impact on our business, results of operations, financial condition and prospects. Worsening political and economic conditions in Brazil may increase production and supply chain costs and adversely affect our results of operations and financial condition. Uncertainty as to whether the Brazilian government will implement changes in policies or regulations affecting these or other factors in the future may contribute to economic uncertainty in Brazil and to heightened volatility in our production operations.
Inflation and government measures to curb inflation may adversely affect the Brazilian economy, the Brazilian securities market, our business and operations, financial condition and the market prices of our common shares and ADRs.
Brazil has experienced high rates of inflation in the past, while recent downward inflationary pressures caused the Brazilian consumer price inflation rates to reach 4.31% in 2019, 4.52% in 2020 and 10.06% in 2021, according to the IPCA, published by the IBGE. See “Item. 5. Operating and Financial Review and Prospects—A. Operating Results—Principal Factors Affecting Our Results of Operations—Brazilian and Global Economic Conditions” and “—Effects of Exchange Rate Variations and Inflation.”
There can be no assurance that inflation rates will decrease nor stabilize. Although inflation levels have been relatively stable from 2018 to 2020, Brazil experienced an abrupt increase in inflation levels during 2021 reaching the highest levels since 1994. Periods of higher inflation slow the growth rate of the Brazilian economy, which may lead to lower growth in consumption of food products. High inflation also puts pressure on industry costs of production and expenses, which may force companies to search for innovative solutions in order to remain competitive. We may not be able to pass any such increase in costs onto our customers and, as a result, it may adversely impact our results of operations and financial condition. In addition, high inflation generally leads to higher domestic interest rates, and, as a result, the costs of servicing our debt may increase. Furthermore, inflation and its effect on domestic interest rates can lead to reduced liquidity in the domestic capital and lending markets, which could affect our ability to refinance our indebtedness and may have an adverse effect on our business, results of operations, financial condition and the market prices of our common shares and ADRs.
| 34 |
Fluctuations in interest rates may have an adverse effect on our business, financial condition and the market prices of our common shares and ADRs.
The Brazilian Central Bank uses interest rates to attempt to keep inflation under control or to stimulate the economy. If interest rates decrease, there is generally greater access to credit and consumption of goods typically increases. This increase in demand can in turn result in inflation. On the other hand, if interest rates go up, the cost of borrowing increases which may inhibit consumption and additional investments. Another consequence of a rising interest rate is that a greater return is paid in respect of government securities, which may impact other investments by making them less attractive by comparison. As a result, there may be additional investment in public debt, which absorbs money that could otherwise fund the private sector.
As of December 31, 2021, 36% of the outstanding amount of principal and interest of our loans and borrowings of R$25,456,030 thousand was either: (i) denominated in (or swapped into) reais and bears interest based on Brazilian floating interest rates, such as the Interbank Deposit Certificate Rate (Certificado de Depósito Interbancário), or CDI, an interbank certificate of deposit rate that applies to our foreign currency swaps and some of our other real-denominated indebtedness, or the IPCA; or (ii) U.S. dollar-denominated and bears floating interest based on the London Interbank Offered Rate, or LIBOR. Any increase in the CDI, IPCA or LIBOR rates may have an adverse impact on our financial expenses and our results of operations.
Exchange rate fluctuations may adversely affect our financial condition and results of operations.
From time to time, there have been significant fluctuations in the exchange rate between the Brazilian currency and the U.S. dollar and other currencies. The real appreciated 16.5% in 2016, and depreciated 1.5%, 17.1%, 4.0%, 22.4% and 6.88%, in 2017, 2018, 2019, 2020 and 2021, respectively, against the U.S. dollar. Following the start of the COVID-19 pandemic, the real depreciated significantly against the U.S dollar, reflecting low interest rates, a deteriorating economic environment and a political crisis. As of December 31, 2021, the real/U.S dollar exchange rate was R$5.58 to US$1.00 and as of March 24, 2022, the real/U.S dollar exchange rate was R$4.81 to US$1.00.
Appreciation of the Brazilian real against the U.S. dollar may lead to a dampening of export-driven growth. Our production costs are denominated in reais, but our international sales are mostly denominated in U.S. dollars. Revenues generated by exports are reduced when translated to reais in the periods in which the real appreciates in relation to the U.S. dollar. Any appreciation could reduce the competitiveness of our exports and adversely affect our net sales and our cash flows from exports. On the other hand, a depreciation of Brazilian real against the U.S. dollar may lead to higher exports and revenues, but costs may be higher.
Costs are also directly impacted by exchange rates. Any depreciation of the real against the U.S. dollar could create additional inflationary pressures in Brazil by increasing the price of imported products and requiring deflationary government policies. In addition, the prices of soy meal and soybeans, which are important ingredients for our animal feedstock, are closely linked to the U.S. dollar, and many of the mineral nutrients added to our feedstock must be purchased in U.S. dollars. The price of corn, another important ingredient for our feedstock, is also linked to the U.S. dollar, but to a lesser degree. In addition to feedstock ingredients, we purchase sausage casings, breeder eggs, packaging and other raw materials, as well as equipment for use in our production facilities, from suppliers located outside Brazil whom we must pay in U.S. dollars or other foreign currencies. When the real depreciates against the U.S. dollar, the cost in reais of our U.S. dollar-linked raw materials and equipment increases, and these increases could materially adversely affect our results of operations. We have established policies and procedures to manage our sensitivity to such risks included in our Financial Risk Management Policy. This policy, however, may not adequately cover our revenue and cost exposure to exchange rates.
We had total foreign currency-denominated loans and borrowings in an aggregate amount of R$16,343,552 thousand as of December 31, 2021, representing 64.2% of our total consolidated indebtedness at that date. Although we manage a portion of our exchange rate risk through foreign currency derivative instruments and future cash flows from exports in U.S. dollars and other foreign currencies, our foreign currency debt obligations are not completely hedged. A significant devaluation of the real in relation to the U.S. dollar or other currencies would increase the amount of reais that we would need in order to meet debt service requirements of our foreign currency-denominated obligations.
| 35 |
Changes in tax laws or changes in their interpretation may increase our tax burden and, as a result, negatively affect our results of operations and financial condition.
The Brazilian government regularly implements changes to tax regimes that may increase our and our suppliers’ and customers’ tax burdens, which may in turn increase the prices we charge for the products we sell, restrict our ability to do business in our existing markets and, therefore, materially adversely affect our results of operations and financial condition.
These changes include modifications in the tax rates and, on occasion, enactment of temporary taxes, the proceeds of which are earmarked for designated governmental purposes. In the past, the Brazilian government has presented certain tax reform proposals, which have been mainly designed to simplify the Brazilian tax system, to avoid internal disputes within and between the Brazilian states and municipalities, and to redistribute tax revenues. The tax reform proposals provide for changes in the rules governing the federal Social Integration Program (Programa de Integração Social) or PIS, and Contribution for Social Security Funding (Contribuição para o Financiamento da Seguridade Social), or COFINS, taxes, ICMS and certain other taxes, such as increases in payroll taxes and in the withholding tax over dividend distributions. The proposals are being discussed by the Brazilian National Congress which has increased the pressure on the Brazil government to advance on tax reforms. Other tax regimes, such as the research and development tax incentive program (Lei do Bem) and the deduction of interest on shareholders’ equity, may be revoked to increase the government’s revenues in light of a possible reduction in the income tax rate, which has been and is being discussed in the Brazilian National Congress. The effects of these proposed tax reform measures and any other changes that could result from the enactment of additional tax reforms have not been, and cannot be, quantified yet due to the uncertainty of whether any changes will be implemented. Some of these measures, if enacted, may result in increases in our overall tax burden, which may adversely affect our overall financial performance. Moreover, certain tax laws may be subject to controversial interpretation by tax authorities. In the event that tax authorities interpret tax laws in a manner that is inconsistent with our interpretations, we may be adversely affected.
Risks Relating to Our Common Shares and Our ADRs
Holders of ADRs may find it difficult to exercise voting rights at our shareholders’ meetings.
Holders of ADRs may exercise voting rights with respect to our common shares represented by American Depositary Shares, or ADSs, and evidenced by ADRs only in accordance with the deposit agreement governing the ADRs. Holders of ADRs face practical limitations in exercising their voting rights because of the additional steps involved in our communications with ADR holders. For example, we are required to publish a notice of our shareholders’ meetings in specified newspapers in Brazil. Holders of our common shares are able to exercise their voting rights by attending a shareholders’ meeting in person or virtually (whenever the shareholders’ meeting is held under a partial or 100% digital format), by means of the distance voting form (boletim de voto a distância) or by voting by proxy. By contrast, holders of ADRs will receive notice of a shareholders’ meeting by mail from the ADR depositary if we give notice to the depositary requesting the depository to do so. To exercise their voting rights, holders of ADRs must instruct the ADR depositary on a timely basis. This voting process necessarily takes longer for holders of ADRs than for holders of our common shares. If the ADR depositary fails to receive timely voting instructions for all or part of the ADRs, the depositary will assume that the holders of those ADRs are instructing it to give a discretionary proxy to a person designated by us to vote their ADRs, to the extent permitted by the New York Stock Exchange rules.
Holders of ADRs also may not receive the voting materials in time to instruct the depositary to vote our common shares underlying the ADSs that are evidenced by their ADRs. In addition, the depositary and its agents are not responsible for failing to carry out voting instructions of the holders of ADRs or for the manner of carrying out those voting instructions. Accordingly, holders of ADRs may not be able to exercise voting rights, and they have little, if any, recourse if the common shares underlying the ADSs that are evidenced by their ADRs are not voted as requested.
| 36 |
Non-Brazilian holders of ADRs or common shares may face difficulties in protecting their interests because we are subject to different corporate rules and regulations as a Brazilian company, and our shareholders may have less extensive rights.
Holders of ADRs are not direct shareholders of our company and may be unable to enforce the rights of shareholders under our bylaws and Brazilian Law No. 6,404, dated December 15, 1976, as amended, or Brazilian Corporate Law.
Our corporate affairs are governed by our bylaws and Brazilian Corporate Law, which differ from the legal principles that would apply if we were incorporated in a jurisdiction in the United States, such as the State of Delaware or New York, or elsewhere outside Brazil. Even if a holder of ADRs surrenders its ADRs and becomes a direct shareholder, its rights as a holder of our common shares under Brazilian Corporate Law to protect its interests relative to actions by our board of directors or executive officers may be limited compared to the laws of those other jurisdictions.
Although insider trading and price manipulation are crimes under Brazilian law, the Brazilian securities markets are subject to different levels of regulations and supervision compared to the U.S. securities markets or the markets in some other jurisdictions. In addition, rules and policies against self-dealing or for preserving shareholder interests may be less well defined and enforced in Brazil than in the United States and certain other countries, which may put non-Brazilian holders of our common shares or ADRs at a potential disadvantage. Corporate disclosures also may be less complete or informative than for a public company in the United States or in certain other countries.
Non-Brazilian holders of ADRs or common shares may face difficulties in serving process on or enforcing judgments against us and other persons.
We are a corporation (sociedade anônima) organized under the laws of Brazil, and all of our directors and executive officers and our independent public accountants reside or are based in Brazil. Most of the assets of our company and of these other persons is located in Brazil. As a result, it may not be possible for non-Brazilian holders of ADRs or common shares to effect service of process upon us or these other persons within the United States or other jurisdictions outside Brazil or to enforce against us or these other persons judgments obtained in the United States or other jurisdictions outside Brazil. Because judgments of U.S. courts for civil liabilities based upon the U.S. federal securities laws may only be enforced in Brazil if certain conditions are met, non-Brazilian holders of ADRs or common shares may face greater difficulties in protecting their interests in the case of actions by us or our directors or executive officers than would shareholders of a U.S. corporation.
Judgments of Brazilian courts with respect to our common shares may be payable only in reais.
If proceedings are brought in the courts of Brazil seeking to enforce our obligations in respect of the common shares, we may not be required to discharge our obligations in a currency other than reais. Under Brazilian exchange control limitations, an obligation in Brazil to pay amounts denominated in a currency other than reais may only be satisfied in Brazilian currency at the exchange rate, as determined by the Central Bank, in effect (1) on the date of actual payment, (2) on the date on which such judgment is rendered or (3) on the date on which collection or enforcement proceedings are commenced. The then prevailing exchange may not afford non-Brazilian investors with full compensation for any claim arising out of or related to our obligations under the common shares or the common shares represented by ADRs.
Holders of ADRs and non-Brazilian holders of our common shares may be unable to exercise preemptive rights and tag-along rights with respect to our common shares underlying the ADSs evidenced by their ADRs.
Holders of ADRs and non-Brazilian holders of our common shares may be unable to exercise the preemptive rights and tag-along rights relating to our common shares (including common shares underlying the ADSs evidenced by their ADRs) unless a registration statement under the U.S. Securities Act of 1933, as amended, or the “Securities Act,” is effective with respect to those rights or an exemption from the registration requirements of the Securities Act is available. We are not obligated to file a registration statement with respect to the shares relating to these preemptive rights, and we cannot assure you that we will file any such registration statement. Unless we file a registration statement or an exemption from registration is available, a holder may receive only the net proceeds from the sale of his or her preemptive rights or tag-along rights, or if these rights cannot be sold, they will lapse and the holder will receive no value from them.
| 37 |
Provisions in our bylaws may prevent efforts by our shareholders to change our control or management.
Our bylaws contain provisions that may discourage, delay or make more difficult a change in control of our company or removal of our directors. These provisions require any shareholder that acquires shares representing 33.33% or more of our share capital, or the Equity Percentage Threshold, to disclose such information immediately through a filing with the Securities and Exchange Commission of Brazil (Comissão de Valores Mobiliários), or CVM, and, within 30 days from the date of such acquisition or event, commence a public tender offer, or the Public Takeover Tender Offer, with respect to all of our shares for a price per share that may not be less than the greater of: (i) 140% of the average trading price on the stock exchange trading the greatest volume of shares of our capital stock during the last 120 trading sessions prior to the date on which the public offer became obligatory; and (ii) 140% of the average trading price on the stock exchange trading the greatest volume of shares of our capital stock during the last 30 trading days prior to the date on which the public offer became obligatory. This provision is subject to limited exceptions. Particularly, our bylaws does not require the launch of a Public Takeover Tender Offer if the ownership of our shares by any given shareholder equals or exceeds the Equity Percentage Threshold upon the acquisition of shares as a result of either (a) statutory succession, to the extent the relevant shareholder sells the shares exceeding the Equity Percentage Threshold within 60 days, (b) merger of another legal entity into the Company, (c) merger of shares of another legal entity into the Company, or (d) the subscription of newly issued shares of the Company, in a single primary issuance approved by the Company’s general shareholders meeting, in accordance with the applicable regulations.
These provisions of our bylaws may delay, defer or prevent a transaction or a change in control that might otherwise be in the best interests of our shareholders.
We do not have a controlling shareholder or control group, which may make us susceptible to the emergence of shareholders with relevant stakes, alliances between shareholders, possible conflicts between shareholders and other events arising from the absence of a controlling shareholder or control group, and that may lead to changes in our corporate policies and strategies.
We currently do not have a controlling shareholder or control group. We are subject to the emergence of controlling shareholders, control groups or even shareholders with relevant stakes or agreements between our shareholders, which could subject us to a situation analogous to the existence of a control group.
If a shareholder or group of shareholders with relevant participation arises and exercises decision-making powers and prevails in general meetings, we may undergo changes in our corporate policies and strategies, including with respect to the composition of our management. For instance, our board of directors approved on February 22, 2022, a slate of our board of directors that will be submitted for election at our General Shareholders’ Meeting on March 28, 2022, or our 2022 General Shareholder’s Meeting. Only 2 out of the 10 members indicated on the slate proposal are already members of our board of directors. See “Item 6. Directors and Senior Management and Employees—A. Directors and Senior Management—Board of Directors Nominees” for further information regarding our board of directors nominees. Also, on March 24, 2022, we received from Caixa de Previdência dos Funcionários do Banco do Brasil – PREVI, which holds 6.13% of our capital stock, a request that a cumulative vote system be adopted for the election of members of our board of directors at our 2022 General Shareholders’ Meeting. As PREVI’s request for the adoption of a cumulative voting system met all legal requirements, the voting slate system originally approved by our board of directors will no longer be adopted, and the election of the members of our board of directors at our 2022 General Shareholders’ Meeting – including those previously nominated by our board of directors and other individuals that may be nominated by shareholders before or during such meeting – will be candidate-based (rather than slate-based). See “Item 10. Additional Information –– B. Memorandum and Articles of Association––Board of Directors.” for further information regarding our cumulative vote system. Any relevant change in the composition of our management, business policy or strategic direction, as well as any process of acquisition of control, or any dispute between shareholders regarding their respective rights, may change our business, strategy and results of operations.
For more information, see “—Provisions in our bylaws may prevent efforts by our shareholders to change our control or management.”
Holders of ADRs could be subject to Brazilian income tax on capital gains from sales of ADRs.
Historically, any capital gain realized on a sale or other disposition of ADRs between non-Brazilian holders outside Brazil was not subject to Brazilian income tax. However, a December 2003 Brazilian law (Law No. 10,833, of December 29, 2003) provides that the acquirer, individual or legal entity resident or domiciled in Brazil, or the acquirer’s attorney-in-fact, when such acquirer is resident or domiciled abroad, shall be responsible for the retention and payment of the income tax applicable to capital gains earned by the individual or legal entity resident or domiciled abroad who disposes of property located in Brazil. The Brazilian tax authorities have issued a normative instruction confirming their intention to assess income tax on capital gains earned by non-Brazilian residents whose assets are located in Brazil. It is unclear whether ADSs representing our common shares and evidenced by ADRs, which are issued by the ADR depositary outside Brazil, will be deemed to be property located in Brazil for purposes of this law. Accordingly, we cannot determine whether Brazilian tax authorities will attempt to tax any capital gains arising from the sale or other disposition of the ADRs, even when the transaction is consummated outside Brazil between non-Brazilian residents.
| 38 |
Brazilian taxes may apply to a gain realized by a non-Brazilian holder on the disposition of common shares to another non-Brazilian holder.
The gain realized by a non-Brazilian holder on the disposition of common shares to another non-Brazilian holder (other than a disposition of shares held pursuant to Resolution No. 4,373, as amended of the Brazilian National Monetary Council (Conselho Monetário Nacional), or CMN is generally viewed as being subject to taxation in Brazil. Pursuant to Article 26 of Law No. 10,833/03, Brazilian tax authorities may assess income tax on capital gains earned by non-Brazilian residents in transactions involving assets that are located in Brazil. In case of a non-Brazilian holder selling common shares on the Brazilian stock exchange, the withholding tax rate would be 0% (in the case of a non-Brazilian holder registered as such before Brazilian Central Bank, or Bacen, under the rules of the CMN, or Registered Holder, and not a resident of a tax haven, or Tax Haven Resident, 15% (in the case of a non-Brazilian holder that is not a Registered Holder and not a Tax Haven Resident), or 25% (in the case of a non-Brazilian holder that is a Tax Haven Resident).
Any other gains realized on the disposition of common shares that are not carried out on the Brazilian stock exchange:
| · | are subject to income tax at the following progressive rate when realized by any non-Brazilian holder that is not a Tax Haven Resident, whether or not such holder is a Registered Holder: |
| i. | 15% upon the portion of capital gains not exceeding R$5,000,000.00; |
| ii. | 17.5% upon the portion of capital gains that exceeds R$5,000,000.00 but not exceeding R$10,000,000.00; |
| iii. | 20% upon the portion of capital gains that exceeds R$10,000,000.00 but not exceeding R$30,000,000.00; and |
| iv. | 22.5% upon the portion of capital gains that exceeds R$30,000,000.00. |
| · | are subject to income tax at a rate of 25% when realized by an individual or legal entity that is a Tax Haven Resident, whether or not such holder is a Registered Holder. |
The relative volatility and limited liquidity of the Brazilian securities markets may negatively affect the liquidity and market price of our common shares and ADRs.
The Brazilian securities markets, including the B3 exchange, are substantially smaller, less liquid and more volatile than major securities markets in the United States. The Brazilian securities markets are also characterized by considerable share concentration.
The ten largest companies in terms of market capitalization represented approximately 42% of the aggregate market capitalization of the São Paulo Stock Exchange as of December 31, 2021. In addition, the ten most widely traded stocks in terms of trading volume accounted for approximately 32% of all shares traded on the São Paulo Stock Exchange as of December 31, 2021. These market characteristics may substantially limit the ability of holders of ADRs to sell common shares underlying ADSs evidenced by ADRs at a price and at a time when they wish to do so and, as a result, could negatively impact the market prices of these securities.
| 39 |
Developments and the perception of risks in other countries, especially emerging markets, may adversely affect the market price of our common shares and ADRs.
The market for securities issued by Brazilian companies is influenced, to varying degrees, by economic and market conditions in other emerging markets. Although economic conditions are different in each country, the reaction of investors to developments in one country may cause the capital markets in other countries to fluctuate. Developments or adverse economic conditions in other emerging markets have at times resulted in significant outflows of funds from, and declines in, the amount of foreign currency invested in Brazil. In addition, economic and political crises in Latin America or other emerging markets may significantly affect perceptions of the risk inherent in investing in the region, including Brazil.
The Brazilian economy, as well as the market for securities issued by Brazilian companies, is also affected, to varying degree, by international economic and market conditions generally, especially economic and market conditions in the United States. Share prices on the São Paulo Stock Exchange, for example, have historically been sensitive to fluctuations in U.S. interest rates as well as movements of the major U.S. stock indexes.
The COVID-19 pandemic added a new source of uncertainty to global economic activity and has resulted in significantly increased volatility in both Brazilian and international financial markets and economic indicators, including exchange rates, interest rates and credit spreads. For example, as a result of heightened volatility, the B3’s circuit breaker was triggered eight times in the month of March 2020. Any significant change in the global financial markets or the Brazilian economy may decrease the interest of investors in assets from Brazil and other countries in which we do business, including our common shares, which may adversely affect the trading price of our common shares and ADRs, or decrease liquidity of our common shares and ADRs generally in addition to hindering our access to the equity capital markets and to financing in the future on acceptable terms.
Additionally, governmental authorities around the world, including Brazil, have taken measures to try to contain the spread of COVID-19. Restrictions will likely remain in place, suppressing social and economic activity, if the contagion does not subside or is not addressed through vaccination efforts. It is uncertain how long it will take to vaccinate substantial portions of the world’s population as well as the Brazilian population, and delays in vaccination efforts may further increase risks relating to the COVID-19 pandemic. We are unable to estimate or quantify all economic and operational consequences of the COVID-19 pandemic, or the micro and macroeconomic effects this pandemic will continue to have on our business. The materialization of these risks has significantly affected global growth. Measures taken by governmental authorities worldwide, including Brazil, to stabilize markets and support economic growth may not be sufficient to control high volatility or to prevent serious and prolonged reductions in economic activity. In addition, the social distancing measures imposed by governmental authorities to contain the COVID-19 pandemic have resulted in a sharp drop or even a halt in certain activities and economic output. At this moment, there is no way to predict how long these measures will remain in force. These policies and measures have influenced the behavior of the consumer market and the population in general, the demand for services, products and credit.
Developments in other countries and securities markets could adversely affect the market prices of our common shares and ADRs and could also make it more difficult for us to access the capital markets and finance our operations in the future on acceptable terms or at all.
We may become a passive foreign investment company, which could result in adverse U.S. tax consequences to U.S. investors.
Based on our financial statements, relevant market and shareholder data, and the projected composition of our income and valuation of our assets, including goodwill, we do not believe that we were a passive foreign investment company, or PFIC, for U.S. federal income tax purposes for 2021, and we do not expect to be a PFIC for 2022, although we can provide no assurances in this regard. If we become a PFIC, U.S. holders of our common shares or ADRs may become subject to increased tax liabilities under U.S. tax laws and regulations and will become subject to burdensome reporting requirements. The determination of PFIC status is fact-specific and will depend on the composition of our income and assets from time to time, and a separate determination must be made each taxable year as to whether we are a PFIC (after the close of each such taxable year). Specifically, for any taxable year we will be classified as a PFIC for U.S. tax purposes if either (i) 75% or more of our gross income in that taxable year is passive income or (ii) the percentage of our assets (which includes cash) by value (determined on the basis of a quarterly average) in that taxable year which produce or are held for the production of passive income is at least 50%. The calculation of the value of our assets (including goodwill and certain intangible assets) will be based, in part, on the quarterly market value of our common shares and ADRs, which is subject to change. Accordingly, it is possible that we may become a PFIC for 2022 or future taxable years due to changes in our income or asset composition.
| 40 |
We may need to raise additional funds in the future and may issue additional common shares or convertible securities, which may result in a dilution of your interest in our common shares underlying the ADSs. In addition, a dilution of your interest in our common shares underlying the ADSs may occur in the event of our merger, consolidation or any other corporate transaction of similar effect in relation to companies that we may acquire in the future.
We may have to raise additional funds in the future through private or public offerings of shares or other securities convertible into shares issued by us. The funds we raise through the public distribution of shares or securities converted into shares may be obtained with the exclusion of right of first refusal of our existing shareholders, including investors in our common shares underlying the ADSs, as provided by the Brazilian Corporate Law, which may dilute the interest of our then-existing investors. In addition, a dilution of your interest in our common shares underlying the ADSs may occur in the event of merger, consolidation or any other corporate transaction of similar effect in relation to companies that we may acquire in the future.
Our shareholders may not receive dividends or interest on capital.
Pursuant to our bylaws, we must pay our shareholders at least 25% of our annual net income, calculated and adjusted in accordance with the Brazilian Corporate Law, in the form of dividends or interest on equity. Our net income may be capitalized, used to offset losses or retained in accordance with the Brazilian Corporate Law and, therefore, may not be fully available for the payment of dividends or interest on equity. In addition, the Brazilian Corporate Law allows a company not to make such mandatory distribution of dividends in a given fiscal year, if it is incompatible with its financial situation. For more information, see “Item 10. Additional Information––B. Memorandum and Articles of Association––Description of Share Capital”, “—Allocation of Net Income and Distribution of Dividends” and “—Payment of Dividends and Interest on Shareholders’ Equity”. In the last 4 fiscal years, we did not distribute dividends. Furthermore, based on our financial information as of December 31, 2021, our accumulated loss was R$2,132,230 thousand. We may only distribute dividends after offsetting the accumulated losses with operating profits or using reserves. In the event of such events, holders of our common shares may not receive dividends or interest on shareholders' equity.
Finally, the income tax exemption on the distribution of dividends and the taxation currently levied on the payment of interest on equity provided for in current legislation may be reviewed and both received and distributed dividends may become taxed and/or or, in the case of interest on equity, have its taxation increased in the future, impacting the net amount to be received by our shareholders as profit sharing.
If you surrender your ADSs and withdraw common shares, you risk losing the ability to remit foreign currency abroad and certain Brazilian tax advantages.
As an ADS holder, you benefit from the electronic certificate of foreign capital registration obtained by the custodian for our common shares underlying the ADSs in Brazil, permitting the custodian to convert dividends and other distributions with respect to our common shares into non-Brazilian currency and remit the proceeds abroad. If you surrender your ADSs and withdraw common shares, you will be entitled to continue to rely on the custodian's electronic certificate of foreign capital registration for only five business days from the date of withdrawal. Thereafter, upon the disposition of distributions relating to our common shares, unless you obtain your own electronic certificate of foreign capital registration, or you qualify under Brazilian foreign investment regulations that entitle certain foreign investors to buy and sell shares on Brazilian stock exchanges without obtaining separate electronic certificates of foreign capital registration, you would not be able to remit abroad non-Brazilian currency. In addition, if you do not qualify under the foreign investment regulations, you will generally be subject to less favorable tax treatment of dividends and distributions on, and the proceeds from any sale of, our common shares.
| 41 |
We and the depositary are entitled to amend the deposit agreement and to change the rights of ADS holders under the terms of such agreement, and we may terminate the deposit agreement, without the consent of the ADS holders.
We and the depositary are entitled to amend the deposit agreement and to change the rights of the ADS holders under the terms of such agreement, without the consent of the ADS holders. We and the depositary may agree to amend the deposit agreement in any way we decide is necessary or advantageous to us. Amendments may reflect, among other things, operational changes in the ADS program, legal developments affecting ADSs or changes in the terms of our business relationship with the depositary. In the event that the terms of an amendment are disadvantageous to ADS holders, ADS holders will only receive 30 days’ advance notice of the amendment, and no consent of the ADS holders is required under the deposit agreement. Furthermore, we may decide to terminate the ADS facility at any time for any reason. For example, terminations may occur when we decide to list our shares on a non-U.S. securities exchange and determine not to continue to sponsor an ADS facility or when we become the subject of a takeover or a going-private transaction. If the ADS facility is to be terminated, ADS holders will receive prior notice, but no consent is required from them. In the event that we decide to make an amendment to the deposit agreement that is disadvantageous to ADS holders or terminate the deposit agreement, the ADS holders may choose to sell their ADSs or surrender their ADSs and become direct holders of our underlying common shares, but will have no right to any compensation whatsoever.
ITEM 4. INFORMATION ON THE COMPANY
| A. | History and Development of the Company |
BRF S.A. is a publicly held company in Brazil and is therefore subject to the requirements of Brazilian Corporate Law and the rules and regulations of the CVM and the B3. Our commercial name is “BRF.”
We were founded as Perdigão by the Brandalise and Ponzoni families in 1934 as Ponzoni, Brandalise e Cia. in the southern State of Santa Catarina and remained under the Brandalise family’s management until September 1994. In 1940, we expanded our operations from general trading, with an emphasis on food and food-related products, to include pork processing. During the 1950s, we entered the poultry processing business. During the 1970s, we broadened the distribution of our products to include export markets, starting with Saudi Arabia. From 1980 through 1990, we expanded our export markets to include Japan in 1985 and Europe in 1990. We also undertook a series of acquisitions in the poultry and pork processing business and made investments in other businesses.
From 1990 through 1993, we suffered substantial losses because of increased financial expenses, underinvestment in product development, limited capacity and modest marketing of our products. By September 1994, we faced a liquidity crisis, as a result of which the Brandalise family sold their interest in our company, consisting of 80.68% of our common shares and 65.54% of our preferred shares, to eight Brazilian pension funds. Upon acquiring control of our company, the eight original pension funds hired a new team of executive officers who restructured management and implemented capital increases and modernization programs.
Our principal executive offices are located at Av. das Nações Unidas, 8501 – 1st Floor, Pinheiros, 05425-070, São Paulo, SP, Brazil, and our telephone number at this address is +55-11-2322-5000/5355/5048. The U.S. Securities and Exchange Commission (the “SEC”) maintains a website (http://www.sec.gov) that contains reports, proxy and information statements and other information regarding registrants, such as us, that file electronically with the SEC. Our internet address is https://www.brf-global.com/. On occasion, we may use our website as a channel of distribution of material company information. Financial and other material information regarding us is routinely posted on and accessible at https://ri.brf-global.com. The information posted on our website or that could be accessed through our website is not an integral part of, or attached to or incorporated by reference into, this annual report.
| 42 |
Business combination with Sadia
On May 19, 2009, we signed a merger agreement with Sadia for a business combination of Sadia S.A. and Perdigão S.A. The business combination became fully effective on September 22, 2009, and Sadia became our wholly owned subsidiary. On December 31, 2012, we merged Sadia S.A., then a wholly owned subsidiary, into BRF, and Sadia ceased to exist as a separate legal entity. In connection with the business combination, we changed our name from Perdigão S.A. to BRF – Brasil Foods S.A. On April 9, 2013, we changed our name from BRF – Brasil Foods S.A. to our current name, BRF S.A.
Corporate Reorganization of One Foods
On January 11, 2017, we established a new wholly owned subsidiary, One Foods Holdings Limited, based in Dubai International Financial Centre, which is focused on Halal markets. The formation of this subsidiary involved a restructuring of certain of our operations in Malaysia and some countries in the Middle East and Africa, including (i) the sale and purchase agreement pursuant to which One Foods acquired equity interests in entities that serve the Halal market from BRF GmbH, a BRF wholly-owned subsidiary, and (ii) the contribution of the equity interest in SHB Indústria e Comércio de Alimentos S.A. (“SHB”) to One Foods. SHB held grain storage facilities, feed mills, outgrower agreements, hatcheries and eight slaughtering and processing plants in Brazil. In addition, we entered into certain agreements with One Foods that provided for the licensing of certain brands, operational and corporate activities, cost sharing and supply of raw materials and finished goods.
On September 1, 2018, we executed a Share Sale and Purchase Agreement with two of our subsidiaries, BRF Foods GmbH and One Foods Holding Ltd., to acquire all common shares of SHB. On December 12, 2018 at our extraordinary shareholders meeting, the merger of SHB with and into BRF was approved. The merger took effect on December 31, 2018, following its approval at the extraordinary shareholders meeting of SHB.
Investment into TBQ and Acquisition of Banvit – Turkey
On May 25, 2017, our subsidiary TBQ Foods GmbH, or TBQ, a joint venture formed by us (60% equity interest) with the Qatar Investment Authority, or QIA, (40% equity interest) in May 2017, completed a transaction for the acquisition of 79.48% of the shares issued by Banvit Bandirma Vitaminli Yem Sanayi Anonim Şirketi, or Banvit, which is the largest poultry producer in Turkey, has fully integrated operations and owns one of the most recognized brands in Turkey. Through a subsequent tender offer process completed on August 17, 2017, TBQ’s ownership of Banvit increased to 91.71%. The total value of the transaction (including the purchase price paid in connection with the tender offer) was R$1,277 million. As of the date of this annual report, TBQ continues to hold 91.71% of Banvit’s equity interest. On November 30, 2021, we began negotiations with QIA for the renewal of certain terms and conditions with respect to our TBQ partnership. Within the context of these negotiations, we and QIA executed a term sheet extending the exercise period of QIA’s put option that would grant QIA with rights to sell its interest in TBQ to us. On December 13, 2021, we executed an amendment to TBQ’s joint venture and shareholders’ agreement providing for new terms and conditions for our partnership in TBQ while terminating the put option then available to QIA and granting further alternatives to liquidate its investment in Banvit.
Sale of Quickfood
On December 7, 2018, we executed a Share Sale and Purchase Agreement with Marfrig Global Foods S.A., or Marfrig, for the sale of our total ownership interest in Quickfood (which constituted 91.89% of the capital stock of Quickfood). Quickfood was our subsidiary in Argentina and operated three beef slaughtering plants with a capacity of 620 heads per day and a processing capacity of approximately 6,000 metric tons per month of hamburgers, franks, cold products and frozen vegetables. The transaction closed on January 2, 2019, for an amount equivalent to R$191,291 thousand (US$49,937 thousand, translated to reais at the exchange rate of R$3.8306 as of January 2, 2019). On December 21, 2021, we executed a settlement agreement with Marfrig, whereby Marfrig, upon the payment of R$48,678 thousand (US$8,958 thousand, translated to reais at the average exchange rate of R$5.4341 as defined in the agreement) by us (“Global Indemnification Amount”), discharged us from any indemnification obligations in connection with the sale of Quickfood, except if such obligations derive from any direct or indirect claims related to Avex S.A. and Campo Austral S.A. R$3,678 thousand (US$650 thousand, translated at the exchange rate of R$5.6591 as of December 24, 2021) of the Global Indemnification Amount was paid in cash by us and the remaining amount was paid by offsetting this amount against the purchase price payable by Marfrig to us for the December 21, 2021 sale of the remainder Varzea Grande properties to Marfrig, as described immediately below.
| 43 |
Sale of Várzea Grande Plant
On December 7, 2018, we executed an agreement with Marfrig for the consideration of R$100 million in both real estate assets and equipment from our plant located in Várzea Grande in the State of Mato Grosso, which produces, among other items, hamburgers, meatballs and kibbehs (a type of Middle Eastern beef patty popular in Brazil). This transaction closed on January 23, 2019 and, on April 1, 2019, a Supply Agreement with Marfrig became effective, under which Marfrig agreed to provide us with finished goods produced in the Várzea Grande plant, such as hamburgers, meatballs, kibbehs, chicken meat and processed chicken breast products for 60 months. On December 21, 2021, we executed another agreement with Marfrig for the sale in the amount of R$45,000 thousand of the remaining real estate properties located in the city of Várzea Grande, all of which neighbor the plant that was sold to Marfrig in December 2018. These real estate properties are non-operational.
Sale of Avex
On December 19, 2018, we entered into a Share Sale and Purchase Agreement whereby we agreed to sell all of the issued and outstanding shares of our Argentinian subsidiary, Avex S.A., to Granja Tres Arroyos S.A. and Fribel S.A. Avex S.A. operates three facilities located in Llavalol, Villa Mercedes and Rio Cuarto, in Argentina, for the production of poultry and margarine. This transaction closed on February 4, 2019, for an amount equivalent to R$169,726 thousand (US$44,824 thousand, translated to reais at the exchange rate of R$3.7865 as of February 4, 2019). In 2021, the parties determined a price adjustment related to the sale of Avex S.A., reducing the price paid in the amount equivalent to R$33,727 thousand.
Sale of Assets in Europe and Thailand
On February 7, 2019, we agreed to sell to Tyson International Holding Co. most of our subsidiaries in Europe, including our Wrexham (UK) and Oosterwolde (Netherlands) processing plants, and our food processing and poultry slaughtering operation in Thailand. This transaction closed on June 3, 2019, for an amount equivalent to R$1,488,033 thousand (US$382,106 thousand, translated to reais at the exchange rate of R$3.8943 as of June 3, 2019).
Other Transactions
On December 18, 2018, we created a Brazilian receivables investment fund (“FIDC”) to acquire trade receivables of commercial transactions entered into by us and our customers in Brazil. The fund has three distinct classes of quotas and may reach an aggregate total volume of R$875 million.
On January 10, 2019, we executed an Asset Sale and Purchase Agreement with BOGS S.A. for the sale of its facility located in the city of Florencio Varela, Argentina, and all assets and liabilities related to it, including the brands “Bocatti” and “Calchaquí”. The transaction closed on February 28, 2019, for an amount equivalent to R$95,036 thousand (US$26,753 thousand, translated to reais at the exchange rate of R$3.5523 as of February 28, 2019).
On January 10, 2019, we executed a Share Sale and Purchase Agreement with La Piamontesa de Averaldo Giacosa y Compañía S.A. for the sale of all of the capital stock of our Argentine subsidiary, Campo Austral S.A., including its facilities in San Andrés de Giles and Pilar and the brand “Campo Austral.” The transaction closed on March 11, 2019 for an amount equivalent to R$29,359 thousand (US$7,619 thousand, translated to reais at the exchange rate of R$3.8534 as of March 11, 2019). In 2021, the parties completed the price adjustment process, reducing the price paid in the amount equivalent to R$25,617 thousand.
On August 20, 2019, our wholly-owned subsidiary Badi Limited executed a Share Purchase Agreement with Al Takamul International Company for Commercial Investment Limited for the purchase of the remaining 25% of the capital stock that it did not own in Al Wafi Al Takamul International Company for Food Products Limited (“Wafi”), a company incorporated in the Kingdom of Saudi Arabia responsible for distributing our products in that country. The transaction closed on April 21, 2020 for an amount equivalent to R$100,390 thousand (US$19,000 thousand, translated to reais at the exchange rate of R$5.2837 as of April 20, 2020), at which point Wafi became a wholly owned subsidiary of Badi Limited.
| 44 |
On September 5, 2019, we executed a Share Sale and Purchase Agreement with Sats Food Services Pte Ltd, providing for the terms and conditions for the sale of our interest in Singaporean food company Sats BRF Food Pte Ltd., equivalent to 49% of its capital stock. The transaction was concluded on September 5, 2019, for an amount equivalent to R$51,197 thousand (SGD17,000 thousand, translated to reais at the exchange rate of R$3.0116 as of September 30, 2019) and also encompassed the execution of a new contract for the distribution and licensing of brands owned by us.
On May 7, 2020, our indirect wholly owned subsidiary Badi Limited executed a Share Purchase Agreement with Hungry Bunny Limited and others, setting forth the terms and conditions for the acquisition of 100% of the capital stock of Joody Al Sharqiya Food Production Factory, a food processing company in Dammam, Saudi Arabia. The transaction was closed on January 18, 2021, and the initial fair value of the consideration transferred was equivalent to R$41,620 thousand (SAR29,793 thousand, translated to reais at the exchange rate of R$1.3967 as of January 18, 2021) paid in cash, and from this date, Joody Al has become a wholly-owned subsidiary of Badi. The consideration paid may be adjusted according to certain conditions established in the purchase agreement.
On June 24, 2020, our indirect wholly owned subsidiary BRF Foods GmbH agreed to sell 70% of the outstanding shares of FFM Further Processing Sdn. Bhd., a company incorporated in Malaysia and owner of a food processing plant in that country, to FFM Berhad, which previously held the remaining 30% of those shares. The transaction was concluded on the same date and BRF Foods GmbH received the purchase price equivalent to R$38,546 thousand (US$7,350 thousand translated to reais at the exchange rate of R$5.2444 as of June 24, 2020).
On December 17, 2020, Nutrinvestment BV and Banvit, companies indirectly controlled by us, executed a Sale and Purchase Agreement with Aaylex System Group S.A. that provides for the sale to Aaylex System Group S.A. of 100% of the shares that the companies hold in Banvit Foods SRL, a company which produces animal feed and manages an egg hatchery in Romania. The transaction closed on May 4, 2021, for an amount equivalent to R$132,425 thousand (EUR 20,300 thousand translated to reais at the exchange rate of R$6.5234 as of May 4, 2021). In June 2021, the parties established a price adjustment due to net debt and working capital changes, increasing the purchase price by an amount equivalent to R$13,059 thousand (EUR2,157 thousand translated to reais at the average exchange rate of R$6.0542 as of June 2021).
On March 9, 2021, we acquired the remaining minority stake in Al Yasra Food K.S.C.C., or BRF AFC, located in Kuwait, through our wholly-owned subsidiary One Foods Holdings Ltd., representing 25% of BRF AFC’s capital stock, for the amount equivalent to R$238,421 thousand (US$40,828 thousand translated to reais at the exchange rate of R$5.8391 as of March 9, 2021). Following that acquisition, BRF AFC became our wholly-owned subsidiary.
On March 25, 2021, our board of directors approved the liquidation of OneFoods Malaysia Sdn Bhd in Kuala Lumpur, Malaysia and the merger of BRF Austria GmbH into BRF GmbH.
In a step toward our plan to become one of the largest and most significant players in the Brazilian pet food market by 2025, on June 18, 2021, our subsidiary BRF Pet S.A., or BRF Pet, entered into an agreement to acquire 100% of the capital stock of the companies dedicated to the development, production and distribution of dry and wet food for dogs and cats that compose the Hercosul Group, or Hercosul, which acquisition closed on August 2, 2021. Upon the closing of the transaction, BRF Pet became owner of 100% of Gewinner Participações Ltda. and 99% of Hercosul International S.R.L. and BRF S.A. became owner of 1% of Hercosul International S.R.L. The fair value of the consideration transferred was of R$812,921 thousand, of which R$675,355 thousand was paid in cash, R$119,180 thousand will be paid in the next four years and R$18,386 thousand refers to contingent consideration (as defined in note 1.2.2 to our consolidated financial statements). According to the conditions established in the purchase and sale agreement, which are common to transactions of this nature, the value of the consideration may be adjusted based on the net debt and working capital of Hercosul.
| 45 |
In addition, on June 25, 2021, BRF Pet entered into an agreement to acquire 100% of Paraguassu Participações S.A. and Affinity Petcare Brasil Participações Ltda., the holders of 100% of the capital stock of Mogiana Alimentos S.A., or Mogiana Alimentos, which specializes in animal nutrition products for dogs and cats. The Mogiana Alimentos transaction closed on September 1, 2021. From this date, Paraguassu and Affinity became wholly-owned subsidiaries of BRF Pet. The fair value of the consideration transferred was of R$481,435 thousand of which R$290,225 thousand was paid in cash, R$145,548 thousand will be paid in the next six years and R$45,662 thousand refers to contingent consideration (as defined in note 1.2.3 to our consolidated financial statements). In addition, R$60,000 thousand of the from the term value will be deposited in an escrow account after the first anniversary of the acquisition, as a guarantee for BRF Pet in case of eventual indemnities provided for in the purchase and sale agreement. According to conditions established in this agreement, which are common to transactions of this nature, the value of the consideration may be adjusted based on the net debt and working capital changes as well as on the contingent assets of Mogiana Alimentos.
In March 2021, we executed a memorandum of understanding with Aleph Farms, Ltd, or Aleph, an Israeli start-up company that develops laboratory proteins from animal cells. The agreement contemplates: (i) the development and production of cultivated meats using the patented production of Aleph (BioFarm™); and (ii) the distribution of cultivated proteins from Aleph, with exclusivity, in Brazil. On July 7, 2021, we participated in the round of investments (Series B) promoted by Aleph, in the amount equivalent to R$13,600 thousand (US$2,437 thousand, translated to reais at the exchange rate of R$5.5805 as of December 31, 2021), of which the equivalent to R$6,797 thousand (US$1,218 thousand, translated to reais at the exchange rate of R$5.5805 as of December 31, 2021) was paid in cash in 2021 and the remainder will be paid in 2022. In connection with this investment and the capital allocated by other investors, the funds will be destined to the large-scale global marketing of products made from cultivated meat, as well as expansion of Aleph’s portfolio. In connection with our Vision 2030 Plan, which includes growing in the “meat substitutes” segment, the investment in Aleph is the first one made in the form of venture capital by us and marks our participation in a pioneering sustainable initiative in the global food chain. With this move, we advance in our plan to meet the growing consumer demand for new and alternative sources of protein, bringing innovative technologies to Brazil, in line with its commitments to sustainability, innovation and food safety.
In line with our long-term sustainability goals, on August 16, 2021, we executed an agreement with a subsidiary of AES Brasil Energia S.A. to form a joint venture for the construction of a self-generated wind energy farm complex in Cajuína, State of Rio Grande do Norte, Brazil, with an installed capacity of 160 Megawatts mechanical, or MWm, half of which would be sold to us in accordance with a 15-year power purchase agreement (“AES Energy Project”). The transaction closed on March 14, 2022. The estimated investment is approximately R$5.4 million per MW installed, and we will directly invest approximately R$92,000 thousand over the course of the development of the AES Energy Project. The energy farm complex is expected to become fully operational by 2024.
In addition, on September 16, 2021, we executed a power purchase agreement and a call option agreement with Intrepid Participações S.A. (“Intrepid”) to form a joint venture for the construction of a self-generated solar energy plant in Mauriti and Milagres, State of Ceará, Brazil, with an installed capacity of 320MWp (megawatt-peak), on average half of which would be sold to us, in accordance with a 15-year power purchase agreement. The estimated investment is approximately R$1.1 billion (R$3.7 million/MWp installed), and we will directly invest approximately R$50,000 thousand over the course of the development of the project. The solar energy plant is expected to be fully operational by 2024. The closing of the call option agreement is subject to the satisfaction of certain customary closing conditions.
In December 2021, BRF Foods GmbH and One Foods Holdings Ltd., our indirect wholly owned subsidiaries, signed an amendment to the shareholders' agreement and joint venture with Qatar Holding LLC, a wholly owned subsidiary of Qatar Investment Authority, through which they agreed to the termination of the put option held by the Qatar Investment Authority provided for in such instrument.
Also, on January 13, 2022, we announced to the market that we entered into a non-binding memorandum of understanding, or MOU, wih the Public Investment Fund, or PIF, Saudi Arabia’s sovereign wealth fund and one of the world’s largest sovereign wealth funds. The MOU aims at the incorporation of a joint venture that will act in the complete chain of chicken production in Saudi Arabia and promote the sale of fresh, frozen and processed products. The joint venture will be 70% owned by us and 30% by PIF and will include a Halal Business Hub in Saudi Arabia. The MOU foresees an investment of approximately US$350 million and reinforces the commitment we have with our strategic plan, in particular with food security in the Gulf region. This transaction is subject to the results of the negotiations of definitive agreements. We cannot assure you that we and PIF will reach satisfactory terms for the execution of final agreements.
| 46 |
On January 18, 2022, we announced the launch of our equity follow-on offering, which closed on February 4, 2022. Pursuant to the equity follow-on offering, we offered 270,000,000 of our common shares in a global offering consisting of (i) an international offering of common shares, including common shares represented by ADSs, outside Brazil and (ii) a concurrent restricted public offering of common shares in Brazil. The international offering included a registered offering in the United States. As a result of this equity follow-on offering, we received net proceeds of approximately R$5,311,440 thousand before expenses and after deducting underwriting commissions.
Recent Significant changes in our Major Shareholders
Between May and June 2021, Marfrig and its affiliates acquired the beneficial ownership of a significant percentage of our common shares and ADSs. Pursuant to a Schedule 13D filed by Marfrig with the SEC on March 1, 2022, Marfrig beneficially owns in the aggregate 359,933,582 of our common shares, representing 33.25% of our outstanding common shares.
Capital Expenditures
The table below sets forth our capital expenditures with respect to operations for the periods indicated:
|
For the year ended December 31, | |||
|
2021 |
2020 |
2019 | |
| (in thousands of reais) | |||
| Property, plant and equipment | 1,555,426 | 804,609 | 417,165 |
| Biological assets | 1,239,746 | 1,006,222 | 837,930 |
| Intangible assets | 179,632 | 96,181 | 64,320 |
| Total capital expenditures | 2,974,804 | 1,907,012 | 1,319,415 |
In 2021, we focused on pursuing our commitment to maximizing the use of our assets by making investments to help eliminate production constraints and increase overall efficiency. Moving forward, we expect to increase investments to expand our operations in the markets we serve and take advantage of new commercial opportunities.
In 2020, we resumed our investment trajectory in growth and innovation projects, in addition to maintaining investments related to compliance with standardization and quality standards of our products.
In 2019, investments were made a priority to meet the regulation and adaptation of our asset base to safety and quality principles in line with our organizational culture.
Key investments, including portfolio strategy segments, such as the acquisition of Brazilian pet food brands, Mogiana Alimentos and Hercosul Group, were made as part of our 2030 Vision Plan. With such new names combined with our existing portfolio and sales channel, we expect to increase our share of the Brazilian pet food market, strengthen our business platform and continue to grow until we achieve our long-term goals in the industry with competitive advantages in cost and quality. Within this context, prior to these acquisitions, we were already present in the Brazilian pet food market with premium brands, such as Balance and the Güd.
Our continued efforts in innovation, efficiency and high value-added industrialized products have led to the inauguration of our Seropédica plant, in the State of Rio de Janeiro, which was built upon the concept of Industry 4.0 (automation and data exchange in manufacturing). Additionally, we have expanded internationally with strategic investments in Turkey and Saudi Arabia in order to enhance our footprint in the region. See “Item 4. Information on the Company— A. History and Development of the Company—Investment into TBQ and Acquisition of Banvit – Turkey” and “Item 4. Information on the Company—A. History and Development of the Company—Other Transactions.”
| 47 |
| B. | Business Overview |
BRF S.A. is one of the largest producers of fresh and frozen protein foods in the world in terms of production capacity, according to WattAgNet, with a portfolio of approximately 7,500 stock keeping units (“SKUs”), as of December 31, 2021. We are committed to operating our business and delivering products to our global customer base in line with our core values: quality, safety and integrity. Our processed products include marinated and frozen chicken, Chester® rooster and turkey meats, specialty meats, frozen processed meats, frozen prepared entrees, portioned products and sliced products. We also sell margarine, butter, cream cheese, sweet specialties, sandwiches, plant-based products, animal feed and pet food. We are the holder of brands such as Sadia, Perdigão, Qualy, Perdix, Confidence and Hilal. For the year ended December 31, 2021, we were responsible for 9% of the world’s poultry trade, according to USDA.
Our portfolio strategy is focused on creating new, convenient, practical and healthy products for our consumers based on their preferences. We seek to achieve that goal through strong innovation to provide us with increasing value-added items that will differentiate us from our competitors and strengthen our brands.
With 38 industrial facilities in Brazil, as of December 31, 2021, we have among our main assets a distribution network that enables our products to reach Brazilian consumers through more than 534,500 average monthly deliveries and 28 distribution centers in the domestic market.
We have been a public company since 1980. Our shares have been listed on the Novo Mercado of the São Paulo Stock Exchange as BRFS3 since 2006, and ADRs representing our common shares are traded on the New York Stock Exchange, or “NYSE” (ADR level III).
A breakdown of our products is as follows, which are sold both in Brazil and to our international customers:
| · | Meat Products, consisting of in natura meat, which we define as frozen whole chicken and cut chicken, as well as frozen pork; |
| · | Processed Food Products, including the following: |
| o | marinated, frozen, whole chicken and cut chicken, roosters (sold under the Chester® brand) and turkey; |
| o | specialty meats, such as sausages, ham products, bologna, frankfurters, salami, bacon and other smoked products; and |
| o | frozen processed meats, such as hamburgers, steaks, breaded meat products, kibbeh and meatballs; |
| · | Other Processed Products including the following: |
| o | Halal products for Islamic markets in accordance with the Halal method of animal slaughtering; |
| o | margarine, butter, cream cheese and cheese bread; |
| o | frozen prepared entrees, such as lasagna, macaroni and cheese, pies, ready-to-eat meals and pizzas, as well as other frozen foods; |
| 48 |
| o | plant-based products, such as nuggets, pies, vegetables and burgers; and |
| o | snacks (salamitos); |
| o | frozen desserts; |
| · | Other, consisting of soy meal, refined soy flour, animal feed and pet food. |
In Brazil, as of December 31, 2021, we operated 35 meat processing plants, three margarine processing plants, three pasta processing plants, three feed meal plants, one commercial feed meal plant, one dessert processing plant and three soybean crushing plants. All of these industrial facilities are located near our raw material suppliers or main consumer centers. We have an advanced logistics system in our domestic market, with 28 distribution centers, six of which are owned by us and 22 of which are leased from third parties, all of which serve supermarkets, retail stores, wholesale stores, restaurants and other clients.
In our international market, as of December 31, 2021, we operated six industrial facilities for meat processing. Additionally, after giving effect to the divestitures made in connection with our financial and operational restructuring plan, we operate 26 distribution centers and 11 warehouses located in Asia, the Southern Cone and the Middle East, as well as commercial offices on four continents.
We are also focused on addressing the impact of climate change on the environment and our business. Among the initiatives that we have taken to reduce our exposure to climate change and to maintain our competitiveness in terms of costs is the monitoring of grain stocks and purchases and the constant monitoring of the weather in agricultural regions to guide our purchasing decisions, as well as anticipating price movements in the commodity markets. Other initiatives include technological innovations in our animal-raising facilities to improve efficiency and safeguard animal welfare. In addition, we recognize that consumers, investors and other stakeholders are more conscious of social and environmental aspects of the production chain. The commitment assumed by us to achieve Net Zero by 2040, established in 2021, was an important step in the climate agenda. We have taken initiatives to address this aspect, such as the Sustainable Grain Purchase Policy, which establishes guidelines with regard to commitments and principles to be applied in the business, with a focus on incorporating environmental, social and sustainable practices to manage BRF's production chain and investments in clean energy in partnerships formed in 2021 with AES Brasil Energia and Ïntrepid Participações S.A., with which it will be possible to reach almost 90% of electricity from clean sources in BRF's operations in Brazil. From 2014 until 2021, we allocated R$1,258.2 million (€360.1 million) to projects with environmental benefits (the amount referring to the investments made in 2021 is still subject to a second opinion from an external certifier, which may result in an adjustment of this amount), and we planted a renewable forest covering 30 thousand hectares.
A Fully Integrated Platform
We are a fully integrated food platform present in all stages of the complex value chain in which we operate, involving a number of partners selected based on sustainable criteria as well as our integrated farmers and outgrowers, production facilities, distribution centers, and omnichannel sales. Our robust operations include approximately 100,000 employees, 9,904 integrated farmers, 44 production facilities across the Americas, Africa, Asia, and the Middle East, 54 logistics centers, 127 countries, and sales channels that varies between traditional retail and other innovative omnichannel formats, such as Mercato em Casa, Mercato Sadia, online marketplaces and store-within-a-store concept.
Efficiency and Cost Control
We believe that we encourage a culture of excellence and for that reason we seek to constantly challenge ourselves to ensure operational efficiency using our programs and action plans. We seek to minimize our losses and improve our procurement and industrial process in order to consistently deliver profitability.
Such pursuit for high-precision cost control culture is increasingly important in order to navigate periods of exacerbated cost pressure and ensure profitability throughout the cycle. As an example, according to CEPEA/ESALQ, corn and soybean prices, which have a direct impact in our cost of goods sold, have increased over 100% in the last 2 years in Brazil, on average, an unprecedented variation for the sector, while we managed in the same period to keep operating at margins considered adequate according to our evaluation.
| 49 |
An important tool to perpetuate our pursuit for excellence is what we call “SEO” – Sistema de Excelência Operacional (Operational Excellence System). The SEO intends to improve productivity and reduce costs worldwide as it is replicable in several geographies and ties into our digital processes by monitoring crops and estimating timing for potential price increases. As of December 31, 2021, with the support of our SEO, we have been able to reduce our losses in the production process by 66%, increase productivity by 3%, loading time of finished products in factories by 46% and accidents by 38%, in relation to the same period in 2018. We believe that the information provided by the SEO combined with our expanding grain storage capacity provide opportunities to have greater inventory during times of higher prices, which promotes a smaller margin decrease that would be expected from more expensive raw material.
As a result, from the year ended December 31, 2018 to the year ended December 31, 2021, we have improved our profitability, which can be measured by the increase of R$3,216,121 thousand in our income (loss) before financial results and income taxes. In this period, the accumulated evolution of the industry’s main cost indexes was 59% (considering the evolution of the price of corn, soybean meal, main plastics for rigid and flexible packaging, variation of inflation indexes, IPCA, IGP-FGV, diesel (ANP) and U.S.$) while ours increased by only 45%. Efficiency is an important part of our business and we intend to continuously put our efforts in finding new ways to improve our processes across more than 127 countries that are covered by our sales channels.
House of Strong Brands
In 2021, BRF has reached 87 years of operations in the consumer food industry. We have decades of accumulated experience on consumer trends and behavior, providing us the knowledge to operate in the global food market. We seek to offer increasingly practical high added-value products within a strong portfolio of brands aiming to offer quality food in a way that improves people’s life, delivering products from farm to table. We believe that such expertise has contributed to the development of our brands in the Brazilian and international markets, reaching millions of households with Sadia, Qualy and Perdigão in Brazil and Sadia Halal and Banvit across the globe.
We believe our brands have contributed to the improvement of our results in 2021 due to increased awareness, which translated to approximately 300 thousand active clients purchasing BRF brands in Brazil during the three-month period from October to December 2021. We calculate active clients as the number of clients who purchased our products (directly or indirectly, through distributors) at least once during the last three months as of any given reference date. Such awareness contributed to promoting Sadia as the most valuable food brand in Brazil in 2020, according to Kantar BrandZ, while also increasing net sales by 22.5%in the year ended December 31, 2021, compared to the year ended December 31, 2020.
There has also been a strategic improvement in our portfolio, which now comprises a variety of high added-value products, including new categories, boosted by improved consumer experience, healthy options and an omnichannel approach. Brazil has played a key role as these products now represent over 84.6% of our portfolio in Brazil. Also, 7% of the total revenue in Brazil come from innovations (products launched in the last 24 months), as of December 31, 2021. As for our international segments, such as Halal, Asia, and Direct Sales, the high added-value products have still plenty of room for growth with 20% of revenues coming from these products.
Additionally, we believe the improvement in innovation during 2021 was in part due to our robust and seasoned management team, which sought to create clear guidelines to promote flexibility in order to allow for quick decision-making throughout our organizational structure.
| 50 |
Omnichannel Strategy
We aim to continuously improve our collaborations with brick-and-mortar and digital initiatives, while advancing with our marketplace, bringing custom-made solutions to improve our level of service. By understanding our customers even more and exceeding their expectations, we intend to provide the best experience with our products, services and brands. As an example of such initiatives for greater proximity with customers, we opened a concept store (the Mercato Sadia) with digital solutions and a completely integrated online brand.
Ultimately, we aim for the consumer to be the central point of our sales strategy not only by being provided with added-value products, but also by having a stronger direct-to-consumer relationship through our own channels, whether digital or physical. In addition to Mercato Sadia and Mercato em Casa, we expect our partnerships with online marketplaces to play a key role in leveraging their current number of customers into having exposure to the BRF brands. Ongoing partnerships include iFood, Rappi, Magalu, Bees and others.
Additionally, our store-within-a-store concept holds more than 40 partnering stores in large retail chains in Brazil, which is complementary to our e-commerce that already serves the majority of the national metropolitan areas.
Environmental, Social and Governance (ESG) – Sustainability in Everything We Do
Our intention to offer quality food in a way that improves people’s lives is connected to our commitment to society and the planet. We expect our growth in the coming years to be aligned with a positive change in sustainability. One of our principles is to ensure the sustainable growth of our chain and we expect our efforts toward sustainability to be stronger by 2030.
According to an IBM Research involving 19,000 people in 28 countries released in early 2020, 57% of consumers were willing to change their purchasing habits to reduce negative environmental impact, and 71% were willing to pay an additional premium for companies offering full transparency and traceability. Therefore, adopting policies and guidelines for sustainable practices can be essential for the growth in the long run.
We expect that by 2024 approximately 90% of our energy requirement in Brazil will be supplied by clean and renewable sources (wind and solar). Additionally, in partnership with Banco do Brasil, we have committed to provide solar energy and panels to integrated farmers with whom we trade, representing an expected investment of more than R$200 million. We are confident that our producers and partners will remain devoted to this project, and together with Banco do Brasil, we expect to build solar farms to meet our own demand, as well as to ensure that in the long-term we will have 100% of our energy requirement supplied by renewable sources. For instance, in August and September 2021, we entered into certain agreements for the implementation of clean energy projects, including a joint venture for the construction of a self-generated wind energy farm complex and a power purchase agreement with an option to form a joint venture for the construction of a self-generated solar energy plant.
| 51 |
As to social aspects, we seek to maintain an open dialogue with society, and expect to keep developing the communities where we operate and encouraging innovation and knowledge. We value education and inclusion, and we expect to invest at least R$400 million in social initiatives by 2030, contributing to the development of communities where we operate. We have also donated approximately R$100 million to communities where we operate in Brazil and abroad to combat the COVID-19 pandemic.
With respect to governance practices, we seek to maintain a clear link between ESG targets and our variable compensation programs, especially for the senior executives that are driving our long-term strategy. New policies are already in place to ensure that we comply with human rights, sustainability and the sustainable purchase of grains moving forward. Such is our commitment with governance that we have already been awarded with the Transparency Award for our Integrated Report, IIA and ISO 37,001 certifications.
From 2019 to 2021, we have invested in actions that reinforce the respect to the environment throughout the production chain. We are a signatory of the Global Pact of U.N. and are also listed in B3 in the corporate sustainability index (ISE), being the only food company in the food sector in Brazil that is included in this index.
Aiming to increase our transparency, we have established global commitments to ESG aspects, related to BRF's Vision for 2030, in harmony with the world’s largest corporate sustainability initiative (UN Global Compact), of the size BRF wants to be. Such commitments are highlighted below:
Animal Welfare
| o | Certify by third-party audits 100% of the plants in Animal Welfare by 2025.1 |
| o | Only use cage-free chicken eggs in the industrial food process globally by 2025. |
| o | Ensure that no antibiotics growth promoter is used in the livestock chain. |
| o | Ensure that 100% of the poultry in the integration system are cage-free globally by 2023. |
| o | BRF is strictly committed to zero tolerance to animal mistreatment, whether through abuse or neglect. |
| o | Use environmental enrichment in 100% of the integration of poultry by 2025. |
Science and Innovation
| o | 100% adherence of new product innovation projects to BRF´s sustainability indicator by 2022. |
Commodities
| o | Ensure 100% traceability of grain acquired from the Brazilian Amazon and the Brazilian Cerrado by 2025.2 |
1 Respecting the religious and/or cultural requirements demanded by our customers.
2 ESG targets linked to our variable compensation system (includes bonus-eligible and executives in accordance with the collective bargaining agreement in effect on the payment date).
| 52 |
Communities
| o | Invest R$400 million in communities by 2030.3 |
Food Waste
| o | Promote education to reduce food waste to 1.5 million people globally by 2030. |
Diversity
| o | Achieve 30% of women in top leadership by 2025. We joined the Equity is Priority movement, which is part of the UN Brazil Global Compact Network that reinforces this commitment. |
| o | The public sector´s commitment to combat racism. |
Packaging
| o | Have 100% recyclable, reusable or biodegradable packaging by 2025. |
Greenhouse Gases
| o | Implement a carbon neutral product line by 2021. |
| o | Net Zero by 2040. |
Natural Resources
| o | Increase electricity from clean sources by 50% by 2030. |
| o | Reduce BRF´s water consumption indicator by 13% by 2025. |
Our Industry
We manage our business to target both the Brazilian market and export markets.
Brazilian Market
As a Brazilian company, with a significant portion of our operations in Brazil, we are acutely affected by local economic conditions. Because of our significant operations in Brazil, fluctuations in Brazilian demand for our products affect our production levels and revenues.
Real GDP in Brazil increased at an average annual rate of 9.0% from 2005 through 2021. For two consecutive years, in 2015 and in 2016, Brazil’s GDP decreased by 3.5%. Reacting to this weak economic environment, the Central Bank lowered the Special System for Settlement and Custody (Sistema Especial de Liquidação e de Custódia, or “SELIC”) interest rate, which is the short-term benchmark interest rate from a 13.75% SELIC interest rate as of December 31, 2016 to 2% as of December 31, 2020. Since then, the Central Bank has been raising the SELIC interest rate to control inflationary pressures. As of December 31, 2021 the SELIC interest rate was 9.25% and, as of the date of this annual report, the SELIC interest rate was 11.75%. For the year ended December 31, 2021, the IPCA inflation index increased to 10.06% in comparison to 4.52% for the year ended December 31, 2020.
The unemployment rate and consumer confidence levels also have an impact on consumption levels in Brazil. The average unemployment rate for 2021 was 11.6%, a decrease of 2.6 percentage points when compared to the 14.2% in 2020. The Consumer Confidence Index for December 2021 was 75.5%, 3 percentage points below that of 78.5% in December 2020.
3 Increase our shared value generation by investing its own resources in the communities, especially in social development and economic inclusion agendas.
| 53 |
According to the Brazilian Association of Supermarkets (Associação Brasileira de Supermercados), or ABRAS, in December 2021, Brazilian household consumption (former supermarket sales) in real terms (adjusted using the IPCA inflation index), increased 4.27% compared to December 2020. For the full year, supermarket sales in real terms rose 3.04% in 2021 as compared to 2020.
Export Markets
The information set forth in this “Export Markets” subsection is derived from SECEX and relates to Brazilian exports as a whole and not only to exports of our company.
Brazilian chicken exports increased by 8.33% in the year ended December 31, 2021, compared to the year ended December 31, 2020, in terms of volume. Pork exports registered an increase of 10.7% in volume sold in the year ended December 31, 2021, compared to the year ended December 31, 2020. Beef exports recorded a decrease of 8.3% in volume in the year ended December 31, 2021, compared to the year ended December 31, 2020, partially driven by China’s ban of beef imports from Brazil from September 4 until December 15, 2021.
Brazilian chicken exports in the year ended December 31, 2021 totaled 4.47 million tons, with sales amounting to US$7.5 billion (or R$31.8 billion, translated to reais at the exchange rate of R$5.5805 as of December 31, 2021). China has been the main destination for these exports (14.3%), followed by Japan (10%), the United Arab Emirates (8.7%) and Saudi Arabia (7.9%).
The volume of pork exports in the year ended December 31, 2021 totaled 1.12 million tons, with sales amounting to US$2.6 billion (or R$14.63 billion, translated to reais at the exchange rate of R$5.5805 as of December 31, 2021). The leading importers, China, Hong Kong and Chile represented 20.3%, 6% and 2.3%, respectively, of total exports from Brazil.
Beef shipments in the year ended December 31, 2021 totaled 1.81 million tons, with sales amounting to US$9.1 billion (or R$50.8 billion, translated to reais at the exchange rate of R$5.5805 as of December 31, 2021) compared to 1.98 million tons with sales of US$8.4 billion (or R$43.7 billion, translated to reais at the exchange rate of R$5.1967 as of December 31, 2020) in the year ended December 31, 2020. This decrease in volume was driven by lower exports to China (7.95%) and Hong Kong (2.3%).
For a discussion on the global economic conditions and further information on the conditions on our export markets and the Brazilian market, see “Item 5. Operating and Financial Review and Prospects—D. Trend Information.”
Products
We are a food company that focuses on the production and sale of branded processed food, poultry and pork products. As of June 2021, we have also dedicated resources to grow in our offering of pet food products, in line with our Vision 2030 Plan to increase our presence in pet markets.
Poultry
We produce fresh/frozen whole and cut poultry. In 2021, we slaughtered approximately 1.72 billion heads of poultry, a 3% increase compared to 1.67 billion in 2020. We sold 2,053.3 thousand tons of fresh and frozen chicken and other poultry products in 2021, compared to 1,904 thousand tons in 2020, excluding our discontinued operations. Most of our poultry sales are to our export markets.
As a result of the trade barriers imposed by the European Union, we have significantly reduced our production of turkey since 2018, as the European Union was our main consumer market for this product. For additional information, see “Item 3. Key Information—D. Risk Factors—Risks Relating to Our Business and Industry—More stringent trade barriers in key export markets may negatively affect our results of operations.”
| 54 |
Pork and Beef
In 2021, we slaughtered approximately 10.06 million hogs compared to 10.21 million in 2020. We raise hogs but do not raise cattle at our facilities. Although most of the hogs that we slaughter are used for processed products in the domestic Brazilian market, we also produce frozen pork and beef cuts, such as loins and ribs, and whole carcasses. In January 2019, following the closing of the transaction in which Marfrig acquired our beef slaughtering facility, we and Marfrig signed a supply agreement under which Marfrig agreed to provide us with finished goods from the Várzea Grande plant. In 2021, we sold 337 thousand tons of pork and beef cuts, excluding our discontinued operations, compared to 319 thousand tons of pork and beef cuts in 2020. We are also further developing our international customer base for pork and beef cuts.
Processed Food Products
We produce processed foods, such as marinated and frozen chicken, Chester® rooster and turkey meat, specialty meats, frozen processed foods, frozen prepared entrees, portioned products and sliced products. Part of our strategy is to develop additional processed food products in these and other categories because these products tend to be less price-sensitive than our frozen poultry and pork products. We sold 1,784.0 thousand tons of processed foods in 2021, compared to 1,832.4 thousand tons in 2020, excluding our discontinued operations. Most of our sales of processed foods are to our domestic market. We believe that there are opportunities to market value-added products like these to targeted regions and other market segments in Brazil as well as to expand our sales in the export market.
Our processed food products strategy relies on accurate brand management, a varied product portfolio with strategic pricing and innovation and service excellence, which we believe will allow our products to expand their reach both in the Brazilian market and international markets.
Specialty Meats
We process pork to produce specialty meats, such as sausages, ham products, bologna, frankfurters, salami, bacon and cold meats. We also process chicken and other poultry to produce specialty meats, such as chicken sausages, chicken hot dogs and chicken bologna.
Frozen Processed Meats
We produce a range of frozen processed poultry, pork and beef products, including hamburgers, steaks, breaded meat products, kibbeh and meatballs.
Marinated Poultry
We produce marinated and seasoned chickens, roosters (under the Chester® brand) and turkeys. We originally developed the Chester® breed of rooster to maximize the yield of breast and leg cuts. In 2004, we sold our rights to the Chester® breed of rooster to Cobb Vantress, a U.S. poultry research and development company engaged in the production, improvement and sale of broiler breeding stock, and we entered into a technology agreement under which Cobb Vantress manages the Chester® breed of rooster. We continue to oversee the production of Chester® roosters in Brazil from hatching to distribution, and we own the trademarks for the Chester® line of products. In 2020, Perdigão launched a new edition of Chester® to celebrate the brand’s 40th anniversary.
Halal Products
We offer poultry products for Islamic markets in accordance with the Halal method of animal slaughtering.
| 55 |
Margarine
We sell margarine under the Qualy, Deline and Claybom brands and also distribute margarine products of the third-party brand Becel. We maintain our leading market position with the Qualy brand by bringing innovation to the Brazilian market. For example, in 2014 we introduced the first aerated margarine in Brazil and, in 2016, we improved the Qualy portfolio by adding a proprietary mix of vitamins and minerals to our products, which is called the Q-Mix. Additionally, in 2017, we introduced the first margarine with whole grains, Qualy Multigrãos. This technology to add grains inside the margarine is protected under a patent in partnership with our equipment supplier. In 2018, we launched Qualy Light Zero Lactose, the first zero lactose margarine in the Brazilian market.
Butter, Cream cheese and Cheese bread
Qualy, a notable margarine brand in Brazil, expanded its portfolio in 2020 by offering new products such as butter and curd and introducing a line of cheese breads. These new products have been available since December 2020 and are consistent with Qualy’s pursuit to become the leading brand in breakfast and afternoon meals, which are relevant markets for the brand. Qualy’s cheese bread line also offers the options of buttered cheese bread and buttered cheese bread with pieces of Sadia ham.
Frozen Prepared Entrees
We produce a range of frozen prepared entrees, some of which contain poultry, beef and pork meat that we produce, including those listed below.
| · | Pastas and Pizzas. We produce several varieties of lasagna, pizza and other ready-to-eat meals. We produce the meat used in these products and buy other raw materials in the domestic market. In 2019, we expanded our portfolio in this category by launching new products, such as the Mac’n Cheese under the Sadia brand. We believe that this new product is an innovative product in the Brazilian market, with greater added value to the ready-to-eat meals sub-category. Inspired by one of the favorite dishes in the United States, the Sadia Mac’n Cheese was launched in October 2019 with three variants: Mac’n Cheese Cheddar, Mac’n Cheese Cheddar with Bacon and Mac’n Cheese Cheddar with Sausage. |
| · | French Fries. We sell frozen French fries, which are imported from Belgium where they are produced and packaged for us by third parties. |
| · | Pies and Pastries. We produce a variety of pies and pastries, such as chicken and heart-of-palm pies. We produce the meat, sauces and toppings used in our pies and pastries, and we purchase other raw materials, such as heart-of-palm, lime and other fillings from third parties. |
Plant-based products
In 2020, we launched Sadia Veg&Tal, our brand for vegan and vegetarian frozen food, including hamburgers, nuggets and pies categories. We also started to expand the Veg&Tal frozen food portfolio in 2020 and launched frozen vegetables, including broccoli, cauliflower, peas and French beans. Our sales represented 11.7% of the vegan nuggets sales in Brazil in 2021. In 2021 we launched the 100% Vegetable Chicken line by Sadia Veg&Tal, composed by 3 SKUs (shredded chicken, in stripes and cubes). It is officially the first line of plant-based carbon neutral chickens on the Brazilian market, and the totality of the production chain emission is neutralized through the purchase of carbon credits from forest conservation projects.
In March 2021, we executed a memorandum of understanding with Aleph Farms, Ltd, or Aleph, an Israeli start-up company that develops laboratory proteins from animal cells. The agreement contemplates: (i) the development and production of cultivated meats using the patented production of Aleph Farms (BioFarm™); and (ii) the distribution of cultivated proteins from Aleph Farms, with exclusivity, in Brazil. In July 2021, we announced our participation in the round of investments (Series B) promoted by Aleph. We will invest US$2,500 thousand in this round, of which US$1,250 thousand was paid in cash in 2021 and the difference will be paid in 2022. In connection with this investment and the capital allocated by other investors, the funds will be destined to the large-scale global marketing of products made from cultivated meat, as well as expansion of Aleph’s portfolio. In connection with our Vision 2030 Plan, which includes a “meat substitutes” growth segment, the investment in Aleph Farms is the first one made in the form of venture capital by us and marks our participation in a pioneering sustainable initiative in the global food chain. With this movement, we advance in our plan to meet the growing consumer demand for new and alternative sources of protein, bringing innovative technologies to Brazil, in line with its commitments to sustainability, innovation and food safety.
| 56 |
Ready meals
In 2021, we launched Sadia Livre&Lev a sub-brand of Sadia, which focuses on well-being and is characterized as a line free of excesses and light in ingredients, specially developed to deliver more naturalness through fewer, well-known ingredients, free of additives. Livre&lev is composed of cold cuts (ham and turkey breast) and ready meals (portioned meals, which allow for different combinations and wraps).
Frozen desserts
We have produced and sold Miss Daisy desserts since 1999. We believe the Miss Daisy brand has a leading market position and has been highly resilient to market changes. We offer a wide variety of products under the Miss Daisy brand, including:
| · | Mousse pie, lemon pie, chocolate and vanilla pie, and mousse pie with chocolate shavings; and |
| · | Dutch pie. |
Inspired by seasonal flavors, the Miss Daisy brand also launched three new flavors as a limited edition: condensed milk fudge mousse pie with caramelized nuts and two new hot pie desserts, hazelnut cream and guava paste with cream cheese.
Pet Products
In 2021, we concluded the acquisition of Mogiana and Hercosul, adding strong and traditional brands, robust industrial facilities and expertise in the specialized pet products. With these acquisitions, we became top three in market share in terms of revenue in Brazil’s pet food segment, market leaders in Uruguay and the number two player in Paraguay, according to estimates based on Brazilian Association of Pet Products Industry (Associação Brasileira da Indústria de Produtos para Animais de Estimação), or ABINPET, data. Our portfolio includes dry and wet food, snacks in a wide range of standard to super premium brands such as: Biofresh, Guabi Natural, GranPlus, Three Dogs, Three cats, Faro e Primocão and our native brand Balance.
Other
We produce animal feed mainly to feed poultry and hogs raised by us, although we also sell a small portion to our integrated outgrowers and to unaffiliated customers. In 2021, we produced 10,071 thousand tons of feed and PREMIX in Brazil, compared to 9,669 thousand tons in 2020, and 824 thousand tons in Turkey. We also produce a limited range of soy-based products, including soy meal and refined soy flour.
Vision 2030 Plan
We announced in December 2020 our Vision 2030 Plan, which is a growth strategy currently in place. While abiding to a strict discipline with regards to our financial leverage, to accomplish this goal we expect under this plan make over R$55 billion in investments, primarily funded from our own cash flow and debt refinancing, focusing on strengthening our leadership position as a global food company with a high added-value portfolio, strong brands, high-quality products, and becoming even more admired by consumers as well as providing increased return and expanded margins.
| 57 |
We will also target the establishment of a local presence internationally in some of the world’s largest added-value consumer centers, and to expand our share of the Brazilian market in ready meals, increasing our presence in the high-added value pork and pet markets, in addition to the production of meat substitutes and new sources of protein, in which significant food industry transformation is expected. Within this context, we expect that by the end of this decade approximately 70% of our revenue will be derived from our portfolio of high added-value products.
Our Vision 2030 Plan also includes a macro-sustainability plan with public commitments involving ESG features. Beginning in 2021, our management has started setting ESG-related goals, and in January 2021, we named a new vice president for Institutional Relations, Reputation and Sustainability to support the advancement of our ESG agenda.
One of our key objectives under our Vision 2030 Plan is to become one of the two largest food companies for pets in Brazil by 2025. Brazil is the second-largest market in the world for pet products, after the United States, with a market value of R$20 billion in 2020. It is estimated that the market potential for pet products will total approximately R$40 billion by 2030. This growth is driven mainly by the verticalization of cities and by the humanization of animals that brings about different needs for the feed. Premium brands for pet food are expected to be favored the most by consumers. We are already present in that segment for both of the key retail channels, including supermarkets (roughly 30% of the market), and the specialized trade channel (remaining 70% of the market). In 2021, we concluded the acquisition of Mogiana and Hercosul, adding strong and traditional brands, robust industrial facilities and expertise in the specialized channel. With the operation, we became value share top 3 in Brazil’s Pet Food segment, market leaders in Uruguay and the number two player in Paraguay, according to estimates based on ABINPET data. To serve this segment, the synergies with our production chain provide us with competitive advantages as to costs and quality. In furtherance to our Vision 2030 Plan, on August 2, 2021 and September 1, 2021, we completed the acquisition of Hercosul Group, which produces and distributes dry and wet pet food for dogs and cats, and Mogiana Alimentos, which specializes in animal nutrition products for dogs and cats. Also, we are already the second-largest producer of animal feed in the southern hemisphere. We are already a producer of the main ingredients for the formulation of feeds. We expect this fact will assist us with higher efficiency and lower production costs, because of both the scale of our grain purchases and our access to specific materials, such as hydrolyzed protein and special oils, which we produce and distribute to the pet food market. We believe that these synergies provide us with advantages in the pet food market that are difficult for other companies to replicate. Additionally, we have access to the distribution channel of the traditional retail segment, and we plan on developing our capabilities in the specialized retail market and the technical products market.
We also believe that this new growth path anticipated for Brazil can be replicated in other regions and geographies in which we operate, which we expect will offer us new opportunities and new growth avenues in the future.
There can be no assurance that we will be able to meet the targeted goals in our Vision 2030 Plan so undue reliance should not be placed with respect to our targeted goals in this plan.
Growth Avenues Mapped at Vision 2030 Plan
Pet Market
We believe that a key growth avenue for us is diving deeper into the untapped potential of the pet food market. By 2030, we expect that the pet food market in Brazil reaches over R$40 billion in revenues in Brazil according to Euromonitor. We expect to become the second largest player in Brazil by 2025. As indicated in our Vision 2030 Plan, there are important opportunities to explore cost synergies and to leverage our distribution network, which includes the large volumes of our purchases, ability to store large amounts of raw material, and strong penetration in the traditional retail chains and e-commerce. After our recent acquisitions of Hercosul Group and Mogiana Alimentos, we have already become the Top 3 brand in the segment in Brazil, according to estimates based on ABINPET data.
| 58 |
Added-Value Swine Market
Brazil has seen important changes in consumer behavior and continues to be impacted by the growing needs for practicality, convenience, and healthiness. According to Mintel, the majority of the national population does not enjoy cooking. Additionally, According to FAOstat, OCDE and Euromonitor, Brazil has a much lower consumption per capita of pork, 14 kg per inhabitant in 2020, when compared to more mature markets, such as the USA with 41 kg per inhabitant in 2020. Thus, there is likely a significant opportunity to increase our penetration in the added-value swine market. Further, in accordance with our internal analysis using data from the Food and Agriculture Organization of the United Nations and from Kantar, the added-value swine market has the potential to reach R$23 billion until 2030.
Ready Meals
As a result of shifts in habits and changes in the lifestyle of consumers, the demand for ready meals is growing worldwide, according to Euromonitor. Everyday convenience can drive consumers, representing a growth opportunity for us. According to Mintel, in 2019, 53% of Brazilian working citizens do not have time to cook, and 61% of Brazilians declare they do not like cooking.
Therefore, one of our strategic priorities through 2030 is to expand our ready meal options to customers, employing our knowledge of food options in order to create new lines of products, always seeking to maintain our high quality. A successful example of such priority was the launch of the Mac’n Cheese in early 2020, which proved to be a milestone for our value-added strategy.
We expect to continue offering good quality, user-friendly food. We believe in our ability to have a great impact and lead the ready meals market, whose demand is growing, considering the trend of consumption habits of our consumers. According to Euromonitor, the ready-meals global market has potential to reach R$16 billion per year, more than 4x its current size.
Meat Substitutes
The penetration of our new product lines in meat substitutes is a key component to our Vision 2030 Plan. According to Euromonitor, this market could reach R$13 billion by 2030. As a result, we are consistently seeking to increase variety in the meat substitutes segment and expect to innovate our offerings, including plant-based food and cultivated meat. We believe to be one of the first Brazilian players to access the cultivated meat technology with our partnership with Aleph Farms. See “Item 4. Information on the Company—A. History and Development of the Company—Other Transactions.”
We hold more than 10 Sadia Veg&Tal products in our portfolio and believe to also be national pioneers in the meat-like chicken cut lines, including Brazil’s first plant-based carbon neutral chicken (i.e., Veg Chicken) and our ready-to-eat Veg&Tal snack.
International Markets Expansion
We believe in our potential to be part of two-thirds of the global consumption markets (North America, Europe and Asia, markets with greater opportunities) by 2030 and aim to be a global food company present in the main consumption centers, with leadership in relevant markets. Our foods are already present in the lives of families worldwide through Sadia and Perdix, which are particularly the leading brands in the Middle East and currently hold 36.9% of market share, according to Nielsen in December 2021. Our Banvit brand in Turkey has experienced significant growth in the recent past and now amounts to a market share of 22.3% according to Nielsen. Our strategy is supported by 3 levers focused on adding value, which are the competitive export platform we have developed through continuous development of the market and product mix optimization, ownership of necessary qualifications, consolidation of the Halal market important presence, and our global expansion to markets that represent more than 50% of high value-added consumption.
| 59 |
Digitalization
Digital transformation is part of our daily lives at BRF, with technology having the potential to transform our culture, processes and tools and ultimately accelerate our business.
We increased our investments in technology by 140% in 2021, by 40% in 2020 and by 20% in 2019, having invested R$450 million in digital initiatives between 2017 and 2021. For the next four years, we have built a solid roadmap of investment in digital initiatives, together with each of our departments, and digitalization is expected to be a key investment vertical for us. Further, from 2021 to 2025, we have identified investment opportunities amounting to R$700 million. In addition, we have 60 ongoing digital projects and we delivered 56 projects in 2021.
As we start to carry out such ambitious plan, we have already trained more than 1,200 employees in agile methodologies, including cloud, design thinking, amongst others. We have promoted the digital inclusion of more than 70,000 employees that started to access online services and information.
We have created a digital lab to increase the connection with startup partners and the number of pilot projects we develop. More than 50 projects are already underway, which could improve the productive strategy and growth of the Company.
Another relevant topic for us in the digitalization process is the concept of innovation in Industry 4.0. We believe that the adoption of new technology could generate significant gains and be replicated across our value chain. There are two fronts of the Industry 4.0 concept being implemented – the digital plant and the intelligent plant. Our concept of a digital factory is intended to provide greater speed in our internal processes. Our concept of a smart factory intends to integrate our plants with Industry 4.0 systems such as online integrations, providing insights into advanced analytics models.
In our egg farms, our Industry 4.0 processes currently collect data which was previously collected manually. Additionally, with investments of approximately R$300 million, we have expanded our production capacity with our new plant in Seropédica, in the State of Rio de Janeiro, Brazil. This is our 40th production site; the first exclusively dedicated to the production of franks and one of the most advanced in the concept of Industry 4.0, using clean energy, generates minimal solid waste, and promotes water reuse.
We already have our commodities smart center in operation with the analysis of images retrieved through satellites and software that already runs a large part of our processes. Our operational transport control center allows us to monitor 100% of our fleet. Our planning is supported by optimization models. We are making headway in implementing our logistics 4.0, in using artificial intelligence and data science.
Overview of Brazil’s Poultry, Pork and Beef Position in the World
Poultry
Brazil was the third largest producer and the leading exporter of poultry in the world in 2021 based on estimates calculated by the United States Department of Agriculture, or the “USDA.” Brazil’s production, consumption and export volumes for poultry have increased significantly over the past several years. This growth has been driven by the increase of Brazilian companies’ production dedicated to exports as well as by the competitiveness of Brazilian poultry.
According to the USDA, global poultry trade increased 0.19% in 2021 compared to 2020, mainly due to higher exports from Brazil (which increased 9% in comparison to 2020), and Turkey (which increased 7% in comparison to 2020). According to the Brazilian Association of Animal Protein (Associação Brasileira de Proteína Animal, or ABPA), exports of poultry parts increased 11.7% in 2021 compared to 2020, representing 68.7% of the total poultry exported volumes. Whole chicken, which represented 22.6% of the total volume, decreased 2.5% in 2021 compared to 2020. The main destinations in 2021 were China, Japan, United Arab Emirates and Saudi Arabia. In comparison to 2020, in 2021 Saudi Arabia decreased total imports from Brazil by 24.4%, China decreased total imports from Brazil by 4.9%, Japan increasedtotal imports from Brazil by 9.4% and United Arab Emirates increased total imports from Brazil by 28.5%.
| 60 |
The following tables identify Brazil’s position within the global poultry industry for the years indicated:
| World Chicken Production | |||
| Primary Chicken Producers | 2021 | 2020 | 2019 |
| (in thousands of tons – “ready to cook” equivalent) | |||
| U.S. | 20,378 | 20,255 | 19,941 |
| China | 14,700 | 14,600 | 13,800 |
| Brazil | 14,500 | 13,880 | 13,690 |
| European Union (27 countries) | 11,020 | 10,850 | 10,836 |
| Russia | 4,600 | 4,680 | 4,668 |
| Mexico | 3,815 | 3,725 | 3,600 |
| Thailand | 3,280 | 3,250 | 3,300 |
| Argentina | 2,290 | 2,215 | 2,171 |
| Turkey | 2,170 | 2,136 | 2,138 |
| Japan | 1,765 | 1,765 | 1,723 |
| United Kingdom | 1,760 | 1,785 | 1,726 |
| Others | 19,793 | 19,768 | 19,614 |
| Total | 99,901 | 99,079 | 97,207 |
|
Primary Chicken Exporters |
2021 | 2020 | 2019 |
| (in thousands of tons – “ready to cook” equivalent) | |||
| Brazil | 4,225 | 3,875 | 3,939 |
| U.S. | 3,367 | 3,376 | 3,259 |
| European Union (27 countries) | 1,780 | 2,033 | 2,148 |
| Thailand | 930 | 941 | 961 |
| Turkey | 470 | 440 | 402 |
| Others | 2,317 | 2,399 | 2,320 |
| Total | 13,089 | 13,064 | 13,029 |
| Primary Chicken Consumers | 2021 | 2020 | 2019 |
| (in thousands of tons – “ready to cook” equivalent) | |||
| U.S. | 17,118 | 16,994 | 16,702 |
| China | 15,030 | 15,211 | 13,952 |
| Brazil | 10,280 | 10,010 | 9,756 |
| European Union (27 countries) | 9,685 | 9,642 | 9,448 |
| Mexico | 4,737 | 16,994 | 16,702 |
| Russia | 4,620 | 4,688 | 4,712 |
| Japan | 2,821 | 2,773 | 2,789 |
| Thailand | 2,320 | 2,299 | 2,389 |
| Argentina | 2,150 | 2,063 | 2,021 |
| United Kingdom | 2,035 | 1,995 | 2,054 |
| South Africa | 1,830 | 1,891 | 1,829 |
| Others | 24,690 | 24,623 | 24,562 |
| Total | 97,316 | 96,749 | 94,683 |
Source: USDA, February 2022.
Pork
Brazil is the fourth largest producer and exporter and the fifth largest consumer of pork in the world in 2021, according to the USDA. Brazil’s production and consumption of pork has increased since 2009. The USDA expects an increase in global production of 0.9% and an increase in pork consumption of 0.9% in 2022. According to the USDA, global pork exports reached 12.4 million tons in 2021. Brazilian pork breeding and slaughtering companies continue to increase their efficiency of production. Research and development have also helped to reduce fat, cholesterol and calories in pork produced in Brazil. These enhancements allow for more efficient production of prime cuts, more meat per carcass and more nutritious and healthier meat. Improved genetic potential of breeders has also contributed to the production increase.
| 61 |
According to the ABPA, as of December 2021, China was Brazil’s primary destination for pork followed by Hong Kong, representing 46.9% and 13.8%, respectively, of total Brazilian pork exports. Chinese imports from Brazil increased 3.9%, while Hong Kong imports decreased 5.6%, from December 31, 2020 to December 31, 2021.
The following tables identify Brazil’s position within the global pork industry for the years indicated:
| World Pork Production | |||
| Main Pork Producers | 2021 | 2020 | 2019 |
| (in thousands of tons – weight in equivalent carcass) | |||
| China | 48,850 | 36,340 | 42,550 |
| European Union (27 countries) | 23,680 | 23,219 | 22,996 |
| U.S. | 12,568 | 12,845 | 12,543 |
| Brazil | 4,325 | 4,125 | 3,975 |
| Russia | 3,700 | 3,611 | 3,324 |
| Vietnam | 2,590 | 2,467 | 2,430 |
| Others | 13,236 | 13,148 | 13,211 |
| Total | 108,949 | 95,755 | 101,029 |
| Main Pork Exporters | 2021 | 2020 | 2019 |
| (in thousands of tons – weight in equivalent carcass) | |||
| European Union (27 countries) | 5,050 | 5,167 | 4,266 |
| U.S. | 3,215 | 3,302 | 2,867 |
| Canada | 1,480 | 1,544 | 1,284 |
| Brazil | 1,322 | 1,178 | 861 |
| Mexico | 330 | 344 | 234 |
| United Kingdom | 300 | 348 | 338 |
| Chile | 280 | 295 | 223 |
| Others | 437 | 376 | 294 |
| Total | 12,414 | 12,554 | 10,367 |
| Main Pork Consumers | 2021 | 2020 | 2019 |
| (in thousands of tons – weight in equivalent carcass) | |||
| China | 53,150 | 41,521 | 44,866 |
| European Union (27 countries) | 18,730 | 18,211 | 18,894 |
| U.S. | 9,896 | 10,034 | 10,066 |
| Russia | 3,528 | 3,468 | 3,363 |
| Brazil | 3,006 | 2,949 | 3,116 |
| Vietnam | 2,884 | 2,687 | 2,493 |
| Others | 16,950 | 16,193 | 17,077 |
| Total | 108,144 | 95,063 | 99,875 |
Source: USDA, February 2022.
Beef
Brazil was the second largest producer, the third largest consumer and the largest exporter of beef in the world in 2021, according to the USDA. From 2021 to 2022, the USDA estimates that there will be an increase in global beef production, consumption and exports of approximately 1.0%, 0.7% and 4.0%, respectively.
| 62 |
The following tables identify Brazil’s position within the global beef industry for the years indicated:
| World Beef Production | |||
| Main Beef Producers | 2021 | 2020 | 2019 |
| (in thousands of tons – weight in equivalent carcass) | |||
| U.S. | 12,736 | 12,389 | 12,385 |
| Brazil | 9,325 | 10,100 | 10,200 |
| European Union (27 countries) | 6,835 | 6,883 | 6,964 |
| China | 6,830 | 6,720 | 6,670 |
| India | 4,100 | 3,760 | 4,270 |
| Argentina | 3,000 | 3,170 | 3,125 |
| Mexico | 2,120 | 2,079 | 2,027 |
| Australia | 1,900 | 2,125 | 2,432 |
| Canada | 1,450 | 1,314 | 1,342 |
| Russia | 1,380 | 1,378 | 1,374 |
| Others | 7,923 | 7,742 | 7,853 |
| Total | 57,599 | 57,660 | 58,642 |
| Main Beef Consumers | 2021 | 2020 | 2019 |
| (in thousands of tons – weight in equivalent carcass) | |||
| U.S. | 12,718 | 12,531 | 12,409 |
| China | 9,763 | 9,486 | 8,826 |
| Brazil | 7,065 | 7,609 | 7,929 |
| European Union (27 countries) | 6,445 | 6,521 | 6,698 |
| India | 2,550 | 2,476 | 2,776 |
| Argentina | 2,279 | 2,365 | 2,379 |
| Others | 15,032 | 15,081 | 15,359 |
| Total | 55,852 | 56,069 | 56,376 |
| Main Beef Exporters | 2021 | 2020 | 2019 |
| (in thousands of tons – weight in equivalent carcass) | |||
| Brazil | 2,320 | 2,539 | 2,314 |
| U.S. | 1,567 | 1,339 | 1,494 |
| India | 1,550 | 1,284 | 1,373 |
| Australia | 1320 | 1,473 | 1,739 |
| Argentina | 730 | 819 | 763 |
| Others | 4,095 | 3,783 | 3,696 |
| Total | 11,582 | 11,237 | 11,379 |
Source: USDA, February 2022.
Processed and Pet Food Markets
Aligned with our Vision 2030, we are enhancing our processed food products portfolio and expanding operations in the pet food segment. These are strategic markets for us due to their positive growing perspectives. See “Vision 2030 Plan.”
According to WMStrategy (WMS), the Ready Meal segment in Brazil is expected to reach US$2.4 billion in 2025, which represents a CAGR of 6.6% from 2020 to 2025.
Global Pet Food Segment also has positive market trends, which are shown by Allied Market Research. Its market size was valued at US$87 billion in 2020, and is expected to reach US$133 billion in 2030, which represents a CAGR of 4.6% between 2021 and 2030. Regarding the Pet Food market in Brazil, it has potential to triple size by 2030, reaching R$40 billion, according to Euromonitor.
| 63 |
Production Process
We are a vertically integrated producer of poultry and pork products. We raise poultry and hogs, produce animal feed and pet food, slaughter the animals, process poultry and pork to produce processed food products and distribute unprocessed and processed products throughout Brazil and in our export markets.
The following graphic is a simplified representation of our meat production chain.
Meat Production Chain
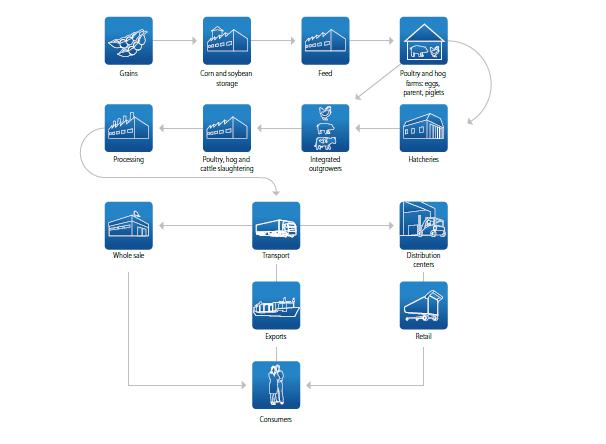
Poultry
At the beginning of the broiler production cycle, we purchase day-old grandparent’s breeder chicks from Aviagen of Brazil. We send these birds to our grandparent stock farms, forming our grandparent breeding stock. With respect to turkeys, we purchase hatched grandparent’s eggs and then send those eggs to our grandparent stock hatchery, where the eggs are hatched, and the chicks are raised, forming our grandparent breeding stock. The eggs produced by our grandparent breeding stock are then hatched, and our parent breeding stock is produced. We also buy a small percentage of our parent stock from another supplier, Cobb Vantress. The parents produce the hatchable eggs that result in day-old chicks that are ultimately used in our poultry products. We produced 1.8 billion day-old chicks and 12.84 million day-old turkeys in 2021, of which 11.7 were produced in Brazil and 1.14 million were purchased in Turkey. We hatch these eggs in our 30 hatcheries (26 broiler, 1 turkey, 3 breeders).
We send the day-old chicks, which we continue to own, to outgrowers, whose operations are integrated with our production process. The farms operated by these outgrowers vary in size and are near our slaughtering facilities. These integrated outgrowers are responsible for managing and growing the poultry in their farms under the supervision of our veterinarians. The payments to outgrowers are based on performance rates determined by bird mortality, the feed-to-meat conversion ratio and the quantity of meat produced and are designed to cover their production costs and provide net profits. We provide feed, veterinary and technical support to the outgrowers throughout the production process. We have business arrangements with approximately 6,700 integrated poultry outgrowers. Many of these outgrowers also produce and sell corn that we use to produce animal feed.
As of December 31, 2021, we have a fully automated slaughtering capacity of 35.4 million heads of poultry per week and 268 thousand heads of turkey per week.
| 64 |
Pork
We produce the vast majority of the pork we use in our products. We also purchase pork on the spot market.
Piglet producers either purchase parent breeder hogs produced by us or from producers such as Agroceres and DanBred. We generally purchase piglets from integrated outgrowers near our production facilities, which raise the piglets until they reach a specified weight, or we purchase young piglets from farmers who own breeder hogs. We transfer these piglets to separate integrated outgrowers, who raise the hogs until they reach slaughtering weight, and then transport the hogs from these outgrowers to our slaughtering facilities. We have agreements with a total of 3,204 integrated outgrowers, including piglet producers and hog raisers. We monitor the production of the hogs by these outgrowers and provide support from our veterinarians.
The local producers from whom we purchase a portion of our pork needs are also located near our production facilities but are not parties to partnership agreements with us. These producers generally raise the hogs from birth until they reach slaughtering weight, but we provide limited technical support. We purchase the hogs raised by these local producers pursuant to contracts with the local producers.
We slaughter the hogs raised by our outgrowers or purchased from local producers or on the spot market. After they are slaughtered, the hogs are immediately cut in half. The half-carcasses are then separated based on their intended use. These parts become the raw material for the production of pork cuts and specialty meats.
As of December 31, 2021, we had a pork slaughtering capacity of 238 thousand heads per week.
Beef
We had a beef slaughtering capacity of 14,400 heads per week until October 1, 2014, when we signed an Investment Agreement with Minerva, pursuant to which we allocated our beef slaughtering plants in Várzea Grande and Mirassol, as well as our employees involved in these activities, to a closed capital company that was incorporated within Minerva. We received an equity interest in Minerva in connection with this transaction. The transaction closed on October 1, 2014. On December 7, 2018, we executed an agreement with Marfrig for its acquisition in the amount of R$100 million of real estate and equipment from our plant located in Várzea Grande in the State of Mato Grosso, which produced approximately 69,000 tons of hamburger meat per year. This transaction closed on January 23, 2019 and, on April 1, 2019, a Supply Agreement with Marfrig became effective, under which Marfrig undertook to provide us with finished goods produced in the Várzea Grande plant, such as hamburgers, meatballs, kibbehs, chicken meat and processed chicken breast products for 60 months.
Processed Foods
We sell a variety of processed foods, some of which contain poultry and pork meat that we produce. We have a total production capacity of 194 thousand tons/month across 17 production units in Brazil (Chapecó, Marau, Capinzal, Toledo, Videira, Lucas do Rio Verde, Rio Verde, Uberlândia, Concórdia, Tatuí, Vitória de Santo Antão, Herval d’Oeste, Lajeado, Ponta Grossa, Paranaguá, Seropédica and Duque de Caxias) processing meat products (such as mortadella, franks, sausage, hamburger and breaded meat) and non-meat products (such as lasagna, ready-to-eat meals and pizzas) for both the domestic and international markets. The company completed the construction of one plant in Seropédica, in the State of Rio de Janeiro, and began its operations in July, 2021. In Tatuí, in the State of São Paulo, we produce ready-to-eat sandwiches, lasagnas, pizzas, cheese breads and other pasta and bakery items. In Ponta Grossa, in the State of Paraná, we produce pizzas, pastas, desserts (such as Miss Daisy) and other processed products. Our Rio Verde plant is adjacent to our Rio Verde poultry and pork slaughtering facilities, and we transport pork from other production facilities to be used as raw materials. We purchase most of the remaining ingredients for our lasagnas, pizzas, pies and pastries in the domestic market from third parties. Such seasonings and secondary raw materials are applied to each product type or line according to established criteria and procedures to ensure consistency of color, texture and flavor. The presentation of final products is achieved by shaping, casing, cooking and freezing in special machines. Products are then subjected to quality controls and distributed to the consumer market after having been packaged, labeled and boxed.
| 65 |
In November 2014, we opened our first plant in the Middle East, with a total capacity of 70 thousand tons/year, aiming to supply the local Middle Eastern market, Europe and Asia. This plant produces franks, breaded meat, hamburger, mortadella and marinated chicken breast.
In January 2021, BRF concluded the acquisition of Joody Al Sharqiya Food Production Factory, its first production plant in Saudi Arabia with a total capacity of 3.6 thousand tons/year. We have an expansion plan to grow the capacity to 18 thousand tons/year of processed chicken products.
We also sell frozen French fries, which are imported from Belgium where they are produced and packaged for us by third parties. In addition, we produce soy-based products, such as soy meal and refined soy flour, at our plants in Videira, located in the State of Santa Catarina, Dois Vizinhos, in the State of Paraná, and in Toledo, also in the State of Paraná. In 2020, we launched Sadia Veg&Tal, our brand for vegan and vegetarian frozen food, including hamburgers, nuggets, and pies categories. We also started to expand the Veg&Tal frozen food portfolio in 2020 and launched frozen vegetables, including broccoli, cauliflower, peas and French beans. Our sales represented 11.8% of the vegan nuggets sales in Brazil in 2021.
The raw material for margarine is crude soybean oil, which is subjected to refining and bleaching processes. We produce margarines in our plants in Paranaguá, State of Paraná, Uberlândia, State of Minas Gerais and Vitória de Santo Antão, under the Qualy, Deline and Claybom and Becel brands and in the State of Pernambuco under the brands Qualy and Deline. We sell these products as part of our strategy to diversify our product lines and to take advantage of our distribution network for refrigerated products.
We also sell halal food, which is the food allowed for Islamic consumption. The halal poultry needs to undergo a specific religious and technical procedure of slaughtering and processing, assuring that it was produced according to the Islamic requirements and that it had no contact with prohibited foods or ingredients. In addition, the Brazilian Federal Inspection Service (Serviço de Inspeção Federal, or “SIF”) of MAPA may establish additional requirements for halal food production that we must comply with. We are assisted by Islamic entities that are responsible for slaughtering and certifying all of our halal products.
Feed
We produce most of the feed consumed at the farms operated by our integrated poultry and hog outgrowers. We provide feed to most of our integrated poultry and hog outgrowers as part of our partnership arrangements with them. We also sell animal feed to local hog producers at market rates.
We own 24 feed and PREMIX production plants in Brazil and three feed production plants in Turkey. Additionally, we lease three feed plants from third parties that are 100% dedicated to our operations and one PREMIX production plant that is not 100% dedicated to our operations. The basic raw materials used in animal feed production are corn and soy meal mixed with preservatives and micronutrients. In 2019 and 2020, we also purchased corn from rural producers and small merchants, through cooperatives and from trading companies such as Coamo, Bunge, Cargill and others. The corn is grown primarily in the states of Paraná, Santa Catarina, Rio Grande do Sul, Goiás, Mato Grosso, Mato Grosso do Sul and Minas Gerais. We buy soy meal from major producers such as Bunge, Cargill and Amaggi, primarily pursuant to long-term contracts. The prices of corn, soybeans and soy meal fluctuate significantly, influenced by international quotes and local currency rates. See “Item 5. Operating and Financial Review and Prospects—A. Operating Results—Principal Factors Affecting our Results of Operations—Commodity Prices.”
Other Raw Materials
We purchase other materials required for our products, such as prepared animal intestines (for sausage casings), cardboard boxes and plastic (for packaging), micronutrients (for animal feed), spices and veterinary drugs from third parties, both in the domestic and international markets.
| 66 |
Suppliers
One of our strategies is to build more efficient relationships with our suppliers by using selection criteria to assess suppliers based on the quality of the product, the product performance and reliability.
We have a Chain Monitoring System that is structured to strengthen social and environmental risk control, support an ethical and responsible business model and develop sustainable partnerships. We seek to accomplish this by undertaking quality audits, distributing and requiring supplier adherence to our Suppliers’ Code of Conduct, following the Policy for Related-Party Transactions, consulting public data and also including certain related obligations in our contracts with suppliers. Our Suppliers’ Code of Conduct, which is posted on our website and agreed to in advance by our suppliers, regulates our relationship and focuses on ethical behavior, social and environmental responsibility. We are focused on a stronger risk management approach, especially with respect to quality, integrity and safety, as well as sustainability and compliance.
In 2019, we created the internal process for suppliers to comply with our Suppliers’ Code of Conduct and established internal procurement standards setting forth this process (“Procurement Standards”). The process was led by an internal working group focused on ensuring effective Suppliers’ Code of Conduct implementation, mitigating our risks and strengthening our relationships with our stakeholders. Beginning in September 2019, all new suppliers were required to confirm compliance with our Suppliers’ Code of Conduct before being registered on our internal systems.
The Procurement Standards provide for certain exceptions to the rule requiring suppliers to accept our Suppliers’ Code of Conduct. For example, suppliers are not required to accept our Suppliers’ Code of Conduct if they are a public entity connected to the government or if they have their own code of conduct, in which case they may fill out a short form indicating the website where their code of conduct is available or attaching it to the form. If a supplier refuses to accept our Suppliers’ Code of Conduct and does not fall into the exceptions set forth by the Procurement Standards, the situation will be directed to our internal critical committee for analysis. Our critical committee consists of members from the legal, compliance and procurement departments. If our critical committee is unable to reach a decision, the matter is referred to our executive committee for resolution.
For cases of conflicts of interest with suppliers, we have a specialized team that analyzes the risk of maintaining or replacing the specified supplier. Additionally, through biweekly reviews of publicly available data in Brazil, we identify suppliers that do not comply with legal requirements or our standards. When evaluating suppliers, we regularly analyze, among other things, the following: environmental practices, labor relations and practices and general compliance with laws and regulations. We are in the process of standardizing our monitoring program across all of our departments, but all of our new suppliers are required to follow the Suppliers’ Code of Conduct and the Policy for Related-Party Transactions, whether in connection with a contract or spot purchase.
The evaluation and appropriate selection of suppliers and maintaining relationships with those suppliers is critical to our market competitiveness. The supplier assessment process often involves the simultaneous consideration of various aspects of the supplier’s performance, including price, innovation, delivery time, quality and post-sales support, along with its social and environmental policies and performance. Our process follows established guidelines, supported by systems and rules to be followed by all members of our procurement team. In 2018, we implemented our purchasing system – Ariba SAP, which is an advanced purchasing tool intended to strengthen our compliance function. In 2019, we implemented a new module within the purchasing system, called Ariba Network, which is focused on the relationship between our contract managers and suppliers. This improvement reinforces our commitment to compliance and transparency in our routine processes by ensuring an accurate evaluation of our contracted services and facilitating robust communication between our suppliers and our systems.
Tracking and auditing are continually monitored through internal and external audits to ensure that our processes are constantly improving and aligned with our norms and codes, compliance and sustainability efforts.
| 67 |
Brazilian Market
Brazil is the fifth largest country in the world in terms of land and has the sixth largest population on the globe. As of December 31, 2021, Brazil had an estimated population of 214 million people, according to figures from the IBGE. Brazil’s GDP amounted to US$1.9 trillion in 2019, US$1.5 trillion in 2020 and US$1.65 trillion in 2021. In the year ended December 31, 2021, GDP increased by 4.6% in nominal terms.
Inflation measured by the National Amplified Consumer Price Index (known as the IPCA - Índice Nacional de Preços ao Consumidor Amplo), published by the IBGE, was 4.31% in 2019, 4.52% in 2020 and 10.06% as of December 31, 2021, following a trend of relatively high rates. The end-of-period exchange rate, as measured by the Brazilian Central Bank, was R$4.03/US$1.00 in 2019, R$5.20/US$1.00 in 2020 and R$5.58/US$1.00 as of December 31, 2021, with the real depreciating by 6.88% as of December 31, 2021, compared to 2020.
Brazil is one of the largest meat consumers in the world, with per capita consumption in 2021 of 95.4 kilograms, including beef, chicken and pork products, according to the USDA, a decrease of 1.8% compared to 2020. Demand for poultry and pork products in the domestic market is directly affected by the country’s economic conditions. Given the GDP contraction, meat consumption decreased in 2021 compared to 2020. A slight economic improvement is expected for 2022 in comparison to 2021. As of December 31, 2021, market analysts consulted by the Central Bank expected that GDP will increase by 0.36%, while IPCA is expected to remain at 5.03%. Brazil’s domestic market is highly competitive, particularly for fresh food and frozen poultry and pork products. Besides us, there are many large producers, including Seara Alimentos S.A. (“Seara”) (which was acquired from Marfrig by JBS in 2013), Cooperativa Central Aurora Alimentos (“Aurora”) and JBS. The main producers in the fresh food market face strong competition from a large number of small producers which operate in the informal economy and sometimes offer low quality products at lower prices than those of the large producers. We seek to develop quality products, focusing on innovative solutions that meet clients’ needs and capture value for the strong brands we own, such as Sadia and Perdigão.
The processed food sector is more concentrated than the fresh food sector in terms of the number of competitors. Consumption of processed products is influenced by a number of factors, including the level of consumer income and marketing efforts directed at meeting consumer demand for more value-added products. We believe that processed foods also represent an opportunity for growth in the coming years.
We estimate the following market information based on available data from A.C. Nielsen, which is reported to them by us and by some of our competitors, as of the 6th bimester of each year:
| · | the Brazilian industrialized food market had revenues of approximately R$31,167 million in 2021 compared to R$26,766 million in 2020; |
| · | the Brazilian frozen food market had revenues of approximately R$7,174 million in 2021 compared to R$5,772 million in 2020; and |
| · | the Brazilian margarine market had revenues of R$5,213 million in 2021 compared to R$4,283 million in 2020. |
These figures do not include BRF data by region or category of products that are not covered by the A.C. Nielsen figures.
International Markets
Brazil is a leading producer in global export markets due to its natural advantages (land, water and climate), competitive inputs, costs and increasing efficiencies in animal production. Like other large Brazilian producers, we have capitalized on these advantages to develop the scope and scale of our business.
Global demand for Brazilian poultry, pork and beef products is significantly affected by trade barriers, including: (i) tariff barriers, which ultimately protect certain domestic markets; and (ii) non-tariff barriers, mainly including import quotas, sanitary barriers and technical/religious barriers. See “Item 5. Operating and Financial Review and Prospects—A. Principal Factors Affecting our Results of Operations––Effects of Trade and Other Barriers” for additional information.
| 68 |
Sales
We sell our products both in the domestic and export markets around the world. Net sales to the Brazilian market, including most of our processed foods, accounted for 51.3%, 53.2%, and 52.3% of our net sales in 2021, 2020 and 2019, respectively. Net sales to international markets, including most of our frozen whole and cut chickens and other poultry and frozen pork cuts and beef cuts, accounted for 44.5% 43.7% and 44.5% of our net sales in 2021, 2020 and 2019, respectively.
The table below sets forth the percentage of our net sales by category in the Brazilian segment, International segment, and Other segments for the periods indicated:
|
2021 |
2020 |
2019 | |
| Brazilian Market | |||
| Poultry | 9.4% | 9.5% | 11.0% |
| Pork/Beef | 3.0% | 3.2% | 2.8% |
| Processed food products | 38.7% | 40.4% | 38.4% |
| Other Sales | 0.2% | 0.1% | 0.0% |
| Total Brazilian market | 51.3% | 53.2% | 52.3% |
|
International Markets |
|||
| Poultry | 32.7% | 31.0% | 33.7% |
| Pork/Beef | 5.0% | 5.9% | 4.0% |
| Processed food products | 6.1% | 6.0% | 6.3% |
| Other Sales | 0.7% | 0.8% | 0.5% |
| Total International markets | 44.5% | 43.7% | 44.5% |
| Other Segments | |||
| Poultry | 0.0% | 0.0% | 0.1% |
| Pork/Beef | 0.1% | 0.0% | 0.0% |
| Processed food products | 0.0% | 0.0% | 0.0% |
| Other Sales | 4.0% | 3.0% | 3.0% |
| Total Other Segments | 4.2% | 3.2% | 3.2% |
| Total | 100% | 100% | 100% |
Overall Comparison of Our Net Sales for the Years Ended December 31, 2021 and 2020
Brazil
We cover substantially all of the Brazilian population through a nationwide distribution network. In the domestic market, we sell our products directly to supermarkets, wholesalers, retail stores, food services and other institutional buyers. The graphs below set forth our Brazilian net sales to supermarkets, retail stores, wholesalers and food services buyers as a percentage of total domestic net sales for the periods indicated.
| 69 |
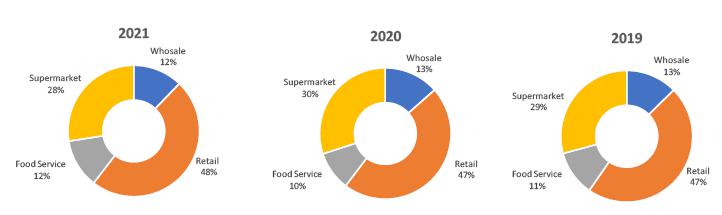
Note: There may be small variations in the percentages presented in the chart above when compared with past reports due to rounding and migration of customers between the sales channels.
Our domestic distribution network consists of 28 distribution centers in several Brazilian states. Refrigerated trucks transport our products from our processing plants to the distribution centers and from the distribution centers to our customers. We have 28 transit points, previously referred as cross-docking points, in several areas of the country that enable us to unload products from large refrigerated trucks onto smaller trucks or vans for transportation to our customers. We own six of our distribution centers and lease the remaining 22 centers, which are listed below under “—Property, Plant and Equipment.” We do not own the vehicles used to transport our products—we contract with carriers to provide this service for us on an exclusive basis.
International
We operate in three business segments, which primarily reflect our geographical structure: Brazil, International (including Halal markets in the Middle East, North Africa, Malaysia and Eastern Europe, as well as Africa, Asia, Europe, Eurasia and the Americas) and Other Segments. The graphs below set forth a breakdown of our net sales by segment.
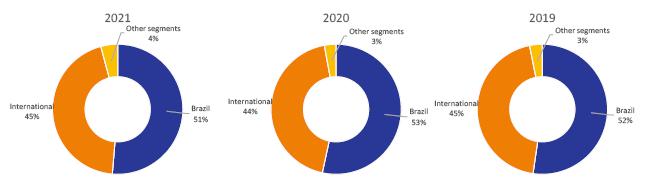
Competition
Brazil
Brazil’s domestic market is highly competitive, particularly for fresh food and frozen poultry and pork products. We endeavor to develop quality products, focusing on innovative solutions that meet clients’ needs and capture value for the strong brands we own, such as Sadia and Perdigão.
| 70 |
In the processed meat and margarine categories, the most recently available percentage of our market share in Brazil in 2020 as reported by A.C. Nielsen shows that we have significant representation in the domestic market, as demonstrated in the graph below, which is separated by retail categories:
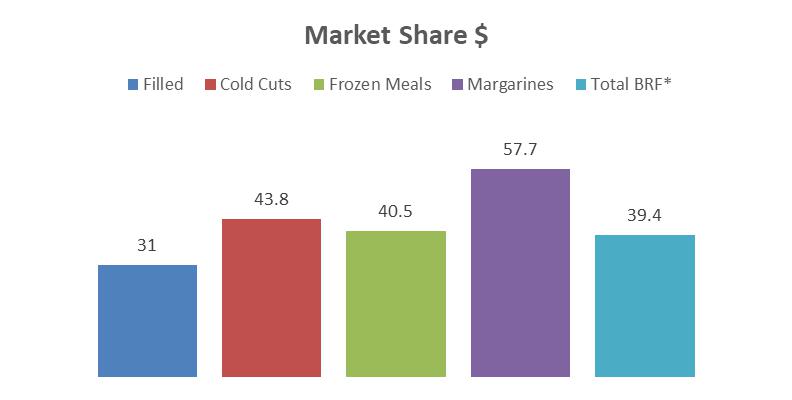
Source: A.C. Nielsen Bimonthly Retail – Margarines and Frozen Meals (October/November 2021 survey); Filled and Cold Cuts (November/December 2021 survey)
Because A.C. Nielsen gathers data from those in the industry who report to it voluntarily in the areas of the country and categories covered by it, the overall market sizes on which these percentages were based are smaller than our own internal estimates of the market sizes that we describe above under “—Brazilian Market.”
Nationally, our main competitor within the Brazilian market for the processed meat segment is JBS (which owns the brands Seara and Rezende) followed by Aurora. The remainder of the market is represented by several small producers, such as Pif Paf Alimentos S.A. and Frimesa, which have relevant performance in the Southeastern and Southern regions of the country, respectively.
In the margarine market, we maintained a leading position with the Qualy brand by a wide margin. Our main competitor is also JBS, which acquired Bunge’s margarine operation (consequently becoming the owner of the brands Delicia and Primor, as well as their previous brands, such as Doriana) followed by Vigor Alimentos S.A.
In the Brazilian market for in natura meat (whole poultry, poultry and pork cuts), we face competition from small producers, some of which operate in the informal economy and offer lower quality products at lower prices. The in natura meat market is volatile and cyclical (higher costs and protein offer). In order to prevent low margins by competing with small producers and keep a stronger market presence, we have changed our price strategy and developed a high aggregate value and innovative portfolio. The initiative has increased our revenue on this portfolio from 5.6% in 2020 to 6.7% in 2021, and we captured opportunities focused on consumer needs for healthy, premium and ready-made products with 123 new products released in 2020 and 87 new products released in 2021. In line with our goal of building stronger margins for in natura meat, we are aiming to increase the per capita consumption of pork cuts in the Brazilian market with a high aggregate value and premium portfolio, capturing bovine meat share of Brazilian consumers.
As mentioned earlier, BRF also has operations of pet food, which is part of the Pet Industry in Brazil. This industry is composed by, other than pet food, veterinary medicines and pet general care, which encompasses pet health care and hygiene, which have been rapidly growing in the past years.
The global pet food market size was valued at R$13 billion in 2020, and is projected to reach $40 billion by 2030, according to Euromonitor, tripling its size during the period, with Brazil playing a key role in this growth. The country has the second largest population of dogs and cats in the world and is the third largest country in total pet population, which market represents 0.36% of total Brazilian GDP, according to ABINPET data.
| 71 |
We believe we are well positioned on this market, being the largest pet food provider in Brazil, with 10% market share and potential to become the second largest in the coming years, according to our estimates based on ABINPET data. Brazil leads in the natural pet food segment, derived from animal ingredients in their natural state. The unpenetrated market is favorable for strong brands, such as the ones we own, to consolidate and lead the national market.
International
We face significant competition in our international markets, both from Brazilian producers and from producers in other countries. Cooperatives are increasingly relevant competitors, as they have tax advantages and certain mobility to reassign their production to foreign markets at times when exports become more attractive than the domestic market. In addition, JBS is one of our direct competitors in the international market that has many of the same competitive advantages that we have over producers in other countries, including natural resources and competitive input costs.
Our chicken and pork cuts, in particular, are price-sensitive and sensitive to substitution with other products. Customers sometimes seek to diversify their sources of supply in different countries, even though we often have a lower cost of production.
Protectionist measures among Brazil’s trading partners are also an important competitive factor. Brazilian exports of poultry and swine are increasingly affected by actions taken by other countries to protect local producers.
Our net sales in the international market reached R$21,514,704 thousand in 2021, an increase of 24.8% from 2020. Despite the still-challenging international market environment in 2021, we believe we export more than our main Brazilian competitors, as we are one of the largest poultry exporters in the world. In 2021, we accounted for 9% of the world’s poultry trade, according USDA.
In our international markets, our competition is based on quality, cost, prices and service to our customers.
Distribution of Products
Brazilian Market
As of December 31, 2021, we operated 28 distribution centers and 28 transit points.
International Markets
We export our products mainly through the ports of Itajaí, Navegantes and Itapoá in the State of Santa Catarina. We also export our products through Rio Grande in the State of Rio Grande do Sul and Paranaguá in the State of Paraná. We store our products in refrigerated storages that are owned and operated mainly by third parties located at ports in the states of Paraná, Santa Catarina and Rio Grande do Sul. In 2021, we packed more than 52% of our export containers at plants, referred to as loading “fresh frozen products.” We contract with exclusive third-party carriers to transport our products from our production facilities to the ports, and we ship our products to export markets through independent shipping companies.
All the ports that we use to load our cargo are private terminals from third parties. We have occasionally experienced disruptions at the ports as a result of logistics challenges, including flooding, strong currents, small drafts, strong winds/waves and winter fog.
Our sales and distribution efforts abroad are coordinated through offices in Austria, Russia, Singapore, South Korea, China, Japan, Vietnam, Saudi Arabia, the United Arab Emirates, Qatar, Oman, Kuwait, South Africa, Uruguay, Chile, and Turkey. We coordinate our marketing efforts and provide sales support to customers in our main international markets through these offices. Our distribution arrangements in our international markets vary according to the market.
| 72 |
Europe. On May 14, 2018, the European Union released its decision to remove 12 of our production facilities in Brazil from the list that permits imports of animal products by the countries in the European Union. Given the ban of imports from our production facilities, we were no longer able to sell our products from such embargoed production plants in the European Union. This suspension on certain products from Brazilian producers caused challenges for our operations in Europe and required us to reorganize our sales and distribution network by strengthening our partnerships with other food processors, food service operators and local distributors. Furthermore, we leveraged our global sourcing network to supply the European market with products produced outside of Brazil. On February 7, 2019, we agreed to sell to Tyson International Holding Co. most of our subsidiaries in Europe, including our Wrexham (UK) and Oosterwolde (Netherlands) processing plants, and our food processing and poultry slaughtering operation in Thailand. This transaction closed on June 3, 2019 for the amount equivalent to R$1,488,033 thousand (US$382,106 thousand, translated to reais at the exchange rate of R$3.8943 as of June 3, 2019). We have undertaken, in the share purchase agreement entered into with Tyson International Holding Co., not to do business or otherwise compete in the sale of poultry products for human consumption in certain jurisdictions in Europe, including the European Economic Area (EEA) and the United Kingdom. That non-compete provision has partially lapsed for certain products and channels. In October 2020, after reaching a commercial agreement with Tyson International Holding Co., we resumed the export of poultry breast cuts to Europe, accelerating our return to the continent. The arrangements with Tyson include a phased removal of the non-compete restrictions in three stages, including our access to (i) B2B, CFR (cost and freight) and wholesalers in Europe by June 2021, (ii) the retail channel in the European market from 2022 and (iii) the Thai market in 2024. By June 2022, we may also invest in businesses that hold import quotas to Europe.
Asia. Asia is a highly diverse continent, both in terms of cultural and economic development characteristics, where we serve over 16 countries, from mainland China to the islands in the South Pacific region. In 2021, China continued to be our largest market in Asia, thanks to local production capacity increase and despite country restrictions due to the COVID-19 pandemic. Our local distribution operation in Shanghai expanded partnerships with retailers, O2O platforms and Sadia’s own ecommerce store by selling Sadia frozen chicken and pork cuts to develop our brand presence. In Japan, our local level of service, coupled with quality standards and product range have made us a preferred supplier of chicken products in the market. In South Korea, we were the first Brazilian producer to export pork cut providing new business opportunities. In Singapore, we consolidated the Sadia brand with a diverse portfolio and brand campaigns, maintaining our presence in modern retails in key products categories. Furthermore, we started our own local distribution model to strengthen even more our brand presence in Singapore. Additionally, in Southeast Asia, we expanded to new countries and clients, serving these markets with a diverse portfolio of chicken, pork and processed meat. In 2020, we concluded the sale of our stake in the joint venture “FFM Further Processing Sdn. Bhd.,” in Malaysia, while maintaining the export leadership to this country.
Middle East. In the Middle East and Turkey we sell to wholesalers, retailers, small stores (traditional trade), food service providers and processors. In these markets, we primarily sell frozen chicken in three categories: whole, cuts and processed products. We have as well launched new products adjacent of the chicken category, such as Frozen French Fries and Frozen Vegetables. We believe we are one of the preferred suppliers of these products in this region due to our quality standards and our long-standing customer relationships. Our biggest brand, Sadia is recognized as the leading food brand in the Middle East and enjoys the highest preference level within the chicken category, according to a study made by Ipsos Research, a third-party consulting firm in 2020. In 2017, we created separate Halal business operations, which was focused 100% in the Halal market. We also announced the completion of the acquisition of Banvit in Turkey, through TBQ Foods GmbH, a joint venture formed with the Qatar Investment Authority in May 2017. Banvit is the number one brand in Turkey in the chicken category, leading with a preference score of 54% according to a study made by Ipsos in 2020. In December 2021, we and QIA have agreed on the termination of the put option available to QIA under the original shareholders’ agreement and agreed to provide QIA with further alternatives to liquidate its investment in Banvit. In any event, we no longer have financial liabilities with respect to QIA. See “Item 4. Information on the Company—A. History and Development of the Company—Investment into TBQ and Acquisition of Banvit – Turkey.” In 2019, our Halal operations were reincorporated into BRF as part of our International operating segment, and they are currently operating similarly to how they operated prior to 2017. In 2021, we concluded the acquisition of a food processing plant in Dammam, Saudi Arabia. See “Item 4. Information on the Company—A. History and Development of the Company—Other Transactions.”
| 73 |
Africa. Our strategy in Africa has focused on unlocking a number of in-market opportunities that fall under the attractive and affordable processed foods category, but also value-added opportunities in key markets. In 2021, we focused on strengthening our partnerships in the region, further improving our leadership position in exports of processed foods to the continent. Our approach to exports in Africa targets sales to distributors with the widest possible distribution. The Sadia and Perdix brands are the primary brands that we have focused on distributing in the region. Angola remains our main market for chicken cuts and processed food, such as franks and mortadella. We also expanded the supply of processed food to South Africa and Mauritius through our facilities in Turkey. Going forward, we will continue to carefully consider future growth markets. Furthermore, our next phase of development will emphasize more control over the interactions between the brands and the consumers by gaining additional insight into consumer preferences to strengthen our value proposition and distribution opportunities, for example by expanding our portfolio of breaded items in South Africa’s main retailers, which we started in 2020.
Americas and Other Countries. We sell our products in the Americas through direct sales to key distributors. Additionally, in 2021, we continued selling chicken cuts, including breasts and wings, to processing companies in Canada, and processed items to the Caribbean. Additionally, Sadia and Qualy are established brands that enjoy significant market shares in Chile and Uruguay, where we maintain local distribution operations, and in Paraguay, where we operate through consolidated local distributors. An example of our commercial strength in the Americas is our leadership in the margarine segment in Chile with our brand Qualy and in the breaded and ready meals segments in Chile and Uruguay with Sadia.
Intellectual Property
Our principal intellectual property consists of our domestic and international brands. We sell our products mainly under the “Sadia,” “Qualy” and “Perdigão” brands in the Brazilian market and mainly under the “BRF Ingredients,” “Perdix,” “Perdigão,” “Sadia,” “Confidence,” “Qualy,” “Borella,” “Sahtein,” “Unef,” “Hilal,” “Balance,” “Gud,” “Onefoods,” and “Deline” brands in our international markets, as described below under “—Marketing.”
We also own several brands for specific products or product lines. In the Brazilian market, these brands include, but are not limited to, “Sadia Bio,” “Sadia Salamitos,” “Sadia Ve&Tal,” Sadia Livre&Lev,” “Sadia Hot Pocket,” “Perdigão Ouro,” “Chester Perdigão,” “Perdigão NaBrasa” and “Claybom.” The “Sadia” trademark is registered in various forms in more than 110 countries. In the Middle East, “Sadia” is registered in various forms in countries such as Saudi Arabia, the United Arab Emirates, Egypt, Jordan, Bahrain, Yemen, Iran, Lebanon, Qatar, Kuwait, and Oman, as well as in countries in Europe, the Caucasus, Asia and Latin America. The Sadia mascot is protected both as a registered trademark and copyright pursuant to a registration with the Brazilian National Library, and such protection extends to countries other than Brazil.
In addition, we have patents registered in Brazil and more than 10 other countries. We have applied to have the Sadia, Perdigão and Qualy trademarks recognized as “well known trademarks” by the Brazilian National Institute for Industrial Property (Instituto Nacional de Propriedade Industrial – INPI), which granted us that recognition for Sadia and Perdigão in June 2011, renewed the recognition in September 2018 and for Qualy in August 2019. We have also applied for our corporate trademark “BRF” (and accompanying design) to be registered in over 100 countries in North and South America, Europe, Asia, Africa and the Middle East.
Lastly, we own several internet domain names, registered with the competent authorities, such as “perdigao.com.br,” “claybom.com.br,” “qualy.com.br,” “sadia.com.br,” “brf.com,” “brf-global.com,” “banvit.com,” “banvitas.com,” “deline.com.br” and “kidelli.com.br.”
Marketing
As one of Brazil’s leading food companies our ambition is to expand to new categories and consumption categories with high added value, recognized and desired brands. With this in mind our marketing efforts are based on: (i) adding value to existing categories and diversifying our product lines; (ii) increasing convenience with respect to our in natura meat and processed products; (iii) ensuring that our brands are recognized and associated with high quality products; and (iv) strengthening our reputation for quality by emphasizing high quality service to our customers. Furthermore, we intend to consolidate our brands, while continuing to tailor our appeal to specific export markets and domestic market segments. We also have an active marketing program using several channels, including television, video, digital, print and brand experiences.
| 74 |
In the Brazilian market, we sell our products primarily under the Sadia, Perdigão and Qualy master brands. Apart from these major brands, we also sell our products under various Sadia lines, including: Sadia Veg&Tal, Sadia Bio, Sadia Orgânico, Sadia Livre&Lev and Sadia Speciale. Additionally, we sell products under various Perdigão lines, including Chester, Ouro, Na Brasa and Meu Menu.
Sadia is the Brazilian most valuable food brand according to Kantar - Brand Z 2020 and holds a leading position in the market. Perdigão leads core volumetric occasions in the Brazilian food market, including in the processed food segment. Chester is a Perdigão line well-known for its Christmas products.
We sell spreads under the Qualy, Deline and Claybom brands. We maintain our leading market position with Qualy by pioneering the margarine market for the last 30 years with consumer centric innovations and progressive positioning that generates consumer connection. In the past decade, we have introduced the first aerated margarine in Brazil, improved the Qualy Cremosa by adding a proprietary mix of vitamins and minerals to our products (Q-Mix), we launched the first zero lactose margarine in the Brazilian market, Qualy Vita, a margarine enriched with Omega 6 and vitamins A, D and E, among others.
In 2019, we introduced a new positioning concept for our Sadia brand based on consumer perception of quality, superiority and transparency. Sadia is the preferred protein brand in the Brazilian food market according to Kantar Insights – Brand Equity Tracking 2021. Sadia and Perdigão, together, hold 42.8% of the food market preference in Brazil. Qualy, Deline and Claybom together have more than 60% of the margarine market preference in Brazil, also according to Kantar Insights – Brand Equity Tracking 2021. Our brands are also amongst the consumers most chosen FMCG brands, Perdigão holds the 4th most preferred position (1st in protein brands), Sadia 9th and Qualy 13th according to Kantar Brand Footprint 2021.
The pandemic has brought about important changes to our customer’s routines, which have required significant shifts in our brand strategy. Among them, we highlight the development of a website designed as a recipe hub, which registered 42.8 million online visits in 2021, and which featured more than 1,200 different recipes for our customers who needed to migrate from eating out to preparing home cooked meals. In addition, the visibility of our brands significantly increased on our commercial partners’ e-commerce platforms as well as on delivery platforms through partnerships. The number of interactions on social networks in 2021 significantly increased, by 25.5%, compared to the same period in 2020. Even with such substantial growth, we maintained generally positive feedback on these initiatives, with an average NPS of 8.63. We have made important improvements in actively listening to our customers through several consumer and market insight initiatives.
In 2021, Sadia launched new products to enhance occasions for culinary indulgence, Coxinhas das Asas (Breaded Buffalo wings) and Burritos, expanded the plant based line Sadia Veg&Tal, including ready to consume hamburgers and meat like chicken, the first zero carbon of the segment. A new clean label line was also introduced in 2021, Sadia Livre&Lev which is composed by ready to consume portioned frozen meals, frozen wraps and ham made with less ingredients. To help consumers in their daily routine, Sadia continued to improve its recipe platform in television and digital. The brand is also a new sponsor of the National Basketball Association, or NBA.
In 2021, Perdigão had a robust always-on brand strategy, both online and offline. The brand started the year with a strong campaign for Mortadela Ouro, celebrating the City of São Paulo’s birthday with Sampadoca activation. The brand also announced its new ambassador, Ivete Sangalo, a famous and prize-winning Brazilian singer, launching the new 360 core campaign, entitled “o Sabor de Perdigão tem Poder”. Finally, Perdigão launched two new lasagna flavors with Chester brand specially developed for Christmas time. Chester communication campaign is celebrating “generosity day”, highlighting the six years of partnership for donations with MESA SESC BRASIL.
| 75 |
Late in 2020, Qualy expanded its portfolio to include new spreads categories by adding Butter and Requeijão (Brazilian cream cheese) and entering in the frozen snacks category with the launch of Qualy buttery ‘Pães de queijo’ line (cheese bread balls). Through our technical knowledge combined with a deep understanding of consumers’ preferences, we seek to maintain our leading market positions. Besides the portfolio expansion, Qualy has also embraced the sustainability pillar. First by reinforcing the reuse of margarine package with the launch of more attractive and resistant collectible versions of containers and recently has committed to the recycling of 100% of the Polypropylene material used in its packs. This is viable due to partnership with ‘eureciclo’ and the process is reviewed by an independent audit firm. The brand is also supporting homemade pastries and cakes entrepreneurs by offering and online platform that offers training, professional techniques and business management skills for free, called “Tudo de Bolo.”
Claybom was relaunched in 2020 with modern looks and portfolio extension by launching a butter-flavored margarine. Deline is our local margarine brand exclusive for North and Northeast regions, developed to deliver local flavors and specificities of the regions culture.
Miss Daisy is our frozen dessert product line. We have produced and sold Miss Daisy deserts since 1999. We offer a wide variety of sweetie pies under the Miss Daisy brand, including chocolate mousse pie, lemon pie, chocolate and vanilla pie, chocolate shavings pie, and Dutch pie. In addition, Miss Daisy develops specific products for Christmas as limited edition: dulce de leche mousse frozen pie with caramelized nuts, and two new hot pie desserts: hazelnut cream and guava paste with cream cheese.
Regulation
MAPA, which is the principal governmental authority overseeing our business, is responsible for the regulation and inspection of activities related to animal health, technical components (including labeling) and quality criteria related to the production of animal food products in all industrial units in Brazil. MAPA also oversees our activities through the Department of Agriculture Defense (Secretaria de Defesa Agropecuária) and the Department of Inspection of Animal Products (Departamento de Inspeção de Produtos Animais).
The inspection activity is performed by placing teams from SIF/MAPA in our facilities. Their scope of work includes all stages of the production process (including receipt of raw materials, production, labeling and storage) and they can identify noncompliance with applicable rules, with penalties ranging from a warning to permanent suspension of business activities.
We are also subject to oversight from a number of other international and Brazilian governmental authorities at the federal, state and municipal levels, which include multiple environmental agencies and the National Agency for Sanitary Surveillance (Agência Nacional de Vigilância Sanitária, or “ANVISA”), which is responsible for supervising, among other matters, the food safety of products sold across Brazil.
| C. | Organizational Structure |
We are an operating company incorporated under Brazilian law, and we conduct business through our operating subsidiaries. The following table sets forth our significant subsidiaries.
| Entities | Country | Main Activity | Interest in Equity as of December 31, 2021 | ||
| BRF GmbH | Austria | Holding | 100.00% | ||
| BRF Global GmbH | Austria | Holding and Trading | 100.00% | ||
| BRF Shanghai Trading Co. Ltd. | China | Import, export and commercialization of products | 100.00% | ||
| Sadia Chile S.A. | Chile | Import, export and commercialization of products | 40.00% | ||
| One Foods Holdings Ltd. | UAE | Holding | 100.00% | ||
| Badi Ltd. | UAE | Holding | 100.00% | ||
| Al-Wafi Al-Takamol International for Foods Products | Saudi Arabia | Import and commercialization of products | 100.00% | ||
| BRF Kuwait WLL | Kuwait | Import, commercialization and distribution of products | 49.00% | ||
| BRF Foods GmbH | Austria | Industrialization, import and commercialization of products | 100.00% | ||
| Al Khan Foodstuff LLC ("AKF") | Oman | Import, commercialization and distribution of products | 70.00% | ||
| TBQ Foods GmbH | Austria | Holding | 60.00% | ||
| Banvit Bandirma Vitaminli | Turkey | Import, industrialization and commercialization of products | 91.71% | ||
| Nutrinvestments BV | The Netherlands | Holding | 100.00% | ||
| Federal Foods LLC | UAE | Import, commercialization and distribution of products | 49.00% | ||
| Federal Foods Qatar | Qatar | Import, commercialization and distribution of products | 49.00% | ||
| BRF Pet S.A. | Brazil | Industrialization, commercialization and distribution of feed and nutrients for animals | 100.00% | ||
| Sadia Chile S.A. | Chile | Import, export and commercialization of products | 60.00% |
| 76 |
The chart below shows our simplified corporate structure.
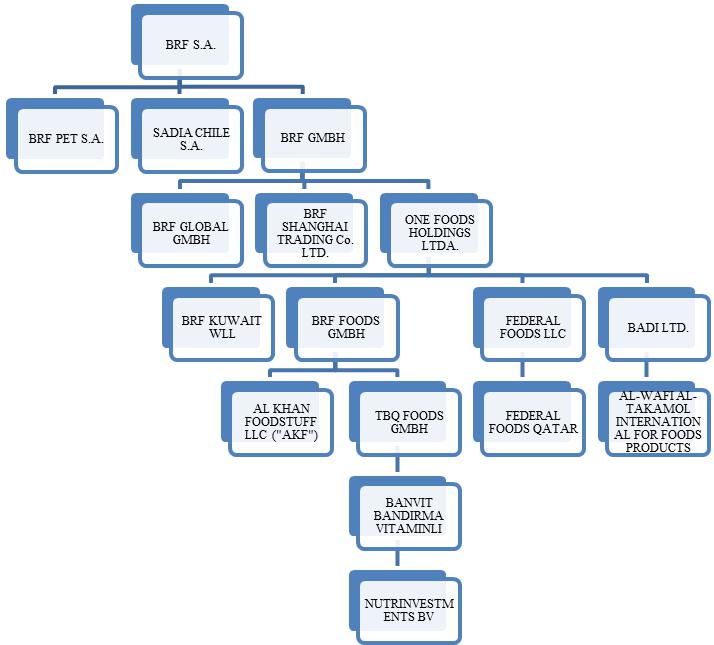
For a complete list of all of our direct and indirect subsidiaries, see note 1.1 to our consolidated financial statements.
| 77 |
| D. | Property, Plant and Equipment |
Production
Our activities are organized into two regions: Brazil and International (consisting of the Middle East, North Africa, Malaysia, Africa, Asia, Europe, Eurasia and the Americas).
In Brazil, as of December 31, 2021, we operated 35 meat processing plants, three margarine processing plants, three pasta processing plants, three soybean crushing plants, three feed meal plants, one commercial feed meal plant, and one dessert processing plant, all of which are located near our raw material suppliers or the main consumer centers. We have an advanced logistics system in our domestic market, with 28 distribution centers, six of which are owned by us and 22 of which are leased from third parties, all of which serve supermarkets, retail stores, wholesale stores, restaurants and other clients.
In our international market, as of December 31, 2021 we operated six industrial facilities for meat processing. Additionally, we operated 26 distribution centers located in Asia, the Southern Cone, and the Middle East as well as commercial offices on four continents.
The table below sets forth our production facilities in Brazil.
|
Production Plant |
State of Location |
Activities |
| Meat Products: | ||
| Buriti Alegre** | Goiás | Poultry slaughtering |
| Campos Novos | Santa Catarina | Pork slaughtering and animal feed |
| Capinzal | Santa Catarina | Poultry slaughtering and industrialized products processing |
| Carambeí**/*** | Paraná | Poultry slaughtering, animal feed and hatchery |
| Chapecó | Santa Catarina | Poultry slaughtering (including turkey), industrialized products processing, animal feed and hatcheries |
| Concórdia | Santa Catarina | Pork and poultry slaughtering, industrialized products processing, animal feed and hatcheries |
| Dois Vizinhos** | Paraná | Poultry slaughtering, animal feed and hatcheries |
| Dourados | Mato Grosso do Sul | Poultry slaughtering, animal feed and hatchery |
| Duque de Caxias | Rio de Janeiro | Industrialized products processing |
| Francisco Beltrão** | Paraná | Poultry slaughtering, animal feed and hatcheries |
| Garibaldi** | Rio Grande Sul | Poultry slaughtering |
| Herval D'Oeste | Santa Catarina | Pork slaughtering, industrialized products and hatchery. |
| Jataí** | Goiás | Poultry slaughtering, animal feed and hatchery |
| Jundiaí | São Paulo | Industrialized products processing |
| Lajeado | Rio Grande do Sul | Pork, poultry slaughtering and industrialized products |
| Lucas de Rio Verde**** | Mato Grosso | Pork and poultry slaughtering, industrialized products processing |
| Marau | Rio Grande Sul | Pork and poultry slaughtering, industrialized products, animal feed and hatcheries |
| Mineiros*** | Goiás | Poultry and special poultry (Chester®) slaughtering and processing |
| Nova Marilândia* | Mato Grosso | Poultry slaughtering |
| Nova Mutum** | Mato Grosso | Poultry slaughtering, animal feed and hatchery |
| Paranaguá | Paraná | Industrialized products processing |
| Ponta Grossa | Paraná | Industrialized products processing |
| Ribeirão das Neves | Minas Gerais | Industrialized products processing |
| Rio Verde*** | Goiás | Pork and poultry slaughtering, industrialized products processing |
| Serafina Corrêa | Rio Grande Sul | Poultry slaughtering |
| Seropédica | Rio de Janeiro | Sausage Factory |
| Tatuí | São Paulo | Industrialized products processing |
| Toledo | Paraná | Pork and poultry slaughtering, industrialized products processing, animal feed and hatcheries |
| Uberlândia** | Minas Gerais | Poultry and pork slaughtering, industrialized products processing and hatcheries |
| Videira | Santa Catarina | Poultry slaughtering, industrialized products, animal feed and hatcheries. |
| Vitória de Santo Antão | Pernambuco | Industrialized products processing |
| Soybean and Margarine Products: | ||
| Paranaguá | Paraná | Margarine processing |
| Uberlândia | Minas Gerais | Margarine processing |
| Vitória de Santo Antão | Pernambuco | Margarine processing |
| Dois Vizinhos** | Paraná | Soybean crushing |
| Videira | Santa Catarina | Soybean crushing |
| Toledo | Paraná | Soybean crushing |
| Pet Food/Feed Meal: | ||
| Bastos | São Paulo | Feed meal / pet food (Mogiana) |
| Campinas | São Paulo | Feed meal / pet food (Mogiana) |
| Ivoti | Rio Grande do Sul | Feed meal / pet food (Hercosul) |
| * | Production facilities owned and operated by third-party producers who produce according to our specifications. |
| ** | Operates in accordance with the Halal requirements. |
| *** | Exports of the Rio Verde and Mineiros plants were suspended by MAPA on March 5, 2018 in connection with Trapaça Operation. For more details, see “Item 8. Financial Information—A. Consolidated Statements and Other Financial Information—Legal Proceedings— Trapaça Operation.” In 2020, Rio Verde plant was withdrawn from the suspension list and started to export again in April 2021. |
| **** | Exports of pork meat from the Lucas do Rio Verde-MT plant to China have been suspended by the GACC. See “Item 3. Key Information—D. Risks Factors Risks—Relating to Our Business and Industry—More stringent trade barriers in key export markets may negatively affect our results of operations.” |
| 78 |
Part of our real estate assets are subject to liens incurred in connection with financing agreements, payment of taxes and lawsuits, as described in note 13 to our consolidated financial statements.
Distribution Centers
We operate 28 distribution centers throughout Brazil, as set forth in the table below.
|
Location |
State |
Owned or Leased |
| Aparecida de Goiânia | Goiás | Leased |
| Belém | Pará | Leased |
| Belford Roxo | Rio de Janeiro | Leased |
| Biguaçu | Santa Catarina | Leased |
| Campinas | São Paulo | Leased |
| Cuiabá | Mato Grosso | Leased |
| Duque de Caxias | Rio de Janeiro | Leased |
| Embu | São Paulo | Leased |
| Exportação Ponta Grossa | Paraná | Owned |
| Fortaleza | Ceará | Leased |
| Itajaí | Santa Catarina | Leased |
| Itapevi | São Paulo | Leased |
| Ivoti | Rio Grande do Sul | Owned |
| Jundiaí | São Paulo | Owned |
| Londrina | Paraná | Leased |
| Manaus | Amazonas | Leased |
| Marau | Rio Grande do Sul | Owned |
| Maringa | Paraná | Leased |
| Nova Santa Rita | Rio Grande do Sul | Leased |
| Paranagua | Paraná | Leased |
| Ribeirão das Neves | Minas Gerais | Leased |
| Rio Verde | Goiás | Owned |
| Salvador | Bahia | Leased |
| São José dos Pinhais | Paraná | Leased |
| Uberlândia | Minas Gerais | Owned |
| Viana | Espírito Santo | Leased |
| Videira | Santa Catarina | Owned |
| Vitória de Santo Antão | Pernambuco | Leased |
| 79 |
Environment
Our activities are subject to strict environmental laws and regulations at the municipal, state and federal levels, which regulate aspects related to water, effluents, solid waste, atmospheric emissions, noise and smells. Our operations are also subject to environmental licensing procedures at the federal, state or municipal levels.
Failure to comply with the environmental laws and regulations can result in civil and criminal penalties against the offender, in addition to indemnification payments for environmental damages. Civil penalties may include fines, the suspension of subsidies by public bodies and the temporary or permanent shutdown of commercial activities. Criminal penalties include fines, temporary loss of rights and prison (for individual offenders) and liquidation, temporary loss of rights, fines and community service (for legal entities). Fines for operating without a license vary from state to state in accordance with the environmental damages caused. Furthermore, under Brazil’s environmental legislation, the corporate form of a company will be disregarded if necessary, to guarantee the payment of costs related to environmental damages.
In our Sustainability Policy, our Health, Safety and Environmental Policy (SSMA Policy) and the Sustainability Pillar of the BRF Operational Excellence System (“SEO”), we established guidelines for environmental management based on national and international references. These instruments seek to ensure that our activities and growth are carried out in accordance with applicable environmental regulations. We have established a set of standards to be used in our environmental management. The monitoring of implementation of these standards is undertaken through technical indicators, such as the Environmental Sustainability Index (ISA) applied to agricultural and industrial plants, with targets that are established on an annual basis. Corrective actions are established to resolve deviations that have been found. An assessment is carried out to make sure that the environmental management system is being observed.
In 2021, we maintained four plants with ISO 14001 certification, all of which are located in Brazil. These plants were audited by regulatory bodies and undergo regular recertification.
Environmental management is part of our daily operations. Our internal controls are built to improve sustainability in our operations. We also develop projects and take part in initiatives to monitor and control environmental matters, and we focus on developing alternative technologies for the generation and use of sustainable energy and the sustainable use of water. The diversification of the energy matrix through the inclusion of clean energy sources, such as solar and wind, is among our most relevant initiatives to mitigate the possible negative impact of climate change on energy availability. Additionally, we analyzed the water vulnerability of our industrial plants by applying two complementary analytical approaches: an internal operational analysis, related to the operations, and an environmental, external analysis, linking the characteristics of the hydrographic basin where the plant is located to the multiple uses of water in the region. Ultimately, the indicators from these approaches are integrated, allowing us to quantitatively review the plant’s water vulnerability.
| 80 |
In 2021, BRF announced the commitment to be Net Zero in greenhouse gas (GHG) emissions by 2040, both in its operations and in its chain. Actions will be implemented to reduce, by 2030, emissions generated by the Company's operations (Scope 1 & 2) and indirect emissions in the chain (Scope 3), in addition to neutralizing residual emissions by 2040. With the advancement of this journey, BRF joined Science Based Targets (SBTi), a global initiative that provides guidelines for setting science-based targets.
The Company identified a set of initiatives on four priority fronts in the value chain, which include the Sustainable Purchase of Grains, promotion of Low-Carbon Agriculture, increased use of Renewable Energy and increased Operational Efficiency.
We use our partnerships with integrated producers to leverage standards in our activities and those of our suppliers. We provide technical support and guidance to help our integrated producers to properly address environmental issues. Additionally, we have structured a program with our integrated producers to collect animal health waste.
We have professional environmental technicians and have trained them in the main aspects of environmental regulations. Our plants are built in line with the applicable environmental regulations. Our environmental structure is composed of experts, engineers and environmental analysts to assist with the implementation and monitoring of legal requirements and internal guidelines. We also have the support of our environmental legal department for legal assistance.
Despite our efforts to comply with the legislation and the environmental regulations, we have occasionally been required to sign environmental agreements with the Brazilian federal and local government related to the non-compliance with environmental licensing requirements. We are required under these agreements to, among other things, address the environmental infraction and remediate any environmental damage. If we do not comply with these obligations, we will be subject to the payment of fines accrued on a daily basis. See “Item 8. Financial Information—A. Consolidated Statements and Other Financial Information—Legal Proceedings—Civil, Commercial and Other Proceedings” for additional information.
Health and Safety
We are committed to the safety of our facilities. All of our employees and contractors in Brazil and abroad must follow our safety protocols. In addition, we have hired a consulting firm to assist with further strengthening our health and safety structure, including with respect to ammonia cooling systems, fire prevention and other health and safety improvements. Our health and safety policies aim to reduce lost time and non-lost time accidents, occupational illnesses and material loss incidents. Between 2019 and 2020, we began to create the framework for and implemented the Health and Safety Pillars applicable to our employees and third-party personnel. These pillars are part of the BRF Operational Excellence System. In this way, we continue reducing the accident frequency rate, calculated based on the Occupational Safety and Health Administration (“OSHA”) requirements, by 56% in three years (2020 to 2023), which we believe demonstrates our commitment to safety.
Insurance Coverage
We purchase insurance to cover our plant assets, equipment and inventory. Our insurance coverage includes comprehensive general liability insurance coverage for operations, executives and employer’s liability, products liability and other claims in connection with the manufacture, production, distribution and sale of our products. We consider the amounts of our insurance coverage to be typical for a company of our size and adequate to meet the foreseeable risks associated with our operations.
| ITEM 4A. | UNRESOLVED STAFF COMMENTS |
None.
| 81 |
ITEM 5. OPERATING AND FINANCIAL REVIEW AND PROSPECTS
| A. | Operating Results |
Overview
BRF S.A. is one of the largest producers of fresh and frozen protein foods in the world in terms of production capacity, according to WattAgNet, with a portfolio of approximately 7,500 stock keeping units (“SKUs”), as of December 31, 2021. We are committed to operating our business and delivering products to our global customer base in line with our core values: quality, safety and integrity. Our processed products include marinated and frozen chicken, Chester® rooster and turkey meats, specialty meats, frozen processed meats, frozen prepared entrees, portioned products and sliced products. We also sell margarine, butter, cream cheese, sweet specialties, sandwiches, plant-based products, animal feed and pet food. We are the holder of brands such as Sadia, Perdigão, Qualy, Perdix, Confidence and Hilal. For the year ended December 31, 2021, we were responsible for 9% of the world’s poultry trade, according to USDA.
Our portfolio strategy is focused on creating new, convenient, practical and healthy products for our consumers based on their preferences. We seek to achieve that goal through strong innovation to provide us with increasing value-added items that will differentiate us from our competitors and strengthen our brands.
With 38 industrial facilities in Brazil, as of December 31, 2021, we have among our main assets a distribution network that enables our products to reach Brazilian consumers through more than 534,500 average monthly deliveries and 28 distribution centers in the domestic market.
We have been a public company since 1980. Our shares have been listed on the Novo Mercado of the São Paulo Stock Exchange as BRFS3 since 2006, and ADRs representing our common shares are traded on the New York Stock Exchange, or “NYSE” (ADR level III).
A breakdown of our products is as follows, which are sold both in Brazil and to our international customers:
| · | Meat Products, consisting of in natura meat, which we define as frozen whole chicken and cut chicken, as well as frozen pork; |
| · | Processed Food Products, including the following: |
| o | marinated, frozen, whole chicken and cut chicken, roosters (sold under the Chester® brand) and turkey; |
| o | specialty meats, such as sausages, ham products, bologna, frankfurters, salami, bacon and other smoked products; and |
| o | frozen processed meats, such as hamburgers, steaks, breaded meat products, kibbeh and meatballs; |
| · | Other Processed Products including the following: |
| o | Halal products for Islamic markets in accordance with the Halal method of animal slaughtering; |
| o | margarine, butter, cream cheese and cheese bread; |
| o | frozen prepared entrees, such as lasagna, macaroni and cheese, pies, ready-to-eat meals and pizzas, as well as other frozen foods; |
| o | plant-based products, such as nuggets, pies, vegetables and burgers; and |
| 82 |
| o | snacks (salamitos); |
| o | frozen desserts; |
| · | Other, consisting of soy meal, refined soy flour, animal feed and pet food. |
In Brazil, as of December 31, 2021, we operated 35 meat processing plants, three margarine processing plants, three pasta processing plants, three feed meal plants, one commercial feed meal plant, one dessert processing plant and three soybean crushing plants. All of these industrial facilities are located near our raw material suppliers or main consumer centers. We have an advanced logistics system in our domestic market, with 28 distribution centers, six of which are owned by us and 22 of which are leased from third parties, all of which serve supermarkets, retail stores, wholesale stores, restaurants and other clients.
In our international market, as of December 31, 2021, we operated six industrial facilities for meat processing. Additionally, after giving effect to the divestitures made in connection with our financial and operational restructuring plan, we operate 26 distribution centers and 11 warehouses located in Asia, the Southern Cone and the Middle East, as well as commercial offices on four continents.
We are also focused on addressing the impact of climate change on the environment and our business. Among the initiatives that we have taken to reduce our exposure to climate change and to maintain our competitiveness in terms of costs is the monitoring of grain stocks and purchases and the constant monitoring of the weather in agricultural regions to guide our purchasing decisions, as well as anticipating price movements in the commodity markets. Other initiatives include technological innovations in our animal-raising facilities to improve efficiency and safeguard animal welfare. In addition, we recognize that consumers, investors and other stakeholders are more conscious of social and environmental aspects of the production chain. The commitment assumed by us to achieve Net Zero by 2040, established in 2021, was an important step in the climate agenda. We have taken initiatives to address this aspect, such as the Sustainable Grain Purchase Policy, which establishes guidelines with regard to commitments and principles to be applied in the business, with a focus on incorporating environmental, social and sustainable practices to manage BRF's production chain and investments in clean energy, in partnerships formed in 2021 with AES Brasil Energia and Ïntrepid Participações S.A., with which it will be possible to reach almost 90% of electricity from clean sources in BRF's operations in Brazil. From 2014 until 2021, we allocated R$1,258.2 million (€360.1 million) to projects with environmental benefits (the amount referring to the investments made in 2021 is still subject to a second opinion from an external certifier, which may result in an adjustment of this amount), and we planted a renewable forest covering 30 thousand hectares.
Principal Factors Affecting Our Results of Operations
Our operating results, financial condition and liquidity have been and will continue to be influenced by a broad range of factors, including:
| · | economic conditions in Brazil and globally; |
| · | disruptions in consumption and trade patterns, supply chains and production processes resulting from the coronavirus (COVID-19 virus) pandemic; |
| · | the effect of trade barriers and other restrictions on imports; |
| · | concerns over African swine fever, avian influenza and other diseases of human and animal origin; |
| · | sensitivity of the domestic market to changes in global demand, including the impact of decisions by our main Brazilian competitors and temporary increases in supply from producers in other countries; |
| · | changes in commodity prices; |
| · | fluctuations in exchange rates and inflation; |
| 83 |
| · | interest rates; and |
| · | freight costs and volume. |
We present a more detailed description of each of these factors below.
Brazilian and Global Economic Conditions
The CMN set the target inflation in Brazil at 3.75% for 2021, with a potential range of 1.5 percentage points higher or lower than this target. The inflation rate, which had been above the target at 4.31% in 2019, increased to 4.52% in 2020 and increased to 10.06% in 2021. Price increases generally reduce consumers’ purchasing power, particularly among the lower income class, and ultimately limit consumption.
The Brazilian labor market registered an average unemployment rate of 11.6% in 2021, according to the IBGE’s National Household Sample Survey (Pesquisa Nacional por Amostra de Domicílios, or “PNAD”), which represents an improvement when compared to the rate of 13.9% in 2020. Additionally, after decreasing to 78.5 points in 2020, Brazilian consumer confidence decreased to 75.5 points in December 2021, according to a Consumer Survey of Fundação Getúlio Vargas (FGV).
Real GDP in Brazil increased at an average annual rate of 9.0% from 2005 through 2021. For two consecutive years, in 2015 and in 2016, Brazil’s GDP decreased by 3.5%. In 2021, GDP increased by 4.6% compared to 2020. Reacting to this weak economic situation, the Central Bank lowered the SELIC interest rate, which is the short-term benchmark interest rate. Overall, the long-term trend in interest rates remains downward, from 18% as of December 31, 2005 to 9.25% as of December 31, 2021.
The Brazilian real depreciated 6.88% against the U.S. dollar in 2021, from R$5.20 per US$1.00 in December 31, 2020 to R$5.58 per US$1.00 in December 31, 2021.
For a discussion on the global economic conditions and further information on the conditions on our export markets and the Brazilian market, see “Item 5. Operating and Financial Review and Prospects—D. Trend Information.”
Effects of Trade and Other Barriers
Global demand for Brazilian poultry and pork products is significantly affected by trade barriers, including: (i) tariff barriers, which ultimately protect certain domestic markets; and (ii) non-tariff barriers, mainly including import quotas, sanitary barriers and technical/religious barriers. In addition, some countries employ subsidies for production and exports, which tend to distort international trade and interfere with our business. We continuously monitor trade barriers and other import restrictions, either directly or through specialized consultancy firms, in the global poultry, pork and beef markets, since these restrictions significantly affect the demand for our products and the levels of our exports. For more information about risks relating to trade barriers, see “Item 3. Key Information—D. Risks Factors Risks—Relating to Our Business and Industry—More stringent trade barriers in key export markets may negatively affect our results of operations.” Certain examples of these barriers are described below.
Tariff barriers
The EU (since 2007), Russia (since 2012) and Mexico (since 2013) have protected their meat industries by applying import quotas and high tariffs on volumes imported outside of the quota.
In September 2013, South Africa raised duties on chicken products originating in all countries except the EU (due to a free trade agreement between them that establishes zero tariff on poultry products). Tariffs increased to 82% on whole chicken, 12% on boneless cuts and 37% on bone-in cuts. In 2020, the South African government announced increases in import tariffs, applied to imports of bone-in (from 37% to 62%) and boneless (from 12% to 42%) chicken in South Africa, which had a negative impact on our competitiveness and profitability in the country. In February 2021, the South African Government announced the beginning of an anti-dumping investigation against certain Brazilian poultry exporters (we are not being investigated), for frozen bone-in chicken. In December 2021, the decision was published in the local official gazette on the provisional anti-dumping tariffs to be enforced immediately in South Africa (bone-in chicken). The South African government decided for a 265% provisional tariff for the companies that have not applied for an individual defense, which was BRF’s case. These provisional tariffs will be applied until June 14, 2022, while this investigation is still ongoing. There can be no certainty that the local government will not impose further restriction to poultry and/or food trade.
| 84 |
In December 2016, Saudi Arabia increased its import tariff for poultry meat from 5% to 20%, which was followed, in 2020, by an increase in VAT applicable to poultry and poultry parts, from 5% to 15%.
In August 2017, the Chinese government initiated an antidumping investigation in connection with Brazilian exports of whole chicken and chicken parts, including our exports. In the preliminary determination released in June 2018, Chinese authorities imposed provisional duties on the imports of poultry products from Brazil. The investigation ended in February 2019 and Brazilian exporters agreed to certain minimum export prices for sales to China.
In August 2018, Iraq increased the tariff on poultry products from 10% to 60%.
Non-tariff barriers
Import quotas
In 2005, Brazil obtained a favorable result in a panel against the EU at the WTO regarding the reclassification (and tariff increase) of salted chicken breast meat exports. In return, the EU introduced quotas on imports of certain tariff codes, especially for salted chicken breast, marinated turkey breast and processed chicken, and in July 2007, Brazil was awarded the majority of these quotas.
Russia utilizes quotas to control imports of poultry and beef. As part of the negotiations surrounding its accession to the WTO, Russia made some changes to its quota system in 2013. It abolished its quotas for pork on January 1, 2020. As a result, imports of pork are subject to a 25% flat import tariff.
On November 23, 2021, the Russian federal service for veterinary and phytosanitary surveillance approved the export to Russia from 4 out of 9 of our pork plants from Brazil. The Brazilian Ministry of Agriculture, announced Russian plans to set a duty-free import quota for up to 100,000 tons of pork meat to be imported in the first half of 2022, along with 200,000 ton duty-free import quota for beef, in order to boost domestic supply. This information has been confirmed and the quotas approved in December 2021. The import of pork and beef is allowed out of quotas, from approved plants, and subject to 25% and 15% of import duty respectively.
Our historical exposure to Russia has been limited and we ceased to export products to the country in light of the ongoing military conflict between Russia and Ukraine. See “Item 3. Key Information—D. Risks Factors Risks—Relating to Our Business and Industry—Geopolitical and other challenges and uncertainties due to the ongoing military conflict between Russia and Ukraine could have a material adverse effect on the global economy, certain material and commodity prices and our business.” for further information regarding the impact of the ongoing war between Russia and Ukraine in our business.
In December 2017, Mexico renewed its import poultry meat quota of 300,000 tons, which expired in October 2019. No subsequent negotiations have taken place since the expiration. As a result, during 2020, we were unable to export poultry meat to the Mexican market due to the absence of import quotas. In September 2021, the Mexican government announced an additional quota of 30,000 tons of exports of chicken from Brazil. The uncertainty about the size and periodicity of exports quotas tend to halt our ability to adequately plan for exporting to the country and may affect negatively our business.
Additionally, the Saudi Arabian government has announced the adoption of an import license system, which has not been implemented yet. Once it is implemented, Saudi Arabia may have the ability to strengthen its control over imported volumes and set limitations. Also, in April 2018, Saudi Arabia instituted a no-stunning requirement for the animal slaughtering process. Saudi Arabia claimed that Brazilian companies’ chicken slaughtering practices violated Halal principles due to the use of an electric shock to stun the birds. We, along with other Brazilian companies, were therefore required to migrate our production processes to non-stunning slaughters in order to supply the Saudi Arabian market. We have incurred, and expect to incur, additional costs in connection with these requirements for exporting to Saudi Arabia.
| 85 |
In June 2021, over 12 companies, including us, were invited to attend a meeting with the undersecretary of the Oman Ministry of Agriculture. In the meeting we were informed about a quota program which the Oman government is planning to implement to protect local production. According to this program, they will decrease 10% from the total import of whole poultry of each company that export whole poultry to their country. The Oman Ministry of Agriculture sent a communication to all companies confirming the implementation of this program as of January 1, 2022. The 10% will be calculated based on an average of imports over the past 3 years.
Sanitary barriers
Despite progress in trade negotiations, several major markets are not yet open to Brazilian meat products due to sanitary barriers, including the European Union and Colombia for pork, and Taiwan and Panama for chicken.
As a result of the Trapaça Operation, on March 5, 2018, we received notice from MAPA that it immediately suspended exports from our Rio Verde, State of Goiás, Carambeí, State of Paraná and Mineiros, State of Goiás plants to 13 countries with specific sanitary requirements related to Salmonella spp. As a precautionary measure, MAPA also suspended exports from 10 other BRF plants to the European Union on March 15, 2018. This precautionary suspension was lifted on April 18, 2018 by MAPA. On May 14, 2018, the European Union released its decision to remove 12 of our production facilities in Brazil from the list that permits imports of animal products by the countries in the European Union. The European Union generally has stricter requirements related to salmonella levels and other food safety standards compared to Brazil and the international markets in which we operate. Given the ban of imports from our production facilities, we are no longer able to sell our products from such embargoed production plants in the European Union and need to direct excess production capacity resulting from such suspension to other markets, which may not occur at similar prices or margins.
Between April 29 and April 30, 2020, our production facility located in Rio Verde, in the State of Goiás, was temporarily suspended in compliance with the determination by the local Federal Inspection Service, or SIF, due to deviations found in the local water supply system.
In 2020, China’s General Customs Administration suspended the authorization for chicken and pork exports from two BRF plants, located in Dourados (SIF 18) and Lajeado (SIF 3975). The suspension was due to alleged concerns over COVID-19 in Brazil. These two plants had their suspensions reversed by the Chinese authorities later in 2020, and they received clearance to resume exports. On August 3, 2021, we became aware through a publication on the website of the GACC of the suspension of the export to China of pork meat from our Lucas do Rio Verde-MT pork plant as of that date. The alleged reason was the malfunctioning of the refrigerating system of one single pork meat container, which was later demonstrated through the transporter’s system log to be the transporter’s sole responsibility and fault. Despite evidence being sent to the Chinese authorities, the suspension has not yet been reversed, which may indicate that the country may impose new similar restrictions. On December 16, 2021, we were also informed by MAPA and GACC of the suspension of the export to China of poultry meat from Marau under the allegation of the finding of content improper for human consumption in a batch of poultry feet. On March 4, 2022, we were informed by GACC that it was suspending, as of March 5, 2022, the export to China of poultry meat from our Lucas do Rio Verde-MT plant as well. The alleged reason for this suspension were certain nonconformities identified during a videoconference audit executed by GACC, such as the occurrences of COVID-19 infections among our employees that were not disclosed to it and the lack of disinfection tank and detections of salmonella above the maximum limit in the reception of live poultry and in the processing of poultry products.
In 2020, the Philippines imposed a temporary ban on poultry meat imports from Brazil after two cities in China found traces of COVID-19 in cargoes of imported frozen food, including chicken wings, from Brazil. The Philippines lifted the embargo on imports of Brazilian chicken products in December 2020. Since no other countries followed the Philippine government’s embargo and we have not been notified, whether directly or through the Brazilian government, of other countries adopting a similar position, we believe that it is unlikely that other similar embargos will occur.
| 86 |
Further, on May 6, 2021, the SFDA notified the WTO Committee on Sanitary and Phytosanitary Measures with respect to a change of the regulation for expiration dates, consisting of a reduction of the shelf-life of in natura frozen chicken from 1 year to 3 months from the date of slaughter. In March 2021, the SFDA started a reinforced control system on imported meat, resulting in up to 3 months delays in products clearance at WTO ports and thus negatively affecting our business results. However, the SFDA withdrew the implementation of this measure, but there is no assurance that this may be reinstated in the future.
Technical barriers
In the short term, we must respond quickly to the imposition of any new restrictions, including temporary health-related restrictions, by redirecting products to other markets or changing product specifications to comply with the new requirements in order to minimize their effect on our net export sales. In the long term, these restrictions may affect the growth rate of our business.
In April 2018, Saudi Arabia instituted a no-stunning requirement for the animal slaughtering process. Saudi Arabia claimed that Brazilian companies’ chicken slaughtering practices violated Halal principles due to the use of an electric shock to stun the birds. We, along with other Brazilian companies, were therefore required to migrate our production processes to non-stunning slaughters in order to supply the Saudi Arabian market. We have incurred, and expect to incur, additional costs in connection with these requirements for exporting to Saudi Arabia. In January 2019, the Saudi Arabian Food and Drug Authority published a report authorizing 25 Brazilian facilities to produce chicken meat for the Saudi Arabian market, which included eight of our plants. One of our plants (Lajeado, State of Rio Grande do Sul) which had previously produced chicken meat for the Saudi Arabian market, was not included as an authorized plant. However, the eight authorized plants have provided sufficient capacity to meet the demand of this market. We also expect to be able to continue to shift production of chicken meat for Saudi Arabia to the authorized plants without a significant disruption to our shipments to Saudi Arabia. In 2021, the country suspended other 11 Brazilian plants, but none of them pertains to BRF.
In 2020, Saudi Arabia continued its practice of creating import barriers, such as by suspending imports from the Francisco Beltrão (SIF 2518) and Dois Vizinhos (SIF 1985) plants in February 2020 without providing technical justifications, increasing the costs of Halal certification by requiring accreditation at the SFDA Halal Center, and adopting import licenses to control the volume of imports. The import license requirements have not yet been fully implemented, and we do not know if the Saudi government will use this tool as a trade barrier. Saudi Arabia also imposed an informal import ban in 2020 against products originating from Turkey, which affected our subsidiary Banvit’s exports.
Additionally, since 2018, the government of South Africa has threatened to launch an anti-dumping investigation against Brazil related to certain protein cuts allegedly being exported at lower prices than those in the South African domestic market. Finally, in March 2021, the South African government has opened up an anti-dumping investigation against certain Brazilian poultry exporters (we are not being investigated), which may result in the imposition of new restrictive measures towards Brazilian exporters. For more information, see “Item 3. Key Information—D. Risk Factors—Risks Relating to Our Business and Industry—More stringent trade barriers in key export markets may negatively affect our results of operations.”
In 2020, the Indonesian government appealed a WTO decision in a case filed by the Brazilian government against chicken import restrictions imposed by Indonesia. The WTO’s appellate body’s activities are suspended waiting the appointment of judges to the appellate body. As a result, we are unable to estimate when this case may be resolved. Since 2020, we have also observed increased efforts in Malaysia in enforcement activities concerning the Halal certificate regulations, resulting in increased difficulty in fulfilling all the requirements. Although, as of the date of this annual report, we have been able to overcome these difficulties for cargo release, we anticipate that this trend may continue in Malaysia, with the imposition of trade barriers.
Angola also imposed certain controls over the issuance of import licenses in 2020 as a way of reducing imports. Angola is facing a foreign currency shortage, mainly U.S. dollars, which has impacted their import volumes. Additionally, also in 2020, Iraq imposed technical barriers by means of a ban on importing poultry parts. In 2019, Iraq had already banned the imports of whole poultry.
| 87 |
In Turkey, there is a risk related to the expiration and non-renewal of the license relating to the validity of transgenic events, which would impact Turkish imports of transgenic soybeans, thereby affecting the cost of our local production.
COVID-19 Pandemic
On March 11, 2020, the World Health Organization declared COVID-19 as a global pandemic. The worldwide spread of COVID-19 has triggered the implementation of significant measures by governments and private sector entities which, in turn, have disrupted consumption and trade patterns, supply chains and production processes on a global scale and specifically relating to our business, including with respect to product shipments. In addition, customers from certain regions in which we operate are being affected, mainly by the measures of social distancing imposed by authorities and restrictions on public gatherings or interactions, which may limit the opportunity for our customers to purchase our products. The consequences of the pandemic could also result in the destabilization of commodity prices or the economies and financial markets of many countries, resulting in an economic downturn that could affect demand for our products and have a material adverse effect on our results of operations. Any deterioration in the credit cycle of our customers as a result of the pandemic or the measures implemented to address it, may adversely affect our results and cash flows in the future.
Our operations include global production and distribution facilities, and if there is an outbreak of COVID-19 in our facilities or the communities where we operate and distribute our products, our production, operations, employees, suppliers, customers and distribution channels could be severely impacted. Ports and other channels of entry may be closed or operate at only a portion of capacity, as workers may be prohibited or otherwise unable to report to work, and means of transporting products within regions or countries may be limited for the same reason, along with the potential for transport restrictions related to travel bans. In addition, countries to which we export our products may institute bans on the importation of our products, products produced by our partners or on all or some food products from Brazil in general based on perceived COVID-19 concerns.
Since the beginning of the global pandemic, we have continued to operate our plants, distribution centers, logistics, supply chain and administrative offices, although currently we have implemented a remote work program in some of our corporate offices and we had to briefly close in 2020 our Lajeado and Rio Verde plants, in each case as the result of an outbreak. Our management has developed and implemented contingency plans to maintain the operations and monitors the effects of the pandemic through a permanent multidisciplinary monitoring committee, formed by executives, specialists in the public health area and consultants. We implemented a comprehensive testing program using RT-PCR and serological methodologies as part of the actions to prevent the spread of the virus in our plants. Our operation can be affected by COVID-19 through reduction of the labor available by COVID-19, reducing the productivity of manufacturing operations, lack of raw materials and packaging, and delay in line growth and maintenance projects due to reduced availability of third parties suppliers.
However, we have incurred direct and incremental expenditures, mainly related to personnel, prevention, control, logistics and philanthropic donations, as a result of the pandemic in the amount of R$288,851 thousand in the year ended December 31, 2021. We have approved the donation of food, medical supplies and other support to research and social development funds, in an amount equal to approximately R$100 million, in order to contribute to the efforts to combat the effects of the COVID-19 pandemic, including support to hospitals, philanthropic entities, social assistance organizations and health professionals in the states and municipalities in which we operate.
Overall, we have not experienced significant negative financial effects arising from the COVID-19 pandemic since it was declared. However, despite having more visibility on the impact of the pandemic compared to March 2020, we may still suffer changes in our operational performance, which may in turn adversely affect our financial position. In March 2020, we sought to strengthen our liquidity profile in light of prevailing market uncertainty, and, between March 26, 2020 and May 15, 2020, we procured bank loans in Brazil totaling R$2.4 billion, with an average term of approximately one year. During the second half of 2020, we prepaid R$2 billion of these precautionary short-term loans and further extended our average debt maturity profile to 9.9 years as of December 31, 2020. We currently have R$3 billion undrawn and available under a revolving credit facility with Banco do Brasil. We have adopted several guidelines, as part of our Financial Risk Management Policy, to ensure that we maintain an appropriate level of liquidity by setting minimum cash and liquidity requirements depending on future expectations and obligations. We consider our liquidity position to be adequate taking into account our payment obligations, including through our capital expenditure plans, in line with our Vision 2030 Plan. We nevertheless recognize that unfavorable operating results may have an adverse impact on our financial metrics, such as leverage. At the same time, we may experience increases in general customer default rates in connection with the pandemic and a resulting increase in our expected credit losses. The possible deterioration in the credit cycle of our customers may adversely affect our results, financial position and cash flows in the future.
| 88 |
The increase in volatility of market risks has significantly affected the fair value of our assets and liabilities, particularly considering wide variations in foreign exchange rates. Additionally, the heightened uncertainty of projections has increased the challenge of accurately measuring certain of our assets and liabilities. However, the judgments used have not been changed significantly, and we are still able to prepare our financial statements on a timely basis. Our management has taken into account the effects and uncertainties regarding the pandemic in the projections of our results and cash flows. As described in note 13.1 to our consolidated financial statements, no impairment has been recognized to our cash generating units. Due to the high volatility and uncertainty around the length and impact of the pandemic, we will continue to monitor the situation in the markets in which we operate and evaluate any necessary adjustments to the assumptions and estimates we use in preparing our financial statements.
The COVID-19 pandemic also resulted in a widespread health crisis that destabilized commodity prices and the economic conditions and financial markets of many countries, resulting in an economic downturn that could affect demand for our products and have a material adverse effect on our results of operations. The current pandemic and any future pandemics could also adversely affect consumer demand, as quarantines may inhibit consumption, and restrictions on public gatherings or interactions may limit the opportunity for our customers and consumers to purchase our products.
In addition, demand for our products has been affected as a result of the COVID-19 pandemic worldwide, especially in our international operations, due to the partial discontinuation of our foodservice channel, weakening of global commercial activities, reduction of population income, and changes in consumption habits. As a result, over the past year we have observed lower average prices as a consequence of relocating production from foodservice to other channels with lower prices and profitability, although we did not register excess inventory.
Effect of Animal Diseases
Avian Influenza
Avian influenza has captured the attention of the international community over the years with outbreaks in poultry having serious consequences on both livelihoods and international trade in many countries. In addition, although most avian influenza viruses do not infect humans, some, such as avian influenza H5N1 and H7N9, are well known to the public because of their implication in serious and sometimes fatal infections in people.
Demand for our products can be significantly affected by outbreaks of animal diseases like avian influenza. If significant numbers of new avian influenza cases were to develop in humans, even if they do not occur in any of our markets, the demand for our poultry products both inside and outside Brazil would likely be negatively affected and the extent of the effect on our business cannot be predicted. Even isolated cases of avian influenza in humans could negatively impact our business due to the public’s sensitivity to the disease.
Brazil has not yet had a documented case of avian influenza, although there are concerns that an outbreak of avian influenza may occur in the country in the future. Any outbreak of avian influenza in Brazil could lead to the required disposal of our poultry flocks, which would result in decreased sales in the poultry industry, prevent recovery of costs incurred in raising or purchasing poultry and result in additional expense for the disposal of poultry. In addition, any outbreak of avian influenza in Brazil would likely lead to immediate restrictions on the export of some of our products to key export markets. Preventive actions adopted by Brazilian authorities, if any, may not be effective in precluding the spread of avian influenza within Brazil. In addition, any future significant outbreak of avian influenza in Brazil could eventually lead to pressure to dispose of our hogs, even if no link between the influenza cases and pork consumption is shown. Any such disposal of our hogs would result in decreased sales of pork, prevent recovery of costs incurred in raising or purchasing our hogs and result in additional expense for the disposal of hogs.
| 89 |
Other Animal Diseases
In addition, demand in our export markets may similarly be influenced by other animal diseases. For example, pork imports from most Brazilian states were banned in Russia from 2005 to 2007 due to cases of foot-and-mouth disease affecting cattle in the States of Mato Grosso do Sul and Paraná, since the disease affects cloven-hoofed animals, such as swine.
Other diseases affect the international trade, as a viral disease called porcine epidemic diarrhea (“PED”), diagnosed in North America and Asia in the last years. The disease was characterized by diarrhea, dehydration, wasting and or growth/retardation and high mortality in suckling pigs. Consequently, the disease causes a huge economic impact in the swine industry. Biosecurity and sanitation are the most effective measures to prevent the introduction and spread the virus.
Besides PED, outbreaks of African swine fever (“ASF”) has been reported in many swine farms in China since August 2018. Beyond China, many countries from Europe, the USA and more recently, the Dominic Republic also detected the disease. At the national level, one major consequence of ASF is the loss of status of export, apart from the cost of implementing drastic measures to control the disease.
In addition to PED and ASF, Classical swine fever (CSF) is considered one of the most important diseases of swine. Although all our hogs are sourced in Brazil from zones free of Classical Swine Fever, there have been a number of recent outbreaks outside of these zones. In October 2018, an outbreak of Classical Swine Fever was confirmed in the Brazilian State of Ceará. Additionally, in 2019, a case of Classical Swine Fever was confirmed in the Brazilian States of Alagoas and Piauí. In 2020, two additional cases were reported in the State of Piauí. Brazil has two zones regarding the sanitary status of Classical Swine Fever, the free zone that is comprised of 16 Brazilian states and includes more than 95% of the Brazilian commercial pork production and a non-free zone, located in the north of Brazil. All three states with confirmed cases of Classical Swine Fever are located outside the Classical Swine Fever-free zone. The Brazilian government also took action to contain the outbreak. No formal commercial embargoes were announced as a result of this outbreak.
Effect of Export Market Demand on the Domestic Market
Demand fluctuations for poultry, pork and beef products in our export markets often have an effect on the supply and selling prices of those products in the Brazilian market. Brazilian exporters generally redirect the products for international markets to the domestic market, increasing the supply of those products domestically and often negatively impacting the selling price. This consequently affects our net sales in the domestic market.
For example, in 2017, Russia banned the imports of pork meat from Brazil, alleging the presence of ractopamine in the animals’ feed meal. As a result, nearly 259.4 thousand tons per year had to be redirected to other markets, which ultimately generated excess supply in the domestic market and contributed to the decrease in pork carcass prices in 2018.
In August 2017, the Chinese government initiated an antidumping investigation in connection with Brazilian exports of whole chicken and chicken parts, including our exports. In the preliminary determination released in June 2018, Chinese authorities imposed provisional duties on the imports of poultry products from Brazil. The investigation ended in February 2019 and Brazilian exporters agreed to certain minimum export prices for sales to China.
In April 2018, Saudi Arabia instituted a no-stunning requirement for the animal slaughtering process. Saudi Arabia claimed that Brazilian companies’ chicken slaughtering practices violated Halal principles due to the use of an electric shock to stun the birds. We, along with other Brazilian companies, were therefore required to migrate our production processes to non-stunning slaughters in order to supply the Saudi Arabian market.
| 90 |
In 2019, Chinese demand for imported protein increased significantly because of African swine fever, a deadly virus that reduced drastically the local supply of pork meat and, consequently, increased local and global protein prices. In 2019, China enabled nine poultry plants, six pork plants and 22 bovine plants from Brazil to increase their import volumes and to address the local protein scarcity. However, in August 2021, China’s GACC suspended the export to China of pork meat from our Lucas do Rio Verde plant. On December 16, 2021, we were also informed by MAPA and GACC of the suspension of the export to China of poultry meat from Marau under the allegation of the finding of content improper for human consumption in a batch of poultry feet. On March 4, 2022, we were informed by GACC that it was suspending, as of March 5, 2022, the export to China of poultry meat from our Lucas do Rio Verde-MT plant as well. The alleged reason for this suspension were certain nonconformities identified during a videoconference audit executed by GACC, such as the occurrences of COVID-19 infections among our employees that were not disclosed to it and the lack of disinfection tank and detections of salmonella above the maximum limit in the reception of live poultry and in the processing of poultry products.
In 2020, as a result of the Trapaça Operation, the Saudi Food & Drug Authority (“SFDA”) temporarily suspended the export authorization of two of our plants, Dois Vizinhos (SIF 2518) and Francisco Beltrão (SIF 1985). The Saudi Arabian government agency based its decision on news reports relating to the investigation. The case has been brought by Brazil as a Specific Trade Concern (“STC”) in the 4th meeting of the Sanitary and Phytosanitary Measures (“SPS”) Committee at the World Trade Organization (“WTO”), held in November 2020. Similarly, in the same year, we have received governmental approval from China to export from two of our plants, Dourados (SIF 18) and Lajeado (SIF 3975).
In 2021, Saudi Arabia banned the imports of chicken from some Brazilian slaughterhouses. This ban only affected the competition, while we continued to be able to export. In addition, Russia and other countries in the region increased their quotas for Brazilian pork imports, creating greater opportunities for international negotiations. In relation to China, the country banned beef imports from Brazil from September to December 2021, in addition to banning the import of pork meat from Germany due to ASF cases.
We monitor the actions of our domestic competitors since they are also impacted by external market changes and may react accordingly, redirecting their products to the domestic or external markets. In addition, we monitor fluctuations in supply generated by producers in China, the U.S., the European Union and other regions, since fluctuations in production in those markets can lead to variations in supply in other countries.
Commodity Prices
Many of our raw materials are commodities whose prices consistently fluctuate in response to market forces of supply and demand. We purchase large quantities of corn, soybean meal, vegetable oils and soybeans (grain), which we use to produce substantially all of our own animal feed. For the most part, the commodities we purchase are priced in reais. While input costs are denominated in real, the prices of the commodities we purchase tend to follow international prices and are influenced by exchange rate fluctuations. Purchases of corn, soybean meal and soybeans represented approximately 46.5% of our cost of production in 2021, compared to 32.3% in 2020. Although we produce most of the hogs we use for our pork products, we also purchased hogs on the spot market in 2021. We purchased 3.8% of the total number of hogs slaughtered in 2021 on the spot market.
In addition, the selling prices for many of our products, including substantially all our export products, are highly sensitive to the market price of those commodities and fluctuate with them. In 2021, the average corn price in Brazil was 60% higher than in 2020. In 2021, the average soybean meal price in Brazil was 22% higher than in 2020. The effect of decreases or increases in prices of raw materials on our gross margin is greater for fresh products relative to value-added products.
Our ability to pass on increases in raw material prices through our selling prices is limited by prevailing prices for the products we sell in our domestic and export markets, especially for fresh products.
For further information about trends in commodity prices in 2021, see “Item 5. Operating and Financial Review and Prospects—D. Trend Information––Raw Materials.”
| 91 |
Effects of Exchange Rate Variations and Inflation
The table below sets forth, for the periods indicated, the fluctuation of the real against the U.S. dollar, the period-end and average daily exchange rates and Brazilian inflation as measured by the National Index of Consumer Prices (Índice Nacional de Preços ao Consumidor, or “INPC”), IPCA and the General Market Price Index (Índice Geral de Preços do Mercado, or “IGP-M”).
|
2021 |
2020 |
2019 | |
| Depreciation of the real against the U.S. dollar | (6.88%) | (22.44%) | (4.02%) |
| Period-end exchange rate (US$1.00) | R$5.58 | R$5.20 | R$4.03 |
| Average (daily) exchange rate (US$1.00)(1) | R$5.4 | R$5.16 | R$3.95 |
| Period-end Basic interest rate SELIC(2) | 9.25% | 2.00% | 4.50% |
| Inflation (INPC)(3) | 10.16% | 5.45% | 4.48% |
| Inflation (IPCA)(4) | 10.06% | 4.52% | 4.31% |
| Inflation (IGP-M)(5) | 17.78% | 23.14% | 7.30% |
Sources: IBGE, Fundação Getúlio Vargas and the Brazilian Central Bank.
| (1) | The average (daily) exchange rate is the sum of the daily exchange rates based on PTAX 800 Option 5, divided by the number of business days in the period. |
| (2) | The SELIC (Sistema Especial de Liquidação e de Custódia) interest rate is the primary Brazilian reference interest rate. |
| (3) | INPC is published by the IBGE, measuring inflation for families with income between one and eight minimum monthly wages in 11 metropolitan areas of Brazil. |
| (4) | IPCA is published by IBGE, measuring inflation for families with income between one and 40 minimum monthly wages in eleven metropolitan areas of Brazil. |
| (5) | The IGP-M gives different weights to consumer prices, wholesale prices and construction prices. The IGP-M is published by the Getúlio Vargas Foundation (Fundação Getúlio Vargas), a private foundation. |
Our results of operations and financial condition are significantly affected by movements in the exchange rate of reais to the U.S. dollar, the euro and the Turkish lira. Outside of Brazil, we invoice our sales primarily in U.S. dollars or U.S. dollar equivalents such as Saudi riyal and Emirati dirham, as well as in Euros and Turkish liras, but we report our results of operations in reais. Appreciation of the real against those currencies decreases the amounts we receive in reais and therefore our net sales from exports, and the opposite occurs when the real depreciates against those currencies.
The prices of soy meal and soybeans, which are important ingredients for our animal feedstock, are closely linked to the U.S. dollar. The price of corn, another important ingredient for our feedstock, is also linked to the U.S. dollar, albeit to a lesser degree than the price of soy meal and soybeans. In addition to soy meal, soybeans and corn, we purchase sausage casings, mineral nutrients for feed, packaging and other raw materials, as well as equipment for use in our production facilities, from suppliers located outside Brazil whom we must pay in U.S. dollars or other foreign currencies. When the real depreciates against the U.S. dollar, the cost in reais of our U.S. dollar-linked raw materials and equipment increases, and such increases could materially adversely affect our results of operations. Although the appreciation of the real has a positive effect on our costs because part of our costs is denominated in U.S. dollars, this reduction in U.S. dollar costs because of the appreciation of the real does not immediately affect our results of operations because of the length of our production cycles for poultry and pork.
We had total foreign currency-denominated loans and borrowings in an aggregate amount of R$16,343,552 thousand as of December 31, 2021, representing 64.2% of our total consolidated indebtedness on that date. Although we manage a portion of our exchange rate risk through foreign currency derivative instruments and future cash flows from exports in U.S. dollars and other foreign currencies, our foreign currency debt obligations are not completely hedged. A significant devaluation of the real in relation to the U.S. dollar or other currencies would increase the amount of reais that we would need in order to meet debt service requirements of our foreign currency-denominated obligations.
Historically, our results of operations and financial condition have been affected by inflation rates in Brazil. Demand for our products in the domestic market is sensitive to inflation in consumer prices, as reflected in variations in the INPC and IPCA inflation indexes, and most of our costs and expenses are incurred in reais. Because long-term contracts with suppliers and customers are not customary in our industry and prices are generally negotiated monthly or quarterly, increases in inflation have a rapid impact on our net sales and costs.
| 92 |
The IGP-M index is often used as an inflation reference rate in negotiating prices we pay to suppliers. In addition, we buy energy to run our production facilities pursuant to long-term contracts that contain periodic inflation adjustments according to the IGP-M index.
In terms of personnel costs, Brazilian salaries are adjusted only once a year, based on collective agreements between employers’ syndicates and unions. Generally, unions follow the INPC as a parameter for their negotiations.
Effects of Interest Rates
Our financial expenses are affected by movements in Brazilian and foreign interest rates. As of December 31, 2021, 26.9% of our total loans and borrowings of R$25,456,030 thousand was either: (i) denominated in (or swapped into) reais and bears interest based on Brazilian floating interest rates, such as the CDI, an interbank certificate of deposit rate that applies to our foreign currency swaps and some of our other real-denominated indebtedness, or IPCA; or (ii) U.S. dollar-denominated and bears floating interest based on LIBOR. Any increase in the CDI, IPCA or LIBOR rates may have an adverse impact on our financial expenses and our results of operations.
The table below shows the average interest rates to which we were exposed in each of the years as follows:
|
Average Interest for the Year Ended December 31, | |||
|
2021 |
2020 |
2019 | |
| (%) | |||
| CDI | 4.4 | 2.8 | 4.4 |
| Six-month LIBOR | 0.2 | 0.7 | 1.9 |
Freight Costs and Volume
The cost of transporting our products throughout our domestic distribution network and to our foreign customers is significant and is affected by fluctuations in the price of oil. In 2021, 2020 and 2019, freight costs from our continuing operations represented approximately 5.0%, 5.1% and 5.0% of our net sales, respectively. For our export goods, we ship many of our goods CFR (cost and freight), CIF (cost, insurance and freight) or DDP (delivered duty paid), including the payment of freight and insurance costs. In recent years, due to global political instability that could affect oil prices, we have included in our agreement with shipping lines a bunker oil (the fuel utilized in vessels) adjustment factor. In 2019, shipping lines also started preparing themselves for the implementation of the International Maritime Organization (or “IMO”) Low Sulphur Regulation, which entered into force on January 1, 2020. As a result of the new regulation, our freight costs increased approximately 11% compared to 2019, due to the higher cost of VLSFO bunker oil, which has lower Sulphur emission when compared to the previous IFO bunker oil. The new IMO regulation has affected all agents in the shipping industry. Similarly, between March and May 2020, due to uncertainties regarding the effects of the COVID-19 pandemic, oil prices dropped drastically, and our sea freight was adjusted as well using the abovementioned Bunker clause. Oil prices had partly recovered by the year ended 2020. During 2021, the bunker's price increase for VLSFO on the market was 48.7% (average of the 20 largest ports in the world). The price increase for us was 7.39%. The bunker represents around 30% to 35% of the ocean freight cost.
Global protein and all other refrigerated cargo demand are also expected to exert pressure on freight volume and restrict container availability, especially in shipping routes with restricted capacity such as the one from South America to Asia. Due to the uncertainty of this increase in global demand and limited offer of refrigerated containers, in 2021 we suffered pressure in logistics around the world. Our sea freight in 2021 increased, approximately, 33%.
| 93 |
Results of Operations
The following discussion should be read in conjunction with our consolidated financial statements included elsewhere in this annual report. The following table sets forth the components of our results of operations as a percentage of net sales for 2021, 2020 and 2019.
|
Year Ended December 31, | ||||||
|
2021 |
2020 (1) |
2019 (1) | ||||
| (in thousands of reais) | (%) | (in thousands of reais) | (%) | (in thousands of reais) | (%) | |
| Continuing Operations | ||||||
| Net sales | 48,343,305 | 100.0 | 39,469,700 | 100.0 | 33,446,980 | 100.0 |
| Cost of sales | (38,177,609) | (79.0) | (30,133,769) | (76.3) | (25,490,912) | (76.6) |
| Gross profit | 10,165,696 | 21.0 | 9,335,931 | 23.7 | 7,956,068 | 23.4 |
| Operating income (expenses) | ||||||
| Selling expenses | (6,531,413) | (13.5) | (5,673,030) | (14.4) | (4,991,145) | (15.2) |
| General and administrative expenses | (822,960) | (1.7) | (832,858) | (2.1) | (685,089) | (2.3) |
| Impairment loss on receivables | (12,799) | 0.0 | (12,137) | 0.0 | (23,899) | (0.1) |
| Other operating income (expenses) | 211,263 | 0.4 | 233,323 | 0.6 |
494,139
|
2.3 |
| Income (loss) from associates and joint ventures | — | 0.0 | — | 0.0 | (1,737) | 0.0 |
| Income before financial results and income tax | 3,009,787 | 6.2 | 3,051,229 | 7.7 | 2,748,337 | 8.2 |
| Financial income | 537,736 | 1.1 | 420,757 | 1.1 | 1,304,187 | 3.9 |
| Financial expenses | (3,331,615) | (6.9) | (1,889,454) | (4.8) | (3,096,716) | (9.3) |
| Foreign exchange and monetary variations | (250,696) | (0.5) | (230,298) | (0.6) | (72,870) | (0.2) |
| Income (loss) before taxes | (34,788) | (0.1) | 1,352,234 | 3.4 | 882,938 | 2.6 |
| Income taxes | 552,102 | 1.1 | 172,763 | 0.4 | 195,395 | 0.6 |
| Income (loss) from Continuing Operations | 517,314 | 1.1 | 1,524,997 | 3.9 | 1,078,333 | 3.2 |
| Loss from Discontinued Operations | (79,930) | (0.2) | — | 0.0 | (915,809) | (2.7) |
| Net income (loss) | 437,384 | 0.9 | 1,524,997 | 3.9 | 162,524 | 0.5 |
| Attributable to | ||||||
| Controlling shareholders | 419,455 | 0.9 | 1,518,492 | 3.8 | 162,684 | 0.5 |
| Non-controlling shareholders | 17,929 | 0.0 | 6,505 | 0.0 | (160) | 0.0 |
(1) In order to improve the level of detail in the presentation of information in the financial statements, in the year ended December 31, 2021, we began to classify the expenses with employee participation and bonuses by function in the statement of income (loss). To ensure comparability between the years presented, the comparative balances of prior periods were restated (note 3.1 to our consolidated financial statements).
Unless stated otherwise, the results that we present below do not consider the results from our discontinued operations.
Presentation of Operating Segments and Net Sales Information
Our operating segments include: (i) Brazil; (ii) International, which concentrates all of our operations outside Brazil; and (iii) Other. These segments include sales through all of our distribution channels and operations, subdivided according to the nature of the following products: (i) poultry (whole poultry and in natura cuts), (ii) pork and others (in natura cuts); (iii) processed (processed foods, frozen and processed products derived from poultry, pork, margarine, vegetables and soybean-based products); and (iv) other sales (flour for food service and others). Other is divided into commercialization and development of animal nutrition ingredients, human nutrition, plant nutrition (fertilizers), health care (health and wellness) and pet food, as well as commercialization of agricultural products. See note 24 to our consolidated financial statements for the year ended December 31, 2021 for a breakdown of net sales by segment.
We report net sales after deducting taxes on gross sales and discounts and returns. Our total sales deductions can be broken down as follows:
| 94 |
| · | ICMS Taxes — ICMS is a state value-added tax on our gross sales in the Brazilian market at a rate that varies by state and product sold. Our average ICMS tax rate for the year ended December 31, 2021 was 9.39%. However, exports are not subject to these taxes. |
| · | PIS and COFINS Taxes — The PIS and the COFINS taxes are federal social contribution taxes levied on gross revenues from the Brazilian market at the rates of 1.65% for PIS and 7.6% for COFINS for the year ended December 31, 2021. However, (1) exports are not subject to these taxes, (2) we currently benefit from a reduction of the tax rate to zero with respect to our in natura pork and poultry cuts and (3) our financial revenues are subject to PIS and COFINS at tax rates of 0.65% and 4.0%, respectively. For more information, see “Item 3. Key Information—D. Risk Factors—Risks Relating to Brazil—Changes in tax laws or changes in their interpretation may increase our tax burden and, as a result, negatively affect our results of operations and financial condition.” |
| · | Discounts, Returns and Other Deductions — Discounts, returns and other deductions are unconditional discounts granted to customers, product returns and other deductions from gross sales. |
Most of our deductions from gross sales are attributable to the ICMS, PIS and COFINS taxes. As a result, our deductions from gross sales in the domestic market, which are subject to these taxes, are significantly greater than our deductions from gross sales in our export markets.
The table below sets forth our gross sales and deductions for the years ended December 31, 2021, 2020 and 2019:
|
Year ended December 31, | |||
|
2021 |
2020 |
2019 | |
| (in thousands of reais) | |||
| Gross sales | |||
| Brazil | 30,700,510 | 26,017,981 | 21,645,253 |
| International | 22,959,318 | 18,514,099 | 16,191,795 |
| Other Segments |
2,319,991 |
1,378,344 |
1,167,463 |
|
55,979,819 |
45,910,424 |
39,004,511 | |
| Sales deduction | |||
| Brazil | (5,891,621) | (5,032,862) | (4,155,774) |
| International | (1,444,614) | (1,273,905) | (1,292,401) |
| Other Segments |
(300,279) |
(133,957) |
(109,356) |
|
(7,636,514) |
(6,440,724) |
(5,557,531) | |
| Net sales | |||
| Brazil | 24,808,889 | 20,985,119 | 17,489,479 |
| International | 21,514,704 | 17,240,194 | 14,899,394 |
| Other Segments |
2,019,712 |
1,244,387 |
1,058,107 |
|
48,343,305 |
39,469,700 |
33,446,980 | |
The following discussion provides comparisons of our results of our continuing operations for the years ended December 31, 2021, 2020 and 2019, based on our consolidated financial statements prepared in accordance with IFRS, as issued by the IASB.
Year Ended December 31, 2021 compared with Year Ended December 31, 2020
Net Sales
Our net sales increased R$8,873,605 thousand, or 22.5%, to R$48,343,305 thousand in the year ended December 31, 2021 from R$39,469,700 thousand in the year ended December 31, 2020, primarily due to an increase of 3.1% in sales volume in the year ended December 31, 2021 compared to sales volume in the year ended December 31, 2020 (particularly in the International and Other segments) and increase of 18.7% in average selling prices across all segments in the year ended December 31, 2021 compared to average selling prices in the year ended December 31, 2020.
| 95 |
Net Sales by Operating Segments
In 2021, we recorded the following sales volumes and average selling prices in our operating segments.
|
Volume Year Ended December 31, |
Average Selling Prices Year Ended December 31, | |||||
|
2021 |
2020 |
Change |
2021 |
2020 |
Change | |
| (in thousands of tons) | (%) | (in reais per kg) | (%) | |||
| Brazil | 2,300 | 2,321 | (0.9) | 10.78 | 9.04 | 19.3 |
| International | 1,957 | 1,880 | 4.1 | 10.99 | 9.17 | 19.8 |
| Other segment | 363 | 277 | 30.8 | 5.56 | 4.48 | 24.1 |
| Total |
4,620 |
4,479 |
3.1 |
10.46 |
8.81 |
18.7 |
Brazil Segment
Net sales from our Brazil segment increased R$3,823,770 thousand, or 18.2%, to R$24,808,889 thousand in the year ended December 31, 2021 from R$20,985,119 thousand in 2020, primarily due to an increase of 19.3% in average selling prices in the year ended December 31, 2021 compared to average selling prices in the year ended December 31, 2020. In the challenging context of loss of consumer confidence and pessimist economic outlook, our competitive advantages, such as brand preference, broad distribution and comprehensive portfolio, among others, are a testament of the effectiveness of our strategy in the Brazilian market, as we successfully conducted price increases to balance the industry margins especially in the processed food and margarine categories, resulting in higher average selling prices.
The following table provides a breakdown of our sales volumes and net sales for our Brazil segment.
|
Volume |
Net Sales | |||||
|
2021 |
2020 |
Change |
2021 |
2020 |
Change | |
| (in thousands of tons) | (%) | (in thousands of reais) | (%) | |||
| Poultry | 456 | 466 | (2.1) | 4,544,724 | 3,738,560 | 21.5 |
| Pork and other | 128 | 119 | 7.4 | 1,457,861 | 1,275,690 | 14.3 |
| Total in natura meat | 584 | 585 | (0.1) | 6,002,585 | 5,014,250 | 19.7 |
| Processed | 1,711 | 1,735 | (1.4) | 18,729,686 | 15,944,162 | 17.5 |
| Other sales | 5 | 1 | 335.9 | 76,618 | 26,707 | 186.8 |
| Total | 2,300 | 2,321 | (0.9) | 24,808,889 | 20,985,119 | 18.2 |
International Segment
Net sales from our International segment increased R$4,274,510 thousand, or 24.8%, to R$21,514,704 thousand in the year ended December 31, 2021 from R$17,240,194 thousand in 2020, primarily due to an expansion of sales volume of 4.1%, a consequence of increased demand for food products, and an increase of average selling prices of 19.8%, of which a part is due to the depreciation of the real against the U.S. dollar during the period (approximately 6.88%). We perceive that food demand is growing, which we believe reflects the increased pace of vaccinations against COVID-19, leading to a more optimistic scenario, growth of economic activity and return of the food service channel, contributing to the general recovery of the food industry.
The following table provides a breakdown of our sales volume and net sales for our International segment.
| 96 |
|
Volume |
Net Sales | |||||
|
2021 |
2020 |
Change |
2021 |
2020 |
Change | |
| (in thousands of tons) | (%) | (in thousands of reais) | (%) | |||
| Poultry | 1,498 | 1,435 | 4.4 | 15,818,512 | 12,246,499 | 29.2 |
| Pork and other | 188 | 194 | (3.1) | 2,394,176 | 2,324,121 | 3.0 |
| Total in natura meat | 1,686 | 1,629 | 3.5 | 18,212,688 | 14,570,620 | 25.0 |
| Processed | 261 | 248 | 5.4 |
2,955,431
|
2,366,204 | 24.9 |
| Other sales | 10 | 4 | 146.9 | 346,585 | 303,370 | 14.2 |
| Total | 1,957 | 1,880 | 4.1 | 21,514,704 | 17,240,194 | 24.8 |
*NM = not meaningful
The following table provides a further breakdown of the sales volume and net sales of the International segment into Asia, direct exports and delivered duty paid (DDP) halal.
|
Volume |
Net Sales | |||||
|
2021 |
2020 |
Change |
2021 |
2020 |
Change | |
| (in thousands of tons) | (%) | (in thousands of reais) | (%) | |||
| Asia | 551 | 554 | (0.5) | 6,285,311 | 5,658,005 | 11.1 |
| Direct exports | 685 | 609 | 12.5 | 6,487,537 | 4,299,739 | 50.9 |
| DDP halal | 721 | 717 | 0.6 | 8,741,856 | 7,282,450 | 20.0 |
| Total | 1,957 | 1,880 | 4.1 | 21,514,704 | 17,240,194 | 24.8 |
Other Segment
Net sales from our Other segment increased R$775,325 thousand, or 62.3%, to R$2,019,712 thousand in the year ended December 31, 2021 from R$1,244,387 thousand in the year ended December 31, 2020, mainly driven by the expansion of (i) the Ingredients business, which processes our byproducts through the creation of high value-added and sustainable products, and (ii) the BRF pet business, through an organic expansion of our portfolio of products in 2021 as well as inorganic growth through the recent acquisitions of Hercosul and Mogiana, which contributed to net sales of R$307,189 thousand in the year ended December 31, 2021.
Cost of Sales
Cost of sales totaled R$38,177,609 thousand in the year ended December 31, 2021, an increase of 26.7% compared to R$30,133,769 thousand in the year ended December 31, 2020. This increase in cost of sales for the year ended December 31, 2021 is attributable to (i) an increase in volumes; (ii) an increase of grain prices; (iii) inflation effects on main production inputs, e.g., plastic packaging and cardboard packaging; and (iv) higher costs of fuel, freight, storage and port services.
Gross Profit
Our gross profit increased R$829,765 thousand, or 8.9%, to R$10,165,696 thousand in the year ended December 31, 2021 from R$9,335,931 thousand in the year ended December 31, 2020, with a gross margin of 21.0% in the year ended December 31, 2021 compared to 23.7% in the year ended December 31, 2020. This decrease in gross margin was driven primarily by the unprecedented inflation of commodities on a global scale, which triggered higher costs of raw materials, packaging and freight, amongst others. By adjusting our average selling prices, we managed to reduce the impact of these higher costs.
Operating Expenses
Our operating expenses increased by 13.9% in the year ended December 31, 2021, to R$7,155,909 thousand in the year ended December 31, 2021 from R$6,284,702 thousand in the year ended December 31, 2020, primarily due to the drivers described below.
| 97 |
Selling Expenses
Our selling expenses increased R$858,383 thousand, or 15.1%, to R$6,531,413 thousand in the year ended December 31, 2021 from R$5,673,030 in the year ended December 31, 2020, primarily as a result of higher freight costs and inflation. Our selling expenses represented 13.5% of the net revenues in the year ended December 31, 2021, a decrease of 0.9 p.p. compared to 14.4% in the year ended December 31, 2020.
General and Administrative Expenses
Our general and administrative expenses decreased by 1.2% in 2021, to R$822,960 thousand in 2021 from R$832,858 thousand in 2020. The decrease was mainly due to a decrease in depreciation expenses.
Other Operating Income (Expenses), Net
Other operating income (expenses), net, amounted to an income of R$211,263 thousand in the year ended December 31, 2021 as compared to an income of R$233,323 thousand in the corresponding period in 2020. This decrease is mainly attributable to: (i) lower income from PIS and COFINS taxes recoveries in the amount of R$62,439 thousand in the year ended December 31, 2021 compared to R$295,593 thousand in the corresponding period in 2020, (ii) net reversal of provisions for civil and tax risks in the amount of R$33,311 thousand in the year ended December 31, 2021 compared to net expenses of R$68,295 thousand in the year ended December 31, 2020, mainly due to the termination of the lawsuits related to ICMS credits in the context of the “Guerra Fiscal” (see note 20.2.1 to our consolidated financial statements for the year ended December 31, 2021), (iii) gains on the disposal of non-financial assets in the amount of R$141,211 thousand in the year ended December 31, 2021 compared to losses of R$40,220 thousand in the year ended December 31, 2020, and (iv) lower reversal of provisions in the amount of R$1,143 thousand in the year ended December 31, 2021 compared to R$73,361 thousand in the year ended December 31, 2020, among other effects presented in note 26 to our consolidated financial statements for the year ended December 31, 2021.
Income before financial results and income taxes
As a result of the foregoing, our income before financial results and income taxes decreased by 1.4% in 2021, to R$3,009,787 thousand in 2021 from R$3,051,229 thousand in 2020.
The table below sets forth our income (loss) before financial results and income taxes for each segment and for Corporate.
| Income before financial results and income taxes | |||
| 2021 | 2020 | Change | |
| (in thousands of reais) | (%) | ||
| Brazil | 1,583,899 | 2,081,150 | (23.9) |
| International | 942,006 | 1,100,212 | (14.4) |
| Other Segments | 393,477 | 197,233 | 99.5 |
| Subtotal | 2,919,382 | 3,378,595 | (13.6) |
| Corporate | 90,405 | (327,366) | (127.6) |
| Total | 3,009,787 | 3,051,229 | (1.4) |
Financial Income (Expenses), Net
Financial expenses, net increased R$1,345,580 thousand, or 79.2%, to R$3,044,575 thousand in the year ended December 31, 2021 from R$1,698,995 thousand in the year ended December 31, 2020. This increase in financial expenses, net is mainly a result of (i) the negative impact of the remeasurement of the fair value of the put option granted by us to Qatar Investment Authority to sell its interest in TBQ (owner of Banvit) to BRF Foods GmbH, our indirect wholly-owned subsidiary, in the amount of R$858,564 thousand; (ii) higher interest expenses mainly due to increasing Extended National Consumer Price Index (Índice Nacional de Preços ao Consumidor Amplo), or IPCA, inflation rate (10.06% for the year ended December 31, 2021 compared to 4.52% for the year ended December 31, 2020); and (iii) higher net charges on general obligations and rights.
| 98 |
Income (loss) Before Taxes
As a result of the foregoing, our loss before taxes was R$34,788 thousand in 2021, representing a decrease of 102.6% in comparison to an income of R$1,352,234 thousand in 2020.
Income Taxes
Our income taxes amounted to R$552,102 thousand in 2021, representing an increase of 219.6% from R$172,763 thousand in 2020. The effective tax rate in 2021 represented a benefit of 1,587.1% compared to an effective rate that represented an expense of 21.1% in 2020. This variation was primarily due to (i) the effects of differences in tax rates on results of our foreign subsidiaries; (ii) the effect of foreign currency exchange variation in subsidiaries with different functional currencies; and (iii) recognition of deferred tax assets on tax losses carryforward of R$1,025,000 in 2021 compared R$361,000 recognized in 2020 (as per our accounting policy disclosed in note 3.9 to our consolidated financial statements for the year ended December 31, 2021).
Income from continuing operations
As a result of the foregoing, our income from continuing operations was R$517,314 thousand in 2021, representing a decrease of 66.1% in comparison to R$1,524,997 thousand in 2020.
Loss from Discontinued Operations
Loss from discontinued operations amounted to R$79,930 thousand in the year ended December 31, 2021, as compared to no income or loss from discontinued operations in the year ended December 31, 2020, mainly due to the completion, in 2021, of the price adjustment processes related to the sale of Campo Austral S.A. and Avex S.A., both sold in 2019.
Net Income (loss)
As a result of the foregoing, our net income decreased by 71.3% in 2021, to R$437,384 thousand in 2021 from R$1,524,997 thousand in 2020.
Year Ended December 31, 2020 Compared with Year Ended December 31, 2019
Net Sales
Our net sales increased by R$6,022,720 thousand, or 18.0%, to R$39,469,700 thousand in 2020 from R$33,446,980 thousand in 2019, primarily due to an expansion of our value-added product mix portfolio in the Brazil and International segments, as well as other drivers described below.
Net Sales by Operating Segments
In 2020, we recorded the following net sales and volumes in our operating segments.
|
Operating Segments |
Volume |
Change from 2019 |
Net Sales |
Change from 2019 |
| (in thousands of tons) | (%) | (in thousands of reais) | (%) | |
| Brazil | 2,321 | 5.7 | 20,985,119 | 20.0 |
| International | 1,880 | (1.5) | 17,240,194 | 15.7 |
| Other Segments | 277 | 3.1 | 1,244,387 | 17.6 |
| Total |
4,479 |
2.4 |
39,469,700 |
18.0 |
| 99 |
Brazil Segment
Net sales from our Brazil segment increased by R$3,495,640 thousand, or 20.0%, to R$20,985,119 thousand in 2020 from R$17,489,479 thousand in 2019. This is primarily attributable to (i) investments in our brands; (ii) a portfolio expansion of our value-added product mix; (iii) the growth of our presence in new channels and the strengthening of our presence in our existing channels; and (iv) the improvement of the level of service to our customers.
The following table provides a breakdown of our sales volume and net sales for our Brazil segment.
|
Volume |
Net Sales | |||||
|
2020 |
2019 |
Change |
2020 |
2019 |
Change | |
| (in thousands of tons) | (%) | (in thousands of reais) | (%) | |||
| Poultry | 466 | 504 | (7.6) | 3,738,560 | 3,692,377 | 1.3 |
| Pork and other | 119 | 117 | 1.8 | 1,275,690 | 943,220 | 35.2 |
| Total in natura meat | 585 | 621 | (5.8) | 5,014,250 | 4,635,597 | 8.2 |
| Processed | 1,735 | 1,574 | 10.3 | 15,944,162 | 12,808,408 | 24.2 |
| Other sales | 1 | NM* | NM* | 26,707 | 45,474 | 79.6 |
| Total | 2,321 | 2,195 | 5.7 | 20,985,119 | 17,489,479 | 20.0 |
*NM = not meaningful
The following table sets forth our average selling prices in our Brazil segment.
|
Average Selling Prices | |||
|
2020 |
2019 |
Change | |
| (in reais per kg) | (%) | ||
| Brazil | 9.04 | 7.97 | 13.4 |
International Segment
Net sales from our International segment increased by R$2,340,800 thousand, or 15.7%, to R$17,240,194 thousand in 2020 from R$14,899,394 thousand in 2019, primarily driven by (i) an increase in the share of our value-added product mix; (ii) an increase in the number of our licensed plants, aiming at strengthening our presence in our existing markets, as well as in new regions and products; (iii) a higher demand from the Asian market due to African swine fever; and (iv) the devaluation of the Brazilian real versus the U.S. dollar that favored prices in reais.
The following table provides a breakdown of our sales volume and net sales for our International segment.
|
Volume |
Net Sales | |||||
|
2020 |
2019 |
Change |
2020 |
2019 |
Change | |
| (in thousands of tons) | (%) | (in thousands of reais) | (%) | |||
| Poultry | 1,435 | 1,504 | (4.6) | 12,246,499 | 11,262,954 | 8.7 |
| Pork and other | 194 | 152 | 27.7 | 2,324,121 | 1,342,892 | 73.1 |
| Total in natura meat | 1,629 | 1,656 | (1.7) | 14,570,620 | 12,605,846 | 15.6 |
| Processed | 248 | 252 | (1.8) | 2,366,204 | 2,119,918 | 11.6 |
| Other sales | 4 | 1 | NM* | 303,370 | 173,630 | 74.7 |
| Total | 1,880 | 1,909 | (1.5) | 17,240,194 | 14,899,394 | 15.7 |
*NM = not meaningful
The following table sets forth our average selling prices for our International segment.
| 100 |
|
Average Selling Prices | |||
|
2020 |
2019 |
Change | |
| (in reais per kg) | (%) | ||
| International | 9.17 | 7.81 | 17.4 |
Other Segment
Our consolidated net sales for our Other Segments operating segment increased by R$186,280 thousand, or 17.6%, to R$1,244,387 thousand in 2020 from R$1,058,107 thousand in 2019, primarily driven by more favorable prices practiced in our ingredients business and higher volumes marketed in our global desk.
The following table provides a breakdown of our net sales and volumes for Other Segments.
|
Volume |
Net Sales | |||||
|
2020 |
2019 |
Change |
2020 |
2019 |
Change | |
| (in thousands of tons) | (%) | (in thousands of reais) | (%) | |||
| Other Segments | 277 | 269 | 3.1 | 1,244,387 | 1,058,107 | 17.6 |
The following table sets forth our average selling prices for Other Segments.
|
Average Selling Prices | |||
|
2020 |
2019 |
Change | |
| (in reais per kg) | (%) | ||
| Other Segments | 4.48 | 3.93 | 14.2 |
Cost of Sales
Cost of sales totaled R$30,133,769 thousand in 2020, representing an increase of 18.2% in comparison to R$25,490,912 thousand in 2019. This was mainly due to higher volumes and an increase in average grains’ prices, as well as the currency devaluation of the Brazilian real that impacted our cost of acquisition of supplies.
Gross Profit
Our gross profit increased by 17.3% in 2020, to R$9,335,931 thousand in 2020 from R$7,956,068 thousand in 2019, with a gross margin of 23.7% in 2020 compared to 23.8% in 2019. This increase was primarily driven by more favorable operational results both in the Brazil and International operating segments.
Operating Expenses
Our operating expenses increased by 20.7% in 2020, to R$6,284,702 thousand in 2020 from R$5,207,731 thousand in 2019, primarily due to the drivers described below.
Selling Expenses
Our selling expenses increased by 13.7% in 2020, to R$5,673,030 thousand in 2020 from R$4,991,145 thousand in 2019, primarily due to (i) costs related to preventing and combatting the effects of the COVID-19 pandemic on our operations; (ii) higher expenses denominated in Brazilian reais, in the international market, due to currency devaluation; and (iii) higher freight expenses in Brazil given the greater supply and demand of trucks.
| 101 |
General and Administrative Expenses
Our general and administrative expenses increased by 21.6% in 2020, to R$832,858 thousand in 2020 from R$685,089 thousand in 2019, mainly due to (i) costs related to preventing and combatting the effects of the COVID-19 pandemic on our operations; and (ii) higher expenses denominated in Brazilian reais, in the international market, due to currency devaluation.
Impairment loss on receivables
Impairment loss on receivables decreased by 49.2% in 2020, to R$12,137 thousand in 2020 from R$23,899 thousand in 2019, primarily due to a general decrease in overdue payments and general default rates of our customers.
Other Operating Income (Expenses), Net
Other operating income (expenses), net decreased by 52.8% in 2020, to an income of R$233,323 thousand in 2020 from an income of R$494,139 thousand in 2019. This decrease was mainly due to the fact that in 2019 we recognized a gain related to the exclusion of the ICMS from the PIS and COFINS tax assessable basis.
Income (loss) from associates and joint ventures
We had no income or loss from associates and joint ventures in 2020, compared to a loss of R$1,737 thousand in 2019, primarily due to the sale of our equity interests in the joint venture Sats BRF Food Pte Ltd. in 2019.
Income before financial results and income taxes
As a result of the foregoing, our income before financial results and income taxes increased by 11.0% in 2020, to an income of R$3,051,229 thousand in 2020 from an income of R$2,748,337 thousand in 2019.
The table below sets forth our operating income (loss) on a segment basis.
| Income before financial results and income taxes by Segment | |||
| 2020 | 2019 | Change | |
| (in thousands of reais) | (%) | ||
| Brazil | 2,081,150 | 1,818,813 | 14.4 |
| International | 1,100,212 | 1,275,285 | (13.7) |
| Other Segments | 197,233 | 109,138 | 80.7 |
| Subtotal | 3,378,595 | 3,203,236 | 5.5 |
| Corporate | (327,366) | (454,899) | (28.0) |
| Total | 3,051,229 | 2,748,337 | 11.0 |
Financial Income (Expenses), Net
Net financial expenses amounted to R$1,698,995 thousand in 2020, representing a decrease of 8.9% compared to R$1,865,399 thousand in 2019, primarily due to (i) the positive impact of the remeasurement of the put option granted by us in the context of a business combination referring to Banvit in the amount of R$579,946 thousand; and (ii) lower net charges on general obligations and rights.
Income Before Taxes
As a result of the foregoing, our income before taxes from continuing operations was R$1,352,234 thousand in 2020, representing an increase of 53.2% in comparison to R$882,938 thousand in 2019.
| 102 |
Income Taxes
Our income taxes amounted to R$172,763 thousand in 2020, representing a decrease of 11.6% from R$195,395 thousand in 2019. The effective tax rate in 2020 was represented an income of 12.8% compared to an effective rate that represents an income of 22.1% in 2019. This variation was primarily due to (i) the effects of differences in tax rates on results of our foreign subsidiaries; (ii) the effect of foreign currency exchange variation in subsidiaries with different functional currencies; and (iii) deferred tax assets not recognized in 2020.
Net Income (loss)
As a result of the foregoing, our net income from continuing operations increased by 41.4% in 2020, to R$1,524,997 thousand in 2020 from R$1,078,333 thousand in 2019. When taking into account discontinued operations, our net income increased by 838.3%, to R$1,524,997 thousand in 2020 from R$162,524 thousand in 2019.
| B. | Liquidity and Capital Resources |
As of December 31, 2021, we held R$7,528,820 thousand in cash and cash equivalents. Of that amount, R$2,088,024 thousand, or 38.36%, was held in jurisdictions outside Brazil. We regularly review the amount of cash and cash equivalents held outside of Brazil to determine the amounts necessary to fund the current operations of our foreign subsidiaries and their growth initiatives as well as amounts needed to service our Brazilian indebtedness and related obligations. If these amounts are moved out of these jurisdictions or repatriated to Brazil, we may be subject to Brazilian tax upon repatriation.
Our main cash requirements are the servicing of our debt, capital expenditures relating to expansion programs and acquisitions, and the payment of dividends and interest on shareholders’ equity. Our primary cash sources have been cash flows from operating activities, loans and other financings and sales of marketable securities. Although we have substantial debt that will mature in coming years, we believe that our current cash and cash equivalents, along with our cash flows from operating activities and plans for the extension of the maturity of a portion of our current indebtedness will be sufficient to cover our working capital needs and the service of our indebtedness in the ordinary course of our business.
As of December 31, 2021, we do not have off-balance sheet arrangements that have or are reasonably likely to have effects on our financial condition, revenues or expenses, results of operations, liquidity, capital expenditure or capital resources that are material to investors, except for the commitments for purchases of goods and services presented in the table below.
The following table summarizes significant contractual obligations and commitments due by period, as of December 31, 2021.
|
Payments Due by Period | |||||
|
Obligation |
Total |
Less than 1 year |
1-3 years |
3-5 years |
More than 5 years |
| (in thousands of reais) | |||||
| Loans and borrowings (1) | 28,248,591 | 2,434,990 | 5,021,732 | 5,168,950 | 15,622,919 |
| Interest on loans and borrowings (2) | 13,415,820 | 1,375,349 | 2,331,920 | 1,960,676 | 7,747,875 |
| Lease liabilities | 3,166,028 | 504,285 | 970,661 | 601,451 | 1,089,631 |
| Commitments for purchases of goods and services (3) |
8,371,514 |
5,090,205 |
2,099,149 |
684,783 |
497,377 |
| Total |
53,201,953 |
9,404,829 |
10,423,462 |
8,415,860 |
24,957,802 |
| (1) | Includes both current and non-current loans and borrowings. |
| (2) | Represents expected interest obligations on the loans and borrowings set forth in the table above, assuming the interest rates in effect on each facility as of December 31, 2021. |
| (3) | These purchase commitments include future purchase commitments for corn and soy meal and service fees to our integrated outgrowers. Amounts payable under contracts for goods or services that allow termination at any time without penalty have been excluded. With respect to contracts for goods and services that allow termination at any time without penalty after a specified notice period, only amounts payable during the specified notice period have been included. |
| 103 |
We also recorded R$1,517,632 thousand as contingencies with probable losses as of December 31, 2021.
Cash Flow
The following table sets forth certain consolidated cash flow information for the periods indicated:
|
Year Ended December 31, | |||
|
2021 |
2020 |
2019 | |
| Cash Flow | (in thousands of reais) | ||
| Net cash provided by operating activities(1) | 3,923,636 | 5,839,169 | 3,812,083 |
| Net cash provided by (used in) investing activities | (3,548,791) | (1,430,989) | 1,443,106 |
| Net cash used in financing activities(1) |
(572,476) |
(2,008,581) |
(6,107,955) |
| Effect on exchange rate variation on cash and cash equivalent |
149,826 |
939,241 |
54,540 |
| Net increase (decrease) in cash and cash equivalents |
(47,805) |
3,338,840 |
(798,226) |
(1) In the year ended December 31, 2021, we changed the classification of payment of interest in the statement of cash flows, reclassifying this item from Operating Activities to Financing Activities. This change was made for better presentation of our cash flows and convergence with the reports used by our management. To ensure comparability between the years presented, prior periods have been reclassified for consistency (note 3.1 to our consolidated financial statements).
Cash Flows Provided by Operating Activities
We recorded net cash flows provided by operating activities of R$3,923,636 thousand in 2021, compared to cash flows provided by operating activities of R$5,839,169 thousand in 2020. The decrease of R$1,915,533 thousand is mainly due to the higher allocation of resources to working capital items in the amount of R$242,974 thousand, a decrease of R$657,218 thousand in the cash effect of derivatives, increase of R$129,432 thousand in payments of tax, civil and labor provisions, in addition to a decrease of R$156,551 thousand in our income from continuing operations adjusted for non-cash effects, among other effects.
We recorded net cash flows provided by operating activities of R$5,839,169 thousand in 2020, compared to cash flows provided by operating activities of R$3,812,083 thousand in 2019. The increase of R$2,027,086 thousand is mainly due to an increase in our income from continuing operations adjusted for non-cash effects and a decrease of R$294,522 thousand in the payment of tax, civil and labor provisions.
Cash Flows Provided by (Used in) Investing Activities
We recorded net cash flows used in investing activities of R$3,548,791 thousand in 2021, compared to net cash flows used in investing activities of R$1,430,989 thousand in 2020. The increase of R$2,117,802 thousand is mainly due to increased investments in fixed, intangible and biological assets in the amount of R$1,067,792 thousand and to the business combinations in the year with Joody Al Sharqiya Food Production Factory, Hercosul Group and Mogiana Alimentos S.A. in the amount of R$985,639 thousand.
We recorded net cash flows used in investing activities of R$1,430,989 thousand in 2020, compared to net cash flows provided by investing activities of R$1,443,106 thousand in 2019. The change of R$2,874,095 thousand is mainly due to the proceeds from the sale of our operations in Europe, Thailand and Argentina in the amount of R$1,664,073 thousand and the price adjustment from the sale of our then dairy segment in the amount of R$242,051 thousand, both in 2019. Additionally, in 2020, we increased our investments in biological assets in the amount of R$168,292 thousand and in property, plant and equipment in the amount of R$387,444 thousand.
| 104 |
Cash Flows Used in Financing Activities
We recorded net cash flows used in financing activities of R$572,476 thousand in 2021, compared to net cash flows used in financing activities of R$2,008,581 thousand in 2020. This decrease is mainly due to an increase of R$1,422,461 thousand in the amount of proceeds from debt issuance in the year ended December 31, 2021 compared to the year ended December 31, 2020.
We recorded net cash flows used in financing activities of R$2,008,581 thousand in 2020, compared to net cash flows used in financing activities of R$6,107,955 thousand in 2019, mainly due to our refinancing strategy and increase in liquidity for 2020. The amount of proceeds from debt issuance net of repayments in 2020 was of R$172,974 thousand, compared to R$4,081,980 thousand of repayments of debt net of proceeds in 2019.
Dividends and Interest on Shareholders’ Equity
We have not made any distributions for the years ended December 31, 2019, 2020 or 2021.
Our Indebtedness
We use the net proceeds of our indebtedness primarily for capital expenditures, working capital and purchases of raw materials. The following table sets forth our net indebtedness (according to the type of debt and currency) net of cash, cash equivalents, marketable securities, restricted cash and derivative financial instruments for the periods indicated.
|
As of December 31, | ||||
|
2021 |
2020 | |||
|
Current |
Non-current |
Total |
Total | |
| (in thousands of reais) | ||||
| Total loans and borrowings |
(3,203,068) |
(22,252,962) |
(25,456,030) |
(22,404,426) |
| Local currency | (1,036,819) | (8,075,659) | (9,112,478) | (6,665,292) |
| Foreign currency | (2,166,249) | (14,177,303) | (16,343,552) | (15,739,134) |
| Derivative financial instruments, net | (192,892) | (31,057) | (223,949) | (7,706) |
| Cash, cash equivalents and marketable securities and restricted cash |
7,900,638 |
447,414 |
8,348,052 |
8,259,718 |
| Local currency | 4,990,530 | 15,439 | 5,005,969 | 4,131,230 |
| Foreign currency |
2,910,108 |
431,975 |
3,342,083 |
4,128,488 |
| Net Debt(1) |
4,504,678 |
(21,836,605) |
(17,331,927) |
(14,152,414) |
| (1) | We define Net Debt as total loans and borrowings (current and non-current) plus derivative financial instruments, net (current and non-current) minus cash and cash equivalents (including marketable securities, current and non-current, and restricted cash, current and non-current). Net Debt is a supplemental measure of our financial condition and used in making certain management decisions. It is not a prescribed measure under IFRS. |
The table below provides a further breakdown of our indebtedness by the type of debt.
| 105 |
|
Current |
Non-current |
Total loans and borrowings as of December 31, | ||
|
As of December 31, 2021 |
2021 |
2020 | ||
| (in thousands of reais) | ||||
| Working capital | 396,941 | 10,021 |
406,962 |
368,681 |
| Certificate of Agribusiness Receivables | 52,691 | 915,257 | 967,948 | 821,093 |
| Development bank credit lines | 3,865 | 3,814 | 7,679 | — |
| Debentures | 137,316 | 4,072,699 | 4,210,015 | 3,022,005 |
| Export credit facility | 442,405 | 3,073,868 | 3,516,273 | 2,408,697 |
| Other | 3,601 | — | 3,601 | 44,816 |
| Total local currency |
1,036,819 |
8,075,659 |
9,112,478 |
6,665,292 |
| Bonds | 1,668,452 | 13,875,560 | 15,544,012 | 14,829,993 |
| Export credit facility | 152,734 | 158,651 | 311,385 | 392,636 |
| Advances for foreign exchange rate contracts | 3,103 | — | 3,103 | — |
| Working capital |
341,960 |
143,092 |
485,052 |
516,505 |
| Total foreign currency |
2,166,249 |
14,177,303 |
16,343,552 |
15,739,134 |
| Total |
3,203,068 |
22,252,962 |
25,456,030 |
22,404,426 |
The maturity schedule of our indebtedness is as follows:
|
As of December
31, 2021 | |
| 2022 | 3,203,068 |
| 2023 | 2,855,597 |
| 2024 | 2,123,239 |
| 2025 | 1,384,398 |
| 2026 | 3,642,778 |
| 2027 onwards |
12,246,951 |
| Total |
25,456,030 |
Our principal debt instruments as of December 31, 2021 are described below. For more information on these facilities, including information on average interest rates and weighted average maturities, see note 14 to our consolidated financial statements.
Local Currency Debt
Working Capital Facilities
Rural Credit Financing. We had rural credit loans in the amount of R$383,342 thousand as of December 31, 2021 with several commercial banks under a Brazilian federal government program that offers favorable interest rates of 5.14% per year, as an incentive to invest in rural activities, with maturity dates in 2022. We generally use the proceeds of these loans for working capital. These credit lines are included under “Working capital” in the table above.
Other Working Capital Facilities. We had other working capital facilities in the amount of R$23,620 thousand as of December 31, 2021 with several commercial banks, with maturity dates from 2021 through 2025. We generally use the proceeds of these loans for working capital. These credit lines are included under “Working capital” in the table above.
| 106 |
Certificate of Agribusiness Receivables (CRAs)
On December 16, 2016, we concluded an issuance of CRAs related to the public offer of distribution of the 1st and 2nd Series of the 1st Issue of Vert Companhia Securitizadora, in the amount of R$1.5 billion, net of interest. The principal of the CRAs of the 1st Series matured in a single installment on December 16, 2020, with interest payable every eight months. The principal of the CRAs of the 2nd Series matures in a single installment on December 18, 2023, with interest payable every 16 or 18 months. As of December 31, 2021, the balance of these CRAs totaled R$967,948 thousand.
Debentures
On July 1, 2019, we completed a public offering in Brazil of non-convertible unsecured debentures in the aggregate amount of R$750,000 thousand. R$70,000 thousand aggregate principal amount of which bear interest based on a rate of CDI plus a spread of 0.8% per year and mature in 2022, R$411,732 thousand aggregate principal amount of which bear interest based on the Extended National Consumer Price Index (Índice Nacional de Preços ao Consumidor Amplo) published by the Brazilian Institute of Geography and Statistics (Instituto Brasileiro de Geografia e Estatística) rate plus a spread of 5.5% per year and mature in 2026 and R$268,268 thousand aggregate principal amount of which bear interest based on the CDI rate plus a spread of 1.45% per year and mature in 2026. As of December 31, 2021, the outstanding principal and interest amount of the debentures was R$823,946 thousand.
On July 14, 2020, we concluded a debenture issuance in the amount of R$2,200,000 thousand. We issued in two series 2,200,000 non-convertible unsecured debentures with nominal unit value of R$1,000.00, which were privately placed with VERT Companhia Securitizadora to back its 46th issuance of CRAs. A description of the series of this debenture issuance is below:
| · | First Series: The principal amount of the 705,000 debentures of the 1st series matures in a single installment on July 15, 2027, with interest payable every six months. The debentures of the 1st series bear interest equal to IPCA plus 5.30% per year; and |
| · | Second Series: The principal amount of the 1,495,000 debentures of the 2nd series matures in three installments, the first on July 17, 2028 (33.33% of the updated outstanding principal amount), the second on July 16, 2029 (50% of the updated outstanding principal amount) and the third on July 15, 2030 (100% of the updated outstanding principal amount), with interest payable every six months. The debentures of the 2nd series bear interest equal to IPCA plus 5.60% per year. |
As of December 31, 2021, the outstanding principal and interest amount of the debentures was R$2,351,363 thousand.
On June 2, 2021, we concluded a debenture issuance in the amount of R$1,000,000 thousand. We issued 1,000,000 non-convertible unsecured debentures with nominal unit value of R$1,000.00, which were privately placed with VERT Companhia Securitizadora to back its 60th issuance of CRAs. The principal amount matures in a single installment on May 14, 2031, with interest payable every six months. The debentures bear interest equal to IPCA plus 4.7843% per year. As of December 31, 2021, the outstanding principal and interest amount of the debentures was R$1,034,706 thousand.
Export Credit Facilities
Export Credit Notes. We have export credit notes in local currency, totaling R$3,516,273 thousand as of December 31, 2021. These notes bear interest at CDI rates, and mature between 2022 and 2028. These credit lines are included under “Export credit facilities” in the table above.
| 107 |
Other
State Tax Incentive Financing Programs. We also had R$3,601 thousand outstanding as of December 31, 2021 under credit facilities offered by the State of Goiás under tax incentive programs to promote investments in such state. Under these programs, we are granted credit proportional to the payment of ICMS tax generated by investments in the construction or expansion of manufacturing facilities in that state. The credit facilities have a 20-year term from 2019 and fixed or variable interest rates based on the IGP-M plus a margin. This credit line is included under “Other” in the table above.
Foreign Currency Debt
Bonds
2022 Notes. On June 6, 2012, we issued senior notes in an aggregate principal amount of US$500,000 thousand, or the 2022 Notes. The 2022 Notes bear interest at a rate of 5.875% per year and mature on June 6, 2022. Later in June 2012, we issued an additional US$250,000 thousand aggregate principal amount of 2022 Notes. In May 2015, we repurchased US$577,100 thousand in aggregate principal amount of the 2022 Notes in a tender offer. In September 2016, we repurchased US$54,200 thousand in aggregate principal amount of the 2022 Notes in a tender offer. In September 2019, we repurchased US$9,350 thousand in aggregate principal amount of 2022 Notes in a tender offer. In July 2020, we repurchased US$27,190 thousand in aggregate principal amount of the 2022 Notes in a tender offer. In September 2020, we repurchased US$11,194 thousand in aggregate principal amount of the 2022 Notes in a tender offer. As of December 31, 2021, the outstanding principal and interest amount of the 2022 Notes amounted to R$396,802 thousand.
2023 Notes. On May 15, 2013, we issued senior notes in an aggregate principal amount of US$500,000 thousand, or the 2023 Notes. The 2023 Notes bear interest at a rate of 3.95% per year and mature on May 22, 2023. In September 2019, we repurchased US$154,011 thousand in aggregate principal amount of the 2023 Notes. In July 2020, we repurchased US$60,567 thousand in aggregate principal amount of the 2023 Notes in a tender offer. In September 2020, we repurchased US$51,389 thousand in aggregate principal amount of the 2023 Notes in a tender offer. As of December 31, 2021, the outstanding principal and interest amount of the 2023 Notes amounted to R$1,303,821 thousand.
2024 Notes. On May 15, 2014, we issued senior notes in an aggregate principal amount of US$750,000 thousand, or the 2024 Notes. The 2024 Notes bear interest at a rate of 4.75% per year and mature on May 22, 2024. In September 2019, we repurchased US$230,957 thousand in aggregate principal amount of the 2024 Notes in a tender offer. In July 2020, we repurchased US$64,144 thousand in aggregate principal amount of the 2024 Notes in a tender offer. In September 2020, we repurchased US$158,351 thousand in aggregate principal amount of the 2024 Notes in a tender offer. As of December 31, 2021, the outstanding principal and interest amount of the 2024 Notes amounted to R$1,653,847 thousand.
Euro Notes. On May 29, 2015, we issued senior notes in the aggregate principal amount of €500,000 thousand, or the Euro Notes. The Euro Notes bear interest at a rate of 2.750% and mature on May 3, 2022. In September 2019, we repurchased €175,219 thousand in aggregate principal amount of the Euro Notes. In July 2020, we repurchased €119,061 thousand in aggregate principal amount of the Euro Notes in a tender offer. In September 2020, we repurchased €39,048 in aggregate principal amount of the Euro Notes in a tender offer. As of December 31, 2021, the aggregate outstanding principal and interest amount of the Euro Notes amounted to R$1,072,454 thousand.
2026 Notes. On September 29, 2016, we, through our wholly-owned subsidiary BRF GmbH, issued senior notes in the aggregate principal amount of US$500,000 thousand, or the 2026 Notes. The 2026 Notes bear interest at a rate of 4.35% per year and mature on September 29, 2026. In September 2020, we repurchased US$718 thousand in aggregate principal amount of the 2026 Notes in a tender offer. As of December 31, 2021, the outstanding principal and interest amount of the 2026 Notes amounted to R$2,779,725 thousand.
| 108 |
2030 Notes. On September 19, 2019, we issued senior notes in an aggregate principal amount of US$750,000 thousand, or the 2030 Notes. The 2030 Notes bear interest at a rate of 4.875% per year and mature on January 24, 2030. In June 2021, we repurchased US$59,402 thousand in aggregate principal amount of the 2030 Notes in a tender offer. As of December 31, 2021, the outstanding principal and interest amount of the 2030 Notes amounted to R$3,914,280 thousand.
2050 Notes. We issued senior notes in an aggregate principal amount of US$500,000 thousand on September 21, 2020 and additional senior notes in an aggregate principal amount of US$300,000 thousand on October 26, 2020 (collectively, the 2050 Notes) for an aggregate amount of the series of US$800,000 thousand. The 2050 Notes bear interest at a rate of 5.750% per year and mature on September 21, 2050. As of December 31, 2021, the outstanding principal and interest amount of the 2050 Notes amounted to R$4,423,083 thousand.
Export Credit Facility
Export Prepayment Facilities. The indebtedness under these facilities is denominated in U.S. dollars, with maturity dates between 2023 and 2024. Interest under these facilities accrues interest either at LIBOR plus a spread or fixed. Under this facility, we receive a loan from one or more lenders secured by the accounts receivable relating to exports of our products to specific customers. These facilities are generally guaranteed by BRF S.A. The covenants under these agreements include limitations on liens and mergers. As of December 31, 2021, the outstanding principal and interest amount of these facilities amounted to R$311,385 thousand.
Advances for Foreign Exchange Rate Contracts
In August 2021, we had advances on foreign exchange contracts to fund exports at a fixed interest rate with maturity in February 2022. As of December 31, 2021, the outstanding amount under these contracts was R$3,103 thousand.
Working Capital
Working Capital in Foreign Currency. These are funds obtained from financial institutions, mainly used for working capital and short-term import financing operations of subsidiaries principally located in Turkey and Paraguay. This funding is denominated in Turkish lira and U.S. dollars, with maturity dates from 2022 through 2027. As of December 31, 2021, the aggregate principal amount outstanding under these working capital facilities was equivalent to R$485,052 thousand.
Derivatives
We entered into foreign currency exchange derivatives under which we had an unealized loss of R$241,461 thousand, commodity derivatives under which we had an unrealized gain of R$47,620 thousand and interest rate derivatives under which we had an unrealized loss of R$30,108 thousand, in each case as of December 31, 2021. The counterparties include several Brazilian financial institutions and involve interest rate swaps, the purchase and sale of non-deliverable forwards and options of currencies and commodities. The derivatives mature between 2021 and 2031. These derivatives are recorded in our statement of financial position as derivative financial instruments.
Investment Fund in Credit Rights Receivables
On December 18, 2018, we established an investment fund in credit rights receivables (Fundo de Investimento em Direitos Creditórios) or FIDC. We assign to the FIDC, and its sole objective is to acquire, from time to time, our receivables generated from commercial transactions between us and our customers in Brazil. The FIDC is a closed-ended fund and its quotas shall be repaid within five years. As of December 31, 2021, the FIDC held receivables in the amount of R$902,679 thousand.
| 109 |
Covenants and Covenant Compliance
Several of the instruments governing our indebtedness contain limitations on liens, and some of the instruments governing our indebtedness contain other covenants, such as limitations on mergers and sales of assets, and transactions with affiliates. As of December 31, 2021, we were in compliance with the covenants contained in our debt instruments. Our debt instruments include customary events of default. The instruments governing a substantial portion of our indebtedness contain cross-default or cross-acceleration clauses, such that the occurrence of an event of default under one of those instruments could trigger an event of default under other indebtedness or enable a creditor under another debt instrument to accelerate that indebtedness.
Seasonality
Brazil
Our net sales of meat and processed products in the Brazilian market are not subject to large seasonal fluctuations. However, our fourth quarter is generally slightly stronger than other quarters due to increased demand for our products during the holiday season, particularly turkeys, Chester® roosters, ham and pork loins. We also market certain products specifically for the holiday season, such as gift packages of our products that some employers distribute to their employees. Our results are also affected by the dry and rainy seasons for corn, soybeans and soy meal, which are our primary raw materials in feed production.
In 2021, total Brazilian sales by quarter were as follows: 21.7% for the first quarter, 23.5% for the second quarter, 25.8% for the third quarter and 29.1% for the fourth quarter.
International
Our sales to international markets as a whole are not materially affected by seasonality, partly because seasonal buying patterns vary according to our international markets. However, net sales in specific markets sometimes vary with the season. In the Halal market, for example, we experience lower net sales during Ramadan and the summer months.
In 2021, total International sales by quarter were as follows: 22.4% for the first quarter, 25.2% for the second quarter, 25.3% for the third quarter and 27.0% for the fourth quarter.
Capital Expenditures
See “Item 4. Information on the Company—A. History and Development of the Company—Capital Expenditures.”
| C. | Research and Development, Patents and Licenses, etc. |
In 2021, we launched 234 new SKUs for consumers, of which 87 were released for the domestic market and 128 for the international market. Of the international market releases, 17 were in Asia, 40 in the Halal market and 71 in our direct exports operations. We also launched 19 SKUs in our PET segment, after the acquisition of Hercosul Group and Mogiana.
Our Research, Development and Innovation activities (“RD&I”) incorporate agricultural research and innovation, as well as products and processes research and development. The Research and Development of Meat Products’ team is based in Jundiaí city, in the State of São Paulo, where our BRF Innovation Center (“BIC”) is based.
The agricultural RD&I area aims to strengthen our international competitiveness through the continuous introduction of new technologies. The goal of these activities is to reduce production costs, improve product quality and client satisfaction and meet consumer demands. For this purpose, we maintain a qualified and experienced team of specialists to experiment with new products and innovations. This team includes highly qualified researchers with advanced degrees, specialists working in animal production, researchers, veterinarians, agronomists and technical support. In addition, we have collaborative arrangements with several universities, government research institutions and innovative private companies, and we use several research incentives made available by government research and development agencies.
| 110 |
We have also been developing a robust trainee and internship program as well as encouraging our employees to participate in undergraduate and graduate courses. In 2019, we started a new program called “PhD in Agro,” in which six PhD positions were created to develop specific projects in different areas: nutrition, animal breeding, animal health, swine production and poultry management. As a result, five of these PhD experts have already been invited to join our permanent staff.
We believe we have one of the largest poultry and swine agricultural experimental research facilities in the world. Our research system includes one experimental feed meal plant and 19 experimental barns, which are distributed across four experimental farms in the State of Santa Catarina, with a total of 1,380 experimental pens to evaluate the impact of new technology and innovation in the production chain. We also have nine bromatological laboratories and seven receiving and classification laboratories, all equipped with NIRS (Near Infrared Spectroscopy) technology, in addition to five animal health laboratories supporting research and operational activities. We expect to enhance our capacity with a new health laboratory in Toledo, in the State of Paraná, in 2023.
In 2017 we implemented a real-time feed formulation technology, also known as NIRS in-line. This technology uses real-time analysis of raw materials in the production line through NIRS, and integrates the data generated with an optimization software of feed formulation that optimizes the feed formula to be produced in each batch of feed. This process improves the precision and quality of the feeds produced and is aligned with our commitment to quality throughout our process. BRF was one of the pioneers in the use of this technology in Brazil. In next years the objective is continuing to expand the technology into the company.
In addition to our formal research department, we have field research initiatives in the production system that allows us to evaluate all technologies under real production conditions. We also use this field research to calculate the productivity and financial impact of innovations and establish the appropriate moment to introduce a technology. We believe that the field research system provides us with an advantage in relation to other research centers and other companies in the sector. With respect to RD&I product projects, we have ongoing research projects on the reduction of additives in meat products, natural solutions for ingredients to extend the products’ due date with the food safety guarantee, new packaging and the reduction in the use of packaging materials.
Beginning on June 20, 2013, BIC was financed by FINEP for a total amount of R$106.0 million, of which R$53.9 million was used for building the facilities. BIC has total space of 13,500m². The building exemplifies our commitment to investing in RD&I in order to create and add value in our products, processes and services. Its structure, which was developed to set technological development standards in the food industry, includes research and development areas for meat, pasta, margarine, vegetables, packaging, graphic arts, visual standardization of packaging, supplier quality, regulatory matters, sustainability and animal welfare. The facility also has meeting rooms, a pilot plant, areas for tests and sensorial evaluation, packaging laboratories, kitchens for food service clients, a library and spaces for brainstorming and benchmarking with potential partners.
We see investments in RD&I as a key factor in maintaining our competitive advantages, including by optimizing our production chain, improving our sustainability, launching innovative products and reaching the expectations and needs of consumers, clients and markets.
Furthermore, we have our own swine breeding program in eight exclusive farms, that produce a competitive genetic packages compared to the most significant international breeding programs. The breeding program has a team of seven highly qualified geneticists. In 2021, we started the selection using genomic breeding values. In order to implement this technology, we established partnerships with six research centers of the Brazilian Company for Agricultural and Farming Research (Empresa Brasileira de Pesquisa Agropecuária, or “EMBRAPA”), as well as with universities and governmental agencies (including the Brazilian National Bank for Economic and Social Development (Banco Nacional de Desenvolvimento Econômico e Social, or “BNDES”), Finep and CNPq).
| 111 |
Since 2009, we have been benefiting from tax credits from the Science, Technology and Innovation Ministry (Ministério da Ciência, Tecnologia e Inovação) to incentivize innovation research, called Lei do Bem. This program supports technological innovation based on the development of new products and new manufacturing processes and incremental improvement in actual products or processes. In recent years, we have established research partnerships on projects funded by EMBRAPA, FINEP, CNPq and BNDES, in different research areas.
The RD&I teams were integrated under the same business unit in 2015 in order to encourage efficiencies among the teams, to increase the speed to market of products and to improve consumer and technological connections.
More than 240 researchers and project managers are dedicated to continuously contributing innovative ideas to the RD&I pipeline, while running cost, process and formulation optimization. We have developed a unique stage gate process, which is managed by a multifunctional team to make bi-monthly decisions regarding potential innovations. This allows us to accelerate the decision-making process in a very complex chain while considering multiple points of view.
We define our growth platforms based on consumer preferences. Our main platforms for the Sadia brand are day-by-day meals, helpers, happy meals, well-being, premium and special dates. Our main platforms for the Perdigão brand are day-by-day meals, barbecue, Christmas and indulgent snacks. Our main platforms for the Qualy brand are breakfast, new occasions and margarine 2.0. The project managers are now able to navigate through different categories, such as ready meals, cold cuts, in natura meat, spreads, snacks and even food services, to design and apply solutions that either fulfill an unmet need or enhance a specific consumer preference. Accordingly, we invested R$244 million, R$196 million and R$206.9 million in 2021, 2020 and 2019, respectively.
In 2019, we launched multiple pork cuts products in line with our strategy of developing new consumer habits for pork cuts in the Brazilian market. We launched a robust portfolio of pork cuts under both the Sadia and Perdigão brands, including day-by-day pork cuts under the Sadia brand, along with special pork cuts for Christmas and seasoned pork cuts for barbecues under the Perdigão brand. We also launched important sub-brands under our Sadia brand: the Speciale Sadia sub-brand, with a premium cold cuts portfolio that includes raw ham and salami with a pepper border, and the Na receita Sadia sub-brand, with a new line of pre-prepared chicken to be used in various recipes in both the retail and food service markets. Under our Sadia brand, we also focused on refreshing the ready meals and cold cuts categories, including launching a new item, namely Mac’n Cheese, for the retail channel. In addition, we expanded the portfolio of our Perdigão brand through our Ouro sub-brand by launching mini sausages snacks and relaunching our pizza line, which is a volume-driven category that we expect will bring greater visibility to the brand on supermarkets’ gondolas.
In 2020, to reinforce our strategy of developing new consumer habits for pork cuts in the Brazilian market, we expanded our portfolio under the Sadia brand with multiple products, including new formats such as cubes, strips and IQF (individual quick freezing). In order to expand the Sadia brand to encompass associations with natural products, we formed a partnership with a Brazilian co-packer to market a new portfolio of organic chicken cuts. We also launched Sadia Veg&Tal, our sub-brand focused on vegan and vegetarian consumers that offers a product portfolio including plant-based hamburgers, breaded, frozen vegetables and frozen pies. We also extended our premium portfolio under our Sadia Speciale sub-brand with beef and chicken hamburgers, pork cuts and a turkey marinated with sparkling wine for our Christmas campaign. In order to increase the market penetration of our Sadia brand, we expanded our portfolio focused on volumetric categories with new formats of frozen fries and the return of the Sadia brand to the bulk hamburger category. To refresh our breaded portfolio under the Sadia brand, we also launched the Sadia chicken breaded wings, a pioneering product in the Brazilian market. Launched in 2019, Mac'n Cheese Sadia also played an important role in increasing the brand’s market share in the ready meals category. In addition, we expanded the portfolio of our Qualy brand to butter, cheese spread and frozen cheese bread.
During 2021, in addition to strengthening and expanding the lines launched in the last two years, we maintained our strategy of building increasingly segmented consumer platforms. We highlight as a novelty the launch of Livre&Lev, a sub-brand of Sadia, which focuses on well-being and is characterized as a line free of excesses and light in ingredients, specially developed to deliver more naturalness through fewer, well-known ingredients, free of additives. Composed of cold cuts (ham and turkey breast) and ready meals (portioned meals, which allow for different combinations and wraps). Another important initiative was the launch of the 100% Vegetable Chicken line by Sadia Veg&Tal, composed of 3 SKUs (shredded chicken, in strips and cubes), it is officially the 1st line of plant-based carbon neutral chickens on the market, whose emissions are neutralized from the grain to the point of sale through the purchase of carbon credits from forest conservation projects. The announcement was made during the COP26 climate conference in Scotland. The launches were awarded: First Place in the ESG Category and Winner of the Impact Projects Category 2021, both handed out by Grow Innovation Awards.
| 112 |
| D. | Trend Information |
In addition to the information set forth in this section, additional information about the trends affecting our business can be found in “—Results of Operations—Principal Factors Affecting our Results of Operations.” You should also read our discussion of the risks and uncertainties that affect our business in “Risk Factors, particularly, Item 3. Key Information—D. Risks Factors—Relating to Our Business and Industry—Geopolitical and other challenges and uncertainties due to the ongoing military conflict between Russia and Ukraine could have a material adverse effect on the global economy, certain material and commodity prices and our business,” “Item 3. Key Information—D. Risks Factors— Relating to Our Business and Industry—Deterioration of general economic and political conditions could negatively impact our business” and “Item 3. Key Information—D. Risks Factors—Risks Relating to Brazil—Brazilian economic, political and other conditions, and Brazilian government policies or actions in response to these conditions, may negatively affect our business, results of operations and the market prices of our common shares and ADRs.”
Global GDP is expected to grow 5.5% in 2021 after a decrease of 3.4% in 2020, according to a report released in January 2022 by the World Bank. Global GDP is expected to grow 4.1% in 2022. For additional information, see “Item 3. Key Information—D. Risk Factors—Risks Relating to Our Business and Industry—Pandemics or human disease outbreaks, such as the coronavirus (COVID-19), may disrupt consumption and trade patterns, supply chains and production processes, which could materially affect our operations and results of operations.”
A threat to global economic growth is the intensification of protectionist pressures, because of a potential widening of global imbalances coupled with sharp exchange rate movements. According to the International Monetary Fund (“IMF”), increased restrictions on global trade and migration would hurt productivity and incomes and have an immediate impact on market sentiment. Another potential risk discussed by the IMF is a tightening of global financing terms. The World Bank expects GDP growth of 3.7% in 2022 and 2.6% in 2023 for the U.S. and of 4.2% in 2022 and 2.1% in 2023 for the European Union. For emerging markets and developing countries in 2022, the World Bank expects a growth rate of 8.7% for India, 2.4% for Russia and 5.1% for China. The same report expects Brazil’s GDP to increase 1.4% in 2022 and 2.7% in 2023. The SELIC interest rate (the primary Brazilian interest reference rate) is expected to end 2022 at 11.75%, according to reports by Focus. Brazilian macroeconomic scenario may further deteriorate during the course of 2022 and 2023 as a result of general economic and political conditions.
Exports
Brazil is a leading producer in global export markets due to its natural advantages (land, water, and climate), competitive input costs and increasing efficiencies in animal production. Like other large Brazilian producers, we have capitalized on these advantages to develop the scope and scale of our business.
Brazilian chicken exports increased by 8.33% in the year ended December 31, 2021, compared to the year ended December 31, 2020, in terms of volume. Pork exports registered an increase of 10.7% in volume sold in the year ended December 31, 2021, compared to the year ended December 31, 2020. Beef exports recorded a decrease of 8.3% in volume sold in the year ended December 31, 2021, compared to the year ended December 31, 2020.
In international markets, we and other Brazilian producers compete with local and other foreign producers. Traditionally, Brazilian producers have emphasized exports of frozen whole and cut poultry and frozen pork and beef cuts. These products continue to account for a substantial portion of export volumes in recent years. Brazilian food companies have also expanded the sales of processed food products. We anticipate that, over the next several years, we and our main Brazilian competitors will sell greater volumes of frozen whole and cut poultry and frozen pork as well as increasing volumes of processed food products.
| 113 |
Brazilian chicken exports in the year ended December 31, 2021 totaled 4.47 million tons on sales of US$7.5 billion (or R$31.8 billion, translated to reais at the exchange rate of R$5.5805 as of December 31, 2021). China has been the main destination for these exports (14.3%), followed by Japan (10%), the United Arab Emirates (8.7%) and Saudi Arabia (7.9%).
The volume of pork exports in the year ended December 31, 2021 totaled 1.12 million tons, representing US$2.6 billion (or R$14.63 billion, translated to reais at the exchange rate of R$5.5805 as of December 31, 2021). The leading importers, China, Hong Kong and Chile represented 20.3%, 6% and 2.3%, respectively, of total exports from Brazil.
Beef shipments in the year ended December 31, 2021 totaled 1.81 million tons, with sales amounting to US$9.1 billion (or R$50.8 billion, translated to reais at the exchange rate of R$5.5805 as of December 31, 2021), compared to 1.98 million tons with sales of US$8.4 billion (or R$43.7 billion, translated to reais at the exchange rate of R$5.1967 as of December 31, 2020) in the year ended December 31, 2020. This decrease in volume was driven by lower exports to China (7.95%) and Hong Kong (2.3%).
In the beginning of 2020, oil prices dropped drastically following from the global economic slowdown brought on by the COVID-19 pandemic as well as an oil supply dispute among key oil producers. In the past, declines in the price of oil reduced the ability of certain countries to import Brazilian products. However, oil prices increased during 2021, surpassing pre-pandemic levels. According to the West Texas Intermediate index, which benchmarks oil prices, oil prices increased 74% in 2021, from an average of US$39.16 in 2020 to an average of US$68.13 in 2021.
Brazilian Market
Brazil is one of the largest meat consumers in the world, with per capita consumption in 2021 of 95.4 kilograms, including beef, chicken and pork products, according to the USDA, a decrease of 1.8% compared to 2020. In line with USDA and IBGE data, pork consumption per capita evolved from 13.93 kg in 2020 to 14.09 kg in 2021. Chicken consumption per capita also grew from 47.27 kg in 2020 to 48.19 kg in 2021. In contrast, in 2021, beef and veal consumption dropped from 35.93 kg per capita in 2020, to 33.12 kg in 2021.
Brazil’s domestic market is highly competitive, particularly for fresh food and frozen poultry and pork products. Besides us, there are many large producers, including Seara (which was acquired from Marfrig by JBS in 2013), Aurora and JBS. The main producers in the fresh food market face strong competition from a large number of small producers which operate in the informal economy and sometimes offer low quality products at lower prices than those of the large producers. We seek to develop quality products, focusing on innovative solutions that meet clients’ needs and capture value for the strong brands we own, such as Sadia and Perdigão.
The processed food sector is more concentrated than the fresh food sector in terms of the number of competitors. Consumption of processed products is influenced by a number of factors, including the level of consumer income and marketing efforts directed at meeting consumer demand for more value-added products. We believe that processed foods also represent an opportunity for growth in the coming years.
Raw Materials
In 2021, Brazil harvested its best soybean crop in history, according to the National Association of Cereal Exporters (Associação Nacional dos Exportadores de Cereais), or ANEC. In addition, the trade dispute between the U.S. and China, which began in April 2018 and continued through 2021, with China making purchases only to meet its short-term demand contributed negatively to Brazilian prices for raw materials as Chinese demand for Brazilian soybean decreased as well. Average soybean prices in Brazil increased 40% in 2021 compared to 2020, while soybean prices on the Chicago Board of Trade (“CBOT”) increased 44% in 2021.
| 114 |
In the Brazilian market, average corn prices increased 60% in 2021 compared to 2020, driven by the record export volumes that occurred in 2021 in addition to other factors such as weather anomalies that affected USA corn crop production and the increase of the Chinese corn imports reflecting lower world stocks and higher international prices. According to Brazil’s national food supply agency (Companhia Nacional de Abastecimento), the corn crop totaled 87 million tons in 2020/21, compared to 102.5 million tons in 2019/20. In the international market, corn crop in the United States in 2020/21 totaled 358.45 million tons, compared with 345.96 million tons in 2019/20.
Social Contributions
Brazilian Provisional Measure No. 774/17, valid as of July 2017, required that we pay a social contribution equal to 20% of our payroll, which is higher than the social contribution we had previously paid based on our gross operating revenue (between 1% and 2.5%). This provisional measure was revoked on August 2017 by Provisional Measure No. 794/17 and thus was not converted into law. In May 2018, Law No. 13,670/18 reestablished the payments of social contribution based on gross operating revenues instead of payroll until December 2020. Such term was subsequently postponed by Laws 14,020/20 and 14,288/21 being the payments of social contribution based on gross operating revenues currently valid until December 2023. Although the new Brazilian government is considering granting Brazilian companies permanent relief from social contributions, we cannot assure that the current relief will available after December 2023.
| E. | Critical Accounting Policies |
We have prepared our consolidated financial statements included in this annual report in accordance with IFRS, as issued by the IASB.
The preparation of these consolidated financial statements required management to make estimates and assumptions that affected the reported amounts of assets and liabilities and the disclosure of contingent assets and liabilities at the date of the consolidated financial statements and the reported amounts of revenues and expenses during the reporting period. Our management evaluates its estimates and judgments on an ongoing basis and bases its estimates and judgments on historical experience and on various other factors that it believes to be reasonable under the circumstances. Actual results may differ from these estimates under different assumptions or conditions.
All the relevant accounting practices adopted by us are disclosed in note 3 to our consolidated financial statements. The following is a description of the critical accounting policies, estimates or judgments that are important to the presentation of our consolidated financial statements.
Financial Instruments
Financial instruments are contracts that give rise to a financial asset for one entity and a financial liability or equity instrument for another. Their presentation in the statement of financial position and explanatory notes takes place according to the characteristics of each contract.
Financial Assets
Financial assets are recognized when the entity becomes a party to the contractual provisions of the instrument and are classified based on the characteristics of their cash flows and on the management model for the asset. The table below shows how financial assets are classified and measured:
| 115 |
| Category | Initial measurement | Subsequent measurement |
| Amortized Cost |
Accounts receivable from Clients and other receivables: billed amount adjusted to present value and, when applicable, reduced by expected credit losses For other assets: Fair value less costs directly attributable to its issuance, reduced by expected credit losses |
Interest, changes in amortized cost and expected credit losses recognized in the income statement. |
| Fair Value through Profit and Loss | Fair Value | Variation on the fair value recognized in the income statement. |
| Fair Value through Other Comprehensive Income | Fair value less costs directly attributable to its issuance. |
Changes in fair value recognized in other comprehensive income. Upon settlement or transfer, accumulated gains or losses are directly reclassified to Retained earnings or accumulated losses. For debt instruments, expected credit losses are recognized directly in the statement of income. |
We evaluate expected credit losses in each reporting period for instruments measured at amortized cost and for debt instruments measured at fair value through other comprehensive income. Losses and reversals of losses are recorded in the income statement.
The interests of financial assets are recorded on Financial Income (Expenses), net.
A financial asset is only derecognized when contractual rights expire or are effectively transferred.
Cash and cash equivalents: comprises the balances of cash, banks accounts and securities of immediate liquidity whose maturities, at the time of acquisition, are equal to or less than 90 days, readily convertible into a known amount of cash and which are subject to an insignificant risk of change in value. Securities classified in this group, by their very nature, are measured at fair value through profit or loss.
Expected credit losses in accounts receivable from customers and other receivables: we regularly assess the historical losses on the customer portfolios that we have in each region, taking in consideration the dynamics of the markets in which we operate and instruments that we have for reducing credit risks, such as letters of credit, insurance and collateral, as well as identifying specific customers whose risks are significantly different than the portfolio, which are treated according to individual expectations.
Based on these assessments, estimated loss factors are generated by portfolio and aging class, which, applied to the amounts of accounts receivable, generate the expected credit losses. Additionally, we evaluate macroeconomic factors that may influence these losses and, if necessary, adjust the calculation model.
Securities receivable with legal proceedings in place are reclassified to noncurrent as well as the related estimated credit losses.
Financial liabilities
Financial liabilities are recognized when the entity becomes a party to the contractual provisions of the instrument. The initial measurement is at fair value and subsequently at amortized cost using the effective interest rate method. The interests of financial liabilities are recorded on Financial Income (Expenses), net.
A financial liability is only derecognized when the contractual obligation expires, is settled or canceled.
| 116 |
Adjustment to present value
We measure the adjustment to present value on short and long-term balances of accounts receivable, suppliers and other obligations, being recognized as a deduction in the asset accounts against the financial result. We adopt the weighted average cost of capital to determine the adjustment to present value of the mentioned assets and liabilities, which corresponded to 9.3% per year on December 31, 2021 (9.8% per year on December 31, 2020).
Hedge accounting
Cash flow hedge: the effective portion of the gain or loss on the hedge instrument is recognized under Other Comprehensive Income and the ineffective portion in the financial result. Accumulated gains and losses are reclassified to the income statement or statement of financial position when the hedge object is recognized, adjusting the item in which the hedge object was accounted for.
When the instrument is designated in a cash flow hedge relationship, changes in the fair value of the future element of the forward contracts and the time value of the options are recognized under Other Comprehensive Income. When the instrument is settled, these hedge costs are reclassified to the income statement together with the intrinsic value of the instruments.
Fair value hedge: the effective portion of the hedge instruments’ gain or loss is recognized in the income statement or statement of financial position, adjusting the item under which the hedge object is or will be recognized. The hedge object, when designated in this relationship, is also measured at fair value.
Net investment hedge: the effective result of the exchange variation of the instrument is recorded under Other Comprehensive Income, in the same item in which the accumulated translation adjustments of the investments (hedge objects) are recognized. Only when the hedged investments are sold, the accumulated amount is reclassified to the income statement, adjusting the gain or loss on the sale.
Interest Rate Benchmark Reform
The Financial Stability Board recommended the reform of specified major interest rate benchmarks such as interbank offered rates (IBORs) and London interbank offered rate (LIBOR) in response to concerns about structural risks. Public authorities in several jurisdiction are undertaking reference rate reform initiatives to identify alternative reference rates that are more observable or transaction based and less susceptible to manipulation.
We do not have a designated relationship for hedge accounting that involve operations indexed to the reference interest rates subject to the reform. Additionally, existing liabilities indexed to the reference interest rates (LIBOR) have contractual arrangements anticipating the replacement for similar rates. Thus, no relevant impact is expected if such interest rates cease to exist or are replaced.
Revenue from contracts with customers
Sales revenues are recognized and measured observing the following steps: (i) identification of the contracts with customers, formalized through sales orders; (ii) identification of the performance obligations in the contract; (iii) determination of the transaction price; (iv) allocation of the transaction price to the performance obligations in the contract; and (v) revenue recognition, as it satisfies the performance obligations.
Revenues are recognized by the amount that reflects our expectation to receive for the sale of products, net of applicable taxes, returns, rebates and discounts.
The sales process begins with sales orders. The discounts and rebates may be negotiated on a spot basis or may have its conditions formally defined in the agreements, generally signed with large retail and wholesale chains. In all cases, the performance condition is satisfied when the control of the goods is transferred to the client.
| 117 |
We have sales with immediate and deferred payments, for which the adjustment to present value is recognized for the financial component. See note 3.20.3 to our consolidated financial statements.
Inventories
Inventories are measured at the lower of the average cost of acquisition or production of finished products and the net realizable value. The cost of finished products includes purchased raw materials, labor, production costs, transportation and storage, which are related to all the processes necessary for bringing the products to sales conditions. Write-down to net realizable value due to obsolescence, impaired items, slow-moving and realizable value through sale are evaluated and recorded in each reporting period, as appropriate. Normal production losses are included in the production cost for the respective month, while abnormal losses, if any, are expensed in cost of sales without movement through inventories.
Income taxes
In Brazil, it comprises income tax (“IRPJ“) and social contribution on profit (“CSLL“), which are calculated monthly based on taxable profit, after offsetting tax losses and negative social contribution base, limited to 30% of the taxable income, applying the rate of 15% plus an additional 10% for the IRPJ and 9% for the CSLL.
The results obtained from foreign subsidiaries are subject to taxation by the countries where they are based, according to applicable rates and legislation. In Brazil, these results suffer the effects of taxation on universal basis established by the Law No. 12,973 / 14. We analyze the results of each subsidiary for the application of its income tax legislation, in order to respect the treaties signed by Brazil and avoid double taxation.
Deferred taxes represent credits and debits on unused tax losses carried forward and negative CSLL base, as well as temporary differences between the tax and accounting bases. Deferred income tax assets and liabilities are classified as non-current. When our internal studies indicate that the future use of these credits over a 10-year horizon is not probable, the asset is derecognized. See note 10.3 to our consolidated financial statements.
Deferred tax assets and liabilities are presented net if there is enforceable legal right to be offset, and if they are under the responsibility of the same tax authority and under the same taxable entity.
Deferred tax assets and liabilities must be measured at the rates applicable in the period in which the asset is realized or the liability is settled, based on the rates (and tax legislation) that are in force on the financial position date.
In compliance with the interpretation IFRIC 23, we analyzed relevant tax decisions of higher courts and whether they conflict in any way with the positions adopted by us. Regarding the known uncertain tax positions, we reviewed the corresponding legal opinions and jurisprudence and did not identify impacts to be recorded, since it concluded that the tax authorities are not likely to reject the positions adopted.
We periodically evaluate the positions assumed in which there are uncertainties about the adopted tax treatment and will set up a provision when applicable.
Property, plant and equipment
Property, plant and equipment are measured by the cost of acquisition, formation, construction or dismantling, less accumulated depreciation. Loans and borrowings costs are recorded as part of the costs of property, plant and equipment in progress, considering the weighted average rate of loans and borrowings effective on the capitalization date.
Depreciation is recognized based on the estimated economic useful life of each asset using the straight-line method. The estimated useful life, residual values and depreciation methods are reviewed annually and the effects of any changes in estimates are accounted for prospectively. Land is not depreciated.
| 118 |
We annually perform an impairment analysis for our cash-generating units, which include the balances of property, plant and equipment. See note 13 to our consolidated financial statements.
Gains and losses on disposal of property, plant and equipment are determined by comparing the sale value with the residual book value and are recognized in the statement of income on the date of sale under other operating income (expense).
Leasing
A contract is, or contains, a lease if the contract conveys the right to control the use of an identified asset for a period of time in exchange for consideration. We assess whether:
| · | the contract involves the use of an identified asset, which may be explicit or implicit, and may be physically distinct or represent substantially the entire capacity of a physically distinct asset. If the supplier has a substantial right to replace the asset, then the asset is not identified; |
| · | we have the right to obtain substantially all the economic benefits from using the asset throughout the period of use; and |
| · | we have the right to direct the use of the asset throughout the period of use, which occurs in either of the following situations: (i) we have the right to direct how and for what purpose the asset is used, or (ii) the conditions are predetermined such that we have the right to operate the asset or has designed the asset in a way that predetermined how and for what purpose it will be used. |
At the beginning of the contract, we recognize a right-of-use asset and a lease liability, which represents the obligation to make payments related to the underlying asset of the lease.
The right-of-use asset is initially measured at cost and comprises: the initial measurement of the lease liability adjusted for any payment made at or before the commencement date, less any incentive received; any initial direct costs incurred; and an estimate of costs in dismantling and removing the asset, restoring the site on which it is located or restoring the asset to the condition required by the terms of the lease. Renewal or early termination options are analyzed individually considering the type of asset involved as well as its relevance in our production process.
The right-of-use asset is subsequently depreciated using the straight-line method from the commencement date until the end of the useful life of the right-of-use asset or until the end of the period of the lease. The estimated useful life of the right-of-use asset is determined on the same methodology used for the assets owned by us. Additionally, the right-of-use asset is adjusted by the subsequent measurement of the lease liability and when applicable, an impairment is recognized.
The lease liability is initially measured at the present value of the future lease payments using the incremental borrowing rate, and subsequently, measured at amortized cost using the effective interest method.
The liability is remeasured when there is a change in (i) future payments resulting from a change in index or rate, (ii) the amount expected to be payable under a residual value guarantee, or (iii) the assessment of whether we will exercise the purchase, renewal or termination option.
When the lease liability is remeasured, the corresponding adjustment is recorded in the book value of the right-of-use asset, or in the statement of income if the book value of the right-of-use asset has been reduced to zero.
We do not apply lease accounting model to: leases with a term of 12 months or less and that do not contain a purchase option; and leases for which the underlying asset is of low value. For these exemptions, the lease payments are recognized as an expense on a straight-line basis over the lease term.
Additionally, contracts with indefinite term and no fixed payments are expensed as incurred.
| 119 |
Intangible assets
Acquired intangible assets are measured at cost at initial recognition, while those arising from a business combination are recognized at fair value on the acquisition date. After initial recognition, are presented at cost less accumulated amortization and impairment losses, when applicable. Internally generated intangible assets, excluding development costs, are not capitalized and the expense is recognized in the income statement when incurred.
Intangible assets with definite useful lives are amortized on a straight-line basis over their economic useful lives. The amortization period and method for an intangible asset with definite life are reviewed at least at the end of each year, and any changes observed are applied prospectively. The amortization of intangible assets with finite lives is recognized in the income statement in the expense category related to their use.
Intangible assets with indefinite useful lives are not amortized, but are tested annually for impairment, being allocated to the cash-generating units. See note 14 to our consolidated financial statements. We record in this subgroup mainly goodwill and brands, which are expected to contribute indefinitely to its cash flows.
Business combinations
Business combinations are recorded according to the acquisition method, which determines that the cost of an acquisition is measured by the sum of the consideration transferred, assessed based on the fair value on the acquisition date, and the value of any non-controlling interest in the acquired company. We measure the non-controlling interest based on our participation in the net assets identified in the acquired company. Costs directly attributable to the acquisition are recorded as expense when incurred.
Business combinations with related parties are recognized using the acquisition method when the agreements have a substance and at cost when no substance is observed in the transaction.
In the acquisition of a business, our management assesses the acquired assets and liabilities assumed in order to classify and allocate them in accordance with the contractual terms, economic circumstances and relevant conditions on the acquisition date.
Initially, goodwill is measured as the excess of the consideration transferred over the fair value of the net assets acquired (identifiable assets and liabilities assumed, net).
After the initial recognition, goodwill is measured at cost less any accumulated impairment losses. For purposes of testing the recoverable amount, goodwill is allocated to each of the cash-generating units that will benefit from the acquisition.
Provision for tax, civil and labor risks and contingent liabilities
The provisions are recognized when we have a present obligation, formalized or not, as a result of a past event, the outflow of resources to settle the obligation is likely to occur and a reliable estimate can be made.
We are involved in several legal and administrative procedures, mainly in Brazil. Assessments of the likelihood of loss in these lawsuits include an analysis of the available evidences, the hierarchy of laws, the available jurisprudence, the most recent court decisions and their relevance in the legal system, as well as the assessment of outside lawyers. Provisions are reviewed and adjusted to reflect changes in circumstances, such as the applicable limitation period, conclusions of tax inspections or additional exposures identified based on new matters or court decisions.
In cases where there are a large number of lawsuits and the amounts are not individually material, we use historical studies to determine the probability and amounts of losses.
Contingent liabilities from business combinations are recognized if they arise from a present obligation that arose from past events and if their fair value can be measured reliably. The initial measurement is done by the fair value and subsequent measurements by the higher value between: the fair value on its acquisition date and the amount by which the provision would be recognized.
| 120 |
ITEM 6. DIRECTORS, SENIOR MANAGEMENT AND EMPLOYEES
| A. | Directors and Senior Management |
Board of Directors
Our board of directors provides our overall strategic direction. At least two members, or 20% of our board of directors, whichever is greater, must be independent under the Novo Mercado rules. Our board members are elected at Ordinary General Shareholders’ Meetings for a two-year term and may be reelected. Our board of directors currently consists of 10 members. Our bylaws do not contemplate alternates to board members. There is no mandatory retirement age for our board members. In case of any vacancy, the remaining members will nominate a board member who will serve until the next shareholders’ meeting, and the shareholders shall elect another board member to serve for the remaining term of office at such meeting. If more than one-third of the positions on the board of directors are vacant at the same time, then an extraordinary shareholders’ meeting shall be called within 30 days counted from such vacancy event. The following table sets forth information about our current Board members:
|
Name |
Position Held |
Appointment Date |
Term |
Age |
| Pedro Pullen Parente (1) | Chairman | April 30, 2020 | 2 years | 69 |
| Augusto Marques da Cruz Filho(1) | Vice-Chairman | April 30, 2020 | 2 years | 69 |
| Dan Ioschpe (1) | Board Member | April 30, 2020 | 2 years | 57 |
| Flavia Buarque de Almeida (1) | Board Member | April 30, 2020 | 2 years | 54 |
| Flavia Maria Bittencourt(1) | Board Member | April 30, 2020 | 2 years | 52 |
| José Luiz Osório (1) | Board Member | April 30, 2020 | 2 years | 70 |
| Luiz Fernando Furlan (1) | Board Member | April 30, 2020 | 2 years | 75 |
| Ivandré Montiel da Silva | Board Member | April 30, 2020 | 2 years | 53 |
| Roberto Rodrigues (1) | Board Member | April 30, 2020 | 2 years | 79 |
| Marcelo Feriozzi Bacci (1) | Board Member | April 30, 2020 | 2 years | 52 |
| (1) | Independent member (as defined in the Brazilian Novo Mercado regulations). |
Below is a summary of the professional experience and areas of activity of our current board members.
Pedro Pullen Parente – Mr. Parente received a bachelor’s degree in electric engineering from the University of Brasília in 1976. He held the positions of Global CEO and Chairman of the Board of Directors of our company from June 2018 to April 2019, when he stepped down from the Global CEO position. He remains as Chairman of our Board of Directors. Mr. Parente started his professional career at Banco do Brasil in 1971 and was transferred to the Brazilian Central Bank in 1973. He has been a consultant for the International Monetary Fund and public institutions in Brazil, including several State Departments and the National Constituent Assembly of 1988, and has occupied various government positions focusing on economics. As deputy minister of Finance, he was part of the team leading Plano Real which succeeded in reducing inflation in Brazil. Between 1999 and 2002, he served as the Chief of Staff to President Fernando Henrique Cardoso, Minister of Planning, and led the transition team after President Luiz Inácio Lula da Silva’s election in 2002. During this period, he played an important role as Chairman of the Energy Crisis Management Chamber when he coordinated the efforts that allowed Brazil to avoid an energy crisis. During president Cardoso’s government, Mr. Parente was Chairman of Petrobras’ board, the state-owned oil company, later becoming its CEO in July 2016, after an invitation from president Temer. In the private sector, he served as the Chief Operating Officer for media group RBS, as Chairman and CEO of Bunge Brazil, Chairman of the board of directors of General Atlantic in Brazil, and has also served on the board of directors of private and state-owned companies, including CPFL, B3, Duratex, Banco do Brasil, Prumo S.A., and others. Currently, he is chairman of the board of directors of Açú Petróleo, independent member and coordinator of the Nomination Committee at Vale, partner at EB Capital and member of the board of directors at Empreendimentos Pague Menos, Continental Grain Corporation and Syngenta AG. He is also Chairman of the Board of Directors (pro bono) of the Symphonic Orchestra of the State of São Paulo.
| 121 |
Augusto Marques da Cruz Filho – Mr. Cruz Filho is the Vice-Chairman of our Board of Directors. Mr. Cruz Filho holds a PhD in Economic Theory from the Institute of Economic Research (IPE) of the University of São Paulo, graduated in Economic Sciences from the Economic and Administration University of the University of São Paulo (FEA-USP) and attended the development abroad course at INSEAD – Executive Program at Institut Européen d’Administration des Affaires. Mr. Cruz Filho worked at Grupo Pão de Açúcar for 11 years holding the positions of executive officer, administrative and financial officer and, for over two years, CFO, until leaving the position in 2005. Between 2005 and 2010, Mr. Cruz Filho was member of the Board of Directors and Audit Committee of B2W. From April 2016 to August 2019, Mr. Cruz Filho acted as the Chairman of the Board of Directors of BR Distribuidora. He is also member of the Board of Directors of SIMPAR S.A. (former Grupo JSL S.A.), and General Shopping. Mr. Cruz Filho also acts as the Coordinator of our Audit and Integrity Committee.
Dan Ioschpe – Mr. Ioschpe graduated from the Federal University of Rio Grande do Sul. He also holds a postgraduate degree from ESPM – SP and an MBA from the Tuck School of Dartmouth College. He started working at Iochpe-Maxion in 1986, where he held several positions until June, 1996, when he left to act as CEO of AGCO in Brazil. He returned to Iochpe-Maxion in January, 1998, where he held the position of CEO. On April 2014, he left such position to become Chairman of the Board of Directors. Mr. Ioschpe acted as a Chairman of Fórum of Empresas Transnacionais Brasileiras (FET) and member of the Board of Directors of Profarma. Currently, he is a member of the Board of Directors of WEG, Embraer, Cosan and Marcopolo, President of Institute for Industrial Development Studies (IEDI) and Chairman of the Board of Directors of Sindipeças. Additionally, he acts as a member of the People, Governance, Organization and Culture Committee and Coordinator of our Finance and Risk Management Committee.
Flavia Buarque de Almeida – Ms. Almeida holds a degree in Business Administration from Fundação Getúlio Vargas and an MBA from Harvard Business School. Ms. Almeida has been a member of our board of directors since 2017 and CEO at Peninsula Capital Participações since 2019. She has also been an associate and officer at Peninsula Capital Participações S.A. and an associate and officer at O3 Gestão de Recursos Ltda. She is a board member of Carrefour S.A. (France), W2W E-Commerce de Vinhos S.A (wine.com.br), Vitamina Chile S.P.A, and Instituto Península. In 2019, Ms. Almeida was elected to the position of independent member of the board of directors of Ultrapar Participações S.A. Ms. Almeida was a board member of Harvard University (Board of Overseers) from 2011 to 2017, GAEC S.A.-Anima Educação from 2014 to 2017, and also an independent member of the board of directors of Lojas Renner S.A. from 2011 to 2016. Between 2009 and 2013, she was a senior partner of Monitor Group (currently Monitor Deloitte). Prior to that, between 2003 and 2009, Ms. Almeida was the general officer of Participações Morro Vermelho S.A., a family holding company that controls the Camargo Corrêa Group. During the years 1989 to 2003, Ms. Almeida worked at McKinsey & Company, where she was a partner. Ms. Almeida is also the Coordinator of our People, Governance, Organization and Culture Committee and a member of our Consumer Intelligence Committee.
Flavia Maria Bittencourt – Ms. Flavia Bittencourt has a degree in Chemical Engineering from the Federal University of Rio de Janeiro – UFRJ, an MBA in Marketing from the Escola Superior de Propaganda e Marketing – ESPM and an Executive MBA from Fundação Dom Cabral. She served as a member of the Board of Directors of Lojas Marisa between 2018 and 2019 and was a Senior Consultant at The Carlyle Group from 2012 until 2013. Ms. Flávia Bittencourt has a long history at Oi – Telemar, with over 10 years of experience in positions as Voice Market Manager (2001 – 2003), General Marketing Manager at Oi Móvel and, later, at Oi Group (2003 – 2005) ) and also held the position of Chief Marketing Officer and Chief Marketing Officer (2005 – 2011). In addition, she occupied the position of officer of Lácteos Brasil, co-founder of STORIES4FUN, and Senior Vice President of Latin America and National President (Brazil) of Sephora Brasil. She is currently CEO of Adidas and a member of the Board of Directors of Tim Brasil. Ms. Flavia Bittencourt is the Coordinator of our Consumer Intelligence Committee and a member of the Quality and Sustainability Committee.
José Luiz Osório – Mr. Osório has a Bachelor’s degree in Engineering from PUC-Rio and a Master’s degree in Engineering from Stanford University in the United States. He founded Jardim Botânico Investimentos in 2003 and he has been a member of the Board of Elba Equipamentos e Serviços S.A., since 2010 and BRADESPAR since 2020. He held executive positions at Bank Boston and Banco Garantia, between 1978 and 1993. In addition, he was the managing partner of investment banking at Banco Icatu (1993 – 1997), country manager at Lehman Brothers Brasil (1997-1999), executive officer of BNDES/BNDESPar (1999) and President of the CVM (2000-2002). He was a member of the board of directors of Lojas Renner (2005-2007), Invest Tur (2007 – 2008), Merger and Acquisitions Committee (2013 – 2015), Banco Triângulo (2003 – 2017), MZ Group (2009 – 2018) and was member of the Advisory Council of the Millstein Center for Global Markets and Corporate Ownership, Columbia University (2013 – 2016) and Millstein Center for Global Markets and Corporate Ownership, Columbia University (2007 – 2012). He also acted as member of the Independent Committee at Smiles/GOL (2019), Claro/Embratel/NET (2014) and Votorantim Celulose e Papel/Aracruz (2009). He also was the CEO of Icatu Securities and Garantia Inc., both in New York, and CEO of Instituto Ibero Americano de Mercado de Capitais. Mr. Osório is also a member of our Quality and Sustainability Committee.
| 122 |
Luiz Fernando Furlan – Mr. Furlan graduated with a degree in Chemical Engineering from FEI (the Industrial Engineering School) and a degree in Business Administration from the Universidade de Santana - São Paulo, with extension and specialization courses in Brazil and abroad. Mr. Furlan was Chairman of the board of directors of Sadia S.A. from 1993 to 2002 and from 2008 to 2009, where he also occupied several different executive positions from 1976 to 1993. He was Vice-Chairman of our board of directors from 2009 to 2011, as well as a member of the board of Telefónica S.A. (Spain) from 2008 to 2019, Global Board of Panasonic (Japan) from 2008 to 2013, Walmart Internacional (USA) from 2011 to 2013, AMIL Participações S.A. from 2008 to 2013, AGCO Corporation (USA) from 2010 to 2017 and a member of the Advisory Board of ABERTIS Infraestruturas S.A. (Spain) from 2013 to 2015. He served as Minister of Development, Industry and Foreign Trade of Brazil from 2003 to 2007. From 2008 to 2016, he was Chairman of the Board of Fundação Amazonas Sustentável (FAS), and since then has been an honorary member. He was also a member of the Global Commission for the Conservation of Oceans (Global Ocean Commission – USA) from 2013 to 2015 and, currently, is a member of the board of directors of Telefonica Brasil S.A. (Brazil), Chairman of the board of LIDE, President of Deliberative Council of SP Negócios (appointed by the Mayor of the São Paulo City) and a member of the Wise Group Brazil-Japan (which seeks the strengthening of strategic economic partnership between Brazil and Japan). Mr. Furlan is also a member of our Quality and Sustainability Committee.
Ivandré Montiel da Silva – Mr. Montiel da Silva graduated in Economic Sciences, with a postgraduate degree in Finance from the Pontifical Catholic University of Rio Grande do Sul (PUC-RGS) and a Masters in Economics from the University of Brasília (UNB), in addition to having taken several courses in training and specialization for Board of Directors with a focus on corporate governance, management and capital markets by the Brazilian Institute of Corporate Governance (“IBGC”) and Fundação Dom Cabral. He served as Deputy Secretary of the Economic Policy Secretariat in the Ministry of Finance from December 2015 to January 2019, in addition to serving as Executive Manager of the Agribusiness Directorate (2012 – 2015) and Vice President of Agribusiness (2019 – 2020) of the Banco do Brasil S.A. and CEO of Mapfre BB SH1 Participações (BrasilSeg) in 2020. Mr. Montiel da Silva has also held the position of member of the Board of Directors of BrasilSeg from January 2019 until January 2020 and Banco da Amazônia S.A. Mr. Montiel da Silva is also a member of our Finance and Risk Management Committee, Audit and Integrity Committee and Consumer Intelligence Committee.
Roberto Rodrigues – Mr. Rodrigues graduated with a degree in agricultural engineering from the Luiz de Queiroz College of Agriculture of the University of São Paulo (ESALQ-USP) in 1965. He was awarded an Honorary Doctorate degree in Rural Administration from the São Paulo State University (UNESP) in 1998. Mr. Rodrigues was a professor at UNESP until 2012, and member of the board of directors of Minerva S.A. from 1967 until 2017. He has been a member of the Advisory Council of the Organization of Cooperatives of the State of São Paulo (OCESP) since 1990 and Coordinator of the Agribusiness Center of the Fundação Getúlio Vargas (FGV) since 2006. He was Chairman of the Organization of the Brazilian Cooperatives from 1985 to 1991, the Brazilian Rural Society from 1994 to 1996, the Brazilian Association of Agribusiness from 1999 to 2002, the International Cooperative Alliance from 1997 to 2001 and the Agribusiness Council of the Federation of Industries of the State of São Paulo (COSAG FIESP) from 2006 to 2012. He was Minister of the Agriculture of Brazil from 2003 to 2006. He is currently a member of the Agribusiness Council of the Federation of Industries of the State of São Paulo (COSAG FIESP). Mr. Rodrigues is also the Coordinator of our Quality and Sustainability Committee.
Marcelo Feriozzi Bacci – Mr. Bacci holds a degree in Public Administration from Fundação Getúlio Vargas – FGV, as well as an MBA in Finance and Capital Markets from IBMEC – Brazilian Institute of Capital Markets and the title of “Master” in Business Administration through the Stanford Graduate School of Business, also holding certificates focused on the effectiveness of the Boards of Directors and Public and Global Management by institutions such as Harvard Business of School and Stanford GSB. Mr. Bacci was elected one of the most admired CFOs in Brazil by Análise Editorial Magazine in the years 2017, 2018 and 2019 and was the winner of the IBEF 2018 Equilibrist Award (CFO of the year). He held several positions at UNIBANCO – União de Bancos Brasileiros, starting his career as a Trainee in 1991 and later holding the positions of Associate – Corporate Finance (1991–1993), International Capital Market Manager (1994-1997) and International Treasury Manager (1998). As a result, he worked at several companies, acting as Summer Associate – Financial Institutions Group at Lehman Brothers, Inc.; Financial Manager (2000-2001), Finance and Administration Officer (2001-2004) and Executive Officer – CFO (2004-2005) at PROMON S/A; also occupied the positions of CFO – Northern Latin America (2005-2009) and CFO – Bioserv (2009-2011) by Louis Dreyfus Company. He is currently the CFO of Suzano Group, company in which he has worked for more than tenyears, and holds the position of member of the Board of Directors of Veracel Celulose S/A. He has already served on the Boards of Directors of companies such as Biosev, Terminal de Exportação de Açúcar Guarujá (TEAG), Companhia Nacional de Açúcar e Álcool (CNAA) and Trópico Sistemas, and also acted as Chairman of the Board of Directors of Ibema Papel Cartão S.A. Mr. Bacci acts as member of our Audit and Integrity Committee and Finance and Risk Management Committee.
| 123 |
Board of Directors Nominees
In a meeting held on February 22, 2022, our board of directors approved a slate proposal presented on the date thereof by the shareholders Marfrig Global Foods S.A. and Fundo de Investimento em Ações Colorado – Investimento no Exterior, which jointly own 33.25% of our capital stock. On March 24, 2022, we received from Caixa de Previdência dos Funcionários do Banco do Brasil – PREVI, which holds 6.13% of our capital stock, a request that a cumulative vote system be adopted for the election of members of our board of directors at our 2022 General Shareholders’ Meeting. See “Item 10. Additional Information –– B. Memorandum and Articles of Association––Board of Directors.” for further information regarding our cumulative vote system. The following table sets forth information about the board of directors nominees that will be submitted for election at our 2022 General Shareholders’ Meeting through a candidate-based (rather than slate-based) system:
|
Name |
Position |
Appointment Date |
Term |
Age |
| Marcos Antonio Molina dos Santos | Chairman | March 28, 2022 | 2 years | 52 |
| Sergio Agapito Lires Rial | Vice-Chairman | March 28, 2022 | 2 years | 61 |
| Marcia Aparecida Pascoal Marçal dos Santos | Board Member | March 28, 2022 | 2 years | 49 |
| Augusto Marques da Cruz Filho(1) | Board Member | March 28, 2022 | 2 years | 69 |
| Deborah Stern Vieitas(1) | Board Member | March 28, 2022 | 2 years | 64 |
| Flávia Maria Bittencourt(1) | Board Member | March 28, 2022 | 2 years | 52 |
| Oscar de Paula Bernardes Neto(1) | Board Member | March 28, 2022 | 2 years | 75 |
| Pedro de Camargo Neto(1) | Board Member | March 28, 2022 | 2 years | 73 |
| Altamir Batista Mateus da Silva(1) | Board Member | March 28, 2022 | 2 years | 47 |
| Eduardo Augusto Rocha Pocetti | Board Member | March 28, 2022 | 2 years | 67 |
| (1) | Independent member (as defined in the Brazilian Novo Mercado regulations). |
Below is a summary of the professional experience and areas of activity of our board members nominees.
Marcos Antonio Molina dos Santos – Mr. Molina is the chairman of Marfrig’s board of directors. He has over 30 years of experience in the food sector, having started his professional career at the age of 16, when he opened his first business, a food distribution company. Mr. Molina is also a partner and the chief executive officer of MMS Participações Ltda., which is Mafrig’s parent company. Marfrig currently owns 33.25% of our share capital. See “Item 7. Major Shareholders and Related Party Transactions⸻ A. Major Shareholders.”
Sergio Agapito Lires Rial – Mr. Rial’s professional career includes the positions of chief executive officer of Marfrig, executive vice-president and chief financial officer of Cargill and president of Banco Santander Brasil. He was also a member of Cargill’s board of directors for nine years. Mr. Rial was president of Seara Alimentos S.A., managing director at Bear Stearns & Co. in New York, director of ABN AMRO Bank and member of the board of directors of ABN AMRO Bank in the Netherlands, as well as a member of the board of directors of Mosaic Fertilizers. He holds a degree in law from the Universidade Federal do Rio de Janeiro and in economics from Universidade Gama Filho, as well as an MBA from IBMEC, in São Paulo and specializations from Harvard Business School, Wharton School of Business, University of Pennsylvania and INSEAD, in France. He is currently chairman of the board of directors of Santander Brasil and chairman of the board of directors of Getnet and Universia Brasil, S.A.
| 124 |
Marcia Aparecida Pascoal Marçal dos Santos – Ms. Marçal dos Santos has been a member of Marfrig’s board of directors since March 2007. She has extensive experience at Marfrig, having been responsible for the financial department from 2000 to 2006 and for the internal audit team from 2000 to 2006. In addition, Ms. Marçal dos Santos actively participates in the Marfrig Fazer e Ser Feliz Social Responsibility Institute, as its chief executive officer. She is also a partner and vice-president of MMS Participações Ltda., which is Marfrig’s parent company.
Augusto Marques da Cruz Filho – See “––Board of Directors.”
Deborah Stern Vieitas – Ms. Vieitas’ career developed and consolidated in the financial market, working in large and renowned international and Brazilian institutions. She has experience in business management with responsibility for results, as well as in the implementation of operations from a banking license. Her academic background includes: a master in public administration from École Nationale d’Administration – ENA, in France; a master's in business administration from Fundação Getúlio Vargas, in São Paulo, international economics; a degree in public administration from Fundação Getúlio Vargas, in São Paulo; a graduate degree in journalism from the Universidade de São Paulo; and certification as a board member by the Brazilian Institute of Corporate Governance. Ms Vieitas also has experience as a member of the board of directors and coordinator of the audit committee. She also has experience on board of directors in the following companies: Banco Santander S.A. (2017-present); AXA Seguros S.A. (2016-2017); and Banco Caixa Geral (2008-2014). Ms. Vieitas has executive experience in the following companies: CEO American Chamber of Commerce for Brazil – AMCHAM Brasil (2015-present); chief executive officer of Banco Caixa Geral (2008-2014); vice-president responsible for large corporates, financial institutions and structured finance at Banco BNP Paribas (2000-2008); and vice-president responsible for exchange, trade finance, corporate loans and capital markets at Banco CCF Brasil (1988-2000). Ms. Vieitas was also a member of the advisory board of the We Ventures Fund focused on female entrepreneurship (2021); a member of the advisory board of the startup Se Candidate Mulher that works in employability for women (2021); she was mentioned in the list of Most Influential Women of the Year by FORBES Magazine (2017); elected one of the 10 Best Executives of the Year by Valor Econômico/Egon Zehnder (2014); and honored as Administrator of the Month by the Conselho Regional de Administração of São Paulo (2014).
Flávia Maria Bittencourt – See “––Board of Directors.”
Oscar de Paula Bernardes Neto – Mr. Bernardes holds a degree in chemical engineering from the Universidade Federal do Rio de Janeiro. He is a partner at Yguaporã Consultoria e Empreendimentos Ltda., a consulting and investment firm in São Paulo since 1999. From 2004 to 2011 he was a partner at Integra Associados – Reestruturação Empresarial Ltda., a consulting firm specializing in restructuring, M&A and asset management crisis. From 1999 to 2003, Mr. Bernardes was chairman of the board of directors of TIW do Brasil, a Canadian telecommunications company, and from 1996 to 1999 he was chairman of Bunge International, a global leader in the agribusiness and food sector. Prior to joining Bunge, he was senior vice-president and partner at Booz Allen and Hamilton for Latin America. Previously, he was the operations officer in Brazil of Ferro Corporation. Mr. Bernardes is a member of the board of directors of the following companies: DASA, Laboratórios da América S.A. – Brazil (2011-present); Locates Rent a Car S.A. – Brazil (2007-present); Mosaic – USA (2018-present); Votorantim Participações – Brazil (2015-present); Jalles Machado (2019-present), chairman of the board of directors since 2020. Mr. Bernardes was also a member of the following boards of directors: Omni Brasil (2011-2020); Marcopolo S.A. – Brazil (2012-2019); Praxair – USA (2010-2018); Gerdau S.A. – Brazil (2003-2016); Metalúrgica Gerdau S.A. – Brazil (2003-2016); Vanguarda (Strategic Committee) – Brazil (2012-2015); Cia Suzano de Papel e Celulose – Brazil (2005- 2015); ALCOA – Brazil (2003-2015); Bunge – Brazil (1999-2013); Johnson Electric Holdings Ltd. – Hong Kong (2003-2011); São Paulo Alpargatas S.A. – Brazil (2006-2012);and Delphi – USA (1999-2000).
Pedro de Camargo Neto – Mr. Camargo is a civil engineer graduated from the Universidade de São Paulo (1972). He has a master of science from the Massachusetts Institute of Technology (1974) and a PhD in production engineering from the Universidade de São Paulo (1984). Mr. Camargo has been a farmer and rancher in the states of São Paulo, Mato Grosso do Sul and Piauí for the last 40 years. He was a business consultant, secretary of production and marketing at MAPA, from 2001 to 2002 and president of the Brazilian Rural Society from 1990 to 1993 and vice-president from 2017 to 2019.
| 125 |
Altamir Batista Mateus da Silva – Mr. da Silva holds a degree in administration from EAESP/Fundação Getúlio Vargas, in São Paulo. He was statutory officer of Banco Safra between 2011 and 2020. He worked for 2 years in a family office and 7 years as head of investment (debt and equity capital markets, M&A, derivative sales, fixed income book, brokerage). He was executive officer of JPMorgan Brazil and in New York in the areas of credit, debt capital markets, equity capital markets, M&A and IB Coverage.
Eduardo Augusto Rocha Pocetti – Mr. Pocetti has been a member of the fiscal council of Marfrig since April 2014. As an accountant, he holds an MBA in Business Administration from Fundação Getúlio Vargas and is currently chairman of the board of directors of IBRACON – Instituto dos Auditores Independentes do Brasil. Mr. Pocetti was a partner at KPMG Auditores Independentes and has 30 years of experience in auditing companies. From 2004 to 2011, he was president of BDO RCS Auditores Independentes S.A., where he represented the name of BDO Brasil for all member firms of the international BDO network. He has extensive experience in finance, accounting, independent auditing, economic-financial planning and coordination at the management and board level in several large national and multinational companies in the industrial and financial sector. Mr. Pocetti worked in several IPO transactions and special corporate finance projects for the purchase and sale of companies. Mr. Pocetti is also a member of the board of directors of the publicly-held company Mahle Metal Leve S.A. and a member of the fiscal council of CIEE – Centro de Integração Empresa Escola.
See “Item 3. Key Information—D. Risk Factors—We do not have a controlling shareholder or control group, which may make us susceptible to the emergence of shareholders with relevant stakes, alliances between shareholders, possible conflicts between shareholders and other events arising from the absence of a controlling shareholder or control group, and that may lead to changes in our corporate policies and strategies.”
Executive Officers
Our executive officers are responsible for our day-to-day operations and implementation of the general policies and guidelines approved from time to time by our board of directors.
Our bylaws require that the board of executive officers consist of a Chief Executive Officer, a Chief Financial and Investor Relations Officer and up to 13 additional Vice Presidents, each with the designation and duties assigned by our board of directors.
Our executive officers are elected by our board of directors for two-year terms and are eligible for reelection. Our board of directors may remove any executive officer from office at any time with or without cause. Under Brazilian Corporate Law, our executive officers must be residents of Brazil but do not need to be our shareholders. Our executive officers hold ordinary monthly meetings, as well as extraordinary meetings, when called by our Chief Executive Officer. The following table sets forth the name, position and the applicable date of appointment of each of our current executive officers.
|
Name |
Position Held |
Appointment Date |
Age |
| Lorival Nogueira Luz Júnior | Global Chief Executive Officer | May 28, 2020 | 50 |
| Carlos Alberto Bezerra de Moura | Chief Financial and Investor Relations Officer | May 28, 2020 | 47 |
| Vinícius Guimarães Barbosa | Vice-President of Operations and Procurement | May 28, 2020 | 53 |
| Sidney Rogério Manzaro | Vice President of Brazil Market | May 28, 2020 | 55 |
| Alessandro Rosa Bonorino | Vice-President of People, Management and Digital Transformation | May 28, 2020 | 52 |
| Leonardo Campo Dall’Orto | Vice-President of Integrated Planning and Logistics | May 28, 2020 | 48 |
| Grazielle Tallia Parenti | Vice-President of Institutional Relations and Sustainability | May 12, 2021 | 51 |
| Marcel Sacco | Vice-President of New Businesses | May 12, 2021 | 54 |
The following is a summary of the business experience in the sector, areas of expertise and principal outside business interests of our current executive officers.
| 126 |
Lorival Nogueira Luz Júnior – Mr. Luz has more than 28 years of professional experience. In September 2017, he was appointed as our Chief Financial and Investor Relations Officer, and in April 2018, he was appointed as interim CEO. In June 2018, he was appointed as Global Chief Operating Officer (COO) and on March 28, 2019, he was named Mr. Parente’s successor as our Global CEO following the end of Mr. Parente’s term. From 2013 to September 2017, he was the Vice President of Finance and Investor Relations at Votorantim Cimentos S.A. Between 2010 and 2011, he was Executive Officer of Treasury and Investor Relations at Votorantim Industrial, and in March 2011 he was elected as Finance and Investor Relations Officer of CPFL Energia S.A. and subsidiaries of the CPFL Energia group. From 2008 to 2009, he was CFO and Investor Relations Officer at Estácio Participações. Prior to that, Mr. Luz worked at Citibank for 17 years, holding different positions in the Corporate and Investment Bank, Treasury, Retail Bank and Financial Control divisions. He was also Executive Officer of Treasury at Credicard and held the same position at Banco Citicard until 2008. Mr. Luz holds a degree in Business Administration at Fundação Armando Álvares Penteado - FAAP, with several specialization courses abroad.
Carlos Alberto Bezerra de Moura – Mr. Moura worked as Executive Officer and CFO at Companhia Brasileira de Metalurgia e Mineração (CBMM). Previously, he held the position of Corporative Vice President and Chief Financial Officer of Diagnósticos da América S.A. (DASA) from November 2009 to May 2011. He was Officer and Partner of Itaú Unibanco Financial Holding for the retail sector from December 2001 to November 2009, and he has occupied previous positions at Banco Bozano, Simonsen and Deloitte Touche Tohmatsu. He graduated in Accounting Sciences from the Federal University of Rio de Janeiro - UFRJ, he holds a post-graduation in Financial Administration from the Getúlio Vargas Foundation of Rio de Janeiro (FGV/RJ) and a MBA from the Dom Cabral Foundation, with coursework at the Kellogg School of Management. Mr. Moura also acted as a member of the Board of Directors to different companies in various sectors, including information technology, financial services and loyalty programs. Since 2019, Mr. Moura has been our chief financial and investor relations officer.
Vinícius Guimarães Barbosa – Mr. Barbosa graduated in Production Engineering from the University of Rio de Janeiro and holds a MBA from IBMEC. He began his career as a trainee at Brahma and served in several positions in procurement, operations and logistics. At Brahma, he was responsible for the integration of several M&A transactions in the supply chain department. Before joining BRF, Mr. Barbosa was Vice President of Operations and Logistics at Anheuser-Busch for the United States and Canada. Since 2018, Mr. Barbosa has been our Vice-President of Operations and Procurement.
Sidney Rogério Manzaro – Mr. Manzaro holds a degree in Business Administration from the University of Santana and a MBA in Advertising and Marketing from School of Higher Education in Advertising and Marketing (ESPM), with a 38-year experience in business management in the food sector, as well as in the commercial and restructuring areas. Mr. Manzaro began his career as a trainee at AmBev in 1991, where he worked for 14 years, with a distinguished career in the commercial area, leading restructurings, the go-to-market (GTM) strategy and various projects in multiple sales channels. At BRF, his career started in 2005 in the AS channel, where he headed the business of the Rezende/Wilson brand, the TAC/CADE project. He also led the GTM strategy of dairy products and route channel. In 2013, he led the GTM project and he took over the retail commercial executive board, directly managing the teams for Sadia, Perdigão, Lácteos (dairy products) and Food Service. In 2015, he was appointed to the São Paulo regional executive board, in charge of Brazil’s highest volume for BRF. Between 2015 and 2018, Mr. Manzaro served as Grano’s CEO and in 2018, he returned to BRF as Chief Commercial Officer for Brazil.
Alessandro Rosa Bonorino – Mr. Bonorino graduated in Economics from the Federal University of Rio de Janeiro – UFRJ, and he holds an Executive MBA from the Dom Cabral Foundation. Mr. Bonorino has more than 30 years of professional experience, having spent the past 19 years in executive positions. He started his career as an auditor at KPMG. In the human resources field, he began his career at IBM in 1992, where he led transformative projects across multiple areas of people management on a national, regional and global scale. Recognized for several years as one of the top human resources professionals in Brazil by industry publications, Mr. Bonorino has had extensive experience in multiple corporate cultures, and has worked in various countries as a human resources specialist. In particular, he was the global Vice President of Recruitment at IBM Corporation in China, he led the human resources department for South America in Argentina, and he was the head of human resources for Brazil and, subsequently, of all of Latin America. In 2017, he joined our company as Vice-President of People, Management and Digital Transformation.
| 127 |
Leonardo Campo Dall’Orto – Mr. Dallorto holds a degree in Mechanical Engineering from the Federal University of Espírito Santo, with a master’s degree and a doctorate in industrial engineering from the Pontifical Catholic University of Rio de Janeiro (PUC-RJ) and a MBA from the Dom Cabral Foundation. Mr. Dallorto has 18 years of experience, the last 10 years of which holding executive positions. He began his career at Vale in 2002 in the Railway and Port Logistics area, and he took part in their international expansion, working in projects in Canada, India and Africa. Between 2007 and 2011, he served with the consulting firm McKinsey & Company, focused on Supply Chain, Procurement, Strategy and M&A of companies across different sectors in Latin America. Mr. Dallorto joined BRF in 2011, serving as Officer, heading the Supplies and Integrated Planning area. As Officer of the Commercial VP Brazil, he led the Logistics and South Region units, developing customer relationship programs, GTM strategies and the review of distributors’ role in the region. As the Industrial Operations Officer, he took part in defining their manufacturing footprint and led their productivity project (Guide). Since 2018, Mr. Leonardo has been our Vice-President of Integrated Planning and Logistics.
Grazielle Tallia Parenti – Ms. Parenti holds a degree in Business Administration from Fundação Getúlio Vargas (FGV), an MBA with emphasis in Marketing from FIA/USP and a post-graduate degree in Public Policy from FGV. Ms. Grazielle Parenti has over 25 years of experience and high representation in the Industry, having worked at Votorantim, Diageo and Mondelez. Currently, she is also President of the Board of ABIA – Brazilian Association of the Food Industry, President of the BRF Institute, a member of the Board of several trade associations, and a member of the Advisory Council of the Private Sector (Conex), a collegiate of the Executive Chamber of Foreign Trade of the Ministry of Economy and the Brazil-China Business Council. Ms. Grazielle Parenti is very committed to the Diversity and Inclusion agenda, and she is the president of the Brazilian Chapter of the BRICS Woman Business Alliance and other national and international initiatives. In May 2021 Ms. Parenti assumed the position of Vice-President of Institutional Relations and Sustainability.
Marcel Sacco – Mr. Sacco holds a bachelor’s degree in Marketing from Escola Superior de Propaganda e Marketing (“ESPM”) and a master’s degree in Business Administration with emphasis in Finance from Fundação Getúlio Vargas (FGV). He also completed specializations in Advanced Marketing Management at IMD in Switzerland, in Advanced General Management at INSEAD, located in France, as well as the Leadership Program at the Institute for Creative Leadership in San Diego, California. In addition, Mr. Sacco completed the Councilor Development Program at Fundação Dom Cabral. In 2008, he was nominated as one of the three best marketing professionals in Brazil by Prêmio Caboré. Mr. Macel Sacco has worked in companies such as Parmalat Brasil, Telefônica, Schincariol and Bauducco. For the past five years, he has held the position of General Manager Brazil & LatAm at The Hersey Company from 2019 until 2021, where he previously served as General Manager Brazil & South America from 2013 until 2019. Currently, Mr. Sacco serves as a member of the Board of Directors at Farmax – Indústria de Cosméticos e Farmacêuticos and NGO Gerando Falcões. In May 2021 assumed the position of Vice-President of New Businesses at BRF S.A.
| B. | Compensation |
In 2021, the total salary and compensation paid by us to all our executive officers and members of our board of directors and fiscal council for their services was R$61.1 million. From this total, the amount to be paid in 2022 to our executive officers with respect to the year ended 2021 as part of our profit-sharing plan is R$13.8 million. The aggregate total compensation paid to members of the board of directors, fiscal council and audit and integrity committee and executive officers in 2021 (including salaries, profit sharing payments, as described below, and benefits) was R$63.4 million.
The amount of variable compensation paid to each executive officer in any year pursuant to our profit-sharing plan is primarily related to financial and non-financial results such as EBIT, net income, cash flow, safety index, KPIs related to ESG and quality. It is also based on an assessment of individual performance of each officer conducted by the CEO and members of Board of Directors. This methodology follows best market practices and provides reasonable maximum amounts while ensuring our market competitiveness in terms of compensation and retention.
Our executive officers are also eligible to participate in our Restricted Stock Plan. As of December 31, 2021, a total of 1,339,495 stock options, RSUs and PSUs were held by our executive officers, with a cost to us of R$29.2 million. In 2021, a total of 708,014 stock options and shares of restricted stock were granted to our executive officers. For additional information regarding our Stock Option Plan and Restricted Stock Plan, see “—E. Share Ownership— Stock Options Plan, Performance Shares Plan and Restricted Stock Plan.”
| 128 |
The table below shows information about the stock options and RSUs granted to executive officers of BRF in 2021 and in previous years that are still outstanding as of December 31, 2021:
|
Grant |
# Options / Restricted Stock Units |
Grant Price(1) |
Strike Price as |
Expiration Date |
| 2019 (Restricted Stock and Performance Shares Units) | 135,800 | R$30.61 | N/A | June 1, 2022 |
| 2020 (Restricted Stock and Performance Shares Units) | 495,681 | R$21.28 | N/A | June 1, 2023 |
| 2021 (Restricted Stock and Performance Shares Units) | 708,014 | R$28.58 | N/A | July 1, 2024 |
| Total | 1.339,495 |
| (1) | The grant price refers to the average stock price at the B3 of the last 20 trading days before the grant date. |
Our executive officers receive certain additional benefits generally provided to employees and their families, such as medical assistance, educational expenses, development and supplementary social security benefits, among others. They also participate in our private pension plan. At age 61, we cease making contributions to pension plans for executive officers and other employees. In 2021, the amount paid as benefits and private pension plan to the executive officers totaled R$2.3 million.
Our executive officers and the members of our board of directors, audit and integrity committee and fiscal council are not parties to employment agreements or other contracts providing for benefits upon the termination of employment. However, non-compete agreements may be entered into with executive officers departing our company. In 2021, we paid severance benefits to former executive officers in the amount of R$2.1 million.
| C. | Board Practices |
For information about the date of expiration of the current term of office and the period during which each member of the Board of Directors and executive officer has served in such office, see “—A. Directors and Senior Management.” For information about contracts for benefits upon termination of employment, see “—B. Compensation.”
On November 26, 2020, our board of directors approved: (i) our Appointment Policy for members of the board of directors, advisory committees and the board of executive officers, which aims to establish guidelines regarding the practices and definition of criteria for the selection and hiring of those members; and (ii) our Management Compensation Policy, to determine the compensation of the members of our board of directors, advisory committees and executive officers. Both policies were prepared and implemented in accordance with applicable legal requirements, best corporate governance practices and the Novo Mercado rules.
On September 30, 2021, our board of directors approved: (i) our Sustainable Grain Policy; and (ii) our Human Rights Policy.
On September 30, 2021, our board of directors approved: (i) our Donations and Sponsorships Corporate Policy; (ii) our Integrity System Policy; (iii) our Conflict of Interests Corporate Policy; and (iv) our Code of Conduct for BRF Business Partners. On November 10, 2021, our board of directors approved: (i) the modification of our Tax Management Policy; (iii) our Result Destination Policy; and (iv) our Financial Policy. On November 23, 2021, our board of directors approved the modification of our Related Party Transactions Policy. On December 16, 2021, our board of directors approved a change to our Financial Risk Management Policy.
| 129 |
Fiscal Council
Under Brazilian Corporate Law, a company’s fiscal council is a corporate body independent of the company’s management and external auditors, and has authority, among other matters, to supervise certain acts of management, to issue a report on the financial statements prepared by management and to give an opinion on management proposals to be submitted to general shareholders’ meetings regarding changes in the capital stock, issuance of debentures or warrants, investment plans or capital budgets, dividend distribution, transformation, merger, consolidation or demerger. The fiscal council is not the equivalent of, or wholly comparable to, a U.S. audit committee.
We have a permanent fiscal council composed of three members and their alternates who are elected at the ordinary general shareholders’ meeting, with terms lasting until the succeeding ordinary general shareholders’ meeting with reelection being permitted.
The following table sets forth information with respect to the current members of our fiscal council and their respective alternates.
|
Name |
Position Held |
Current Position Held Since |
Age |
| Attilio Guaspari(1) | President of the Fiscal Council | April 26, 2018 | 75 |
| Marcus Vinicius Dias Severini | Alternate | April 27, 2021 | 64 |
| Maria Paula Soares Aranha(1) | Member of the Fiscal Council | April 29, 2019 | 65 |
| Mônica Hojaij Carvalho Molina(1) | Alternate | April 29, 2019 | 52 |
| André Vicentini(1) | Member of the Fiscal Council | April 26, 2018 | 40 |
| Valdecyr Maciel Gomes(1) | Alternate | April 26, 2018 | 59 |
| (1) | Independent Member (as defined under the Brazilian Novo Mercado rules). |
Below is a summary of the professional experience and areas of activity of our current fiscal council members:
Attilio Guaspari — Mr. Guaspari is the president of our Fiscal Council. Mr. Guaspari holds a degree in Civil Engineering from the Polytechnic School of the University of São Paulo (POLI-USP) and a Master’s degree in Business Sciences. He was a member of the Audit Committee of the National Development Bank – BNDES and President of the Fiscal Council and the Audit Committee of both Perdigão and BRF, with the designation of audit committee financial expert. He has extensive experience in the position of Internal Audit Committee Head, Financial Director and member of boards of directors. Mr. Guaspari qualifies as an independent member of the Fiscal Council under the Novo Mercado rules.
Maria Paula Soares Aranha – Mrs. Aranha has a bachelor’s degree in administration by FGV-EAESP, a postgraduate degree in Administration with specialization in Finances by FGV-EAESP, a postgraduate degree in Accounting Sciences by FGV-RJ, an MBA Controller by Universidade de São Paulo – USP and a Master’s degree in Controllership and Accountability by FEA/USP. She was (i) Member of the Board of Directors of Fibria Celulose S.A. (2013-2018), acting as coordinator of CAE–Committee of Statutory Audit, since its implementation, (ii) Member of the Board of Directors of Paranapanema S.A. (2014-2016), also as coordinator of the Audit Committee, in this case non-statutory, (iii) Tax Advisor for 2 years in Fibria Celulose S.A. (2011-2013) and another 2 years in Invepar S.A. (2016-2018). Currently, she acts in the Audit and Risks Committee of Grupo Hapvida as specialist in management of risks and studies of financial statements. She is a certified Board Member by the ICSS-A, with participation in the commission of Management of Risks and Controls of IBGC and participation in the Board Members of EY. She is a specialist adviser in controllership, internal controls and systems of corporate management. Mrs. Aranha was an employee of Banco do Brasil from 1981 to 2007, having held the position of Executive Manager of the Controllership Board and Distribution Board. She has experience with 28 financial institutions, both in the conception of models and in the implementation and development of tools and management systems. She also has experience with planning and budget, costs, management accounting, risks management, management in the area of distribution of bank services, and management of agency network, of service terminals, of the process and of service to clients.
| 130 |
André Vicentini — Mr. Vicentini graduated in Mechanical Production Engineering by Escola Politécnica of the University of São Paulo – USP with specialization in ALM (Asset Liability Management) and in Risk Management. Working as Corporate Superintendent of Treasury and Financial Services, he has more than 20 years’ experience in the financial management of large corporations, such as BM&FBOVESPA S.A., Telefonica S.A., Perdigão S.A. and Banco Votorantim.
Fiscal Council Nominees
In a meeting held on February 22, 2022, our board of directors approved the nomination of Attílio Guaspari, Bernardo Szpigel and Ana Paula Teixeira de Sousa as members of our fiscal council. The following table sets forth information about our fiscal council nominees and their respective alternates that will be submitted for election at our general shareholders’ meeting on March 28, 2022:
|
Name |
Position Held |
Current Position Held Since |
Age |
| Attilio Guaspari(1) | Member of the Fiscal Council | April 26, 2018 | 75 |
| Marcus Vinicius Dias Severini | Alternate | April 27, 2021 | 64 |
| Ana Paula Teixeira de Sousa | Member of the Fiscal Council | March 28, 2022 | 51 |
| Cristina Ferreira de Brito | Alternate | March 28, 2022 | 58 |
| Bernardo Szpigel | Member of the Fiscal Council | March 28, 2022 | 76 |
| Valdecyr Maciel Gomes(1) | Alternate | April 26, 2018 | 59 |
| (1) | Independent Member (as defined under the Brazilian Novo Mercado rules). |
Below is a summary of the professional experience and areas of activity of our fiscal council nominees:
Attilio Guaspari – See “––Fiscal Council.”
Ana Paula Teixeira de Sousa – Ms. Sousa holds a degree in accounting from Universidade de Brasília, a postgraduate degree in accounting sciences from Fundação Getúlio Vargas, an MBA in finance and international business from Universidade de São Paulo and a master's degree in economy from Universidade de Brasília. She is vice-president of internal controls and risk management at Banco do Brasil since May 2021. She also held the position of internal controls officer at Banco do Brasil, was chief executive officer of BESCVAL and commercial and products officer of BB DTVM. Ms. Sousa is a board member of livelo and of BB Administradora de Consórcios.
Bernardo Szpigel – Mr. Spzigel is a mechanical engineer graduated from Instituto de Teconologia de Aeronáutica. He has a master in engineering from Pontifícia Universidade Católica of Rio de Janeiro, and a PhD in business administration from the University of California. Mr. Szpigel was chief financial officer of Bahia Sul and Suzano Papel e Celulose.
Audit and Integrity Committee
Our shareholders approved the establishment of a statutory audit committee at our ordinary and extraordinary general shareholders’ meeting held on April 3, 2014. On November 5, 2018, shareholders at our extraordinary general shareholders’ meeting voted to rename the committee the Audit and Integrity Committee. The Audit and Integrity Committee is composed of three to five members, a majority of whom must be independent members, one of whom cannot be a member of the board of directors and none of whom may be an executive officer (in accordance with the independence standards of the CVM, in particular CVM Instruction No. 509/11).
The members of the Audit and Integrity Committee must be appointed by the board of directors for terms of two years, but for a total period not to exceed ten years. They are subject to removal from their positions by the board of directors at any time. The members of the Audit and Integrity Committee who are also members of the board of directors shall terminate concomitantly with his or her termination as a board member.
| 131 |
Our Audit and Integrity Committee complies with CVM Instruction No. 509/11 of November 16, 2011, and accordingly, allows us to rely on the exemption from the audit committee requirements of the SEC contained in paragraph (c)(3) of Rule 10A-3 under the Securities Exchange Act of 1934, as amended (the “Exchange Act”). The Audit and Integrity committee is not the equivalent of, or wholly comparable to, a U.S. audit committee.
On September 25, 2020, our board of directors, with the recommendation of the Audit and Integrity Committee, approved the Extra-Audit Services Hiring Policy with the following objectives: (i) to ensure that any extra-audit services that may compromise the independence of our independent auditors are not engaged; (ii) to set forth minimum standards required by us, pursuant to applicable law, to engage such services or other services provided by consulting companies formed by our independent auditors; and (iii) to ensure the independence of our independent auditors so that they can provide audit services objectively and issue an impartial opinion, contributing to the formation of an environment of trust and credibility among managers, employees, shareholders and other interested parties.
The following table sets forth information with respect to the current members of our Audit and Integrity Committee.
|
Name |
Position Held |
Current Position Held Since |
Term |
Age |
| Augusto Marques da Cruz Filho(2) | Coordinator | April 30, 2020 | 2 years | 69 |
| Ivandré Montiel da Silva | Member | April 30, 2020 | 2 years | 53 |
| Marcelo Feriozzi Bacci(2) | Member | April 30, 2020 | 2 years | 52 |
| Valmir Pedro Rossi | External Member | May 28, 2020 | 2 years | 60 |
| Jerônimo Antunes(1) | External Member | May 28, 2020 | 2 years | 66 |
| (1) | Audit Committee Financial Expert (as defined under the rules of the SEC) |
| (2) | Independent Member (as defined under the Brazilian Novo Mercado rules). |
Below is a summary of the professional experience and areas of activity of our current members of the Audit and Integrity Committee:
Please see “—A. Directors and Senior Management” for the biographical information of Mr. Cruz Filho, Mr. Montiel da Silva and Mr. Bacci.
Valmir Pedro Rossi – Mr. Rossi holds a bachelor’s degree in Accounting Sciences from the University of Passo Fundo, with a postgraduate degree in Finances by the University of Caxias do Sul and a Marketing degree by PUC-RJ. He also has an MBA in Administration by the University of São Paulo and in Business Management by the National University of Brasília. In recent years, he has served as a member of the Board of Directors and the Fiscal Council of several companies, such as Metalúrgica Gerdau S.A., Brasilprev S.A., BB Seguridade S.A., Banco da Amazônia S.A. and Kepler Weber S.A., and he currently holds the position of Deliberative Advisor for several entities and associations. He occupied several positions at Banco do Brasil S.A. for 30 years, between 1983 and 2015. Currently, Mr. Rossi holds the position of member of the Fiscal Council at Cadam S.A. – Kamim LLC and Companhia Siderúrgica Nacional, of alternate member of the Fiscal Council at Banco Santander S.A. (Brasil), of member of the Audit Committee of SIMPAR S.A. (former Grupo JSL S.A.), and of member of the Ethical Commission of IBGC.
Jerônimo Antunes – Mr. Antunes has a PhD and a Master’s degree in Accounting Sciences in the area of Controllership and Accounting Specialization from the University of São Paulo (1998 and 2005, respectively) and holds a bachelor’s degree in Business Administration (1981) and in Accounting Sciences (1987). Mr. Antunes was a member of the Board of Directors, Audit Committee and Appointment, Remuneration and Succession Committee at Petrobras and Petrobras Distribuidora. He also occupied the position of board member of and Chairman of the Audit Committee of Companhia de Saneamento Básico do Estado de São Paulo - SABESP and Companhia do Metropolitano de São Paulo - Metrô and he was member of the Board of Directors and Officer of Instituto Brasileiro de Auditores Independentes – IBRACON. Currently, Mr. Antunes is a professor at University of São Paulo, member of the Board of Directors and Chairman of the Audit Committee of Centrais Elétricas Brasileiras S.A. – Eletrobras, Agência de Fomento do Estado de São Paulo – Desenvolve SP and Companhia Müller de Bebidas. He is also member of the Audit Committee of the IRB-Brasil Resseguros and Paranapanema S.A. and member of the Board of Trustees of the Fundação Instituto de Pesquisas Contábeis, Atuariais e Financeiras – Fipecafi. Mr. Jerônimo Antunes has experience in the Administration area, with emphasis in Accounting Sciences, acting mainly in the following activities: independent auditing, assurance services, risk management, business consulting, accounting expertise, coordination of audit and risk committees and board of directors.
| 132 |
For more information about the Audit and Integrity Committee, see “Item 10. Additional Information –– B. Memorandum and Articles of Association––Audit and Integrity Committee.”
Advisory Committees for our Board of Directors
Under our bylaws, our board of directors may, for advisory purposes, set up technical or consultative committees, of a non-deliberative nature, to undertake special tasks or general activities of interest to us.
In addition to the Audit and Integrity Committee, we have four other advisory committees for our board of directors: (i) Finance and Risk Management Committee; (ii) People, Governance, Organization and Culture Committee; (iii) Consumer Intelligence Committee; and (iv) Quality and Sustainability Committee. They are composed of members of our board of directors, as well as other professionals.
The People, Governance, Organization and Culture Committee is responsible for advising the board of directors in establishing the compensation of our executives and employees. This committee also provides our executive officers support in the assessment, selection and development of top leadership, and advises our board of directors in the formulation and practice of our corporate culture in order to monitor and encourage the proper behavior of our leaders. Further, it proposes actions to align the expectations of our shareholders and executives. This committee is not the equivalent of, or wholly comparable to, a U.S. compensation committee.
The Finance and Risk Management Committee is responsible for evaluating recommendations to our board of directors concerning our financial and risk policies; analysis of financial information, issuing recommendations in accordance with the annual plan of objectives and goals, and taking into consideration our more material risks; follow-up regarding financial statements, financial operations and M&A transactions, report to the board of directors the limits of our risk exposures and request adjustments, when applicable.
The Quality and Sustainability Committee is responsible for: (i) evaluating the social, environmental, economic and qualitative aspects pertaining to our business model; (ii) assisting in the development of products, guidelines, certifications, and policies; (iii) following-up on compliance matters regarding ISO standards, specific food safety standards, sustainability and our customers; and (iv) monitoring our Quality Assurance System.
The Consumer Intelligence Committee is responsible for assisting our board of directors and management in acquiring knowledge about the habits, interests and trends of the consumers of our products with the following assignments: (i) assisting in the evolution of our digital process (“Go Digital”); and (ii) proposing processes and systems to improve the “Go Digital” campaign.
| D. | Employees |
The table below sets forth the number of our employees by primary category of activity as of the dates indicated:
| 133 |
|
As of December 31, | |||
|
2021 |
2020 |
2019 | |
| Administration | 20,906 | 20,493 | 18,904 |
| Production |
79,270 |
80,509 |
73,938 |
| Total |
100,176 |
101,002 |
92,842 |
All of our employees listed above are located in Brazil, except for approximately 7,184 employees in 2021 (7,335 in 2020 and 6,717 in 2019) who are located abroad, mainly in our offices and processing plants in Europe, Southern Cone, Middle East and Asia.
We do not employ a material number of temporary employees. However, during the Christmas holiday season in Brazil we contract a company that furnishes sales representatives to assist us with holiday sales.
All of our employees in Brazil are represented by labor unions and each location has a different union. The terms of our collective bargaining agreements vary in accordance with the union. In each case, however, salary negotiations are conducted annually between workers’ unions and us. The agreement reached with the local or regional union that negotiates the applicable collective bargaining agreement for a particular facility is binding on all employees, whether or not they are members of the union. In general, collective bargaining agreements are applicable to all employees of that union or region, respecting the different professional categories. In other countries, where applicable, a union represents our employees and all of them are covered by collective bargaining agreement. We believe that our relations with our employees and their labor unions are satisfactory.
We offer to our employees all legally required benefits according to each country’s laws and in some locations complementary benefits are also offered. We have competitive benefit plans for each office around the world. In Brazil, the main benefits are: (i) the private pension plan, administered by BRF Previdência (formerly BFPP – Brasil Foods Sociedade de Previdência Privada); (ii) a credit cooperative that offers to the associated employee credit lines with attractive interest rates; (iii) supplementary health plan that allows the employee to use the network agreements with costs subsidized by us; (iv) meals, offered in our own restaurants or restaurant cards for subsidies of up to 80% by us; (v) basic consumer products granted to employees with salary of up to five times the minimum wage and 80% subsidized by us; and (vi) a collective insurance life policy.
We have implemented productivity incentive programs, such as the Profits and Results Sharing Program, which is available to all employees, as well as variable compensation systems linked to targets for operating, sales personnel and staff. The purpose of those programs is to institute and regulate employee participation in our profits and results, thus encouraging improved performance, the recognition of team and individual effort and accomplishment of our targets.
| E. | Share Ownership |
Share Ownership of Directors, Executive Officers and Members of the Fiscal Council and the Audit and Integrity Committee
As of December 31, 2021, members of our board of directors, our executive officers and members of our Fiscal Council (and alternates) and Audit and Integrity Committee owned the common shares of our company set forth on the table below. The share numbers set forth below show the shares held by such persons in their individual capacity and exclude any shares held by shareholders who have nominated certain of our directors.
| 134 |
|
Directors, Executive Officers and Members of the Fiscal Council (and Alternates) and the Audit and Integrity Committee |
Common Shares |
% |
| Members of the Board of Directors | ||
| Pedro Pullen Parente | 130,252 | 0.02 |
| Augusto Marques da Cruz Filho | — | — |
| Dan Ioschpe | — | — |
| Flavia Buarque de Almeida | — | — |
| Flavia Maria Bittencourt | — | — |
| José Luiz Osório | — | — |
| Luiz Fernando Furlan | 6,091,932 | 0.75 |
| Ivandré Montiel da Silva | — | — |
| Roberto Rodrigues | 2 | 0.00 |
| Marcelo Feriozzi Bacci. | — | — |
| Subtotal | 6,314,932 | 0.78 |
| Executive Officers (1) | ||
| Lorival Nogueira Luz Júnior | 260,581 | 0.03 |
| Carlos Alberto Bezerra de Moura | — | — |
| Vinícius Guimarães Barbosa | 111,056 | 0.01 |
| Sidney Rogério Manzaro | 288,704 | 0.04 |
| Alessandro Rosa Bonorino | 149,006 | 0.02 |
| Leonardo Campo Dallorto | 82,072 | 0.01 |
| Grazielle Tallia Parenti | 4,359 | — |
| Marcel Sacco | 1,904 | — |
| Subtotal | 971,318 | 0.12 |
| Fiscal Council (and alternates) | ||
| Attilio Guaspari | — | — |
| Susana Hanna Stiphan Jabra | — | — |
| Maria Paula Soares Aranha | — | — |
| Mônica Hojaij Carvalho Molina | — | — |
| André Vicentini | 600 | — |
| Valdecyr Maciel Gomes | — | — |
| Subtotal | 600 | — |
| Audit and Integrity Committee (1) | — | — |
| Valmir Pedro Rossi | 2,000 | — |
| Jerônimo Antunes | — | — |
| Subtotal |
2,000 |
— |
| (1) | The other members of the audit and integrity committee, Augusto Marques da Cruz Filho, Ivandré Montiel da Silva and Marcelo Feriozzi Bacci, are members of the Board of Directors whose share ownership is already included above. |
For information about the stock options held by the persons listed above, including information about exercise prices, expiration dates and exercises, see “—B. Compensation.”
| 135 |
Stock Options Plan, Performance Shares Plan and Restricted Stock Plan
We have a long-term incentive program for our executive officers and other employees. This plan is part of the eligible executives’ compensation and is intended to attract, retain and motivate our executives in order to generate value for our companies and align their interests with the interests of our shareholders.
The long-term incentive program is available for our executive officers, directors and executive managers, such as plant managers. It is a significant element of our compensation strategy, and we rely more on this long-term compensation component than our direct competitors or the overall food industry in Brazil. For senior leadership roles, over 1/3 of their direct compensation is based on the long-term incentive program, which is the element with the heavier weight in their compensation mix.
Our current long-term incentive plan (“Stock Option Plan”) was approved at the shareholder meeting held on April 8, 2015.
The Stock Option Plan is managed by our board of directors. Exercise prices of stock options granted under the Stock Option Plan are determined by our board of directors on the grant date based on the average closing price of our shares for the 20 trading days preceding the grant date. Exercise prices are adjusted monthly based on the IPCA.
On April 26, 2017, a restricted stock unit program (“Restricted Stock Plan”) was approved at our shareholder meeting to replace the Stock Option Plan. This change in the long-term incentive program was proposed to align it with best market practices with the objective to retain and align the interests of top management and our shareholders. Since then, no more stock options units were granted by us under our long-term incentive program.
There are currently two programs under our Restricted Stock Plan, the Restricted Share Units program (“RSU”) mentioned above and the Performance Share Units program (“PSU”). The Restricted Stock Plan enables us to make a partial grant in RSUs and a partial grant in PSUs. Our board of directors approved a grant under the Restricted Stock Plan in May 2019. As of 2021, the RSU grant represented 60% and the PSU grant represented 40%. The amount to be granted to a particular executive is subject to programs rules, based on market practices, company and individual performance evaluation, and it is submitted to our Board of Directors for approval. Vesting conditions are time-based and performance based for RSUs and for PSUs, respectively, and our Board of Directors sets forth the collective goals for the performance indicators, which is currently ROIC (Return on Invested Capital) and TSR (Total Shareholder Return).
With respect to our Stock Option Plan, as of December 31, 2021, there were no outstanding options. During the year ended December 31, 2021, no options were granted or exercised.
With respect to the Restricted Stock Plan, the RSU and PSU programs are managed by our board of directors. As administrator of the Restricted Stock Plan, our board of directors approves the program rules, eligibility, payment levels, severance rules of the Restricted Stock Plan, to guarantee the program competitiveness and the alignment of interests with shareholders. The total number of shares of restricted stock that may be granted under the RSU and PSU programs shall not exceed 2.5% of the common stock, with no par value, representing our total capital stock. As of December 31, 2021, a total of 2,681,969 RSU/PSUs had been granted and held by approximately 286 people.
| 136 |
ITEM 7. MAJOR SHAREHOLDERS AND RELATED PARTY TRANSACTIONS
| A. | Major Shareholders |
Our capital stock is comprised of common shares. As of March 24, 2022, we had outstanding 1,082,473,246 common shares, or 99.53% of our total common shares (excluding 5,053,554 common shares held in treasury), of which 218,606,918, or 20.20%, correspond to ADRs. As of March 24, 2022, we had approximately 78,525 shareholders, including approximately 183 registered U.S. resident holders of our common shares (including The Bank of New York Mellon, as depositary).
The following table sets forth certain information as of March 24, 2022 (except to the extent disclosed below), with respect to: (i) any person known to us to be the beneficial owner of more than 5% of our common shares (including treasury shares); and (ii) certain other shareholders who disclose their share ownership in Brazil.
|
Major Shareholders |
Quantity |
% |
| Marfrig Global Foods S.A.(1) | 359,933,582 | 33.25 |
| Caixa de Previdência dos Funcionários do Banco do Brasil – PREVI(2) | 66,346,438 | 6.129 |
| Fundação Petrobras de Seguridade Social – PETROS(2) | 56,947,828 | 5.261 |
| Kapitalo Investimentos Ltda. | 55,730,079 | 5.148 |
| (1) | Based on a statement on Amendment No. 3 to Schedule 13D, filed on March 1, 2022, by Marfrig Global Foods S.A., the date of the last available Schedule 13D filed by such person with the SEC. The address for Marfrig Global Foods S.A. is Avenida Queiroz Filho, n. 1.560, Bloco 5 (Torre Sabiá), 3º andar, sala 301, Vila Hamburguesa, São Paulo, SP, 05319-000, Brazil. |
| (2) | These pension funds are controlled by participating employees of the respective companies. |
Our major shareholders do not have differing voting rights.
Changes in Ownership
There has been no significant change in the percentage ownership held by any major shareholder since January 1, 2019, except as described below.
| · | On February 12, 2019, Standard Life Aberdeen plc. filed a Schedule 13G/A reporting beneficial ownership of 39,027,817 common shares or ADRs, representing approximately 4.8% of our share capital. |
| · | On May 31, 2019, GIC Private Limited informed us that its aggregate shareholding position had reached 40,776,747 common shares or other securities and derivatives referred in such shares, representing approximately 5.02% of our share capital as of May 31, 2019. |
| · | On August 14, 2019, GIC Private Limited informed us that its aggregate shareholding position had reached 40,408,499 common shares or other securities and derivatives referred in such shares, representing approximately 4.97% of our share capital as of August 12, 2019. |
| · | On August 29, 2019, Caixa de Previdência dos Funcionários do Banco do Brasil – PREVI informed us that its aggregate shareholding position had reached 81,121,752 common shares or other securities and derivatives referred in such shares, representing approximately 9.4% of our share capital as of August 28, 2019. |
| · | On September 10, 2020, Kapitalo Investimentos Ltda., on behalf of some of its clients and as their investment fund manager, informed us that it had acquired our common shares, and that, on September 10, 2020, their interests in us reached, on an aggregated basis, 40,760,522 common shares and ADSs, representative of common shares, corresponding to approximately 5.02% of our share capital. |
| 137 |
| · | On December 23, 2020, Kapitalo Investimentos Ltda., on behalf of some of its clients and as their investment fund manager, informed us that it had sold our common shares, and that, on December 22, 2020, their interests in us reached, on an aggregated basis, 40,126,298 common shares and ADSs, corresponding to approximately 4.94% of our share capital. |
| · | On January 22, 2021, Kapitalo Investimentos Ltda., on behalf of some of its clients and as their investment fund manager, informed us that it had acquired our common shares, and that, on January 21, 2021, their interests in us reached, on an aggregated basis, 40,784,398 common shares and ADSs, representative of common shares, corresponding to approximately 5.02% of our share capital. |
| · | On January 27, 2021, Fundação Petrobras de Seguridade Social (Petros) informed us that it had sold our common shares, and that, on January 27, 2021, its interests in us reached 80,447,828 common shares and ADSs, representative of common shares, corresponding to approximately 9.90% of our share capital. |
| · | On May 25, 2021, JPMorgan Chase & Co. informed us that its aggregate shareholding position had reached 58,109,075 common shares or other securities and derivatives referred in such shares, representing approximately 7.15% of our share capital as of May 20, 2021. |
| · | On February 4, 2022, BlackRock, Inc. informed us that its shareholding position reached 40,199,394 common shares and 2,632,816 ADRs, representing approximately 3.95% of our total common shares and 67,983 cash-settled derivative financial instruments referenced in our common shares. |
| · | On February 10, 2022, JPMorgan Chase & Co. informed us that they hold a derivative financial instrument that represent a synthetic exposure to less than 5% of our share capital. |
| · | Between May and June 2021, Marfrig and its affiliates acquired the beneficial ownership of a significant percentage of our common shares and ADSs. Pursuant to the Schedule 13D/A filed by Marfrig with the SEC on March 1, 2022, Marfrig beneficially owned in the aggregate 359,933,582 of our common shares, representing 33.25% of our outstanding common shares. |
| · | On March 9, 2022, BlackRock, Inc. filed a Schedule 13G/A reporting beneficial ownership of 48,860,579 of our common shares, representing 4.5% of our share capital. |
| B. | Related Party Transactions |
From time to time we have entered into transactions with related parties, including with entities involving certain members of our board of directors or senior management.
We have a Related Party Transactions Policy which sets forth rules and principles to ensure transparency and arm's-length terms in our transactions with related parties and other situations of potential conflicts of interest. The definition of related party is based on applicable accounting standards and on this internal policy, which may be more restrictive than applicable laws and regulations under certain circumstances. This policy establishes the corporate body responsible for approving related party transactions. Our Audit and Integrity Committee is also responsible for, among other things, reviewing whether the procedures set forth in the Related Party Transactions Policy are followed. For further details regarding our related party transactions, see note 29 to our consolidated financial statements included elsewhere in this annual report.
None of the members of our board of directors, our executive officers or close members of their families has had any direct interest in any transaction we effected that is or was unusual in its nature or conditions, or material to our business during the year, and which remains outstanding or unperformed. In addition, we have not entered into any transaction with related parties which is or was unusual in its nature or conditions during the current or the three immediately preceding financial years, nor is any such transaction proposed, that is or would be material to our business. Our Related Party Transactions Policy prohibits us from extending loans or guarantees to the members of our board of directors, our executive officers, our key management personnel or any close member of their families.
| 138 |
Arrangements with BRF Previdência
We make contributions related to the post-employment benefit plans of our employees to BRF Previdência, which holds these plans. See note 19 to our consolidated financial statements. Additionally, we lease properties owned by BRF Previdência, and for the year ended on December 31, 2021, the total amount of lease payments was R$20,647 thousand (R$19,528 thousand for the year ended on December 31, 2020). The rent value was set based on market conditions.
Agreement with Marfrig Global Foods S.A.
On November 22, 2021, we entered into an agreement with Marfrig Global Foods S.A. to extend the supply of beef to our facility situated in Abu Dhabi. The total amount of this transaction is approximately US$14.0 million and is valid until August 18, 2022. On June 2, 2021, Marfrig Global Foods S.A acquired 257,267,671 of our common shares, corresponding to, approximately 31.66% of our share capital. See “–– B. Major Shareholders.”
Other transactions with related parties
We maintain other transactions with related parties resulting from guarantees, transfers and donations to related associations and institutes, as well as leasing and other commercial transactions with related parties, both individuals and entities. Such transactions are compliant with our Related Party Transactions Policy and are not material, individually or in the aggregate.
Indemnification Agreements
We have entered into indemnification agreements with our executive officers (the “indemnified parties” and each, an “indemnified party”). Pursuant to these agreements, we have agreed to indemnify and hold harmless each indemnified party with respect to losses which they may be subject to in connection with any administrative or judicial proceedings in Brazil or abroad so long as the proceeding arises from their relationship with us in such role (or related roles), among other circumstances (the “covered risks”), excluded from the coverage of these indemnifications agreements any action of the indemnified parties taken with bad faith or scienter. Under the terms of these agreements, we have also agreed to either advance or reimburse expenses incurred by the indemnified parties in connection with the covered risks (including legal counsels’ fees). We have also agreed to contract director and officer insurance coverage for acts carried out by the indemnified parties in the course of their duties. Each agreement will remain in force during and after the period of the indemnified party’s employment with us, for an indefinite period of time. In our extraordinary shareholders’ meeting held on May 25, 2018, our shareholders approved the execution of indemnification agreements by us with current and former members of our board of directors. In a meeting of the board of directors held on July 30, 2020, the members of our board of directors approved the execution of indemnification agreements with Jerônimo Antunes and Valmir Pedro Rossi. In a meeting of the board of directors held on May 12, 2021, the members of our board of directors approved the execution of indemnification agreements with Grazielle Tallia Parenti and Marcel Sacco.
| C. | Interests of Experts and Counsel |
Not applicable.
| 139 |
ITEM 8. FINANCIAL INFORMATION
| A. | Consolidated Statements and Other Financial Information |
Our consolidated financial statements are appended at the end of this annual report starting at page F-1, and form a part hereof.
Legal Proceedings
We are involved in certain legal proceedings arising from the regular course of business, which include civil, commercial, administrative, regulatory, environmental, tax, social insurance and labor lawsuits.
We classify the risk of adverse decisions in the legal suits as “remote,” “possible” or “probable.” We record provisions for probable losses in our financial statements in connection with these proceedings in an amount determined by our management on the basis of legal advice and statistical models. We disclose the aggregate amounts of these proceedings that we have judged possible or probable, to the extent those amounts can be reasonably estimated, and we record provisions only for losses that we consider probable. However, the amounts involved in certain of the proceedings are substantial, and the losses to us could, therefore, be significantly higher than the amounts for which we have recorded provisions, if any. Even for the amounts recorded as provisions for probable losses, a judgment against us would have an adverse impact on our cash flow if we are required to pay those amounts. See “Item 3. Key Information—D. Risk Factors—Risks Relating to Our Business and Industry—Unfavorable outcomes in legal proceedings may reduce our liquidity and negatively affect us.”
Tax Proceedings
Contingencies for Probable Losses
We are engaged in several legal proceedings with Brazilian tax authorities for which we have recorded provisions for probable losses. As of December 31, 2021, our provision for such tax proceedings is R$400,101 thousand, compared to R$427,302 thousand as of December 31, 2020.
The tax contingencies classified as probable losses involve the following main legal proceedings:
| · | ICMS: We are involved in a number of administrative and judicial tax disputes regarding the recording or use of amounts paid for ICMS taxes, mainly related to the maintenance of credits on acquisition of products which subsequent exit is made with a calculation reduction (staple basket products), materials for use and consumption, property and equipment, electricity, disallowance of presumed credit, tax substitution, isolated fines, differential rate of tempered products and others. The provisioned amount is R$71,928 thousand as of December 31, 2021 (R$248,560 thousand as of December 31, 2020). |
| · | PIS and COFINS: We are involved in administrative proceedings related to the use of federal PIS and COFINS tax credits to offset other taxes, in the amount of R$141,729 thousand as of December 31, 2021 (R$149,945 thousand as of December 31, 2020). |
| · | Other tax contingencies: We recorded other provisions for lawsuits related to the payment of social security contributions under various Brazilian government programs (INCRA, FUNRURAL, SESI/SENAI/SEBRAE), debts included in a refinancing program (REFIS) with deposits that await consolidation and conversion into payment, in addition to debts arising from divergence in accessory obligations, import tax, IOF, industrialized products tax and others. The provisioned amount is R$186,444 thousand as of December 31, 2021 (R$75,360 thousand as of December 31, 2020). |
Contingencies for Possible Losses
The amount of tax contingencies for which the probability of loss is classified as “possible” is R$12,499,764 thousand as of December 31, 2021 (R$12,536,528 thousand as of December 31, 2020).
| 140 |
The most significant of these tax cases for which the risk of loss is classified as possible are described below:
| · | PIS and COFINS: We are involved in administrative proceedings regarding the use of PIS and COFINS credits arising from a divergence in the definition of inputs in the non-cumulative tax system and their use as important and essential products in our industry. We are also involved in proceedings concerning PIS and COFINS that discuss (i) tax revenues for purposes of ICMS credits as a tax benefit, (ii) liabilities relating to the tax classification of seasoned meats, (iii) Decrees-Law Nos. 2,445/88 and 2,449/88, which were considered unconstitutional by the Federal Supreme Court as they established different basis and rates of calculation, as well as determined different timing for payment (semi-annual), among others. Such proceedings amount to R$6,371,171 thousand as of December 31, 2021 (R$5,549,431 thousand as of December 31, 2020). |
| · | ICMS: We are involved in a number of disputes relating to the ICMS tax, including: (i) the alleged improper granting of ICMS tax credits generated by states of origin (known as the guerra fiscal dispute) in a total amount of R$253,765 thousand as of December 31, 2021 (R$416,238 thousand as of December 31, 2020). The decrease in this amount occurred with the publication of Convênio Confaz 190/17 and LC 160/17, which validated the tax benefits and allowed the remission of these credits; (ii) the absence of evidence to prove the balances of exports in the amount of R$63,361 thousand as of December 31, 2021 (R$265,590 thousand as of December 31, 2020); (iii) tax assessment notices from the State of Rio de Janeiro, received on October 1, 2019 and February 11, 2020, referring to the period from 2014 to 2018, due to alleged non-compliance with the Term of Agreement (TARE), which provided for a tax benefit in the State of Rio de Janeiro, in the amount of R$567,903 thousand on December 31, 2021 (R$550,367 thousand on December 31, 2020); (iv) ACP/MP/RJ due to the use of tax benefits, in the amount of R$249,715 thousand (R$239,845 thousand on December 31, 2020); (v) ICMS tax assessment notice from the State of Goiás referring to the exclusion of the credit from the PROTEGE calculation base, in the amount of R$184,300 thousand (R$105,866 thousand on December 31, 2020) and (vi) R$2,063,603 thousand (R$2,228,462 thousand on December 31, 2020) related to other tax lawsuits regarding ICMS. The relevant reduction in the amounts related to (i) “guerra fiscal”, is mainly due to the recognition of the credits by the state of São Paulo, for which the probability of loss has been changed to remote; and (ii) lack of evidence of exports, due to the termination of proceedings in which the Company provided evidence that was accepted by the fiscal authority. |
| · | Profits earned abroad: We were assessed by the Brazilian Federal Revenue (Receita Federal do Brasil) for alleged underpayment of income tax and social contribution on profits earned by subsidiaries established abroad. The total amount is R$638,361 thousand as of December 31, 2021 (R$629,341 thousand as of December 31, 2020). We have presented our defense based on the fact that our subsidiaries located abroad are only subject to full taxation in the countries in which they are based as a result of treaties regarding double taxation. The Superior Administrative Court (CSRF) issued a final decision unfavorable to us, the tax enforcement has started, and we have offered a guarantee. |
| · | Income tax and social contribution: We are involved in administrative disputes regarding the use of income tax and social contribution losses, refunds and credits to offset other federal tax debts, including credits generated by legal disputes related to the Plano Verão, an economic stabilization plan from 1989. In addition, on February 5, 2015, we received a tax assessment notice related to the compensation of tax loss carryforwards and negative calculation basis up to a limit of 30% from when we incorporated one of the group’s entities during calendar year 2012. The Superior Administrative Court (CSRF) issued a final decision unfavorable to us, the tax enforcement has started, and we have offered a guarantee. The income tax and social contribution disputes total R$1,326,862 thousand as of December 31, 2021 (R$1,249,062 thousand as of December 31, 2020). |
| · | IPI: We are involved in administrative proceedings relating to the failure to permit the use of credits under the sales tax for industrial products (Imposto sobre Produtos Industrializados, or “IPI”) generated from purchases of goods not taxed or intermediate products. The amount involved in such proceedings was R$182,246 thousand as of December 31, 2021 (R$209,314 thousand as of December 31, 2020). |
| 141 |
| · | Social security charges: We are involved in disputes related to social security charges on payroll compensation, our profit-sharing plan, additional payments of GILRAT to finance employee’s special retirement, SAT/RAT as well as joint responsibility claims in connection with the acquisition of GALE. We also have disputes involving civil construction service providers and others in the aggregate amount of R$417,903 thousand as of December 31, 2021 (R$418,957 thousand as of December 31, 2020). |
| · | Other contingencies: We are involved in other tax contingencies involving a variety of matters, including cases related to the requirement of a 50% fine over the amount of PIS/COFINS and IRPJ compensation not ratified but pending final judgment before the compensation proceedings, the tax basis for calculating social contribution on net income, tax assessment notice referring to taxes on services, drawback evidence, IPTU, import tax, IOF as well as an isolated fine resulting from alleged inaccuracies in EFD (accessory obligation) totaling R$180,573 thousand as of December 31, 2021 (R$674,055 thousand as of December 31, 2020). The reduction in the year ended December 31, 2021 is mainly due to the development in the proceedings related to isolated fine on denial of tax credits compensation, for which the probability of loss was reviewed and classified as remote. |
As noted above, we are involved in other lawsuits for which we classify our risk of loss as remote, and the amounts involved in certain of those proceedings are substantial.
Exclusion of VAT (ICMS) from PIS and COFINS Tax Base
On March 15, 2017, the Federal Supreme Court decided in the judgment of the Extraordinary Appeal, or RE, No. 574.706/PR, brought by the Import, Export and Oil Industry, or IMCOPA, that the amount of ICMS levied on the sale of products or services should not be included in the taxable basis of PIS/COFINS. In October 2020, December 2020 and July 2021, the Federal Supreme Court issued final decisions in favor of Eleva Alimentos S.A. (a former subsidiary of ours merged into us), Batavia (a former subsidiary of ours merged into us) and UP! Alimentos Ltda. (an entity that is no longer operational and jointly controlled by us), respectively, related to the exclusion of ICMS from the PIS/COFINS tax base. The effects of these proceedings are disclosed in note 9.2 to our consolidated financial statements.
Interests on Late Tax Refund
On September 24, 2021, the Brazilian Federal Supreme Court (STF) ruled that interest received by a taxpayer on a late tax refund from the National Treasury should not be included in the calculation basis of the corporate income tax (IRPJ) or the social contribution on net profit (CSLL) – Theme 962. The interest was calculated based on the Brazilian federal funds rate (or SELIC rate). Also, BRF held the final decision in her own case, to exclude from its corporate tax income over the past years payments over any type of interests – not only SELIC. According to the decisions these interests received cannot be considered as a result in capital or asset increase, but only redress for the damages and losses suffered for the late tax refund. The effects of these proceedings are disclosed in note 9.4 to our consolidated financial statements.
Labor Proceedings
As of December 31, 2021, we were involved in 11,709 labor claims ongoing in the total amount of approximately R$1,150.0 million (which amount includes risks deemed “remote,” “possible” and “probable”), compared to R$957.3 million as of December 31, 2020. These cases are mainly related to overtime, work in hazardous conditions, rest breaks, set forth article 253 of the Labor Code (Consolidation of Labor Laws), illnesses allegedly contracted at work and work accidents. Labor claims are being processed mainly at the Brazilian lower court level and our provisions for “probable” losses from these labor claims are recorded in the amount R$628,767 thousand on December 31, 2021, compared to R$634,706 thousand on December 31, 2020. These provisions were recorded based on our past historical payments, and the opinions of our legal counsel.
| 142 |
Included in these proceedings is a series of judicial proceedings filed by the Office of the Public Labor Prosecutors or workers unions related to overtime, mandatory rest breaks and other labor-related issues. Of the 73 cases pending, some have no assigned value and the largest has a value of approximately R$63.7 million, which is included in the total amounts disclosed above as of December 31, 2021.
Civil, Commercial and Other Proceedings
As of December 31, 2021, we are defendants in 4,240 civil, commercial and other proceedings (administrative, environment, regulatory and other matters) amounting to total claims of R$3,417 million (such amount includes risks deemed “remote,” “possible” and “probable”). We were defendants in several civil, commercial and other proceedings related to, among other things, alleged breach of contracts, alleged breach of civil and commercial law, traffic and other accidents, real estate disputes, consumer claims and alleged infringement of environmental and regulatory standards. We have recorded provisions for probable losses in the amount of R$357,013 thousand in connection with our pending civil, commercial and other proceedings as of December 31, 2021 (R$343,530 thousand as of December 31, 2020). We recorded these provisions based on our historical payments and on the inputs of our external legal advisors.
The most significant of these civil, commercial and other proceedings are described below. We are involved, or may become involved, in other legal proceedings from time to time and the amounts involved in certain of those other proceedings could be substantial.
On May 18, 2001, a declaratory action together with a condemnatory request was filed by Texaco do Brasil S/A Produtos de Petróleo (currently Ipiranga Produtos de Petróleo S/A), where the plaintiff claimed that we (previously Perdigao S/A) did not comply with the three contracts executed by the parties (the Tax Incentives Implementation Commitment and Promise of Share Purchase and Sales, the Share Purchase and Sale Contract and Resale Promise and the Private Instrument of Tax Incentives Implementation Commitment and Promise of Share Purchase and Sales). Such contracts were related to the structuring and acquisition of common and preferred shares of Perdigão Amazônia S.A, whose project would be financed by Texaco via tax incentives. The case ended with an unfavorable lower court decision against us, and an order to indemnify Ipiranga for the damages related to the project. The São Paulo Court of Appeals reversed the trial court’s judgment only to establish different criteria of liquidation of damages. In June 2009, Ipiranga started the liquidation stage, and an accounting expert was initially named to analyze the parameters set forth in the final judgment. However, considering there were unaccounted items to be calculated by the expert, the forensic accountant informed of his inability to perform these tasks. Afterwards, an engineering expert was indicated to proceed with the asset liquidation. The opinion of the court-appointed engineering has already been presented, but Ipiranga contested the results. The appeal filed by Ipiranga aimed at the revision of the expert report was partially granted by the Court, which determined the calculation review of some unaccounted items. We have filed an appeal to be submitted directly to the Superior Court of Justice in order to grant a special appeal requiring the maintenance of the expert report. The President of the Private Law Section of the Court upheld the contested decision and ordered the remittance of the case records to the Superior Court of Justice. We recorded a provision with respect to this dispute, which is supported by inputs and calculations prepared by external accounting experts and reviewed by our management.
On October 6, 2004, a public civil action was filed by the Federal Public Prosecutor Office seeking moral and material damages resulting from the integrated production contracts executed with public resources of an agricultural fund. We ordered to pay an award with respect to the material damages, but this decision was suspended by the Court of Appeals. We filed an appeal to the Superior Court of Justice and, since September 8, 2015, the admissibility of such appeal has been pending. We have not included any provision for this lawsuit regarding the material damages (the amount of which will be determined in a future procedure). On March 13, 2020, our appeal was dismissed and, on April 24, 2021, we filed a new appeal, which awaits judgment.
In 2008, 2012 and 2018, the Federal Public Prosecutor’s Office filed three public civil actions in order to obtain a judicial decision compelling BRF not to use overweight trucks on federal highways and sought indemnification for collective damage. The first two proceedings resulted, at first, in favorable decisions for us in the Court of Appeals and Superior Courts. With respect to the 2012 public civil action, on September 3, 2019, the Superior Court of Justice, by a majority decision, granted the special appeal filed by the Federal Public Prosecutor’s Office and found that the public civil action had merit and ordered (i) BRF to pay indemnification for collective damages in an amount to be determined; and (ii) BRF not to use overweight trucks on federal highways, subject to a penalty of R$20 thousand for each new infringement. BRF filed appeals against such decision, which were denied by the Superior Court of Justice and the Federal Supreme Court. The decision rendered by the Superior Court of Justice with respect to the 2012 public civil action against us became final and unappealable. As of the date hereof, the Federal Public Prosecutor’s Office has not initiated the proceeding to calculate the damages or possible penalties that BRF was ordered to pay. With respect to the public civil action filed in 2008, in March 2020, the Superior Court of Justice, by a majority decision, denied the appeal filed by the Federal Public Prosecutor’s Office to maintain the action as groundless. This decision also became final and unappealable. With respect to the public civil action filed in 2018, the lower court decision was favorable to us and we are currently awaiting a decision by the Court of Appeals on the appeal filed by the Federal Public Prosecutor’s Office. As of the date hereof, we have not recorded any provisions with respect to these proceedings.
| 143 |
On August 20, 2008, the Federal Public Prosecutor’s Office filed a public civil action against us due to alleged damages to consumers related to the excess of water absorbed by the chicken products manufactured at Francisco Beltrão, State of Paraná and Dois Vizinhos, State of Paraná. The Federal Public Prosecutor’s Office requested that we individually indemnify all consumers who acquired products with any quality issues related to water in excess, that we pay collective damages and that we publicly disclose this problem via newspaper, radio and other means. On September 10, 2009, an unfavorable judgment was issued ordering us and the other defendants to: (i) indemnify consumers for the irregularity of the products; (ii) pay R$700 thousand as collective damages; and (iii) publicly disclose a message describing this matter via local media (newspaper, radio and other means). We, along with the other defendants, filed our respective appeals, which the Court of Appeal rejected in 2011. On January 30, 2012, we filed an appeal to the Superior Court. The case is currently awaiting judgment at the Superior Court. We recorded a provision with respect to this dispute.
On January 28, 2009, Valore Participações e Empreendimentos Ltda. and Ama Participações e Empreendimentos filed an execution proceeding based on an extrajudicial title requesting the payment of the fifth and sixth installments (total estimated value of R$175 million) of their industrial plant sales contract signed with us. On June 2018, the process was suspended by the lower court for producing evidence. In November 2021, the court ordered that it was not necessary to wait any longer, as the related evidence was already produced and the process was resumed. Following closing arguments, the final decision remains pending. We have classified the risk of loss as possible, with no provisions recorded.
On September 21, 2011, the Association of the Villagers of Paraíba and Mudau River Ares filed an action seeking indemnification for moral and material damages due to the “Açude das Nações” dam rupture. The case is in the pre-trial phase and evidence is being produced. This action is still at its preliminary stages and we have classified the risk of loss as possible, with no provisions recorded. As of December 31, 2021, the amount at issue in the case is estimated to be R$195 million.
We had a leasing contract with WJ Produtos Alimentícios Ltda., or WJ, for an industrial plant, which was terminated by us. On April 11, 2012, WJ filed a lawsuit to require our compliance with the leasing contract and pay an early termination fine of R$3.7 million and material damages of up to R$5 million. The expert report indicated that the industrial plant was destroyed and calculated a loss value of R$28 million. The court decided in favor of WJ and ordered us to pay for the losses and damages caused by the early termination of the leasing contract, which are not limited to the R$28 million calculated by the expert since part of the alleged losses and damages still need to be estimated due to their nature. The court ruled that another expert assessment is necessary to determine the total loss value in the execution stage of the proceeding. We filed an appeal against such decision, which was rejected by the São Paulo State Court, confirming all the terms of the decision rendered by the lower court judge. In view of this, BRF requested for clarification of some obscure points identified in São Paulo State Court’s decision and another appeal may be filed to the Superior Court of Justice at appropriate time. The risk of loss in this proceeding has been classified as possible. The amount at issue in the case is currently estimated in R$84 million. Such amount does not consider the losses and damages that still need to be estimated in the execution stage.
On October 10, 2013, a lawsuit for damages was filed by Attilio Fontana’s heiresses in order to require that we pay damages for the destruction or concealment of Sadia S.A.’s statutory books. Such books were not exhibited in the preliminary proceeding, which would have prevented the plaintiffs from discovering potentially illegal donations made by Mr. Fontana to his other heirs and their other siblings. On December 12, 2018, the case was dismissed on the grounds that the lack of the statutory books did not cause any harm to the plaintiffs since they could investigate the existence of any potential illegal donations through other statutory documents that were available to them. The plaintiffs filed an appeal to the Court of Appeals and we subsequently filed our response. The plaintiffs’ appeal was dismissed. The plaintiffs filed an appeal to the Superior Court of Justice and to the Federal Supreme Court. At first, the Superior Court of Justice promptly denied the special appeal judgment due to lack of legal requirements. However, after the plaintiffs filed a new appeal, on November 9, 2021, the Superior Court of Justice decided to submit the special appeal for judgment. Since the plaintiffs’ claims were dismissed by the trial court judge and the Court of Appeals, and plaintiffs’ special appeal is pending with the Superior Court of Justice, we have classified the risk of loss as remote, with no provisions recorded.
| 144 |
In recent years, we have been sued by ex-carriers seeking indemnification for the absence of previous payment for road toll fees, as established under Brazilian federal law. We currently have ten ongoing cases related to this matter: six cases have initially resulted in unfavorable decisions for us (one of such cases is being processed before the Court of Small Claims) and four cases are pending decisions. For all ten cases, we recorded a provision with respect to the disputes.
On October 17, 2013, Mr. Marcus Macedo Cazarré filed an indemnification action as a result of our alleged exploitation of his Patent MU 8300298-7 in the biodigesters used in farms. Mr. Cazarré requested damages of over R$300.0 million. An expert report favorable to us was issued, which indicated that there was no violation of Mr. Cazarré’s patent. On September 22, 2017, the lower court judge dismissed the requests made by Mr. Cazarré. On December 1, 2017, Mr. Cazarré filed an appeal and we presented our counterarguments on February 2, 2018. On June 20, 2018, the Court of Appeals ruled and granted the appeal on the merits and, therefore, the trial decision was overturned. As a result, Mr. Cazarré’s requests were granted and we were ordered to pay material damages (in an amount to be calculated in the execution proceedings) and R$150,000 for moral damages. On February 20, 2019, we filed an appeal with the Court of Appeals to elevate the proceeding to the Superior Court of Justice, and on March 27, 2019, Mr. Cazarré responded to such appeal. On April 15, 2019, the Court of Appeals ruled dismissing our appeal. On May 13, 2019, we filed an appeal directly to the Superior Court of Justice and on June 29, 2019, Mr. Cazarré presented his defense. On July 11, 2019, the Court of Appeals reviewed its decision and admitted our appeal, determining that the proceeding’s records be sent to the Superior Court of Justice. Our appeal is pending before the court. On April 13, 2020, we filed a petition requesting the suspension of the lawsuit until the decision on the merits of the nullity action filed by us against Mr. Cazarré and Instituto Nacional de Propriedade Industrial-INPI (BPTO) before the Federal Court of Rio de Janeiro becomes final. On June 18, 2020, we filed a petition repeating the request for suspension and informing that BPTO had presented its opinion in the nullity action agreeing with our arguments for the nullity of Mr. Cazarré’s patent. On April 30, 2021, the court rendered a decision staying the infringement action for a year, due to the ongoing invalidity lawsuit. On November 17, 2021, BRF filed a new brief informing the court that a decision was published in the Official Gazette n. 2.652 dated November 3, 2021, in which the Brazilian PTO invalidated patent MU8300298-7 during the post-grant opposition procedure. Considering the patent in question is no longer valid, BRF requested the decision to be overruled in order to reject the Mr. Cazarre’s infringement pleads. Currently, BRF is awaiting a decision regarding its November 17 brief. We have classified the risk of loss as possible, with no provisions recorded for this case.
On April 24, 2014, we executed a TAC with the Public Prosecutors’ office of the State of Goiás because of irregularities in our treatment of soil resulting from approximately 300 tons of solid material, which did not have proper treatment in the facility located in Rio Verde. Fullfilment of the TAC’s obligations is in progress.
On March 24, 2014, we executed a TAC with the Consumer Protection Agency of the Municipality of Rio de Janeiro, or Procon Carioca, due to problems with the distribution of skimmed UHT milk in Rio de Janeiro. Because of that agreement, we paid a fine of R$150,000 and undertook other obligations that have already been fulfilled by us. On October 23, 2014, the Consumer Protection Agency of the State of Rio de Janeiro, or Procon Estadual, filed a civil action against us related to a similar claim with respect to the distribution of skimmed milk. In May 2016, a judgment was issued recognizing that we had diligently taken all necessary actions to mitigate damages on this case, including executing a TAC on the matter. Nevertheless, the lower court determined that any consumers that manage to prove they suffered material losses as a result of the milk shall be reimbursed on the ground of compensation for special damages. The Procon Estadual appealed the decision and their appeal was dismissed, but they filed a Special Appeal which was granted, and we were also ordered to pay R$100,000 on the ground of compensation for general damages. On October 28, 2020, we paid R$216,069 related to the condemnation to pay general damages plus monetary remeasurement and penalty interest, as well as legal fees. We are awaiting possible execution of the order to pay the special damages.
| 145 |
On October 23, 2015, Perdue Foods LLC, or Perdue, filed an enforcement lawsuit against us. Perdue sought an order for us to comply with the obligations undertaken in the Coexistence Agreement, as amended, entered into by both parties related to the trademarks of Perdue and our trademark Perdix. In the event that we do not comply with these obligations, Perdue also seeks the imposition of a daily fine, in the amount of R$50,000 for each day of delay. We have presented our defense in the case and the case is currently pending judgment in the lower court. In September 2021, we filed an appeal to the Court of Appeals against the decision which denied BRF's argument regarding the occurrence of the statute of limitations. On November 23, 2021, our appeal was dismissed. On January 31, 2022 we filed a new appeal before the Court of Appeals. Since the enforcement lawsuit has no measurable economic value, no provisions have been recorded for these proceedings.
On August 20, 2015, a city councilor filed a popular action against us in connection with alleged irregularities identified on a competitive bid for the supply of school meal to the Municipality of São Paulo. We have filed our defense. On December 9, 2019, a court-appointed expert presented a technical report informing that there was no evidence of irregularity. The plaintiff and the Public Prosecutors’ Office of the State of São Paulo filed motions against the technical report and requesting that it be complemented. On September 11, 2020, due to a request from the Public Prosecutors’ Office of the State of São Paulo, the trial court judge determined the Health Surveillance Coordination, or COVISA/SP, to be notified in order to clarify whether there is any difference between the school meal (sausages) described in the bid procedure and the one regularly sold in supermarkets. On April 20, 2021, COVISA/SP filed its response confirming there were differences between the products. The plaintiff, BRF and the Public Prosecutor’s Office of the State of São Paulo then filed their opinion for the claim to be deemed groundless. All parties filed their closing arguments, and the case is awaiting trial since then. After the end of the evidentiary stage, the Public Prosecutor’s Office of the State of São Paulo filed their opinion for the claim to be deemed groundless and all parties filed their closing arguments. The action was ruled groundless on January 31, 2022. The sentence recognized that there wasn’t a single evidence of overpricing, since the product acquired in the bidding had its own characteristics, both with regard to the form of production and composition, as well as packaging, and that ten companies have participated in the bidding, and BRF was the winner, for having presented the lowest price. The sentence is subject to mandatory review even if the Plaintiff doesn’t appeal, and therefore should be referred to the Court We have classified the risk of loss as possible, with no provisions recorded.
On September 18, 2015, we executed a TAC with the Public Prosecutors’ Office of Rio de Janeiro State, in order to restore an environmental license of our facility located in Duque de Caxias. Fullfilment of the TAC’s obligations is in progress.
On December 14, 2015, the Public Prosecutors’ Office of the State of Pernambuco filed a public civil action against us in connection with alleged irregularities identified on dairy products sold by us. On March 19, 2019, the plaintiff’s claims were partially granted and we were ordered to: (i) pay collective damages in the amount of R$1 million; (ii) under the penalty of payment of a R$5 million fine for each instance of non-compliance, (a) recall the batches of sausages that presented risk to consumers’ health - in spite of the fact that the class action handles of alleged irregularities related to dairy products, the sentence also have mentioned issues regarding the sausages; such inaccuracy is object of the Appeal we have filled against it and (b) provide a public notice regarding such recall on our website and social media; (iii) publish the trial court decision in a newspaper of general circulation in the city of Recife, under the penalty of a R$1 thousand daily-fine for non-compliance; and (iv) pay 50% of the court fees. On April 23, 2019, we filed an appeal to the Pernambuco Court of Appeals. On June 12, 2019, the court granted an interim relief to stay the trial’s court decision. The appeal is still pending a decision on its merits. We have classified the risk of loss as possible, with no provisions recorded.
On March 14, 2016, a public civil action was filed by Abracon-Saúde – Associação Brasileira de Defesa dos Consumidores de Plano de Saúde, an association for health insurance customers, seeking to require us to insert the following warning on the package of its products: “CONTAINS GLUTEN – gluten is harmful to celiac patients” or another similar alert to demonstrate how gluten can be harmful to consumers. After we presented our defense, a judgment was issued on September 14, 2016 ordering us to include such information on the package of all of our products that contain gluten. We filed an appeal and on December 20, 2019, the Federal Regional Court (TRF3) ruled that the Superior Court of Justice is the competent authority to rule on this proceeding. No substantial provisions were deemed necessary for this proceeding.
| 146 |
On April 4, 2016, we executed a TAC with the Public Prosecutor Office of the State of Goiás in order to compensate for the environmental damage caused by the disposal of industrial waste without proper treatment in the “Córrego Lageado” by the Jataí facility. Satisfaction of the TAC is in progress.
On May 9, 2018, the Public Prosecutors’ Office of the State of Pernambuco filed a public civil action against us in connection with alleged irregularities identified in meat products (sausages) sold by us. We filed our defense on May 3, 2019. On February 15, 2019, the court rendered a decision granting the injunction requested by the Public Prosecutors’ Office to order us to, under the penalty of a R$5 million fine for each instance of non-compliance: (i) cease commercialization of sausages with irregularities; (ii) comply with the legislation on sausage manufacturing; (iii) cease using deteriorated or mislabeled ingredients in sausage manufacturing; (iv) recall the batches of sausages that present risk to consumers’ health; (v) provide a public notice regarding such recall on our website and social media. On April 24, 2019, we filed an interlocutory appeal with a request for an interim relief in order to stay the injunction. The court decided to evaluate the suspensive effects after Public Prosecutors’ Office of the State of Pernambuco filed its counterarguments. On May 5, 2019, we filed our defense. On September 13, 2021, The Public Prosecutors’ Office of State of Pernambuco has filed an opinion in favor of partially granting the interlocutory appeal to reduce the amount of the fine for non-compliance with the court order for R$5,000. The case is pending trial. We have classified the risk of loss as possible, with no provisions recorded.
We also have regulatory liabilities corresponding to 1,190 cases, for which the possibility of loss is classified as probable and we have recognized a provision of R$30.6 million as of December 31, 2021. The cases refer to MAPA fines and other administrative sanctions (especially the suspension of a plant’s activities for a period of some days), for alleged noncompliance with the sanitary legislation and, individually, they do not represent significant losses. These fines are a result of routine inspections of the quality processes by MAPA. The cases are addressed directly with MAPA, and when we do not successfully defend against these penalties, the payments are made to MAPA. Alternatively, we may initiate a legal proceeding against MAPA to attempt to nullify the penalties imposed.
On March 14, 2019, the Turkish Competition Authority, or the TCA, announced a decision regarding its investigation into Banvit and other producers for alleged anticompetitive practices in connection with chicken meat production in Turkey. The TCA imposed an administrative fine equivalent to R$22,507 thousand (TRY30,518 thousand, translated to reais at the exchange rate of R$0.7375 as of September 30, 2019) against Banvit. The decision was confirmed on September 17, 2019, reaffirming that the alleged anticompetitive practices took place before the acquisition of Banvit’s control by us. Banvit anticipated the payment of the fine to benefit from a 25% discount, under the terms of the Turkish law. We were substantially reimbursed for the fine paid and for certain associated costs based on the insurance policy and contractual provisions for indemnity for losses relating to the period prior to the acquisition of Banvit by us under the terms of the share purchase and sale agreement entered into with the former controlling shareholders of Banvit. Banvit continues to discuss judicially the imposition of the penalty.
On March 27, 2020, we filed confidential arbitration proceedings against two energy generation companies and one energy trading company with Fundação Getúlio Vargas (FGV) Arbitration Chamber (Câmara de Mediação e Arbitragem da FGV). The proceedings involve two electric power purchase agreements, executed in 2007 and expiring in 2025, and the amount at issue in the case related to possible losses and damages will depend on the decision of the arbitral tribunal. The arbitration proceeding is currently pending. In the executory proceedings, all amounts (R$42 million) have been deposited and may be reimbursed in case the Arbitral Chamber rules in our favor. We have classified the risk as possible, with no provisions recorded.
In March 2017, an administrative proceeding was filed by the National Consumer Secretariat (SENACON – Ministério da Justiça) in order to ascertain whether there were violations of consumer law by us, in view of the findings by the MAPA, in 2017, regarding excess of water in frozen chicken carcasses. In May 2017, we presented our preliminary defense motion, and in December 2020, we presented our final brief in our defense. In January 2021, the Secretariat ruled against us, finding that we breached consumer law, and it imposed a fine of approximately R$5.3 million. On February 8, 2021, we filed an administrative appeal, which is still pending review. In July 2021, we filed a petition expressing interest to execute a Consent Decree (Termo de Ajustamento de Conduta – TAC), in which we commit to pay a certain amount, with no admission of guilt or liability in that proceeding. On September 30, 2021, we filed a non-binding draft of a Consent Decree, along with a judicial decision given by the Federal Regional Court in Goiás in our favor against MAPA. The Consent Decree is currently under review by SENACON, with its decision being subject to judicial review.
| 147 |
Pasteur Operation
Brazilian authorities are investigating Brazil’s dairy industry in the so-called “Pasteur Operation.” The Federal Police announced the operation on December 27, 2014 with the purpose of investigating improper payments and bribery to the MAPA auditors. One of such auditors and a former employee of BRF entered into plea bargains with the Brazilian authorities confirming that such improper payments were made between 2009 and 2013.
On May 3, 2021, the Federal Prosecution Office charged five former employees of the Company with the crimes of active and passive corruption and criminal association under the Brazilian Penal Code. The court has accepted the charges on July 2, 2021, with such employees presenting their plea of not guilty.
The analysis of the court of the plea presented by the defendants is still pending. This analysis should decide whether the case will continue or not. This investigation was related to the dairy industry, a business unit sold by us in 2015. We are not a party in this case, and considering the date of the facts, we are only monitoring the it.
Civil Inquiry - Public Prosecutor’s Office of the State of Rio de Janeiro (Tax Benefits involving dairy factory in Barra do Piraí, State of Rio de Janeiro)
The Public Prosecutor’s Office of the State of Rio de Janeiro opened a civil inquiry to investigate alleged acts by the government by means of which tax benefits would have been irregularly granted to us and another competing company, through irregular electoral donations. The investigation is being conducted by the Public Prosecutor’s Office of the State of Rio de Janeiro (Specialized Acting Group to Combat Tax Evasion and Illicit Acts against the Tax Order – GAESF).
With respect to us, the inquiry is investigating the concession of tax benefits granted based on the future construction of a dairy factory by us in Barra do Piraí, in the State of Rio de Janeiro. The city government of Barra do Piraí assigned the land for the facility, but based on an internal decision, we chose to terminate the project although the tax benefit had already been granted. The land and initial construction by us, amounting to R$26 million, were returned in 2014 to the city government free of charge.
Since the inquiry is investigating the conduct relating to two competing companies, this legal proceeding and related documentation are confidential, and we do not have access to most of the documents. We are cooperating with and providing all requested clarifications to the authorities.
Confidential Proceeding in Connection with Civil Inquiry Described Above
In May 2020, the Rio de Janeiro State Prosecutor filed a lawsuit against us seeking (i) to freeze assets in the amount of R$235.6 million associated with alleged improper tax benefits obtained in Rio de Janeiro, (ii) additional payments of other amounts in tax benefits that had been received by us associated with the matter, if any, and (iii) that we be prohibited from receiving incentives, subsidies, grants, donations or loans from public agencies or entities and public financial institutions or those controlled by the government. Before we had a chance to present a defense, an injunction was granted by the trial court. A requirement to suspend the injunction was presented and granted in our favor by the Court of Appeals on July 10, 2020. The case is still at an early stage.
| 148 |
Police Inquiry - Superintendence of the Federal Police of Rio de Janeiro (dairy factory in Barra do Piraí, State of Rio de Janeiro)
On October 29, 2018, the Federal Police of Rio de Janeiro opened an investigation into possible illegal payments made by a third-party competitor of ours to the former governor of the State of Rio de Janeiro, Sérgio Cabral, and another person. On January 6, 2020, an excerpt from a report issued by the Specialized Acting Group to Combat Tax Evasion and Illicit Acts against the Tax Order – GAESF within the Public Prosecutor’s Office of the State of Rio de Janeiro became publicly available. Information in that document indicated that the inquiry is investigating benefits granted to the J&F Group, including a 400,000 m² land in Barra do Piraí, State of Rio de Janeiro, where a factory of VIGOR (a company of J&F Group) was built. The report also mentions how the land was previously granted to us and later transferred by the government to VIGOR. In this context, a notice was sent to us on December 23, 2019 seeking our clarification on how the land in Barra do Piraí, State of Rio de Janeiro was granted to us, returned to the city of Barra do Piraí, State of Rio de Janeiro and then transferred by the city government to VIGOR (a company of J&F Group). In our response, filed on February 27, 2020, we provided all the requested clarifications to the authorities, but this motion was not analyzed yet. In addition, Joesley Mendonca Batista (of the J&F Group) has already testified to the Federal Police of Rio de Janeiro and filed another motion providing for additional explanations about the investigated facts.
Carne Fraca Operation
Brazilian authorities are investigating Brazil’s meat processing industry in the so-called “Carne Fraca Operation.” The investigation involves a number of companies in the Brazilian industry and, among other things, includes allegations relating to food safety, quality control and misconduct related to improper offers or promises made to government inspectors.
On March 17, 2017, we learned of a decision issued by the 14th Federal Court of Curitiba in the State of Paraná authorizing the search and seizure of information and documents from us, and the detention of certain individuals in the context of the Carne Fraca Operation. Two of our employees were detained (both of whom have been released) and three others were identified for questioning (of which only two were questioned).
In addition, our Mineiros plant was temporarily suspended by MAPA on March 17, 2017, so that MAPA could conduct an additional audit on its production process. After conducting an audit, MAPA authorized the Mineiros plant to resume operations as of April 8, 2017. The Mineiros plant reopened on April 10, 2017 and resumed its operations on April 11, 2017.
On April 20, 2017, based on the Brazilian Federal Police investigation, Brazilian federal prosecutors filed several charges against two of our employees (one of our regional manufacturing officers and one of our corporate affairs managers). One such employee was acquitted by lower courts of all charges on September 28, 2018, while the other employee was convicted on one charge. The Brazilian federal prosecutors and one of our former employees filed an appeal, which is pending judgment by the court. On January 22, 2018, the Attorney General’s Office of the Third District of the State of Goiás filed a criminal complaint against the industrial manager of our Mineiros plant at the time of the events subject to investigation in the Carne Fraca Operation. The employee was charged for allegedly committing crimes against consumers, as provided in article 7, item II of Law 8,137/90. The complaint does not contain any allegations of corruption.
We informed certain regulators and governmental entities of the Carne Fraca Operation, including the SEC and the U.S. Department of Justice (DOJ). On February 25, 2021, we were informed by the SEC that it had concluded its investigations with respect to the Carne Fraca Operation, and based on the information reviewed, the SEC Division of Enforcement did not recommend any enforcement action against us. On May 5, 2021, we were informed by the DOJ of the conclusion of its investigations against us pursuant to the Carne Fraca Operation and Trapaça Operation, based on the information it had received until that date. No enforcements or remedies were imposed against us. We continue to cooperate with all applicable authorities, including the CVM, and there has been no adverse action taken against any of our employees as of December 31, 2021.
Currently, the decision of the appeal presented by the defendants and the Federal Prosecution Office by the Tribunal Regional Federal da 4ª Região – TRF4 is pending.
Our Audit and Integrity Committee initiated an investigation with respect to the allegations and related conduct involving our employees in the Carne Fraca Operation. The investigation involves the engagement of an external legal counsel. The effects of the Carne Fraca Operation had operational consequences for us, which are disclosed together with the Trapaça Operation below.
| 149 |
The outcome of the Carne Fraca Operation, including any potential future developments therefrom, may result in penalties, fines and sanctions from applicable governmental authorities or other forms of liabilities, which may have a material adverse impact on our reputation, brands, results of operations, financial position and cash flows. Currently, the losses related to this matter are not possible to be estimated, and, as a result, no provision has been recorded.
For information about the risks related to this investigation, see “Item 3. Key Information—D. Risk Factors—Risks Relating to Our Business and Industry—We may fail to ensure compliance with relevant anti-fraud, anti-corruption, anti-money laundering and other international laws and regulations.”
Trapaça Operation
On March 5, 2018, we learned of a decision issued by the 1st Federal Court of Ponta Grossa in the State of Paraná, which authorized the search and seizure of information and documents from us and certain current and former employees and the temporary detention of certain individuals. In what media reports have identified as the “Trapaça Operation,” 11 of our current and former employees were temporarily detained for questioning, including former Chief Executive Officer Pedro Faria and former Vice President for Global Operations Helio Rubens. All such current and former employees were released from custody and those who are still our employees were placed on leave of absence. A number of our other employees and former employees were identified for questioning. The primary allegations in the Trapaça Operation involve alleged misconduct relating to quality violations, improper use of feed components and falsification of tests at certain of our manufacturing plants and accredited labs.
As a result of the Trapaça Operation, on March 5, 2018, we received notice from MAPA that it immediately suspended exports from our Rio Verde, State of Goiás, Carambeí, State of Paraná and Mineiros, State of Goiás plants to 13 countries with specific sanitary requirements related to Salmonella spp. As a precautionary measure, MAPA also suspended exports from 10 of our other plants to the European Union on March 15, 2018, which was lifted on April 18, 2018. On May 14, 2018, the European Union released its decision to remove 12 of our production facilities in Brazil from the list that permits imports of animal products by the countries in the European Union. The European Union generally has stricter requirements related to salmonella levels and other food safety standards compared to Brazil and the other international markets in which we operate. Given the ban of imports from our production facilities, we are no longer able to sell our products from such embargoed production plants in the European Union and, therefore, our results of operations may be further adversely affected if we are not able to direct excess production capacity resulting from such suspension to other markets at similar prices or margins.
On October 15, 2018, the Brazilian Federal Police issued the final report on the investigation of the Trapaça Operation with accusations against 43 people, among which 23 are our current or former employees, including former Chief Executive Officer Pedro Faria, former chairman of the board of directors Abilio Diniz, and three former vice presidents. Those who are still our employees were placed on leaves of absence.
On December 4, 2019, in the context of the Trapaça Operation, a complaint was filed by the Federal Public Prosecutor’s Office against our former employees for allegedly committing, in the manufacturing of animal feed and PREMIX compound (a supplement added to the animal feed), aggravated larceny by fraud, false representation, wrapper or container with false indication, forgery of substance or food product, forgery of product intended for therapeutic or medicinal purposes and criminal association between the years 2012 and 2018. The complaint was received by the lower court on January 21, 2020. There was no negative decision against any of the defendants during 2021. As of the date of this annual report, the defendants’ have presented their response and the proceedings are still pending, without an adverse decision against the defendants.
On November 4, 2020, also in the context of the Trapaça Operation, a second complaint was filed by the Federal Public Prosecutor’s Office against our former and inactive employees for allegedly committing aggravated larceny by fraud, false representation, selling products harmful to health and criminal association, between the years 2012 and 2017, related to the presence of Salmonella on food products. The complaint was received by the lower court on November 20, 2020. As of the date of this annual report, some of the defendants’ have presented their response.
| 150 |
We informed certain regulators and governmental entities of the Trapaça Operation, including the SEC and the DOJ. On February 25, 2021, we were informed by the SEC that it had concluded its investigations with respect to the Trapaça Operation, and based on the information reviewed, the SEC Division of Enforcement did not recommend any enforcement action against us. On May 6, 2021, we were also informed by the DOJ that it also had concluded its investigations and did not recommend enforcement action against us or our executives. We continue to cooperate with all applicable authorities, including the CVM.
Our Audit and Integrity Committee has initiated an investigation with respect to the allegations and related conduct involving our employees in the Trapaça Operation. The investigation involves the engagement of an external legal counsel. The effects of the Carne Fraca and Trapaça Operations had operational consequences for us, as we incurred expenses in the amount of R$9,003 thousand in 2021 mainly with law firms, recorded as other operating expenses (R$28,004 thousand in 2020).
The outcome of the Trapaça Operation, including any potential future developments therefrom, may result in penalties, fines and sanctions from applicable governmental authorities or other forms of liabilities, which may have a material adverse impact on our reputation, brands, results of operations, financial position and cash flows. Currently, the losses related to this matter are not possible to be estimated, and, as a result, no provision has been recorded.
See “Item 3.—D. Risk Factors— Risks Relating to Our Business and Industry—Health risks related to our business and the food industry could adversely affect our ability to sell our products” and “Item 3.—D. Risk Factors— Risks Relating to Our Business and Industry—We have been subject to significant investigations relating to, among other things, food safety and quality control, and an adverse outcome of any of these investigations could result in penalties, fines or other forms of liability and could have a material adverse effect on our business, reputation, brand, results of operations and financial condition.”
Controladoria-Geral da União (CGU) Proceedings
In June 2018 and in May 2019, we learned of administrative proceedings commenced against us by the Brazilian Comptroller General of the Union (Controladoria-Geral da União), or CGU, which is primarily related to alleged irregularities in connection with conduct that could represent harmful acts to the public administration under the Brazilian Anti-Corruption Law and other applicable laws, as described in Carne Fraca Operation and Trapaça Operation. The CGU is an internal control body of the Brazilian federal government responsible for carrying out activities related to the defense of public property and the increase of management transparency, through actions of public audit, correction, prevention and combat of corruption, among others. These CGU administrative proceedings against us remain pending without any adverse decision against us as of the date of this annual report.
At the administrative proceedings related to the Trapaça Operation, when we are subpoenaed, we intend to present our defense in this matter.
At the administrative proceedings related to the Carne Fraca Operation, BRF was subpoenaed and presented its defense in September 2021, and the proceeding is currently in the investigative phase.
We will continue to discuss a possible resolution of these proceedings with CGU, and to cooperate with the governmental authorities. The outcome of the CGU proceedings may result in penalties, fines, compensation, sanctions from governmental authorities or other forms of liabilities, which may have a material adverse impact on our reputation, brand, results of operations, financial position and cash flows. Currently, any losses related to this matter cannot be estimated, and, as a result, no provision has been recorded.
| 151 |
Romanos Operation
On October 1, 2019, we became aware of a decision held by a federal judge of the 1st Federal Court of Ponta Grossa in the State of Paraná, which authorized a search and seizure operation of information and documents to be carried out against federal inspectors from MAPA in several of our production locations. A limited number of inspectors were still located in our production units. None of our employees were involved in this search and seizure operation and neither we nor our employees are a party to such operation and investigation. On July, 27, 2021, the court overturned the federal judge’s decision made on October 1, 2019 and the proceeding governing the search and seizure operation was filed and dismissed on August 17, 2021. However, the police investigation is still ongoing and we will continue to cooperate with the relevant authorities on this matter.
U.S. Class Action
On March 12, 2018, a shareholder class action lawsuit was filed against us, some of our former managers and a current officer of ours in the U.S. Federal District Court in the Southern District of New York. On July 2, 2018, the Court appointed the City of Birmingham Retirement and Relief System lead plaintiff in the action (the “Lead Plaintiff”). On December 5, 2018, the Lead Plaintiff filed an amended complaint that sought to represent all persons and entities who purchased or otherwise acquired our ADRs during the period from April 4, 2013, through and including March 2, 2018. The class action alleged, among other things, that we and certain officers or directors of ours engaged in securities fraud or other unlawful business practices related to the regulatory issues in connection with the Carne Fraca Operation and Trapaça Operation. On December 13, 2019, we and the other defendants filed a motion to dismiss. On January 21, 2020, the Lead Plaintiff filed an opposition motion, and, on February 11, 2020, we and the other defendants filed our response. While the court’s decision on the motion to dismiss was still pending, the parties reached an agreement on March 27, 2020 to settle this class action for an amount equivalent to R$204,436 thousand (US$40,000 thousand, translated to reais at the exchange rate of R$5.1109 as of March 27, 2020). On May 27, 2020, the amount was transferred to an escrow account in the name of the lawyers of the lead plaintiff and there is not any additional amount payable by us in connection with this lawsuit. The court approved this settlement on October 23, 2020.
Brazilian Investor Arbitrations
In March 2020, three confidential arbitration proceedings were brought against us in the Market Arbitration Chamber (Câmara de Arbitragem do Mercado) of the B3 in Brazil by investors that had purchased our shares traded on the B3, seeking recovery from alleged losses incurred by them, due to a drop in our share price. In September 2020, the Chairman of Market Arbitration Chamber of B3 decided to consolidate these three arbitrations into a single proceeding. Because this arbitration proceeding is in its initial stage, we believe the possible loss or range of losses, if any, arising from this arbitration cannot be estimated. In the event that this proceeding is decided against us, or we enter into an agreement to settle, there can be no assurance that an unfavorable outcome or settlement would not have a material impact on us.
COVID-19 Arbitration
We initiated an arbitration procedure before the Center for Arbitration and Mediation of the Chamber of Commerce Brazil-Canada, or CAM-CCBC, in order to solve a dispute against our insurers regarding the coverage of damages caused by the events inflicted in the context of the ongoing COVID-19 global pandemic. The accurate amount of losses will be precisely calculated further on in the subsequent phase of the proceedings, after the prejudgment process. On December 17, 2021, we submitted our statement of claim. The proceedings are still in their early stages. On January 3, 2022, our statement of claim was shared with the insurers, who shall submit their response within the period established under the arbitration term. Once their response is submitted, we will present our response.
Other
Requests for information by the CVM with respect to transactions with our common shares
In October 2021, we received a letter from the CVM inquiring as to whether we or any of the members of our management, employees or agents had been informed about Marfrig's intention to acquire our common shares in the market, prior to the press release issued on May 21, 2021, announcing the acquisition, by Marfrig Global Foods S.A., of an equity interest equivalent to approximately 24.23% of our capital stock (the “Press Release”). In November 2021, the CVM requested, from one of the members of our management, information about transactions carried out with our common shares before the Press Release was issued. The letters from the CVM were timely answered, and there have been no new communications from the CVM on the matter as of the date of this annual report. We cannot assure that the CVM will not send additional communications or take any other action in connection with the matter.
| 152 |
Dividends and Dividend Policy
Our dividend policy has historically included the distribution of periodic dividends, based on quarterly balance sheets approved by our board of directors. When we pay dividends on an annual basis, they are declared at our annual shareholders’ meeting, which we are required by Brazilian Corporate Law and our bylaws to hold by April 30 of each year. When we declare dividends, we are generally required to pay them within 60 days of declaring them unless the shareholders’ resolution establishes another payment date. In any event, if we declare dividends, we must pay them by the end of the fiscal year in which they are declared.
As permitted by Brazilian Corporate Law, our bylaws specify that 25% of our adjusted net profits for each fiscal year must be distributed to shareholders as dividends or interest on shareholders’ equity. We refer to this amount as the mandatory distributable amount. Under Brazilian Corporate Law, the amount by which the mandatory distributable amount exceeds the “realized” portion of net income for any particular year may be allocated to the unrealized income reserve, and the mandatory distribution may be limited to the “realized” portion of net income. The “realized” portion of net income is the amount by which our net income exceeds the sum of: (i) our net positive results, if any, from the equity method of accounting for earnings and losses of our subsidiaries and certain associated companies; and (ii) the profits, gains or income obtained on transactions maturing after the end of the following fiscal year. As amounts allocated to the unrealized income reserve are realized in subsequent years, such amounts must be added to the dividend payment relating to the year of realization.
During the years ended December 31, 2021, 2020 and 2019, no dividends and interest on shareholders’ equity were paid to holders of our common shares.
Any decision to declare and pay dividends or interest on shareholders’ equity in the future will be made at our discretion and will be subject to our continuing determination that such payments are in the best interests of our shareholders and are in compliance with all laws and agreements to which we are subject.
Amounts Available for Distribution
The section of this annual report entitled “Item 10. Additional Information––B. Memorandum and Articles of Association––Description of Share Capital” contains a description of the calculation and payment of dividends and interest on shareholders’ equity under Brazilian Corporate Law. See “Item 10. Additional Information––B. Memorandum and Articles of Association––Allocation of Net Income and Distribution of Dividends” and “Item 10. Additional Information––B. Memorandum and Articles of Association––—Payment of Dividends and Interest on Shareholders’ Equity.”
Disclosure pursuant to Section 13(r) of the Exchange Act
Section 13(r) of the Securities Exchange Act of 1934 requires issuers to make specific disclosure in their annual reports of certain types of dealings with Iran, including certain transactions or dealings with persons or entities who meet the definition of Government of Iran pursuant to 31 C.F.R. § 560.304. In 2021, we shipped 4,041 tons of whole chicken to the UAE pursuant to a supply contract with a UAE company, which the UAE company subsequently shipped to a consignee/distributor in Iran. This limited business was conducted by a non-U.S. affiliate of our company. The gross revenues from these sales amounted to less than US$6 million, representing less than 0.05% of our global revenue for the year ended December 31, 2021. Sales are expected to continue under the same terms abovementioned. Prior to these sales, we obtained halal certification for the products, which required inspection by the World Halal Center EIRELI atour facilities in Brazil and subsequent certification by the Iranian Veterinarian Association (IVO) (affiliated with Iran’s Ministry of Agriculture), to certify that products are produced as per Halal practices. We received no revenue (and therefore no profit) from the regulatory inspection and approval process.
| 153 |
In addition to Section 13(r) of the Exchange Act, U.S. law generally restricts dealings by persons subject to U.S. jurisdiction with certain countries or territories that are the target of comprehensive sanctions, currently Crimea, Cuba, Iran, North Korea, and Syria. We do business, via non-U.S. entities (which are not owned or controlled by U.S. entities), in certain of these jurisdictions. While we believe any such dealings comply in all material respects with all applicable U.S. sanctions, such laws are complex and continue to evolve rapidly.
| B. | Significant Changes |
None.
ITEM 9. THE OFFER AND LISTING
| A. | Offer and Listing Details |
Our common shares trade on the São Paulo Stock Exchange. ADRs representing our common shares trade on the NYSE. As of March 24, 2022, there are 1,082,473,246 common shares without par value issued and outstanding (excluding 5,053,554 common shares held in treasury), and 218,606,918 ADRs outstanding, representing 20.20% of our outstanding common shares.
| B. | Plan of Distribution |
Not applicable.
| C. | Markets |
Our common shares trade on the São Paulo Stock Exchange. ADRs representing our common shares trade on the NYSE.
Trading on the B3
The B3 is a public company which resulted from the merger among Bolsa de Mercadorias e Futuros (BM&F, the Brazilian commodities and futures exchange), Bolsa de Valores de São Paulo (“Bovespa”), Companhia Brasileira de Liquidação e Custódia (“CBLC,” the Bovespa’s securities clearing system) and CETIP S.A. - Balcão Organizado de Ativos e Derivativos.
Trading on the São Paulo Stock Exchange is limited to member brokerage firms and a limited number of authorized non-members. The São Paulo Stock Exchange currently has trading sessions, from 10:00 a.m. to 5:00 p.m. local time. There is also trading in the so-called After-Market, only through the automated quotation system of the São Paulo Stock Exchange, from 5:30 p.m. to 6:00 p.m. local time. Only shares that were traded during the regular trading session of the day may be traded in the After-Market of the same day. Trades are made by entering orders in the Mega Bolsa electronic trading system, created and operated by the B3.
| 154 |
Settlement of transactions conducted on the São Paulo Stock Exchange is affected three business days after the trade date without any adjustment for inflation. Delivery of and payment for shares is made through Central Depositária, the São Paulo Stock Exchange’s securities clearing system. The seller is ordinarily required to deliver the shares to the exchange on the third business day following the trade date.
In order to maintain better control over the fluctuation of the São Paulo Stock Exchange index, the São Paulo Stock Exchange has a “circuit breaker” system in which the trading session is suspended for a period of 30 minutes or one hour in the event the São Paulo Stock Exchange index were to fall below the limit of 10% or 15%, respectively, in relation to the closing rate of the index of the previous trading session.
The São Paulo Stock Exchange is significantly less liquid than the NYSE and the world’s other major stock exchanges. While all of the outstanding shares of a listed company may trade on the São Paulo Stock Exchange, in most cases fewer than half of the listed shares are actually available for trading by the public. The remaining shares are often held by a single or small group of controlling persons or by governmental entities.
Trading on the São Paulo Stock Exchange by a holder not deemed to be domiciled in Brazil for Brazilian tax and regulatory purposes, or a non-Brazilian holder, is subject to certain limitations under Brazilian foreign investment regulations. With limited exceptions, non-Brazilian holders may trade on the São Paulo Stock Exchange only in accordance with the requirements of Resolution No. 4,373 of September 29, 2014 of the CMN, as amended (“Resolution No. 4,373”). Resolution No. 4,373 requires securities held by non-Brazilian holders to be maintained in the custody of, or in deposit accounts with, financial institutions that are authorized by the Central Bank and the Brazilian Securities Commission. In addition, Resolution No. 4,373 requires non-Brazilian holders to restrict their securities trading to transactions on the São Paulo Stock Exchange or organized over-the-counter markets. With limited exceptions, non-Brazilian holders may not transfer the ownership of investments made under Resolution No. 4,373 to other non-Brazilian holders through private transactions. For more information, see “Item 10. Additional Information––B. Memorandum and Articles of Association––Regulation of Foreign Investment.”
Regulation of Brazilian Securities Markets
The Brazilian securities markets are regulated by the CVM, which has authority over stock exchanges and the securities markets generally, by the CMN and by the Central Bank. The Central Bank, on the other hand, has, among other powers, licensing authority over brokerage firms and regulates foreign investment and foreign exchange transactions. The Brazilian securities market is governed by Brazilian Law No. 6,385/76, as amended, and by Brazilian Corporate Law and other CVM rulings and regulations.
Under Brazilian Corporate Law, a company may be either public (companhia aberta), as we are, or closely held (companhia fechada). All public companies are registered with the CVM and are subject to periodic reporting requirements. A company registered with the CVM may have its securities traded on the Brazilian stock exchanges or in the Brazilian over-the-counter market. The shares of a listed company, like those of our company, also may be traded privately subject to certain limitations.
The Brazilian over-the-counter market consists of direct trades between persons in which a financial institution registered with the CVM serves as intermediary. No special application, other than registration with the CVM, is necessary for securities of a public company to be traded in this market. The CVM must receive notice of all trades carried out in the Brazilian over-the counter market by the respective intermediaries.
Trading of a company’s securities on the São Paulo Stock Exchange may be suspended in anticipation of a material announcement. A company must also suspend trading of its securities on international stock exchanges on which its securities are traded. Trading may also be suspended by the São Paulo Stock Exchange or the CVM, among other reasons, based on or due to a belief that a company has provided inadequate information regarding a material event or has provided inadequate responses to an inquiry by the CVM or the relevant stock exchange.
Brazilian Law No. 6,385/76, as amended, Brazilian Corporate Law and regulations issued by the CVM provide for, among other things, disclosure obligations, restrictions on insider trading and price manipulation and protections for minority shareholders. However, the Brazilian securities markets are not as highly regulated and supervised as securities markets in the United States and some other jurisdictions. In addition, rules and policies against self-dealing or for preserving shareholder interests may be less well-defined and enforced in Brazil than in the United States, which may put holders of our common shares and ADRs at a disadvantage. Corporate disclosures also may be less complete than for public companies in the United States and certain other jurisdictions.
| 155 |
São Paulo Stock Exchange Corporate Governance Standards
The São Paulo Stock Exchange has listing segments:
| · | The Bovespa Mais; |
| · | The Bovespa Mais Level 2; |
| · | Corporate Governance Level 1; |
| · | Corporate Governance Level 2; and |
| · | The Novo Mercado (New Market) of the B3. |
These listing segments have been designed for the trading of shares issued by companies that voluntarily undertake to abide by corporate governance practices and disclosure requirements in addition to those already required under Brazilian Corporate Law. The inclusion of a company in any of the new segments requires adherence to a series of corporate governance rules. These rules are designed to increase shareholders’ rights and enhance the quality of information provided by Brazilian corporations.
In April 2006, we entered into a listing agreement with the São Paulo Stock Exchange, under which we agreed to comply with stricter corporate governance and disclosure requirements established by the São Paulo Stock Exchange in order to qualify as a company admitted to the Novo Mercado.
As a company listed on the Novo Mercado and subject to its regulations, we agreed, among other things, to:
| · | maintain a share capital structure composed exclusively of common shares; |
| · | ensure the free float of shares representing at least 25% of our total outstanding share capital or 15%, in case of average daily trading volume greater than R$25 million; |
| · | adopt offering procedures that favor widespread ownership of shares whenever making a public offering; |
| · | comply with minimum quarterly disclosure standards; |
| · | disclose the following policies, approved by the Board of Directors: |
o Management Compensation Policy;
o Appointment Policy for Members of the Board of Directors, of the Advisory Committees and of the Board of Executive Officers;
o Financial Risk Management Policy;
o Related Party Transactions Policy; and
o Securities Trading Policy by any controlling shareholders and our directors and executive officers.
| 156 |
| · | make a schedule of corporate events available to our shareholders; |
| · | offer tag-along rights to minority shareholders (meaning that, upon the acquisition of a controlling interest, the purchaser must also agree to purchase the shares of minority shareholders for the same price paid for the shares in the controlling stake); |
| · | in the event of a delisting of shares, conduct a public tender offer for our common shares at a price at least equal to the economic value determined according to CVM and Novo Mercado rules; |
| · | present an annual balance sheet prepared in accordance with, or reconciled to, IFRS; |
| · | establish a maximum of two-year term for all members of the board of directors; |
| · | require that at least 2 members or 20% of our board of directors, whichever is greater, consist of independent directors; and |
| · | submit to arbitration by the Market Arbitration Chamber (Câmara de Arbitragem do Mercado) all controversies involving our company, members of our board of directors, board of executive officers, fiscal council and audit and integrity committee or shareholders relating to the application, validity, efficacy, interpretation, violation or effect of the Novo Mercado listing agreement and rules, our bylaws, Brazilian Corporate Law or the rules of the CMN, the Central Bank, the CVM or the Market Arbitration Chamber or other rules within the jurisdiction of the Market Arbitration Chamber. |
All members of our board of directors and board of executive officers executed a management compliance statement (Termo de Anuência dos Administradores) under which they take personal responsibility for compliance with the Novo Mercado listing agreement, the rules of the Market Arbitration Chamber and the Novo Mercado rules.
| D. | Selling Shareholders |
Not applicable.
| E. | Dilution |
Not applicable.
| F. | Expenses of the Issue |
Not applicable.
ITEM 10. ADDITIONAL INFORMATION
| A. | Share Capital |
Not applicable.
| B. | Memorandum and Articles of Association |
Description of Share Capital
Set forth below is a summary of the material terms of provisions of our common shares. This description does not purport to be complete and is qualified in its entirety by reference to our amended and restated bylaws (filed herewith as Exhibit 1.01), Brazilian Corporate Law, the rules and regulations of the CVM and the rules of the Novo Mercado. We have described some of the amendments below.
| 157 |
Under the Novo Mercado listing agreement that we entered into with the São Paulo Stock Exchange (B3) and our bylaws, we may not issue preferred shares or shares with restricted voting rights. Accordingly, this section does not discuss the Brazilian statutory rights conferred upon holders of preferred shares.
General
We are a publicly held corporation (sociedade por ações de capital aberto) incorporated under the laws of Brazil. Our headquarters are located in Itajaí, State of Santa Catarina. We are duly registered with the Junta Comercial do Estado de Santa Catarina under NIRE 42.300.034.240 and with the CVM under No. 01629-2.
As of the date of this annual report, our paid-in capital was R$13,053,417,963.36, which is composed of 1,082,473,246 book-entry common shares without par value. The Board is authorized to increase our capital stock to 1,325,000,000 common shares.
Corporate Purpose
Article 3 of our bylaws provides that our corporate purpose consists of:
| · | the manufacture, sale, in the retail and wholesale sector, and transaction of business relating to food in general, particularly animal protein by-products and food items that use the cold chain for support and distribution; |
| · | the manufacture and sale of animal feed, nutrients and food supplements for animals; |
| · | the provision of food services in general; |
| · | the manufacture, refining and sale of vegetable oils, fats and dairy products; |
| · | the production, conservation, storage, silage and sale of grains, their derivatives and by-products; |
| · | the sale on the retail and wholesale market of consumer and production goods, including equipment and vehicles for the development of its logistical activity; |
| · | the export and import of production and consumer goods; |
| · | the provision of services of transport, logistics and distribution of freight and food in general; |
| · | holding equity stakes in other companies, with the aim of achieving the corporate purposes to the fullest extent; |
| · | the participation in any projects needed for the operation of our business; |
| · | the manufacture on its own or on demand, commercialization, export and import of pharmochemical products derived from animal slaughter; |
| · | the manufacture and commercialization of organic chemical products derived from animal slaughter; and |
| · | the manufacture, distribution and export of pharmaceutical ingredients derived from animal slaughter. |
| 158 |
We may further engage directly, or indirectly through other companies, in any support activities for the core business described above, such as:
| · | administrative, technical or operational support activities, aimed at creating conditions to improve our core business; |
| · | transport services, in general; |
| · | product storage and stocking services and other related ancillary services; |
| · | activities to promote and replace our products in the retail market and at points of sale exposed to the final consumer, including the support needed by clients to allow the packaging and visualization of the products; |
| · | services for receiving and allocating raw materials to be used in production; |
| · | the provision of machine and vehicle repair, maintenance and overhaul services; |
| · | the promotion of the growth of agribusiness in Brazil through programs, technical assistance and supply; |
| · | the manufacture, development and sale of packaging products of any kind; |
| · | the processing and raising of livestock in general; |
| · | the sale of commodities in general; |
| · | research and development of techniques for the production and improvement of our genetic matrixes; |
| · | the activities of reforestation, extraction, manufacturing and sale of timber; |
| · | the sale of mobile assets, real estate, including machines, equipment and vehicles, fixed assets, to meet the activities within our corporate purpose; and |
| · | services to supply fuel for our own fleet or outsourced service providers, particularly freight, transport, logistics and distribution. |
Our bylaws prohibit our managers from engaging in any practices that involve us in matters or activities inconsistent with our corporate purpose and core business or contrary to our bylaws. Any such practices shall be null and void and may result in civil or criminal liability, as the case may be, of the individuals involved.
Rights of Common Shares
At our shareholders’ meetings, each share of our common stock is entitled to one vote. Pursuant to our bylaws and to the Novo Mercado listing agreement, we may not issue shares without voting rights or with restricted voting rights. In addition, our bylaws and Brazilian Corporate Law provide that holders of our common shares are entitled to dividends or other distributions made in respect of our common shares ratably in accordance with their respective participation in the total amount of our issued and outstanding shares. See “— Payment of Dividends and Interest on Shareholders’ Equity” for a more complete description of the payment of dividends and other distributions on our shares. In addition, upon our liquidation, holders of our common shares are entitled to share our remaining assets, after payment of all of our liabilities, ratably in accordance with their respective participation in the total amount of our issued and outstanding shares. Holders of our common shares have, except in certain circumstances listed in Brazilian Corporate Law and in our bylaws, the right to participate in our company’s future capital increases, in proportion to their participation in our capital stock, and also the right to dispose of shares in a public offering in case of acquisition of shares in quantities equal to or in excess of 33.33% of total shares issued in the offering, in compliance with the terms and conditions provided in Article 41 of our bylaws.
| 159 |
According to Brazilian Corporate Law, neither our bylaws nor actions taken at a shareholders’ meeting may deprive a shareholder of the following rights:
| · | the right to participate in the distribution of profits; |
| · | the right to participate equally and ratably in any remaining residual assets in the event of our liquidation; |
| · | preemptive rights in the event of issuance of shares, convertible debentures or warrants, except in certain specific circumstances under Brazilian Corporate Law described under “—Preemptive Rights”; |
| · | the right to monitor our management in accordance with the provisions of Brazilian Corporate Law; and |
| · | the right to withdraw from our company in the cases specified in Brazilian Corporate Law, which are described under “—Withdrawal Rights.” |
Meeting of Shareholders
Under Brazilian Corporate Law, our shareholders are generally empowered at our shareholders’ meetings to take any action relating to our corporate purposes and to pass resolutions that they deem necessary to our interests and development at duly called and convened general meetings. Shareholders at our annual shareholders’ meeting, which is required to be held within four months of the end of our fiscal year, have the exclusive right to approve our audited financial statements and to determine the allocation of our net profits and the distribution of dividends with respect to the fiscal year ended immediately prior to the relevant shareholders’ meeting. The election of our board members typically takes place at the annual shareholders’ meeting, every two years, although under Brazilian Corporate Law it may also occur at an extraordinary shareholders’ meeting. Members of the fiscal council (conselho fiscal) may be elected at any shareholders’ meeting.
An extraordinary shareholders’ meeting may be held concurrently with the annual shareholders’ meeting and at other times during the year.
Under our bylaws and Brazilian Corporate Law, the following actions, among others, may be taken only at a shareholders’ meeting:
| · | amendment of our bylaws; |
| · | election and dismissal, at any time, of the members of our board of directors and fiscal council and approval of their aggregate compensation; |
| · | approval of management accounts and our audited financial statements; |
| · | granting stock awards and approval of stock splits or reverse stock splits; |
| · | approval of stock option plans for our management and employees or individuals who provide services to us, as well as those of companies directly or indirectly controlled by us; |
| · | authorization of the issuance of convertible debentures exceeding the authorized capital stock; |
| · | suspension of the rights of a shareholder; |
| 160 |
| · | approval of the distribution of our profits and payment of dividends, as well as the establishment of any reserve other than the legal reserve; |
| · | acceptance or rejection of the valuation of in-kind contributions offered by a shareholder in consideration for issuance of shares of our share capital; |
| · | approval of our transformation, merger, consolidation, spin-off; |
| · | approval of any dissolution or liquidation, and the appointment and dismissal of a liquidator, as well as the members of our fiscal council, which shall be installed in the event of our liquidation if it does not already exist at the time; |
| · | authorization to delist from the Novo Mercado, as well as the approval of the waiver of the presentation of the Public Offer of Purchase of Shares in such circumstances; and |
| · | authorization to petition for bankruptcy or file a request for judicial or extra-judicial restructuring. |
Quorum
As a general rule, Brazilian Corporate Law provides that the quorum for our shareholders’ meetings consists of shareholders representing at least a quarter of our issued and outstanding shares on the first call and, if that quorum is not reached, any percentage on the second call. If the shareholders are convened to amend our bylaws, a quorum at a shareholders’ meeting consists of shareholders representing at least two-thirds of our issued and outstanding share capital entitled to vote on the first call and any percentage on the second call. In most cases, the affirmative vote of shareholders representing at least the majority of our issued and outstanding shares present in person, virtually (whenever the shareholders’ meeting is held under a partial or 100% digital format), by means of the distance voting form (boletim de voto a distância) or represented by proxy at a shareholders’ meeting is required to approve any proposed action, and blank votes are not counted as shares present in person or represented by proxy. However, the affirmative vote of shareholders representing not less than one-half of our issued and outstanding shares is required to, among other measures:
| · | reduce the percentage of mandatory dividends; |
| · | change our corporate purpose; |
| · | consolidate with or merge our company into another company; |
| · | spin off assets of our company; |
| · | approve our participation in a centralized group of companies; |
| · | apply for cancellation of any voluntary liquidation; and |
| · | approve our dissolution. |
A quorum smaller than the quorum established by Brazilian Corporate Law may be authorized by the CVM for a public company with widely traded shares and that has had less than half of the holders of its voting shares in attendance at its last three shareholders’ meetings.
Elimination of or amendment to limit shareholders’ rights under Article 41 of our bylaws, which requires any shareholder who becomes the holder of 33.33% or more of our total capital stock to effect a public offer for all of our outstanding stock, is permitted only when approved by the majority of shareholders present at the shareholders’ meeting.
| 161 |
Notice of Shareholders’ Meetings
Under Brazilian Corporate Law, notice of our shareholders’ meetings must be published at least three times in a widely circulated newspaper in the state of the location of our head office, which is currently the Valor Econômico.
Notices of shareholders’ meetings must contain the agenda for the meeting and, in the case of an amendment to our bylaws, a summary of the proposed amendment. Under Brazilian Corporate Law, the first notice must be published at least 21 days before the date of the meeting on the first call, and no later than eight days before the date of the meeting on the second call. However, under our bylaws and except as provided under applicable legislation, Brazilian issuers of depositary receipts, such as our company, must call their shareholders’ meetings not less than 30 days prior to the meeting in the first call, and no later than eight days before the date of the meeting on the second call. In addition, upon request of any shareholder, the CVM may suspend for up to 15 days the required prior notice of an extraordinary shareholders’ meeting so that the CVM can become familiar with, and analyze, the proposals to be submitted at the meeting and, if applicable, inform us, up to the end of the suspension period, about the reasons why it believes that a proposed resolution violates legal or regulatory provisions.
Location of Shareholders’ Meetings
Our shareholders’ meetings take place at our head offices in the City of Itajaí, State of Santa Catarina. Brazilian Corporate Law allows our shareholders to hold meetings in another location in the event of force majeure, provided that the meetings are held in the same city in which our head office is located and the relevant notice includes a clear indication of the place where the meeting will occur. Additionally, CVM Instruction No. 481 of December 17, 2009, as amended by CVM Instruction No. 622 of April 17, 2020 and CVM Resolution No. 5 of August 27, 2020, permits our shareholders’ meeting to be held under a total or partial digital format.
Calling of Shareholders’ Meetings
Our board of directors may call shareholders’ meetings. Shareholders’ meetings also may be called by:
| · | any shareholder, if our board of directors fails to call a shareholders’ meeting within 60 days after the date it is required to do so under applicable law and our bylaws; |
| · | shareholders holding at least 5% of our common shares, if our board of directors fails to call a meeting within eight days after receipt of a request to call the meeting by those shareholders indicating the reasons for calling such a meeting and the proposed agenda; |
| · | shareholders holding at least 5% of our common shares if our board of directors fails to call a meeting within eight days after receipt of a request to call a meeting to approve the creation of a fiscal council; and |
| · | our fiscal council, if the board of directors fails to call an annual shareholders’ meeting within one month after the date it is required to do so under applicable law and our bylaws. The fiscal council may also call an extraordinary general shareholders’ meeting if it believes that there are important or urgent matters to be addressed. |
Conditions of Admission
Our shareholders may be represented at a shareholders’ meeting by a proxy appointed less than a year before the meeting, which proxy holder must be either a shareholder, a corporate officer, a lawyer or, in the case of a publicly traded company, such as our company, a financial institution. An investment fund shareholder must be represented by its investment fund officer or by a proxy holder.
Pursuant to our bylaws, to ensure the efficiency of the works during our shareholders’ meetings shareholders attending a shareholders’ meeting are required to deliver, at least five days prior to the shareholders’ meeting, proof of their status as shareholders and proof that they hold the shares they intend to vote by delivery of proper identification and, if necessary, a receipt issued by the custodian agent, a power of attorney (if the shareholder is represented by a third party) or an extract evidencing the holding of registered shares. Notwithstanding the above and in accordance with Brazilian Corporate Law and our bylaws, shareholders who are able to make proof of their status as our shareholders may participate and vote at our shareholders’ meeting.
| 162 |
In addition, shareholders may vote by sending the distance voting form or by public request for proxy made available by us, duly filled and signed directly to us at Avenida Doutora Ruth Cardoso, 1st Floor, 05425-070, São Paulo – SP – Brazil, to the attention of the Corporate Legal Department, with copies of the following documents:
| · | certified copies of an identification document with a photo for individuals and the bylaws, corporate and proxy documents and an identification document with a photo of the proxy holder for legal entities; and |
| · | in the case of investment funds, the rules of the fund, the bylaws of the manager or the administrator, according to the voting policy of the fund, corporate and proxy documents and an identification document with a photo of the proxy holder. |
It is not mandatory to notarize the signature on the distance voting form. Corporate and proxy documents of legal entities and investment funds in foreign languages shall be notarized and accompanied by a sworn translation.
The holders of ADRs will be represented by The Bank of New York Mellon, in its capacity as a depository institution within the terms of the Deposit Agreement signed with us.
Shareholders may also vote by means of instruction transmitted to our bookkeeping agent. This option is aimed exclusively to shareholders whose shares are kept with the bookkeeping agent and that are not held in the central depositary.
Shareholders with shares which are not held in the central depositary and who choose to exercise their voting right through service providers may transmit their instructions to the bookkeeping agent of our shares, in accordance with the service provider’s rules. Shareholders should contact the bookkeeping agent and verify the procedures it has established for distance voting form along with the documents and information it requires to exercise this service.
The shareholders whose shares are deposited in the central depositary of the B3 and who choose to exercise their voting right through service providers should transmit their instructions to the respective custodian agents, in line with their rules, which, in turn, will forward these voting instructions to the central depositary of the B3. This option is aimed exclusively at shareholders whose shares are in the custody of the B3. Voting will be exercised by the shareholders according to the procedures adopted by their custodian agents.
In case a shareholders’ meeting is held under a total or partial digital format, we will fully disclose the conditions of admission on the documents related to the referred to shareholders’ meeting.
Board of Directors
Under our bylaws, our board of directors is composed of nine to eleven members. The members of our board of directors are elected at the shareholders’ meeting for a period of two years and may be reelected. Our bylaws do not contemplate alternates to board members. At least 2 of the directors or 20% of the board of directors, whichever is greater, must be independent (as defined in the Novo Mercado rules). The Board of Directors must annually assess and disclose the independent board members and describe any event that may compromise their independence. There is no mandatory retirement age for our directors. In case of any vacancy, the remaining members will nominate an alternate director who will serve until the next shareholders’ meeting, when shareholders shall elect another director to serve for the remaining term of office. If more than 1/3 of the seats on the board of directors are vacant at the same time, then an extraordinary shareholders’ meeting shall be called within 30 days counted from such vacancy event to elect the substitutes for such positions, who will serve for a term of office coinciding with the term of the other members.
| 163 |
Pursuant to our bylaws, whenever the shareholders’ meeting is convened to elect the board of directors, the board members are required to vote on and submit to the shareholders’ meeting a slate with candidates for all of the vacant board seats, including for the positions of chairman and vice chairman of the board. A shareholder who intends to nominate one or more members that are not on the slate prepared by the board must notify us, preferably in writing, at least five days prior to the shareholders’ meeting at which the members of the board of directors will be elected, providing us with the name, a complete list of qualifications and resume of the candidate. If we receive such a notification, we will be responsible for immediately disclosing this information through a Shareholders’ Notice to be posted on the CVM website and our website.
Brazilian Corporate Law sets forth that a cumulative vote system must be made available upon request of shareholders representing at least 10% of our voting share capital. The cumulative vote system entitles each share held by a shareholder to as many votes as there are members of the board of directors and to give each share the right to vote cumulatively for only one candidate or to distribute its votes among several candidates. Whenever the election has been carried out by the cumulative vote process, the dismissal of any member of the board of directors by the shareholders’ meeting will imply the dismissal of all other members, and a new election shall be held.
Pursuant to CVM regulations, the minimum percentage of voting capital required for the adoption of the cumulative vote system by a publicly held company may be reduced based on its share capital, varying from 5% to 10%. In our case, considering the amount of our share capital, shareholders representing 5% of the voting capital may request the adoption of the cumulative vote system to elect the members of our board of directors. Pursuant to our bylaws, if a shareholder requests the adoption of the cumulative vote system, as provided by Section 141, paragraph one of Brazilian Corporate Law, we must disclose our receipt and the contents of such notification immediately through a Shareholder Notice, available on the CVM website or in accordance with applicable laws or CVM rules.
On March 24, 2022, we received from Caixa de Previdência dos Funcionários do Banco do Brasil – PREVI, which holds 6.13% of our capital stock, a request that a cumulative vote system be adopted for the election of members of our board of directors at our 2022 General Shareholders’ Meeting. For further information, see “Item 3. Key Information—D. Risk Factors—Risks Relating to Our Business and Industry—We do not have a controlling shareholder or control group, which may make us susceptible to the emergence of shareholders with relevant stakes, alliances between shareholders, possible conflicts between shareholders and other events arising from the absence of a controlling shareholder or control group, and that may lead to changes in our corporate policies and strategies” and “Item 6. Directors and Senior Management and Employees—A. Directors and Senior Management—Board of Directors Nominees.”
Board of Executive Officers
Our bylaws provide for a board of executive officers composed of at least two and no more than 15 members, comprised of a Global Chief Executive Officer, a Chief Financial and Investor Relations Officer and all other members as Vice Presidents. The titles and duties of the remaining executive officers are proposed by the Global Chief Executive Officer to the board of directors. The members of our board of executive officers are elected by our board of directors for two-year terms and are eligible for reelection. Our board of directors may remove any executive officer from office at any time with or without cause. Under Brazilian Corporate Law, our executive officers need not be shareholders of our company.
In accordance with the Brazilian Corporate Law, Novo Mercado rules and our bylaws, the position of Chairman of the Board of Directors and Chief Executive Officer may not be occupied by the same individual, except in the event of a vacancy in the position of Chief Executive Officer, in which case, we should: (i) disclose the occurrence of an individual holding both positions as a result of the vacancy; (ii) disclose, within 60 days, counted from the vacancy, the measures taken to end any such occurrence; and (iii) end any such occurrence within one year.
Fiscal Council
Under Brazilian Corporate Law, the fiscal council is an auditing body independent from our management. Its main responsibility is to inspect the management actions and audit our consolidated financial statements, reporting its conclusions to the shareholders.
We have a permanent fiscal council composed of three members and an equal number of alternates. Brazilian Corporate Law and our bylaws provide that, if there is a controlling shareholder, then minority shareholders jointly representing 10% or more of our shares will have the right to elect, in a separate vote, one member of the fiscal council and one alternate.
| 164 |
Members of the fiscal council may not be members of the board of directors, officers or employees of the company or of a controlled company or a company from the same group. Brazilian Corporate Law also requires that members of the fiscal council receive compensation, at a minimum, in the amount of 10% of the average compensation paid to our officers, excluding other benefits.
Audit and Integrity Committee
At our shareholders’ meeting held on April 3, 2014, our shareholders approved the establishment of a permanent audit and integrity committee. Our bylaws provide that the permanent audit and integrity committee shall be comprised of a minimum of three and a maximum of five members, provided that: (i) the majority of the members shall be independent; (ii) at least one of the independent members of the board of directors shall be a member of the audit and integrity committee; (iii) at least one of the audit and integrity committee members shall not be a member of the board of directors; and (iv) none of them can be an officer. The audit and integrity committee are designed to comply with CVM Instruction No. 308, as amended, and to allow us to rely on the exemption from the audit committee requirements of the SEC contained in paragraph (c)(3) of Rule 10A-3 under the Exchange Act. See “Item 16D. Exemptions from the Listing Standards for Audit Committees.”
The audit and integrity committee are an advisory body directly linked to the board of directors. The members of the audit and integrity committee are appointed by the board of directors for terms of two years and will serve for no more than 10 years. At least one of the members of the audit and integrity committee must be a financial specialist, having knowledge of corporate accounting, auditing and finance.
Our audit and integrity committee have the following functions:
| · | opine on the engagement and removal of the independent external auditors for the preparation of the outside independent audit or for any other service; |
| · | monitor the activities of: (i) the independent external auditors to evaluate their independence, the quality and suitability of the services rendered and the annual work plan; (ii) our internal controls department; (iii) our internal audit department; and (iv) of our financial reporting department; |
| · | monitor the quality and integrity of our internal control mechanisms, our quarterly information, our interim and annual financial statements and additional information and metrics published on the basis of adjusted account data and non-accounting data which may incorporate information not typically reported in the financial statements; |
| · | evaluate and monitor our exposure to risk, including requiring detailed information on policies and procedures related to management compensation, the use of our assets and expenses incurred in our name, and integrity (compliance) practices; |
| · | evaluate and monitor, jointly with management and the internal audit department, the policy, suitability and reasoning of transactions with related parties, and internal policies; |
| · | evaluate, monitor and recommend to the board of directors the remediation or improvement of our internal policies, including our Related Parties Transactions Policy; |
| · | evaluate our compliance practices and suggest improvements; |
| · | evaluate and discuss the annual work plan for the independent external auditor and submit it to the board of directors for its assessment; and |
| · | prepare a summarized annual report to be presented together with the financial statements containing a description of its activities, results and conclusions reached and recommendations offered, and any situations where there is significant divergence between our management, the independent external auditors and the audit and integrity committee in relation to our financial statements. |
| 165 |
The audit and integrity committee must also have mechanisms to receive, retain and respond to whistleblower complaints, including of a confidential nature, on matters related to the scope of our internal or external activities, related to the violation of legal provisions and rules applicable to us (including those of an accounting, internal controls and auditing nature), in addition to internal codes and rules, including with provisions for specific procedures for the protection of whistleblowers and the confidentiality of the information.
The audit and integrity committee have a written charter, which was approved by the board of directors and describes in detail the committee’s functions and operating procedures.
Transactions in Which Members of the Board of Directors and Executive Officers Have a Conflict of Interest
Our bylaws contain a specific provision limiting the right of a member of the board of directors to have access to information, participate in the discussions or vote on a proposal, arrangement or contract in which he or she has an interest that conflicts with our interests. In addition, Brazilian Corporate Law prohibits a member of the board of directors or board of executive officers from intervening in any transaction that conflicts with our interests.
Allocation of Net Income and Distribution of Dividends
Calculation of Distributable Amount
At each annual shareholders’ meeting, our board of executive officers and our board of directors are required to recommend how to allocate our net profits, if any, from the preceding fiscal year. This allocation is subject to consideration by our shareholders.
Brazilian Corporate Law defines “net profits” for any fiscal year as net profits after income and social contribution taxes for that fiscal year, net of any accumulated losses from prior fiscal years and any amounts allocated to employees’ and management’s participation in our net profits in such fiscal year. Our bylaws provide that the shareholders may allocate the participation of directors, executive officers and employees on our net profits as follows: up to 10% to employees and up to the limit established under applicable laws to our directors and executive officers.
Our bylaws provide that an amount equal to 25% of our net profits, if any, as reduced by amounts allocated to our legal reserves and contingency reserves, and increased by any reversals of our contingency reserves, if any, must be allocated for dividend distributions in any particular year. This dividend is limited to the realized portion of our net profits, which amount is the minimum mandatory dividend. Such amount must be calculated after excluding the allocation of profits to employees and directors. The calculation of our net profits, allocations to reserves and distributable amounts are determined on the basis of our unconsolidated financial statements prepared in accordance with Brazilian Corporate Law.
Profit Reserve Accounts
The financial statements of corporations constituted under Brazilian law include two principal reserve accounts: profit reserves and capital reserves. Except for the legal reserve, allocations to any reserve are subject to the approval of our shareholders at our annual shareholders’ meetings.
Profit Reserves
Under Brazilian Corporate Law, our profit reserves account is comprised of the legal reserve, unrealized profits reserve, contingency reserve, bylaw reserves and retained earnings reserve. Allocations to each of these reserves (other than the legal reserve) are subject to approval by the company’s shareholders at the annual shareholders’ meeting.
| 166 |
Legal Reserve
Under Brazilian Corporate Law and our bylaws, we are required to maintain a legal reserve to which we must allocate 5% of net profits for each fiscal year until the aggregate amount in the reserve equals 20% of share capital. However, we are not required to make any allocations to legal reserve in a fiscal year in which the legal reserve, when added to the established capital reserves, exceeds 30% of total capital. The amounts to be allocated to such reserve may only be used to increase share capital or to absorb losses but are not available for distribution. This amount must be calculated after excluding the allocation of profits to employees, officers and directors. As of December 31, 2021, we did not have a legal reserve.
Unrealized Profit Reserve
Under Brazilian Corporate Law, the amount by which the distributable amount exceeds realized net profits in a given fiscal year may be allocated to unrealized profits reserves. Brazilian Corporate Law defines realized net profits as the amount by which net profits exceed the sum of: (i) the portion of net income, if any, attributable to earnings and losses of subsidiaries and affiliates accounted for using the equity method of accounting; and (ii) the profits, gains or returns that will be received by company after the end of the next fiscal year. The profits allocated to the unrealized profits reserves must be added to the next mandatory minimum dividend distribution after those profits have been realized, if they have not been used to absorb losses in subsequent periods. As of December 31, 2021, we did not have an unrealized profits reserve.
Contingency Reserve
Under Brazilian Corporate Law, a percentage of net profits may be allocated to a contingency reserve for estimable losses that are considered probable in future years. Any amount so allocated in a prior year must either be reversed in the fiscal year in which the loss had been anticipated if the loss does not occur as projected or be offset in the event that the anticipated loss occurs. As of December 31, 2021, we did not have a contingency reserve.
Bylaw Reserves
Under Brazilian Corporate Law, any corporation may provide in its bylaws for additional reserves, provided that the maximum amount that may be allocated, the purpose and allocation criteria of the reserve are specified. Our bylaws provide for the following additional reserves:
| · | Reserves for increases in capital. 20% of adjusted net profits for each fiscal year must be allocated to reserves for increases in capital until the aggregate amount in such reserve equals 20% of share capital. This amount must be calculated after excluding the allocation of profits to employees, officers and directors. As of December 31, 2021, we did not have increases in capital reserve. |
| · | Expansion reserves. Shareholders may decide at a meeting to retain up to 50% of our net profits to allocate to an expansion reserve, up to a limit of 80% of share capital. This amount must be calculated after excluding the allocation of profits to employees, officers and directors. This reserve is intended to ensure investment in fixed assets or the increase in our working capital. As of December 31, 2021, we did not have an expansion reserve. |
In addition, under the Brazilian Corporate Law, shareholders may decide at a meeting to retain the portion of net profits arising from government donations or subsidies for investment and allocate them to a reserve for tax incentives. This reserve can be excluded from the calculation basis of the mandatory minimum dividends. As of December 31, 2021, we did not have a reserve for tax incentives.
Retained Earnings Reserves
Under Brazilian Corporate Law, our shareholders may decide at a general shareholders’ meeting to retain a portion of our net profits that is provided for in a capital expenditure budget. As of December 31, 2021, we did not have a retained earnings reserve.
| 167 |
Capital Reserves
Under Brazilian Corporate Law, the capital reserve consists of the share premium from the issuance of shares, goodwill reserves from mergers, sales of founders’ shares and sales of subscription warrants. Amounts allocated to our capital reserve are not taken into consideration for purposes of determining the mandatory minimum dividends. We are not allowed to issue founders’ shares. In addition, the remaining balance in the capital reserve may only be used to increase share capital, to absorb losses that surpass accumulated profits and the profit reserves or to redeem, reimburse or purchase shares. As of December 31, 2021, we had a capital reserve of R$141,834 thousand.
Payment of Dividends and Interest on Shareholders’ Equity
The bylaws of a Brazilian company must specify a minimum percentage of profit available for distribution, which must be paid to shareholders as mandatory dividends or as interest on shareholders’ equity. Consistent with Brazilian Corporate Law, our bylaws provide that an amount equal to 25% of our net profits, adjusted as described in “—Allocation of Net Income and Distribution of Dividends” above, must be allocated for dividend distributions or payment of interest on shareholders’ equity in a particular year.
While we are required under Brazilian Corporate Law to pay a mandatory dividend each year, we may suspend the mandatory dividends if our administrative bodies report to our annual shareholders’ meeting that the distribution is incompatible with our financial condition. Our fiscal council, if in operation, must review any suspension of mandatory dividends recommended by our management. In such case, our management would be required to submit a report to the CVM setting forth the reasons for any suspension of dividends. Profits not distributed by virtue of such a suspension are allocated to a special reserve and, if not absorbed by any subsequent losses, are required to be distributed as dividends as soon as our financial condition permits their distribution.
We are able to allocate mandatory dividends in the form of interest on shareholders’ equity, which is deductible when calculating our income tax and social contribution. We have done so in the past and expect to continue to do so in the foreseeable future.
Dividends
We are required by Brazilian Corporate Law and our bylaws to hold an annual shareholders’ meeting no later than the fourth month following the end of each fiscal year at which, among other things, the shareholders must vote to declare an annual dividend. The annual dividend is calculated based on our audited financial statements prepared for the immediately preceding fiscal year.
Any holder of shares on the date the dividend is declared is entitled to receive the dividend. Under Brazilian Corporate Law, dividends are generally required to be paid within 60 days of the declaration date, unless the shareholders’ resolution establishes another date of payment, which, in any case, must occur before the end of the fiscal year in which the dividend is declared.
Our bylaws do not require that we index the amount of any dividend payment to inflation.
Our board of directors may declare interim dividends or interest on shareholders’ equity based on realized profits reflected in semiannual financial statements. The board of directors may also declare dividends based on financial statements prepared for shorter periods, but they cannot exceed the amount of capital reserves. Any payment of interim dividends may be set off against the amount of mandatory dividends relating to the net profits earned in the year in which the interim dividends were paid.
Interest on Shareholders’ Equity
Since January 1, 2006, Brazilian companies are permitted to pay interest on shareholders’ equity and treat those payments as a deductible expense for purposes of calculating Brazilian income tax and social contribution tax. The amount of the deduction is limited to the greater of: (i) 50% of our net profits (after deduction of social contribution and before payment of any interest or any deduction for income taxes) relating to the period to which the payment is made; and (ii) 50% of our accumulated profits. The payment of interest on shareholders’ equity is an alternative to the payment of mandatory dividends. The rate applied in calculating interest on shareholders’ equity cannot exceed the Long-Term Interest Rate (Taxa de Juros de Longo Prazo, or “TJLP”) for the applicable period. The amount distributed to our shareholders as interest on shareholders’ equity, net of any income tax, may be included as part of the mandatory dividends. In accordance with applicable law, we are required to pay to shareholders an amount sufficient to ensure that the net amount they receive in respect of interest on shareholders’ equity, after payment of any applicable withholding tax plus the amount of declared dividends, is at least equivalent to the mandatory dividend amount. For more information, see “E. Taxation—Brazilian Tax Considerations—Income Tax.”
| 168 |
Any payment of interest on shareholders’ equity to holders of common shares or ADRs, whether or not they are Brazilian residents, is subject to Brazilian withholding tax at the rate of 15%, except that a 25% withholding tax rate applies if the recipient is a Tax Haven Resident. A tax haven jurisdiction is a country: (i) that does not impose income tax or whose income tax rate is lower than 20%; or (ii) that does not permit disclosure of the identity of shareholders of entities organized under its jurisdiction. Under our bylaws, we may include the amount distributed as interest on shareholders’ equity, net of any withholding tax, as part of the mandatory dividend amount.
There are no restrictions on our ability to distribute dividends that have been lawfully declared under Brazilian law. However, as with other types of remittances from Brazil, the Brazilian government may impose temporary restrictions on remittances to foreign investors of the proceeds of their investments in Brazil, as it did for approximately nine months in 1989 and early 1990, and on the conversion of Brazilian currency into foreign currencies, which could hinder or prevent the depositary from converting dividends into U.S. dollars and remitting these U.S. dollars abroad.
Statute of Limitations
Our shareholders have three years to claim dividend distributions made with respect to their shares, from the date that we distribute the dividends to our shareholders, after which any unclaimed or not received dividend distributions legally revert to us. We are not required to adjust the amount of any distributions for inflation that occurs during the period from the date of declaration to the payment date.
Withdrawal Rights
Shareholders who dissent from certain actions taken by our shareholders at a shareholders’ meeting have withdrawal rights. Under Brazilian Corporate Law, a shareholder’s withdrawal rights may be exercised in the following circumstances, among others:
| · | spin-off (as described below); |
| · | reduction in our mandatory dividends; |
| · | change in our corporate purpose; |
| · | consolidation with or merger into another company; |
| · | participation in a group of companies (as defined in Brazilian Corporate Law); or |
| · | the acquisition by us of the control of any company if the acquisition price exceeds the limits established in the second paragraph of Article 256 of Brazilian Corporate Law. |
However, under Brazilian Corporate Law, a spin-off will not trigger withdrawal rights unless, as a result:
| 169 |
| · | there is a change in our corporate purpose, except to the extent that the principal business purpose of the entity to which the spun-off assets and liabilities were transferred is consistent with our business purpose; |
| · | there is a reduction in our mandatory dividend; or |
| · | we are made part of a centralized group of companies, as defined in Brazilian Corporate Law. |
In cases where we:
| · | merge into or consolidate with another company; |
| · | participate in a group of companies (as defined in Brazilian Corporate Law); |
| · | participate in a merger of shares; or |
| · | acquire the control of any company if the acquisition price exceeds the limits established in the second paragraph of Article 256 of Brazilian Corporate Law. |
Our shareholders will not be given withdrawal rights if our shares: (i) are “liquid,” which means that they are part of the São Paulo Stock Exchange Index or another traded stock exchange index, as defined by the CVM; or (ii) are widely held, such that our controlling shareholders and their affiliates jointly hold less than 50% of the type or class of shares that are being withdrawn.
The right to withdraw expires 30 days after publication of the minutes of the relevant shareholders’ meeting. We are entitled to reconsider any action giving rise to withdrawal rights for ten days after the expiration of this period if we determine that the redemption of shares of dissenting shareholders would jeopardize our financial stability.
Any shareholder who exercises withdrawal rights is entitled to receive book value for its shares, based on our most recent audited balance sheet approved by our shareholders. However, if the resolution giving rise to the withdrawal rights is made more than 60 days after the date of our most recent balance sheet, a shareholder may request that its shares be valued in accordance with a new balance sheet dated no more than 60 days prior to the date of the resolution. In such case, we are obligated to pay 80% of the refund value of the shares based on the most recent balance sheet approved by our shareholders, and the remaining balance must be paid within 120 days after the date of the resolution at the shareholders’ meeting that gave rise to withdrawal rights based on the new balance sheet.
Redemption
Under Brazilian Corporate Law, we may redeem our shares by a decision taken in an extraordinary shareholders’ meeting by shareholders representing at least 50% of our share capital.
Preemptive Rights
Except as described below, each of our shareholders has a general preemptive right to participate in any issuance of new shares, convertible debentures and warrants, in proportion to its shareholding at such time, but the conversion of debentures and warrants into shares, the granting of options to purchase shares and the issuance of shares as a result of the exercise of options are not subject to preemptive rights.
A period of at least 30 days following the publication of notice of the issuance of shares, convertible debentures or warrants is allowed for the exercise of the preemptive right, and the right may be transferred or disposed of for value. Under the terms of Article 172 of Brazilian Corporate Law and our bylaws, our board of directors may exclude preemptive rights or reduce the exercise period with respect to the issuance of new shares, debentures convertible into our shares and warrants up to the limit of our authorized stock capital if the distribution of those securities is effected through a stock exchange, through a public offering or through an exchange offer for shares in a public offering the purpose of which is to acquire control of another company.
| 170 |
Anti-Takeover Effects of Provisions in Bylaws
Our bylaws contain provisions that have the effect of avoiding concentration of our common shares in the hands of a small group of investors, in order to promote more widespread ownership of our common shares. These provisions require each shareholder who becomes the holder of 33.33% or more of our total share capital to immediately disclose that fact and within 30 days from the date of such event or acquisition, commence a public tender offer to buy all of our outstanding shares in accordance with the CVM and the São Paulo Stock Exchange regulations and our bylaws. These provisions are triggered by the acquisition of beneficial ownership as well as record ownership of our common shares.
These provisions are not applicable to shareholders who become holders of 33.33% or more of our common shares as a result of: (i) statutory succession, provided that the shareholder sells any shares in excess of the 33.33% limit within 60 days of the event; (ii) the merging of another company into us; (iii) the merging of the shares of another company by us; and (iv) the subscription of newly issued shares of the Company, in a single primary issuance approved by our shareholders’ meeting, in accordance with the applicable regulations.
Involuntary capital increases resulting from cancellation of treasury shares or capital reductions with cancellation of shares will not be considered in the calculation of the 33.33% of total shares issued by us.
The public tender offer must be: (i) directed to all of our shareholders; (ii) made through an auction to take place at the São Paulo Stock Exchange; (iii) launched at a fixed price in accordance with the procedure set forth below; and (iv) paid upfront in Brazilian currency. The takeover should be immediately disclosed through a material fact notice, and a public tender offer must be commenced within 30 days from the date of such acquisition or event and must be done with respect to all of our shares for a price per share that may not be less than the greater of: (i) 140% of the average trading price on the stock exchange trading the greatest volume of shares of the capital stock of the Company during the last 120 trading sessions prior to the date on which the public tender offer became obligatory; and (ii) 140% of the average trading price on the stock exchange trading the greatest volume of shares of the capital stock of the Company during the last 30 trading days prior to the date on which the public tender offer became obligatory.
The realization of the public tender offer does not exclude the right of another of our shareholders or of our company to launch a competing public tender offer in accordance with applicable regulations.
Restriction on Certain Transactions by Controlling Shareholders, Directors and Officers
We are subject to the rules of CVM Resolution 44, of August 23, 2021, as amended, relating to the trading of our securities.
Any person, with the purpose of obtaining an advantage, for himself or for others, who has knowledge of material information and knows it has not been disclosed to the market, must abstain from trading our securities, prior to the disclosure of such material information to the market.
For the purposes of CVM Resolution 44, it is assumed that:
| · | the person who traded securities having material information not yet disclosed made use of such information in said trade; |
| · | we, our direct or indirect controlling shareholders, directors, members of our board of directors and of the fiscal council, in relation to business with securities issued by us, have access to all material information not yet disclosed; |
| 171 |
| · | we, our direct or indirect controlling shareholders, directors, members of our board of directors and of the fiscal council, as well as those who have a commercial, professional or trusting relationship with us, having had access to material information not yet disclosed, they know that it is privileged information; |
| · | a member of our management, who leaves our company with relevant and not yet disclosed information makes use of such information if he trades securities issued by us within a period of 3 months from his departure; |
| · | from the moment in which studies or analyzes related to the matter are initiated, information about merger operations, total or partial spin-off, transformation, or any form of corporate reorganization or business combination, change in control, including through the execution, amendment or termination of a shareholders' agreement, decision to cancel our registration or change in the environment or trading segment of the shares issued by us, are considered material information; and |
| · | requests for judicial or extrajudicial recovery and bankruptcy made by us, from the moment studies or analyzes related to such request are initiated, are considered material information. |
Arbitration
In accordance with our bylaws, we, our shareholders, directors and members of our fiscal council agree to resolve through arbitration any disputes or controversies that may arise between us relating to or derived from, in particular, the application, validity, enforceability, interpretation or breach (and its effects) of the provisions under Law No. 6,385/1976, Novo Mercado listing agreement, Novo Mercado rules, our bylaws, Brazilian Corporate Law, the rules published by the CVM, the other rules applicable to the Brazilian capital markets in general, other B3 rules, as well as the rules of the Market Arbitration Chamber of the São Paulo Stock Exchange itself, in each case in accordance with the rules of the Market Arbitration Chamber.
Going-Private Process
We may become private if our controlling shareholder or any company which controls us, directly or indirectly, as the case may be, conducts a public tender offer to acquire all of our outstanding shares in accordance with the rules under the Novo Mercado rules. The offered price per share must be fair and shareholders holding more than 33.33% of the outstanding shares must agree to the public tender offer or otherwise expressly agree to voluntarily exit the Novo Mercado without the effective sale of shares. The voluntary exit from the Novo Mercado may occur regardless of the public tender offer, if approved by shareholders in a meeting pursuant to the rules and conditions of the Novo Mercado rules.
The compulsory exit from the Novo Mercado must be preceded by a public tender offer pursuant to the CVM rules. Our shares will remain listed under the Novo Mercado segment for an additional six months in the event the minimum percentage for delisting is not reached after completion of the public tender offer. In addition, we will remain subject to other penalties that may be imposed by B3.
Delisting from the Novo Mercado
Our delisting from the Novo Mercado, either by voluntary or compulsory action or by virtue of a corporate restructuring, shall observe the rules contained in the Regulation of the Novo Mercado. At any time, we may delist our shares from the Novo Mercado, provided that a public tender offer for the acquisition of our outstanding shares is carried out.
Such tender offer shall observe the procedures provided in the regulation issued by CVM on the tender offer for the cancellation of registration as a publicly held company, including the following requirements: (i) the price offered shall be fair, and a request of new valuation of us shall be in the form established in Brazilian Corporate Law; and (ii) shareholders holding more than 1/3 of the outstanding shares shall accept the tender offer or expressly agree with the delisting from the Novo Mercado without the effective sale of the shares.
| 172 |
The voluntary delisting from the Novo Mercado may occur regardless of the completion of the tender offer mentioned above in the event of a waiver approved at a General Shareholders’ Meeting, which must observe the rules and conditions of the Regulation of the Novo Mercado. The compulsory delisting from the Novo Mercado shall be preceded by a tender offer that observes the procedures provided in the regulation issued by CVM on public tender offers for purchases of shares for cancellation of registration of a publicly held company and the requirements established in Article 43 of our bylaws. Our shares will remain listed under the Novo Mercado segment for an additional six months in the event the minimum percentage for delisting is not reached after completion of the public tender offer. In addition, we will remain subject to other penalties that may be imposed by B3.
With the exception of tender offers related to delisting from the Novo Mercado or cancelling the registration of a publicly held company, the unified tender offer may only be initiated by a shareholder who holds an amount equal or higher than 33.33% of our total shares, observing the minimum price to be paid per share established in Article 41 of our bylaws.
Change of Control
Under the rules of the Novo Mercado, the direct or indirect sale of our control, in one transaction or in a series of transactions, creates an obligation by the acquirer to complete, subject to applicable regulations, a public tender offer for the acquisition of all other outstanding shares on the same terms and conditions granted to the selling controlling shareholder.
The change of control concept provided for in our bylaws and the situations in which the acquiring shareholder is required to make a public tender offer includes and may be broader than the concepts and situations provided for in Brazilian Corporate Law and in the Novo Mercado rules.
The acquirer must take all necessary measures to reconstitute the minimum percentage of the free float required under the Novo Mercado regulations within eighteen months of the acquisition.
Our bylaws contain provisions that may discourage, delay or make more difficult a change in control of our company or removal of our directors. For more information, see “Item 10. Additional Information––B. Memorandum and Articles of Association–– Anti-Takeover Effects of Provisions in Bylaws.”
Holders of 33.33% or More of Our Shares
Any person who acquires or becomes a shareholder through an offering for quantities of shares equal to or greater than 33.33% of the total issued shares should undertake or apply for registration of a takeover bid of all shares of our offering and should comply with CVM rules, the regulations of the São Paulo Stock Exchange, and the provisions of our bylaws.
The takeover should be immediately disclosed through a material fact notice, and a public tender offer must be commenced within 30 days from the date of such acquisition or event and must be done with respect to all of our shares for a price per share that may not be less than the greater of: (i) 140% of the average trading price on the stock exchange trading the greatest volume of shares of our capital stock during the last 120 trading sessions prior to the date on which the public tender offer became obligatory; and (ii) 140% of the average trading price on the stock exchange trading the greatest volume of shares of our capital stock during the last 30 trading days prior to the date on which the public tender offer became obligatory.
These provisions are not applicable to shareholders who become holders of 33.33% or more of our common shares as a result of: (i) statutory succession, provided that the shareholder sells any shares in excess of the 33.33% limit within 60 days of the event; (ii) the merging of another company into us; (iii) the merging of the shares of another company by us; and (iv) the subscription of newly issued shares of the Company, in a single primary issuance approved by our shareholders’ meeting, in accordance with the applicable regulations.
For a detailed description of the procedures applicable to takeover bid by increased participation, see our bylaws filed as exhibit 1.01 to this annual report.
| 173 |
Suspension of Rights of Acquiring Shareholder for Violation of Our Bylaws
In the event an acquiring shareholder violates the provisions of our bylaws regarding the need to conduct a public offer as a result of a change of control or of the purchase of shares representing 33.3% or more of our share capital, the rights of such acquiring shareholder may be suspended by a decision taken at our shareholders’ meeting. If such a violation occurs, we must hold a shareholders’ meeting and the acquiring shareholder will not be entitled to vote at such meeting.
Purchases of Our Shares by Our Company
Our bylaws entitle our board of directors to approve the acquisition of our shares, except when approval by the shareholders is mandatory pursuant to CVM rules. The acquisition of our shares for cancellation or maintenance in treasury may not, among other actions:
| · | be used to purchase shares of the controlling shareholder; |
| · | be carried out in organized markets at a price greater than market price; |
| · | be carried out during a public tender offer for the acquisition of shares issued by us; |
| · | require the use of resources greater than those available, pursuant to the CVM rules; |
| · | create, directly or indirectly, any artificial demand, supply or share price condition, or use any unfair practice as a result of any action or omission; or |
| · | be carried out when there is a material information not yet disclosed to the market. |
The decision to purchase our own shares, when taken by the board of directors, which must specify, among other information: (i) the purpose and economic effects of the purchase; (ii) the amount of shares to be purchased; (iii) price; (iv) impacts on the shareholding structure; (v) maximum term for the liquidation of the purchase; (vi) intermediary institutions, if any; and (vii) the reasons why the board believes the purchase will not affect the compliance with obligations with creditors or the payment of mandatory dividends.
We cannot hold in treasury more than 10% of our total shares, including the shares held by our subsidiaries and affiliates.
Reporting Requirements
We are subject to the reporting requirements established by Brazilian Corporate Law and the regulations of the CVM. In addition, as a result of our listing on the Novo Mercado, we must meet the reporting requirements of the Novo Mercado rules.
Information Required by the CVM
Brazilian securities regulations require that a publicly held corporation must provide the CVM and the relevant stock exchanges with the following periodic information, among others:
| · | financial statements prepared in accordance with IFRS and related management, fiscal council, audit and integrity committee and auditors’ reports, within three months from the end of its fiscal year or on the date in which they are published or made available to shareholders, whichever occurs first, together with the Demonstrações Financeiras Padronizadas (a report on a standard form containing financial information derived from our financial statements required to be filled out by us and filed with the CVM). Due to subsequent events, the consolidated financial statements included herein differ from those filed with the CVM, as detailed in note 1.7 to our consolidated financial statements; |
| 174 |
| · | notices of our annual shareholders’ meeting on the date of its publication; |
| · | a summary of the decisions taken at the annual general shareholders’ meeting on the day the meeting is held; |
| · | a copy of the minutes of the annual shareholders’ meeting within seven business days of its occurrence; |
| · | report on good governance practices, pursuant to the Brazilian Code of Corporate Governance for Publicly Listed Companies (Código Brasileiro de Governança Corporativa - Companhias Abertas); |
| · | Formulário de Referência – a report on a standard form containing annual corporate, business, and selected financial information, five months from the end of our fiscal year; and we must update this document in accordance with Instructions 480 and 481 of the CVM; |
| · | Informações Trimestrais – ITR (a report on a standard form containing quarterly corporate, business and financial information), together with a special review report issued by our independent auditor, within 45 days from the end of each quarter (except for the last quarter of each year) or upon disclosure of such information to the public if it occurs within 45 days from the end of the relevant quarter. |
In addition to the foregoing, we must also file with the CVM and the São Paulo Stock Exchange the following information, among others:
| · | a notice of any extraordinary shareholders’ meeting on the same date it is published; |
| · | a summary of the decisions taken at any extraordinary shareholders’ meetings on the day the meeting is held; |
| · | minutes of any extraordinary shareholders’ meeting within seven business days of the date the meeting occurred; |
| · | minutes of board of directors' meetings, whenever its decisions are to be effective in relation to third parties; |
| · | a copy of any shareholders’ agreement within seven business days it is filed with us; |
| · | any press release giving notice of material facts, on the same date it is published in the press; |
| · | information on any filing for plan of reorganization, as well as a copy of any judicial decision on such request, on the same date it is filed and, on the date, we take notice of the judicial decision, respectively; |
| · | request for bankruptcy, on the same day that we become aware of such requests; and |
| · | a copy of any judicial decision granting a bankruptcy request and appointing of a bankruptcy trustee, on the date we become aware of it. |
Information Required by the São Paulo Stock Exchange from Companies Listed on the Novo Mercado
Our shares have been listed to trade on the Brazilian Securities and Derivatives Stock Exchange special listing segment named Novo Mercado, of B3. Accordingly, we, our shareholders, directors, officers and members of our fiscal council (if active) are bound by B3’s Novo Mercado Listing Rules. Whenever a provision of our bylaws is detrimental to our shareholders who may benefit from any tender offer, the Novo Mercado Regulations shall prevail over the provisions of the bylaws.
| 175 |
As a Novo Mercado company, we must observe the following additional disclosure requirements, among others:
| · | we must publish the internal rules of our board of directors and its advisory committees, and of the fiscal council; |
| · | we must inform the market that an officer or a director has resigned or has been removed; |
| · | we must publish statements of material facts, information on earnings and press releases of our results in English; |
| · | we must make a public presentation on our quarterly results and on our financial statements within five (5) days of their publishing; and |
| · | we must make a calendar available up to December 10th each year with the dates of the following events: (i) publishing of our financial statements and our standardized financial statements (DFP); (ii) publishing of our quarterly information (ITR); (iii) ordinary general shareholders’ meeting; and (iv) filing of our Formulário de Referência (FR). |
Information Regarding Any Trading Carried Out by Any Controlling Shareholders, Members of Our Board of Directors, Our Board of Executive Officers or Members of Our Fiscal Council
Pursuant to the rules of the CVM and the Novo Mercado, any controlling shareholders, officers, directors, members of the fiscal council, if active, and members of any other technical or advisory committee created by our bylaws, must disclose to us, the CVM and the São Paulo Stock Exchange information in connection with the total amount and characteristics of our securities owned, directly or indirectly, or any derivatives with reference to such securities, as well as any subsequent trading of such securities and derivatives. In the case of individuals, this information must also include securities held by the spouse, companion or dependents of such persons and be included in the annual income tax statement of the controlling shareholder, officer, director or member of the fiscal council. This information must be communicated to the CVM and the São Paulo Stock Exchange by the Investor Relations Officer within ten days after the end of each month.
In addition, our shareholders who have caused the election of members of our board of directors or fiscal council, as well as any individual, legal entity or group of persons acting jointly to conduct relevant negotiations (i.e., transactions by means of which the direct or indirect equity of such persons surpasses, upwards or downwards, 5%, 10%, 15% and so on of the specie or class of shares that represent our capital stock) must provide to us, the CVM and the São Paulo Stock Exchange the following information:
| · | the name and qualifications of the person acquiring the shares or other securities, with their respective enrollment number before the Taxpayers’ Registry; |
| · | the number of shares and other securities and derivative financial instruments benchmarked on such shares, either physically or financially settled, informing the amount, class and type of the benchmarked shares; |
| · | the reason and purpose of the acquisition containing, if applicable, statement that such negotiations do not intend to modify our equity or management structure; |
| · | information on any agreement regarding the exercise of voting rights or the purchase and sale of our securities; and |
| 176 |
| · | in case the shareholder is resident or domiciled abroad, the name or corporate name and the Taxpayer enrollment number of its attorney or legal representative in the country. |
Disclosure of Material Developments
According to Law No. 6,385 of December 7, 1976 and subsequent amendments, the rules published by the CVM, and our Policy on Disclosure of Material Acts or Facts and Trading of Securities we must disclose any material development related to our business to the CVM and to the São Paulo Stock Exchange and must publish a notice of the material development. A development is deemed to be material if it impacts the price of our securities, the decision of investors to trade in our securities or the decision of investors to exercise any rights as holders of any of our securities. Under special circumstances, we may request confidential treatment of certain material developments from the CVM when our management believes that public disclosure could result in adverse consequences to us.
Annual Calendar
Novo Mercado regulations require that companies and their management, by December 10 of each year, disclose an annual calendar, and send a copy to the São Paulo Stock Exchange, containing the dates for the following events: (i) the publishing of our financial statements and our standardized financial statements (DFP); (ii) the publishing of our quarterly financial information (ITR); (iii) our ordinary general shareholders’ meeting; and (iv) the filing of our Formulário de Referência (FR). Amendments to the calendar must be communicated to the São Paulo Stock Exchange.
Trading on Stock Exchanges
Our shares trade on the Novo Mercado segment of the São Paulo Stock Exchange under the symbol “BRFS3.” The CVM and the São Paulo Stock Exchange have discretionary authority to suspend trading of the shares of a particular issuer under certain circumstances.
The São Paulo Stock Exchange operates a central clearing system. A holder of our shares may choose, in its discretion, to participate in this system and elect all shares to be deposited in the custody of the São Paulo Stock Exchange (through a Brazilian institution duly authorized by the Central Bank and with a clearing account with the São Paulo Stock Exchange). The fact that those shares are held in the custody of the São Paulo Stock Exchange will be reflected in our register of shareholders. Each participating shareholder will, in turn, be registered in our register of beneficial shareholders maintained by the São Paulo Stock Exchange and will be treated in the same way as registered shareholders.
Agreements within Our Group
According to CVM Instruction no. 480, we must disclose and send the São Paulo Stock Exchange information relating to any agreements entered into by our company with our controlled companies and affiliates, officers and any controlling shareholders, and, moreover, any agreements entered into by our company with controlled companies and affiliates of the officers and controlling shareholders as well as other companies that, together with these persons, compose a single group, in fact or in right, provided that such agreements, whether or not they involve one single agreement or successive agreements or the same or different purposes, in the explanatory notes.
The information disclosed should include a description of the purpose of the material contract, its term, value, termination provisions and any influence that this agreement may have over the management and operations of our company.
| 177 |
Regulation of Foreign Investment
Investors residing outside Brazil, including institutional investors, are authorized to purchase equity instruments, including our common shares, on the São Paulo Stock Exchange, provided that they comply with the registration requirements set forth in Resolution No. 4,373 and CVM Instruction No. 560.
With certain limited exceptions, Resolution No. 4,373 investors are permitted to carry out any type of transaction in the Brazilian capital markets involving a security traded on a stock, future or organized over-the-counter market, but may not transfer the ownership of investments made under Resolution No. 4,373 to other non-Brazilian holders through private transactions. Investments and remittances outside Brazil of gains, dividends, profits or other payments under our common shares are made through the foreign exchange market.
In order to become a Resolution No. 4,373 investor, an investor residing outside Brazil must:
| · | appoint at least one representative in Brazil who will be responsible for complying with registration and reporting requirements and procedures with the Central Bank and the CVM, which shall be a financial institution or institution authorized by Central Bank to operate in Brazil. |
| · | register as a foreign investor with the CVM; and |
| · | appoint at least one custodian duly authorized by CVM. |
Securities and other financial assets held by foreign investors pursuant to Resolution No. 4,373 must be registered or maintained in deposit accounts or under the custody of an entity duly licensed by the Central Bank or the CVM. In addition, securities trading by foreign investors is generally restricted to transactions on the São Paulo Stock Exchange or in organized over-the-counter markets licensed by the CVM.
| C. | Material Contracts |
For the two years immediately preceding the publication of this annual report, we were not a party to any material contract outside the ordinary course of business, except for the M&A contracts described in Item 4. Information on the Company—A. History and Development of the Company.
| D. | Exchange Controls |
Brazilian law provides that, whenever there is a significant imbalance in Brazil’s balance of payments or reasons to foresee such an imbalance, temporary restrictions may be imposed on remittances of foreign capital abroad. For approximately six months in 1989 and early 1990, for example, with the goal of preserving Brazil’s foreign currency reserves, the Brazilian government froze all dividend and capital repatriations that were owed to foreign equity investors and held by the Central Bank. These amounts were subsequently released in accordance with Brazilian government directives. There can be no assurance, however, that the Brazilian government may not take similar measures in the future.
There are no restrictions on ownership of our capital share by individuals or legal entities domiciled outside Brazil. However, the right to convert dividend payments and proceeds from the sale of common shares into foreign currency and to remit such amounts outside Brazil is subject to exchange control restrictions and foreign investment legislation that generally requires, among other things, obtaining an electronic registration under the Resolution No. 4,373. Under such resolution, qualified foreign investors registered with the CVM and acting through authorized custody accounts managed by local agents may buy and sell shares on Brazilian share exchanges without obtaining separate electronic registration for each transaction. Investors under the Resolution No. 4,373 are also generally entitled to favorable tax treatment.
Electronic registrations by the Brazilian Central Bank have been issued in our name with respect to our ADRs. Pursuant to the electronic registration, the custodian will be able to convert dividends and other distributions with respect to the shares represented by our ADRs into foreign currency and remit the proceeds outside Brazil.
| 178 |
| E. | Taxation |
The following summary contains a description of certain Brazilian and U.S. federal income tax consequences of the acquisition, ownership and disposition of common shares or ADRs, but it does not purport to be a comprehensive description of all the tax considerations that may be relevant to a decision to purchase common shares or ADRs. The summary is based upon the tax laws of Brazil and regulations thereunder and on the tax laws of the United States and regulations thereunder as in effect on the date of this annual report, which are subject to change. Prospective purchasers of common shares or ADRs should consult their own tax advisors as to the tax consequences of the acquisition, ownership and disposition of common shares or ADRs.
Although there is at present no tax treaty to avoid double taxation between Brazil and the United States, the tax authorities of the two countries have had discussions that may culminate in such a treaty. No assurance can be given, however, as to whether or when a treaty will enter into force or how it will affect the U.S. holders (as defined below under “—U.S. Federal Income Tax Considerations”) of common shares or ADRs. Prospective holders of common shares or ADRs should consult their own tax advisors in order to clarify the tax consequences of the acquisition, ownership and disposition of common shares or ADRs in their particular circumstances.
Brazilian Tax Considerations
The following discussion summarizes the material Brazilian tax consequences of the acquisition, ownership and disposition of common shares or ADRs by a holder that is not domiciled in Brazil for purposes of Brazilian taxation (a “Non-Resident Holder”) and does not specifically address all the Brazilian tax considerations applicable to any particular Non-Resident Holder. Each Non-Resident Holder should consult its own tax adviser concerning the Brazilian tax consequences of an investment in common shares or ADRs. The information below is based on Brazilian law as currently in effect. Any change in that law may change the consequences described below.
Income Tax
Dividends. Dividends paid by a Brazilian corporation, such as ourselves, including stock dividends and other dividends paid to a Non-Resident Holder of common shares or ADRs, are currently not subject to Brazilian withholding income tax, as far as such amounts are related to profits generated on or after January 1, 1996. Dividends relating to profits generated prior to January 1, 1996 may be subject to Brazilian withholding tax at varying rates, depending on the year the profits were generated.
Interest on Shareholders’ Equity. Law No. 9,249, dated as of December 26, 1995, as amended, permits a Brazilian corporation to make distributions to shareholders of interest on shareholders’ equity. These distributions may be paid in cash. Such payments represent a deductible expense from the payer’s corporate income tax and social contribution on net profits tax basis. For tax purposes, this interest is limited to the daily pro rata variation of the TJLP (the Brazilian government's long-term interest rate), as determined by Brazilian Central Bank from time to time, and may not exceed the greater of:
| · | 50% of net income (after the social contribution on net profits tax, and before the provision for corporate income tax and the amounts attributable to shareholders as interest on shareholders’ equity) for the period in respect of which the payment is made; and |
| · | 50% of the sum of retained profits and profit reserves as of the date of the beginning of the period in respect of which the payment is made. |
Payment of interest to a Non-Resident Holder is subject to withholding income tax at the rate of 15%, or 25% if the Non-Resident Holder is resident of a tax haven. For this purpose, a “tax haven” is a country or location that does not impose income tax, where the income tax rate is lower than 20% or where the local legislation imposes restrictions on disclosing the shareholding composition or the ownership of the investment. These payments of interest on shareholders’ equity may be included as part of mandatory dividends.
| 179 |
We recommend prospective investors to consult their own tax advisors from time to time to verify any possible tax consequences arising from Normative Instruction No. 1,037/2010 (that provides an exhaustive list of all jurisdictions considered by Brazilian legislation as “tax havens.”
Distributions of interest on shareholders equity to Non-Resident Holders may be converted into U.S. dollars and remitted outside Brazil, subject to applicable exchange controls, to the extent that the investment is registered with the Brazilian Central Bank.
Gains
According to Law No. 10,833/03, capital gains recognized by Non-Resident Holders on the disposition of assets located in Brazil, such as common shares are subject to income tax in Brazil. This rule is applicable regardless of whether the disposition is conducted in Brazil or abroad or if the disposition is or is not made to an individual or entity resident or domiciled in Brazil.
Generally, capital gains realized as a result of a disposition transaction are the positive difference between the amount realized on the disposition of the common shares and the respective acquisition cost.
Capital gains realized by Non-Resident Holders on the disposition of common shares sold on the Brazilian stock exchange (which includes the transactions carried out on the organized over-the-counter market) are subject to the following taxes:
| · | 0% income tax with respect to gains realized by a Non-Resident Holder that (i) is a Registered Holder (according to Resolution 4,373 from Brazilian Central Bank) and (ii) is not a Tax Haven Resident; |
| · | income tax at a rate of 15% with respect to gains realized by a Non-Resident Holder that is neither a Registered Holder nor a Tax Haven Resident. |
| · | income tax at a rate of 15% with respect to gains realized by a Non-Resident Holder that is a Tax Haven Resident if such holder is a Registered Holder. For Non-Registered holders domiciled in a Tax Haven withholding income tax should be applied at a 25% rate. In addition, a withholding income tax of 0.005% will apply and can be offset against any income tax due on the capital gain, except in the case of a Registered Holder that is not resident or domiciled in a tax haven jurisdiction. |
Any other gains realized on the disposition of common shares that are not carried out on the Brazilian stock exchange:
| · | are subject to income tax at the following progressive rates when realized by any Non-Resident Holder that is not a Tax Haven Resident, whether or not such holder is a Registered Holder: |
| i. | 15% upon the portion of capital gains not exceeding R$5,000,000.00; |
| ii. | 17.5% upon the portion of capital gains that exceeds R$5,000,000.00 but not exceeding R$10,000,000.00; |
| iii. | 20% upon the portion of capital gains that exceeds R$10,000,000.00 but not exceeding R$30,000,000.00; and |
| iv. | 22.5% upon the portion of capital gains that exceeds R$30,000,000.00. |
| · | are subject to income tax at a rate of 25% when realized by Non-Resident that is a Tax Haven Resident, whether or not such holder is a Registered Holder. |
In the cases described above, if the gains are related to transactions conducted on the Brazilian non-organized over-the-counter market with intermediation, the withholding income tax of 0.005% shall also be applicable and can be offset against any income tax due on the capital gain.
| 180 |
Any exercise of preemptive rights relating to common shares will not be subject to Brazilian withholding income tax. Gains realized by a Non-Resident Holder on the disposition of preemptive rights will be subject to Brazilian income tax according to the same rules applicable to disposition of common shares.
In the case of a redemption of common shares or a capital reduction, the positive difference between the amount received by the Non-Resident Holder and the acquisition cost of the common shares redeemed in reais is treated as capital gain derived from the sale or exchange of shares not carried out on a Brazilian stock exchange market and is therefore subject to income tax at the above-mentioned progressive rate, or 25%, as the case may be.
There can be no assurance that the current favorable tax treatment of Registered Holders will continue in the future.
Sale of ADRs by U.S. holders to Other Non-Residents in Brazil
As discussed above, the sale of property located in Brazil involving Non-Resident Holders is subject to Brazilian withholding income tax. Our understanding is that ADRs do not qualify as property located in Brazil and, thus, should not be subject to the Brazilian withholding tax. Insofar as the regulatory norm referred to in Article 26 of Law No. 10,833/03 is generic and has not been tested through the administrative or judicial courts, we are unable to assure the final outcome of such discussion.
Gains on the Exchange of ADRs for Common Shares
Although there is no clear regulatory guidance, the exchange of ADRs for common shares should not be subject to Brazilian withholding tax. Non-Resident Holders may exchange the ADSs evidenced by ADRs for the underlying common shares, sell the common shares on a Brazilian stock exchange and remit abroad the proceeds of the sale within five business days from the date of exchange (in reliance on the depositary’s electronic registration) with no tax consequences.
Upon receipt of the underlying common shares in exchange for ADSs evidenced by ADRs, Non-Resident Holders may also elect to register with the Brazilian Central Bank the U.S. dollar value of such common shares as a foreign portfolio investment under Resolution 4,373, which will entitle them to the tax treatment discussed above.
Alternatively, the Non-Resident Holder is also entitled to register with the Brazilian Central Bank the U.S. dollar value of such common shares as a foreign direct investment under Law 4,131/62, in which case the respective sale would be subject to the tax treatment applicable to transactions carried out on the Brazilian stock exchange.
Gains on the Exchange of Common Shares for ADRs
The deposit of common shares in exchange for ADRs may be subject to Brazilian withholding income tax on capital gains if the amount previously registered with the Central Bank as a foreign investment in common shares or, in the case of other market investors under Resolution No. 4,373, the acquisition cost of the common shares, as the case may be, is lower than:
| · | the average price per common share on the Brazilian stock exchange on which the greatest number of such common shares were sold on the day of deposit; or |
| · | if no common shares were sold on that day, the average price on the Brazilian stock exchange on which the greatest number of common shares were sold during the 15 preceding trading sessions. |
The difference between the amount previously registered, or the acquisition cost, as the case may be, and the average price of the common shares, calculated as set forth above, is considered a capital gain subject to income tax at the above-mentioned progressive rate from 15% to 22.5%, or 25% for Tax Haven Residents.
| 181 |
Tax on Foreign Exchange and Financial Transactions (“IOF”)
Brazilian law imposes a tax on financial transactions involving foreign exchange, securities, credit and insurance. The rate of IOF applicable on foreign exchange transactions (“IOF exchange”) involving common shares is currently 0%, but the Minister of Finance is permitted to prospectively increase such rate at any time up to 25%.
IOF may also be levied on transactions involving bonds and securities (“IOF securities”), including those carried out on a Brazilian stock, futures or commodities exchanges. The rate of the IOF securities applicable to most transactions involving common shares is currently 0%, but the Brazilian government may also prospectively increase the rate of the IOF up to 1.5% per day at any time.
Other Brazilian Taxes
There are no Brazilian inheritance, gift or succession taxes applicable to the ownership, transfer or disposition of common shares or ADRs, except for gift and inheritance taxes imposed by some Brazilian states on gifts or bequests by individuals or entities not domiciled or residing in Brazil to individuals or entities domiciled or residing within such states. There are no Brazilian stamp, issue, registration or similar taxes or duties payable by holders of common shares or ADRs.
U.S. Federal Income Tax Considerations
The following summary describes certain U.S. federal income tax consequences of the acquisition, beneficial ownership and disposition of our common shares and ADRs as of the date of this annual report.
Except where noted, this summary deals only with U.S. holders (as defined below) that hold our common shares or ADRs as capital assets for U.S. federal income tax purposes (generally, property held for investment). As used in this summary, the term “U.S. holder” means a holder of our common shares or ADRs that is for U.S. federal income tax purposes:
| · | an individual citizen or resident of the United States; |
| · | a corporation (or other entity treated as a corporation for U.S. federal income tax purposes) created or organized in or under the laws of the United States, any state thereof, or the District of Columbia; |
| · | an estate the income of which is subject to U.S. federal income taxation regardless of its source; or |
| · | a trust, if it (i) is subject to the primary supervision of a U.S. court and one or more U.S. persons have the authority to control all substantial decisions of the trust; or (ii) has a valid election in effect under applicable U.S. Treasury regulations to be treated as a U.S. person for U.S. federal income tax purposes. |
A “non-U.S. holder” is a beneficial owner of our common shares or ADRs that is neither a U.S. holder nor a partnership for U.S. federal income tax purposes.
This summary does not represent a detailed description of the U.S. federal income tax consequences applicable to you if you are subject to special treatment under the U.S. federal income tax laws, including if you are:
| · | a broker or dealer in securities or currencies; |
| · | a bank or other financial institution; |
| · | a regulated investment company; |
| · | a real estate investment trust; |
| 182 |
| · | a holder who holds our common shares or ADRs in a retirement account or other tax-deferred account; |
| · | an insurance company; |
| · | a tax-exempt organization; |
| · | a holder who holds our common shares or ADRs as part of a hedging, integrated or conversion transaction or a straddle; |
| · | a holder deemed to sell our common shares or ADRs under the constructive sale provisions of the U.S. Internal Revenue Code of 1986, as amended (the “Code”); |
| · | a trader in securities that has elected the mark-to-market method of accounting for your securities; |
| · | a holder liable for alternative minimum tax; |
| · | a holder who owns or is deemed to own 10% or more of our stock (by vote or value); |
| · | a controlled foreign corporation or a passive foreign investment company; |
| · | a partnership or other pass-through entity for U.S. federal income tax purposes; |
| · | a holder who is required to accelerate the recognition of any item of gross income with respect to our common shares or ADRs as a result of such income being recognized on an applicable financial statement; |
| · | a holder who is a U.S. expatriate, former U.S. citizen or former long-term resident of the United States; or |
| · | a holder whose “functional currency” for U.S. federal income tax purposes is not the U.S. dollar. |
The discussion below is based upon the provisions of the Code, existing and proposed income tax regulations issued under the Code and judicial decisions and administrative rulings thereunder, all as of the date of this annual report. All of the foregoing is subject to be replaced, revoked or modified at any time, and any such action could be retroactive and could affect the accuracy of this discussion. This discussion is not binding on the IRS or the courts, and there can be no assurance that the IRS or a court will not take a different position concerning the U.S. federal income tax consequences of an investment in our common shares or ADRs or that any such position would not be sustained. In addition, this summary is based, in part, upon representations made by the depositary to us and assumes that the deposit agreement relating to the ADRs, and all other related agreements, will be performed in accordance with their terms.
If a partnership (including for this purpose any entity treated as a partnership for U.S. federal income tax purposes) holds our common shares or ADRs, the U.S. tax treatment of a partner will generally depend upon the status of the partner and the activities of the partnership. If you are a partner of a partnership holding our common shares or ADRs, you should consult your tax advisors.
This summary does not contain a detailed description of all the U.S. federal income tax consequences to you in light of your particular circumstances and does not address the Medicare tax on net investment income, U.S. federal non-income tax laws, such as U.S. federal estate and gift tax laws, or the effects of any state, local or non-United States tax laws. If you are considering the purchase, beneficial ownership or disposition of our common shares or ADRs, you should consult your own tax advisors concerning the U.S. federal income tax consequences to you in light of your particular situation, as well as any consequences arising under the laws of any other taxing jurisdiction.
| 183 |
ADRs
If you hold ADRs, for U.S. federal income tax purposes, you generally will be treated as the owner of the underlying common shares that are represented by the ADSs evidenced by ADRs. Accordingly, deposits or withdrawals of common shares for ADRs will not be subject to U.S. federal income tax. The U.S. Department of Treasury has expressed concerns that intermediaries in the chain of ownership between the holder of an ADS and the issuer of the security underlying the ADS may be taking actions that are inconsistent with the claiming of foreign tax credits for U.S. holders of ADSs. Accordingly, the credibility of foreign taxes, if any, as described below, could be affected by actions taken by intermediaries in the chain of ownership between the holder of an ADS and us.
Taxation of Dividends
Subject to the discussion under “—Passive Foreign Investment Company” below, if you are a U.S. holder, the gross amount of distributions on ADRs or our common shares (including amounts withheld to reflect Brazilian withholding taxes and distributions of interest on shareholders’ equity, as described above under “—Brazilian Tax Considerations”) will be taxable to you as dividends, to the extent paid out of our current or accumulated earnings and profits, as determined under U.S. federal income tax principles. Such income (including withheld taxes) will be includable in your gross income as ordinary income on the day actually or constructively received by you, in the case of our common shares, or by the depositary, in the case of ADRs. Such dividends will not be eligible for the dividends received deduction generally allowed to U.S. corporations in respect of dividends received from other U.S. or, in certain circumstances, non-U.S. corporations.
With respect to non-corporate U.S. holders, certain dividends received from a qualified foreign corporation may be subject to reduced rates of taxation so long as certain holding period and other requirements are met. Subject to certain limitations, a foreign corporation generally is treated as a qualified foreign corporation if its shares (or ADRs backed by such shares) are readily tradable on an established securities market in the United States, such as the NYSE, and such corporation is not a PFIC (as discussed below under “— Passive Foreign Investment Company”) in the taxable year in which dividends are paid or in the preceding taxable year. U.S. Treasury Department guidance indicates that our ADRs (which are listed on the NYSE), but not our common shares, are readily tradable on an established securities market in the United States. Thus, although we believe that dividends received with respect to ADRs currently meet the conditions required for those reduced tax rates, we do not believe that dividends received with respect to common shares (rather than ADRs) currently meet the conditions required for those reduced tax rates. We cannot assure you that our ADRs will be considered readily tradable on an established securities market in later years. Additionally, even if we are a qualified foreign corporation, the reduced rates on dividends will apply only if such dividends are paid with respect to the ADRs that a non-corporate U.S. holder has held for at least 61 days during the 121-day period beginning 60 days before the “ex-dividend date.” Also, regardless of our status as a qualified foreign corporation, the reduced rates will not apply if a non-corporate U.S. holder elects to treat the dividend income as “investment income” for purposes of the investment interest expense limitations of Section 163(d) of the Code. In addition, the rate reduction will not apply to a dividend if the recipient of the dividend is obligated (whether pursuant to a short sale or otherwise) to make related payments with respect to positions in substantially similar or related property. This disallowance applies even if the minimum holding period has been met. The dividend rules are complex, and you should consult your own tax advisors regarding the application of these rules given your particular circumstances.
The amount of any dividend paid in reais will equal the U.S. dollar value of the reais received calculated by reference to the exchange rate in effect on the date the dividend is received by you, in the case of common shares, or by the depositary, in the case of ADRs, regardless of whether the reais are converted into U.S. dollars. If the reais received as a dividend are converted into U.S. dollars on the date they are received, you generally will not be required to recognize foreign currency gain or loss in respect of the dividend income. If the reais received as a dividend are not converted into U.S. dollars on the date of receipt, you will have a basis in the reais equal to their U.S. dollar value on the date of receipt. Any gain or loss of a U.S. holder realized on a subsequent conversion or other disposition of the reais generally will be treated as U.S. source ordinary income or loss.
Subject to certain conditions and limitations, if you are a U.S. holder of our common shares or ADRs, Brazilian withholding taxes on distributions (including distribution of interest on shareholders’ equity) paid to you with respect to the common shares or ADRs generally will be treated as foreign taxes eligible for credit against your U.S. federal income tax liability. For purposes of calculating the foreign tax credit, dividends paid on ADRs or our common shares will be treated as income from sources outside the United States and will generally constitute passive category income. In addition, in certain circumstances, if you have held ADRs or common shares for less than a specified minimum period during which you are not protected from risk of loss or are obligated to make payments related to the dividends, you will not be allowed a foreign tax credit for foreign taxes imposed on dividends paid on ADRs or common shares. The rules governing foreign tax credits are complex. You are urged to consult your tax advisors regarding the availability of the foreign tax credit under your particular circumstances. Instead of claiming a credit, you may, at your election, deduct such otherwise creditable Brazilian withholding taxes in computing your taxable income, but only for a taxable year in which you elect to do so with respect to all foreign income taxes paid or accrued in such taxable year and subject to generally applicable limitations under U.S. law.
| 184 |
Subject to the discussion under “—Passive Foreign Investment Company” below, to the extent that the amount of any distribution (including amounts withheld to reflect Brazilian withholding taxes and distributions of interest on shareholders’ equity, as described above under “—Brazilian Tax Considerations”) exceeds our current and accumulated earnings and profits for a taxable year, as determined under U.S. federal income tax principles, the distribution will first be treated as a tax-free return of capital, causing a reduction in the adjusted basis of ADRs or common shares (but not below zero), and the balance in excess of adjusted basis will be taxed as capital gain recognized on a sale or exchange (as discussed below under “—Taxation of Dispositions”). However, we do not expect to calculate earnings and profits in accordance with U.S. federal income tax principles. Therefore, you should assume that a distribution will generally be treated as a dividend (as discussed above).
Distributions of common shares or ADRs, or rights to subscribe for common shares or ADRs, which are received as part of a pro rata distribution to all of our shareholders generally will not be subject to U.S. federal income tax.
If you are a non-U.S. holder, dividends paid to you generally will not be subject to U.S. income tax unless the dividends are “effectively connected” with your conduct of a trade or business within the United States, and the dividends are attributable to a permanent establishment (or in the case of an individual, a fixed place of business) that you maintain in the United States if that is required by an applicable income tax treaty as a condition for subjecting you to U.S. taxation on a net income basis. In such cases you generally will be taxed in the same manner as a U.S. holder. If you are a corporate non-U.S. holder, “effectively connected” dividends may, under certain circumstances, be subject to an additional “branch profits tax” at a 30% rate or a lower rate if you are eligible for the benefits of an income tax treaty that provides for a lower rate.
Taxation of Dispositions
For U.S. federal income tax purposes, a U.S. holder generally will recognize taxable gain or loss on any sale, exchange or redemption of its common shares or ADRs in an amount equal to the difference between the amount realized for the common shares or ADRs (including any amounts withheld to reflect Brazilian withholding taxes) and the U.S. holder’s adjusted tax basis in the common shares or ADRs, both determined in U.S. dollars. Subject to the discussion under “—Passive Foreign Investment Company” below, such gain or loss will generally be capital gain or loss. Capital gains of U.S. holders who are individuals (as well as certain trusts and estates) derived with respect to capital assets held for more than one year are generally eligible for reduced rates of taxation. The deductibility of capital losses is subject to limitations. Any gain or loss recognized by a U.S. holder will generally be treated as U.S. source gain or loss. Consequently, in the case of gain from the disposition of common shares or ADRs, U.S. holders may not be able to use the foreign tax credit arising from any Brazilian tax imposed on the disposition of our common shares or ADRs unless such credit can be applied (subject to applicable limitations) against tax due on other income treated as derived from sources outside the United States in the appropriate category for foreign tax credit purposes.
A U.S. holder’s initial tax basis on our common shares or ADRs will be the U.S. dollar value of the reais denominated purchase price determined on the date of purchase. With respect to the sale, exchange or other taxable disposition of common shares or ADRs, the amount realized generally will be the U.S. dollar value of the payment received determined on: (i) the date of actual or constructive receipt of payment in the case of a cash basis U.S. holder; or (ii) the date of disposition in the case of an accrual basis U.S. holder. If the common shares or ADRs are traded on an “established securities market,” a cash basis U.S. holder, or an electing accrual basis U.S. holder, will determine the U.S. dollar rate of the cost of the common shares or the amount realized based on the exchange rate on the settlement date of the sale. If a U.S. holder sells or otherwise disposes of our common shares or ADRs in exchange for currency other than U.S. dollars, any gain or loss that results from currency exchange fluctuations during the period from the date of the sale or other disposition until the date that the currency is converted into U.S. dollars generally will be treated as ordinary income or loss and will not be eligible for the reduced tax rate applicable to long-term capital gains. Such gain or loss generally will be U.S.-source income or loss. If the currency is converted into U.S. dollars on the date of receipt, a U.S. holder generally would not be required to recognize foreign currency gain or loss in respect of the amount realized. U.S. holders are urged to consult their own tax advisors regarding the treatment of any foreign currency gain or loss realized with respect to any currency received in a sale or other disposition of the common shares or ADRs that is converted into U.S. dollars (or otherwise disposed of) on a date subsequent to receipt.
| 185 |
If you are a non-U.S. holder, you will not be subject to U.S. federal income tax on gain recognized on the sale, exchange or other disposition of your common shares or ADRs unless:
| · | the gain is “effectively connected” with your conduct of a trade or business in the United States, and the gain is attributable to a permanent establishment (or, in the case of an individual, a fixed place of business) that you maintain in the United States if that is required by an applicable income tax treaty as a condition for subjecting you to U.S. taxation on a net income basis, or |
| · | you are an individual, you are present in the United States for 183 or more days in the taxable year of such sale, exchange or other disposition and certain other conditions are met. |
In the first case, the non-U.S. holder will be taxed in the same manner as a U.S. holder. In the second case, the non-U.S. holder will be subject to U.S. federal income tax at a rate of 30% on the amount by which such non-U.S. holder’s U.S. source capital gains exceed non-U.S. source capital losses.
If you are a corporate non-U.S. holder, “effectively connected” gains that you recognize may also, under certain circumstances, be subject to an additional “branch profits tax” at a 30% rate or at a lower rate if you are eligible for the benefits of an income tax treaty that provides for a lower rate.
Passive Foreign Investment Company
The Code provides special rules regarding certain distributions received by U.S. persons (which would include U.S. holders as defined above for purposes of this discussion) with respect to, and sales, exchanges and other dispositions, including pledges, of, shares of stock (or ADRs backed by such shares) in a PFIC. In general, we will be a PFIC for any taxable year in which:
| · | at least 75% of our gross income is passive income, or |
| · | at least 50% of the value (based on the average of the fair market values of the assets determined at the end of each quarterly period) of our assets is attributable to assets that produce or are held for the production of passive income. |
For this purpose, passive income generally includes dividends, interest, royalties, rents (other than royalties and rents derived in the active conduct of a trade or business and not derived from a related person), gains from commodities and securities transactions, and gains from passive assets. Passive assets generally include the assets that produce passive income or are held for the production of passive income. For this purpose, cash is treated as passive asset. If we own (directly or indirectly) at least 25% (by value) of the stock of another corporation, we will be treated, for purposes of the PFIC tests, as owning our proportionate share of the other corporation’s assets and receiving our proportionate share of the other corporation’s income.
Based on our financial statements, relevant market and shareholder data, and the projected composition of our income and valuation of our assets, including goodwill, we do not believe we were a PFIC for U.S. federal income tax purposes for 2020, and we do not expect to be a PFIC for 2021, although we can provide no assurances in this regard. The determination of whether we are a PFIC must be made annually. Accordingly, it is possible that we may become a PFIC in the current or any future taxable year due to changes in our income or asset composition. Because we have valued our goodwill based on the market value of our equity, a decrease in the price of our ADRs or common shares may also result in our becoming a PFIC. If you are a U.S. holder and we are a PFIC for any taxable year during which you hold our ADRs or common shares, you will be subject to special tax rules discussed below and could suffer adverse tax consequences.
| 186 |
If we are a PFIC for any taxable year during which a U.S. holder holds our ADRs or common shares, such U.S. holder will be subject to special tax rules with respect to any “excess distribution” received and any gain realized from a sale or other disposition, including a pledge, of ADRs or common shares. Distributions received in a taxable year that are greater than 125% of the average annual distributions received during the shorter of the three preceding taxable years or the U.S. holder’s holding period for ADRs or common shares will be treated as excess distributions. Under these special tax rules:
| · | the excess distributions and gains are allocated ratably to each day of the U.S. holder’s holding period during which we were a PFIC, |
| · | amounts allocated to the taxable year in which the excess distribution or disposition occurs and amounts allocated to any period in the U.S. holder’s holding period before the first day of the first taxable year that we were a PFIC will be treated as ordinary income (rather than capital gain) earned in the taxable year of the excess distribution or disposition, |
| · | the amount allocated to each other year will be subject to tax at the highest tax rate in effect for that year and the interest charge generally applicable to underpayments of tax will be imposed on the resulting tax attributable to each such year, and |
| · | the tax liability for amounts allocated to years before the year of disposition or excess distribution cannot be offset by any net operating losses for such year, and gains (but not losses) realized on the sale of the common shares or ADRs cannot be treated as capital gain, even if the U.S. holder held such common shares or ADRs as capital assets. |
If we are a PFIC for any taxable year during which a U.S. holder holds the common shares or ADRs, then we generally will continue to be treated as a PFIC with respect to the U.S. holder for all succeeding years during which the U.S. holder holds the common shares or ADRs, even if we no longer satisfy either the passive income or passive asset test described above, unless the U.S. holder terminates this deemed PFIC status by making a “deemed sale” election. If such election is made, the U.S. holder will be deemed to have sold the common shares or ADRs at their fair market value on the last day of the last taxable year for which we were a PFIC, and any gain from such deemed sale would be subject to the excess distribution rules as described above. After the deemed sale election, the common shares or ADRs with respect to which the deemed sale election was made will not be treated as shares in a PFIC unless we subsequently become a PFIC.
In addition, non-corporate U.S. holders will not be eligible for reduced rates of taxation on any dividends received from us if we are a PFIC in the taxable year in which such dividends are paid or in the preceding taxable year (as described above under “—Taxation of Dividends”). You will generally be required to file Internal Revenue Service Form 8621 if you hold our ADRs or common shares in any year in which we are classified as a PFIC.
If we are a PFIC for any taxable year and any of our non-U.S. subsidiaries is also a PFIC, a U.S. holder would be treated as owning a proportionate amount (by value) of the common shares of the lower-tier PFIC for purposes of the application of these rules. You are urged to consult your tax advisors about the application of the PFIC rules to any of our subsidiaries.
In certain circumstances, in lieu of being subject to the excess distribution rules discussed above, a U.S. holder may make an election to include gain on the stock of a PFIC as ordinary income under a mark-to-market method, provided that such stock is regularly traded on a qualified exchange. Under current law, the mark-to-market election may be available to the U.S. holders of ADRs, because our ADRs are listed on the NYSE, which constitutes a qualified exchange, although there can be no assurance that our ADRs will be “regularly traded” for purposes of the mark-to-market election. It should also be noted that only our ADRs and not our common shares are listed on the NYSE. Our common shares are listed on the Novo Mercado (New Market) of the São Paulo Stock Exchange, which must meet certain trading, listing, financial disclosure and other requirements to be treated as a qualified exchange under applicable Treasury regulations for purposes of the mark-to-market election, and no assurance can be given that the common shares will be “regularly traded” for purposes of the mark-to-market election.
| 187 |
If a U.S. holder makes a valid mark-to-market election for the first taxable year in which such U.S. holder holds (or is deemed to hold) our common shares or ADRs when we are determined to be a PFIC, such U.S. holder generally will not be subject to the PFIC rules described above in respect of its common shares or ADRs. Instead, a U.S. holder that makes a mark-to-market election will be required to include in income each year an amount equal to the excess, if any, of the fair market value of the common shares or ADRs that the U.S. holder owns as of the close of the taxable year over the U.S. holder’s adjusted tax basis in the common shares or ADRs. The U.S. holder will be entitled to deduct the excess, if any, of the U.S. holder’s adjusted tax basis in the common shares or ADRs over their fair market value as of the close of the taxable year, but only to the extent of the net mark-to-market gains with respect to the common shares or ADRs included by the U.S. holder in prior taxable years as a result of the mark-to-market election. If the U.S. holder makes a valid mark-to-market election, in each year that we are a PFIC amounts included in income of such U.S. holder pursuant to a mark-to-market election, as well as gain on the sale, exchange or other disposition of its common shares or ADRs will be treated as ordinary income, and any loss will be treated as ordinary loss, but only to the extent of the net amount previously included in income as a result of the mark-to-market election.
If a U.S. holder makes a valid mark-to-market election, its adjusted tax basis for ADRs or common shares will be increased by the amount of any income inclusion and decreased by the amount of any deductions under the mark-to-market rules. Any distributions made by us in a year in which we are a PFIC and a mark-to-market election is in effect would generally be subject to the rules discussed above under “—Taxation of Dividends,” except the lower rate applicable to qualified dividend income would not apply. In addition, gain or loss realized by the U.S. holder on the sale of our common shares or ADRs will be ordinary gain or loss provided a valid mark-to-market election is in effect.
Once properly made, a mark-to-market election will be effective for the taxable year for which it is made and all subsequent taxable years unless the common shares or ADRs are no longer regularly traded on a qualified exchange or the IRS consents to the revocation of the election. The excess distribution rules generally do not apply to a U.S. holder for taxable years for which a mark-to market election is in effect. If we are a PFIC for any year in which the U.S. holder owns our common shares or ADRs but before a mark-to-market election is made, the interest charge rules described above will apply to any mark-to-market gain recognized in the year the election is made. Generally, if we cease to be a PFIC, the U.S. holder’s mark-to-market election would no longer require the income inclusion (or permit the deduction of loss) described above. However, cessation of our status as a PFIC will not terminate a mark-to-market election and if we become a PFIC again, mark-to-market inclusion may be required. You are urged to consult your tax advisor about the availability of the mark-to-market election, and whether making the election would be advisable in your particular circumstances.
Additionally, if we are a PFIC and have any non-U.S. subsidiaries that are PFICs (each a “Subsidiary PFIC”), a U.S. holder will be treated as owning its proportionate amount (by value) of the common shares of each such Subsidiary PFIC and will be subject to the PFIC rules with respect to each such Subsidiary PFIC. A U.S. holder may not make a mark-to-market election with respect to the common shares of any Subsidiary PFIC. Thus, the mark-to-market election is not available to mitigate the adverse tax consequences attributable to any Subsidiary PFIC.
Alternatively, the excess distribution rules may be avoided if a U.S. holder makes a qualified electing fund (“QEF”) election effective beginning with the first taxable year in the U.S. holder’s holding period in which we are treated as a PFIC with respect to such U.S. holder. However, the QEF election is not available to our U.S. holders because we do not intend to comply with the requirements necessary to permit our U.S. holders to make this election.
| 188 |
U.S. holders are urged to consult their tax advisors as to our status as a PFIC, and, if we are treated as a PFIC, as to the effect on them of, and the reporting requirements with respect to, the PFIC rules and the desirability of making, and the availability of, a mark-to-market election with respect to our common shares or ADRs.
Information with respect to Foreign Financial Assets
U.S. holders that are individuals (and, to the extent provided in regulations, certain entities) that own “specified foreign assets,” including possibly the common shares or ADRs, with an aggregate value in excess of $50,000 at the end of the taxable year or $75,000 at any time during the taxable year are generally required to file IRS Form 8938 with information regarding such assets. Depending on the circumstances, higher threshold amounts may apply. Specified foreign financial assets include any financial accounts maintained by foreign financial institutions, as well as any of the following, but only if they are not held in accounts maintained by financial institutions: (i) stock and securities issued by non-U.S. person, (ii) financial instruments and contracts held for investment that have non-U.S. issuer or counterparties, and (iii) interests in non-U.S. entities. If a U.S. holder is subject to this information reporting regime, the failure to timely file IRS Form 8938 may subject the U.S. holder to penalties. In addition to these requirements, U.S. holders may be required to annually file FinCEN Report 114 (Report of Foreign Bank and Financial Accounts) with the U.S. Department of Treasury. U.S. holders are thus encouraged to consult their U.S. tax advisors with respect to these and other reporting requirements that may apply to their acquisition of the common shares and ADRs.
Information Reporting and Backup Withholding
In general, information reporting requirements will apply to distributions made on the common shares or ADRs within the United States to a non-corporate U.S. holder and to the proceeds from the sale, exchange, redemption or other disposition of common shares or ADRs by a non-corporate U.S. holder to or through a U.S. office of a broker. Payments made (and sales or other dispositions effected at an office) outside the U.S. will be subject to information reporting in limited circumstances.
In addition, backup withholding of U.S. federal income tax may apply to such amounts if the U.S. holder fails to provide an accurate taxpayer identification number (or otherwise establishes, in the manner provided by law, an exemption from backup withholding) or to report dividends required to be shown on the U.S. holder’s U.S. federal income tax returns.
Backup withholding is not an additional income tax, and the amount of any backup withholding from a payment to a U.S. holder will be allowed as credit against the U.S. holder’s U.S. federal income tax liability provided that the appropriate returns are timely filed.
A non-U.S. holder generally may eliminate the requirement for information reporting and backup withholding by providing a properly completed and duly executed certification of its foreign status to the payer, under penalties of perjury, on IRS Form W-8BEN or, W-8BEN-E or other appropriate W-8, as applicable. You should consult your own tax advisor as to the qualifications for exemption from backup withholding and the procedures for obtaining the exemption.
The foregoing does not purport to be a complete analysis of the potential tax considerations relating to the acquisition, beneficial ownership and disposition of common shares or ADRs. Prospective investors should consult their own tax advisors as to the particular tax considerations applicable to them relating to the acquisition, beneficial ownership and disposition of common shares or ADRs, including the applicability of the U.S. federal, state and local tax laws or non-tax laws, foreign tax laws, any tax treaties, and any changes in applicable tax laws and any pending or proposed legislation or regulations.
| F. | Dividends and Paying Agents |
Not applicable.
| G. | Statement by Experts |
Not applicable.
| 189 |
| H. | Documents on Display |
We make our filings in electronic form under the EDGAR filing system of the SEC. Its filings are available through the EDGAR system at www.sec.gov. In addition, our filings are available to the public over the Internet at our web site at https://ri.brf-global.com/en/. Such filings and other information on its website are not incorporated by reference in this annual report. You may request a copy of this filing, and any other report, at no cost, by contacting us at:
Investor Relations Department
BRF S.A.
Avenida das Nações Unidas, 8501 - 1st Floor
05425-070 – São Paulo – SP – Brazil
Telephone: +55 11 2322-5377
E-mail: acoesri@brf.com
| I. | Subsidiary Information |
See note 1.1 to our consolidated financial statements for a description of our subsidiaries.
ITEM 11. QUANTITATIVE AND QUALITATIVE DISCLOSURES ABOUT MARKET RISK
We are exposed to a variety of market risks related to potential losses resulting from adverse changes in interest rates, exchange rates and the price of some commodities. We have established policies and procedures to manage our sensitivity to such risks in our Financial Risk Management Policy. These procedures include the monitoring of our level of exposure to each market risk through an analysis based on our balance sheet exposure combined with an analysis of expected cash flows. We also use derivative financial instruments to mitigate our exposure to these risks, guided by our risk policy under the management of our Financial Risk Management Committee, our board of executive officers and our board of directors.
Our risk management department is responsible for monitoring, evaluating and reporting our financial risk. Our board of directors is responsible for approving our risk policy and periodically evaluating improvements to it, defining the limits of risk tolerance for different types of risks to which we are exposed and defining action plans to align the risks within these limits. Our Financial Risk Management Committee is in charge of the execution of our risk policy, which includes supervising the risk management process, planning and verifying the impact of the decisions implemented, evaluating and approving hedging alternatives, and monitoring the exposure levels to risks in order to ensure compliance with our risk policy. Our risk policy defines the risk management strategies to be adopted. Among other things, our risk policy does not authorize us to engage in leveraged transactions in derivative markets and states that the notional amount of individual hedging transactions must be limited to 2.5% of our shareholders’ equity.
Under IFRS, we have accounted for our derivative instruments using the fair value method. For more information on our financial instruments and risk management, see note 23 to our consolidated financial statements.
The following section describes the significant market risks associated with our activities and the related financial instruments.
Interest Rate Risk
We are exposed to risk from changes in interest rates, which may be caused by factors related to the global economy, changes in monetary policy in the Brazilian and foreign markets, and other factors. Our interest rate exposure under our indebtedness is primarily to the LIBOR rate, the TJLP rate, the UMBNDES rate and the CDI rate. We also have indebtedness denominated in reais and U.S. dollars that bear interest at fixed rates. With respect to our marketable securities, our principal exposure is to the CDI rate for investments in the Brazilian market. Our marketable securities in foreign markets are generally U.S. dollar instruments at a fixed coupon.
| 190 |
The table below provides information about our financial instruments that are sensitive to changes in interest rates as of December 31, 2021. For debt obligations, the table presents principal cash flows and related weighted average interest rates by expected maturity dates. The information is presented in real equivalents. The instruments’ actual cash flows are denominated in U.S. dollars, euro and reais, as applicable, once these currencies are subject to interest rate risks. See also “—Foreign Exchange Risk” below, which describes our foreign exchange derivatives. Even though these derivatives were entered into primarily to manage foreign exchange risk, they may also have an interest rate risk component because certain derivatives are linked to variable interest rates such as the CDI rate.
To facilitate the analysis of market risk, the table below includes cash, cash equivalents and debt (amounts in millions of reais, except weighted average annual interest rates).
|
Financial Instruments |
All-in weighted average annual interest rate |
Short Term |
2023 |
2024 |
2025 |
2026 |
Thereafter |
Fair value |
| Assets - Short/Long-term | 7,895.2 | 42.1 | ― | ― | ― | ― | 7,937.3 | |
| Fixed rate | 1,843.9 | 13.3 | ― | ― | ― | ― | 1,857.2 | |
| In US dollarS | 0.01% | 763.4 | 13.3 | ― | ― | ― | ― | 776.8 |
| In US dollarS | Overnight rate | 946.8 | ― | ― | ― | ― | ― | 946.8 |
| Other currencies | 0.08% | 133.7 | ― | ― | ― | ― | ― | 133.7 |
| Variable rate | 4,800.9 | ― | ― | ― | ― | ― | 4,800.9 | |
| In Reais | 93.21% of CDI | 4,476.2 | ― | ― | ― | ― | ― | 4,476.2 |
| In Reais | 100.00% of SELIC | 324.8 | ― | ― | ― | ― | ― | 324.8 |
| Floating rate | 3.6 | 15.4 | ― | ― | ― | ― | 19.1 | |
| In Reais | Floating rate | 3.6 | 15.4 | ― | ― | ― | ― | 19.1 |
| MTM | 0.0 | 13.3 | ― | ― | ― | ― | 13.4 | |
| Other currencies | ― | 0.0 | 13.3 | ― | ― | ― | ― | 13.4 |
| Without rate | 1,246.7 | 0.0 | ― | ― | ― | ― | 1,246.7 | |
| In Reais | ― | 185.9 | 0.0 | ― | ― | ― | ― | 185.9 |
| In Euros | ― | 103.6 | ― | ― | ― | ― | ― | 103.6 |
| Other currencies | ― | 957.1 | ― | ― | ― | ― | ― | 957.1 |
| Liabilities - Short/Long-term | (3,179.5) | (2,413.4) | (1,649.7) | ― | (3,084.9) | (15,023.0) | (25,350.5) | |
| Fixed rate | (2,403.9) | (1,358.5) | (1,648.3) | ― | (2,608.0) | (8,188.5) | (16,207.1) | |
| In US dollar | 4.98% | (618.5) | (1,303.6) | (1,648.3) | ― | (2,608.0) | (8,110.0) | (14,288.3) |
| In Euros | 2.74% | (1,072.5) | ― | ― | ― | ― | ― | (1,072.5) |
| In Reais | 5.11% | (386.9) | ― | ― | ― | ― | ― | (386.9) |
| In Turkish Lira | 14.78% | (326.0) | (54.9) | ― | ― | ― | (78.5) | (459.4) |
| Variable rate | (775.6) | (1,054.9) | (1.4) | ― | (477.0) | (6,834.5) | (9,143.4) | |
| In Reais | (517.3) | ― | ― | ― | ― | (3,341.3) | (3,858.6) | |
| In Reais | (115.1) | (915.3) | ― | ― | (477.0) | (3,492.8) | (5,000.1) | |
| In Reais | TJLP+004% | (1.6) | (0.1) | (1.4) | ― | ― | (0.5) | (3.6) |
|
In US dollar |
LIBOR6M+0.16% |
(141.6) |
(139.5) |
― |
― |
― |
― |
(281.1) |
| Nets | 4,715.7 | (2.371,2) | (1,649.7) | ― | (3,084.9) | (15,023.0) | (17,413.2) |
Foreign Exchange Risk
In managing our foreign exchange risk, we seek to balance our assets denominated in foreign currency against our liabilities also denominated in foreign currency. We also consider future cash flows resulting from transactions in foreign currency, especially exports denominated in U.S. dollars and euro. We usually enter into derivative instruments, mainly local short-term swaps, to manage such foreign exchange risk, but these derivatives generally do not cover all of the principal amount of our U.S. dollar-denominated obligations.
| 191 |
The table below provides information about our financial instruments and presents such information in real equivalents as of December 31, 2021. The table summarizes information on instruments and transactions that are sensitive to foreign currency exchange rates. The table presents principal cash flows and related weighted average interest rates by expected maturity dates (amounts in millions of reais, except average annual interest rates).
|
On-balance Sheet Financial Instruments |
Short Term |
2023 |
2024 |
2025 |
2026 |
Thereafter |
Fair value |
| US dolar instruments | (88.5) | (1,035.7) | (1,655.3) | ― | (2,786.2) | (8,140.0) | (13,705.7) |
| Assets | 1,648.2 | 426.7 | ― | ― | ― | ― | 2,074.8 |
| Short/Long-term investments | 701.4 | 426.7 | ― | ― | ― | ― | 1,128.1 |
| Average annual interest rate | 0.15% | 3.70% | 0.00% | 0.00% | 0.00% | 0.00% | 1.49% |
| Liabilities | (1,736.6) | (1,462.4) | (1,655.3) | ― | (2,786.2) | (8,140.0) | (15,780.5) |
| Short/Long-term debt | (1,736.6) | (1,462.4) | (1,655.3) | ― | (2,786.2) | (8,140.0) | (15,780.5) |
| Average annual interest rate | 2.29% | 3.92% | 4.81% | 0.00% | 4.35% | 5.46% | 4.71% |
| Euro instruments | (968.8) | ― | ― | ― | ― | ― | (968.8) |
| Assets | 103.6 | ― | ― | ― | ― | ― | 103.6 |
| Short/Long-term investments | 103.6 | ― | ― | ― | ― | ― | 103.6 |
| Average annual interest rate | 0.00% | 0.00% | 0.00% | 0.00% | 0.00% | 0.00% | 0.00% |
| Liabilities | (1,072.5) | ― | ― | ― | ― | ― | (1,072.5) |
| Short/Long-term debt | (1,072.5) | ― | ― | ― | ― | ― | (1,072.5) |
| Average annual interest rate | 2.74% | 0.00% | 0.00% | 0.00% | 0.00% | 0.00% | 2.74% |
| Other Currencies instruments | 764.8 | (49.6) | ― | ― | ― | ― | 715.2 |
| Assets | 1,090.8 | 5.3 | ― | ― | ― | ― | 1,096.1 |
| Short/Long-term investments | 1,090.8 | 5.3 | ― | ― | ― | ― | 1,096.1 |
| Average annual interest rate | 0.01% | 17.50% | 0.00% | 0.00% | 0.00% | 0.00% | 0.09% |
| Liabilities | (326.0) | (54.9) | ― | ― | ― | ― | (380.9) |
| Short/Long-term debt | (326.0) | (54.9) | ― | ― | ― | ― | (380.9) |
| Average annual interest rate | 11.22% | 14.90% | 0.00% | 0.00% | 0.00% | 0.00% | 11.75% |
| (1) | Includes overnight deposits, time deposits, long-term Brazilian government bonds, credit linked notes and other short-term investments. |
| (2) | Denominated in U.S. dollars. |
The table below presents our derivative financial instruments under which we have exposure to foreign exchange risk and interest rate risk, using the notional amounts and weighted average exchange rates by expected (contractual) maturity dates.
|
Exchange/Interest rate derivatives |
Short Term |
2023 |
2024 |
2025 |
2026 |
Thereafter |
Fair value |
| Total Notional | 331,331.9 | 33.4 | ― | ― | ― | ― | (688.9) |
| Cross currency swaps: | 258.8 | ― | ― | ― | ― | ― | (342.8) |
| Receive US Dollar Pay Real | |||||||
| Notional amount | 258.8 | ― | ― | ― | ― | ― | (342.8) |
| Average interest received in US Dollar | 0.00% | 0.00% | 0.00% | 0.00% | 0.00% | 0.00% | 0.00% |
| Average interest paid in CDI+ | 0.00% | 0.00% | 0.00% | 0.00% | 0.00% | 0.00% | 0.00% |
| Duration | 6.84 | ― | ― | ― | ― | ― | 6.8 |
| Non-deliverable forward: | 329,241.9 | 33.4 | ― | ― | ― | ― | (316.2) |
| Receive Reais Pay US Dollar | |||||||
| Notional amount | 7,062.6 | 33.4 | ― | ― | ― | ― | (184.6) |
| Average interest received in reais | 0.00% | 0.00% | 0.00% | 0.00% | 0.00% | 0.00% | 0.00% |
| Average interest paid in US dollar | 8.87% | 9.57% | 0.00% | 0.00% | 0.00% | 0.00% | 8.88% |
| Duration | 0.2 | 1.5 | ― | ― | ― | ― | 0.2 |
| Receive Reais Pay Euros | |||||||
| Notional amount | 1,673.7 | ― | ― | ― | ― | ― | (103.7) |
| Average interest received in reais | 0.00% | 0.00% | 0.00% | 0.00% | 0.00% | 0.00% | 0.00% |
| Average interest paid in euros | 9.16% | 0.00% | 0.00% | 0.00% | 0.00% | 0.00% | 0.00% |
| Duration | 0.2 | ― | ― | ― | ― | ― | 0.2 |
| Receive US Dollar Pay Euros | |||||||
| Notional amount | 51.9 | ― | ― | ― | ― | ― | 1.4 |
| Average interest received in US dollar | 0.00% | 0.00% | 0.00% | 0.00% | 0.00% | 0.00% | 0.00% |
| Average interes tpaid in euros | 0.00% | 0.00% | 0.00% | 0.00% | 0.00% | 0.00% | 0.00% |
| Duration | 0.2 | ― | ― | ― | ― | ― | 0.2 |
| Receive Iene Pay Euros | |||||||
| Notional amount | 320,150.0 | ― | ― | ― | ― | ― | 1.1 |
| Average interest received in iene | 0.00% | 0.00% | 0.00% | 0.00% | 0.00% | 0.00% | 0.00% |
| Average interest paid in euros | 0.00% | 0.00% | 0.00% | 0.00% | 0.00% | 0.00% | 0.00% |
| Duration | 0.2 | ― | ― | ― | ― | ― | 0.2 |
| Receive Turkish Lira Pay US dollar | |||||||
| Notional amount | 303.6 | ― | ― | ― | ― | ― | (0,6) |
| Average interest received in russian ruble | 0.00% | 0.00% | 0.00% | 0.00% | 0.00% | 0.00% | 0.00% |
| Average interest paid in euros | 0.00% | 0.00% | 0.00% | 0.00% | 0.00% | 0.00% | 0.00% |
| Duration | 0.2 | ― | ― | ― | ― | ― | 0.2 |
| FX Options | 274.2 | ― | ― | ― | ― | ― | 4.7 |
| National amount US dollar | 274.2 | ― | ― | ― | ― | ― | 4.7 |
| Duration | 0.2 | ― | ― | ― | ― | ― | 0.2 |
| FX Futures | 1,557.0 | ― | ― | ― | ― | ― | (34.6) |
| Notional amount US dollar | 1,557.0 | ― | ― | ― | ― | ― | (34.6) |
| Duration | 0.1 | ― | ― | ― | ― | ― | 0.1 |
| 192 |
The table below provides further detail on our foreign currency-denominated assets and liabilities as of the dates indicated below. Further details are provided in note 23.4.2 to our consolidated financial statements.
|
As of December 31, | ||
|
2021 |
2020 | |
| (in thousands of R$) | ||
| Cash and cash equivalents | 2,064,631 | 2,855,979 |
| Trade accounts receivable | 6,377,104 | 5,765,753 |
| Trade accounts payable | (1,221,354) | (859,790) |
| Loans and borrowings | (16,726,412) | (14,947,793) |
| Other assets and liabilities, net | 49,732 | 225,694 |
| Exposure of assets and liabilities in foreign currencies | (9,456,299) | (6,960,157) |
| Derivative financial instruments (hedge) (1) | 8,454,971 | 6,849,947 |
| Foreign exchange exposure |
(1,001,328) |
(110,210) |
| (1) | Swaps, foreign currency futures and non-deliverable forwards not designated as hedge accounting instruments, which impact our financial results. |
The table below presents a sensitivity analysis relating to our foreign exchange risk that considers six scenarios in the next twelve months for the variations in exchange rates between the real and the U.S. dollar, the real and the euro, the real and the Japanese iene, the real and the Turkish lyra and the real and the Angolan kwanza. We have adopted what we believe is the most likely scenario shown in the table (the Base scenario). The total of export sales analyzed corresponds to the total of derivative financial instruments plus the amortization flow under export prepayment facilities designated as hedge accounting instruments.
| 193 |
| Scenario | |||||||
| Exchange rate - Balance | Base | - 50% | - 25% | - 10% | + 10% | + 25% | + 50% |
| USD | 5.5805 | 2.7903 | 4.1854 | 5.0225 | 6.1386 | 6.9756 | 8.3708 |
| Monetary Assets and Liabilities | 4,363,957 | 2,181,979 | 872,791 | (872,791) | (2,181,979) | (4,363,957) | |
| Derivative Instruments - Not designated | (3,518,304) | (1,759,152) | (703,661) | 703,661 | 1,759,152 | 3,518,304 | |
| Net effect | 845,653 | 422,827 | 169,130 | (169,130) | (422,827) | (845,653) | |
| EUR | 6.3210 | 3.1605 | 4.7408 | 5.6889 | 6.9531 | 7.9013 | 9.4815 |
| Monetary Assets and Liabilities | 757,905 | 378,953 | 151,581 | (151,581) | (378,953) | (757,905) | |
| Derivative Instruments - Not designated | (770,243) | (385,122) | (154,049) | 154,049 | 385,122 | 770,243 | |
| Net effect | (12,338) | (6,169) | (2,468) | 2,468 | 6,169 | 12,338 | |
| Japanese Iene | 0.0485 | 0.0243 | 0.0364 | 0.0437 | 0.0534 | 0.0606 | 0.0728 |
| Monetary Assets and Liabilities | (99,177) | (49,588) | (19,835) | 19,835 | 49,588 | 99,177 | |
| Derivative Instruments - Not designated | 60,588 | 30,294 | 12,118 | (12,118) | (30,294) | (60,588) | |
| Net effect | (38,589) | (19,294) | (7,717) | 7,717 | 19,294 | 38,589 | |
| Turkish Lira | 0.4223 | 0.2112 | 0.3167 | 0.3801 | 0.4645 | 0.5279 | 0.6335 |
| Monetary Assets and Liabilities | (133,270) | (66,635) | (26,654) | 26,654 | 66,635 | 133,270 | |
| Net effect | (133,270) | (66,635) | (26,654) | 26,654 | 66,635 | 133,270 | |
| Angolan Kwanza | 0.0099 | 0.0050 | 0.0074 | 0.0089 | 0.0109 | 0.0124 | 0.0149 |
| Monetary Assets and Liabilities | (159,330) | (79,665) | (31,866) | 31,866 | 79,665 | 159,330 | |
| Net effect | (159,330) | (79,665) | (31,866) | 31,866 | 79,665 | 159,330 | |
| Scenario | |||||||
| Exchange rate - Operating results | Base | - 50% | - 25% | - 10% | + 10% | + 25% | + 50% |
| USD | 5.5805 | 2.7903 | 4.1854 | 5.0225 | 6.1386 | 6.9756 | 8.3708 |
| Revenue in USD | (1,001,700) | (500,850) | (200,340) | 200,340 | 500,850 | 1,001,700 | |
| NDF | 792,431 | 396,216 | 158,486 | (158,486) | (396,216) | (792,431) | |
| Collar | 202,303 | 97,668 | 34,888 | (11,743) | (69,018) | (173,652) | |
| Net effect | (6,966) | (6,966) | (6,966) | 30,111 | 35,616 | 35,617 | |
Commodity Price Risk
In the normal course of our operations, we purchase commodities, including corn, soy meal and live hogs, which make up a significant portion of our raw materials and costs of production.
Corn and soy meal prices are subject to volatility resulting from weather conditions, crop yield, transportation costs, storage costs, agricultural policy of the government, foreign exchange rates and the prices of these commodities on the international market, among other factors. The price of hogs acquired from third parties is subject to market conditions and is determined by supply and demand in the international market, among other factors.
| 194 |
Our risk policy provides guidelines to hedging against increases in the price of corn and soy meal. In 2021, we used derivative instruments such as corn futures in addition to inventory management for this purpose.
The table below presents the notional amounts of our derivative financial instruments under which we have exposure to corn prices:
| Exchange/Interest rate derivatives |
Short Term |
2023 |
2024 |
2025 |
2026 |
Thereafter |
Fair value |
| Commodities Futures | (54,998.5) | (6,034.0) | — | — | — | — | (41.8) |
| Receive Corn Pay US dollar | |||||||
| Notional amount | (57,576.9) | (6,034.0) | — | — | — | — | (46.2) |
| Duration | 0.5) | 1.5) | — | — | — | — | 0.6) |
| Receive Soy Oil Pay US dollar | |||||||
| Notional amount | 2,954.6) | — | — | — | — | — | 2.2) |
| Duration | 0.2) | — | — | — | — | — | 0.2) |
| Receive Corn Pay in reais | |||||||
| Notional amount | 1.8) | — | — | — | — | — | (0.3) |
| Duration | 0.2) | — | — | — | — | — | 0.2) |
| Receive Soy Oil Pay US dollar | |||||||
| Notional amount | 1.0) | — | — | — | — | — | 1.0) |
| Duration | 0.3) | — | — | — | — | — | 0.3) |
| Receive US dollar Pay Soy | |||||||
| Notional amount | (15.0) | — | — | — | — | — | (1.6) |
| Duration | 0.1) | — | — | — | — | — | 0.1) |
| Corn Futures | |||||||
| Notional amount (Ton/USD) | (378.9) | — | — | — | — | — | 1.4) |
| Duration | 0.1) | — | — | — | — | — | 0.1) |
The table below presents a sensitivity analysis relating to our commodity price risk that considers six scenarios in the next twelve months for the variations in corn, soybean meal and soybean prices.
| Scenario | |||||||
| Operating results - Commodities | Base | - 50% | - 25% | - 10% | + 10% | + 25% | + 50% |
| Soy Grain - CBOT - USD/Ton | 492 | 246 | 369 | 443 | 541 | 615 | 738 |
| Cost of Sales | (7,623) | (3,811) | (1,525) | 1,525 | 3,811 | 7,623 | |
| NDF | 7,623 | 3,811 | 1,525 | (1,525) | (3,811) | (7,623) | |
| Net effect | - | - | - | - | - | - | |
| Soybean Meal - CBOT - USD/Ton | 434 | 217 | 326 | 391 | 478 | 543 | 651 |
| Cost of Sales | 80,312 | 40,156 | 16,062 | (16,062) | (40,156) | (80,312) | |
| Collar | (15,414) | (6,550) | (1,819) | 919 | 5,883 | 14,747 | |
| NDF | (63,696) | (31,848) | (12,739) | 12,739 | 31,848 | 63,696 | |
| Net effect | 1,202 | 1,758 | 1,504 | (2,404) | (2,425) | (1,869) | |
| Soybean Oil - CBOT - USD/Ton | 1,237 | 618 | 927 | 1,113 | 1,360 | 1,546 | 1,855 |
| Cost of Sales | 2,721 | 1,360 | 544 | (544) | (1,360) | (2,721) | |
| Collar | (1,299) | (402) | - | - | 383 | 1,280 | |
| NDF | (927) | (464) | (185) | 185 | 464 | 927 | |
| Net effect | 495 | 494 | 359 | (359) | (513) | (514) | |
| Corn - CBOT - USD/Ton | 231 | 115 | 173 | 208 | 254 | 288 | 346 |
| Cost of Sales | (45,151) | (22,575) | (9,030) | 9,030 | 22,575 | 45,151 | |
| NDF | 45,151 | 22,575 | 9,030 | (9,030) | (22,575) | (45,151) | |
| Net effect | - | - | - | - | - | - | |
| Corn - B3 - BRL/Ton | 1,418 | 709 | 1,064 | 1,276 | 1,560 | 1,773 | 2,127 |
| Cost of Sales | (132,309) | (66,154) | (26,462) | 26,462 | 66,154 | 132,309 | |
| Collar | (63,107) | (28,749) | (8,188) | 1,611 | 21,039 | 55,397 | |
| Future | 199,465 | 99,733 | 39,893 | (39,893) | (99,733) | (199,465) | |
| Net effect | 4,049 | 4,830 | 5,243 | (11,820) | (12,540) | (11,759) | |
| 195 |
ITEM 12. DESCRIPTION OF SECURITIES OTHER THAN EQUITY SECURITIES
| A. | Debt Securities |
Not applicable.
| B. | Warrants and Rights |
Not applicable.
| C. | Other Securities |
Not applicable.
| D. | American Depositary Shares |
The following table sets for the fees and charges that a holder of ADRs may have to pay pursuant to our Amended and Restated Deposit Agreement, dated as of November 2, 2011 (the “Deposit Agreement”), with The Bank of New York Mellon, as depositary, in connection with our ADR program:
Fees and Reimbursement Provisions
| Rates and Fees | Service |
| 1. US$0.05 (or less) per ADR | Issuance of ADRs, including issuances resulting from a distribution of shares, rights or other property; and Cancellation of ADRs for the purpose of withdrawal, including if the deposit agreement terminates. |
| 2. US$0.02 (or less) per ADR | Any cash distribution to ADR holders. |
| 3. US$0.02 (or less) per ADRs per calendar year | Depositary services. |
| 4. A fee equivalent to the fee that would be payable if securities distributed to you had been shares and the shares had been deposited for issuance of ADRs | Distribution of securities distributed to holders of deposited securities which are distributed by the Depositary to ADR holders. |
| 5. Registration or transfer fees | Transfer and registration of shares on our share registry to or from the name of the Depositary or its agent when you deposit or withdraw shares. |
| 6. Expenses of the Depositary | Cable, telex and facsimile transmissions (when expressly provided in the deposit agreement); and Converting foreign currency to U.S. dollars. |
| 7. Taxes and other governmental charges the Depositary or the Custodian may have to pay on any ADR or share underlying an ADR | As necessary. |
| 8. Any charges incurred by the Depositary or its agents for servicing the deposited securities | As necessary. |
| 196 |
The fee and reimbursement provisions described in rows 3 and 8 of the table above may, at the depositary’s discretion, be billed to the holders of ADRs or deducted from one or more cash dividends or other cash distributions.
For the year ended December 31, 2021, pursuant to a letter agreement between us and The Bank of New York Mellon, they reimbursed us for fees, expenses and related taxes in the gross amount of US$3,440,292.99 or net amount of US$2,661,892.31.
A form of the Deposit Agreement is filed as Exhibit 2.02 to this annual report. We encourage you to review this document carefully if you are a holder of ADRs.
PART II
ITEM 13. DEFAULTS, DIVIDEND ARREARAGES AND DELINQUENCIES
None.
ITEM 14. MATERIAL MODIFICATIONS TO THE RIGHTS OF SECURITY HOLDERS AND USE OF PROCEEDS
None.
ITEM 15. CONTROLS AND PROCEDURES
| A. | Disclosure Controls and Procedures |
As of the end of the period covered by this annual report, our management, with the participation of our Chief Executive Officer and Chief Financial Officer, performed an evaluation of the effectiveness of the design and operation of our disclosure controls and procedures as defined in Rules 13a-15(e) and 15d-15(e) of the Exchange Act. Our disclosure controls and procedures are designed to ensure that information required to be disclosed in the reports we file or submit under the Exchange Act is recorded, processed, summarized and reported within the time periods specified in the SEC’s rules and forms, and that such information is accumulated and communicated to our management, including the Chief Executive Officer and the Chief Financial Officer, to allow timely decisions regarding required disclosures. Any controls and procedures, no matter how well designed and operated, can provide only reasonable assurance of achieving the desired control objective. For information about the significance of these entities, see “—B. Management’s Annual Report on Internal Control Over Financial Report.” Based on our management’s evaluation, our Chief Executive Officer and Chief Financial Officer concluded that, as of December 31, 2021, our disclosure controls and procedures were effective at the reasonable assurance level.
| 197 |
| B. | Management’s Annual Report on Internal Control Over Financial Reporting |
There were no other significant changes in our controls that have materially affected, or are reasonably likely to materially affect, our internal control over financial reporting.
Management is responsible for establishing and maintaining adequate internal control over our financial reporting. In order to evaluate the effectiveness of internal control over financial reporting, as required by Section 404 of the Sarbanes-Oxley Act, management has conducted an assessment, including testing, using the 2013 criteria in Internal Control-Integrated Framework, issued by the Committee of Sponsoring Organizations of the Treadway Commission (COSO). Our system of internal control over financial reporting is designed to provide reasonable assurance regarding the reliability of financial reporting and the preparation of financial statements for external purposes in accordance with generally accepted accounting principles. Because of its inherent limitations, internal control over financial reporting may not prevent or detect misstatements. Also, projections of any evaluation of effectiveness to future periods are subject to the risk that controls may become inadequate because of changes in conditions, or that the degree of compliance with the policies or procedures may deteriorate.
Based on its assessment, management has concluded that we maintained effective internal control over financial reporting as of December 31, 2021, based on criteria in Internal Control-Integrated Framework, issued by the COSO (2013).
KPMG Auditores Independentes Ltda., an independent registered public accounting firm, which has audited and reported on the consolidated financial statements contained in this annual report, has issued a report on management’s assessment of our internal control over financial reporting.
| C. | Report of the Registered Public Accounting Firm |
See “Item 18—Financial Statements.”
| D. | Changes in Internal Control Over Financial Reporting |
There were no changes in our internal control over financial reporting (as defined in Rules 13a-15(f) and 15d-15(f) under the Exchange Act) that occurred during the year ended December 31, 2021 that have materially affected, or are reasonably likely to materially affect, our internal control over financial reporting.
We have not made any significant change in internal controls over financial reporting during the year ended December 31, 2021.
ITEM 16. [RESERVED]
| ITEM 16A. | AUDIT COMMITTEE FINANCIAL EXPERT |
The Board of Directors has determined that Mr. Jerônimo Antunes, a member of our Audit and Integrity Committee, is an “audit committee financial expert,” as such term is defined in the SEC rules. Mr. Jerônimo Antunes is independent, as such term is defined in the Novo Mercado listing rules. We have determined that Mr. Jerônimo Antunes is independent under the standards of the NYSE listing rules and Rule 10A-3 under the Exchange Act that would apply if we were not relying on the exemption provided in paragraph (c)(3) of Rule 10A-3, as described in “Item 16D. Exemptions from the Listing Standards for Audit Committees.” See “Item 6. – A. Directors, Senior Management and Employees—C. Board Practices” for information regarding the experience of Mr. Jerônimo Antunes.
| ITEM 16B. | CODE OF ETHICS |
Under NYSE Rule 303A.10, each U.S. listed company must adopt and disclose a code of business conduct and ethics for directors, officers and employees and promptly disclose any waivers of the code for directors or executive officers. We are subject to a similar requirement under Brazilian Decree 8.420/2015, article 42 item 2, and we have adopted a code of conduct and ethics that applies to our directors, officers and employees.
| 198 |
Our code of conduct and ethics, called the “Transparency Guide,” as well as further information concerning our corporate governance practices and applicable Brazilian law, is available on our website at https://www.brf-global.com/wp-content/uploads/2020/12/BRF_Manual_Transp_2020_FINAL1_EN_1.11.pdf. Information on our website is not incorporated by reference in this annual report. Copies of our “Code of Ethics and Conduct” are also available without charge upon request to our Investor Relations Office.
| ITEM 16C. | PRINCIPAL ACCOUNTANT FEES AND SERVICES |
Audit and Non-Audit Fees
The following table sets forth the fees billed to us by the independent auditors responsible for auditing the financial statements included in the annual report, which was KPMG Auditores Independentes Ltda. for the fiscal years ended December 31, 2021 and 2020. No payments of consultancy fees were made to the independent auditors during 2021 and 2020. The hiring of our auditors for consultancy services is subject to the approval of our Board of Directors and Audit and Integrity Committee and presupposes that the service in question does not risk the independence and objectivity of our auditors in the performance of the outside audit. The Board’s approval also takes into account restrictions on certain services under the Sarbanes-Oxley Act.
Aggregate fees for professional services rendered to us by KPMG Auditores Independentes Ltda. for the years ended December 31, 2021 and 2020 were:
|
Year Ended December 31, | ||
|
2021 |
2020 | |
| (in thousands of reais) | ||
| Audit fees(1) | 11,766 | 9,854 |
| Audit-related fees(2) | 1,427 | 1,040 |
| Tax fees(3) | — | — |
| All other fees(3) | — | — |
| Total fees | 13,193 | 10,894 |
(1) Audit fees in the above table are the fees billed by our independent auditors in connection with the audit of our annual consolidated financial statements, the review of our quarterly financial information, the audit of our internal control over financial reporting and the statutory audits of our foreign subsidiaries.
(2) Audit-related fees in the above table for 2021 and 2020 refer to services related to debt offerings.
(3) There were no other fees in 2021 or 2020.
| ITEM 16D. | EXEMPTIONS FROM THE LISTING STANDARDS FOR AUDIT COMMITTEES |
Our audit and integrity committee meets the requirements for the exemption available to foreign private issuers under paragraph (c)(3) of Rule 10A-3 under the Exchange Act. The audit and integrity committee is not the equivalent of, or wholly comparable to, a U.S. audit committee. Among other differences, it is not required to meet the standards of “independence” established in Rule 10A-3 and is not fully empowered to act on all the matters that are required by Rule 10A-3 to be within the scope of an audit committee’s authority. Nonetheless, with the attributes provided to the audit and integrity committee under our bylaws to the extent permitted by Brazilian law, we believe that its corporate governance system, taken as a whole, is materially equivalent to a system having an audit committee functioning as a committee of its board of directors. Accordingly, the Company does not believe that its reliance on the exemption in paragraph (c)(3) of Rule 10A-3 materially adversely affects the ability of the audit and integrity committee to act independently and to satisfy the other requirements of Rule 10A-3 to the extent permitted by Brazilian Corporate Law.
We also have a permanent Fiscal Council. However, as of April 3, 2014, we no longer rely on the Fiscal Council to avail ourselves of the exemption contained in paragraph (c)(3) of Rule 10A-3 under the Exchange Act.
| 199 |
| ITEM 16E. | PURCHASES OF EQUITY SECURITIES BY THE ISSUER AND AFFILIATED PURCHASERS |
On March 26, 2020, our board of directors approved a share repurchase program for an aggregate amount of up to 7,500,000 common shares potentially to be repurchased during a one-year period ending on March 26, 2021. The program was concluded on May 22, 2020 and we acquired 4,836,000 of our common shares, representative of approximately 0.60% of our capital stock.
On September 30, 2021, our board of directors approved a share repurchase program for an aggregate amount of up to 3,696,858 common shares potentially to be repurchased during a one-year period ending on April 1, 2023. As of December 31, 2021, no shares have been repurchased through our share repurchase program. Any of the common shares acquired under the program may be held in treasury, cancelled or later resold, or they may be used to comply with the obligations assumed by us under the Stock Option Plan and the Restricted Stock Plan, which are further described under “Item 6. Directors, Senior Management and Employees—E. Share Ownership— Stock Options Plan, Performance Shares Plan and Restricted Stock Plan.”
| ITEM 16F. | CHANGE IN REGISTRANT’S CERTIFYING ACCOUNTANT |
None.
| ITEM 16G. | CORPORATE GOVERNANCE |
We adopt corporate governance practices for a continual process of organizational improvement aimed at greater transparency, liquidity and return for our investors.
We were the first company in the food sector to list on B3’s Novo Mercado (2006), which requires us to comply with stringent regulations, including, among them, diffused control, protection mechanisms and equality of rights among shareholders. In addition, we have adhered to Level A of the Global Reporting Initiative guidelines for the publication of our annual reports under Brazilian law.
Further information concerning our corporate governance practices and applicable Brazilian law is available on our website (https://ri.brf-global.com). Information on our website is not incorporated by reference in this annual report.
Under Section 303A.11 of the NYSE Listed Company Manual (the “LCM”), we are required to disclose any significant differences in our corporate governance practices from those required to be followed by U.S. companies under the NYSE listing standards. We have summarized these significant differences below.
We are permitted to follow practices in Brazil in lieu of the provisions of the LCM, except that we are required to have a qualifying audit committee under Section 303A.06 of the LCM or avail ourselves of an appropriate exemption. As a foreign private issuer, we have established an audit and integrity committee in order to avail ourselves of an exemption from the listing standards for audit committees. See “Item 6.—A. Directors, Senior Management and Employees—C. Board Practices—Audit and Integrity Committee.” In addition, our chief executive officer is obligated, under Section 303A.12(b) of the LCM, to promptly notify the NYSE in writing after any of our executive officers becomes aware of any material non-compliance with any applicable provisions of the LCM. We are also required under Section 303A.12(c) of the LCM to submit an annual written affirmation of compliance with applicable provisions of the rules and, under certain circumstances, an interim written affirmation.
On December 1, 2021, we were included in the 17th B3 Corporate Sustainability Index – ISE portfolio. The index, pioneer in Latin America, is a tool for comparative analysis of the performance of the companies listed on the B3 from the standpoint of corporate sustainability, based on economic efficiency, environmental equilibrium, social justice and corporate governance. The new portfolio will remain valid from January 3, 2022, through April 29, 22, and is comprised of 34 shares of B3 listed companies.
| 200 |
Majority of Independent Directors
Under Section 303A.01 of the LCM, each U.S. listed company must have a majority of independent directors. Under the Novo Mercado rules, at least two directors or 20% of our board of directors, whichever is greater, must be independent, and a majority of our directors currently meet that standard. In addition, the independence standards under the LCM are different from the independence standards under the Novo Mercado rules.
Separate Meetings of Non-Management Directors
Under Section 303A.03 of the LCM, the non-management directors of each U.S. listed company must meet at regularly scheduled executive sessions without management. In addition, if a listed company chooses to hold regular meetings of all non-management directors, such listed company should hold an executive session including only independent directors at least once a year. We do not have a similar requirement under Brazilian practice, but in any event, all members of our board are non-executive directors. However, our independent directors do not meet separately from directors who are not independent.
Nominating/Corporate Governance Committee
Under Section 303A.04 of the LCM, each U.S. listed company must have a nominating/corporate governance committee composed entirely of independent directors. We are not required to have such a committee under Brazilian law. However, we have a People, Governance, Organization and Culture Committee composed of independent members according to Novo Mercado rules. This committee is not the equivalent of, or wholly comparable to, a U.S. nominating/corporate governance committee.
Compensation Committee
Section 303A.05 of the LCM requires each U.S. listed company to have a compensation committee composed entirely of independent directors and contains more specific guidance regarding the independence standards for those directors. Listed companies must grant the compensation committee, in its sole discretion, the authority to retain or obtain a compensation adviser and to be directly responsible for the compensation and oversight of any compensation adviser so retained with appropriate funding from the listed company. In addition, the compensation committee must assess the independence of any compensation adviser, subject to certain exceptions.
We are not required to have such a committee or to comply with similar requirements under Brazilian rules. However, we have established the People, Governance, Organization and Culture Committee, which is responsible for advising the board of directors in establishing the compensation of our executives and employees. This committee also provides our executive officers support in the assessment, selection and development of top leadership, and advises our board of directors in the formulation and practice of our corporate culture in order to monitor and encourage the proper behavior of our leaders. Further, it proposes actions to align the expectations of our shareholders and executives. This committee is not the equivalent of, or wholly comparable to, a U.S. compensation committee.
In accordance with the Brazilian Corporate Law and with our Management Compensation Policy, our shareholders approve the aggregate compensation of the members of our board of directors and fiscal council for each fiscal year. Our board of directors then decides the allocation of the compensation among its members and the members of the fiscal council. In addition, our board of directors is directly responsible for employee and executive compensation and recruitment, incentive compensation and related matters.
Audit and Integrity Committee
Under Section 303A.06 of the LCM and the requirements of Rule 10A-3 under the Exchange Act, each U.S. listed company is required to have an audit committee consisting entirely of independent members that comply with the requirements of Rule 10A-3. In addition, the audit committee must have a written charter compliant with the requirements of Section 303A.07(b) of the LCM, the listed company must have an internal audit function and the listed company must fulfill all other requirements of the NYSE and Rule 10A-3. The SEC has recognized that, for foreign private issuers, local legislation may delegate some of the functions of the audit committee to other bodies. We established the Audit and Integrity Committee upon approval at the Annual and Extraordinary General Meeting held on April 3, 2014. Our Audit and Integrity Committee meets the requirements for the exemption available to foreign private issuers under paragraph (c)(3) of Rule 10A-3 under the Exchange Act. The Audit and Integrity Committee is not the equivalent of, or wholly comparable to, a U.S. audit committee. Among other differences, it is not required to meet the standards of “independence” established in Rule 10A-3 and is not fully empowered to act on all the matters that are required by Rule 10A-3 to be within the scope of an audit committee’s authority.
| 201 |
Corporate Governance Guidelines
Under NYSE Rule 303A.09, each U.S. listed company must adopt and disclose their corporate governance guidelines. We do not have a similar requirement under Brazilian law. However, we have listed our common shares on the Novo Mercado of the São Paulo Stock Exchange, which requires adherence to the corporate governance standards described under “Item 9. The Offer and Listing—C. Markets —São Paulo Stock Exchange Corporate Governance Standards.” In addition, we have adopted a Policy on Disclosure of Material Acts or Facts and Trading of Securities.
Further information concerning our corporate governance practices and applicable Brazilian law is available on our website. Information on our website is not incorporated by reference in this annual report.
| ITEM 16H. | MINE SAFETY DISCLOSURE |
Not applicable.
| ITEM 16I. | DISCLOSURE REGARDING FOREIGN JURISDICTIONS THAT PREVENT INSPECTIONS |
Not applicable.
PART III
ITEM 17. FINANCIAL STATEMENTS
Not applicable.
ITEM 18. FINANCIAL STATEMENTS
See our consolidated financial statements beginning at page F-1.
ITEM 19. EXHIBITS
The agreements and other documents filed as exhibits to this annual report are not intended to provide factual information or other disclosure other than with respect to the terms of the agreements or other documents themselves, and you should not rely on them for that purpose. In particular, any representations and warranties made by us in these agreements or other documents were made solely within the specific context of the relevant agreement or document and for the benefit of the other parties to the agreements and they may not describe the actual state of affairs as of the date they were made or at any other time.
The total amount of our long-term debt authorized under each instrument does not exceed 10% of our total assets and its subsidiaries on a consolidated basis. We undertake to furnish to the SEC any instruments relating to our long-term debt and that of our subsidiaries upon request by the SEC.
The following are filed as exhibits hereto:
| 202 |
|
Exhibit Number |
Description |
| 1.01 | Amended and Restated Bylaws of the Registrant, approved at the ordinary and extraordinary general shareholders' meeting held on January 17, 2022 (incorporated by reference to Exhibit 1 to the Report on Form 6-K filed on January 18, 2022, SEC File No. 001-15148). |
| 2.01 | Description of Securities registered under Section 12 of the Exchange Act. |
| 2.02 | Form of Deposit Agreement among BRF S.A. (Perdigão S.A.), The Bank of New York Mellon, as depositary, and the owners and beneficial owners of American Depositary Shares, as amended and restated as of November 2, 2011 (incorporated by reference to Exhibit 1 to the Registration Statement on Form F-6, filed on November 2, 2011, SEC File No. 333-177676). |
| 2.03 | Form of American Depositary Receipt (incorporated by reference to Exhibit A to Exhibit 1 to the Registration Statement on Form F-6, filed on November 2, 2011, SEC File 333-177676). |
| 4.01 | Stock Options Grant Plan of BRF S.A., approved at the ordinary and extraordinary general shareholders’ meeting held on April 27, 2020 (incorporated by reference to Exhibit 1 to the Report on Form 6-K filed on April 28, 2020, SEC File No. 001-15148). |
| 4.02 | Restricted Stocks Plan of BRF S.A., approved at the ordinary and extraordinary general shareholders’ meeting held on April 27, 2021 (incorporated by reference to Exhibit 1 to the Report on Form 6-K, filed on April 28, 2021, SEC File No. 001-15148). |
| 4.03 | Management Compensation Policy of the Registrant, approved at the ordinary meeting of the board of directors held on November 26, 2020 (incorporated by reference to Exhibit 1 to the Report on Form 6-K, filed on December 14, 2020, SEC File No. 001-15148). |
| 8.01 | Subsidiaries of the Registrant. |
| 12.01 | Certification of the Chief Executive Officer pursuant to Securities Exchange Act Rules 13a-14(a) and 15d-14(a), as adopted pursuant to Section 302 of the Sarbanes-Oxley Act of 2002. |
| 12.02 | Certification of the Chief Financial Officer pursuant to Securities Exchange Act Rules 13a-14(a) and 15d-14(a), as adopted pursuant to Section 302 of the Sarbanes-Oxley Act of 2002. |
| 13.01* | Certification of the Chief Executive Officer pursuant to 18 U.S.C. Section 1350, as adopted pursuant to Section 906 of the Sarbanes-Oxley Act of 2002. |
| 13.02* | Certification of the Chief Financial Officer pursuant to 18 U.S.C. Section 1350, as adopted pursuant to Section 906 of the Sarbanes-Oxley Act of 2002. |
| 101 | eXtensible Business Reporting Language (XBRL) |
| * | This certification will not be deemed “filed” for purposes of Section 18 of the Exchange Act (15 U.S.C. §78r), or otherwise subject to the liability of that section. Such certification will not be deemed to be incorporated by reference into any filing under the Securities Act or the Exchange Act, except to the extent that the Registrant specifically incorporates it by reference. |
| 203 |
SIGNATURES
Pursuant to the requirements of Section 12 of the Securities Exchange Act of 1934, the registrant, BRF S.A., hereby certifies that it meets all of the requirements for filing on Form 20-F and that it has duly caused this annual report to be signed on its behalf by the undersigned, thereunto duly authorized, in the city of São Paulo, in the state of São Paulo, Brazil, on March 25, 2022.
BRF S.A.
By: /s/Lorival Nogueira Luz Júnior
Name: Lorival Nogueira Luz Júnior
Title: Global Chief Executive Officer
By: /s/Carlos Alberto Bezerra de Moura
Name: Carlos Alberto Bezerra de Moura
Title: Chief Financial and Investor Relations Officer
| 204 |
INDEX TO FINANCIAL STATEMENTS
| Consolidated Financial Statements: | |
| Report of Independent Registered Public Accounting Firm ( |
R-1 |
| Consolidated Statements of Financial Position as of December 31, 2021 and 2020 | F-4 |
| Consolidated Statements of Income (Loss) for the Years Ended December 31, 2021, 2020 and 2019 | F-5 |
| Consolidated Statements of Comprehensive Income (Loss) for the Years Ended December 31, 2021, 2020 and 2019 | F-6 |
| Consolidated Statements of Changes in Equity for the Years Ended December 31, 2021, 2020 and 2019 | F-7 |
| Consolidated Statements of Cash Flows for the Years Ended December 31, 2021, 2020 and 2019 | F-9 |
| Notes to the Consolidated Financial Statements | F-10 |
KPMG Auditores Independentes Ltda.
Rua Arquiteto Olavo Redig de Campos, 105, 6º andar - Torre A
04711-904 - São Paulo/SP - Brasil
Caixa Postal 79518 - CEP 04707-970 - São Paulo/SP - Brasil
Telefone +55 (11) 3940-1500
kpmg.com.br
Report of Independent Registered Public Accounting Firm
To the Shareholders and Board of Directors
BRF S.A.:
Opinions on the Consolidated Financial Statements and Internal Control Over Financial Reporting
We have audited the accompanying consolidated statements of financial position of BRF S.A. and subsidiaries (the Company) as of December 31, 2021 and 2020, the related consolidated statements of income (loss), comprehensive income (loss), changes in equity, and cash flows for each of the years in the three-year period ended December 31, 2021, and the related notes (collectively, the consolidated financial statements). We also have audited the Company’s internal control over financial reporting as of December 31, 2021, based on criteria established in Internal Control – Integrated Framework (2013) issued by the Committee of Sponsoring Organizations of the Treadway Commission.
In our opinion, the consolidated financial statements referred to above present fairly, in all material respects, the financial position of the Company as of December 31, 2021 and 2020, and the results of its operations and its cash flows for each of the years in the three-year period ended December 31, 2021, in conformity with International Financial Reporting Standards as issued by the International Accounting Standards Board. Also in our opinion, the Company maintained, in all material respects, effective internal control over financial reporting as of December 31, 2021 based on criteria established in Internal Control – Integrated Framework (2013) issued by the Committee of Sponsoring Organizations of the Treadway Commission.
Emphasis of matter
We draw attention to explanatory note 1.5 to the consolidated financial statements, which describe the investigations concluded by United States Government authorities and the ongoing investigations conducted by Brazilian Government authorities involving the Company, as well as their current and potential developments. In the current stage of the ongoing investigations, it is not possible to determine the potential financial and non-financial impacts on the Company as a result of those investigations and their potential developments and, consequently, to record potential losses which could have a material adverse effect on the Company´s financial position, results of operations and cash flows in the future.
Basis for Opinions
The Company’s management is responsible for these consolidated financial statements, for maintaining effective internal control over financial reporting, and for its assessment of the effectiveness of internal control over financial reporting, included in the accompanying Management’s Annual Report on Internal Control Over Financial Reporting. Our responsibility is to express an opinion on the Company’s consolidated financial statements and an opinion on the Company’s internal control over financial reporting based on our audits. We are a public accounting firm registered with the Public Company Accounting Oversight Board (United States) (PCAOB) and are required to be independent with respect to the Company in accordance with the U.S. federal securities laws and the applicable rules and regulations of the Securities and Exchange Commission and the PCAOB.
We conducted our audits in accordance with the standards of the PCAOB. Those standards require that we plan and perform the audits to obtain reasonable assurance about whether the consolidated financial statements are free of material misstatement, whether due to error or fraud, and whether effective internal control over financial reporting was maintained in all material respects.
| R-1 |
Our audits of the consolidated financial statements included performing procedures to assess the risks of material misstatement of the consolidated financial statements, whether due to error or fraud, and performing procedures that respond to those risks. Such procedures included examining, on a test basis, evidence regarding the amounts and disclosures in the consolidated financial statements. Our audits also included evaluating the accounting principles used and significant estimates made by management, as well as evaluating the overall presentation of the consolidated financial statements. Our audit of internal control over financial reporting included obtaining an understanding of internal control over financial reporting, assessing the risk that a material weakness exists, and testing and evaluating the design and operating effectiveness of internal control based on the assessed risk. Our audits also included performing such other procedures as we considered necessary in the circumstances. We believe that our audits provide a reasonable basis for our opinions.
Definition and Limitations of Internal Control Over Financial Reporting
A company’s internal control over financial reporting is a process designed to provide reasonable assurance regarding the reliability of financial reporting and the preparation of financial statements for external purposes in accordance with generally accepted accounting principles. A company’s internal control over financial reporting includes those policies and procedures that (1) pertain to the maintenance of records that, in reasonable detail, accurately and fairly reflect the transactions and dispositions of the assets of the company; (2) provide reasonable assurance that transactions are recorded as necessary to permit preparation of financial statements in accordance with generally accepted accounting principles, and that receipts and expenditures of the company are being made only in accordance with authorizations of management and directors of the company; and (3) provide reasonable assurance regarding prevention or timely detection of unauthorized acquisition, use, or disposition of the company’s assets that could have a material effect on the financial statements.
Because of its inherent limitations, internal control over financial reporting may not prevent or detect misstatements. Also, projections of any evaluation of effectiveness to future periods are subject to the risk that controls may become inadequate because of changes in conditions, or that the degree of compliance with the policies or procedures may deteriorate.
Critical Audit Matters
The critical audit matters communicated below are matters arising from the current period audit of the consolidated financial statements that were communicated or required to be communicated to the audit committee and that: (1) relates to accounts or disclosures that are material to the consolidated financial statements and (2) involved our especially challenging, subjective, or complex judgments. The communication of a critical audit matter does not alter in any way our opinion on the consolidated financial statements, taken as a whole, and we are not, by communicating the critical audit matters below, providing a separate opinion on the critical audit matters or on the accounts or disclosures to which they relate.
Recoverability of deferred tax assets
As discussed in Notes 3.9 and 10 to the consolidated financial statements, the Company has deferred tax assets of R$ 2,941,270 thousand as of December 31, 2021 relating to tax losses, negative basis of social contribution and temporary differences. In estimating the recoverability of deferred tax assets, the Company considers its budget and strategic plans to determine whether it is probable that these deferred tax credits will be realized.
We identified the evaluation of recoverability of deferred tax assets as a critical audit matter. Evaluation the recoverability of deferred tax assets involves a high degree of judgment to assess the significant assumptions that are reflected in the forecast of future taxable income. The significant assumptions include, net sales, cost of sales, operating and administrative expenses. In addition, changes in these assumptions could have a significant impact on the Company’s evaluation of the recoverability of the deferred tax assets.
| R-2 |
The following are the primary procedures we performed to address this critical audit matter. We evaluated the design and tested the operating effectiveness of certain internal controls over recoverability of deferred taxes assets, including controls related to the determination of assumptions used in the projections of future taxable income. We evaluated the consistency of these assumptions with the budget and strategic plan approved by the Board of Directors. We involved valuation professionals with specialized skills and knowledge, who assisted in (i) evaluating the assumptions by comparing the expectations of net sales, cost of sales and operating and administrative expenses to publicly available market data for comparable companies, and (ii) performing sensitivity analysis over the significant assumptions to assess their impact on the Company’s forecast of the future taxable income.
Acquisition-date fair value of the brands acquired through business combinations
As discussed in Notes 1.2.2, 1.2.3 and 13 to the consolidated financial statements, during the months of August and September 2021 the Company completed the acquisitions of Hercosul Group and Mogiana Group (both from the pet food sector) for a total consideration of R$ 812,921 thousand and R$ 481,435 thousand, respectively. The Company measured the identifiable assets acquired and liabilities assumed at fair value, which resulted in the recognition of assets, including brands intangible assets in the total amount of R$ 474,875 thousand.
We identified the acquisition-date fair value of the brands acquired through the business combination of Grupo Hercosul and Grupo Mogiana as a critical audit matter. Fair value is determined using a discounted cash flow model. Evaluating certain inputs used in the discounted cash flow model for each brand involved a high degree of auditor judgment due to the significant uncertainty in measuring the assumptions. The key assumptions used within the valuation models included revenue growth rates, royalty rates and discount rates. In addition, changes in the revenue growth rates and royalty rates may change the fair value of the brands by a significant amount.
The following are the primary procedures we performed to address this critical audit matter. We evaluated the design and tested the operating effectiveness of certain internal controls over the development of the revenue growth rates, royalty rates, and the discount rates assumptions for each brand used in the calculation of fair value. We involved valuation professionals with specialized skills and knowledge, who assisted in: (i) comparing the Company’s forecasted revenue growth rates for each brand to historical results and to forecasted growth rates in the sector; (ii) performing sensitivity analyses over those assumptions to assess their impact on the Company’s determination of the fair value of the brands; (iii) evaluating the royalty rates comparing them to publicly available market data for comparable companies; and (iv) evaluating the discount rate by independently developing discount rates using publicly available market data and comparing them to the Company’s discount rates.
/s/ KPMG Auditores Independentes Ltda.
We have served as the Company’s auditor since 2017.
São Paulo, Brazil
March 25, 2022
| R-3 |
INDEX
BRF S.A. | 2021 AND 2020 CONSOLIDATED FINANCIAL STATEMENTS | F-2 |
| 32. INSURANCE COVERAGE | F-80 |
| 33. TRANSACTIONS THAT DO NOT INVOLVE CASH | F-80 |
| 34. EVENTS AFTER THE REPORTING PERIOD | F-80 |
| 35. APPROVAL OF THE CONSOLIDATED FINANCIAL STATEMENTS | F-81 |
BRF S.A. | 2021 AND 2020 CONSOLIDATED FINANCIAL STATEMENTS | F-3 |
(in thousands of Brazilian Reais)
CONSOLIDATED STATEMENTS OF FINANCIAL POSITION
| ASSETS | Note | 12.31.21 | 12.31.20 | LIABILITIES | Note | 12.31.21 | 12.31.20 | |||||
| CURRENT ASSETS | CURRENT LIABILITIES | |||||||||||
| Cash and cash equivalents | 4 | |
|
Loans and borrowings | 14 | |
| |||||
| Marketable securities | 5 | |
|
Trade accounts payable | 15 | | ||||||
| Trade and other receivables | 6 | |
|
Supply chain finance | 16 | |
| |||||
| Inventories | 7 | |
|
Lease liability | 17 | |
| |||||
| Biological assets | 8 | |
|
Payroll, related charges and employee profit sharing | |
| ||||||
| Recoverable taxes | 9 | |
|
Taxes payable | |
| ||||||
| Recoverable income taxes | 9 | Derivative financial instruments | 23 | |
| |||||||
| Derivative financial instruments | 23 | |
|
Provision for tax, civil and labor risks | 20 | |
| |||||
| Restricted cash | Employee benefits | 19 | | |||||||||
| Assets held for sale | |
Liabilities directly associated with assets held for sale | - | |||||||||
| Other current assets | |
|
Other current liabilities | |
| |||||||
| Total current assets | Total current liabilities | |||||||||||
| NON-CURRENT ASSETS | NON-CURRENT LIABILITIES | |||||||||||
| LONG-TERM RECEIVALBLES | Loans and borrowings | 14 | ||||||||||
| Marketable securities | 5 | |
|
Trade accounts payable | 15 | |||||||
| Trade and other receivables | 6 | Lease liability | 17 | |
| |||||||
| Recoverable taxes | 9 | |
|
Taxes payable | |
| ||||||
| Recoverable income taxes | 9 | |
Provision for tax, civil and labor risks | 20 | |
| ||||||
| Deferred income taxes | 10 | |
|
Deferred income taxes | 10 | |||||||
| Judicial deposits | 11 | |
|
Employee benefits | 19 | |
| |||||
| Biological assets | 8 | |
|
Derivative financial instruments | 23 | | ||||||
| Derivative financial instruments | 23 | |
Other non-current liabilities | |
| |||||||
| Restricted cash | ||||||||||||
| Other non-current assets | ||||||||||||
| Total long-term receivables | |
Total non-current liabilities | ||||||||||
| EQUITY | 21 | |||||||||||
| Capital | ||||||||||||
| Capital reserves | |
| ||||||||||
| Other equity transactions | ( |
| ||||||||||
| Investments | |
Accumulated losses | ( |
( | ||||||||
| Property, plant and equipment | 12 | Treasury shares | ( |
( | ||||||||
| Intangible assets | 13 | |
|
Other comprehensive loss | ( |
( | ||||||
| Attributable to controlling shareholders | |
| ||||||||||
| Non-controlling interests | |
| ||||||||||
| Total non-current assets | Total equity | |
| |||||||||
| TOTAL ASSETS | TOTAL LIABILITIES AND EQUITY | |||||||||||
The accompanying notes are an integral part of the financial statements.
BRF S.A. | 2021 AND 2020 CONSOLIDATED FINANCIAL STATEMENTS | F-4 |
(in thousands of Brazilian Reais)
CONSOLIDATED STATEMENTS OF INCOME (LOSS)
| Note | 12.31.21 | 12.31.20 (1) | 12.31.19 (1) | ||||
| CONTINUING OPERATIONS | |||||||
| NET SALES | 25 | |
| ||||
| Cost of sales | 28 | ( |
( |
( | |||
| GROSS PROFIT | |
| |||||
| OPERATING INCOME (EXPENSES) | |||||||
| Selling expenses | 28 | ( |
( |
( | |||
| General and administrative expenses | 28 | ( |
( |
( | |||
| Impairment loss on trade receivables | 6 | ( |
( |
( | |||
| Other operating income (expenses), net | 26 | |
|||||
| Income from associates and joint ventures | - | - | ( | ||||
| INCOME BEFORE FINANCIAL RESULTS AND INCOME TAXES | |
| |||||
| Financial income | |
| |||||
| Financial expenses | ( |
( |
( | ||||
| Foreign exchange and monetary variations | ( |
( |
( | ||||
| FINANCIAL INCOME (EXPENSES), NET | 27 | ( |
( |
( | |||
| INCOME (LOSS) BEFORE TAXES | ( |
|
|||||
| Income taxes | 10 | |
|||||
| INCOME FROM CONTINUING OPERATIONS | 1.3 | |
|
| |||
| LOSS FROM DISCONTINUED OPERATIONS | ( |
- | ( | ||||
| INCOME FOR THE YEAR | |
|
|||||
| Net Income from Continuing Operation Attributable to | |||||||
| Controlling shareholders | |
|
| ||||
| Non-controlling interest | |
||||||
| INCOME (LOSS) FROM CONTINUING OPERATIONS | |
|
| ||||
| Net Loss From Discontinued Operations Attributable to | |||||||
| Controlling shareholders | ( |
- | ( | ||||
| Non-controlling interest | - | - | ( | ||||
| ( |
- | ( | |||||
| INCOME PER SHARE FROM CONTINUED OPERATIONS | |||||||
| Weighted average shares outstanding - basic | |||||||
| Income per share - basic | 22 | |
| ||||
| Weighted average shares outstanding - diluted | |||||||
| Income per share - diluted | 22 | |
| ||||
| LOSSES PER SHARE FROM DISCONTINUED OPERATIONS | |||||||
| Weighted average shares outstanding - basic | - | ||||||
| Losses per share - basic | 22 | ( |
- | ( | |||
| Weighted average shares outstanding - diluted | - | ||||||
| Losses per share - diluted | 22 | ( |
- | ( | |||
| (1) |
The accompanying notes are an integral part of the financial statements.
BRF S.A. | 2021 AND 2020 CONSOLIDATED FINANCIAL STATEMENTS | F-5 |
(in thousands of Brazilian Reais)
CONSOLIDATED STATEMENTS OF COMPREHENSIVE INCOME (LOSS)
| Note | 12.31.21 | 12.31.20 (1) | 12.31.19 (1) | ||||
| Income for the year | |
||||||
| Other comprehensive income (loss), net of taxes | |||||||
| Loss on foreign currency translation of foreign operations | ( |
( |
|||||
| Loss on net investment hedge | ( |
( |
( | ||||
| Cash flow hedges – effective portion of changes in fair value | 23 | ( |
|||||
| Cash flow hedges – reclassified to profit or loss | 23 | ( |
( |
( | |||
| Debt investments measured at FVTOCI (1) - changes in fair value | 5 | - | |
||||
| Items that are or may be reclassified subsequently to profit or loss | ( |
( |
|||||
| Equity investments measured at FVTOCI (1) - changes in fair value | 5 | |
|||||
| Actuarial gains on pension and post-employment plans | 19 | |
( | ||||
| Items that will not be reclassified to profit or loss | |
( | |||||
| Comprehensive income (loss) for the year | ( |
|
|||||
| Attributable to | |||||||
| Controlling shareholders | ( |
|
|||||
| Non-controlling interest | ( |
( | |||||
| Total comprehensive income (loss), net of taxes | ( |
|
|||||
| (1) |
Items above are stated net of income taxes and the related taxes are disclosed in note 10.
The accompanying notes are an integral part of the financial statements.
BRF S.A. | 2021 AND 2020 CONSOLIDATED FINANCIAL STATEMENTS | F-6 |
(in thousands of Brazilian Reais)
CONSOLIDATED STATEMENTS OF CHANGES IN EQUITY
| Attributed to controlling shareholders | |||||||||||||||||||||||||||||||
| Other comprehensive income (loss) | |||||||||||||||||||||||||||||||
| Capital | Capital reserves | Other equity transactions (4) | Treasury shares | Accumulated foreign currency translation adjustments | Gains (losses) on marketable securities at FVTOCI (2) | Gains (losses) on cash flow hedge | Actuarial gains (losses) | Retained losses | Total equity | Non-controlling interest | Total shareholders' equity (consolidated) | ||||||||||||||||||||
| BALANCES AT DECEMBER 31, 2018 | ( |
( |
( |
( |
( |
( |
( |
|
|
| |||||||||||||||||||||
| Adoption of IFRS 16 | - | - | - | - | - | - | - | 6,287 | 6,287 | - | 6,287 | ||||||||||||||||||||
| Comprehensive income (loss) (1) | |||||||||||||||||||||||||||||||
| Gains (losses) on foreign currency translation of foreign operations | - | - | - | |
- | - | - | |
( |
| |||||||||||||||||||||
| Loss on net investment hedge | - | - | - | ( |
- | - | - | ( |
- | ( | |||||||||||||||||||||
| Marketable securities at FVTOCI (2) - changes in fair value | - | - | - | - | - | - | - | |
- | | |||||||||||||||||||||
| Unrealized losses in cash flow hedge | - | - | - | - | |
- | - | |
- | | |||||||||||||||||||||
| Actuarial losses on pension and post-employment plans | - | - | - | - | - | ( |
- | ( |
( |
( | |||||||||||||||||||||
| Income (loss) for the year | - | - | - | - | - | - | |
|
( |
| |||||||||||||||||||||
| SUB-TOTAL COMPREHENSIVE INCOME (LOSS) | - | - | - | |
|
( |
|
|
( |
| |||||||||||||||||||||
| Realized loss in marketable securities at FVTOCI (2) | - | - | - | - | - | - | ( |
- | - | - | |||||||||||||||||||||
| Employee benefits remeasurement - defined benefit | - | - | - | - | - | ( |
|
- | - | - | |||||||||||||||||||||
| Appropriation of income (loss) | |||||||||||||||||||||||||||||||
| Dividends | - | - | - | - | - | - | - | - | ( |
( | |||||||||||||||||||||
| Share-based payments | - | - | ( |
|
- | - | - | - | |
- | | ||||||||||||||||||||
| Acquisition of non-controlling interests | - | - | - | - | - | - | - | |
( |
( | |||||||||||||||||||||
| BALANCES AT DECEMBER 31, 2019 | ( |
( |
|
( |
( |
( |
|
|
| ||||||||||||||||||||||
| Comprehensive income (loss) (1) | |||||||||||||||||||||||||||||||
| Gains (losses) on foreign currency translation of foreign operations | - | - | - | ( |
- | - | - | ( |
|
( | |||||||||||||||||||||
| Loss on net investment hedge | - | - | - | ( |
- | - | - | ( |
- | ( | |||||||||||||||||||||
| Marketable securities at FVTOCI (2) - changes in fair value | - | - | - | - | |
- | - | - | - | ||||||||||||||||||||||
| Unrealized losses in cash flow hedge | - | - | - | - | ( |
- | - | ( |
- | ( | |||||||||||||||||||||
| Actuarial losses on pension and post-employment plans | - | - | - | - | - | - | ( |
||||||||||||||||||||||||
| Income for the year | - | - | - | - | - | - | |
|
|
| |||||||||||||||||||||
| SUB-TOTAL COMPREHENSIVE INCOME (LOSS) | - | - | - | ( |
|
( |
|
|
|
| |||||||||||||||||||||
| Employee benefits remeasurement - defined benefit | - | - | - | - | - | ( |
|
- | - | - | |||||||||||||||||||||
| Appropriation of income (loss) | |||||||||||||||||||||||||||||||
| Dividends | - | - | - | - | - | - | - | - | ( |
( | |||||||||||||||||||||
| Share-based payments | - | - | |
|
- | - | - | - | |
- | | ||||||||||||||||||||
| Acquisition of non-controlling interests (3) | - | - | ( |
- | - | - | - | - | ( |
( |
( | ||||||||||||||||||||
| Acquisition of treasury shares | - | - | ( |
- | - | - | - | ( |
- | ( | |||||||||||||||||||||
| BALANCES AT DECEMBER 31, 2020 | |
( |
( |
|
( |
( |
( |
|
|
| |||||||||||||||||||||
| (1) |
| (2) |
| (3) |
| (4) |
BRF S.A. | 2021 AND 2020 CONSOLIDATED FINANCIAL STATEMENTS | F-7 |
(in thousands of Brazilian Reais)
| Attributed to controlling shareholders | |||||||||||||||||||||||||||||||
| Other comprehensive income (loss) | |||||||||||||||||||||||||||||||
| Capital | Capital reserves | Other equity transactions (5) | Treasury shares | Accumulated foreign currency translation adjustments | Gains (losses) on marketable securities at FVTOCI (2) | Gains (losses) on cash flow hedge | Actuarial gains (losses) | Retained losses | Total equity | Non-controlling interest | Total shareholders' equity (consolidated) | ||||||||||||||||||||
| BALANCES AT DECEMBER 31, 2020 | |
( |
( |
|
( |
( |
( |
|
|
| |||||||||||||||||||||
| Comprehensive income (loss) (1) | |||||||||||||||||||||||||||||||
| Losses on foreign currency translation of foreign operations | - | - | - | ( |
- | - | - | ( |
( |
( | |||||||||||||||||||||
| Losses on net investment hedge | - | - | - | ( |
- | - | - | ( |
- | ( | |||||||||||||||||||||
| Marketable securities at FVTOCI (2) - changes in fair value | - | - | - | - | - | - | - | |
- | | |||||||||||||||||||||
| Unrealized losses in cash flow hedge | - | - | - | - | ( |
- | - | ( |
( |
( | |||||||||||||||||||||
| Actuarial gains (losses) on pension and post-employment plans | - | - | - | - | - | |
- | |
( |
| |||||||||||||||||||||
| Income for the year | - | - | - | - | - | - | |
|
|
| |||||||||||||||||||||
| SUB-TOTAL COMPREHENSIVE INCOME (LOSS) | - | - | - | ( |
( |
|
|
( |
( |
( | |||||||||||||||||||||
| Marketable securities at FVTOCI (2) - realized gain | - | - | - | - | ( |
- | - | |
- | - | - | ||||||||||||||||||||
| Employee benefits remeasurement - defined benefit | - | - | - | - | - | ( |
- | - | - | ||||||||||||||||||||||
| Dividends | - | - | - | - | - | - | - | - | ( |
( | |||||||||||||||||||||
| Share-based payments | - | - | ( |
( |
- | - | - | - | ( |
- | ( | ||||||||||||||||||||
| Acquisition of minority shareholders (3) | - | - | ( |
- | - | - | - | - | ( |
( |
( | ||||||||||||||||||||
| Write-off of put option held by minority shareholders (4) | - | - | - | - | - | - | - | |
|
| |||||||||||||||||||||
| BALANCES AT DECEMBER 31, 2021 | ( |
( |
( |
( |
( |
( |
|
|
| ||||||||||||||||||||||
| (1) |
| (2) |
| (3) |
| (4) |
| (5) |
The accompanying notes are an integral part of the financial statements.
BRF S.A. | 2021 AND 2020 CONSOLIDATED FINANCIAL STATEMENTS | F-8 |
(in thousands of Brazilian Reais)
CONSOLIDATED STATEMENTS OF CASH FLOWS
| Restated (4) | Restated (4) | |||||
| 12.31.21 | 12.31.20 | 12.31.19 | ||||
| OPERATING ACTIVITIES | ||||||
| Income from continuing operations | | |||||
| Adjustments for: | ||||||
| Depreciation and amortization | |
| ||||
| Depreciation and depletion of biological assets | |
| ||||
| Result on disposal of property, plant and equipments and investment | ( |
| ||||
| Write-down of inventories to net realizable value | | |||||
| Provision for tax, civil and labor risks | | |||||
| Impairment | - | | ||||
| Income from investments under the equity method | - | - | | |||
| Financial results, net | |
| ||||
| Tax recoveries and gains in tax lawsuits | ( |
( |
( | |||
| Deferred income tax | ( |
( |
( | |||
| Employee profit sharing | | |||||
| Other provisions | | |||||
| |
| |||||
| Trade accounts receivable | ( |
( | ||||
| Inventories | ( |
( |
( | |||
| Biological assets - current | ( |
( |
( | |||
| Trade accounts payable | |
( | ||||
| Supply chain finance | ( | |||||
| Cash generated by operating activities | |
| ||||
| Investments in securities at FVTPL (1) | ( |
- | ( | |||
| Redemptions of securities at FVTPL (1) | | |||||
| Interest received | | |||||
| Dividends and interest on shareholders' equity received | - | - | | |||
| Payment of tax, civil and labor provisions | ( |
( |
( | |||
| Derivative financial instruments | ( | |||||
| Payment of income taxes | - | ( |
( | |||
| Other operating assets and liabilities (2) | ( |
| ||||
| Net cash provided by operating activities | |
| ||||
| INVESTING ACTIVITIES | ||||||
| Investments in securities at amortized cost | ( |
- | ( | |||
| Redemptions of securities at amortized cost | - | | ||||
| Investments in securities at FVTOCI (3) | ( |
- | - | |||
| Redemptions of securities at FVTOCI (3) | | |||||
| Redemption of restricted cash | |
| ||||
| Additions to property, plant and equipment | ( |
( |
( | |||
| Additions to biological assets - non-current | ( |
( |
( | |||
| Proceeds from disposals of property, plant, equipments and investment | | |||||
| Additions to intangible assets | ( |
( |
( | |||
| Business combination, net of cash | ( |
- | - | |||
| Sale of participation in subsidiaries with loss of control | ( | |||||
| Acquisition of participation in joint ventures and subsidiaries | ( |
- | ||||
| Net cash used in investing activities | ( |
( |
| |||
| Net cash used in investing activities from discontinued operations | ( |
- | ( | |||
| Net cash used in investing activities | ( |
( |
| |||
| FINANCING ACTIVITIES | ||||||
| Proceeds from debt issuance | |
| ||||
| Repayment of debt | ( |
( |
( | |||
| Payment of interest | ( |
( |
( | |||
| Payment of interest derivatives - fair value hedge | ( |
- | - | |||
| Treasury shares acquisition | ( |
( |
- | |||
| Acquisition of non-controlling interests | ( |
( |
( | |||
| Payment of lease liabilities | ( |
( |
( | |||
| Net cash used in financing activities | ( |
( |
( | |||
| Net cash provided by financing activities from discontinued operations | - | - | | |||
| Net cash used in financing activities | ( |
( |
( | |||
| EFFECT OF EXCHANGE RATE VARIATION ON CASH AND CASH EQUIVALENTS | | |||||
| Net increase (decrease) in cash and cash equivalents | ( |
( | ||||
| Balance at the beginning of the year | |
| ||||
| Balance at the end of the year | |
|
| (1) |
| (2) |
| (3) |
| (4) |
The accompanying notes are an integral part of the financial statements.
BRF S.A. | 2021 AND 2020 CONSOLIDATED FINANCIAL STATEMENTS | F-9 |
| 1. | COMPANY’S OPERATIONS |
BRF S.A. (“BRF”) and its subsidiaries (collectively the “Company”) is a publicly traded company, listed on the segment Novo Mercado of Brasil, Bolsa, Balcão (“B3”), under the ticker BRFS3, and listed on the New York Stock Exchange (“NYSE”), under the ticker BRFS. The Company’s registered office is at Rua Jorge Tzachel, nº 475, Bairro Fazenda, Itajaí - Santa Catarina and the main business office is in the city of São Paulo.
BRF is a Brazilian multinational company, with global presence, which owns a comprehensive portfolio of products, and it is one of the world’s largest companies of food products. The Company operates by raising, producing and slaughtering poultry and pork for processing, production and sale of fresh meat, processed products, pasta, margarine, pet food and others.
The Company holds as main brands Sadia, Perdigão, Qualy, Chester®, Kidelli, Perdix, Banvit, Biofresh and Gran Plus, present mainly in Brazil, Turkey and Middle Eastern countries.
BRF S.A. | 2021 AND 2020 CONSOLIDATED FINANCIAL STATEMENTS | F-10 |
1.1. Equity interest
| % equity interest | |||||||||
| Entity | Main activity | Country (1) | 12.31.21 | 12.31.20 | |||||
| (n) | | ||||||||
| (g) | | ||||||||
| | |||||||||
| | |||||||||
| | |||||||||
| (h) | |||||||||
| | |||||||||
| | |||||||||
| | |||||||||
| | |||||||||
| | |||||||||
| | |||||||||
| | |||||||||
| | |||||||||
| | |||||||||
| (d) | - | | |||||||
| | |||||||||
| | |||||||||
| | |||||||||
| | |||||||||
| (p) | | ||||||||
| | |||||||||
| | |||||||||
| (b) | - | ||||||||
| (c) | | ||||||||
| | |||||||||
| (p) | | ||||||||
| (e) | - | | |||||||
| (o) | | ||||||||
| | |||||||||
| (a) | | ||||||||
| (f) | - | ||||||||
| | |||||||||
| | |||||||||
| (f) | - | | |||||||
| | |||||||||
| (p) | | ||||||||
| (p) | | ||||||||
| (a) | | ||||||||
| (a) | | ||||||||
| | |||||||||
| | |||||||||
| (m) | - | ||||||||
| - | |||||||||
| (j) | - | ||||||||
| - | |||||||||
| - | |||||||||
| - | |||||||||
| (k) | - | ||||||||
| (m) | - | ||||||||
| - | |||||||||
| (k) | - | ||||||||
| (i) | - | | |||||||
| | |||||||||
| | |||||||||
| | |||||||||
| (a) | | ||||||||
| | |||||||||
| | |||||||||
| (l) | - | | |||||||
| | |||||||||
| | |||||||||
| | |||||||||
| (a) | |||||||||
| (a) | |||||||||
| (1) |
| (a) |
| (b) |
| (c) |
BRF S.A. | 2021 AND 2020 CONSOLIDATED FINANCIAL STATEMENTS | F-11 |
| (d) |
| (e) |
| (f) |
| (g) |
| (h) |
| (i) |
| (j) |
| (k) |
| (l) |
| (m) |
| (n) |
| (o) |
| (p) |
Except for the associate PR-SAD, in which the Company recognizes the investments by the equity method, all other entities presented in the table above were consolidated.
| 1.1.1. | Acquisition of minority shareholding in BRF Kuwait WLL |
On March 9, 2021 the Company, through its wholly-owned subsidiary One Foods Holdings Ltd. (“One Foods”) acquired from Al Yasra Food Company W.L.L their minority stake of 25% of BRF Kuwait WLL (previously named BRF Al Yasra Food K.S.C.C. or BRF AFC), entity located in Kuwait, responsible for the distribution of BRF products in the country.
The transaction was concluded for the
amount equivalent to R$
| 1.1.2. | Sale of the shares held in Banvit Foods SRL |
On May 4, 2021, Nutrinvestment BV and
Banvit Bandirma Vitaminli, indirectly controlled subsidiaries of the Company, concluded the sale to Aaylex System Group S.A. of 100% of
the shares held in Banvit Foods SRL, engaged in the activities of manufacture of animal feed and egg hatchery in Romania. The sale amount,
received on that date, was equivalent to R$132,425 (EUR 20,300). In June, the parties established a price adjustment due to net debt and
working capital, in the amount equivalent to R$
| 1.1.3. | Amendment to the shareholders’ agreement of TBQ Foods GmbH |
On December 13, 2021, the Company, through its wholly-owned indirect subsidiaries BRF Foods GmbH and One Foods Holdings Ltd. has executed an amendment to the shareholders’ agreement with Qatar Holding LLC, a wholly-owned subsidiary of the Qatar Investment Authority (“QIA”). The amendment provides for new terms and conditions to the partnership between BRF and QIA in TBQ Foods GmbH (“TBQ”), a holding company held 60% by BRF and 40% by QIA, which holds 91.71% of the shares issued by Banvit Bandırma Vitaminli Yem Sanayi Anonim Şirketi (“Banvit”).
In the Amendment, BRF and QIA have agreed on the termination of the put option available to QIA under the original shareholders’ agreement. From 2023, QIA will have further alternatives to liquidate its investment in Banvit and BRF’s financial liability towards QIA has been terminated.
On this date, the financial liability
related to the put option held by QIA, in the amount of R$315,319, was derecognized with the corresponding increase in the non-controlling
interests in consolidated Equity, in the amount of R$294,661. The difference between the liability and the book value of the non-controlling
interest on December 13, 2021, in the amount of R$
BRF S.A. | 2021 AND 2020 CONSOLIDATED FINANCIAL STATEMENTS | F-12 |
1.2. Business combinations
| 1.2.1. | Joody Al Sharqiya Food Production Factory |
On , through its wholly-owned subsidiary Badi Limited ("Badi"), the Company concluded the acquisition of % of the capital stock of Joody Al Sharqiya Food Production Factory ("Joody Al"), a food processing company in Saudi Arabia. The fair value of the consideration transferred was equivalent to R$40,720 (SAR29,195) paid in cash and, from this date, Joody Al has become a wholly-owned subsidiary of Badi.
The goodwill of R$11,476 arising from the business combination consists mainly of the synergies expected with the combination of the operations of BRF and Joody Al, strengthening the Company’s presence in the Saudi Arabian market. The results and the goodwill from this business combination are presented in the International segment (note 24).
The fair value of the acquired assets and assumed liabilities in the business combination is presented below:
| Fair value at the acquisition date | ||
| Assets | ||
| Cash and cash equivalents | | |
| Inventories | | |
| Property, plant and equipment | ||
| Other current and non-current assets | | |
| Liabilities | ||
| Trade accounts payable | ||
| Taxes payable | | |
| Employee benefits | | |
| Other current and non-current liabilities | | |
| Net assets acquired | ||
| Fair value of consideration transferred | ||
| Goodwill |
BRF S.A. | 2021 AND 2020 CONSOLIDATED FINANCIAL STATEMENTS | F-13 |
| 1.2.2. | Hercosul Group |
On August 2, 2021 the Company concluded the acquisition of 100% of the capital stock of the companies that compose the Hercosul Group, after with the fulfillment of the conditions precedent. From this date, BRF Pet S.A. (“BRF Pet”) became owner of 100% of Gewinner Participações Ltda. and 99% of Hercosul International S.R.L. (“Hercosul International”) and BRF S.A. became owner of 1% of Hercosul International.
The fair value of the assets acquired and liabilities assumed in the business combination with Hercosul Group is presented below:
| Fair value at the acquisition date | ||||
| Gewinner Participações Consolidated |
Hercosul International | |||
| Assets | ||||
| Cash and cash equivalents | ||||
| Trade and other receivables | ||||
| Inventories | ||||
| Recoverable taxes | ||||
| Property, plant and equipment | ||||
| Intangible assets | ||||
| Other current and non-current assets | ||||
| Liabilities | ||||
| Social and Labor Obligations | | |||
| Trade accounts payable | ||||
| Taxes payable | | |||
| Loans and borrowings | ||||
| Provision for tax, civil and labor risks (1) | - | |||
| Lease liability | | |||
| Deferred income taxes | - | |||
| Other current and non-current liabilities | ||||
| Net assets acquired | ||||
| Fair value of consideration transferred | ||||
| Goodwill | ||||
| (1) |
The fair value of the consideration transferred was of R$812,921, of which R$675,355 was paid in cash, R$119,180 will be paid in the next 4 years and R$18,386 refers to contingent consideration. The amount payable is subject to interest and was recorded as Other liabilities, with subsequent changes recorded as Financial expenses.
According to conditions established in the acquisition contract, which are common to transactions of this nature, the amount of the consideration may be adjusted based on the net debt and working capital of the Hercosul Group, for which the Company has used its best estimate at the disclosure date of these consolidated financial statements. There is no maximum amount defined for the price adjustment.
The recognized contingent consideration is linked to the gain, by the acquired entities, in administrative and legal proceedings existing on the acquisition date. In order to determine the fair value, the prognosis of the attorneys representing each case was considered, in addition to the business aspects determined in the acquisition contract. The payment of the contingent consideration will be made as the legal proceedings are terminated favorably to the Hercosul Group and it uses its economic benefits.
It is worth noting that these processes will be registered within the Hercosul Group when they meet the criteria for asset recognition.
BRF S.A. | 2021 AND 2020 CONSOLIDATED FINANCIAL STATEMENTS | F-14 |
The measurement of assets acquired and liabilities assumed was completed up to the date of disclosure of these consolidated financial statements and the main assets and liabilities identified that received fair value allocations in the business combination were: property, plant and equipment, inventories, customer relationship, trademarks and contingent liabilities.
The contingent liability recognized
at the amount of R$
The goodwill consists mainly of the value of the synergies expected from the combination of the operations of BRF Pet, Mogiana Group (defined in the note 1.2.3) and Hercosul Group, reinforcing BRF's presence in the pet food sector. The results, intangible assets with indefinite useful life and goodwill arising from this business combination are presented in Other segments (note 24). The Company expects that the goodwill recorded will be deductible for tax purposes.
The Company incurred in expenses with
advisors, lawyers and other related to the acquisition and integration of Hercosul Group in the amount of R$
This business combination contributed
net revenue of R$
BRF S.A. | 2021 AND 2020 CONSOLIDATED FINANCIAL STATEMENTS | F-15 |
| 1.2.3. | Mogiana Group |
On September 1, 2021, the Company, through its wholly-owned subsidiary BRF Pet concluded the acquisition of Paraguassu Participações S.A. ("Paraguassu") and Affinity Petcare Brasil Participações Ltda. ("Affinity"), both owner of 100% of the capital stock of Mogiana Alimentos S.A. (together form the “Mogiana Group”), after fulfillment of all conditions precedent. Therefore, from this date, Paraguassu and Affinity became wholly-owned subsidiaries of BRF Pet.
The fair value of the assets acquired and liabilities assumed in the business combination with Hercosul Group is presented below:
| Mogiana Group Combined | Fair value at the acquisition date | |
| Assets | ||
| Cash and cash equivalents | | |
| Marketable securities | ||
| Trade and other receivables | ||
| Inventories | ||
| Recoverable taxes | ||
| Property, plant and equipment | ||
| Intangible assets | ||
| Other current and non-current assets | ||
| Liabilities | ||
| Trade accounts payable | ||
| Loans and borrowings | ||
| Lease liability | ||
| Taxes payable | ||
| Payroll, related charges and employee profit sharing | 6,296 | |
| Provision for tax, civil and labor risks (1) | 34,976 | |
| Employee benefits | ||
| Deferred income taxes | | |
| Other current and non-current liabilities | ||
| Net assets acquired | ||
| Fair value of consideration transferred | ||
| Goodwill |
| (1) |
The fair value of the consideration transferred was of R$481,435 of which R$290,225 was paid in cash, R$145,548 will be paid in the next 6 years and R$45,662 refers to contingent consideration. The amount payable is subject to interest and was recorded as Other liabilities, with subsequent changes recorded as Financial expenses. In addition, from the term value, R$60,000 will be deposited in an escrow account (restricted cash) after the first anniversary of the acquisition, as a guarantee for BRF Pet in case of eventual indemnities provided for in the acquisition contract.
According to conditions established in the acquisition contract, which are common to transactions of this nature, the amount of the consideration may be adjusted based on the net debt and working capital of Mogiana Alimentos S.A. and for which the Company has used its best estimate at the disclosure date of these consolidated financial statements. There is no maximum amount defined for the price adjustment.
The recognized contingent consideration is linked to the gain, by the acquired entities, in administrative and legal proceedings existing on the acquisition date. In order to determine the fair value, the prognosis of the attorneys representing each case was considered, in addition to the business aspects determined in the purchase and sale agreement. The payment of the contingent consideration will be made as the legal proceedings are won by the Mogiana Group and it uses its economic benefits. In the year ended December 31, 2021, R$2,830 were paid in relation to the contingent consideration.
BRF S.A. | 2021 AND 2020 CONSOLIDATED FINANCIAL STATEMENTS | F-16 |
It is worth noting that these processes will be registered within the Mogiana Group when they meet the criteria for asset recognition.
The measurement of assets acquired and liabilities assumed was completed up to the date of disclosure of these consolidated financial statements and the main assets and liabilities identified that received fair value allocation in the business combination were: property, plant and equipment, inventories, customer relationship, trademarks, contingent liabilities and taxes payable (recognized under Other Non-current Liabilities).
The contingent liability recognized at the amount of R$28,853, is related to legal proceedings classified as present obligations and for which the fair value was measured reliably, based on premises that include the metrics agreed in the share purchase agreement.
The goodwill consists mainly of the value of the synergies expected from the combination of the operations of BRF Pet, Mogiana Group and Hercosul Group, reinforcing BRF's presence in the pet food sector. The results, intangible assets with indefinite useful life and goodwill arising from this business combination are presented in Other segments (note 24). The Company expects that the goodwill recorded will be deductible for tax purposes.
The Company incurred in expenses with
advisors, lawyers and other related to the acquisition and integration of Mogiana in the amount of R$
This business combination contributed
net revenue of R$
| 1.2.4. | Effects of the business combinations as though the acquisition date had been as of the beginning of the year |
If the business combinations had occurred at the beginning of the year ended December 31, 2021, the consolidated net sales for the year would be R$48,870,891 and the consolidated net profit for the year would be R$429,081.
| 1.3. | Discontinued Operations |
In the year ended December 31, 2021, the Company completed the price adjustment processes related to sale of Campo Austral S.A. and Avex S.A. The referred price adjustments totaled an expense of R$59,270 (R$47,802 net of taxes) and are presented in Net Loss from Discontinued Operations, consistently with the practice adopted in the sale of the operations in 2019.
On December 21, 2021, the Company entered into an agreement with Marfrig Global Foods S.A. (“Marfrig”) and MFG Holding S.A.U. in order to settle indemnities related to the sale of the previously controlled entity Quickfood S.A. to Marfrig, concluded on January 2, 2019. This transaction resulted in an expense of R$48,768 (R$32,128 net of income taxes), which is presented under Net Loss from Discontinued Operations, consistently with the practice adopted in the sale of operations in 2019.
| 1.4. | Partnership – self-generation of energy |
| 1.4.1. | Partnership with AES |
On August 16, 2021, the Company executed an investment agreement with a subsidiary of AES Brasil Energia S.A. to incorporate a joint venture for the construction of a wind energy park for self-generation in the wind farm complex of Cajuína, Rio Grande do Norte, with an installed capacity of 160MWm (average Megawatt), generating 80MWm to be supplied to the Company by means of a 15-year power purchase agreement.
The partnership was closed on March 14, 2022 and the operation of the park is scheduled to begin by 2024.
| 1.4.2. | Partnership with PontoOn |
On September 16, 2021, the Company together with Intrepid Participações S.A. (“Intrepid”) entered into a 15-year renewable energy power purchase agreement together with a call option agreement, which provides for the entry of BRF, through a holding company jointly held with Intrepid, aiming the construction of a sun energy self-generation plant in Mauriti and Milagres, Ceará, with an installed capacity of 320MWp (Megawatt-peak) generating, on average, 80MWm.
BRF S.A. | 2021 AND 2020 CONSOLIDATED FINANCIAL STATEMENTS | F-17 |
The call option agreement provides BRF with the right to acquire participation in Intrepid for a fixed price. Should BRF exercise the option, the Company will directly invest the approximate amount of R$50 million, to be disbursed during the Project’s development. The operation of the complex is scheduled to begin by 2024.
| 1.5. | Investigations involving BRF |
The Company has been subject to two investigations conducted by Brazilian governmental entities, denominated “Carne Fraca Operation” in 2017 and “Trapaça Operation” in 2018. The Company’s Audit and Integrity Committee conducted independent investigations, along with the Independent Investigation Committee, composed of external members and with external legal advisors in Brazil and abroad with respect to the allegations involving BRF employees and former employees.
The main impacts observed as result
of the referred investigations were recorded in Other Operating Expenses in the amount of R$
In addition to the impacts already recorded, there are uncertainties about the outcome of these investigations which may result in penalties, fines and normative sanctions, right restrictions and other forms of liabilities, for which the Company is not able to make a reliable estimate of the potential losses. The outcomes may result in payments of substantial amounts, which may cause a material adverse effect on the Company’s financial position, results and cash flows in the future.
Regarding the investigations conducted by regulators offices and governmental entities in the United States of America about these operations, on February 25, 2021, the Division of Enforcement of the U.S. Securities and Exchange Commission (“SEC”) issued a letter to the Company stating that it has concluded its investigation and, based on information to date, does not intend to recommend an enforcement action by the SEC against the Company. On May 5, 2021, the U.S. Department of Justice (“DOJ”) issued a letter stating that it has closed its investigation against BRF, based on information to date. No sanctions or penalties were imposed against the Company.
| 1.6. | Coronavirus (COVID-19) |
On January 31, 2020 the World Health Organization announced that the COVID-19 is a global health emergency and on March 11, 2020 declared it a global pandemic. The outbreak has triggered significant decisions from governments and private sector entities, which in addition to the potential impact, increased the uncertainty level for the economic agents and may cause effects in the amounts recognized in the consolidated financial statements.
BRF continues to operate its industrial complexes, distribution centers, logistics, supply chain and administrative offices, even if temporarily and partially under remote work regime in some of the corporate offices. Therefore, until the date of approval of these consolidated financial statements, there has been no relevant change in its production plan, operation and/or commercialization. Additionally, management has developed and implemented contingency plans to maintain the operations and monitors the effects of the pandemic through a permanent multidisciplinary monitoring committee, formed by executives, specialists in the public health area and consultants.
Due to the pandemic, the Company has incurred in direct expenditures, such as transportation, personnel, prevention, control and donations, which are presented in the consolidated statement of income (loss) within the following line items:
| 12.31.21 | 12.31.20 | |||
| Cost of sales (1) | ( |
( | ||
| Selling expenses | ( |
( | ||
| General and administrative expenses | ( |
( | ||
| ( |
( |
| (1) |
As described in note 13.1 no impairment was recognized to the cash generating units. Due to the high volatility and uncertainty around the length and the impact of the pandemic, the Company will continue to monitor the situation and evaluate the impacts on assumptions and estimates used in preparing our financial reporting.
BRF S.A. | 2021 AND 2020 CONSOLIDATED FINANCIAL STATEMENTS | F-18 |
| 1.7. | U.S. Class Action |
On March 12, 2018, a shareholder class action lawsuit was filed against the Company, some of its former managers and one current officer before the United States Federal District Court in the city of New York, on behalf of holders of American Depositary Receipts (“ADR”) between April 4, 2013 and March 5, 2018. The suit alleged violations of the federal securities laws of the United States related to allegations concerning, among other matters, Carne Fraca Operation and Trapaça Operation. On July 2, 2018, that Court appointed the City of Birmingham Retirement and Relief System lead plaintiff in the action. On October 25, 2019, the Court granted to the lead plaintiff leave to file a Fourth Amended Complaint, which was filed on November 8, 2019. On December 13, 2019, the served defendants, including the Company, filed a motion to dismiss. On January 21, 2020, the Lead Plaintiff filed its opposition motion and, on February 11, 2020, the defendants filed a response.
On May 27, 2020, the amount was transferred to an escrow account in the name of the lawyers of the lead plaintiff. On October 23, 2020, the agreement was approved by the United States District Court for the Southern District of New York. The agreement does not constitute any admission of liability or wrongdoing by BRF or its executives and expressly provides that BRF denies any misconduct or that any plaintiff has suffered any damages or was harmed by any conduct alleged in this action.
The Company is subject to the reporting requirements established by the Brazilian Corporation Law and the regulations of the Securities and Exchange Commission of Brazil (Comissão de Valores Mobiliários, or “CVM”). The liability of this class action lawsuit was not recognized in the financial statements filed with the CVM for the year ended on December 31, 2019, which were filed on March 3, 2020. Therefore, the class action lawsuit was recognized in the financial statements filed with the CVM for the year ended on December 31, 2020. The main differences between these consolidated financial statements and those filed with the CVM, resulting from this event, are disclosed below.
| As filed with the CVM | Adjustment for class action settlement | As filed with the SEC | Corresponding notes | |||||||||||
| 12.31.20 | 12.31.19 | 12.31.20 | 12.31.19 | 12.31.20 | 12.31.19 | 12.31.21 | ||||||||
| Statement of income (loss) | ||||||||||||||
| Other operating income (expenses), net | ( |
|
|
( |
( |
|
24 and 26 | |||||||
| Income taxes | |
|
( |
|
|
|
10 | |||||||
| Net income from continuing operations | |
|
|
( |
|
|
22 | |||||||
| Statement of Financial Position | ||||||||||||||
| Other current liabilities | |
|
- | |
|
|
- | |||||||
| Deferred income taxes | |
|
- | |
|
|
- | |||||||
| Accumulated losses | ( |
( |
- | ( |
( |
( |
- | |||||||
| Total assets and total liabilities and equity | |
|
- | |
|
|
- | |||||||
| 2. | BASIS OF PREPARATION AND PRESENTATION OF FINANCIAL STATEMENTS |
The consolidated financial statements were prepared in accordance with International Financial Reporting Standards - IFRS, issued by International Accounting Standards Board - IASB.
The consolidated financial statements are expressed in thousands of Brazilian Reais (“R$”), unless otherwise stated. For disclosures of amounts in other currencies, the values were also expressed in thousands, unless otherwise stated.
The preparation of the consolidated financial statements requires Management to make judgments, use estimates and adopt assumptions that affect the reported amounts of revenues, expenses, assets and liabilities, as well as the disclosures of contingent liabilities. The uncertainty inherent to these judgments, assumptions and estimates could result in material adjustments to the carrying amount of certain assets and liabilities in future periods.
Any judgments, estimates and assumptions are reviewed at each reporting period.
The consolidated financial statements were prepared based on the recoverable historical cost, except for the following material items recognized in the statements of financial position:
(i) derivative financial instruments and non-derivative financial instruments measured at fair value;
BRF S.A. | 2021 AND 2020 CONSOLIDATED FINANCIAL STATEMENTS | F-19 |
(ii) share-based payments and employee benefits measured at fair value;
(iii) biological assets measured at fair value; and
(iv) assets held for sale in instances where the fair value is lower than historical cost.
The Company prepared consolidated financial statements under the going concern assumption and disclosed all relevant information in its explanatory notes, in order to clarify and complement the accounting basis adopted.
| 3. | SUMMARY OF SIGNIFICANT ACCOUNTING POLICIES |
| 3.1. | Changes in accounting practices |
In the year ended December 31, 2021, the Company changed the classification of payment of interest in the consolidated statement of cash flows, reclassifying this item from Operating Activities to Financing Activities. This change was made for better presentation of the Company’s cash flows and convergence with the reports used by the Administration in its management.
To ensure comparability between the years presented, the Company performed the following reclassifications for the year ended December 31, 2020 and 2019:
| 12.31.20 | 12.31.19 | |||||||||||
| Previously presented | Reclassification | Restated | Previously presented | Reclassification | Restated | |||||||
| Net cash provided by operating activities | |
|
|
|
|
| ||||||
| Net cash used in investing activities | ( |
- | ( |
|
- | | ||||||
| Net cash provided by (used in) financing activities | ( |
( |
( |
( |
( |
( | ||||||
| Effect of exchange rate variation on cash and cash equivalents | |
- | |
|
- | | ||||||
| Net increase in cash and cash equivalents | |
- | |
( |
- | ( | ||||||
In order to improve the level of detail in the presentation of information in the consolidated financial statements, in the year ended December 31, 2021, the Company began to classify the expenses with employee participation and bonuses by function in the consolidated statement of income (loss). To ensure comparability between the years presented, the comparative balances were restated as below:
| 12.31.20 | 12.31.19 | |||||||||||||
| Previously presented | Reclassification | Restated | Previously presented | Reclassification | Restated | Corresponding Notes | ||||||||
| Cost of sales | ( |
( |
( |
( |
28 | |||||||||
| Operating Income (Expenses) | ||||||||||||||
| Selling expenses | ( |
( |
( |
( |
28 | |||||||||
| General and administrative expenses | ( |
( |
( |
( |
28 | |||||||||
| Other operating income (expenses), net | ( |
|
|
|
|
|
26 | |||||||
| 3.2. | Consolidation |
The consolidated financial statements include BRF and the subsidiaries (note 1.1) of which BRF has direct or indirect control, obtained when the Company is exposed to or has right to variable returns of such subsidiaries and has the power to influence these returns.
The financial information of all consolidated entities was prepared using the same accounting policies.
All transactions and balances between BRF and its subsidiaries have been eliminated upon consolidation, as well as the unrealized profits or losses arising from these transactions, net of taxes. Non-controlling interests are presented separately.
| 3.3. | Accounting judgments, estimates and assumptions |
The Management made the following judgments which have a material impact on the amounts recognized in the financial statements:
Main judgments:
| » | control, significant influence and consolidation (note 1.1); |
| » | share-based payment transactions (note 18); |
BRF S.A. | 2021 AND 2020 CONSOLIDATED FINANCIAL STATEMENTS | F-20 |
| » | transfer of control for revenue recognition (note 25); |
| » | probability of exercise of a renewal option or anticipated termination of the lease agreements (note 17). |
Main estimates:
| » | fair value of financial instruments (note 23); |
| » | annual assessment of impairment of non-financial assets (note 13); |
| » | expected credit losses (note 6); |
| » | write-down of inventories to net realizable value (note 7); |
| » | fair value of biological assets (note 8); |
| » | assessment of recoverability of taxes (note 9 and 10); |
| » | useful lives of property, plant, equipment and intangible assets with definite useful life (note 12 and 13); |
| » | employee benefits (note 19); |
| » | provision for tax, civil and labor risks (note 20); |
| » | Fair value of assets acquired and liabilities assumed in business combinations (note 1.2). |
The Company reviews the estimates and underlying assumptions used in its accounting estimates in each reporting period. Revisions to accounting estimates are recognized in the period in which the estimates are revised.
| 3.4. | Functional currency and foreign currency transactions |
The financial statements of each subsidiary included in consolidation are prepared using the currency of the main economic environment where it operates.
The financial statements of foreign subsidiaries with functional currency different from Reais are translated into Brazilian Reais, under the following criteria:
| » | assets and liabilities are translated at the closing exchange rate; |
| » | income and expenses are translated at the monthly average rate; |
| » | the cumulative effects of gains or losses upon translation are recognized in Other Comprehensive Income, within equity. |
Goodwill arising from business combinations with foreign entities is expressed in the functional currency of that entity and translated by the closing exchange rate for the reporting currency of the acquirer, with the exchange variation effects recognized in Other Comprehensive Income.
The transactions in foreign currency follow the criteria below:
| » | non-monetary assets and liabilities, as well as incomes and expenses, are translated at the historical rate of the transaction; |
| » | monetary assets and liabilities are translated at the closing exchange rate; |
| » | the cumulative effects of gains or losses upon translation of monetary assets and liabilities are recognized in the statements of income (loss). |
| 3.5. | Hyperinflationary economies |
The Company has subsidiaries in Argentina, which is considered a hyperinflationary economy. For these subsidiaries the accounting policies below are adopted:
Non-monetary items, as well as income and expenses, are adjusted by the changes in the inflation index between the initial recognition and the closing date, so that the balances are stated at current value.
The translation of the balances of the subsidiaries with a hyperinflationary economy to the reporting currency were made at the closing rate of the reporting period for both financial position and income statement balances.
The inflation rates used in 2021 and 2020 were, respectively, 51.65% and 34.04%.
| 3.6. | Business combination |
Business combinations are recorded according to the acquisition method, which determines that the cost of an acquisition is measured by the sum of the consideration transferred, assessed based on the fair value on the acquisition date, and the value of any non-controlling interest in the acquired company. The Company measures the non-controlling interest based on its participation in the net assets identified in the acquired company. Costs directly attributable to the acquisition are recorded as expense when incurred.
BRF S.A. | 2021 AND 2020 CONSOLIDATED FINANCIAL STATEMENTS | F-21 |
Business combinations with related parties are recognized using the acquisition method when the agreements have a substance and at cost when no substance is observed in the transaction.
In the acquisition of a business, Management assesses the acquired assets and liabilities assumed in order to classify and allocate them in accordance with the contractual terms, economic circumstances and relevant conditions on the acquisition date.
Initially, goodwill is measured as the excess of the consideration transferred over the fair value of the net assets acquired (identifiable assets and liabilities assumed, net).
After the initial recognition, goodwill is measured at cost less any accumulated impairment losses. For purposes of testing the recoverable amount, goodwill is allocated to each of the cash-generating units that will benefit from the acquisition.
| 3.7. | Inventories |
Inventories are measured at the lower of the average cost of acquisition or production of finished products and the net realizable value. The cost of finished products includes purchased raw materials, labor, production costs, transportation and storage, which are related to all the processes necessary for bringing the products to sales conditions. Write-down to net realizable value due to obsolescence, impaired items, slow-moving and realizable value through sale are evaluated and recorded in each reporting period, as appropriate. Normal production losses are included in the production cost for the respective month, while abnormal losses, if any, are expensed in Cost of sales without movement through inventories.
| 3.8. | Biological assets |
The consumable and production biological assets (live animals) and forests are measured at their fair value, using the cost approach technique to live animals and the revenue approach for forests. In determining the fair value of live animals, all losses inherent to the breeding process are already considered.
| 3.9. | Income taxes |
In Brazil, it comprises income tax
(“IRPJ“) and social contribution on profit (“CSLL“), which are calculated monthly based on taxable profit, after
offsetting tax losses and negative social contribution base,
The results obtained from foreign subsidiaries are subject to taxation by the countries where they are based, according to applicable rates and legislation. In Brazil, these results suffer the effects of taxation on universal basis established by the Law No. 12,973 / 14. The Company analyzes the results of each subsidiary for the application of its Income Tax legislation, in order to respect the treaties signed by Brazil and avoid double taxation.
Deferred taxes represent credits and debits on unused tax losses carried forward and negative CSLL base, as well as temporary differences between the tax and accounting bases. Deferred income tax assets and liabilities are classified as non-current. When the Company’s internal studies indicate that the future use of these credits over a 10-year horizon is not probable, the asset is derecognized (note 10.3).
Deferred tax assets and liabilities are presented net if there is enforceable legal right to be offset, and if they are under the responsibility of the same tax authority and under the same taxable entity.
Deferred tax assets and liabilities must be measured at the rates applicable in the period in which the asset is realized or the liability is settled, based on the rates (and tax legislation) that are in force on the financial position date.
In compliance with the interpretation IFRIC 23, the Company analyzed relevant tax decisions of higher courts and whether they conflict in any way with the positions adopted by the Company. Regarding the known uncertain tax positions, the Company reviewed the corresponding legal opinions and jurisprudence and did not identify impacts to be recorded, since it concluded that the tax authorities are not likely to reject the positions adopted.
The Company periodically evaluates the positions assumed in which there are uncertainties about the adopted tax treatment and will set up a provision when applicable.
BRF S.A. | 2021 AND 2020 CONSOLIDATED FINANCIAL STATEMENTS | F-22 |
| 3.10. | Assets held for sale and discontinued operations |
Assets held for sale are measured at the lower of the book value and the fair value less selling costs and are not depreciated or amortized. Such items are only classified under this item when its sale is highly probable and they are available for immediate sale in their current conditions.
Losses due to impairment are recorded under Other operating expenses.
The statement of income and cash flows are classified as discontinued operations and presented separately from continued operations of the Company when the operation represents a separate major line of business or geographical area of operations.
The prior periods of the statement of income (loss) and of the statement of cash flows are restated for comparative purposes. The statement of financial position remains as disclosed in prior periods.
| 3.11. | Investments |
Investments classified in this group are: i) in associated companies, that are entities over which the Company has significant influence, which is the power to participate in decisions on the investee’s financial and operational policies, but without individual or joint control of these policies; and ii) in joint ventures, in which the control of the business is shared through contractual agreement and decisions about the relevant activities require the unanimous consent of the parties.
Investments are initially recognized at cost and subsequently adjusted using the equity method.
| 3.12. | Property, plant and equipment |
Property, plant and equipment are measured by the cost of acquisition, formation, construction or dismantling, less accumulated depreciation. Loans and borrowings costs are recorded as part of the costs of property, plant and equipment in progress, considering the weighted average rate of loans and borrowings effective on the capitalization date.
Depreciation is recognized based on the estimated economic useful life of each asset using the straight-line method. The estimated useful life, residual values and depreciation methods are reviewed annually and the effects of any changes in estimates are accounted for prospectively. Land is not depreciated.
The Company annually performs an impairment analysis for its cash-generating units, which include the balances of property, plant and equipment (note 12).
Gains and losses on disposal of property, plant and equipment are determined by comparing the sale value with the residual book value and are recognized in the statement of income on the date of sale under Other operating income (expense).
| 3.13. | Intangible assets |
Acquired intangible assets are measured at cost at initial recognition, while those arising from a business combination are recognized at fair value on the acquisition date. After initial recognition, are presented at cost less accumulated amortization and impairment losses, when applicable. Internally generated intangible assets, excluding development costs, are not capitalized and the expense is recognized in the income statement when incurred.
Intangible assets with definite useful lives are amortized on a straight-line basis over their economic useful lives. The amortization period and method for an intangible asset with definite life are reviewed at least at the end of each year, and any changes observed are applied prospectively. The amortization of intangible assets with finite lives is recognized in the income statement in the expense category related to their use.
Intangible assets with indefinite useful lives are not amortized, but are tested annually for impairment, being allocated to the cash-generating units (note 13). The Company records in this subgroup mainly goodwill and brands, which are expected to contribute indefinitely to its cash flows.
| 3.14. | Contingent assets |
Contingent assets are possible assets to which existence needs to be confirmed by the occurrence or not of one or more uncertain future events. The Company does not record contingent assets, however when the inflow of economic benefits is more likely than not to occur, the contingent assets are disclosed.
BRF S.A. | 2021 AND 2020 CONSOLIDATED FINANCIAL STATEMENTS | F-23 |
| 3.15. | Leasing |
A contract is, or contains, a lease if the contract conveys the right to control the use of an identified asset for a period of time in exchange for consideration. The Company assesses whether:
| » | the contract involves the use of an identified asset, which may be explicit or implicit, and may be physically distinct or represent substantially the entire capacity of a physically distinct asset. If the supplier has a substantial right to replace the asset, then the asset is not identified; |
| » | the Company has the right to obtain substantially all the economic benefits from using the asset throughout the period of use; and |
| » | the Company has the right to direct the use of the asset throughout the period of use, which occurs in either of the following situations: |
| o | the Company has the right to direct how and for what purpose the asset is used, or |
| o | the conditions are predetermined so as the Company has the right to operate the asset or has designed the asset in a way that predetermined how and for what purpose it will be used. |
At the beginning of the contract, the Company recognizes a right-of-use asset and a lease liability, which represents the obligation to make payments related to the underlying asset of the lease.
The right-of-use asset is initially measured at cost and comprises: the initial measurement of the lease liability adjusted for any payment made at or before the commencement date, less any incentive received; any initial direct costs incurred; and an estimate of costs in dismantling and removing the asset, restoring the site on which it is located or restoring the asset to the condition required by the terms of the lease. Renewal or early termination options are analyzed individually considering the type of asset involved as well as its relevance in the Company’s production process.
The right-of-use asset is subsequently depreciated using the straight-line method from the commencement date until the end of the useful life of the right-of-use asset or until the end of the period of the lease. The estimated useful life of the right-of-use asset is determined on the same methodology used for the assets owned by the Company (note 3.12). Additionally, the right-of-use asset is adjusted by the subsequent measurement of the lease liability and when applicable, an impairment is recognized.
The lease liability is initially measured at the present value of the future lease payments using the incremental borrowing rate, and subsequently, measured at amortized cost using the effective interest method.
The liability is remeasured when there is a change in (i) future payments resulting from a change in index or rate, (ii) the amount expected to be payable under a residual value guarantee, or (iii) the assessment of whether the Company will exercise the purchase, renewal or termination option.
When the lease liability is remeasured, the corresponding adjustment is recorded in the book value of the right-of-use asset, or in the statement of income if the book value of the right-of-use asset has been reduced to zero.
The Company does not apply lease accounting model to: leases with a term of 12 months or less and that do not contain a purchase option; and leases for which the underlying asset is of low value. For these exemptions, the lease payments are recognized as an expense on a straight-line basis over the lease term.
Additionally, contracts with indefinite term and no fixed payments are expensed as incurred.
| 3.16. | Share based payments |
The Company offers to its executives stock option plans and restricted stock plans of its own issuance. The Company recognizes as expense the fair value of the options or shares, measured at the grant date, on a straight-line basis during the period of service required by the plan, with a corresponding entry: to the shareholders’ equity for plans exercisable in shares; and to liabilities for cash exercisable plans. The accumulated expense recognized reflects the vesting period and the Company’s best estimate of the number of shares to be delivered.
The expense of the plans is recognized in the statement of income (loss) in accordance with the function performed by the beneficiary.
| 3.17. | Pension and other post-employment plans |
The Company sponsors supplementary defined benefit and defined contribution pension plans, as well as other post-employment benefits for which an actuarial appraisal is annually prepared by an independent actuary and is reviewed by Management. The cost of defined benefits is established separately for each plan using the projected unit credit method.
BRF S.A. | 2021 AND 2020 CONSOLIDATED FINANCIAL STATEMENTS | F-24 |
The measurements comprise the actuarial gains and losses, the effect of the limit on contributions and returns on the plan assets and are recognized in the financial position against Other Comprehensive Income when incurred, except Award for Length of Service, which its recognition occurs against statement of income. These measurements are not reclassified to statement of income in subsequent periods.
The Company recognizes the net defined benefit asset when:
| » | controls the resource and has the ability to use the surplus to generate future benefits; |
| » | the control is the result of past events; |
| » | future economic benefits are available for the Company in the form of a reduction in future contributions or cash refunds, either directly to the sponsor or indirectly to another loss-making fund. The effect of the asset limit (irrecoverable surplus) is the present value of these future benefits. |
Past service costs are recognized in income for the year on the following dates, whichever comes first:
| » | date of changing the plan or significantly reducing the expected length of service; |
| » | date in which the Company recognizes the costs related to restructuring. |
The cost of services and net interest on the value of the defined benefit liability or asset are recognized in the expense categories related to the function the beneficiary performs and to the financial result, respectively.
| 3.18. | Employee and management profit sharing |
Employees are entitled to profit sharing based on certain targets agreed upon on an annual basis, whereas directors are entitled to profit sharing based on the provisions of the bylaws, proposed by the Board of Directors and approved by the shareholders. The profit-sharing amount expected to be paid is recognized by function in the statement of income (loss).
| 3.19. | Provision for tax, civil and labor risks and contingent liabilities |
The provisions are recognized when the Company has a present obligation, formalized or not, as a result of a past event, the outflow of resources to settle the obligation is likely to occur and a reliable estimate can be made.
The Company is involved in several legal and administrative procedures, mainly in Brazil. Assessments of the likelihood of loss in these lawsuits include an analysis of the available evidences, the hierarchy of laws, the available jurisprudence, the most recent court decisions and their relevance in the legal system, as well as the assessment of outside lawyers. Provisions are reviewed and adjusted to reflect changes in circumstances, such as the applicable limitation period, conclusions of tax inspections or additional exposures identified based on new matters or court decisions.
In cases where there are a large number of lawsuits and the amounts are not individually relevant, the Company use historical studies to determine the probability and amounts of losses.
Contingent liabilities from business combinations are recognized if they arise from a present obligation that arose from past events and if their fair value can be measured reliably. The initial measurement is done by the fair value and subsequent measurements by the higher value between: the fair value on its acquisition date; and the amount by which the provision would be recognized.
| 3.20. | Financial instruments |
Financial instruments are contracts that give rise to a financial asset for one entity and a financial liability or equity instrument for another. Their presentation in the statement of financial position and explanatory notes takes place according to the characteristics of each contract.
| 3.20.1. | Financial assets |
Financial assets are recognized when the entity becomes party to the contractual provisions of the instrument and classified based on the characteristics of its cash flows and on the management model for the asset. The table below shows financial assets are classified and measured:
BRF S.A. | 2021 AND 2020 CONSOLIDATED FINANCIAL STATEMENTS | F-25 |
| Category | Initial Measurement | Subsequent Measurement | ||
| Amortized Cost | Accounts receivable from Clients and other receivables: billed amount adjusted to present value and, when applicable, reduced by expected credit losses For other assets: Fair value less costs directly attributable to its issuance, reduced by expected credit losses |
Interest, changes in amortized cost and expected credit losses recognized in the income statement. | ||
| Fair Value through Profit and Loss (“FVTPL”) | Fair Value | Variation on the fair value recognized in the income statement. | ||
| Fair Value through Other Comprehensive Income (“FVTOCI”). | Fair value less costs directly attributable to its issuance. | Changes in fair value recognized in other comprehensive income. Upon settlement or transfer, accumulated gains or losses are directly reclassified to Retained earnings or accumulated losses. For debt instruments, expected credit losses are recognized directly in the statement of income. |
The Company evaluates expected credit losses in each reporting period for instruments measured at amortized cost and for debt instruments measured at Fair Value through Other Comprehensive Income. Losses and reversals of losses are recorded in the income statement.
The interests of financial assets are recorded on Financial Income (Expenses), net.
A financial asset is only derecognized when contractual rights expire or are effectively transferred.
Cash and cash equivalents: comprise the balances of cash, banks and securities of immediate liquidity whose maturities, at the time of acquisition, are equal to or less than 90 days, readily convertible into a known amount of cash and which are subject to an insignificant risk of change in value. Securities classified in this group, by their very nature, are measured at fair value through profit or loss.
Expected credit losses in Accounts receivable from customers and other receivables: the Company regularly assesses the historical losses on the customer portfolios it has in each region, taking in consideration the dynamics of the markets in which it operates and instruments it has for reducing credit risks, such as: letters of credit, insurance and collateral, as well as identifying specific customers whose risks are significantly different than the portfolio, which are treated according to individual expectations.
Based on these assessments, estimated loss factors are generated by portfolio and aging class, which, applied to the amounts of accounts receivable, generate the expected credit losses. Additionally, the Company evaluates macroeconomic factors that may influence these losses and, if necessary, adjusts the calculation model.
Securities receivable with legal proceedings in place are reclassified to noncurrent as well as the related estimated credit losses. The securities are written off against the estimated loss when the Management considers that they are no longer recoverable after taking all appropriate actions to collect them.
| 3.20.2. | Financial liabilities |
Financial liabilities are recognized when the entity becomes party to the contractual provisions of the instrument. The initial measurement is at fair value and subsequently at amortized cost using the effective interest rate method. The interests of financial liabilities are recorded on Financial Income (Expenses), net.
A financial liability is only derecognized when the contractual obligation expires, is settled or canceled.
| 3.20.3. | Adjustment to present value |
The Company measures the adjustment
to present value on short and long-term balances of accounts receivable, suppliers and other obligations, being recognized as a deduction
in the asset accounts against the financial result. The Company adopts the weighted average cost of capital to determine the adjustment
to present value of the mentioned assets and liabilities, which corresponds to
BRF S.A. | 2021 AND 2020 CONSOLIDATED FINANCIAL STATEMENTS | F-26 |
| 3.20.4. | Hedge accounting |
Cash flow hedge: the effective portion of the gain or loss on the hedge instrument is recognized under Other Comprehensive Income and the ineffective portion in the Financial result. Accumulated gains and losses are reclassified to the Income statement or statement of financial position when the hedge object is recognized, adjusting the item in which the hedge object was accounted for.
When the instrument is designated in a cash flow hedge relationship, changes in the fair value of the future element of the forward contracts and the time value of the options are recognized under Other Comprehensive Income. When the instrument is settled, these hedge costs are reclassified to the income statement together with the intrinsic value of the instruments.
A hedging relationship is discontinued prospectively when it no longer meets the criteria for qualifying as hedge accounting. Upon discontinuation of a cash flow hedge relationship in which the hedged future cash flows are still expected to occur, the accumulated amount remains under Other Comprehensive Income until the flows occur and are reclassified to income.
Fair value hedge: the effective portion of the hedge instrument’s gain or loss is recognized in the Income Statement or statement of financial position, adjusting the item under which the hedge object is or will be recognized. The hedge object, when designated in this relationship, is also measured at fair value.
Net investment hedge: the effective result of the exchange variation of the instrument is recorded under Other Comprehensive Income, in the same item in which the accumulated translation adjustments of the investments (hedge objects) are recognized. Only when the hedged investments are sold, the accumulated amount is reclassified to the income statement, adjusting the gain or loss on the sale.
| 3.20.5. | Reference interest rate reform |
The Company does not have relationship designated for hedge accounting that involve operations indexed to the reference interest rates object from reform. Additionally, existing liabilities indexed to the reference interest rates (Libor) have contractual arrangements foreseeing the replacement for similar rates. Thus, no relevant impact is expected for the Company if such interest rates cease to exist or are replaced.
| 3.21. | Segment information |
An operating segment is a component of the Company that develops business activities to obtain revenues and incur expenses. The operating segments reflect the way in which the Company’s management reviews the financial information for decision making. The Company’s management identified the operating segments, which meet the quantitative and qualitative parameters of disclosure, pursuant its current management model (note 24).
| 3.22. | Revenue from contracts with customers |
Sales revenues are recognized and measured observing the following steps: (i) identification of the contracts with customers, formalized through sales orders; (ii) identification of the performance obligations in the contract; (iii) determination of the transaction price; (iv) allocation of the transaction price to the performance obligations in the contract; and (v) revenue recognition as it satisfies the performance obligations.
Revenues are recognized by the amount that reflects the Company’s expectation to receive for the sale of products, net of applicable taxes, returns, rebates and discounts.
The sales process begins with sales orders. The discounts and rebates may be negotiated on a spot basis or may have its conditions formally defined in the agreements, generally signed with large retail and wholesale chains. In all cases, the performance condition is satisfied when the control of the goods is transferred to the client.
The Company has sales with immediate and deferred payments, for which the adjustment to present value is recognized for the financial component (note 3.20.3).
| 3.23. | Government grants |
Government grants are recognized at fair value when there is reasonable assurance that the conditions established will be met and the benefit will be received. The amounts appropriated as revenue in the income statement, when used to reduce income taxes, are transferred from retained earnings to the tax incentive reserve in the years the Company presents profit higher than the reclassification.
BRF S.A. | 2021 AND 2020 CONSOLIDATED FINANCIAL STATEMENTS | F-27 |
| 3.24. | Earnings (loss) per share |
The basic earnings (losses) per share are calculated by dividing the earnings (losses) attributable to the owners of ordinary shares, by the weighted average quantity of available ordinary shares during the year.
The diluted earnings (losses) per share are calculated by dividing the earnings (losses) attributable to the owners of ordinary shares by the weighted average quantity of available ordinary shares during the year summed to the weighted average quantity of ordinary shares that would be available on the conversion of all potential dilutive ordinary shares (stock options and restricted shares within the share-based payment plans).
The stock options shall only be considered dilutive when the strike price is lower than the current share price.
| 3.25. | Standards issued but not yet effective |
The new and amended standards, which are effective for annual reporting periods beginning after December 31, 2021, are not expected to have a significant impact on the Company’s consolidated financial statements.
BRF S.A. | 2021 AND 2020 CONSOLIDATED FINANCIAL STATEMENTS | F-28 |
| 4. | CASH AND CASH EQUIVALENTS |
| Average rate (1) | |||||
| 12.31.21 | 12.31.20 | ||||
| Cash and bank accounts | |||||
| U.S. Dollar | - | |
| ||
| Saudi Riyal | - | |
| ||
| Brazilian Reais | - | |
| ||
| Euro | - | |
| ||
| Turkish lira | - | |
| ||
| Other currencies | - | |
| ||
| |
| ||||
| Cash equivalents | |||||
| In Brazilian Reais | |||||
| Investment funds | 4.97% | |
| ||
| Bank deposit certificates | 8.53% | |
| ||
| |
| ||||
| In U.S. Dollar | |||||
| Term deposit | - | |
| ||
| Overnight | 0.15% | |
| ||
| Other currencies | |||||
| Term deposit | - | |
| ||
| |
| ||||
| |
| ||||
| (1) |
| 5. | MARKETABLE SECURITIES |
| Average rate (2) | |||||||||
| WAM (1) | Currency | 12.31.21 | 12.31.20 | ||||||
| Fair value through other comprehensive income | |||||||||
| Stocks (3) | - | - | |
| |||||
| Fair value through profit and loss | |||||||||
| Financial treasury bills | |
| |||||||
| Investment funds - FIDC BRF | - | |
| ||||||
| Other | - | |
| ||||||
| |
| ||||||||
| Amortized cost | |||||||||
| Sovereign bonds and other (4) | |
| |||||||
| |
| ||||||||
| Current | |
| |||||||
| Non-current (5) | |
| |||||||
| (1) |
| (2) |
| (3) |
| (4) |
| (5) |
On December 31, 2021, the amount of
R$
BRF S.A. | 2021 AND 2020 CONSOLIDATED FINANCIAL STATEMENTS | F-29 |
| 6. | TRADE ACCOUNTS RECEIVABLE AND OTHER RECEIVABLES |
| 12.31.21 | 12.31.20 | ||
| Trade accounts receivable | |||
| Domestic market | |||
| Third parties | |
| |
| Foreign market | |||
| Third parties | |
| |
| |
| ||
| ( - ) Adjustment to present value | ( |
( | |
| ( - ) Expected credit losses | ( |
( | |
| |
| ||
| Current | |||
| Non-current | |||
| Other receivables | |||
| Other receivables | |
| |
| ( - ) Adjustment to present value | ( |
( | |
| ( - ) Expected credit losses | ( |
( | |
| |
| ||
| Current | |
| |
| Non-current (1) | |
|
| (1) |
The Company performs credit assignments
with no right of return to the BRF Clients’ Credit Rights Investment Fund (“FIDC BRF“), which has the sole purpose to
acquire credit rights arising from commercial transactions carried out between the Company and its clients in Brazil. On December 31,
2021, FIDC BRF had an outstanding balance of R$
On December 31, 2021, other receivables
are mainly represented by receivables from the sale of farms and various properties, with a balance of R$
The movements of the expected credit losses are presented below:
| 12.31.21 | 12.31.20 | ||
| Beginning balance | ( |
( | |
| (Additions) Reversals | ( |
( | |
| Write-offs | |
| |
| Exchange rate variation | ( |
( | |
| Ending balance | ( |
( |
BRF S.A. | 2021 AND 2020 CONSOLIDATED FINANCIAL STATEMENTS | F-30 |
The aging of trade accounts receivable is as follows:
| 12.31.21 | 12.31.20 | ||
| Not overdue | |
| |
| Overdue | |||
| 01 to 60 days | |
| |
| 61 to 90 days | |
| |
| 91 to 120 days | |
| |
| 121 to 180 days | |
| |
| 181 to 360 days | |
| |
| More than 360 days | |
| |
| ( - ) Adjustment to present value | ( |
( | |
| ( - ) Expected credit losses | ( |
( | |
| |
|
7. | INVENTORIES |
| 12.31.21 | 12.31.20 | ||
| Finished goods | |
| |
| Work in progress | |
| |
| Raw materials | |
| |
| Packaging materials | |
| |
| Secondary materials | |
| |
| Supplies | |
| |
| Imports in transit | |
| |
| Other | |
| |
| (-) Adjustment to present value | ( |
( | |
| 9,654,870 | 6,802,759 |
The movements in the write-down of inventories to the net realizable value, for which the additions, reversals and write-offs were recorded against Cost of Sales, are presented in the table below:
| Realizable value through sale | Impaired inventories | Obsolete inventories | Total | ||||||||||||
| 12.31.21 | 12.31.20 | 12.31.21 | 12.31.20 | 12.31.21 | 12.31.20 | 12.31.21 | 12.31.20 | ||||||||
| Beginning balance | ( |
( |
( |
( |
( |
( |
( |
( | |||||||
| Additions | ( |
( |
( |
( |
( |
( |
( |
( | |||||||
| Reversals | |
|
- | - | - | - | |
| |||||||
| Write-offs | - | - | |
|
|
|
|
| |||||||
| Exchange rate variation | |
|
|
( |
|
( |
|
( | |||||||
| Ending balance | ( |
( |
( |
( |
( |
( |
( |
( | |||||||
BRF S.A. | 2021 AND 2020 CONSOLIDATED FINANCIAL STATEMENTS | F-31 |
| 8. | BIOLOGICAL ASSETS |
The live animals are represented by poultry and pork and segregated into consumables and animals for production. The rollforward of the biological assets are presented below:
| Current | Non-current | ||||||||||||||||||||||||||
| Live animals | Live animals | ||||||||||||||||||||||||||
| Poultry | Pork | Total | Poultry | Pork | Forests | Total | |||||||||||||||||||||
| 12.31.21 | 12.31.20 | 12.31.21 | 12.31.20 | 12.31.21 | 12.31.20 | 12.31.21 | 12.31.20 | 12.31.21 | 12.31.20 | 12.31.21 | 12.31.20 | 12.31.21 | 12.31.20 | ||||||||||||||
| Beginning balance | |
|
|
|
|
|
|
|
|
|
|
|
|
| |||||||||||||
| Additions/Transfer | |
|
|
|
|
|
|
|
|
|
|
|
|
| |||||||||||||
| Changes in fair value (1) | |
|
|
|
|
|
|
|
( |
( |
|
|
( |
( | |||||||||||||
| Harvest | - | - | - | - | - | - | - | - | - | - | ( |
( |
( |
( | |||||||||||||
| Write-off | - | - | - | - | - | - | - | - | - | - | ( |
( |
( |
( | |||||||||||||
| Transfer between current and non-current | |
|
|
|
|
|
( |
( |
( |
( |
- | - | ( |
( | |||||||||||||
| Transfer to assets held for sale | - | - | - | - | - | - | - | ( |
- | - | - | |
- | ( | |||||||||||||
| Transfer to inventories | ( |
( |
( |
( |
( |
( |
- | - | - | - | - | - | - | - | |||||||||||||
| Exchange variation | ( |
|
- | - | ( |
|
( |
|
- | - | - | - | ( |
| |||||||||||||
| Ending balance | |
|
|
|
|
|
|
|
|
|
|
|
|
| |||||||||||||
| (1) |
BRF S.A. | 2021 AND 2020 CONSOLIDATED FINANCIAL STATEMENTS | F-32 |
The book value and estimated quantities of live animals are set forth below:
| 12.31.21 | 12.31.20 | ||||||
| Quantity (thousand of heads) |
Book value | Quantity (thousand of heads) |
Book value | ||||
| Consumable biological assets | |||||||
| Immature poultry | |
|
|
| |||
| Immature pork | |
|
|
| |||
| Total current | |
|
|
| |||
| Production biological assets | |||||||
| Immature poultry | |
|
|
| |||
| Mature poultry | |
|
|
| |||
| Immature pork | |
|
|
| |||
| Mature pork | |
|
|
| |||
| Total non-current | |
|
|
| |||
| |
|
|
| ||||
The Company has forests pledged as
collateral for financing and tax and civil contingencies on December 31, 2021 in the amount of R$
| 8.1. | Sensitivity analysis |
The fair value of animals and forests is determined using unobservable inputs, using the best practices available in the valuation circumstances, therefore it is classified in the Level 3 of the fair value hierarchy. The main assumptions used in the measurement of the fair value of forests and their impact on measurement are presented below.
| The estimated fair value can change if: | ||||||||
| Asset | Valuation methodology | Non observable significant inputs | Increase | Decrease | ||||
| Forests | Income approach | Estimated price of standing wood | Increase in the price of wood | Decrease in the price of wood | ||||
| Productivity per hectare estimated | Increase in yield per hectare | Decrease in yield per hectare | ||||||
| Harvest and transport cost | Decrease of harvest cost | Increase of harvest cost | ||||||
| Discount rate | Descrease in discount rate | Increase in discount rate | ||||||
| Live animals | Cost approach | Price of the feed inputs | Increase in feed cost | Decrease in feed cost | ||||
| Storage costs | Increase in storage cost | Decrease in storage cost | ||||||
| Outgrowers cost | Increase in outgrowers cost | Decrease in outgrowers cost | ||||||
The prices used in the valuation are those practiced in the regions where the Company is located and were obtained through market research. The discount rate corresponds to the average cost of capital and other economic assumptions for a market participant.
The weighted average price used in
the valuation of biological assets (forests) on December 31, 2021 was equivalent to R$
BRF S.A. | 2021 AND 2020 CONSOLIDATED FINANCIAL STATEMENTS | F-33 |
| 9. | RECOVERABLE TAXES |
The rollforward of recoverable taxes are set forth below:
| Note | 12.31.20 | Business combination (note 1.2) | Additions | Offset / Reversals | Transfers (1) | Interest | Exchange variation | 12.31.21 | ||||||||||
| ICMS and VAT | 9.1 | |||||||||||||||||
| Recoverable ICMS and VAT | |
|
|
( |
( |
|
( |
| ||||||||||
| (-) Impairment | ( |
- | ( |
- | - | ( | ||||||||||||
| PIS and COFINS | 9.2 | |||||||||||||||||
| Recoverable PIS and COFINS | |
|
( |
- | - | | ||||||||||||
| (-) Impairment | ( |
- | - | - | - | - | - | ( | ||||||||||
| IPI | 9.3 | |||||||||||||||||
| Recoverable IPI | |
|
|
( |
- | |
- | | ||||||||||
| (-) Impairment | ( |
- | - | - | - | - | - | ( | ||||||||||
| INSS | ||||||||||||||||||
| Recoverable INSS | |
( |
- | |
- | | ||||||||||||
| (-) Impairment | ( |
- | |
- | - | - | - | - | ||||||||||
| Other | ||||||||||||||||||
| Other recoverable taxes | |
( |
- | - | ( |
|||||||||||||
| (-) Impairment | ( |
- | |
|
- | - | - | ( | ||||||||||
| |
|
( |
( |
|
( |
| ||||||||||||
| Current | 899,120 | 976,133 | ||||||||||||||||
| Non-current | 4,868,198 | 4,780,096 | ||||||||||||||||
| Note | 12.31.20 | Business combination | Additions | Offset / Reversals | Transfers (1) | Interest | Exchange variation | 12.31.21 | ||||||||||
| Income taxes | 9.4 | |||||||||||||||||
| Recoverable income taxes | |
|
|
( |
- | |
( |
| ||||||||||
| (-) Impairment | ( |
- | ( |
- | - | - | - | ( | ||||||||||
| |
|
( |
- | |
( |
| ||||||||||||
| Current | 43,840 | 71,762 | ||||||||||||||||
| Non-current | 54,859 | 206,355 |
| (1) |
| Note | 12.31.19 | Additions | Offset / Reversals | Transfers | Restatement | Exchange variation | 12.31.20 | |||||||||
| ICMS and VAT | 9.1 | |||||||||||||||
| Recoverable ICMS and VAT | |
|
( |
( |
|
| ||||||||||
| (-) Impairment | ( |
( |
|
- | - | ( | ||||||||||
| PIS and COFINS | 9.2 | |||||||||||||||
| Recoverable PIS and COFINS | |
|
( |
- | - | | ||||||||||
| (-) Impairment | (16,922) | - | 2,694 | - | - | - | (14,228) | |||||||||
| IPI | 9.3 | |||||||||||||||
| Recoverable IPI | |
|
( |
( |
- | | ||||||||||
| (-) Impairment | ( |
( |
|
- | - | - | ( | |||||||||
| INSS | ||||||||||||||||
| Recoverable INSS | |
( |
- | |
| |||||||||||
| (-) Impairment | ( |
- | - | - | - | - | ( | |||||||||
| Other taxes | ||||||||||||||||
| Other recoverable taxes | ( |
( |
- | ( |
||||||||||||
| (-) Impairment | ( |
- | |
- | - | - | ( | |||||||||
| Total | |
|
( |
( |
|
| ||||||||||
| Current | 473,732 | 899,120 | ||||||||||||||
| Non-current | 5,169,547 | 4,868,198 | ||||||||||||||
| Note | 12.31.19 | Additions | Offset / Reversals | Transfers | Restatement | Exchange variation | 12.31.20 | |||||||||
| Income taxes | 9.4 | |||||||||||||||
| Recoverable income taxes | |
( |
- | |
| |||||||||||
| (-) Impairment | ( |
- | - | - | - | - | ( | |||||||||
| Total | |
( |
- | |
||||||||||||
| Current | 152,486 | 43,840 | ||||||||||||||
| Non-current | 269,263 | 54,859 |
| 9.1. | ICMS – Tax on Movement of Goods and Services and VAT – Value Added Taxes |
As result of (i) export activity, (ii) tax benefits, (iii) sales in the domestic market subject to reduced rates; and (iv) acquisition of property, plant and equipment, the Company generates recoverable ICMS balances that are offset against ICMS payables arising from sales in the domestic market or that are transferred to third parties.
The Company has recoverable ICMS balances in the States of Paraná, Santa Catarina, Mato Grosso do Sul, Minas Gerais and Amazonas, which will be realized in the short and long term, based on the recoverability study reviewed and approved by the Management.
In other jurisdictions outside Brazil, value added taxes (VAT) are due in regular operations of the Company with goods and services.
BRF S.A. | 2021 AND 2020 CONSOLIDATED FINANCIAL STATEMENTS | F-34 |
| 9.2. | PIS and COFINS –Social Integration Plan and Contribution for Social Security Financing |
The accumulated recoverable PIS and COFINS balances arise from taxes on raw material purchases subsequently used in the production of exported products or products for which sale is not taxed, such as fresh meat and margarine, as well as recoverable taxes on commercial and labor expenses. The realization of these balances usually occurs through the offsetting with taxes payable on sales of taxed products in the domestic market, with other federal taxes and social security contributions payable, or even, if necessary, through refund or reimbursement requests.
In the year ended December 31, 2021, the Company recognized gains arising from processes filed by the subsidiaries SHB Comércio e Indústria de Alimentos S.A. and Batávia S.A., both already incorporated by BRF S.A. and of a process filed by UP! Alimentos Ltda. (an entity jointly controlled by BRF S.A., whose operations were closed), granting the Company the right to exclude ICMS from the PIS and COFINS calculation basis. The periods involved in the processes are from 2002 until 2017, date from which the Company began to exclude the ICMS from the PIS and COFINS calculation basis. The Company, supported by its consultants, obtained the fiscal files for the period and reconciled them with the accessory obligations, measuring the balances reliably through the ICMS presented in the invoices. Thus, the amount of R$92,171 was recognized under Recoverable PIS and COFINS, being R$41,554 of principal recorded in Other Operating Income and R$50,617 of interests recorded in Financial Income.
As of December 31, 2021, the updated balance of the processes related to the exclusion of the ICMS from the PIS and COFINS calculation basis recognized by the Company is R$2,341,737 (R$2,818,391 as of December 31, 2020). The amount of R$628,557 related do these credits was offset against other federal taxes for the year ended December 31, 2021 (null for the year ended December 31, 2020).
In the study prepared by the Management, its realization is estimated through offsetting with federal taxes or through reimbursement of the amounts as expectation below:
| PIS and COFINS | |
| Current | |
| Non-current | |
| 2023 | |
| 2024 | |
| 2025 | |
| |
| 9.3. | IPI - Industrialized Product Tax |
The Company recognized relevant tax assets as result of gains from lawsuits related to IPI, specially “crédito prêmio”. The balance referring to these assets on December 31, 2021 is R$945,845 (R$860,820 on December 31, 2020), of which R$919,982 (R$805,001 on December 31, 2020) is recorded as Recoverable Taxes and the remainder, referring to cases in which the government will reimburse in cash, is recorded as Other Current Assets, in the amount of R$8,936 (R$40,370 on December 31, 2020) and as Other Non-Current Assets, in the amount of R$16,927 (R$15,449 on December 31, 2020).
Schedule of realization is estimated through the refund of the amounts
According to projections prepared by the Management, its realization is estimated through the refund of the amounts as expected below:
| IPI | |
| Current | |
| Non-current | |
| 2023 | |
| 2025 | |
| 2026 | |
| |
BRF S.A. | 2021 AND 2020 CONSOLIDATED FINANCIAL STATEMENTS | F-35 |
| 9.4. | Income Taxes |
The accumulated recoverable income taxes arise, mostly, from withholding taxes on securities, interest and prepayments of income tax and social contribution in Brazil. The realization occurs through the offset with federal taxes and contributions payable.
In the year ended December 31, 2021, the Federal Supreme Court, the highest instance of the Judiciary in Brazil, ruled unconstitutional the taxation of income tax (“IRPJ”) and social contribution (“CSLL”) on interest income recognized due to tax overpayments. The periods involved in the processes are from 2005 until 2020. From the date of this judgment, the Company ceased taxing such income and was entitled to recover the amounts of taxes previously paid.
For the years in which the Company had taxable income and, therefore, paid IRPJ and CSLL on income arising from interest tax overpayments, the amount of R$132,224 was recognized under Recoverable Income Taxes, being the principal of R$91,800 recorded against Income Taxes and the interest of R$40,424 recorded against Financial Income. Such recoverable taxes can be used to offset other federal taxes in Brazil. For the years in which the company presented tax losses, an increase in tax losses carryforward was calculated in the amount of R$2,526,115.
| 9.5. | Realization of Brazilian federal tax credits |
The Company received in cash, through court orders related to recoverable IPI balances, the amount of R$32,802 for the year ended December 31, 2021 (R$235,405 for the year ended December 31, 2020).
The Company used PIS, COFINS, IPI, IRPJ, CSLL, INSS and other recoverable taxes to offset federal taxes payable such as INSS and Income Taxes in the amount of R$1,153,520 for the year ended December 31, 2021 (R$863,602 for the year ended December 31, 2020), preserving its liquidity and optimizing its capital structure.
BRF S.A. | 2021 AND 2020 CONSOLIDATED FINANCIAL STATEMENTS | F-36 |
| 10. | DEFERRED INCOME TAXES |
| 10.1. | Breakdown |
Schedule of deferred income and social contribution taxes
| 12.31.21 | 12.31.20 | ||
| Assets | |||
| Tax losses carryforward | |
| |
| Negative calculation basis (social contribution) | |
| |
| Temporary differences - Assets | |||
| Provisions for tax, civil and labor risks | |
| |
| Expected credit losses | |
| |
| Impairment on tax credits | |
| |
| Provision for other obligations | |
| |
| Employees' profit sharing | |
| |
| Write-down to net realizable value of inventories | |
| |
| Employees' benefits plan | |
| |
| Lease basis difference | |
| |
| Unrealized losses on derivatives, net | |
| |
| Other temporary differences | |
| |
| |
| ||
| Temporary differences - Liabilities | |||
| Goodwill amortization basis difference | (307,442) | (320,729) | |
| Depreciation (useful life) basis difference | (895,407) | (851,436) | |
| Business combination (1) | ( |
( | |
| Unrealized gains on derivatives, net | - | (42,493) | |
| Unrealized fair value gains, net | (37,692) | (39,269) | |
| Other temporary differences | ( |
( | |
| ( |
( | ||
| Total deferred taxes | |
| |
| Total Assets | |
| |
| Total Liabilities | ( |
( | |
| 2,917,560 | 2,082,537 |
| (1) |
The roll-forward of deferred income taxes, net, is set forth below:
Schedule of rollforward deferred tax
| 12.31.21 | 12.31.20 | ||
| Beginning balance | |
| |
| Deferred income taxes recognized in income from continuing operations | |
| |
| Deferred income taxes recognized in other comprehensive income | |
| |
| Deferred income taxes recognized in loss from discontinued operations | |
- | |
| Other (1) | ( |
| |
| Ending balance | |
|
| (1) |
| 10.2. | Estimated period of realization |
Deferred tax assets arising from temporary differences will be realized as the differences are settled or realized. The period of settlement or realization of such differences is subject to externalities and is linked to several factors that are not under the control of Management.
In estimating the realization of deferred tax credits on tax losses carryforward, Management considers its budget and strategic plans, which were approved by the Board of Directors, adjusted for changes in economic assumptions and based on the estimates of the main tax additions and exclusions. The recoverability study is reviewed by the Fiscal Council and approved by the Board of Directors. Based on this estimate, Management believes that it is probable that these deferred tax credits will be realized, as presented below:
BRF S.A. | 2021 AND 2020 CONSOLIDATED FINANCIAL STATEMENTS | F-37 |
| 2022 | |
| 2023 | |
| 2024 | |
| 2025 | |
| 2026 | |
| 2027 to 2029 | |
| 2030 and 2031 | |
| |
The Company has tax losses carryforward
in Brazil, which at current tax rates represent R$
| 10.3. | Effective income tax rate reconciliation |
| 12.31.21 | 12.31.20 | 12.31.19 | ||
| Income (loss) before taxes - continued operations | ( |
|
| |
| Nominal tax rate | ||||
| Benefit (expense) at nominal rate | |
( |
( | |
| Adjustments to income taxes | ||||
| Income from associates and joint ventures | |
- | | |
| Difference of tax rates on results of foreign subsidiaries | |
|
| |
| Difference of functional currency of foreign subsidiaries | ( |
|
| |
| Deferred tax assets not recognized (1) | ( |
( |
( | |
| Recognition of tax assets from previous years (2) | |
|
| |
| Interest on overpayment of taxes (3) | |
- | - | |
| Profits taxed by foreign jurisdictions | ( |
( |
( | |
| Share-based payment | ( |
( |
( | |
| Transfer price | ( |
( |
( | |
| Penalties | ( |
( |
( | |
| Investment grant | |
|
| |
| Reversal (recognition) of provision with no deferred tax constituted | - | - | | |
| Other permanent differences | |
|
( | |
| |
|
| ||
| Effective rate | - |
- | ||
| Current tax | ( |
( |
( | |
| Deferred tax | |
|
|
| (1) |
| (2) |
| (3) |
The Company’s management determined that the total profits recorded by the holdings of its wholly-owned subsidiaries abroad will not be redistributed. Such funds will be used for investments in the wholly-owned subsidiaries.
Income tax returns in Brazil are subject to review by the tax authorities for a period of five years from the date of their delivery. The Company may be subject to additional collection of taxes, fines and interest as a result of these reviews. The results obtained by subsidiaries abroad are subject to taxation in accordance with the tax laws of each country.
BRF S.A. | 2021 AND 2020 CONSOLIDATED FINANCIAL STATEMENTS | F-38 |
| 11. | JUDICIAL DEPOSITS |
The rollforward of the judicial deposits is set forth below:
| Tax | Labor | Civil, commercial and other | Total | ||||||||||||
| 12.31.21 | 12.31.20 | 12.31.21 | 12.31.20 | 12.31.21 | 12.31.20 | 12.31.21 | 12.31.20 | ||||||||
| Beginning balance | |
|
|
|
|
|
|
| |||||||
| Additions | |
|
|
|
|
|
|
| |||||||
| Release in favor of the Company | ( |
( |
( |
( |
( |
( |
( |
( | |||||||
| Release in favor of the counterparty | ( |
( |
( |
( |
( |
( |
( |
( | |||||||
| Business combination (note 1.2) | |
- | |
- | - | - | |
- | |||||||
| Interest | |
|
|
|
|
|
|
| |||||||
| Exchange rate variation | - | - | ( |
( |
- | - | ( |
( | |||||||
| Ending balance | |
|
|
|
|
|
|
| |||||||
BRF S.A. | 2021 AND 2020 CONSOLIDATED FINANCIAL STATEMENTS | F-39 |
| 12. | PROPERTY, PLANT AND EQUIPMENT |
The rollforward of property, plant and equipment is set forth below:
| Average rate (1) | 12.31.20 | Additions | Disposals | Business combination (note 1.2) | Transfers (2) | Exchange rate variation | 12.31.21 | ||||||||
| Cost | |||||||||||||||
| Land | |
|
( |
|
|
( |
| ||||||||
| Buildings, facilities and improvements | |
|
( |
|
|
( |
| ||||||||
| Machinery and equipment | |
|
( |
|
|
( |
| ||||||||
| Furniture and fixtures | |
|
( |
|
|
( |
| ||||||||
| Vehicles | |
|
( |
|
|
|
| ||||||||
| Construction in progress | |
|
( |
|
( |
( |
| ||||||||
| Advances to suppliers | |
|
|
|
( |
( |
| ||||||||
| |
|
( |
|
( |
( |
| |||||||||
| Depreciation | |||||||||||||||
| Land (3) | ( |
( |
|
|
( |
( |
( | ||||||||
| Buildings, facilities and improvements | ( |
( |
|
|
|
|
( | ||||||||
| Machinery and equipment | ( |
( |
|
|
|
|
( | ||||||||
| Furniture and fixtures | ( |
( |
|
|
|
|
( | ||||||||
| Vehicles | ( |
( |
|
|
|
( |
( | ||||||||
| ( |
( |
|
|
( |
|
( | |||||||||
| |
|
( |
|
( |
( |
|
| (1) |
| (2) |
| (3) |
BRF S.A. | 2021 AND 2020 CONSOLIDATED FINANCIAL STATEMENTS | F-40 |
| Average rate | 12.31.19 | Additions | Disposals | Transfers | Exchange rate variation | 12.31.20 | |||||||
| Cost | |||||||||||||
| Land | |
|
( |
|
|
| |||||||
| Buildings, facilities and improvements | |
|
( |
|
|
| |||||||
| Machinery and equipment | |
|
( |
|
|
| |||||||
| Furniture and fixtures | |
|
( |
|
|
| |||||||
| Vehicles | |
|
( |
( |
|
| |||||||
| Construction in progress | |
|
- | ( |
( |
| |||||||
| Advances to suppliers | |
|
- | |
( |
| |||||||
| |
|
( |
( |
|
| ||||||||
| Depreciation | |||||||||||||
| Land | ( |
( |
|
( |
( |
( | |||||||
| Buildings, facilities and improvements | ( |
( |
|
|
( |
( | |||||||
| Machinery and equipment | ( |
( |
|
|
( |
( | |||||||
| Furniture and fixtures | ( |
( |
|
( |
( |
( | |||||||
| Vehicles | ( |
( |
|
|
( |
( | |||||||
| ( |
( |
|
|
( |
( | ||||||||
| |
|
( |
( |
|
|
BRF S.A. | 2021 AND 2020 CONSOLIDATED FINANCIAL STATEMENTS | F-41 |
The amount of capitalized borrowing
costs during the year ended December 31, 2021 was of R$
The weighted average rate used to determine
the amount of borrowing costs subject to capitalization was
The book value of the property, plant and equipment items that are pledged as collateral for transactions of different natures are set forth below:
| Type of collateral | 12.31.21 | 12.31.20 | ||||
| Land | |
| ||||
| Buildings, facilities and improvements | |
| ||||
| Machinery and equipment | |
| ||||
| Furniture and fixtures | |
| ||||
| Vehicles | |
| ||||
| |
|
| 13. | INTANGIBLE ASSETS |
The intangible assets rollforward is set forth below:
| Average rate (1) | 12.31.20 | Additions | Disposals | Business combination (note 1.2) | Transfers | Exchange rate variation | 12.31.21 | |||||||
| Cost | ||||||||||||||
| Goodwill | |
|
( |
|
|
|
| |||||||
| Trademarks | |
|
|
|
|
( |
| |||||||
| Non-compete agreement | |
|
( |
|
|
|
| |||||||
| Outgrowers relationship | |
|
( |
|
|
|
| |||||||
| Patents | |
|
( |
|
|
( |
| |||||||
| Customer relationship | |
|
|
|
|
( |
| |||||||
| Software | |
|
( |
|
|
( |
| |||||||
| Intangible in progress | |
|
|
|
( |
( |
| |||||||
| |
|
( |
|
|
( |
| ||||||||
| Amortization | ||||||||||||||
| Non-compete agreement | ( |
( |
|
|
|
( |
( | |||||||
| Outgrowers relationship | ( |
( |
|
|
|
|
( | |||||||
| Patents | ( |
( |
|
|
( |
|
( | |||||||
| Customer relationship | ( |
( |
|
|
|
|
( | |||||||
| Software | ( |
( |
|
|
|
( |
( | |||||||
| ( |
( |
|
|
|
|
( | ||||||||
| |
( |
( |
|
|
( |
|
| (1) |
BRF S.A. | 2021 AND 2020 CONSOLIDATED FINANCIAL STATEMENTS | F-42 |
| Average rate (1) | 12.31.19 | Additions | Disposals | Transfers | Exchange rate variation | 12.31.20 | |||||||
| Cost | |||||||||||||
| Goodwill | |
- | - | ( |
|
| |||||||
| Trademarks | |
- | - | - | |
| |||||||
| Non-compete agreement | |
|
( |
- | |
| |||||||
| Outgrowers relationship | |
- | ( |
- | - | | |||||||
| Patents | |
- | ( |
- | |
| |||||||
| Customer relationship | |
- | - | - | |
| |||||||
| Software | |
|
( |
|
|
| |||||||
| Intangible in progress | |
|
- | ( |
|
| |||||||
| |
|
( |
|
|
| ||||||||
| Amortization | |||||||||||||
| Non-compete agreement | ( |
( |
|
- | ( |
( | |||||||
| Outgrowers relationship | ( |
( |
|
- | - | ( | |||||||
| Patents | ( |
( |
|
- | ( |
( | |||||||
| Customer relationship | ( |
( |
- | - | ( |
( | |||||||
| Software | ( |
( |
|
|
( |
( | |||||||
| ( |
( |
|
|
( |
( | ||||||||
| |
( |
( |
|
|
|
| (1) |
| 13.1. | Impairment test |
The impairment test of assets is carried out annually based on the discounted cash flow method, which is prepared in order to determine the value in use of the Company’s cash-generating units (“CGU”). In 2021, the Company used its budget, strategic and financial planning with projections until 2026 and average perpetuity of the cash generating units of 3.10% p.a., based on the history of recent years, as well as in the economic and financial projections of each market in which the Company operates, in addition to official information from independent and governmental institutions.
The discount rate used by Management to prepare discounted cash flows varied from 9.14% p.a. to 11.60% p.a. according to the CGU. The assumptions presented in the table below were also adopted:
| 2022 | 2023 | 2024 | 2025 | 2026 | ||||||
| Inflation Brazil | ||||||||||
| Inflation - United States | ||||||||||
| Exchange rate - BRL / USD |
The rates presented above don’t consider the effects of income taxes.
Based on Management’s analysis, no impairment adjustments were identified.
In addition to the analysis mentioned above, Management prepared a deterministic sensitivity analysis considering the variations in the Earnings Before Interest and Tax (“EBIT”) margin and in the nominal discount rate as shown below:
| Variations | |||||
| Apreciation (devaluation) | ( | ||||
| BRAZIL CGU | |||||
| Discount rate | |||||
| Ebit Margin | |||||
| INTERNATIONAL CGU´s | |||||
| Discount rate | |||||
| Ebit Margin |
The Company, in its sensitivity analysis, did not identify any scenarios in which an impairment was necessary.
BRF S.A. | 2021 AND 2020 CONSOLIDATED FINANCIAL STATEMENTS | F-43 |
| 14. | LOANS AND BORROWINGS |
| Charges (p.a.) | Average rate (1) | WAMT (2) | 12.31.20 | Borrowing | Business combination (note 1.2) | Amortization | Interest paid | Interest accrued | Exchange rate variation | 12.31.21 | |||||||||||
| Local currency | |||||||||||||||||||||
| Working capital | (3.25% on 12.31.20) |
|
( |
( |
|
|
|||||||||||||||
| Certificate of agribusiness receivables (3) | (10.21% on 12.31.20) |
- | - | - | |
- | |||||||||||||||
| Development bank credit lines | - | - | ( |
( |
- | ||||||||||||||||
| Debentures | (8.28% on 12.31.20) |
- | - | ( |
- | ||||||||||||||||
| Export credit facility (4) | |
( |
( |
||||||||||||||||||
| Fiscal incentives | (2.40% on 12.31.20) |
- | |
|
- | ( |
( |
- | |||||||||||||
| |
( |
( |
|||||||||||||||||||
| Foreign currency | |||||||||||||||||||||
| Bonds | (4.81% on 12.31.20) |
|
- | - | ( |
( |
| ||||||||||||||
| Export credit facility | - | |
( |
( |
|
|
|||||||||||||||
| Advances for foreign exchange rate contracts | - | ( |
( |
||||||||||||||||||
| Working capital | |
( |
( |
|
( |
||||||||||||||||
| |
|
( |
( |
| |||||||||||||||||
| |
( |
( |
| ||||||||||||||||||
| Current | |||||||||||||||||||||
| Non-current | |
|
| (1) |
| (2) |
| (3) |
| (4) |
BRF S.A. | 2021 AND 2020 CONSOLIDATED FINANCIAL STATEMENTS | F-44 |
| Charges (p.a.) | Average rate | WAMT | 12.31.19 | Borrowing | Amortization | Interest paid | Interest accrued | Exchange rate variation | 12.31.20 | ||||||||||
| Local currency | |||||||||||||||||||
| Working capital | (6.07% on 12.31.19) |
|
|
( |
( |
|
- | | |||||||||||
| Certificate of agribusiness receivables | (6.73% on 12.31.19) |
|
- | ( |
( |
|
- | | |||||||||||
| Development bank credit lines | - | |
- | ( |
( |
|
- | | |||||||||||
| Debentures | (7.40% on 12.31.19) |
|
|
- | ( |
|
- | | |||||||||||
| Export credit facility | |
|
( |
( |
|
|
| ||||||||||||
| Special program asset restructuring | - | |
- | ( |
( |
|
- | - | |||||||||||
| Fiscal incentives | (2.40% on 12.31.19) |
- | |
|
( |
( |
|
- | | ||||||||||
| |
|
( |
( |
|
|
| |||||||||||||
| Foreign currency | |||||||||||||||||||
| Bonds | (4.36% on 12.31.19) |
|
|
( |
( |
|
|
| |||||||||||
| Export credit facility | |
- | ( |
( |
|
|
| ||||||||||||
| Advances for foreign exchange rate contracts | - | - | |
|
( |
- | - | ( |
| ||||||||||
| Working capital | |
|
( |
( |
|
( |
| ||||||||||||
| |
|
( |
( |
|
|
| |||||||||||||
| |
|
( |
( |
|
|
| |||||||||||||
| Current | |
| |||||||||||||||||
| Non-current | |
|
On December 31, 2021 and on December 31, 2020 the Company did not have any financial covenant clauses related to its loans and borrowings agreements.
The maturity schedule of the loans and borrowings is presented on note 23.3.
BRF S.A. | 2021 AND 2020 CONSOLIDATED FINANCIAL STATEMENTS | F-45 |
| 14.1. | Revolving credit facility |
With the purpose of maintaining a prudential
and sustainable short-term liquidity position, in line with the adoption of measures to extend its average debt maturity and reduce the
cost of debt, on December 27, 2019, the Company retained from Banco do Brasil a revolving credit facility up to the limit of R$
14.2. Issuance of debentures
On June 02, 2021, 1,000,000 (one million) Debentures were subscribed with a notional value of R$ 1,000.00 (one thousand Brazilian Reais), in a total amount of R$1,000,000, in a single series. The Debentures are simple, not convertible into shares, unsecured and for private placement. The Debentures were privately placed with VERT Companhia Securitizadora, to back its sixtieth issuance of Agribusiness Receivables Certificates which were object of public distribution with restricted placement efforts.
| 12.31.21 | ||||||||||||
| Operation | Series | Issue date | Maturity | Rate | Notional | Updated Value | ||||||
| Debenture - 3rd Issue | |
| ||||||||||
The issuance costs of R$34,258 are recognized on the statement of income over the term of the debt according to the effective interest rate method.
| 14.3. | Senior Notes repurchase offer |
During June 2021, the Company made an offer to repurchase its 4.875% Senior Notes due on 2030, in which it repurchased the principal amount equivalent to R$297,141 (USD59,402). The Company paid the amount of R$317,532 for the repurchase of these liabilities, amount that includes principal, interest and premium. The Company incurred in financial expenses in the amount of R$14,114 with the premium paid, R$2,491 with taxes and R$3,089 with the write-off of the costs of issuance. The principal outstanding after the repurchase is equivalent to R$3,454,509 (USD690,598).
| 14.4. | Guarantees |
| 12.31.21 | 12.31.20 | ||
| Total loans and borrowings | |
| |
| Mortgage guarantees | |
| |
| Related to FINAME | |
- | |
| Related to tax incentives and other | |
|
On December 31, 2021, the amount of
bank guarantees contracted by the Company was of R$
BRF S.A. | 2021 AND 2020 CONSOLIDATED FINANCIAL STATEMENTS | F-46 |
| 15. | TRADE ACCOUNTS PAYABLE |
| 12.31.21 | 12.31.20 | ||
| Trade accounts payable | |||
| Domestic market | |||
| Third parties | |
| |
| Foreign market | |||
| Third parties | |
| |
| |
| ||
| (-) Adjustment to present value | ( |
( | |
| |
| ||
| Current | |
| |
| Non-current | |
|
Within the trade accounts payable balance
as of December 31, 2021, R$
| 16. | SUPPLY CHAIN FINANCE |
| 12.31.21 | 12.31.20 | |||
| Supply chain finance | ||||
| Domestic market | |
| ||
| Foreign market | |
| ||
| |
| |||
| (-) Adjustment to present value | ( |
( | ||
| |
|
The Company has agreements with several financial institutions that allow the suppliers to anticipate their receivables. The suppliers may choose whether to participate and if so, with which institution. The anticipation allows the suppliers to better manage their cash flow needs. This flexibility allows the Company to intensify its commercial relations with the network of suppliers by potentially leveraging benefits such as preference for supply in case of restricted supply, better price conditions and/or more flexible payment terms, among others, without identifiable changes in other commercial conditions. The operations presented in this line item are the ones in which there were changes in the payment terms and prices negotiated with the suppliers.
On December 31, 2021, the discount
rates applied to the supply chain finance transactions agreed between our suppliers and the financial institutions in the domestic market
were set between
On December 31, 2021, the discount
rates applied to the supply chain finance transactions agreed between our suppliers and the financial institutions in the external market
were set between
BRF S.A. | 2021 AND 2020 CONSOLIDATED FINANCIAL STATEMENTS | F-47 |
| 17. | LEASES |
The Company is lessee in several lease agreements for forest lands, offices, distribution centers, outgrowers, vehicles, among others. Some contracts have a renewal option for an additional period at the end of the agreement, established by contractual amendments. Automatic renewals or renewals for undetermined periods are not allowed.
The contract clauses mentioned, with respect to renewal, readjustment and purchase option, are contracted according to market practices. In addition, there are no clauses of contingent payments or restrictions on dividends distribution, payments of interest on shareholders’ equity or obtaining debt.
| 17.1. | Right-of-use assets |
The right-of-use assets as set forth below are part of the balances of property, plant and equipment and intangible assets (notes 12 and 13).
| Average rate (1) | 12.31.20 | Additions | Disposals | Transfers | Business combination (note 1.2) | Exchange rate variation | 12.31.21 | ||||||||
| Cost | |||||||||||||||
| Land | |
|
( |
|
- | |
| ||||||||
| Buildings | |
|
( |
( |
|
|
| ||||||||
| Machinery and equipment | |
|
( |
|
|
|
| ||||||||
| Vehicles | |
|
( |
( |
|
|
| ||||||||
| Software | |
|
( |
- | - | - | | ||||||||
| |
|
( |
- | |
|
| |||||||||
| Depreciation | |||||||||||||||
| Land | ( |
( |
|
( |
- | ( |
( | ||||||||
| Buildings | ( |
( |
|
|
- | ( |
( | ||||||||
| Machinery and equipment | ( |
( |
|
( |
- | ( |
( | ||||||||
| Vehicles | ( |
( |
|
|
- | ( |
( | ||||||||
| Software | ( |
( |
|
- | - | - | ( | ||||||||
| ( |
( |
|
- | - | ( |
( | |||||||||
| |
( |
( |
- | |
|
|
| (1) | Weighted average annual rate. |
| Average rate (1) | 12.31.19 | Additions | Disposals | Transfers | Exchange rate variation | 12.31.20 | |||||||
| Cost | |||||||||||||
| Land | |
|
( |
|
|
| |||||||
| Buildings | |
|
( |
( |
|
| |||||||
| Machinery and equipment | |
|
( |
- | |
| |||||||
| Vehicles | |
|
( |
- | |
| |||||||
| Software | |
|
( |
( |
- | | |||||||
| |
|
( |
- | |
| ||||||||
| Depreciation | |||||||||||||
| Land | ( |
( |
|
( |
( |
( | |||||||
| Buildings | ( |
( |
|
( |
( |
( | |||||||
| Machinery and equipment | ( |
( |
|
- | ( |
( | |||||||
| Vehicles | ( |
( |
|
- | ( |
( | |||||||
| Software | ( |
( |
|
|
- | ( | |||||||
| ( |
( |
|
- | ( |
( | ||||||||
| |
( |
( |
- | |
|
| (1) |
BRF S.A. | 2021 AND 2020 CONSOLIDATED FINANCIAL STATEMENTS | F-48 |
| 17.2. | Lease liabilities |
| WAM (1) | 12.31.20 | Additions | Payments | Interest paid | Interest accrued | Disposals | Transfers | Business combination (note 1.2) | Exchange rate variation | 12.31.21 | |||||||||||
| Land | |
|
( |
( |
|
( |
|
- | |
| |||||||||||
| Buildings | |
|
( |
( |
|
( |
( |
|
( |
| |||||||||||
| Machinery and equipment | |
|
( |
( |
|
( |
- | |
|
| |||||||||||
| Vehicles | |
|
( |
( |
|
( |
- | |
( |
| |||||||||||
| Software | |
|
( |
( |
|
- | - | - | - | | |||||||||||
| |
|
( |
( |
|
( |
- | |
( |
| ||||||||||||
| Current | |
| |||||||||||||||||||
| Non-current | |
|
| (1) |
| WAM (1) | 12.31.19 | Additions | Payments | Interest paid | Interest accrued | Disposals | Transfers | Exchange rate variation | 12.31.20 | ||||||||||
| Land | |
|
( |
( |
|
( |
|
|
| ||||||||||
| Buildings | |
|
( |
( |
|
( |
( |
|
| ||||||||||
| Machinery and equipment | |
|
( |
( |
|
( |
|
|
| ||||||||||
| Vehicles | |
|
( |
( |
|
( |
( |
|
| ||||||||||
| Software | |
|
( |
( |
|
- | - | - | | ||||||||||
| |
|
( |
|
( |
- | |
| ||||||||||||
| Current | |
383,162 | |||||||||||||||||
| Non-current | |
2,153,519 |
| (1) |
| 17.3. | Lease liabilities maturity schedule |
The maturity schedule of the minimum required future payments is presented below:
| 12.31.21 | |
| Current | |
| Non-current | |
| 2023 | |
| 2024 | |
| 2025 | |
| 2026 | |
| 2027 onwards | |
| |
BRF S.A. | 2021 AND 2020 CONSOLIDATED FINANCIAL STATEMENTS | F-49 |
| 17.4. | Incremental borrowing rate |
The Company uses nominal incremental borrowing rates to measure its lease liabilities. The nominal and real interest rates are presented below:
| 12.31.21 | 12.31.20 | |||||||
| Contract Terms | Nominal rate % p.a. | Real rate % p.a. | Nominal rate % p.a. | Real rate % p.a. | ||||
| - | - | |||||||
| - | - | |||||||
| - | - | |||||||
| - | - | |||||||
| - | - | |||||||
| - | - | |||||||
| - | - | |||||||
| - | - | |||||||
| - | - | |||||||
| - | - | |||||||
| - | - | |||||||
The nominal rates presented above as of December 31, 2021 refer to the incremental borrowing rates used in contracts recognized during the year ended December 31, 2021 and the rates as of December 31, 2020 refer to the rates used in contracts recognized during the year ended December 31, 2020.
| 17.5. | Amounts recognized in the statement of income |
The amounts directly recognized in the statement of income presented below relate to items exempt of recognition: low-value assets, short-term leases and leases with variable payments.
| 12.31.21 | 12.31.20 | 12.31.19 | ||||
| Variable payments not included in the lease liabilities | |
|
| |||
| Expenses related to short-term leases | |
|
| |||
| Expenses related to low-value assets | |
|
| |||
| |
|
|
| 18. | SHARE-BASED PAYMENT |
The Company grants to its eligible employees, stock options and restricted stocks, ruled by plans approved at the General Shareholder’s Meeting, with the purpose of: (i) stimulating the expansion, success and achievement of the Company’s social objectives; (ii) aligning the interests of the Company’s shareholders with those of the eligible employees; and (iii) enabling the Company and its subsidiaries to attract and retain the employees. The limit of grants is 2.5% of the common, registered, book-entry shares with no par value, representative of the Company’s total capital stock.
Annually, or whenever it deems appropriate, the Board of Directors approves the grant of restricted stocks, electing the beneficiaries in favor of which the Company will transfer the restricted stocks, establishing the terms, quantities and conditions of acquisition of rights related to restricted stocks.
The vesting is conditional to the: (i) continuity of the employment relationship with the Company for three years after the grant date; (ii) achievement of a minimum shareholder return defined by the Board of Directors in the granting agreements and measured at the end of the vesting period; or (iii) any other conditions determined by the Board of Directors in each grant.
BRF S.A. | 2021 AND 2020 CONSOLIDATED FINANCIAL STATEMENTS | F-50 |
The breakdown of the outstanding shares granted is set forth as follows:
| Date | Quantity | Grant (1) | ||||||
| Grant | Vesting date | Shares granted | Outstanding shares | Fair value of the shares | ||||
| 06.01.22 | |
|
| |||||
| 07.01.22 | |
|
| |||||
| 10.01.22 | |
|
| |||||
| 06.01.23 | |
|
| |||||
| 07.01.24 | |
|
| |||||
| |
5,395,519 | |||||||
| (1) |
| Outstanding options/stocks as of December 31, 2020 (1) | | |
| Granted | ||
| Restricted stocks - July 2021 | | |
| Exercised / Delivered: | ||
| Restricted stocks – grant of June, 2020 | ( | |
| Restricted stocks – grant of September, 2019 | ( | |
| Restricted stocks – grant of July, 2019 | ( | |
| Restricted stocks – grant of June, 2019 | ( | |
| Restricted stocks – grant of October, 2018 | ( | |
| Forfeiture (2) : | ||
| Restricted stocks – grant of July, 2021 | ( | |
| Restricted stocks – grant of June, 2020 | ( | |
| Restricted stocks – grant of September, 2019 | ( | |
| Restricted stocks - grant of July, 2019 | ( | |
| Restricted stocks – grant of June, 2019 | ( | |
| Restricted stocks - grant of October, 2018 | ( | |
| Expired: | ||
| Stock options - grant of May, 2016 | ( | |
| Stock options - grant of April, 2016 | ( | |
| Outstanding options/stocks as of December 31, 2021 | |
| (1) |
| (2) |
The Company has registered under shareholders’
equity, the fair value of share-based compensation
plans in the amount of R$ (R$ as of December 31, 2020) and in the amount of R$
| 19. | EMPLOYEES BENEFITS PLANS |
| 19.1. | Supplementary pension plans |
The Company is the sponsor of the following pension plans for its employees and executives: i) Plan II –Variable Contribution with Defined Benefit option – closed for admissions; ii) Plan III – Defined Contribution –open for admissions; and iii) FAF Plan – Defined Benefit - closed for admissions.
BRF S.A. | 2021 AND 2020 CONSOLIDATED FINANCIAL STATEMENTS | F-51 |
These plans are managed by BRF Previdência, a closed supplementary pension entity, of non-economic and non-profit nature, and through its Deliberative Board, is responsible for defining pension objectives and policies, as well as establishing fundamental guidelines aa well as organization, operation and management rules. The Deliberative Board is composed of representatives from the sponsor and participants, in the proportion of 2/3 and 1/3 respectively.
| 19.1.1. | Defined benefit plans |
The Plan II is a variable contribution plan structured as defined contribution during the accumulation of mathematic provisions and at the benefit grant date the beneficiary may choose to convert the accumulated balance in a lifetime monthly income (defined benefit). The main related actuarial risks are (i) survival rates above the mortality tables and (ii) actual return on equity below the actual discount rate.
The FAF (Fundação Attílio Francisco Xavier Fontana) Plan aims to complement the benefit paid by the Brazilian Social Security (“INSS – Instituto Nacional de Seguridade Social”). The benefit is calculated based on the income of the participant and the amounts vary according to the type of the retirement, the length of the service and other criteria defined by the plan. The main actuarial risks related are: (i) survival rates above the mortality tables, (ii) turnover lower than expected, (iii) salary growth higher than expected, (iv) actual return on equity below the actual discount rate, (v) changes to the rules of social security, and (vi) actual family composition of the retired employee or executive different than the established assumption.
The actuarial calculations of the plans managed by BRF Previdência are prepared annually by independent specialists and reviewed by Management, according to the rules in force.
In the case of a deficit in the plans results, the sponsor, the participants and the beneficiaries, must support the plan according to the proportion of their contributions.
The economic benefit presented as an asset considers only the portion of the surplus that is actually recoverable. The recovery of the surplus on the plans is through reductions in future contributions.
| 19.1.2. | Defined contribution plan |
The Plan III is a defined contribution
plan, in which the contributions are known and the benefit depends directly on the contributions made by participants and sponsors, on
the contribution time and on the returns obtained through the investment of the contributions. The contributions made by the Company in
the year ended December 31, 2021 amounted R$
When the participants of the plans II and III terminate the employment relationship with the sponsor, the unused balance of the contributions made by the sponsor forms a surplus fund that may be used to compensate future contributions of the sponsor.
BRF S.A. | 2021 AND 2020 CONSOLIDATED FINANCIAL STATEMENTS | F-52 |
| 19.1.3. | Rollforward of defined benefit and variable contribution |
The assets and actuarial liabilities, as well as the movement of the related rights and obligations are presented below:
| FAF | Plan II | ||||||
| 12.31.21 | 12.31.20 | 12.31.21 | 12.31.20 | ||||
| Composition of actuarial assets and liabilities | |||||||
| Present value of actuarial liabilities | |
|
|
| |||
| Fair value of assets | ( |
( |
( |
( | |||
| (Surplus) Deficit | ( |
( |
|
( | |||
| Irrecoverable surplus - (asset ceiling) | |
|
- | | |||
| Net actuarial (assets) liabilities | - | - | |
( | |||
| Rollforward of irrecoverable surplus | |||||||
| Beginning balance of irrecoverable surplus | |
|
|
| |||
| Interest on irrecoverable surplus | |
|
|
| |||
| Changes in irrecoverable surplus during the year | |
( |
( |
( | |||
| Ending balance of irrecoverable surplus | |
|
- | | |||
| Rollforward of present value of actuarial liabilities | |||||||
| Beginning balance of the present value of liabilities | |
|
|
| |||
| Interest on actuarial obligations | |
|
|
| |||
| Current service cost | |
|
- | - | |||
| Past service cost - plan changes | - | ( |
- | - | |||
| Benefit paid | ( |
( |
( |
( | |||
| Actuarial losses - experience | |
|
|
| |||
| Actuarial losses - hypothesis | ( |
( |
( |
( | |||
| Ending balance of actuarial liabilities | |
|
|
| |||
| Rollforward of the fair value of the assets | |||||||
| Beginning balance of the fair value of plan assets | ( |
( |
( |
( | |||
| Interest income on assets plan | ( |
( |
( |
( | |||
| Benefit paid | |
|
|
| |||
| Return on assets higher (lower) than projection | |
|
|
| |||
| Ending Balance of the fair value of the assets | ( |
( |
( |
( | |||
| Rollforward of comprehensive income | |||||||
| Beginning balance | |
|
( |
| |||
| Reversion to accumulated losses | ( |
( |
|
( | |||
| Actuarial gains (losses) | |
|
( |
( | |||
| Return on assets higher (lower) than projection | ( |
( |
( |
( | |||
| Changes on irrecoverable surplus | ( |
|
|
| |||
| Ending balance of comprehensive income | |
|
( |
( | |||
| Costs recognized in statement of income | |||||||
| Current service costs | ( |
( |
- | - | |||
| Interest on actuarial obligations | ( |
( |
( |
( | |||
| Projected return on assets | |
|
|
| |||
| Interest on irrecoverable surplus | ( |
( |
( |
( | |||
| Past service cost - plan changes | - | |
- | - | |||
| Costs recognized in statement of income | ( |
( |
|
| |||
| Estimated costs for the next year | |||||||
| Costs of defined benefit | ( |
( |
( |
| |||
| Estimated costs for the next year | ( |
( |
( |
| |||
BRF S.A. | 2021 AND 2020 CONSOLIDATED FINANCIAL STATEMENTS | F-53 |
| 19.1.4. | Actuarial assumptions and demographic data |
The main actuarial assumptions and demographic data used in the actuarial calculations are presented below:
| FAF | Plan II | ||||||
| 12.31.21 | 12.31.20 | 12.31.21 | 12.31.20 | ||||
| Actuarial assumptions | |||||||
| Economic hypothesis | |||||||
| Discount rate | |||||||
| Inflation rate | |||||||
| Wage growth rate | N/A | N/A | |||||
| Demographic hypothesis | |||||||
| Mortality schedule | |||||||
| Mortality schedule - Disabled | |||||||
| Demographic data | |||||||
| Number of active participants | - | - | |||||
| Number of beneficiary participants assisted | |||||||
| 19.1.5. | The composition of the investment portfolios |
The composition of the investment portfolios is presented below:
| FAF | Plan II | |||||||||||||||
| 12.31.21 | 12.31.20 | 12.31.21 | 12.31.20 | |||||||||||||
| Composition of the fund's portfolio | ||||||||||||||||
| Fixed income | |
|
|
|
||||||||||||
| Variable income | |
|
|
|
||||||||||||
| Real estate | |
|
|
- | - | |||||||||||
| Structured investments | |
|
|
|
||||||||||||
| Foreign | |
- | - | |
- | - | ||||||||||
| Transactions with participants | |
|
- | - | - | - | ||||||||||
| |
|
|
|
|||||||||||||
| % of nominal return on assets | ||||||||||||||||
| 19.1.6. | Expected benefit payments and average term of payments |
The following amounts represent the expected benefit payments for future periods and the average duration of the plan’s obligations:
| FAF | Plan II | ||
| 2022 | |
| |
| 2023 | |
| |
| 2024 | |
| |
| 2025 | |
| |
| 2026 | |
| |
| 2027 to 2031 | |
| |
| Weighted average duration - in years |
BRF S.A. | 2021 AND 2020 CONSOLIDATED FINANCIAL STATEMENTS | F-54 |
| 19.1.7. | Sensitivity analysis of the defined benefit plan - FAF |
| Assumptions utilized | Variation of (+1%) | Variation of (-1%) | ||||||||
| Relevant assumptions | Average rate | Actuarial liabilities | Average rate | Actuarial liabilities | ||||||
| Benefit plan - FAF | ||||||||||
| Discount rate | |
| ||||||||
| Wage growth rate | |
| ||||||||
| 19.2. | Employee benefits: description and characteristics of benefits and associated risks |
| Liabilities | |||
| 12.31.21 | 12.31.20 | ||
| Medical assistance | |
| |
| F.G.T.S. Penalty (1) | |
| |
| Award for length of service | |
| |
| Other | |
| |
| |
| ||
| Current | |
| |
| Non-current | |
| |
| (1) |
The Company has the policy to offer the following post-employment and other employee benefits plans in addition to the pension plans, which are measured by actuarial calculation and recognized in the consolidated financial statement:
| 19.2.1. | Medical plan |
The Company offers a medical plan with fixed contribution to the retired employees according to the Law No. 9,656/98.
It is ensured to the retired employee that has contributed to the health plan during the employment relationship for at least 10 years, the right of maintenance as beneficiary, on the same conditions of coverage existing when the employment contract was in force. The main related actuarial risks are (i) survival rates above the mortality tables, (ii) turnover lower than expected and (iii) medical costs growth higher than expected.
| 19.2.2. | F.G.T.S. penalty by dismissal on retirement |
As settled by the Regional Labor Court (“TRT”) on April 20, 2007, retirement does not affect the employment contract between the Company and its employees. However, when the employee is retired through INSS and is dismissed from the Company, the Company may, in certain cases, enter into a mutual agreement granting the payment of the benefit equivalent to the 20% penalty on the F.G.T.S. balance. The main related actuarial risks are: (i) survival rates above the mortality tables, (ii) turnover lower than expected and (iii) salary growth higher than expected.
| 19.2.3. | Award for length of service |
The Company has the policy to reward active employees that attain at least 10 years of services rendered and subsequently every 5 years, with an additional remuneration. The main related actuarial risks rare (i) survival rates above the mortality tables, (ii) turnover lower than expected and (iii) salary growth higher than expected.
BRF S.A. | 2021 AND 2020 CONSOLIDATED FINANCIAL STATEMENTS | F-55 |
| 19.2.4. | Other - Brazil |
| i. | Retirement compensation |
On retirement, employees with more than 8 years of services rendered to the Company are eligible for additional compensation. The main actuarial related risks are (i) survival rates above the mortality tables, (ii) turnover lower than expected and (iii) salary growth higher than expected.
| ii. | Life insurance |
The Company offers life insurance benefits to the employees who, at the time of their termination, are retired and during the employment contract opted for the insurance, with the period of benefit varying from 2 to 3 years. The main related actuarial risks are (i) survival rates above the mortality tables, (ii) turnover lower than expected and (iii) salary growth higher than expected.
| 19.2.5. | Other – Foreign entities |
The Company has a liability recorded for defined benefit plans to certain subsidiaries located in Turkey, Saudi Arabia, Qatar and United Arab Emirates, related to end of service payments when certain conditions are met, which varies based on the labor laws for each country. The main related actuarial risks are: (i) survival rates above the mortality tables, (ii) turnover lower than expected and (iii) salary growth higher than expected.
| 19.2.6. | Rollforward of actuarial liabilities |
The rollforward of actuarial liabilities related to other benefits, which was prepared based on actuarial report reviewed by the Management, are as follows:
| Medical plan | F.G.T.S. penalty | Award for length of service | Other (1) | |||||||||||||
| 12.31.21 | 12.31.20 | 12.31.21 | 12.31.20 | 12.31.21 | 12.31.20 | 12.31.21 | 12.31.20 | |||||||||
| Composition of actuarial liabilities | ||||||||||||||||
| Present value of actuarial liabilities | |
|
|
|
|
|
|
| ||||||||
| Net actuarial liabilities | |
|
|
|
|
|
|
| ||||||||
| Rollforward of present value of actuarial liabilities | ||||||||||||||||
| Beginning balance of present value of actuarial liabilities | |
|
|
|
|
|
|
| ||||||||
| Interest on actuarial liabilities | |
|
|
|
|
|
|
| ||||||||
| Current service costs | - | - | |
|
|
|
|
| ||||||||
| Past service costs (2) | |
- | ( |
- | - | - | |
- | ||||||||
| Benefits paid directly by the Company | ( |
( |
( |
( |
( |
( |
( |
( | ||||||||
| Business combination (note 1.2) | |
- | - | - | - | - | |
- | ||||||||
| Actuarial (gains) losses - experience | ( |
|
|
|
|
|
|
| ||||||||
| Actuarial (gains) losses - demographic hypothesis | ( |
|
( |
|
( |
|
( |
| ||||||||
| Actuarial losses - economic hypothesis | ( |
( |
( |
( |
( |
( |
( |
| ||||||||
| Actuarial (gains) losses - exchange variation | - | - | - | - | - | - | (11,288) | 18,169 | ||||||||
| Ending balance of liabilities | |
|
|
|
|
|
|
| ||||||||
| Rollforward of the fair value of the assets | ||||||||||||||||
| Benefits paid directly by the Company | |
|
|
|
|
|
|
| ||||||||
| Contributions of the sponsor | ( |
( |
( |
( |
( |
( |
( |
( | ||||||||
| Ending Balance of the fair value of the assets | - | - | - | - | - | - | - | - | ||||||||
| Rollforward of comprehensive income | ||||||||||||||||
| Beginning balance | (72,744) | (80,680) | (110,903) | (98,645) | - | - | (102,324) | (87,709) | ||||||||
| Actuarial gains (losses) | |
|
|
( |
- | - | |
( | ||||||||
| Exchange variation | - | - | - | - | - | - | |
| ||||||||
| Ending balance of comprehensive income | (34,720) | (72,744) | 6,636 | (110,903) | - | - | (84,050) | (102,324) | ||||||||
| Costs recognized in statement of income | ||||||||||||||||
| Interest on actuarial liabilities | ( |
( |
( |
( |
( |
( |
( |
( | ||||||||
| Current service costs | - | - | ( |
( |
( |
( |
( |
( | ||||||||
| Past service costs (2) | ( |
- | |
- | - | - | ( |
- | ||||||||
| Immediate recognition of reduction | - | - | - | - | |
( |
- | - | ||||||||
| Cost recognized in statement of income | ( |
( |
|
( |
( |
( |
( |
( | ||||||||
| Estimated costs for the next year | ||||||||||||||||
| Current service costs | ( |
- | ( |
( |
( |
( |
( |
( | ||||||||
| Interest on actuarial liabilities | ( |
( |
( |
( |
( |
( |
( |
( | ||||||||
| Estimated costs for the next year | ( |
( |
( |
( |
( |
( |
( |
( | ||||||||
| (1) |
| (2) |
BRF S.A. | 2021 AND 2020 CONSOLIDATED FINANCIAL STATEMENTS | F-56 |
| 19.2.7. | Actuarial assumptions and demographic data |
The main actuarial assumptions and demographic data used in the actuarial calculations are summarized below:
| Medical plan | F.G.T.S. penalty | Other (1) | ||||||||||
| Actuarial assumptions | 12.31.21 | 12.31.20 | 12.31.21 | 12.31.20 | 12.31.21 | 12.31.20 | ||||||
| Economic hypothesis | ||||||||||||
| Discount rate | 7.68% | 7.11% | 6.02% | |||||||||
| Inflation rate | 3.25% | 9.04% | 6.39% | |||||||||
| Medical inflation | 6.35% | N/A | N/A | N/A | N/A | |||||||
| Wage growth rate | N/A | N/A | ||||||||||
| F.G.T.S. balance growth | N/A | N/A | N/A | N/A | ||||||||
| Demographic hypothesis | ||||||||||||
| Mortality schedule | ||||||||||||
| Disability entry schedule | N/A | N/A | ||||||||||
| Schedule of turnover - BRF's historical | ||||||||||||
| Demoraphic data | ||||||||||||
| Number of active participants | |
|
|
|
||||||||
| Number of assisted beneficiary participants | |
|
- | - | ||||||||
19.2.8. | Expected benefit payments and average duration of obligations |
The following amounts represent the expected benefit payments for future years (10 years), from the obligation of benefits granted and the average duration of the plan obligations:
| Payments | Medical plan | F.G.T.S. penalty | Award for length of service | Other | Total | |||||
| 2022 | ||||||||||
| 2023 | ||||||||||
| 2024 | ||||||||||
| 2025 | ||||||||||
| 2026 | ||||||||||
| 2027 to 2031 | ||||||||||
| Weighted average duration - in years |
| 19.2.9. | Sensitivity analysis of post-employment plans |
The Company prepared sensitivity analysis regarding the relevant assumptions of the plans as of December 31, 2021, as presented below:
| Assumptions utilized | (+) Variation | (-) Variation | ||||||||
| Relevant assumptions | Average (%) | Actuarial liabilities | Average (%) | Actuarial liabilities | ||||||
| Medical plan | ||||||||||
| Discount rate | |
| ||||||||
| Medical inflation | |
| ||||||||
| F.G.T.S. penalty | ||||||||||
| Discount rate | |
| ||||||||
| Wage growth rate | |
| ||||||||
| Turnover | Historical | + |
|
- |
| |||||
BRF S.A. | 2021 AND 2020 CONSOLIDATED FINANCIAL STATEMENTS | F-57 |
| 20. | PROVISION FOR TAX, CIVIL AND LABOR RISKS |
The Company and its subsidiaries are involved in certain legal matters arising in the normal course of business, which include civil, tax, social security, labor, commercial and other processes.
Company’s Management believes that, based on the elements existing at the base date of these consolidated financial statements, the provision for tax, civil, labor, commercial and other risks, is sufficient to cover eventual losses with administrative and legal proceedings, as set forth below.
The rollforward of the provisions for tax, labor, civil, commercial and other risks classified as with probable loss, and contingent liabilities is presented below:
| Tax | Labor | Civil, commercial and other | Contingent liabilities (1) | Total | |||||||||||||||
| 12.31.21 | 12.31.20 | 12.31.21 | 12.31.20 | 12.31.21 | 12.31.20 | 12.31.21 | 12.31.20 | 12.31.21 | 12.31.20 | ||||||||||
| Beginning balance | |
|
|
|
|
|
|
|
|
| |||||||||
| Additions | |
|
|
|
|
|
- | - | |
| |||||||||
| Business combination (note 1.2) | |
- | |
- | |
- | |
- | |
- | |||||||||
| Reversals | ( |
( |
( |
( |
( |
( |
( |
( |
( |
( | |||||||||
| Payments | ( |
( |
( |
( |
( |
( |
- | - | ( |
( | |||||||||
| Interest | |
|
|
|
|
|
- | - | |
| |||||||||
| Exchange rate variation | ( |
( |
( |
|
( |
|
( |
( |
( |
| |||||||||
| Ending balance | |
|
|
|
|
|
|
|
|
| |||||||||
| Current | |
| |||||||||||||||||
| Non-current | |
| |||||||||||||||||
| (1) |
| 20.1. | Contingencies with probable losses |
| 20.1.1. | Tax |
The tax contingencies classified as probable losses relate to the following main legal proceedings:
ICMS: The Company is involved
in administrative and judicial disputes related to the ICMS tax arising from credits on the acquisition of goods for consumption, presumed
credit, tax substitution, isolated fines, tax rate differential on seasoned product and others, in the amount of R$
PIS and COFINS: The Company is involved in administrative and judicial disputes related to the use of certain tax credits arising from the acquisition of supplies to offset federal taxes payable, in the amount of R$141,729 (R$149,945 as of December 31, 2020).
Other tax contingencies: The Company has other provisions for tax claims related to the payment of social security contribution, INCRA, FUNRURAL, SESI/SENAI/SEBRAE, debts included in the government regularization program (REFIS) with deposits awaiting consolidation and conversion into payment, differences in supplementary fiscal obligations, disputes related to presumed IPI credit, import taxes, IOF, Finsocial and others, in the amount of R$186,444 (R$75,360 as of December 31, 2020).
| 20.1.2. | Labor |
The Company is defendant in several labor claims either filed by individuals or by the Public Prosecutors Office, mainly related to overtime, thermal rest, unhealthy environment, occupational accidents, among others. None of these claims is individually significant. The Company recorded a provision based on past history of payments, statistical models and on prognosis of loss.
| 20.1.3. | Civil, commercial and others |
Civil, commercial and other contingencies are mainly related to litigations containing allegations of contractual breaches and noncompliance of legal obligations of several natures as disputes arising from contracts in general, intellectual property disputes, regulatory issues, environmental and real state, consumer relations, among others. The claims are mostly for compensation of losses and damages, application of penalties and compliance with obligations to do or not to do. None of these claims is individually significant.
BRF S.A. | 2021 AND 2020 CONSOLIDATED FINANCIAL STATEMENTS | F-58 |
| 20.2. | Contingencies with possible losses |
The Company is involved in contingencies
for which losses are possible, in accordance with the assessment prepared by Management with support from legal advisors. On December
31, 2021, the total amount of contingencies classified as possible was R$
| 20.2.1. | Tax |
The tax contingencies for which losses
have been assessed as possible amounted to R$
PIS and COFINS:
ICMS:
Income Tax and Social Contribution
(IRPJ and CSLL): The Company is involved in administrative and judicial disputes related to refunds and compensation of negative income
tax and social contribution balances, including credits arising from the Plano Verão and requirement of IRPJ and CSLL related
to the compensation of tax loss carryforwards above the limit of 30% in the incorporation of entities. The contingencies related to these
taxes totaled R$
Profits earned abroad: The Company
was assessed by the Brazilian Federal Revenue for alleged underpayment of income tax and social contribution on profits earned by its
subsidiaries located abroad, in a total amount of R$
IPI:
Social security taxes:
Other contingencies:
| 20.2.2. | Labor |
On December 31, 2021 the labor contingencies
assessed as possible loss totaled R$
BRF S.A. | 2021 AND 2020 CONSOLIDATED FINANCIAL STATEMENTS | F-59 |
| 20.2.3. | Civil, commercial and others |
Civil commercial and other contingencies
for which losses were assessed as possible totaled R$
Additionally, see the development of the processes described in the note 1.5.
| 21. | EQUITY |
| 21.1. | Capital stock |
On December 31, 2021, the subscribed
and paid capital of the Company was R$
The Company is authorized to increase the capital stock, irrespective of amendment to the bylaws, up to the limit of 1,000,000,000 (one billion) common book-entry shares with no par value.
On February 4, 2022, a capital increase was concluded (note 34.2).
| 21.1.1. | Breakdown of capital stock by nature |
| 12.31.21 | 12.31.20 | 12.31.19 | |||
| Common shares | |
|
| ||
| Treasury shares | ( |
( |
( | ||
| Outstanding shares | |
|
|
| 21.1.2. | Breakdown of capital stock by owner |
The shareholding position of the shareholders holding more than 5% of the voting stock, management and members of the Board of Directors is presented below:
| 12.31.21 | 12.31.20 | |||||||
| Shareholders | Quantity | % | Quantity | % | ||||
| Major shareholders | ||||||||
| Marfrig Global Food S.A. | |
Not available (2) | ||||||
| Fundação Petrobras de Seguridade Social - Petros (1) | |
|
||||||
| Caixa de Previd. dos Func. do Banco do Brasil (1) | |
|
||||||
| Kapitalo Investimentos Ltda. | |
Not available (2) | ||||||
| Management | ||||||||
| Board of Directors | |
|
||||||
| Executives | |
|
||||||
| Treasury shares | |
|
||||||
| Other | |
|
||||||
| |
|
|||||||
| (1) |
| (2) |
The Company is bound to arbitration in the Market Arbitration Chamber, as established by the arbitration clause in the by-laws.
| 21.1.3. | Rollforward of outstanding shares |
BRF S.A. | 2021 AND 2020 CONSOLIDATED FINANCIAL STATEMENTS | F-60 |
| Quantity of outstanding of shares | ||||||
| 12.31.21 | 12.31.20 | 12.31.19 | ||||
| Shares at the beginning of the year | |
|
| |||
| Purchase of treasury shares | ( |
( |
- | |||
| Delivery of restricted shares | |
|
| |||
| Shares at the end of the year | |
|
| |||
| 21.2. | Capital reserves and Other equity transactions |
For better presentation of the transactions, the balance previously presented in Capital reserves was split between Capital reserves and Other equity transactions. In the current presentation, Capital reserves contemplate only the balances related with results on the sale and exchange of stocks, in compatibility with the Law 6.404/1976 (“Lei das S.A”) – Brazilian Corporate Law.
| 12.31.21 | 12.31.20 | 12.31.19 | ||||
| Capital reserves | |
|
| |||
| Other equity transactions | ( |
|
| |||
| Share-based payments | |
|
| |||
| Acquisition of non-controlling interest | ( |
( |
( | |||
| Capital transactions with controlled entities | ( |
( |
( | |||
| |
|
|
| 21.3. | Absorption of accumulated losses |
The Net income for
the year ended December 31, 2021, in the amount of R$
| 21.4. | Treasury shares |
| Quantity of outstanding of shares | ||||||
| 12.31.21 | 12.31.20 | 12.31.19 | ||||
| Shares at the beggining of the year | |
|
| |||
| Purchase of treasury shares | |
|
- | |||
| Delivery of restricted shares | ( |
( |
( | |||
| Shares at the end of the year | |
|
| |||
On September 30, 2021, the Company’s Board of Directors approved the Company’s share buyback program up to the limit of 3,696,858 common shares, in an 18-month term. The goal of the program is to comply with the obligations assumed by the Company under the Restricted Shares Plan.
In the year ended December 2021, the Company purchased common shares at the total cost of R$.
BRF S.A. | 2021 AND 2020 CONSOLIDATED FINANCIAL STATEMENTS | F-61 |
| 22. | EARNINGS (LOSS) PER SHARE |
| Continued operations | Discontinued operations | Continued and discontinued operations | |||||||||||
| 12.31.21 | 12.31.20 | 12.31.19 | 12.31.21 | 12.31.19 | 12.31.21 | 12.31.19 | |||||||
| Basic numerator | |||||||||||||
| Net earnings (loss) for the year attributable to controlling shareholders | |
|
|
( |
( |
|
| ||||||
| Basic denominator | |||||||||||||
| Common shares | |
|
|
|
|
|
| ||||||
| Weighted average number of outstanding shares - basic (except treasury shares) | |
|
|
|
|
|
| ||||||
| Net earnings (loss) per share basic - R$ | |
|
|
( |
( |
|
| ||||||
| Diluted numerator | |||||||||||||
| Net earnings (loss) for the year attributable to controlling shareholders | |
|
|
( |
( |
|
| ||||||
| Diluted denominator | |||||||||||||
| Weighted average number of outstanding shares - basic (except treasury shares) | |
|
|
|
|
|
| ||||||
| Number of potential shares | |
|
|
- | - | |
| ||||||
| Weighted average number of outstanding shares - diluted | |
|
|
|
|
|
| ||||||
| Net earnings (loss) per share diluted - R$ | |
|
|
||||||||||
For the year ended December 31, 2020, the Income (loss) from discontinued operations was null.
| 23. | FINANCIAL INSTRUMENTS AND RISK MANAGEMENT |
| 23.1. | Overview |
In the ordinary course of business, the Company is exposed to credit, liquidity and market risks, which are actively managed in compliance with the Financial Risk Management Policy (“Risk Policy”) and internal guidelines and strategic documents subject to such policy, executing the formal designation of its hedge accounting relations. The Risk Policy was approved by the Board of Directors on December 16, 2021, is valid for one year and is available at the Company’s website.
The Company’s risk management strategy, guided by the Risk Policy, has as main objectives:
| » | To protect the Company’s operating and financial results, as well as its equity from adverse changes in the market prices, particularly commodities, foreign exchange and interests; |
| » | To protect the Company against counterparty risks in existing financial operations as well as to establish guidelines for sustaining the necessary liquidity to fulfil its financial commitments; |
| » | To protect the cash of Company against price volatilities, adverse conditions in the markets in which the Company acts and adverse conditions in its production chain. |
The Risk Policy defines the governance of the bodies responsible for the execution, tracking and approval of the risk management strategies, as well as the limits and instruments that can be used.
Additionally, the Management of the Company approved the following policies on November 10, 2021, which are available at the Company’s website:
| » | Financial Policy, which aims to: (i) establish guidelines for the management of the Company's financial debt and capital structure; and (ii) guide the Company's decision-making in connection with cash management (financial investments). |
| » | Profit Allocation Policy, which aims to establish the practices adopted by the Company regarding the allocation of its profits, providing, among others, the periodicity of payment of dividends and the baseline used to establish the respective amount. |
BRF S.A. | 2021 AND 2020 CONSOLIDATED FINANCIAL STATEMENTS | F-62 |
| 23.2. | Credit risk management |
The Company is exposed to the credit risk related to the financial assets held: trade and non-trade accounts receivable, marketable securities, derivative instruments and cash and equivalents. The Company’s credit risk exposure can be assessed in notes 4, 5 and 6.
| 23.2.1. | Credit risk in accounts receivable |
The credit risk associated with trade accounts receivable is actively managed through specific systems and is supported by internal policies for credit analysis. The significant level of diversification and geographical dispersion of the customer portfolio significantly reduces the risk. However, the Company chooses to complement the risk management by contracting insurance policies for specific markets. The impairment of these financial assets is carried out based on expected credit losses.
| 23.2.2. | Counterparty credit risk |
The credit risk associated with marketable securities, cash and cash equivalents and derivative instruments in general is directed to counterparties with Investment Grade ratings. The maintenance of assets with counterparty risk is constantly assessed according to credit ratings and the Company’s portfolio concentration, aligned with the applicable impairment requisites.
On December 31, 2021, the Company held
financial investments over R$
The Company also held derivative contracts with the following financial institutions: Banco Bradesco, Banco Itaú, Banco Santander, Banco Votorantim, Bank of America Merrill Lynch, Banco BNP Paribas, Citibank, Goldman Sachs, J.P. Morgan Chase Bank, Morgan Stanley, Rabobank, T. Garanti Bankasi A.Ş. and Banco XP.
| 23.3. | Capital management and liquidity risk |
The Company is exposed to liquidity risk as far as it needs cash or other financial assets to settle its obligations in the respective terms. The Company’s cash and liquidity strategy takes into consideration historical volatility scenarios of results as well as simulations of sectorial and systemic crisis. It is grounded on allowing resilience in scenarios of capital restriction.
The ideal capital structure definition at BRF is essentially associated with (i) strong cash position as a tolerance factor for liquidity shocks, which includes minimum cash analysis; (ii) net indebtedness; and (iii) maximization of the capital opportunity cost.
On December 31, 2021, the non-current
consolidated gross debt, as presented below, represented
The Company monitors the gross debt and net debt as set forth below:
| 12.31.21 | 12.31.20 | ||||||
| Current | Non-current | Total | Total | ||||
| Foreign currency loans and borrowings | ( |
( |
( |
( | |||
| Local currency loans and borrowings | ( |
( |
( |
( | |||
| Derivative financial instruments, net | ( |
( |
( |
( | |||
| Gross debt | ( |
( |
( |
( | |||
| Cash and cash equivalents | |
- | |
| |||
| Marketable securities | |
|
|
| |||
| Restricted cash | |
|
|
| |||
| |
|
|
| ||||
| Net debt | |
( |
( |
( | |||
The table below summarizes the significant commitments and contractual obligations that may impact the Company’s liquidity:
BRF S.A. | 2021 AND 2020 CONSOLIDATED FINANCIAL STATEMENTS | F-63 |
| 12.31.21 | |||||||||||||||
| Book value |
Contractual cash flow | 2022 | 2023 | 2024 | 2025 | 2026 | 2027 onwards | ||||||||
| Non derivative financial liabilities | |||||||||||||||
| Loans and borrowings | |
|
|
|
|
|
|
| |||||||
| Principal | |
|
|
|
|
|
| ||||||||
| Interest | |
|
|
|
|
|
| ||||||||
| Trade accounts payable | |
|
|
|
|
|
- | - | |||||||
| Supply chain finance | |
|
|
- | - | - | - | - | |||||||
| Lease liabilities | |
|
|
|
|
|
|
| |||||||
| Derivative financial liabilities | |||||||||||||||
| Financial instruments designated as cash flow hedge | |||||||||||||||
| Interest rate derivatives | |
|
- | - | - | - | - | | |||||||
| Currency derivatives | |
|
|
|
- | - | - | - | |||||||
| Commodities derivatives | |
|
|
|
- | - | - | - | |||||||
| Financial instruments not designated as cash flow hedge | |||||||||||||||
| Currency derivatives | |
|
|
- | - | - | - | - | |||||||
The Company does not expect that the cash outflows to fulfill the obligations shown above will be significantly anticipated by factors unrelated to its best interests, or have its value substantially modified outside the normal course of business.
23.4. Market risk management
| 23.4.1. | Interest rate risk |
The interest rate risk may cause economic losses to the Company resulting from volatility in interest rates that affect its assets and liabilities.
The Company’s Risk Policy does not restrict exposure to different interest rates, neither establishes limits for fixed or floating rates. However, the Company continually monitors the market interest rates in order to evaluate any need to enter into hedging transactions to protect from the volatility of such rates and manage the mismatch between its financial assets and liabilities.
The Company’s exposure to interest rates is set forth below:
| 12.31.21 | |||||||||
| Notional | |||||||||
| Index | Assets | Liabilities | Derivative financial instruments | Exposure, Net | |||||
| Fixed | |||||||||
| Fixed Reais | |
( |
( |
( | |||||
| Fixed U.S. Dollars (USD) | |
( |
|
( | |||||
| Fixed Turkish Liras (TRY) | |
( |
- | ( | |||||
| Fixed Euros (EUR) | |
( |
|
| |||||
| Fixed Other | |
- | ( |
| |||||
| Floating | |||||||||
| Floating IPCA Reais | - | ( |
|
( | |||||
| Floating CDI Reais | |
( |
( |
( | |||||
| Floating Libor U.S. Dollars (USD) | - | ( |
- | ( | |||||
| |
( |
- | ( | ||||||
| Interest and fair value adjustment of derivatives | - | ( |
( |
( | |||||
| Total | |
( |
( |
( | |||||
The derivative financial instruments used to hedge the exposure to interest rates as of December 31, 2021 are presented in the table below:
BRF S.A. | 2021 AND 2020 CONSOLIDATED FINANCIAL STATEMENTS | F-64 |
| 12.31.21 | |||||||||||||||
| Fair value (R$) | |||||||||||||||
| Fair value hedge - Derivative instruments | Hedged Object | Maturity | Asset | Liability | Notional | Instrument | Object (1) | ||||||||
| Interest rate swap | |
BRL | |
( | |||||||||||
| Interest rate swap | |
BRL | ( |
| |||||||||||
| Interest rate swap | |
BRL | ( |
| |||||||||||
| Interest rate swap | |
BRL | |
| |||||||||||
| |
( |
| |||||||||||||
| (1) |
| 23.4.2. | Foreign exchange risk |
The risk is the one that may cause unexpected losses to the Company resulting from volatility of the FX rates, reducing its assets and revenues, or increasing its liabilities and costs. The Company’s exposure is managed in three dimensions: statement of financial position exposure, operating income exposure and investments exposure.
| i. | Statement of financial position exposure |
The Risk Policy regarding statement of financial position exposure has the objective to balance assets and liabilities denominated in foreign currencies, hedging the Company’s statement of financial position by using natural hedges, over-the-counter derivatives and exchange traded futures.
Assets and liabilities denominated in foreign currency for which the exchange variations are recognized in the Financial Results are as follows, summarized in Brazilian Reais:
| 12.31.21 | 12.31.20 | |||
| Cash and cash equivalents | |
| ||
| Trade accounts receivable | |
| ||
| Trade accounts payable | ( |
( | ||
| Loans and borrowings | ( |
( | ||
| Other assets and liabilities, net | |
| ||
| Exposure of assets and liabilities in foreign currencies | ( |
( | ||
| Derivative financial instruments (hedge) | |
| ||
| Exposure in result, net | ( |
( |
The net P&L exposure is mainly composed of the following currencies:
| Net P&L Exposure | 12.31.21 | 12.31.20 | ||
| Argentinian Peso (ARS) | ( |
( | ||
| Angolan kwanza (AOA) | |
| ||
| Euros (EUR) | |
| ||
| Yen (JPY) | |
| ||
| Turkish Liras (TRY) | |
| ||
| U.S. Dollars (USD) | ( |
( | ||
| Total | ( |
( |
The Company is exposed to other currencies, although they have been grouped in the currencies above due to its high correlation or for not being individually significant.
The derivative financial instruments acquired to hedge the foreign currency statement of financial position exposure on December 31, 2021 are not designated as hedge accounting and are set forth below:
BRF S.A. | 2021 AND 2020 CONSOLIDATED FINANCIAL STATEMENTS | F-65 |
| 12.31.21 | |||||||||||||
| Derivative instruments not designated | Asset | Liability | Maturity | Notional | Exercise rate | Fair value (R$) | |||||||
| Non-deliverable forward | EUR | |
|
( | |||||||||
| Non-deliverable forward | USD | |
|
( | |||||||||
| Futures - B3 | USD | |
|
( | |||||||||
| Non-deliverable forward | EUR | |
|
| |||||||||
| Non-deliverable forward | EUR | |
|
( | |||||||||
| Total | ( | ||||||||||||
| ii. | Operating income exposure |
The Risk Policy regarding operating income exposure has the objective to hedge revenues and costs denominated in foreign currencies. The Company is supported by internal models to measure and monitor these risks, and uses financial instruments for hedging, designating the relations as cash flow hedges.
The derivative financial instruments designated as cash flow hedges for foreing exchange operating income exposure on December 31, 2021 are set forth below:
| 12.31.21 | |||||||||||||||
| Cash flow hedge - Derivative instruments | Hedged object | Asset | Liability | Maturity | Notional | Designation rate | Fair value | ||||||||
| Non-deliverable forward | USD | |
|
| |||||||||||
| Non-deliverable forward | USD | |
|
| |||||||||||
| Collar | USD | |
|
| |||||||||||
| Collar | USD | |
|
| |||||||||||
| Collar | USD | |
|
| |||||||||||
| | |||||||||||||||
| iii. | Investments exposure |
The Company holds investments abroad in functional currencies different than the Brazilian Real, which generate currency exposure that affects directly the Company’s Equity, in Other Comprehensive Income.
The non-derivative financial instruments designated as net investment hedge instruments on December 31, 2021 are set forth below:
| 12.31.21 | |||||||||||||
| Net investment hedge - Non-derivative instruments |
Object (Investment) | Liability | Maturity | Notional | Rate | Fair value (1) | |||||||
| Bond - BRF SA BRFSBZ 4.35 | USD | |
|
( | |||||||||
| Bond - BRF SA BRFSBZ 4.35 | USD | |
|
( | |||||||||
| Bond - BRF SA BRFSBZ 4.35 | USD | |
|
( | |||||||||
| ( | |||||||||||||
| (1) |
| 23.4.3. | Commodities price risk |
In the ordinary course of business, the Company purchases commodities, mainly corn, soybean, soybean meal and soybean oil, individual components of the production costs.
Corn and soy prices are subject to volatility resulting from weather conditions, harvest productivity, transport and warehouse costs, government agricultural policies, FX rates and international market prices, among other factors.
The Risk Policy establishes coverage limits to the flow of purchases of corn and soy with the purpose of reducing the impact due to a price increase of these raw materials. The hedge may be reached using derivatives or by inventory management.
The financial instruments designated as cash flow hedges and fair value hedges for the commodities price exposure on December 31, 2021 are set forth below:
BRF S.A. | 2021 AND 2020 CONSOLIDATED FINANCIAL STATEMENTS | F-66 |
| 12.31.21 | |||||||||||||
| Cash flow hedge - Derivative instruments | Hedged object | Index | Maturity | Quantity | Exercise price (1) | Fair value | |||||||
| Non-deliverable forward - buy | |
ton | |
| |||||||||
| Non-deliverable forward - buy | |
ton | |
| |||||||||
| Non-deliverable forward - buy | |
ton | |
| |||||||||
| Collar - buy | |
ton | |
| |||||||||
| Collar - buy | |
ton | |
| |||||||||
| Corn future - buy | |
ton | |
( | |||||||||
| Corn future - buy | |
ton | |
( | |||||||||
| Collar - buy | |
ton | |
( | |||||||||
| Collar - buy | |
ton | |
( | |||||||||
| Non-deliverable forward - buy | |
ton | |
( | |||||||||
| Non-deliverable forward - buy | |
ton | |
( | |||||||||
| Collar - buy | |
ton | |
| |||||||||
| Collar - buy | |
ton | |
| |||||||||
| Collar - buy | |
ton | |
| |||||||||
| | |||||||||||||
| (1) |
| 12.31.21 | |||||||||||||||
| Cash flow hedge - Derivative instruments |
Protection object | Assets | Liabilities | Maturity | Notional | Exercise price | Fair value (R$) | ||||||||
| Non-deliverable forward | USD | |
( | ||||||||||||
| ( | |||||||||||||||
| 12.31.21 | |||||||||||||
| Fair value hedge - Derivative instruments | Hedged object | Index | Maturity | Quantity | Exercise price (1) | Fair value | |||||||
| Non-deliverable forward - sell | |
ton | |
( | |||||||||
| Non-deliverable forward - sell | |
ton | |
( | |||||||||
| Non-deliverable forward - sell | |
ton | |
( | |||||||||
| Non-deliverable forward - sell | |
ton | |
( | |||||||||
| Non-deliverable forward - sell | |
ton | |
| |||||||||
| Non-deliverable forward - sell | |
ton | |
( | |||||||||
| Corn future - sell | |
ton | |
| |||||||||
| Corn future - sell | |
ton | |
| |||||||||
| Corn future - sell | |
ton | |
| |||||||||
| Corn future - sell | |
ton | |
| |||||||||
| Corn future - sell | |
ton | |
| |||||||||
| Corn future - sell | |
ton | |
( | |||||||||
| Collar - sell | |
ton | |
( | |||||||||
| ( | |||||||||||||
| (1) |
| 12.31.21 | |||||||||||||||
| Fair value hedge - Derivative instruments |
Protection object | Assets | Liabilities | Maturity | Notional | Exercise price | Fair value | ||||||||
| Non-deliverable forward | USD | |
( | ||||||||||||
| Non-deliverable forward | USD | |
( | ||||||||||||
| Non-deliverable forward | USD | |
( | ||||||||||||
| Non-deliverable forward | USD | |
( | ||||||||||||
| Non-deliverable forward | USD | |
| ||||||||||||
| ( | |||||||||||||||
BRF S.A. | 2021 AND 2020 CONSOLIDATED FINANCIAL STATEMENTS | F-67 |
| 23.5. | Effects of hedge instruments on financial information |
The effects of the financial instruments for hedging exchange rate, commodities price and interest rates in the income (loss) for the year, in Other Comprehensive Income and in the financial position are set forth below:
| Income for the year | ||||||||||||||
| 12.31.21 | Note | Exposure | Hedge accounting | Foreign Exchange | Commodities | Interest Rate | Total | |||||||
| Net Sales | |
- | - | | ||||||||||
| Derivatives result | Operating Results | Cash flow | |
- | - | | ||||||||
| Net Revenue | 25 | |
- | - | | |||||||||
| Cost of Sales | - | ( |
- | ( | ||||||||||
| Derivatives result | Operating Results | Cash flow / Fair value | - | ( |
- | ( | ||||||||
| Cost of Sales | - | ( |
- | ( | ||||||||||
| Interests on loans and borrowings | - | - | ( |
( | ||||||||||
| Interest Rate Derivatives result | Interest expenses | Fair value | - | - | ( |
( | ||||||||
| Foreign Exchange variation on assets and liabilities | ( |
- | - | ( | ||||||||||
| Foreign Exchange Derivatives result | Financial Position | Not designated | |
- | - | | ||||||||
| Effects on Financial Result | 27 | ( |
- | ( |
( | |||||||||
| Other Comprehensive Income | ||||||||||||||
| 12.31.21 | Exposure | Hedge accounting | Foreign Exchange | Commodities | Interest Rate | Total | ||||||||
| Derivative Instruments - current | Operating Results | Cash flow | ( |
( |
- | ( | ||||||||
| Non-derivative Instruments – current (1) | Operating Results | Cash flow | ( |
- | - | ( | ||||||||
| Non-derivative Instruments – non-current (1) | Operating Results | Cash flow | |
- | - | | ||||||||
| Non-derivative Instruments - non-current | Foreign investments | Net investment | ( |
- | - | ( | ||||||||
| Other Comprehensive Income (2) | ( |
( |
- | (318,469) | ||||||||||
| Statement of financial position | ||||||||||||||
| 12.31.21 | Note | Exposure | Hedge accounting | Foreign Exchange | Commodities | Interest Rate | Total | |||||||
| Designated derivatives | Operating Results | Cash flow / Fair value | ( |
|
( |
| ||||||||
| Not designated derivatives | Financial Position | Not designated | ( |
- | - | ( | ||||||||
| Asset / (Liability) net | ( |
|
( |
( | ||||||||||
| Derivative Instruments - current (3) | Operating Results | Cash flow | |
|
- | | ||||||||
| Non-derivative instruments – current | Operating Results | Cash flow | ( |
- | - | ( | ||||||||
| Non-derivative instruments – non-current | Operating Results | Cash flow | ( |
- | - | ( | ||||||||
| Non-derivative Instruments - non-current | Foreign investments | Net investment | ( |
- | - | ( | ||||||||
| Other Comprehensive Income (2) | ( |
|
- | ( | ||||||||||
| Derivatives result | Operating Results | Cash flow / Fair value | - | |
- | | ||||||||
| Inventories | 7 | - | |
- | | |||||||||
| (1) |
| (2) |
| (3) |
BRF S.A. | 2021 AND 2020 CONSOLIDATED FINANCIAL STATEMENTS | F-68 |
| Income for the year | ||||||||||||||
| 12.31.20 | Note | Exposure | Hedge accounting | Foreign Exchange | Commodities | Interest Rate | Total | |||||||
| Net Sales | |
- | - | | ||||||||||
| Derivatives result | Operating Results | Cash flow | ( |
- | - | ( | ||||||||
| Net Revenue | 25 | |
- | - | | |||||||||
| Cost of Sales | - | ( |
- | ( | ||||||||||
| Derivatives result | Operating Results | Cash flow / Fair value | - | ( |
- | ( | ||||||||
| Cost of Sales | - | ( |
- | ( | ||||||||||
| Interests on loans and borrowings | - | - | ( |
( | ||||||||||
| Interest Rate Derivatives result | Interest expenses | Cash flow | - | - | ( |
( | ||||||||
| Foreign Exchange variation on assets and liabilities | ( |
- | - | ( | ||||||||||
| Foreign Exchange Derivatives result | Financial Position | Not designated | |
- | - | | ||||||||
| Effects on Financial Result | 27 | ( |
- | ( |
( | |||||||||
| Other Comprehensive Income | ||||||||||||||
| 12.31.20 | Exposure | Hedge accounting | Foreign Exchange | Commodities | Interest Rate | Total | ||||||||
| Derivative Instruments - current | Operating Results | Cash flow | ( |
|
- | | ||||||||
| Non-derivative Instruments – non-current | Operating Results | Cash flow | ( |
- | - | ( | ||||||||
| Non-derivative Instruments - non-current | Foreign investments | Net investment | ( |
- | - | ( | ||||||||
| Other Comprehensive Income | ( |
|
- | ( | ||||||||||
| Statement of financial position | ||||||||||||||
| 12.31.20 | Note | Exposure | Hedge accounting | Foreign Exchange | Commodities | Interest Rate | Total | |||||||
| Designated derivatives | Operating Results | Cash flow / Fair value | |
( |
- | ( | ||||||||
| Not designated derivatives | Financial Position | Not designated | |
- | ( |
| ||||||||
| Asset / (Liability) net | |
( |
( |
( | ||||||||||
| Derivative Instruments - current | Operating Results | Cash flow | |
|
- | | ||||||||
| Non-derivative instruments – non-current | Operating Results | Cash flow | ( |
- | - | ( | ||||||||
| Non-derivative Instruments - non-current | Foreign investments | Net investment | ( |
- | - | ( | ||||||||
| Other Comprehensive Income | ( |
|
- | ( | ||||||||||
| Derivatives result | Operating Results | Cash flow / Fair value | - | |
- | | ||||||||
| Inventories | 7 | - | |
- | | |||||||||
In the statement of cash flows, the effect of the derivative financial instruments designated as hedge accounting is presented in the line item in which the hedged object is recorded. For the instruments not designated, the effects are presented in the Derivative Financial Instruments line item.
On December 16, 2021, the Financial Risk Management Policy was amended and from this date, non-derivative financial instruments may only be designated as hedge instruments in net investment hedge relations. Thus, on December 16, 2021, the cash flow hedge relations presented below were discontinued because the hedging instruments were non-derivative financial instruments (loans) and no longer met the Company’s strategies and objectives.
| 12.31.21 | |||||||||||||||
| Cash flow hedge - Non-derivative instruments | Hedged object | Liability | Maturity | Notional | Designation rate | Rate (1) | Balance (2) | ||||||||
| Bond BRF SA BRFSBZ 5 7/8 (3) | USD | |
|
|
( | ||||||||||
| Bond BRF SA BRFSBZ 3.95 | USD | |
|
|
( | ||||||||||
| ( | |||||||||||||||
| (1) |
| (2) |
| (3) |
The amounts above will be kept under Other Comprehensive Income until their respective months of maturity, according to the previous designation and effectiveness of each relationship.
BRF S.A. | 2021 AND 2020 CONSOLIDATED FINANCIAL STATEMENTS | F-69 |
Summarized financial position of derivative financial instruments:
| 12.31.21 | 12.31.20 | ||
| Assets | |||
| Designated as hedge accounting | |||
| Currency derivatives | |
| |
| Commodities derivatives | |
| |
| Interest rate derivatives | |
- | |
| Not designated as hedge accounting | |||
| Currency derivatives | |
| |
| |
| ||
| Current assets | |
| |
| Non-current assets | |
| |
| Liabilities | |||
| Designated as hedge accounting | |||
| Currency derivatives | ( |
( | |
| Commodities derivatives | ( |
( | |
| Interest rate derivatives | (40,565) | - | |
| Not designated as hedge accounting | |||
| Currency derivatives | ( |
( | |
| Interest rate derivatives | - | ( | |
| ( |
( | ||
| Current liabilities | ( |
( | |
| Non-current liabilities | ( |
( |
BRF S.A. | 2021 AND 2020 CONSOLIDATED FINANCIAL STATEMENTS | F-70 |
| 23.6. | Sensitivity analysis |
The Management believes that the most relevant risks that may affect the Company’s results are the volatility of commodities prices and foreign exchange rates. Currently the fluctuation of the interest rates does not affect significantly the Company’s results since Management has chosen to keep at fixed rates a considerable portion of its debts.
The amounts below represent the possible impacts (incremental results) of the hedging instruments and their respective hedged positions, considering situations of increase and decrease in the selected risk factors.
The information used in the preparation of the analysis is based on the position as of December 31, 2021, which has been described in the items above. The estimated values may differ significantly to numbers and results that will be effectively registered by the Company. Positive values indicate gains and negative values indicate losses.
| Scenario | ||||||||||||||
| Exchange rate - Balance | Base | - 50% | - 25% | - 10% | + 10% | + 25% | + 50% | |||||||
| USD | ||||||||||||||
| Monetary Assets and Liabilities | 4,363,957 | |
|
( |
( |
( | ||||||||
| Derivative Instruments - Not designated | (3,518,304) | ( |
( |
|
|
| ||||||||
| Net effect | 845,653 | |
|
( |
( |
( | ||||||||
| EUR | ||||||||||||||
| Monetary Assets and Liabilities | 757,905 | |
|
( |
( |
( | ||||||||
| Derivative Instruments - Not designated | (770,243) | ( |
( |
|
|
| ||||||||
| Net effect | (12,338) | ( |
( |
|
|
| ||||||||
| JPY | ||||||||||||||
| Monetary Assets and Liabilities | (99,177) | ( |
( |
|
|
| ||||||||
| Derivative Instruments - Not designated | 60,588 | |
|
( |
( |
( | ||||||||
| Net effect | (38,589) | ( |
( |
|
|
| ||||||||
| TRY | ||||||||||||||
| Monetary Assets and Liabilities | (133,270) | ( |
( |
|
|
| ||||||||
| Net effect | (133,270) | ( |
( |
|
|
| ||||||||
| AOA | ||||||||||||||
| Monetary Assets and Liabilities | ( |
( |
( |
|
|
| ||||||||
| Net effect | ( |
( |
( |
|
|
| ||||||||
| Scenario | ||||||||||||||
| Exchange rate - Operating results | Base | - 50% | - 25% | - 10% | + 10% | + 25% | + 50% | |||||||
| USD | 5.5805 | 2.7903 | 4.1854 | 5.0225 | 6.1386 | 6.9756 | 8.3708 | |||||||
| Revenue in USD | ( |
( |
( |
|
|
| ||||||||
| NDF | |
|
|
( |
( |
( | ||||||||
| Collar | |
|
|
( |
( |
( | ||||||||
| Net effect | ( |
( |
( |
|
|
| ||||||||
BRF S.A. | 2021 AND 2020 CONSOLIDATED FINANCIAL STATEMENTS | F-71 |
| Scenario | ||||||||||||||
| Exchange rate - Operating results | Base | - 50% | - 25% | - 10% | + 10% | + 25% | + 50% | |||||||
| USD | 5.5805 | 2.7903 | 4.1854 | 5.0225 | 6.1386 | 6.9756 | 8.3708 | |||||||
| Cost of Sales | ( |
( |
( |
|
|
| ||||||||
| NDF | |
|
|
( |
( |
( | ||||||||
| Net effect | - | - | - | - | - | - | ||||||||
| Scenario | ||||||||||||||
| Operating results - Commodities | Base (1) | - 50% | - 25% | - 10% | + 10% | + 25% | + 50% | |||||||
| Soy Grain - CBOT | 492 | 246 | 369 | 443 | 541 | 615 | 738 | |||||||
| Cost of Sales | ( |
( |
( |
|
|
| ||||||||
| NDF | |
|
|
( |
( |
( | ||||||||
| Net effect | - | - | - | - | - | - | ||||||||
| Soybean Meal - CBOT | 434 | 217 | 326 | 391 | 478 | 543 | 651 | |||||||
| Cost of Sales | |
|
|
( |
( |
( | ||||||||
| Collar | ( |
( |
( |
|
|
| ||||||||
| NDF | ( |
( |
( |
|
|
| ||||||||
| Net effect | |
|
|
( |
( |
( | ||||||||
| Soybean Oil - CBOT | 1,237 | 618 | 927 | 1,113 | 1,360 | 1,546 | 1,855 | |||||||
| Cost of Sales | |
|
|
( |
( |
( | ||||||||
| Collar | ( |
( |
- | - | |
| ||||||||
| NDF | ( |
( |
( |
|
|
| ||||||||
| Net effect | |
|
|
( |
( |
( | ||||||||
| Corn - CBOT | 231 | 115 | 173 | 208 | 254 | 288 | 346 | |||||||
| Cost of Sales | ( |
( |
( |
|
|
| ||||||||
| NDF | |
|
|
( |
( |
( | ||||||||
| Net effect | - | - | - | - | - | - | ||||||||
| Corn - B3 | 1,418 | 709 | 1,064 | 1,276 | 1,560 | 1,773 | 2,127 | |||||||
| Cost of Sales | ( |
( |
( |
|
|
| ||||||||
| Collar | ( |
( |
( |
|
|
| ||||||||
| Future | |
|
|
( |
( |
( | ||||||||
| Net effect | |
|
|
( |
( |
( | ||||||||
| (1) |
23.7. Financial instruments by category
| 12.31.21 | |||||||
| Amortized cost | Fair value through other comprehensive income | Fair value through profit and loss | Total | ||||
| Equity instruments | |||||||
| Assets | |||||||
| Cash and bank | |
- | - | | |||
| Cash equivalents | - | - | |
| |||
| Marketable securities | |
|
|
| |||
| Restricted cash | |
- | - | | |||
| Trade accounts receivable | |
- | |
| |||
| Other receivables | |
- | - | | |||
| Derivatives not designated | - | - | |
| |||
| Derivatives designated as hedge accounting (1) | - | - | |
| |||
| Liabilities | |||||||
| Trade accounts payable | ( |
- | - | ( | |||
| Supply chain finance | ( |
- | - | ( | |||
| Loans and borrowings (2) | ( |
- | ( |
( | |||
| Derivatives not designated | - | - | ( |
( | |||
| Derivatives designated as hedge accounting (1) | - | - | ( |
( | |||
| ( |
|
|
( | ||||
| (1) |
| (2) |
BRF S.A. | 2021 AND 2020 CONSOLIDATED FINANCIAL STATEMENTS | F-72 |
| 12.31.20 | |||||||
| Amortized cost | Fair value through other comprehensive income | Fair value through profit and loss | Total | ||||
| Equity instruments | |||||||
| Assets | |||||||
| Cash and bank | |
- | - | | |||
| Cash equivalents | - | - | |
| |||
| Marketable securities | |
|
|
| |||
| Restricted cash | |
- | - | | |||
| Trade accounts receivable | |
- | |
| |||
| Other receivables | |
- | - | | |||
| Derivatives not designated | - | - | |
| |||
| Derivatives designated as hedge accounting | - | - | |
| |||
| Liabilities | |||||||
| Trade accounts payable | ( |
- | - | ( | |||
| Supply chain finance | ( |
- | - | ( | |||
| Loans and borrowings | ( |
- | - | ( | |||
| Derivatives not designated | - | - | ( |
( | |||
| Derivatives designated as hedge accounting | - | - | ( |
( | |||
| Written option– business combination | - | - | ( |
( | |||
| ( |
|
|
( | ||||
| 23.8. | Fair value of financial instruments |
The fair value is the price that would be received to sell an asset or paid to transfer a liability in an orderly transaction between market participants at the measurement date.
Depending on the inputs used for measurement, the financial instruments at fair value may be classified into 3 hierarchy levels:
| » | Level 1 – Uses quoted prices (unadjusted) for identical instruments in active markets. In this category are classified investments in stocks, savings accounts, overnights, term deposits, Financial Treasury Bills (“LFT”) and investment funds; |
| » | Level 2 – Uses prices quoted in active markets for similar instruments, prices quoted for identical or similar instruments in non-active markets and evaluation models for which inputs are observable. In this level are classified the investments in Bank Deposit Certificates (“CDB”) and derivatives, which are measured by well-known pricing models: discounted cash flows and Black-Scholes. The observable inputs are interest rates and curves, volatility factors and foreign exchange rates; |
| » | Level 3 – Instruments for which significant inputs are non-observable. The Company had a financial liability arising from a put option written in the context of a business combination, which was terminated on December 13, 2021 (notes 1.1.3 and 23.8.1). |
The table below presents the overall classification of financial instruments measured at fair value by measurement hierarchy. For the year ended December 31, 2021, there were no changes among the 3 levels of hierarchy.
BRF S.A. | 2021 AND 2020 CONSOLIDATED FINANCIAL STATEMENTS | F-73 |
| 12.31.21 | 12.31.20 | ||||||||||||
| Level 1 | Level 2 | Total | Level 1 | Level 2 | Level 3 | Total | |||||||
| Financial Assets | |||||||||||||
| Fair value through other comprehensive income | |||||||||||||
| Stocks | |
- | |
|
- | - | | ||||||
| Fair value through profit and loss | |||||||||||||
| Savings account and overnight | |
- | |
|
- | - | | ||||||
| Term deposits | |
- | |
|
- | - | | ||||||
| Bank deposit certificates | - | |
|
- | |
- | | ||||||
| Financial treasury bills | |
- | |
|
- | - | | ||||||
| Investment funds | |
- | |
|
- | - | | ||||||
| Trade accounts receivable | - | |
|
- | |
- | | ||||||
| Derivatives | - | |
|
- | |
- | | ||||||
| Other titles | |
- | |
- | - | - | - | ||||||
| Financial Liabilities | |||||||||||||
| Fair value through profit and loss | |||||||||||||
| Derivatives | - | ( |
( |
- | ( |
- | ( | ||||||
| Loans and borrowings | - | ( |
( |
- | - | - | - | ||||||
| Written option– business combination | - | - | - | - | - | ( |
( | ||||||
| |
|
|
|
|
( |
| |||||||
Except for the items set forth below, the fair value of all other financial instruments is approximate to their book value. The fair value of the bonds set forth below is based on prices observed in active markets, level 1 of the fair value hierarchy, while the debentures are based on level 2 and are measured by discounted cash flows.
| 12.31.21 | 12.31.20 | |||||||||||
| Currency | Maturity | Book value |
Fair value |
Book value |
Fair value | |||||||
| BRF S.A. | ||||||||||||
| BRF SA BRFSBZ 5 7/8 | USD | ( |
( |
( |
( | |||||||
| BRF SA BRFSBZ 4 3/4 | USD | ( |
( |
( |
( | |||||||
| BRF SA BRFSBZ 3.95 | USD | ( |
( |
( |
( | |||||||
| BRF SA BRFSBZ 2 3/4 | EUR | ( |
( |
( |
( | |||||||
| BRF SA BRFSBZ 4 7/8 | USD | ( |
( |
( |
( | |||||||
| BRF SA BRFSBZ 5 3/4 | USD | ( |
( |
( |
( | |||||||
| Debenture - 1st Issue | BRL | ( |
( |
( |
( | |||||||
| Debenture - 2nd Issue | BRL | ( |
( |
( |
( | |||||||
| Debenture - 3rd Issue | BRL | ( |
( |
- | - | |||||||
| BRF GmbH | ||||||||||||
| BRF SA BRFSBZ 4.35 | USD | ( |
( |
( |
( | |||||||
| ( |
( |
( |
( | |||||||||
| 23.8.1. | Level 3 measurement |
The Company had a financial liability arising from a put option written in the context of a business combination, option that gave the non-controlling shareholder the right to sell its equity stake in the subsidiary for an amount equivalent, in Turkish Liras, to a multiple of the Earnings Before Interest, Taxes, Depreciation and Amortization (EBITDA) of the economic group of this subsidiary in the last 12 months prior to the exercise.
This liability was measured at the
present value of redemption amount using internal assumptions regarding the results of that economic group. The effects of the subsequent
measurement resulted in a loss recorded in Financial expenses of R$
On December 31, 2021, this liability was terminated, as described in note 1.1.3.
BRF S.A. | 2021 AND 2020 CONSOLIDATED FINANCIAL STATEMENTS | F-74 |
| 24. | SEGMENT INFORMATION |
The operating segments are reported consistently with the management reports provided to the main strategic and operational decision makers for assessing the performance of each segment and allocation of resources. The operating segments information is prepared considering three reportable segments, being: Brazil, International and Other Segments.
The operating segments include the sales of all distribution channels and are subdivided according to the nature of the products, for which the characteristics are described below:
| » | Poultry: production and sale of whole poultry and in-natura cuts. |
| » | Pork and others: production and sale of in-natura cuts. |
| » | Processed: production and sale of processed food, frozen and processed products derived from poultry, pork and beef, margarine, vegetables and soybean-based products. |
| » | Other sales: sale of flour for food service and others. |
Other segments are comprised of commercialization and development of animal nutrition ingredients, human nutrition, plant nutrition (fertilizers), healthcare (health and wellness), pet food, as well as commercialization of agricultural products.
The items not allocated to the segments are presented as Corporate and refer to relevant events not attributable to the operating segments.
The net sales by nature for each reportable operating segment is set forth below:
| Net sales | 12.31.21 | 12.31.20 | 12.31.19 | |||
| Brazil | ||||||
| In-natura | |
|
| |||
| Poultry | |
|
| |||
| Pork and other | |
|
| |||
| Processed | |
|
| |||
| Other sales | |
|
| |||
| |
|
| ||||
| International | ||||||
| In-natura | |
|
| |||
| Poultry | |
|
| |||
| Pork and other | |
|
| |||
| Processed | |
|
| |||
| Other sales | |
|
| |||
| |
|
| ||||
| Other segments | |
|
| |||
| |
|
|
The income (loss) before financial results for each segment and for Corporate is set forth below:
| 12.31.21 | 12.31.20 | 12.31.19 | ||||
| Brazil | |
|
| |||
| International | |
|
| |||
| Other segments | |
|
| |||
| Sub total | |
|
| |||
| Corporate | |
( |
( | |||
| |
|
|
The composition of the main effects not allocated to the operating segments and presented as Corporate is set forth below:
BRF S.A. | 2021 AND 2020 CONSOLIDATED FINANCIAL STATEMENTS | F-75 |
| Corporate | 12.31.21 | 12.31.20 | 12.31.19 | |||
| Impairment and result in the sale of investments | |
( |
( | |||
| Results with sale and disposal of fixed assets | |
( |
( | |||
| Reversal/(provision) for tax and civil contingencies | |
( |
( | |||
| Expenses with demobilization | ( |
( |
( | |||
| Investigations involving the Company (note 1.5) | ( |
( |
( | |||
| Expenses COVID-19 (1) | ( |
( |
- | |||
| Arbitration reversal | - | |
- | |||
| Restructuring plan | - | ( |
( | |||
| Results with disposal of businesses | - | ( |
| |||
| Agreement - Class Action | - | - | (204,436) | |||
| Other | |
|
( | |||
| |
( |
( |
| (1) | Mainly comprised of donations in Brazil, consultants and expenses with health and safety, which are not associated with the business segments. |
No customer individually or in aggregate (economic group) accounted for more than 5% of net sales for the years ended December 31, 2021, 2020 and 2019.
The goodwill arising from business combinations and the intangible assets with indefinite useful life (trademarks) were allocated to the reportable operating segments, considering the economic benefits generated by such intangible assets. The allocation of these intangible assets is presented below:
| Goodwill | Trademarks | Total | |||||||||
| 12.31.21 | 12.31.20 | 12.31.21 | 12.31.20 | 12.31.21 | 12.31.20 | ||||||
| Brazil | |
|
|
|
|
| |||||
| International | |
|
|
|
|
| |||||
| Other segments | |
- | |
- | |
- | |||||
| |
|
|
|
| |||||||
Information related to total assets by reportable segment is not disclosed, as it is not included in the set of information made available to the Company’s management, which makes investment decisions and determine allocation of resources based on information about the consolidated assets.
| 25. | NET SALES |
| 12.31.21 | 12.31.20 | 12.31.19 | |||
| Gross sales | |||||
| Brazil | |
|
| ||
| International | |
|
| ||
| Other segments | |
|
| ||
| |
|
| |||
| Sales deductions | |||||
| Brazil | ( |
( |
( | ||
| International | ( |
( |
( | ||
| Other segments | ( |
( |
( | ||
| ( |
( |
( | |||
| Net sales | |||||
| Brazil | |
|
| ||
| International | |
|
| ||
| Other segments | |
|
| ||
| |
|
|
BRF S.A. | 2021 AND 2020 CONSOLIDATED FINANCIAL STATEMENTS | F-76 |
| 26. | OTHER OPERATING INCOME (EXPENSES), NET |
| 12.31.21 | 12.31.20 | 12.31.19 | |||
| Recovery of expenses (1) | |
|
| ||
| Provision reversal | |
|
| ||
| Scrap sales | |
|
| ||
| Provision for civil and tax risks (2) | |
( |
( | ||
| Other employees benefits | ( |
( |
( | ||
| Insurance claims costs | ( |
( |
( | ||
| Gains (losses) on the disposal of non-financial assets | |
( |
( | ||
| Demobilization expenses | ( |
( |
( | ||
| Expected credit losses in other receivables | ( |
( |
- | ||
| Impairment of investments | - | ( |
( | ||
| Other (3) | ( |
( |
( | ||
| 211,263 | 233,323 | 494,139 |
| (1) |
| (2) |
| (3) |
| 27. | FINANCIAL INCOME (EXPENSES), NET |
| Note | 12.31.21 | 12.31.20 | 12.31.19 | ||||
| Financial income | |||||||
| Interest on cash and cash equivalents | 4 | |
|
| |||
| Income with marketable securities | 5 | |
|
| |||
| Fair value through other comprehensive income | - | |
| ||||
| Fair value through profit and loss | |
|
| ||||
| Amortized cost | |
|
| ||||
| Interest on recoverable taxes (1) | 9 | |
|
| |||
| Interest on other assets | |
|
| ||||
| |
|
| |||||
| Financial expenses | |||||||
| Interests on loans and borrowings | 14 | ( |
( |
( | |||
| Interest on contingencies (2) | 20 | ( |
( |
( | |||
| Interest on leases | 17 | ( |
( |
( | |||
| Interest on actuarial liabilities | ( |
( |
( | ||||
| Interest on other liabilities | |
|
( | ||||
| Written option - Business combination | 23.8.1 | ( |
|
( | |||
| Adjustment to present value | 6 and 15 | ( |
( |
( | |||
| Other | ( |
( |
( | ||||
| ( |
( |
( | |||||
| Foreign exchange and monetary variations | |||||||
| Exchange rate variation on monetary assets and liabilities | ( |
( |
| ||||
| Derivative results | |
|
( | ||||
| ( |
( |
( | |||||
| ( |
( |
( |
| (1) |
| (2) |
BRF S.A. | 2021 AND 2020 CONSOLIDATED FINANCIAL STATEMENTS | F-77 |
| 28. | STATEMENT OF INCOME BY NATURE |
The Company discloses its statement of income by function and thus presents below the details by nature:
| 12.31.21 | 12.31.20 | 12.31.19 | |||
| Costs of sales | |||||
| Raw materials and supplies (1) | |
|
| ||
| Salaries and employees benefits | |
|
| ||
| Depreciation | |
|
| ||
| Amortization | |
|
| ||
| Other | |
|
| ||
| |
|
| |||
| Sales expenses | |||||
| Indirect and direct logistics expenses | |
|
| ||
| Marketing | |
|
| ||
| Salaries and employees benefits | |
|
| ||
| Depreciation | |
|
| ||
| Amortization | |
|
| ||
| Other | |
|
| ||
| |
|
| |||
| Administrative expenses | |||||
| Salaries and employees benefits | |
|
| ||
| Fees | |
|
| ||
| Depreciation | |
|
| ||
| Amortization | |
|
| ||
| Other | |
|
| ||
| |
|
|
| (1) |
The Company incurred in expenses with
internal research and development of new products of R$
| 29. | RELATED PARTIES |
In the normal course of business, rights and obligations arise between related parties, resulting from transactions of sale and purchase of products, as well as from financial operations.
The Company holds a Related Parties Transactions Policy, which was reviewed and approved by the Board of Directors and applies to all subsidiaries of the group.
The policy mentioned above provides the conditions that must be observed for the realization of a transaction between related parties, as well as establishes approval hierarchies according to the value and nature of the transactions involved. The policy also foresees situations of conflict of interests and how they must be conducted.
In the year ended December 31, 2021, Marfrig Global Foods S.A. (“Marfrig”) acquired common shares issued by BRF S.A., achieving 33.20% of participation in the Company’s capital stock. With such participation, Marfrig is able to exercise significant influence over BRF S.A., becoming a related party. On October 20, 2021, the Administrative Council for Economic Defense’s Court (Tribunal do Conselho Administrativo de Defesa Econômica − CADE) confirmed the approval without restrictions of the acquisition of interest by Marfrig in the Company’s capital stock. The transactions and balances with Marfrig and its subsidiaries during the period are presented below.
BRF S.A. | 2021 AND 2020 CONSOLIDATED FINANCIAL STATEMENTS | F-78 |
Schedule of transaction and balances of other parties
| Accounts receivable | Trade accounts payable | ||
| 12.31.21 | 12.31.21 | ||
| Marfrig Global Foods S.A. | |
( | |
| Marfrig Chile S.A. | |
( | |
| Quickfood S.A. | |
- | |
| Total | |
( | |
| Sales | Purchases | ||
| 12.31.21 | 12.31.21 | ||
| Marfrig Global Foods S.A. (1) | |
( |
|
| Marfrig Chile S.A. (1) | |
( |
|
| Quickfood S.A. (1) | |
- | |
| Marfrig Alimentos S.A. (1) | |
- | |
| Total | |
( |
|
| (1) |
The subsidiaries of the Company enter
into loan agreements pursuant its cash management strategy. As of December 31, 2021, the balance of these transactions was R$
(R$ as of December 31, 2020) with a weighted average rate of
The Company made contributions related
to the post-employment benefit plans of its employees to BRF Previdência, which holds these plans (note 19). Additionally, the Company
leased properties owned by BRF Previdência, and for the year ended December 31, 2021 the total amount of lease payments was R$
The Company maintains other transactions with related parties resulting from guarantees, transferences and donations to related associations and institutes, as well as leasing and other commercial transactions with related people and entities. Such transactions are compliant with the Related Party Transactions Policy and are not relevant, individually or in aggregate.
| 29.1. | Management remuneration |
The total remuneration and benefits expense with board members, statutory directors and the head of internal audit are set forth below:
| 12.31.21 | 12.31.20 | 12.31.19 | |||
| Salary and profit sharing | |
|
| ||
| Short-term benefits (1) | |
|
| ||
| Private pension | |
|
| ||
| Post-employment benefits | - | - | | ||
| Termination benefits | |
|
| ||
| Share-based payment | |
|
| ||
| |
|
|
| (1) |
In addition, the executive officers (non-statutory)
received among remuneration and benefits the total amount of R$
| 30. | GOVERNMENT GRANTS |
The Company has tax benefits related to ICMS granted by the state governments as follows: Programa de Desenvolvimento Industrial e Comercial de Mato Grosso (“PRODEIC”), Programa de Desenvolvimento do Estado de Pernambuco (“PRODEPE”) and Fundo de Participação e Fomento à Industrialização do Estado de Goiás (“FOMENTAR”). Such incentives are directly associated to the manufacturing facilities operations, job generation and to the economic and social development.
For the year ended December 31, 2021,
the government grants totaled R$
BRF S.A. | 2021 AND 2020 CONSOLIDATED FINANCIAL STATEMENTS | F-79 |
| 31. | COMMITMENTS |
In the normal course of the business, the Company enters into agreements with third parties for the purchase of raw material, mainly corn and soymeal. The agreed prices in these agreements can be fixed or variable. The Company also enters into other agreements, such as electricity supply, packaging supplies, construction of buildings and others for the supply of its manufacturing activities. The firm commitments schedule is set forth below:
| 12.31.21 | ||
| Current | | |
| Non-current | | |
| 2023 | | |
| 2024 | | |
| 2025 | | |
| 2026 | | |
| 2027 onwards | | |
| 8,371,514 |
| 32. | INSURANCE COVERAGE |
The Company’s policy for insurance considers the concentration and relevance of the risks identified in its risk management program. Thus, according to Managements understanding, the contracted insurance coverage is adequate to the entity’s size and nature of activities being sufficient to cover eventual damages. The Company also takes into consideration orientations provided by its advisors.
| 12.31.21 | ||||
| Assets covered | Coverage | Amount of coverage | ||
| Operational risks | | |||
| Transport of goods | | |||
| Civil responsability | |
Each legal entity has its own coverages, which are not complementary.
| 33. | TRANSACTIONS THAT DO NOT INVOLVE CASH |
The following transactions did not involve cash or cash equivalents during the year ended December 31, 2021:
| (i) | Capitalized loan interest: as referred in note 12. |
| (ii) | Addition of lease by right-of-use assets and respective lease liability: for the year ended December 31,
2021 amounted to R$ |
| 34. | EVENTS AFTER THE REPORTING PERIOD |
| 34.1. | Memorandum of Understanding with the Public Investment Fund |
On January 13, 2022, The Company executed
a Memorandum of Understanding (“MOU”) with the Public Investment Fund (“PIF”), Saudi Arabia’s sovereign
wealth fund.
| 34.2. | Capital Increase through a Public Offering of Shares |
On January 17, 2022 an Extraordinary General Shareholders’ Meeting was held and approved the amendment to the limit of authorization for capital increase, regardless of statutory reform, which was set to 1,325,000,000 ordinary shares.
BRF S.A. | 2021 AND 2020 CONSOLIDATED FINANCIAL STATEMENTS | F-80 |
The increase in the capital of the Company was also approved, through public offering of up to 325,000,000 new ordinary shares.
The pricing of the public offering of shares was on February 2, 2022 and the Board of Directors approved the offering of 270,000,000 shares at the price of R$20.00 (twenty Brazilian Reais), in a total amount of R$5,400,000. From this amount, R$500,000 shall be allocated to the capital stock and the remaining will be allocated to the formation of a capital reserve. The settlement of the offering was on February 4, 2022.
| 35. | APPROVAL OF THE CONSOLIDATED FINANCIAL STATEMENTS |
The consolidated financial statements were approved and the issuance authorized by the Board of Directors on March 24, 2022.
BRF S.A. | 2021 AND 2020 CONSOLIDATED FINANCIAL STATEMENTS | F-81 |