REGISTRATION STATEMENT PURSUANT TO SECTION 12(b) OR 12(g) OF THE SECURITIES EXCHANGE ACT OF 1934 |
ANNUAL REPORT PURSUANT TO SECTION 13 OR 15(d) OF THE SECURITIES EXCHANGE ACT OF 1934 |
For the fiscal year ended |
TRANSITION REPORT PURSUANT TO SECTION 13 OR 15(d) OF THE SECURITIES EXCHANGE ACT OF 1934 |
SHELL COMPANY REPORT PURSUANT TO SECTION 13 OR 15(d) OF THE SECURITIES ACT OF 1934 |
Title of Each Class |
Trading Symbol(s) |
Name of Each Exchange on Which Registered | ||
* | Traded in the form of American Depositary Receipts evidencing American Depositary Shares (the “ADSs”), each representing two Common Shares of ASE Technology Holding Co., Ltd. |
☒ |
Accelerated Filer | ☐ |
Non-accelerated Filer |
☐ |
Emerging growth company |
U.S. GAAP ☐ |
Other ☐ |
TABLE OF CONTENTS
Page | ||||
1 | ||||
5 | ||||
6 | ||||
Item 1. Identity of Directors, Senior Management and Advisers |
6 | |||
6 | ||||
6 | ||||
6 | ||||
6 | ||||
6 | ||||
6 | ||||
27 | ||||
27 | ||||
29 | ||||
54 | ||||
57 | ||||
61 | ||||
61 | ||||
62 | ||||
71 | ||||
72 | ||||
72 | ||||
72 | ||||
72 | ||||
79 | ||||
81 | ||||
81 | ||||
82 | ||||
83 | ||||
83 | ||||
84 | ||||
85 | ||||
85 | ||||
85 | ||||
87 | ||||
87 | ||||
87 | ||||
88 | ||||
88 | ||||
88 | ||||
88 | ||||
88 | ||||
88 | ||||
88 | ||||
88 | ||||
94 | ||||
96 | ||||
97 | ||||
98 | ||||
101 | ||||
101 | ||||
101 | ||||
102 | ||||
102 |
i
ii
USE OF CERTAIN TERMS
Unless the context otherwise requires, references in this annual report to:
· | “Advanced Shanghai” are to ASE Advanced Semiconductor (Shanghai) Limited, a company incorporated under the laws of the P.R.C. that spun off from ASESH AT in November 2020 and was disposed of in December 2021; |
· | “AMPI” are to Advanced Microelectronic Products Inc., a company incorporated under the laws of the R.O.C.; |
· | “ASDI” are to ASDI Assistance Direction S.A.S., a simplified limited liability company (societe par actions simplifiee) organized under the laws of France; |
· | “ASE,” “ASE Inc.” or “ASE Group” are to Advanced Semiconductor Engineering Inc. and, unless the context requires otherwise, its subsidiaries; |
· | “ASE Chung Li” are to ASE (Chung Li) Inc., a company previously incorporated under the laws of the R.O.C. that merged into ASE Inc. in 2004; |
· | “ASE Electronics” are to ASE Electronics Inc., a company incorporated under the laws of the R.O.C.; |
· | “ASE Japan” are to ASE Japan Co. Ltd., a company incorporated under the laws of Japan; |
· | “ASE Korea” are to ASE (Korea) Inc., a company incorporated under the laws of the Republic of Korea; |
· | “ASE Material” are to ASE Material Inc., a company previously incorporated under the laws of the R.O.C. that merged into ASE Inc. in 2004; |
· | “ASE Shanghai” are to ASE (Shanghai) Inc., a company incorporated under the laws of the P.R.C.; |
· | “ASE Test” are to ASE Test Limited, a company incorporated under the laws of Singapore; |
· | “ASE Malaysia” are to ASE Electronics (M) Sdn. Bhd., a company incorporated under the laws of Malaysia; |
· | “ASE Test Taiwan” are to ASE Test, Inc., a company incorporated under the laws of the R.O.C.; |
· | “ASEH,” the “Company,” “ASE Technology Holding,” “we,” “us” or “our” are to ASE Technology Holding Co., Ltd. and, unless the context requires otherwise, its subsidiaries; |
· | “ASEKS” are to ASE (Kunshan) Inc., a company incorporated under the laws of the P.R.C. and was disposed of in December 2021; |
· | “ASEN” are to Suzhou ASEN Semiconductors Co., Ltd., a company incorporated under the laws of the P.R.C. and was disposed of in December 2021; |
· | “ASESH AT” are to ASE Assembly & Test (Shanghai) Limited, formerly known as Global Advanced Packaging Technology Limited, or GAPT, a company incorporated under the laws of the P.R.C.; |
· | “ASEWH” are to ASE (Weihai), Inc., a company incorporated under the laws of the P.R.C. and was disposed of in December 2021; |
· | “Deposit Agreement” are to the deposit agreement, dated April 30, 2018, by and among ASE Technology Holding Co., Ltd., a company organized under the laws of the R.O.C. and previously known as “ASE Industrial Holding Co., Ltd.,” Citibank, N.A., as Depositary, and the Holders and Beneficial Owners of American Depositary Shares issued thereunder; |
1
· | “EMS” are to electronic manufacturing services; |
· | “EU” are to the European Union; |
· | “Exchange Act” are to the U.S. Securities Exchange Act of 1934, as amended; |
· | “FAFG” or “FAFG Group” are to Financiere AFG S.A.S., a simplified limited liability company (societe par actions simplifiee) organized under the laws of France and, unless the context requires otherwise, its subsidiaries; |
· | “FSC” are to the Financial Supervisory Commission of the Republic of China; |
· | “Hung Ching” are to Hung Ching Development & Construction Co. Ltd., a company incorporated under the laws of the R.O.C.; |
· | “IFRS” are to International Financial Reporting Standards, International Accounting Standards and Interpretations as issued by the International Accounting Standards Board; |
· | “ISE Shanghai” are to ISE Labs, China, Ltd., a company incorporated under the laws of the P.R.C.; |
· | “ISE Labs” are to ISE Labs, Inc., a corporation incorporated under the laws of the State of California; |
· | “Initial SPIL Tender Offer” are to ASE’s offer to purchase 779,000,000 common shares (including common shares represented by outstanding American depositary shares) of SPIL through concurrent tender offers in the R.O.C. and the U.S., at a price of NT$45 per SPIL common share and NT$225 per SPIL American depositary share, commenced on August 24, 2015 and expired on September 22, 2015; |
· | “Joint Share Exchange Agreement” are to the joint share exchange agreement entered into between ASE and SPIL on June 30, 2016; |
· | “Korea” or “South Korea” are to the Republic of Korea; |
· | “MOEAIC” are to the Investment Commission of the R.O.C. Ministry of Economic Affairs; |
· | “NYSE” are to New York Stock Exchange; |
· | “PCAOB” are to Public Company Accounting Oversight Board (United States); |
· | “PowerASE” are to PowerASE Technology Inc., a company incorporated under the laws of the R.O.C., which was merged into ASE Inc. in 2012; |
· | “PPA Effects” are to the earnings effects from purchase price allocation (the “PPA”). “PPA of SPIL Acquisition” is the allocation of ASEH’s purchase price of SPIL into identifiable assets acquired and liabilities assumed from SPIL based on their fair values. The fair value write-up results in earnings effects over time which generate increased operating costs, operating expenses, other operating income and expenses and non-operating expenses; |
· | “P.R.C.” are to the People’s Republic of China; |
· | “P.R.C. Regulations” are to the Regulations Governing Securities Investment and Futures Trading in Taiwan by Mainland Area Investors; |
· | “QDII” are to qualified domestic institutional investors; |
· | “Republic of China,” the “R.O.C.” and “Taiwan” are to the Republic of China, including Taiwan and certain other possessions; |
· | “R.O.C. Trading Day” are to a day when TWSE is open for business; |
2
· | “SEC” are to the Securities and Exchange Commission of the United States; |
· | “Second SPIL Tender Offer” are to ASE’s offer to purchase 770,000,000 common shares (including common shares represented by outstanding American depositary shares) of SPIL through concurrent tender offers in the R.O.C. and the U.S., at a price of NT$55 per SPIL common share and NT$275 per SPIL American depositary share, commenced on December 29, 2015 and expired on March 17, 2016 due to failure to obtain regulatory approval from the Taiwan Fair Trade Commission (the “TFTC”) prior to the expiration of the Second SPIL Tender Offer; |
· | “Securities Act” are to the U.S. Securities Act of 1933, as amended; |
· | “Share Exchange” are to the statutory share exchange pursuant to the laws of the Republic of China, through which ASEH (i) acquired all issued shares of ASE in exchange for shares of ASEH using the share exchange ratio and (ii) acquired all issued shares of SPIL using the cash consideration; |
· | “SiP” are to system-in-package; |
· | “SPIL” or “SPIL Group” are to Siliconware Precision Industries Co., Ltd., and, unless the context requires otherwise, its subsidiaries; |
· | “SPIL Acquisition” are to ASEH’s effort to effect an acquisition of 100% of the common shares and American depositary shares of SPIL pursuant to the Joint Share Exchange Agreement; |
· | “SZ” are to Siliconware Technology (Suzhou) Limited, a company incorporated under the laws of the P.R.C.; |
· | “Taiwan-IFRS” are to the Regulations Governing the Preparation of Financial Reports by Securities Issuers, the IFRS as well as related guidance translated by Accounting Research and Development Foundation and endorsed by the FSC; |
· | “Tessera” are to Tessera Technologies, Inc. and its subsidiaries; |
· | “TWSE” are to Taiwan Stock Exchange; |
· | “UGJQ” are to Universal Global Technology (Shanghai) Co., Ltd., a company incorporated under the laws of the P.R.C.; |
· | “UGKS” are to Universal Global Technology (Kunshan) Co. Ltd., a company incorporated under the laws of the P.R.C.; |
· | “USIPL” are to Universal Scientific Industrial Poland Sp. z o.o., a company incorporated under the laws of Poland; |
· | “UGTW” are to Universal Global Scientific Industrial Co. Ltd., a company incorporated under the laws of the R.O.C.; |
· | “Universal Scientific Industrial” or “USI” are to Universal Scientific Industrial Co., Ltd., a company incorporated under the laws of the R.O.C.; |
· | “USIFR” are to Universal Scientific Industrial (France), a simplified limited liability company (societe par actions simplifiee) organized under the laws of France; |
· | “USI Shanghai” are to Universal Scientific Industrial (Shanghai) Co., Ltd., a company incorporated under the laws of the P.R.C.; |
· | “U.S.” refers to the United States of America; |
· | “U.S. GAAP” are to accounting principles generally accepted in the U.S.; |
3
· | “USI Group” are to USI Inc. and its subsidiaries; |
· | “USI Inc.” are to USI Inc., a company incorporated under the laws of the R.O.C.; |
· | “USI Mexico” are to Universal Scientific Industrial de Mexico S.A. DE C.V., a company incorporated under the laws of Mexico; |
· | “USISZ” are to USI Electronics (Shenzhen) Co. Ltd., a company incorporated under the laws of the P.R.C. and its production facilities were gradually relocated to Universal Global Technology (Huizhou) Co., Ltd. in 2022; and |
· | “Wuxi Tongzhi” are to Wuxi Tongzhi Microelectronics Co., Ltd., a company incorporated under the laws of the P.R.C. |
We publish our financial statements in New Taiwan dollars, the lawful currency of the R.O.C. In this annual report, references to “United States dollars,” “U.S. dollars” and “US$” are to the currency of the U.S.; references to “New Taiwan dollars,” “NT dollars” and “NT$” are to the currency of the R.O.C.; references to “RMB” are to the currency of the P.R.C.; references to “JP¥” are to the currency of Japan; references to “MYR” are to the currency of Malaysia; references to “SGD” are to the currency of the Republic of Singapore; references to “KRW” are to the currency of the Republic of Korea; references to “EUR” are to the currency of the EU; and references to “PLN” are to the currency of the Poland. Unless otherwise noted, all translations from NT dollars to U.S. dollars were made at the exchange rate as set forth in the H.10 weekly statistical release of the Federal Reserve System of the United States (the “Federal Reserve Board”) as of December 30, 2022, which was NT$30.73=US$1.00, and all translations from RMB to U.S. dollars were made at the exchange rate as set forth in the H.10 weekly statistical release of the Federal Reserve Board as of December 30, 2022, which was RMB6.8972=US$1.00. All amounts translated into U.S. dollars in this annual report are provided solely for your convenience and no representation is made that the NT dollar, RMB or U.S. dollar amounts referred to herein could have been or could be converted into U.S. dollars or NT dollars/RMB, as the case may be, at any particular rate or at all. On March 24, 2023, the exchange rate between NT dollars and U.S. dollars as set forth in the H.10 weekly statistical release by the Federal Reserve Board was NT$30.30=US$1.00. On March 24, 2023, the exchange rate between RMB and U.S. dollars as set forth in the H.10 weekly statistical release by the Federal Reserve Board was RMB6.8675=US$1.00.
4
SPECIAL NOTE REGARDING FORWARD-LOOKING STATEMENTS
This annual report on Form 20-F contains “forward-looking statements” within the meaning of Section 27A of the Securities Act and Section 21E of the Exchange Act. Although these forward-looking statements, which may include statements regarding our future results of operations, financial condition, or business prospects, are based on our own information and information from other sources we believe to be reliable, you should not place undue reliance on these forward-looking statements, which apply only as of the date of this annual report. The words “anticipate,” “believe,” “estimate,” “expect,” “intend,” “plan” and similar expressions, as they relate to us, are intended to identify these forward-looking statements in this annual report. Our actual results of operations, financial condition or business prospects may differ materially from those expressed or implied in these forward-looking statements for a variety of reasons, including risks associated with cyclicality and market conditions in the semiconductor or electronics industry; changes in our regulatory environment, including our ability to comply with new or stricter environmental regulations and to resolve environmental liabilities; demand for the outsourced semiconductor packaging, testing and EMS we offer and for such outsourced services generally; the highly competitive semiconductor or manufacturing industry we are involved in; our ability to introduce new technologies in order to remain competitive; international business activities; our business strategy; our future expansion plans and capital expenditures; the strained relationship between the R.O.C. and the P.R.C.; general economic and political conditions; the recent global economic crisis; possible disruptions in commercial activities caused by natural or human-induced disasters; fluctuations in foreign currency exchange rates; and other factors. For a discussion of these risks and other factors, see “Item 3. Key Information—Risk Factors.”
5
PART I
Item 1. Identity of Directors, Senior Management and Advisers
Not applicable.
Item 2. Offer Statistics and Expected Timetable
Not applicable.
Item 3. Key Information
[RESERVED]
CAPITALIZATION AND INDEBTEDNESS
Not applicable.
REASON FOR THE OFFER AND USE OF PROCEEDS
Not applicable.
RISK FACTORS
Below please find a summary of the principal risks we face, organized under relevant headings.
Risks Relating to Our Business
· | Since we are dependent on the highly cyclical semiconductor and electronics industries and conditions in the markets for the end-use applications of our products, our revenues and net income may fluctuate significantly. |
· | A reversal or slowdown in the outsourcing trend for semiconductor packaging and testing services and EMS could adversely affect our growth prospects and profitability. |
· | If we are unable to compete favorably in the highly competitive markets of semiconductor packaging and testing and EMS, our revenues and net income may decrease. |
· | Our profitability depends on our ability to respond to rapid technological changes in the semiconductor industry. |
· | Our operating results are subject to significant fluctuations, which could adversely affect the market value of our Common Shares and ADSs. |
· | If we are unable to manage our expansion or investments effectively, our growth prospects may be limited, and our future profitability and core business operations may be adversely affected. |
· | If we are unable to obtain sufficient funding in a timely manner or on acceptable terms, our results of operations and financial conditions may be materially and adversely affected. |
· | Any global political, economic, or financial crisis, as well as trade barriers, could adversely affect our business, financial condition, and results of operations. |
· | Inflation could adversely affect our business, financial condition, results of operations, and cash flows. |
· | Fluctuations in exchange rates could adversely affect our business, results of operations, or financial condition. |
· | Any impairment charges may have a material adverse effect on our income. |
6
· | Cyber attacks could harm our business, financial condition, and results of operations. |
Risks Relating to Taiwan, R. O. C.
· | Strained relations between the R.O.C. and the P.R.C. and disruptions in Taiwan’s political environment caused by domestic political events could negatively affect our business and the market value of our Common Shares and ADSs. |
· | As a substantial portion of our business and operations are located in Taiwan, we are vulnerable to natural disasters including earthquakes, typhoons, droughts, as well as power outages and other industrial incidents, which could severely disrupt the normal operation of our business and adversely affect our results of operations. |
Risks Relating to the SPIL Acquisition
· | There may be risks associated with the impacts of the SPIL Acquisition on our subgroups and our holding company structure. |
Risks Relating to Ownership of Our Common Shares and the ADSs
· | The market for our Common Shares and the ADSs may not be liquid. |
· | If a non-R.O.C. holder of ADSs withdraws and holds Common Shares, such holder of ADSs will be required to appoint a tax guarantor, local agent, and custodian in the R.O.C. and register with the TWSE or the Taipei Exchange in order to buy and sell securities on the TWSE. |
· | We may not continue to declare cash dividends in any particular amount. |
· | Holders of Common Shares and ADSs may experience dilution if we issue stock bonuses, share options, or restricted stocks to employees or sell additional equity or equity-linked securities. |
Below please find the detailed analysis of the principal risks we face.
Risks Relating to Our Business
Since we are dependent on the highly cyclical semiconductor and electronics industries and conditions in the markets for the end-use applications of our products, our revenues and net income may fluctuate significantly.
Our business is affected by market conditions in the highly cyclical semiconductor and electronics industries. Most of our customers operate in this industry, and variations in order levels from our customers and service fee rates may result in volatility in our revenues and net income. From time to time, the semiconductor and electronics industries experience significant, and sometimes prolonged, downturns. As our business is, and will continue to be, dependent on the requirements for independent packaging, testing and EMS, any future downturn in the industry would reduce demand for our services. If we cannot reduce our costs or adjust our product mix to sufficiently offset any decline in sales volumes, our profitability will suffer, and we may incur losses.
Market conditions in the semiconductor and electronics industries depend to a large degree on conditions in the markets for the end-use applications of various products, such as communications, computing, and consumer electronics products. Any deterioration of conditions in the markets for the end-use applications would reduce demand for our services and would likely have a material adverse effect on our financial condition and results of operations. In 2022, approximately 52.5%, 15.8% and 31.7% of our operating revenues from packaging and testing of semiconductors were attributed to communications, computing and consumer electronics/industrial/automotive/other applications, respectively. In the same year, approximately 37.3%, 10.2%, 32.0%, 12.8% and 7.7% of our operating revenues from EMS were attributed to communications, computing, consumer electronics applications, industrial, and automotive applications and other, respectively. Across end-use applications, our customers face intense competition and significant shifts in demand, which could put pricing pressure on our services and may adversely affect our revenues and net income.
7
A reversal or slowdown in the outsourcing trend for semiconductor packaging and testing services and EMS could adversely affect our growth prospects and profitability.
Semiconductor manufacturers that have their own in-house packaging and testing capabilities, known as integrated device manufacturers and original equipment manufacturers, have increasingly outsourced stages of the production process, including packaging, testing, electronic manufacturing, and assembly, to independent companies to reduce costs, eliminate product complexity, and meet fast-to-market requirements. In addition, the availability of advanced independent semiconductor manufacturing services has also enabled the growth of so-called “fabless” semiconductor companies that focus exclusively on design and marketing and outsource their manufacturing, packaging, and testing requirements to independent companies. We cannot ensure that these manufacturers and companies will continue to outsource their packaging, testing, and manufacturing requirements to third parties like us. Furthermore, during an economic downturn, these integrated device manufacturers typically rely more on their own in-house packaging and testing capabilities, therefore decreasing their need to outsource. A reversal of, or a slowdown in, this outsourcing trend could result in reduced demand for our services and adversely affect our growth prospects and profitability.
Any global economic downturn could adversely affect the demand for our products and services, and a protracted global economic crisis would have a material adverse effect on us.
Higher inflation, especially in the U.S. and major European economies, has triggered a tightening of global financial conditions. P.R.C.’s economy slowed down as a result of the stringent COVID-19 lockdown policy, and there have been further negative impacts from the Russia-Ukraine conflict. As a result, global economic growth has slowed and faces more uncertainty. Our revenue and net income are impacted to a significant extent by economic conditions in Asia and globally, as well as economic conditions specific to our business. The global economy, markets and levels of spending by businesses and consumers are influenced by many factors beyond our control, including pandemics and other natural disasters.
In addition, there have been concerns about the relationships among the P.R.C. and other Asian countries, the relationship between the P.R.C. and the U.S., as well as the relationship between the U.S. and certain other Asian countries such as North Korea, which may result in or intensify potential conflicts in relation to territorial, regional security and trade disputes. The Russia-Ukraine conflict has resulted in significant disruptions to supply chains, logistics and business activities in the region. The conflict has also caused, and continues to intensify, significant geopolitical tensions in Europe and across the globe. The resulting sanctions imposed are expected to have significant impacts on the economic conditions of the countries and markets targeted by such sanctions, and may have unforeseen, unpredictable secondary effects on global energy prices, supply chains, and other aspects of the global economy.
As of the date of this annual report, our business, results of operations, and financial condition have not been materially affected by the global trade tensions, military conflicts, or pandemics. Nevertheless, any economic downturn or crisis may cause our customers to cancel or reduce planned expenditures for our products and services. Any uncertainty or significant volatility in global economic conditions, including inflation, interest rates, the continuing global supply chain crisis, and economic sanctions and restrictive measures in response to the Russia-Ukraine conflict, may negatively affect our business, results of operations, and financial condition.
If we are unable to compete favorably in the highly competitive markets of semiconductor packaging and testing and EMS, our revenues and net income may decrease.
The markets of semiconductor packaging and testing and EMS are very competitive. We face competition from many sources, including other independent semiconductor packaging and testing companies, integrated device manufacturers, and other EMS providers with large-scale manufacturing capabilities who can quickly react to market changes. In addition, some foundry players have actively invested and expanded their advanced packaging capacity and gained some customer bases with their services and solutions.
We believe that the principal competitive factors in our industry are:
· | technological expertise; |
· | ability to provide total solutions to our customers, including integrated design, manufacturing, packaging and testing and EMS; |
8
· | ability to offer interconnect technologies at an optimal scale for our businesses; |
· | range of package types and testing platforms available; |
· | ability to work closely with our customers at the product development stage; |
· | responsiveness and flexibility; |
· | fast-to-market product development; |
· | capacity; |
· | diversity in facility locations; |
· | production yield; and |
· | prices. |
We face increasing competition, as most of our customers obtain services from more than one source. Rapid technological advancements and aggressive pricing strategies by our competitors may continue to increase the level of competition. Our ability to successfully compete depends on factors both within and outside of our control and may be constrained by the distinct characteristics and production requirements of individual products. We cannot ensure that we will be able to continue to improve production efficiency and maintain reasonable profit for all our products.
In addition, some of our competitors may have superior financial, marketing, manufacturing, research and development and technological resources than we do. For example, the central government of the P.R.C., as well as provincial and municipal governments, have provided various incentives to domestic companies in the semiconductor industry, including major semiconductor testing and packaging providers, such as Jiangsu Changjiang Electronics Technology Co., Ltd. Similarly, our customers may face competition from their competitors in the P.R.C., and such competitors may also receive significant subsidies from the P.R.C. government. As we are upstream providers, the impact of such government policies on competition and price pressure of our customers may negatively impact our business. Increasing competition may lead to declines in product prices and profitability and could have a material adverse effect on our business, financial condition, results of operations, and future prospects.
Our profitability depends on our ability to respond to rapid technological changes in the semiconductor industry.
The semiconductor industry is characterized by rapid increases in the diversity and complexity of semiconductors. As a result, we expect that we will need to continually offer more sophisticated packaging and testing technologies and processes in order to respond to competitive industry conditions and customer requirements. We have successfully combined our packaging, testing, and materials technologies with the expertise of EMS at the systems level to develop our SiP business. Still, there is no assurance that we will be successful in achieving the features and benefits we expect.
We continue to develop new products in anticipation of future demand. However, there is no assurance that the launch of any new product will be successful or that we will be able to produce enough of these products to meet market demand. If we fail to develop, or obtain access to, advances in packaging or testing technologies or processes, we may become less competitive and less profitable. In addition, advances in technology typically lead to declining average selling prices for semiconductors packaged or tested with older technologies or processes. As a result, if we cannot reduce the costs associated with our services, the profitability of a given service and our overall profitability may decrease over time.
9
Our operating results are subject to significant fluctuations, which could adversely affect the market value of our Common Shares and the ADSs.
Our operating results have varied significantly from period to period and may continue to vary in the future. Downward fluctuations in our operating results may result in decreases in the market price of our Common Shares and the ADSs. Among the more important factors affecting our quarterly and annual operating results are the following:
· | changes in general economic and business conditions, particularly the cyclical nature of the semiconductor and electronics industries and the markets served by our customers; |
· | our ability to quickly adjust to unanticipated declines or shortfalls in demand and market prices; |
· | changes in prices for our products or services; |
· | volume of orders relative to our packaging, testing and manufacturing capacity; |
· | changes in costs and availability of raw materials, equipment and labor; |
· | our ability to obtain or develop substitute raw materials with lower cost; |
· | our ability to successfully develop or market new products or services; |
· | our ability to successfully manage product mix in response to changes in market demand and differences in margin associated with different products; |
· | timing of capital expenditures in anticipation of future orders; |
· | our ability to acquire, or design and produce, cost-competitive interconnect materials, and provide integrated solutions for EMS; |
· | fluctuations in the exchange rate; |
· | fluctuations in interest rates, including the volatility of LIBOR and potential changes of the use of LIBOR as a benchmark for our variable rate borrowings; and |
· | typhoons, earthquakes, droughts, epidemics, tsunamis and other natural disasters, as well as industrial and other incidents such as fires and power outages. |
Due to the factors listed above, our future operating results or growth rates may be below the expectations of research analysts and investors. If so, the market price of our Common Shares and the ADSs, and thus the market value of your investment, may fall.
Due to our high percentage of fixed costs, we may be unable to maintain our gross margin at past levels if we are unable to achieve relatively high capacity utilization rates.
Our operations, in particular our testing operations, are characterized by relatively high fixed costs. We expect to continue to incur substantial depreciation and other expenses in connection with our acquisitions of equipment and facilities. Our profitability depends not only on the pricing levels for our services or products, but also on utilization rates for our machinery and equipment, commonly referred to as “capacity utilization rates.” Increases or decreases in our capacity utilization rates can significantly affect gross margins since the unit cost generally decreases as fixed costs are allocated over a larger number of units. In periods of low demand, we experience relatively low capacity utilization rates in our operations, which lead to reduced margins. We cannot ensure that we will be able to maintain or surpass our past gross margin levels if we cannot consistently achieve or maintain relatively high capacity utilization rates.
We may not be successful in pursuing mergers and acquisitions. Any mergers or acquisitions we make may lead to a diversion of management resources.
Our future success may depend on acquiring businesses and technologies, making investments, or forming joint ventures that complement, enhance, or expand our current product offerings or otherwise offer growth opportunities. In pursuing such acquisitions, we may face competition from other companies in the semiconductor industry. Our ability to acquire or invest in suitable targets may be limited by applicable laws and regulations in the R.O.C., P.R.C., U.S., European countries, and other jurisdictions where we do business. Even if we are successful in making such acquisitions or investments, we may have to expend substantial amounts of cash, incur debt, assume loss-making divisions, and incur other types of expenses. We may also face challenges in successfully integrating any acquired companies into our existing organization or in creating the anticipated synergistic benefits. Each of these risks could have a material adverse effect on our business, financial condition, and results of operations.
10
The loss of a large customer or disruption of our strategic alliance or other commercial arrangements with semiconductor foundries and providers of other complementary semiconductor manufacturing services may result in a decline in our revenues and profitability.
Although we have a large customer base, we have derived, and expect to continue to derive, a large portion of our revenues from a small group of customers during any particular period due in part to the concentration of market share in the semiconductor and electronics industries. Our five largest customers together accounted for approximately 54.5%, 49.6% and 50.2% of our operating revenues in 2020, 2021 and 2022, respectively. One customer accounted for more than 10.0% of our operating revenues in 2020, 2021 and 2022. The demand for our services from a customer is directly dependent upon that customer’s level of business activity, which could vary significantly from year to year. Our key customers typically operate in the cyclical semiconductor and electronic business and order levels have significantly varied from period to period in the past and may vary in the future. Some of these companies are relatively small, have limited operating histories and financial resources, and are highly exposed to the cyclicality of the industry. We cannot ensure that these customers or any other customers will continue to place orders with us in the future at the same levels as in past periods. The loss of one or more of our significant customers, or reduced orders by any one of them, and our inability to replace these customers or make up for such orders, could adversely affect our revenues and profitability. In addition, we have in the past reduced, and may in the future be requested to reduce, our prices to limit the level of order cancellations. Any price reduction would likely reduce our margins and profitability.
Since 1997, we have maintained a strategic alliance with Taiwan Semiconductor Manufacturing Company Limited, or TSMC, one of the largest dedicated semiconductor foundries in the world. TSMC designates us as its non-exclusive preferred provider of packaging and testing services for semiconductors manufactured by TSMC. Such strategic alliances, as well as our other commercial arrangements with providers of other complementary semiconductor manufacturing services, enable us to offer total semiconductor manufacturing solutions to our customers. These strategic alliances and other commercial arrangements may not achieve their anticipated commercial benefits and may be terminated at any time. Any failure in successfully maintaining such alliances, any termination of such alliances or our failure to enter substantially similar strategic alliances or commercial arrangements may adversely affect our competitiveness, revenues, and profitability.
We rely on a limited number of key customers in certain products for our revenues, and our results of operations may be adversely affected by a reduction of our key customers’ business.
Our results of operations also depend on the performance and business of our key customers. Accordingly, risks that could seriously harm our key customers could harm us as well, including:
· | loss of market share for our key customers’ products; |
· | recession in our key customers’ markets; |
· | failure of their products to gain widespread commercial acceptance; and |
· | our key customers’ inability to manage their operations efficiently and effectively. |
The launch and market acceptance of our individual key customers’ products could significantly impact our product and customer mix, resulting in significant volatility in the demand for the solutions we offer and our results of operations. It is also possible that a key customer’s market share with respect to its product may decline as its competitors introduce new products, which could adversely affect our results of operations, particularly if we are unable to sell our solutions to such competitors. Furthermore, sales of our key customers’ products are subject to seasonal fluctuation.
11
Our revenues and profitability may decline if we are unable to obtain adequate supplies of raw materials in a timely manner and at a reasonable price.
Our operations, such as packaging operations, substrate operations, and EMS require that we obtain adequate supplies of raw materials on a timely basis. Shortages in the supply of raw materials have in the past resulted in occasional price increases and delivery delays. In addition, the operations of some of our suppliers are vulnerable to natural disasters, such as earthquakes and typhoons, the occurrences of which may deteriorate and prolong the shortage or increase the uncertainty of the supply of raw materials. For example, after the Fukushima nuclear disaster in 2011, we experienced a disruption to the supply of raw materials from Japan for about three to four weeks due to the fear of radiation contamination and the reduction or postponement in production by some of our Japanese suppliers. Although the purchase of supplies from Japan has been restored to the previous level, we cannot ensure that we will not suffer long term impacts from future earthquakes and tsunamis.
Raw materials such as IC substrates are prone to supply shortages since such materials are produced by a limited number of suppliers, such as Kinsus Interconnect Technology Corporation, Nan Ya Printed Circuit Board Corporation, LG Innotek Co., Ltd., Samsung Electro-Mechanics Co. Ltd., and Unimicron Technology Corporation. The growing demand for high-performance computing driven by artificial intelligence (AI), and the supporting infrastructure such as servers, data centers, and networking equipment has resulted in increased demand for semiconductor chips. However, this demand has also led to greater complexity in chip and substrate design. Specifically, the Ajinomoto Build-up Film (ABF) substrate, a crucial component for manufacturing high-performance chips, may face a higher risk of supply shortages or extended lead times due to potential strong demand for AI, elevated manufacturing difficulty, and heavy capital requirements for capacity expansion.
Operations conducted through our wholly-owned subsidiaries, ASE Electronics and ASE Shanghai, have improved our ability to obtain IC substrates on a timely basis and at a reasonable cost. In 2022, our interconnect materials operations supplied approximately 8.5% of our consolidated substrate requirements by value. We do not expect that these internal interconnect materials operations will be able to meet all our interconnect materials requirements for the foreseeable future. Consequently, we will remain dependent on market supply and demand for our substrates.
In addition, recent fluctuations in prices of precious metals, such as gold, have affected the price at which we have been able to purchase the principal raw materials we use in our packaging processes. We cannot guarantee that we will not experience shortages in the future or that we will be able to obtain adequate supplies of raw materials in a timely manner or at a reasonable price. Our revenues and net income could also decline under these circumstances, or if there are significant increases in the costs of raw materials that we cannot pass on to our customers.
If we are unable to manage our expansion or investments effectively, our growth prospects may be limited, and our future profitability and core business operations may be adversely affected.
We have significantly expanded our operations through acquisitions and joint ventures in recent years. We anticipate that further expansion will be required as we adapt to the changing needs of customers. For our expansions and investments, see “Item 4. Information on the Company—Business Overview—Strategy—Strategically Expand and Streamline Production Capacity.”
Expansion in general increases the complexity of operations and places significant strains on our management, operational, and financial resources. We also face uncertainties in creating strategic and operational synergies as we combine existing operations with the new sites. Furthermore, we may have limited experience in operating business in certain new countries or regions. As a result of our expansion, we may incur additional costs and expenses, such as hiring and training additional employees, devoting more of management’s attention to operations and compliance, and allocating additional resources in dealing with potential disputes relating to its operations. The expected growth and expansion of our business will place significant demands on our management and operations teams and require significant additional resources to meet our needs, which may not be available at a reasonable price. If we cannot effectively manage our expansion or investments, we may not be able to execute our business plan, respond to competitive pressures, take advantage of market opportunities, satisfy customer requirements, or maintain high-quality product offerings, any of which could lead to inefficiencies, redundancies, and result in reduced growth prospects and profitability. We cannot ensure that we will be able to deploy and manage new business initiatives successfully or effectively.
12
In addition, we have made several investments in the real estate development businesses in the P.R.C. The P.R.C. property market is volatile and may experience undersupply or oversupply, as well as property price fluctuations. Central and local governments frequently adjust monetary and other fiscal policies to prevent or curtail the overheating of the economy. Such policies may lead to changes in market conditions, including price instability, and imbalance of supply and demand in respect to office, residential, retail, entertainment, cultural, and intellectual properties. Our exposure to risks related to real estate development may also increase over time as a result of our expansion into such a business. We may continue to make investments in this area in the future and our diversification in this industry may put pressure on our managerial, financial, operational, and other resources. There can be no assurance that our investments in such a business will yield the anticipated returns and that our expansion into such a business, including the resulting diversion of management’s attention, will not adversely affect our core business operations.
If we are unable to obtain sufficient funding in a timely manner or on acceptable terms, our results of operations and financial conditions may be materially and adversely affected.
Our businesses regularly require significant capital investments in order to support the expansion of our facilities both domestically and globally. If we are required to rapidly increase our current geographical footprint to fulfill our customers’ needs, our capital requirements may increase suddenly and significantly. In addition to capacity expansion, we will also need increasing levels of resources to fund our research and development activities in order to remain competitive, and to support operations outside of its existing footprint. We believe that our existing cash, marketable securities, expected cash flow from operations, and existing credit lines under our loan facilities will be sufficient to meet our capital expenditures, working capital, and cash obligations under our existing debt and lease arrangements, and other requirements for at least the next 12 months.
Our ability to obtain external financing in the future is subject to a variety of uncertainties, including:
· | our future financial condition, results of operations, and cash flows; |
· | general market conditions for financing activities by semiconductor or electronics companies; and |
· | economic, political, and other conditions in Taiwan and elsewhere. |
If we are unable to obtain new or additional land or land use rights, additional equipment, or facilities in a timely manner and at a reasonable cost, our competitiveness and future profitability may be adversely affected.
In order to meet customer demand, we need to expand existing facilities or obtain suitable land for construction of new facilities. Both expansion and construction projects are currently underway or being contemplated. Such expansion or construction requires us to obtain land use or development rights. If we are unable to obtain new or additional land or use rights in a timely manner, we could experience significant fulfillment delays in our customers’ orders, resulting in negative impacts on our results of operations. In addition, semiconductor businesses are capital intensive and require significant investment in expensive equipment manufactured by a limited number of suppliers. The market for semiconductor equipment is characterized by intense demand, limited supply, and long delivery cycles. Our operations and expansion plans depend on our ability to obtain a significant amount of such equipment from a limited number of suppliers. From time to time, we have also leased equipment. We have no binding supply agreements with any of our suppliers and acquire our equipment on a purchase order basis, which exposes us to changing market conditions and other substantial risks. For example, shortages of capital equipment could result in an increase in the price of equipment and longer delivery times. Semiconductor products and services also require sizeable facilities. If we are unable to obtain equipment or facilities in a timely manner, we may be unable to fulfill our customers’ orders, which could adversely affect our growth prospects as well as financial condition and results of operations. See “Item 4. Information on the Company—Business Overview—Equipment.”
Our global manufacturing and sales activities subject us to risks associated with legal, political, economic, or other conditions which could negatively affect our business, financial status, and the market value of our Common Shares and ADSs.
Our principal executive office and production facilities are in the R.O.C, and generate the majority of our net revenues In addition, we have operations worldwide and a significant percentage of our revenue comes from sales to overseas locations. Changes in policies and laws, including environmental regulations, as well as general political and economic conditions, security risks, health conditions, and possible disruptions in transportation networks in the various countries in which we operate, could adversely affect our business, and negatively impact our results of operations as well as the market price and liquidity of our Common Shares and ADSs.
13
Any global political, economic, or financial crisis, as well as trade barriers, could adversely affect our business, financial condition, and results of operations.
Political changes in the U.S. have created uncertainty regarding future U.S. trade policies. Recently, the U.S. government has called for changes to its domestic and foreign policy, including policies toward the P.R.C. and Russia. Specifically, U.S.-P.R.C. trade relations remain uncertain as the U.S. continues to add more P.R.C. companies to the entity list and implements more regulations aimed at advanced computing, semiconductor manufacturing, and AI. Further, the U.S. and other countries have imposed sanctions and revised export control and other regulations against Russia in response to the military aggression against Ukraine. If the U.S. expands licensing requirements and regulatory controls in the future, or if tariffs on foreign-sourced goods imported into the U.S. continue to rise, our U.S. customers may seek new suppliers in the U.S. or other countries, which could adversely affect our business, financial condition and results of operations. Also, in response to U.S. trade restrictions, the P.R.C. government has doubled down on cash incentives and policy support for domestic semiconductor companies, as part of the drive to achieve greater self-sufficiency in semiconductor production amid heightened rivalry with the U.S., reducing reliance on foreign suppliers and adds to the uncertainty of our business related to the P.R.C. supply chain.
Furthermore, the increasing economic uncertainty and the related investment risk in the P.R.C. in association with trade tensions has accelerated the relocation of many production facilities from the P.R.C. We build flexible and resilient supply chains to address shifts in market conditions and to satisfy customer needs, broadening our markets through expansion of operations, joint ventures, acquisitions, and other strategic investments. While we strive to continue providing customers with a cost-competitive manufacturing location and attract them with supply chain diversification, any future political turmoil could cause revenue or profits for the semiconductor industry as a whole to decline dramatically. If economic or financial conditions for our customers were to deteriorate, the demand for our products and services may decline, which could adversely affect our business, financial condition, and results of operations.
We do business within the P.R.C. This may expose us to additional political, regulatory, economic, and foreign investment risks.
We have packaging and testing, EMS, and real estate subsidiaries in the P.R.C. that require approval and compliance with regulatory requirements. However, P.R.C. laws and regulations are often subject to varying interpretations, means of enforcement, and additional approvals from the relevant governmental authorities, which may be delayed or denied. The P.R.C. government holds significant discretion in matters relating to foreign investment, which may adversely affect our operations.
In addition, our controlling stake of USI Shanghai, an entity currently listed on the Shanghai Stock Exchange under the symbol “601231,” makes us vulnerable to extreme price and volume fluctuations in the P.R.C. stock market that may indirectly affect the market price of our Common Shares and ADSs.
The escalation of tensions between South Korea and North Korea could have an adverse effect on our operations in South Korea and the market value of our shares.
The political relationship between South Korea and North Korea has been tense throughout Korea’s modern history. The level of tension between the two countries has heightened and may increase abruptly as a result of current or future events. In recent years, there have been increasing security concerns stemming from North Korea’s nuclear weapons and ballistic missile testing, and uncertainty regarding North Korea’s actions and potential responses from the international community. Although we do not derive any revenue from, nor sell any products in, North Korea, any further increase in tension between North Korea and South Korea. For example, if North Korea experiences a leadership crisis, high-level contacts between South Korea and North Korea break down or military conflicts occur, could have a material adverse effect on our South Korea subsidiary, our business, financial condition, results of operations, and the market value of our common stock.
14
We depend on select personnel and could be negatively affected by the loss of their services.
We depend on the continued service of our executive officers and skilled technical personnel. Our business could suffer if we lose the services of any of these personnel and cannot adequately replace them. Although some of these management personnel have entered into employment agreements with us, they may nevertheless leave before the expiration of these agreements. We are not insured against the loss of the services of any of our personnel. In addition, the resulting disruption may shift these and other employees’ attention from our business operations.
We may be required to increase substantially the number of employees as a result of our expansion plans, and there is intense recruiting and hiring competition in this industry. We may not be able to retain our present personnel or attract additional necessary qualified personnel. In addition, we may need to increase employee compensation levels in order to retain our existing officers and employees and attract the additional personnel that we expect to require. Recently, some companies have accelerated efforts to maliciously poach talented Taiwan semiconductor experts by offering high-level positions with substantial salaries. If the number of malicious acts involving technology theft increase, Taiwan’s semiconductor industry would be seriously affected and our business would be adversely jeopardized.
Furthermore, a portion of the workforce at our facilities in Taiwan is foreign workers employed under work permits, which are subject to government regulations on renewal and other terms. Consequently, our business could suffer if Taiwan’s regulations relating to the employment of foreign workers were to become significantly more restrictive or if we are otherwise unable to attract or retain these workers at a reasonable cost.
The ongoing legal proceeding involving Dr. Tien Wu may have an adverse impact on our business and cause our Common Shares and ADS price to decline.
Dr. Tien Wu, our director and chief operating officer, was involved in a criminal proceeding brought by the Taiwan Kaohsiung District Prosecutors Office. The indictment alleged that Dr. Tien Wu violated Article 157-1 of the R.O.C. Securities and Exchange Act for insider trading activities involving SPIL’s common shares conducted during the Initial SPIL Tender Offer, the Second SPIL Tender Offer, and negotiations of the memorandum of understanding in connection with the SPIL Acquisition. Dr. Tien Wu was accused of informing a friend about the aforementioned tender offers and negotiation ahead of the public announcements. After an investigation spanning over two years, the Taiwan Kaohsiung District Court, on February 5, 2020, found Dr. Tien Wu NOT guilty. On March 20, 2020, the Taiwan Kaohsiung District Prosecutors Office filed an appeal against the February 5, 2020 judgment, and the appeal was rejected by the Taiwan High Court Kaohsiung Branch Court on June 9, 2021 (the “June 9 judgment”). On July 2, 2021, the Kaohsiung Branch, Taiwan High Prosecutors Office filed another appeal against the June 9 judgment. The Supreme Court of the R.O.C. reversed the June 9 judgment and remanded this case to the Taiwan High Court Kaohsiung Branch Court on January 6, 2022. This matter is now being tried by the Taiwan High Court Kaohsiung Branch Court. We have strengthened internal control measures after this incident, and no other directors are expected to become a party to any current or future litigation in connection with Dr. Tien Wu.
On October 26, 2018, the R.O.C. Securities and Futures Investors Protection Center (the “SFIPC”) filed a civil lawsuit against Dr. Tien Wu and ASEH, requesting the court to remove Dr. Tien Wu from ASEH’s board of directors based on Article 10-1 of the R.O.C. Securities Investor and Futures Trader Protection Act (the “Director Removal Case”). On August 25, 2020, the Taiwan Ciaotou District Court ruled in favor of Dr. Tien Wu. SFIPC filed an appeal against the August 25, 2020 judgment and the appeal was rejected by the Taiwan High Court Kaohsiung Branch Court on September 29, 2021 (the “September 29 judgment”). On October 20, 2021, SFIPC filed another appeal against the September 29 judgment. The Supreme Court of the R.O.C. reversed the September 29 judgment and remanded this case to the Taiwan High Court Kaohsiung Branch Court on May 25, 2022. This matter is now being tried by the Taiwan High Court Kaohsiung Branch Court. In addition to the Director Removal Case, on July 8, 2021, SFIPC filed an additional class action to request Dr. Tien Wu and other three defendants of the aforementioned criminal proceeding of insider trading to be jointly liable for the damages caused by the alleged insider trading activities. The Intellectual Property and Commercial Court of the R.O.C. ruled in favor of SFIPC and portion of the damages was awarded on August 18, 2022, and all defendants of this class action filed appeals against the August 18 judgment. This matter is now being tried by the Supreme Court of the R.O.C. The proceedings in connection with this incident, or potential regulatory scrutiny, might attract further media attention. Any negative publicity in connection with the legal proceedings may adversely affect our brand and reputation, which might result in a material adverse impact on our business operations and prospects.
15
As we depend on the continuing service of our directors and executive officers, and we are not insured against the loss of service of any of our personnel, our business operations could suffer from the loss of services of any director or executive officer, including Dr. Tien Wu. There are no assurances that we will be able to find suitable replacement directors or executive officers.
Our insurance coverage may be inadequate to cover all our business risks.
Although we seek to obtain insurance for some of our primary operational risks, the amount of our insurance coverage may not be adequate to cover all potential claims or liabilities, and we may be forced to bear substantial costs resulting from the risks and uncertainties of our business. There is also no guarantee that we will be able to obtain insurance coverage when desired or that insurance will be available on commercially attractive terms. Any failure to obtain adequate insurance coverage on terms favorable to us, or at all, could have a material adverse effect on our business, financial condition, and results of operations.
Volatility of LIBOR and potential changes of the use of LIBOR as a benchmark could affect our profitability, earnings, and cash flow.
The continued availability of the London Inter-bank Offering Rate (the “LIBOR”) is not guaranteed after 2022 and by June 2023, LIBOR is scheduled to be eliminated entirely. LIBOR is the subject of recent national, international, and other regulatory guidance and proposals for reform. The publication of U.S. Dollar LIBOR for the one-week and two-month U.S. Dollar LIBOR tenors ceased on December 31, 2021, and the ICE Benchmark Administration (the “IBA”), the administrator of LIBOR, with the support of the United States Federal Reserve and the United Kingdom’s Financial Conduct Authority, announced the publication of all other U.S. Dollar LIBOR tenors will cease on June 30, 2023. The United States Federal Reserve concurrently issued a statement advising banks to cease issuing U.S. Dollar LIBOR instruments after 2021. As such, any new loan agreements we enter will not use LIBOR as an interest rate.
We cannot predict whether or to what extent banks will continue to provide LIBOR submissions to the administrator of LIBOR or whether any additional reforms to LIBOR may be enacted. At this time, no consensus exists as to what rate or rates may become acceptable alternatives to LIBOR with the exception of overnight repurchase agreements, which are expected to be based on the Secured Overnight Financing Rate (the “SOFR”). Uncertainty about the nature of alternative reference rates and potential changes or other reforms to LIBOR may adversely affect LIBOR rates and the value of LIBOR-based loans. Discontinuation of LIBOR and uncertainty about the nature of potential changes, alternative reference rates, or other reforms may impact the amounts of interest we pay under our debt arrangements. We cannot predict what impact this transition will have on our operations.
Inflation could adversely affect our business, financial condition, results of operations, and cash flows.
We are exposed to economic and political conditions in the countries and regions where we operate. We are also affected by governmental policies regarding spending and investment, exchange controls, regulatory and taxation changes, and other adverse political, economic, or social developments in the countries and regions in which we operate. Like all companies with extensive operations, we are exposed to risks from fluctuations in inflation.
High inflation rates may adversely affect our business by increasing the cost of the raw materials, energy, labor, and transportation. Current or future efforts by various governments to stimulate their economies may increase the risk of inflation. In the event of an increase in inflation, we may need to increase the sales prices of our services in order to maintain satisfactory profits; however, such increases may not be accepted by our customers, and may not sufficiently compensate for the negative impacts of inflation. At a macro level, inflation might reduce households’ disposable income and reduce people’s savings, which may decrease discretionary spending and negatively impact the sales of our customers’ products and, correspondingly, their demand for our manufacturing services. If we are unable to fully offset the effects of increased inflation, we may have material adverse impacts on our business, financial condition, results of operations, and cash flows.
16
Fluctuations in exchange rates could adversely affect our business, results of operations, or financial condition.
Within our global operations, significant transactions and balances are denominated in currencies other than the NT dollar. A significant portion of our revenues are denominated in U.S. dollars, with the remaining portion denominated in NT dollars and Japanese yen. Our operating costs and operating expenses are also incurred in several currencies, primarily NT dollars, U.S. dollars, RMB, Japanese yen, Korean won, as well as, to a lesser extent, Singapore dollars and Malaysian ringgit, Polish zloty and EUR. In addition, a substantial portion of our capital expenditures, primarily for the purchase of equipment, has been, and is expected to continue to be, denominated in U.S. dollars, with the remainder in Japanese yen. As a result, fluctuations in exchange rates, primarily among the U.S. dollar and Japanese yen against the NT dollar, RMB and EUR, will affect our financial condition and results of operations. In addition, these fluctuations could result in exchange losses in NT dollar and other local currency terms, even if we have implemented hedging and mitigating techniques. We recorded net foreign exchange gains of NT$1,005.4 million in 2020, net foreign exchange gains of NT$1,395.1 million in 2021 and net foreign exchange losses of NT$2,459.5 million (US$80.0 million) in 2022. See “Item 11. Quantitative and Qualitative Disclosures about Market Risk— Market Risk—Foreign Currency Exchange Rate Risk.”
The financial performance of our equity method investments could adversely affect our results of operations.
As part of our business strategy, we have and may continue to pursue acquisitions of businesses and assets, strategic alliances, and investments in associates and joint ventures. We currently have equity investments in certain entities and the accounting treatment applied for these investments varies depending on several factors, including, but not limited to, our percentage of ownership, our percentage of membership of the investee’s board, and the level of influence we have over the relevant entity. Any losses experienced by these entities could adversely affect our results of operations and the value of our investment. In addition, if these entities were to fail and cease operations, we may lose the entire value of our investment and the stream of any shared profits.
There can be no assurance that we will be able to maintain or enhance the value or performance of our investee companies or that we will achieve the returns or benefits sought from such investments. If our interests differ from those of other investors in our investee companies, we may not be able to enjoy synergies with the investee and it may adversely affect our financial results or condition.
We recognized impairment charges of nil in both 2020 and 2021, and NT$61.2 million (US$2.0 million) in 2022 in our investments under the equity method.
Any impairment charges may have a material adverse effect on our income.
Under IFRS, we are required to evaluate our assets, such as property, plant and equipment, investment properties, intangible assets, including goodwill, and investments in financial instruments, for possible impairment at least annually or whenever there is an indication of impairment. If certain criteria are met, we are required to record an impairment charge.
With respect to assets, we recognized impairment charges of NT$992.3 million, NT$126.8 million and NT$388.8 million (US$12.7 million) in 2020, 2021 and 2022, respectively, primarily as a result of impairment charges related to property, plant and equipment, and other intangible assets as well as investments under the equity method.
We are unable to estimate the extent and timing of any impairment charges for future years and we cannot give any assurance that impairment charges will not be required in periods subsequent to December 31, 2022. Any impairment charge could have a material adverse effect on our net income. The determination of an impairment charge at any given time is based significantly on our expected results of operations over several years in the future. As a result, an impairment charge is more likely to occur during a period in which our operating results and outlook are otherwise already depressed.
Any failure to achieve and maintain effective internal controls could have a material adverse effect on our business and results of operations.
We are subject to reporting obligations under the U.S. securities laws. As required by Section 404 of the Sarbanes-Oxley Act of 2002, the SEC adopted rules requiring every public company to include a management report on the effectiveness of such company’s internal control over financial reporting in its annual report. In addition, an independent registered public accounting firm must report on such company’s internal control over financial reporting.
17
Any failure to maintain effective internal control over financial reporting could harm our business, erode investor confidence in our financial statements, and negatively impact the trading price of our Common Shares and ADSs. Furthermore, we may need to incur additional costs and use additional management and other resources in order to comply with Section 404 of the Sarbanes-Oxley Act and other requirements going forward. Please refer to “Item 15. Controls and Procedures” for details on our internal control over financial reporting.
Restrictive covenants and broad default provisions in our existing debt agreements may materially restrict our operations as well as adversely affect our liquidity, financial condition, and results of operations.
We are a party to numerous loans and other agreements relating to the incurrence of debt, which may include restrictive covenants and broad default provisions. Covenants in the agreements governing our existing debt, and debt we may incur in the future, may materially restrict our operations, including our ability to incur debt, pay dividends, and make certain investments and payments, other than in connection with restructurings of consolidated entities, and encumbering or disposing of assets. In addition, any global economic deterioration or ineffective expansion may cause us to incur significant net losses or force us to assume considerable liabilities. We cannot ensure that we will be able to remain in compliance with our financial covenants, which, as a result, may lead to a default. This may thereby restrict our ability to access unutilized credit facilities or the global capital markets to meet our liquidity needs. Furthermore, a default under any agreement by us or our subsidiaries may trigger cross-defaults under our other agreements. In the event of default, we may not be able to cure the default or obtain a waiver on a timely basis. An event of default under any agreement governing our existing or future debt, if not cured or waived, could have a material adverse effect on our liquidity, financial condition, and results of operations.
As of December 31, 2022, we were not in breach of any of the financial covenants under our existing loan agreements, although we cannot provide any assurance that we will not breach any of such financial covenants in the future.
We could potentially face tax uncertainties arising from our decisions, activities, and operations or any changes in tax laws in jurisdictions in which we operate, which may adversely affect our operations.
There are many activities in our daily operations that may give rise to tax issues, ranging from procurement, research and development activities, manufacturing to product storage and distribution, among others. Additional tax liabilities such as double taxation, inapplicability of tax incentives, tax adjustment, and related interest and penalties may arise if tax issues are not dealt with appropriately. The development and evolution of tax laws and regulations present considerable variations in interpretation and enforcement, which could result in more stringent compliance measures and tax audits in the jurisdictions in which we operate. Failure to comply with any change in tax laws could result in unfavorable tax consequences to us and have an adverse impact on our business, financial condition, and results of operations.
We have business operations in multiple countries and our worldwide operations are taxed under the laws of the jurisdictions in which we operate. However, the integrated nature of our worldwide operations can produce conflicting claims from revenue authorities in different countries as to the profits to be taxed in the individual countries, which could increase our effective tax rate and adversely affect our reputation and operations. Furthermore, our tax expense and effective tax rate could be adversely affected by several other factors, including changes in tax laws and their interpretation and the continuing Organization for Economic Co-operation and Development’s (OECD) international tax reform work, mainly for Base Erosion and Profit Shifting (BEPS) Action Plan, as well as the impact of acquisitions, disposals, and any restructuring of our businesses.
We may be subject to intellectual property rights disputes, which could adversely affect our business.
Our ability to compete successfully and achieve future growth depends in part on developing and safeguarding our proprietary technologies while securing commercially acceptable terms for non-owned technologies. Our failure to do so may seriously harm our competitive position.
18
Our ability to compete successfully also depends in part on operating without infringing others’ proprietary rights. In particular, the semiconductor and electronics industries are characterized by frequent litigation regarding patent and other intellectual property rights. We have received communication alleging infringement of others’ technologies and may receive more in the future. Infringement claims could result in acquiring licenses, discontinuing certain technologies, paying damages, or unfeasibly seeking to develop alternative technologies, which could result in financial consequences. For example, in connection to the 2016 patent dispute between Broadcom and Tessera, we recognized a settlement amount of US$5.0 million in our consolidated financial statements for the year ended December 31, 2019, which fully settled in February 2020 between SPIL and Broadcom. See “Item 8. Financial Information—Consolidated Statements and Other Financial Information—Legal Proceedings” for more information about the Broadcom Patent Dispute.
Any litigation, whether as plaintiff or defendant and regardless of the outcome, is costly and diverts company resources. Any of the foregoing could harm our competitive position and render us unable to fully provide our services operations.
Regulations related to conflict minerals could adversely affect our business, financial condition and results of operations.
In August 2012, the SEC adopted annual disclosure and reporting requirements, as mandated by the Dodd-Frank Wall Street Reform and Consumer Protection Act, for companies that use conflict minerals in their products. These rules require companies that manufacture or contract to manufacture products for which conflict minerals are necessary for functionality or production to begin scrutinizing the origin of conflict minerals in their products. We filed a specialized disclosure report on Form SD in accordance with the requirements and we have retained an independent auditing firm to conduct audits on our due diligence framework to provide a private sector report for our specialized disclosure report on Form SD. There will be costs associated with complying with these disclosure requirements, including costs for diligence to determine the sources of conflict minerals used in our products and other potential changes to products, processes, or sources of supply as a consequence of the results of such verification activities. The implementation of these rules could adversely affect the sourcing, supply, and pricing of materials used in our products.
As there may be only a limited number of suppliers offering “conflict free” minerals, we cannot be sure that we will be able to obtain necessary “conflict free” minerals from such suppliers in sufficient quantities or at competitive prices. Also, we may face adverse effects to our reputation if we determine that certain of our products contain minerals not determined to be conflict free or if we are unable to sufficiently verify the origins for all conflict minerals used in our products.
Any environmental claims or failure to comply with any present or future environmental regulations, as well as any fire or other industrial accident, may require us to spend additional funds and may materially and adversely affect our financial condition and results of operations.
We are subject to various laws and regulations relating to the use, storage, discharge, and disposal of chemical by-products of, and water used in, our packaging and interconnect materials production processes, and the emission of volatile organic compounds and the discharge and disposal of solid industrial wastes. In recent years, we have been subject to environmental administrative actions and judicial proceedings related to certain wastewater discharge incidents that occurred at our facilities. As a result of these proceedings, we have been subject to monetary fines as well as sanctions, including orders to suspend or limit our operations and criminal charges against us. For further details, see “Item 4. Information on the Company—Business Overview—Environmental Matters,” and “Item 8. Financial Information—Consolidated Statements and Other Financial Information—Legal Proceedings.”
Climate change, water shortages, and other environmental concerns could negatively affect our business and financial planning.
Anthropogenic greenhouse gas emissions could adversely and irreversibly affect the global economy if substantial remediation is not taken. Even a modest change in average global temperatures could result in increased coastal flooding, altered precipitation patterns, and increased risk of biodiversity loss for vulnerable species. Climate change can also cause extreme weather conditions, such as heat, droughts, and floods, that can impact business operations and financial performance. For example, our business operations depend on adequate supplies of water, so an extended drought may affect our ability to obtain sufficient amounts of water and threaten our production capability.
19
We believe that we should play our part in the mitigation of man-made climate change. For example, we have incorporated green design standards and building concepts into the construction of our facilities. Since 2012, we have transformed existing facilities and built new facilities and offices that comply with international low carbon building standards. Through quantifying and analyzing the entire life cycle of building carbon emissions, carbon reduction was driven from the design stage and promoted along the value chain to build sustainable factories.
Public expectations for reductions in greenhouse gas emissions could result in increased energy, transportation, and raw material costs. Changes in scientific findings, political attention, and regulations related to the existence and extent of man-made climate change may also result in increased production costs due to higher energy prices or the introduction of energy or carbon taxes. Regulations and further legislation aimed at reducing greenhouse gas emissions may require companies to purchase emission credits at higher cost, new equipment, or raw materials with lower carbon footprints, which could negatively affect our operations and financial performance. Additionally, changes in environmental regulations, such as those regarding the use of perfluorinated compounds (commonly known as the “PFCs”), could increase our production costs, which may adversely affect our results of operation and financial results.
Stable water supply of sufficient amounts of good-quality freshwater plays a critical role for ASEH. Taiwan is also susceptible to typhoons and droughts, which may cause damage and business interruptions to facilities. Since our business operations depend on adequate supplies of water, an extended drought may affect our ability to obtain sufficient water and threaten our production capability. Although we have not yet been directly affected by droughts, we are dependent upon water for our packaging and substrate operations and a drought could interrupt such operations. To address related risks, we have established a sustainable water recycling system and implemented water management strategies to prevent water shortages. We operate one of the industry’s largest water recycling facilities in Taiwan, allowing us to reuse each drop of water more than three times and avoid disruptions caused by water shortages. Our twenty-two main facilities are also using scientific data from the World Resources Institute to conduct climate risk assessments and develop robust water risk management strategies. These actions will enable the company to respond effectively to climate change over the next decade.
Cyber attacks could harm our business, financial condition, and results of operations.
As technology advances, cyberattacks become more frequent and sophisticated. Attackers are organized, well-funded, and are developing increasingly sophisticated systems to attack and evade detection. While we take strict measures to protect our trade secrets and customer data, a security breach or failure could expose us and our customers, dealers, and suppliers to risks such as unauthorized access to information technology systems, misuse and compromise of confidential information, and manipulation and destruction of data. Such incidents could potentially disrupt our business operations, harm our reputation, weaken our competitive position, and adversely affect our financial condition and results of operations. Additionally, security breaches could lead to litigation with third parties, regulatory actions, and higher costs of implementing additional data protection measures. Furthermore, geopolitical tensions or conflicts may increase the risk of cyberattacks. While we continuously review and strengthen our information security policies and procedures, we cannot guarantee that we will be immune to new and emerging risks and attacks in the constantly evolving landscape of cybersecurity threats.
Negative publicity may adversely affect our brand and reputation, which may result in a material adverse impact on our business, results of operations and business prospects, and cause fluctuations in the trading price of our Common Shares and ADSs.
In addition, any change in policy or the direction in which we carry our corporate social responsibility or sustainability activities may also have an adverse effect on our business reputation. In recent years, we have experienced and may continue to experience negative publicity in connection with administrative penalties and criminal charges related to alleged violations of environmental regulations and laws. For further details, see “Item 4. Information on the Company—Business Overview—Environmental Matters,” and “Item 8. Financial Information—Consolidated Statements and Other Financial Information—Legal Proceedings.”
We face risks related to public health epidemics, natural disasters, and other disruptive events.
Our business could be materially and adversely affected by the outbreak of a 1) widespread health epidemic, such as COVID-19, swine flu, avian influenza, severe acute respiratory syndrome, Ebola, or Zika; 2) natural disasters, such as snowstorms, earthquakes, fires, floods, and the effects of climate change (such as drought, floods and increased storm severity); 3) or other events, such as wars, acts of terrorism, environmental accidents, power shortages, or communication interruptions. Disruptive events may have a material adverse effect on our business, financial condition, and results of operations. For example, these events could cause a temporary closure of the facilities we use for our operations, significantly disrupt supply chains and logistics services, or severely impact consumer behaviors and the operations of merchants, business partners, and other participants in our ecosystem. Our operations could also be disrupted if any of our employees or employees of our business partners are suspected of contracting an epidemic disease, since this could require us or our business partners to quarantine some or all these employees or disinfect the facilities used for operations. In addition, our revenue and profitability could be materially reduced to the extent that a natural disaster, health epidemic, or other outbreak harms the global economy in general.
20
Risks Relating to Taiwan, R.O.C.
Strained relations between the R.O.C. and the P.R.C. and disruptions in Taiwan’s political environment caused by domestic political events could negatively affect our business and the market value of our Common Shares and ADSs.
Our principal executive offices and facilities are located in Taiwan and approximately 56.3%, 57.0% and 58.5% of our operating revenues in 2020, 2021 and 2022, respectively, were derived from our operations in Taiwan. Accordingly, our business and financial condition may be affected by changes in local governmental policies and political and social instability.
The R.O.C. has a unique international political status. The government of the P.R.C. asserts sovereignty over all of China, including Taiwan, and does not recognize the legitimacy of the R.O.C. government. Although significant economic and cultural relations have been established in recent years between the R.O.C. and the P.R.C., relations have often been strained. Any major change in the Taiwanese political environment, including the outcome of presidential or municipal elections, or potential shifts in government policy, may affect the direction of economic and political developments and negatively impact the economic and political environment in Taiwan. Past developments related to the interaction between the two governments, domestic political events, or election results have on occasion depressed the market prices of the securities of Taiwanese or Taiwan-related companies, including our own. Relations between the R.O.C. and the P.R.C. and other factors affecting the political or economic conditions in Taiwan could have a material adverse effect on our financial condition and results of operations, as well as the market price and the liquidity of our Common Shares and ADSs.
We manufacture interconnect materials in the P.R.C. through our wholly-owned subsidiary, ASE Shanghai. We also provide packaging and testing services, develop real estate, and manufacture computer peripherals and electronic components through our subsidiaries in the P.R.C. See “Item 4. Information on the Company—Organizational Structure—Our Consolidated Subsidiaries.” In the past, R.O.C. companies, including our own, were not allowed to invest in semiconductor packaging and testing facilities in the P.R.C. Although the prohibitions were relaxed in February 2010, the R.O.C. government currently still restricts certain types of investments in the P.R.C. We do not know when or if such laws and policies governing investment in the P.R.C. will be amended, and we cannot ensure that such R.O.C. investment laws and policies will permit us to make certain beneficial investments in the P.R.C. in the future. Our growth prospects and profitability may be adversely affected if we are restricted from making certain additional investments in the P.R.C. and are not able to fully capitalize on the growth of the semiconductor industry in the P.R.C.
As a substantial portion of our business and operations are located in Taiwan, we are vulnerable to natural disasters including earthquakes, typhoons, droughts, as well as power outages and other industrial incidents, which could severely disrupt the normal operation of our business and adversely affect our results of operations.
Taiwan is in a region that is prone to typhoons and earthquakes, and these natural disasters have caused significant property damage, business disruptions at operating facilities, and loss of life in the past. The semiconductor and electronics industries are particularly vulnerable to disruptions caused by earthquakes. While we have not experienced any structural damage to our facilities or damage to our machinery and equipment due to earthquakes, we have experienced interruptions to our production schedule in the past, primarily as a result of power outages caused by earthquakes. In the event of a major earthquake, we could experience significant disruptions to our operations, which could have a material adverse effect on our business, financial condition, and results of operations. We seek to continuously enhance our disaster preparedness and business continuity plans to minimize the impact of earthquakes and other natural disasters on our operations, but we cannot guarantee that such plans will be effective in all circumstances. The supply of electrical power in Taiwan, which is primarily provided by Taiwan Power Company, is susceptible to power disruptions that could be prolonged and frequent, caused by overload as a result of high demand or other reasons. Such power disruptions could further be exacerbated with the government of Taiwan having set the target of being free of nuclear power by 2025. For example, on March 3, 2022, Taiwan experienced a massive power blackout, which left millions of homes, offices, and factories without power. Although the power blackout did not have a material impact on our operations, future power blackout may disrupt our business operations and adversely affect our results of operations.
21
Additionally, Taiwan has experienced severe droughts in the past and future droughts could significantly impact our operations. Our manufacturing process is heavily reliant on freshwater. We primarily recycle using ultra-filtration systems, chemical mechanical polishing wastewater recycling, and reverse osmosis water recycling. We also collect rainwater for scrubbing and cooling towers. We regularly monitor our water storage and recycling equipment and prepare truckloads of water to meet future water demand. We also refine our manufacturing capacity in response to water allocation to minimize the impact of water risks.
Although we have not experienced direct impacts from droughts, a drought could interrupt our packaging and substrate operations, which rely heavily on water. In addition, a drought could disrupt the manufacturing processes at other parts of the supply chain including our foundry partners, leading to potential production delays for our customers and a decline in demand for our services. While we are proactive in managing water risks and planning to mitigate their impact, we cannot guarantee that insufficient water storage will not affect our operations.
In addition, we are also subject to the risk of industrial and workplace accidents that could lead to injury or loss of life, damages to our facilities, and adversely impact our business reputation, commercial prospects, and operations.
Our production facilities, as well as many of our suppliers, customers, and providers of complementary semiconductor manufacturing services, including wafer foundries, are located in Taiwan. If our customers are impacted by natural disasters such as earthquakes, typhoons, droughts, or industrial incidents including power outage and labor strikes, these events could cause a decline in the demand for our services. If our suppliers or providers of complementary semiconductor manufacturing services are affected by such events, our production schedule could be interrupted, which might adversely impact our financial condition and results of operations.
Risks Relating to the SPIL Acquisition
There may be risks associated with the impacts of the SPIL Acquisition on our subgroups and our holding company structure.
ASE entered into a Joint Share Exchange Agreement with SPIL in June 2016, pursuant to which ASEH, a holding company in Taiwan, holds 100% of the equity interests in both ASE and SPIL such that ASE and SPIL became wholly-owned subsidiaries of ASEH. Subsequently, the Common Shares of ASEH were listed on the TWSE, and the ADSs of ASEH were listed on the NYSE.
This restructuring plan led to ASE Group and SPIL Group being separate subgroups under our holding company. This may create future difficulties in achieving strategic and operational synergies between them and could result in contingent risks, including increased tax liabilities or trading discounts relating to a holding company discount. For details about the Joint Share Exchange Agreement, see “Item 10. Additional Information—Material Contract.”
Risks Relating to Ownership of Our Common Shares and the ADSs
The market for our Common Shares and the ADSs may not be liquid.
Active, liquid trading markets generally result in lower price volatility and more efficient execution of buy and sell orders for investors, compared to less active and less liquid markets. Liquidity of a securities market is often a function of the volume of the underlying shares that are publicly held by unrelated parties.
There has been no trading market outside the R.O.C. for our Common Shares and the only trading market for our Common Shares is the TWSE. The outstanding ADSs are listed on the NYSE. There is no assurance that the market for our Common Shares or the ADSs will be active or liquid.
22
Although ADS holders are entitled to withdraw our Common Shares underlying the ADSs from the depositary at any time, the R.O.C. law requires that our Common Shares be held in an account in the R.O.C. or sold for the benefit of the holder on the TWSE. In connection with any withdrawal of Common Shares from our ADS facility, the ADSs evidencing these Common Shares will be canceled. Unless additional ADSs are issued, the effect of withdrawals will be to reduce the number of outstanding ADSs. If a significant number of withdrawals are affected, the liquidity of our ADSs will be substantially reduced. We cannot ensure that the ADS depositary will be able to arrange for a sale of deposited shares in a timely manner or at a specified price, particularly during periods of illiquidity or volatility.
If a non-R.O.C. holder of ADSs withdraws and holds Common Shares, such holder of ADSs will be required to appoint a tax guarantor, local agent, and custodian in the R.O.C. and register with the TWSE or the Taipei Exchange in order to buy and sell securities on the TWSE.
When a non-R.O.C. holder of ADSs elects to withdraw and hold Common Shares represented by ADSs, such holder of the ADSs will be required to appoint an agent for filing tax returns and making tax payments in the R.O.C. Such agent will be required to meet the qualifications set by the R.O.C. Ministry of Finance and, upon appointment, becomes the guarantor of the withdrawing holder’s tax payment obligations. Evidence of the appointment of a tax guarantor, the approval of such appointment by the R.O.C. tax authorities, and tax clearance certificates or evidentiary documents issued by such tax guarantor may be required as conditions to such holder repatriating the profits derived from the sale of Common Shares. We cannot ensure that a withdrawing holder will be able to appoint, and obtain approval for, a tax guarantor in a timely manner.
In addition, under current R.O.C. law, such withdrawing holder is required to register with the TWSE or the Taipei Exchange and appoint a local agent in the R.O.C. to, among other things, open a bank account and open a securities trading account with a local securities brokerage firm, pay taxes, remit funds, and exercise such holder’s rights as a shareholder. Furthermore, such withdrawing holder must appoint a local bank or a local securities firm to act as custodian for confirmation and settlement of trades, safekeeping of securities and cash proceeds, and reporting and declaration of information. Without satisfying these requirements, non-R.O.C. withdrawing holders of ADSs would not be able to hold or otherwise subsequently sell our Common Shares on the TWSE or otherwise.
Pursuant to P.R.C. Regulations, only QDIIs or persons that have otherwise obtained the approval from the MOEAIC and registered with the TWSE are permitted to withdraw and hold our shares from a depositary receipt facility. In order to hold our shares, such QDIIs are required to appoint an agent and custodian as required by the P.R.C. Regulations. If the aggregate amount of our shares held by any QDII or shares received by any QDII upon a single withdrawal or in the aggregate accounts for 10.0% of our total issued and outstanding shares, such QDII must obtain the prior approval from the MOEAIC. We cannot ensure that such approval would be granted.
The market value of our ADSs may fluctuate due to the volatility of the R.O.C. securities market.
The trading price of our ADSs may be affected by the trading price of our Common Shares on the TWSE. The R.O.C. securities market is smaller and more volatile than the securities markets in the U.S. and in many European countries. The TWSE has experienced substantial fluctuations in the prices and volumes of sales of listed securities and there are currently limits on the range of daily price movements on the TWSE. During 2022, the TWSE Weighted Index peaked at 18,526.35 on January 4, 2022, and reached a low of 12,666.12 on October 25, 2022, and the trading price of our Common Shares ranged from NT$71.4 per Share to NT$112.0 per Share. On March 24, 2023, the TWSE Weighted Index closed at 15,914.7 and the closing value of our Common Shares was NT$111.0 per Share.
The TWSE is particularly volatile during times of political instability, including when relations between the R.O.C. and the P.R.C. are strained. Several investment funds affiliated with the R.O.C. government have also from time to time purchased securities from the TWSE to support the trading level of the TWSE. Moreover, the TWSE has experienced problems such as market manipulation, insider trading, and settlement defaults. The recurrence of these or similar problems could have an adverse effect on the market price and liquidity of the securities of R.O.C. companies, including our Common Shares and ADSs, in both the domestic and international markets.
23
We may not continue to declare cash dividends in any particular amount.
We intend to continue to pay dividends. However, future dividends may be affected by, among other things, the best interests of our Company and our shareholders, our results of operations, cash balances and future cash requirements, financial condition, investments and acquisitions, legal risks, and other factors that the board of directors may consider relevant. Our dividend payments may change occasionally, and we cannot ensure that we will continue to declare dividends in any particular amount. A reduction in, a delay of, or elimination of our dividend payments could adversely affect our share price.
Our major shareholders may take actions that are not in, or may conflict with, our public shareholders’ best interests.
Members of the Chang family own, directly or indirectly, a significant interest in our outstanding Common Shares. See “Item 7. Major Shareholders and Related Party Transactions— Major Shareholders.” Accordingly, these shareholders will continue to have the ability to exercise a significant influence over our business, including matters relating to:
· | our operation, management, and policies; |
· | the timing and distribution of dividends; and |
· | the election of our directors. |
Members of the Chang family may take actions that public shareholders may not agree with or that are not in alignment with our or our public shareholders’ best interests.
We are an R.O.C. company and, because the rights of shareholders under R.O.C. law differ from those under U.S. law and the laws of certain other countries, our shareholders may have difficulty protecting their shareholder rights.
Our corporate affairs are governed by our Articles of Incorporation and by the laws governing corporations incorporated in the R.O.C. The rights of shareholders and the responsibilities of management and the members of the board of directors under R.O.C. law are different from those applicable to a corporation incorporated in the U.S. and certain other countries. As a result, public shareholders of R.O.C. companies may experience increased difficulty in protecting their interests in connection with actions taken by management or members of the board of directors than they would as public shareholders of a corporation in the U.S. or certain other countries.
Holders of Common Shares and ADSs may experience dilution if we issue stock bonuses, share options, or restricted stocks to employees or sell additional equity or equity-linked securities.
Like other R.O.C. technology companies, we periodically issue bonuses in the form of Common Shares. Bonuses in the form of our Common Shares are valued at the closing price of our Common Shares on the day prior to our meeting of the board of directors. Therefore, the issuance of our Common Shares pursuant to stock bonuses, share options and restricted stock awards may have a dilutive effect on the holders of outstanding Common Shares and ADSs. In addition, the issuance of additional equity or equity-linked securities may result in additional dilution to our shareholders.
As of December 31, 2022, a total of approximately 91,262 thousand share options and restricted stocks assumed and issued by ASEH were outstanding. See “Item 6. Directors, Senior Management and Employees—Compensation—Share-Based Payment Arrangements.”
Restrictions on the ability to deposit our Common Shares into our ADS facility may adversely affect the liquidity and price of our ADSs.
The ability to deposit Common Shares into our ADS facility is restricted by R.O.C. law. A significant number of withdrawals of Common Shares underlying our ADSs would reduce the liquidity of the ADSs by reducing the number of ADSs outstanding. As a result, the prevailing market price of our ADSs may differ from the prevailing market price of our Common Shares on the TWSE. Under current R.O.C. law, no person or entity, including shareholders and ourselves, may deposit our Common Shares in our ADS facility without specific approval of the FSC, unless:
(1) | we pay stock dividends on our Common Shares; |
24
(2) | we make a free distribution of Common Shares; |
(3) | holders of ADSs exercise preemptive rights in the event of capital increases; or |
(4) | to the extent permitted under the deposit agreement and the relevant custody agreement and within the amount of depositary receipts which have been withdrawn, investors purchase our Common Shares, directly or through the depositary, on the TWSE, and deliver our Common Shares to the custodian for deposit into our ADS facility, or our existing shareholders deliver our Common Shares to the custodian for deposit into our ADS facility. |
With respect to item (4) above, the depositary may issue ADSs against the deposit of those Common Shares only if the total number of ADSs outstanding following the deposit will not exceed the number of ADSs previously approved by the FSC, plus any ADSs issued pursuant to the events described in items (1), (2) and (3) above.
In addition, in the case of a deposit of our Common Shares requested under item (4) above, the depositary will refuse to accept deposit of our Common Shares if such deposit is not permitted under any legal, regulatory, or other restrictions notified by us to the depositary, which restrictions may include blackout periods during which deposits may not be made, minimum and maximum amounts, and frequency of deposits.
The depositary will not offer holders of ADSs preemptive rights unless the distribution of both the rights and the underlying Common Shares to our ADS holders are either registered under the Securities Act or exempt from registration under the Securities Act.
Holders of ADSs will not have the same voting rights as our shareholders, which may affect the value of their ADSs.
The voting rights of a holder of ADSs as to our Common Shares represented by its ADSs are governed by the deposit agreement. Holders of ADSs will not be able to exercise voting rights on an individual basis. If holders representing at least 51% of the ADSs outstanding at the relevant record date instruct the depositary to vote in the same manner regarding a resolution, including the election of directors, the depositary will cause all Common Shares represented by the ADSs to be voted in that manner. If the depositary does not receive timely instructions representing at least 51% of the ADSs outstanding at the relevant record date to vote in the same manner for any resolution, including the election of directors, holders of ADSs will be deemed to have instructed the depositary or its nominee to authorize all our Common Shares represented by the ADSs to be voted at the discretion of our chairman or his designee, which may not be in the interest of holders of ADSs. Moreover, while shareholders who own 1% or more of our outstanding shares are entitled to submit one proposal to be considered at our annual general meetings of shareholders, only holders representing at least 51% of our ADSs outstanding at the relevant record date are entitled to submit one proposal to be considered at our annual general meetings of shareholders. Hence, only one proposal may be submitted on behalf of all ADS holders.
The right of holders of ADSs to participate in our rights offerings is limited, which could cause dilution to their holdings.
We may from time to time distribute rights to our shareholders, including rights to acquire our securities. Under the deposit agreement, the depositary will not offer holders of ADSs those rights unless both the distribution of the rights and the underlying securities to all our ADS holders are either registered under the Securities Act or exempt from registration under the Securities Act. Although we may be eligible to take advantage of certain exemptions under the Securities Act available to certain foreign issuers for rights offerings, we can give no assurances that we will be able to establish an exemption from registration under the Securities Act, and we are under no obligation to file a registration statement for any of these rights. Accordingly, holders of ADSs may be unable to participate in our rights offerings and may experience dilution of their holdings.
If the depositary is unable to sell rights that are not exercised or not distributed or if the sale is not lawful or reasonably practicable, it will allow the rights to lapse, in which case holders of ADSs will receive no value for these rights.
25
Changes in exchange controls, which restrict to the conversion of proceeds received from ownership of ADSs, may have an adverse effect on the value of these investments.
Under current R.O.C. law, the depositary, without obtaining approvals from the Central Bank of the Republic of China (Taiwan) or any other governmental authority or agency of the R.O.C., may convert NT dollars into other currencies, including U.S. dollars, for:
· | the proceeds of the sale of Common Shares represented by ADSs or received as stock dividends from our Common Shares and deposited into the depositary receipt facility; and |
· | any cash dividends or distributions received from our Common Shares. |
In addition, the depositary may also convert into NT dollars incoming payments for purchases of Common Shares for deposit in the ADS facility against the creation of additional ADSs. The depositary may be required to obtain foreign exchange approval from the Central Bank of the Republic of China (Taiwan) on a payment-by-payment basis for conversion from NT dollars into foreign currencies of the proceeds from the sale of subscription rights for new Common Shares. Although it is expected that the Central Bank of the Republic of China (Taiwan) will grant this approval as a routine matter, we cannot ensure that in the future any approval will be obtained in a timely manner, or at all.
Under the R.O.C. Foreign Exchange Control Act, the Executive Yuan of the R.O.C. government may, without prior notice but subject to subsequent legislative approval, impose foreign exchange controls in the event of, among other things, a material change in international economic conditions. We cannot ensure that foreign exchange controls or other restrictions will not be introduced in the future.
The value of our Common Shares or ADSs may be reduced by possible future sales of Common Shares or ADSs by us or our shareholders.
While we are not aware of any plans by any major shareholders to dispose of significant numbers of Common Shares, we cannot ensure that one or more existing shareholders or owners of securities convertible or exchangeable into or exercisable for our Common Shares or ADSs will not dispose of significant numbers of Common Shares or ADSs. In addition, several of our subsidiaries and affiliates hold Common Shares, depositary shares representing Common Shares, and options to purchase Common Shares or ADSs. They may decide to sell those securities in the future. See “Item 7. Major Shareholders and Related Party Transactions—Major Shareholders” for a description of our significant shareholders and affiliates that hold our Common Shares.
We cannot predict the effect, if any, that future sales of Common Shares or ADSs, or the availability of Common Shares or ADSs for future sale, will have on the market price of our Common Shares or the ADSs at any time. Sales of substantial numbers of Common Shares or ADSs in the public market, or the perception that such sales may occur, could depress the prevailing market prices of our Common Shares or the ADSs.
Techniques employed by short sellers may drive down the trading price of the ADSs.
Short selling is the practice of selling securities that the seller does not own but rather has borrowed from a third party with the intention of buying identical securities back at a later date to return to the lender. The short seller hopes to profit from a decline in the value of the securities between the sale of the borrowed securities and the purchase of the replacement shares, as the short seller expects to pay less in that purchase than it received in the sale. As it is in the short seller’s interest for the price of the security to decline, many short sellers publish, or arrange for the publication of, negative opinions regarding the relevant issuer and its business prospects in order to create negative market momentum and generate profits for themselves after selling a security short. These short attacks have, in the past, led to selling of shares in the market.
Public companies listed in the U.S. that have material operations in the P.R.C., among others, have on occasion been the subject of short selling. Much of the scrutiny and negative publicity has centered on allegations of a lack of effective internal control over financial reporting resulting in financial and accounting irregularities and mistakes, inadequate corporate governance policies or a lack of adherence thereto, and, in many cases, allegations of fraud. As a result, many of these companies are now conducting internal and external investigations into the allegations and, in the interim, are subject to shareholder lawsuits and/or SEC enforcement actions.
26
It is not clear what effect such negative publicity could have on us. If we were to become the subject of any unfavorable allegations, whether such allegations are proven to be true or untrue, we would have to expend a significant amount of resources to investigate such allegations and/or defend ourselves. While we would endeavor to defend against any such short seller attacks, we may be constrained in how we can oppose a relevant short seller by principles of freedom of speech, applicable state law, or issues of commercial confidentiality. Such a situation could be costly and time-consuming and could divert our management’s attention from growing our business. Even if such allegations are ultimately proven to be groundless, allegations against us could severely impact the ADSs and their value could be greatly reduced or rendered worthless.
Item 4. Information on the Company
HISTORY AND DEVELOPMENT OF THE COMPANY
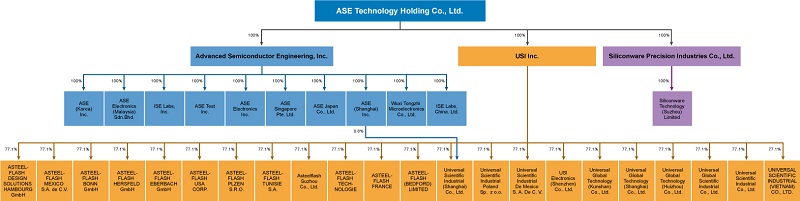
ASE Technology Holding Co., Ltd. was jointly established on April 30, 2018 as a company limited by shares under the R.O.C. Company Law, by the combination of Advanced Semiconductor Engineering, Inc., which was incorporated on March 23, 1984, and Siliconware Precision Industries Co., Ltd., which was incorporated on May 17, 1984.
ASEH directly controls ASE Group, SPIL Group, USI Group, and ASE Social Enterprise Co., Ltd. ASEH’s main manufacturing facilities are located in Taiwan, the P.R.C., South Korea, Japan, Singapore, Malaysia, Vietnam, Mexico, America, Poland, France, the United Kingdom, Germany, Tunisia and Czech Republic. Our principal executive offices are located at 26, Chin 3rd Rd., Nanzih Dist., Kaohsiung, Taiwan, R.O.C. and our telephone number at the above address is (886) 7-361-7131. Our Common Shares have been listed on the TWSE under the symbol “3711” and ADSs representing our Common Shares have been listed on the NYSE under the ticker symbol “ASX” since April 2018.
SPIL Acquisition
In August 2015, ASE announced an offer to purchase 779,000,000 common shares (including those represented by American depositary shares) of SPIL through concurrent tender offers in the R.O.C. and the U.S., at a price of NT$45 per SPIL common share and NT$225 per SPIL American depositary share. The Initial SPIL Tender Offer expired on September 22, 2015, with 1,147,898,165 common shares (including those represented by American depositary shares) validly tendered and not validly withdrawn, exceeding the offer cap, and as a result, after proration, 725,749,060 SPIL common shares and 10,650,188 SPIL American depositary shares were accepted for purchase. On October 1, 2015, ASE became a shareholder holding approximately 24.99% of the issued and outstanding share capital in SPIL.
In December 2015, following an announcement by SPIL that it planned to issue 1,033 million shares, if approved by SPIL shareholders, to a third party pursuant to a share placement agreement, ASE submitted a written proposal to SPIL’s board proposing to acquire all SPIL shares not otherwise owned by ASE, contingent upon the termination of the share placement agreement. The board of directors of SPIL did not respond to our acquisition proposal. Subsequently, ASE launched an offer to purchase 770,000,000 common shares (including those represented by American depositary shares) of SPIL through concurrent tender offers in the R.O.C. and the U.S., at a price of NT$55 per SPIL common share and NT$275 per SPIL American depositary share. The Second SPIL Tender Offer expired on March 17, 2016. Because the TFTC did not render a decision before the expiration of the Second SPIL Tender Offer, resulting in the failure to satisfy one of the tender offer conditions, the Second SPIL Tender Offer was not successful. The TFTC subsequently suspended its review on March 23, 2016.
Notwithstanding the failure of the Second SPIL Tender Offer, ASE continued to seek control of SPIL, with the purpose of effecting an acquisition of 100% of the common shares and American depositary shares of SPIL. Simultaneously with the acquisition of SPIL, ASE planned to establish a holding company in Taiwan that would hold 100% of the equity interests of both ASE and SPIL such that ASE and SPIL would be wholly-owned subsidiaries of such holding company, which would maintain all current operations of ASE and SPIL.
In March and April 2016, ASE acquired an additional 258,300,000 common shares of SPIL (including those represented by American depositary shares) through open market purchases.
In June 2016, ASE entered into the Joint Share Exchange Agreement with SPIL, pursuant to which ASEH was formed by means of a statutory share exchange pursuant to the laws of the Republic of China, and ASEH (i) acquired all issued shares of ASE in exchange for shares of ASEH, and (ii) acquired all issued shares of SPIL using cash consideration.
27
The Share Exchange was conditionally approved by the Anti-Monopoly Bureau under the State Administration for Market Regulation on November 23, 2017. Among other restrictive conditions imposed by the Anti-Monopoly Bureau, ASE and SPIL had to maintain independent operations for 24 months.
On January 16, 2018, ASE converted 9,690,452 American depositary shares of SPIL that it owned into 48,452,260 common shares.
On February 12, 2018, ASE and SPIL, respectively, held extraordinary general shareholders’ meetings and each approved the proposed Joint Share Exchange, pursuant to which, ASEH acquired 100% of both ASE and SPIL shares.
The Share Exchange consummated on April 30, 2018, and ASE and SPIL became privately held and wholly-owned subsidiaries of ASEH concurrently.
On March 25, 2020, the Anti-Monopoly Bureau officially lifted all restrictive conditions imposed on the Share Exchange.
USI Group and USI Group Restructuring
USI Group engages primarily in EMS in relation to computing, consumer electronics, communications, industrial and automotive, among other services and businesses.
We have been purchasing shares of Universal Scientific Industrial since 1999. Upon several acquisitions through cash and stock tender offer, Universal Scientific Industrial became our subsidiary in 2010. In 2012, USI Shanghai completed its IPO on the Shanghai Stock Exchange with the symbol “601231.” In 2015, Universal Scientific Industrial completed a spin-off of USI Inc. Following the completion of a series of share transfers, USI Inc. became the parent company of the USI Group in 2016.
In October 2018, to enhance operational flexibility through organizational restructure, ASE’s board of directors resolved to spin off ASE’s investment department, which is responsible for managing the ordinary shares and assets of USI Inc., into USI Global, a newly established company. USI Global issued new ordinary shares to us as consideration for the spin-off. The spin-off consummated in November 2018 and we obtained control over ASE and USI Global. In December 2018, our board of directors and the board of director of USI Global resolved to merge USI Global and ASE Technology Holding Co., Ltd. The merger consummated in January 2019 and ASE Technology Holding Co., Ltd. became the surviving entity after the merger and USI Global was thereby dissolved. Our financial position or financial performance was not materially affected by USI Global’s spin-off from ASE Inc. or USI Global’s merger with ASE Technology Holding Co., Ltd.
On December 12, 2019, USIFR, FAFG and the shareholders of FAFG entered into a share purchase agreement (the “FAFG Share Purchase Agreement”), and USI Shanghai and ASDI, one of the shareholders of FAFG and privately held company owned by FAFG’s founder, entered into a framework agreement for purchasing assets through issuing shares, pursuant to which USIFR and USI Shanghai would ultimately acquire 100.0% of the share capital of FAFG by way of a share purchase (the “FAFG Transaction”). The FAFG Transaction proposed a two-step transaction. In the first step, USIFR would directly purchase 89.6% of FAFG’s share capital in exchange for a cash payment. In the second step, USI Shanghai would acquire the remaining 10.4% of FAFG’s share capital from ASDI in exchange for newly issued shares of USI Shanghai. At the conclusion of both steps, USI Shanghai would directly or indirectly own 100% of the share capital of FAFG. On March 26, 2020, the issuance of new shares for the FAFG Transaction was approved unconditionally by the M&A and Restructuring Committee of China Securities Regulatory Commission. On December 1, 2020, the transaction was completed and as a result, USI acquired 100% of FAFG’s total issued shares, 79,848 thousand shares. The consideration transferred amounted to NT$12,443.6 million.
28
China Site Dispositions
In 2021, ASEH and Beijing Wise Road Asset Management Co., Ltd. (the “Wise Road Capital”) entered into a Sale and Purchase Agreement by which ASEH to sell shares and equity interests in GAPT Holding Limited (GAPT Holding Limited directly or indirectly holds 100.0% equity interests in Global Advanced Packaging Test (HongKong) Limited, ASEWH, ASEN and Advanced Shanghai) and ASEKS to Wise Road Capital or its designated affiliate in exchange for a cash consideration in an aggregate amount of NT$36,939.1 million. The due date of outstanding receivables of the cash consideration (the “Receivables”), originally scheduled to be the business day following the expiration of 6 months from the settlement date, was postponed to the business day following the expiration of 15 months from the settlement date, which was March 17, 2023, by the resolution of the board of directors and the agreement with the counterparty. To increase our opportunity for capital gains in the future, the Company’s board of directors resolved on March 15, 2023 to enter into a supplemental share purchase agreement (the “Agreement”) with the counterparty and its affiliates stipulating that the counterparty’s affiliate will offer us newly issued ordinary shares (the “Alternative Consideration Shares”) as an alternative to its obligation of the Receivables. If the counterparty’s affiliates fail to offer us the Alternative Consideration Shares within 12 months following the signing date of the Agreement, the counterparty and its affiliates should pay us the Receivables within 5 months after the expiry of the 12-month period.
Capital Expenditures
Our capital expenditures for the years ended December 31, 2020, 2021 and 2022 for property, plant, and equipment were NT$59,024.2 million, NT$74,417.5 million and NT$75,800.6 million (US$2,466.7 million), respectively. We had commitments for capital expenditures of approximately NT$59,675.6 million (US$1,941.9 million), of which NT$3,689.9 million (US$120.1 million) had been prepaid as of December 31, 2022, mainly in connection with the expansion of our operations in the R.O.C. and the P.R.C. In addition, we are adaptable to changing customer needs and will be able to expand our footprint to other countries and regions as needed in the future. Any future expansion of our operating activities could result in additional capital expenditures. We anticipate our capital expenditures in 2023 will be financed through existing cash, expected cash flow from operations, and existing credit lines under our loan facilities and will consist of, among other things, additional machinery and equipment procurements for our capacity expansions. See “Item 5. Operating and Financial Review and Prospects—Liquidity and Capital Resources” for more information. There were no significant financial investments or divestitures in 2020, 2021 and 2022.
For more information on our history and development, see “—Organizational Structure.”
BUSINESS OVERVIEW
ASEH is a leading provider of semiconductor manufacturing services in assembly and testing. Our services include semiconductor packaging, production of interconnect materials, front-end engineering testing, wafer probing, and final testing services, as well as integrated solutions for EMS in relation to computing, peripherals, communications, industrial, automotive, and server applications.
We believe that, as a result of the following strengths, we are able to compete effectively to meet customers’ requirements across a wide range of applications:
· | our ability to provide a broad range of cost-effective semiconductor packaging and testing services on a large-scale turnkey basis within key centers of semiconductor manufacturing; |
· | our expertise in developing and providing cost-effective packaging, interconnect materials, and testing technologies and solutions; |
· | our ability to provide proactive original design manufacturing services using innovative solution-based designs; |
· | our commitment to investing in capacity expansion and research and development, as well as selective acquisitions, that will benefit customers and our business; |
· | our geographic presence in key centers of outsourced semiconductor and electronics manufacturing; and |
· | our long-term relationships with providers of complementary semiconductor manufacturing services, including our strategic alliance with TSMC. |
29
We believe that it is still the trend for semiconductor companies to outsource their packaging, testing, and manufacturing requirements as semiconductor companies rely on independent providers of foundry, packaging and testing, and EMS. In response to the increased pace of new product development and shortened product life and production cycles, semiconductor companies are increasingly seeking both independent packaging and testing companies that can provide turnkey services that reduce time to market and electronic manufacturing companies with proactive original design capabilities that can provide large-scale production. We believe that our technological expertise, scale, and our ability to integrate a broad range of solutions into turnkey services and EMS allow us to benefit from the accelerated outsourcing trend and better serve our existing and potential customers.
We believe that we have benefited, and will continue to benefit, from our geographic location in Taiwan. Taiwan is currently the largest center for outsourced semiconductor manufacturing in the world and has a high concentration of EMS providers. Our close proximity to foundries and other providers of complementary semiconductor manufacturing services is attractive to our customers who wish to take advantage of the efficiencies of a total semiconductor manufacturing solution by outsourcing several stages of their manufacturing requirements. We believe that, as a result, we are well positioned to meet the advanced semiconductor engineering and manufacturing requirements of our customers.
Industry Background
General
Semiconductors are the building blocks used to create an increasing variety of electronic products and systems. Continuous improvements in semiconductor process and design technologies have led to smaller, more complex, and more reliable semiconductors at a lower cost per function. These improvements have resulted in significant performance and price benefits to manufacturers of electronic products. As a result, semiconductor demand has grown substantially in our primary end-user markets for communications, computing and consumer electronics, and has experienced increased growth in other markets such as automotive products and industrial automation and control systems.
The semiconductor industry is characterized by strong long-term growth, with periodic and sometimes severe cyclical downturns. The Semiconductor Industry Association reported that worldwide sales of semiconductors increased from approximately US$51.0 billion in 1990 to approximately US$573.5 billion in 2022. We believe that overall growth and cyclical fluctuations will continue over the long term in the semiconductor industry.
EMS
EMS providers typically achieve large economies of scale in manufacturing by pooling together product design techniques and providing value-added services such as warranties and repairs. Companies who do not need to manufacture a constant supply of products have increasingly outsourced their manufacturing to these service providers so that they can respond quickly and efficiently to sudden spikes in demand without having to maintain large inventories of products.
EMS are sought by companies in a wide range of industries including, among others, information, communications, computing, consumer electronics, automotive electronics, medical treatment, industrial applications, aviation, navigation, national defense, and transportation. Although affected by global economic fluctuations, we expect the EMS industry to continue to grow in the long term, and we have enhanced our presence in the industry through USI Group.
Outsourcing Trends in Semiconductor Manufacturing
Historically, semiconductor companies designed, manufactured, packaged, and tested semiconductors primarily within their own facilities. However, there is a clear trend in the industry to outsource the manufacturing process. Virtually every significant stage of the manufacturing process can be outsourced. Wafer foundry services, semiconductor packaging and testing services, and EMS are currently the largest segments of the independent semiconductor manufacturing services market.
The availability of technologically advanced independent manufacturing services has also enabled the growth of “fabless” semiconductor companies that focus on semiconductor design and marketing, while outsourcing their wafer fabrication, packaging, and testing requirements to independent companies. We believe that the growth in the number and scale of fabless semiconductor companies that rely solely on independent companies to meet their manufacturing requirements will continue to be a driver of growth for us. Similarly, the availability of technologically advanced independent manufacturing services has encouraged integrated device manufacturers, which traditionally have relied on in-house semiconductor manufacturing capacity, to increasingly outsource their manufacturing requirements to independent semiconductor manufacturing companies.
30
We believe the outsourcing of semiconductor manufacturing services will increase in the future for many reasons, including:
· | Technological Expertise and Significant Capital Expenditure. Semiconductor manufacturing processes have become highly complex, requiring substantial investment in specialized equipment and facilities and sophisticated engineering and manufacturing expertise. In addition, product life cycles have been shortening, magnifying the need to continuously upgrade or replace manufacturing equipment to accommodate new products. As a result, new investments in in-house facilities are becoming less desirable to integrated device manufacturers because of the high investment costs as well as the inability to achieve sufficient economies of scale and utilization rates necessary to be competitive with the independent service providers. Independent packaging, testing, wafer foundry, and EMS companies, on the other hand, are able to realize the benefits of specialization and achieve economies of scale by providing services to a large base of customers across a wide range of products. This enables them to reduce costs and shorten production cycles through high capacity utilization and process expertise. In the process, they are also able to focus on discrete stages of semiconductor manufacturing and deliver services of superior quality. Some semiconductor companies with in-house operations are under increasing pressure to rationalize these operations by relocating to locations with lower costs or better infrastructure, in order to lower manufacturing costs and shorten production cycle time. We expect semiconductor companies to increasingly outsource their requirements to take advantage of the advanced technology and scale of operations of independent packaging and testing companies and EMS providers. |
· | Focus on Core Competencies. As the semiconductor industry becomes more competitive, semiconductor companies are expected to further outsource their semiconductor manufacturing requirements in order to focus their resources on core competencies, such as semiconductor design and marketing. |
· | Time-to-Market Pressure. The increasingly short product life cycle has accelerated time-to-market pressure for semiconductor companies, leading them to rely increasingly on outsourced suppliers as a key source for effective manufacturing solutions. |
· | Capitalizization on High Growth Rates in Emerging Markets. Emerging markets, and China in particular, have become both major manufacturing centers for the technology industry and growing markets for technology-based products. In order to gain direct access to the Chinese market, many semiconductor companies are seeking to establish manufacturing facilities in China by partnering with local subcontractors. As a result, certain stages of the semiconductor manufacturing process that were previously handled in-house will be increasingly outsourced in order to improve efficiency. |
Trends of Mergers and Acquisitions in the Semiconductor Industry
The global semiconductor industry is highly competitive, and the competitive landscape is changing as a result of a trend toward consolidation within the industry. Packaging and testing service providers, in particular, have engaged in cross-border mergers and acquisitions in recent years as part of their expansion strategy, which have gradually changed the ecosystem of the semiconductor industry.
Examples of mergers and acquisitions by and among semiconductor design companies, integrated device and chips manufacturers, and software business providers include Intel Corporation’s acquisition of Altera Corporation, ON Semiconductor Corporation’s acquisition of Fairchild Semiconductor International, NXP Semiconductors’s acquisition of Freescale Semiconductor, Avago Technologies’s acquisition of Broadcom Corporation, several acquisitions of semiconductor design companies by MediaTek, Bain Capital’s acquisition of Toshiba Corporation’s memory chip business, Microchip Technology’s acquisition of Atmel Corporation and Microsemi Corporation, Qualcomm Incorporated’s attempted acquisition of NXP Semiconductors, Broadcom Limited’s attempted acquisition of Qualcomm Incorporated, Infineon’s acquisition of Cypress, NXP Semiconductors’s acquisition of Marvell’s Wi-Fi Connectivity Business, ON Semiconductor Corporation’s acquisition of Quantenna, NVIDIA’s acquisition of ARM Limited from SoftBank Group, Analog Devices’s acquisition of Maxim Integrated Products, AMD’s acquisition of Xilinx, Intel’s acquisition of Tower Semiconductor, Beijing Zhiguangxin Holding’s acquisition of Tsinghua Unigroup, MaxLinear’s acquisition of Silicon Motion, AMD’s acquisition of Pensando, and Broadcom’s attempt to acquisition of VMware.
31
Examples of mergers and acquisitions by and among semiconductor packaging and testing companies include Jiangsu Changjiang Electronics Technology’s acquisition of STATS ChipPAC, Nantong Fujitsu Microelectronics’s acquisition of the packaging and testing factory of AMD, Amkor’s acquisition of J-Devices, and Tianshui Huatian Technology’s acquisition of Unisem.
As a result of the aforementioned mergers and acquisitions, our competitors were able to further strengthen their competitive position by expanding their product offerings and combining their financial resources. We expect this consolidation trend to continue.
Overview of Semiconductor Manufacturing Process
The manufacturing of semiconductors is a complex process that requires increasingly sophisticated engineering and manufacturing expertise. The manufacturing process can be generally divided into the following stages:
32
We are involved in all stages of the semiconductor manufacturing process except circuit design and wafer fabrication.
Process |
Description | |
1. Circuit Design | The design of a semiconductor is developed by laying out circuit components and interconnections. | |
2. Engineering Test | Throughout and following the design process, prototype semiconductors undergo engineering testing, which involves software development, electrical design validation, and reliability and failure analysis. | |
3. Wafer Fabrication | Process begins with the generation of a photomask through the definition of the circuit design pattern on a photographic negative, known as a mask, by an electron beam or laser beam writer. These circuit patterns are transferred to the wafers using various advanced processes. | |
4. Wafer Probe | Each individual die is electrically tested, or probed, for defects. Dies that fail this test are marked to be discarded. | |
5. Packaging (or Assembly) | Packaging, also called assembly, is the processing of bare semiconductors into finished semiconductors and serves to protect the die and facilitate electrical connections and heat dissipation. | |
6. Final Test | Final testing is conducted to ensure that the packaged semiconductor meets performance specifications. Final testing involves using sophisticated testing equipment, known as testers, and customized software to electrically test several attributes of packaged semiconductors, including functionality, speed, predicted endurance, and power consumption. The final testing of semiconductors is categorized by the functions of the semiconductors tested into logic/mixed-signal/RF/3D IC/discrete final testing and memory final testing. Memory final testing typically requires simpler test software but longer testing time per device tested. | |
7. Module, Board Assembly, and Test | Module, board assembly, and test refers to the combination of one or more packaged semiconductors with other components in an integrated module or board to enable increased functionality. | |
8. Material | Material refers to the interconnection of materials which connect the input/output on the semiconductor dies to the printed circuit board, such as substrate, leadframe, and flip chip. |
Strategy
Our objective is to provide integrated solutions that set industry standards, including packaging, testing services, interconnect materials design and production capabilities, and to lead and facilitate the industry trend toward outsourcing semiconductor manufacturing requirements. The principal elements of our strategy are to:
Grow Our Packaging Services and Expand Our Range of Offerings
We believe that an important factor in attracting leading semiconductor companies to be our customers is our ability to fulfill the demand for a broad range of packaging solutions on a large scale. We intend to continue to develop process and product technologies to meet the packaging requirements of clients. Our expertise in packaging technology has enabled us to develop sophisticated solutions such as flip chip packaging, bump chip carrier packaging, stacked die packaging, and fine-pitch wire bonding. We are continuously investing in research and development in response to and in anticipation of migrations in technology and intend to continue to acquire access to new technologies through strategic alliances and licensing arrangements.
The increasing miniaturization of semiconductors and the growing complexity of interconnect technology have also resulted in the convergence of assembly processes at different levels of integration: chip, module, board, and system. In response to this miniaturization and growing complexity, we have focused on providing module assembly services and, in addition, our subsidiary USI Group has provided us with access to process and product technologies at the levels of module, board, and system assembly and testing, which helps us to better anticipate industry trends and take advantage of potential growth opportunities. We expect to continue to combine our packaging, testing, and materials technologies with the expertise of USI Group at the systems level to develop our SiP business.
33
Strategically Expand and Streamline Production Capacity
To capitalize on growing industry demand, we intend to strategically expand our production capacity, both through internal growth and selective acquisitions and joint ventures, with a focus on providing cost-competitive and innovative packaging and testing services.
We intend to invest in trends that are essential to the development of the industry. We plan to expand our capacity to meet demand for smaller form factors, higher performance, and higher packaging density.
In addition, we intend to promote our copper wire solutions to our customers in addition to gold wire. Gold wire is a significant raw material for us. Gold prices, however, are subject to intense fluctuations and have in the past impacted our profitability. We believe that replacing gold wire in some of our packages with copper wire technology will not only improve our profitability but will also enable us to provide more value to our customers by providing lower cost solutions, which could enhance our competitiveness and market share. We are currently the industry leader in terms of copper wire capacity. We plan to capitalize on the overall industry trend of copper conversion by maintaining our leadership and focusing on integrating copper wire into a wider range of traditional leadframe-based packages and higher-end substrate-based packages.
We expect to focus on providing cost-competitive services through better management of capacity utilization and efficiency improvements and offer our services on a large scale with the intention of driving more integrated device manufacturer outsourcing in the long run.
We evaluate acquisition and joint venture opportunities on the basis of access to new markets and technology, the enhancement of our production capacity, improvement of research and development capabilities, economies of scale and management resources, and closer proximity to existing and potential customers. The table below sets forth our recent major investments.
Year |
Investments | |
2020 |
· We set up a Vietnam-based subsidiary, UNIVERSAL SCIENTIFIC INDUSTRIAL VIETNAM COMPANY LIMITED, to fulfill international customer orders and strengthen supply chain management.
· We acquired 100% of FAFG to further enhance our manufacturing capabilities, expand our EMS customer base, and capture a wider range of opportunities throughout the product development life cycle. | |
2021 |
· We obtained 20.82% shareholdings in Chipletz, Inc., which was founded by experienced experts in chiplet technology. | |
2022 |
· We obtained 6.67% shareholdings in Questyle Audio Engineering Co., Ltd., to develop Ultra-wideband market.
· We obtained 49.00% shareholdings in MUtek Electronics Co., Ltd., to expand SiP business. |
On March 17, 2023, the board of director of USISH, resolved to establish a special purpose vehicle (“SPV”) by its wholly-owned subsidiary, Universal Global Technology Co., Limited (“UGT”), and an unrelated party, Ample Trading, Co., Ltd. (“Ample Trading”), through a joint venture agreement. UGT will obtain 75.1% ownership of the SPV and Ample Trading will obtain the remaining 24.9% ownership of the SPV. The SPV will acquire the automotive wireless business (“Target Business”) of an unrelated party, TE Connectivity Ltd. The transaction is subject to the approvals from the respective countries where the Target Business will operate in.
Continue to Leverage Our Presence in Key Centers of Semiconductor and Electronics Manufacturing
We intend to continue leveraging our presence in key centers of semiconductor and electronics manufacturing to further grow our business. We have significant packaging, testing, and EMS operations in Taiwan, currently one of the leading centers for outsourced semiconductor and electronics manufacturing in the world. This presence enables our engineers to work closely with our customers as well as wafer foundries and other providers of complementary semiconductors and EMS early in the design process, enhances our responsiveness to the requirements of our customers, and shortens production cycles. In addition, as a turnkey service provider, we are able to offer our products to our customers and complementary service providers within relatively close geographic proximity. Besides our current operations in Taiwan, we intend to expand our operations in our other subsidiaries.
34
In addition to Taiwan, we have primary operations in the following locations:
· | P.R.C. — a fast-growing market for semiconductor and electronics manufacturing; |
· | Korea — an important center for the manufacturing of memory and communications devices; |
· | Malaysia, Singapore, and Vietnam — each a center for outsourced semiconductor and electronics manufacturing in Southeast Asia; |
· | Silicon Valley in California — the preeminent center for semiconductor design, with a concentration of fabless customers; |
· | Japan — an emerging market for packaging and testing outsourcing services as Japanese integrated device manufacturers increasingly outsource their semiconductor manufacturing requirements; |
· | Mexico — a development and manufacturing center for electronic products across different industries with an auxiliary service depot to provide technical services; |
· | Africa — a strategic location for electronic components manufacturing and assembly; and |
· | Europe — an original equipment manufacturing solutions for the electronics industry. |
Strengthen and Develop Strategic Relationships with Our Customers and Providers of Complementary Semiconductor Manufacturing Services
We intend to strengthen existing and develop new strategic relationships with our customers and providers of complementary semiconductor manufacturing services, such as wafer foundries, as well as equipment vendors, raw material suppliers, and technology research institutes, in order to offer our customers total semiconductor manufacturing solutions covering all stages of the manufacturing process from design to shipment. In addition, we are working with our customers to co-develop new packaging technologies and designs.
Since 1997, we have maintained a strategic alliance with TSMC, which designates us as their non-exclusive preferred provider of packaging and testing services for semiconductors manufactured by TSMC. Through our strategic alliance with and close geographic proximity to TSMC, we are able to offer our customers a total semiconductor manufacturing solution that includes access to foundry services in addition to our packaging, testing, and direct shipment services.
Principal Products and Services
We offer a broad range of semiconductor packaging and testing services. In addition, we provide EMS through USI Group. Our package types generally employ either leadframes or substrates as interconnect materials. The semiconductors we package are used in a wide range of end-use applications, including communications, computing, consumer electronics, industrial, automotive, and other applications. Our testing services include front-end engineering testing, which is performed during and following the initial circuit design stage of the semiconductor manufacturing process, wafer probe, final testing, and other related semiconductor testing services. We focus on packaging and testing semiconductors. We offer our customers turnkey services, which consist of packaging, testing, and direct shipment of semiconductors to end users designated by our customers. Our EMS are used in a wide range of end-use applications, including, but not limited to, computing, peripherals, communications, industrial applications, automotive electronics, and server applications. In 2022, our revenues generated from packaging, testing, and EMS accounted for 45.3%, 8.3% and 45.0% of our operating revenues, respectively.
35
Packaging Services
We offer a broad range of package types to meet the requirements of our customers, including flip chip BGA, flip chip CSP, aCSP (advanced chip scale packages), quad flat packages (QFP), low profile and thin quad flat packages (LQFP/TQFP), bump chip carrier (BCC), quad flat no-lead (QFN) packages, aQFN (advanced QFN), and Plastic BGA. In addition, we provide 3D chip packages, such as aMAP POP (advanced, laser ablation type), which enable our customers to mount packages more easily, and HB PoP (High-Band package on Package) for higher performance orientation and marketing requirement. We also offer other forms of stacked die solutions in different package types, such as stacked die QFN, hybrid BGAs containing stacked wire bond, and FC die. Meanwhile, we are developing cost-effective solutions to 3D packages, such as FOCOS (Fan-out Chip-on-Substrate) and 2.5D (silicon interposer), to fulfill current low-cost and high-performance requirements in parallel with 3D IC with TSV (Through Silicon Via) technology. In addition, to meet current trends toward low-cost solutions, we provide copper wire bonding solutions which can be applied to traditional gold wire products. We also provide a high-volume manufacturing experience with silver wire bonding for FCCSP Hybrid packages. Furthermore, we are one of the key providers of IoT (Internet of Things), server and automotive services. We believe we are among the leaders in such packaging processes and technologies and are well positioned to lead the technology migration in the semiconductor packaging industry.
To address the new demands of 5G wireless technology, we survey new materials and structures based on developed package structures and focus our efforts on developing more integration solutions, such as Application Processor (AP) module and RF front end (RFFE) with customized SiP services.
Wirebonding. We provide wirebonding, including leadframe-based packages and substrate-based packages. Leadframe-based packages are packaged by connecting the die, using wire bonders, to the leadframe with gold wire or copper wire. As packaging technology improves, the number of leads per package increases. In addition, improvements in leadframe-based packages have reduced the footprint of the package on the circuit board and improved the electrical performance of the package. To have higher interconnected density and better electrical performance, semiconductor packages have evolved from leadframe-based packages to substrate-based packages. The key differences of these package types are the size of the package; the density of electrical connections the package can support; flexibility at lower costs; the thermal and electrical characteristics of the package; and environmentally conscious designs. Substrate-based packages generally employ the BGA design. Whereas traditional leadframe technology places the electrical connection around the perimeter of the package, the BGA package type places the electrical connection at the bottom of the package surface in the form of small bumps or balls. These small bumps or balls are typically distributed evenly across the bottom surface of the package, allowing greater distance between individual leads and higher pin-counts. Our expertise in BGA packages also includes capabilities in stacked-die BGA, which assembles multiple dies into a single package.
3D packaging has recently gained a lot of publicity because of the advent of Through Silicon Via (TSV)-based chip stacking. Chip stacking has been employed for many years, albeit without TSVs. Wire bond die is routinely stacked on leadframes as well as BGA substrates. A more recent implementation is the stacking of packages as package on package (PoP) and the more specialized package in package (PiP). We have advanced PoP by the invention of aMAPPoP which provides the package interconnects by exposing a molded in solder ball with a laser via. Aside from being cost-effective due to block molding, this PoP also has much lower warpage, greatly improving the stacking yield.
The following table sets forth our principal wirebonding packages.
Package Types |
Number of Leads |
Description |
End-Use Applications | |||
Advanced Quad Flat No-Lead Package (aQFN) | 104-276 | aQFN allows for leadless, multi-row, and fine-pitch leadframe packaging and is characterized by enhanced thermal and electrical performance. aQFN is a cost-effective packaging solution due to its cost-effective materials and simpler packaging process. | Telecommunications products, wireless local access networks, personal digital assistants, digital cameras, low to medium lead count packaging information appliances. | |||
Quad Flat Package (QFP)/Low 44-256 profile and Thin Quad Flat Package (LQFP/TQFP) | 44-256 | Designed for advanced processors and controllers, application-specific integrated circuits, and digital signal processors. | Multimedia applications, cellular phones, personal computers, automotive and industrial products, hard disk drives, communication boards such as ethernet, integrated services digital networks, and notebook computers. |
36
Package Types |
Number of Leads |
Description |
End-Use Applications | |||
Quad Flat No-Lead Package (QFN)/ Dual-Row QFN (DR-QFN)/ Microchip Carrier (MCC) | 8-176 | QFN/DRQFN, also known as types of MCC, uses half-encapsulation technology to expose the rear side of the die pad and the tiny fingers, which are used to connect the chip and bonding wire with printed circuit boards. Dual-Row is to increase the lead counts for product requirement. | Cellular phones, wireless local access networks, personal digital assistant devices, and digital cameras. | |||
Small Outline Plastic Package (SOP)/Thin Small Outline Plastic Package (TSOP) | 8-56 | Designed for memory devices including static random access memory, or SRAM, dynamic random access memory, or DRAM, fast static RAM, also called FSRAM, and flash memory devices. | Consumer audio/video and entertainment products, cordless telephones, pagers, fax machines, printers, copiers, personal computer peripherals, automotive parts, telecommunications products, recordable optical disks, and hard disk drives. | |||
Small Outline Plastic J-Bend Package (SOJ) | 20-44 | Designed for memory and low pin-count applications. | DRAM memory devices, microcontrollers, digital analog conversions, and audio/video applications. | |||
Plastic Leaded Chip Carrier (PLCC) | 28-84 | Designed for applications that do not require low-profile packages with high density of interconnects. | Personal computers, scanners, electronic games, and monitors. | |||
Plastic Dual In-line Package (PDIP) | 8-64 | Designed for consumer electronic products. | Telephones, televisions, audio/video applications, and computer peripherals. | |||
Plastic BGA | 119-1520 | Designed for semiconductors which require the enhanced performance provided by plastic BGA, including personal computer chipsets, graphic controllers and microprocessors, application-specific integrated circuits, digital signal processors, and memory devices. | Telecommunications products, global positioning systems, notebook computers, disk drives, and video cameras. | |||
Stacked-Die BGA | 120-1520 | Combination of multiple dies in a single package enables package to have multiple functions within a small surface area. | Telecommunications products, local area networks, graphics processor applications, digital cameras, and pagers. | |||
Package-on-Package (POP, aMAP POP) | 136-904 | This technology places one package on top of another to integrate different functionalities while maintaining a compact size. It offers procurement flexibility, low cost of ownership, better total system cost and faster time to market. Designers typically use the topmost package for memory applications and the bottommost package for ASICs. By using this technology, the memory known good die issue can be mitigated and the development cycle time and cost can be reduced. | Cellular phones, personal digital assistants, and system boards. |
37
Package Types |
Number of Leads |
Description |
End-Use Applications | |||
Land Grid Array (LGA) |
10-72 | Leadless package, which is essentially a BGA package without the solder balls. Based on laminate substrate, land grid array packages allow flexible routing and are capable of multichip module functions. | High-frequency integrated circuits such as wireless communications products, computers servers, personal computer peripherals, and MEMS sensors. |
Advanced Packages. The semiconductor packaging industry has evolved to meet the requirements of high-performance electronics products. We believe that there will continue to be growing demand for packaging solutions with increased input/output density, smaller size, and a better heat dissipation characteristic.
We have focused on developing our capabilities in certain packaging solutions, such as aCSP (wafer-level chip scale package), flip chip BGA, Heat-Spreader FCBGA, flip-chip CSP, Hybrid FCCSP (Flip Chip + W/B), Flip Chip PiP (Package in Package), Flip Chip PoP (Package on Package), aS3TM (Advanced Single Sided Substrate), HB POP (High-Bandwidth POP), Fan-Out Wafer-Level Packaging, SESUB, and 2.5D. Flip-chip BGA technology replaces wire bonding with wafer bumping for interconnections within the package. Wafer bumping involves the placing of tiny solder balls, instead of wires, on top of dies for connection to substrates. As compared with more traditional packages, which allow input/output connection only on the boundaries of the dies, flip chip or wafer-level package solutions significantly enhance the input/output flow by allowing input/output connections over the entire surface of the dies.
Chip scale packages typically have an area no greater than 120% of the silicon die. For wafer-level packages, the electrical connections are plated or printed directly onto the wafer itself, resulting in a package very close to the size of the silicon die. Wafer-level packages do not include an interposer so they are unlike substrate-based packages, where the die is usually mounted on an interposer, which contains electrical connections in the form of small bumps or balls.
Advance Embedded Assembly Substrate Integration (aEASI) is a technology which allows the embedding of thin chips into substrate build-up layers. aEASI can be used in various technologies tailored to clients’ demands, such as package solution of miniaturization, and has also been proven to have better electrical/thermal performance. It also provides flexibility in design (such as for MicroSiP), and the electrical contacts to the chips are realized by laser-drilled and metallized micro-vias to replace the traditional wire bonding process. aEASI is mainly used in power management applications.
Wafer-Level MEMs (WL MEMs) is an advanced assembly technology for MEMs in wafer-level types instead of current LGA or leadframe types using TSV or chip-to-wafer technology. WL MEMs are mainly used in applications such as pressure, temperature, humidity, and gyroscope sensors, among others.
Fan-Out Wafer-Level Packages (FOWLP) provide an extended solution and package type to integrate different functional chips or packages, a reduction in resistance and inductance over FCCSP, better thermal performance, and smaller form factors of packages. FOWLP can be applied for different stack and SiP solutions.
We provide numerous technologies to meet various customer demands. The following table sets forth our principal advanced packages.
Package Types |
Number of Leads |
Description |
End-Use Applications | |||
Wafer-Level Chip Scale Package (aCSP) | 4-792 | A wafer-level chip scale package that can be directly attached to the circuit board. Provides shortest electrical path from the die pad to the circuit board, thereby enhancing electrical performance. | Cellular phones, personal digital assistants, watches, MP3 players, digital cameras, and camcorders. |
38
Package Types |
Number of Leads |
Description |
End-Use Applications | |||
Flip Chip Scale Package (FC-CSP, a-fcCSP) | 16-1287 | A lightweight package with a small, thin profile provides better protection for chips and better solder joint reliability than other comparable package types. | RFICs and memory ICs such as digital cameras, DVDs, devices that utilize wireless technology, cellular phones, GPS devices, and personal computer peripherals. | |||
Flip Chip PiP (Package in Package) (FC-CSP PiP) | 500-980 | System-in-Package for Flip Chip + Memory known good package inside with better electrical performance package types. | Application processor for smartphone and data modem on portable devices. | |||
Flip Chip PoP (Package on Package) (FC-CSP PoP) | 500-1300 | SoC (System-on-Chip) die for Assembly to Bottom package and then applied for memory package on top inside with better electrical performance package types. | High-tier application processor for smartphones and data modem on portable devices. | |||
Flip Chip BGA/ HF FCBGA(High Performance / Heat Spreader / FCBGA) | 16-5475 | Using advanced interconnect technology, the flip chip BGA packages allow higher density of input/output connection over the entire surface of the dies. HF FCBGA is designed for the semiconductor high-performance requirement of high density of interconnects. | High-performance networking, graphics, server, and data center processor applications. | |||
Hybrid (Flip Chip and Wire Bonding) | 49-608 | A package technology that stacks a die on top of a probed good die to integrate ASIC and memory (flash, SRAM, and DDR) into one package and interconnects them with wire bonding and molding. This technology suffers from known good die issues (i.e., one bad die will ruin the entire module). Rework is also not an option in hybrid packages. | Digital cameras, smartphones, bluetooth applications, and personal digital assistants. | |||
aS3 | up to 300 | Ultra-thin profile package which is an excellent middle pin-count alternative solution; standard BT material and manufacturing equipment; and lower cost via on pad. | High I/O and short wire length package solution in high-performance requirement. | |||
Integrated Passive Device (IPD) | ~ 20 | IPD can provide a high-performance/high Q-factor inductor and single/double layers for lower cost and turnkey solutions and integrate passives into one IPD chip. IPD requires less involvement in the Surface Mount Technology (the “SMT”) process and is considered to be more compatible with current assembly process and suitable for all package solutions. | Cellular phones, Wi-Fi module, TV, and personal digital assistants. |
39
Package Types |
Number of Leads |
Description |
End-Use Applications | |||
HBPoP (High-Bandwidth Package On Package) | ~ 1300 | High-Bandwidth POP can provide a data rate and good signal integrity for Cellular AP, an integration solution for ASIC and memory, decoupling functions for multiple memory mount applications. | Cellular phones and application processors. | |||
FOWLP (Fan-Out Wafer-Level Package) | ~ 1,500+ | FOWLP provides an extended solution/package type to integrate most different functional chips or packages and to have good reduction in resistance and inductance over FCCSP, better thermal performance and smaller form factors of packages, and can be applied for different stack or SiP solutions. | Cellular phones, logic devices, power management, RF, Codec, IoT, wearables, and networking. |
Heterogeneous Integration. Heterogeneous Integration refers to the integration of separately manufactured components into a higher-level assembly that, in the aggregate, provides enhanced functionality and improved operating characteristics:
· | SiP and Modules. |
The drive towards semiconductor miniaturization and integration is expanding the commercial potential of SiP, a package or module containing a functional electronic system or subsystem that is integrated and miniaturized through IC greater assembly technologies. With attributes that deliver higher performance, cost-effectiveness, and shorter time to market, SiP technology is enabling functionality and creating more commercial opportunities across a broader variety of electronics applications.
ASEH is a market leader in SiP technologies from design to assembly and high-volume manufacturing. SiP involves the integration of multiple components from IC chips and components including ASICs, Memory, Analog & mixed signals devices, passives, MEMs, sensors, antennas, and other devices into one single package. SiP and Modules products are gaining significant traction within the industry, given growing demand for miniaturized electronic devices that deliver more functions and higher performance, lower power, greater speed, and increased bandwidth. ASEH’s SiP portfolio includes flip chip and wirebond multichip packaging, embedding technologies such as SESUB and aEASI, and wafer-level technologies including fan-out and IPD. IPD uses a wafer-level process to integrate passive components on an individual substrate. Recent IPD innovation involves the extension of the RDL (Redistribution) process to build a high-quality factor (Q) inductor and RF circuits on top of silicon wafers. It can be used in the following three approaches to enhance product performance: 1) replace discrete components such as Balun and Filter, 2) integrate other passive components and act as interposer, and 3) replace PWB and act as a substrate of the module. In addition, we leverage some of our SMT-based technologies, such as compartment shielding, double-sided module, and antenna integration.
We also offer module assembly services, which combine one or more packaged semiconductors with other components in an integrated module to enable increased functionality for system-level assembly. End-use applications for modules include cellular phones and wireless LAN applications, Bluetooth applications, camera modules, automotive applications, toys, networking, storage, and power management.
· | Fan-Out. |
Fan-out packaging continues to gain prominence within the industry, based on significant technical advantages that have led to its broad commercialization. This advanced packaging platform is evolving to meet application demands for smaller form factors and improved electrical and thermal performance.
With the packaging done on singulated die formed into a reconstituted molded wafer or panel, fan-out packaging enables multi-die packages, through partitioning with different nodes and functionality. Fan-out can be done either chip first or chip last, with both options resulting in much higher-density interconnect and improved cost efficiency. Initially fan-out was used primarily for smaller, lower I/O count packages, until we introduced a very high-density fan-out alternative to 2.5D Interposer packages, Fan-out Chip on Substrate (FOCoS), a hybrid fan-out/FCBGA package. Today, fan-out is used in high-volume applications for a wide variety of products, including PMICs, RF packages, Baseband processors, and high-end networking systems. Key attributes include:
· | Parallel Manufacturing Process in Wafer Form; |
40
· | Smallest Package in X, Y and Z; and |
· | Excellent Mechanical, Electrical, and Thermal Performance. |
· | 2.5D and 3D Packaging. |
As 5G, AI, and high-performance computing continue to make inroads on a global basis, we believe there is an increased demand for semiconductor devices that deliver enhanced performance, lower latency, increased bandwidth, and greater power efficiency. ASEH strives to meet this demand by innovating 2.5D and 3D technologies that we believe are becoming more central within the semiconductor industry. We have established ourselves as a leader in 2.5D technology through our successful pioneering of 2.5D solutions that helped bring advanced ASIC and HBM products to the marketplace. In addition, ASEH is introducing high-density fan-out technology for multi-die solutions to achieve high bandwidth and high-performance across the market landscape, addressing demand from high density data centers to consumer and mobile spaces.
Automotive Electronics. We assemble automotive electronic products based on our leading technology, good quality systems, and automation. We provide a variety of products, such as leadframe base, substrate base, Flip Chip, and Wafer-Level packages. We also provide robust package solutions to customers and end-users, including most types of industrial package solutions together with tailor-made solutions to meet customers’ and end-users’ requirements for automotive specifications.
Having accumulated production experience in using gold wire for automotive devices over several years, we collaborate with certain customers to develop and release copper wire for advanced wafer process (40nm for QFP and 40 nm for BGA) development that will fulfill criteria in AEC-Q100 and under development of the 28 nm wafer process with variety packaging structure. In addition, we offer the FOWLP solution for radar products according to requests from some tier 1 customers.
Interconnect Materials. Interconnect materials connect the input/output on the semiconductor dies to the printed circuit board. Interconnect materials include substrate, which is a multilayer miniature printed circuit board, and is an important element of the electrical characteristics and overall performance of semiconductors. We produce substrates for use in our packaging operations.
The demand for higher-performance semiconductors in smaller packages will continue to spur the development of IC substrates that can support the advancement in circuit design and fabrication. As a result, we believe that the market for substrates will grow and the cost of substrates as a percentage of the total packaging process will increase. In the past, substrates we designed for our customers were produced by independent substrate manufacturers. Since 1997, we have been designing and producing a portion of our interconnect materials in-house. In 2022, our interconnect materials operations supplied approximately 8.5% of our consolidated substrate requirements by value.
The following table sets forth, for the periods indicated, the percentage of our packaging revenues accounted for by each principal type of packaging products or services.
Year Ended December 31, | ||||||||||||
2020 | 2021 | 2022 | ||||||||||
Bumping, Flip Chip, WLP, and SiP |
42.3% | 41.2% | 50.5% | |||||||||
Wirebonding(1) |
46.8% | 48.5% | 41.6% | |||||||||
Discrete and other |
10.9% | 10.3% | 7.9% | |||||||||
|
|
|
|
|
|
|||||||
Total |
100.0% | 100.0% | 100.0% | |||||||||
|
|
|
|
|
|
(1) | Includes leadframe-based packages such as QFP/TQFP, QFN/MCC and PLCC/PDIP and substrate-based packages, such as various BGA package types and LGA. |
41
Testing Services
We provide a complete range of semiconductor testing services, including front-end engineering testing, wafer probing, final testing of logic/mixed-signal/RF/(2.5D/3D) packages and SiP/MEMS/Discrete modules, and other test-related services.
The testing of semiconductors requires technical expertise and knowledge of the specific applications and functions of the semiconductors tested as well as the testing equipment utilized. We believe that our testing services employ technology and expertise which are among the most sophisticated in the semiconductor industry. In addition to maintaining different types of testing equipment, which enables us to test a variety of semiconductor functions, we work closely with our customers to design effective testing solutions on multiple equipment platforms for particular semiconductors.
In recent years, complex, high-performance logic/mixed-signal/RF/(2.5D/3D) packages and SiP/MEMS modules have accounted for an increasing portion of our testing revenues.
Front-End Engineering Testing. We provide front-end engineering testing services, including customized software development, electrical design validation, and reliability and failure analysis.
· | Customized Software Development. Test engineers develop customized software to test the semiconductors using our equipment. Customized software, developed on specific test platforms, is required to test the conformity of each particular semiconductor type to its unique functionality and specification. |
· | Electrical Design Validation. A prototype of the designed semiconductor is subjected to electrical tests using advanced test equipment and customized software. These tests assess whether the prototype semiconductor complies with a variety of different operating specifications, including functionality, frequency, voltage, current, timing, and temperature range. |
· | Reliability Analysis. Reliability analysis is designed to assess the long-term reliability of the semiconductor and its suitability of use for intended applications. Reliability testing can include “burn-in” services, which electrically stress a device, usually at high temperature and voltage, for a period of time long enough to cause the failure of marginal devices. |
· | Failure Analysis. In the event that the prototype semiconductor does not function to specifications during either the electrical design validation or reliability testing processes, it is typically subjected to failure analysis to determine the cause of the failure to perform as anticipated. As part of this analysis, the prototype semiconductor may be subjected to a variety of analyses of electrical testing. |
Wafer Probing. Wafer probing is the step immediately before the packaging of semiconductors and involves visual inspection and electrical testing of the processed wafer for defects to ensure that it meets our customers’ specifications. Wafer probing services require expertise and testing equipment similar to that used in final testing, and most of our testers can also be used for wafer probing.
Logic/Mixed-signal/RF/(2.5D/3D) Module and SiP/Discrete Final Testing. We conduct final tests of a wide variety of logic/mixed-signal/RF/(2.5D/3D) packages and SiP/MEMS/discrete modules, with the number of leads or bumps ranging from the single digits to over 30 thousand and operating frequencies of over 32 Gbps for digital semiconductors and mmWave for 5G semiconductors, which are at the high end of the range for the industry. The products we test include applications for wired, wireless, and mobile communications, automotive, home entertainment, IoT, personal computer, artificial intelligence, and high-performance computing applications, as well as a variety of consumer and application-specific integrated circuits for various specialized applications.
Other Test-Related Services. We provide a broad range of additional test-related services, such as:
· | Electric Interface Board and Mechanical Test Tool Design. Process of designing individualized testing apparatuses such as test load boards, sockets, handler change kits, and probe cards for unique semiconductor devices and packages. |
42
· | Program Conversion. Process of converting a program from one-test platform to different test platforms to reduce testing costs or optimize testing capacity. |
· | Program Efficiency Improvement. Process of optimizing the program code or increasing site count of parallel tests to improve testing throughout. |
· | Burn-In Testing. Burn-in testing is the process of electrically stressing a device, usually at high temperature and voltage, for a period of time to simulate the continuous use of the device to determine whether this use would cause the failure of marginal devices. |
· | Module and SiP Testing. We provide module and SiP testing through an integrated bench solution or automatic test equipment to our customers with a complete solution with respect to fingerprint sensor module, camera module, 3D depth sensing module, wireless connectivity devices, global positioning system devices, personal navigation devices, digital video broadcasting devices, RF front end devices, and 5G AiPs. |
· | Tape and Reel. Process which involves transferring semiconductors from a tray or tube into a tape-like carrier for shipment to customers. |
Drop Shipment Services. We offer drop shipment services for shipment of semiconductors directly to end users designated by our customers. Drop shipment services are provided mostly in conjunction with logic/mixed-signal/RF/3D IC/discrete testing. We provide drop shipment services to a significant percentage of our testing customers. A substantial portion of our customers at each of our facilities have qualified these facilities for drop shipment services. Since drop shipment eliminates the additional step of inspection by the customer before shipment to the end user, quality of service is a key consideration. We believe that our ability to successfully execute our full range of services, including drop shipment services, is an important factor in maintaining existing customers as well as attracting new customers.
The following table sets forth, for the periods indicated, the percentage of our testing revenues accounted for by each type of testing service.
Year Ended December 31, | ||||||||||||
2020 | 2021 | 2022 | ||||||||||
Front-end engineering testing |
2.0% | 2.0% | 1.8% | |||||||||
Wafer probing |
31.8% | 33.5% | 38.6% | |||||||||
Final testing |
66.2% | 64.5% | 59.6% | |||||||||
|
|
|
|
|
|
|||||||
Total |
100.0% | 100.0% | 100.0% | |||||||||
|
|
|
|
|
|
EMS
We provide integrated solutions for EMS in relation to computing, peripherals, communications, industrial, automotive, and server applications through USI Group. The key products and services we offer to our customers include:
· | Computing: motherboards for server and desktop PCs; peripherals; port replicators; network attached systems; solid state drives; |
· | Communications: Wi-Fi; SiP; |
· | Consumer products: control boards for flat panel devices; SiP; |
· | Automotive electronics: automotive EMS; car LED lighting; regulators/rectifiers; |
· | Industrial products: point-of-sale systems; smart handheld devices; and |
· | Others: field replacement units; return material authorization. |
43
Seasonality
See “Item 5. Operating and Financial Review and Prospects—Operating Results—Quarterly Operating Revenues, Gross Profit and Gross Margin.”
Sales and Marketing
Sales and Marketing Presence
We maintain sales and marketing offices in Taiwan, the U.S., Belgium, Singapore, the P.R.C., Korea, Malaysia, Japan, and a number of other countries. We also have sales representatives operating in certain other countries in which we do not have offices. Our sales and marketing offices in Taiwan are located in Hsinchu, Taichung and Kaohsiung. We conduct marketing research through our customer service personnel and through our relationships with our customers and suppliers we endeavor to keep abreast of market trends and developments. We also provide advice on production process technology to our major customers planning the introduction of new products. When placing orders, our customers specify which of our facilities will receive the order. Our customers conduct separate qualification and correlation processes for each of our facilities that they use. See “—Qualification and Correlation by Customers.”
Customers
Our five largest customers together accounted for approximately 54.5%, 49.6% and 50.2% of our operating revenues in 2020, 2021 and 2022, respectively. One customer accounted for more than 10.0% of our operating revenues in 2020, 2021 and 2022.
The U.S. Bureau of Industry and Security (the “US BIS”) added Huawei and its affiliates to the entity list under the Export Administration Regulation (the “EAR”), published on August 20, 2020. As of September 15, 2020, we were no longer allowed to do business directly or indirectly with Huawei and its affiliates. HiSilicon, a Huawei affiliate, was one of our top customers during the first half of 2020; and, as a result, this US BIS action adversely affected our results of operations. Further, because of the EAR, we had unusable raw materials and reduced loading on our capitalized equipment, which resulted in an inventory write-off and an impairment loss to other operating expense during the third quarter of 2020.
We package and test for our customers a wide range of products with end-use applications in the communications, computing, and consumer electronics/industrial/automotive sectors. The following table sets forth a breakdown of the percentage of our operating revenues generated from our packaging and testing services, for the periods indicated, by the principal end-use applications of the products that were packaged and tested.
Year Ended December 31, | ||||||||||||
2020 | 2021 | 2022 | ||||||||||
Communications |
53.3% | 50.1% | 52.6% | |||||||||
Computing |
14.1% | 14.9% | 15.8% | |||||||||
Consumer electronics/industrial/automotive/other |
32.6% | 35.0% | 31.6% | |||||||||
|
|
|
|
|
|
|||||||
Total |
100.0% | 100.0% | 100.0% | |||||||||
|
|
|
|
|
|
Our EMS provide a wide range of products with end-use applications. The following table sets forth a breakdown of the percentage of our operating revenues generated from our EMS for the periods indicated by the principal end-use applications.
Year Ended December 31, | ||||||||||||
2020 | 2021 | 2022 | ||||||||||
Communications |
42.5% | 38.4% | 37.3% | |||||||||
Computing |
8.0% | 8.8% | 10.2% | |||||||||
Consumer electronics |
36.2% | 33.6% | 32.0% | |||||||||
Industrial |
9.1% | 13.0% | 12.8% | |||||||||
Automotive |
3.6% | 4.7% | 6.6% | |||||||||
Other |
0.6% | 1.5% | 1.1% | |||||||||
|
|
|
|
|
|
|||||||
Total |
100.0% | 100.0% | 100.0% | |||||||||
|
|
|
|
|
|
44
We categorize our operating revenues geographically based on the country in which the customer is headquartered. The following table sets forth, for the periods indicated, the percentage breakdown by geographic regions of our operating revenues.
Year Ended December 31, | ||||||||||||
2020 | 2021 | 2022 | ||||||||||
U.S. |
62.3% | 62.0% | 66.5% | |||||||||
Taiwan |
13.6% | 16.6% | 12.5% | |||||||||
Asia |
15.6% | 11.0% | 11.3% | |||||||||
Europe |
8.3% | 10.2% | 9.5% | |||||||||
Other |
0.2% | 0.2% | 0.2% | |||||||||
|
|
|
|
|
|
|||||||
Total |
100.0% | 100.0% | 100.0% | |||||||||
|
|
|
|
|
|
Qualification and Correlation by Customers
Customers generally require that our facilities undergo a stringent qualification process during which the customer evaluates our operations and production processes, including engineering, delivery control, and testing capabilities. The qualification process typically takes up to several weeks but can take longer depending on the requirements of the customer. In the case of our testing operations, after we have been qualified by a customer and before the customer delivers semiconductors to us for testing in volume, a process known as correlation is undertaken. During the correlation process, the customer provides us with sample semiconductors to be tested and either provides us with the test program or requests that we develop a conversion program. In some cases, the customer also provides us with a data log of results of any testing of the semiconductors that the customer may have conducted previously. The correlation process typically takes up to two weeks but can take longer depending on the requirements of the customer. We believe our ability to provide turnkey services reduces the amount of time spent by our customers in the qualification and correlation process. As a result, customers utilizing our turnkey services are able to achieve shorter production cycles.
Pricing
We price our packaging services and EMS by taking into account the actual costs and prevailing market prices. We price our testing services primarily on the basis of the amount of time, measured in central processing unit seconds, taken by the automated testing equipment to execute the test programs specific to the products being tested, as well as the cost of the equipment, with additional consideration of prevailing market prices. Prices for our packaging, testing, and EMS are confirmed at the time orders are received from customers, which is typically several weeks before delivery.
Raw Materials and Suppliers
Packaging
The principal raw materials used in our packaging processes are interconnect materials such as leadframes and substrates, gold wire, and molding compound. The silicon die, which is the functional unit of the semiconductor to be packaged, is supplied in the form of silicon wafers. Each silicon wafer contains a number of identical dies. We receive the wafers from customers or foundries on a consignment basis. Consequently, we generally do not incur inventory costs relating to the silicon wafers used in our packaging process.
We do not maintain large inventories of leadframes, substrates, gold wire, or molding compound, but generally maintain sufficient stock of each principal raw material based on blanket orders and rolling forecasts of near-term requirements received from customers. In addition, several of our principal suppliers dedicate portions of their inventories as reserves to meet our production requirements. However, shortages in the supply of materials experienced by the semiconductor industry have in the past resulted in occasional price adjustments and delivery delays. In order to reduce adverse impacts caused by the price fluctuations of raw materials, we have developed substitute raw materials, such as copper wire, which costs much less than gold wire. However, we cannot guarantee that we will not experience shortages or price increases in the near future, or that we will be able to obtain adequate supplies of raw materials in a timely manner and at a reasonable price or to develop any substitute raw materials. In the event of a shortage and/or price increase, we generally inform our customers and work together to accommodate changes in delivery schedules and/or the price increase of raw materials.
45
We produce substrates for use in our packaging operations. In 2022, our interconnect materials operations supplied approximately 8.5% of our consolidated substrate requirements by value. See “—Principal Products and Services—Interconnect Materials.”
In response to RoHS, we have adjusted our purchases of raw materials and our production processes in order to use raw materials that comply with this legislation for part of our production. This legislation restricts the use in the EU of certain substances that the EU deems harmful to consumers including certain grades of molding compounds, solder, and other raw materials that are used in our products. Manufacturers of electrical and electronic equipment must comply with this legislation in order to sell their products in an EU member state. Any failure by us to comply with regulatory environmental standards such as RoHS and REACH may have a material adverse effect on our results of operations.
Testing
For the functional and burn-in testing of semiconductors, no other raw materials are needed. However, we often design and outsource the manufacturing of test interface products such as load boards, probe cards, and burn-in boards.
EMS
Our manufacturing processes use many raw materials. For 2022, raw materials costs accounted for 80.9% of our operating revenues from EMS. Our principal raw materials include, among others, printed circuit boards, integrated chips, ink, semiconductor devices, computer peripherals, and related accessories and electronic components. Our principal raw materials varied in the past, depending on the end-use products provided.
To ensure quality, on-time delivery and pricing competitiveness, we have established both a standardized supplier assessment system and an evaluation mechanism, continued to maintain close working relationships with our suppliers, and jointly created a stable and sustainable supply chain. In addition, we adjusted the procurement strategy in line with industry trends as well as the nature of raw materials, and decentralized the sources of raw materials to lower our supply concentration risk. However, we cannot ensure that we will not experience any shortages or price increases in the near future. See “Item 3. Key Information—Risk Factors—Risks Relating to Our Business—Our revenues and profitability may decline if we are unable to obtain adequate supplies of raw materials in a timely manner and at a reasonable price.”
Equipment
Packaging
The wire bonding process is important for routing the signal out of die to the system for the IC wire-bonding solutions. Thus, wire bonder is the important equipment used for such process. As products become finer and finer pitch, the bumping process will replace the wire bonding process for the signal routing purpose. Thus, sputter and plater will be the crucial equipment for this type of process.
Wire bonders connect the input/output terminals on the silicon die using extremely fine gold or copper wire to leads on leadframes or substrates. Typically, a wire bonder may be used, with minor modifications, for the packaging of different products. As of January 31, 2023, we operated an aggregate of 25,859 wire bonders, of which 25,284 were fine-pitch wire bonders. As of the same date, 13 of the wire bonders operated by us were consigned by customers. For the packaging of certain types of substrate-based packages, die bonders are used in place of wire bonders. The number of bonders at a given facility is commonly used as a measure of the packaging capacity of the facility. In addition to bonders, we maintain a variety of other types of packaging equipment, such as wafer grinds, wafer mounts, wafer saws, heat sink placement, automated molding machines, laser markers, solder plates, pad printers, dejunkers, trimmers, formers, substrate saws, and scanners. We purchase our packaging equipment from major international manufactures, including Hanmi Semiconductor Co., Ltd., Besi Singapore Pte.Ltd., DISCO Corporation, TOWA Corporation, and All Ring Tech Co., Ltd.
46
Testing
Testing equipment is the most capital-intensive component of the testing process. We generally seek to purchase testers from different suppliers with similar functionality and acquire the ability to test a variety of different semiconductors. We purchase testers from major international manufacturers, including Teradyne, Inc., Advantest Corporation, Aircare Engineering Corp., Qualcomm Semiconductor Limited, and Hon Precision, Inc. Upon acquisition of new testers, we install, configure, calibrate, perform burn-in diagnostic tests on, and establish parameters for the testers based on the anticipated requirements of existing and potential customers and considerations relating to market trends. As of January 31, 2023, we operated an aggregate of 5,378 testers, of which 2,167 were consigned by customers and 3 were leased. In addition to testers, we maintain a variety of other types of testing equipment, such as automated handlers and probers (special handlers for wafer probing), scanners, reformers, and computer workstations for use in software development. Each tester may be attached to a handler or prober. Handlers attach to testers and transport individual packaged semiconductors to the tester interface. Probers similarly attach to the tester and align each individual die on a wafer with the interface to the tester.
For the majority of our testing equipment, we typically base our purchases on prior discussions with our customers about their forecast requirements. The balance consists of testing equipment on consignment from customers, which is dedicated exclusively to the testing of these customers’ specific products.
Test programs, which consist of the software that drives the testing of specific semiconductors, are written for a specific testing platform. We sometimes perform test program conversions that enable us to test semiconductors on multiple test platforms. This portability between testers enables us to allocate semiconductors tested across our available test capabilities and thereby improve capacity utilization rates. In cases where a customer requires the testing of a semiconductor product that is not yet fully developed, the customer may provide computer workstations to us to test specific functions. In cases where a customer has specified testing equipment that was not widely applicable to other products that we test, we have required the customer to furnish the equipment on a consignment basis.
EMS
The SMT assembly line is the key facility of our electronic manufacturing operations and generally includes a printer and one or two high-speed mounters and/or a multifunction mounter. The SMT assembly process primarily consists of the following three manufacturing steps: (i) solder paste stencil printing, (ii) component placement, and (iii) solder reflow. High-speed SMT assembly systems offer both economic and technical advantages that may reduce both production cost and time while meeting quality requirements. Thus, SMT has become the most popular assembly method for sophisticated electronic devices. We had 230 SMT lines as of January 31, 2023.
Intellectual Property
As of January 31, 2023, we held 2,284 Taiwan patents, 1,914 U.S. patents, 1,858 P.R.C. patents, 13 Europe patents, and 30 patents in other countries related to various semiconductor packaging technologies and invention, utility, and design on our EMS. In addition, as of January 31, 2023, we had a total of 1,864 pending patent applications, 178 in Taiwan, 515 in the U.S., 1,153 in the P.R.C., 13 in Europe, and 5 in other countries. Moreover, we filed several trademarks applications in Taiwan, the U.S., the P.R.C., and the EU. For example, “ASE,” “aCSP,” “a-EASI,” “a-fcCSP,” “aQFN,” “a-QFN,” “a-S3, “ “a-TiV,” “aWLP,” “a-WLP,” “iSiP,” “iWLP,” “aSiM,” “SiP-id” “SPIL,” “HSiP,” “XnBay” and “Emerald” have been registered in Taiwan.
We have also entered into various non-exclusive technology license agreements with other companies involved in the semiconductor manufacturing process, including Infineon Technologies AG, TDK Corporation, and DECA Technologies Inc. The technology we license from these companies includes solder bumping, redistribution, ultra CSP assembly, advanced QFN assembly, wafer-level packaging, and other technologies used in the production of package types, such as BCC, flip chip BGA, film BGA, aQFN, and chip embedding. One of our license agreements with Infineon Technologies AG will remain in effect until expiration of the patents licensed by the agreement, and the other automatically renews each year unless the parties to the agreement agree otherwise. Our license agreement with TDK Corporation will remain in effect until expiration of the TDK’s patents licensed by the agreement. Our license agreement with DECA will expire on January 13, 2026.
47
In addition, we improve our technological platform by licensing innovative package technologies. For example, through wafer bumping and redistribution technology, we are able to form and redistribute bumps on the chip to make a silicon die by directly attaching the substrate using bumps rather than wire bonding, and through wafer level CSP technology, we are able to produce a chip scale package at the stage of wafer level.
Our success depends in part on our ability to obtain, maintain, and protect our patents, licenses, and other intellectual property rights, including rights under our license agreements with third parties.
Quality Control
We believe that our process technology and reputation for high quality and reliable services have been important factors in attracting and retaining leading international semiconductor companies as customers of our services and/or products. We maintain a quality control staff at each of our facilities. Our quality control staff typically includes engineers, technicians, and other employees who monitor the processes in order to ensure high quality. Our quality assurance systems impose strict process controls, statistical in-line monitors, supplier control, data review and management, quality controls, and corrective action systems. Our quality control employees operate quality control stations along production lines, monitor clean room environments, and follow up on quality through outgoing product inspection and interaction with customer service staff. We have established quality control systems that are designed to ensure high-quality products/service to customers, hightesting reliability, and high production yields at our facilities. We also have established an environmental management system in order to ensure that we can comply with the environmental standards of our customers and the countries within which they operate. See “—Raw Materials and Suppliers—Packaging.” In addition, our facilities have been qualified by all of our major customers after satisfying stringent quality standards prescribed by these customers.
Our packaging and testing operations are undertaken in clean rooms where air purity, temperature, and humidity are controlled. To ensure stability and integrity of our operations, we maintain clean rooms at our facilities that meet U.S. Federal Standard 209E class 1,000, 10,000 and 100,000 standards.
ISE Labs’ testing facilities in Fremont, California are considered suitably equipped by the Defense Logistics Agency to perform the MIL-STD-883 tests on monolithic microcircuits in accordance with the requirements of military specification MIL-PRF-38535.
We have also obtained many certifications on our packaging, testing, and interconnect materials facilities. Some of these certifications are required by some semiconductor manufacturers as a threshold indicator of a company’s quality control standards or by many countries in connection with sales of industrial products. The table below sets forth the main certifications we have for our packaging, testing and interconnect materials.
Location |
IATF 16949 (1) |
ISO 9001(2) |
ISO 14001(3) |
ISO 17025(4) |
ISO 14064-1 (5) |
ISO 14067(6) |
IECQ HSPM QC 080000(7) |
Sony Green Partner(8) |
OHSAS 18001/ ISO 45001(9) |
TOSHMS(10) |
ISO 50001 (11) |
ISO 13485 (12) |
ISO 28000 (13) |
ISO 26262(14) |
ISO 15408- EAL6 (15) |
TL 9000(16) |
ISO 22301(17) |
RBA Edition (18) |
ISO/IEC 27001(19) |
GSMA- SAS for UICC Production (20) |
ISO 46001(21) |
ISO 21434 (22) |
IEC 62443-2-1 (23) | |||||||||||||||||||||||
Taiwan |
✓ | ✓ | ✓ | ✓ | ✓ | ✓ | ✓ | ✓ | ✓ | ✓ | ✓ | ✓ | ✓ | ✓ | ✓ | ✓ | ✓ | ✓ | ✓ | ✓ | ✓ | ✓ | ✓ | |||||||||||||||||||||||
P.R.C. |
✓ | ✓ | ✓ | ✓ | ✓ | ✓ | ✓ | ✓ | ✓ | ✓ | ✓ | ✓ | ✓ | |||||||||||||||||||||||||||||||||
Korea |
✓ | ✓ | ✓ | ✓ | ✓ | ✓ | ✓ | ✓ | ✓ | |||||||||||||||||||||||||||||||||||||
Japan |
✓ | ✓ | ✓ | ✓ | ✓ | ✓ | ✓ | |||||||||||||||||||||||||||||||||||||||
Malaysia |
✓ | ✓ | ✓ | ✓ | ✓ | ✓ | ✓ | ✓ | ||||||||||||||||||||||||||||||||||||||
Singapore |
✓ | ✓ | ✓ | ✓ | ✓ | ✓ | ✓ | ✓ | ||||||||||||||||||||||||||||||||||||||
U.S. |
✓ | ✓ | ✓ | ✓ |
(1) | IATF 16949 standards were originally created by the International Automotive Task Force in conjunction with the International Standards Organization (ISO). These standards provide for continuous improvement with an emphasis on the prevention of defects and reduction of variation and waste in the supply chain. |
(2) | ISO 9001 quality standards are related to quality management systems and designed to help organizations ensure that they meet the needs of customers and other stakeholders while meeting statutory and regulatory requirements related to the product. |
(3) | ISO 14001 sets out the criteria for an environmental management system. It can be used by any organization that wants to improve resource efficiency, reduce waste and drive down costs. |
(4) | ISO 17025 is the main ISO standard used by testing and calibration laboratories. |
(5) | ISO 14064-1 standard provides governments, businesses, regions and other organizations with a complementary set of tools for programs to quantify, monitor, report and verify greenhouse gas emissions. |
(6) | ISO 14067 is a standard for the quantification and communication of the carbon footprint of a product based on International Standards on life cycle assessment for quantification and on environmental labels and declarations for communication. |
(7) | IECQ HSPM QC080000 is a certification designed to manage, reduce and eliminate hazardous substances. |
48
(8) | “Sony Green Partner” indicates our compliance with the “Sony Green Package” standard requirements. |
(9) | ISO 45001 is a standard for an occupational health and safety management system that gives guidance for organizations to provide safe and healthy workplaces by preventing work-related injury and ill health and proactively improving its occupational health and safety performance. It replaced OHSAS 18001 over three years following its publication in March 2018. |
(10) | TOSHMS is the Taiwan Occupational and Health Management System. |
(11) | ISO 50001 is a standard for an energy management system. It can be used by any organization that wants to reduce energy costs and use energy more efficiently. |
(12) | ISO 13485 quality management system sets forth the quality requirements for organizations that are required to consistently meet customers’ requirements and regulatory requirements in the medical devices and related services industry. |
(13) | ISO 28000 is a standard for security management system dealing with security assurance in a supply chain. |
(14) | ISO 26262 is a standard for functional safety of electrical and electronic systems in production automobiles. |
(15) | ISO 15408-EAL6 is a framework that outlines the criteria for globally recognized standards and security inspections for IT products. It is designed for products and applications that are targeted for high-security-intensive markets, such as the government, banking, or defense sector. |
(16) | TL 9000 quality management system sets forth the supply chain quality requirements of the global communications industry. |
(17) | ISO 22301 is a standard for requirements to plan, establish, implement, operate, monitor, review, maintain and continually improve a documented management system to protect against, reduce the likelihood of occurrence, prepare for, respond to, and recover from disruptive incidents when they arise. |
(18) | The Responsible Business Alliance (RBA) is the world’s largest industry coalition dedicated to corporate social responsibility in global supply chains. |
(19) | ISO/IEC 27001 is a standard for information security. |
(20) | The GSMA Security Accreditation Scheme (SAS) for Universal Integrated Circuit Card (UICC) Production is a scheme through which UICC suppliers subject their production sites to a comprehensive security audit which ensures that UICC suppliers have implemented adequate security measures to protect the interests of mobile network operators. |
(21) | ISO 46001 is a standard for water resource management. |
(22) | ISO 21434 is a standard for engineering requirements for cybersecurity risk management. |
(23) | IEC 62443-2-1 is a standard to establish an industrial automation and control system security program |
We also have strict process controls in our EMS business. UGTW’s facilities in Nantou, Taiwan, are considered suitably equipped by the Defense Logistics Agency to perform the MIL-STD-883 tests on assemble, seal, and test hybrid microcircuits in compliance with MIL-PRF-38534 Classes H and K. USIPL is in compliance with VDA 6.3 audit, which focuses on process audit for planning and manufacturing of products and services, and VDA 6.5, which is a qualification for product audit. The table below sets forth the certifications we have obtained for our EMS facilities.
Location |
IATF 16949 |
ISO 9001 |
ISO 14001 |
ISO 17025 |
ISO 14064-1 |
ISO 14067 |
IECQ HSPM QC 080000 |
IS 45001 |
TOSHMS |
ISO 50001 |
ISO 13485 |
ISO 22301 |
ISO 26262 |
TL 9000 |
RBA Edition |
ISO 21434 |
ISO/IEC 27001 |
AS/EN 9100: 2016(1) |
IRIS ISO/TS 22163(2) | |||||||||||||||||||
Taiwan |
✓ | ✓ | ✓ | ✓ | ✓ | ✓ | ✓ | ✓ | ✓ | ✓ | ✓ | ✓ | ✓ | |||||||||||||||||||||||||
P.R.C. |
✓ | ✓ | ✓ | ✓ | ✓ | ✓ | ✓ | ✓ | ✓ | ✓ | ✓ | ✓ | ✓ | |||||||||||||||||||||||||
Mexico |
✓ | ✓ | ✓ | ✓ | ✓ | ✓ | ✓ | ✓ | ✓ | ✓ | ||||||||||||||||||||||||||||
Poland |
✓ | ✓ | ✓ | ✓ | ✓ | |||||||||||||||||||||||||||||||||
United Kingdom |
✓ | ✓ | ✓ | ✓ | ||||||||||||||||||||||||||||||||||
U.S. |
✓ | ✓ | ✓ | ✓ | ||||||||||||||||||||||||||||||||||
France |
✓ | ✓ | ✓ | ✓ | ✓ | |||||||||||||||||||||||||||||||||
Germany |
✓ | ✓ | ✓ | ✓ | ✓ | |||||||||||||||||||||||||||||||||
Czech Republic |
✓ | ✓ | ||||||||||||||||||||||||||||||||||||
Tunisia |
✓ | ✓ | ✓ | ✓ | ||||||||||||||||||||||||||||||||||
Vietnam |
✓ | ✓ | ✓ | ✓ | ✓ | ✓ |
(1) | AS/EN 9100: 2016 quality standards are for aviation, space, and defense industry in management of development, production, manufacturing, installation, construction, and maintenance as well as trade and distribution. |
(2) | IRIS ISO/TS 22163 quality standards define quality management system requirements for the rail sector that can be applied throughout the supply chain—including design and development, manufacturing, and maintenance. |
The global market for semiconductor packaging and testing markets is highly competitive. We face competition from a number of sources and integrated device manufacturers with in-house packaging and testing capabilities and fabless semiconductor design companies with their own in-house testing capabilities. Some of these integrated device manufacturers have commenced, or may commence, in-house packaging and testing operations in Asia. Substantially all of packaging and testing companies that compete with us have established operations in Taiwan and across the region.
49
Integrated device manufacturers that use our services continuously evaluate our performance against their own in-house packaging and testing capabilities. These integrated device manufacturers may have access to more sophisticated technologies and greater financial and other resources than we do. We believe, however, that we can offer greater efficiency at lower cost while maintaining equivalent or higher quality for several reasons. First, as we benefit from specialization and economies of scale by providing services to a large base of customers across a wide range of products, we are better able to reduce costs and shorten production cycles through high-capacity utilization and process expertise. Second, as a result of our customer base and product offerings, our equipment generally has a longer useful life. Third, as a result of the continuing reduction of investments in in-house packaging and testing capacity and technology at integrated device manufacturers, we are better positioned to meet their packaging and testing requirements on a large scale.
Our packaging and testing business also face actual and potential competition from companies at other levels of the supply chain, which have the financial resources and technical capabilities to enter into and effectively compete within the industry. For example, TSMC has offered advanced packaging technologies such as integrated fan-out (the “InFO”) technology since 2016. InFO is expected to further intensify the competition in the packaging and testing industry.
Our EMS business faces significant competition from other EMS providers, such as Hon Hai Precision Industry Co., Ltd., with comprehensive integration, wide geographic coverage, and large production capabilities that enable them to achieve economies of scale. We believe, however, that we can still achieve satisfactory performance in the market given that we have been able to provide products with high quality and we are capable of designing new products by cooperating with our customers.
Environmental Matters
Our operations of packaging, interconnect materials, and EMS generate both hazardous and non-hazardous wastes. We have installed various types of anti-pollution equipment for the treatment of liquid and gaseous chemical waste and adopted comprehensive antipollution measures for the effective management of environmental protection that we believe are consistent with international standards. In addition, we believe we are in compliance in all material respects with present environmental laws and regulations applicable to all our operations and facilities. Our estimated environmental capital expenditures for 2023 will be approximately US$27.3 million, of which 22.54% will be used in climate change adaptation.
In order to demonstrate our commitment to environmental protection, in December 2013, ASE’s board of directors approved contributions to environmental protection efforts in Taiwan in a total amount of not less than NT$3,000.0 million (US$97.6 million), to be made in the following 30 years. On November 13, 2020, we established the ASE Environmental Protection and Sustainability Foundation for the promotion of public interest related to environmental protection. For the year ended December 31, 2020, we made contributions in the amount of NT$100.0 million through ASE Cultural and Educational Foundation to fund various environmental projects and we have made contributions in the amount of NT$100.0 million (US$3.3 million) for each of the years 2021 and 2022 through the ASE Environmental Protection and Sustainability Foundation to continuously implement the activities related to environmental protection projects.
Our operations involving wafer-level process and requiring wastewater treatment at our Kaohsiung facility have been subject to scrutiny by the Kaohsiung City Environmental Protection Bureau as a result of alleged water pollution violations that occurred in 2013. In addition, five employees of a China subsidiary were accused by a People’s Procuratorate of the P.R.C. (the “Procuratorate”) for committing the crime of environmental pollution that occurred in 2018 and such case was concluded on April 7, 2021. For additional details of these administrative actions and judicial proceedings related to our environment claims, see “Item 8. Financial Information—Consolidated Statements and Other Financial Information—Legal Proceedings.”
Defending against any of the pending or future actions will likely be costly and time-consuming and could significantly divert our management team’s efforts and resources. Any future suspension of operations at our facilities may adversely affect our business, financial condition, results of operations and cash flows. See “Item 3. Key Information—Risk Factors— Risks Relating to Our Business—Any environmental claims or failure to comply with any present or future environmental regulations, as well as any fire or other industrial accident, may require us to spend additional funds and may materially and adversely affect our financial condition and results of operations.”
50
Climate Change Management
ASEH established the Corporate Sustainability Committee (the “CSC”) as the highest level of authority in the planning and supervision of sustainability-related strategies including climate change and water-related issues and has entrusted the CSC with facilitating the accomplishment of sustainability management policies and the goals of the three key subsidiaries of ASEH. The CSC comprises ASEH’s directors and top management executives and is headed by the chairman of ASEH. The CSC oversees the performance of the company’s sustainability programs and reports progress to the board of directors annually. ASEH aims to balance the company’s growth trajectory with an equal focus on creating positive social and environmental impacts.
ASEH has passed a compliance review by the Science Based Targets initiative and also committed to Net-Zero emission targets to exert positive social influence. We have planned mid- and long-term absolute carbon reduction goals. Using 2016 as the base year for the completion of Scopes 1 and 2 verification, we plan to reduce absolute Scope 1 and 2 GHG emissions 35% by 2030 and commit to reduce absolute Scope 3 GHG emissions 15% by 2030 from a 2020 base year.
We are committed to reducing the emission of greenhouse gases from our business operations. We aim to address and integrate climate change into our business strategies by (i) Low-carbon energy resource diversification: promoting low-carbon development through energy saving, green energy, and energy storage; (ii) Smart green facilities: building low carbon buildings and factories which use resource recycling and smart technologies to manage operations and production; (iii) Innovative technology and investments: invest in renewable energy or carbon capture and storage technologies to lower environmental and external social costs; (iv) Climate solutions: providing the global market with feasible low-carbon solutions; and (v) Sustainable lifestyle: promoting and internalizing a sustainable way of life by fostering a low-carbon culture internally and contributing low-carbon solutions externally. For further information on our climate change management, please see our TCFD Report, which are available at https://www.aseglobal.com/csr/tcfd-report.
We believe that there are opportunities associated with climate change related risks and have implemented the following strategies to evaluate the risks and identify the opportunities:
· | Management procedures. We have been using an emergency response management system to address climate change-related risks. Potential risks induced by climate change are identified and assessed at a global scale. We have established monitoring and control mechanisms to reduce the adverse impacts of climate change on our business operation. The identified risks are managed by a variety of departments or risk functions across all parts of our organization. |
· | Identification processes for risks and opportunities. The identification process for risks and opportunities is carried out both at the company and asset level. Our risk management programs are regularly updated and implemented in our manufacturing sites as well as all group-level functional departments and assets. Risk identification, assessment, and response are three important steps in the emergency response management cycle. Risks and events that might influence our business objectives are identified and evaluated to identify appropriate responses. |
· | Prioritize the risks and opportunities identified. In accordance with a matrix analysis, the priority of climate change risks and opportunities are determined by the following criteria: time frame, likelihood, control effectiveness, and magnitude of impact on our sustainable operation. A comprehensive methodology is designed to evaluate the cost of implementation, effectiveness (degree to which a response will reduce impact), feasibility (difficulty), and time needed for implementation. Furthermore, at least three climate scenario models are adopted to simulate the potential impact. Each facility will set its climate change scenario analytical framework to simulate various parameter changes to assess potential areas of impact. Through implementing preventative mechanisms, early warning, and an emergency response system, we believe that we will be able to effectively address climate change risks. |
Transition to Low-Carbon Economy
Our climate leadership stems from bringing low carbon solutions to the global market and through balancing operational growth and low-carbon transformation targets that meet stakeholders’ expectations.
51
We explore potential pathways with environmental specialists to achieve carbon reduction targets and establish response systems to adapt to climate change. We are dedicated to providing high efficiency products as well as investing in the research and development of eco-friendly design. Starting from the product design stage, we actively incorporate environmentally friendly materials into production processes. We have also maintained a multi-site certification for ISO 14001, ISO 14064-1, and ISO 50001, which regularly examines the effectiveness of our environment and energy management systems. Global warming and climate change are contributing to extreme weather patterns and causing more stress to the environment. As global citizens, we are taking measurable actions to support and promote environmental sustainability. We have signed up with a major customer’s “Supplier Clean Energy Program” to increase our energy efficiency and transition to clean and renewable electricity. We have also joined the Semiconductor Climate Consortium (SCC) which is the first global collaborative of semiconductor ecosystem companies focused on reducing greenhouse gas emissions across the value chain, and Taiwan Institute for Sustainable Energy’s Net-zero Emission Alliance in pledging commitment to Net-zero 2030/2050, to build a supply chain that is resilient, transformative, and progressive.
We believe proactively engaging in supplier development is key to the sustainable development of our supply chain. We provide trainings, workshops, seminars, and face-to-face consultation to reinforce our suppliers’ capabilities to address sustainability issues and enhance their awareness of best practices for sustainability. In 2015, we joined the RBA, previously known as the Electronic Industry Citizens Coalition, and every year all of our facilities complete the RBA’s Self-Assessment Questionnaire to identify the labor, environmental, and ethical risks in their respective operations. For internal management, we have adopted the guidelines set out by the United Nations Framework Convention on Climate Change and encourage all our sites to submit self-initiated goals that are set according to their respective operation scale and capabilities.
To improve overall energy management, we established a green energy platform composed of multiple departments of our Group as well as teams based in Taiwan. We have allocated resources to support our suppliers in establishing GHG and product carbon footprint management systems that accelerate their efforts to meet emission regulatory requirements. In 2022, we collaborated with third party consultants on a medium to long term supplier low carbon guidance program which was conducted both online and in-person. The program not only supports suppliers to attain ISO 14064-1certification and carbon footprint verification but also facilitates carbon inventory management across the supply chain. A thorough understanding of the supply chain GHG emissions and carbon footprint allows ASEH to step up our carbon reduction plans and increase competitiveness. As part of our strategic efforts to build a stable and more sustainable supply chain, we established the Supplier Sustainability Awards, which recognizes suppliers with outstanding performance in sustainability. In 2020, the award program was jointly organized by all three ASEH subgroups. In addition, a new supplier incentive program focusing on the company’s Low Carbon and Circular strategies was launched, and the number of participating suppliers expanded. The program encourages suppliers to submit sustainability partnership projects of a 1-3 year duration for review by ASEH and independent third parties. The submitted projects will undergo a rigorous selection process based on the implementation timeframe and efficacy, and selected projects will be funded by the ASE Environmental Protection and Sustainability Foundation.
Sustainability Activities
We are committed to pursuing a win-win sustainable future and achieving our vision of contributing to society through a range of sustainability activities. In 2021, we established our long-term sustainability targets for 2030 based on major sustainability topics and their relative importance to our business operations. These targets serve to strengthen the correlation between the United Nations’ Sustainable Development Goals (SDGs) and our sustainability strategies, leading to the ultimate fulfillment of our commitment to corporate social responsibility.
We currently focus our sustainability efforts in sustainability governance, integrity and accountability, green transformation, sustainable supply chain, inclusive workplace, and corporate citizenship.
Moreover, in June 2022, we established ASE Social Enterprise Co., Ltd. to advance sustainable development, promote social inclusion, and address environmental problems.
For further information on our sustainability efforts, please see our annual ESG Report, which is available at https://www.aseglobal.com/csr-download.
52
Information Security Management
We rely on the efficient and uninterrupted operation of complex information technology applications, systems, and networks to operate our business. Our systems are vulnerable to damage or interruption from earthquakes, terrorist attacks, floods, fires, power loss, telecommunications failures, cyberattacks, computer viruses, denial of service attacks, or other attempts to harm our system, and similar events. The risks we face from cyberattacks have increased significantly in recent years. Some of these attacks originate from well-organized, highly skilled organizations. Although there have not been reported major cyberattacks against our systems in recent years, any such attack or system or network disruption could result in a loss of our intellectual property, the release of commercially sensitive information and customer or employee personal data. Failures to protect the privacy of customer and employee confidential data against breaches of network security could result in damage to our reputation.
Furthermore, some of our data centers are located in areas with a high risk of major earthquakes. Our data centers are also subject to break-ins, sabotage, and intentional acts of vandalism, and to potential disruptions if the operators of these facilities have financial difficulties. Some of our systems are not fully redundant, and our disaster recovery planning cannot account for all eventualities. The occurrence of a natural disaster, or a decision to close a facility we are using without adequate notice for financial reasons or other unanticipated problems at our data centers could result in loss of production capabilities and lengthy interruptions in our service. Any damage to or failure of our systems could result in interruptions in our service. Interruptions in our service could materially and adversely affect our business, financial condition, and results of operations.
Cybersecurity threats continue to expand and evolve globally. The information security management committee established by the CSC is responsible for overall information security across all subsidiaries. Our vice chairman has been appointed the chair of the committee, which is dedicated to enhancing information security, preventing and mitigating information security threats and risks by developing strategic plans for information security, establishing benchmarks for information security maturity assessments, promoting information security risk management in our subsidiaries, and coordinating internal and external technologies, resources and information. Our chief information security officer is responsible for regular reviews of all our subsidiaries’ information security management and incident response plans, and submits the information security governance report to the board of directors in the fourth quarter of each year.
In 2020, initiated by the information security management committee of the CSC, information security committees of our subsidiaries worked together to integrate and strengthen the information security protection of each subsidiary. The committees also set up an information security risk alert system, through which we could conduct on-site operational inspections to minimize information security risks by hiring third-party experts. In addition, our major subsidiaries have obtained ISO 27001 certification (for information security management system) and ISO 22301 certification to strengthen crisis management and disaster response. In addition, our Kaohsiung facility has been facing accelerating digital transition and is the first semiconductor assembly and testing facility in the world to receive the ISO 21434 international automotive network security standard certification and passed the mobile communication security certification standard and obtained the GSMA certification. We also have established management procedures for the reporting and handling of information security incidents which allow employees to report any security incidents to ensure prompt handling, followed by efficient responses that will mitigate information security risks. In addition, we conduct an annual disaster recovery drill to mitigate the risk of service disruptions caused by impacts from major crisis events to our information systems. All employees participate in our annual proprietary information protection training courses, which include training on information security policy, management framework, and control measures.
Furthermore, we employ third-party service providers to conduct an annual audit and review of our information security performance. In the event of a sudden external cyberattack, our on-site safety teams would immediately hold a meeting to share information, discuss responses and countermeasures; external experts would be invited to join the meeting to conduct reviews and analyses if necessary. While we actively take measures to manage information technology security risks, there can be no assurance that these measures will be sufficient to mitigate all potential risks to our system, networks, and data.
In addition to focusing on information security technologies and capabilities of the semiconductor industry and high-tech manufacturing, in 2021, we joined the SEMI to jointly develop and launch the SEMI E187- Specification for Cybersecurity of Fab Equipment.
53
In terms of trade secrets management, we continuously train our employees to enhance protection of trade secret and preventing the risk of infringement. Our management team reports to the board of directors on the progress of the management plan and implementation, and sets forth improvement measures based on the board of directors’ recommendations at least once a year.
Risk Management
Our board of directors established a risk management committee and approved the “Risk Management Policies and Procedures” as the ultimate guiding risk management principle. Awareness in risk management forms an integral part of our management, and risk management has been duly incorporated into our business strategies and organizational culture. To effectively review and oversee the overall sustainability-related opportunities and risks of ASEH, the CSC assigns a supervisory role to the chief administration officer of ASEH. Because chief administration officer concurrently serves as a member of the risk management committee and the chief risk officer of ASEH, in addition to performing a rolling review of the company’s internal sustainability strategies and approaches, the chief administration officer is also responsible for monitoring changes in the external environment and providing simultaneous feedback on the company’s risk management when analyzing sustainability-related opportunities and risks. On an annual basis, the chief administration officer reports the progress of strategies and implementation status directly to the board of directors and risk management committee, ensuring concise visibility of the environmental, social, and governance risk management at ASEH and its subsidiaries. We conduct risk assessments on an annual basis. For major risks, we formulate specific management plans covering goals, organizational structure and responsibilities, and risk management procedures. These plans have been developed to identify, measure, monitor and control various risk exposures effectively. We also conduct a comprehensive evaluation on the probability impacts of various risks faced during the ordinary course of business and take appropriate measures to continuously make improvements to better respond to natural disasters and other disruptive events such as cyberattacks or energy crises that could adversely affect the operation of our business.
We proactively implement risk management plans and report to the board of directors on a yearly basis. For example, in 2022, risk management committee have reported on major risks including the management of geopolitics and COVID-19, and also discussed emerging risks including renewable energy resources, cybersecurity, geopolitics, and talent retention. For a discussion of these risks and other factors, see “Item 3. Key Information—Risk Factors.”
Insurance
We have insurance policies covering property damage and damage to our production facilities, buildings, and machinery. We also have liability insurance policies, including but not limited to general liability insurance policies, product liability insurance policies for specified clients and products, and directors’ and officers’ insurance policies. In addition, considering the cybersecurity risks and challenges facing business entities, we adopted a cyber liability insurance policy, which is expected to help us respond to and control the impact of a cybersecurity incident.
We are not insured against the loss of key personnel.
ORGANIZATIONAL STRUCTURE
The following chart illustrates our corporate structure, including our principal packaging, testing, and EMS manufacturing subsidiaries as of January 31, 2023. The following chart does not include intermediate holding subsidiaries, internal trading subsidiaries, or those subsidiaries without manufacturing operations and in the process of construction. For complete information on our subsidiaries, see Note 4 to our consolidated financial statements included in this annual report.
54
Our Consolidated Subsidiaries
ASE Group
ASE Inc.
ASE Inc., which was established on March 23, 1984, is our wholly-owned subsidiary. It is incorporated in Taiwan and provides packaging and testing services, wafer sort testing, final testing services, substrate design, and manufacturing.
ASE Test Taiwan
ASE Test Taiwan, which was acquired in 1990, is our wholly-owned subsidiary. It is incorporated in Taiwan and is engaged in the testing of integrated circuits.
ASE Malaysia
ASE Malaysia, which was established in 1991, is our wholly-owned subsidiary. It is incorporated in Malaysia and is engaged in the packaging and testing of integrated circuits.
ISE Labs
ISE Labs is our wholly-owned subsidiary. It is a semiconductor company specializing in front-end engineering testing that is incorporated in the U.S. and has its principal facilities located in Fremont, California. We acquired 70.0% of the outstanding shares of ISE Labs in 1999 through ASE Test and increased our holding to 100.0% through purchases made in 2000 and 2002.
ASE Singapore Pte. Ltd.
ASE Singapore Pte. Ltd., our wholly-owned subsidiary, is incorporated in Singapore and provides packaging and testing services. We acquired ASE Singapore Pte. Ltd., which was wholly-owned by ISE Labs, through our acquisition of ISE Labs in 1999.
ASE Electronics
ASE Material was established in 1997 as an R.O.C. company for the production of interconnect materials, such as substrates, used in the packaging of semiconductors. We initially held a majority stake in ASE Material, but acquired the remaining equity by means of a merger with ASE Material in August 2004. In August 2006, we spun off the operations originally conducted through ASE Material into our wholly-owned subsidiary ASE Electronics. ASE Electronics currently supplies our packaging operations with a substantial portion of our substrate requirements. The facilities of ASE Electronics are primarily located in the Nanzih Technology Industrial Park near our packaging and testing facilities in Kaohsiung, Taiwan.
ASE Chung Li and ASE Korea
In July 1999, we purchased Motorola’s Semiconductor Products Sector operations in Chung Li, Taiwan and Paju, South Korea for the packaging and testing of semiconductors, thereby forming ASE Chung Li and ASE Korea. In August 2004, we acquired the remaining outstanding shares of ASE Chung Li that we did not already own and merged with ASE Chung Li.
55
ASE Japan
ASE Japan, which we acquired from NEC Electronics Corporation in May 2004, is our wholly-owned subsidiary. It is incorporated in Japan and is engaged in the packaging and testing of semiconductors.
ASE Shanghai
ASE Shanghai was established in 2001 as a wholly-owned subsidiary of ASE Inc. and began operations in June 2004. ASE Shanghai primarily manufactures and supplies interconnect materials for our packaging operations.
Wuxi Tongzhi
In May 2013, we, through our subsidiary ASESH AT, acquired 100.0% of the shares of Wuxi Tongzhi from Toshiba Semiconductor (Wuxi) Co., Ltd. Wuxi Tongzhi is based in Wuxi, P.R.C. and is engaged in semiconductor packaging and testing.
ISE Shanghai
ISE Shanghai was established in 2018 and began operating in 2019. ISE Shanghai is based in Shanghai, P.R.C. and is engaged in semiconductor testing.
SPIL Group
SPIL is a provider of semiconductor packaging and testing services. SPIL offers a full range of packaging and testing solutions, including advanced packages, substrate packages and leadframe packages, as well as testing for logic and mixed signal devices. SPIL also provides turnkey services, from packaging and testing to shipment services.
SPIL and ASE entered into a Joint Share Exchange Agreement on June 30, 2016, pursuant to which ASE established ASEH through a statutory exchange, and ASEH acquired all issued and outstanding shares of both ASE and SPIL. For details about the Joint Share Exchange Agreement, see “Item 10. Additional information—Material Contract.”
The Share Exchange consummated on April 30, 2018, and SPIL’s shares concurrently delisted from TWSE and NASDAQ on April 30, 2018. On April 30, 2018, ASE and SPIL became privately held wholly-owned subsidiaries of ASEH. For details about the SPIL Acquisition, see “Item 4. Information on the Company—SPIL Acquisition.”
The board of directors of the subsidiary, SPIL (Cayman) Holding Limited, resolved in September 2020 to dispose its 100% shareholdings in Siliconware Electronics (Fujian) Co., Limited to Shenzhen Hiwin System Limited with a consideration of RMB966,000 thousand. The disposal was completed in October 2020.
USI Group
USI Group engages primarily in EMS in relation to computing, consumer electronics, communications, industrial, and automotive, among other services and businesses.
As of January 31, 2023, we held 100.0% interest in USI Inc. and held 78.0% interest in USI Shanghai through our subsidiaries USI Inc. and ASE Shanghai. In addition, as of January 31, 2023, we held 100.0% interest in FAFG through our subsidiaries USIFR and USI Shanghai. See “Item 4. Information on the Company—Information on the Company—History and Development of the Company—USI Group and USI Group Restructuring” for more information.
56
PROPERTY, PLANTS AND EQUIPMENT
We operate a number of packaging, testing, and electronic manufacturing facilities in Asia, Africa, the U.S., and Europe. Our facilities provide varying types or levels of services with respect to different end-product focus, customers, technologies, and geographic locations. With our diverse facilities we are able to tailor our packaging, testing, and electronic manufacturing solutions closely to our customers’ needs. The following table sets forth the location, commencement of operation, primary use, approximate floor space, and ownership of our principal facilities in operation as of January 31, 2023.
Facility |
Location |
Commencement of Operation |
Primary Use |
Approximate Floor Space (in sq. ft.) |
Owned or Leased | |||||
ASE Inc. |
Kaohsiung, R.O.C. | March 1984 | Our primary packaging facility, which offers complete semiconductor manufacturing solutions in conjunction with ASE Test Taiwan and foundries located in Taiwan. Focuses primarily on packaging services such as flip chip, wafer bumping, and fine-pitch wire. bonding. | 7,988,000 | Land: leased Buildings: owned and leased | |||||
Chung Li, R.O.C. | Acquired in July 1999 | An integrated packaging and testing facility that specializes in semiconductors for communications and consumer applications. | 4,402,000 | Land and buildings: owned | ||||||
ASE Test Taiwan |
Kaohsiung, R.O.C. | Acquired in April 1990 | Our primary testing facilities, which offer complete semiconductor manufacturing solutions in conjunction with ASE Inc.’s facility in Kaohsiung and foundries located in Taiwan. Focuses primarily on advanced logic/mixed-signal/RF/3D IC testing for integrated device manufacturers, fabless design companies, and system companies. | 1,290,000 | Land: leased Buildings: owned and leased | |||||
ASE Malaysia |
Penang, Malaysia | February 1991 | An integrated packaging and testing facility that focuses primarily on the requirements of integrated device manufacturers. | 1,102,000 | Land: leased Buildings: owned | |||||
ASE Korea |
Paju, Korea | Acquired in July 1999 | An integrated packaging and testing facility that specializes in semiconductors for radio frequency, sensor, and automotive applications. | 1,374,000 | Land and buildings: owned | |||||
ISE Labs |
California, U.S. | Acquired in May 1999 | Front-end engineering and final testing facilities located in Northern California in close proximity to some of the world’s largest fabless design companies. | 80,000 | Land and buildings: owned |
57
Facility |
Location |
Commencement of Operation |
Primary Use |
Approximate Floor Space (in sq. ft.) |
Owned or Leased | |||||
ASE Singapore |
Singapore | Acquired in May 1999 | An integrated packaging and testing facility that specializes in semiconductors for communication, computers, and consumer applications. | 443,000 | Land: leased Buildings: owned and leased | |||||
ASE Shanghai |
Shanghai, P.R.C. | June 2004 | Design and production of semiconductor packaging materials. | 1,813,000 | Land: leased Buildings: owned | |||||
ASE Japan |
Takahata, Japan | Acquired in May 2004 | An integrated packaging and testing facility that specializes in semiconductors for cellular phone, household appliance, and automotive applications. | 108,000 | Land and buildings: leased | |||||
ASE Electronics |
Kaohsiung, R.O.C. | August 2006 | Facilities for the design and production of interconnect materials such as substrates used in the packaging of semiconductors. | 612,000 | Land: leased Buildings: owned | |||||
Wuxi Tongzhi |
Wuxi, P.R.C. | Acquired in May 2013 | An integrated packaging and testing facility that specializes in semiconductors for MP3, vehicle, household appliance, and communications applications. | 78,000 | Land and buildings: leased | |||||
ISE Shanghai |
Shanghai, P.R.C. | October 2018 | Testing facility for semiconductors. | 67,000 | Land and buildings: leased | |||||
Universal Scientific Industrial |
Nantou, R.O.C. | Acquired in February 2010 | Manufacture and marketing of electronic components, accessories, and related products. | 418,000 | Land and buildings: owned | |||||
USI Mexico |
Guadalajara, Mexico | Acquired in February 2010 | Manufacturing site, which offers motherboard manufacture and system assembly. | 1,327,000 | Land and buildings: owned | |||||
USI Shanghai |
Shanghai, P.R.C. | Acquired in February 2010 | Manufacturing site for design, manufacture, and marketing of motherboards, electronic components, accessories, and related products in the P.R.C. | 1,779,000 | Land: leased Buildings: owned and leased | |||||
UGKS |
Kunshan, P.R.C. | August 2011 | Manufacturing site for design, manufacture, and marketing of motherboards, electronic components, accessories, and related products in the P.R.C. | 1,125,000 | Land and buildings: leased | |||||
UGTW |
Nantou, R.O.C. | February 2010 | Design, manufacture, and marketing of electronic components, accessories and related products, and related research and development services. | 1,629,000 | Land: owned Buildings: owned and leased |
58
Facility |
Location |
Commencement of Operation |
Primary Use |
Approximate Floor Space (in sq. ft.) |
Owned or Leased | |||||
UGJQ |
Shanghai, P.R.C. | Established in September 2013 | Design, manufacture, and marketing of motherboards, electronic components, accessories, and related products in the P.R.C. | 1,012,000 | Land and buildings: leased | |||||
USIPL |
Wroclaw-Kobierzyce, Poland | Acquired in October 2019 | Design, manufacture miniaturization, material sourcing, logistics operations, and after sales services of electronic devices and modules. | 363,000 | Land and buildings: owned | |||||
Universal Global Technology (Huizhou) Co., Ltd. |
Huizhou, P.R.C. | October 2021 | Research and manufacturing of new electronic applications, communications, computers, and other electronics products; provides auxiliary technical services as well as import and export services. | 1,967,000 | Land: leased Buildings: owned | |||||
UNIVERSAL SCIENTIFIC INDUSTRIAL VIETNAM COMPANY LIMITED |
Haiphong, Vietnam | July 2021 | IC assembly for wearable devices. | 1,286,000 | Land: leased Buildings: owned | |||||
ASTEELFLASH (BEDFORD) LIMITED |
Bedford, United Kingdom | Acquired in December 2020 | Manufacturing site for design and manufacture of electronic components, and specializes in industrial, telecommunication, internet of things, data processing, consumer electronics, and aerospace related devices. | 51,000 | Land and buildings: leased | |||||
ASTEELFLASH FRANCE |
Soissons, Normandie, Lorraine, Duttlenhei, Langon and Grenoble, France | Acquired in December 2020 | Manufacture of electronic components such as complex mechatronic subsets (analog and digital) and design of electronic boards and mechatronic subsets engineering, electronic manufacturing services, expertise in high-mix and low-volume products. | 910,000 | Land and buildings: owned and leased | |||||
ASTEELFLASH TUNISIE S.A. |
La Soukra, Tunisia | Acquired in December 2020 | Design and manufacture of electronic components, such as PCBA assembly, coating, varnishing, and in-circuit testing capabilities. | 236,000 | Land and buildings: leased | |||||
ASTEELFLASH TECHNOLOGIE |
Alencon, France | Acquired in December 2020 | Design and manufacture of mechatronic parts, specifically targeted to automotive. | 173,000 | Land and buildings: owned |
59
Facility |
Location |
Commencement of Operation |
Primary Use |
Approximate Floor Space (in sq. ft.) |
Owned or Leased | |||||
Asteelflash Suzhou Co., Ltd. |
Suzhou, P.R.C. | Acquired in December 2020 | Manufacturing site specializing in SMT assembly for PCBA and system assembly/box build for module/final product in different segments. | 1,452,000 | Land and buildings: owned | |||||
ASTEELFLASH HERSFELD GmbH |
Bad Hersfeld, Germany | Acquired in December 2020 | Manufacturing site for PCB assembly, mainly automotive business, mid and high volume products linked to high security level, box build. | 742,000 | Land and buildings: owned | |||||
ASTEELFLASH EBERBACH GmbH |
Eberbach, Germany | Acquired in December 2020 | Manufacturing site that offers high/medium mix to low/medium volume electronic manufacturing services and focuses on smart building, smart home, green technologies, industrial, and medical devices and equipment. | 85,000 | Land and buildings: leased | |||||
ASTEELFLASH BONN GmbH |
Bonn, Germany | Acquired in December 2020 | Manufacturing site that offers high/medium mix to low/medium volume electronic manufacturing services. Focused on smart building, smart home, green technologies, internet of things, and telecommunication devices and equipment. | 91,000 | Land and buildings: leased | |||||
ASTEELFLASH DESIGN SOLUTIONS HAMBOURG GmbH |
Hamburg, Germany | Acquired in December 2020 | Manufacture and design for low/mid volumes with mid/high complexity products for industrial, medical, railway and IoT products. | 38,000 | Buildings: leased | |||||
ASTEELFLASH PLZEN S.R.O. |
Pilsen, Czech Republic | Acquired in December 2020 | Manufacturing site that offers solder paste printers, in-line solder paste inspection, full SMT lines, in-line automated optical inspection, wave soldering, and flying probe testing. | 40,000 | Land and buildings: leased | |||||
ASTEELFLASH USA CORP. |
California, U.S. | Acquired in December 2020 | Manufacturing site that offers solder paste printers, in-line solder paste inspection, full SMT lines, in-line automated optical inspection, wave soldering, flying probe testing, X- Ray capabilities, and potting. | 130,000 | Land and buildings: leased |
60
Facility |
Location |
Commencement of Operation |
Primary Use |
Approximate Floor Space (in sq. ft.) |
Owned or Leased | |||||
ASTEELFLASH MEXICO S.A. de C.V. |
Tijuana, Mexico | Acquired in December 2020 | Manufacturing site which specializes in automotive, medical, aerospace, and commercial customers. | 133,000 | Land and buildings: leased | |||||
Siliconware Precision Industries Co., Ltd. |
Taichung, Changhua and Hsinchu, R.O.C. | Acquired in April 2018 | Packaging and Testing facility, which offers semiconductor packaging and testing turnkey services. | 9,567,000 | Land: owned and leased Buildings: owned | |||||
SZ |
Suzhou, P.R.C. | Acquired in April 2018 | Packaging and Testing facility, which offers semiconductor packaging and testing services. | 1,549,000 | Land: leased Buildings: owned |
We have leased land in the Kaohsiung Nanzih Technology Industrial Park from the Export Processing Zone Administration (the “EPZA”) with different lease terms for several years that will expire in August 2061. We have leased land from the Central Taiwan Science Park Administration in Taichung with 19-year to 20-year terms that will expire in December 2041. We have leased land from Hsinchu Science Park Administrations in Hsinchu with 14-year to 40-year terms that will expire in December 2034. No sublease or lending of the land is allowed. We have leased land from Export Processing Zone Administration in Taichung for 10 years that will expire in March 2032. The EPZA, the Central Taiwan Science Park Administration and the Hsinchu Science Park Administrations have the right to adjust the rental price in the event the government revalues the land. The leases are typically renewable with one-month to three-month notice prior to the termination date.
Smart Factories
To enhance factory efficiency, improve manufacturing process quality, and meet customer delivery time demands, we have invested in automated, lights-out factories since 2015. Automation, heterogeneous integration in machine and production systems, and heterogeneous integration in SiP are 3 major forces driving smart factories and digital transformation. At the end of 2022, we had 36 lights-out factories in operation and we will continue to make further investment into automating manufacturing capacity.
Our Kaohsiung facility is our operation headquarters and houses our industry-leading R&D center, which is dedicated to providing world-class assembly, wafer bumping, and test services and also offers full turnkey services, including substrate design and manufacturing capabilities. Our 5G smart factory, the world’s first, which is supported by the Industrial Development Bureau and Qualcomm Technologies, Inc. and was developed through a strategic multi-organizational collaborations, has commenced operation at Kaohsiung facility. The smart factory features the digital transformation of factory processes that are highly secured and highly reliable through facilitating 5G wireless infrastructure integration, smart heterogeneous equipment integration, and OT security system integration.
We currently do not have plans for significant expansion, but will reevaluate our need for future expansion based on market condition and future demand requirements to meet our expected future growth. For information on the aggregate capacity of our facilities we operate, see “—Business Overview—Equipment.” For administrative actions and judicial proceedings related to Kaohsiung Facility, see “Item 8. Financial Information—Consolidated Statements and Other Financial Information—Legal Proceedings.”
Item 4A. Unresolved Staff Comments
None.
Item 5. Operating and Financial Review and Prospects
61
OPERATING RESULTS
The following discussion of our business, financial condition, and results of operations should be read in conjunction with our consolidated financial statements, which are included elsewhere in this annual report. This discussion contains forward-looking statements that reflect our current views with respect to future events and financial performance. Our actual results may differ materially from those anticipated in these forward-looking statements as a result of any number of factors, such as those set forth under “Item 3. Key Information—Risk Factors” and elsewhere in this annual report. See “Special Note Regarding Forward-Looking Statements.” Please refer to our Form 20-F dated March 29, 2022 (File No. 001-16125), as amended, for our discussion of financial information and operating results for 2021.
Overview
We offer a broad range of semiconductor packaging and testing services, and we offer EMS through USI Group. In addition to offering each service separately, we also offer turnkey services, which include integrated packaging, testing, and direct shipment of semiconductors to end users designated by our customers and solution-based proactive original design manufacturing. In addition, we have been generating revenues from our real estate business and the manufacturing of integrated circuits. Our operating revenues increased from NT$569,997.1 million in 2021 to NT$670,872.6 million (US$21,831.2 million) in 2022.
Discussed below are several factors that have had a significant influence on our financial results in recent years.
Pricing and Revenue Mix
We price our services taking into account the actual costs involved in providing these services, with consideration of prevailing market prices. The majority of our prices and revenues is denominated in U.S. dollars. Any significant fluctuation in exchange rates, especially between NT dollars and U.S. dollars, will affect our costs and, in turn, our revenues.
In the case of semiconductor packaging, the cost of the silicon die, typically the most costly component of the packaged semiconductor, is usually not reflected in our costs (or revenues) since it is generally supplied by our customers on a consignment basis.
The semiconductor industry is characterized by a general trend toward declining prices for products and services of a given technology over time. In addition, during periods of intense competition and adverse conditions in the semiconductor industry, the rate of this decline may be more rapid than in other years. The average selling prices of our packaging and testing services have experienced sharp declines during such periods as a result of intense price competition from other market participants that attempt to maintain high-capacity utilization levels in the face of reduced demand.
Declines in average selling prices have historically been partially offset by changes in our revenue mix, and typically the selling price is largely dependent on the complexity of the services. Revenues derived from more advanced package types, such as flip chip BGA, higher-density packages with finer lead-to-lead spacing, or pitch, and testing of more complex, high-performance semiconductors have particularly increased as a percentage of total revenues. We intend to continue to focus on package types such as bumping, flip chip BGA and SiP, developing and offering new technologies in packaging and testing services, and expanding our capacity to achieve economies of scale, as well as improving production efficiencies for older technologies, in order to mitigate the effects of declining average selling prices on our profitability.
Our profitability for a specific package type does not depend linearly on its average selling price. Some of our more traditional package types, which typically have low average selling prices, may well command steadier and sometimes higher margins than more advanced package types with higher average selling prices.
High Fixed Costs
Our operations, in particular our testing operations, are characterized by relatively high fixed costs. We expect to continue to incur substantial depreciation and other expenses, especially from our acquisitions of packaging and testing equipment and facilities. Our profitability depends in part not only on absolute pricing levels for our products/services, but also on utilization rates on equipment, commonly referred to as “capacity utilization rates.” Increases or decreases in our capacity utilization rates could have a significant effect on gross margins since the unit cost of our products and/or services generally decreases as fixed costs are allocated over a larger number of units. The capacity utilization rates of the machinery and equipment installed at our production facilities typically depend on factors such as the volume and variety of products, the efficiency of our operations in terms of the loading and adjustment of machinery and equipment for different products, the complexity of the different products to be packaged or tested, the amount of time set aside for the maintenance and repair of the machinery and equipment, and the experience and schedule of work shifts of operators.
62
In 2021 and 2022, our depreciation, amortization, and rental expenses included in operating costs as a percentage of operating revenues was 8.7% and 7.6%, respectively. The decrease in depreciation, amortization, and rental expenses as a percentage of operating revenues in 2022 compared to 2021 was primarily a result of an increase in our operating revenues. We begin depreciating our equipment when the machinery is placed into service. There may sometimes be a time lag between when our equipment is available for use and when it achieves high levels of utilization. In particular, the capacity utilization rates for our testing equipment are more severely affected during an industry downturn as a result of a decrease in outsourcing demand from integrated device manufacturers, which typically maintain larger in-house testing capacity than in-house packaging capacity.
In addition to purchasing testers, we also lease a portion of our testers, which we believe allows us to better manage our capacity utilization rates and cash flow. Since leased testers can be replaced with more advanced testers upon the expiration of the lease, we believe that these leases have enabled us to improve our capacity utilization rates by allowing us to better align our capacity with changes in equipment technology and the needs of our customers. For more information about our testers, including the number of testers under lease, see “Item 4. Information on the Company—Business Overview—Equipment—Testing.”
Raw Material Costs
Substantially all of our raw material costs are accounted for by packaging, the production of interconnect materials, and EMS. Our EMS in particular requires more significant quantities of raw materials than our packaging and production of interconnect materials. In 2022, raw material costs accounted for 80.9% of our operating revenues from EMS, and our revenues generated from EMS contributed to 45.0% of our operating revenues. In 2021 and 2022, raw material cost as a percentage of our operating revenues was 49.3% and 52.1%, respectively.
We have developed copper wire to gradually replace gold wire in the packaging processes in order to benefit from the lower material cost of copper. However, gold wire is still and will continue to be one of the principal raw materials for our packaging processes. It may be difficult for us to adjust our average selling prices to account for fluctuations in the price of gold. Thus, we expect our raw material costs to continue to be affected by fluctuations in the price of gold.
Recent Accounting Pronouncements
Please refer to Note 3 to our consolidated financial statements included in this annual report.
Critical Accounting Estimates
Preparation of our consolidated financial statements requires us to make estimates and judgments in applying our critical accounting policies that have a significant impact on the results we report in our consolidated financial statements. Our critical accounting judgments and key sources of estimation uncertainty are set forth in detail in Note 5 to our consolidated financial statements included in this annual report.
63
Results of Operations
The following table sets forth, for the periods indicated, financial data from our consolidated statements of comprehensive income.
Year Ended December 31, | ||||||||||||||||||||||||||||
2020 | 2021 | 2022 | ||||||||||||||||||||||||||
NT$ | Percentage | NT$ | Percentage | NT$ | US$ | Percentage | ||||||||||||||||||||||
(in millions, except percentages) | ||||||||||||||||||||||||||||
Operating revenues |
476,978.7 | 100.0% | 569,997.1 | 100.0% | 670,872.6 | 21,831.2 | 100.0% | |||||||||||||||||||||
Operating costs |
(398,994.4) | (83.7)% | (459,628.3) | (80.6)% | (535,942.6) | (17,440.4) | (79.9)% | |||||||||||||||||||||
|
|
|
|
|
|
|
|
|
|
|
|
|
|
|||||||||||||||
Gross profit |
77,984.3 | 16.3% | 110,368.8 | 19.4% | 134,930.0 | 4,390.8 | 20.1% | |||||||||||||||||||||
Operating expenses |
(43,108.2) | (9.0)% | (48,244.4) | (8.5)% | (54,754.4) | (1,781.8) | (8.2)% | |||||||||||||||||||||
Other operating income and expenses, net |
502.5 | 0.1% | 1,189.8 | 0.2% | 1,014.3 | 33.0 | 0.2% | |||||||||||||||||||||
|
|
|
|
|
|
|
|
|
|
|
|
|
|
|||||||||||||||
Profit from operations |
35,378.6 | 7.4% | 63,314.2 | 11.1% | 81,189.9 | 2,642.0 | 12.1% | |||||||||||||||||||||
Non-operating income, net |
390.2 | 0.1% | 16,879.6 | 3.0% | 573.7 | 18.7 | 0.1% | |||||||||||||||||||||
|
|
|
|
|
|
|
|
|
|
|
|
|
|
|||||||||||||||
Profit before income tax |
35,768.8 | 7.5% | 80,193.8 | 14.1% | 81,763.6 | 2,660.7 | 12.2% | |||||||||||||||||||||
Income tax expense |
(7,116.9) | (1.5)% | (17,943.8) | (3.1)% | (17,145.5) | (557.9) | (2.5)% | |||||||||||||||||||||
|
|
|
|
|
|
|
|
|
|
|
|
|
|
|||||||||||||||
Profit for the year |
28,651.9 | 6.0% | 62,250.0 | 11.0% | 64,618.1 | 2,102.8 | 9.7% | |||||||||||||||||||||
|
|
|
|
|
|
|
|
|
|
|
|
|
|
|||||||||||||||
Attributable to |
||||||||||||||||||||||||||||
Owners of the Company |
26,970.6 | 5.7% | 60,150.2 | 10.6% | 61,501.6 | 2,001.4 | 9.2% | |||||||||||||||||||||
Non-controlling interests |
1,681.3 | 0.3% | 2,099.8 | 0.4% | 3,116.5 | 101.4 | 0.5% | |||||||||||||||||||||
|
|
|
|
|
|
|
|
|
|
|
|
|
|
|||||||||||||||
28,651.9 | 6.0% | 62,250.0 | 11.0% | 64,618.1 | 2,102.8 | 9.7% | ||||||||||||||||||||||
|
|
|
|
|
|
|
|
|
|
|
|
|
|
|||||||||||||||
Other comprehensive income for the year, net of income tax |
495.3 | 0.1% | 406.0 | 0.0% | 8,632.5 | 280.9 | 1.3% | |||||||||||||||||||||
|
|
|
|
|
|
|
|
|
|
|
|
|
|
|||||||||||||||
Total comprehensive income for the year |
29,147.2 | 6.1% | 62,656.0 | 11.0% | 73,250.6 | 2,383.7 | 11.0% | |||||||||||||||||||||
|
|
|
|
|
|
|
|
|
|
|
|
|
|
|||||||||||||||
Attributable to |
||||||||||||||||||||||||||||
Owners of the Company |
27,440.7 | 5.7% | 60,630.2 | 10.6% | 69,706.9 | 2,268.4 | 10.4% | |||||||||||||||||||||
Non-controlling interests |
1,706.5 | 0.4% | 2,025.8 | 0.4% | 3,543.7 | 115.3 | 0.6% | |||||||||||||||||||||
|
|
|
|
|
|
|
|
|
|
|
|
|
|
|||||||||||||||
29,147.2 | 6.1% | 62,656.0 | 11.0% | 73,250.6 | 2,383.7 | 11.0% | ||||||||||||||||||||||
|
|
|
|
|
|
|
|
|
|
|
|
|
|
The following table sets forth, for the periods indicated, earnings per Common Share and ADS.
Year Ended December 31, | ||||||||||||
2020 | 2021 | 2022 | ||||||||||
Earnings per Common Share (NT$)(1): |
||||||||||||
Basic |
6.32 | 13.97 | 14.39 | |||||||||
Diluted |
6.17 | 13.54 | 13.81 | |||||||||
Earnings per equivalent ADS (NT$)(1): |
||||||||||||
Basic |
12.65 | 27.94 | 28.77 | |||||||||
Diluted |
12.33 | 27.07 | 27.61 | |||||||||
Number of Common Shares (in million shares)(2): |
||||||||||||
Basic |
4,265.7 | 4,305.3 | 4,274.7 | |||||||||
Diluted |
4,288.6 | 4,365.7 | 4,323.4 | |||||||||
Number of equivalent ADSs (in million shares)(3) |
||||||||||||
Basic |
2,132.9 | 2,152.7 | 2,137.3 | |||||||||
Diluted |
2,144.3 | 2,182.8 | 2,161.7 |
(1) | The denominators for diluted earnings per Common Share and diluted earnings per equivalent ADS are calculated to account for the potential diluted factors, such as employees’ compensation, the exercise of options, and the issuance of employee restricted stock awards. |
(2) | Represents the weighted average number of shares after retroactive adjustments to give effect to stock dividends. Common shares held by consolidated subsidiaries are classified as “treasury stock,” and are deducted from the number of Common Shares outstanding. |
(3) | For the computation of earnings per ADS, the denominators were the half of the aforementioned weighted average outstanding shares (one ADS represents two ordinary shares). |
64
The following table sets forth, for the periods indicated, segment results. Gross margin is calculated by dividing gross profit by their respective operating revenues.
Year Ended December 31, | ||||||||||||||||||||||||||||
2020 | 2021 | 2022 | ||||||||||||||||||||||||||
NT$ | Percentage | NT$ | Percentage |
NT$ | US$ | Percentage | ||||||||||||||||||||||
(in millions, except percentages) | ||||||||||||||||||||||||||||
Operating revenues: |
||||||||||||||||||||||||||||
Packaging |
218,666.1 | 45.9% | 272,543.9 | 47.8% | 303,947.5 | 9,890.9 | 45.3% | |||||||||||||||||||||
Testing |
47,271.1 | 9.9% | 49,978.7 | 8.8% | 55,960.2 | 1,821.0 | 8.3% | |||||||||||||||||||||
EMS |
204,690.6 | 42.9% | 239,488.3 | 42.0% | 301,966.8 | 9,826.5 | 45.0% | |||||||||||||||||||||
Gross profit: |
||||||||||||||||||||||||||||
Packaging |
43,251.7 | 19.8% | 69,985.5 | 25.7% | 82,327.0 | 2,679.0 | 27.1% | |||||||||||||||||||||
Testing |
15,257.3 | 32.3% | 17,404.5 | 34.8% | 21,043.5 | 684.8 | 37.6% | |||||||||||||||||||||
EMS |
18,825.9 | 9.2% | 21,384.7 | 9.0% | 28,947.4 | 942.0 | 9.6% |
The following table sets forth, for the periods indicated, a breakdown of our total operating costs and operating expenses, expressed as a percentage of operating revenues.
Year Ended December 31, | ||||||||||||
2020 | 2021 | 2022 | ||||||||||
Operating costs |
||||||||||||
Raw materials |
50.4% | 49.3% | 52.1% | |||||||||
Labor |
11.6% | 11.5% | 10.1% | |||||||||
Depreciation, amortization and rental expense |
9.8% | 8.7% | 7.6% | |||||||||
Others |
11.9% | 11.1% | 10.1% | |||||||||
Total operating costs |
83.7% | 80.6% | 79.9% | |||||||||
Operating expenses |
||||||||||||
Selling |
1.2% | 1.2% | 1.0% | |||||||||
General and administrative |
3.8% | 3.6% | 3.5% | |||||||||
Research and development |
4.0% | 3.7% | 3.7% | |||||||||
Total operating expenses |
9.0% | 8.5% | 8.2% |
Year Ended December 31, 2022 Compared to Year Ended December 31, 2021
Operating Revenues. Operating revenues increased by 17.7% to NT$670,872.6 million (US$21,831.2 million) in 2022 from NT$569,997.1 million in 2021, primarily due to an increase in revenue from our packaging and EMS business. Packaging revenues increased 11.5% to NT$303,947.5 million (US$9,890.9 million) in 2022 from NT$272,543.9 million in 2021, primarily due to an increase in demand of advanced packaging such as Bumping, Flip Chip, WLP, and SiP services. Testing revenues increased 12.0% to NT$55,960.2 million (US$1,821.0 million) in 2022 from NT$49,978.7 million in 2021, primarily due to an increase in providing testing services for wafer probing. Revenues from our EMS business increased 26.1% to NT$301,966.8 million (US$9,826.5 million) in 2022 from NT$239,488.3 million in 2021, primarily due to an increase in orders for communications, consumer electronics products, and automotive products.
Gross Profit. Gross profit increased by 22.3% to NT$134,930.0 million (US$4,390.8 million) in 2022 from NT$110,368.8 million in 2021. Our gross profit as a percentage of operating revenues, or gross margin, was 20.1% in 2022 compared to 19.4% in 2021, which was primarily driven by a favorable impact of NT dollars depreciation for our packaging, testing, and EMS businesses. Raw material costs in 2022 were NT$349,813.9 million (US$11,383.5 million) compared to NT$280,789.2 million in 2021, primarily due to product mix of our EMS business. As a percentage of operating revenues, raw material costs increased to 52.1% in 2022 from 49.3% in 2021. Labor costs in 2022 were NT$68,024.3 million (US$2,213.6 million) compared to NT$65,433.8 million in 2021, primarily related to an increase in salary rate and higher employee headcount. As a percentage of operating revenues, labor cost decreased to 10.1% in 2022 from 11.5% in 2021. Depreciation, amortization, and rental expenses in 2022 were NT$50,766.6 million (US$1,652.0 million) compared to NT$50,068.2 million in 2021. As a percentage of operating revenues, depreciation, amortization, and rental expenses decreased to 7.6% in 2022 from 8.7% in 2021. The percentage decrease was primarily related to higher revenues in 2022. Our gross margin for packaging business increased to 27.1% in 2022 from 25.7% in 2021, our gross margin for testing business increased to 37.6% in 2022 from 34.8% in 2021, and our gross margin for EMS business increased to 9.6% in 2022 from 9.0% in 2021, primarily due to higher loading and efficiency as well as the impact of NT dollars depreciation.
65
Profit from Operations. Profit from operations increased by 28.2% to NT$81,189.9 million (US$2,642.0 million) in 2022 compared to NT$63,314.2 million in 2021. Our profit from operations as a percentage of operating revenues increased to 12.1% in 2022 from 11.1% in 2021, primarily due to an increase in gross profit. General and administrative expenses increased 12.8% to NT$23,464.0 million (US$763.6 million) in 2022 from NT$20,804.0 million in 2021. General and administrative expenses as a percentage of our operating revenues was 3.5% in 2022 compared to 3.6% in 2021. Research and development expenses increased 15.8% to NT$24,369.9 million (US$793.0 million) in 2022 compared to NT$21,053.6 million in 2021, accounting for 3.7% of operating revenues in both 2022 and 2021, respectively. Selling expenses increased 8.4% to NT$6,920.5 million (US$225.2 million) in 2022 from NT$6,386.8 million in 2021. Selling expenses as percentages of operating revenues was 1.0% in 2022 compared to 1.2% in 2021. The increase in the operating expenses were primarily due to an increase in new advanced research projects costs and salary expenses which include higher employee headcount, employee bonus and profit-sharing expenses in relation to business performance, as well as miscellaneous costs related to share-based payment arrangements. We had a net other operating income of NT$1,014.3 million (US$33.0 million) in 2022 compared to NT$1,189.8 million in 2021. The decrease was primarily due to an increase in impairment loss and compensation charges, partially offset by an increase in rental and royalty income.
Non-Operating Income and Expenses. We had a net non-operating income of NT$573.7 million (US$18.7 million) in 2022 compared to NT$16,879.6 million in 2021. This decrease was primarily due to the gain of NT$17,340.4 million from China site dispositions in 2021, whereas no such transaction occurred in 2022, and an increase in finance costs and foreign exchange loss, partially offset by the gain on valuation of financial instruments and share of profit of associates and joint ventures.
Net Profit. Net profit, excluding non-controlling interests, increased by 2.2% to NT$61,501.6 million (US$2,001.4 million) in 2022 compared to NT$60,150.2 million in 2021. Our diluted earnings per ADS increased to NT$27.61 (US$0.90) in 2022 compared to NT$27.07 in 2021. Our income tax expenses decreased by 5.2% to NT$17,145.5 million (US$557.9 million) in 2022 compared to NT$17,943.8 million in 2021. This decrease was primarily attributed to lower additional income tax imposed on unappropriated earnings and a decrease in capital gains tax that resulted from the gain on China site dispositions in 2021, partially offset by higher income tax as a result of higher 2022 earnings.
In relation to the SPIL Acquisition, we identified the difference between investment cost and our share of net fair value of SPIL’s identifiable assets and liabilities, or PPA effects of SPIL Acquisition, which caused the increase in the total of NT$4,605.6 million and NT$4,529.5 million (US$147.4 million), of which an increase of NT$3,522.2 million and NT$3,507.5 million (US$114.1 million) to depreciation and amortization in operating costsNT$1,004.2 million and NT$1,000.0 million (US$32.6 million) to amortization in operating expenses and NT$79.2 million and NT$22.0 million (US$0.7 million) to other operating income and expenses, net in 2021 and 2022, respectively.
Year Ended December 31, 2021 Compared to Year Ended December 31, 2020
For a detailed description of the comparison of our operating results for the year ended December 31, 2021 to the year ended December 31, 2020, please refer to “Item 5. Operating and Financial Review and Prospects— Operating Results and Trend Information—Results of Operations—Year Ended December 31, 2021 Compared to Year Ended December 31, 2020” of our annual report on Form 20-F filed with the Securities and Exchange Commission on March 29, 2022, as amended.
Quarterly Operating Revenues, Gross Profit and Gross Margin
The following table sets forth our unaudited consolidated operating revenues, gross profit, and gross margin for the quarterly periods indicated. The unaudited quarterly results reflect all adjustments, consisting of normal recurring adjustments that, in the opinion of management, are necessary for a fair presentation of the amounts, on a basis consistent with the audited consolidated financial statements included elsewhere in this annual report. You should read the following table in conjunction with the audited consolidated financial statements and related notes included elsewhere in this annual report.
66
Our operating revenues, gross profit, and gross margin for any quarter are not necessarily indicative of the results for any future period. Our unaudited quarterly operating revenues, gross profit and gross margin may fluctuate significantly.
Quarter Ended, | ||||||||||||||||||||||||||||||||
Mar. 31, | Jun. 30, | Sep. 30, | Dec. 31, | Mar. 31, | Jun. 30, | Sep. 30, | Dec. 31, | |||||||||||||||||||||||||
2021 | 2021 | 2021 | 2021 | 2022 | 2022 | 2022 | 2022 | |||||||||||||||||||||||||
NT$ | NT$ | NT$ | NT$ | NT$ | NT$ | NT$ | NT$ | |||||||||||||||||||||||||
(in millions, except percentages) | ||||||||||||||||||||||||||||||||
Operating Revenues |
||||||||||||||||||||||||||||||||
Packaging |
59,033.4 | 64,149.3 | 73,995.8 | 75,365.4 | 68,382.7 | 78,393.7 | 80,541.3 | 76,629.8 | ||||||||||||||||||||||||
Testing |
11,129.9 | 11,676.4 | 13,416.1 | 13,756.3 | 12,582.6 | 13,759.8 | 14,941.5 | 14,676.3 | ||||||||||||||||||||||||
EMS |
47,683.9 | 49,147.0 | 61,116.2 | 81,541.2 | 61,162.7 | 66,212.5 | 90,660.0 | 83,931.6 | ||||||||||||||||||||||||
Others |
1,622.6 | 1,953.6 | 2,136.7 | 2,273.3 | 2,262.8 | 2,073.1 | 2,482.7 | 2,179.5 | ||||||||||||||||||||||||
|
|
|
|
|
|
|
|
|
|
|
|
|
|
|
|
|||||||||||||||||
Total |
119,469.8 | 126,926.3 | 150,664.8 | 172,936.2 | 144,390.8 | 160,439.1 | 188,625.5 | 177,417.2 | ||||||||||||||||||||||||
|
|
|
|
|
|
|
|
|
|
|
|
|
|
|
|
|||||||||||||||||
Gross Profit |
||||||||||||||||||||||||||||||||
Packaging |
14,241.6 | 16,212.7 | 19,311.0 | 20,220.2 | 18,135.9 | 22,184.1 | 21,966.5 | 20,040.5 | ||||||||||||||||||||||||
Testing |
3,395.4 | 3,733.1 | 5,123.1 | 5,152.9 | 4,387.3 | 5,063.0 | 5,960.1 | 5,633.1 | ||||||||||||||||||||||||
EMS |
3,988.7 | 4,453.7 | 5,855.5 | 7,086.8 | 5,364.9 | 6,627.2 | 9,171.1 | 7,784.2 | ||||||||||||||||||||||||
Others |
260.7 | 404.7 | 494.3 | 434.4 | 583.1 | 513.3 | 874.2 | 641.5 | ||||||||||||||||||||||||
|
|
|
|
|
|
|
|
|
|
|
|
|
|
|
|
|||||||||||||||||
Total |
21,886.4 | 24,804.2 | 30,783.9 | 32,894.3 | 28,471.2 | 34,387.6 | 37,971.9 | 34,099.3 | ||||||||||||||||||||||||
|
|
|
|
|
|
|
|
|
|
|
|
|
|
|
|
|||||||||||||||||
Gross Profit (%) |
||||||||||||||||||||||||||||||||
Packaging |
24.1% | 25.3% | 26.1% | 26.8% | 26.5% | 28.3% | 27.3% | 26.2% | ||||||||||||||||||||||||
Testing |
30.5% | 32.0% | 38.2% | 37.5% | 34.9% | 36.8% | 39.9% | 38.4% | ||||||||||||||||||||||||
EMS |
8.4% | 9.1% | 9.6% | 8.7% | 8.8% | 10.0% | 10.1% | 9.3% | ||||||||||||||||||||||||
Overall |
18.3% | 19.5% | 20.4% | 19.0% | 19.7% | 21.4% | 20.1% | 19.2% |
Our results of operations are affected by seasonality. In general, our first quarter operating revenues have historically decreased over the preceding fourth quarter, primarily due to the combined effects of holidays in the U.S., Taiwan, and elsewhere in Asia. Moreover, the increase or decrease in operating revenues of a particular quarter as compared with the immediately preceding quarter varies significantly. See “Item 3. Key Information—Risk Factors—Risks Relating to Our Business—Our operating results are subject to significant fluctuations, which could adversely affect the market value of our Common Shares and ADSs.”
Exchange Rate Fluctuations
Fluctuations in the exchange rate between NT dollars and U.S. dollars will affect the U.S. dollar equivalent of the NT dollar price of our Common Shares on the TWSE and, as a result, will likely affect the market price of the ADSs. Fluctuations will also affect the U.S. dollar conversion by the depositary under our ADS deposit agreement referred to below of cash dividends paid in NT dollars on, and the NT dollar proceeds received by, the depositary from any sale of Common Shares represented by ADSs, in each case, according to the terms of the deposit agreement dated April 30, 2018, Citibank N.A. as depositary, and the holders and beneficial owners from time to time of the ADSs, which we refer to as the deposit agreement.
For quantitative and qualitative disclosure of our exposure to foreign currency exchange rate risk, see “Item 11. Quantitative and Qualitative Disclosures about Market Risk—Market Risk—Foreign Currency Exchange Rate Risk.”
Taxation
We have filed a consolidated corporate income tax return starting from 2019 and a consolidated undistributed earnings tax since 2018 for all qualified domestic subsidiary companies with the tax authority in accordance with Article 45 of the R.O.C. Business Mergers and Acquisitions Act. The corporate income tax rate and tax rate on unappropriated earnings in the R.O.C. are 20% and 5%, respectively. Since we have facilities located in export processing zones and bonded factories in Taiwan, we enjoy exemptions from various import duties, commodity taxes, and business taxes on imported machinery, equipment, raw materials, and components which are directly used for manufacturing finished goods. We also enjoy exemptions from commodity and business taxes on finished goods exported or sold to others within the zones and benefit from tax incentives for purchase of certain qualified machinery and equipment.
67
Under the amendment to the Income Tax Law, which became effective on January 1, 2018, the corporate income tax rate increased from 17% to 20%. The R.O.C. Statute for Upgrading Industries, which provided various tax incentives, including investment tax credits, tax exemptions, and tax holidays for companies, expired on December 31, 2009. Under this statute, we had been granted tax holidays covering the portion of our income attributable to eligible machinery and equipment that were procured with cash infusions from our shareholders or after the capitalization of retained earnings through the issuance of stock dividends, and tax credits of 7% for the purchase of qualifying manufacturing equipment. We can continue to enjoy the tax holidays that have been granted to us by the R.O.C. tax authority. Under the prevailing Statute for Industrial Innovation Act, effective from January 1, 2010 to December 31, 2029, a profit-seeking enterprise may deduct up to (i) 15% of its research and development expenditures from its income tax payable for the fiscal year in which these expenditures are incurred; or (ii) 10% of its research and development expenditures from its income tax payable for the fiscal year in which these expenditures are incurred or the following two years. However, the deduction may not exceed 30% of the income tax payable for that fiscal year. Our five-year tax holiday was expired in December 2022.
Under the Alternative Minimum Tax Act (the “AMT Act”), when the amount of the regular income tax calculated pursuant to the Income Tax Law of the R.O.C. (the “Income Tax Law”) is below the amount of the alternative minimum tax, or the AMT, a taxpayer is required to pay the difference between the AMT and the said regular income tax, which becomes the AMT payable. Taxable income for calculating the AMT includes most sources of income that are exempted from income tax under various legislations such as tax holidays. However, there are grandfathered treatments for the tax holidays approved by the tax authority before the AMT Act took effect. Under the amended AMT Act, the standard deduction for taxable income that applies to business entities decreased from NT$2.0 million to NT$0.5 million and the tax rate that applies to business entities increased from 10% to 12%.
Under the amended Income Tax Law, which became effective on January 1, 2018, the tax rate on unappropriated earnings is reduced from 10% to 5%. In addition, to encourage profit-seeking enterprises to use their earnings to make substantial investment or upgrade production technology or the quality of products or services, if a company uses a certain amount of its undistributed earnings to construct or purchase buildings, software or hardware equipment, or technology for use in production or operation as needed for operation of its business or ancillary business within three years from the year after such earnings are derived, such investment amounts may be deducted from the undistributed earnings in calculation of the current year’s undistributed earnings for assessment of additional profit-seeking enterprise income tax leviable on undistributed earnings from the year 2018 under Article 66-9 of the Income Tax Act. We have only deducted the amount of capital expenditure from the unappropriated earnings that has been reinvested when calculating the tax on unappropriated earnings based on this new amendment. However, we did not deduct such investment amounts from the undistributed earnings in calculation of income tax on unappropriated earnings in 2021 and 2022.
Our non-R.O.C. subsidiaries are subject to taxation in their respective jurisdiction. Some of our P.R.C. subsidiaries qualified as high technology enterprises were entitled to a reduced income tax rate of 15% and were eligible to deduct certain research and development expenses from their taxable income.
In 2022, our effective income tax rate decreased to 21% from 22% in 2021 primarily due to lower additional income tax imposed on unappropriated earnings and a decrease in capital gains tax that resulted from the gain on China site dispositions in 2021. We believe that our future estimated taxable income will be sufficient to utilize our deferred tax assets recorded as of December 31, 2022.
LIQUIDITY AND CAPITAL RESOURCES
As of December 31, 2022, our primary source of liquidity was NT$58,040.4 million (US$1,888.7 million) of cash and cash equivalents and NT$6,825.2 million (US$222.1 million) of financial assets – current, consisting mainly of quoted ordinary shares, unquoted preferred shares, open-end mutual funds, target redemption forward contracts, swap contracts, and forward exchange contracts. As of December 31, 2022, we had total unused credit lines of NT$345,950.9 million (US$11,257.8 million). As of December 31, 2022, we had working capital of NT$71,041.8 million (US$2,311.8 million).
As of December 31, 2022, we had total debts of NT$202,279.4 million (US$6,582.5 million), of which NT$46,731.1 million (US$1,520.7 million) were short-term debts, NT$11,020.4 million (US$358.6 million) were current portion of long-term debts and NT$144,527.9 million (US$4,703.2 million) were long-term debts. In 2022, the maximum amount of our short-term and current portion of debts was NT$97,368.3 million (US$3,168.5 million) and the average amount of our short-term and current portion of debts was NT$77,319.2 million (US$2,516.1 million). The fluctuation was primarily because our working capital balance periodically fluctuated during 2022. The annual interest rate for borrowings under our short-term borrowings ranged from 1.42% to 6.50% as of December 31, 2022. Our short-term bank loans are primarily revolving facilities with a term of one year, each of which may be extended on an annual basis with lender consent. Our long-term debts consist of bonds payable, long-term debts (including bank borrowings and bills payable), and financial liabilities for hedging – non-current and lease liabilities – non-current. Our long-term borrowings, including bank loans, bills payable, and bonds payable, typically carried variable annual interest rates which ranged from 0.72% to 5.26% as of December 31, 2022. For the maturity information and interest rates by currencies, see “Item 11—Quantitative and Qualitative Disclosures about Market Risk—Market Risk—Interest Rate Risk.”
68
We have historically been able to satisfy our working capital needs from our cash flow from operations. We have also historically funded our capacity expansion from internally generated cash and, to the extent necessary, the issuance of equity securities and borrowings. If adequate funds are not available on satisfactory terms, we may be forced to curtail our expansion plans. Moreover, our ability to meet our working capital needs from cash flow from operations will be affected by the demand for our packaging services, testing services, and EMS, which in turn may be affected by several factors. Many of these factors are outside of our control, such as economic downturns and declines in the prices of our services or products caused by a downturn in the industry. See “Item 3. Key Information—Risk Factors—Risks Relating to Our Business—Our operating results are subject to significant fluctuations, which could adversely affect the market value of our Common Shares and ADSs.” To the extent we do not generate sufficient cash flow from our operations to meet our cash requirements, we will have to rely on external financing.
We have provided a portion of our assets, with a carrying value of NT$23,383.5 million (US$760.9 million) as of December 31, 2022, as collateral to secure our obligations under our bank borrowings, tariff guarantees of imported raw materials, or collateral.
Cash Flows
Year Ended December 31, | ||||||||||||||||
2020 | 2021 | 2022 | ||||||||||||||
NT$ | NT$ | NT$ | US$ | |||||||||||||
(in millions) | ||||||||||||||||
Capital expenditures |
(62,077.4) | (70,905.7) | (72,639.9) | (2,363.8) | ||||||||||||
Net cash flows generated from (used in): |
||||||||||||||||
Operating activities |
75,060.6 | 81,733.9 | 111,001.0 | 3,612.1 | ||||||||||||
Investing activities |
(60,946.3) | (49,091.6) | (73,951.9) | (2,406.5) | ||||||||||||
Financing activities |
(21,995.3) | (5,870.8) | (62,458.8) | (2,032.5) |
Net cash generated by operating activities amounted to NT$111,001.0 million (US$3,612.1 million) in 2022, primarily from (i) our operating performance with profit before income tax of NT$81,763.6 million (US$2,660.7 million), and (ii) our non-cash items of depreciation and amortization of NT$55,451.9 million (US$1,804.5 million) and foreign currency exchange loss of NT$6,318.3 million (US$205.6 million), partially offset by (i) the changes in inventories of NT$21,669.1 million (US$705.1 million), and (ii) income tax payment of NT$14,250.5 million (US$463.7 million). Net cash generated from operating activities amounted to NT$81,733.9 million in 2021, primarily from (i) our operating performance with profit before income tax of NT$80,193.8 million, (ii) our non-cash depreciation and amortization in the amount of NT$54,524.3 million, partially offset by the non-cash gain on disposal of China subsidiaries of NT$17,340.4 million, and (iii) the changes in trade receivables, inventories and trade payables of NT$37,628.6 million. The increase in net cash generated from operating activities in 2022 compared to 2021 was primarily due to a decrease in non-cash items of gain on disposal of China subsidiaries and foreign currency exchange gain as well as the cash inflows from decrease in trade receivables, partially offset by cash outflows from a decrease in trade payables and an increase in payment of tax in 2022.
Net cash used in investing activities amounted to NT$73,951.9 million (US$2,406.5 million) in 2022, primarily due to our net payment for property, plant and equipment of NT$71,890.1 million (US$2,339.4 million). Net cash used in investing activities amounted to NT$49,091.6 million in 2021, primarily due to our net payment for property, plant, and equipment of NT$69,300.7 million, partially offset by our proceeds from disposal of China subsidiaries of NT$23,941.3 million. The increase in net cash used in investing activities in 2022 compared to 2021 was primarily due to a decrease in proceeds from disposal of subsidiaries and an increase cash outflow from purchase of property, plant, and equipment.
69
Net cash used in financing activities amounted to NT$62,458.8 million (US$2,032.5 million) in 2022. This amount comprises net proceeds from short-term and long-term bank loans, bills payable, and bonds payable in the amount of NT$31,189.6 million (US$1,015.0 million) and the distribution of cash dividends in the amount of NT$29,990.8 million (US$975.9 million). Net cash used in financing activities amounted to NT$5,870.8 million in 2021. This amount comprises net proceeds from short-term and long-term bank loans, bills payable, and bonds payable in the amount of NT$22,343.2 million, the decrease in non-controlling interests in the amount of NT$6,400.2 million primarily due to the financial cost from the USI Group repurchase of its outstanding shares, and the distribution of cash dividends in the amount of NT$18,082.5 million as well as the payments for repurchase of ordinary shares of NT$5,529.3 million. The increase in net cash used in financing activities in 2022 compared to 2021 was primarily due to an increase cash outflows for repayment of long-term borrowings and payment of cash dividends.
Contractual Obligations
The following table sets forth the maturity of our contractual obligations as of December 31, 2022.
Payments due to period | ||||||||||||||||||||
Total | Less than 1 Year |
1 to 3 Years | 3 to 5 Years | More than 5 Years |
||||||||||||||||
(in NT$ millions) | ||||||||||||||||||||
Contractual Obligations: |
||||||||||||||||||||
Short-Term debts(1) |
470.4 | 470.4 | - | - | - | |||||||||||||||
Long-term debts(2) |
157,706.5 | 13,580.8 | 119,331.4 | 19,145.6 | 5,648.7 | |||||||||||||||
Lease liabilities(3) |
8,946.1 | 1,112.8 | 1,598.9 | 1,087.1 | 5,147.3 | |||||||||||||||
Purchase obligations(4) |
29,727.6 | 29,727.6 | - | - | - | |||||||||||||||
|
|
|
|
|
|
|
|
|
|
|||||||||||
Total(5)(6)(7) |
196,850.6 | 44,891.6 | 120,930.3 | 20,232.7 | 10,796.0 | |||||||||||||||
|
|
|
|
|
|
|
|
|
|
(1) | Includes short-term borrowings and financial liabilities for hedging – current and interest payments. |
(2) | Includes long-term and current portion of borrowings, bills payable, bonds payable, and financial liabilities for hedging – non-current (before the deduction of unamortized arrangement fees, unamortized issuance cost, and discounts on bonds payable) and interest payments. |
(3) | Represents our commitments under leases liabilities and imputed interest which are mainly from land and buildings and improvements. See Note 16 to our consolidated financial statements included in this annual report. |
(4) | Represents material commitments to purchase machinery and equipment of approximately NT$31,590.3 million (US$1,028.0 million), of which NT$1,862.7 million (US$60.6 million) had been paid as of December 31, 2022. |
(5) | Excludes material commitments for construction of approximately NT$28,085.3 million (US$913.9 million), of which NT$1,827.2 million (US$59.5 million) had been paid as of December 31, 2022, since the schedule of payments is difficult to determine. |
(6) | Excludes our unfunded defined benefit obligation since the schedule of payments is difficult to determine. Under defined benefit pension plans, we made pension contributions of approximately NT$736.5 million (US$24.0 million) in 2022, and we estimate that we will contribute approximately NT$547.2 million (US$17.8 million) in 2023. See note 23 to our consolidated financial statements included in this annual report. |
(7) | Excludes uncertain tax liabilities. We recognized additional taxes payable of NT$167.1 million (US$5.4 million) and accrued interest and penalties of NT$18.5 million (US$0.6 million) related to uncertain tax positions as of or for the year ended December 31, 2022. Because we were unable to make a reasonable estimate of the timing of the tax audits, such balances were not included in the table. |
As of December 31, 2022, we were not in breach of any of the financial covenants under our existing loan agreements. See “Item 3. Key Information—Risk Factors—Risks Relating to Our Business—Restrictive covenants and broad default provisions in our existing debt agreements may materially restrict our operations as well as adversely affect our liquidity, financial condition, and results of operations.”
As of December 31, 2022, we had no contingent obligations, which normally consist of guarantees provided by us to our subsidiaries.
Capital Expenditures
We have made, and expect to continue to make, substantial capital expenditures in connection with the expansion of our production capacity. The table below sets forth our principal capital expenditures incurred for the periods indicated.
Year Ended December 31, | ||||||||||||
2020 | 2021 | 2022 | ||||||||||
NT$ | NT$ | NT$ | ||||||||||
(in millions) | ||||||||||||
Land |
- | 1,126.0 | 1,453.8 | |||||||||
Building and improvements |
50,237.1 | 56,546.4 | 24,241.9 | |||||||||
Machinery and equipment |
8,787.1 | 16,745.1 | 50,104.9 | |||||||||
|
|
|
|
|
|
|||||||
Total |
59,024.2 | 74,417.5 | 75,800.6 | |||||||||
|
|
|
|
|
|
70
We had commitments for capital expenditures of approximately NT$59,675.6 million (US$1,941.9 million), of which NT$3,689.9 million (US$120.1 million) had been prepaid as of December 31, 2022, primarily in connection with the expansion of our operations. We estimate that our environmental capital expenditures for 2023 will be approximately US$27.3 million, of which 22.54% will be used in climate change adaptation. We may adjust our capital expenditures based on market conditions, the progress of our expansion plans, and cash flow from operations. Due to the rapid changes in technology in the semiconductor industry, we frequently need to invest more in land, buildings, factories as well as machinery and equipment, which may require us to raise additional capital. As we are responsive to changing customer needs and could expand our footprint to other countries and regions if needed in the future, we cannot ensure that we will be able to raise additional capital should it become necessary on terms acceptable to us, or at all. See “Item 3. Key Information—Risk Factors—Risks Relating to Our Business—If we are unable to obtain sufficient funding in a timely manner or on acceptable terms, our results of operations and financial conditions may be materially and adversely affected.”
We believe that our cash and cash equivalents, short-term investments, expected cash flow from operations, and existing credit lines under our loan facilities will be sufficient to meet our capital expenditures, purchase commitments, working capital, cash obligations under our existing debts and lease arrangements, and other business requirements associated with existing operations, over the next 12 months and beyond. We currently hold cash primarily in U.S. dollars, RMB, New Taiwan dollars, Korean Won, Japanese yen, and EUR. As of December 31, 2022, we had contractual obligations of NT$165,821.8 million (US$5,396.1 million) due in the next three years. We currently expect to meet our payment obligations through the expected cash flow from operations, long-term borrowings, and the issuance of additional equity. We will continue to evaluate our capital structure and periodically may decide to increase or decrease our financial leverage through equity offerings or borrowings. The issuance of additional equity securities may result in additional dilution to our shareholders.
We regularly evaluate possible investments, acquisitions, or divestments and may, if a suitable opportunity arises, make an investment, acquisition, or divestment.
Our exposure to financial market risks relates primarily to changes in foreign currency exchange rates that arise from ordinary business operations. To mitigate these risks, we utilize derivative instruments. All derivative transactions entered into by us were designated as either hedging or trading. We have sometimes entered into interest rate swap transactions to hedge our interest rate exposure. In addition, we have sometimes entered into forward exchange contracts, swap contracts, cross-currency swap contracts, and foreign currency options contracts to hedge our existing assets and liabilities denominated in foreign currencies. See “Item 11. Quantitative and Qualitative Disclosures about Market Risk” and Notes 7, 8 and 34 to our consolidated financial statements included in this annual report.
RESEARCH AND DEVELOPMENT
For 2021 and 2022, our research and development expenditures totaled approximately NT$21,053.6 million and NT$24,369.9 million (US$793.0 million), respectively. These expenditures represented approximately 3.7% of operating revenues in both 2021 and 2022. As of December 31, 2022, we had a research and development team of 11,033 employees. We cultivate and maintain a research and development engineering team that continuously surveys and adapts to the latest trends in technology. Our research and development activities are primarily directed toward optimizing relevant technologies in key components, manufacturing processes, and product development. Our research and development objectives are to enhance the performance of our products and drive greater business growth. To incentivize innovation and encourage our employees to engage in research and development, we offer cash rewards to employees that contribute significantly to our research efforts.
Packaging
We centralize our research and development efforts in packaging technology in our Kaohsiung and Taichung facilities in Taiwan. After initial phases of development, we conduct pilot runs in one of our facilities before new technologies or processes are implemented commercially at other sites. Facilities with special product expertise, such as ASE Korea, also conduct research and development of these specialized products and technologies at their sites. One of the areas of emphasis for our research and development efforts is improving the efficiency and technology of our packaging processes, and these efforts are expected to continue. We are also investing significant research and development efforts into the development and adoption of innovative technology. We work closely with manufacturers of our packaging equipment and materials in designing and developing the equipment and materials used in our production process. We also collaborate with our significant customers to jointly develop new product and process technologies.
71
In addition to investing in the development of more advanced packaging technology and improving production efficiency, a significant portion of our research and development efforts is focused on the development of IC substrate production technology for BGA packaging. Substrate is the principal raw material for BGA packages. Development and production of IC substrates involve complex technology. We are currently working closely with certain first-tier substrate suppliers in Asia, primarily including those located in Japan, Taiwan, Korea, and the P.R.C. We believe that our successful cooperation with substrate suppliers to enhance overall substrate production capability and meet future package requirements has enabled us to capture an increasingly important value-added component of the packaging process and helped ensure a stable and cost-effective supply of substrates for our BGA packaging operations and shortened time to market.
Testing
Our research and development efforts in testing have focused primarily on developing advanced testing solutions for mmWave, SiP, silicon photonics, and optical sensor modules; characterization of semiconductors, layout design and electrical simulation for high-frequency test board and developing software of parametric test data analysis. With the maturity of advanced processes, reliability becomes increasingly significant. We have developed a high-power cooling system of “burn in” to improve the reliability of products for customers. We also develop WiFi6e low-cost test technology, optical communication, and millimeter wave test technology to meet the development needs of today’s wireless communication technology. Besides working closely with our customers on the leading-edge test technologies, our research and development operations also include an equipment development group, which currently designs testing hardware and software for specific semiconductors to offer our customers cost-effective test solutions.
EMS
To further enhance the quality of our services and products and increase competitiveness, we focus on developing diversified and innovative products. By leveraging our proprietary research and development expertise, we are able to optimize our product design, engineering, and manufacturing capabilities to provide our customers with high-performance and cost-effective products and services. During the process of designing, as well as developing, the technology for our software and hardware, our research and development team also dedicates itself to discovering new information and applying it to create new, advanced, and improved products, processes, methodology, and services. We are currently investing in the development of products used in EMS in relation to computing and peripherals, communications, consumer products, automotive, industrial, and server applications.
TREND INFORMATION
Other than as disclosed elsewhere in this annual report, we are not aware of any trends, uncertainties, demands, commitments, or events for the period from January 1, 2022 to December 31, 2022 that are reasonably likely to have a material effect on our operating revenues, income, profitability, liquidity or capital resources, or that caused the disclosed financial information to not be indicative of future operating results or financial conditions.
SAFE HARBOR
Please see the section entitled “Special Note Regarding Forward-Looking Statements.”
Item 6. Directors, Senior Management and Employees
DIRECTORS AND SENIOR MANAGEMENT
Directors
Our board of directors is elected by our shareholders in a shareholders’ meeting at which a quorum, consisting of a majority of all issued and outstanding Common Shares, not including treasury stocks and Common Shares held by our subsidiaries, is present. The chairman is elected by the board from among the directors. Our 13-member board of directors, including three independent directors, is responsible for the management of our business.
72
We currently have 13 directors, each serving a three-year term. The current board of directors was elected in an annual general shareholders’ meeting on August 12, 2021 and began serving on August 13, 2021. Directors may serve any number of consecutive terms and may be removed from office at any time by a resolution adopted at a meeting of shareholders. Normally, all board members are elected at the same meeting of shareholders, except where the posts of one-third or more of the directors are vacant, at which time an extraordinary general shareholders’ meeting shall be convened to elect directors to fill the vacancies. We and our subsidiaries do not have service contracts with our directors that provide for benefits upon termination of employment.
Audit Committee
Our audit committee currently consists of Shen-Fu Yu, the chairman of our audit committee, and Mei-Yueh Ho and Wen-Chyi Ong, who are independent under Rule 10A-3 and the R.O.C. Securities and Exchange Act and are financially literate with accounting or related financial management expertise. Our audit committee is entrusted with the same duties and responsibilities as set out in Rule 10A-3(b) under the Exchange Act. Pursuant to the Article 14-4 of the R.O.C. Securities and Exchange Act, our audit committee was established on June 22, 2018 in lieu of supervisors to exercise the powers and duties of supervisors stipulated in the R.O.C. Company Law and other applicable laws and regulations. Our audit committee meets at least once every quarter but may meet at any time deemed necessary. Our board of directors has adopted a committee charter for the audit committee. Our audit committee’s responsibilities and powers include, but are not limited to, assistance with the board of directors in fulfilling its quality and integrity in supervising the implementation of relevant accounting, internal auditing, financial reporting procedures, and financial controls. In addition, in order to enhance corporate governance, the audit committee also takes responsibility for overseeing the policy and procedures for complaints and concerns regarding accounting, internal accounting controls, auditing matters, violations of Code of Business Conduct and Ethics, or unethical conduct.
Compensation Committee
Our compensation committee currently consists of Shen-Fu Yu, the chairman of our compensation committee, Wen-Chyi Ong, and Hsiao-Ying Ku. Our board of directors established a compensation committee to satisfy the requirements under the R.O.C. Securities and Exchange Act. According to the Taiwan Stock Exchange Corporation Operation Directions for Compliance with the Establishment of Board of Directors by TWSE Listed Companies and the Board’s Exercise of Powers, a majority of compensation committee’s members shall be independent directors. In addition, according to the R.O.C. Securities and Exchange Act and the Regulations Governing the Appointment and Exercise of Powers by the Remuneration Committee of a Company Whose Stock Is Listed on the TWSE or the Taipei Exchange, compensation committee members shall have at least one independent director. We do not assess the independence of our compensation committee member(s) under the independence requirements of the NYSE listing standards but adopt the independence standard as promulgated under the R.O.C. Regulations Governing the Appointment and Exercise of Powers by the Remuneration Committee of a Company Whose Stock Is Listed on the TWSE or the Taipei Exchange. See “Item 16G. Corporate Governance” for more information. Our compensation committee meets at least twice a year. Our board of directors has adopted a compensation committee charter for our compensation committee. The compensation committee shall exercise the due care of a good administrator and faithfully perform the duties listed below, and shall submit its recommendations to the board of directors for discussion. (i) Prescribe and periodically review the performance review and remuneration policy, system, standards, and structure for directors and managerial officers. (ii) Periodically evaluate and prescribe the remuneration of directors managerial officers. (iii) The compensation committee shall exercise the care of a good administrator to examine remuneration system for directors, supervisors and managerial officers adopted by the board of directors of a subsidiary and the reference data related to the remuneration of directors, supervisors, and managerial officers submitted by the subsidiary and submit its opinion to the board of directors.
73
Risk Management Committee
Our risk management committee currently consists of Shen-Fu Yu, the chairman of our risk management committee, Mei-Yueh Ho, and Du-Tsuen Uang. In December 2019, our board of directors established a risk management committee, which comprises a majority of independent directors, and approved its charter to enable us to discover and preempt internal and external operational risks. On September 30, 2021, our board of directors reappointed the aforementioned committee members as the members of the second risk management committee. The risk management committee is responsible for overseeing overall risk management, implementing the decisions of the board of directors in connection to risk management, coordinating and promoting interdepartmental risk management plans, supervising and managing overall risk control and remedial mechanisms, and auditing and integrating each risk control report. The risk management committee files an annual report to our board of directors to inform the board about the status of risk management implementation and share insights for optimization.
The following table sets forth information regarding all of our directors as of January 31, 2023. In accordance with R.O.C. law, each of our directors is elected either in his or her capacity as an individual or as an individual representative of a corporation or government. Persons designated to represent corporate or government shareholders as directors are nominated by such shareholders at the shareholders’ meeting and may be replaced as representatives by such shareholders at will. Of the current directors, nine represent ASE Enterprises Limited. The remaining directors serve in their capacity as individuals.
Name |
Position |
Director Since |
Age | Other Significant Positions Held Outside of ASEH | ||||
Jason C.S. Chang(1)(2) |
Director and Chairman |
2018 | 78 | None | ||||
Richard H.P. Chang(1)(2) |
Director, Vice Chairman and President |
2018 | 76 | Chairman, Sino Horizon Holdings Ltd. | ||||
Chi-Wen Tsai(2) |
Director; Chairman and President, SPIL |
2018 | 75 | None | ||||
Yen-Chun Chang(2) |
Director; Chief Operating Officer, SPIL |
2021 | 67 | None | ||||
Tien Wu(2) |
Director and Chief Operating Officer |
2018 | 65 | None | ||||
Joseph Tung(2) |
Director and Chief Financial Officer |
2018 | 64 | None | ||||
Raymond Lo(2) |
Director; General Manager, Kaohsiung packaging facility |
2018 | 68 | None | ||||
Tien-Szu Chen(2) |
Director; General Manager, ASE Inc. Chung-Li branch |
2018 | 61 | None | ||||
Jeffrey Chen(2) |
Director; Chairman, Universal Scientific Industrial (Shanghai) Co., Ltd. |
2018 | 58 | Independent Director, and a member of the compensation committee and audit committee, Mercuries & Associates Holding Ltd. | ||||
Rutherford Chang(3) |
Director; General Manager, China Region of ASE Inc. |
2018 | 43 | None | ||||
Shen-Fu Yu |
Independent Director and Member, Audit Committee, Compensation Committee, and Risk Management Committee |
2018 | 78 | Independent Director, TaiGen Biopharmaceuticals Holdings Ltd. | ||||
Mei-Yueh Ho |
Independent Director and Member, Audit Committee, and Risk Management Committee |
2018 | 72 | Independent Director, Center Laboratories, Inc. and Onward Therapeutics SA; Director, KINPO Electronics Inc. | ||||
Wen-Chyi Ong |
Independent Director and Member, Audit Committee, and Compensation Committee |
2021 | 63 | Independent Director, Formosa Plastics Corporation |
(1) | Jason C.S. Chang and Richard H.P. Chang are brothers. |
(2) | Representative of ASE Enterprises Limited, a company organized under the laws of Hong Kong, which held 15.66% of our total outstanding shares as of January 31, 2023. All of the outstanding shares of ASE Enterprises Limited are held through intermediary holding companies and under a revocable trust established under the laws of the Bailiwick of Guernsey for the benefit of our Chairman, Jason C.S. Chang, and his family. |
(3) | Rutherford Chang is the son of Jason C.S. Chang. |
74
Executive Officers
The following table sets forth information regarding all of our executive officers as of January 31, 2023.
Name |
Position |
Years with the Company |
Age | |||
Jason C.S. Chang |
Chairman |
38 | 78 | |||
Richard H.P. Chang |
Vice Chairman and President |
38 | 76 | |||
Chi-Wen Tsai |
Chairman and President, SPIL |
38 | 75 | |||
Yen-Chun Chang |
Director and Chief Operating Officer, SPIL |
38 | 67 | |||
Tien Wu |
Chief Operating Officer |
22 | 65 | |||
Joseph Tung |
Chief Financial Officer |
28 | 64 | |||
Raymond Lo |
General Manager, ASE Test Taiwan and Kaohsiung packaging facility |
36 | 68 | |||
Tien-Szu Chen |
General Manager, ASE Inc. Chung-Li branch |
34 | 61 | |||
Rutherford Chang |
General Manager, China Region of ASE Inc. |
17 | 43 | |||
Du-Tsuen Uang |
Chief Administration Officer |
20 | 63 | |||
Chun-Che Lee |
General Manager, ASE Electronics |
38 | 63 | |||
Chung Lin |
General Manager, ASE Shanghai |
18 | 59 | |||
Gichol Lee |
General Manager, ASE Korea |
25 | 60 | |||
Chih-Hsiao Chung |
General Manager, ASE Japan and Wuxi Tongzhi |
23 | 58 | |||
Kwai Mun Lee |
President, ASE South-East Asia operations |
24 | 60 | |||
Yean Peng Chen |
General Manager, ASE Singapore Pte. Ltd. |
24 | 51 | |||
Heng Ee Ooi |
General Manager, ASE Malaysia |
28 | 54 | |||
Kenneth Hsiang |
Chief Executive Officer, ISE Labs and ISE Shanghai |
23 | 52 | |||
Chi-Pin Chang |
General Manager, Siliconware USA, Inc. |
33 | 55 | |||
Kevin Yu |
General Manager, SZ |
27 | 49 | |||
Jeffrey Chen |
Chairman, Universal Scientific Industrial (Shanghai) Co., Ltd. |
28 | 58 | |||
Chen-Yen Wei |
Chairman, Universal Scientific Industrial Co., Ltd.; President, Universal Scientific Industrial |
43 | 68 | |||
Jing Cao |
General Manager, UGJQ |
7 | 63 | |||
Ta-I Lin |
General Manager, UGKS |
35 | 59 | |||
Yueh-Ming Lin |
General Manager, Universal Global Technology (Huizhou) Co., Ltd. |
27 | 57 | |||
Hui-Min Liu |
General Manager, UNIVERSAL SCIENTIFIC INDUSTRIAL VIETNAM COMPANY LIMITED |
19 | 50 | |||
Bernardo Santos Balderrama |
General Manager, USI Mexico |
3 | 54 | |||
Gilles Benhamou |
Chief Executive Officer, ASTEELFLASH TECHNOLOGIE and Chairman, |
23 | 69 | |||
Ying Pin Wu |
General Manager, Asteelflash Suzhou Co., Ltd. |
14 | 56 |
Biographies of Directors and Executive Officers
Jason C.S. Chang has served as chairman and principal executive officer of ASEH since its founding in April 2018. He is also chairman of ASE Inc. Dr. Chang holds a bachelor’s degree in Electrical Engineering from National Taiwan University in Taiwan and a master’s degree from Illinois Institute of Technology. Dr. Chang received an Honorary Degree of Doctor of Engineering from National Sun Yat-sen University in Taiwan in November 2018 and an Honorary Degree of Doctor of Engineering from National Cheng Kung University in Taiwan in July 2022. He is the brother of Richard H.P. Chang, our vice chairman and president.
Richard H.P. Chang has served as vice chairman and president of ASEH since its founding in April 2018. Mr. Chang holds a bachelor’s degree in Industrial Engineering from Chung Yuan Christian University in Taiwan. He is the brother of Jason C.S. Chang, our chairman.
Chi-Wen Tsai has served as a director of ASEH since its founding in April 2018. Mr. Tsai has been SPIL’s director since August 1984. Mr. Tsai is currently chairman and president of SPIL. Mr. Tsai holds a bachelor’s degree in Electrical Engineering from National Taipei Institute of Technology in Taiwan.
Yen-Chun Chang has served as a director of ASEH since August 2021. He is currently a director and chief operating officer of SPIL. Mr. Chang was a (senior) vice president of SPIL from March 2000 to February 2021. Mr. Chang had worked as an engineer at Lingsen Precision Industries, Ltd. Mr. Chang holds a bachelor’s degree in Electronic Engineering from Southern Taiwan University of Science and Technology.
75
Tien Wu has served as a director and chief operating officer of ASEH since its founding in April 2018. Dr. Wu is currently the chief executive officer of ASE Inc. Prior to joining ASE Inc. in March 2000, Dr. Wu had worked at IBM. Dr. Wu holds a bachelor’s degree in Civil Engineering from National Taiwan University in Taiwan, and a master’s and a doctorate degree in Mechanical Engineering and Applied Mechanics from the University of Pennsylvania. In 2015, Dr. Wu received an Honorary Degree of Doctor of Science from Binghamton University in New York.
Joseph Tung has served as a director and chief financial officer of ASEH since its founding in April 2018. He was a director of ASE Inc. from April 1997 to December 2020 and chief financial officer of ASE Inc. from December 1994 to July 2020. He was an independent director of Ta Chong Bank Ltd. from October 2007 to December 2017. Before joining ASE Inc., Mr. Tung was a vice president at Citibank, N.A. Mr. Tung holds a bachelor’s degree in Economics from National Chengchi University in Taiwan and a master’s degree in Business Administration from the University of Southern California.
Raymond Lo has served as a director of ASEH since its founding in April 2018 and general manager of our packaging facility in Kaohsiung, Taiwan since April 2006. Mr. Lo also served as a supervisor of ASE Inc. between July 2000 and May 2006 and director of ASE Inc. since May 2006. Before joining ASE Inc., Mr. Lo was a director of quality assurance at Zeny Electronics Co. Mr. Lo holds a bachelor’s degree in Electronic Physics from National Chiao Tung University in Taiwan.
Tien-Szu Chen has served as a director of ASEH since its founding in April 2018. Mr. Chen has served as a director of ASE Inc. since June 2015 and general manager of ASE Inc. Chung-Li branch since August 2015. He has also served as a supervisor of ASE Inc. from June 2006 to June 2015 and president of PowerASE Technology Inc. from June 2006 to May 2012. Prior to joining ASE Inc. in June 1988, Mr. Chen worked at TSMC and Philips Semiconductor Kaohsiung. Mr. Chen holds a bachelor’s degree in Industrial Engineering from Chung Yuan Christian University in Taiwan.
Jeffrey Chen has served as a director of ASEH since its founding in April 2018 and he has also served as a director of ASE Inc. since June 2003. Mr. Chen has served as chairman of Universal Scientific Industrial (Shanghai) Co., Ltd. since June 2018. Prior to joining ASE Inc., he worked in the corporate banking department of Citibank, N.A. in Taipei and as a vice president of corporate finance at Bankers Trust in Taipei. Mr. Chen holds a bachelor’s degree in Finance and Economics from Simon Fraser University in Vancouver, Canada and a master’s degree in Business Administration from the University of British Columbia in Canada.
Rutherford Chang has served as a director of ASEH since its founding in April 2018. He has also served as a director of ASE Inc. since June 2009 and general manager of China Region of ASE Inc. since June 2010. Mr. Chang holds a bachelor’s degree in Psychology from Wesleyan University in Connecticut. He is the son of Jason C.S. Chang, our chairman.
Shen-Fu Yu has served as an independent director of ASEH since June 2018. Mr. Yu is also a member of the audit committee, compensation committee, and risk management committee of ASEH. He is an independent director, and a member of the audit committee and compensation committee of TaiGen Biopharmaceuticals Holdings Ltd. He worked at the Deloitte & Touche accounting firm as a consultant from June 2003 to November 2006. Mr. Yu holds a bachelor’s degree in Accounting from National Taiwan University in Taiwan and a master’s degree in Accounting from National Chengchi University in Taiwan.
Mei-Yueh Ho has served as an independent director of ASEH since June 2018. She is also a member of the audit committee and risk management committee of ASEH. Ms. Ho is an independent director and a member of the audit committee of Center Laboratories, Inc. and Onward Therapeutics SA. She is also a member of the compensation committee of Center Laboratories, Inc. and a board director of KINPO Electronics Inc. Ms. Ho served as Minister of Ministry of Economic Affairs, R.O.C. from May 2004 to January 2006. She was also Chairperson of the Council for Economic Planning and Development, R.O.C. from May 2007 to May 2008. Ms. Ho holds a bachelor’s degree in Agricultural Chemistry from National Taiwan University in Taiwan.
76
Wen-Chyi Ong has served as an independent director of ASEH since August 2021. Mr. Ong is also a member of the audit committee and compensation committee. Mr. Ong is now an adjunct professor of finance at the Business School of National Chengchi University in Taipei. In July 2017, Mr. Ong was invited by the board of the SinoPac Financial Holding Company to lead the distressed financial institution. Spending three years with the bank, Mr. Ong successfully turned the bank around in terms of profitability and corporate governance. Prior to this private sector job, Mr. Ong was chairman of the state-owned Chunghwa Post Company. Before returning to Taipei, Mr. Ong was Taiwan’s representative to India between 2008 and 2012. With ambassadorial ranking, he played a critical role in enhancing India-Taiwan’s economic and cultural relations. In 2005, Mr. Ong was appointed by Taiwan’s Financial Supervisory Commission (FSC) to set up a representative office in New York where he worked closely with U.S. financial regulators for cross-border supervision. Prior to New York, Mr. Ong was a Trade Negotiator representing Taiwan at the World Trade Organization. He spent three years in Geneva. In Taiwan, Mr. Ong was a financial regulator for foreign banks for two years and director for the QFII (Qualified Foreign Institutional Investors) business for four years. In his earlier career, he spent six years in Washington, DC as a junior Foreign Service Officer. Mr. Ong graduated from the National Taiwan University in 1981, majoring in international relations. In 1998, Mr. Ong enrolled in the Cass Business School of the City University, London, where he earned an MS degree in investment and risk management.
Du-Tsuen Uang has served as chief administrative officer of ASEH since its founding in April 2018. He also has served as chief corporate governance officer of ASEH since March 2019, and chief risk officer of ASEH since February 2020. As one of ASEH’s managing team members, Mr. Uang has also served as chief administrative officer of ASE Inc. since August 2017. Other than the aforementioned positions, Mr. Uang has also served as the chairman/ general manager of Advanced Semiconductor Engineering (China) Ltd., general manager/ director of ASE Social Enterprise Co., Ltd. and ASE Assembly & Test (Shanghai) Limited, and a director of ASE Environmental Protection and Sustainability Foundation, ASE Cultural & Educational Foundation, ASE Inc., USI Shanghai, Hung Ching and Sino Horizon Holdings Ltd. Prior to joining ASEH, Mr. Uang was the Dean and professor in the law department at Ming Chuan University. He is an Honorary Professor at Ming Chuan University in the law department. Mr. Uang was also a senior chief secretary of the Taiwan Ministry of Economic Affairs Central Bureau of Standards, commissioner of Taiwan FTC, an independent director of First Commercial Bank. Mr. Uang received his Ph.D. in Law from National Cheng-Chi University in Taiwan.
Chun-Che Lee has served as general manager of ASE Electronics since August 2011, prior to which he was vice president, director, and manager of research and development of ASE Inc. since 1984. Mr. Lee holds a bachelor’s degree in Aeronautics from Tamkung University in Taiwan.
Chung Lin has served as general manager of ASE Shanghai since May 2018 and vice president of ASESH AT since May 2012, after serving as vice president of ASEWH since 2010 and ASE Shanghai since May 2005. Mr. Lin holds a master’s degree in Computer Science from Columbia University.
Gichol Lee has served as general manager of ASE Korea since November 2019. Mr. Lee was previously the vice president of Business Systems with Motorola and then ASE Korea. Prior to his current position, he has held various managerial positions with DuPont and Unilever. He holds a master’s degree from Columbia University.
Chih-Hsiao Chung has served as general manager of ASE Japan since March 2011 and general manager of Wuxi Tongzhi since June 2013. Mr. Chung has also managed the sales and marketing of the ASE Japan region since April 2007. Before joining ASE Inc., Mr. Chung was a senior manager of sales and marketing at Kimberly Clark Co., Taiwan. He holds a master’s degree in Business Administration from the University of Wisconsin-Madison.
Kwai Mun Lee has served as president of our Southeast Asia operations, with responsibility for the operations of our Penang, Malaysia, and Singapore manufacturing facilities, since March 2006 and as general manager of ASE Singapore from May 1999 to February 2006. Before joining ASE Inc., Mr. Lee held senior management positions at Chartered Semiconductor and STATS ChipPAC. He started his career as an engineer at Intel. He holds a degree in Engineering from Swinburne Institute of Technology in Australia.
Yean Peng Chen has served as general manager of ASE Singapore Pte. Ltd. since January 2019. He has also worked at ISE Labs before being appointed as vice president of operations in ASE Singapore in July 2015. He started his career as an equipment engineer at STATS ChipPAC Ltd. Mr. Chen holds a diploma in Electronic and Computer Engineering from Ngee Ann Polytechnic in Singapore.
Heng Ee Ooi has served as general manager of ASE Malaysia since July 2016 after serving as vice president of operations since July 2015. He joined ASE Inc. in July 1994. Before joining ASE Inc., he worked as a process engineer at AMD, Penang. Mr. Ooi holds a bachelor’s degree in Chemical Engineering from Universiti Teknologi Malaysia.
77
Kenneth Hsiang has served as chief executive officer of ISE Labs and ISE Shanghai since 2019 and served as general manager of ISE Labs from June 2004 to 2019. Prior to joining ASE Inc. in November 1999, Mr. Hsiang worked in various management positions within finance and strategic analysis in the healthcare and biotech industries in the San Francisco Bay area in California. He also worked for Price Waterhouse LLP as a certified public accountant. Mr. Hsiang received a bachelor’s degree in Economics and Rhetoric from the University of California, Berkeley.
Chi-Pin Chang has joined SPIL in 1989 and served as R&D engineer. In 1993, he joined SPIL’s new established Technical Service department serving North America accounts and transferred to Siliconware USA, Inc. in 2001, as Director of FAE in North America. In 2003 he took over as Senior Director of Sales and FAE, eventually becoming Senior Vice President of Business Management in 2018. He was appointed as president and chief executive officer of Siliconware USA, Inc. in December 2022. Mr. Chang holds a bachelor’s degree in Electrical Engineering from National Yunlin Institute of Technology.
Kevin Yu has served as general manager of SZ since December 2021. He holds a bachelor’s degree in Electrical Engineering from Minghsin University in Taiwan.
Chen-Yen Wei has served as chairman of Universal Scientific Industrial Co., Ltd. since July 2014 and president of Universal Scientific Industrial (Shanghai) Co., Ltd. since April 2008. He joined Universal Scientific Industrial as an engineer in August 1979. He holds a bachelor’s degree in Communication Engineering from National Chiao Tung University in Taiwan.
Jing Cao serves as Sr. Vice President, General Manager of USI Asia Region, SiM Business Unit, and Smart Manufacturing of Universal Scientific Industrial Co. Ltd. (USI). He joined USI on April 15, 2015 as Sr. VP of Operations and Smart Manufacturing, expanded his responsibilities to GM of Zhangjing Site in January 2018 then to GM of SiM BU and USI Shanghai in March, 2020. Prior to joining USI, he worked as Senior Vice President of Operations of UTAC Group and other executive positions at several public semiconductor companies in the United States. Jing Cao holds a master’s degree in mechanical engineering and a master’s degree in industrial engineering from Arizona State University in the United States.
Ta-I Lin has served as general manager of UGKS since August 2011. He joined USI as an engineer in August 1987. He holds a bachelor’s degree in Electrical Engineering from National Cheng Kung University in Taiwan and an executive master’s degree in Business Administration from Peking University in China.
Yueh-Ming Lin has served as general manager of USIHZ since April 2019 and vice president of the Global Operation Management (Shenzhen) Division of USISZ since February 2017. He joined USI as a section manager in October 1995. He holds a bachelor’s degree in Electrical Engineering from Feng Chia University in Taiwan.
Hui-Min Liu has served as general manager of UNIVERSAL SCIENTIFIC INDUSTRIAL VIETNAM COMPANY LIMITED since May 2021 and vice president of ALCMM group of USI since December 2020. He joined USI as an assistant manager in October 2003. He holds a master’s degree in Mechanical Engineering from YUNLIN University of Science and Technology in Taiwan.
Bernardo Santos Balderrama has served as USI Mexico assistant vice president since September 2019 and general manager since May 2020. He worked in various OEM companies including Visteon Electronics in Chihuahua Chih. Mexico, Delphi Mechatronics Systems in Matamoros, Tamaulipas, Mexico, and he became the operations director of Jabil Guadalajara, which is Jabil’s largest site in the Americas, where he stayed until he joined USI Mexico. He holds a bachelor’s degree in Mechanical Design Engineering, a second degree in Electronics Engineering and a master’s degree in Business Administration from Universidad Autonoma de Nuevo Leon. He is also certified as a Six Sigma Black Belt by the ASQ.
Gilles Benhamou has served as chief executive officer of ASTEELFLASH TECHNOLOGIE since January 2005 and Chairman of Asteelflash Suzhou Co., Ltd. since April 2008. He founded ASTEEL in 1999 which was the predecessor of ASTEELFLASH. He has been responsible for sales and marketing, manufacturing, and procurement for FAFG Group. He holds a master’s degree in Engineering from Ecole Polytechnique in France.
78
Ying Pin Wu has served as general manager of ASTEELFLASH SUZHOU CO., LTD. since January 2009. He joined ASTEELFLASH Group in 2008 via the Flash Electronics, Inc. acquisition by ASTEEL. He previously served in a variety of finance positions within Flash Electronics, Inc. and now is responsible for operations in both sales & marketing, manufacture, and procurement in FAFG APAC region and USI Kunshan site. He holds a master’s degree in Business Administration from California State University.
The business address of our directors and executive officers is our registered office.
COMPENSATION
In 2022, we recorded expenses of approximately NT$2,411.9 million (US$78.5 million) as remuneration to our directors and executive officers. In 2022, we accrued pension costs of NT$7.7 million (US$0.3 million) for retirement benefits for our management.
According to our Articles of Incorporation, the remuneration of our independent directors is set at NT$3.0 million (US$0.1 million) per person per year. We set aside 0.01% to 1.00% of net profit before income tax as employees’ compensation and remuneration to the directors and no more than 0.75% as remuneration to the directors. We recorded NT$248.6 million (US$8.1 million) as compensation to our directors for the year ended December 31, 2022. If there is a change in the proposed amounts after the consolidated financial statement authorized for issue, the differences are recorded as a change in accounting estimate and will be adjusted in the following year. We have not provided any loans to, or guarantees for, the benefit of any of our directors or executive officers. For information regarding our pension and other retirement plans and those of our subsidiaries, see Note 23 to our consolidated financial statements included in this annual report. On March 30, 2023, our board of directors approved the directors’ compensation in the amount of NT$247.0 million (US$8.0 million).
Employee Compensation
We award bonuses to employees of ASEH and its subsidiaries who are located in Taiwan based on overall income and individual performance targets. Employees are eligible to receive bonuses in the form of our Common Shares valued at the closing price (after adjustment with consideration of the effects on the share price, if any, brought by cash and stock dividends resolved at shareholders’ meetings) of our Common Shares on the day prior to our meeting of the board of directors. Actual amounts of compensation to individual employees are determined based upon the employee meeting specified individual performance objectives. We recorded NT$155.4 million (US$5.1 million) as compensation to our employees for the year ended December 31, 2022. If there is a change in the proposed amounts after the consolidated financial statement authorized for issue, the differences are recorded as a change in accounting estimate and will be adjusted in the following year. On March 30, 2023, our board of directors approved the employees’ compensation in the amount of NT$155.5 million (US$5.1 million) in cash.
Share-Based Payment Arrangements
ASEH Employee Share Option Plans
ASEH assumed ASE’s 2010 and 2015 employee stock option plans on April 30, 2018. In August 2018, our board of directors and FSC both approved the first ASEH employee share options plan. The 2010 employee stock option plan was forfeited or exercised during 2021, and as a result, ASEH currently maintains two employee stock option plans, adopted in 2015 and 2018.
Pursuant to these plans, our full-time employees are eligible to receive share options. Each share option represents the right to purchase one ordinary share of the Company when exercised. Under the terms of the plan, share options are granted at an exercise price equal to or not less than the closing price of the ordinary shares listed on the TWSE at the issue date. The right of those share options granted under the plan is valid for 10 years, non-transferable and exercisable at certain percentages subsequent to the second anniversary of the grant date. For any subsequent changes in the Company’s capital structure or when cash dividend per ordinary share exceeds 1.5% of the market price per ordinary share, the exercise price is accordingly adjusted.
As of December 31, 2022, 8,625 thousand options were outstanding with an exercise price of NT$73.0 per Share under the 2015 plan and 72,637 thousand options were outstanding with an exercise price of NT$47.5 per Share under the 2018 plan.
79
In February 2023, ASEH’s board of directors resolved to issue the second ASEH employee share options plan, which became effective on March 8, 2023, and granted 150,000 thousand share units. Each unit represents the right to purchase one newly issued ordinary share of the Company when exercised, which amounted to 150,000 thousand shares.
ASEH Employee Restricted Stock Awards Plan
In 2021, ASEH adopted the 2021 restricted stock awards plan, or the 2021 RSA Plan, and grant 15,000 thousand Common Shares, or the 2021 RSAs, as a token of gratitude, to its employees, including domestic and foreign subsidiaries. Directors who are non-employees and/or individual(s) holding more than 10% of the Common Shares of ASEH are not eligible to participate in the 2021 RSA Plan. The 2021 RSAs granted to eligible participants will be issued in the name of a custodian and deposited in a trust account pursuant to (i) a custodian agreement entered into between the trustee and ASEH and (ii) a power of attorney issued by the eligible participant to ASEH in relation to the custodian agreement.
The 2021 RSAs deposited in the trust account are subject to forfeiture restrictions, for example, they are non-transferrable, redeemable or revocable by ASEH upon termination of employment and/or upon material breach of employment agreement, or if the eligible participant fails to reach specific performance targets. Vesting of the 2021 RSAs to the eligible participant is subject to personal performance targets and ASEH’s operation objectives, as specified under the 2021 RSA Plan. In three years after the date of issuance, the maximum number of 2021 RSAs that can vest each year is limited to one-third of the total 2021 RSAs granted for each participant. Eligible participants will be entitled to certain economic benefits, same as the other Common Shares holders, of the unvested 2021 RSAs, including stock dividends, cash dividends, rights to receive from legal reserve and capital surplus, and share options at cash capital increase, which benefits will be accrued in the trust account and transfer to the participant upon vesting. As of December 31, 2022, all of the 2021 RSAs under the 2021 RSA Plan have been granted to the eligible participants and issued pursuant to the custodian agreement, of which a total of 10,000 thousand shares of 2021 RSAs remain restricted.
AMPI Share Option Plans
In May 2021, the authority approved AMPI’s employee share options plan with the issuance of up to 10,000 thousand units. The options are valid for 10 years, non-transferable and exercisable at certain percentages subsequent to the second anniversary of the grant date. For any subsequent changes in AMPI’s capital structure, the exercise price will be adjusted accordingly. AMPI’s board of directors resolved a capital reduction which record date was determined at July 25, 2022, and the exercise price of its share options was adjusted from NT$7.5 to NT$30.0 accordingly. As of December 31, 2022, 3,100 thousand options were outstanding with an exercise price of NT$30.0 per share.
USI Shanghai Option Plans and Restricted Stock Plans
As of December 31, 2022, USI Shanghai maintained six option plans: three share option plans in 2015, 2019 and 2020, as well as, three restricted stock plans in 2019, 2020 and 2021.
Under the share option plan in 2015, certain employees of USI Shanghai are granted options to purchase ordinary shares of USI Shanghai at an exercise price of RMB15.5 per share. Each option is valid for 10 years from the date of the grant.
In 2019, USI Shanghai adopted the first share option plan and granted 17,167 thousand share options to its employees. Each unit represents the right to purchase one ordinary share of USI Shanghai when exercised. The options are valid for 3.0 years, 4.0 years and 5.0 years, respectively, and are exercisable at certain percentages within 12 months subsequent to the second, the third and the fourth anniversary of the grant date subject to the satisfaction of certain performance conditions within each respective vesting period. In 2019, USI Shanghai also adopted the first restricted stock plan and granted 6,156 thousand ordinary shares to its directors (excluding independent directors), supervisors and employees. In April 2020, the board of directors further resolved to grant 6,403 thousand ordinary shares instead, while other terms remained constant. The plan was of three phases starting from 2019 and each phase lasts for one year with a valid period of 4.5 years, 3.5 years, and 2.5 years, respectively. Upon satisfaction of certain performance conditions in each phase, participants are entitled to subscribe a certain percentage of the total USI Shanghai’s ordinary shares issued under the plan with a lock-up period of one year. The valid period may be terminated early or extended prior to one month of the expiration date depending on the conditions of ordinary shares granted. In the event that USI Shanghai increases share capital by capital surplus or by cash, or distributes share dividends or cash dividends, the exercise price is accordingly adjusted.
80
In 2020, USI Shanghai adopted the second share option plan and granted 1,140 thousand share options to its employees. The conditions of these issued share options are the same as the share options plan that issued in 2019, except that the options are valid for 2.2 years, 3.2 years, and 4.2 years, respectively and with each respective vesting period of 1.2 years, 2.2 years, and 3.2 years. In 2020, USI Shanghai also adopted the second restricted stock plan and granted 425 thousand ordinary shares to its employees. The conditions of these issued restricted stocks are the same as the restricted stocks plan that issued in 2019, except that the restricted stocks are valid for 2 years and the ordinary shares that USI Shanghai would issue to participants are with a lock-up period of 1.3 years. All stocks granted under this restricted stocks plan have been forfeited, expired, or exercised during 2022.
In 2021, USI Shanghai adopted the third restricted stock plan and granted 281 thousand ordinary shares to its expatriate staff. The conditions of issued 2021 restricted stocks are the same as the 2020 restricted stocks plan.
As of December 31, 2022, USI Shanghai had 22,230 thousand options outstanding which consists of (i) 20,246 thousand options which were outstanding under the share options plan, 11,975 thousand options of which had an exercise price of RMB15.5 per share under the share options plan in 2015, 7,678 thousand options of which has an exercise price of RMB12.4 per share under the share options plan in 2019 and 594 thousand options of which has an exercise price of RMB20.9 per share under the share options plan in 2020 and (ii) 1,984 thousand options were outstanding under the restricted stocks plan, 1,715 thousand options of which has an exercise price of RMB12.4 per share under the restricted stocks plan in 2019 and 269 thousand options of which has an exercise price of nil per share under the restricted stocks plan in 2021.
BOARD PRACTICES
General
For a discussion of the term of office of the board of directors, see “—Directors and Senior Management.” No benefits are payable to members of the board or the executive officers upon termination of their relationship with us. Our board of directors established the audit committee, compensation committee, and risk management committee, to convene meetings and perform duties as prescribed in the charters and/or within applicable laws and regulations. The committees also submit proposals for board resolution, and report the status of matters relating to their respective functions to the board of directors. In parallel, our internal audit department conducts periodical audits and presents audit results to the audit committee and the board of directors. In 2019, Du-Tsuen Uang, chief administration officer, was appointed as the corporate governance officer by the board of directors to facilitate the operation of the board of directors. In addition, we have established the resource integration and decision-making committee to strengthen resource integration and decision-making efficiency across all subsidiaries, with the goal of maximizing shareholder and stakeholder value. For discussions of our committees, see “—Directors and Senior Management—Audit Committee”, “—Directors and Senior Management—Compensation Committee”, and “—Directors and Senior Management—Risk Management Committee.”
EMPLOYEES
The following table sets forth certain information concerning our employees as of the dates indicated.
As of December 31, | ||||||||||||
2020 | 2021 | 2022 | ||||||||||
Total |
101,981 | 95,727 | 97,079 | |||||||||
Function |
||||||||||||
Direct labor |
55,878 | 50,352 | 49,631 | |||||||||
Indirect labor (manufacturing) |
26,673 | 27,446 | 28,242 | |||||||||
Indirect labor (selling and administration) |
8,540 | 8,001 | 8,173 | |||||||||
Research and development |
10,890 | 9,928 | 11,033 | |||||||||
Location |
||||||||||||
Taiwan |
58,421 | 59,315 | 61,908 | |||||||||
P.R.C. and Hong Kong |
30,025 | 21,816 | 19,895 | |||||||||
Korea |
2,765 | 2,638 | 2,480 | |||||||||
Malaysia |
3,403 | 3,590 | 3,724 | |||||||||
Mexico |
2,716 | 2,776 | 2,873 | |||||||||
Singapore |
795 | 797 | 884 | |||||||||
Japan |
410 | 545 | 566 | |||||||||
Vietnam |
– | 573 | 768 | |||||||||
U.S. |
594 | 560 | 611 | |||||||||
Poland |
141 | 159 | 303 | |||||||||
Tunisia |
1,051 | 1,155 | 1,248 | |||||||||
Germany |
575 | 561 | 547 | |||||||||
France |
829 | 955 | 971 | |||||||||
Czech Republic |
148 | 182 | 169 | |||||||||
United Kingdom |
108 | 100 | 127 | |||||||||
Belgium |
– | 5 | 5 |
81
Eligible employees may participate in our and our subsidiaries’ employee share options plans and restricted stocks plans. See “—Compensation.”
We have never experienced a work stoppage caused by our employees. We believe that our relationship with our employees is good.
SHARE OWNERSHIP
The following table sets forth certain information with respect to our Common Shares and options of ASEH exercisable for our Common Shares held by our directors and executive officers as of January 31, 2023. Percentage of beneficial ownership is based on 4,369,048,307 Common Shares outstanding as of January 31, 2023.
Director or Executive Officer |
Number of ASEH Common Shares Beneficially Held(1) |
Percentage of ASEH Total Common Shares Issued and Outstanding |
Number of Options Exercisable(2) |
Exercise Price of Options (NT$) |
Expiration Date of Options | |||||||||||||
Jason C.S. Chang |
949,352,706(3) | 21.73% | 2,400,000 | 47.5 | 2028/11/23 | |||||||||||||
Richard H. P. Chang |
124,175,228 | 2.84% | 2,400,000 | 47.5 | 2028/11/23 | |||||||||||||
Chi-Wen Tsai |
14,165,000 | * | 0 | – | – | |||||||||||||
Yen-Chun Chang |
1,100,000 | * | * | 47.5 | 2028/11/23 | |||||||||||||
Tien Wu |
5,877,473 | * | * | 47.5 | 2028/11/23 | |||||||||||||
Joseph Tung |
3,315,411 | * | * | 47.5 | 2028/11/23 | |||||||||||||
Raymond Lo |
2,683,430 | * | * | 47.5 | 2028/11/23 | |||||||||||||
Tien-Szu Chen |
1,881,821 | * | * | 47.5 | 2028/11/23 | |||||||||||||
Jeffrey Chen |
1,383,000 | * | * | 47.5 | 2028/11/23 | |||||||||||||
Rutherford Chang |
1,832,647 | * | * | 47.5 | 2028/11/23 | |||||||||||||
Shen-Fu Yu |
2,388 | * | 0 | – | – | |||||||||||||
Mei-Yueh Ho |
0 | 0.00% | 0 | – | – | |||||||||||||
Wen-Chyi Ong |
0 | 0.00% | 0 | – | – | |||||||||||||
Du-Tsuen Uang |
440,000 | * | * | 47.5 | 2028/11/23 | |||||||||||||
Chun-Che Lee |
2,862,251 | * | * | 47.5 | 2028/11/23 | |||||||||||||
Chung Lin |
35,278 | * | * | 47.5 | 2028/11/23 | |||||||||||||
Gichol Lee |
0 | 0.00% | 0 | – | – | |||||||||||||
Chih-Hsiao Chung |
340,489 | * | * | 47.5 | 2028/11/23 | |||||||||||||
Kwai Mun Lee |
0 | 0.00% | 0 | – | – | |||||||||||||
Yean Peng Chen |
0 | 0.00% | 0 | – | – | |||||||||||||
Heng Ee Ooi |
0 | 0.00% | 0 | – | – | |||||||||||||
Kenneth Hsiang |
40,000 | * | * | 47.5 | 2028/11/23 | |||||||||||||
Chi-Pin Chang |
15,439 | * | * | 47.5 | 2028/11/23 | |||||||||||||
Kevin Yu |
250,000 | * | * | 47.5 | 2028/11/23 | |||||||||||||
Chen-Yen Wei |
366,115 | * | 0 | – | – | |||||||||||||
Jing Cao |
0 | 0.00% | 0 | – | – | |||||||||||||
Ta-I Lin |
0 | 0.00% | 0 | – | – | |||||||||||||
Yueh-Ming Lin |
0 | 0.00% | 0 | – | – | |||||||||||||
Hui-Min Liu |
0 | 0.00% | 0 | – | – | |||||||||||||
Bernardo Santos Balderrama |
0 | 0.00% | 0 | – | – | |||||||||||||
Gilles Benhamou |
0 | 0.00% | 0 | – | – | |||||||||||||
Ying Pin Wu |
0 | 0.00% | 0 | – | – |
(1) | Including shares directly held and shares beneficially owned through spouse and minor children. |
(2) | Each option may be converted into one of our Common Shares. The figures referred to herein include options convertible into our Common Shares scheduled to vest within 60 days as of the date hereof. |
82
(3) | Including 684,327,886 Common Shares Jason C.S. Chang beneficially owned through ASE Enterprises Limited, Aintree Limited and JC Holdings Limited and 265,024,820 Common Shares beneficially owned through Value Tower Limited and JC Holdings Limited. See “Item 7. Major Shareholders and Related Party Transactions—Major Shareholders.” |
* | The sum of the number of Common Shares held and the number of Common Shares issuable upon exercise of all options held is less than 1.0% of our total outstanding shares |
Item 7. Major Shareholders and Related Party Transactions
MAJOR SHAREHOLDERS
The following table sets forth information known to us with respect to the beneficial ownership of our Common Shares, as of January 31, 2023, by each shareholder known by us to beneficially own more than 5.0% of our total outstanding shares.
Beneficial ownership is determined in accordance with the rules and regulations of the SEC. Percentage of beneficial ownership is calculated based on 4,369,048,307 Common Shares outstanding as of January 31, 2023. In addition, when computing the number of shares beneficially owned by a person and the percentage ownership of that person, we have included shares that the person has the right to acquire within 60 days, including through the exercise of any option, warrant, or other right or the conversion of any other security. These shares, however, are not included in the computation of the percentage ownership of any other person.
Name of Shareholder | Common Shares Beneficially Owned |
|||||||
|
|
|||||||
Number | Percentage | |||||||
|
|
|
|
|
||||
Jason C.S. Chang(1) |
949,352,706 | 21.73% |
(1) | Jason C.S. Chang is our chairman. Jason C.S. Chang beneficially owned 684,327,886 Common Shares through ASE Enterprises Limited, Aintree Limited, and JC Holdings Limited, and 265,024,820 Common Shares through Value Tower Limited and JC Holdings Limited. As a result, Jason C.S. Chang beneficially owned 949,352,706 Common Shares, representing 21.73% of our total outstanding shares (based on 4,369,048,307 Common Shares as of January 31, 2023). ASE Enterprises Limited is a company organized under the laws of Hong Kong. All of the outstanding shares of ASE Enterprises Limited are held by Aintree Limited. Aintree Limited is a company organized under the laws of the British Virgin Islands. All of the shares of Aintree Limited are held by JC Holdings Limited. Value Tower Limited is a company organized under the laws of the British Virgin Islands. Jason C.S. Chang is the sole director of Value Tower Limited and JC Holdings Limited is the sole shareholder of Value Tower Limited. The shares of JC Holdings Limited are held through intermediary holding companies and under a revocable trust established under the laws of the Bailiwick of Guernsey for the benefit of our chairman, Jason C.S. Chang, and his family. There were no significant changes in the percentage of ownership beneficially owned by Jason C.S. Chang in 2020, 2021 and 2022. |
The following table sets forth information relating to our Common Shares held directly by our consolidated subsidiaries and our equity method investee as of January 31, 2023.
Name of Shareholder | Common Shares Beneficially Owned |
|||||||
|
|
|||||||
Number | Percentage | |||||||
|
|
|
|
|
||||
ASE(1) |
67,452,117 | 1.54% | ||||||
ASE Test Taiwan(2) |
5,489,388 | 0.13% | ||||||
Hung Ching(3) |
44,130,751 | 1.01% |
(1) | ASE is our wholly owned subsidiary. ASE’s ownership of our Common Shares is the result of the merger, subsequent dividends upon shares received in connection with merger and capital reduction. See “—Related Party Transactions.” for more information. |
83
(2) | ASE Test Taiwan is our wholly-owned subsidiary. ASE Test Taiwan’s ownership of our Common Shares is mainly the result of the merger of ASE Material with and into ASE in August 2004, and subsequent dividends upon shares received in connection with this merger. In order to comply with Singapore Companies Act, a trust had been established to hold and dispose of our Common Shares issued to ASE Test Taiwan, which had been a subsidiary of ASE Test, upon completion of the merger. In December 2014, the trust established to hold the Common Shares issued to ASE Test Taiwan had been terminated because ASE Test Taiwan was no longer a subsidiary owned by ASE Test and therefore no longer subject to Singapore Companies Act requirements. As a result, ASE Test Taiwan directly owned 5,489,388 of our Common Shares as of January 31, 2023. See “—Related Party Transactions.” |
(3) | Hung Ching is our equity method investee. As of January 31, 2023, we held 26.2% of the outstanding shares of Hung Ching. Hung Ching acquired our Common Shares in open market transactions, subsequent dividends upon the acquired shares and shares purchased pursuant to the rights offered by the Company. |
As of January 31, 2023, none of our major shareholders had voting rights different from those of our other shareholders. We are not aware of any arrangement that may at a subsequent date result in a change of controlling interests. Furthermore, other than as disclosed above, we are not aware of any significant changes in the percentage of ownership held by our major shareholders in 2020, 2021 and 2022.
As of January 31, 2023, a total of 4,369,048,307 Common Shares were outstanding. With certain limited exceptions, holders of Common Shares that are not R.O.C. persons are required to hold their Common Shares through a brokerage account in the R.O.C. As of January 31, 2023, 314,327,740 Common Shares were registered in the name of a nominee of Citibank, N.A., the depositary under our ADS deposit agreement. Citibank, N.A. has advised us that, as of January 31, 2023, 165,430,846 ADSs, representing 314,327,626 Common Shares, were held of record by Cede & Co., and 57 ADSs, representing 114 Common Shares, were held by 4 other U.S. persons.
RELATED PARTY TRANSACTIONS
In recent years, we have awarded cash bonuses to the employees of our subsidiaries as part of their compensation, based in part on our consolidated net income and the subsidiaries’ contribution to our consolidated income. We expect to continue this practice in the future.
In order to comply with Singapore law and other applicable laws and regulations, trusts organized under R.O.C. law were established to hold and dispose of our Common Shares issued to ASE Test and ASE Test Taiwan in connection with the merger of ASE Chung Li and ASE Material into our company in August 2004. Under Section 76(1)(b)(ii) of Singapore’s Companies Act, Chapter 50, ASE Test, a Singapore company, may not purport to acquire, directly or indirectly, shares or units of shares in our company, ASE Test’s parent company. Pursuant to the applicable trust agreements, the trustee under each trust is (1) the registered owner of our Common Shares, (2) authorized to exercise all of the rights as a shareholder of our Common Shares, (3) authorized to sell our Common Shares, subject to market conditions, when such Common Shares become available for resale under R.O.C. law and in accordance with volume limitations under R.O.C. law, at its sole discretion; provided such Common Shares are sold (i) in compliance with R.O.C. laws and regulations, (ii) in an orderly manner in order to minimize the impact on the trading price of our Common Shares, and (iii) in a manner consistent with its fiduciary duties owed to ASE Test, and (4) able to transfer and deliver to ASE Test or ASE Test Taiwan the proceeds from the sale of our Common Shares and any cash dividends distributed, as the case may be. In February 2010, to complete the tender offer to acquire Universal Scientific Industrial, ASE Test transferred 141,808,499 shares to the shareholders of Universal Scientific Industrial. Neither ASE Test nor ASE Test Taiwan have any rights with respect to our Common Shares held in trust pursuant to the applicable trust agreements other than the right to receive the proceeds from the sale of such Common Shares and cash dividends declared while the shares remain in trust. In December 2014, the trust established to hold the Common Shares issued to ASE Test Taiwan had been terminated because ASE Test Taiwan was no longer a subsidiary owned by ASE Test and therefore no longer subject to the Singapore Companies Act requirements. In the fourth quarter of 2022, ASE Test and J&R Holding Limited reduced capital by remitting 44,100,236 and 23,351,881 of our Common Shares, respectively, to shareholders, ASE. As a result, ASE Test Taiwan owned 5,489,388 of our Common Shares and ASE held 67,452,117 of our Common Shares as of January 31, 2023.
In order to demonstrate our commitment to environmental protection, in December 2013, ASE’s board of directors approved contributions to environmental protection efforts in Taiwan in a total amount of not less than NT$3,000.0 million (US$97.6 million), to be made in the next 30 years. In 2022, we have made contributions in the amount of NT$100.0 million (US$3.3 million) through the ASE Environmental Protection and Sustainability Foundation to continuously implement the activities related to environmental protection projects.
84
ASE and ASEE entered into a joint construction and allocation of housing units agreement with HC, respectively, in August 2021. The agreement stipulates that ASE and ASEE will provide land and leasehold land and HC will provide fund for joint construction of plant and consult with a professional appraisal firm to evaluate the allocation ratio of the value under joint construction. After the completion of the plant construction, ASE, ASEE and its affiliates will have the priority to purchase the property, which was obtained by HC based on the agreed proportion of joint construction. Since the joint construction agreement between ASEE and HC has not yet started, the joint construction agreement was terminated by mutual consent of both parties, and the board of directors of ASEE decided to terminate the joint construction agreement in May 2022.
ASE entered into a joint construction and allocation of housing units agreement with HC in April 2022. The agreement stipulates that ASE and HC will provide a part of land and fund, respectively, for joint construction of plant and consult with professional appraisal firm to evaluate the allocation ratio of the value under joint construction. After the completion of the plant construction, ASE will have the priority to purchase the property, which obtained by HC based on the agreed proportion of joint construction.
INTERESTS OF EXPERTS AND COUNSEL
Not applicable.
Item 8. Financial Information
CONSOLIDATED STATEMENTS AND OTHER FINANCIAL INFORMATION
Consolidated financial statements are set forth under “Item 18. Financial Statements.”
Export Sales
We categorize our revenues geographically based on the country in which the customer is headquartered. Revenues from our export sales were NT$412,149.4 million, NT$475,399.1 million and NT$587,217.5 million (US$19,108.9 million) in 2020, 2021 and 2022, respectively, which contributed 86.4%, 83.4% and 87.5% of our total sales volume for those periods, respectively. See “Item 4. Information on the Company—Business Overview—Sales and Marketing” for information on our export sales.
Legal Proceedings
K7 Plant Wastewater Discharge
On December 20, 2013, the Kaosiung Environmental Protection Bureau (“KEPB”) imposed an administrative fine of NT$102.0 million (the “Original Fine”) upon us for violation of the Water Pollution Control Act. After we sought administrative remedies against the Original Fine, the Original Fine was revoked by final judgment of Supreme Administrative Court on June 8, 2017, and KEPB was ordered to refund the Original Fine to us. On December 27, 2019, KEPB refunded NT$55.1 million to us. On February 10, 2020, KEPB reimposed an administrative fine of NT$47.0 million (the “New Fine”) upon us and offset the New Fine by the remaining amount which shall be refunded to us, therefore no additional payment required for the New Fine. After we filed an administrative appeal against the New Fine, the Administrative Appeal Review Committee of Kaohsiung City Government revoked the New Fine on December 15, 2020 and remanded to KEPB for another legitimate administrative action.
Broadcom Patent Dispute
In May 2019, Broadcom Corporation, Broadcom Singapore Pte. Ltd. and Broadcom Limited (collectively, “Broadcom”) filed a request for arbitration with the American Arbitration Association for a dispute over a Semiconductor Packaging Agreement that Broadcom and SPIL entered into in September 2012 (the “Semiconductor Packaging Agreement”). The Semiconductor Packaging Agreement stipulates that in the event the products provided by SPIL to Broadcom infringe upon third-party patent rights, SPIL must indemnify Broadcom for relevant loss suffered. In connection to the 2016 patent dispute between Broadcom and Tessera, Broadcom requested SPIL to indemnify Broadcom pursuant to the Semiconductor Packaging Agreement. In February 2020, Broadcom and SPIL settled this matter for a total amount of US$5.0 million.
85
Waste Disposal Discharge
Five employees and a waste disposal supplier of a subsidiary in the P.R.C. were accused by the Procuratorate of committing the crime of environmental pollution in 2018. During the trial, the Procuratorate claimed that the subsidiary should also be charged with a corporate crime which caused the subsidiary to receive a change and addition indictment in October 2019. In June 2020, during the first trial, the court of first instance ruled that the subsidiary shall be imposed a fine of RMB400 thousand and return the benefit (RMB344 thousand) generated from such violation. Both the fine and the return of benefit from violation were recognized by the subsidiary under the line item of “other gains and losses.” Because some of the co-defendants have filed an appeal against the judgment and, pursuant to local applicable law, the entire case will be deemed appealed. This case was denied by the court of second instance, which affirmed the judgment of the first instance on April 7, 2021. The case was concluded.
Any penalties, fines, damages, or settlements made in connection with these criminal, civil, and/or administrative investigations and/or lawsuits may divert management’s attention and resources, which may cause a material adverse effect on our results of operations, financial condition, and business. We are also unable to quantify the harm to our reputation should any adverse findings be made against us. See “Item 3. Key Information—Risk Factors—Risks Relating to Our Business—Any environmental claims or failure to comply with any present or future environmental regulations, as well as any fire or other industrial accident, may require us to spend additional funds and may materially and adversely affect our financial condition and results of operations,” and “Item 4. Information on the Company—Business Overview—Environmental Matters.”
Dividends and Dividend Policy
The following table sets forth the stock dividends paid during each of the years indicated and related information. On March 30, 2023, our board of directors adopted resolutions to pay cash dividends of NT$8.8 per share based on 4,372,963,937 shares, which equals the number of issued shares shown in the shareholders’ roster as of March 21, 2023. This proposal is subject to the actual cash dividends per share may be adjusted by fluctuations in the number of our shares due to factors such as the exercise of share options, capital increase in cash, cancellation and repurchase of treasury stocks.
Cash Dividends per Common Share |
Stock Dividends per Common Share |
Total Common Shares Issued as Stock Dividends |
Outstanding Common Shares on Record Date(1) |
Percentage of Outstanding Common Shares Represented by Stock Dividends | ||||||
|
|
|
|
| ||||||
NT$ | NT$ | |||||||||
2018 |
2.50(2) | – | – | 4,319,674,282 | – | |||||
2019 |
2.50 | – | – | 4,324,861,082 | – | |||||
2020 |
2.00 | – | – | 4,338,439,132 | – | |||||
2021 |
4.20 | – | – | 4,378,537,032 | – | |||||
2022 |
7.00 | – | – | 4,357,425,832 | – |
(1) | Aggregate number of Common Shares outstanding on the record date applicable to the dividend payment. Includes Common Shares issued in the previous year under our employee bonus plan. |
(2) | Cash dividend from capital surplus. ASEH, the continuing entity of ASE, was established on April 30, 2018 and as such has no retained earnings. In June 2018, to protect shareholder’s interest, we resolved to distribute cash from capital surplus that was assumed from ASE’s retained earnings and generated from the Share Exchange process. |
In order to meet the needs of our present and future capital expenditures, we anticipate paying both stock and cash dividends in the future. The form, frequency, and amount of future cash or stock dividends on our Common Shares will depend upon our net income, cash flow, financial condition, shareholders’ requirement for cash inflow, and other factors. According to our Articles of Incorporation, we have a general policy that cash dividend distribution shall not be less than 30% of the total dividend amount and the residual dividends shall be distributed in form of stocks in accordance with the distribution plan proposed by the board of directors and resolved by the general shareholders’ meeting.
86
In general, we are not permitted to distribute dividends or make other distributions to shareholders in any given year in which we did not have either earnings or retained earnings. Before distribution of dividends, we shall offset the losses incurred in prior years and set aside 10% of remaining net earnings as a legal reserve until the accumulated legal reserve equals our paid-in capital, and then allocate or reverse a special surplus reserve in accordance with laws or regulations set forth by the authorities concerned. The remainder plus the undistributed earnings shall be distributed in accordance with the proposal submitted by the board of directors and adopted by the general meeting of shareholders. However, when earnings are distributed as cash dividends, this may be approved by the majority of the directors at a Board meeting in which over two-thirds of the directors are present, and then reported to the shareholders’ meeting.
According to our Articles of Incorporation, the remuneration of our independent directors is set at NT$3.0 million (US$0.1 million) per person per year. For those that do not serve a full year, the remuneration will be calculated in proportion to the number of days of the term that were actually served. The additional remuneration of the Company’s independent directors who are also the members of the Company’s compensation committee is set at NT$360 thousand per person annually. For those that do not serve a full year, the additional remuneration will be calculated in proportion to the number of days of the term that were actually served. In addition, if we are profitable, we set aside 0.01% to 1.00% of the profits as compensation to employees and 0.75% or less of the profits should be allocated as compensation to directors. While we have accumulated losses, the profit shall be set aside to compensate losses before distribution.
See “Item 10. Additional information—Articles of Incorporation—Dividends and Distributions.”
Holders of ADSs will be entitled to receive dividends, subject to the terms of the deposit agreement, to the same extent as the holders of our Common Shares. Cash dividends will be paid to the depositary in NT dollars and, except as otherwise provided in the deposit agreement, will be converted by the depositary into U.S. dollars and paid to holders of ADSs according to the terms of the deposit agreement. Stock dividends will be distributed to the depositary and, except as otherwise provided in the deposit agreement, will be distributed by the depositary, in the form of additional ADSs, to holders of ADSs according to the terms of the deposit agreement.
Holders of outstanding Common Shares on a dividend record date will be entitled to the full dividend declared without regard to any prior or subsequent transfer of Common Shares. Holders of outstanding ADSs are entitled to receive dividends, subject to the terms of the deposit agreement, to the same extent as the holders of outstanding Common Shares.
For information relating to R.O.C. withholding taxes payable on dividends, see “Item 10. Additional Information—Taxation—R.O.C. Taxation—Dividends.”
SIGNIFICANT CHANGES
Other than as disclosed elsewhere in this annual report, we have not experienced any significant changes since the date of the annual financial statements.
Item 9. The Offer and Listing
OFFER AND LISTING DETAILS
Our Common Shares have been listed on the TWSE under the symbol “3711” since April 30, 2018. The TWSE is an auction market where the securities traded are priced according to supply and demand through announced bid and ask prices. As of January 31, 2023, there was an aggregate of 4,369,048,307 of our Common Shares outstanding.
The performance of the TWSE has in recent years been characterized by extreme price volatility. There are currently limits on the range of daily price movements on the TWSE. In the case of equity securities traded on the TWSE, such as our Common Shares, fluctuations in the price of a particular security may not exceed a 10.0% change either above or below the previous day’s closing price of such security.
Our ADSs have been listed on the NYSE under the symbol “ASX” since April 30, 2018. The outstanding ADSs are identified by the CUSIP number 00215W100. As of January 31, 2023, a total of 157,163,870 ADSs were outstanding.
87
PLAN OF DISTRIBUTION
Not applicable.
MARKETS
The principal trading market for our Common Shares is the TWSE and the principal trading market for ADSs representing our Common Shares is the NYSE.
SELLING SHAREHOLDERS
Not applicable.
DILUTION
Not applicable.
EXPENSES OF THE ISSUE
Not applicable.
Item 10. Additional Information
SHARE CAPITAL
Not applicable.
ARTICLES OF INCORPORATION
General
We are a company limited by shares organized under the laws of the R.O.C. Our organizational document is our Articles of Incorporation. We have no by-laws.
Our Articles of Incorporation provide, in Article 2, that we may engage in the General Investment Business, which includes investments in various businesses including agriculture, forestry, fishery, animal husbandry, industry, mining and merchandising business, investments in service companies, securities companies, bank insurance companies, trading companies, cultural companies, construction of residential buildings, commercial building, recreation businesses, and tourist hotels-related business.
We were incorporated on April 30, 2018 as a company limited by shares under the R.O.C. Company Law. Our authorized share capital was NT$55,000,000,000, divided into 5,500,000,000 Common Shares with a par value of NT$10 per Share. We do not have any equity in the form of preference shares or otherwise outstanding as of the date of this annual report.
Subject to limited exceptions, with the approval of our board of directors and the FSC, we may grant share options to our employees; share options worth NT$4,000,000,000 are reserved for employee subscription. We may issue new shares to employees with restricted rights after the resolutions of the shareholders’ meeting. See “Item 6. Directors, Senior Management and Employees—Compensation.”
Directors
Our Articles of Incorporation provide that we are to have nine directors (three independent directors and six non-independent directors) who will be elected by the general shareholders’ meeting from candidates with legal capacity. Each director shall hold office for a term of three years and may continue to serve in the office if re-elected. The election of the directors of the Company shall be conducted pursuant to the R.O.C. Company Act and relevant regulations. The election of independent directors and non-independent directors should be held concurrently, with the exception that the number of independent directors and non-independent directors elected shall be calculated separately; those who receive votes representing more voting rights will be elected as independent directors or non-independent directors.
88
Our audit committee replaced the function of supervisors in accordance with the R.O.C. Securities and Exchange Act to exercise the powers and duties of supervisors. The audit committee shall be comprised solely of independent directors.
A candidate nomination system is used in the election of directors. Shareholders who hold 1% or more of our issued shares and the board of directors may nominate a list of candidates for directors. Re-elections are allowed. The board of directors have certain powers and duties, including (1) preparing business plans; (2) preparing surplus distribution or loss make-up proposals; (3) preparing proposals to increase or decrease capital; (4) reviewing material internal rules and contracts; (5) hiring and discharging the general manager; (6) establishing and dissolving branch offices; (7) reviewing budgets and audited financial statements; and (8) other duties and powers granted by or in accordance with the R.O.C. Company Act or shareholders’ resolutions.
The board of directors is constituted of directors, and the chairman and vice chairman are elected by more than half of the directors at a board meeting at which two-thirds or more of the directors are present. If the chairman is absent or unable to discharge his or her duties for any reason, his or her acting proxy shall be elected in accordance with the R.O.C. Company Act. Board meetings may be held in the R.O.C. or at any location that is convenient for the directors to attend and appropriate for the meeting to be convened, or by video conference. A director may appoint another director to attend a board meeting and vote by proxy, but only one proxy may be accepted.
Dividends and Distributions
In general, we are not permitted to distribute dividends or make other distributions to shareholders in any given year in which we did not have either earnings or retained earnings. Before distribution of dividends, we shall offset the losses incurred in prior years and set aside 10% of remaining net earnings as a legal reserve until the accumulated legal reserve equals our paid-in capital, and then allocate or reverse a special surplus reserve in accordance with laws or regulations set forth by the authorities concerned. The remainder plus the undistributed earnings shall be distributed in accordance with the proposal submitted by the board of directors and adopted by the general meeting of shareholders. However, if earnings are to be distributed as cash dividends, they shall be reported to the shareholders’ meeting with the approval of the majority of the directors at a board meeting, at which over two-thirds of the directors are present.
According to our Articles of Incorporation, the remuneration of our independent directors is set at NT$3.0 million per person per year. For those that do not serve a full year, the remuneration will be calculated in proportion to the number of days of the term that were actually served. The additional remuneration of our independent directors who are also the members of our compensation committee is set at NT$360.0 thousand per person per year. For those that do not serve a full year, the additional remuneration will be calculated in proportion to the number of days of the term that were actually served.
If we are profitable, we set aside 0.01% to 1.00% of the profits as compensation to employees and 0.75% or less of the profits should be allocated as compensation to directors. While we have accumulated losses, the profit shall be set aside to compensate losses before distribution.
At the annual general meeting of shareholders, our board of directors submits to the shareholders for their approval any proposal for the distribution of dividends or the making of any other distribution to shareholders from our net income for the preceding fiscal year. All Common Shares outstanding and fully paid as of the relevant record date are entitled to share equally in any dividend or other distribution so approved. Dividends may be distributed in cash, in the form of Common Shares or a combination of the two, as determined by the shareholders at the meeting. According to our Articles of Incorporation, we have a general policy that cash dividend distribution shall not be less than 30% of the total dividend amount and the residual dividends shall be distributed in form of stocks in accordance with the distribution plan proposed by the board of directors and resolved by the general shareholders’ meeting. See “Item 8. Financial Information—Consolidated Statements and Other Financial Information—Dividends and Dividend Policy.”
The compensation being distributed to employees in the form of stock or cash shall be approved by more than half of the directors at a board meeting at which two-thirds or more of the directors are present and report to the general shareholders’ meeting. In addition to permitting dividends to be paid out of earnings or retained earnings, the R.O.C. Company Act permits us to make distributions to our shareholders in cash or in the form of Common Shares from capital surplus and the legal reserve. While legal reserve is distributed by issuing new shares or by cash, only the portion of legal reserve which exceeds 25% of our paid-in capital can be distributed. We distribute profit to employees in the form of shares by a resolution of a meeting of the board of directors, and may resolve, at the same meeting of the board of directors, to distribute the shares by way of new shares to be issued by us or existing shares to be repurchased by us.
89
For information on the dividends paid in recent years, see “Item 8. Financial Information—Consolidated Statements and Other Financial Information—Dividends and Dividend Policy.” For information as to R.O.C. taxes on dividends and distributions, see “—Taxation—R.O.C. Taxation—Dividends.”
Preemptive Rights
Under the R.O.C. Company Law, when an R.O.C. company issues new shares for cash, existing shareholders who are listed on the shareholders’ register as of the record date have preemptive rights to subscribe for the new issue in proportion to their existing shareholdings, while a company’s employees, whether or not they are shareholders of the company, have rights to subscribe for 10% to 15% of the new issue. Any new shares that remain unsubscribed at the expiration of the subscription period may be freely offered, subject to compliance with applicable R.O.C. law.
In addition, in accordance with the R.O.C. Securities and Exchange Act, a public company that intends to offer new shares for cash must offer to the public at least 10% of the shares to be sold, except under certain circumstances or when exempted by the FSC. This percentage can be increased by a resolution passed at a shareholders’ meeting, which would diminish the number of new shares subject to the preemptive rights of existing shareholders.
These preemptive rights provisions do not apply to offerings of new shares through a private placement approved at a shareholders’ meeting.
Meetings of Shareholders
General shareholders’ meetings include both annual general meetings and extraordinary general meetings. We are required to hold an annual general meeting of our shareholders within six months following the end of each fiscal year. These meetings are generally held in Kaohsiung, Taiwan. Any shareholder who holds 1% or more of our issued and outstanding shares may submit one proposal for discussion at our annual general meeting. Extraordinary general shareholders’ meetings may be convened by resolution of the board of directors or by the board of directors upon the written request of any shareholder or shareholders who have held 3% or more of the outstanding Common Shares for a period of one year or longer or shareholders who have held more than 50% of the outstanding Common Shares for three months or longer. Shareholders’ meetings may also be convened by member(s) of the audit committee. Notice in writing of meetings of shareholders, stating the place, time, and purpose, must be dispatched to each shareholder at least 30 days, in the case of annual general meetings, and 15 days, in the case of extraordinary meetings, before the date set for each meeting. A majority of the holders of all issued and outstanding Common Shares present at a shareholders’ meeting constitutes a quorum for meetings of shareholders.
Voting Rights
Under the R.O.C. Company Law, except under limited circumstances, shareholders have one vote for each Common Share held. Under the R.O.C. Company Law, our directors are elected at a shareholders’ meeting through cumulative voting.
In general, a resolution can be adopted by the holders of at least a majority of our Common Shares represented at a shareholders’ meeting at which the holders of a majority of all issued and outstanding Common Shares are present. Under R.O.C. Company Law, the approval by at least a majority of our Common Shares represented at a shareholders’ meeting in which a quorum of at least two-thirds of all issued and outstanding Common Shares are represented is required for major corporate actions, including:
· | amendment to the Articles of Incorporation, including increase of authorized share capital and any changes of the rights of different classes of shares; |
· | execution, amendment, or termination of any contract through which the company leases its entire business to others, or the company appoints others to operate its business, or the company operates its business with others on a continuous basis; |
90
· | transfer of its entire business or assets or a substantial part of its business or assets; |
· | acquisition of the entire business or assets of any other company, which would have a significant impact on the company’s operations; |
· | distribution of any stock dividend; |
· | dissolution, merger, or spin-off of the company; |
· | issuance of restricted stocks to employees; and |
· | removal of the directors. |
However, in the case of a listed company such as us, the resolution may be adopted by the holders of at least two-thirds of our issued and outstanding Common Shares represented at a shareholders’ meeting at which the holders of at least a majority of all issued and outstanding Common Shares are present.
A shareholder may be represented at an annual general or extraordinary meeting by proxy if a valid proxy form is delivered to us five days before the commencement of the annual general or extraordinary general shareholders’ meeting. Shareholders may exercise their voting rights by way of a written ballot or by way of electronic transmission if the voting decision is delivered to us two days before the commencement of the annual general or extraordinary general shareholders’ meeting.
Holders of ADSs do not have the right to exercise voting rights with respect to the underlying Common Shares, except as described in the deposit agreement.
Other Rights of Shareholders
Under the R.O.C. Company Law, dissenting shareholders are entitled to appraisal rights in certain major corporate actions such as a proposed amalgamation by the company. If agreement with the company cannot be reached, dissenting shareholders may seek a court order for the company to redeem all of their shares. Shareholders may exercise their appraisal rights by serving written notice on the company prior to or at the related shareholders’ meeting and/or by raising and registering an objection at the shareholders’ meeting. In addition to appraisal rights, shareholders have the right to sue for the annulment of any resolution adopted at a shareholders’ meeting where the procedures were legally defective within 30 days after the date of the shareholders’ meeting. One or more shareholders who have held 1% or more of the issued and outstanding shares of a company for a period of six months or longer may require an independent director to bring a derivative action on behalf of the company against a director as a result of the director’s unlawful actions or failure to act.
Rights of Holders of Deposited Securities
Except as described below, holders of ADSs generally have no right under the deposit agreement to instruct the depositary to exercise the voting rights for our Common Shares represented by the ADSs. Instead, by accepting ADSs or any beneficial interest in ADSs, holders of ADSs are deemed to have authorized and directed the depositary to appoint our chairman or his designee to represent them at our shareholders’ meetings and to vote our Common Shares deposited with the custodian according to the terms of the deposit agreement.
The depositary will mail to holders of ADSs any notice of a shareholders’ meeting received from us together with information explaining how to instruct the depositary to exercise the voting rights of the securities represented by ADSs.
If we fail to timely provide the depositary with an English-language translation of our notice of meeting or other materials related to any meeting of owners of Common Shares, the depositary will endeavor to cause all the deposited securities represented by ADSs to be present at the applicable meeting, insofar as practicable and permitted under applicable law, but will not cause those securities to be voted.
If the depositary timely receives voting instructions from owners of at least 51.0% of the outstanding ADSs to vote in the same direction regarding one or more resolutions to be proposed at the meeting, including election of directors, the depositary will notify our chairman or his designee to attend the meeting and vote all the securities represented by the holders’ ADSs in accordance with the direction received from owners of at least 51.0% of the outstanding ADSs.
91
If we have timely provided the depositary with the materials described in the deposit agreement and the depositary has not timely received instructions from holders of at least 51.0% of the outstanding ADSs to vote in the same direction regarding any resolution to be considered at the meeting, then holders of ADSs will be deemed to have authorized and directed the depositary bank to give a discretionary proxy to our chairman or his designee to attend and vote at the meeting our Common Shares represented by the ADSs in any manner our chairman or his designee may wish, which may not be in the interests of holders.
The ability of the depositary to carry out voting instructions may be limited by practical and legal limitations and the terms of the securities on deposit. We cannot assure ADS holders that they will receive voting materials in time to enable them to return voting instructions to the depositary in a timely manner.
While shareholders who own 1% or more of our outstanding shares are entitled to submit one proposal to be considered at our annual general meetings, only holders representing at least 51% of our ADSs outstanding at the relevant record date are entitled to submit one proposal to be considered at our annual general meetings. Hence, only one proposal may be submitted on behalf of all ADS holders.
Register of Shareholders and Record Dates
Our share registrar, President Securities Corp., maintains our register of shareholders at its offices in Taipei, Taiwan. Under the R.O.C. Company Law and our Articles of Incorporation, we may, by giving advance public notice, set a record date and close the register of shareholders for a specified period in order for us to determine the shareholders or pledgees that are entitled to rights pertaining to our Common Shares. The specified period required is as follows:
· | annual general meeting—60 days; |
· | extraordinary general shareholders’ meeting—30 days; and |
· | relevant record date for distribution of dividends, bonuses, or other interests—5 days. |
Annual Financial Statements
At least 10 days before the annual general meeting, our annual financial statements, which are prepared in conformity with Taiwan-IFRS, must be available at our principal executive office in Kaohsiung, Taiwan for inspection by the shareholders. According to the regulations of the FSC, we are required to publish our annual and quarterly financial statements on a consolidated basis. In addition, the R.O.C. Securities and Exchange Act requests a public company, such as us, to publicly announce its audited annual financial report within three months after the close of each fiscal year.
Transfer of Common Shares
The transfer of Common Shares in registered form is effected by endorsement and delivery of the related share certificates but, in order to assert shareholders’ rights against us, the transferee must have his or her name and address registered on our register of shareholders. Shareholders are required to file their respective specimen seals, also known as chops, with us. Chops are official stamps widely used in Taiwan by individuals and other entities to authenticate the execution of official and commercial documents. The settlement of trading in our Common Shares is normally carried out on the book-entry system maintained by the Taiwan Depository & Clearing Corporation.
Acquisition of Common Shares by ASEH
Under the R.O.C. Securities and Exchange Act, we may purchase our own Common Shares for treasury stock under limited circumstances, including:
· | to transfer shares to our employees; |
92
· | to deliver shares upon the conversion or exercise of bonds with warrants, preferred shares with warrants, convertible bonds, convertible preferred shares, or warrants issued by us; and |
· | to maintain our credit and our shareholders’ equity, provided that the shares so purchased shall be canceled. |
We may purchase our Common Shares on the TWSE or by means of a public tender offer. These transactions require the approval of a majority of our board of directors at a meeting in which at least two-thirds of the directors are in attendance. The total amount of Common Shares purchased for treasury stock may not exceed 10.0% of the total issued shares. In addition, the total cost of the purchased shares shall not exceed the aggregate amount of our retained earnings, any premium from share issuances, and the realized portion of our capital reserve.
We may not pledge or hypothecate any of our shares purchased by us. In addition, we may not exercise any shareholders’ right attaching to such shares. In the event that we purchase our shares on the TWSE, our affiliates, directors, managers, and shareholders, together with their respective spouses, minor children, and/or nominees who hold 10.0% or more of our total issued shares (as well as such respective spouses, minor children and/or nominees) are prohibited from selling any of our shares during the period in which we are purchasing our shares.
Pursuant to the R.O.C. Company Law, an entity in which our company directly or indirectly owns more than 50.0% of the voting shares or paid-in capital, which is referred to as a controlled entity, may not purchase our shares. Also, if our company and a controlled entity jointly own, directly or indirectly, more than 50.0% of the voting shares or paid-in capital of another entity, which is referred to as a third entity, the third entity may not purchase shares in either our company or a controlled entity.
Liquidation Rights
In the event of our liquidation, the assets remaining after payment of all debts, liquidation expenses, and taxes will be distributed pro rata to the shareholders in accordance with the relevant provisions of the R.O.C. Company Law.
Transfer Restrictions
Substantial Shareholders
The R.O.C. Securities and Exchange Act currently requires:
· | each director, manager, or substantial shareholder (that is, a shareholder who holds more than 10.0% of the shares of a company), together with their respective spouses, minor children, or nominees, to report any change in that person’s shareholding (as well as such respective spouses, minor children, or nominees), on a monthly basis, to the issuer of the shares; and |
· | each director, manager, or substantial shareholder, together with their respective spouses, minor children, or nominees, after acquiring the status of director, manager, or substantial shareholder for a period of six months, to report his or her intent to transfer any shares (as well as such respective spouses, minor children, or nominees) on the TWSE or on the Taipei Exchange to the FSC at least three days before the intended transfer, unless the number of shares to be transferred does not exceed 10,000 shares. |
In addition, the number of shares that can be sold or transferred on the TWSE or on the Taipei Exchange by any person subject to the restrictions described above on any given day may not exceed the greater of:
· | 0.2% of the outstanding shares of the company in the case of a company with no more than 30 million outstanding shares; or |
· | 0.2% of 30 million shares plus 0.1% of the outstanding shares exceeding 30 million shares in the case of a company with more than 30 million outstanding shares; and |
· | 5.0% of the average trading volume (number of shares) on the TWSE for the 10 consecutive trading days preceding the reporting day on which the director, manager or substantial shareholder reports the intended share transfer to the FSC. |
93
These restrictions do not apply to sales or transfers of our ADSs.
MATERIAL CONTRACT
Disposal of Advanced Shanghai, ASEKS, ASEN, and ASEWH
The disposal agreement for Advanced Shanghai, ASEKS, ASEN, and ASEWH, or collectively, the China Sites, was entered into on December 1, 2021 between ASEH and certain of its subsidiaries, as sellers, and Beijing Wise Road Asset Management Co., Ltd., or Wise Road Capital, as purchaser. Pursuant to the disposal agreement, Wise Road Capital acquired the entire equity interest in GAPT Holding Limited, Global Advanced Packaging Test (HongKong) Limited and the China Sites, or collectively, the Disposed Companies, from ASEH and certain of its subsidiaries. The transaction was completed on December 16, 2021.
The total consideration for the sale of the Disposed Companies was US$1.33 billion, comprising of (i) US$1.08 billion in cash, plus the cash held by the Disposed Companies, less the debt held by the Group Companies, at closing with further adjustment post-completion; and (ii) follow-on cash consideration of US$380 million, payable following the expiry of a six-month period from the date of completion or a longer period as agreed by the parties.
Under the disposal agreement, ASEH and certain of its subsidiaries gave Wise Road Capital certain warranties and indemnities in relation to the shares, equity interests, and assets that were the subject of the disposal. In addition, ASEH and certain of its subsidiaries provided an indemnity in relation to the potential liabilities of the Disposed Companies arising out of litigation, tax, third-party software license, and social security and housing fund matters. Pursuant to the disposal agreement, Wise Road Capital shall procure that the Disposed Companies shall, as soon as practicable, but in any event by June 30, 2022, remove from each of their company or trading name, domain name, logo, or trade or service mark (whether registered or unregistered) references to us.
The disposal of the China Sites would realign the Group’s resources to focus on the major operations in the P.R.C., such as SPIL, and to generate more cash resources for organic expansion and strategic investments to address other opportunities in the P.R.C.
Share Purchase Agreement between USI Shanghai and the Shareholders of Financiere AFG S.A.S.
On December 12, 2019, the shareholders of FAFG and USI Shanghai entered into a share purchase agreement and a framework agreement pursuant to which the shareholders of FAFG undertook to sell the control of FAFG to USI Shanghai under the following terms and conditions:
· | pursuant to the FAFG Share Purchase Agreement, USIFR would acquire 71,530,174 shares, representing approximately 89.6% of the share capital and voting rights of FAFG, as of the closing date (the “First FAFG Closing Date”) provided under the FAFG Share Purchase Agreement for the transfer of such shares (the “FAFG First Transaction”); |
· | pursuant to the framework agreement, as from the First FAFG Closing Date, ASDI would keep 8,317,462 shares, representing approximately 10.4% of the share capital and voting rights of FAFG, which would be (i) subsequently exchanged by ASDI against new shares issued by USI Shanghai, (ii) or alternatively, if such exchange is not possible, against a cash payment in an amount corresponding to the price per FAFG share used in the context of the First FAFG Transaction (the “Second FAFG Transaction” and, together with the First FAFG Transaction, the “FAFG Transaction”). In case of exchange of shares, the USI Shanghai shares granted to ASDI would be locked for a period of time to be agreed upon with the Chinese listing authorities, but which shall not exceed 36 months as from the completion of the Second FAFG Transaction. |
On December 1, 2020, USI Shanghai and USIFR successfully completed the acquisition of 100% of the shares of FAFG. Upon making payment of the cash consideration, USIFR paid NT$10,800,558 thousand to acquire 71,530 thousand shares of FAFG (approximately 89.6% of the issued shares of FAFG) and USI Shanghai issued its 25,940 thousand new ordinary shares, which amounted to NT$1,734,570 thousand, as share consideration in exchange for 8,318 thousand shares of FAFG (approximately 10.4% of the issued shares of FAFG). As a result, USI has acquired 100% of FAFG’s total issued shares, 79,848 thousand shares. In addition, USIFR is obliged to pay an additional amount up to US$42,805 thousand, in 2023 if FAFG’s net profit in 2021 and 2022 reaches the predetermined target. In December 2020, USIFR deposited NT$294,244 thousand (equivalent to US$10,122 thousand) in advance to trust account. Based on the fair value report of the contingent consideration, USIFR will be able to receive NT$385,735 thousand back, of which NT$294,244 thousand will be received from trust account while NT$91,491 thousand will be received additionally.
94
Joint Share Exchange Agreement between ASE and SPIL
ASE and SPIL entered into the Joint Share Exchange Agreement pursuant to which a holding company, ASEH, was formed by means of a statutory share exchange, and ASEH (i) acquired all issued shares of ASE in exchange for shares of ASEH using the Exchange Ratio as described below, and (ii) acquired all issued shares of SPIL using the Cash Consideration as described below. Upon the consummation of the Share Exchange, ASE and SPIL became wholly-owned subsidiaries of ASEH concurrently.
Pursuant to the terms and subject to the conditions set forth in the Joint Share Exchange Agreement, at the effective time of the Share Exchange (the “Effective Time”):
i. for SPIL shareholders:
· | each SPIL common share, par value NT$10 per share, was issued immediately prior to the Effective Time (including SPIL’s treasury shares and the common shares of SPIL beneficially owned by ASE) and was transferred to ASEH in consideration for the right to receive NT$51.2, which represented NT$55 minus a cash dividend and a return of capital reserve of NT$3.8 per common share of SPIL distributed by SPIL on July 1, 2016, payable in cash in NT dollars, without interest and net of any applicable withholding taxes (the “SPIL Common Shares Cash Consideration”); and |
· | each SPIL American depositary share, representing five common shares of SPIL, was canceled in exchange for the right to receive through JPMorgan Chase Bank, N.A., as depositary for the SPIL American depositary shares (the “SPIL Depositary”), the U.S. dollar equivalent of NT$256 (representing five times of the SPIL Common Shares Cash Consideration) minus (i) all processing fees and expenses per SPIL American depositary shares in relation to the conversion from NT dollars into U.S. dollars, and (ii) US$0.05 per SPIL American depositary shares cancellation fees pursuant to the terms of the deposit agreement dated January 6, 2015 by and among SPIL, SPIL Depositary and the holders and beneficial owners from time to time of the SPIL American depositary shares issued thereunder, payable in cash in U.S. dollars, without interest and net of any applicable withholding taxes (the “SPIL ADS Cash Consideration,” together with the SPIL Common Shares Cash Consideration, the “Cash Consideration”). |
ii. for ASE shareholders:
· | each common share of ASE, par value NT$10 per share, issued immediately prior to the Effective Time (including ASE’s treasury shares), was transferred to ASE Technology Holding in consideration for the right to receive 0.5 ASE Technology Holding Common Shares, par value NT$10 per share; and |
· | each ASE ADS, representing five common shares of ASE, represented the right to receive 1.25 ASEH ADS. Each ASEH ADS represents two ASEH Common Shares upon surrender for cancellation to Citibank, N.A., as depositary for the ASE ADSs, after the Effective Time. The ratio at which the common shares of ASE were exchanged for the common shares of ASEH and ASE ADSs were exchanged for ASEH American depositary shares is hereinafter referred to as the “Exchange Ratio.” |
Under Republic of China law, if any fractional ASEH Common Shares that represented less than one Common Share was otherwise allotted to former holders of ASE common shares in connection with the Share Exchange, those fractional shares would not be issued to those shareholders. Pursuant to the Joint Share Exchange Agreement, ASE aggregated the fractional entitlements and sold the aggregated ASE common shares using the closing price of ASE common shares on the TWSE on the ninth R.O.C. Trading Day prior to the Effective Time, to an appointee of the Chairman of ASEH. The cash proceeds from the sale were distributed to the former holders of ASE common shares by ASEH on a proportionate basis in accordance with their respective fractions at the Effective Time.
On February 12, 2018, ASE held an extraordinary general shareholders’ meeting and approved the Joint Share Exchange Agreement and approved ASEH’s share capital to be NT$50,000,000,000.
95
On March 26, 2018, TWSE approved the delisting of common shares of ASE and SPIL on April 30, 2018 and the listing of Common Shares of ASEH on the same day. On April 30, 2018, the Share Exchange consummated, ASE and SPIL became wholly-owned subsidiaries of ASEH, and ASEH began trading on the TWSE under the stock symbol “3711” and on NYSE under the same ticker symbol “ASX.”
FOREIGN INVESTMENT IN THE R.O.C.
Historically, foreign investment in the R.O.C. securities market has been restricted. Since 1983, the R.O.C. government has periodically enacted legislation and adopted regulations to permit foreign investment in the R.O.C. securities market.
On September 30, 2003, the Executive Yuan approved an amendment to the Regulations Governing Investment in Securities by Overseas Chinese and Foreign National (the “Regulations”), which took effect on October 2, 2003. Pursuant to the Regulations, the FSC abolished the mechanism of the “qualified foreign institutional investors” and “general foreign investors” as stipulated in the Regulations before the amendment.
Under the Regulations, foreign investors (other than P.R.C. persons) are classified as either “onshore foreign investors” or “offshore foreign investors” according to their respective geographical location. Both onshore and offshore foreign investors are allowed to invest in R.O.C. securities after they register with the TWSE or the Taiwan Futures Exchange. The Regulations further classify foreign investors into foreign institutional investors and foreign individual investors. “Foreign institutional investors” refer to those investors incorporated and registered in accordance with foreign laws outside of the R.O.C. (i.e., offshore foreign institutional investors) or their branches set up and recognized within the R.O.C. (i.e., onshore foreign institutional investors). Offshore overseas Chinese and foreign individual investors may be subject to a maximum investment ceiling that will be separately determined by the FSC, after consultation with the Central Bank of the Republic of China (Taiwan). Currently, there is no maximum investment ceiling for offshore overseas Chinese and foreign individual investors. Foreign institutional investors are not subject to any ceiling for investment in the R.O.C. securities market.
Except for certain specified industries, such as telecommunications, investments in R.O.C. listed companies by foreign investors are not subject to individual or aggregate foreign ownership limits. Custodians for foreign investors are required to submit to the Central Bank of the Republic of China (Taiwan) and the TWSE a monthly report of trading activities and status of assets under custody and other matters. Capital remitted to the R.O.C. under these guidelines may be remitted out of the R.O.C. at any time after the date the capital is remitted to the R.O.C. Capital gains and income on investments may be remitted out of the R.O.C. at any time.
Foreign investors (other than P.R.C. persons) who wish to make (i) direct investments in the shares of R.O.C. private companies or (ii) investment in 10.0% or more of the equity interest of a R.O.C. company listed on the TWSE or the Taipei Exchange in any single transaction are required to submit a foreign investment approval application to the MOEAIC or other applicable government authority. The MOEAIC or such other government authority reviews each foreign investment approval application and approves or disapproves each application after consultation with other governmental agencies (such as the Central Bank of the Republic of China (Taiwan) and the FSC).
Under current R.O.C. law, any non-R.O.C. person possessing a foreign investment approval may remit capital for the approved investment and is entitled to repatriate annual net profits, interest, and cash dividends attributable to the approved investment. Dividends attributable to such investment may be repatriated upon submitting certain required documents to the remitting bank, and investment capital and capital gains attributable to such investment may be repatriated after approvals of the MOEAIC or other government authorities have been obtained.
In addition to the general restriction against direct investment by foreign investors in securities of R.O.C. companies, foreign investors (except in certain limited cases) are currently prohibited from investing in certain industries in the R.O.C. pursuant to a “negative list,” as amended by the Executive Yuan. The prohibition on foreign investment in the prohibited industries specified in the negative list is absolute in the absence of a specific exemption from the application of the negative list. Pursuant to the negative list, certain other industries are restricted so that foreign investors (except in limited cases) may invest in these industries only up to a specified level and with the special approval of the relevant competent authority that is responsible for enforcing the relevant legislation that the negative list is intended to implement.
96
The FSC announced the P.R.C. Regulations on April 30, 2009. According to the P.R.C. Regulations, a P.R.C. QDII is allowed to invest in R.O.C. securities (including less than 10.0% (or less in certain industries) of shareholding of a R.O.C. company listed on the TWSE or the Taipei Exchange), provided that the total investment amount of any QDII does not exceed US$500 million. The custodians of QDIIs must apply with the TWSE for the remittance amount for each QDII, which cannot exceed US$100 million, and QDII can only invest in R.O.C. securities at an amount approved by the TWSE. In addition, QDIIs are currently prohibited from investing in certain industries, and their investment in any company of certain other industries is restricted to a certain percentage pursuant to a list promulgated by the FSC and amended from time to time. P.R.C. investors other than QDII are prohibited from making investments in a R.O.C. company listed on the TWSE or the Taipei Exchange if the investment is less than 10.0% of the equity interest of such R.O.C. company.
In addition to investments permitted under the P.R.C. Regulations, P.R.C. investors who wish to make (i) a direct investment in the shares of R.O.C. private companies or (ii) investments, individually or in the aggregate, in 10.0% or more of the equity interest of a R.O.C. company listed on the TWSE or the Taipei Exchange, are required to submit an investment approval application to the MOEAIC or other government authority. The MOEAIC or such other government authority reviews each investment approval application and approves or disapproves each application after consultation with other governmental agencies.
In addition to the general restriction against a direct investment by P.R.C. investors in securities of R.O.C. companies, P.R.C. investors may only invest in certain industries on the “positive list” promulgated by the Executive Yuan. Furthermore, a P.R.C. investor who wishes to be elected as a R.O.C. company’s director or supervisor shall submit an investment approval application to the MOEAIC or other government authority for approval.
EXCHANGE CONTROLS
R.O.C. Exchange Controls
The R.O.C. Foreign Exchange Control Act and regulations provide that all foreign exchange transactions must be executed by banks designated by the FSC and by the Central Bank of the Republic of China (Taiwan) to engage in such transactions. Current regulations favor trade-related or service-related foreign exchange transactions. Consequently, foreign currency earned from exports of merchandise and services may now be retained and used freely by exporters, and all foreign currency needed for the importation of merchandise and services may be purchased freely from designated foreign exchange banks.
Apart from trade-related or service-related foreign exchange transactions, R.O.C. companies and individual residents of the R.O.C. reaching the age of 20 years old may, without foreign exchange approval, remit foreign currency of up to US$50 million (or its equivalent) and US$5 million (or its equivalent) to and from the R.O.C. (or such other amount as determined by the Central Bank of the Republic of China (Taiwan) from time to time at its discretion in consideration of the economic and financial conditions of the R.O.C. or the needs to maintain the order of the foreign exchange market in the R.O.C.), respectively, in each calendar year. The above limits apply to remittances involving either a conversion of NT dollars into a foreign currency or a conversion of foreign currency into NT dollars. In addition, a requirement is also imposed on all enterprises incorporated or registered in the R.O.C. to register their medium- and long-term foreign debts with the Central Bank of the Republic of China (Taiwan).
In addition, foreign persons may, subject to specified requirements, but without foreign exchange approval of the Central Bank of the Republic of China (Taiwan), remit to and from the R.O.C. foreign currencies of up to US$100,000 (or its equivalent) per remittance if the required documentation is provided to the R.O.C. authorities. The above limit applies to remittances involving either a conversion of NT dollars into a foreign currency or a conversion of foreign currency into NT dollars. The above limit does not, however, apply to the conversion of NT dollars into other currencies, including U.S. dollars, from the proceeds of a sale of any underlying shares withdrawn from a depositary receipt facility.
97
TAXATION
R.O.C. Taxation
The following discussion describes the material R.O.C. tax consequences of the ownership and disposition of our Common Shares or ADSs by and to a nonresident individual or nonresident entity holder that owns our Common Shares or ADSs (referred to here as a “non-R.O.C. holder”). As used in this context, a “nonresident individual” is a non-R.O.C. national who owns our Common Shares or ADSs and is not physically present in the R.O.C. for 183 days or more during any calendar year, and a “nonresident entity” is a corporation or a noncorporate body that owns our Common Shares or ADSs, is organized under the laws of a jurisdiction other than the R.O.C. and has no fixed place of business or business agent in the R.O.C.
Dividends
Dividends (whether in cash or Common Shares) declared by us out of retained earnings and distributed to a non-R.O.C. holder are subject to R.O.C. withholding tax at 21% (unless a preferable tax rate is provided under a tax treaty between the R.O.C. and the jurisdiction where the non-R.O.C. holder is a resident) on the amount of the distribution (in the case of cash dividends) or on the par value of the distributed Common Shares (in the case of stock dividends).
Distributions of Common Shares or cash out of capital reserves will not be subject to withholding tax, except under limited circumstances.
Capital Gains
Starting from January 1, 2016, capital gains realized upon the sale or other disposition of common shares are exempt from R.O.C. income tax.
Sales of ADSs are not regarded as sales of R.O.C. securities, and thus any gains derived from transfers of ADSs by non-R.O.C. holders are not currently subject to R.O.C. income tax.
Securities Transaction Tax
Securities transaction tax will be imposed on the seller at the rate of 0.3% of the transaction price upon a sale of common shares. Transfers of ADSs are not subject to R.O.C. securities transaction tax. During the one-year period from April 28, 2017 to April 27, 2018, the tax rate for day trading of shares meeting certain criteria was reduced to 0.15%. The Legislative Yuan approved on April 13, 2018 is an extension of the aforesaid reduction in the tax rate. Under the amended Securities Transaction Tax Act, which became effective on April 27, 2018, the aforesaid reduction in the tax rate applies until December 31, 2024.
Subscription Rights
Distributions of statutory subscription rights for our Common Shares in compliance with the R.O.C. Company Law are currently not subject to R.O.C. tax. Sales of statutory subscription rights evidenced by securities are subject to securities transaction tax, currently at the rate of 0.3% of the gross amount received. Holders are exempt from income tax on capital gains from the sale of statutory subscription rights evidenced by securities. Proceeds derived from sales of statutory subscription rights, which are not evidenced by securities, are not subject to securities transaction tax but are subject to income tax at a fixed rate of 20% of the income if the seller is a non-R.O.C. holder. Subject to compliance with R.O.C. law, we, in our sole discretion, may determine whether statutory subscription rights are evidenced by securities.
Estate and Gift Tax
R.O.C. estate tax is payable on any property within the R.O.C. left by a deceased nonresident individual, and R.O.C. gift tax is payable on any property within the R.O.C. donated by a nonresident individual. Estate tax and gift tax are currently imposed at the progressive rates of 10%, 15% and 20%. Under the R.O.C. Estate and Gift Tax Act, common shares issued by R.O.C. companies are deemed property located in the R.O.C. without regard to the location of the owner. It is unclear whether a holder of ADSs will be considered to own common shares for this purpose.
98
Tax Treaty
At present, the R.O.C. has income tax treaties with Indonesia, Singapore, New Zealand, Australia, the United Kingdom, South Africa, Gambia, eSwatini (Swaziland), Malaysia, North Macedonia, the Netherlands, Senegal, Sweden, Belgium, Denmark, Israel, Vietnam, Paraguay, Hungary, France, India, Slovakia, Switzerland, Germany, Thailand, Kiribati, Luxembourg, Austria, Italy, Japan, Canada, Poland, Czech Republic, and Saudi Arabia. These tax treaties may limit the rate of R.O.C. withholding tax on dividends paid with respect to common shares issued by R.O.C. companies. A non-R.O.C. holder of ADSs may or may not be considered as the beneficial owner of common shares for the purposes of such treaties. Accordingly, holders of ADSs who wish to apply a reduced withholding tax rate that is provided under a tax treaty should consult their own tax advisers concerning such application. The U.S. does not have an income tax treaty with the R.O.C.
U.S. Federal Income Taxation
The following discussion describes material U.S. federal income tax consequences of the ownership and disposition of our Common Shares or ADSs to the U.S. Holders described below that hold such Common Shares or ADSs as capital assets for U.S. federal income tax purposes. As used herein, a “U.S. Holder” is a person that, for U.S. federal income tax purposes, is a beneficial owner of our Common Shares or ADSs and:
· | a citizen or individual resident of the U.S.; |
· | a corporation, or other entity taxable as a corporation, created or organized under the laws of the U.S. or of any political subdivision of the U.S.; or |
· | an estate or trust the income of which is subject to U.S. federal income taxation regardless of its source. |
This discussion does not describe all of the tax consequences that may be relevant in light of a U.S. Holder’s particular circumstances, including alternative minimum tax consequences, the provisions of the Internal Revenue Code of 1986, as amended (the “Code”) known as the Medicare contribution tax, and tax consequences that may be relevant to U.S. Holders subject to special rules, including:
· | insurance companies; |
· | tax-exempt entities, “individual retirement accounts” or “Roth IRAs”; |
· | dealers or traders in securities that use a mark-to-market method of accounting for U.S. federal income tax purposes; |
· | certain financial institutions; |
· | partnerships or other entities classified as partnerships for U.S. federal income tax purposes and partners therein; |
· | persons holding Common Shares or ADSs in connection with a trade or business conducted outside of the U.S.; |
· | persons that hold or will hold Common Shares or ADSs as part of a straddle, hedge, conversion transaction, integrated transaction, or similar transactions; |
· | persons whose functional currency for U.S. federal income tax purposes is not the U.S. dollar; |
· | persons that own or are deemed to own 10% or more of the voting power or value of our stock; or |
· | persons that acquired our Common Shares or ADSs pursuant to the exercise of any employee stock option or otherwise as compensation. |
If an entity that is classified as a partnership for U.S. federal income tax purposes holds our Common Shares or ADSs, the U.S. federal income tax treatment of a partner will generally depend on the status of the partner and the activities of the partnership. Partnerships holding our Common Shares or ADSs and their partners should consult their tax advisers as to the particular U.S. federal income tax consequences of holding and disposing of our Common Shares or ADSs.
99
This discussion is based on the Code, final, temporary, and proposed Treasury regulations, administrative pronouncements, and judicial decisions, all as of the date hereof. These laws and regulations are subject to change, possibly with retroactive effect.
In general, for U.S. federal income tax purposes, a U.S. Holder that owns ADSs should be treated as the owner of the Common Shares represented by the ADSs. Accordingly, no gain or loss should be recognized if a U.S. Holder exchanges ADSs for the Common Shares represented by those ADSs.
U.S. Holders should consult their tax advisers with regard to the application of the U.S. federal income tax laws to their Common Shares or ADSs, as well as any tax consequences arising under the laws of any state, local or non-U.S. taxing jurisdiction.
Dividends
Distributions paid on our Common Shares or ADSs, other than certain pro rata distributions of our Common Shares to all holders of our Common Shares and ADSs, will generally constitute dividend income to the extent paid out of our current or accumulated earnings and profits, as determined in accordance with U.S. federal income tax principles. Because we do not maintain calculations of our earnings and profits under U.S. federal income tax principles, it is expected that distributions generally will be reported to U.S. Holders as dividends. The amount a U.S. Holder will be required to include in income with respect to any dividend paid in NT dollars will be equal to the U.S. dollar value of the NT dollars paid, calculated by reference to the exchange rate in effect on the date the payment is received by the depositary (in the case of ADSs) or by a U.S. Holder (in the case of Common Shares), regardless of whether the payment is in fact converted into U.S. dollars on the date of receipt. If a U.S. Holder does not convert the NT dollars so received into U.S. dollars on the date of receipt, any gain or loss recognized on a subsequent sale or other disposition of the NT dollars generally will be U.S.-source ordinary income or loss. The amount of any taxable distribution of property other than cash will be the fair market value of such property on the date of distribution. Dividends will not be eligible for the dividends-received deduction generally available to U.S. corporations under the Code.
Subject to applicable limitations, certain dividends paid by “qualified foreign corporations” to certain non-corporate U.S. Holders are taxable at the preferential rates applicable to long-term capital gain. A non-U.S. corporation is treated as a qualified foreign corporation with respect to dividends it pays on shares (or depositary shares representing such shares) that are readily tradable on a securities market in the U.S., such as the NYSE, where our ADSs are traded. Noncorporate U.S. Holders should consult their tax advisers to determine whether these preferential rates may apply to dividends they receive and whether they are subject to any special rules that limit their ability to be taxed at these preferential rates.
Dividend income will be foreign-source and will include the amount of any R.O.C. taxes withheld thereon. Subject to applicable limitations and restrictions, which can vary depending upon the U.S. Holder’s circumstances (such as a requirement to satisfy certain minimum holding periods), R.O.C. taxes withheld from dividend distributions may be eligible for credit against the U.S. Holder’s U.S. federal income tax liability However, under certain Treasury regulations, in order for non-U.S. income taxes to be creditable the relevant non-U.S. income tax rules must be consistent with certain U.S. federal income tax principles, and we have not determined whether the R.O.C. income tax system meets these requirements. The limitation on foreign taxes eligible for credit is calculated separately with respect to specific classes of income. In lieu of claiming a credit, U.S. Holders may, at their election, deduct otherwise creditable R.O.C. taxes in computing their taxable income, subject to generally applicable limitations. An election to deduct non-U.S. taxes instead of claiming foreign tax credits applies to all creditable non-U.S. taxes paid or accrued in the taxable year. The rules governing foreign tax credits are complex and U.S. Holders should consult their tax advisers regarding the creditability or deductibility of any R.O.C. tax generally (including under the Treasury regulations mentioned above) and in their particular circumstances.
Certain pro rata distributions of Common Shares by us to all our shareholders (including ADS holders) will not be subject to U.S. federal income tax. Accordingly, these distributions will not give rise to U.S. federal income tax against which the R.O.C. tax imposed on these distributions may be credited. U.S. Holders should consult their tax advisers as to whether any R.O.C. tax imposed on such distributions may be creditable in general, and if so, the extent to which such R.O.C. tax may be creditable against their U.S. federal income tax on foreign-source income from other sources.
100
Capital Gains
A U.S. Holder generally will recognize U.S.-source capital gain or loss for U.S. federal income tax purposes on the sale or taxable exchange of our Common Shares or ADSs, which will be long-term capital gain or loss if our Common Shares or ADSs have been held by the U.S. Holder for more than one year. The amount of gain or loss will be equal to the difference between the U.S. Holder’s tax basis in our Common Shares or ADSs disposed of and the amount realized on disposition, in each case as determined in U.S. dollars. A U.S. Holder’s tax basis in our Common Shares or ADSs acquired for cash will generally equal the U.S. Holder’s cost of such Common Shares or ADSs. U.S. Holders should consult their tax advisers about the treatment of capital gains, which may be taxed at lower rates than ordinary income for noncorporate taxpayers, and capital losses, the deductibility of which may be limited.
The R.O.C. securities transaction tax imposed upon a sale of Common Shares (as discussed above under “R.O.C. Taxation—Securities Transaction Tax”) will not be treated as creditable foreign tax for U.S. federal income tax purposes. However, such tax may reduce the amount realized by a U.S. Holder upon a disposition of our Common Shares.
Passive Foreign Investment Company Rules
We believe that we were not a passive foreign investment company (“PFIC”) for U.S. federal income tax purposes for our 2022 taxable year. However, since PFIC status depends upon the composition of a company’s income and assets and the market value of its assets (including its equity investments), there can be no assurance that we will not be a PFIC for any taxable year.
If we are a PFIC for any taxable year during which a U.S. Holder owns a Common Share or an ADS, certain adverse consequences could apply to that U.S. Holder, such as an increased U.S. federal income tax liability on gains from depositions of our Common Shares or ADSs, or on certain excess distributions. In addition, if we are a PFIC for any taxable year during which a U.S. Holder owns a Common Share or an ADS, such U.S. Holder will generally be required to file Internal Revenue Service Form 8621 with its annual U.S. federal income tax returns, subject to certain exceptions. Furthermore, if we are a PFIC for any taxable year in which we pay a dividend or the preceding taxable year, any preferential tax that may have otherwise applied in the case of noncorporate U.S. Holders will not be available. U.S. Holders should consult their tax advisers regarding the potential application of the PFIC rules to their ownership or disposition of our Common Shares or ADSs.
Information Reporting and Backup Withholding
Payments of dividends and sales proceeds that are made within the U.S. or through certain U.S.-related financial intermediaries generally are subject to information reporting, and may be subject to backup withholding, unless (i) the U.S. Holder is an exempt recipient (and establishes that fact if required to do so) or (ii) in the case of backup withholding, the U.S. Holder provides a correct taxpayer identification number and certifies that it is not subject to backup withholding.
The amount of any backup withholding from a payment to a U.S. Holder will be allowed as a credit against the U.S. Holder’s U.S. federal income tax liability and may entitle it to a refund, provided that the required information is timely furnished to the Internal Revenue Service.
DIVIDENDS AND PAYING AGENTS
Not applicable.
STATEMENT BY EXPERTS
Not applicable.
DOCUMENTS ON DISPLAY
We file annual reports on Form 20-F and furnish periodic reports on Form 6-K with the SEC. You can read and copy these reports and other information at the SEC’s Public Reference Room at 450 Fifth Street, N.W., Washington, D.C. 20549. You can also request copies of the documents, upon payment of a duplicating fee, by writing to the Public Reference Section of the SEC. Please call the SEC at 1-800-SEC-0330 for further information on the operation of the Public Reference Room. The reports and other information we file electronically with the SEC are also available to the public from the SEC’s website at https://www.sec.gov. Information about ASEH is also available to the public on our website at https://www.aseglobal.com.
101
SUBSIDIARY INFORMATION
Not applicable.
ANNUAL REPORT TO SECURITY HOLDERS
We intend to submit any annual report provided to security holders in electronic format as an exhibit to a current report on Form 6-K.
Item 11. Quantitative and Qualitative Disclosures about Market Risk
The derivative instruments used by us were to mitigate risks arising from ordinary business operations. Our risk management department monitored risks to mitigate risk exposures, and reported unsettled positions, transaction balances, and related gains or losses to our chief financial officer on monthly basis. See Note 34 to our consolidated financial statements included in this annual report for details.
Market Risk
Our exposure to financial market risks relates primarily to changes in foreign currency exchange rates. Gains or losses arising from fluctuations in foreign currency exchange rates of a variety of derivative financial instruments were approximately offset by those of hedged items. Interest rate risk was not significant as the cost of capital was expected to be fixed.
Interest Rate Risk. Our exposure to interest rate risks relates primarily to our borrowings with floating rates, which are normally incurred to support our corporate activities and capital expenditures. We utilized financing instruments with low interest rates and favorable terms to maintain low financing cost, and adequate banking facilities, as well as to hedge interest rate risk.
For assets and liabilities with floating interest rates, a 100 basis point increase or decrease was used when reporting interest rate risk internally to key management personnel. If interest rates had been 100 basis points (1%) higher or lower and all other variables held constant, our profit before income tax for the year ended 2022 would have decreased or increased approximately by NT$794.0 million (US$25.8 million). Hedging contracts and hedged items have been considered while measuring the changes in profit before income tax. The abovementioned sensitivity analysis mainly focused on the interest rate items at the end of year. As the year-end exposure did not reflect the exposure for the year ended December 31, 2022, the abovementioned sensitivity analysis was unrepresentative of 2022.
The tables below set forth information relating to our significant obligations, including short-term borrowings and long-term borrowings, including bank loans, bills payable and bonds payable as of December 31, 2022.
102
Expected Maturity Date | ||||||||||||||||||||||||||||||||
2023 | 2024 | 2025 | 2026 | 2027 | Thereafter | Total | Fair Value |
|||||||||||||||||||||||||
(in millions, except percentages) | ||||||||||||||||||||||||||||||||
Short-term borrowings: |
||||||||||||||||||||||||||||||||
Variable rate (NT$) |
7,737.5 | - | - | - | - | - | 7,737.5 | 7,737.5 | ||||||||||||||||||||||||
Average interest rate |
1.71% | - | - | - | - | - | 1.71% | - | ||||||||||||||||||||||||
Fixed rate (NT$) |
7,800.0 | - | - | - | - | - | 7,800.0 | 7,800.0 | ||||||||||||||||||||||||
Average interest rate |
1.68% | - | - | - | - | - | 1.68% | - | ||||||||||||||||||||||||
Variable rate (US$) |
283.8 | - | - | - | - | - | 283.8 | 283.8 | ||||||||||||||||||||||||
Average interest rate |
5.24% | - | - | - | - | - | 5.24% | - | ||||||||||||||||||||||||
Fixed rate (US$) |
62.0 | - | - | - | - | - | 62.0 | 62.0 | ||||||||||||||||||||||||
Average interest rate |
4.70% | - | - | - | - | - | 4.70% | - | ||||||||||||||||||||||||
Variable rate (RMB) |
656.5 | - | - | - | - | - | 656.5 | 656.5 | ||||||||||||||||||||||||
Average interest rate |
3.39% | - | - | - | - | - | 3.39% | - | ||||||||||||||||||||||||
Fixed rate (RMB) |
350.0 | - | - | - | - | - | 350.0 | 350.0 | ||||||||||||||||||||||||
Average interest rate |
2.43% | - | - | - | - | - | 2.43% | - | ||||||||||||||||||||||||
Variable rate (EUR) |
19.0 | - | - | - | - | - | 19.0 | 19.0 | ||||||||||||||||||||||||
Average interest rate |
4.75% | - | - | - | - | - | 4.75% | - | ||||||||||||||||||||||||
Fixed rate (EUR) |
373.5 | - | - | - | - | - | 373.5 | 373.5 | ||||||||||||||||||||||||
Average interest rate |
2.27% | - | - | - | - | - | 2.27% | - | ||||||||||||||||||||||||
Variable rate (HKD) |
832.6 | - | - | - | - | - | 832.6 | 832.6 | ||||||||||||||||||||||||
Average interest rate |
5.98% | - | - | - | - | - | 5.98% | - | ||||||||||||||||||||||||
Long-term borrowings: |
||||||||||||||||||||||||||||||||
Variable rate (NT$) |
1,123.8 | 40,640.7 | 3,100.4 | 1,100.4 | 850.4 | 1,346.5 | 48,162.2 | 48,162.2 | ||||||||||||||||||||||||
Average interest rate |
1.66% | 1.35% | 1.39% | 1.39% | 1.74% | 0.50% | 1.34% | - | ||||||||||||||||||||||||
Fixed rate (NT$) |
5,000.0 | 13,902.4 | 15,000.0 | 3,500.0 | 2,000.0 | - | 39,402.4 | 39,402.4 | ||||||||||||||||||||||||
Average interest rate |
0.60% | 1.43% | 0.88% | 1.03% | 0.95% | - | 1.06% | - | ||||||||||||||||||||||||
Variable rate (US$) |
- | 806.7 | 415.3 | - | - | - | 1,222.0 | 1,222.0 | ||||||||||||||||||||||||
Average interest rate |
- | 4.03% | 3.96% | - | - | - | 4.01% | - | ||||||||||||||||||||||||
Fixed rate (EUR) |
2.0 | 2.0 | 2.0 | 2.0 | 2.0 | - | 10.0 | 10.0 | ||||||||||||||||||||||||
Average interest rate |
3.90% | 3.90% | 3.90% | 3.90% | 3.90% | - | 3.90% | - | ||||||||||||||||||||||||
Variable rate (RMB) |
525.3 | 564.6 | 502.5 | 222.9 | 238.4 | 832.2 | 2,885.9 | 2,885.9 | ||||||||||||||||||||||||
Average interest rate |
3.13% | 2.62% | 3.78% | 5.28% | 1.20% | 1.02% | 2.54% | - | ||||||||||||||||||||||||
Fixed rate (RMB) |
350.0 | - | - | - | 2,005.3 | - | 2,355.3 | 2,355.3 | ||||||||||||||||||||||||
Average interest rate |
2.25% | - | - | - | 0.20% | - | 0.50% | - |
Foreign Currency Exchange Rate Risk. Our foreign currency exposure gives rise to market risk associated with exchange rate movements against the NT dollar, our functional currency. Currently, the majority of our revenues are denominated in U.S. dollars, with a portion denominated in NT dollars and Japanese yen. Our costs of revenues and operating expenses are incurred in several currencies, primarily in NT dollars, U.S. dollars, RMB, Japanese yen, Korean won, and Euro, as well as, to a lesser extent, Singapore dollars and Malaysian ringgit. In addition, a substantial portion of our capital expenditures, primarily for the purchase of equipment, has been, and is expected to continue to be, denominated primarily in U.S. dollars with the remainder in Japanese yen. The majority of our borrowings are denominated in NT dollars, U.S. dollars and RMB. Fluctuations in exchange rates, primarily among the U.S. dollar and Japanese yen against the NT dollar, RMB, and EUR, will affect our costs and operating margins and could result in exchange losses and increased costs in NT dollar and other local currency terms.
We use 1% fluctuation when reporting foreign currency exchange rate risk internally to key management personnel and it represents management’s assessment of reasonably possible changes in foreign currency exchange rates. The sensitivity analysis included financial assets and liabilities and intercompany receivables and payables within the Group. The changes in profit before income tax due to a 1% change in U.S. dollar and Japanese yen against NT dollar, RMB, and EUR would be NT$60.0 million (US$2.0 million) for the year ended December 31, 2022. The abovementioned sensitivity analysis mainly focused on the foreign currency monetary items at each balance sheet date. As the period-end exposure did not reflect the exposure for the year ended December 31, 2022, the abovementioned sensitivity analysis was unrepresentative.
To protect against reductions in value and the volatility of future cash flows caused by changes in foreign currency exchange rates, we entered into a variety of nonderivative financial instruments and derivative financial instruments to minimize the impact of foreign currency fluctuations on our results of operations. Despite these hedging and mitigating techniques, fluctuations in exchange rates have affected, and may continue to affect, our financial condition and results of operations.
103
Our hedging strategy was to lift borrowings denominated in foreign currencies to avoid exchange rate exposure from its investments in equity instruments denominated in foreign currencies (recognized under the line item of financial assets at FVTPL) and net investment in foreign subsidiary, USIFR, which has EUR as its functional currency. Those transactions were designated as fair value hedges and a hedge of net investment in foreign operation, respectively. Hedge adjustments were made to totally offset the foreign exchange gains or losses from those equity instruments denominated in foreign currencies and foreign operations when they were evaluated based on the exchange rates on each balance sheet date. The hedge ineffectiveness in these hedging relationships arose from the material difference between the notional amounts of borrowings denominated in foreign currencies and the original investments in equity instruments denominated in foreign currencies and net investment in foreign operations. No other source of ineffectiveness is expected to emerge from these hedging relationships.
The table below sets forth our outstanding forward exchange contracts and swap contracts, for which the expected maturity dates are in 2023, in aggregate terms by type of contract as of December 31, 2022.
Forward Exchange Contracts |
Swap Contracts | |||
Buy US$ against NT$ |
||||
Notional Amount |
US$130.0 million | US$2,690.0 million | ||
Weighted Average Strike Price |
US$/NT$30.846 | US$/NT$29.154 | ||
Fair Value |
Negative US$1.142 million | US$87.669 million | ||
Buy US$ against RMB |
||||
Notional Amount |
US$155.4 million | US$350.0 million | ||
Weighted Average Strike Price |
US$/RMB6.961 | US$/RMB6.963 | ||
Fair Value |
Negative US$0.203 million | Negative US$0.486 million | ||
Buy JPY against RMB |
||||
Notional Amount |
JPY810.0 million | - | ||
Weighted Average Strike Price |
JPY/RMB0.052 | - | ||
Fair Value |
US$0.035 million | - | ||
Buy JPY against EUR |
||||
Notional Amount |
JPY100.0 million | - | ||
Weighted Average Strike Price |
JPY/EUR0.007 | - | ||
Fair Value |
US$0.015 million | - | ||
Buy NTD against RMB |
||||
Notional Amount |
NTD30.7 million | - | ||
Weighted Average Strike Price |
NTD/RMB0.228 | - | ||
Fair Value |
Negative US$0.004 million | - | ||
Sell US$ against PLN |
||||
Notional Amount |
US$12.0 million | - | ||
Weighted Average Strike Price |
US$/PLN5.094 | - | ||
Fair Value |
US$1.601 million | - | ||
Sell US$ against NT$ |
||||
Notional Amount |
US$125.4 million | US$530.3 million | ||
Weighted Average Strike Price |
US$/NT$30.541 | US$/NT$30.586 | ||
Fair Value |
Negative US$0.259 million | Negative US$1.234 million | ||
Sell US$ against RMB |
||||
Notional Amount |
US$368.5 million | - | ||
Weighted Average Strike Price |
US$/RMB6.999 | - | ||
Fair Value |
US$2.500 million | - | ||
Sell US$ against JPY |
||||
Notional Amount |
US$63.7 million | - | ||
Weighted Average Strike Price |
US$/JPY133.121 | - | ||
Fair Value |
US$0.583 million | - | ||
Sell US$ against MYR |
||||
Notional Amount |
US$25.0 million | - | ||
Weighted Average Strike Price |
US$/MYR4.506 | - | ||
Fair Value |
US$0.670 million | - | ||
Sell US$ against SGD |
||||
Notional Amount |
US$16.6 million | - | ||
Weighted Average Strike Price |
US$/SGD1.372 | - | ||
Fair Value |
US$0.396 million | - | ||
Sell US$ against KRW |
||||
Notional Amount |
US$2.0 million | US$42.0 million | ||
Weighted Average Strike Price |
US$/KRW1,267.400 | US$/KRW1,289.343 | ||
Fair Value |
Negative US$0.001 million | US$0.686 million | ||
Sell US$ against EUR |
||||
Notional Amount |
US$14.7 million | - | ||
Weighted Average Strike Price |
US$/EUR0.998 | - | ||
Fair Value |
US$1.128 million | - |
104
Other Market Risk. We are exposed to equity price risk through investments in financial assets at FVTPL and financial assets at FVTOCI. The value of these investments may fluctuate based on various factors including prevailing market conditions. Moreover, the fair value of investments in unlisted securities may be significantly different from their carrying value. As of December 31, 2022, our investments in quoted ordinary shares, open-end mutual funds, unquoted preferred shares, and private-placement funds classified as financial assets at FVTPL were NT$5,043.4 million (US$164.1 million). As of December 31, 2022, our investments in equity instruments at FVTOCI were NT$482.6 million (US$15.7 million). If equity price was 1.0% higher or lower, profit before income tax would have increased or decreased approximately by NT$50.0 million (US$1.6 million) for the same period and other comprehensive income before income tax would have increased or decreased approximately by NT$5.0 million (US$0.2 million) for the same period. Furthermore, fluctuations in gold prices may also affect the price at which we have been able to purchase gold wire. How this will impact the results of our operations depends on whether such costs can be transferred to our customers.
Item 12. Description of Securities Other Than Equity Securities
DEBT SECURITIES
Not applicable.
WARRANTS AND RIGHTS
Not applicable.
OTHER SECURITIES
Not applicable.
105
AMERICAN DEPOSITARY SHARES
Depositary Fees and Charges
As an ADS holder, you will be required to pay the following fees under the terms of the deposit agreement:
Service |
Fees | |
Issuance of ADSs (e.g., an issuance upon a deposit of shares, upon a change in ADS(s)-to-Common Share(s) ratio, or for any other reason), excluding issuances as a result of distributions of Common Shares |
Up to U.S. $5.00 per 100 ADSs issued | |
Cancellation of ADSs (e.g., a cancellation of ADSs for delivery of deposited Common Shares, upon a change in the ADS(s)-to-Common Share(s) ratio, or for any other reason) |
Up to U.S. $5.00 per 100 ADSs cancelled | |
Distribution of cash dividends or other cash distributions (e.g., upon a sale of rights and other entitlements) |
Up to U.S. $5.00 per 100 ADSs held | |
Distribution of ADSs pursuant to (i) stock dividends or other free stock distributions, or (ii) exercise of rights to purchase additional ADSs |
Up to U.S. $5.00 per 100 ADSs held | |
Distribution of securities other than ADSs or rights to purchase additional ADSs (e.g., upon a spin-off) |
Up to U.S. $5.00 per 100 ADSs held | |
ADS Services |
Up to U.S. $5.00 per 100 ADSs held on the applicable record date(s) established by the Depositary |
As an ADS holder you will also be responsible to pay certain charges such as:
· | taxes (including applicable interest and penalties) and other governmental charges; |
· | the registration fees as may from time to time be in effect for the registration of Common Shares on the share register and applicable to transfers of Common Shares to or from the name of the custodian, the Depositary or any nominees upon the making of deposits and withdrawals, respectively; |
· | certain cable, telex, and facsimile transmission and delivery expenses; |
· | the expenses and charges incurred by the Depositary in the conversion of foreign currency; |
· | the fees and expenses incurred by the Depositary in connection with compliance with exchange control regulations and other regulatory requirements applicable to Common Shares, ADSs and ADRs; and |
· | the fees and expenses incurred by the Depositary, the custodian, or any nominee in connection with the servicing or delivery of deposited property. |
ADS fees and charges payable upon (i) the issuance of ADSs and (ii) cancellation of ADSs will be payable by the person to whom the ADSs are so issued (in the case of ADS issuances) and by the person whose ADSs are being cancelled (in the case of ADS cancellations). In the case of ADSs issued by the Depositary into DTC or held via DTC, the ADS issuance and cancellation fees and charges will be payable by the DTC participant(s) receiving the ADSs or whose ADSs are being cancelled, as the case may be, on behalf of the beneficial owner(s) and will be charged by the DTC participant(s) to the account(s) of the applicable beneficial owner(s) in accordance with the procedures and practices of the DTC participant(s) as in effect at the time. ADS fees and charges in respect of distributions and the ADS service fee are charged to the holders as of the applicable ADS record date. In the case of distributions of cash, the amount of the applicable ADS fees and charges is deducted from the funds being distributed. In the case of (i) distributions other than cash and (ii) the ADS service fee, holders as of the ADS record date will be invoiced for the amount of the ADS fees and charges and such ADS fees and charges may be deducted from distributions made to holders of ADSs. For ADSs held through DTC, the ADS fees and charges for distributions other than cash and the ADS service fee may be deducted from distributions made through DTC and may be charged to the DTC participants in accordance with the procedures and practices prescribed by DTC and the DTC participants in turn charge the amount of such ADS fees and charges to the beneficial owners for whom they hold ADSs.
In the event of refusal to pay the Depositary fees, the Depositary may, under the terms of the Deposit Agreement, refuse the requested service until payment is received or may set off the amount of the Depositary fees from any distribution to be made to the ADS holder. Certain of the depositary fees and charges (such as the ADS services fee) may become payable shortly after the Closing Date. Note that the fees and charges you may be required to pay may vary over time and may be changed by us and by the Depositary. You will receive prior notice of such changes. The Depositary may reimburse us for certain expenses incurred by us in respect of the ADR program, by making available a portion of the ADS fees charged in respect of the ADR program or otherwise, upon such terms and conditions as we and the Depositary agree from time to time.
106
Depositary Payments
In 2022, we received direct reimbursement of US$3,924,354.00 (net of U.S. withholding tax) from Citibank, N.A., the depositary bank for our ADR programs.
107
PART II
Item 13. Defaults, Dividend Arrearages and Delinquencies
Not applicable.
Item 14. Material Modifications to the Rights of Security Holders and Use of Proceeds
Not applicable.
Item 15. Controls and Procedures
Disclosure Controls and Procedures
As of December 31, 2022, our management, with the participation of our principal executive officer and chief financial officer, evaluated the effectiveness of our disclosure controls and procedures as defined in Rules 13a-15(e) and 15(d)-15(e) under the Exchange Act. Our management necessarily applied its judgment in assessing the costs and benefits of such controls and procedures, which by their nature can provide only reasonable assurance regarding management’s control objectives. Based on this evaluation, our principal executive officer and chief financial officer concluded that our disclosure controls and procedures are effective for recording, processing, summarizing and reporting, within the time periods specified in the SEC’s rules and forms, for information required to be disclosed in the reports we file or submit under the Exchange Act, and for accumulating and communicating such information to our management, including our principal executive officer and chief financial officer, as appropriate to allow timely decisions regarding required disclosure.
Management’s Annual Report on Internal Control over Financial Reporting
Our management is responsible for establishing and maintaining adequate internal control over financial reporting, as defined in Rule 13a-15(f) and 15d-15(f) promulgated under the Securities Exchange Act of 1934.
Because of its inherent limitations, internal control over financial reporting may not prevent or detect misstatements. Projections of any evaluation of effectiveness to future periods are subject to the risk that controls may become inadequate because of changes in conditions or that the degree of compliance with the policies or procedures may deteriorate.
Our management assessed the effectiveness of our internal control over financial reporting as of December 31, 2022. In making this assessment, our management used the criteria set forth by the Committee of Sponsoring Organizations of the Treadway Commission (COSO) in Internal Control-Integrated Framework (2013).
Based on this assessment, management concluded that, as of December 31, 2022, our internal control over financial reporting is effective based on those criteria.
Our independent registered public accounting firm, Deloitte & Touche, assessed the effectiveness of our internal control over financial reporting. Deloitte & Touche has issued an attestation report, which is included below.
108
REPORT OF INDEPENDENT REGISTERED PUBLIC ACCOUNTING FIRM
To the shareholders and the Board of Directors of ASE Technology Holding Co., Ltd.
Opinion on Internal Control over Financial Reporting
We have audited the internal control over financial reporting of ASE Technology Holding Co., Ltd. (a Republic of China corporation) and its subsidiaries (collectively, the “Group”) as of December 31, 2022, based on criteria established in Internal Control - Integrated Framework (2013) issued by the Committee of Sponsoring Organizations of the Treadway Commission (COSO). In our opinion, the Group maintained, in all material respects, effective internal control over financial reporting as of December 31, 2022, based on criteria established in Internal Control - Integrated Framework (2013) issued by COSO.
We have also audited, in accordance with the standards of the Public Company Accounting Oversight Board (United States) (PCAOB), the consolidated financial statements as of and for the year ended December 31, 2022 of the Group and our report dated March 20, 2023, expressed an unqualified opinion on those consolidated financial statements.
Basis for Opinion
The Group’s management is responsible for maintaining effective internal control over financial reporting and for its assessment of the effectiveness of internal control over financial reporting, included in the accompanying Management’s Annual Report on Internal Control Over Financial Reporting. Our responsibility is to express an opinion on the Group’s internal control over financial reporting based on our audit. We are a public accounting firm registered with the PCAOB and are required to be independent with respect to the Group in accordance with the U.S. federal securities laws and the applicable rules and regulations of the Securities and Exchange Commission and the PCAOB.
We conducted our audit in accordance with the standards of the PCAOB. Those standards require that we plan and perform the audit to obtain reasonable assurance about whether effective internal control over financial reporting was maintained in all material respects. Our audit included obtaining an understanding of internal control over financial reporting, assessing the risk that a material weakness exists, testing and evaluating the design and operating effectiveness of internal control based on the assessed risk, and performing such other procedures as we considered necessary in the circumstances. We believe that our audit provides a reasonable basis for our opinion.
Definition and Limitations of Internal Control over Financial Reporting
A company’s internal control over financial reporting is a process designed to provide reasonable assurance regarding the reliability of financial reporting and the preparation of financial statements for external purposes in accordance with generally accepted accounting principles. A company’s internal control over financial reporting includes those policies and procedures that (1) pertain to the maintenance of records that, in reasonable detail, accurately and fairly reflect the transactions and dispositions of the assets of the company; (2) provide reasonable assurance that transactions are recorded as necessary to permit preparation of financial statements in accordance with generally accepted accounting principles, and that receipts and expenditures of the company are being made only in accordance with authorizations of management and directors of the company; and (3) provide reasonable assurance regarding prevention or timely detection of unauthorized acquisition, use, or disposition of the company’s assets that could have a material effect on the financial statements.
Because of its inherent limitations, internal control over financial reporting may not prevent or detect misstatements. Also, projections of any evaluation of effectiveness to future periods are subject to the risk that controls may become inadequate because of changes in conditions, or that the degree of compliance with the policies or procedures may deteriorate.
/s/ Deloitte & Touche |
Taipei, Taiwan Republic of China |
March 20, 2023 |
109
Changes in Internal Control over Financial Reporting
There has been no change in our internal control over financial reporting that occurred during the period covered by this annual report that has materially affected, or is reasonably likely to materially affect, our internal control over financial reporting during 2022.
Item 16. [Reserved]
Item 16A. Audit Committee Financial Expert
Our board of directors determined that Shen-Fu Yu, Mei-Yueh Ho, and Wen-Chyi Ong are audit committee financial experts as defined under the applicable rules of the SEC issued pursuant to Section 407 of the Sarbanes-Oxley Act of 2002 and are independent for the purposes of Rule 10A-3 of the Exchange Act.
Item 16B. Code of Ethics
We have adopted a Code of Business Conduct and Ethics (the “Code of Ethics”), which satisfies the requirements of Item 16B of Form 20-F and applies to all employees, officers, supervisors, and directors of our Company and subsidiaries, including our principal executive officer, chief financial officer, and principal accounting officer. The Code of Ethics contains the policies with respect to anti-corruption, fair competition, anti-money laundering, whistleblowing, and regulatory compliance. The robust and effective policies and procedures have been built in the Code of Ethics to enable us to persistently maintain high ethical standards of business conduct. We have continued to implement the Code of Ethics through promoting awareness and educational activities among our employees, officers, supervisors, and directors of our Company and subsidiaries in daily operation. For further details on the Code of Ethics, please refer to our website at https://ir.aseglobal.com/html/ir_doc.php.
110
Year Ended December 31, | ||||||||||||
2021 |
2022 | |||||||||||
NT$ |
NT$ |
US$ | ||||||||||
(in thousands) | ||||||||||||
Audit fees (1) |
186,435.0 | 216,948.7 | 7,059.8 | |||||||||
Audit-related fees (2) |
2,393.1 | 2,420.5 | 78.8 | |||||||||
Tax fees (3) |
20,013.1 | 26,532.5 | 863.4 | |||||||||
All other fees (4) |
6,094.1 | 12,807.0 | 416.8 | |||||||||
Total |
214,935.3 | 258,708.7 | 8,418.8 | |||||||||
(1) | Audit fees are defined as the standard audit and review work that needs to be performed each year in order to issue an opinion on our consolidated financial statements and to issue reports on the local statutory financial statements. It also includes services that can only be provided by our auditor such as statutory audits required by the Tax Bureau of the R.O.C. and the Customs Bureau of the R.O.C., consents, and comfort letters and any other audit services required for SEC or other regulatory filings. |
(2) | Audit-related fees consist of assurance and related services by Deloitte & Touche and its affiliated firms that are reasonably related to the performance of the audit or review of our financial statements and are not reported above under Audit Fees. The service for the fees disclosed under this category relate to cash capital increase and bonds offering. |
(3) | Tax fees consist of professional services rendered by Deloitte & Touche and its affiliated firms for tax compliance and tax advice. The services for the fees disclosed under this category include tax return preparation and technical tax advice. |
(4) | Other fees primarily consist of a risk management advisory fee and a business operation and process advisory fee, among others. |
Item 16D. Exemptions from the Listing Standards for Audit Committees
Not applicable.
Item 16E. Purchases of Equity Securities by the Issuer and Affiliated Purchasers
Share Repurchase
On November 5, 2021, we announced a share repurchase program, or the “First Share Repurchase Program,” which is approved by our board of directors to repurchase our Common Shares during the period from November 8, 2021 to January 7, 2022. The repurchase price under the First Share Repurchase Program was between NT$90.0 to NT$150.0 per Common Share. The maximum number of Common Shares allowed to be repurchased pursuant to the First Share Repurchase Program was 55.0 million, equal to 1.25% of our issued and outstanding Common Shares.
The First Share Repurchase Program was concluded on December 30, 2021, with a total number of 55.0 million Common Shares being repurchased for an aggregate purchase price of NT$8,250 million. February 25, 2022 was the record date for capital reduction and we completed the cancellation of those repurchased ordinary shares.
The table below sets forth detailed information about the First Share Repurchase Program.
Period |
Total Number of Common Shares Purchased |
Average Price Paid Per Common Share (NT$) |
Total Number of Common Shares Purchased as Part of Publicly Announced Programs |
Maximum Number (or Approximate Dollar Value) of Common Shares that May Still Be Purchased Under the Programs |
||||||
First Share Repurchase |
||||||||||
November 2021 (November 9, 2021 – December 30, 2021) |
55,000,000 | 104.27 | 55,000,000 | – |
Item 16F. Change in Registrant’s Certifying Accountant
Not applicable.
Item 16G. Corporate Governance
As a company listed on the NYSE, we are subject to certain corporate governance rules of the NYSE. The application of the NYSE’s corporate governance rules is limited for foreign private issuers, recognizing that they must comply with domestic requirements. As a foreign private issuer, we must comply with the following NYSE corporate governance rules: 1) satisfy the audit committee requirements of the SEC; 2) the principal executive officer must promptly notify the NYSE in writing upon becoming aware of any material non-compliance with applicable NYSE corporate governance rules; 3) submit annual and interim affirmations to the NYSE regarding compliance with applicable NYSE corporate governance requirements; and 4) provide a brief description of any significant differences between our corporate governance practices and those required of U.S. companies under the NYSE listing standards. The table below sets forth the significant differences between our corporate governance practices and those required of U.S. companies under the NYSE listing standards.
112
New York Stock Exchange Corporate Governance Rules Applicable to U.S. Companies |
Description of Significant Differences Between Our Governance Practices and the NYSE Corporate Governance Rules Applicable to U.S. Companies | |
Director independence | ||
Listed companies must have a majority of independent directors, as defined under the NYSE listing standards. | Three members of our board of directors are independent as defined in Rule 10A-3 under the Exchange Act. We do not assess the independence of our directors under the independence requirements of the NYSE listing standards. Pursuant to relevant laws and regulations of the R.O.C., we have three independent directors on our board of directors that were elected through the candidate nomination system at our annual general shareholders’ meeting on August 12, 2021. | |
To empower non-management directors to serve as a more effective check on management, the non-management directors of each company must meet at regularly scheduled executive sessions without management. | All of our directors attend the meetings of the board of directors. Our non-management directors do not meet at regularly scheduled executive sessions without management. The R.O.C. Company Law does not require companies incorporated in the R.O.C. to have their non-management directors meet at regularly scheduled executive sessions without management. | |
Nominating/Corporate governance committee | ||
Listed companies must have a nominating/corporate governance committee composed entirely of independent directors and governed by a written charter that provides for certain responsibilities of the committee set out in the NYSE listing standards. | We do not have a nominating/corporate governance committee. The R.O.C. Company Law does not require companies incorporated in the R.O.C. to have a nominating/corporate governance committee. Currently, our board of directors performs the duties of a corporate governance committee and regularly reviews our corporate governance principles and practices. In addition, our chief administration officer was appointed as the corporate governance officer by the board of directors to facilitate the operation of the board of directors.
The R.O.C. Company Law requires that directors be elected by shareholders. Under R.O.C. laws and regulations, companies that have independent directors are required to adopt a candidate nomination system for the election of independent directors. Our three independent directors were elected through the candidate nomination system provided in our Articles of Incorporation. However, starting from 2021, the directors (including independent directors) of the company listed on the TWSE or the Taipei Exchange shall be nominated by adopting the candidate nomination system. | |
Compensation committee | ||
Listed companies must have a compensation committee composed entirely of independent directors and governed by a written charter that provides for certain responsibilities of the committee set out in the NYSE listing standards. | We have a compensation committee as required by the regulations promulgated by the FSC. The charter of such committee contains similar responsibilities as those provided under NYSE listing standards. |
113
New York Stock Exchange Corporate Governance Rules Applicable to U.S. Companies |
Description of Significant Differences Between Our Governance Practices and the NYSE Corporate Governance Rules Applicable to U.S. Companies | |
In addition to any requirement of Rule 10A-3(b)(1), all compensation committee members must satisfy the independence requirements for independent directors set out in the NYSE listing standards. | We do not assess the independence of our compensation committee member under the independence requirements of the NYSE listing standards but adopt the independence standard as promulgated under the R.O.C. Regulations Governing the Appointment and Exercise of Powers by the Remuneration Committee of a Company Whose Stock is Listed on the TWSE or the Taipei Exchange. | |
Audit committee | ||
Listed companies must have an audit committee that satisfies the requirements of Rule 10A-3 under the Exchange Act. | We have an audit committee that satisfies the requirements of Rule 10A-3 under the Exchange Act and the requirements under the R.O.C. Securities and Exchange Act. | |
The audit committee must have a minimum of three members. In addition to any requirement of Rule 10A-3(b)(1), all audit committee members must satisfy the independence requirements for independent directors set out in the NYSE listing standards. | We currently have three members on our audit committee. Our audit committee members satisfy the independence requirements of Rule 10A-3 under the Exchange Act. We do not assess the independence of our audit committee member under the independence requirements of the NYSE listing standards. | |
The audit committee must have a written charter that provides for the duties and responsibilities set out in Rule 10A-3 and addresses certain other matters required by the NYSE listing standards. | Our audit committee charter provides for the audit committee to assist our board of directors in its oversight of (i) the integrity of our financial statements, (ii) the qualifications, independence, and performance of our independent auditor and (iii) our compliance with legal and regulatory requirements and provides for the duties and responsibilities set out in Rule 10A-3. Our audit committee charter does not address all the matters required by the NYSE listing standards beyond the requirements of Rule 10A-3. | |
Because the appointment and retention of our independent auditor are the responsibility of our entire board of directors under R.O.C. laws and regulations, our audit committee charter provides that the audit committee shall make recommendations to the board of directors with respect to these matters. | ||
Each listed company must have an internal audit function. | We have an internal audit function. Under the R.O.C. Regulations for the Establishment of Internal Control Systems by Public Companies, a public company is required to set out its internal control systems in writing, including internal audit implementation rules, which must be approved by the board of directors. Our entire board of directors and the principal executive officer are responsible for the establishment of the internal audit functions, compliance with the internal audit implementation rules, and oversight of our internal control systems, including the appointment and retention of our independent auditor. |
114
New York Stock Exchange Corporate Governance Rules Applicable to U.S. Companies |
Description of Significant Differences Between Our Governance Practices and the NYSE Corporate Governance Rules Applicable to U.S. Companies | |
Equity compensation plans |
||
Shareholders must be given the opportunity to vote on all equity compensation plans and material revisions thereto, except for employment inducement awards, certain grants, plans, and amendments in the context of mergers and acquisitions, and certain specific types of plans. |
The board of directors has authority under R.O.C. laws and regulations to approve (i) the distribution of employee compensation and (ii) employee stock option plans by a majority vote of the board of directors at a meeting where at least two-thirds of all directors are present and to grant options to employees pursuant to such plans, provided that shareholders’ approval is required if the exercise price of an option would be less than the closing price of the Common Shares on the TWSE on the grant date of the option, subject to the approval of the Securities and Futures Bureau of the FSC, and to approve treasury stock programs and the transfer of shares to employees under such programs by a majority vote of the board of directors in a meeting where at least two-thirds of all directors are present. | |
Corporate governance guidelines |
||
Listed companies must adopt and disclose corporate governance guidelines. |
We have adopted the corporate governance best practice principles in accordance with the Corporate Governance Best Practice Principles for TWSE and Taipei Exchange Listed Companies promulgated by the TWSE and the Taipei Exchange, and we provide an explanation of the differences between our practice and the principles, if any, in our R.O.C. annual report. We have posted our corporate governance best practice principles on our website. Also, we have a dedicated section on our website to disclose the relevant information and inform investors how to access such principles. | |
Code of ethics for directors, officers, and employees |
||
Listed companies must adopt and disclose a code of business conduct and ethics for directors, officers, and employees, and promptly disclose any waivers of the code for directors or executive officers. |
We have adopted a code of ethics that satisfies the requirements of Item 16B of Form 20-F and applies to all employees, officers, supervisors and directors of our company and our subsidiaries and will disclose any waivers of the code as required by Item 16B of Form 20-F. We have posted our code of ethics on our website. | |
Description of significant differences |
||
Listed foreign private issuers must disclose any significant ways in which their corporate governance practices differ from those followed by domestic companies under NYSE listing standards. |
This table contains the significant differences between our corporate governance practices and those required of U.S. companies under the NYSE listing standards. | |
Principal Executive Officer certification |
||
Each listed company principal executive officer must certify to the NYSE each year that he or she is not aware of any violation by the company of NYSE corporate governance listing standards, qualifying the certification to the extent necessary. |
As a foreign private issuer, we are not required to comply with this rule; however, our principal executive officer provides certifications under Sections 302 and 906 of the Sarbanes-Oxley Act. | |
Each listed company principal executive officer must promptly notify the NYSE in writing after any executive officer of the listed company becomes aware of any material non-compliance with any applicable provisions of Section 303A. |
We intend to comply with this requirement. |
115
New York Stock Exchange Corporate Governance Rules Applicable to U.S. Companies |
Description of Significant Differences Between Our Governance Practices and the NYSE Corporate Governance Rules Applicable to U.S. Companies | |
Each listed company must submit an executed Written Affirmation annually to the NYSE. In addition, each listed company must submit an interim Written Affirmation each time a change occurs to the board or any of the committees subject to Section 303A. The annual and interim Written Affirmations must be in the form specified by the NYSE. |
We have complied with this requirement to date and intend to continue to comply going forward. | |
Website |
||
Listed companies must have and maintain a publicly accessible website. |
We have and maintain a publicly accessible website. |
Item 16H. Mine Safety Disclosure
Not applicable.
Item 16I. Disclosure Regarding Foreign Jurisdictions that Prevent Inspections
Not applicable.
116
PART III
Item 17. Financial Statements
The Company has elected to provide financial statements and related information pursuant to Item 18.
Item 18. Financial Statements
See the consolidated financial statements starting on page F-1 of this annual report.
Item 19. Exhibits
1. |
2.
(a) |
(b) |
4.
(a) | ^Asset Purchase Agreement dated July 3, 1999 among ASE (Chung Li) Inc., ASE Inc., Motorola Electronics Taiwan, Ltd. and Motorola, Inc. (incorporated by reference to Exhibit 10.2 to ASE Test’s registration statement on Form F-3 (File No. 333-10892) filed on September 27, 1999 (the “ASE Test 1999 Form-3”)). |
(b) |
(c) | ^Stock Purchase Agreement dated July 3, 1999 among ASE Investment (Labuan) Inc., ASE Inc., Motorola Asia Ltd. and Motorola, Inc. relating to the purchase and sale of 100.0% of the common stock of Motorola Korea Ltd. (incorporated by reference to Exhibit 10.3 to the ASE Test 1999 Form F-3). |
(d) |
(e) |
117
(f) |
(g) |
(h) |
(i) |
(j) |
(k) |
(l) |
(m) |
(n) |
(o) |
(p) |
(q) |
118
(r) |
(s) |
(t) |
(u) |
(v) |
(w) |
8. |
12.
(a) | *Certification of Jason C.S. Chang, required by Rule 13a-14(a) of the Exchange Act. |
(b) | *Certification of Joseph Tung, required by Rule 13a-14(a) of the Exchange Act. |
13.
(a) |
(b) |
15.
(a) |
(b) |
101.INS* | Inline XBRL Instance Document—this instance document does not appear in the Interactive Data File because its XBRL tags embedded within the Inline XBRL document |
101.SCH* | Inline XBRL Taxonomy Extension Schema Document |
101.CAL* | Inline XBRL Taxonomy Extension Calculation Linkbase Document |
101.DEF* | Inline XBRL Taxonomy Extension Definition Linkbase Document |
119
101.LAB* | Inline XBRL Taxonomy Extension Label Linkbase Document |
101.PRE* | Inline XBRL Taxonomy Extension Presentation Linkbase Document |
104 | Cover Page Interactive Data File. (Embedded within the Inline XBRL document) |
† | Pursuant to Item 601(b)(10)(iv) of Regulation S-K promulgated by the Securities and Exchange Commission, certain portions of this exhibit have been redacted because they are neither material nor the type that the Company treats as private or confidential |
^ | Filed in paper. |
* | Filed herewith. |
** | Schedules and annexes have been omitted. |
The Company agrees to furnish to the SEC upon request a copy of any instrument which defines the rights of holders of long-term debt of the Company and its consolidated subsidiaries.
120
SIGNATURES
The registrant hereby certifies that it meets all of the requirements for filing on annual report on Form 20-F and that it has duly caused and authorized the undersigned to sign this annual report on its behalf.
ASE TECHNOLOGY HOLDING CO., LTD. | ||
By: |
/s/ Joseph Tung | |
Name: Title: |
Joseph Tung Chief Financial Officer |
Date: April 10, 2023
ASE Technology Holding Co., Ltd. and Subsidiaries Consolidated Financial Statements as of December 31, 2021 and 2022 and for the Years Ended December 31, 2020, 2021 and 2022 and Reports of Independent Registered Public Accounting Firms |
• |
We tested the design and operating effectiveness of controls over management’s goodwill impairment evaluation, including those over the determination of the value in use of the packaging and testing segments, such as controls related to management’s selection of the discount rates and assessment on the reasonableness of forecasts of future revenues. |
• | We evaluated management’s ability to accurately forecast future revenues of the packaging and testing segments by comparing their actual results to management’s historical forecasts. |
• | We performed sensitivity analyses to evaluate the risk of impairment if key assumptions are changed. |
• | With the assistance of our fair value specialists, we evaluated the reasonableness of the discount rates by performing certain procedures, including: |
- | Testing the source information underlying the determination of the discount rates and the mathematical accuracy of the calculation. |
- | Developing a range of independent estimates and comparing those to the discount rates selected by management. |
December 31, 2021 |
December 31, 2022 |
|||||||||||
NT$ |
NT$ |
US$ (Note 4) |
||||||||||
ASSETS |
||||||||||||
CURRENT ASSETS |
||||||||||||
Cash and cash equivalents (Note 6) |
$ | $ | $ | |||||||||
Financial assets at fair value through profit or loss - current (Note 7) |
||||||||||||
Contract assets - current (Note 4 )1 |
||||||||||||
Trade receivables, net (Note 10) |
||||||||||||
Other receivables (Notes 10 and 30) |
||||||||||||
Current tax assets |
||||||||||||
Inventories (Note 11) |
||||||||||||
Inventories related to real estate business (Notes 12 and 36) |
||||||||||||
Other financial assets - current (Notes 13 and 36) |
||||||||||||
Other current assets |
||||||||||||
|
|
|
|
|
|
|||||||
Total current assets |
|
|||||||||||
|
|
|
|
|
|
|||||||
NON-CURRENT ASSETS |
||||||||||||
Financial assets at fair value through profit or loss — non-current (Note 7) |
||||||||||||
Financial assets at fair value through other comprehensive income — non-current (Note |
||||||||||||
Investments accounted for using the equity method (Note 14) |
||||||||||||
Property, plant and equipment (Notes 15, 25, 36 and 37) |
||||||||||||
Right-of-use |
||||||||||||
Investment properties (Notes 17, 25 and 36) |
||||||||||||
Goodwill (Note 18) |
||||||||||||
Other intangible assets (Notes 19 and 25) |
||||||||||||
Deferred tax assets |
||||||||||||
Other financial assets - non-current (Notes 13 and 36) |
||||||||||||
Other non-current assets |
||||||||||||
|
|
|
|
|
|
|||||||
Total non-current assets |
||||||||||||
|
|
|
|
|
|
|||||||
TOTAL |
$ | $ | $ | |||||||||
|
|
|
|
|
|
December 31, 2021 |
December 31, 2022 |
|||||||||||
NT$ |
NT$ |
US$ (Note 4) |
||||||||||
LIABILITIES AND EQUITY |
||||||||||||
CURRENT LIABILITIES |
||||||||||||
Short-term borrowings (Notes 20 and 36) |
$ | $ | $ | |||||||||
Financial liabilities at fair value through profit or loss - current (Note 7) |
||||||||||||
Financial liabilities for hedging - current (Notes 20 and 34) |
||||||||||||
Trade payables |
||||||||||||
Other payables (Note 22) |
||||||||||||
Current tax liabilities |
||||||||||||
Lease liabilities - current (Note 16) |
||||||||||||
Current portion of bonds payable (Note 21) |
||||||||||||
Current portion of long-term borrowings (Notes 20 and 36) |
||||||||||||
Other current liabilities |
||||||||||||
|
|
|
|
|
|
|||||||
Total current liabilities |
||||||||||||
|
|
|
|
|
|
|||||||
NON-CURRENT LIABILITIES |
||||||||||||
Financial liabilities for hedging - non-current (Notes 20 and 34) |
- |
- |
||||||||||
Bonds payable (Note 21) |
||||||||||||
Long-term borrowings (Notes 20 and 36) |
||||||||||||
Deferred tax liabilities |
||||||||||||
Lease liabilities - non-current (Note 16) |
||||||||||||
Net defined benefit liabilities (Note 23) |
||||||||||||
Other non-current liabilities |
||||||||||||
|
|
|
|
|
|
|||||||
Total non-current liabilities |
||||||||||||
|
|
|
|
|
|
|||||||
Total liabilities |
||||||||||||
|
|
|
|
|
|
|||||||
EQUITY ATTRIBUTABLE TO OWNERS OF THE COMPANY (Note 24) |
||||||||||||
Share capital |
||||||||||||
Ordinary shares |
||||||||||||
Shares subscribed in advance |
||||||||||||
|
|
|
|
|
|
|||||||
Total share capital |
||||||||||||
|
|
|
|
|
|
|||||||
Capital surplus |
||||||||||||
|
|
|
|
|
|
|||||||
Retained earnings |
||||||||||||
Legal reserve |
||||||||||||
Special reserve |
||||||||||||
Unappropriated earnings |
||||||||||||
|
|
|
|
|
|
|||||||
Total retained earnings |
||||||||||||
|
|
|
|
|
|
|||||||
Other equity |
( |
) | ( |
) | ( |
) | ||||||
|
|
|
|
|
|
|||||||
Treasury shares |
( |
) | ( |
) | ( |
) | ||||||
|
|
|
|
|
|
|||||||
Equity attributable to owners of the Company |
||||||||||||
NON-CONTROLLING INTERESTS (Note 24) |
||||||||||||
|
|
|
|
|
|
|||||||
Total equity |
||||||||||||
|
|
|
|
|
|
|||||||
TOTAL |
$ | $ | $ | |||||||||
|
|
|
|
|
|
The accompanying notes are an integral part of the consolidated financial statements. |
(Concluded) |
For the Year Ended December 31 |
||||||||||||||||
2020 |
2021 |
2022 |
||||||||||||||
NT$ |
NT$ |
NT$ |
US$ (Note 4) |
|||||||||||||
OPERATING REVENUES (Note 4 1 |
$ | $ | $ | $ | ||||||||||||
OPERATING COSTS (Notes 11 and 25) |
||||||||||||||||
|
|
|
|
|
|
|
|
|||||||||
GROSS PROFIT |
||||||||||||||||
|
|
|
|
|
|
|
|
|||||||||
OPERATING EXPENSES (Note 25) |
||||||||||||||||
Selling and marketing expenses |
||||||||||||||||
General and administrative expenses |
||||||||||||||||
Research and development expenses |
||||||||||||||||
|
|
|
|
|
|
|
|
|||||||||
Total operating expenses |
||||||||||||||||
|
|
|
|
|
|
|
|
|||||||||
OTHER OPERATING INCOME AND EXPENSES, NET (Note 25) |
||||||||||||||||
|
|
|
|
|
|
|
|
|||||||||
PROFIT FROM OPERATIONS |
||||||||||||||||
|
|
|
|
|
|
|
|
|||||||||
NON-OPERATING INCOME AND EXPENSES |
||||||||||||||||
Other income (Note 25) |
||||||||||||||||
Other gains and losses (Note 25) |
||||||||||||||||
Finance costs (Note 25) |
( |
) | ( |
) | ( |
) | ( |
) | ||||||||
Share of the profit or loss of associates and joint ventures |
||||||||||||||||
|
|
|
|
|
|
|
|
|||||||||
Total non-operating income and expenses |
||||||||||||||||
|
|
|
|
|
|
|
|
|||||||||
PROFIT BEFORE INCOME TAX |
||||||||||||||||
INCOME TAX EXPENSE (Note 26) |
||||||||||||||||
|
|
|
|
|
|
|
|
|||||||||
PROFIT FOR THE YEAR |
||||||||||||||||
|
|
|
|
|
|
|
|
|||||||||
OTHER COMPREHENSIVE INCOME (LOSS) |
||||||||||||||||
Items that will not be reclassified subsequently to profit or loss: |
||||||||||||||||
Remeasurement of defined benefit obligation |
( |
) | ||||||||||||||
Unrealized gain (loss) on equity instruments at fair value through other comprehensive income |
( |
) | ( |
) | ( |
) | ||||||||||
Share of other comprehensive income (loss) of associates and joint ventures |
( |
) | ( |
) | ||||||||||||
Income tax relating to items that will not be reclassified subsequently to profit or loss |
( |
) | ( |
) | ||||||||||||
|
|
|
|
|
|
|
|
|||||||||
( |
) | ( |
) | |||||||||||||
|
|
|
|
|
|
|
|
For the Year Ended December 31 |
||||||||||||||||
2020 |
2021 |
2022 |
||||||||||||||
NT$ |
NT$ |
NT$ |
US$ (Note 4) |
|||||||||||||
Items that may be reclassified subsequently to profit or loss: |
||||||||||||||||
Exchange differences on translating foreign operations |
$ | ( |
) | $ | ( |
) | $ | $ | ||||||||
Unrealized gain (loss) on debt investments at fair value through other comprehensive income |
( |
) | ( |
) | ( |
) | ||||||||||
Gain (loss) on hedging instruments |
( |
) | ||||||||||||||
Share of other comprehensive income (loss) of associates and joint ventures |
( |
) | ( |
) | ||||||||||||
|
|
|
|
|
|
|
|
|||||||||
( |
) | ( |
) | |||||||||||||
|
|
|
|
|
|
|
|
|||||||||
Other comprehensive income for the year, net of income tax |
||||||||||||||||
|
|
|
|
|
|
|
|
|||||||||
TOTAL COMPREHENSIVE INCOME FOR THE YEAR |
$ | $ | $ | $ | ||||||||||||
|
|
|
|
|
|
|
|
|||||||||
NET PROFIT ATTRIBUTABLE TO: |
||||||||||||||||
Owners of the Company |
$ | $ | $ | $ | ||||||||||||
Non-controlling interests |
||||||||||||||||
|
|
|
|
|
|
|
|
|||||||||
$ | $ | $ | $ | |||||||||||||
|
|
|
|
|
|
|
|
|||||||||
TOTAL COMPREHENSIVE INCOME ATTRIBUTABLE TO: |
||||||||||||||||
Owners of the Company |
$ |
$ |
$ | $ | ||||||||||||
Non-controlling interests |
||||||||||||||||
|
|
|
|
|
|
|
|
|||||||||
$ | $ | $ | $ | |||||||||||||
|
|
|
|
|
|
|
|
|||||||||
EARNINGS PER SHARE (Note 27) |
||||||||||||||||
Basic |
$ | $ | $ | $ | ||||||||||||
|
|
|
|
|
|
|
|
|||||||||
Diluted |
$ | $ | $ | $ | ||||||||||||
|
|
|
|
|
|
|
|
|||||||||
EARNINGS PER AMERICAN DEPOSITARY SHARE (“ADS”) (Note 27) |
||||||||||||||||
Basic |
$ | $ | $ | $ | ||||||||||||
|
|
|
|
|
|
|
|
|||||||||
Diluted |
$ | $ | $ | $ | ||||||||||||
|
|
|
|
|
|
|
|
The accompanying notes are an integral part of the consolidated financial statements. |
(Concluded) |
Equity Attributable to Owners of the Company |
||||||||||||||||||||||||||||||||||||||||||||||||||||||||||||||||
Other Equity |
||||||||||||||||||||||||||||||||||||||||||||||||||||||||||||||||
Exchange Differences on Translating Foreign Operations |
Unrealized Gain (Loss) on Financial Assets at Fair Value Through Other Comprehensive Income |
Gain (Loss) on Hedging Instruments |
Unearned Employee Compensation |
Total |
Treasury Shares |
Total |
Non-controlling Interests |
Total Equity |
||||||||||||||||||||||||||||||||||||||||||||||||||||||||
Share Capital |
Retained Earnings |
|||||||||||||||||||||||||||||||||||||||||||||||||||||||||||||||
Shares (In Thousands) |
Amounts |
Capital Surplus |
Legal Reserve |
Special Reserve |
Unappropriated Earnings |
Total |
||||||||||||||||||||||||||||||||||||||||||||||||||||||||||
BALANCE AT JANUARY 1, 2020 |
$ | $ | $ | $ | $ | $ | $ | ( |
) | $ | ( |
) | $ | — | $ | — | $ | ( |
) | $ | ( |
) | $ | $ | $ | |||||||||||||||||||||||||||||||||||||||
|
|
|
|
|
|
|
|
|
|
|
|
|
|
|
|
|
|
|
|
|
|
|
|
|
|
|
|
|
|
|
|
|||||||||||||||||||||||||||||||||
Appropriation of 2019 earnings |
||||||||||||||||||||||||||||||||||||||||||||||||||||||||||||||||
Legal reserve |
— | — | — | — | ( |
) | — | — | — | — | — | — | — | — | — | — | ||||||||||||||||||||||||||||||||||||||||||||||||
Special reserve |
— | — | — | — | ( |
) | — | — | — | — | — | — | — | — | — | — | ||||||||||||||||||||||||||||||||||||||||||||||||
Cash dividends distributed by the Company |
— | — | — | — | — | ( |
) | ( |
) | — | — | — | — | — | — | ( |
) | — | ( |
) | ||||||||||||||||||||||||||||||||||||||||||||
|
|
|
|
|
|
|
|
|
|
|
|
|
|
|
|
|
|
|
|
|
|
|
|
|
|
|
|
|
|
|
|
|||||||||||||||||||||||||||||||||
— | — | — | ( |
) | ( |
) | — | — | — | — | — | — | ( |
) | — | ( |
) | |||||||||||||||||||||||||||||||||||||||||||||||
|
|
|
|
|
|
|
|
|
|
|
|
|
|
|
|
|
|
|
|
|
|
|
|
|
|
|
|
|
|
|
|
|||||||||||||||||||||||||||||||||
Change from investments in associates accounted for using the equity method |
— | — | — | — | — | — | — | — | — | — | — | — | — | |||||||||||||||||||||||||||||||||||||||||||||||||||
|
|
|
|
|
|
|
|
|
|
|
|
|
|
|
|
|
|
|
|
|
|
|
|
|
|
|
|
|
|
|
|
|||||||||||||||||||||||||||||||||
Other changes in the capital surplus |
— | — | — | — | — | — | — | — | — | — | — | — | — | |||||||||||||||||||||||||||||||||||||||||||||||||||
|
|
|
|
|
|
|
|
|
|
|
|
|
|
|
|
|
|
|
|
|
|
|
|
|
|
|
|
|
|
|
|
|||||||||||||||||||||||||||||||||
Net profit for the year ended December 31, 2020 |
— | — | — | — | — | — | — | — | — | — | — | |||||||||||||||||||||||||||||||||||||||||||||||||||||
Other comprehensive income (loss) for the year ended December 31, 2020, net of income tax |
— | — | — | — | — | ( |
) | ( |
) | ( |
) | ( |
) | — | — | |||||||||||||||||||||||||||||||||||||||||||||||||
|
|
|
|
|
|
|
|
|
|
|
|
|
|
|
|
|
|
|
|
|
|
|
|
|
|
|
|
|
|
|
|
|||||||||||||||||||||||||||||||||
Total comprehensive income (loss) for the year ended December 31, 2020 |
— | — | — | — | — | ( |
) | ( |
) | — | — | |||||||||||||||||||||||||||||||||||||||||||||||||||||
|
|
|
|
|
|
|
|
|
|
|
|
|
|
|
|
|
|
|
|
|
|
|
|
|
|
|
|
|
|
|
|
|||||||||||||||||||||||||||||||||
Cash dividends received by subsidiaries from the Company |
— | — | — | — | — | — | — | — | — | — | — | — | — | |||||||||||||||||||||||||||||||||||||||||||||||||||
|
|
|
|
|
|
|
|
|
|
|
|
|
|
|
|
|
|
|
|
|
|
|
|
|
|
|
|
|
|
|
|
|||||||||||||||||||||||||||||||||
Disposal of interest in investments accounted for using the equity method |
— | — | — | — | ( |
) | ( |
) | — | — | — | — | — | |||||||||||||||||||||||||||||||||||||||||||||||||||
|
|
|
|
|
|
|
|
|
|
|
|
|
|
|
|
|
|
|
|
|
|
|
|
|
|
|
|
|
|
|
|
|||||||||||||||||||||||||||||||||
Differences between consideration and carrying amount arising from acquisition or disposal of subsidiaries (Note 31) |
— | — | ( |
) | — | — | — | — | — | — | — | — | — | — | ( |
) | ( |
) | ( |
) | ||||||||||||||||||||||||||||||||||||||||||||
|
|
|
|
|
|
|
|
|
|
|
|
|
|
|
|
|
|
|
|
|
|
|
|
|
|
|
|
|
|
|
|
|||||||||||||||||||||||||||||||||
Changes in percentage of ownership interest in subsidiaries (Note 31) |
— | — | ( |
) | — | — | ( |
) | ( |
) | — | — | — | — | — | — | ( |
) | ( |
) | ( |
) | ||||||||||||||||||||||||||||||||||||||||||
|
|
|
|
|
|
|
|
|
|
|
|
|
|
|
|
|
|
|
|
|
|
|
|
|
|
|
|
|
|
|
|
|||||||||||||||||||||||||||||||||
Issue of ordinary shares under employee share options (Note 28) |
— | — | — | — | — | — | — | — | — | — | — | |||||||||||||||||||||||||||||||||||||||||||||||||||||
|
|
|
|
|
|
|
|
|
|
|
|
|
|
|
|
|
|
|
|
|
|
|
|
|
|
|
|
|
|
|
|
|||||||||||||||||||||||||||||||||
Cash dividends distributed by subsidiaries |
— | — | — | — | — | — | — | — | — | — | — | — | — | — | ( |
) | ( |
) | ||||||||||||||||||||||||||||||||||||||||||||||
|
|
|
|
|
|
|
|
|
|
|
|
|
|
|
|
|
|
|
|
|
|
|
|
|
|
|
|
|
|
|
|
|||||||||||||||||||||||||||||||||
Additional non-controlling interest arising on issue of employee share options by subsidiaries (Note 28) |
— | — | ( |
) | — | — | ( |
) | ( |
) | — | — | — | — | — | — | ( |
) | ||||||||||||||||||||||||||||||||||||||||||||||
|
|
|
|
|
|
|
|
|
|
|
|
|
|
|
|
|
|
|
|
|
|
|
|
|
|
|
|
|
|
|
|
|||||||||||||||||||||||||||||||||
Disposal of investments in equity instruments at fair value through other comprehensive income |
— | — | — | — | — | — | ( |
) | — | — | ( |
) | — | — | — | — | ||||||||||||||||||||||||||||||||||||||||||||||||
|
|
|
|
|
|
|
|
|
|
|
|
|
|
|
|
|
|
|
|
|
|
|
|
|
|
|
|
|
|
|
|
|||||||||||||||||||||||||||||||||
BALANCE AT DECEMBER 31, 2020 (RETROSPECTIVELY ADJUSTED) |
$ | $ | $ | $ | $ | $ | $ | ( |
) | $ | $ | ( |
) | $ | — | $ | ( |
) | $ | ( |
) | $ | $ | $ | ||||||||||||||||||||||||||||||||||||||||
|
|
|
|
|
|
|
|
|
|
|
|
|
|
|
|
|
|
|
|
|
|
|
|
|
|
|
|
|
|
|
|
|||||||||||||||||||||||||||||||||
BALANCE AT JANUARY 1, 2021 (RETROSPECTIVELY ADJUSTED) |
$ | $ | $ | $ | $ | $ | $ | ( |
) | $ | $ | ( |
) | $ | — | $ | ( |
) | $ | ( |
) | $ | $ | $ | ||||||||||||||||||||||||||||||||||||||||
|
|
|
|
|
|
|
|
|
|
|
|
|
|
|
|
|
|
|
|
|
|
|
|
|
|
|
|
|
|
|
|
|||||||||||||||||||||||||||||||||
Appropriation of 2020 earnings |
||||||||||||||||||||||||||||||||||||||||||||||||||||||||||||||||
Legal reserve |
— | — | — | — | ( |
) | — | — | — | — | — | — | — | — | — | — | ||||||||||||||||||||||||||||||||||||||||||||||||
Special reserve |
— | — | — | — | ( |
) | — | — | — | — | — | — | — | — | — | — | ||||||||||||||||||||||||||||||||||||||||||||||||
Cash dividends distributed by the Company |
— | — | — | — | — | ( |
) | ( |
) | — | — | — | — | — | — | ( |
) | — | ( |
) | ||||||||||||||||||||||||||||||||||||||||||||
|
|
|
|
|
|
|
|
|
|
|
|
|
|
|
|
|
|
|
|
|
|
|
|
|
|
|
|
|
|
|
|
|||||||||||||||||||||||||||||||||
— | — | — | ( |
) | ( |
) | ( |
) | — | — | — | — | — | — | ( |
) | — | ( |
) | |||||||||||||||||||||||||||||||||||||||||||||
|
|
|
|
|
|
|
|
|
|
|
|
|
|
|
|
|
|
|
|
|
|
|
|
|
|
|
|
|
|
|
|
|||||||||||||||||||||||||||||||||
Change from investments in associates accounted for using the equity method |
— | — | ( |
) | — | — | — | ( |
) | — | — | ( |
) | — | ( |
) | — | ( |
) | |||||||||||||||||||||||||||||||||||||||||||||
|
|
|
|
|
|
|
|
|
|
|
|
|
|
|
|
|
|
|
|
|
|
|
|
|
|
|
|
|
|
|
|
|||||||||||||||||||||||||||||||||
Other changes in the capital surplus |
— | — | — | — | — | — | — | — | — | — | — | — | — | |||||||||||||||||||||||||||||||||||||||||||||||||||
|
|
|
|
|
|
|
|
|
|
|
|
|
|
|
|
|
|
|
|
|
|
|
|
|
|
|
|
|
|
|
|
|||||||||||||||||||||||||||||||||
Net profit for the year ended December 31, 2021 |
— | — | — | — | — | — | — | — | — | — | — | |||||||||||||||||||||||||||||||||||||||||||||||||||||
Other comprehensive income (loss) for the year ended December 31, 2021, net of income tax |
— | — | — | — | — | ( |
) | — | — | ( |
) | |||||||||||||||||||||||||||||||||||||||||||||||||||||
|
|
|
|
|
|
|
|
|
|
|
|
|
|
|
|
|
|
|
|
|
|
|
|
|
|
|
|
|
|
|
|
|||||||||||||||||||||||||||||||||
Total comprehensive income (loss) for the year ended December 31, 2021 |
— | — | — | — | — | ( |
) | — | — | |||||||||||||||||||||||||||||||||||||||||||||||||||||||
|
|
|
|
|
|
|
|
|
|
|
|
|
|
|
|
|
|
|
|
|
|
|
|
|
|
|
|
|
|
|
|
Equity Attributable to Owners of the Company |
||||||||||||||||||||||||||||||||||||||||||||||||||||||||||||||||
Other Equity |
||||||||||||||||||||||||||||||||||||||||||||||||||||||||||||||||
Exchange Differences on Translating Foreign Operations |
Unrealized Gain (Loss) on Financial Assets at Fair Value Through Other Comprehensive Income |
Gain (Loss) on Hedging Instruments |
Unearned Employee Compensation |
Total |
Treasury Shares |
Total |
Non-controlling Interests |
Total Equity |
||||||||||||||||||||||||||||||||||||||||||||||||||||||||
Share Capital |
Retained Earnings |
|||||||||||||||||||||||||||||||||||||||||||||||||||||||||||||||
Shares (In Thousands) |
Amounts |
Capital Surplus |
Legal Reserve |
Special Reserve |
Unappropriated Earnings |
Total |
||||||||||||||||||||||||||||||||||||||||||||||||||||||||||
Buy-back of ordinary shares |
— | $ | — | $ | — | $ | — | $ | — | $ | — | $ | — | $ | — | $ | — | $ | — | $ | — | $ | — | $ | ( |
) | $ | ( |
) | $ | — | $ | ( |
) | ||||||||||||||||||||||||||||||
|
|
|
|
|
|
|
|
|
|
|
|
|
|
|
|
|
|
|
|
|
|
|
|
|
|
|
|
|
|
|
|
|||||||||||||||||||||||||||||||||
Cash dividends received by subsidiaries from the Company |
— | — | — | — | — | — | — | — | — | — | — | — | — | |||||||||||||||||||||||||||||||||||||||||||||||||||
|
|
|
|
|
|
|
|
|
|
|
|
|
|
|
|
|
|
|
|
|
|
|
|
|
|
|
|
|
|
|
|
|||||||||||||||||||||||||||||||||
Changes in percentage of ownership interest in subsidiaries (Note 31) |
— | — | ( |
) | — | — | ( |
) | ( |
) | — | — | — | — | — | — | ( |
) | ( |
) | ( |
) | ||||||||||||||||||||||||||||||||||||||||||
|
|
|
|
|
|
|
|
|
|
|
|
|
|
|
|
|
|
|
|
|
|
|
|
|
|
|
|
|
|
|
|
|||||||||||||||||||||||||||||||||
Issue of ordinary shares under employee share options (Note 28) |
— | — | — | — | — | — | — | ( |
) | ( |
) | — | — | |||||||||||||||||||||||||||||||||||||||||||||||||||
|
|
|
|
|
|
|
|
|
|
|
|
|
|
|
|
|
|
|
|
|
|
|
|
|
|
|
|
|
|
|
|
|||||||||||||||||||||||||||||||||
Cash dividends distributed by subsidiaries |
— | — | — | — | — | — | — | — | — | — | — | — | — | — | ( |
) | ( |
) | ||||||||||||||||||||||||||||||||||||||||||||||
|
|
|
|
|
|
|
|
|
|
|
|
|
|
|
|
|
|
|
|
|
|
|
|
|
|
|
|
|
|
|
|
|||||||||||||||||||||||||||||||||
Additional non-controlling interest arising on issue of employee share options by subsidiaries (Note 28) |
— | — | — | — | — | — | — | — | — | — | — | — | ||||||||||||||||||||||||||||||||||||||||||||||||||||
|
|
|
|
|
|
|
|
|
|
|
|
|
|
|
|
|
|
|
|
|
|
|
|
|
|
|
|
|
|
|
|
|||||||||||||||||||||||||||||||||
Issue of convertible bonds by subsidiary (Note 21) |
— | — | — | — | — | — | — | — | — | — | — | — | — | — | ||||||||||||||||||||||||||||||||||||||||||||||||||
|
|
|
|
|
|
|
|
|
|
|
|
|
|
|
|
|
|
|
|
|
|
|
|
|
|
|
|
|
|
|
|
|||||||||||||||||||||||||||||||||
Disposal of investments in equity instruments at fair value through other comprehensive income |
— | — | — | — | — | — | ( |
) | — | — | ( |
) | — | — | — | — | ||||||||||||||||||||||||||||||||||||||||||||||||
|
|
|
|
|
|
|
|
|
|
|
|
|
|
|
|
|
|
|
|
|
|
|
|
|
|
|
|
|
|
|
|
|||||||||||||||||||||||||||||||||
BALANCE AT DECEMBER 31, 2021 |
$ | $ | $ | $ | $ | $ | $ | ( |
) | $ | $ | $ | ( |
) | $ | ( |
) | $ | ( |
) | $ | $ | $ | |||||||||||||||||||||||||||||||||||||||||
|
|
|
|
|
|
|
|
|
|
|
|
|
|
|
|
|
|
|
|
|
|
|
|
|
|
|
|
|
|
|
|
|||||||||||||||||||||||||||||||||
BALANCE AT JANUARY 1, 2022 |
$ | $ | $ | $ | $ | $ | $ | ( |
) | $ | $ | $ | ( |
) | $ | ( |
) | $ | ( |
) | $ | $ | $ | |||||||||||||||||||||||||||||||||||||||||
|
|
|
|
|
|
|
|
|
|
|
|
|
|
|
|
|
|
|
|
|
|
|
|
|
|
|
|
|
|
|
|
|||||||||||||||||||||||||||||||||
Appropriation of 2021 earnings |
||||||||||||||||||||||||||||||||||||||||||||||||||||||||||||||||
Legal reserve |
— | — | — | — | ( |
) | — | — | — | — | — | — | — | — | — | — | ||||||||||||||||||||||||||||||||||||||||||||||||
Special reserve |
— | — | — | — | ( |
) | — | — | — | — | — | — | — | — | — | — | ||||||||||||||||||||||||||||||||||||||||||||||||
Cash dividends distributed by the Company |
— | — | — | — | — | ( |
) | ( |
) | — | — | — | — | — | — | ( |
) | — | ( |
) | ||||||||||||||||||||||||||||||||||||||||||||
|
|
|
|
|
|
|
|
|
|
|
|
|
|
|
|
|
|
|
|
|
|
|
|
|
|
|
|
|
|
|
|
|||||||||||||||||||||||||||||||||
— | — | — | ( |
) | ( |
) | — | — | — | — | — | — | ( |
) | — | ( |
) | |||||||||||||||||||||||||||||||||||||||||||||||
|
|
|
|
|
|
|
|
|
|
|
|
|
|
|
|
|
|
|
|
|
|
|
|
|
|
|
|
|
|
|
|
|||||||||||||||||||||||||||||||||
Donations from shareholders |
— | — | — | — | — | — | — | — | — | — | — | — | — | |||||||||||||||||||||||||||||||||||||||||||||||||||
|
|
|
|
|
|
|
|
|
|
|
|
|
|
|
|
|
|
|
|
|
|
|
|
|
|
|
|
|
|
|
|
|||||||||||||||||||||||||||||||||
Change from investments in associates accounted for using the equity method |
— | — | — | — | — | ( |
) | — | — | ( |
) | — | — | |||||||||||||||||||||||||||||||||||||||||||||||||||
|
|
|
|
|
|
|
|
|
|
|
|
|
|
|
|
|
|
|
|
|
|
|
|
|
|
|
|
|
|
|
|
|||||||||||||||||||||||||||||||||
Other changes in the capital surplus |
— | — | — | — | — | — | — | — | — | — | — | — | — | |||||||||||||||||||||||||||||||||||||||||||||||||||
|
|
|
|
|
|
|
|
|
|
|
|
|
|
|
|
|
|
|
|
|
|
|
|
|
|
|
|
|
|
|
|
|||||||||||||||||||||||||||||||||
Net profit for the year ended December 31, 2022 |
— | — | — | — | — | — | — | — | — | — | — | |||||||||||||||||||||||||||||||||||||||||||||||||||||
Other comprehensive income (loss) for the year ended December 31, 2022, net of income tax |
— | — | — | — | — | ( |
) | — | — | |||||||||||||||||||||||||||||||||||||||||||||||||||||||
|
|
|
|
|
|
|
|
|
|
|
|
|
|
|
|
|
|
|
|
|
|
|
|
|
|
|
|
|
|
|
|
|||||||||||||||||||||||||||||||||
Total comprehensive income (loss) for the year ended December 31, 2022 |
— | — | — | — | — | ( |
) | — | — | |||||||||||||||||||||||||||||||||||||||||||||||||||||||
|
|
|
|
|
|
|
|
|
|
|
|
|
|
|
|
|
|
|
|
|
|
|
|
|
|
|
|
|
|
|
|
|||||||||||||||||||||||||||||||||
Buy-back of ordinary shares |
— | — | — | — | — | — | — | — | — | — | — | — | ( |
) | ( |
) | — | ( |
) | |||||||||||||||||||||||||||||||||||||||||||||
|
|
|
|
|
|
|
|
|
|
|
|
|
|
|
|
|
|
|
|
|
|
|
|
|
|
|
|
|
|
|
|
|||||||||||||||||||||||||||||||||
Cancelation of treasury shares |
( |
) | ( |
) | ( |
) | — | — | ( |
) | ( |
) | — | — | — | — | — | — | — | — | ||||||||||||||||||||||||||||||||||||||||||||
|
|
|
|
|
|
|
|
|
|
|
|
|
|
|
|
|
|
|
|
|
|
|
|
|
|
|
|
|
|
|
|
|||||||||||||||||||||||||||||||||
Cash dividends received by subsidiaries from the Company |
— | — | — | — | — | — | — | — | — | — | — | — | — | |||||||||||||||||||||||||||||||||||||||||||||||||||
|
|
|
|
|
|
|
|
|
|
|
|
|
|
|
|
|
|
|
|
|
|
|
|
|
|
|
|
|
|
|
|
|||||||||||||||||||||||||||||||||
Changes in percentage of ownership interest in subsidiaries (Note 31) |
— | — | ( |
) | — | — | ( |
) | ( |
) | — | — | — | — | — | — | ( |
) | ( |
) | ( |
) | ||||||||||||||||||||||||||||||||||||||||||
|
|
|
|
|
|
|
|
|
|
|
|
|
|
|
|
|
|
|
|
|
|
|
|
|
|
|
|
|
|
|
|
|||||||||||||||||||||||||||||||||
Issue of ordinary shares under employee share options (Note 28) |
— | — | — | — | — | — | — | — | — | |||||||||||||||||||||||||||||||||||||||||||||||||||||||
|
|
|
|
|
|
|
|
|
|
|
|
|
|
|
|
|
|
|
|
|
|
|
|
|
|
|
|
|
|
|
|
|||||||||||||||||||||||||||||||||
Cash dividends distributed by subsidiaries |
— | — | — | — | — | — | — | — | — | — | — | — | — | — | ( |
) | ( |
) | ||||||||||||||||||||||||||||||||||||||||||||||
|
|
|
|
|
|
|
|
|
|
|
|
|
|
|
|
|
|
|
|
|
|
|
|
|
|
|
|
|
|
|
|
|||||||||||||||||||||||||||||||||
Additional non-controlling interest arising on issue of employee share options by subsidiaries (Note 28) |
— | — | — | — | — | — | — | — | — | — | — | — | ||||||||||||||||||||||||||||||||||||||||||||||||||||
|
|
|
|
|
|
|
|
|
|
|
|
|
|
|
|
|
|
|
|
|
|
|
|
|
|
|
|
|
|
|
|
|||||||||||||||||||||||||||||||||
Issue of convertible bonds by subsidiary (Note 21) |
— | — | — | — | — | — | — | — | — | — | — | — | — | — | ||||||||||||||||||||||||||||||||||||||||||||||||||
|
|
|
|
|
|
|
|
|
|
|
|
|
|
|
|
|
|
|
|
|
|
|
|
|
|
|
|
|
|
|
|
|||||||||||||||||||||||||||||||||
Disposal of investments in equity instruments at fair value through other comprehensive income |
— | — | — | — | — | ( |
) | ( |
) | — | — | — | — | — | — | — | ||||||||||||||||||||||||||||||||||||||||||||||||
|
|
|
|
|
|
|
|
|
|
|
|
|
|
|
|
|
|
|
|
|
|
|
|
|
|
|
|
|
|
|
|
|||||||||||||||||||||||||||||||||
BALANCE AT DECEMBER 31, 2022 |
$ | $ | $ | $ | $ | $ | $ | ( |
) | $ | $ | $ | ( |
) | $ | ( |
) | $ | ( |
) | $ | $ | $ | |||||||||||||||||||||||||||||||||||||||||
|
|
|
|
|
|
|
|
|
|
|
|
|
|
|
|
|
|
|
|
|
|
|
|
|
|
|
|
|
|
|
|
|||||||||||||||||||||||||||||||||
US DOLLARS (Note 4) |
||||||||||||||||||||||||||||||||||||||||||||||||||||||||||||||||
BALANCE AT DECEMBER 31, 2022 |
$ | $ | $ | $ | $ | $ | $ | ( |
) | $ | $ | $ | ( |
) | $ | ( |
) | $ | ( |
) | $ | $ | $ | |||||||||||||||||||||||||||||||||||||||||
|
|
|
|
|
|
|
|
|
|
|
|
|
|
|
|
|
|
|
|
|
|
|
|
|
|
|
|
|
|
|
|
The accompanying notes are an integral part of the consolidated financial statements. |
(Concluded) |
For the Year Ended December 31 |
||||||||||||||||
2020 |
2021 |
2022 |
||||||||||||||
NT$ |
NT$ |
NT$ |
US$ (Note 4) |
|||||||||||||
CASH FLOWS FROM OPERATING ACTIVITIES |
||||||||||||||||
Profit before income tax |
$ | $ | $ | $ | ||||||||||||
Adjustments for: |
||||||||||||||||
Depreciation expense |
||||||||||||||||
Amortization expense |
||||||||||||||||
Net loss (gain) on fair value change of financial assets and liabilities at fair value through profit or loss |
( |
) | ( |
) | ||||||||||||
Finance costs |
||||||||||||||||
Interest income |
( |
) | ( |
) | ( |
) | ( |
) | ||||||||
Dividend income |
( |
) | ( |
) | ( |
) | ( |
) | ||||||||
Share based compensations |
||||||||||||||||
Share of profit of associates and joint ventures |
( |
) | ( |
) | ( |
) | ( |
) | ||||||||
Gain on disposal of property, plant and equipment |
( |
) | ( |
) | ( |
) | ( |
) | ||||||||
Loss (gain) on disposal of investments accounted for using the equity method |
( |
) | ( |
) | ( |
) | ||||||||||
Impairment loss recognized on financial assets |
— | |||||||||||||||
Reversal of impairment loss recognized on financial assets |
( |
) | — | — | — | |||||||||||
Impairment loss recognized on non-financial assets |
||||||||||||||||
G ain on disposal of subsidiaries |
( |
) | ( |
) | — | — | ||||||||||
Gain from bargain purchase - acquisition of subsidiary |
— | ( |
) | — | — | |||||||||||
Net loss (gain) on foreign currency exchange |
( |
) | ( |
) | ||||||||||||
Others |
( |
) | ( |
) | ||||||||||||
Changes in operating assets and liabilities |
||||||||||||||||
Financial assets mandatorily at fair value through profit or loss |
||||||||||||||||
Contract assets |
( |
) | ( |
) | ( |
) | ||||||||||
Trade receivables |
( |
) | ( |
) | ||||||||||||
Other receivables |
( |
) | ( |
) | ( |
) | ( |
) | ||||||||
Inventories |
( |
) | ( |
) | ( |
) | ( |
) | ||||||||
Other current assets |
( |
) | ||||||||||||||
Other financial assets |
— | ( |
) | ( |
) | ( |
) | |||||||||
Other operating activities assets |
( |
) | ( |
) | ( |
) | ||||||||||
Financial liabilities held for trading |
( |
) | ( |
) | ( |
) | ( |
) | ||||||||
Trade payables |
( |
) | ( |
) | ||||||||||||
Other payables |
||||||||||||||||
Other current liabilities |
||||||||||||||||
Other operating activities liabilities |
( |
) | ||||||||||||||
|
|
|
|
|
|
|
|
|||||||||
Cash generated from operations |
||||||||||||||||
Interest received |
||||||||||||||||
Dividend received |
||||||||||||||||
Interest paid |
( |
) | ( |
) | ( |
) | ( |
) | ||||||||
Income tax paid |
( |
) | ( |
) | ( |
) | ( |
) | ||||||||
|
|
|
|
|
|
|
|
|||||||||
Net cash generated from operating activities |
||||||||||||||||
|
|
|
|
|
|
|
|
For the Year Ended December 31 |
||||||||||||||||
2020 |
2021 |
2022 |
||||||||||||||
NT$ |
NT$ |
NT$ |
US$ (Note 4) |
|||||||||||||
CASH FLOWS FROM INVESTING ACTIVITIES |
||||||||||||||||
Purchase of financial assets at fair value through other comprehensive income |
$ | ( |
) | $ | ( |
) | $ | ( |
) | $ | ( |
) | ||||
Proceeds from sale of financial assets at fair value through other comprehensive income |
— | — | ||||||||||||||
Return of capital from financial assets at fair value through other comprehensive income |
||||||||||||||||
Proceeds from sale of financial assets at amortized cost |
— | — | — | |||||||||||||
Acquisition of associates and joint ventures |
( |
) | ( |
) | ( |
) | ( |
) | ||||||||
Proceeds from disposal of investments accounted for using the equity method |
— | — | — | |||||||||||||
Net cash outflow on acquisition of subsidiaries |
( |
) | ( |
) | — | — | ||||||||||
Proceeds from disposal of subsidiaries |
— | — | ||||||||||||||
Return of capital by investee accounted for using the equity method |
— | — | — | |||||||||||||
Payments for property, plant and equipment |
( |
) | ( |
) | ( |
) | ( |
) | ||||||||
Proceeds from disposal of property, plant and equipment |
||||||||||||||||
Payments for intangible assets |
( |
) | ( |
) | ( |
) | ( |
) | ||||||||
Proceeds from disposal of intangible assets |
||||||||||||||||
Payments for right-of-use |
( |
) | ( |
) | ( |
) | ( |
) | ||||||||
Payments for investment properties |
( |
) | — | ( |
) | ( |
) | |||||||||
Increase in other financial assets |
( |
) | ( |
) | ( |
) | ( |
) | ||||||||
Decrease in other financial assets |
||||||||||||||||
Increase in other non-current assets |
( |
) | ( |
) | ( |
) | ( |
) | ||||||||
Decrease in other non-current assets |
||||||||||||||||
Income tax paid |
— | ( |
) | ( |
) | ( |
) | |||||||||
Proceeds from disposal of right-of-use |
— | — | ||||||||||||||
Other investing activities items |
— | |||||||||||||||
|
|
|
|
|
|
|
|
|||||||||
Net cash used in investing activities |
( |
) | ( |
) | ( |
) | ( |
) | ||||||||
|
|
|
|
|
|
|
|
|||||||||
CASH FLOWS FROM FINANCING ACTIVITIES |
||||||||||||||||
Proceeds from short-term borrowings |
— | |||||||||||||||
Repayment of short-term borrowings |
( |
) | — | — | — | |||||||||||
Proceeds from bonds offering |
||||||||||||||||
Repayment of bonds payable |
( |
) | ( |
) | ( |
) | ( |
) | ||||||||
Proceeds from long-term borrowings |
||||||||||||||||
Repayment of long-term borrowings |
( |
) | ( |
) | ( |
) | ( |
) | ||||||||
Repayment of the principle portion of lease liabilities |
( |
) | ( |
) | ( |
) | ( |
) | ||||||||
Dividends paid |
( |
) | ( |
) | ( |
) | ( |
) | ||||||||
Proceeds from exercise of employee share options |
||||||||||||||||
Payments for buy-back of ordinary shares |
— | ( |
) | ( |
) | ( |
) |
For the Year Ended December 31 |
||||||||||||||||
2020 |
2021 |
2022 |
||||||||||||||
NT$ |
NT$ |
NT$ |
US$ (Note 4) |
|||||||||||||
Decrease in non-controlling interests |
$ | ( |
) | $ | ( |
) | $ | ( |
) | $ | ( |
) | ||||
Other financing activities items |
( |
) | ||||||||||||||
|
|
|
|
|
|
|
|
|||||||||
Net cash used in financing activities |
( |
) | ( |
) | ( |
) | ( |
) | ||||||||
|
|
|
|
|
|
|
|
|||||||||
EFFECTS OF EXCHANGE RATE CHANGES ON THE BALANCE OF CASH AND CASH EQUIVALENTS HELD IN FOREIGN CURRENCY |
( |
) | ( |
) | ||||||||||||
|
|
|
|
|
|
|
|
|||||||||
NET INCREASE (DECREASE) IN CASH AND CASH EQUIVALENTS |
( |
) | ( |
) | ( |
) | ||||||||||
CASH AND CASH EQUIVALENTS AT THE BEGINNING OF THE YEAR |
||||||||||||||||
|
|
|
|
|
|
|
|
|||||||||
CASH AND CASH EQUIVALENTS AT THE END OF THE YEAR |
$ | $ | $ | $ | ||||||||||||
|
|
|
|
|
|
|
|
The accompanying notes are an integral part of the consolidated financial statements. | (Concluded) |
1. |
GENERAL INFORMATION |
2. |
APPROVAL OF FINANCIAL STATEMENTS |
3. |
APPLICATION OF NEW AND REVISED INTERNATIONAL FINANCIAL REPORTING STANDARDS AS ISSUED BY THE INTERNATIONAL ACCOUNTING STANDARDS BOARD (“IASB”) (collectively, “IFRSs”) |
a. | Amendments to IFRSs that are mandatorily effective for the current year |
b. | New, revised or amended standards and interpretations in issue but not yet effective |
New, Revised or Amended Standards and Interpretations |
Effective Date Announced by IASB (Note 1) | |||
Amendments to IAS 1 “Disclosure of Accounting Policies” |
January 1, 2023 (Note 2) | |||
Amendments to IAS 8 “Definition of Accounting Estimates” |
January 1, 2023 (Note 3) | |||
Amendments to IAS 12 “Deferred Tax related to Assets and Liabilities arising from a Single Transaction” |
January 1, 2023 (Note 4) | |||
Amendments to IFRS 10 and IAS 28 “Sale or Contribution of Assets between an Investor and its Associate or Joint Venture” |
To be determined by IASB | |||
Amendments to IFRS 16“Leases Liability in a Sale and Leaseback” |
January 1, 2024 (Note 5) | |||
Amendments to IAS 1 “Classification of Liabilities as Current or Non-current” |
January 1, 2024 | |||
Amendments to IAS 1 “Non-current Liabilities with Covenants” |
January 1, 2024 |
Note 1: |
Unless stated otherwise, the above IFRSs are effective for annual reporting periods beginning on or after their respective effective dates. |
Note 2: |
The amendments will be applied prospectively for annual reporting periods beginning on or after January 1, 2023. |
Note 3: |
The amendments will be applicable to changes in accounting estimates and changes in accounting policies that occur on or after the beginning of the annual reporting period beginning on or after January 1, 2023. |
Note 4: |
Except for deferred taxes that were recognized on January 1, 2022 for temporary differences associated with leases and decommissioning obligations, the amendments were applied prospectively to transactions that occur on or after January 1, 2022. |
Note 5: |
A seller-lessee shall apply the Amendments to IFRS 16 retrospectively to sale and leaseback transactions entered into after the date of initial application of IFRS 16. |
c. |
Significant changes in accounting policy resulted from new, revised and amended standards and interpretations in issue but not yet effective |
1) |
Amendments to IAS 1 “Disclosure of Accounting Policies” |
• |
Accounting policy information that relates to immaterial transactions, other events or conditions is immaterial and need not be disclosed; |
• |
The Group may consider the accounting policy information as material because of the nature of the related transactions, other events or conditions, even if the amounts are immaterial; and |
• |
Not all accounting policy information relating to material transactions, other events or conditions is itself material. |
a) |
the Group changed its accounting policy during the reporting period and this change resulted in a material change to the information in the financial statements; |
b) |
the Group chose the accounting policy from options permitted by the standards; |
c) |
the accounting policy was developed in accordance with IAS 8 “Accounting Policies, Changes in Accounting Estimates and Errors” in the absence of an IFRS that specifically applies; |
d) |
the accounting policy relates to an area for which the Group is required to make significant judgements or assumptions in applying an accounting policy, and the Group discloses those judgements or assumptions; or |
e) |
the accounting is complex and users of the financial statements would otherwise not understand those material transactions, other events or conditions. |
2) |
Amendments to IAS 8 “Definition of Accounting Estimates” |
3) |
Amendments to IAS 12 “Deferred Tax related to Assets and Liabilities arising from a Single Transaction” |
4) |
Amendments to IAS 1 “Classification of Liabilities as Current or Non-current” (referred to as the “2020 amendments”) and “Non-current Liabilities with Covenants” (referred to as the “2022 amendments”) |
4. |
SUMMARY OF SIGNIFICANT ACCOUNTING POLICIES |
a. | Statement of compliance |
b. | Basis of preparation |
1) | Level 1 inputs are quoted prices (unadjusted) in active markets for identical assets or liabilities; |
2) | Level 2 inputs are inputs other than quoted prices included within Level 1 that are observable for an asset or a liability, either directly (i.e. as prices) or indirectly (i.e. derived from prices); and |
3) | Level 3 inputs are unobservable inputs for an asset or a liability. |
c. | Classification of current and non-current assets and liabilities |
d. | Basis of consolidation |
1) | Principles for preparing consolidated financial statements |
2) | Subsidiaries included in consolidated financial statements were as follows: |
Establishment and Operating Location |
Percentage of Ownership (%) |
|||||||||||||
December 31 |
||||||||||||||
Name of Investor |
Name of Investee |
Main Businesses |
2021 |
2022 |
||||||||||
The Company |
ASE |
|
|
|||||||||||
USI Inc. (“USIINC”) |
|
|
||||||||||||
SPIL |
|
|
||||||||||||
ASE Social Enterprise Co., Ltd. |
|
|
||||||||||||
ASE |
A.S.E. Holding Limited |
|
|
|||||||||||
J & R Holding Limited (“J&R Holding”) |
|
|
||||||||||||
Innosource Limited |
|
|
||||||||||||
Omniquest Industrial Limited |
|
|
||||||||||||
ASE Marketing & Service Japan Co., Ltd. |
|
|
||||||||||||
ASE Test, Inc. |
|
|
||||||||||||
Luchu Development Corporation |
|
|
||||||||||||
Advanced Microelectronic Products Inc. (“AMPI”) |
|
|
||||||||||||
ASE Singapore Pte. Ltd. |
|
|
||||||||||||
ASE Electronics (M) Sdn. Bhd. |
|
|
||||||||||||
ASE Test, Inc. |
Alto Enterprises Limited |
|
|
|||||||||||
Super Zone Holdings Limited |
|
|
||||||||||||
Luchu Development Corporation |
|
|
||||||||||||
TLJ Intertech Inc. |
|
|
||||||||||||
MingFeng Information Service Corp., Ltd. |
|
|
||||||||||||
AMPI |
|
|
||||||||||||
A.S.E. Holding Limited |
ASE Investment (Labuan) Inc. |
|
|
|||||||||||
ASE Test |
|
|
||||||||||||
ASE Technology Partners, Limited |
|
|
||||||||||||
Integrated Solutions Enterprise Europe (“ITGEU”) |
|
|
||||||||||||
J&R Holding |
ASE Test |
|
|
|||||||||||
Omniquest Industrial Limited |
|
|
||||||||||||
J&R Industrial Inc. |
|
|
||||||||||||
ASE Japan Co., Ltd. |
|
|
||||||||||||
ASE (U.S.) Inc. |
|
|
||||||||||||
Global Advanced Packaging Technology Limited |
|
|
Establishment and Operating Location |
Percentage of Ownership (%) |
|||||||||||||
December 31 |
||||||||||||||
Name of Investor |
Name of Investee |
Main Businesses |
2021 |
2022 |
||||||||||
Innosource Limited |
Omniquest Industrial Limited |
|
|
|||||||||||
ASE (Shanghai) Inc. |
|
|
||||||||||||
Omniquest Industrial Limited |
ASE Corporation |
|
|
|||||||||||
Alto Enterprises Limited |
ASE (Kunshan) Inc. |
|
|
(Note 2 | ) | |||||||||
ASE Investment (Kun Shan) Limited |
|
|
||||||||||||
Super Zone Holdings Limited |
Advanced Semiconductor Engineering (China) Ltd. |
|
|
|||||||||||
ASE Investment (Labuan) Inc. |
ASE (Korea) Inc. (“ASE Korea”) |
|
|
|||||||||||
ASE Technology Partners, Limited |
ASE Technology Acquisition Corporation |
|
|
|||||||||||
ASE Test |
ASE Test Holdings, Ltd. |
|
|
|||||||||||
ASE Holdings (Singapore) Pte Ltd |
|
|
||||||||||||
ASE Investment (Labuan) Inc. |
|
|
||||||||||||
ASE Singapore Pte. Ltd. |
|
|
||||||||||||
ASE Test Holdings, Ltd. |
ISE Labs, Inc. |
|
|
|||||||||||
ISE Labs, Inc. |
ISE Services, Inc. |
|
|
|||||||||||
ASE Holdings (Singapore) Pte Ltd |
ASE Electronics (M) Sdn. Bhd. |
|
|
|||||||||||
Global Advanced Packaging Technology Limited |
ASE Assembly & Test (Shanghai) Limited |
|
|
|||||||||||
GAPT Holding Limited |
|
|
(Note 2 | ) | ||||||||||
GAPT Holding Limited |
Global Advanced Packaging Test (Hongkong) Limited |
|
|
(Note 2 | ) | |||||||||
Global Advanced Packaging Test (Hongkong) Limited |
Suzhou ASEN Semiconductors Co., Ltd. (“ASEN”) |
|
|
(Note 2 | ) | |||||||||
ASE (Weihai) Inc. |
|
|
(Note 2 | ) | ||||||||||
ASEN |
ASE Advanced Semiconductor (Shanghai) Limited |
|
|
(Note 2 | ) | |||||||||
ASE Assembly & Test (Shanghai) Limited |
ASE Investment (Kun Shan) Limited |
|
|
|||||||||||
Wuxi Tongzhi Microelectronics Co., Ltd. |
|
|
||||||||||||
ISE Labs, China, Ltd. |
|
|
||||||||||||
Shanghai Ding Hui Real Estate Development Co., Ltd. (“DH”) |
|
|
||||||||||||
DH |
Shanghai Ding Qi Property Management Co., Ltd. |
|
|
|||||||||||
Shanghai Ding Wei Real Estate Development Co., Ltd. |
|
|
||||||||||||
Shanghai Ding Yu Real Estate Development Co., Ltd. |
|
|
||||||||||||
Kun Shan Ding Hong Real Estate Development Co., Ltd |
|
|
Establishment and Operating Location |
Percentage of Ownership (%) |
|||||||||||||
December 31 |
||||||||||||||
Name of Investor |
Name of Investee |
Main Businesses |
2021 |
2022 |
||||||||||
Shanghai Ding Xu Property Management Co., Ltd. |
|
|
||||||||||||
Shanghai Ding Yao Estate Development Co., Ltd. |
|
|
||||||||||||
Shanghai Ding Fan Business Management Co., Ltd. |
|
|
||||||||||||
ASE Investment (Kun Shan) Limited |
ASE (Kunshan) Inc. |
|
|
(Note 2 | ) | |||||||||
ASE Corporation |
ASE Mauritius Inc. |
|
|
|||||||||||
ASE Labuan Inc. |
|
|
||||||||||||
ASE Mauritius Inc. |
ASE (Kunshan) Inc. |
|
|
(Note 2 | ) | |||||||||
ASE (Shanghai) Inc. |
|
|
||||||||||||
ASE Labuan Inc. |
ASE Electronics Inc. |
|
|
|||||||||||
ASE (Shanghai) Inc. |
Advanced Semiconductor Engineering (HK) Limited |
|
|
|||||||||||
Shanghai Ding Hui Real Estate Development Co., Ltd. |
|
|
||||||||||||
Universal Scientific Industrial (Shanghai) Co., Ltd. (“USISH”) |
|
|
||||||||||||
USIINC |
Huntington Holdings International Co., Ltd. |
|
|
|||||||||||
Huntington Holdings International Co., Ltd. |
Unitech Holdings International Co., Ltd. |
|
|
|||||||||||
Real Tech Holdings Limited |
|
|
||||||||||||
Universal ABIT Holding Co., Ltd. |
|
|
||||||||||||
Real Tech Holdings Limited |
USI Enterprise Limited (“USIE”) |
|
|
|||||||||||
USIE |
USISH |
|
|
|||||||||||
USISH |
Universal Global Technology Co., Limited (“UGT”) |
|
|
|||||||||||
Universal Global Technology (Kunshan) Co., Ltd. (“UGKS”) |
|
|
||||||||||||
Universal Global Technology (Shanghai) Co., Ltd. |
|
|
||||||||||||
Universal Global Electronics (Shanghai) Co., Ltd. |
|
|
||||||||||||
USI Electronics (Shenzhen) Co., Ltd. |
|
|
||||||||||||
Universal Global Technology (Huizhou) Co., Ltd. |
|
|
||||||||||||
FINANCIERE AFG (”FAFG”) |
|
|
||||||||||||
UGT |
Universal Global Industrial Co., Limited |
|
|
|||||||||||
Universal Global Scientific Industrial Co., Ltd. (“UGTW”) |
|
|
||||||||||||
USI America Inc. |
|
|
||||||||||||
Universal Scientific Industrial De Mexico S.A. De C.V. |
|
|
||||||||||||
USI Japan Co., Ltd. |
|
|
||||||||||||
USI Electronics (Shenzhen) Co., Ltd. |
|
|
Establishment and Operating Location |
Percentage of Ownership (%) |
|||||||||||||
December 31 |
||||||||||||||
Name of Investor |
Name of Investee |
Main Businesses |
2021 |
2022 |
||||||||||
Universal Global Electronics Co., Ltd. |
|
|
||||||||||||
Universal Scientific Industrial (France) (“USIFR”) |
|
|
||||||||||||
UNIVERSAL SCIENTIFIC INDUSTRIAL VIETNAM COMPANY LIMITED |
|
|
||||||||||||
Universal Global Industrial Co., Limited |
Universal Scientific Industrial De Mexico S.A. De C.V. |
|
|
(Note 1 | ) | (Note 1 | ) | |||||||
UGTW |
Universal Scientific Industrial Co., Ltd. |
|
|
|||||||||||
Universal Global Electronics Co., Ltd. |
Universal Scientific Industrial Poland Sp. z o.o. (“USIPL”) |
|
|
|||||||||||
Universal Global Electronics (Shanghai) Co., Ltd. |
USI Science and Technology (Shenzhen) Co., Ltd. |
|
|
|||||||||||
USIFR |
FAFG |
|
|
|||||||||||
FAFG |
ASTEELFLASH GROUP |
|
|
|||||||||||
MANUFACTURING POWER TUNISIA |
|
|
||||||||||||
ASTEELFLASH MEXICO S.A. de C.V. |
|
|
||||||||||||
ASTEELFLASH (BEDFORD) LIMITED |
|
|
||||||||||||
ASTEELFLASH FRANCE |
|
|
||||||||||||
ASTEELFLASH TUNISIE S.A. |
|
|
||||||||||||
ASTEELFLASH HONG KONG LIMITED |
|
|
||||||||||||
ASTEELFLASH GERMANY GmbH |
|
|
||||||||||||
ASTEELFLASH US HOLDING CORP. |
|
|
||||||||||||
AFERH TUNISIE |
|
|
||||||||||||
ASTEEL ELECTRONICS MANUFACTURING SERVICES |
|
|
||||||||||||
ASTEELFLASH PLZEN S.R.O. |
|
|
Establishment and Operating Location |
Percentage of Ownership (%) |
|||||||||||||
December 31 |
||||||||||||||
Name of Investor |
Name of Investee |
Main Businesses |
2021 |
2022 |
||||||||||
ASTEELFLASH GROUP |
ASTEELFLASH (BEDFORD) LIMITED |
|
|
|||||||||||
ASTEELFLASH FRANCE |
|
|
||||||||||||
ASTEELFLASH TUNISIE S.A. |
|
|
||||||||||||
ASTEELFLASH HONG KONG LIMITED |
|
|
||||||||||||
ASTEELFLASH MEXICO S.A. de C.V. |
|
|
||||||||||||
ASTEELFLASH GERMANY GmbH |
|
|
||||||||||||
MANUFACTURING POWER TUNISIA |
|
|
||||||||||||
ASTEELFLASH US HOLDING CORP. |
|
|
||||||||||||
AFERH TUNISIE |
|
|
||||||||||||
ASTEEL ELECTRONICS MANUFACTURING SERVICES |
|
|
||||||||||||
ASTEELFLASH PLZEN S.R.O. |
|
|
||||||||||||
ASTEELFLASH (BEDFORD) LIMITED |
ASTEELFLASH TUNISIE S.A. |
|
|
(Note 1 | ) | (Note 1 | ) | |||||||
ASTEELFLASH TECHNOLOGIE |
ASTEELFLASH FRANCE |
|
|
(Note1 | ) | (Note1 | ) | |||||||
ASTEELFLASH FRANCE |
ASTEEL ELECTRONICS MANUFACTURING SERVICES |
|
|
|||||||||||
ASTEELFLASH TECHNOLOGIE |
|
|
||||||||||||
ASTEELFLASH BRETAGNE |
|
|
||||||||||||
ASTEELFLASH TUNISIE S.A. |
|
|
(Note 1 | ) | (Note 1 | ) | ||||||||
AFERH TUNISIE |
|
|
||||||||||||
ASTEELFLASH HONG KONG LIMITED |
Asteelflash Suzhou Co., Ltd. |
|
|
|||||||||||
Asteelflash Suzhou Co., Ltd. |
ASTEELFLASH TUNISIE S.A. |
|
|
(Note 1 | ) | (Note 1 | ) | |||||||
ASTEELFLASH GERMANY GmbH |
ASTEELFLASH HERSFELD GmbH |
|
|
|||||||||||
ASTEELFLASH EBERBACH GmbH |
|
|
||||||||||||
ASTEELFLASH BONN GmbH |
|
|
||||||||||||
ASTEELFLASH SCHWANDORF GmbH |
|
|
||||||||||||
ASTEELFLASH DESIGN SOLUTIONS HAMBOURG GmbH |
|
|
Establishment and Operating Location |
Percentage of Ownership (%) |
|||||||||||||
December 31 |
||||||||||||||
Name of Investor |
Name of Investee |
Main Businesses |
2021 |
2022 |
||||||||||
EN ELECTRONICNETWORK SRL |
|
|
||||||||||||
ASTEELFLASH TUNISIE S.A. |
|
|
(Note 1 | ) | (Note 1 | ) | ||||||||
ASTEELFLASH MEXICO S.A. de C.V. |
ASTEELFLASH TUNISIE S.A. |
|
|
(Note 1 | ) | (Note 1 | ) | |||||||
ASTEELFLASH US HOLDING CORP. |
ASTEELFLASH USA CORP. |
|
|
|||||||||||
ASTEELFLASH USA CORP. |
ASTEELFLASH TUNISIE S.A. |
|
|
(Note 1 | ) | (Note 1 | ) | |||||||
SPIL |
SPIL (B.V.I.) Holding Limited |
|
|
|||||||||||
Siliconware Investment Co., Ltd. |
|
|
||||||||||||
SPIL (B.V.I.) Holding Limited |
Siliconware USA, Inc. |
|
|
|||||||||||
SPIL (Cayman) Holding Limited |
|
|
||||||||||||
SPIL (Cayman) Holding Limited |
Siliconware Technology (Suzhou) Limited |
|
|
Note 1: | The number of shares held was |
Note 2: | In December 2021, the Company’s board of directors resolved to dispose its 100% shareholdings in those subsidiaries, which were settled in December 2021 and resulted in losing its control over those subsidiaries. Refer to Note 30 DISPOSAL OF SUBSIDIARIES for related disclosure. |
e. | Business combinations |
f. | Foreign currencies |
g. | Inventories and inventories related to real estate business |
h. | Investments in associates and joint ventures |
i. | Property, plant and equipment |
j. | Investment properties |
k. | Goodwill |
l. | Other intangible assets |
1) | Separate acquisition |
2) | Acquired through business combinations |
3) | Derecognition |
m. | Impairment of property, plant and equipment, right-of-use |
n. | Financial instruments |
1) | Financial assets |
a) | Measurement categories |
i. | Financial asset at FVTPL |
ii. | Financial assets at amortized cost |
i) | The financial asset is held within a business model whose objective is to hold financial assets in order to collect contractual cash flows; and |
ii) | The contractual terms of the financial asset give rise on specified dates to cash flows that are solely payments of principal and interest on the principal amount outstanding. |
i) | Purchased or originated credit-impaired financial assets, for which interest income is calculated by applying the credit-adjusted effective interest rate to the amortized cost of the financial asset; and |
ii) | Financial assets that are not credit-impaired on purchase or origination but have subsequently become credit-impaired, for which interest income is calculated by applying the effective interest rate to the amortized cost of such financial assets in subsequent reporting periods. |
i) | Significant financial difficulty of the issuer or the borrower; |
ii) | Breach of contract, such as a default; |
iii) | It is becoming probable that the borrower will enter bankruptcy or undergo a financial reorganization; or |
iv) | The disappearance of an active market for that financial asset because of financial difficulties. |
iii. | Investments in debt instruments at FVTOCI |
i) | the debt instrument is held within a business model whose objective is achieved by both the collecting of contractual cash flows and the selling of the financial assets; and |
ii) | the contractual terms of the debt instrument give rise on specified dates to cash flows that are solely payments of principal and interest on the principal amount outstanding. |
iv. | Investments in equity instruments at FVTOCI |
b) | Impairment of financial assets and contract assets |
c) | Derecognition of financial assets |
2) | Equity instruments |
3) | Financial liabilities |
a) | Subsequent measurement |
b) | Derecognition of financial liabilities |
4) | Derivative financial instruments |
5) | Convertible bonds issued by the subsidiaries |
o. | Hedge accounting |
1) | Fair value hedges |
2) | Cash flow hedges |
3) | Hedges of net investments in foreign operations |
p. | Revenue recognition |
q. | Leases |
1) | The Group as lessor |
2) | The Group as lessee |
r. | Borrowing costs |
s. | Government grants |
t. | Employee benefits |
1) | Short-term employee benefits |
2) | Retirement benefits |
u. | Share-based payment arrangements |
v. | Taxation |
1) | Current tax |
2) | Deferred tax |
3) | Current and deferred tax for the year |
w. | U.S. Dollar Amounts |
5. |
CRITICAL ACCOUNTING JUDGMENTS AND KEY SOURCES OF ESTIMATION UNCERTAINTY |
6. |
CASH AND CASH EQUIVALENTS |
December 31 |
||||||||||||
2021 |
2022 |
|||||||||||
NT$ |
NT$ |
US$ (Note 4) |
||||||||||
Cash on hand |
$ | $ | $ | |||||||||
Checking accounts and demand deposits |
||||||||||||
Cash equivalents (time deposits with original maturity of less than three months and repurchase agreements collateralized by bonds) |
||||||||||||
|
|
|
|
|
|
|||||||
$ | $ | |
$ | |
||||||||
|
|
|
|
|
|
7. |
FINANCIAL INSTRUMENTS AT FAIR VALUE THROUGH PROFIT OR LOSS |
December 31 |
||||||||||||
2021 |
2022 |
|||||||||||
NT$ |
NT$ |
US$ (Note 4) |
||||||||||
Financial assets mandatorily classified as at FVTPL |
||||||||||||
Derivative instruments (non-designated hedges) |
||||||||||||
Swap contracts |
$ | |
$ | |
$ | |
||||||
Forward exchange contracts |
December 31 |
||||||||||||
2021 |
2022 |
|||||||||||
NT$ |
NT$ |
US$ (Note 4) |
||||||||||
Call option and put option of convertible bonds |
— | — | ||||||||||
Target redemption forward contracts |
— | — | ||||||||||
Non-derivative financial assets |
||||||||||||
Quoted ordinary shares |
||||||||||||
Private-placement funds |
||||||||||||
Unquoted preferred shares |
||||||||||||
Contingent considerations (Note 29) |
||||||||||||
Open-end mutual funds |
||||||||||||
|
|
|
|
|
|
|||||||
Current |
||||||||||||
|
|
|
|
|
|
|||||||
Non-current |
$ | |
$ | $ | ||||||||
|
|
|
|
|
|
|||||||
Financial liabilities held for trading |
||||||||||||
Derivative instruments (non-designated hedges) |
||||||||||||
Swap contracts |
$ | $ | $ | |||||||||
Forward exchange contracts |
||||||||||||
|
|
|
|
|
|
|||||||
Current |
$ | $ | |
$ | |
|||||||
|
|
|
|
|
|
a. | At each balance sheet date, outstanding swap contracts not accounted for hedge accounting were as follows: |
Currency |
Maturity Period |
Notional Amount (In Thousands) | ||
December 31, 2021 |
||||
Sell RMB/Buy US$ |
RMB | |||
Sell NT$/Buy US$ |
- |
NT$ | ||
Sell US$/Buy RMB |
US$ | |||
Sell US$/Buy JPY |
US$ | |||
Sell US$/Buy KRW |
US$ | |||
Sell US$/Buy NT$ |
- |
US$ | ||
December 31, 2022 |
||||
Sell RMB/Buy US$ |
RMB | |||
Sell NT$/Buy US$ |
- | NT$ | ||
Sell US$/Buy KRW |
US$ | |||
Sell US$/Buy NT$ |
US$ |
b. | At each balance sheet date, outstanding forward exchange contracts not accounted for hedge accounting were as follows: |
Currency |
Maturity Period |
Notional Amount (In Thousands) | ||
December 31, 2021 |
||||
Sell RMB/Buy JPY |
RMB | |||
Sell RMB/Buy US$ |
RMB | |||
Sell NT$/Buy US$ |
- |
NT$ | ||
Sell US$/Buy RMB |
- |
US$ | ||
Sell US$/Buy EUR |
US$ | |||
Sell US$/Buy JPY |
- |
US$ | ||
Sell US$/Buy MYR |
- |
US$ | ||
Sell US$/Buy NT$ |
US$ | |||
Sell US$/Buy SGD |
- |
US$ | ||
December 31, 2022 |
||||
Sell RMB/Buy JPY |
RMB | |||
Sell RMB/Buy NT$ |
- | RMB | ||
Sell RMB/Buy US$ |
- | RMB | ||
Sell EUR/Buy JPY |
EUR | |||
Sell NT$/Buy US$ |
- | NT$ | ||
Sell US$/Buy RMB |
- | US$ | ||
Sell US$/Buy EUR |
- | US$ | ||
Sell US$/Buy JPY |
US$ | |||
Sell US$/Buy KRW |
US$ | |||
Sell US$/Buy MYR |
- | US$ | ||
Sell US$/Buy NT$ |
- | US$ | ||
Sell US$/Buy PLN |
- | US$ | ||
Sell US$/Buy SGD |
- | US$ |
c. | As of each balance sheet date, outstanding target redemption forward contracts not accounted for hedge accounting were as follows: |
Currency |
Maturity Period |
Notional Amount (In Thousands) | ||
December 31, 2021 |
||||
Sell EUR/Buy US$ |
EUR |
8. |
FINANCIAL ASSETS AT FAIR VALUE THROUGH OTHER COMPREHENSIVE INCOME (FVTOCI) |
December 31 |
||||||||||||
2021 |
2022 |
|||||||||||
NT$ |
NT$ |
US$ (Note 4) |
||||||||||
Investments in equity instruments at FVTOCI |
$ | $ | $ | |||||||||
Investments in debt instruments at FVTOCI |
||||||||||||
|
|
|
|
|
|
|||||||
$ | $ | |
$ | |
||||||||
|
|
|
|
|
|
a. | Investments in equity instruments at FVTOCI |
December 31 |
||||||||||||
2021 |
2022 |
|||||||||||
NT$ |
NT$ |
US$ (Note 4) |
||||||||||
Unquoted ordinary shares |
$ | |
$ | $ | ||||||||
Quoted ordinary shares |
||||||||||||
Unquoted preferred shares |
||||||||||||
Limited partnership |
||||||||||||
|
|
|
|
|
|
|||||||
$ | |
$ | |
$ | |
|||||||
|
|
|
|
|
|
b. | Investments in debt instruments at FVTOCI |
December 31 |
||||||||||||
2021 |
2022 |
|||||||||||
NT$ |
NT$ |
US$ (Note 4) |
||||||||||
Unsecured subordinate corporate bonds |
$ | |
$ | |
$ | |
||||||
|
|
|
|
|
|
9. |
CREDIT RISK MANAGEMENT FOR INVESTMENTS IN DEBT INSTRUMENTS |
10. |
TRADE RECEIVABLES, NET |
December 31 |
||||||||||||
2021 |
2022 |
|||||||||||
NT$ |
NT$ |
US$ (Note 4) |
||||||||||
At amortized cost |
||||||||||||
Gross carrying amount |
$ | $ | $ | |||||||||
Less: Allowance for impairment loss |
||||||||||||
|
|
|
|
|
|
|||||||
At FVTOCI |
||||||||||||
|
|
|
|
|
|
|||||||
$ | $ | $ | ||||||||||
|
|
|
|
|
|
a. | Trade receivables |
1) | At amortized cost |
Not Past Due |
Overdue 1 to 30 days |
Overdue 31 to 90 Days |
Overdue Over 91 Days |
Individually Impaired |
Total |
|||||||||||||||||||
NT$ |
NT$ |
NT$ |
NT$ |
NT$ |
NT$ |
|||||||||||||||||||
Expected credit loss rate |
% |
% |
% |
% |
% |
|||||||||||||||||||
Gross carrying amount |
$ | |
$ | |
$ | |
$ | |
$ | |
$ | |||||||||||||
Loss allowance (Lifetime ECLs) |
( |
) | ( |
) | ( |
) | ( |
) | ( |
) | ( |
) | ||||||||||||
|
|
|
|
|
|
|
|
|
|
|
|
|||||||||||||
$ | $ | $ | $ | $ | $ | |||||||||||||||||||
|
|
|
|
|
|
|
|
|
|
|
|
Not Past Due |
Overdue 1 to 30 days |
Overdue 31 to 90 Days |
Overdue Over 91 Days |
Individually Impaired |
Total |
|||||||||||||||||||
NT$ |
NT$ |
NT$ |
NT$ |
NT$ |
NT$ |
|||||||||||||||||||
Expected credit loss rate |
% |
% |
% |
% |
% |
|||||||||||||||||||
Gross carrying amount |
$ | |
$ | $ | $ | |
$ | $ | ||||||||||||||||
Loss allowance (Lifetime ECLs) |
( |
) | ( |
) | ( |
) | ( |
) | ( |
) | ( |
) | ||||||||||||
|
|
|
|
|
|
|
|
|
|
|
|
|||||||||||||
$ | $ | |
$ | |
$ | $ | |
$ | ||||||||||||||||
|
|
|
|
|
|
|
|
|
|
|
|
Not Past Due |
Overdue 1 to 30 days |
Overdue 31 to 90 Days |
Overdue Over 91 Days |
Individually Impaired |
Total |
|||||||||||||||||||
US$ (Note 4) |
US$ (Note 4) |
US$ (Note 4) |
US$ (Note 4) |
US$ (Note 4) |
US$ (Note 4) |
|||||||||||||||||||
Expected credit loss rate |
% |
% |
% |
% |
% |
|||||||||||||||||||
Gross carrying amount |
$ | |
$ | $ | |
$ | |
$ | |
$ | ||||||||||||||
Loss allowance (Lifetime ECLs) |
( |
) | ( |
) | ( |
) | ( |
) | ( |
) | ( |
) | ||||||||||||
|
|
|
|
|
|
|
|
|
|
|
|
|||||||||||||
$ | $ | |
$ | $ | $ | $ | |
|||||||||||||||||
|
|
|
|
|
|
|
|
|
|
|
|
December 31 |
||||||||||||||||
2020 |
2021 |
2022 |
||||||||||||||
NT$ |
NT$ |
NT$ |
US$ (Note 4) |
|||||||||||||
Balance at January 1 |
$ | $ | $ | $ | ||||||||||||
Remeasurement of loss allowance |
( |
) | ||||||||||||||
Reclassification |
( |
) | ||||||||||||||
Acquisition through business combinations |
||||||||||||||||
Amounts written off |
( |
) | ( |
) | ||||||||||||
Disposal of subsidiaries |
( |
) | ||||||||||||||
Effects of foreign currency exchange differences |
( |
) | ( |
) | ||||||||||||
|
|
|
|
|
|
|
|
|||||||||
Balance at December 31 |
$ | $ | $ | $ | ||||||||||||
|
|
|
|
|
|
|
|
2) | At FVTOCI |
December 31, 2021 |
| |||||||||||||||||||||||
Not Past Due |
Overdue 1 to 30 days |
Overdue 31 to 90 Days |
Overdue Over 91 Days |
Individually Impaired |
Total |
|||||||||||||||||||
NT$ |
NT$ |
NT$ |
NT$ |
NT$ |
NT$ |
|||||||||||||||||||
Expected credit loss rate |
% |
% |
% |
% |
||||||||||||||||||||
Gross carrying amount |
$ | $ | $ | $ | $ | $ | ||||||||||||||||||
Loss allowance (Lifetime ECLs) |
||||||||||||||||||||||||
|
|
|
|
|
|
|
|
|
|
|
|
|||||||||||||
$ | $ | $ | $ | $ | $ | |||||||||||||||||||
|
|
|
|
|
|
|
|
|
|
|
|
|||||||||||||
December 31, 2022 |
| |||||||||||||||||||||||
Not Past Due |
Overdue 1 to 30 days |
Overdue 31 to 90 Days |
Overdue Over 91 Days |
Individually Impaired |
Total |
|||||||||||||||||||
NT$ |
NT$ |
NT$ |
NT$ |
NT$ |
NT$ |
|||||||||||||||||||
Expected credit loss rate |
% |
% |
% |
% |
||||||||||||||||||||
Gross carrying amount |
$ | $ | $ | $ | $ | $ | ||||||||||||||||||
Loss allowance (Lifetime ECLs) |
||||||||||||||||||||||||
|
|
|
|
|
|
|
|
|
|
|
|
|||||||||||||
$ | $ | $ | $ | $ | $ | |||||||||||||||||||
|
|
|
|
|
|
|
|
|
|
|
|
|||||||||||||
Not Past Due |
Overdue 1 to 30 days |
Overdue 31 to 90 Days |
Overdue Over 91 Days |
Individually Impaired |
Total |
|||||||||||||||||||
US$ (Note 4) |
US$ (Note 4) |
US$ (Note 4) |
US$ (Note 4) |
US$ (Note 4) |
US$ (Note 4) |
|||||||||||||||||||
Expected credit loss rate |
% |
% |
% |
% |
||||||||||||||||||||
Gross carrying amount |
$ | $ | $ | $ | $ | $ | ||||||||||||||||||
Loss allowance (Lifetime ECLs) |
||||||||||||||||||||||||
|
|
|
|
|
|
|
|
|
|
|
|
|||||||||||||
$ | $ | $ | $ | $ | $ | |||||||||||||||||||
|
|
|
|
|
|
|
|
|
|
|
|
3) | At FVTPL |
b. | Transfers of financial assets |
Counterparty |
Receivables Factoring Proceed |
Reclassified to Other Receivables |
Advances Received- Unused |
Advances Received- Used |
Annual Interest Rates on Advances Received (%) |
|||||||||||||||
December 31, 2021 |
||||||||||||||||||||
BNP Paribas |
EUR | EUR | EUR | EUR | ||||||||||||||||
First Commercial Bank |
NT$ | NT$ | — | NT$ | — | NT$ | ||||||||||||||
December 31, 2022 |
||||||||||||||||||||
BNP Paribas |
EUR | |
EUR | EUR | EUR | |
11. |
INVENTORIES |
December 31 |
||||||||||||
2021 |
2022 |
|||||||||||
NT$ |
NT$ |
US$ (Note 4) |
||||||||||
Finished goods |
$ | $ | $ | |||||||||
Work in process |
||||||||||||
Raw materials |
||||||||||||
Supplies |
||||||||||||
Raw materials and supplies in transit |
||||||||||||
|
|
|
|
|
|
|||||||
$ | $ | $ | ||||||||||
|
|
|
|
|
|
12. |
INVENTORIES RELATED TO REAL ESTATE BUSINESS |
December 31 |
||||||||||||
2021 |
2022 |
|||||||||||
NT$ |
NT$ |
US$ (Note 4) |
||||||||||
Land and buildings held for sale |
$ | $ | $ | |||||||||
Construction in progress |
||||||||||||
Land held for construction |
||||||||||||
|
|
|
|
|
|
|||||||
$ | |
$ | |
$ | |
|||||||
|
|
|
|
|
|
13. |
OTHER FINANCIAL ASSETS |
December 31 |
||||||||||||
2021 |
2022 |
|||||||||||
NT$ |
NT$ |
US$ (Note 4) |
||||||||||
Guarantee deposits |
$ | $ | $ | |||||||||
Pledged time deposits (Note 36) |
||||||||||||
Time deposits with original maturity over three months |
||||||||||||
Others (Note 36) |
||||||||||||
|
|
|
|
|
|
|||||||
Current |
||||||||||||
|
|
|
|
|
|
|||||||
Non-current |
$ | |
$ | $ | ||||||||
|
|
|
|
|
|
14. |
INVESTMENTS ACCOUNTED FOR USING THE EQUITY METHOD |
December 31 |
||||||||||||
2021 |
2022 |
|||||||||||
NT$ |
NT$ |
US$ (Note 4) |
||||||||||
Investments in associates |
$ | $ | $ | |||||||||
Investments in joint ventures |
||||||||||||
|
|
|
|
|
|
|||||||
$ | $ | $ | ||||||||||
|
|
|
|
|
|
a. | Investments in associates |
1) | Investments in associates accounted for using the equity method that was not individually material consisted of the following: |
Operating |
Carrying Amount as of December 31 |
|||||||||||||||||
Name of Associate |
Main Business |
Location |
2021 |
2022 |
||||||||||||||
NT$ |
NT$ |
US$ (Note 4) |
||||||||||||||||
Yann Yuan Investment Co., Ltd. (“Yann Yuan”) |
|
$ | $ | $ | ||||||||||||||
ChipMOS Technologies Inc. (“ChipMOS”) |
|
|||||||||||||||||
M-Universe Investments Pte. Ltd. (“MU”) |
|
|||||||||||||||||
Hung Ching Development & Construction Co. (“HC”) |
|
|||||||||||||||||
Hung Ching Kwan Co. (“HCK”) |
|
|||||||||||||||||
Chipletz, Inc. (“CHIPLETZ”) |
|
|||||||||||||||||
Questyle Audio Engineering Co., Ltd. (“QUESTYLE”) |
|
|||||||||||||||||
Deca Technologies Inc. (“DECA”) |
|
|||||||||||||||||
|
|
|
|
|
|
|||||||||||||
Less: Deferred gain on transfer of land |
||||||||||||||||||
|
|
|
|
|
|
|||||||||||||
$ | $ | $ | ||||||||||||||||
|
|
|
|
|
|
2) | At each balance sheet date, the total percentages of ownership held by the Group were as follows: |
December 31 | ||||||||||
2021 |
2022 | |||||||||
Yann Yuan |
||||||||||
ChipMOS |
||||||||||
MU |
||||||||||
HC |
||||||||||
HCK |
||||||||||
CHIPLETZ |
||||||||||
DECA |
||||||||||
QUESTYLE |
|
3) | In June 2022, the Group’s subsidiary, SPIL, subscribed for additional new shares of Yann Yuan at a percentage different from its existing ownership percentage, which led to a decrease in the Group’s percentage of ownership in Yann Yuan to |
4) | In November 2022, the Group’s subsidiary, USISH , invested RMBownership of QUESTYLE. The Group considered it has significant influence over QUESTYLE since it involves in making significant decisions by participating in QUESTYLE’s board meeting. |
5) | At the end of 2022, the Group evaluated the recoverable amount of its investment in CHIPLETZ by using the value in use. The recoverable amount was lower than the carrying amount and, therefore, the Group recognized an impairment loss of NT$ The value in use of its investment in CHIPLETZ was the present value of cash flow projections made by CHIPLETZ’s management with a discount rate of |
6) | Fair values (Level 1) of investments in associates with available published price quotation are summarized as follows: |
December 31 |
||||||||||||
2021 |
2022 |
|||||||||||
NT$ |
NT$ |
US$ (Note 4) |
||||||||||
ChipMOS |
$ | $ | $ | |||||||||
|
|
|
|
|
|
|||||||
HC |
$ | $ | $ | |||||||||
|
|
|
|
|
|
7) | Aggregate information of associates that are not individually material |
For the Year Ended December 31 |
||||||||||||||||
2020 |
2021 |
2022 |
||||||||||||||
NT$ |
NT$ |
NT$ |
US$ (Note 4) |
|||||||||||||
The Group’s share of: |
||||||||||||||||
Net inco m e |
$ | $ | $ | $ | ||||||||||||
Other comprehensive income (loss) |
( |
) | ( |
) | ||||||||||||
|
|
|
|
|
|
|
|
|||||||||
Total comprehensive income (loss) |
$ | $ | $ | ( |
) | $ | ( |
) | ||||||||
|
|
|
|
|
|
|
|
b. | Investments in joint ventures |
1) | Investment in joint ventures that was not individually material and accounted for using the equity method consisted of the following: |
Operating |
Carrying Amount as of December 31 |
|||||||||||||||||
Name of Joint Venture |
Main Business |
Location |
2021 |
2022 |
||||||||||||||
NT$ |
NT$ |
US$ (Note 4) |
||||||||||||||||
SUMA-USI Electronics Co., Ltd. (“SUMA-USI”) |
|
$ | $ | $ | ||||||||||||||
MUtek Electronics Co., Ltd. (“MUtek”) |
|
— | ||||||||||||||||
|
|
|
|
|
|
|||||||||||||
$ | $ | $ | ||||||||||||||||
|
|
|
|
|
|
2) | At each balance sheet date, the percentages of ownership held by the Group’s subsidiary were as follows: |
December 31 | ||||||||||
2021 |
2022 | |||||||||
SUMA-USI |
% | % | ||||||||
MUtek |
— | % |
3) | Aggregate information of joint ventures that were not individually material |
For the Year Ended December 31 |
||||||||||||||||
2020 |
2021 |
2022 |
||||||||||||||
NT$ |
NT$ |
NT$ |
US$ (Note 4) |
|||||||||||||
The Group’s share of: |
||||||||||||||||
Net income |
$ | $ | $ | $ | ||||||||||||
Other comprehensive income |
— | — | — | |||||||||||||
|
|
|
|
|
|
|
|
|||||||||
Total comprehensive income |
$ | |
$ | $ | $ | |||||||||||
|
|
|
|
|
|
|
|
15. |
PROPERTY, PLANT AND EQUIPMENT |
December 31 |
||||||||||||
2021 |
2022 |
|||||||||||
NT$ |
NT$ |
US$ (Note 4) |
||||||||||
Land |
$ | $ | $ | |||||||||
Buildings and improvements |
||||||||||||
Machinery and equipment |
||||||||||||
Other equipment |
||||||||||||
Construction in progress and machinery under installation |
||||||||||||
|
|
|
|
|
|
|||||||
$ | $ | $ | ||||||||||
|
|
|
|
|
|
Land |
Buildings and Improvements |
Machinery and Equipment |
Other Equipment |
Construction in Progress and Machinery under Installation |
Total |
|||||||||||||||||||
NT$ |
NT$ |
NT$ |
NT$ |
NT$ |
NT$ |
|||||||||||||||||||
Cost |
||||||||||||||||||||||||
Balance at January 1, 2020 |
$ | $ | $ | $ | $ | $ | ||||||||||||||||||
Additions |
— | |||||||||||||||||||||||
Disposals |
— | ( |
) | ( |
) | ( |
) | ( |
) | ( |
) | |||||||||||||
Disposal of subsidiaries (Note 30) |
— | ( |
) | ( |
) | ( |
) | ( |
) | ( |
) | |||||||||||||
Reclassification |
— | ( |
) | |||||||||||||||||||||
Acquisitions through business combinations (Note 29) |
||||||||||||||||||||||||
Effect of foreign currency exchange differences |
( |
) | ( |
) | ( |
) | ( |
) | ( |
) | ( |
) | ||||||||||||
|
|
|
|
|
|
|
|
|
|
|
|
|||||||||||||
Balance at December 31, 2020 |
$ | $ | $ | $ | $ | $ | ||||||||||||||||||
|
|
|
|
|
|
|
|
|
|
|
|
|||||||||||||
Accumulated depreciation and impairment |
||||||||||||||||||||||||
Balance at January 1, 2020 |
$ |
— |
$ | $ | $ | $ | — |
$ | ||||||||||||||||
Depreciation expense |
— | — | ||||||||||||||||||||||
Impairment losses recognized |
— | — | — | |||||||||||||||||||||
Disposals |
— | ( |
) | ( |
) | ( |
) | — | ( |
) | ||||||||||||||
Disposal of subsidiaries (Note 30) |
— | ( |
) | ( |
) | ( |
) | — | ( |
) | ||||||||||||||
Reclassification |
— | ( |
) | — | ||||||||||||||||||||
Acquisitions through business combinations (Note 29) |
— | — | ||||||||||||||||||||||
Effect of foreign currency exchange differences |
— | ( |
) | ( |
) | ( |
) | — | ( |
) | ||||||||||||||
|
|
|
|
|
|
|
|
|
|
|
|
|||||||||||||
Balance at December 31, 2020 |
$ | — | $ | $ | $ | $ | — | $ | ||||||||||||||||
|
|
|
|
|
|
|
|
|
|
|
|
Land |
Buildings and Improvements |
Machinery and Equipment |
Other Equipment |
Construction in Progress and Machinery under Installation |
Total |
|||||||||||||||||||
NT$ |
NT$ |
NT$ |
NT$ |
NT$ |
NT$ |
|||||||||||||||||||
Cost |
||||||||||||||||||||||||
Balance at January 1, 2021 |
$ | $ | $ | $ | $ | $ | ||||||||||||||||||
Additions |
||||||||||||||||||||||||
Disposals |
( |
) | ( |
) | ( |
) | ( |
) | ( |
) | ( |
) | ||||||||||||
Disposal of subsidiaries (Note 30) |
— | ( |
) | ( |
) | ( |
) | ( |
) | ( |
) | |||||||||||||
Reclassification |
( |
) | ( |
) | ||||||||||||||||||||
Acquisitions through business combinations (Note 29) |
— | |||||||||||||||||||||||
Effect of foreign currency exchange differences |
( |
) | ( |
) | ( |
) | ( |
) | ( |
) | ||||||||||||||
|
|
|
|
|
|
|
|
|
|
|
|
|||||||||||||
Balance at December 31, 2021 |
$ | $ | $ | $ | $ | $ | ||||||||||||||||||
|
|
|
|
|
|
|
|
|
|
|
|
Land |
Buildings and Improvements |
Machinery and Equipment |
Other Equipment |
Construction in Progress and Machinery under Installation |
Total |
|||||||||||||||||||
NT$ |
NT$ |
NT$ |
NT$ |
NT$ |
NT$ |
|||||||||||||||||||
Accumulated depreciation and impairment |
||||||||||||||||||||||||
Balance at January 1, 2021 |
$ | — | $ | $ | $ | $ | — | $ | |
|||||||||||||||
Depreciation expense |
— | — | ||||||||||||||||||||||
Impairment losses recognized |
— | — | ||||||||||||||||||||||
Disposals |
— | ( |
) | ( |
) | ( |
) | — | ( |
) | ||||||||||||||
Disposal of subsidiaries (Note 30) |
— | ( |
) | ( |
) | ( |
) | — | ( |
) | ||||||||||||||
Reclassification |
— | ( |
) | ( |
) | — | ( |
) | ||||||||||||||||
Acquisitions through business combinations (Note 29) |
— | — | ||||||||||||||||||||||
Effect of foreign currency exchange differences |
— | ( |
) | ( |
) | ( |
) | — | ( |
) | ||||||||||||||
|
|
|
|
|
|
|
|
|
|
|
|
|||||||||||||
Balance at December 31, 2021 |
$ | — | $ | $ | $ | $ | — | $ | ||||||||||||||||
|
|
|
|
|
|
|
|
|
|
|
|
Land |
Buildings and Improvements |
Machinery and Equipment |
Other Equipment |
Construction in Progress and Machinery under Installation |
Total |
|||||||||||||||||||
NT$ |
NT$ |
NT$ |
NT$ |
NT$ |
NT$ |
|||||||||||||||||||
Cost |
||||||||||||||||||||||||
Balance at January 1, 2022 |
$ | $ | $ | $ | $ | $ | ||||||||||||||||||
Additions |
||||||||||||||||||||||||
Disposals |
( |
) | ( |
) | ( |
) | ( |
) | ( |
) | ( |
) | ||||||||||||
Reclassification |
( |
) | ( |
) | ||||||||||||||||||||
Effect of foreign currency exchange differences |
||||||||||||||||||||||||
|
|
|
|
|
|
|
|
|
|
|
|
|||||||||||||
Balance at December 31, 2022 |
$ | $ | $ | $ | $ | $ | ||||||||||||||||||
|
|
|
|
|
|
|
|
|
|
|
|
|||||||||||||
Accumulated depreciation and impairment |
||||||||||||||||||||||||
Balance at January 1, 2022 |
$ | — | $ | $ | $ | $ | — | $ | ||||||||||||||||
Depreciation expense |
— | — | ||||||||||||||||||||||
Impairment losses recognized |
— | — | ||||||||||||||||||||||
Disposals |
— | ( |
) | ( |
) | ( |
) | — | ( |
) | ||||||||||||||
Reclassification |
— | ( |
) | — | ||||||||||||||||||||
Effect of foreign currency exchange differences |
— | — | ||||||||||||||||||||||
|
|
|
|
|
|
|
|
|
|
|
|
|||||||||||||
Balance at December 31, 2022 |
$ | — | $ | $ | $ | $ | — | $ | ||||||||||||||||
|
|
|
|
|
|
|
|
|
|
|
|
Land |
Buildings and Improvements |
Machinery and Equipment |
Other Equipment |
Construction in Progress and Machinery under Installation |
Total |
|||||||||||||||||||
US$ (Note 4) |
US$ (Note 4) |
US$ (Note 4) |
US$ (Note 4) |
US$ (Note 4) |
US$ (Note 4) |
|||||||||||||||||||
Cost |
||||||||||||||||||||||||
Balance at January 1, 2022 |
$ | $ | $ | $ | $ | $ | ||||||||||||||||||
Additions |
||||||||||||||||||||||||
Disposals |
( |
) | ( |
) | ( |
) | ( |
) | ( |
) | ( |
) | ||||||||||||
Reclassification |
( |
) | ( |
) | ||||||||||||||||||||
Effect of foreign currency exchange differences |
||||||||||||||||||||||||
|
|
|
|
|
|
|
|
|
|
|
|
|||||||||||||
Balance at December 31, 2022 |
$ | $ | $ | $ | $ | $ | ||||||||||||||||||
|
|
|
|
|
|
|
|
|
|
|
|
|||||||||||||
Accumulated depreciation and impairment |
||||||||||||||||||||||||
Balance at January 1, 2022 |
$ | — | $ | $ | $ | $ | — | $ | ||||||||||||||||
Depreciation expense |
— | — | ||||||||||||||||||||||
Impairment losses recognized |
— | — | ||||||||||||||||||||||
Disposals |
— | ( |
) | ( |
) | ( |
) | — | ( |
) | ||||||||||||||
Reclassification |
— | ( |
) | — | ||||||||||||||||||||
Effect of foreign currency exchange differences |
— | — | ||||||||||||||||||||||
|
|
|
|
|
|
|
|
|
|
|
|
|||||||||||||
Balance at December 31, 2022 |
$ | — | $ | $ | $ | $ | — | $ | ||||||||||||||||
|
|
|
|
|
|
|
|
|
|
|
|
Buildings and improvements |
||||
Main plant buildings |
||||
Cleanrooms |
||||
Others |
||||
Machinery and equipment |
||||
Other equipment |
16. |
LEASE ARRANGEMENTS |
a. | Right-of-use |
December 31 |
||||||||||||
2021 |
2022 |
|||||||||||
NT$ |
NT$ |
US$ (Note 4) |
||||||||||
Carrying amounts |
||||||||||||
Land |
$ | $ | $ | |||||||||
Buildings and improvements |
||||||||||||
Machinery and equipment |
||||||||||||
Other equipment |
||||||||||||
|
|
|
|
|
|
|||||||
$ | $ | $ | ||||||||||
|
|
|
|
|
|
For the Year Ended December 31 |
||||||||||||||||
2020 |
2021 |
2022 |
||||||||||||||
NT$ |
NT$ |
NT$ |
US$ (Note 4) |
|||||||||||||
Additions to right-of-use |
$ | $ | $ | $ | ||||||||||||
|
|
|
|
|
|
|
|
|||||||||
Depreciation charge for right-of-use |
||||||||||||||||
Land |
$ | $ | $ | $ | ||||||||||||
Buildings and improveme n ts |
||||||||||||||||
Machinery and equipment |
||||||||||||||||
Other equipment |
||||||||||||||||
|
|
|
|
|
|
|
|
|||||||||
$ | |
$ | $ | $ | ||||||||||||
|
|
|
|
|
|
|
|
b. | Lease liabilities |
December 31 |
||||||||||||
2021 |
2022 |
|||||||||||
NT$ |
NT$ |
US$ (Note 4) |
||||||||||
Carrying amounts |
||||||||||||
Current |
$ | |
$ | $ | ||||||||
|
|
|
|
|
|
|||||||
Non-current |
$ | $ | $ | |||||||||
|
|
|
|
|
|
December 31 |
||||||||
2021 |
2022 |
|||||||
Land (%) |
||||||||
Buildings and improvements (%) |
c. | Material lease-in activities and terms |
d. | Subleases |
e. | Other lease information |
December 31 |
||||||||||||
2021 |
2022 |
|||||||||||
NT$ |
NT$ |
US$ (Note 4) |
||||||||||
Expenses relating to short-term leases |
$ | $ | $ | |||||||||
|
|
|
|
|
|
|||||||
Expenses relating to low-value assets leases |
$ | $ | $ | |||||||||
|
|
|
|
|
|
|||||||
Expenses relating to variable lease payments not included in the measurement of lease liabilities |
$ | $ | $ | |||||||||
|
|
|
|
|
|
|||||||
Total cash outflow for leases |
$ | $ | $ | |||||||||
|
|
|
|
|
|
17. |
INVESTMENT PROPERTIES |
Land |
Buildings and Improvements |
Right-of-use Assets |
Total |
|||||||||||||
NT$ |
NT$ |
NT$ |
NT$ |
|||||||||||||
Cost |
||||||||||||||||
Balance at January 1, 2020 |
$ | $ | $ | $ | ||||||||||||
Additions |
— | — | ||||||||||||||
Disposals |
— | ( |
) | — | ( |
) | ||||||||||
Reclassifi c ation |
— | ( |
) | |||||||||||||
Effects of foreign currency exchange differences |
— | |||||||||||||||
|
|
|
|
|
|
|
|
|||||||||
Balance at December 31, 2020 |
$ | |
$ | |
$ | |
$ | |
||||||||
|
|
|
|
|
|
|
|
Land |
Buildings and Improvements |
Right-of-use Assets |
Total |
|||||||||||||
NT$ |
NT$ |
NT$ |
NT$ |
|||||||||||||
Accumulated depreciation |
||||||||||||||||
Balance at January 1, 2020 |
$ | — | $ | $ | $ | |||||||||||
Depreciation expenses |
— | |||||||||||||||
Disposals |
— | ( |
) | — | ( |
) | ||||||||||
Reclassification |
— | ( |
) | |||||||||||||
Effects of foreign currency exchange differences |
— | |||||||||||||||
|
|
|
|
|
|
|
|
|||||||||
Balance at December 31, 2020 |
$ | — | $ | $ | $ | |||||||||||
|
|
|
|
|
|
|
|
|||||||||
Carrying amount at December 31, 2020 |
$ | |
$ | |
$ | |
$ | |
||||||||
|
|
|
|
|
|
|
|
Land |
Buildings and Improvements |
Right-of-use Assets |
Total |
|||||||||||||
NT$ |
NT$ |
NT$ |
NT$ |
|||||||||||||
Cost |
||||||||||||||||
Balance at January 1, 2021 |
$ | $ | $ | $ | ||||||||||||
Disposals |
— | ( |
) | — | ( |
) | ||||||||||
Disposal of subsidiaries (Note 30) |
— | ( |
) | ( |
) | ( |
) | |||||||||
Reclassification (Note 12) |
( |
) | ||||||||||||||
Effects of foreign currency exchange differences |
— | ( |
) | |||||||||||||
|
|
|
|
|
|
|
|
|||||||||
Balance at December 31, 2021 |
$ | $ | |
$ | |
$ | |
|||||||||
|
|
|
|
|
|
|
|
|||||||||
Accumulated depreciation |
||||||||||||||||
Balance at January 1, 2021 |
$ | — | $ | $ | $ | |||||||||||
Depreciation expenses |
— | |||||||||||||||
Disposals |
— | ( |
) | — | ( |
) | ||||||||||
Disposal of subsidiaries (Note 30) |
— | ( |
) | ( |
) | ( |
) | |||||||||
Reclassification |
— | |||||||||||||||
Effects of foreign currency e x change differences |
— | ( |
) | ( |
) | |||||||||||
|
|
|
|
|
|
|
|
|||||||||
Balance at December 31, 2021 |
$ | — | $ | $ | $ | |||||||||||
|
|
|
|
|
|
|
|
|||||||||
Carrying amount at December 31, 2021 |
$ | |
$ | |
$ | |
$ | |
||||||||
|
|
|
|
|
|
|
|
Land |
Buildings and Improvements |
Right-of-use Assets |
Total |
|||||||||||||
NT$ |
NT$ |
NT$ |
NT$ |
|||||||||||||
Cost |
||||||||||||||||
Balance at January 1, 2022 |
$ |
$ |
$ |
$ |
||||||||||||
Additions |
— |
— |
||||||||||||||
Disposals |
— |
( |
) |
— |
( |
) | ||||||||||
Reclassification |
( |
) |
||||||||||||||
Effects of foreign currency exchan g e differences |
||||||||||||||||
|
|
|
|
|
|
|
|
|||||||||
Balance at December 31, 2022 |
$ |
$ |
$ |
$ |
||||||||||||
|
|
|
|
|
|
|
|
|||||||||
Accumulated depreciation |
||||||||||||||||
Balance at January 1, 2022 |
$ |
— |
$ |
$ |
$ |
|||||||||||
Depreciation expenses |
— |
|||||||||||||||
Disposals |
— |
( |
) |
— |
( |
) | ||||||||||
Reclassification |
— |
( |
) |
( |
) |
( |
) | |||||||||
Effects of foreign currency exchange differences |
— |
|||||||||||||||
|
|
|
|
|
|
|
|
|||||||||
Balance at December 31, 2022 |
$ |
— |
$ |
$ |
$ |
|||||||||||
|
|
|
|
|
|
|
|
|||||||||
Carrying amount at December 31, 2022 |
$ |
$ |
$ |
$ |
||||||||||||
|
|
|
|
|
|
|
|
|||||||||
Land |
Buildings and Improvements |
Right-of-use Assets |
Total |
|||||||||||||
US$ (Note 4) |
US$ (Note 4) |
US$ (Note 4) |
US$ (Note 4) |
|||||||||||||
Cost |
||||||||||||||||
Balance at January 1, 2022 |
$ |
$ |
$ |
$ |
||||||||||||
Additions |
— |
— |
||||||||||||||
Disposals |
— |
( |
) |
— |
( |
) | ||||||||||
Reclassification |
( |
) |
||||||||||||||
Effects of foreign currency exchange differences |
— |
|||||||||||||||
|
|
|
|
|
|
|
|
|||||||||
Balance at December 31, 2022 |
$ |
$ |
$ |
$ |
||||||||||||
|
|
|
|
|
|
|
|
|||||||||
Accumulated depreciation |
||||||||||||||||
Balance at January 1, 2022 |
$ |
— |
$ |
$ |
$ |
|||||||||||
Depreciation expenses |
— |
|||||||||||||||
Disposals |
— |
( |
) |
— |
( |
) | ||||||||||
Reclassification |
— |
( |
) |
( |
) |
( |
) | |||||||||
Effects of foreign currency exchange differences |
— |
|||||||||||||||
|
|
|
|
|
|
|
|
|||||||||
Balance at December 31, 2022 |
$ |
— |
$ |
$ |
$ |
|||||||||||
|
|
|
|
|
|
|
|
|||||||||
Carrying amount at December 31, 2022 |
$ |
$ |
$ |
$ |
||||||||||||
|
|
|
|
|
|
|
|
December 31 |
||||||||||||
2021 |
2022 |
|||||||||||
NT$ |
NT$ |
US$ (Note 4) |
||||||||||
Year 1 |
$ | $ | $ | |||||||||
Year 2 |
||||||||||||
Year 3 |
||||||||||||
Year 4 |
||||||||||||
Year 5 |
||||||||||||
Year 6 onwards |
||||||||||||
|
|
|
|
|
|
|||||||
$ | $ | $ | ||||||||||
|
|
|
|
|
|
Main buildings |
||||
Right-of-use |
December 31 |
||||||||||||
2021 |
2022 |
|||||||||||
NT$ |
NT$ |
US$ (Note 4) |
||||||||||
Fair value |
$ |
$ |
$ |
|||||||||
|
|
|
|
|
|
18. |
GOODWILL |
Cost |
Accumulated impairment |
Carrying amount |
||||||||||
NT$ |
NT$ |
NT$ |
||||||||||
Balance at January 1, 2020 |
$ |
$ |
$ |
|||||||||
Acquisition through business combinations (Note 29) |
— |
|||||||||||
Effect of foreign currency exchange differences |
( |
) |
— |
( |
) | |||||||
|
|
|
|
|
|
|||||||
Balance at December 31, 2020 |
$ |
$ |
$ |
|||||||||
|
|
|
|
|
|
Cost |
Accumulated impairment |
Carrying amount |
||||||||||
NT$ |
NT$ |
NT$ |
||||||||||
Balance at January 1, 2021 |
$ |
$ |
$ |
|||||||||
Disposal of subsidiaries (Note 30) |
( |
) |
— |
( |
) | |||||||
Effect of foreign currency exchange differences |
( |
) |
— |
( |
) | |||||||
|
|
|
|
|
|
|||||||
Balance at December 31 , 2021 |
$ |
$ |
$ |
|||||||||
|
|
|
|
|
|
Cost |
Accumulated impairment |
Carrying amount |
||||||||||
NT$ |
NT$ |
NT$ |
||||||||||
Balance at January 1, 2022 |
$ |
$ |
$ |
|||||||||
Effect of foreign currency exchange differences |
— |
|||||||||||
|
|
|
|
|
|
|||||||
Balance at December 31, 2022 |
$ |
$ |
$ |
|||||||||
|
|
|
|
|
|
Cost |
Accumulated Impairment |
Carrying Amount |
||||||||||
US$ (Note 4) |
US$ (Note 4) |
US$ (Note 4) |
||||||||||
Balance at January 1, 2022 |
$ |
$ |
$ |
|||||||||
Effect of foreign currency exchange differences |
— |
|||||||||||
|
|
|
|
|
|
|||||||
Balance at December 31, 2022 |
$ |
$ |
$ |
|||||||||
|
|
|
|
|
|
a. | Allocating goodwill to cash-generating units |
December 31 |
||||||||||||
2021 |
2022 |
|||||||||||
Cash-generating units |
NT$ |
NT$ |
US$ (Note 4) |
|||||||||
Packaging segment |
$ | $ | $ | |||||||||
Testing segment |
||||||||||||
EMS segment |
||||||||||||
Others |
||||||||||||
|
|
|
|
|
|
|||||||
$ | $ | $ | ||||||||||
|
|
|
|
|
|
b. | Impairment assessment |
19. |
OTHER INTANGIBLE ASSETS |
December 31 |
||||||||||||
2021 |
2022 |
|||||||||||
NT$ |
NT$ |
US$ (Note 4) |
||||||||||
Customer relationships |
$ | $ | $ | |||||||||
Computer software |
||||||||||||
Patents and acquired specific technology |
||||||||||||
Others |
||||||||||||
|
|
|
|
|
|
|||||||
$ | $ | $ | ||||||||||
|
|
|
|
|
|
Customer Relationships |
Computer Software |
Patents and Acquired Specific Technology |
Others |
Total |
||||||||||||||||
NT$ |
NT$ |
NT$ |
NT$ |
NT$ |
||||||||||||||||
Cost | ||||||||||||||||||||
Balance at January 1, 2020 |
$ | $ | |
$ | |
$ | $ | |
||||||||||||
Additions |
— | |||||||||||||||||||
Disposals or derecognition |
( |
) | ( |
) | ( |
) | ||||||||||||||
Disposal of subsidiaries (Note 30) |
— | ( |
) | — | — | ( |
) | |||||||||||||
Acquisition through business combinations (Note 29) |
— | |||||||||||||||||||
Effect of foreign currency exchange differences |
( |
) | ( |
) | ( |
) | ||||||||||||||
|
|
|
|
|
|
|
|
|
|
|||||||||||
Balance at December 31, 2020 |
$ | $ | $ | $ | |
$ | ||||||||||||||
|
|
|
|
|
|
|
|
|
|
|||||||||||
Accumulated amortization | ||||||||||||||||||||
Balance at January 1, 2020 |
$ | $ | $ | $ | $ | |||||||||||||||
Amortization expense |
||||||||||||||||||||
Disposals or derecognition |
( |
) | ( |
) | ( |
) | ||||||||||||||
Disposal of subsidiaries (Note 30) |
— | ( |
) | — | — | ( |
) | |||||||||||||
Acquisition through business combinations (Note 29) |
— | |||||||||||||||||||
Effect of foreign currency exchange differences |
( |
) | ( |
) | ( |
) | ||||||||||||||
|
|
|
|
|
|
|
|
|
|
|||||||||||
Balance at December 31, 2020 |
$ | |
$ | $ | |
$ | $ | |||||||||||||
|
|
|
|
|
|
|
|
|
|
Customer Relationships |
Computer Software |
Patents and Acquired Specific Technology |
Others |
Total |
||||||||||||||||
NT$ |
NT$ |
NT$ |
NT$ |
NT$ |
||||||||||||||||
Cost | ||||||||||||||||||||
Balance at January 1, 2021 |
$ | $ | |
$ | |
$ | $ | |
||||||||||||
Additions |
— | |||||||||||||||||||
Disposals or derecognition |
( |
) | ( |
) | — | ( |
) | ( |
) | |||||||||||
Disposal of subsidiaries (Note 30) |
— | ( |
) | ( |
) | ( |
) | ( |
) | |||||||||||
Acquisition through business combinations (Note 29) |
— | — | — | |||||||||||||||||
Effect of foreign currency exchange differences |
( |
) | ( |
) | ( |
) | ( |
) | ( |
) | ||||||||||
|
|
|
|
|
|
|
|
|
|
|||||||||||
Balance at December 31, 2021 |
$ | $ | $ | $ | $ | |||||||||||||||
|
|
|
|
|
|
|
|
|
|
|||||||||||
Accumulated amortization | ||||||||||||||||||||
Balance at January 1, 2021 |
$ | $ | $ | $ | |
$ | ||||||||||||||
Amortization expense |
||||||||||||||||||||
Disposals or derecognition |
( |
) | ( |
) | — | ( |
) | ( |
) | |||||||||||
Disposal of subsidiaries (Note 30) |
— | ( |
) | ( |
) | ( |
) | ( |
) | |||||||||||
Acquisition through business combinations (Note 29) |
— | — | — | |||||||||||||||||
Effect of foreign currency exchange differences |
( |
) | ( |
) | ( |
) | ( |
) | ( |
) | ||||||||||
|
|
|
|
|
|
|
|
|
|
|||||||||||
Balance at December 31, 2021 |
$ | $ | $ | $ | $ | |||||||||||||||
|
|
|
|
|
|
|
|
|
|
Customer Relationships |
Computer Software |
Patents and Acquired Specific Technology |
Others |
Total |
||||||||||||||||
NT$ |
NT$ |
NT$ |
NT$ |
NT$ |
||||||||||||||||
Cost | ||||||||||||||||||||
Balance at January 1, 2022 |
$ | $ | |
$ | |
$ | |
$ | |
|||||||||||
Additions |
— | |||||||||||||||||||
Disposals or derecognition |
( |
) | ( |
) | ( |
) | ||||||||||||||
Effect of foreign currency exchange differences |
||||||||||||||||||||
|
|
|
|
|
|
|
|
|
|
|||||||||||
Balance at December 31, 2022 |
$ | $ | $ | $ | $ | |||||||||||||||
|
|
|
|
|
|
|
|
|
|
|||||||||||
Accumulated amortization and impairment | ||||||||||||||||||||
Balance at January 1, 2022 |
$ | $ | $ | $ | $ | |||||||||||||||
Amortization expense |
||||||||||||||||||||
Impairment losses recognized |
||||||||||||||||||||
Disposals or derecognition |
( |
) | ( |
) | ( |
) | ||||||||||||||
Effect of foreign currency exchange differences |
||||||||||||||||||||
|
|
|
|
|
|
|
|
|
|
|||||||||||
Balance at December 31, 2022 |
$ | $ | $ | $ | $ | |||||||||||||||
|
|
|
|
|
|
|
|
|
|
Customer Relationships |
Computer Software |
Patents and Acquired Specific Technology |
Others |
Total |
||||||||||||||||
US$ (Note 4) |
US$ (Note 4) |
US$ (Note 4) |
US$ (Note 4) |
US$ (Note 4) |
||||||||||||||||
Cost | ||||||||||||||||||||
Balance at January 1, 2022 |
$ | $ | $ | $ | $ | |||||||||||||||
Additions |
— | |||||||||||||||||||
Disposals or derecognition |
( |
) | ( |
) | ( |
) | ||||||||||||||
Effect of foreign currency exchange differences |
||||||||||||||||||||
|
|
|
|
|
|
|
|
|
|
|||||||||||
Balance at December 31, 2022 |
$ | $ | $ | $ | $ | |||||||||||||||
|
|
|
|
|
|
|
|
|
|
|||||||||||
Accumulated amortization and impairment |
||||||||||||||||||||
Balance at January 1, 2022 |
$ | $ | $ | $ | $ | |||||||||||||||
Amortization expense |
||||||||||||||||||||
Impairment losses recognized |
||||||||||||||||||||
Disposals or derecognition |
( |
) | ( |
) | ( |
) | ||||||||||||||
Effect of foreign currency exchange differences |
||||||||||||||||||||
|
|
|
|
|
|
|
|
|
|
|||||||||||
Balance at December 31, 2022 |
$ | $ | $ | $ | $ | |||||||||||||||
|
|
|
|
|
|
|
|
|
|
Customer relationships |
||||
Computer software |
||||
Patents and acquired specific technology |
||||
Others |
20. |
BORROWINGS |
a. | Short-term borrowings |
December 31 |
||||||||||||
2021 |
2022 |
|||||||||||
NT$ |
NT$ |
US$ (Note 4) |
||||||||||
Secured bank loans, annual interest rates were |
$ | $ | |
$ | ||||||||
Unsecured bank loans, annual interest rates were |
||||||||||||
|
|
|
|
|
|
|||||||
Less: financial liabilities for hedging - current (Note 34) |
||||||||||||
|
|
|
|
|
|
|||||||
$ | |
$ | $ | |||||||||
|
|
|
|
|
|
b. | Long-term borrowings |
1) | Bank loans |
December 31 |
||||||||||||
2021 |
2022 |
|||||||||||
NT$ |
NT$ |
US$ (Note 4) |
||||||||||
Revolving bank loans |
||||||||||||
Syndicated bank loans - redeemed in January 2022, annual interest rate was |
$ | $ | |
$ | ||||||||
Others - repayable through January 2023 to July 2029, annual interest rates were |
||||||||||||
Mortgage loans (Note 36) |
||||||||||||
Repayable through January 2023 to December 2033, annual interest rates were |
||||||||||||
|
|
|
|
|
|
|||||||
December 31 |
||||||||||||
2021 |
2022 |
|||||||||||
NT$ |
NT$ |
US$ (Note 4) |
||||||||||
Less: unamortized discounts |
$ |
$ |
$ |
|||||||||
|
|
|
|
|
|
|||||||
Less: current portion |
||||||||||||
financial liabilities for hedging - non-current (Note 34) |
||||||||||||
|
|
|
|
|
|
|||||||
$ |
$ |
$ |
||||||||||
|
|
|
|
|
|
2) | Long-term bills payable |
December 31 |
||||||||||||
2021 |
2022 |
|||||||||||
NT$ |
NT$ |
US$ (Note 4) |
||||||||||
Ta Ching Bills Finance Corporation, repayable through |
$ |
$ |
$ |
|||||||||
Cathay United Bank, repayable in |
||||||||||||
China Bills Finance Corporation, redeemed in |
||||||||||||
Mega Bills Finance Corporation, redeemed in |
||||||||||||
International Bills Finance Corporation, redeemed in |
||||||||||||
|
|
|
|
|
|
|||||||
Less: unamortized discounts |
||||||||||||
|
|
|
|
|
|
|||||||
$ |
$ |
$ |
||||||||||
|
|
|
|
|
|
21. |
BONDS PAYABLE |
December 31 |
||||||||||||
2021 |
2022 |
|||||||||||
NT$ |
NT$ |
US$ (Note 4) |
||||||||||
Unsecured domestic bonds |
||||||||||||
Repayable at maturity in January 2023 and interest due annually with annual interest rate at |
$ | $ | $ | |||||||||
Repayable at maturity in January 2024 and interest due annually with annual interest rate at |
||||||||||||
Repayable at maturity in April 2024 and interest due annually with annual interest rate at |
||||||||||||
Repayable at maturity in April 2026 and interest due annually with annual interest rate at |
||||||||||||
Repayable at maturity in April 2025 and interest due annually with annual interest rate at |
||||||||||||
Repayable at maturity in August 2023 and interest due annually with annual interest rate at |
||||||||||||
Repayable at maturity in August 2025 and interest due annually with annual interest rate at |
||||||||||||
Repayable at maturity in August 2027 and interest due annually with annual interest rate at |
||||||||||||
Redeemed in January 2022 and interest due annually with annual interest rate at |
||||||||||||
Unsecured overseas bonds |
||||||||||||
US$ |
||||||||||||
US$ |
||||||||||||
Unsecured overseas convertible bonds |
||||||||||||
RMB |
||||||||||||
|
|
|
|
|
|
|||||||
December 31 |
||||||||||||
2021 |
2022 |
|||||||||||
NT$ |
NT$ |
US$ (Note 4) |
||||||||||
Less: discounts on bonds payable |
$ | $ | |
$ | ||||||||
|
|
|
|
|
|
|||||||
Less: current portion of bonds payable |
||||||||||||
|
|
|
|
|
|
|||||||
$ | $ | $ | ||||||||||
|
|
|
|
|
|
22. |
OTHER PAYABLES |
December 31 |
||||||||||||
2021 |
2022 |
|||||||||||
NT$ |
NT$ |
US$ (Note 4) |
||||||||||
Payables for property, plant and equipment |
$ | $ | $ | |||||||||
Accrued salary and bonus |
||||||||||||
Accrued employees’ compensation and remuneration to directors |
||||||||||||
Accrued employee insurance |
||||||||||||
Accrued utilities |
||||||||||||
Others |
||||||||||||
|
|
|
|
|
|
|||||||
$ | $ | $ | ||||||||||
|
|
|
|
|
|
23. |
RETIREMENT BENEFIT PLANS |
a. | Defined contribution plans |
1) | The pension plan under the R.O.C. Labor Pension Act (“LPA”) for the Group’s R.O.C. resident employees is a government-managed defined contribution plan. Based on the LPA, the Company and its subsidiaries in R.O.C. makes monthly contributions to employees’ individual pension accounts at |
2) | The subsidiaries of the Group located in countries other than R.O.C. also make contributions at various ranges according to relevant local regulations. |
b. | Defined benefit plans |
1) |
The Company and its subsidiaries in R.O.C. joined the defined benefit pension plan under the R.O.C. Labor Standards Law operated by the government. Pension benefits are calculated on the basis of the length of service and average monthly salaries of the last six months before retirement. The Company and its subsidiaries in R.O.C. make contributions based on a certain percentage of their domestic employees’ monthly salaries to a pension fund administered by the pension fund monitoring committee. Before the end of each year, the Company and its subsidiaries in R.O.C. assess the balance in the pension fund. If the balance in the pension fund is inadequate to pay retirement benefits for employees who conform to retirement requirements in the next year, the Company and its subsidiaries in R.O.C. are required to fund the difference in one appropriation that should be made by the end of March in the next year. Pension contributions are deposited in the Bank of Taiwan in the committee’s name and are managed by the Bureau of Labor Funds, Ministry of Labor (“the Bureau”); the Company and its subsidiaries in Taiwan have no right to influence the investment policy and strategy. |
2) | Pension plans for certain subsidiaries of the Group stipulate that employees with service years exceeding agreed years are entitled to receive a lump-sum payment based on their length of service and the agreed salaries at the time of termination of employment. |
3) | ASE, SPIL, ASE Test, Inc. and ASEE have pension plans for executive managers. Pension costs under the plans were NT$ |
4) | |
December 31 |
||||||||||||
2021 |
2022 |
|||||||||||
NT$ |
NT$ |
US$ (Note 4) |
||||||||||
Present value of the defined benefit obligation |
$ | $ | $ | |||||||||
Fair value of the plan assets |
( |
) | ( |
) | ( |
) | ||||||
|
|
|
|
|
|
|||||||
Present value of unfunded defined benefit obligation |
||||||||||||
Recorded under other payables |
( |
) | ( |
) | ( |
) | ||||||
Recorded under other non-current assets |
— | |||||||||||
|
|
|
|
|
|
|||||||
Net defined benefit liabilities |
$ | $ | $ | |||||||||
|
|
|
|
|
|
Present Value of the Defined Benefit Obligation |
Fair Value of the Plan Assets |
Net Defined Benefit Liabilities (Assets) |
||||||||||
NT$ |
NT$ |
NT$ |
||||||||||
Balance at January 1, 2020 |
$ | $ | ( |
) | $ | |||||||
|
|
|
|
|
|
|||||||
Service cost |
||||||||||||
Current service cost |
||||||||||||
Past service cost and gain on settlements |
( |
) | ( |
) | ||||||||
Net interest expense (income) |
( |
) | ||||||||||
|
|
|
|
|
|
|||||||
Recognized in profit or loss |
( |
) | ||||||||||
|
|
|
|
|
|
|||||||
Remeasurement |
||||||||||||
Return on plan assets (excluding amounts included in net interest) |
( |
) | ( |
) | ||||||||
Actuarial (gain) loss |
||||||||||||
Changes in financial assumptions |
||||||||||||
Experience adjustments |
||||||||||||
Changes in demographic assumptions |
( |
) | ( |
) | ||||||||
|
|
|
|
|
|
|||||||
Recognized in other comprehensive income |
( |
) | ||||||||||
|
|
|
|
|
|
|||||||
Contributions from the employer |
( |
) | ( |
) | ||||||||
Benefits paid from |
||||||||||||
the pension fund |
( |
) | ||||||||||
the Group |
( |
) | ( |
) | ||||||||
Assets extinguished on settlement |
||||||||||||
Business combinations |
||||||||||||
Exchange differences on foreign plans |
( |
) | ||||||||||
|
|
|
|
|
|
|||||||
Balance at December 31, 2020 |
( |
) | ||||||||||
|
|
|
|
|
|
Present Value of the Defined Benefit Obligation |
Fair Value of the Plan Assets |
Net Defined Benefit Liabilities (Assets) |
||||||||||
NT$ |
NT$ |
NT$ |
||||||||||
Service cost |
||||||||||||
Current service cost |
$ | $ | $ | |||||||||
Past service cost and gain on settlements |
( |
) | ( |
) | ||||||||
Net interest expense (income) |
( |
) | ||||||||||
|
|
|
|
|
|
|||||||
Recognized in profit or loss |
( |
) | ||||||||||
|
|
|
|
|
|
|||||||
Remeasurement |
||||||||||||
Return on plan assets (excluding amounts included in net interest) |
( |
) | ( |
) | ||||||||
Actuarial (gain) loss |
||||||||||||
Changes in financial assumptions |
( |
) | ( |
) | ||||||||
Experience adjustments |
||||||||||||
Changes in demographic assumptions |
||||||||||||
|
|
|
|
|
|
|||||||
Recognized in other comprehensive income |
( |
) | ( |
) | ( |
) | ||||||
|
|
|
|
|
|
|||||||
Contributions from the employer |
( |
) | ( |
) | ||||||||
Benefits paid from |
||||||||||||
the pension fund |
( |
) | ||||||||||
the Group |
( |
) | ( |
) | ||||||||
Business combinations |
||||||||||||
Exchange differences on foreign plans |
( |
) | ( |
) | ||||||||
|
|
|
|
|
|
|||||||
Balance at December 31, 2021 |
( |
) | ||||||||||
|
|
|
|
|
|
|||||||
Service cost |
||||||||||||
Current service cost |
||||||||||||
Past service cost and gain on settlements |
( |
) | ( |
) | ||||||||
Net interest expense (income) |
( |
) | ||||||||||
|
|
|
|
|
|
|||||||
Recognized in profit or loss |
( |
) | ||||||||||
|
|
|
|
|
|
|||||||
Remeasurement |
||||||||||||
Return on plan assets (excluding amounts included in net interest) |
( |
) | ( |
) | ||||||||
Actuarial (gain) loss |
||||||||||||
Changes in financial assumptions |
( |
) | ( |
) | ||||||||
Experience adjustments |
||||||||||||
Changes in demographic assumptions |
( |
) | ( |
) | ||||||||
|
|
|
|
|
|
|||||||
Recognized in other comprehensive income |
( |
) | ( |
) | ( |
) | ||||||
|
|
|
|
|
|
|||||||
Contributions from the employer |
— | ( |
) | ( |
) | |||||||
Benefits paid from |
||||||||||||
the pension fund |
( |
) | ||||||||||
the Group |
( |
) | ( |
) | ||||||||
Assets extinguished on settlement |
( |
) | ( |
) | ||||||||
Exchange differences on foreign plans |
( |
) | ||||||||||
|
|
|
|
|
|
|||||||
Balance at December 31, 2022 |
$ | $ | ( |
) | $ | |||||||
|
|
|
|
|
|
Present Value of the Defined Benefit Obligation |
Fair Value of the Plan Assets |
Net Defined Benefit Liabilities (Assets) |
||||||||||
US$ (Note 4) |
US$ (Note 4) |
US$ (Note 4) |
||||||||||
Balance at January 1, 2022 |
$ | $ | ( |
) | $ | |||||||
|
|
|
|
|
|
|||||||
Service cost |
||||||||||||
Current service cost |
||||||||||||
Past service cost and gain on settlements |
( |
) | — | ( |
) | |||||||
Net interest expense (income) |
( |
) | ||||||||||
|
|
|
|
|
|
|||||||
Recognized in profit or loss |
( |
) | ||||||||||
|
|
|
|
|
|
|||||||
Remeasurement |
||||||||||||
Return on plan assets (excluding amounts included in net interest) |
( |
) | ( |
) | ||||||||
Actuarial (gain) loss |
||||||||||||
Changes in financial assumptions |
( |
) | ( |
) | ||||||||
Experience adjustments |
||||||||||||
Changes in demographic assumptions |
( |
) | ( |
) | ||||||||
|
|
|
|
|
|
|||||||
Recognized in other comprehensive income |
( |
) | ( |
) | ( |
) | ||||||
|
|
|
|
|
|
|||||||
Contributions from the employer |
( |
) | ( |
) | ||||||||
Benefits paid from |
||||||||||||
the pension fund |
( |
) | ||||||||||
the Group |
( |
) | ( |
) | ||||||||
Assets extinguished on settlement |
( |
) | ( |
) | ||||||||
Exchange differences on foreign plans |
( |
) | ||||||||||
|
|
|
|
|
|
|||||||
Balance at December 31, 2022 |
$ | $ | ( |
) | $ | |||||||
|
|
|
|
|
|
5) | |
December 31 |
||||||||||||
2021 |
2022 |
|||||||||||
NT$ |
NT$ |
US$ (Note 4) |
||||||||||
Cash |
$ | $ | $ | |||||||||
Equity instruments |
||||||||||||
Debt instruments |
|
|||||||||||
Others |
||||||||||||
|
|
|
|
|
|
|||||||
Total |
$ | $ | |
$ | ||||||||
|
|
|
|
|
|
6) | Through the defined benefit plans under the Labor Standards Law of the R.O.C., the Group in R.O.C. are exposed to the following risks: |
a) | Investment risk |
b) | Interest risk |
c) | Salary risk |
7) | The management of ASE Korea is responsible for the administration of the fund and determination of the investment strategies according to related local regulations. ASE Korea is responsible for the shortfall between the fund and the defined benefit obligation. The plan assets are investment in the certificates of deposits. |
8) | The present value of the defined benefit obligation and the related current service cost and past service cost were measured using the Projected Unit Credit Method. |
December 31 | ||||||
2021 |
2022 | |||||
Discount rates (%) |
||||||
Expected rates of salary increase (%) |
December 31 |
||||||||||||
2021 |
2022 |
|||||||||||
NT$ |
NT$ |
US$ (Note 4) |
||||||||||
Discount rate |
||||||||||||
0.5% higher |
$ | ( |
) | $ | ( |
) | $ | ( |
) | |||
|
|
|
|
|
|
|||||||
0.5% lower |
$ | $ | |
$ | ||||||||
|
|
|
|
|
|
|||||||
Expected rates of salary increase |
||||||||||||
0.5% higher |
$ | |
$ | $ | ||||||||
|
|
|
|
|
|
|||||||
0.5% lower |
$ | ( |
) | $ | ( |
) | $ | ( |
) | |||
|
|
|
|
|
|
9) | |
December 31 |
||||||||||||
2021 |
2022 |
|||||||||||
NT$ |
NT$ |
US$ (Note 4) |
||||||||||
No later than 1 year |
$ | $ | $ | |||||||||
Later than 1 year but not later than 5 years |
||||||||||||
Later than 5 years |
||||||||||||
|
|
|
|
|
|
|||||||
$ | $ | $ | ||||||||||
|
|
|
|
|
|
24. |
EQUITY |
a. | Share capital |
December 31 |
||||||||||||
2021 |
2022 |
|||||||||||
Numbers of shares authorized (in thousands) |
|
|
||||||||||
|
|
|
|
|||||||||
Numbers of shares reserved (in thousands) |
||||||||||||
Employee share options |
||||||||||||
|
|
|
|
|||||||||
Number of shares issued and fully paid (in thousands) |
||||||||||||
|
|
|
|
December 31 |
||||||||||||
2021 |
2022 |
|||||||||||
NT$ |
NT$ |
US$ (Note 4) |
||||||||||
Share capital authorized |
$ | |
$ | |
$ | |
||||||
|
|
|
|
|
|
|||||||
Share capital reserved |
||||||||||||
Employee share options |
$ | $ | $ | |||||||||
|
|
|
|
|
|
b. | Capital surplus |
December 31 |
||||||||||||
2021 |
2022 |
|||||||||||
NT$ |
NT$ |
US$ (Note 4) |
||||||||||
May be used to offset a deficit, distributed as cash dividends, or transferred to share capital (1) |
||||||||||||
Issuance of ordinary shares |
$ | $ | $ | |||||||||
Merger by share exchange |
||||||||||||
Difference between consideration and the carrying amount of the subsidiaries’ net assets during actual disposal or acquisition |
||||||||||||
Exercised employee share options |
||||||||||||
Treasury share transactions |
||||||||||||
Donations from shareholders |
||||||||||||
Expired share options (Note 28) |
||||||||||||
|
|
|
|
|
|
|||||||
|
|
|
|
|
|
|||||||
May be used to offset a deficit only |
||||||||||||
Changes in percentage of ownership interest in subsidiaries (2) |
$ | $ | $ | |||||||||
Share of changes in capital surplus of associates accounted for using the equity method |
||||||||||||
Dividends that the claim period has elapsed and unclaimed by shareholders |
||||||||||||
Exercised disgorgement |
||||||||||||
|
|
|
|
|
|
|||||||
|
|
|
|
|
|
|||||||
May not be used for any purpose |
||||||||||||
Employee share options |
||||||||||||
Employee restricted stock awards |
||||||||||||
Others (3) |
||||||||||||
|
|
|
|
|
|
|||||||
|
|
|
|
|
|
|||||||
$ | $ | $ | ||||||||||
|
|
|
|
|
|
1) | Such capital surplus may be used to offset a deficit; in addition, when the Company has no deficit, such capital surplus may be distributed as cash dividends or transferred to share capital (limited to a certain percentage of the Company’s capital surplus and once a year). |
2) | Such capital surplus arises from the effects of changes in ownership interests in subsidiaries resulting from equity transactions other than actual disposals or acquisitions, or from changes in capital surplus of subsidiaries accounted for using the equity method. |
3) | Such capital surplus represents the excess of the carrying amount of related accounts over the par value due to employee share options exercised and the Company has not completed registration formalities. |
c. | Retained earnings and dividend policy |
1) | Replenishment of deficits; |
2) | 10.0% as legal reserve; |
3) | Special reserve appropriated or reversed in accordance with laws or regulations set forth by the authorities concerned; |
4) |
If annual net income remains, a proposal for the distribution of such amount together with a part or all of the accumulated undistributed profits from previous years shall be prepared by the board of directors and submit to the shareholders’ meeting for resolution. However, the distributable dividends may be paid in cash after a resolution has been adopted by a majority vote at a meeting of the board of directors attended by two-thirds of the total number of directors; and, in addition, a report of such distribution shall be submitted to the shareholders’ meeting. |
Appropriation of Earnings |
Dividends Per Share |
|||||||||||||||
For Year 2020 |
For Year 2021 |
For Year 2020 |
For Year 2021 |
|||||||||||||
NT$ |
NT$ |
NT$ |
NT$ |
|||||||||||||
(in dollars) |
(in dollars) |
|||||||||||||||
Legal reserve |
$ | $ | ||||||||||||||
Special reserve (reversed) |
( |
) | ||||||||||||||
Cash dividends |
$ | $ | ||||||||||||||
|
|
|
|
|||||||||||||
$ | $ | |||||||||||||||
|
|
|
|
d. | Others equity items |
1) | Exchange differences on translating foreign operations |
For the Year Ended December 31 |
||||||||||||||||
2020 |
2021 |
2022 |
||||||||||||||
NT$ |
NT$ |
NT$ |
US$ (Note 4) |
|||||||||||||
Balance at January 1 |
$ | ( |
) | $ | ( |
) | $( |
) | $ | ( |
) | |||||
Recognized for the year |
||||||||||||||||
Exchange differences arising on translating foreign operations |
( |
) | ( |
) |
For the Year Ended December 31 |
||||||||||||||||
2020 |
2021 |
2022 |
||||||||||||||
NT$ |
NT$ |
NT$ |
US$ (Note 4) |
|||||||||||||
Share from associates and joint ventures accounted for using the equity method |
$ | $ | $ | ( |
) | $ | ( |
) | ||||||||
Reclassification |
||||||||||||||||
Disposal of associates and joint venture accounted for using the equity method |
— | — | — | |||||||||||||
Disposal of foreign operations |
( |
) | — | — | ||||||||||||
|
|
|
|
|
|
|
|
|||||||||
Balance at December 31 |
$ | ( |
) | $ | ( |
) | $ | ( |
) | $ | ( |
) | ||||
|
|
|
|
|
|
|
|
2) | Unrealized gain (loss) on financial assets at F VTO CI |
For the Year Ended December 31 |
||||||||||||||||
2020 |
2021 |
2022 |
||||||||||||||
NT$ |
NT$ |
NT$ |
US$ (Note 4) |
|||||||||||||
Balance at January 1 |
$ | ( |
) | $ | $ | $ | ||||||||||
|
|
|
|
|
|
|
|
|||||||||
Unrealized gain (loss) recognized during the year Debt instruments |
( |
) | ( |
) | ( |
) | ||||||||||
Equity instruments |
( |
) | ( |
) | ( |
) | ( |
) | ||||||||
Share from associates and joint ventures accounted for using the equity method |
( |
) | ( |
) | ||||||||||||
|
|
|
|
|
|
|
|
|||||||||
Other comprehensive income for the year |
|
|
( |
) | ( |
) | ||||||||||
|
|
|
|
|
|
|
|
|||||||||
Disposal of associates and joint ventures accounted for using the equity method |
— | — | — | |||||||||||||
Cumulative unrealized loss of equity instruments transferred to retained earnings due to disposal |
For the Year Ended December 31 |
||||||||||||||||
2020 |
2021 |
2022 |
||||||||||||||
NT$ |
NT$ |
NT$ |
US$ (Note 4) |
|||||||||||||
Cumulative unrealized gain transferred to retained earnings due to disposal of equity instruments in relation to associates and joint venture accounted for using the equity method |
$ | ( |
) | $ | ( |
) | $ | ( |
) | $ | ( |
) | ||||
|
|
|
|
|
|
|
|
|||||||||
Balance at December 31 |
$ | |
$ | |
$ | |
$ | |
||||||||
|
|
|
|
|
|
|
|
3) | Gain (loss) on hedging instruments - hedges of net investments of foreign operations |
For the Year Ended December 31 |
||||||||||||||||
2020 |
2021 |
2022 |
||||||||||||||
NT$ |
NT$ |
NT$ |
US$ (Note 4) |
|||||||||||||
Balance at January 1 |
$ | $ | ( |
) | $ | $ | ||||||||||
Recognized during the year |
||||||||||||||||
Foreign currency risk – loans denominated in foreign currency |
( |
) | ||||||||||||||
|
|
|
|
|
|
|
|
|||||||||
Balance at December 31 |
$ | ( |
) | $ | |
$ | |
$ | |
|||||||
|
|
|
|
|
|
|
|
4) | Unearned employee compensation |
For the Year Ended December 31 |
||||||||||||
2021 |
2022 |
|||||||||||
NT$ |
NT$ |
US$ (Note 4) |
||||||||||
Balance at January 1 |
$ | $ | ( |
) | $ | ( |
) | |||||
Issuance of employee restricted stock awards |
( |
) | ||||||||||
Share-based payment expenses |
|
|
|
|||||||||
Valuation adjustments |
||||||||||||
|
|
|
|
|
|
|||||||
Balance at December 31 |
$ | ( |
) | $ | ( |
) | $ | ( |
) | |||
|
|
|
|
|
|
e. | Treasury shares |
Purpose of Repurchase |
Shares repurchased for cancellation |
Shares held by subsidiaries |
Total |
|||||||||
(in thousand shares) |
||||||||||
Balance at January 1, 2021 |
||||||||||||
Increase during the year |
||||||||||||
|
|
|
|
|
|
|||||||
Balance at December 31, 2021 |
||||||||||||
Increase during the year |
||||||||||||
Decrease during the year |
( |
) | ( |
) | ||||||||
|
|
|
|
|
|
|||||||
Balance at December 31, 2022 |
||||||||||||
|
|
|
|
|
|
Shares Held by Subsidiaries |
Carrying Amount |
Carrying Amount |
Fair Value |
Fair Value |
||||||||||||||||
(in thousand shares) |
NT$ |
US$ (Note 4) |
NT$ |
US$ (Note 4) |
||||||||||||||||
December 31, 2021 |
||||||||||||||||||||
ASE Test |
$ | $ | ||||||||||||||||||
J&R Holding |
||||||||||||||||||||
ASE Test, Inc. |
||||||||||||||||||||
|
|
|
|
|
|
|||||||||||||||
$ | $ | |||||||||||||||||||
|
|
|
|
|
|
|||||||||||||||
December 31, 2022 |
||||||||||||||||||||
ASE |
$ | $ | $ | $ | ||||||||||||||||
ASE Test, Inc. |
||||||||||||||||||||
|
|
|
|
|
|
|
|
|
|
|||||||||||
$ | $ | $ | $ | |||||||||||||||||
|
|
|
|
|
|
|
|
|
|
f. | Non-controlling interests |
For the Year Ended December 31 |
||||||||||||||||
2020 |
2021 |
2022 |
||||||||||||||
NT$ |
NT$ |
NT$ |
US$ (Note 4) |
|||||||||||||
Balance at January 1 |
$ | $ | $ | |
$ | |||||||||||
Share of profit for the year |
||||||||||||||||
Other comprehensive income (loss) for the year |
||||||||||||||||
Exchange difference on translating foreign operations |
( |
) | ||||||||||||||
Unrealized gain (loss) on equity instruments at FVTOCI |
( |
) | ( |
) | ||||||||||||
Gain (loss) from hedging |
( |
) | ||||||||||||||
Remeasurement on defined benefit plans |
( |
) | ||||||||||||||
Share in other comprehensive income from associates accounted for using the equity method |
— | ( |
) | ( |
) | |||||||||||
Non-controlling interests arising from acquisition or disposal of subsidiaries (Note 29) |
— | — | — | |||||||||||||
Acquisition of non-controlling interests in subsidiaries (Note 31) |
( |
) | — | — | — | |||||||||||
Issuance of ordinary shares by subsidiaries (Note 29) |
— | — | — | |||||||||||||
Subsidiaries’ buy back of their own outstanding ordinary shares (Note 31) |
( |
) | ( |
) | ( |
) | ( |
) | ||||||||
Equity component of convertible bonds issued by subsidiaries |
— | |||||||||||||||
Non-controlling interest relating to outstanding vested employee share options granted by subsidiaries |
||||||||||||||||
Cash dividends to non-controlling interests |
( |
) | ( |
) | ( |
) | ( |
) | ||||||||
|
|
|
|
|
|
|
|
|||||||||
Balance at December 31 |
$ | |
$ | $ | $ | |
||||||||||
|
|
|
|
|
|
|
|
25. |
PROFIT BEFORE INCOME TAX |
a. | Other operating income and expenses, net |
For the Year Ended December 31 |
||||||||||||||||
2020 |
2021 |
2022 |
||||||||||||||
NT$ |
NT$ |
NT$ |
US$ (Note 4) |
|||||||||||||
Rental income |
$ | $ | $ | $ | ||||||||||||
Gain on disposal of property, plant and equipment |
||||||||||||||||
Royalty income |
— | |||||||||||||||
Impairment loss on non-financial assets (Notes 15 and 19) |
( |
) | ( |
) | ( |
) | ( |
) | ||||||||
Others |
( |
) | ( |
) | ||||||||||||
|
|
|
|
|
|
|
|
|||||||||
$ | |
$ | |
$ | |
$ | ||||||||||
|
|
|
|
|
|
|
|
b. | Other income |
For the Year Ended December 31 |
||||||||||||||||
2020 |
2021 |
2022 |
||||||||||||||
NT$ |
NT$ |
NT$ |
US$ (Note 4) |
|||||||||||||
Interest income |
||||||||||||||||
Bank deposits |
$ | $ | $ | $ | ||||||||||||
Contracts with customers |
— | |||||||||||||||
Government subsidies |
||||||||||||||||
Dividends income |
||||||||||||||||
|
|
|
|
|
|
|
|
|||||||||
$ | |
$ | |
$ | |
$ | ||||||||||
|
|
|
|
|
|
|
|
c. | Other gains and losses |
For the Year Ended December 31 |
||||||||||||||||
2020 |
2021 |
2022 |
||||||||||||||
NT$ |
NT$ |
NT$ |
US$ (Note 4) |
|||||||||||||
Net gain on financial assets mandatorily at FVTPL |
$ | $ | $ | $ | ||||||||||||
Net loss arising on financial instruments held for trading |
( |
) | ( |
) | ( |
) | ( |
) | ||||||||
Gain on disposal of subsidiaries (Note 30) |
— | — | ||||||||||||||
Foreign exchange gains (losses), net |
( |
) | ( |
) | ||||||||||||
Gain recognized in bargain purchase transaction (Note 29) |
— | — | — | |||||||||||||
Impairment loss on investments accounted for using the equity method (Note 14) |
— | — | ( |
) | ( |
) | ||||||||||
Gain (loss) on disposal of investments accounted for using the equity method |
( |
) | ||||||||||||||
|
|
|
|
|
|
|
|
|||||||||
$ | $ | $ | $ | |||||||||||||
|
|
|
|
|
|
|
|
d. | Finance costs |
For the Year Ended December 31 |
||||||||||||||||
2020 |
2021 |
2022 |
||||||||||||||
NT$ |
NT$ |
NT$ |
US$ (Note 4) |
|||||||||||||
Interest on lease liabilities |
$ | $ | $ | $ | ||||||||||||
Interest on borrowings and bonds payable |
||||||||||||||||
|
|
|
|
|
|
|
|
|||||||||
Total interest expense for financial liabilities measured at amortized cost |
||||||||||||||||
Less: Amounts included in the cost of qualifying assets |
||||||||||||||||
Inventories related to real estate business |
( |
) | ( |
) | ||||||||||||
Property, plant and equipment |
( |
) | ( |
) | ( |
) | ( |
) | ||||||||
|
|
|
|
|
|
|
|
|||||||||
Other finance costs |
||||||||||||||||
|
|
|
|
|
|
|
|
|||||||||
$ | |
$ | |
$ | |
$ | ||||||||||
|
|
|
|
|
|
|
|
For the Year Ended December 31 |
||||||||||||
2020 |
2021 |
2022 |
||||||||||
Annual interest capitalization rates |
||||||||||||
Inventories related to real estate business (%) |
— | |||||||||||
Property, plant and equipment (%) |
e. | Depreciation and amortization |
For the Year Ended December 31 |
||||||||||||||||
2020 |
2021 |
2022 |
||||||||||||||
NT$ |
NT$ |
NT$ |
US$ (Note 4) |
|||||||||||||
Property, plant and equipment |
$ | |
$ | |
$ | |
$ | |||||||||
Right-of-use |
||||||||||||||||
Investment properties |
||||||||||||||||
Other intangible assets |
||||||||||||||||
|
|
|
|
|
|
|
|
|||||||||
Total |
$ | $ | $ | $ | ||||||||||||
|
|
|
|
|
|
|
|
|||||||||
Summary of depreciation by function |
||||||||||||||||
Operating costs |
$ | $ | $ | $ | ||||||||||||
Operating expenses |
||||||||||||||||
|
|
|
|
|
|
|
|
|||||||||
$ | $ | $ | |
$ | |
|||||||||||
|
|
|
|
|
|
|
|
For the Year Ended December 31 |
||||||||||||||||
2020 |
2021 |
2022 |
||||||||||||||
NT$ |
NT$ |
NT$ |
US$ (Note 4) |
|||||||||||||
Summary of amortization by function |
||||||||||||||||
Operating costs |
$ | $ | $ | $ | ||||||||||||
Operating expenses |
||||||||||||||||
|
|
|
|
|
|
|
|
|||||||||
$ | |
$ | |
$ | |
$ | |
|||||||||
|
|
|
|
|
|
|
|
For the Year Ended December 31 |
||||||||||||||||
2020 |
2021 |
2022 |
||||||||||||||
NT$ |
NT$ |
NT$ |
US$ (Note 4) |
|||||||||||||
Direct operating expenses of investment properties that generated rental income |
$ | |
$ | |
$ | |
$ | |
||||||||
|
|
|
|
|
|
|
|
f. | Employee benefits expense |
For the Year Ended December 31 |
||||||||||||||||
2020 |
2021 |
2022 |
||||||||||||||
NT$ |
NT$ |
NT$ |
US$ (Note 4) |
|||||||||||||
Post-employment benefits |
||||||||||||||||
Defined contribution plans |
$ | |
$ | $ | $ | |||||||||||
Defined benefit plans |
||||||||||||||||
|
|
|
|
|
|
|
|
|||||||||
Equity-settled share-based payments |
||||||||||||||||
Other employee benefits |
||||||||||||||||
|
|
|
|
|
|
|
|
|||||||||
$ | $ | $ | $ | |||||||||||||
|
|
|
|
|
|
|
|
|||||||||
Summary of employee benefits expense by function |
||||||||||||||||
Operating costs |
$ | $ | $ | $ | ||||||||||||
Operating expenses |
||||||||||||||||
|
|
|
|
|
|
|
|
|||||||||
$ | $ | $ | $ | |||||||||||||
|
|
|
|
|
|
|
|
g. | Employees’ compensation and the remuneration to directors |
For the Year Ended December 31 |
||||||||||||||||||
2021 |
2022 |
|||||||||||||||||
Accrual Rate (%) |
Accrual Amount |
Accrual Rate (%) |
Accrual Amount |
|||||||||||||||
NT$ |
NT$ |
US$ (Note 4) |
||||||||||||||||
Employees’ compensation |
$ | |
$ | |
$ | |
||||||||||||
Remuneration to directors |
For Year 2020 |
For Year 2021 |
|||||||||||||||
Employees’ compensation |
Remuneration to directors |
Employees’ compensation |
Remuneration to directors |
|||||||||||||
NT$ |
NT$ |
NT$ |
NT$ |
|||||||||||||
Resolved by the board of directors |
$ | $ | $ | $ | ||||||||||||
|
|
|
|
|
|
|
|
|||||||||
Recognized in the consolidated financial statements |
$ | $ | $ | $ | ||||||||||||
|
|
|
|
|
|
|
|
26. |
INCOME TAX |
a. | Income tax recognized in profit or loss |
For the Year Ended December 31 |
||||||||||||||||
2020 |
2021 |
2022 |
||||||||||||||
NT$ |
NT$ |
NT$ |
US$ (Note 4) |
|||||||||||||
Current income tax |
||||||||||||||||
In respect of the current year |
$ | |
$ | $ | $ | |||||||||||
Income tax on unappropriated earnings |
||||||||||||||||
Changes in estimate for prior years |
( |
) | ( |
) | ( |
) | ( |
) | ||||||||
|
|
|
|
|
|
|
|
|||||||||
|
|
|
|
|
|
|
|
For the Year Ended December 31 |
||||||||||||||||
2020 |
2021 |
2022 |
||||||||||||||
NT$ |
NT$ |
NT$ |
US$ (Note 4) |
|||||||||||||
Deferred income tax |
||||||||||||||||
In respect of the current year |
$ | |
$ | ( |
) | $ | $ | |||||||||
Changes in tax rates |
— | ( |
) | ( |
) | |||||||||||
Changes in estimate for prior years |
( |
) | ||||||||||||||
Effect of foreign currency exchange differences |
( |
) | ( |
) | ||||||||||||
|
|
|
|
|
|
|
|
|||||||||
( |
) | |||||||||||||||
|
|
|
|
|
|
|
|
|||||||||
Income tax expense recognized in profit or loss |
$ | $ | $ | |
$ | |
||||||||||
|
|
|
|
|
|
|
|
For the Year Ended December 31 |
||||||||||||||||
2020 |
2021 |
2022 |
||||||||||||||
NT$ |
NT$ |
NT$ |
US$ (Note 4) |
|||||||||||||
Profit before income tax |
$ | $ | $ | $ | ||||||||||||
|
|
|
|
|
|
|
|
|||||||||
Income tax expense calculated at the statutory rates |
$ | $ | $ | $ | ||||||||||||
Nontaxable expense (income) in determining taxable income |
( |
) | ( |
) | ||||||||||||
Tax-exempt income |
( |
) | ( |
) | ( |
) | ( |
) | ||||||||
Additional income tax on unappropriated earnings |
||||||||||||||||
Income tax credits |
( |
) | ( |
) | ( |
) | ( |
) | ||||||||
The origination and reversal of temporary differences |
( |
) | ||||||||||||||
Income tax adjustments on prior years |
( |
) | ( |
) | ( |
) | ( |
) | ||||||||
Unrecognized deferred tax liability for temporary differences associated with investments |
( |
) | ( |
) | ( |
) | ( |
) | ||||||||
Unrecognized loss carryforwards |
— | |||||||||||||||
Realized investment loss on merger of subsidiary |
( |
) | — | |||||||||||||
Withholding tax |
||||||||||||||||
Land value increment tax |
— | |||||||||||||||
Capital gains tax |
— | |||||||||||||||
|
|
|
|
|
|
|
|
|||||||||
Income tax expense recognized in profit or loss |
$ | $ | $ | $ | ||||||||||||
|
|
|
|
|
|
|
|
b. | Income tax recognized directly in equity |
For the Year Ended December 31 |
||||||||||||||||
2020 |
2021 |
2022 |
||||||||||||||
NT$ |
NT$ |
NT$ |
US$ (Note 4) |
|||||||||||||
Deferred income tax |
||||||||||||||||
Related to employee share options |
$ |
( |
) |
$ |
( |
) |
$ |
$ |
||||||||
|
|
|
|
|
|
|
|
c. | Income tax recognized in other comprehensive income |
For the Year Ended December 31 |
||||||||||||||||
2020 |
2021 |
2022 |
||||||||||||||
NT$ |
NT$ |
NT$ |
US$ (Note 4) |
|||||||||||||
Deferred income tax |
||||||||||||||||
Related to remeasurement of defined benefit plans |
$ |
$ |
( |
) |
$ |
( |
) |
$ |
( |
) | ||||||
Unrealized loss on equity instruments at fair value through other comprehensive income |
( |
) |
( |
) |
||||||||||||
|
|
|
|
|
|
|
|
|||||||||
Income tax recognized in other comprehensive income |
$ |
( |
) |
$ |
( |
) |
$ |
$ |
||||||||
|
|
|
|
|
|
|
|
d. | Current tax assets and liabilities |
December 31 |
||||||||||||
2021 |
2022 |
|||||||||||
NT$ |
NT$ |
US$ (Note 4) |
||||||||||
Current tax assets |
||||||||||||
Tax refund receivable |
$ | $ | $ | |||||||||
Prepaid income tax |
||||||||||||
|
|
|
|
|
|
|||||||
$ | $ | $ | ||||||||||
|
|
|
|
|
|
|||||||
Current tax liabilities |
||||||||||||
Income tax payable |
$ | $ | $ | |||||||||
|
|
|
|
|
|
e. | Deferred tax assets and liabilities |
Balance at January 1 |
Recognized in Profit or Loss |
Recognized in Other Comprehensive Income |
Recognized in Equity |
Exchange Differences |
Acquisitions through Business Combinations |
Disposal of Subsidiaries |
Balance at December 31 |
|||||||||||||||||||||||||
NT$ |
NT$ |
NT$ |
NT$ |
NT$ |
NT$ |
NT$ |
NT$ |
|||||||||||||||||||||||||
Deferred tax assets |
||||||||||||||||||||||||||||||||
Temporary differences |
||||||||||||||||||||||||||||||||
Property, plant and equipment |
$ | $ | $ | — | $ | — | $ | $ | $ | ( |
) | $ | ||||||||||||||||||||
Defined benefit obligation |
( |
) | — | — | ||||||||||||||||||||||||||||
FVTPL financial instruments |
( |
) | — | — | ( |
) | ( |
) | ||||||||||||||||||||||||
Others |
— | ( |
) | ( |
) | ( |
) | |||||||||||||||||||||||||
|
|
|
|
|
|
|
|
|
|
|
|
|
|
|
|
|||||||||||||||||
( |
) | ( |
) | ( |
) | |||||||||||||||||||||||||||
Loss carry-forward |
( |
) | — | — | ( |
) | ( |
) | ||||||||||||||||||||||||
Investment credits |
( |
) | — | — | ( |
) | — | — | ||||||||||||||||||||||||
|
|
|
|
|
|
|
|
|
|
|
|
|
|
|
|
|||||||||||||||||
$ | $ | $ | $ | ( |
) | $ | ( |
) | $ | $ | ( |
) | $ | |||||||||||||||||||
|
|
|
|
|
|
|
|
|
|
|
|
|
|
|
|
|||||||||||||||||
Deferred tax liabilities |
||||||||||||||||||||||||||||||||
Temporary differences |
||||||||||||||||||||||||||||||||
Property, plant and equipment |
$ | $ | $ | — | $ | — | $ | ( |
) | $ | $ | — | $ | |||||||||||||||||||
FVTPL financial instruments |
( |
) | — | — | — | — | ||||||||||||||||||||||||||
Others |
( |
) | ( |
) | ||||||||||||||||||||||||||||
|
|
|
|
|
|
|
|
|
|
|
|
|
|
|
|
|||||||||||||||||
$ | $ | $ | $ | $ | ( |
) | $ | $ | ( |
) | $ | |||||||||||||||||||||
|
|
|
|
|
|
|
|
|
|
|
|
|
|
|
|
Balance at January 1 |
Recognized in Profit or Loss |
Recognized in Other Comprehensive Income |
Recognized in Equity |
Exchange Differences |
Disposal of Subsidiaries |
Balance at December 31 |
||||||||||||||||||||||
NT$ |
NT$ |
NT$ |
NT$ |
NT$ |
NT$ |
NT$ |
||||||||||||||||||||||
Deferred tax assets |
||||||||||||||||||||||||||||
Temporary differences |
||||||||||||||||||||||||||||
Property, plant and equipment |
$ | $ | ( |
) | $ | — | $ | — | $ | ( |
) | $ | ( |
) | $ | |||||||||||||
Defined benefit obligation |
( |
) | ( |
) | — | ( |
) | — | ||||||||||||||||||||
FVTPL financial instruments |
— | — | ( |
) | — | |||||||||||||||||||||||
Others |
— | ( |
) | ( |
) | |||||||||||||||||||||||
|
|
|
|
|
|
|
|
|
|
|
|
|
|
|||||||||||||||
( |
) | ( |
) | ( |
) | ( |
) | |||||||||||||||||||||
Loss carry-forward |
— | — | ( |
) | ( |
) | ||||||||||||||||||||||
Investment credits |
( |
) | — | — | ( |
) | — | |||||||||||||||||||||
|
|
|
|
|
|
|
|
|
|
|
|
|
|
|||||||||||||||
$ | $ | $ | ( |
) | $ | ( |
) | $ | ( |
) | $ | ( |
) | $ | ||||||||||||||
|
|
|
|
|
|
|
|
|
|
|
|
|
|
|||||||||||||||
Deferred tax liabilities |
||||||||||||||||||||||||||||
Temporary differences |
||||||||||||||||||||||||||||
Property, plant and equipment |
$ | $ | $ | — | $ | — | $ | ( |
) | $ | ( |
) | $ | |||||||||||||||
FVTPL financial instruments |
— | — | ( |
) | — | |||||||||||||||||||||||
Others |
( |
) | ||||||||||||||||||||||||||
|
|
|
|
|
|
|
|
|
|
|
|
|
|
|||||||||||||||
$ | $ | $ | $ | $ | $ | ( |
) | $ | ||||||||||||||||||||
|
|
|
|
|
|
|
|
|
|
|
|
|
|
Balance at January 1 |
Recognized in Profit or Loss |
Recognized in Other Comprehensive Income |
Exchange Differences |
Balance at December 31 |
||||||||||||||||
NT$ |
NT$ |
NT$ |
NT$ |
NT$ |
||||||||||||||||
Deferred tax assets |
||||||||||||||||||||
Temporary differences |
||||||||||||||||||||
Property, plant and equipment |
$ |
$ |
$ |
— |
$ |
$ |
||||||||||||||
Defined benefit obligation |
( |
) |
( |
) |
||||||||||||||||
FVTPL financial instruments |
— |
|||||||||||||||||||
Others |
— |
|||||||||||||||||||
|
|
|
|
|
|
|
|
|
|
|||||||||||
( |
) |
|||||||||||||||||||
Loss carry-forward |
( |
) |
— |
|||||||||||||||||
Investment credits |
— |
|||||||||||||||||||
|
|
|
|
|
|
|
|
|
|
|||||||||||
$ |
$ |
$ |
( |
) |
$ |
$ |
||||||||||||||
|
|
|
|
|
|
|
|
|
|
|||||||||||
Deferred tax liabilities |
||||||||||||||||||||
Temporary differences |
||||||||||||||||||||
Property, plant and equipment |
$ |
$ |
$ |
— |
$ |
$ |
||||||||||||||
FVTPL financial instruments |
— |
|||||||||||||||||||
Others |
( |
) |
||||||||||||||||||
|
|
|
|
|
|
|
|
|
|
|||||||||||
$ |
$ |
$ |
( |
) |
$ |
$ |
||||||||||||||
|
|
|
|
|
|
|
|
|
|
Balance at January 1 |
Recognized in Profit or Loss |
Recognized in Other Comprehensive Income |
Exchange Differences |
Balance at December 31 |
||||||||||||||||
US$ (Note 4) |
US$ (Note 4) |
US$ (Note 4) |
US$ (Note 4) |
US$ (Note 4) |
||||||||||||||||
Deferred tax assets |
||||||||||||||||||||
Temporary differences |
||||||||||||||||||||
Property, plant and equipment |
$ |
$ |
$ |
— |
$ |
$ |
||||||||||||||
Defined benefit obligation |
( |
) |
( |
) |
||||||||||||||||
FVTPL financial instruments |
— |
|||||||||||||||||||
Others |
— |
|||||||||||||||||||
|
|
|
|
|
|
|
|
|
|
|||||||||||
( |
) |
|||||||||||||||||||
Loss carry-forward |
( |
) |
— |
|||||||||||||||||
Investment credits |
— |
|||||||||||||||||||
|
|
|
|
|
|
|
|
|
|
|||||||||||
$ |
$ |
$ |
( |
) |
$ |
$ |
||||||||||||||
|
|
|
|
|
|
|
|
|
|
|||||||||||
Deferred tax liabilities |
||||||||||||||||||||
Temporary differences |
||||||||||||||||||||
Property, plant and equipment |
$ |
$ |
$ |
— |
$ |
$ |
||||||||||||||
FVTPL financial instruments |
— |
|||||||||||||||||||
Others |
( |
) |
||||||||||||||||||
|
|
|
|
|
|
|
|
|
|
|||||||||||
$ |
$ |
$ |
( |
) |
$ |
$ |
||||||||||||||
|
|
|
|
|
|
|
|
|
|
f. | Items for which no deferred tax assets have been recognized for loss carry-forward, investment credits and deductible temporary differences |
December 31 |
||||||||||||
2021 |
2022 |
|||||||||||
NT$ |
NT$ |
US$ (Note 4) |
||||||||||
Loss carry-forward |
$ | $ | $ | |||||||||
Investment credits |
||||||||||||
Deductible temporary differences |
||||||||||||
|
|
|
|
|
|
|||||||
$ | $ | $ | ||||||||||
|
|
|
|
|
|
g. | Information about unused loss carry-forward, investment credits, tax-exemption and other tax reli ef |
Expiry Year |
NT$ |
US$ (Note 4) |
||||||
2023 |
$ | $ | ||||||
2024 |
||||||||
2025 |
||||||||
2026 |
||||||||
2027 and thereafter |
||||||||
|
|
|
|
|||||
$ | $ | |||||||
|
|
|
|
Tax Credit Source |
Remaining Creditable Amount |
Expiry Year | ||||||||
NT$ |
US$ (Note 4) |
|||||||||
Purchase of machinery and equipment |
$ | $ | ||||||||
Others |
||||||||||
|
|
|
|
|||||||
$ | $ | |||||||||
|
|
|
|
h. | Unrecognized deferred tax liabilities associated with investments |
i. | Income tax assessments |
27. |
EARNINGS PER SHARE |
For the Year Ended December 31 |
||||||||||||||||
2020 |
2021 |
2022 |
||||||||||||||
NT$ |
NT$ |
NT$ |
US$ (Note 4) |
|||||||||||||
Profit for the year attributable to owners of the Company |
$ | $ | $ | $ | ||||||||||||
Effect of potentially dilutive ordinary shares: |
||||||||||||||||
Potential ordinary shares of the subsidiary |
( |
) | ( |
) | ( |
) | ( |
) | ||||||||
|
|
|
|
|
|
|
|
|||||||||
Earnings used in the computation of diluted earnings per share |
$ | $ | $ | $ | ||||||||||||
|
|
|
|
|
|
|
|
For the Year Ended December 31 |
||||||||||||
2020 |
2021 |
2022 |
||||||||||
Weighted average number of ordinary shares in the computation of basic earnings per share |
||||||||||||
Effect of potentially dilutive ordinary shares |
||||||||||||
Employee share options |
||||||||||||
Employees’ compensation |
||||||||||||
Employee restricted stock awards |
— | |||||||||||
|
|
|
|
|
|
|||||||
Weighted average number of ordinary shares in the computation of diluted earnings per share |
||||||||||||
|
|
|
|
|
|
28. |
SHARE-BASED PAYMENT ARRANGEMENTS |
a. | Employee share option plans of the Company |
For the Year Ended December 31 |
||||||||||||||||||||||||
2020 |
2021 |
2022 |
||||||||||||||||||||||
Number of Options (In Thousands) |
Weighted Average Exercise Price Per Share (NT$) |
Number of Options (In Thousands) |
Weighted Average Exercise Price Per Share (NT$) |
Number of Options (In Thousands) |
Weighted Average Exercise Price Per Share (NT$) |
|||||||||||||||||||
Balance at January 1 |
$ | $ | $ | |||||||||||||||||||||
Options expired |
( |
) | ||||||||||||||||||||||
Options forfeited |
( |
) | ( |
) | ( |
) | ||||||||||||||||||
Options exercised |
( |
) | ( |
) | ( |
) | ||||||||||||||||||
|
|
|
|
|
|
|||||||||||||||||||
Balance at December 31 |
||||||||||||||||||||||||
|
|
|
|
|
|
|||||||||||||||||||
Options exercisable, end of year |
||||||||||||||||||||||||
|
|
|
|
|
|
Range of Exercise Price Per Share (NT$) |
Weighted Average Remaining Contractual Life (Years) |
|||||||
December 31, 2021 |
||||||||
ASE 5 th share options |
$ | |||||||
The Company 1 st share options |
||||||||
December 31, 2022 |
||||||||
ASE 5 th share options |
||||||||
The Company 1 st share options |
b. | Employee restricted stock awards plan of the Company |
For the Year Ended December 31 |
||||||||
2021 |
2022 |
|||||||
(in thousand shares) |
|||||||
Balance at January 1 |
||||||||
Stocks granted |
||||||||
Stocks unrestricted |
( |
) | ||||||
|
|
|
|
|||||
Balance at December 31 |
||||||||
|
|
|
|
c. | Employee share option plans of subsidiaries |
For the Year Ended December 31, 2020 |
||||||||
Number of Options (In Thousands) |
Weighted Average Exercise Price Per Share (US$) |
|||||||
Balance at January 1 |
$ | |||||||
Options forfeited |
( |
) | ||||||
Options exercised |
( |
) | ||||||
|
|
|||||||
Balance at December 31 |
||||||||
|
|
|||||||
Options exercisable, end of year |
||||||||
|
|
For the Year Ended December 31 |
||||||||||||||||||||||||
2020 |
2021 |
2022 |
||||||||||||||||||||||
Number of Options (In Thousands) |
Exercise Price Per Share (RMB) |
Number of Options (In Thousands) |
Exercise Price Per Share (RMB) |
Number of Options (In Thousands) |
Exercise Price Per Share (RMB) |
|||||||||||||||||||
Balance at January 1 |
$ | $ | $ | |||||||||||||||||||||
Options granted |
||||||||||||||||||||||||
Options expired |
( |
) | ||||||||||||||||||||||
Options forfeited |
( |
) | ( |
) | ( |
) | ||||||||||||||||||
Options exercised |
( |
) | ( |
) | ( |
) | ||||||||||||||||||
|
|
|
|
|
|
|||||||||||||||||||
Balance at December 31 |
||||||||||||||||||||||||
|
|
|
|
|
|
|||||||||||||||||||
Options exercisable, end of year |
||||||||||||||||||||||||
|
|
|
|
|
|
|||||||||||||||||||
Fair value of options granted (RMB) |
$ | $ | $ | |||||||||||||||||||||
|
|
|
|
|
|
Range of Exercise Price Per Share (RMB) |
Remaining Contractual Life (Years) |
|||||||
December 31, 2021 |
||||||||
2015 share options |
$ | |||||||
2019 share options |
||||||||
2020 share options |
||||||||
December 31, 2022 |
||||||||
2015 share options |
||||||||
2019 share options |
||||||||
2020 share options |
For the Year Ended December 31, 2022 |
||||||||
Number of Options (In Thousands) |
Exercise Price Per Share (NT$) |
|||||||
Balance at January 1 |
$ | |||||||
Options granted |
||||||||
|
|
|||||||
Balance at December 31 |
||||||||
|
|
|||||||
Options exercisable, end of year |
||||||||
|
|
|||||||
Weighted-average fair value of options granted ($) |
||||||||
|
|
Range of Exercise Price Per Share |
Remaining Contractual Life (Years) |
|||||||
December 31, 2022 |
||||||||
2022 share options |
$ |
d. | Employee restricted stock plans of subsidiaries |
For the Year Ended December 31 |
||||||||||||||||||||||||
2020 |
2021 |
2022 |
||||||||||||||||||||||
Number of Options (In Thousands) |
Exercise Price Per Share (RMB) |
Number of Options (In Thousands) |
Exercise Price Per Share (RMB) |
Number of Options (In Thousands) |
Exercise Price Per Share (RMB) |
|||||||||||||||||||
Balance at January 1 |
$ | $ | $ | |||||||||||||||||||||
Options granted |
||||||||||||||||||||||||
Options expired |
( |
) | ||||||||||||||||||||||
Options exercised |
( |
) | ( |
) | ( |
) | ||||||||||||||||||
Options forfeited |
— | — | ( |
) | ( |
) | ||||||||||||||||||
|
|
|
|
|
|
|||||||||||||||||||
Balance at December 31 |
||||||||||||||||||||||||
|
|
|
|
|
|
|||||||||||||||||||
Options exercisable, end of year |
||||||||||||||||||||||||
|
|
|
|
|
|
|||||||||||||||||||
Fair value of options granted (RMB) |
$ | $ | $ | |||||||||||||||||||||
|
|
|
|
|
|
Range of Exercise Price Per Share (RMB) |
Remaining Contractual Life (Years) |
|||||||
December 31, 2021 |
||||||||
2019 restricted stocks |
$ | |||||||
2020 restricted stocks |
— | |||||||
2021 restricted stocks |
— | |||||||
December 31, 2022 |
||||||||
2019 restricted stocks |
||||||||
2021 restricted stocks |
— |
e. | Fair value information |
2020 share options plan |
2022 share options plan |
2022 share options plan after capital reduction | ||||
Share price at the grant date |
RMB |
NT$ |
NT$ | |||
Exercise price |
RMB |
NT$ |
NT$ | |||
Expected volatility (%) |
||||||
Expected lives (years) |
||||||
Expected dividend yield |
— | — | — | |||
Risk free interest rate (%) |
2020 restricted stocks plan |
2021 restricted stocks plan | |||
Share price at the grant date |
RMB |
RMB | ||
Exercise price |
(Note) | (Note) | ||
Expected volatility (%) |
||||
Lock-up periods (years) |
||||
Expected dividend yield |
— | — | ||
Risk free interest rate (%) |
Note: | The restricted stock s plan is to transfer ordinary shares for free upon satisfaction of certain performance conditions prior to the expiration. |
29. |
BUSINESS COMBINATIONS |
a. | Subsidiaries acquired |
Principal Activity |
Date of Acquisition |
Proportion of Voting Equity Interests Acquired (%) |
Consideration Transferred |
|||||||||
NT$ |
||||||||||||
FAFG |
|
$ |
||||||||||
ITGEU |
|
$ |
||||||||||
SER |
|
$ |
||||||||||
|
|
b. | Consideration Transferred |
FAFG |
ITGEU |
SER |
||||||||||
NT$ |
NT$ |
NT$ |
||||||||||
Cash |
$ | $ | $ | |||||||||
Equity instrument issued |
— | — | ||||||||||
Contingent consideration arrangement |
( |
) | — | — | ||||||||
|
|
|
|
|
|
|||||||
Fair value of identifiable net assets acquired |
$ | $ | |
$ | |
|||||||
|
|
|
|
|
|
c. | Assets acquired and liabilities assumed at the date of acquisition |
FAFG |
ITGEU |
SER |
||||||||||
NT$ |
NT$ |
NT$ |
||||||||||
Assets |
||||||||||||
Cash and cash equivalents |
$ | |
$ | $ | ||||||||
Trade and other receivables |
||||||||||||
Inventories |
— | |||||||||||
Property, plant and equipment |
||||||||||||
Intangible assets |
||||||||||||
Others |
||||||||||||
Liabilities |
||||||||||||
Trade and other payables |
( |
) | ( |
) | ( |
) | ||||||
Borrowings and bonds payables |
( |
) | — | — | ||||||||
Others |
( |
) | ( |
) | ( |
) | ||||||
|
|
|
|
|
|
|||||||
Fair value of identifiable net assets acquired |
$ | $ | $ | |||||||||
|
|
|
|
|
|
d. | Non-controlling interest |
e. | Goodwill recognized on acquisitions or gain recognized in bargain purchase transaction |
FAFG |
ITGEU |
SER |
||||||||||
NT$ |
NT$ |
NT$ |
||||||||||
Consideration transferred |
$ | $ | $ | |||||||||
Add: Non-controlling interests |
— | — | ||||||||||
Less: Fair value of identifiable net assets acquired |
( |
) | ( |
) | ( |
) | ||||||
|
|
|
|
|
|
|||||||
Goodwill recognized on acquisition (gain recognized in bargain purchase transaction) |
$ | $ | ( |
) | $ | — | ||||||
|
|
|
|
|
|
f. | Net cash outflow (inflow) on acquisition of subsidiaries |
FAFG |
ITGEU |
SER |
||||||||||
NT$ |
NT$ |
NT$ |
||||||||||
Consideration transferred |
$ | $ | $ | |||||||||
Less: Cash and cash equivalent acquired |
( |
) | ( |
) | ( |
) | ||||||
|
|
|
|
|
|
|||||||
Net cash outflow (inflow) on acquisition of subsidiaries |
$ | $ | ( |
) | $ | |
||||||
|
|
|
|
|
|
g. | Impact of acquisitions on the results of the Group |
FAFG (for the period from December 1, 2020 through December 31, 2020) |
ITGEU (for the period from October 21, 2021 through December 31, 2021) |
SER (for the period from November 2, 2021 through December 31, 2021) |
||||||||||
NT$ |
NT$ |
NT$ |
||||||||||
Operating revenue |
$ | $ | $ | |||||||||
|
|
|
|
|
|
|||||||
Net profit (loss) |
$ | $ | ( |
) | $ | ( |
) | |||||
|
|
|
|
|
|
h. | As of December 31, 2021, the Group has completed the identification of the difference between the cost of the investment and the Group’s share of FAFG’s net fair value of identifiable assets and liabilities, and has retrospectively adjusted the comparative consolidated financial statements as of and for the year ended December 31, 2020. As of December 31, 2020, the retrospective adjustments are summarized as follows: |
December 31, 2020 |
||||||||
After Retrospectively Adjusted |
Before Retrospectively Adjusted |
|||||||
NT$ |
NT$ |
|||||||
Consolidated balance sheet |
||||||||
Inventories |
$ | $ | ||||||
|
|
|
|
|||||
Financial assets at fair value through profit or loss – non-current |
$ | $ | ||||||
|
|
|
|
|||||
Property, plant and equipment |
$ | $ | ||||||
|
|
|
|
|||||
Right-of-use |
$ | $ | ||||||
|
|
|
|
|||||
Goodwill |
$ | $ | ||||||
|
|
|
|
|||||
Other intangible assets |
$ | $ | ||||||
|
|
|
|
|||||
Deferred tax liabilities |
$ | $ | ||||||
|
|
|
|
|||||
Non-controlling interests |
$ | $ | ||||||
|
|
|
|
30. |
DISPOSAL OF SUBSIDIARIES |
a. | Analysis of assets and liabilities on the date control was lost |
2020 |
2021 |
|||||||
SF |
GAPT Holding and ASEKS |
|||||||
NT$ |
NT$ |
|||||||
Current Assets |
||||||||
Cash and cash equivalent |
$ | $ | ||||||
Trade and other receivables |
||||||||
Inventories |
||||||||
Other current assets |
||||||||
Non-Current Assets |
||||||||
Property, plant and equipment |
||||||||
Right-of-use |
||||||||
Investment property |
— | |||||||
Goodwill |
— | |||||||
Deferred tax assets |
||||||||
Other non-current assets |
||||||||
Current Liabilities |
||||||||
Short-term borrowings |
— | ( |
) | |||||
Trade and other payables |
( |
) | ( |
) | ||||
Current portion of long-term borrowings |
( |
) | — | |||||
Other current liabilities |
( |
) | ( |
) | ||||
Non-Current Liabilities |
||||||||
Long-term borrowings |
( |
) | — | |||||
Deferred tax liabilities |
( |
) | ( |
) | ||||
Lease liabilities – non-current |
— | ( |
) | |||||
Other non-current liabilities |
— | ( |
) | |||||
|
|
|
|
|||||
Net assets disposed of |
$ | |
$ | |
||||
|
|
|
|
b. | Gain on disposal of subsidiaries |
2020 |
2021 |
|||||||
SF |
GAPT Holding and ASEKS |
|||||||
NT$ |
NT$ |
|||||||
Total consideration (paid in cash) |
$ | $ | ||||||
Net assets disposed of |
( |
) | ( |
) | ||||
Reclassification of accumulated exchange difference from equity to profit or loss due to the loss of control |
( |
) | ||||||
|
|
|
|
|||||
Gain on disposals |
$ | $ | ||||||
|
|
|
|
c. | Net cash inflow on disposals of subsidiaries |
2020 |
2021 |
|||||||
SF |
GAPT Holding and ASEKS |
|||||||
NT$ |
NT$ |
|||||||
Consideration received in cash and cash equivalents |
$ | |
$ | |||||
Less: Cash and cash equivalent balances disposed of |
( |
) | ( |
) | ||||
Other receivables (the outstanding receivables of consideration, net of relevant expenditure) |
( |
) | ( |
) | ||||
|
|
|
|
|||||
$ | $ | |||||||
|
|
|
|
31. |
EQUITY TRANSACTION WITH NON-CONTROLLING INTERESTS |
a. | USISH |
b. | USIPL |
c. | USIE |
32. |
CASH FLOW INFORMATION |
a. | Non-cash investing activities |
For the Year Ended December 31 |
||||||||||||||||
2020 |
2021 |
2022 |
||||||||||||||
NT$ |
NT$ |
NT$ |
US$ (Note 4) |
|||||||||||||
Payments for property, plant and equipment |
||||||||||||||||
Purchase of property, plant and equipment |
$ | $ | $ | $ | ||||||||||||
Increase (decrease) in other non-current assets |
( |
) | ( |
) | ||||||||||||
Decrease (increase) in other payables |
( |
) | ( |
) | ( |
) | ||||||||||
Capitalized borrowing costs |
( |
) | ( |
) | ( |
) | ( |
) | ||||||||
|
|
|
|
|
|
|
|
|||||||||
$ | $ | $ | $ | |||||||||||||
|
|
|
|
|
|
|
|
|||||||||
Proceeds from disposal of property, plant and equipment |
||||||||||||||||
Consideration from disposal of property, plant and equipment |
$ | $ | $ | $ | ||||||||||||
Decrease (increase) in other non-current assets |
— | ( |
) | |||||||||||||
Decrease (increase) in other receivables |
( |
) | ||||||||||||||
|
|
|
|
|
|
|
|
|||||||||
$ | $ | $ | $ | |||||||||||||
|
|
|
|
|
|
|
|
b. | Changes in liabilities arising from financing activities |
Short-term Borrowings (including financial liabilities for hedging) |
Bonds Payable |
Long-term Borrowings |
Lease Liabilities |
Total |
||||||||||||||||
NT$ |
NT$ |
NT$ |
NT$ |
NT$ |
||||||||||||||||
Balance at January 1, 2020 |
$ | $ | $ | $ | $ | |||||||||||||||
Net financing cash flows |
( |
) | ( |
) | ( |
) | ( |
) | ||||||||||||
Interest under operating activities |
— | — | — | |||||||||||||||||
Rent expense under operating activities |
— | — | — | ( |
) | ( |
) | |||||||||||||
Non-cash changes |
||||||||||||||||||||
Additions to lease liabilities |
— | — | — | |||||||||||||||||
Amortization of issuance cost |
— | — | ||||||||||||||||||
Lease modifications |
— | — | — | ( |
) | ( |
) | |||||||||||||
Short-term borrowings transferred to long-term borrowings |
( |
) | — | — | — | |||||||||||||||
Adjustments for government subsidy |
— | — | — | |||||||||||||||||
Acquisition of subsidiaries (Note 29) |
— | — | ||||||||||||||||||
Disposal of subsidiaries (Note 30) |
— | — | ( |
) | ( |
) | ( |
) | ||||||||||||
Effects of foreign currency exchange |
( |
) | — | ( |
) | ( |
) | ( |
) | |||||||||||
|
|
|
|
|
|
|
|
|
|
|||||||||||
Balance at December 31, 2020 |
$ | $ | $ | $ | $ | |||||||||||||||
|
|
|
|
|
|
|
|
|
|
|||||||||||
For the year ended December 31, 2021 |
| |||||||||||||||||||
Short-term Borrowings (including financial liabilities for hedging) |
Bonds Payable |
Long-term Borrowings (including financial liabilities for hedging) |
Lease Liabilities |
Total |
||||||||||||||||
NT$ |
NT$ |
NT$ |
NT$ |
NT$ |
||||||||||||||||
Balance at January 1, 2021 |
$ | $ | $ | $ | $ | |||||||||||||||
Net financing cash flows |
( |
) | ( |
) | ||||||||||||||||
Interest under operating activities |
— | — | — | |||||||||||||||||
Rent expense under operating activities |
— | — | — | ( |
) | ( |
) | |||||||||||||
Equity components of convertible bonds and embedded derivative liability |
— | ( |
) | — | — | ( |
) | |||||||||||||
Non-cash changes |
||||||||||||||||||||
Additions to lease liabilities |
— | — | — | |||||||||||||||||
Amortization of issuance cost |
— | — | ||||||||||||||||||
Convertible bonds issued by subsidiaries and converted to ordinary shares |
— | ( |
) | — | — | ( |
) | |||||||||||||
Lease modifications |
— | — | — | ( |
) | ( |
) | |||||||||||||
Acquisition of subsidiaries (Note 29) |
— | — | — | |||||||||||||||||
Disposal of subsidiaries (Note 30) |
( |
) | — | — | ( |
) | ( |
) | ||||||||||||
Reclassification |
— | — | — | |||||||||||||||||
Effects of foreign currency exchange |
( |
) | ( |
) | ( |
) | ( |
) | ||||||||||||
|
|
|
|
|
|
|
|
|
|
|||||||||||
Balance at December 31, 2021 |
$ | $ | $ | $ | $ | |||||||||||||||
|
|
|
|
|
|
|
|
|
|
Short-term Borrowings (including financial liabilities for hedging) |
Bonds Payable |
Long-term Borrowings (including financial liabilities for hedging) |
Lease Liabilities |
Total |
||||||||||||||||
NT$ |
NT$ |
NT$ |
NT$ |
NT$ |
||||||||||||||||
Balance at January 1, 2022 |
$ | $ | $ | $ | $ | |||||||||||||||
Net financing cash flows |
( |
) | ( |
) | ( |
) | ( |
) | ||||||||||||
Interest under operating activities |
— | — | — | |||||||||||||||||
Rent expense under operating activities |
— | — | — | ( |
) | ( |
) | |||||||||||||
Equity components of convertible bonds and embedded derivative liability |
— | ( |
) | — | — | ( |
) | |||||||||||||
Non-cash changes |
||||||||||||||||||||
Additions to lease liabilities |
— | — | — | |||||||||||||||||
Amortization of issuance cost |
— | — | ||||||||||||||||||
Convertible bonds issued by subsidiaries and converted to ordinary shares |
— | ( |
) | — | — | ( |
) | |||||||||||||
Lease modifications |
— | — | — | ( |
) | ( |
) | |||||||||||||
Adjustments for government subsidy |
— | — | ( |
) | — | ( |
) | |||||||||||||
Long-term borrowings transferred to short-term borrowings |
— | ( |
) | — | — | |||||||||||||||
Effects of foreign currency exchange |
||||||||||||||||||||
|
|
|
|
|
|
|
|
|
|
|||||||||||
Balance at December 31, 2022 |
$ | $ | $ | $ | $ | |||||||||||||||
|
|
|
|
|
|
|
|
|
|
|||||||||||
Short-term Borrowings (including financial liabilities for hedging) |
Bonds Payable |
Long-term Borrowings (including financial liabilities for hedging) |
Lease Liabilities |
Total |
||||||||||||||||
US$ (Note 4) |
US$ (Note 4) |
US$ (Note 4) |
US$ (Note 4) |
US$ (Note 4) |
||||||||||||||||
Balance at January 1, 2022 |
$ | $ | $ | $ | $ | |||||||||||||||
Net financing cash flows |
( |
) | ( |
) | ( |
) | ( |
) | ||||||||||||
Interest under operating activities |
— | — | — | |||||||||||||||||
Rent expense under operating activities |
— | — | — | ( |
) | ( |
) | |||||||||||||
Equity components of convertible bonds and embedded derivative liability |
— | ( |
) | — | — | ( |
) | |||||||||||||
Non-cash changes |
||||||||||||||||||||
Additions to lease liabilities |
— | — | — | |||||||||||||||||
Amortization of issuance cost |
— | — | ||||||||||||||||||
Convertible bonds issued by subsidiaries and converted to ordinary shares |
— | ( |
) | — | — | ( |
) | |||||||||||||
Lease modifications |
— | — | — | ( |
) | ( |
) | |||||||||||||
Adjustments for government subsidy |
— | — | ( |
) | — | ( |
) | |||||||||||||
Long-term borrowings transferred to short-term borrowings |
— | ( |
) | — | — | |||||||||||||||
Effects of foreign currency exchange |
||||||||||||||||||||
|
|
|
|
|
|
|
|
|
|
|||||||||||
Balance at December 31, 2022 |
$ | $ | $ | $ | $ | |||||||||||||||
|
|
|
|
|
|
|
|
|
|
c. |
Total taxes paid |
For the Year Ended December 31 |
||||||||||||||||
2020 |
2021 |
2022 |
||||||||||||||
NT$ |
NT$ |
NT$ |
US$ (Note 4) |
|||||||||||||
Operating activities |
$ | $ | $ | $ | ||||||||||||
Investing activities |
— | |||||||||||||||
|
|
|
|
|
|
|
|
|||||||||
$ | |
$ | |
$ | |
$ | |
|||||||||
|
|
|
|
|
|
|
|
33. |
CAPITAL MANAGEMENT |
34. |
FINANCIAL INSTRUMENTS |
a. | Fair value of financial instruments that are not measured at fair value |
1) | Fair value of financial instruments not measured at fair value but for which fair value is disclosed |
Carrying Amount |
Fair Value |
|||||||||||||||
NT$ |
US$ (Note 4) |
NT$ |
US$ (Note 4) |
|||||||||||||
December 31, 2021 |
$ | $ | ||||||||||||||
December 31, 2022 |
$ | $ |
2) | Fair value hierarchy |
b. | Fair value of financial instruments that are measured at fair value on a recurring basis |
1) | Fair value hierarchy |
Level 1 |
Level 2 |
Level 3 |
Total |
|||||||||||||
NT$ |
NT$ |
NT$ |
NT$ |
|||||||||||||
December 31, 2021 |
||||||||||||||||
Financial assets at FVTPL |
||||||||||||||||
Derivative financial assets |
||||||||||||||||
Swap contracts |
$ | — | $ | $ | — | $ | ||||||||||
Forward exchange contracts |
— | — | ||||||||||||||
Call option and put option of convertible bonds |
— | — | ||||||||||||||
Target redemption forward contracts |
— | — | ||||||||||||||
Non-derivative financial assets |
||||||||||||||||
Quoted ordinary shares |
— | — | ||||||||||||||
Private-placement funds |
— | — | ||||||||||||||
Contingent considerations |
— | — | ||||||||||||||
Unquoted preferred shares |
— | — | ||||||||||||||
Open-end mutual funds |
— | — | ||||||||||||||
|
|
|
|
|
|
|
|
|||||||||
$ | $ | $ | $ | |||||||||||||
|
|
|
|
|
|
|
|
|||||||||
Financial assets at FVTOCI |
||||||||||||||||
Investments in equity instruments |
||||||||||||||||
Unquoted ordinary shares |
$ | — | $ | — | $ | $ | ||||||||||
Quoted ordinary shares |
— | — | ||||||||||||||
Unquoted preferred shares |
— | — |
Level 1 |
Level 2 |
Level 3 |
Total |
|||||||||||||
NT$ |
NT$ |
NT$ |
NT$ |
|||||||||||||
Limited partnership |
$ |
— |
$ |
— |
$ |
$ |
||||||||||
Investments in debt instruments |
||||||||||||||||
Unsecured subordinate corporate bonds |
— |
— |
||||||||||||||
Trade receivables, net |
— |
— |
||||||||||||||
|
|
|
|
|
|
|
|
|||||||||
$ |
$ |
— |
$ |
$ |
||||||||||||
|
|
|
|
|
|
|
|
|||||||||
Financial liabilities at FVTPL |
||||||||||||||||
Derivative financial liabilities |
||||||||||||||||
Swap contracts |
$ |
— |
$ |
$ |
— |
$ |
||||||||||
Forward exchange contracts |
— |
— |
||||||||||||||
|
|
|
|
|
|
|
|
|||||||||
$ |
— |
$ |
$ |
— |
$ |
|||||||||||
|
|
|
|
|
|
|
|
|||||||||
December 31, 2022 |
||||||||||||||||
Financial assets at FVTPL |
||||||||||||||||
Derivative financial assets |
||||||||||||||||
Swap contracts |
$ |
— |
$ |
$ |
— |
$ |
||||||||||
Forward exchange contracts |
— |
— |
||||||||||||||
Non-derivative financial assets |
||||||||||||||||
Quoted ordinary shares |
— |
— |
||||||||||||||
Private-placement funds |
— |
— |
||||||||||||||
Unquoted preferred shares |
— |
— |
||||||||||||||
Contingent considerations |
— |
— |
||||||||||||||
Open-end mutual funds |
— |
— |
||||||||||||||
|
|
|
|
|
|
|
|
|||||||||
$ |
$ |
$ |
$ |
|||||||||||||
|
|
|
|
|
|
|
|
|||||||||
Financial assets at FVTOCI |
||||||||||||||||
Investments in equity instruments |
||||||||||||||||
Unquoted ordinary shares |
$ |
— |
$ |
— |
$ |
$ |
||||||||||
Quoted ordinary shares |
— |
— |
||||||||||||||
Unquoted preferred shares |
— |
— |
||||||||||||||
Limited partnership |
— |
— |
||||||||||||||
Investments in debt instruments |
||||||||||||||||
Unsecured subordinate corporate bonds |
— |
— |
||||||||||||||
Trade receivables, net |
— |
— |
||||||||||||||
|
|
|
|
|
|
|
|
|||||||||
$ |
$ |
— |
$ |
$ |
||||||||||||
|
|
|
|
|
|
|
|
|||||||||
Financial liabilities at FVTPL |
||||||||||||||||
Derivative financial liabilities |
||||||||||||||||
Swap contracts |
$ |
— |
$ |
$ |
— |
$ |
||||||||||
Forward exchange contracts |
— |
— |
||||||||||||||
|
|
|
|
|
|
|
|
|||||||||
$ |
— |
$ |
$ |
— |
$ |
|||||||||||
|
|
|
|
|
|
|
|
Level 1 |
Level 2 |
Level 3 |
Total |
|||||||||||||
US$ (Note 4) |
US$ (Note 4) |
US$ (Note 4) |
US$ (Note 4) |
|||||||||||||
December 31, 2022 |
||||||||||||||||
Financial assets at FVTPL |
||||||||||||||||
Derivative financial assets |
||||||||||||||||
Swap contracts |
$ | — | $ | $ | — | $ | ||||||||||
Forward exchange contracts |
— | — | ||||||||||||||
Non-derivative financial assets |
||||||||||||||||
Quoted ordinary shares |
— | — | ||||||||||||||
Private-placement funds |
— | — | ||||||||||||||
Unquoted preferred shares |
— | — | ||||||||||||||
Contingent considerations |
— | — | ||||||||||||||
Open-end mutual funds |
— |
— |
||||||||||||||
|
|
|
|
|
|
|
|
|||||||||
$ | |
$ | |
$ | $ | |
||||||||||
|
|
|
|
|
|
|
|
|||||||||
Financial assets at FVTOCI |
||||||||||||||||
Investments in equity instruments |
||||||||||||||||
Unquoted ordinary shares |
$ | — | $ | — | $ | $ | ||||||||||
Quoted ordinary shares |
— | — | ||||||||||||||
Unquoted preferred shares |
— | — | ||||||||||||||
Limited partnership |
— | — | ||||||||||||||
Investments in debt instruments |
||||||||||||||||
Unsecured subordinate corporate bonds |
— | — | ||||||||||||||
Trade receivables, net |
— | — | ||||||||||||||
|
|
|
|
|
|
|
|
|||||||||
$ | $ | — | $ | |
$ | |||||||||||
|
|
|
|
|
|
|
|
|||||||||
Financial liabilities at FVTPL |
||||||||||||||||
Derivative financial liabilities |
||||||||||||||||
Swap contracts |
$ | — | $ | $ | — | $ | ||||||||||
Forward exchange contracts |
— | — | ||||||||||||||
|
|
|
|
|
|
|
|
|||||||||
$ | — | $ | $ | — | $ | |||||||||||
|
|
|
|
|
|
|
|
2) | Reconciliation of Level 3 fair value measurements of financial assets |
Financial Assets at FVTPL |
Financial Assets at FVTOCI |
|||||||||||||||||||
Financial Assets |
Equity Instruments |
Debt Instruments |
Equity Instruments |
Debt Instruments |
Total |
|||||||||||||||
NT$ |
NT$ |
NT$ |
NT$ |
NT$ |
||||||||||||||||
Balance at January 1 |
$ |
$ |
— |
$ |
$ |
$ |
||||||||||||||
Recognized in profit or loss |
( |
) |
— |
— |
— |
( |
) | |||||||||||||
Recognized in other comprehensive income |
||||||||||||||||||||
Included in unrealized losses on financial assets at FVTOCI |
— |
— |
( |
) |
( |
) |
( |
) | ||||||||||||
Effects of foreign currency exchange |
( |
) |
— |
( |
) |
— |
( |
) | ||||||||||||
Net increase in trade receivables |
— |
— |
||||||||||||||||||
Trade receivables factoring |
— |
( |
) |
— |
( |
) |
( |
) | ||||||||||||
Purchases |
— |
— |
||||||||||||||||||
Disposals |
( |
) |
— |
( |
) |
— |
( |
) | ||||||||||||
Acquisition through business combinations |
— |
— |
— |
|||||||||||||||||
Exercise of call option |
( |
) |
— |
— |
— |
( |
) | |||||||||||||
|
|
|
|
|
|
|
|
|
|
|||||||||||
Balance at December 31 |
$ |
$ |
— |
$ |
$ |
$ |
||||||||||||||
|
|
|
|
|
|
|
|
|
|
Financial Assets at FVTPL |
Financial Assets at FVTOCI |
|||||||||||||||||||
Financial Assets |
Equity Instruments |
Debt Instruments |
Equity Instruments |
Debt Instruments |
Total |
|||||||||||||||
NT$ |
NT$ |
NT$ |
NT$ |
NT$ |
||||||||||||||||
Balance at January 1 |
$ |
$ |
— |
$ |
$ |
$ |
||||||||||||||
Recognized in profit or loss |
— |
— |
— |
|||||||||||||||||
Recognized in other comprehensive income |
||||||||||||||||||||
Included in unrealized gains on financial assets at FVTOCI |
— |
— |
||||||||||||||||||
Effects of foreign currency exchange |
( |
) |
— |
( |
) |
— |
( |
) | ||||||||||||
Net increase in trade receivables |
— |
— |
||||||||||||||||||
Trade receivables factoring |
— |
( |
) |
— |
( |
) |
( |
) | ||||||||||||
Purchases |
— |
— |
||||||||||||||||||
Disposals |
( |
) |
— |
( |
) |
— |
( |
) | ||||||||||||
Reclassify |
— |
— |
( |
) |
— |
( |
) | |||||||||||||
|
|
|
|
|
|
|
|
|
|
|||||||||||
Balance at December 31 |
$ |
$ |
— |
$ |
$ |
$ |
||||||||||||||
|
|
|
|
|
|
|
|
|
|
|||||||||||
For the year ended December 31, 2022 |
| |||||||||||||||||||
Financial Assets at FVTPL |
Financial Assets at FVTOCI |
|||||||||||||||||||
Financial Assets |
Equity Instruments |
Debt Instruments |
Equity Instruments |
Debt Instruments |
Total |
|||||||||||||||
NT$ |
NT$ |
NT$ |
NT$ |
NT$ |
||||||||||||||||
Balance at January 1 |
$ |
$ |
— |
$ |
$ |
$ |
||||||||||||||
Recognized in profit or loss |
— |
— |
||||||||||||||||||
Recognized in other comprehensive income |
||||||||||||||||||||
Included in unrealized losses on financial assets at FVTOCI |
— |
— |
( |
) |
( |
) |
( |
) | ||||||||||||
Effects of foreign currency exchange |
— |
— |
||||||||||||||||||
Net increase (decrease) in trade receivables |
— |
— |
( |
) |
||||||||||||||||
Trade receivables factoring |
— |
( |
) |
— |
( |
) |
( |
) | ||||||||||||
Purchases |
— |
|||||||||||||||||||
Disposals |
( |
) |
( |
) |
( |
) |
— |
( |
) | |||||||||||
|
|
|
|
|
|
|
|
|
|
|||||||||||
Balance at December 31 |
$ |
$ |
— |
$ |
$ |
$ |
||||||||||||||
|
|
|
|
|
|
|
|
|
|
|||||||||||
Financial Assets at FVTPL |
Financial Assets at FVTOCI |
|||||||||||||||||||
Financial Assets |
Equity Instruments |
Debt Instruments |
Equity Instruments |
Debt Instruments |
Total |
|||||||||||||||
US$ (Note 4) |
US$ (Note 4) |
US$ (Note 4) |
US$ (Note 4) |
US$ (Note 4) |
||||||||||||||||
Balance at January 1 |
$ |
$ |
— |
$ |
$ |
$ |
||||||||||||||
Recognized in profit or loss |
— |
— |
||||||||||||||||||
Recognized in other comprehensive income |
||||||||||||||||||||
Included in unrealized losses on financial assets at FVTOCI |
— |
— |
( |
) |
( |
) |
( |
) | ||||||||||||
Effects of foreign currency exchange |
— |
— |
||||||||||||||||||
Net increase (decrease) in trade receivables |
— |
— |
( |
) |
||||||||||||||||
Trade receivables factoring |
— |
( |
) |
— |
( |
) |
( |
) | ||||||||||||
Purchases |
— |
|||||||||||||||||||
Disposals |
( |
) |
( |
) |
( |
) |
— |
( |
) | |||||||||||
|
|
|
|
|
|
|
|
|
|
|||||||||||
Balance at December 31 |
$ |
$ |
— |
$ |
$ |
$ |
||||||||||||||
|
|
|
|
|
|
|
|
|
|
3) | Valuation techniques and assumptions applied for the purpose of measuring fair value |
a) | Valuation techniques and inputs applied for the purpose of measuring Level 2 fair value measurement |
Financial Instruments |
Valuation Techniques and Inputs | |
Derivatives - swap contracts and forward exchange contracts |
Discounted cash flows - Future cash flows are estimated based on observable forward exchange rates at balance sheet dates and contract forward exchange rates, discounted at rates that reflected the credit risk of various counterparties. | |
Derivatives - redemption option and put option of convertible bonds |
Option pricing models - Use of present value techniques and reflect the time value and intrinsic value of redemption option and put option. | |
Target redemption forward contracts |
Valuation based on the spot exchange rate on the valuation date, the exercise price, the volatility in exchange rate, the contract period and the quoted risk free interest rate during the contract period. |
b) | Valuation techniques and inputs applied for the purpose of measuring Level 3 fair value measurement |
c. | Categories of financial instruments |
December 31 |
||||||||||||
2021 |
2022 |
|||||||||||
NT$ |
NT$ |
US$ (Note 4) |
||||||||||
Financial assets |
||||||||||||
FVTPL |
||||||||||||
Mandatorily at FVTPL |
$ | $ | $ | |||||||||
Measured at amortized cost (Note 1) |
||||||||||||
FVTOCI |
||||||||||||
Equity instruments |
||||||||||||
Debt instruments |
||||||||||||
Trade receivables, net |
||||||||||||
Financial liabilities |
||||||||||||
FVTPL |
||||||||||||
Held for trading |
||||||||||||
Financial liabilities for hedging |
||||||||||||
Measured at amortized cost (Note 2) |
Note 1: |
The balances included financial assets measured at amortized cost which comprised cash and cash equivalents, trade and other receivables and other financial assets. | |
Note 2: |
The balances included financial liabilities measured at amortized cost which comprised short-term borrowings, trade and other payables, bonds payable and long-term borrowings. |
d. | Financial risk management objectives and policies |
1) | Market risk |
a) | Foreign currency exchange rate risk |
Hedging Instrument/ |
Line item in |
Carrying Amount |
||||||||
Hedged Items |
Balance sheet |
Asset |
Liability |
|||||||
NT$ |
NT$ |
|||||||||
Fair value hedge |
||||||||||
Borrowings denominated in foreign currencies/ Financial assets at FVTPL |
Financial liabilities for hedging - current |
$ | — | $ | ||||||
Hedge of net investment in foreign operation |
Financial liabilities for hedging - current |
— | ||||||||
Hedge of net investment in foreign operation |
Financial liabilities for hedging - non-current |
— |
Change in Value Used for Calculating Hedge Ineffectiveness |
Accumulated Gains or Losses in Other Equity |
Carrying Amount of Hedged Item in Fair Value Hedge |
Accumulated Amount of Fair Value Hedge Adjustments on Hedged Item |
|||||||||||||||||||||
Hedging Instrument/ Hedged Item |
Hedging Instrument |
Hedged Item |
Continuing Hedges |
Hedge Accounting No Longer Applied |
Asset |
Asset |
||||||||||||||||||
NT$ |
NT$ |
NT$ |
NT$ |
NT$ |
NT$ |
|||||||||||||||||||
Fair value hedge |
||||||||||||||||||||||||
Borrowings denominated in foreign currencies/ Financial assets at FVTPL |
$ | $ | ( |
) | $ | — | $ | — | $ | $ | ( |
) | ||||||||||||
Hedge of net investment in foreign operation |
( |
) | — | — | — |
Hedging Instrument/ |
Line item in |
Carrying Amount |
||||||||||||||||
Hedged Items |
Balance sheet |
Asset |
Liability |
|||||||||||||||
NT$ |
US$ (Note 4) |
NT$ |
US$ (Note 4) |
|||||||||||||||
Fair value hedge |
||||||||||||||||||
Borrowings denominated in foreign currencies/ Financial assets at FVTPL |
Financial liabilities for hedging - current |
$ | — | $ | — | $ | $ | |||||||||||
Hedge of net investment in foreign operation |
Financial liabilities for hedging - current |
— | — |
Change in Value Used for Calculating Hedge Ineffectiveness |
Accumulated Gains or Losses in Other Equity |
Carrying Amount of Hedged Item in Fair Value Hedge |
Accumulated Amount of Fair Value Hedge Adjustments on Hedged Item |
|||||||||||||||||||||
Hedging Instrument/ Hedged Item |
Hedging Instrument |
Hedged Item |
Continuing Hedges |
Hedge Accounting No Longer Applied |
Asset |
Asset |
||||||||||||||||||
NT$ |
NT$ |
NT$ |
NT$ |
NT$ |
NT$ |
|||||||||||||||||||
Fair value hedge |
||||||||||||||||||||||||
Borrowings denominated in foreign currencies/ Financial assets at FVTPL |
$ | ( |
) | $ | $ | — | $ | — | $ | $ | ||||||||||||||
Hedge of net investment in foreign operation |
( |
) | — | — | — | |||||||||||||||||||
Change in Value Used for Calculating Hedge Ineffectiveness |
Accumulated Gains or Losses in Other Equity |
Carrying Amount of Hedged Item in Fair Value Hedge |
Accumulated Amount of Fair Value Hedge Adjustments on Hedged Item |
|||||||||||||||||||||
Hedging Instrument/ Hedged Item |
Hedging Instrument |
Hedged Item |
Continuing Hedges |
Hedge Accounting No Longer Applied |
Asset |
Asset |
||||||||||||||||||
US$ (Note 4) |
US$ (Note 4) |
US$ (Note 4) |
US$ (Note 4) |
US$ (Note 4) |
US$ (Note 4) |
|||||||||||||||||||
Fair value hedge |
||||||||||||||||||||||||
Borrowings denominated in foreign currencies/ Financial assets at FVTPL |
$ | ( |
) | $ | $ | — | $ | — | $ | $ | ||||||||||||||
Hedge of net investment in foreign operation |
( |
) | — | — | — |
b) | Interest rate risk |
December 31 |
||||||||||||
2021 |
2022 |
|||||||||||
NT$ |
NT$ |
US$ (Note 4) |
||||||||||
Fair value interest rate risk |
||||||||||||
Financial assets |
$ | $ | $ | |||||||||
Financial liabilities |
||||||||||||
Cash flow interest rate risk |
||||||||||||
Financial assets |
||||||||||||
Financial liabilities |
c) | Other price risk |
2) | Credit risk |
3) | Liquidity risk |
On Demand or Less than 1 Month |
1 to 3 Months |
3 Months to 1 Year |
1 to 5 Years |
More than 5 Years |
||||||||||||||||
NT$ |
NT$ |
NT$ |
NT$ |
NT$ |
||||||||||||||||
Non-derivative financial liabilities |
||||||||||||||||||||
Non-interest bearing |
$ |
$ |
$ |
$ |
$ |
|||||||||||||||
Obligation under leases |
||||||||||||||||||||
Floating interest rate liabilities |
||||||||||||||||||||
Fixed interest rate liabilities |
||||||||||||||||||||
|
|
|
|
|
|
|
|
|
|
|||||||||||
$ |
$ |
$ |
$ |
$ |
||||||||||||||||
|
|
|
|
|
|
|
|
|
|
Less than 1 Year |
1 to 5 Years |
5 to 10 Years |
10 to 15 Years |
15 to 20 Years |
More than 20 Years |
|||||||||||||||||||
NT$ |
NT$ |
NT$ |
NT$ |
NT$ |
NT$ |
|||||||||||||||||||
Obligation under leases |
$ |
$ |
$ |
$ |
$ |
$ |
||||||||||||||||||
|
|
|
|
|
|
|
|
|
|
|
|
On Demand or Less than 1 Month |
1 to 3 Months |
3 Months to 1 Year |
1 to 5 Years |
More than 5 Years |
||||||||||||||||
NT$ |
NT$ |
NT$ |
NT$ |
NT$ |
||||||||||||||||
Non-derivative financial liabilities |
||||||||||||||||||||
Non-interest bearing |
$ |
$ |
$ |
$ |
$ |
|||||||||||||||
Obligation under leases |
||||||||||||||||||||
Floating interest rate liabilities |
||||||||||||||||||||
Fixed interest rate liabilities |
||||||||||||||||||||
|
|
|
|
|
|
|
|
|
|
|||||||||||
$ |
$ |
$ |
$ |
$ |
||||||||||||||||
|
|
|
|
|
|
|
|
|
|
On Demand or Less than 1 Month |
1 to 3 Months |
3 Months to 1 Year |
1 to 5 Years |
More than 5 Years |
||||||||||||||||
US$ (Note 4) |
US$ (Note 4) |
US$ (Note 4) |
US$ (Note 4) |
US$ (Note 4) |
||||||||||||||||
Non-derivative financial liabilities |
||||||||||||||||||||
Non-interest bearing |
$ |
$ |
$ |
$ |
$ |
|||||||||||||||
Obligation under leases |
||||||||||||||||||||
Floating interest rate liabilities |
||||||||||||||||||||
Fixed interest rate liabilities |
||||||||||||||||||||
|
|
|
|
|
|
|
|
|
|
|||||||||||
$ |
$ |
$ |
$ |
$ |
||||||||||||||||
|
|
|
|
|
|
|
|
|
|
Less than 1 Year |
1 to 5 Years |
5 to 10 Years |
10 to 15 Years |
15 to 20 Years |
More than 20 Years |
|||||||||||||||||||
NT$ |
NT$ |
NT$ |
NT$ |
NT$ |
NT$ |
|||||||||||||||||||
Obligation under leases |
$ |
$ |
$ |
$ |
$ |
$ |
||||||||||||||||||
|
|
|
|
|
|
|
|
|
|
|
|
Less than 1 Year |
1 to 5 Years |
5 to 10 Years |
10 to 15 Years |
15 to 20 Years |
More than 20 Years |
|||||||||||||||||||
US$ (Note 4) |
US$ (Note 4) |
US$ (Note 4) |
US$ (Note 4) |
US$ (Note 4) |
US$ (Note 4) |
|||||||||||||||||||
Obligation under leases |
$ |
$ |
$ |
$ |
$ |
$ |
||||||||||||||||||
|
|
|
|
|
|
|
|
|
|
|
|
On Demand or Less than 1 Month |
1 to 3 Months |
3 Months to 1 Year |
||||||||||
NT$ |
NT$ |
NT$ |
||||||||||
December 31, 2021 |
||||||||||||
Net settled |
||||||||||||
Forward exchange contracts |
$ | ( |
) | $ | ( |
) | $ | — | ||||
|
|
|
|
|
|
|||||||
Gross settled |
||||||||||||
Forward exchange contracts |
||||||||||||
Inflows |
$ | |
$ | |
$ | |
||||||
Outflows |
( |
) | ( |
) | ( |
) | ||||||
|
|
|
|
|
|
|||||||
|
|
|
|
|
|
|||||||
Swap contracts |
||||||||||||
Inflows |
||||||||||||
Outflows |
( |
) | ( |
) | ( |
) | ||||||
|
|
|
|
|
|
|||||||
( |
) | ( |
) | ( |
) | |||||||
|
|
|
|
|
|
|||||||
Target redemption forward contracts |
||||||||||||
Inflows |
||||||||||||
Outflows |
( |
) | ( |
) | ( |
) | ||||||
|
|
|
|
|
|
|||||||
|
|
|
|
|
|
|||||||
$ | ( |
) | $ | ( |
) | $ | ( |
) | ||||
|
|
|
|
|
|
|||||||
December 31, 2022 |
||||||||||||
Net settled |
||||||||||||
Forward exchange contracts |
$ | ( |
) | $ | $ | — | ||||||
|
|
|
|
|
|
|||||||
Gross settled |
||||||||||||
Forward exchange contracts |
||||||||||||
Inflows |
$ | $ | $ | |||||||||
Outflows |
( |
) | ( |
) | ( |
) | ||||||
|
|
|
|
|
|
|||||||
|
|
|
|
|
|
|||||||
Swap contracts |
||||||||||||
Inflows |
||||||||||||
Outflows |
( |
) | ( |
) | ( |
) | ||||||
|
|
|
|
|
|
|||||||
|
|
|
|
|
|
|||||||
$ | $ | $ | ||||||||||
|
|
|
|
|
|
On Demand or Less than 1 Month |
1 to 3 Months |
3 Months to 1 Year |
||||||||||
US$ (Note 4) |
US$ (Note 4) |
US$ (Note 4) |
||||||||||
December 31, 2022 |
||||||||||||
Net settled |
||||||||||||
Forward exchange contracts |
$ | ( |
) | $ | $ | — | ||||||
|
|
|
|
|
|
|||||||
Gross settled |
||||||||||||
Forward exchange contracts |
||||||||||||
Inflows |
$ | $ | $ | |||||||||
Outflows |
( |
) | ( |
) | ( |
) | ||||||
|
|
|
|
|
|
|||||||
|
|
|
|
|
|
|||||||
Swap contracts |
||||||||||||
Inflows |
||||||||||||
Outflows |
( |
) | ( |
) | ( |
) | ||||||
|
|
|
|
|
|
|||||||
|
|
|
|
|
|
|||||||
$ | $ | $ | ||||||||||
|
|
|
|
|
|
35. |
RELATED PARTY TRANSACTIONS |
a. | Related parties |
Related Parties |
Relationship with the Group | |
ASE Cultural and Educational Foundation |
Substantial related party | |
ASE Environmental Protection and Sustainability Foundation |
Substantial related party |
b. | Contribution of related party |
For the Year Ended December 31 |
||||||||||||||||
Relationship and Name of Related Party |
2020 |
2021 |
2022 |
|||||||||||||
NT$ |
NT$ |
NT$ |
US$ (Note 4) |
|||||||||||||
Substantial related party |
||||||||||||||||
ASE Environmental Protection and Sustainability Foundation |
$ | $ | $ | $ | ||||||||||||
ASE Cultural and Educational Foundation |
||||||||||||||||
|
|
|
|
|
|
|
|
|||||||||
$ | |
$ | |
$ | |
$ | |
|||||||||
|
|
|
|
|
|
|
|
c. |
ASE and HC entered into a joint development agreement in June 2020 under the concept of joint construction. The agreement stipulates that HC will build the plant on the leasehold land and ASE and its affiliates will have the priority to purchase the plant after the completion of the plant construction. The final transaction price will be the purchase price less an amount based on the ratio calculated by independent professional appraisers. |
d. |
ASE and ASEE entered into a joint construction and allocation of housing units agreement with HC, respectively, in August 2021. The agreement stipulates that ASE and ASEE will provide land and leasehold land and HC will provide fund for joint construction of plant and consult with professional appraisal firm to evaluate the allocation ratio of the value under joint construction. After the completion of the plant construction, ASE, ASEE and its affiliates will have the priority to purchase the property, which obtained by HC based on the agreed proportion of joint construction. Since the joint construction agreement between ASEE and HC has not yet started, therefore, the joint construction agreement was terminated by mutual consent of both parties, and the board of directors of ASEE decided to terminate the joint construction agreement in May 2022. |
e. |
In the third quarter of 2021, ASE purchased real estate properties from HC with an amount of NT$ |
f. |
ASE entered into a joint construction and allocation of housing units agreement with HC in April 2022. The agreement stipulates that ASE and HC will provide a part of land and fund, respectively, for joint construction of plant and consult with professional appraisal firm to evaluate the allocation ratio of the value under joint construction. After the completion of the plant construction, ASE will have the priority to purchase the property, which obtained by HC based on the agreed proportion of joint construction. |
g. |
Compensation to key management personnel |
For the Year Ended December 31 |
||||||||||||||||
2020 |
2021 |
2022 |
||||||||||||||
NT$ |
NT$ |
NT$ |
US$ (Note 4) |
|||||||||||||
Short-term employee benefits |
$ | $ | $ | $ | ||||||||||||
Post-employment benefits |
||||||||||||||||
Share-based payments |
||||||||||||||||
|
|
|
|
|
|
|
|
|||||||||
$ | $ | |
$ | |
$ | |
||||||||||
|
|
|
|
|
|
|
|
36. |
ASSETS PLEDGED AS COLLATERAL OR FOR SECURITY |
December 31 |
||||||||||||
2021 |
2022 |
|||||||||||
NT$ |
NT$ |
US$ (Note 4) |
||||||||||
Inventories related to real estate business |
$ | $ | $ | |||||||||
Property, plant and equipment |
||||||||||||
Investment properties |
||||||||||||
Other financial assets (including current and non-current) |
||||||||||||
|
|
|
|
|
|
|||||||
$ | $ | $ | ||||||||||
|
|
|
|
|
|
37. |
SIGNIFICANT CONTINGENT LIABILITIES AND UNRECOGNIZED COMMITMENTS |
a. | As of December 31, 2021 and 2022, unused letters of credit of the Group were approximately NT$ |
b. | As of December 31, 2021 and 2022, letters of bank guarantee provided to customs for the import and export of goods with bank facilities granted to the Group were approximately NT$ |
c. | As of December 31, 2021 and 2022, the Group’s commitments to purchase property, plant and equipment were approximately NT$ |
d. | The Group entered into long-term purchase agreements of materials and supplies with multiple suppliers. The relative minimum purchase quantity is specified in the agreements. |
e. |
The Group entered into long-term agreements with multiple customers. The relative minimum order quantity from customers and minimum purchase quantity of materials from suppliers are specified in the agreements. |
f. | In December 2022, in consideration of corporate social responsibility, the board of directors of ASE resolved the disbursements of NT$ fulfil the social responsibilities. l |
g. | In December 2013, in consideration of corporate social responsibility for environmental protection, the board of directors of ASE, approved the contributions of at least NT$ |
38. |
OTHERS |
a. | There were five employees and a waste disposal supplier of a subsidiary in China accused by China People’s Procuratorate (the “Procuratorate”) for committing the crime of environmental pollution in 2018. During the trial, the Procuratorate claimed that the subsidiary should also be charged with corporate crime which caused the subsidiary received a change and addition indictment in October 2019. In June 2020, in the first trial, the court of first instance ruled that the subsidiary shall be imposed a fine of RMB co-defendants have filed an appeal against the judgment and, pursuant to local applicable law, the whole case were deemed appealed. On April 7, 2021, the court of the second instance has issued a ruling to deny the appeal and to affirm the judgment of the first instance, and the case has been concluded. |
b. | On December 20, 2013, the Kaohsiung Environmental Protection Bureau (the “KEPB”) imposed an administrative fine of NT$ re-imposed an administrative fine of NT$ |
39. |
SIGNIFICANT SUBSEQUENT EVENTS |
40. |
SIGNIFICANT ASSETS AND LIABILITIES DENOMINATED IN FOREIGN CURRENCIES |
Foreign Currencies (In Thousand) |
Exchange Rate |
Carrying Amount (In Thousand) |
||||||||
December 31, 2021 |
||||||||||
Monetary financial assets |
||||||||||
US$ |
$ | $ | ||||||||
US$ |
||||||||||
US$ |
||||||||||
JPY |
||||||||||
JPY |
||||||||||
Monetary financial liabilities |
||||||||||
US$ |
||||||||||
US$ |
||||||||||
US$ |
||||||||||
JPY |
||||||||||
JPY |
||||||||||
December 31, 2022 |
||||||||||
Monetary financial assets |
||||||||||
US$ |
||||||||||
US$ |
||||||||||
US$ |
||||||||||
JPY |
||||||||||
JPY |
||||||||||
Monetary financial liabilities |
||||||||||
US$ |
||||||||||
US$ |
||||||||||
US$ |
||||||||||
JPY |
||||||||||
JPY |
For the Year Ended December 31 |
||||||||||||||||||||||
2020 |
2021 |
2022 |
||||||||||||||||||||
Functional Currencies |
Exchange Rate |
Net Foreign Exchange Gain (Loss) |
Exchange Rate |
Net Foreign Exchange Gain (Loss) |
Exchange Rate |
Net Foreign Exchange Gain (Loss) |
||||||||||||||||
NT$ |
NT$ |
NT$ |
US$ (Note 4) |
|||||||||||||||||||
US$ |
$ | ( |
) | $ | $ | ( |
) | $ | ( |
) | ||||||||||||
NT$ |
( |
) | ( |
) | ||||||||||||||||||
RMB |
( |
) | ( |
) | ||||||||||||||||||
|
|
|
|
|
|
|
|
|||||||||||||||
$ | $ | $ | ( |
) | $ | ( |
) | |||||||||||||||
|
|
|
|
|
|
|
|
4 1 . |
OPERATING SEGMENTS INFORMATION |
a. | Segment revenues and operation results |
Packaging |
Testing |
EMS |
Others |
Adjustments and Eliminations |
Total |
|||||||||||||||||||
NT$ |
NT$ |
NT$ |
NT$ |
NT$ |
NT$ |
|||||||||||||||||||
For the year ended December 31, 2020 |
||||||||||||||||||||||||
Revenue from external customers |
$ | $ | $ | $ | $ | — | $ | |||||||||||||||||
Inter-group revenues (Note 1) |
( |
) | — | |||||||||||||||||||||
Segment revenues |
— | |||||||||||||||||||||||
Interest income |
— | |||||||||||||||||||||||
Interest expense |
( |
) | ( |
) | ( |
) | ( |
) | — | ( |
) | |||||||||||||
Depreciation and amortization |
( |
) | ( |
) | ( |
) | ( |
) | — | ( |
) | |||||||||||||
Share of the profit or loss of associates and joint ventures |
— | — | ||||||||||||||||||||||
Impairment loss |
( |
) | ( |
) | — | — | — | ( |
) | |||||||||||||||
Segment profit before income tax |
( |
) | — | |||||||||||||||||||||
Expenditures for segment assets |
— | |||||||||||||||||||||||
December 31, 2020 |
||||||||||||||||||||||||
Investments accounted for using the equity method |
— | — | ||||||||||||||||||||||
Contract assets |
— | — | — | |||||||||||||||||||||
For the year ended December 31, 2021 |
||||||||||||||||||||||||
Revenue from external customers |
— | |||||||||||||||||||||||
Inter-group revenues (Note 1) |
( |
) | — | |||||||||||||||||||||
Segment revenues |
— | |||||||||||||||||||||||
Interest income |
— | |||||||||||||||||||||||
Interest expense |
( |
) | ( |
) | ( |
) | ( |
) | — | ( |
) | |||||||||||||
Depreciation and amortization |
( |
) | ( |
) | ( |
) | ( |
) | — | ( |
) | |||||||||||||
Share of the profit or loss of associates and joint ventures |
— | — | ||||||||||||||||||||||
Impairment loss |
( |
) | ( |
) | — | — | — | ( |
) | |||||||||||||||
Segment profit before income tax |
— | |||||||||||||||||||||||
Expenditures for segment assets |
— | |||||||||||||||||||||||
December 31, 2021 |
||||||||||||||||||||||||
Investments accounted for using the equity method |
— | — | ||||||||||||||||||||||
Contract assets |
— | — | — | |||||||||||||||||||||
For the year ended December 31, 2022 |
||||||||||||||||||||||||
Revenue from external customers |
$ | $ | $ | $ | $ | — | $ | |||||||||||||||||
Inter-group revenues (Note 1) |
( |
) | — | |||||||||||||||||||||
Segment revenues |
— | |||||||||||||||||||||||
Interest income |
— | |||||||||||||||||||||||
Interest expense |
( |
) | ( |
) | ( |
) | ( |
) | — | ( |
) | |||||||||||||
Depreciation and amortization |
( |
) | ( |
) | ( |
) | ( |
) | — | ( |
) | |||||||||||||
Share of the profit or loss of associates and joint ventures |
— | — | ||||||||||||||||||||||
Impairment loss |
( |
) | ( |
) | ( |
) | — | — | ( |
) | ||||||||||||||
Segment profit before income tax |
— | |||||||||||||||||||||||
Expenditures for segment assets |
— | |||||||||||||||||||||||
December 31, 2022 |
||||||||||||||||||||||||
Investments accounted for using the equity method |
— | — | ||||||||||||||||||||||
Contract assets |
— | — | — | |||||||||||||||||||||
Packaging |
Testing |
EMS |
Others |
Adjustments and Eliminations |
Total |
|||||||||||||||||||
US$ (Note 4) |
US$ (Note 4) |
US$ (Note 4) |
US$ (Note 4) |
US$ (Note 4) |
US$ (Note 4) |
|||||||||||||||||||
For the year ended December 31, 2022 |
||||||||||||||||||||||||
Revenue from external customers |
$ | $ | $ | $ | $ | — | $ | |||||||||||||||||
Inter-group revenues (Note 1) |
( |
) | — | |||||||||||||||||||||
Segment revenues |
— | |||||||||||||||||||||||
Interest income |
— | |||||||||||||||||||||||
Interest expense |
( |
) | ( |
) | ( |
) | ( |
) | — | ( |
) | |||||||||||||
Depreciation and amortization |
( |
) | ( |
) | ( |
) | ( |
) | — | ( |
) | |||||||||||||
Share of the profit or loss of associates and joint ventures |
— | — | ||||||||||||||||||||||
Impairment loss |
( |
) | ( |
) | ( |
) | — | — | ( |
) | ||||||||||||||
Segment profit before income tax |
— | |||||||||||||||||||||||
Expenditures for segment assets |
— | |||||||||||||||||||||||
December 31, 2022 |
||||||||||||||||||||||||
Investments accounted for using the equity method |
— | — | ||||||||||||||||||||||
Contract assets |
— | — | — |
Note 1: |
Inter-group revenues were eliminated upon consolidation. | |
Note 2: |
The disaggregated product and service type from the Group’s contract with customer is the same as those disclosed in above reportable segment. |
b. | Revenue from major products and services |
For the Year Ended December 31 |
||||||||||||||||
2020 |
2021 |
2022 |
||||||||||||||
NT$ |
NT$ |
NT$ |
US$ (Note 4) |
|||||||||||||
Packaging service |
$ | $ | $ | $ | ||||||||||||
Testing service |
||||||||||||||||
EMS |
||||||||||||||||
Others |
||||||||||||||||
|
|
|
|
|
|
|
|
|||||||||
$ | $ | $ | $ | |||||||||||||
|
|
|
|
|
|
|
|
c. | Geographical information |
1) | Net revenues from external customers |
For the Year Ended December 31 |
||||||||||||||||
2020 |
2021 |
2022 |
||||||||||||||
NT$ |
NT$ |
NT$ |
US$ (Note 4) |
|||||||||||||
United States |
$ | $ | $ | $ | ||||||||||||
Taiwan |
||||||||||||||||
Asia |
||||||||||||||||
Europe |
||||||||||||||||
Others |
||||||||||||||||
|
|
|
|
|
|
|
|
|||||||||
$ | $ | $ | $ | |||||||||||||
|
|
|
|
|
|
|
|
2) | Non-current assets |
December 31 |
||||||||||||
2021 |
2022 |
|||||||||||
NT$ |
NT$ |
US$ (Note 4) |
||||||||||
Taiwan |
$ | $ | $ | |||||||||
China |
||||||||||||
Others |
||||||||||||
|
|
|
|
|
|
|||||||
$ | $ | $ | ||||||||||
|
|
|
|
|
|
d. | Major customers |