Exhibit 99.1

Paris, July 29, 2019
Sanofi delivered solid growth in Q2 2019
|
Q2 2019
|
Change
|
Change at CER
|
H1 2019
|
Change
|
Change at CER
| |||||||
| IFRS net sales reported |
€8,628m | +5.5% | +3.9% | €17,019m | +5.9% | +4.1% | ||||||
| IFRS net income reported |
-€87m | -111.4%(2) | - | €1,050m | -40.9% | - | ||||||
| IFRS EPS reported
|
-€0.07 | -111.5%(2)
|
-
|
€0.84 | -40.8%
|
-
| ||||||
| Business net income(1) |
€1,641m | +5.3% | +4.9% | €3,406m | +7.9% | +7.0% | ||||||
| Business EPS(1)
|
€1.31 | +4.8%
|
+4.8%
|
€2.73 | +7.9%
|
+7.1%
| ||||||
|
Second-quarter 2019 sales growth(3) driven by Sanofi Genzyme, Sanofi Pasteur and Emerging Markets
• Net sales were €8,628 million, up 5.5% on a reported basis, up 3.9%(3) at CER and up 5.8% at CER/CS(4).
• Sanofi Genzyme sales up 21.8% due to strong launch performance of Dupixent®.
• Vaccines sales increased 24.7% mainly reflecting the recovery and growth of Pentaxim® in China and low basis for comparison.
• CHC sales up 1.1%, as U.S. growth more than offset lower sales in Europe impacted by non-strategic brand divestments.
• Primary Care GBU sales declined 10.4% at CER/CS mainly as a result of lower Diabetes sales.
• Emerging Markets sales(5) grew double-digits (up 10.0%) supported by higher Vaccines and Rare Disease sales.
2019 business EPS guidance revised upward
• Q2 2019 business net income increased 5.3% to €1,641 million and 4.9% at CER.
• Q2 2019 business EPS(1) up 4.8% at CER to €1.31.
• Q2 2019 IFRS EPS was -€0.07 (-115.5%) reflecting a €1.8 billion impairment charge mainly related to Eloctate®.
• Business EPS(1) in 2019 is now expected to grow approximately 5% at CER(6) barring unforeseen major adverse events. Applying the average July 2019 exchange rates, the currency impact on 2019 business EPS is estimated to be between 1% and 2%.
Key regulatory milestones achieved in R&D
• Isatuximab accepted for review by the FDA and EMA for approval in relapsed/refractory multiple myeloma.
• Libtayo® approved for advanced cutaneous squamous cell carcinoma in the EU.
• Dupixent® recommended by CHMP for atopic dermatitis in adolescents.
• Dupixent® approved in the U.S. for chronic rhinosinusitis with nasal polyposis.
• FDA accepted for review MenQuadfiTM, a meningococcal vaccine candidate.
|
|
Sanofi Chief Executive Officer, Olivier Brandicourt, commented: “Sanofi continued its growth phase with a solid business performance in the second quarter, led by the strong launch of Dupixent® driven by the accelerated uptake in atopic dermatitis and asthma in the U.S. Specialty Care and Vaccines were significant contributors across all geographies. Our increased focus in R&D delivered important results with several positive data read-outs and the achievement of regulatory milestones. We are confident in the growth outlook for the year. Consequently, we have revised upward our guidance for full-year business EPS growth to approximately 5%.”
|
(1) In order to facilitate an understanding of operational performance, Sanofi comments on the business net income statement. Business net income is a non-GAAP financial measure (see Appendix 10 for definitions). The consolidated income statement for Q2 2019 is provided in Appendix 3 and a reconciliation of reported IFRS net income to business net income is set forth in Appendix 4;(2) including a €1.8 billion impairment charge mainly related to Eloctate® – see page 12; (3) Changes in net sales are expressed at constant exchange rates (CER) unless otherwise indicated (see Appendix 10); (4) Constant Structure: Adjusted for divestment of European Generics business and sales of Bioverativ products to SOBI; (5) See definition page 9; (6) 2018 business EPS was €5.47.
|
Investor Relations: (+) 33 1 53 77 45 45 - E-mail: IR@sanofi.com - Media Relations: (+) 33 1 53 77 46 46 - E-mail: MR@sanofi.com Website: www.sanofi.com Mobile app: SANOFI IR available on the App Store and Google Play
|
1
2019 Second-quarter and first-half Sanofi sales
| Unless otherwise indicated, all percentage changes in sales in this press release are stated at CER(7). |
In the second quarter of 2019, Company sales were €8,628 million, up 5.5% on a reported basis. Exchange rate movements had a positive effect of 1.6 percentage points mainly driven by the U.S. dollar which largely offset the negative impact from the Argentine Peso and Turkish Lira. At CER, Company sales increased 3.9%.
First-half Company sales reached €17,019 million, up 5.9% on a reported basis. Exchange rate movements had a favorable effect of 1.8 percentage points. At CER, Company sales were up 4.1%.
Global Business Units
The table below presents sales by Global Business Unit (GBU). Please note that Emerging Markets sales for Specialty Care and Primary Care are included in the China & Emerging Markets GBU.
|
Net Sales by GBU
(€ million) |
Q2 2019
|
Change at CER
|
H1 2019
|
Change at CER
|
||||||||||||
|
Sanofi Genzyme (Specialty Care)(a) |
2,292 | +21.8% | 4,311 | +25.9%(c) | ||||||||||||
| Primary Care(a) |
2,281 | -15.7%(d) | 4,566 | -16.3%(e) | ||||||||||||
| China & Emerging Markets(b) |
1,891 | +7.0% | 3,849 | +8.7% | ||||||||||||
| Total Pharmaceuticals |
6,464 | +1.7% | 12,726 | +2.4% | ||||||||||||
| Consumer Healthcare (CHC) |
1,143 | +1.1% | 2,399 | +0.8% | ||||||||||||
| Sanofi Pasteur (Vaccines) |
1,021 | +24.7% | 1,894 | +22.5% | ||||||||||||
| Total net sales |
8,628 | +3.9% | 17,019 | +4.1%(f) | ||||||||||||
(a) Does not include China & Emerging Markets sales - see definition page 10; (b) Includes Emerging Markets sales for Primary Care and Specialty Care; (c) +18.6% at CS -Adjusted for Bioverativ acquisition and sales of Bioverativ products to SOBI –see page 5; (d) -10.4% at CS; (e) -11.1% at CS; (f) +4.8% at CS - Adjusted for Bioverativ and sales of Bioverativ products to SOBI and European Generics.
Global Franchises
The tables below present second-quarter and first-half 2019 sales by global franchise, including Emerging Markets sales, to facilitate comparisons. Appendix 1 provides a reconciliation of sales by GBU and franchise.
| Net sales by Franchise
(€ million)
|
Q2 2019
|
Change
at CER |
Developed
Markets |
Change at CER
|
Emerging
Markets |
Change
at CER |
||||||||||||||||||
| Specialty Care franchises |
2,620 | +22.9% | 2,292 | +21.8% | 328 | +30.0% | ||||||||||||||||||
| Rare Disease |
810 | +8.3% | 640 | +3.0% | 170 | +31.7% | ||||||||||||||||||
| Multiple Sclerosis |
540 | +2.8% | 522 | +2.9% | 18 | 0.0% | ||||||||||||||||||
| Oncology |
431 | +14.1% | 302 | +10.2% | 129 | +24.3% | ||||||||||||||||||
| Immunology |
548 | +166.3% | 541 | +164.1% | 7 | ns | ||||||||||||||||||
| Rare Blood Disorder |
291 | +7.8%(1) | 287 | +6.2%(2) | 4 | ns | ||||||||||||||||||
| Primary Care franchises |
3,844 | -8.7%(3) | 2,281 | -15.7%(4) | 1,563 | +3.1% | ||||||||||||||||||
| Established Rx Products(5) |
2,406 | -10.0%(6) | 1,275 | -18.2%(7) | 1,131 | +1.0% | ||||||||||||||||||
| Diabetes |
1,290 | -7.0% | 865 | -13.3% | 425 | +8.2% | ||||||||||||||||||
| Cardiovascular |
148 | -1.4% | 141 | -4.2% | 7 | +133.3% | ||||||||||||||||||
| Consumer Healthcare |
1,143 | +1.1% | 753 | +1.5% | 390 | +0.3% | ||||||||||||||||||
| Vaccines |
1,021 | +24.7% | 578 | +15.8% | 443 | +37.7% | ||||||||||||||||||
| Total net sales |
8,628 | +3.9%(8) | 5,904 | 1.2%(9) | 2,724 | +10.0% | ||||||||||||||||||
(1) +2.2 % at CS- see page 5; (2) +0.7% at CS- see page 5; (3) -5.2% at CS; (4)-10.4% at CS; (5) including Generics; (6) -4.5% at CS; (7) -8.9% at CS; (8) +5.8% at CS;(9) +3.8% at CS
(7) See Appendix 10 for definitions of financial indicators.
2
|
Net sales by Franchise (€ million)
|
H1 2019
|
Change at CER
|
Developed Markets
|
Change at CER
|
Emerging Markets
|
Change at CER
|
||||||||||||||||||
| Specialty Care franchises |
4,947 | +26.7%(1) | 4,311 | +25.9% | 636 | +31.8% | ||||||||||||||||||
| Rare Disease |
1,576 | +9.2% | 1,253 | +3.4% | 323 | +34.3% | ||||||||||||||||||
| Multiple Sclerosis |
1,069 | +4.3% | 1,029 | +3.7% | 40 | +18.9% | ||||||||||||||||||
| Oncology |
830 | +11.0% | 575 | +6.3% | 255 | +22.7% | ||||||||||||||||||
| Immunology |
907 | +173.8% | 897 | +171.5% | 10 | ns | ||||||||||||||||||
| Rare Blood Disorder |
565 | +65.4%(2) | 557 | +62.9%(3) | 8 | ns | ||||||||||||||||||
| Primary Care franchises |
7,779 | -8.5%(4) | 4,566 | -16.3%(5) | 3,213 | +4.9% | ||||||||||||||||||
| Established Rx Products(6) |
4,912 | -9.7%(7) | 2,582 | -18.5%(8) | 2,330 | +2.3% | ||||||||||||||||||
| Diabetes |
2,584 | -6.9% | 1,714 | -14.6% | 870 | +11.7% | ||||||||||||||||||
| Cardiovascular |
283 | -1.1% | 270 | -3.4% | 13 | +85.7% | ||||||||||||||||||
| Consumer Healthcare |
2,399 | +0.8% | 1,586 | -0.9% | 813 | +4.2% | ||||||||||||||||||
| Vaccines |
1,894 | +22.5% | 1,102 | +10.8% | 792 | +42.2% | ||||||||||||||||||
|
Total net sales
|
|
17,019
|
|
|
+4.1%(9)
|
|
|
11,565
|
|
|
+0.6%(10)
|
|
|
5,454
|
|
|
+11.8%
|
| ||||||
(1)+20.3 % at CS- Adjusted for Bioverativ and sales of products to SOBI – see page 5; (2) +1.7% at CS- see page 5; (3) +0.2% -see page 5; (4) -5.0% at CS; (5) -11.1% at CS; (6) including Generics; (7)-4.1% at CS; (8) -9.4% at CS; (9) +4.8% at CS- Adjusted for Bioverativ and sales of Bioverativ products to SOBI and European Generics;(10)+1.6% at CS - Adjusted for Bioverativ and sales of Bioverativ products to SOBI and European Generics
Pharmaceuticals
Second-quarter Pharmaceutical sales were up 1.7% to €6,464 million mainly driven by Dupixent® which was partially offset by Diabetes and Established Rx Products including the disposal of the European generics business. First-half sales for Pharmaceuticals increased 2.4% to €12,726 million.
Specialty Care franchises
Immunology franchise
|
Net sales (€ million)
|
Q2 2019
|
Change at CER
|
H1 2019
|
Change at CER
|
||||||||||||
| Dupixent® |
496 | +168.2% | 825 | +175.3% | ||||||||||||
| Kevzara® |
52 | +150.0% | 82 | +160.0% | ||||||||||||
|
Total Immunology
|
|
548
|
|
|
+166.3%
|
|
|
907
|
|
|
+173.8%
|
| ||||
Dupixent® (collaboration with Regeneron) generated sales of €496 million in the second quarter (up 168.2%). In the U.S., Dupixent® sales of €403 million (up 152.3%) were driven by continued growth in atopic dermatitis which benefited from launch in the adolescent age group (12 to 17 years of age) in mid-March and from rapid uptake in asthma. In Europe, second-quarter sales were €46 million (up 187.5%). First-half Dupixent® sales increased 175.3% to €825 million. Dupixent® has been launched in 28 countries as of the second quarter of 2019 with 11 more launches in atopic dermatitis and 7 in asthma planned over the remainder of 2019. The U.S. FDA approved Dupixent® for chronic rhinosinusitis with nasal polyposis on June 26, 2019.
Kevzara® (collaboration with Regeneron) sales were €52 million (up 150.0%) in the second quarter, of which €30 million was in the U.S. (up 86.7%) reflecting increased adoption and category share. First-half Kevzara® sales increased 160.0% to €82 million.
Multiple Sclerosis franchise
|
Net sales (€ million)
|
Q2 2019
|
Change at CER
|
H1 2019
|
Change at CER
|
||||||||||||
| Aubagio® |
466 | +10.6% | 903 | +11.2% | ||||||||||||
| Lemtrada® |
74 | -28.4% | 166 | -21.7% | ||||||||||||
|
Total Multiple Sclerosis
|
|
540
|
|
|
+2.8%
|
|
|
1,069
|
|
|
+4.3%
|
| ||||
Second-quarter Multiple Sclerosis (MS) sales increased 2.8% to €540 million driven by double-digit growth of Aubagio® in the U.S and Europe, partially offset by lower Lemtrada® sales. First-half MS sales increased 4.3% to €1,069 million.
3
Second-quarter Aubagio® sales increased 10.6% to €466 million, supported by the U.S. performance (up 10.5% to €336 million) and Europe (up 18.0% to €105 million). First-half Aubagio® sales increased 11.2% to €903 million.
In the second quarter, Lemtrada® sales decreased 28.4% to €74 million due to lower U.S. sales (down 13.0% to €42 million) and European sales (down 51.1% to €22 million), reflecting increased global competition and the update to the EU label. First-half Lemtrada® sales decreased 21.7% to €166 million.
Oncology franchise
| Net sales (€ million) | Q2 2019 |
Change at CER
|
H1 2019 |
Change at CER
| ||||||
| Jevtana® |
126 | +18.4% | 237 | +13.4% | ||||||
| Thymoglobulin® |
94 | +23.0% | 175 | +17.4% | ||||||
| Eloxatin® |
55 | +19.6% | 109 | +20.0% | ||||||
| Mozobil® |
49 | +9.1% | 93 | +9.8% | ||||||
| Taxotere® |
42 | 0.0% | 89 | +3.6% | ||||||
| Zaltrap® |
23 | -4.2% | 45 | -2.2% | ||||||
| Others |
42 | +10.8% | 82 | 0.0% | ||||||
| Total Oncology
|
431
|
+14.1%
|
830
|
+11.0%
| ||||||
Second-quarter Oncology sales increased 14.1% to €431 million driven by Emerging Markets (up 24.3% to €129 million) and the U.S. (up 12.7% to €150 million). First-half Oncology sales increased 11.0% to €830 million.
Jevtana® sales were up 18.4% to €126 million in the second quarter supported by the performance in the U.S. (up 18.6% to €54 million) and Europe (up 15.8% to €44 million). First-half Jevtana® sales increased 13.4% to €237 million. In the second quarter, Thymoglobulin® sales increased 23.0% to €94 million driven by Emerging Markets and the U.S. Eloxatin® sales grew 19.6% to €55 million driven by China. First-half sales of Thymoglobulin® and Eloxatin® increased 17.4% (to €175 million) and 20.0% (to €109 million), respectively.
Libtayo® (cemiplimab-rwlc, collaboration with Regeneron) was approved in the U.S. in September 2018 for the treatment of patients with metastatic cutaneous squamous cell carcinoma (CSCC) or locally advanced CSCC who are not candidates for curative surgery or curative radiation. U.S. Libtayo® sales are consolidated by Regeneron. Libtayo® was approved in Brazil at the end of March and in Canada in April. In July, Libtayo® was approved in the European Union for adult patients with metastatic or locally advanced CSCC who are not candidates for curative surgery or curative radiation.
Rare Disease franchise
| Net sales (€ million) | Q2 2019 |
Change at CER
|
H1 2019 |
Change at CER
| ||||||
| Myozyme® / Lumizyme® |
234 | +11.0% | 454 | +10.9% | ||||||
| Fabrazyme® |
211 | +9.6% | 396 | +7.8% | ||||||
| Cerezyme® |
187 | +5.5% | 363 | +5.9% | ||||||
| Aldurazyme® |
54 | +5.8% | 121 | +18.4% | ||||||
| Cerdelga® |
50 | +28.9% | 98 | +28.4% | ||||||
| Others Rare Disease |
74 | -4.0% | 144 | -0.7% | ||||||
| Total Rare Disease
|
810
|
+8.3%
|
1,576
|
+9.2%
| ||||||
In the second quarter, Rare Disease sales increased 8.3% to €810 million, driven by Emerging Markets (up 31.7% to €170 million). In the U.S., second-quarter Rare Disease sales grew 6.8% to €299 million. In Europe, sales were stable in the quarter at €256 million. First-half Rare Disease sales increased 9.2% to €1,576 million.
Second-quarter Gaucher (Cerezyme® and Cerdelga®) sales were up 9.6% to €237 million, supported by the increasing penetration of Cerdelga® in Europe and the U.S. and the sustained growth of Cerezyme® in Emerging Markets. Second-quarter Cerdelga® sales increased 28.9% to €50 million, with sales up 50% in Europe (to €18 million) and up 17.4% in the U.S. (to €29 million). First-half Gaucher sales were €461 million, up 9.8%.
Second-quarter Pompe (Myozyme®/Lumizyme®) sales grew 11.0% to €234 million, supported by positive trends in naïve patient accruals. This performance was driven by the U.S. (up 13.0% to €83 million) and Emerging Markets (up 36.7% to €39 million). First-half Myozyme®/Lumizyme® sales increased 10.9% to €454 million.
4
Second-quarter Fabry (Fabrazyme®) sales grew 9.6% to €211 million, reflecting strong performance in Emerging Markets (up 55.0% to €29 million). Over the period, U.S. sales increased 6.5% (to €105 million) and European sales were stable (at €45 million). First-half Fabrazyme® sales were up 7.8% to €396 million.
Rare Blood Disorder franchise
| Net sales (€ million) | Q2 2019 |
Change at CER
|
H1 2019 |
Change at CER
| ||||||
| Eloctate® |
|
171 | -8.0%* | 345 | +47.5%* | |||||
| Alprolix® |
105 | +23.5%** | 200 | +84.3%** | ||||||
| Cablivi® |
15 | - | 20 | - | ||||||
| Total Rare Blood Disorder |
291 | +7.8%*** | 565 | +65.4%*** | ||||||
*-11% at CS in Q2 2019 and -7.7% in H1 2019 at CS-see footnotes 8 and 9; **+12.4% at CS in Q2 2019 and +9.3% at CS in H1 2019 –see footnotes 8 and 9);
***+2.2% at CS in Q2 2019 and +1.7% in H1 2019 at CS-see footnotes 8 and 9
Bioverativ was consolidated in Sanofi’s Financial Statements from March 9, 2018. Second-quarter sales of the Rare Blood Disorder franchise were €291 million, up 2.2% at CS(8). Non U.S. sales were €71 million with Japan as the primary contributor. Consolidated first-half sales of the Rare Blood Disorder franchise were €565 million, up 1.7% at CS(9).
Eloctate® sales were €171 million in the second quarter, down 11.0% at CS(8). In the U.S., sales of the product decreased 16.4% to €135 million, reflecting ongoing competitive pressure. In the Rest of the World region, Eloctate® sales increased 6.9% at CS(8) to €32 million. First-half Eloctate® sales were €345 million, down 7.7% at CS(9).
Alprolix® sales were €105 million in the second quarter, up 12.4% at CS(8). In the U.S., sales of the product increased 4.5% to €74 million. In the Rest of the World region, Alprolix® sales increased 42.9% at CS(8) to €31 million due to growth in product sales to SOBI. First-half Alprolix® sales were €200 million, up 9.3% at CS(9).
Cablivi® (caplacizumab-yhdp) for the treatment of adults with acquired thrombotic thrombocytopenic purpura (aTTP), generated second-quarter sales of €15 million. In the U.S., where Cablivi® was launched on April 2, 2019, sales were €11 million. In Europe, where the product is commercially available in Germany, Denmark and Austria, sales were €4 million. Additional European launches are expected by year-end. First-half Cablivi® sales were €20 million.
Primary Care franchises
Cardiovascular franchise
| Net sales (€ million) | Q2 2019 |
Change at CER
|
H1 2019 |
Change at CER
| ||||||
| Praluent® |
|
66 | +3.2% | 122 | +6.3% | |||||
| Multaq® |
82 | -4.8% | 161 | -6.2% | ||||||
| Total cardiovascular franchise |
148 | -1.4% | 283 | -1.1% | ||||||
Second-quarter Praluent® (collaboration with Regeneron) sales increased 3.2% to €66 million, driven by growth in Europe (up 40.9% to €32 million). In the U.S., sales decreased 37.1% to €24 million, impacted by significantly higher rebates. As a result of negotiations to further improve patient access and affordability throughout 2019, lower average U.S. net pricing for Praluent® versus prior year is expected. First-half Praluent® sales increased 6.3% to €122 million.
In the Praluent® patent litigation in Germany, the Regional Court of Düsseldorf ruled on July 11, 2019 finding infringement and issued an injunction which requires Sanofi and Regeneron to stop marketing, selling, and manufacturing Praluent® in Germany. Sanofi and Regeneron appealed. Amgen enforced the injunction on July 19, 2019 and Sanofi and Regeneron complied. On July 23, 2019, the Higher Regional Court ordered a temporary stay of the injunction until it rules on the request by Sanofi and Regeneron for a stay of the injunction during the pendency of main appeal. Praluent® sales in Germany were €20 million in the first half of 2019.
(8) Sales of products to SOBI were initially recorded in “other revenues” in H1 2018” and in sales from H2 2018; H1 2018 sales were adjusted accordingly for calculation of CS. Unaudited data.
(9) Growth comparing first-half 2019 sales versus full first-half 2018 sales at CER. Sales of products to SOBI were initially recorded in “other revenues” in H1 2018” and in sales from H2 2018; H1 2018 sales were adjusted accordingly for calculation of CS. Unaudited data.
5
Diabetes franchise
| Net sales (€ million) | Q2 2019 |
Change at CER
|
H1 2019 |
Change at CER
|
||||||||||||
| Lantus® |
758 | -16.2% | 1,532 | -16.7% | ||||||||||||
| Toujeo® |
220 | -0.9% | 431 | +2.2% | ||||||||||||
| Total glargine |
978 | -13.2% | 1,963 | -13.2% | ||||||||||||
| Apidra® |
84 | -7.6% | 173 | -4.9% | ||||||||||||
| Amaryl® |
81 | -6.9% | 171 | 0.0% | ||||||||||||
| Admelog® |
77 | ns | 143 | ns | ||||||||||||
| Soliqua® |
28 | +64.7% | 50 | +84.6% | ||||||||||||
| Insuman® |
22 | -4.3% | 43 | -6.4% | ||||||||||||
| Total Diabetes |
1,290 | -7.0% | 2,584 | -6.9% | ||||||||||||
In the second quarter, global Diabetes sales decreased 7.0% to €1,290 million, due to lower glargine (Lantus® and Toujeo®) sales in the U.S. Second-quarter U.S. Diabetes sales were down 17.5% to €461 million, reflecting the increased contribution to the coverage gap related to Medicare Part D and a continued decline in average U.S. glargine net prices. Second-quarter sales in Emerging Markets increased 8.2% to €425 million. Second-quarter sales in Europe decreased 6.8% to €303 million despite Toujeo® growth (up 10.7%). First-half global Diabetes sales decreased 6.9% to €2,584 million.
In the second quarter, Lantus® sales were €758 million, down 16.2%. In the U.S., Lantus® sales decreased 33.7% to €284 million, mainly reflecting lower average net price and the increased contribution to the coverage gap related to Medicare Part D. In Europe, second-quarter Lantus® sales were €146 million, down 16.1% due to biosimilar glargine competition and patients switching to Toujeo®. In Emerging Markets, second-quarter Lantus® sales were up 14.3% to €272 million. First-half Lantus® sales decreased 16.7% to €1,532 million.
Second-quarter Toujeo® sales were €220 million, down 0.9%. In the U.S., second-quarter Toujeo® sales were €70 million, down 23.3% mainly reflecting lower average net price and the increased contribution to the coverage gap related to Medicare Part D. In Europe and Emerging Markets, second-quarter Toujeo® sales were €83 million (up 10.7%) and €45 million (up 24.3%), respectively. First-half Toujeo® sales increased 2.2% to €431 million.
Second-quarter Apidra® sales decreased 7.6% to €84 million. Lower sales in the U.S. (down 42.1% to €12 million) offset growth in Emerging Markets (up 14.8% to €30 million). First-half Apidra® sales decreased 4.9% to €173 million.
Second-quarter and first-half Amaryl® sales were €81 million (down 6.9%) and €171 million (stable), respectively.
Admelog® (insulin lispro injection) generated sales of €77 million in the second quarter of which €73 million were in the U.S. (versus €1 million in the second quarter of 2018) mainly due to access in Managed Medicaid. In the U.S., Admelog® sales are expected to be lower in the second half of 2019 due to WAC price adjustment of -44% as of July 1.
Second-quarter and first-half Soliqua® 100/33 (insulin glargine 100 Units/mL & lixisenatide 33 mcg/mL injection) and Suliqua™ sales increased 64.7% (to €28 million) and 84.6% (to €50 million), respectively.
Established Rx Products
| Net sales (€ million) | Q2 2019 |
Change at CER
|
H1 2019 |
Change at CER
|
||||||||||||
| Lovenox® |
347 | -8.0% | 690 | -9.9% | ||||||||||||
| Plavix® |
362 | -3.5% | 766 | -0.4% | ||||||||||||
| Aprovel®/Avapro® |
173 | +0.6% | 374 | +7.9% | ||||||||||||
| Synvisc® /Synvisc-One® |
87 | -9.8% | 155 | -8.1% | ||||||||||||
| Renvela®/Renagel® |
66 | -35.0% | 145 | -30.3% | ||||||||||||
| Myslee®/Ambien®/Stilnox® |
55 | -3.6% | 107 | -11.2% | ||||||||||||
| Allegra® |
26 | -7.1% | 82 | -2.5% | ||||||||||||
| Generics |
254 | -35.8% | 536 | -34.8% | ||||||||||||
| Other |
1,036 | -3.2% | 2,057 | -4.3% | ||||||||||||
| Total Established Rx Products |
2,406 | -10.0% | 4,912 | -9.7% | ||||||||||||
6
In the second quarter, Established Rx Products sales decreased 10.0% to €2,406 million, primarily reflecting the divestment of the European generics business Zentiva at the end of the third quarter of 2018. Excluding the generics divestment, Established Rx Products sales decreased 4.5% in the second quarter, reflecting generic competition to Renvela®/Renagel® (sevelamer) in the U.S. and lower Lovenox sales in Europe®. First-half Established Rx Products sales decreased 9.7% to €4,912 million (down 4.1% at CS).
Second-quarter Lovenox® sales decreased 8.0% to €347 million, reflecting lower Mature Markets sales (down 18.0% to €211 million) due to biosimilar competition in several countries in Europe. In Emerging Markets, Lovenox® sales grew 13.2% to €136 million. First-half Lovenox® sales were down 9.9% to €690 million.
In the second quarter, Plavix® sales decreased 3.5% to €362 million due to generic competition in Japan (sales down 19.0% to €36 million). In China, Plavix® sales were stable at €208 million, reflecting implementation of the volume based procurement program (VBP) in key cities at the beginning of the second quarter. The VBP program is expected to result in a decline in Plavix® sales in China over the remainder of 2019. First-half Plavix® sales decreased 0.4% to €766 million.
Second-quarter Aprovel®/Avapro® sales increased 0.6% to €173 million. In China, Aprovel®/Avapro® sales were stable at €75 million reflecting the implementation of the VBP program in key cities at the beginning of the second quarter. The VBP program is expected to result in a decline in Aprovel®/Avapro® sales in China over the remainder of 2019. Second-quarter Aprovel®/Avapro® sales continued to grow in the rest of Emerging Markets. First-half Aprovel®/Avapro® sales increased 7.9% to €374 million.
Second-quarter Renvela®/Renagel® (sevelamer) sales decreased 35.0% to €66 million, due to generic competition in the U.S. (down 65.0% to €22 million) and despite growth in China. First-half Renvela®/Renagel® sales decreased 30.3% to €145 million.
In the second quarter, Generics sales decreased 35.8% to €254 million, reflecting the divestment of the European generics business Zentiva at the end of the third quarter of 2018. At CS, second-quarter Generics sales increased 4.9% driven by the U.S. (up 60.0% to €42 million). In Emerging Markets, Generics sales decreased 5.8% to €155 million, due to lower sales in Africa and the Middle East region. First-half Generics sales were €536 million, down 34.8% and up 4.2% at CS.
Consumer Healthcare
CHC sales by geography and category are provided in Appendix 1.
|
Net sales (€ million)
|
Q2 2019
|
Change at CER
|
H1 2019
|
Change at CER
|
||||||||||||
| Allergy Cough & Cold |
249 | +1.7% | 611 | +2.8% | ||||||||||||
| of which Allegra® |
105 | +3.0% | 243 | +1.7% | ||||||||||||
| of which Mucosolvan® |
15 | -27.3% | 43 | -10.2% | ||||||||||||
| of which Xyzal® |
13 | +85.7% | 27 | +23.8% | ||||||||||||
| Pain |
308 | +1.6% | 630 | +2.1% | ||||||||||||
| of which Doliprane® |
77 | 0.0% | 156 | -3.1% | ||||||||||||
| of which Buscopan® |
50 | +10.0% | 98 | +4.8% | ||||||||||||
| Digestive |
277 | +10.1% | 548 | +9.1% | ||||||||||||
| of which Dulcolax® |
60 | +7.1% | 116 | +5.5% | ||||||||||||
| of which Enterogermina® |
54 | +20.0% | 115 | +22.3% | ||||||||||||
| of which Essentiale® |
50 | +8.7% | 99 | +12.4% | ||||||||||||
| of which Zantac® |
37 | +12.9% | 69 | +4.8% | ||||||||||||
| Nutritionals |
162 | -3.0% | 314 | -5.5% | ||||||||||||
| Other |
147 | -10.8% | 296 | -11.3% | ||||||||||||
| of which Gold Bond® |
48 | -6.3% | 100 | -4.1% | ||||||||||||
|
Total Consumer Healthcare
|
|
1,143
|
|
|
+1.1%
|
|
|
2,399
|
|
|
+0.8%
|
| ||||
In the second quarter, CHC sales increased 1.1% to €1,143 million, led by the U.S. In the first-half, Consumer Healthcare (CHC) sales growth of 0.8% to €2,399 million was impacted by strengthening regulatory requirements, particularly in Europe, as well as the continued effect of divestments. These factors are expected to have a dampening effect on CHC performance in 2019 and through the first part of 2020.
In Europe, second-quarter CHC sales decreased 2.8% to €314 million reflecting a continued weak Cough & Cold season, as well as divestments of non-strategic brands and strengthening regulatory requirements. First-half CHC sales in Europe were down 3.4% to €680 million.
7
In the U.S., second-quarter CHC sales increased 5.5% to €284 million driven by growth of the Allergy Cough & Cold (up 11.8%), Pain (up 12.2%) and Digestive (up 8.5%) categories which were partially offset by a lower performance of Gold Bond. In the U.S., first-half CHC sales increased 1.5% to €588 million.
In Emerging Markets, second-quarter CHC sales increased 0.3% to €390 million, reflecting growth in the Digestive (up 15.7%) category, partially offset by lower Allergy Cough & Cold, Pain and Nutritional categories. In the first half, Emerging Markets CHC sales increased 4.2% to €813 million.
Vaccines
|
Net sales (€ million)
|
Q2 2019
|
Change at CER
|
H1 2019
|
Change at CER
|
||||||||||||
| Polio/Pertussis/Hib vaccines
(incl. Hexaxim® / Hexyon®, Pentacel®, Pentaxim® and Imovax®) |
502 | +41.5% | 988 | +33.5% | ||||||||||||
| Travel and other endemic vaccines |
138 | +7.9% | 257 | +10.5% | ||||||||||||
| Meningitis/Pneumo vaccines
(incl. Menactra®) |
136 | +13.8% | 248 | +17.1% | ||||||||||||
| Adult Booster vaccines (incl. Adacel ®) |
134 | +38.3% | 234 | +22.0% | ||||||||||||
| Influenza vaccines
(incl. Vaxigrip®, Fluzone HD® & Fluzone®) |
85 | -10.2% | 117 | -5.5% | ||||||||||||
| Other vaccines |
26 | +4.3% | 50 | +12.2% | ||||||||||||
|
Total Vaccines
|
|
1,021
|
|
|
+24.7%
|
|
|
1,894
|
|
|
+22.5%
|
| ||||
Second-quarter Vaccines sales increased 24.7% to €1,021 million. This growth was driven by the strong performance of Polio/Pertussis/Hib vaccines in Emerging Markets (up 64.6% to €291 million), together with the timing of CDC purchases in the U.S. (up 20.4% to €337 million) and the performance of Boosters and Hexaxim® in Europe (up 20.1% to €161 million). First-half Vaccines sales were up 22.5% to €1,894 million.
In the second quarter, Polio/Pertussis/Hib (PPH) vaccines sales increased 41.5% to €502 million, driven by recovery and increased demand for Pentaxim® in China, coupled with favorable sales phasing and growth in other Emerging Markets. In the U.S., PPH sales increased 44.6% to €100 million helped by the low base for comparison in the second quarter of 2018, which resulted from the timing of CDC purchases. In Europe, PPH vaccines sales increased 14.7% to €78 million, driven by Hexaxim®. First-half PPH vaccines sales were up 33.5% to €988 million.
Second-quarter Travel and other endemic vaccines sales were €138 million up 7.9%, supported by Rabies vaccines. First-half Travel and other endemic vaccines sales were up 10.5% to €257 million.
Second-quarter Menactra® sales increased 13.8% to €136 million, driven by expansion in the Middle East. First-half Menactra® sales increased 17.1% to €248 million.
Second-quarter Adult Booster vaccines sales were up 38.3% to €134 million, reflecting strong performance of Repevax® in Europe and the low base for comparison of Adacel®in the U.S. in the second quarter of 2018, which resulted from the timing of CDC purchases. First-half Adult Booster vaccines sales increased 22.0% to €234 million.
Influenza vaccines sales decreased 10.2% (to €85 million) in the second quarter and decreased 5.5% (to €117 million) in the first half due to lower sales in the southern hemisphere campaign. Due to a delay in strain selection by the WHO, Sanofi expects influenza vaccine sales in the second half of 2019 to be significantly weighted towards the fourth quarter.
8
Company sales by geographic region
|
Sanofi sales (€ million)
|
Q2 2019
|
Change at CER
|
H1 2019
|
Change at CER
|
||||||||||||
| United States |
2,851 | +8.4% | 5,401 | +7.8% | ||||||||||||
| Emerging Markets(a) |
2,724 | +10.0% | 5,454 | +11.8% | ||||||||||||
| of which Asia |
1,132 | +13.5% | 2,338 | +15.7% | ||||||||||||
| of which Latin America |
690 | +12.3% | 1,305 | +8.5% | ||||||||||||
| of which Africa, Middle East |
553 | +1.7% | 1,109 | +6.6% | ||||||||||||
| of which Eurasia(b) |
322 | +13.4% | 634 | +17.6% | ||||||||||||
| Europe(c) |
2,164 | -7.5% | 4,351 | -8.4% | ||||||||||||
| Rest of the World(d) |
889 | +4.3% | 1,813 | +6.3% | ||||||||||||
| of which Japan |
465 | +2.6% | 997 | +7.7% | ||||||||||||
|
Total Sanofi sales
|
|
8,628
|
|
|
+3.9%
|
|
|
17,019
|
|
|
+4.1%
|
| ||||
| (a) | World excluding U.S., Canada, Western & Eastern Europe (except Eurasia), Japan, South Korea, Australia, New Zealand and Puerto Rico |
| (b) | Russia, Ukraine, Georgia, Belarus, Armenia and Turkey |
| (c) | Western Europe + Eastern Europe except Eurasia |
| (d) | Japan, South Korea, Canada, Australia, New Zealand, Puerto Rico |
Second-quarter sales in the U.S. increased 8.4% to €2,851 million, driven by Dupixent®. In the U.S., first-half sales increased 7.8% to €5,401 million.
Second-quarter sales in Emerging Markets grew 10.0% to €2,724 million, mainly driven by Vaccines (up 37.7%), Rare Disease (up 31.7%), Diabetes (up 8.2%) and Oncology (up 24.3%). In Asia, second-quarter sales were up 13.5% to €1,132 million. In China, sales increased 17.1% to €709 million, driven by recovery and strong demand for Pentaxim®, as well as by strong growth in Oncology. In Latin America, second-quarter sales increased 12.3% to €690 million. Second-quarter sales in Brazil were stable at €235 million impacted by lower CHC and Vaccines sales. In Africa and the Middle East region, second-quarter sales were €553 million up 1.7% driven by Africa performance partially offset by lower sales in the Middle East. Second-quarter sales in the Eurasia region increased 13.4% to €322 million, supported by strong growth in Turkey. Second-quarter sales in Russia were €173 million up 1.2%. In Emerging Markets, first-half sales increased 11.8% to €5,454 million.
Second-quarter sales in Europe were €2,164 million, down 7.5% reflecting divestment of the European generics business. At CS, second-quarter sales decreased 0.9% reflecting lower Lovenox® and Diabetes sales which were partially offset by Dupixent® and Vaccines performance. In Europe, first-half sales decreased 8.4% (-2.0% at CS) to €4,351 million.
Sales in Japan increased 2.6% to €465 million in the second quarter, driven by Dupixent® which largely offset lower sales of Plavix® and Aprovel® due to generic competition. In Japan, first-half sales decreased 7.7% to €997 million.
R&D update
| Consult Appendix 6 for full overview of Sanofi’s R&D pipeline
|
Regulatory update
Regulatory updates since April 26, 2019 include the following:
| • | In July, the U.S. Food and Drug Administration (FDA) accepted for review the Biologics License Application (BLA) for isatuximab for the treatment of patients with relapsed/refractory multiple myeloma (RRMM). The target action date for the FDA decision is April 30, 2020. |
| • | In June, Libtayo® (cemiplimab, collaboration with Regeneron) was approved in the European Union (EU) for the treatment of adults with metastatic or locally advanced cutaneous squamous cell carcinoma (CSCC) who are not candidates for curative surgery or curative radiation. |
| • | In June, the European Medicines Agency’s (EMA) Committee for Medicinal Products for Human Use (CHMP) adopted a positive opinion for Dupixent® (dupilumab, collaboration with Regeneron) recommending extending its approval in the EU to include adolescents 12 to 17 years of age with moderate-to-severe atopic dermatitis who are candidates for systemic therapy. |
| • | The FDA accepted for review the BLA for Sanofi’s MenQuadfiTM Meningococcal Polysaccharide Tetanus Toxoid Conjugate Vaccine candidate to help prevent meningococcal meningitis. The target action date for the FDA decision is April 25, 2020. |
9
| • | In June, the FDA approved Dupixent® for the treatment of chronic rhinosinusitis with nasal polyposis (CRSwNP) in adults whose disease is not adequately controlled. |
| • | In May, the European Commission approved Dupixent® for use in adults and adolescents 12 years and older as an add-on maintenance treatment for severe asthma with type 2 inflammation characterized by raised blood eosinophils and/or raised fractional exhaled nitric oxide (FeNO), who are inadequately controlled with high dose inhaled corticosteroid (ICS) plus another medicinal product for maintenance treatment. |
| • | In May, SAR341402 (insulin aspart), a rapid acting insulin, was submitted to the EMA for the treatment of Type I and II diabetes. |
| • | In April, the FDA approved Praluent® (collaboration with Regeneron) to reduce the risk of heart attack, stroke, and unstable angina requiring hospitalization in adults with established cardiovascular disease. |
At the end of July 2019, the R&D pipeline contained 83 projects, including 34 new molecular entities in clinical development. 35 projects are in phase 3 or have been submitted to the regulatory authorities for approval.
Portfolio update
Phase 3:
| • | Topline results from three Phase 3 trials of ZynquistaTM (sotagliflozin) in adults with type 2 diabetes from the InSynchrony clinical program were announced on July 26. Given the primary endpoint results of blood sugar control (HbA1c) reduction in the SOTA-CKD3 and SOTA-CKD4 studies, Sanofi provided notice to Lexicon that it is terminating the collaboration to develop, manufacture, and commercialize ZynquistaTM in all ongoing global type 1 and type 2 diabetes programs. At this time, the ongoing Phase 3 clinical trials will continue and there will be no immediate changes. Sanofi has expressed willingness to work with Lexicon to ensure a smooth transition of the studies. Sanofi remains committed to working and supporting the investigators and patients enrolled in the studies while next steps are discussed with Lexicon. |
| • | Results from a phase 3 study evaluating Soliqua®/Suliqua® (insulin glargine 100 Units/mL and lixisenatide) in adults with type 2 diabetes inadequately controlled by GLP-1 receptor agonist (GLP-1 RA) treatments were presented at the American Diabetes Association (ADA) Scientific Sessions in June. The study met the primary objective by demonstrating a statistically superior reduction of average blood sugar level (HbA1c) after 26 weeks, compared with continuing GLP-1 RA treatment. |
| • | Pivotal phase 3 ICARIA-MM trial results were presented at the 2019 American Society of Clinical Oncology (ASCO) Annual Meeting in June and demonstrated that isatuximab added to pomalidomide and dexamethasone (isatuximab combination therapy) showed statistically significant improvements compared to pomalidomide and dexamethasone (pom-dex) alone in patients with relapsed/refractory multiple myeloma (RRMM). |
| • | A phase 3 study evaluating cemiplimab, a PD-1 inhibitor, in adjuvant treatment for Cutaneous Squamous Cell Carcinoma (CSCC) started. |
| • | Dupilumab, moved into phase 3 in Chronic Obstructive Pulmonary Disease (COPD). |
| • | Fitusiran, a siRNA inhibitor targeting AT3, entered phase 3 for pediatric hemophilia. |
| • | Nirsevimab (SP0232, collaboration with Medimmune), a monoclonal antibody, entered phase 3 for respiratory syncytial virus (RSV) |
Phase 2:
| • | SAR440340/REGN3500 (collaboration with Regeneron), an investigational IL-33 antibody, met the primary endpoint of improvement in loss of asthma control when comparing monotherapy to placebo in a phase 2 proof-of-concept trial The trial also met a key secondary endpoint, demonstrating SAR440340 monotherapy significantly improved lung function compared to placebo. Patients treated with Dupixent® monotherapy did numerically better than SAR440340 across all endpoints, although the trial was not powered to show differences between active treatment arms. The combination of SAR440340 and Dupixent® did not demonstrate increased benefit compared to Dupixent® monotherapy in this trial. |
Phase 1:
| • | A phase 1 trial evaluating SAR441255, a trigonal GLP1R/GIPR/GCGR agonist was initiated. |
| • | SAR441236, a tri-specific neutralizing anti-HIV mAb, entered into phase 1. |
An additional seven research projects have been discontinued to enhance the company’s focus on delivering first and best in class medicines
10
Collaboration
In June, Sanofi and Google announced that they will establish a new virtual Innovation Lab with the ambition to transform how future medicines and health services are delivered by tapping into the power of emerging data technologies. The collaboration aims to change how Sanofi develops new treatments and will focus on three key objectives: to better understand patients and diseases, to increase Sanofi’s operational efficiency, and to improve the experience of Sanofi’s patients and customers.
2019 Second-quarter and first-half financial results(10)
Business Net Income(10)
In the second quarter of 2019, Sanofi generated net sales of €8,628 million, an increase of 5.5% (up 3.9% at CER). First-half sales were €17,019 million, up 5.9% on a reported basis (up 4.1% at CER).
Second-quarter other revenues increased 15.4% (up 9.2% at CER) to €352 million, reflecting the VaxServe sales contribution of non-Sanofi products (€302 million, up 25.0% at CER). First-half other revenues increased 26.5% (up 18.8% at CER) to €674 million driven by the VaxServe sales contribution of non-Sanofi products (€543 million, up 28.0% at CER) and the consolidation of collaboration revenues from Swedish Orphan Biovitrum AB (SOBI).
Second-quarter Gross Profit increased 6.5% to €6,211 million (up 4.7% at CER). The gross margin ratio was 72.0% (71.8% at CER) versus 71.3% in the second quarter of 2018 and benefited from the strong performance of Dupixent®, Vaccines and the divestment of the Generics business in Europe as well as the end of royalty payments to Bristol-Myers Squibb on Plavix® and Avapro® sales. These positive drivers more than offset the negative impact from U.S. Diabetes net price evolution and the decline in Established Rx Products sales in mature markets. In the second quarter of 2019, the gross margin ratio of segments were 75.1% for Pharmaceuticals (up 0.2 percentage points), 67.1% for CHC (down 0.3 percentage points) and 62.3% for Vaccines (up 7.2 percentage points). First-half Gross Profit increased 7.6% to €12,308 million (up 5.5% at CER). In the first half of 2019, the gross margin ratio increased 1.1 percentage point to 72.3% (72.1% at CER) versus the first half of 2018. Sanofi now expects its full-year 2019 gross margin ratio to be between 70% and 71% at CER.
Research and Development (R&D) expenses increased 7.7% to €1,588 million in the second quarter of 2019. At CER, R&D expenses increased 5.4%, due to expansion of phase 3 clinical programs together with investments in Vaccines and Emerging Markets. These increased expenditures were partly offset by lower research costs resulting from the end of the Immuno-oncology agreement with Regeneron. First-half R&D expenses increased 7.9% to €2,973 million (up 5.2% at CER).
Second-quarter selling general and administrative expenses (SG&A) decreased 1.5% to €2,462 million. At CER, SG&A expenses were down 3.1%, reflecting investments in Specialty Care offset by cost efficiency measures notably in Primary Care in Mature Markets and support functions. In the second quarter, the ratio of SG&A to sales decreased 2.1 percentage points to 28.5% compared to the second quarter of 2018. First-half SG&A expenses increased 0.7% to €4,842 million (down 1.3% at CER). In the first half of 2019, the ratio of SG&A to sales was 1.4 percentage points lower at 28.5% compared to the same period of 2018.
Second-quarter operating expenses were €4,050 million, an increase of 1.9% and 0.1% at CER. First-half operating expenses were €7,815 million, an increase of 3.3% and 1.0% at CER.
Second-quarter other current operating income net of expenses was -€91 million versus €189 million in the second quarter of 2018 and included the share of profit to Regeneron of the monoclonal antibodies Alliance. In the second quarter of 2018, this line also included €123 million of capital gains on disposals of some small products and income from a data share agreement. First-half other current operating income net of expenses was -€193 million versus €158 million in the first half of 2018.
The share of profits from associates was €98 million in the second quarter versus €75 million for the same period of 2018, partly driven by the increased contribution of the share of profits in Regeneron. In the first half, the share of profits from associates was €169 million versus €149 million for the same period of 2018.
In the second quarter, non-controlling interests were -€5 million versus -€28 million in the second quarter of 2018, reflecting the end of non-controlling interests related to the Alliance with Bristol-Myers Squibb on Plavix® and Avapro®. First-half non-controlling interests were -€15 million versus -€58 million for the same period of 2018.
(10) See Appendix 3 for 2019 second-quarter consolidated income statement; see Appendix 10 for definitions of financial indicators, and Appendix 4 for reconciliation of IFRS net income reported to business net income.
11
Second-quarter business operating income increased 3.4% to €2,163 million. At CER, business operating income increased 3.0%. The ratio of business operating income to net sales decreased 0.5 percentage points to 25.1% versus the second quarter of 2018. Over the period, the business operating income ratio of segments were 33.8% for Pharmaceuticals (down 3.7 percentage points), 38.6% for CHC (up 3.0 percentage points) and 27.0% for Vaccines (up 11.0 percentage points). First-half business operating income was €4,454 million, up 7.9% (up 7.1% at CER). In the first half of 2019, the ratio of business operating income to net sales increased 0.5 percentage point to 26.2%.
Net financial expenses were -€85 million in the second quarter versus -€107 million in the same period of 2018, reflecting lower cost of net debt. First-half net financial expenses were -€130 million versus -€105 million in the first half of 2018.
Second-quarter and first-half effective tax rate was stable at 22.0%.
Second-quarter business net income(10) increased 5.3% to €1,641 million and increased 4.9% at CER. The ratio of business net income to net sales decreased 0.1 percentage points to 19.0% versus the second quarter of 2018. First-half 2019 business net income(10) increased 7.9% to €3,406 million and increased 7.0% at CER. The ratio of business net income to net sales increased 0.4 percentage points to 20.0% versus the first half of 2018.
|
In the second quarter of 2019, business earnings per share(10) (EPS) increased 4.8% to €1.31 on a reported basis and at CER. The average number of shares outstanding was 1,248.5 million versus 1,247.4 million in the second quarter of 2018.
In the first half of 2019, business earnings per share(10) was €2.73, up 7.9% on a reported basis and up 7.1% at CER. The average number of shares outstanding was 1,247.2 million in the first half of 2019 versus 1,247.8 million in the first half of 2018.
|
Reconciliation of IFRS net income reported to business net income (see Appendix 4)
In the first half of 2019, the IFRS net income was €1,050 million. The main items excluded from the business net income were:
| • | An amortization charge of €1,116 million related to fair value remeasurement on intangible assets of acquired companies (primarily Genzyme: €368 million, Bioverativ: €272 million, Boehringer Ingelheim CHC business: €122 million, Aventis: €107 million) and to acquired intangible assets (licenses/products: €56 million). An amortization charge of €559 million related to fair value remeasurement on intangible assets of acquired companies (primarily Genzyme: €182 million, Bioverativ: €137 million, Boehringer Ingelheim CHC business: €61 million, Aventis: €53 million), and to acquired intangible assets (licenses/products: €26 million) was recorded in the second quarter. These items have no cash impact on the Company. |
| • | An impairment of intangible assets of €1,840 million (of which €1,835 million in the second quarter) mainly related to Eloctate® based on actual sales performance in the U.S. and revision of sales projections. |
| • | Restructuring costs and similar items of €747 million (of which €426 million in the second quarter) mainly related to streamlining initiatives in Europe and the U.S. |
| • | An income of €190 million (of which €130 million in the second quarter) mainly reflecting a decrease of Bayer contingent considerations linked to Lemtrada® (income of €140 million, of which €143 million in second quarter). |
| • | A €905 million tax effect arising from the items listed above, mainly comprising €711 million of deferred taxes generated by amortization and impairments of intangible assets, and €197 million associated with restructuring costs and similar items. The second quarter tax effect was €678 million, including €573 million of deferred taxes generated by amortization and impairments of intangible assets and €102 million associated with restructuring costs and similar items (see Appendix 4). |
| • | A net gain of €317 million mainly related to litigation. |
| • | An income of €53 million net of tax (of which €28 million in the second quarter) related to restructuring costs of associates and joint ventures, and expenses arising from the impact of acquisitions on associates and joint ventures. |
(10) See Appendix 3 for 2019 second-quarter consolidated income statement; see Appendix 10 for definitions of financial indicators, and Appendix 4 for reconciliation of IFRS net income reported to business net income.
12
Capital Allocation
In the first half of 2019, net cash generated by operating activities was €2,850 million after capital expenditures of €684 million and an increase in working capital of €833 million. Over the period, the dividend paid by Sanofi was €3,834 million, restructuring costs and similar items were €705 million and acquisitions and partnerships net of disposals were €631 million. As a consequence, net debt increased from €17,628 million at December 31, 2018, to €18,705 million at June 30, 2019 (amount net of €6,742 million cash and cash equivalents).
Forward-Looking Statements
This press release contains forward-looking statements as defined in the Private Securities Litigation Reform Act of 1995, as amended. Forward-looking statements are statements that are not historical facts. These statements include projections and estimates and their underlying assumptions, statements regarding plans, objectives, intentions and expectations with respect to future financial results, events, operations, services, product development and potential, and statements regarding future performance. Forward-looking statements are generally identified by the words “expects”, “anticipates”, “believes”, “intends”, “estimates”, “plans” and similar expressions. Although Sanofi’s management believes that the expectations reflected in such forward-looking statements are reasonable, investors are cautioned that forward-looking information and statements are subject to various risks and uncertainties, many of which are difficult to predict and generally beyond the control of Sanofi, that could cause actual results and developments to differ materially from those expressed in, or implied or projected by, the forward-looking information and statements. These risks and uncertainties include among other things, the uncertainties inherent in research and development, future clinical data and analysis, including post marketing, decisions by regulatory authorities, such as the FDA or the EMA, regarding whether and when to approve any drug, device or biological application that may be filed for any such product candidates as well as their decisions regarding labelling and other matters that could affect the availability or commercial potential of such product candidates, the absence of guarantee that the product candidates if approved will be commercially successful, the future approval and commercial success of therapeutic alternatives, Sanofi’s ability to benefit from external growth opportunities, to complete related transactions and/or obtain regulatory clearances, risks associated with intellectual property and any related pending or future litigation and the ultimate outcome of such litigation, trends in exchange rates and prevailing interest rates, volatile economic conditions, the impact of cost containment initiatives and subsequent changes thereto, the average number of shares outstanding as well as those discussed or identified in the public filings with the SEC and the AMF made by Sanofi, including those listed under “Risk Factors” and “Cautionary Statement Regarding Forward-Looking Statements” in Sanofi’s annual report on Form 20-F for the year ended December 31, 2018. Other than as required by applicable law, Sanofi does not undertake any obligation to update or revise any forward-looking information or statements.
Appendices
List of appendices
| Appendix 1: | 2019 second-quarter and first-half net sales by GBU, franchise, geographic region and product | |
| Appendix 2: | 2019 second-quarter and first-half Business net income statement | |
| Appendix 3: | 2019 second-quarter and first-half Consolidated income statement | |
| Appendix 4: | Reconciliation of IFRS net income reported to business net income | |
| Appendix 5: | Change in net debt | |
| Appendix 6: | Simplified consolidated balance sheet | |
| Appendix 7: | Currency sensitivity | |
| Appendix 8: | R&D pipeline | |
| Appendix 9: | Expected R&D milestones | |
| Appendix 10: | Definitions of non-GAAP financial indicators | |
13
Appendix 1: 2019 second-quarter net sales by GBU, franchise, geographic region and product
|
Q2 2019 (€ million)
|
Total GBUs
|
% CER
|
% |
Europe |
% CER |
United |
% CER |
Rest of the World |
% CER |
Emerging |
% CER |
Total Franchises |
% CER |
% reported |
||||||||||||||||||||||||||||||||||||||||||||||||||||||||||||||
| Aubagio |
456 | 11.5 | % | 16.6 | % | 105 | 18.0 | % | 336 | 10.5 | % | 15 | -6.7 | % | 10 | -15.4 | % | 466 | 10.6 | % | 15.3 | % | ||||||||||||||||||||||||||||||||||||||||||||||||||||||
| Lemtrada |
66 | -32.6 | % | -30.5 | % | 22 | -51.1 | % | 42 | -13.0 | % | 2 | -50.0 | % | 8 | 28.6 | % | 74 | -28.4 | % | -27.5 | % | ||||||||||||||||||||||||||||||||||||||||||||||||||||||
| Total MS | 522 | 2.9 | % | 7.4 | % | 127 | -5.2 | % | 378 | 7.2 | % | 17 | -15.8 | % | 18 | 0.0 | % | 540 | 2.8 | % | 6.7 | % | ||||||||||||||||||||||||||||||||||||||||||||||||||||||
| Cerezyme |
115 | -7.5 | % | -4.2 | % | 60 | -11.8 | % | 45 | 2.4 | % | 10 | -20.0 | % | 72 | 31.1 | % | 187 | 5.5 | % | 3.3 | % | ||||||||||||||||||||||||||||||||||||||||||||||||||||||
| Cerdelga |
49 | 29.7 | % | 32.4 | % | 18 | 50.0 | % | 29 | 17.4 | % | 2 | 50.0 | % | 1 | 0.0 | % | 50 | 28.9 | % | 31.6 | % | ||||||||||||||||||||||||||||||||||||||||||||||||||||||
| Myozyme |
195 | 6.7 | % | 8.9 | % | 98 | 3.2 | % | 83 | 13.0 | % | 14 | 0.0 | % | 39 | 36.7 | % | 234 | 11.0 | % | 12.0 | % | ||||||||||||||||||||||||||||||||||||||||||||||||||||||
| Fabrazyme |
182 | 4.2 | % | 8.3 | % | 45 | 0.0 | % | 105 | 6.5 | % | 32 | 3.3 | % | 29 | 55.0 | % | 211 | 9.6 | % | 12.2 | % | ||||||||||||||||||||||||||||||||||||||||||||||||||||||
| Aldurazyme |
39 | 5.4 | % | 5.4 | % | 19 | 0.0 | % | 14 | 18.2 | % | 6 | 0.0 | % | 15 | 6.7 | % | 54 | 5.8 | % | 3.8 | % | ||||||||||||||||||||||||||||||||||||||||||||||||||||||
| Total Rare Disease | 640 | 3.0 | % | 6.0 | % | 256 | 0.0 | % | 299 | 6.8 | % | 85 | 0.0 | % | 170 | 31.7 | % | 810 | 8.3 | % | 9.0 | % | ||||||||||||||||||||||||||||||||||||||||||||||||||||||
| Jevtana |
118 | 18.6 | % | 21.6 | % | 44 | 15.8 | % | 54 | 18.6 | % | 20 | 25.0 | % | 8 | 16.7 | % | 126 | 18.4 | % | 22.3 | % | ||||||||||||||||||||||||||||||||||||||||||||||||||||||
| Mozobil |
45 | 4.9 | % | 9.8 | % | 13 | 8.3 | % | 28 | 8.3 | % | 4 | -20.0 | % | 4 | 66.7 | % | 49 | 9.1 | % | 11.4 | % | ||||||||||||||||||||||||||||||||||||||||||||||||||||||
| Thymoglobulin |
67 | 14.3 | % | 19.6 | % | 9 | -10.0 | % | 51 | 17.1 | % | 7 | 40.0 | % | 27 | 50.0 | % | 94 | 23.0 | % | 27.0 | % | ||||||||||||||||||||||||||||||||||||||||||||||||||||||
| Taxotere |
8 | -22.2 | % | -11.1 | % | 1 | 0.0 | % | -1 | -200.0 | % | 8 | 0.0 | % | 34 | 6.3 | % | 42 | 0.0 | % | 2.4 | % | ||||||||||||||||||||||||||||||||||||||||||||||||||||||
| Eloxatine |
4 | -55.6 | % | -55.6 | % | 1 | - | -4 | - | 7 | -22.2 | % | 51 | 37.8 | % | 55 | 19.6 | % | 19.6 | % | ||||||||||||||||||||||||||||||||||||||||||||||||||||||||
| Total Oncology | 302 | 10.2 | % | 13.5 | % | 93 | 6.9 | % | 150 | 12.7 | % | 59 | 9.4 | % | 129 | 24.3 | % | 431 | 14.1 | % | 16.8 | % | ||||||||||||||||||||||||||||||||||||||||||||||||||||||
| Dupixent |
490 | 166.3 | % | 180.0 | % | 46 | 187.5 | % | 403 | 152.3 | % | 41 | 387.5 | % | 6 | 500.0 | % | 496 | 168.2 | % | 181.8 | % | ||||||||||||||||||||||||||||||||||||||||||||||||||||||
| Kevzara |
51 | 145.0 | % | 155.0 | % | 10 | 233.3 | % | 30 | 86.7 | % | 11 | 450.0 | % | 1 | - | 52 | 150.0 | % | 160.0 | % | |||||||||||||||||||||||||||||||||||||||||||||||||||||||
| Total immunology | 541 | 164.1 | % | 177.4 | % | 56 | 194.7 | % | 433 | 146.4 | % | 52 | 400.0 | % | 7 | 600.0 | % | 548 | 166.3 | % | 179.6 | % | ||||||||||||||||||||||||||||||||||||||||||||||||||||||
| Alprolix |
105 | 23.5 | % | 29.6 | % | 0 | - | 74 | 4.5 | % | 31 | 114.3 | % | 0 | - | 105 | 23.5 | % | 29.6 | % | ||||||||||||||||||||||||||||||||||||||||||||||||||||||||
| Eloctate |
167 | -10.2 | % | -5.1 | % | 0 | - | 135 | -16.4 | % | 32 | 29.2 | % | 4 | - | 171 | -8.0 | % | -2.8 | % | ||||||||||||||||||||||||||||||||||||||||||||||||||||||||
| Cablivi |
15 | - | - | 4 | - | 11 | - | 0 | - | 0 | - | 15 | - | - | ||||||||||||||||||||||||||||||||||||||||||||||||||||||||||||||
| Total Rare Blood Disorder | 287 | 6.2 | % | 11.7 | % | 4 | - | 220 | -5.5 | % | 63 | 63.2 | % | 4 | - | 291 | 7.8 | % | 13.2 | % | ||||||||||||||||||||||||||||||||||||||||||||||||||||||||
| Sanofi Genzyme (Specialty Care) |
2,292 | 21.8 | % | 26.8 | % | 536 | 8.1 | % | 1,480 | 26.1 | % | 276 | 32.2 | % | 328 | 30.0 | % | 2,620 | 22.9 | % | 26.5 | % | ||||||||||||||||||||||||||||||||||||||||||||||||||||||
| Lantus |
486 | -27.7 | % | -24.9 | % | 146 | -16.1 | % | 284 | -33.7 | % | 56 | -21.4 | % | 272 | 14.3 | % | 758 | -16.2 | % | -14.9 | % | ||||||||||||||||||||||||||||||||||||||||||||||||||||||
| Toujeo |
175 | -6.1 | % | -2.8 | % | 83 | 10.7 | % | 70 | -23.3 | % | 22 | 5.3 | % | 45 | 24.3 | % | 220 | -0.9 | % | 1.4 | % | ||||||||||||||||||||||||||||||||||||||||||||||||||||||
| Apidra |
54 | -16.9 | % | -16.9 | % | 33 | -5.7 | % | 12 | -42.1 | % | 9 | -9.1 | % | 30 | 14.8 | % | 84 | -7.6 | % | -8.7 | % | ||||||||||||||||||||||||||||||||||||||||||||||||||||||
| Amaryl |
11 | -15.4 | % | -15.4 | % | 4 | 0.0 | % | 1 | 0.0 | % | 6 | -25.0 | % | 70 | -5.4 | % | 81 | -6.9 | % | -6.9 | % | ||||||||||||||||||||||||||||||||||||||||||||||||||||||
| Admelog |
77 | - | - | 4 | 300.0 | % | 73 | - | 0 | -100.0 | % | 0 | - | 77 | - | - | ||||||||||||||||||||||||||||||||||||||||||||||||||||||||||||
| Total Diabetes | 865 | -13.3 | % | -10.4 | % | 303 | -6.8 | % | 461 | -17.5 | % | 101 | -12.2 | % | 425 | 8.2 | % | 1,290 | -7.0 | % | -5.6 | % | ||||||||||||||||||||||||||||||||||||||||||||||||||||||
| Praluent |
61 | -1.7 | % | 1.7 | % | 32 | 40.9 | % | 24 | -37.1 | % | 5 | 100.0 | % | 5 | 150.0 | % | 66 | 3.2 | % | 6.5 | % | ||||||||||||||||||||||||||||||||||||||||||||||||||||||
| Multaq |
80 | -6.1 | % | -2.4 | % | 10 | 0.0 | % | 69 | -5.8 | % | 1 | -33.3 | % | 2 | 100.0 | % | 82 | -4.8 | % | -1.2 | % | ||||||||||||||||||||||||||||||||||||||||||||||||||||||
| Total Cardiovascular | 141 | -4.2 | % | -0.7 | % | 42 | 28.1 | % | 93 | -16.3 | % | 6 | 33.3 | % | 7 | 133.3 | % | 148 | -1.4 | % | 2.1 | % | ||||||||||||||||||||||||||||||||||||||||||||||||||||||
| Plavix |
88 | -11.5 | % | -8.3 | % | 35 | -7.9 | % | 0 | - | 53 | -13.8 | % | 274 | -0.7 | % | 362 | -3.5 | % | -3.2 | % | |||||||||||||||||||||||||||||||||||||||||||||||||||||||
| Lovenox |
211 | -18.0 | % | -17.6 | % | 183 | -19.4 | % | 9 | 0.0 | % | 19 | -9.5 | % | 136 | 13.2 | % | 347 | -8.0 | % | -8.0 | % | ||||||||||||||||||||||||||||||||||||||||||||||||||||||
| Renagel / Renvela |
43 | -47.6 | % | -47.6 | % | 13 | -18.8 | % | 22 | -65.0 | % | 8 | 50.0 | % | 23 | 22.2 | % | 66 | -35.0 | % | -34.0 | % | ||||||||||||||||||||||||||||||||||||||||||||||||||||||
| Aprovel |
52 | 2.0 | % | 2.0 | % | 27 | 0.0 | % | 7 | 133.3 | % | 18 | -14.3 | % | 121 | 0.0 | % | 173 | 0.6 | % | 1.2 | % | ||||||||||||||||||||||||||||||||||||||||||||||||||||||
| Synvisc / Synvisc one |
71 | -10.5 | % | -6.6 | % | 8 | 0.0 | % | 59 | -13.6 | % | 4 | 33.3 | % | 16 | -6.3 | % | 87 | -9.8 | % | -5.4 | % | ||||||||||||||||||||||||||||||||||||||||||||||||||||||
| Allegra |
26 | -7.1 | % | -7.1 | % | 4 | 33.3 | % | 0 | - | 22 | -12.0 | % | 0 | - | 26 | -7.1 | % | -7.1 | % | ||||||||||||||||||||||||||||||||||||||||||||||||||||||||
| Stilnox |
41 | -4.9 | % | 0.0 | % | 9 | 0.0 | % | 11 | -8.3 | % | 21 | -5.0 | % | 14 | 0.0 | % | 55 | -3.6 | % | 0.0 | % | ||||||||||||||||||||||||||||||||||||||||||||||||||||||
| Depakine |
44 | -4.3 | % | -4.3 | % | 40 | -4.8 | % | 0 | - | 4 | 0.0 | % | 72 | 2.9 | % | 116 | 0.0 | % | 0.0 | % | |||||||||||||||||||||||||||||||||||||||||||||||||||||||
| Tritace |
39 | 0.0 | % | 2.6 | % | 37 | 2.7 | % | 0 | - | 2 | -100.0 | % | 17 | -10.0 | % | 56 | -3.4 | % | -3.4 | % | |||||||||||||||||||||||||||||||||||||||||||||||||||||||
| Generics |
99 | -58.3 | % | -57.0 | % | 31 | -83.1 | % | 42 | 60.0 | % | 26 | 13.6 | % | 155 | -5.8 | % | 254 | -35.8 | % | -36.8 | % | ||||||||||||||||||||||||||||||||||||||||||||||||||||||
| Other other Rx |
561 | -6.1 | % | -4.4 | % | 421 | -4.3 | % | 46 | -18.0 | % | 94 | -8.4 | % | 303 | 1.3 | % | 864 | -3.6 | % | -3.5 | % | ||||||||||||||||||||||||||||||||||||||||||||||||||||||
| Total Established Rx Products | 1,275 | -18.2 | % | -16.7 | % | 808 | -21.4 | % | 196 | -17.4 | % | 271 | -6.9 | % | 1,131 | 1.0 | % | 2,406 | -10.0 | % | -9.8 | % | ||||||||||||||||||||||||||||||||||||||||||||||||||||||
| Primary Care |
2,281 | -15.7 | % | -13.5 | % | 1,153 | -16.9 | % | 750 | -17.4 | % | 378 | -7.8 | % | 1,563 | 3.1 | % | 3,844 | -8.7 | % | -8.0 | % | ||||||||||||||||||||||||||||||||||||||||||||||||||||||
| China and Emerging Markets |
1,891 | 7.0 | % | 4.8 | % | 1,891 | 7.0 | % | ||||||||||||||||||||||||||||||||||||||||||||||||||||||||||||||||||||
| Total Pharmaceuticals |
6,464 | 1.7 | % | 3.4 | % | 1,689 | -10.3 | % | 2,230 | 7.2 | % | 654 | 5.8 | % | 1,891 | 7.0 | % | 6,464 | 1.7 | % | 3.4 | % | ||||||||||||||||||||||||||||||||||||||||||||||||||||||
| Allergy, Cough and Cold |
249 | 1.7 | % | 4.2 | % | 62 | -7.5 | % | 80 | 11.8 | % | 28 | 12.5 | % | 79 | -2.5 | % | 249 | 1.7 | % | 4.2 | % | ||||||||||||||||||||||||||||||||||||||||||||||||||||||
| Pain |
308 | 1.6 | % | 1.3 | % | 125 | 2.5 | % | 48 | 12.2 | % | 34 | 3.3 | % | 101 | -3.6 | % | 308 | 1.6 | % | 1.3 | % | ||||||||||||||||||||||||||||||||||||||||||||||||||||||
| Digestive |
277 | 10.1 | % | 11.7 | % | 82 | 5.1 | % | 54 | 8.5 | % | 15 | 0.0 | % | 126 | 15.7 | % | 277 | 10.1 | % | 11.7 | % | ||||||||||||||||||||||||||||||||||||||||||||||||||||||
| Nutritional |
162 | -3.0 | % | -2.4 | % | 29 | 0.0 | % | 9 | 0.0 | % | 70 | 6.2 | % | 54 | -14.3 | % | 162 | -3.0 | % | -2.4 | % | ||||||||||||||||||||||||||||||||||||||||||||||||||||||
| Consumer Healthcare |
1,143 | 1.1 | % | 2.5 | % | 314 | -2.8 | % | 284 | 5.5 | % | 155 | 4.1 | % | 390 | 0.3 | % | 1,143 | 1.1 | % | 2.5 | % | ||||||||||||||||||||||||||||||||||||||||||||||||||||||
| Polio / Pertussis / Hib |
502 | 41.5 | % | 41.8 | % | 78 | 14.7 | % | 100 | 44.6 | % | 33 | -22.5 | % | 291 | 64.6 | % | 502 | 41.5 | % | 41.8 | % | ||||||||||||||||||||||||||||||||||||||||||||||||||||||
| Adult Booster Vaccines |
134 | 38.3 | % | 42.6 | % | 49 | 69.0 | % | 73 | 23.2 | % | 7 | 16.7 | % | 5 | 66.7 | % | 134 | 38.3 | % | 42.6 | % | ||||||||||||||||||||||||||||||||||||||||||||||||||||||
| Meningitis/Pneumonia |
136 | 13.8 | % | 17.2 | % | 0 | - | 101 | 6.7 | % | 4 | 33.3 | % | 31 | 39.1 | % | 136 | 13.8 | % | 17.2 | % | |||||||||||||||||||||||||||||||||||||||||||||||||||||||
| Influenza Vaccines |
85 | -10.2 | % | -13.3 | % | 1 | - | 2 | - | 17 | -5.3 | % | 65 | -13.9 | % | 85 | -10.2 | % | -13.3 | % | ||||||||||||||||||||||||||||||||||||||||||||||||||||||||
| Travel And Other Endemic Vaccines |
138 | 7.9 | % | 9.5 | % | 33 | 3.1 | % | 41 | -2.5 | % | 16 | 30.8 | % | 48 | 14.6 | % | 138 | 7.9 | % | 9.5 | % | ||||||||||||||||||||||||||||||||||||||||||||||||||||||
| Vaccines |
1,021 | 24.7 | % | 25.9 | % | 161 | 20.1 | % | 337 | 20.4 | % | 80 | -6.0 | % | 443 | 37.7 | % | 1,021 | 24.7 | % | 25.9 | % | ||||||||||||||||||||||||||||||||||||||||||||||||||||||
| Total Company |
8,628 | 3.9 | % | 5.5 | % | 2,164 | -7.5 | % | 2,851 | 8.4 | % | 889 | 4.3 | % | 2,724 | 10.0 | % | 8,628 | 3.9 | % | 5.5 | % | ||||||||||||||||||||||||||||||||||||||||||||||||||||||
14
2019 first-half net sales by GBU, franchise, geographic region and product
|
H1 2019 (€ million) |
Total GBUs |
% CER |
% reported |
Europe |
% CER |
United |
% CER |
Rest of the |
% CER |
Emerging |
% CER |
Total Franchises |
% CER |
% |
||||||||||||||||||||||||||||||||||||||||||||||||||||||||||||||
| Aubagio |
877 | 11.2 | % | 16.9 | % | 203 | 10.3 | % | 645 | 11.3 | % | 29 | 16.0 | % | 26 | 12.0 | % | 903 | 11.2 | % | 16.5 | % | ||||||||||||||||||||||||||||||||||||||||||||||||||||||
| Lemtrada |
152 | -25.1 | % | -22.1 | % | 63 | -31.5 | % | 83 | -17.2 | % | 6 | -40.0 | % | 14 | 33.3 | % | 166 | -21.7 | % | -19.8 | % | ||||||||||||||||||||||||||||||||||||||||||||||||||||||
| Total MS | 1,029 | 3.7 | % | 8.9 | % | 266 | -3.6 | % | 728 | 7.1 | % | 35 | 0.0 | % | 40 | 18.9 | % | 1,069 | 4.3 | % | 8.9 | % | ||||||||||||||||||||||||||||||||||||||||||||||||||||||
| Cerezyme |
228 | -6.4 | % | -3.4 | % | 123 | -8.2 | % | 88 | -1.2 | % | 17 | -15.8 | % | 135 | 30.0 | % | 363 | 5.9 | % | 2.0 | % | ||||||||||||||||||||||||||||||||||||||||||||||||||||||
| Cerdelga |
96 | 26.0 | % | 31.5 | % | 34 | 54.5 | % | 57 | 12.8 | % | 5 | 25.0 | % | 2 | 200.0 | % | 98 | 28.4 | % | 32.4 | % | ||||||||||||||||||||||||||||||||||||||||||||||||||||||
| Myozyme |
383 | 6.6 | % | 9.7 | % | 192 | 2.1 | % | 162 | 13.5 | % | 29 | 3.6 | % | 71 | 37.5 | % | 454 | 10.9 | % | 12.1 | % | ||||||||||||||||||||||||||||||||||||||||||||||||||||||
| Fabrazyme |
349 | 4.4 | % | 9.1 | % | 90 | 3.4 | % | 199 | 3.9 | % | 60 | 7.4 | % | 47 | 36.8 | % | 396 | 7.8 | % | 10.6 | % | ||||||||||||||||||||||||||||||||||||||||||||||||||||||
| Aldurazyme |
78 | 7.0 | % | 9.9 | % | 39 | 2.6 | % | 26 | 14.3 | % | 13 | 8.3 | % | 43 | 43.8 | % | 121 | 18.4 | % | 17.5 | % | ||||||||||||||||||||||||||||||||||||||||||||||||||||||
| Total Rare Disease | 1,253 | 3.4 | % | 7.1 | % | 511 | 1.8 | % | 576 | 5.7 | % | 166 | 1.3 | % | 323 | 34.3 | % | 1,576 | 9.2 | % | 9.6 | % | ||||||||||||||||||||||||||||||||||||||||||||||||||||||
| Jevtana |
223 | 12.6 | % | 16.8 | % | 86 | 10.3 | % | 101 | 11.9 | % | 36 | 20.7 | % | 14 | 27.3 | % | 237 | 13.4 | % | 17.3 | % | ||||||||||||||||||||||||||||||||||||||||||||||||||||||
| Mozobil |
87 | 7.8 | % | 13.0 | % | 24 | 0.0 | % | 54 | 11.1 | % | 9 | 12.5 | % | 6 | 40.0 | % | 93 | 9.8 | % | 13.4 | % | ||||||||||||||||||||||||||||||||||||||||||||||||||||||
| Thymoglobulin |
125 | 10.3 | % | 16.8 | % | 18 | -5.3 | % | 95 | 14.1 | % | 12 | 10.0 | % | 50 | 37.8 | % | 175 | 17.4 | % | 21.5 | % | ||||||||||||||||||||||||||||||||||||||||||||||||||||||
| Taxotere |
15 | -17.6 | % | -11.8 | % | 2 | 0.0 | % | -1 | -200.0 | % | 14 | -7.1 | % | 74 | 9.0 | % | 89 | 3.6 | % | 6.0 | % | ||||||||||||||||||||||||||||||||||||||||||||||||||||||
| Eloxatine |
10 | -37.5 | % | -37.5 | % | 1 | 0.0 | % | -4 | - | 13 | -13.3 | % | 99 | 32.4 | % | 109 | 20.0 | % | 21.1 | % | |||||||||||||||||||||||||||||||||||||||||||||||||||||||
| Total Oncology | 575 | 6.3 | % | 10.6 | % | 181 | 2.8 | % | 287 | 8.1 | % | 107 | 8.3 | % | 255 | 22.7 | % | 830 | 11.0 | % | 14.2 | % | ||||||||||||||||||||||||||||||||||||||||||||||||||||||
| Dupixent |
816 | 173.0 | % | 189.4 | % | 82 | 215.4 | % | 669 | 154.5 | % | 65 | 520.0 | % | 9 | 800.0 | % | 825 | 175.3 | % | 191.5 | % | ||||||||||||||||||||||||||||||||||||||||||||||||||||||
| Kevzara |
81 | 156.7 | % | 170.0 | % | 18 | 260.0 | % | 48 | 95.7 | % | 15 | 600.0 | % | 1 | - | 82 | 160.0 | % | 173.3 | % | |||||||||||||||||||||||||||||||||||||||||||||||||||||||
| Total immunology | 897 | 171.5 | % | 187.5 | % | 100 | 222.6 | % | 717 | 149.4 | % | 80 | 533.3 | % | 10 | 900.0 | % | 907 | 173.8 | % | 189.8 | % | ||||||||||||||||||||||||||||||||||||||||||||||||||||||
| Alprolix |
200 | 84.3 | % | 96.1 | % | 0 | - | 144 | 62.7 | % | 56 | 178.9 | % | 0 | - | 200 | 84.3 | % | 96.1 | % | ||||||||||||||||||||||||||||||||||||||||||||||||||||||||
| Eloctate |
337 | 43.8 | % | 53.9 | % | 0 | - | 272 | 35.8 | % | 65 | 90.6 | % | 8 | - | 345 | 47.5 | % | 57.5 | % | ||||||||||||||||||||||||||||||||||||||||||||||||||||||||
| Cablivi |
20 | - | - | 9 | - | 11 | - | 0 | - | 0 | - | 20 | - | - | ||||||||||||||||||||||||||||||||||||||||||||||||||||||||||||||
| Total Rare Blood Disorder | 557 | 62.9 | % | 73.5 | % | 9 | - | 427 | 47.8 | % | 121 | 125.5 | % | 8 | - | 565 | 65.4 | % | 76.0 | % | ||||||||||||||||||||||||||||||||||||||||||||||||||||||||
| Sanofi Genzyme (Specialty Care) |
4,311 | 25.9 | % | 31.9 | % | 1,067 | 8.3 | % | 2,735 | 32.4 | % | 509 | 39.1 | % | 636 | 31.8 | % | 4,947 | 26.7 | % | 30.8 | % | ||||||||||||||||||||||||||||||||||||||||||||||||||||||
| Lantus |
979 | -28.5 | % | -25.3 | % | 298 | -16.1 | % |
568 | -35.2 | % | 113 | -20.9 | % | 553 | 14.6 | % | 1,532 | -16.7 | % | -15.0 | % | ||||||||||||||||||||||||||||||||||||||||||||||||||||||
| Toujeo |
342 | -5.2 | % | -2.0 | % | 163 | 14.8 | % | 139 | -24.0 | % | 40 | 5.6 | % | 89 | 41.5 | % | 431 | 2.2 | % | 4.1 | % | ||||||||||||||||||||||||||||||||||||||||||||||||||||||
| Apidra |
109 | -17.1 | % | -15.5 | % | 66 | -5.7 | % | 25 | -42.5 | % | 18 | -5.3 | % | 64 | 24.1 | % | 173 | -4.9 | % | -5.5 | % | ||||||||||||||||||||||||||||||||||||||||||||||||||||||
| Amaryl |
22 | -8.3 | % | -8.3 | % | 8 | 0.0 | % | 1 | 0.0 | % | 13 | -13.3 | % | 149 | 1.4 | % | 171 | 0.0 | % | 0.6 | % | ||||||||||||||||||||||||||||||||||||||||||||||||||||||
| Admelog |
143 | - | - | 7 | 250.0 | % | 136 | - | 0 | -100.0 | % | 0 | - | 143 | - | - | ||||||||||||||||||||||||||||||||||||||||||||||||||||||||||||
| Total Diabetes | 1,714 | -14.6 | % | -11.1 | % | 608 | -6.2 | % | 906 | -20.2 | % | 200 | -12.2 | % | 870 | 11.7 | % | 2,584 | -6.9 | % | -5.1 | % | ||||||||||||||||||||||||||||||||||||||||||||||||||||||
| Praluent |
113 | 1.9 | % | 5.6 | % | 61 | 46.3 | % | 44 | -32.8 | % | 8 | 60.0 | % | 9 | 125.0 | % | 122 | 6.3 | % | 9.9 | % | ||||||||||||||||||||||||||||||||||||||||||||||||||||||
| Multaq |
157 | -6.9 | % | -1.3 | % | 20 | -4.8 | % | 135 | -6.7 | % | 2 | -33.3 | % | 4 | 33.3 | % | 161 | -6.2 | % | -0.6 | % | ||||||||||||||||||||||||||||||||||||||||||||||||||||||
| Total Cardiovascular | 270 | -3.4 | % | 1.5 | % | 81 | 29.0 | % | 179 | -14.8 | % | 10 | 25.0 | % | 13 | 85.7 | % | 283 | -1.1 | % | 3.7 | % | ||||||||||||||||||||||||||||||||||||||||||||||||||||||
| Plavix |
169 | -11.8 | % | -9.1 | % | 69 | -9.2 | % | 0 | - | 100 | -13.6 | % | 597 | 3.3 | % | 766 | -0.4 | % | 0.7 | % | |||||||||||||||||||||||||||||||||||||||||||||||||||||||
| Lovenox |
429 | -19.5 | % | -19.4 | % | 375 | -20.4 | % | 18 | -15.0 | % | 36 | -12.2 | % | 261 | 11.9 | % | 690 | -9.9 | % | -10.2 | % | ||||||||||||||||||||||||||||||||||||||||||||||||||||||
| Renagel / Renvela |
101 | -42.3 | % | -39.9 | % | 26 | -18.8 | % | 59 | -54.5 | % | 16 | 6.7 | % | 44 | 30.3 | % | 145 | -30.3 | % | -27.9 | % | ||||||||||||||||||||||||||||||||||||||||||||||||||||||
| Aprovel |
107 | 5.0 | % | 5.9 | % | 54 | -1.8 | % | 14 | 160.0 | % | 39 | -4.9 | % | 267 | 9.1 | % | 374 | 7.9 | % | 9.0 | % | ||||||||||||||||||||||||||||||||||||||||||||||||||||||
| Synvisc / Synvisc one |
124 | -10.7 | % | -5.3 | % | 14 | 7.7 | % | 103 | -12.6 | % | 7 | -14.3 | % | 31 | 3.4 | % | 155 | -8.1 | % | -3.1 | % | ||||||||||||||||||||||||||||||||||||||||||||||||||||||
| Allegra |
82 | -2.5 | % | 2.5 | % | 6 | 20.0 | % | 0 | - | 76 | -4.0 | % | 0 | - | 82 | -2.5 | % | 2.5 | % | ||||||||||||||||||||||||||||||||||||||||||||||||||||||||
| Stilnox |
76 | -14.3 | % | -9.5 | % | 17 | -15.0 | % | 18 | -22.7 | % | 41 | -9.5 | % | 31 | -3.1 | % | 107 | -11.2 | % | -7.8 | % | ||||||||||||||||||||||||||||||||||||||||||||||||||||||
| Depakine |
87 | -4.4 | % | -4.4 | % | 80 | -4.8 | % | 0 | - | 7 | 0.0 | % | 149 | 7.2 | % | 236 | 2.6 | % | 2.6 | % | |||||||||||||||||||||||||||||||||||||||||||||||||||||||
| Tritace |
74 | -1.3 | % | -1.3 | % | 71 | -1.4 | % | 0 | - | 3 | 0.0 | % | 35 | -10.0 | % | 109 | -4.3 | % | -5.2 | % | |||||||||||||||||||||||||||||||||||||||||||||||||||||||
| Generics |
214 | -57.6 | % | -56.0 | % | 61 | -83.4 | % | 79 | 54.2 | % | 74 | 0.0 | % | 322 | -3.1 | % | 536 | -34.8 | % | -36.0 | % | ||||||||||||||||||||||||||||||||||||||||||||||||||||||
| Other other Rx |
1,119 | -6.0 | % | -5.2 | % | 835 | -5.7 | % | 93 | -16.0 | % | 191 | -2.1 | % | 593 | -3.5 | % | 1,712 | -5.1 | % | -5.5 | % | ||||||||||||||||||||||||||||||||||||||||||||||||||||||
| Total Established Rx Products | 2,582 | -18.5 | % | -17.1 | % | 1,608 | -22.7 | % | 384 | -16.4 | % | 590 | -5.5 | % | 2,330 | 2.3 | % | 4,912 | -9.7 | % | -9.4 | % | ||||||||||||||||||||||||||||||||||||||||||||||||||||||
| Primary Care |
4,566 | -16.3 | % | -14.0 | % | 2,297 | -17.7 | % | 1,469 | -18.6 | % | 800 | -7.0 | % | 3,213 | 4.9 | % | 7,779 | -8.5 | % | -7.6 | % | ||||||||||||||||||||||||||||||||||||||||||||||||||||||
| China and Emerging Markets |
3,849 | 8.7 | % | 6.3 | % | 3,849 | 8.7 | % | ||||||||||||||||||||||||||||||||||||||||||||||||||||||||||||||||||||
| Total Pharmaceuticals |
12,726 | 2.4 | % | 4.3 | % | 3,364 | -10.9 | % | 4,204 | 8.6 | % | 1,309 | 6.8 | % | 3,849 | 8.7 | % | 12,726 | 2.4 | % | 4.3 | % | ||||||||||||||||||||||||||||||||||||||||||||||||||||||
| Allergy, Cough and Cold |
611 | 2.8 | % | 5.3 | % | 163 | -2.4 | % | 187 | 0.6 | % | 88 | 9.0 | % | 173 | 7.4 | % | 611 | 2.8 | % | 5.3 | % | ||||||||||||||||||||||||||||||||||||||||||||||||||||||
| Pain |
630 | 2.1 | % | 0.3 | % | 254 | 0.4 | % | 93 | 11.5 | % | 63 | 3.5 | % | 220 | 0.4 | % | 630 | 2.1 | % | 0.3 | % | ||||||||||||||||||||||||||||||||||||||||||||||||||||||
| Digestive |
548 | 9.1 | % | 10.5 | % | 167 | 3.1 | % | 103 | 1.1 | % | 28 | 0.0 | % | 250 | 18.5 | % | 548 | 9.1 | % | 10.5 | % | ||||||||||||||||||||||||||||||||||||||||||||||||||||||
| Nutritional |
314 | -5.5 | % | -4.8 | % | 62 | 1.6 | % | 19 | 0.0 | % | 122 | -3.3 | % | 111 | -11.8 | % | 314 | -5.5 | % | -4.8 | % | ||||||||||||||||||||||||||||||||||||||||||||||||||||||
| Consumer Healthcare |
2,399 | 0.8 | % | 2.0 | % | 680 | -3.4 | % | 588 | 1.5 | % | 318 | 0.7 | % | 813 | 4.2 | % | 2,399 | 0.8 | % | 2.0 | % | ||||||||||||||||||||||||||||||||||||||||||||||||||||||
| Polio / Pertussis / Hib |
988 | 33.5 | % | 34.6 | % | 151 | 7.9 | % | 192 | 1.7 | % | 110 | 29.6 | % | 535 | 61.5 | % | 988 | 33.5 | % | 34.6 | % | ||||||||||||||||||||||||||||||||||||||||||||||||||||||
| Adult Booster Vaccines |
234 | 22.0 | % | 25.8 | % | 85 | 28.8 | % | 124 | 19.6 | % | 13 | 7.7 | % | 12 | 20.0 | % | 234 | 22.0 | % | 25.8 | % | ||||||||||||||||||||||||||||||||||||||||||||||||||||||
| Meningitis/Pneumonia |
248 | 17.1 | % | 21.0 | % | 0 | - | 175 | 4.5 | % | 7 | 0.0 | % | 66 | 68.3 | % | 248 | 17.1 | % | 21.0 | % | |||||||||||||||||||||||||||||||||||||||||||||||||||||||
| Influenza Vaccines |
117 | -5.5 | % | -7.9 | % | 2 | 100.0 | % | 4 | -25.0 | % | 20 | -12.5 | % | 91 | -4.1 | % | 117 | -5.5 | % | -7.9 | % | ||||||||||||||||||||||||||||||||||||||||||||||||||||||
| Travel And Other Endemic Vaccines |
257 | 10.5 | % | 12.7 | % | 67 | 13.6 | % | 74 | 12.9 | % | 30 | 7.1 | % | 86 | 7.6 | % | 257 | 10.5 | % | 12.7 | % | ||||||||||||||||||||||||||||||||||||||||||||||||||||||
| Vaccines |
1,894 | 22.5 | % | 24.4 | % | 307 | 12.9 | % | 609 | 8.8 | % | 186 | 13.9 | % | 792 | 42.2 | % | 1,894 | 22.5 | % | 24.4 | % | ||||||||||||||||||||||||||||||||||||||||||||||||||||||
| Total Company |
17,019 | 4.1 | % | 5.9 | % | 4,351 | -8.4 | % | 5,401 | 7.8 | % | 1,813 | 6.3 | % | 5,454 | 11.8 | % | 17,019 | 4.1 | % | 5.9 | % | ||||||||||||||||||||||||||||||||||||||||||||||||||||||
15
Appendix 2: Business net income statement
|
Second Quarter 2019
|
Pharmaceuticals
|
Consumer Healthcare
|
Vaccines
|
Others(1)
|
Total Group
| |||||||||||||||||||||||||||||||||||||||||||||||||||||
| € million | Q2 2019 |
Q2 2018 |
Change | Q2 2019 |
Q2 2018 |
Change | Q2 2019 |
Q2 2018 |
Change | Q2 2019 |
Q2 2018 |
Change | Q2 2019 |
Q2 2018 |
Change | |||||||||||||||||||||||||||||||||||||||||||
|
Net sales
|
6,464 | 6,250 | 3.4% | 1,143 | 1,115 | 2.5% | 1,021 | 811 | 25.9% | — | — | 8,628 | 8,176 | 5.5% | ||||||||||||||||||||||||||||||||||||||||||||
|
Other revenues |
49 | 76 | (35.5)% | 1 | — | 302 | 229 | 31.9% | — | — | 352 | 305 | 15.4% | |||||||||||||||||||||||||||||||||||||||||||||
| Cost of Sales | (1,661) | (1,643) | 1.1% | (377) | (364) | 3.6% | (687) | (593) | 15.9% | (44) | (51) | (13.7)% | (2,769) | (2,651) | 4.5% | |||||||||||||||||||||||||||||||||||||||||||
| As % of net sales | (25.7)% | (26.3)% | (33.0)% | (32.6)% | (67.3)% | (73.1)% | (32.1)% | (32.4)% | ||||||||||||||||||||||||||||||||||||||||||||||||||
|
Gross Profit
|
4,852 | 4,683 | 3.6% | 767 | 751 | 2.1% | 636 | 447 | 42.3% | (44) | (51) | 6,211 | 5,830 | 6.5% | ||||||||||||||||||||||||||||||||||||||||||||
| As % of net sales | 75.1% | 74.9% | 67.1% | 67.4% | 62.3% | 55.1% | 72.0% | 71.3% | ||||||||||||||||||||||||||||||||||||||||||||||||||
| Research and development expenses | (1,233) | (1,135) | 8.6% | (35) | (30) | 16.7% | (169) | (142) | 19.0% | (151) | (168) | (10.1)% | (1,588) | (1,475) | 7.7% | |||||||||||||||||||||||||||||||||||||||||||
| As % of net sales | (19.1)% | (18.2)% | (3.1)% | (2.7)% | (16.6)% | (17.5)% | (18.4)% | (18.0)% | ||||||||||||||||||||||||||||||||||||||||||||||||||
| Selling and general expenses | (1,379) | (1,394) | (1.1)% | (383) | (399) | (4.0)% | (185) | (173) | 6.9% | (515) | (533) | (3.4)% | (2,462) | (2,499) | (1.5)% | |||||||||||||||||||||||||||||||||||||||||||
| As % of net sales | (21.3)% | (22.3)% | (33.5)% | (35.8)% | (18.1)% | (21.3)% | (28.5)% | (30.6)% | ||||||||||||||||||||||||||||||||||||||||||||||||||
| Other current operating income/expenses | (147) | 139 | 94 | 77 | (6) | (2) | (32) | (25) | (91) | 189 | ||||||||||||||||||||||||||||||||||||||||||||||||
| Share of profit/loss of associates* and joint-ventures |
98 | 75 | — | — | — | — | — | — | 98 | 75 | ||||||||||||||||||||||||||||||||||||||||||||||||
| Net income attributable to non controlling interests |
(3) | (26) | (2) | (2) | — | — | — | — | (5) | (28) | ||||||||||||||||||||||||||||||||||||||||||||||||
|
Business operating income
|
2,188 | 2,342 | (6.6)% | 441 | 397 | 11.1% | 276 | 130 | 112.3% | (742) | (777) | (4.5)% | 2,163 | 2,092 | 3.4% | |||||||||||||||||||||||||||||||||||||||||||
|
As % of net sales
|
33.8% | 37.5% | 38.6% | 35.6% | 27.0% | 16.0% | 25.1% | 25.6% | ||||||||||||||||||||||||||||||||||||||||||||||||||
| Financial income and expenses | (85) | (107) | ||||||||||||||||||||||||||||||||||||||||||||||||||||||||
| Income tax expenses | (437) | (427) | ||||||||||||||||||||||||||||||||||||||||||||||||||||||||
| Tax rate** | 22.0% | 22.0% | ||||||||||||||||||||||||||||||||||||||||||||||||||||||||
|
|
Business net income
|
1,641 | 1,558 | 5.3% | ||||||||||||||||||||||||||||||||||||||||||||||||||||||
|
|
As % of net sales
|
19.0% | 19.1% | |||||||||||||||||||||||||||||||||||||||||||||||||||||||
|
|
Business earnings / share
(in
|
1.31 | 1.25 | 4.8% | ||||||||||||||||||||||||||||||||||||||||||||||||||||||
*** Net of tax.
*** Determined on the basis of Business income before tax, associates, and non-controlling interests.
*** Based on an average number of shares outstanding of 1,248.5 million in the second quarter of 2019 and 1,247.4 million in the second quarter of 2018.
(1) Other includes the cost of Global Support Functions (Medical Affairs, External Affairs, Finance, Human Resources, Information Solution & Technologies, Sanofi Business Services, etc…).
16
| Half year 2019 | Pharmaceuticals | Consumer Healthcare | Vaccines | Others (1) | Total Group | |||||||||||||||||||||||||||||||||||||||||||||||||||||||||
| € million | H1 2019 |
H1 2018 |
Change | H1 2019 |
H1 2018 |
Change |
H1 2019 |
H1 2018 |
Change |
H1 2019 |
H1 2018 |
Change |
H1 2019 |
H1 2018 |
Change |
|||||||||||||||||||||||||||||||||||||||||||||||
|
Net sales
|
12,726 | 12,199 | 4.3% | 2,399 | 2,353 | 2.0% | 1,894 | 1,522 | 24.4% | — | 17,019 | 16,074 | 5.9% | |||||||||||||||||||||||||||||||||||||||||||||||||
| Other revenues | 129 | 134 | (3.7)% | 1 | — | 544 | 399 | 36.3% | — | 674 | 533 | 26.5% | ||||||||||||||||||||||||||||||||||||||||||||||||||
| Cost of Sales | (3,242) | (3,230) | 0.4% | (773) | (763) | 1.3% | (1,259) | (1,068) | 17.9% | (111) | (105) | 5.7% | (5,385) | (5,166) | 4.2% | |||||||||||||||||||||||||||||||||||||||||||||||
| As % of net sales | (25.5)% | (26.5)% | (32.2)% | (32.4)% | (66.5)% | (70.2)% | (31.6)% | (32.1)% | ||||||||||||||||||||||||||||||||||||||||||||||||||||||
|
Gross Profit
|
9,613 | 9,103 | 5.6% | 1,627 | 1,590 | 2.3% | 1,179 | 853 | 38.2% | (111) | (105) | 12,308 | 11,441 | 7.6% | ||||||||||||||||||||||||||||||||||||||||||||||||
| As % of net sales | 75.5% | 74.6% | 67.8% | 67.6% | 62.2% | 56.0% | 72.3% | 71.2% | ||||||||||||||||||||||||||||||||||||||||||||||||||||||
| Research and development expenses | (2,306) | (2,113) | 9.1% | (70) | (58) | 20.7% | (302) | (268) | 12.7% | (295) | (316) | (6.6)% | (2,973) | (2,755) | 7.9% | |||||||||||||||||||||||||||||||||||||||||||||||
| As % of net sales | (18.1)% | (17.3)% | (2.9)% | (2.5)% | (15.9)% | (17.6)% | (17.5)% | (17.1)% | ||||||||||||||||||||||||||||||||||||||||||||||||||||||
| Selling and general expenses | (2,654) | (2,648) | 0.2% | (777) | (788) | (1.4)% | (358) | (326) | 9.8% | (1,053) | (1,047) | 0.6% | (4,842) | (4,809) | 0.7% | |||||||||||||||||||||||||||||||||||||||||||||||
| As % of net sales | (20.9)% | (21.7)% | (32.4)% | (33.5)% | (18.9)% | (21.4)% | (28.5)% | (29.9)% | ||||||||||||||||||||||||||||||||||||||||||||||||||||||
| Other current operating income/expenses |
(234) | 132 | 105 | 82 | (6) | — | (58) | (56) | (193) | 158 | ||||||||||||||||||||||||||||||||||||||||||||||||||||
| Share of profit/loss of associates* and joint-ventures | 169 | 150 | — | — | — | (1) | — | — | 169 | 149 | ||||||||||||||||||||||||||||||||||||||||||||||||||||
| Net income attributable to non controlling interests | (9) | (52) | (6) | (6) | — | — | — | — | (15) | (58) | ||||||||||||||||||||||||||||||||||||||||||||||||||||
|
Business operating income
|
4,579 | 4,572 | 0.2% | 879 | 820 | 7.2% | 513 | 258 | 98.8% | (1,517) | (1,524) | (0.5)% | 4,454 | 4,126 | 7.9% | |||||||||||||||||||||||||||||||||||||||||||||||
| As % of net sales | 36.0% | 37.5% | 36.6% | 34.8% | 27.1% | 17.0% | 26.2% | 25.7% | ||||||||||||||||||||||||||||||||||||||||||||||||||||||
| Financial income and expenses | (130 | ) | (105 | ) | ||||||||||||||||||||||||||||||||||||||||||||||||||||||||||
| Income tax expenses | (918 | ) | (865 | ) | ||||||||||||||||||||||||||||||||||||||||||||||||||||||||||
| Tax rate** | 22.0 | % | 22.0 | % | ||||||||||||||||||||||||||||||||||||||||||||||||||||||||||
|
Business net income
|
3,406 | 3,156 | 7.9 | % | ||||||||||||||||||||||||||||||||||||||||||||||||||||||||||
| As % of net sales
|
20.0 | % | 19.6 | % | ||||||||||||||||||||||||||||||||||||||||||||||||||||||||||
|
Business earnings / share (in euros)***
|
2.73 | 2.53 | 7.9 | % | ||||||||||||||||||||||||||||||||||||||||||||||||||||||||||
*** Net of tax.
*** Determined on the basis of Business income before tax, associates, and non-controlling interests.
*** Based on an average number of shares outstanding of 1,247.2 million in the first half 2019 and 1,247.8 million in the first half 2018.
(1) Other includes the cost of Global Support Functions (Medical Affairs, External Affairs, Finance, Human Resources, Information Solution & Technologies, Sanofi Business Services, etc…).
17
Appendix 3: Consolidated income statements
| € million | Q2 2019 | Q2 2018 | H1 2019 | H1 2018 | ||||||||||||||
| Net sales |
8,628 | 8,176 | 17,019 | 16,074 | ||||||||||||||
| Other revenues |
352 | 305 | 674 | 533 | ||||||||||||||
| Cost of sales |
(2,767 | ) | (2,720 | ) | (5,385 | ) | (5,265 | ) | ||||||||||
| Gross profit |
6,213 | 5,761 | 12,308 | 11,342 | ||||||||||||||
| Research and development expenses |
(1,587 | ) | (1,475 | ) | (2,972 | ) | (2,755 | ) | ||||||||||
| Selling and general expenses |
(2,459 | ) | (2,507 | ) | (4,835 | ) | (4,819 | ) | ||||||||||
| Other operating income |
209 | 298 | 273 | 323 | ||||||||||||||
| Other operating expenses |
(300 | ) | (109 | ) | (466 | ) | (165 | ) | ||||||||||
| Amortization of intangible assets |
(559 | ) | (541 | ) | (1,116 | ) | (999 | ) | ||||||||||
| Impairment of intangible assets |
(1,835 | ) | (98 | ) | (1,840 | ) | (101 | ) | ||||||||||
| Fair value remeasurement of contingent consideration |
130 | 66 | 190 | 10 | ||||||||||||||
| Restructuring costs and similar items |
(426 | ) | (416 | ) | (747 | ) | (607 | ) | ||||||||||
| Other gains and losses, and litigation (1) |
317 | (18 | ) | 317 | (67 | ) | ||||||||||||
| Operating income |
(297 | ) | 961 | 1,112 | 2,162 | |||||||||||||
| Financial expenses |
(138 | ) | (107 | ) | (244 | ) | (202 | ) | ||||||||||
| Financial income |
42 | — | 94 | 97 | ||||||||||||||
| Income before tax and associates and joint ventures |
(393 | ) | 854 | 962 | 2,057 | |||||||||||||
| Income tax expense |
242 | (110 | ) | (13 | ) | (297 | ) | |||||||||||
| Share of profit/(loss) of associates and joint ventures |
69 | 45 | 116 | 75 | ||||||||||||||
| Net income excluding the exchanged/held-for-exchange Animal Health business |
(82 | ) | 789 | 1,065 | 1,835 | |||||||||||||
| Net income/(loss) of the exchanged/held-for-exchange Animal Health business |
— | 1 | — | — | ||||||||||||||
| Net income |
(82 | ) | 790 | 1,065 | 1,835 | |||||||||||||
| Net income attributable to non-controlling interests |
5 | 28 | 15 | 57 | ||||||||||||||
| Net income attributable to equity holders of Sanofi |
(87 | ) | 762 | 1,050 | 1,778 | |||||||||||||
| Average number of shares outstanding (million)
|
|
1,248.5
|
|
|
1,247.4
|
|
|
1,247.2
|
|
|
1,247.8
|
| ||||||
| Earnings per share excluding the exchanged/held-for-exchange Animal Health business (in euros) |
(0.07 | ) | 0.61 | 0.84 | 1.42 | |||||||||||||
| IFRS Earnings per share (in euros) |
(0.07 | ) | 0.61 | 0.84 | 1.42 | |||||||||||||
| (1) | In 2019, net gain of €317 million mainly related to litigation. In 2018, separation costs for the European Generics business divestiture. |
18
Appendix 4: Reconciliation of Net income attributable to equity holders of Sanofi to Business net income
|
€ million
|
Q2 2019
|
Q2 2018
|
Change
|
|||||||||
| Net income attributable to equity holders of Sanofi |
(87 | ) | 762 | (111.4 | )% | |||||||
| Amortization of intangible assets (1) |
559 | 541 | ||||||||||
| Impairment of intangible assets(2) |
1,835 | 98 | ||||||||||
| Fair value remeasurement of contingent consideration |
(130 | ) | (66 | ) | ||||||||
| Expenses arising from the impact of acquisitions on inventories |
— | 69 | ||||||||||
| Other expenses related to business combinations |
— | 8 | ||||||||||
| Restructuring costs and similar items |
426 | 416 | ||||||||||
| Other gains and losses, and litigation (3) |
(317 | ) | 18 | |||||||||
| Effects of IFRS 16 on Lease contracts (4) |
5 | — | ||||||||||
| Tax effect of the items listed above : |
(678 | ) | (290 | ) | ||||||||
| Amortization and impairment of intangible assets |
(573 | ) | (153 | ) | ||||||||
| Fair value remeasurement of contingent consideration |
28 | 17 | ||||||||||
| Expenses arising from the impact of acquisitions on inventories |
— | (17 | ) | |||||||||
| Other expenses related to business combinations |
— | 1 | ||||||||||
| Restructuring costs and similar items |
(102 | ) | (131 | ) | ||||||||
| Other tax effects |
(31 | ) | (7 | ) | ||||||||
| Other tax items (5) |
— | (27 | ) | |||||||||
| Restructuring costs of associates and joint ventures, and expenses arising from the impact of acquisitions on associates and joint ventures |
28 | 30 | ||||||||||
| Animal Health items |
— | (1 | ) | |||||||||
| Business net income
|
|
1,641
|
|
|
1,558
|
|
|
5.3
|
%
| |||
| IFRS earnings per share(6) (in euros)
|
|
(0.07
|
)
|
|
0.61
|
|
||||||
| (1) | Of which related to amortization expense generated by the remeasurement of intangible assets as part of business combinations: €533 million in the second quarter of 2019 and €509 million in the second quarter of 2018. |
| (2) | In 2019, of which Eloctate impairment. |
| (3) | In 2019, net gain of €317 million mainly related to litigation. In 2018, separation costs for the European Generics business divestiture. |
| (4) | Impact of new lease standard IFRS 16, is effective January 1, 2019 using the modified retrospective transition method (no restatement of prior periods), since Business. |
| (5) | In 2018, mainly due to US tax reform. |
| (6) | Based on an average number of shares outstanding of 1,248.5 million in the second quarter of 2019 and 1,247.4 million in the second quarter of 2018. |
19
|
€ million
|
H1 2019
|
H1 2018
|
Change
|
|||||||||
| Net income attributable to equity holders of Sanofi |
1,050 | 1,778 | (40.9 | )% | ||||||||
| Amortization of intangible assets (1) |
1,116 | 999 | ||||||||||
| Impairment of intangible assets(2) |
1,840 | 101 | ||||||||||
| Fair value remeasurement of contingent consideration |
(190 | ) | (10 | ) | ||||||||
| Expenses arising from the impact of acquisitions on inventories |
3 | 99 | ||||||||||
| Other expenses related to business combinations |
— | 10 | ||||||||||
| Restructuring costs and similar items |
747 | 607 | ||||||||||
| Other gains and losses, and litigation (3) |
(317 | ) | 67 | |||||||||
| Effects of IFRS 16 on Lease contracts (4) |
9 | — | ||||||||||
| Tax effect of the items listed above: |
(905 | ) | (475 | ) | ||||||||
| Amortization and impairment of intangible assets |
(711 | ) | (275 | ) | ||||||||
| Fair value remeasurement of contingent consideration |
24 | 11 | ||||||||||
| Expenses arising from the impact of acquisitions on inventories |
— | (23 | ) | |||||||||
| Restructuring costs and similar items |
(197 | ) | (183 | ) | ||||||||
| Other tax effects |
(21 | ) | (5 | ) | ||||||||
| Other tax items (5) |
— | (93 | ) | |||||||||
| Share of items listed above attributable to non-controlling interests |
— | (1 | ) | |||||||||
| Restructuring costs of associates and joint ventures, and expenses arising from the impact of acquisitions on associates and joint ventures |
53 | 74 | ||||||||||
| Business net income
|
|
3,406
|
|
|
3,156
|
|
|
7.9
|
%
| |||
| IFRS earnings per share(6) (in euros)
|
|
0.84
|
|
|
1.42
|
|
||||||
| (1) | Of which related to amortization expense generated by the remeasurement of intangible assets as part of business combinations: €1,060 million in the first half 2019 and €934 million in the first half 2018. |
| (2) | In 2019, of which Eloctate impairment. |
| (3) | In 2019, net gain of €317 million mainly related to litigation. In 2018, separation costs for the European Generics business divestiture. |
| (4) | Impact of new lease standard IFRS 16, is effective January 1, 2019 using the modified retrospective transition method (no restatement of prior periods), since Business Net Income remains reported as previously under IAS 17 and related interpretations for comparison purposes. |
| (5) | In 2018, mainly due to US tax reform |
| (6) | Based on an average number of shares outstanding of 1,247.2 million in the first half 2019 and 1,247.8 million in the first half 2018. |
20
Appendix 5: Change in net debt
|
€ million
|
H1 2019
|
H1 2018
|
||||||
| Business net income |
3,406 | 3,156 | ||||||
| Depreciation, amortization and impairment of property, plant and equipment and software |
647 | 591 | ||||||
| Gains and losses on disposals of non-current assets, net of tax |
(63 | ) | (216 | ) | ||||
| Other non cash items |
377 | 151 | ||||||
| Operating cash flow before changes in working capital (1) |
4,367 | 3,682 | ||||||
| Changes in working capital (1) |
(833 | ) | (1,139 | ) | ||||
| Acquisitions of property, plant and equipment and software |
(684 | ) | (689 | ) | ||||
| Free cash flow (1) |
2,850 | 1,854 | ||||||
| Acquisitions of intangible assets excluding software |
(115 | ) | (77 | ) | ||||
| Acquisitions of investments in consolidated undertakings including assumed debt |
(122 | ) | (12,872 | ) | ||||
| Restructuring costs and similar items paid |
(705 | ) | (414 | ) | ||||
| Proceeds from disposals of property, plant and equipment, intangible assets and other non-current assets net of tax |
868 | 489 | ||||||
| Issuance of Sanofi shares |
58 | 19 | ||||||
| Dividends paid to shareholders of Sanofi |
(3,834 | ) | (3,773 | ) | ||||
| Acquisition of treasury shares |
(9 | ) | (730 | ) | ||||
| Transactions with non-controlling interests including dividends |
(9 | ) | (18 | ) | ||||
| Foreign exchange impact |
(60 | ) | (210 | ) | ||||
| Net cash-flow from the swap between BI - CHC and Sanofi Animal Health business |
— | 5 | ||||||
| Other items
|
|
1
|
|
|
(322
|
)
| ||
| Change in net debt
|
|
(1,077
|
)
|
|
(16,049
|
)
| ||
| (1) Excluding restructuring costs and similar items. |
21
Appendix 6: Simplified consolidated balance sheet
|
ASSETS € million
|
June 30, 2019
|
Dec 31, 2018
|
LIABILITIES & EQUITY € million
|
June 30, 2019
|
Dec 31, 2018
|
|||||||||||||
| Equity attributable to equity holders of Sanofi | 56,353 | 58,876 | ||||||||||||||||
| Equity attributable to non-controlling interests
|
165 | 159 | ||||||||||||||||
| Total equity |
56,518 | 59,035 | ||||||||||||||||
| Long-term debt | 21,087 | 22,007 | ||||||||||||||||
| Property, plant and equipment - Owned assets |
9,606 | 9,651 | Long-term lease liability | 958 | — | |||||||||||||
| Right of use |
1,105 | — | Non-current liabilities related to business combinations and to non-controlling interests | 739 | 963 | |||||||||||||
| Intangible assets (including goodwill) |
63,516 | 66,124 | Provisions and other non-current liabilities | 9,099 | 8,613 | |||||||||||||
| Non-current financial assets & investments in associates and deferred tax assets
|
10,934 | 10,986 | Deferred tax liabilities | 2,938 | 3,414 | |||||||||||||
|
Non-current assets
|
|
85,161 |
|
|
86,761 |
|
Non-current liabilities |
|
34,821 |
|
|
34,997 |
| |||||
| Accounts payable & Other current liabilities | 14,282 | 14,402 | ||||||||||||||||
| Current liabilities related to business combinations and to non-controlling interests | 273 | 341 | ||||||||||||||||
| Inventories, accounts receivable and other current assets |
18,572 | 17,654 | Short-term lease liability | 240 | — | |||||||||||||
| Cash and cash equivalents |
6,742 | 6,925 | Short-term debt and current portion of long-term debt
|
4,411 | 2,633 | |||||||||||||
| Current assets |
25,314 | 24,579 | Current liabilities |
19,206 | 17,376 | |||||||||||||
| Assets held for sale or exchange |
70 | 68 | Liabilities related to assets held for sale or exchange
|
— | — | |||||||||||||
|
Total ASSETS
|
|
110,545 |
|
|
111,408 |
|
Total LIABILITIES & EQUITY |
|
110,545 |
|
|
111,408 |
| |||||
22
Appendix 7 : currency sensitivity
2019 Business EPS currency sensitivity
|
Currency
|
Variation
|
Business EPS Sensitivity
| ||
| U.S. Dollar |
+0.05 USD/EUR | -EUR 0.10 | ||
| Japanese Yen |
+5 JPY/EUR | -EUR 0.02 | ||
| Chinese Yuan |
+0.2 CNY/EUR | -EUR 0.02 | ||
| Brazilian Real |
+0.4 BRL/EUR | -EUR 0.01 | ||
| Russian Ruble |
+10 RUB/EUR | -EUR 0.03 | ||
Currency exposure on Q2 2019 sales
|
Currency
|
Q2 2019
| |||
| US $ |
34.2% | |||
| Euro € |
22.5% | |||
| Chinese Yuan |
8.2% | |||
| Japanese Yen |
5.2% | |||
| Brazilian Real |
2.6% | |||
| Russian Ruble |
1.9% | |||
| Australian $ |
1.7% | |||
| Mexican Peso |
1.6% | |||
| British Pound |
1.5% | |||
| Canadian $ |
1.5% | |||
| Others |
19.1% |
Currency average rates
| Q2 2018
|
Q2 2019
|
Change
|
||||||||||
| €/$ |
1.19 | 1.12 | -5.7% | |||||||||
| €/Yen |
130.15 | 123.48 | -5.1% | |||||||||
| €/Yuan |
7.60 | 7.68 | +1.1% | |||||||||
| €/Real |
4.30 | 4.40 | +2.5% | |||||||||
|
€/Ruble |
74.02 | 72.56 | -2.0% | |||||||||
23
Appendix 8: R&D Pipeline
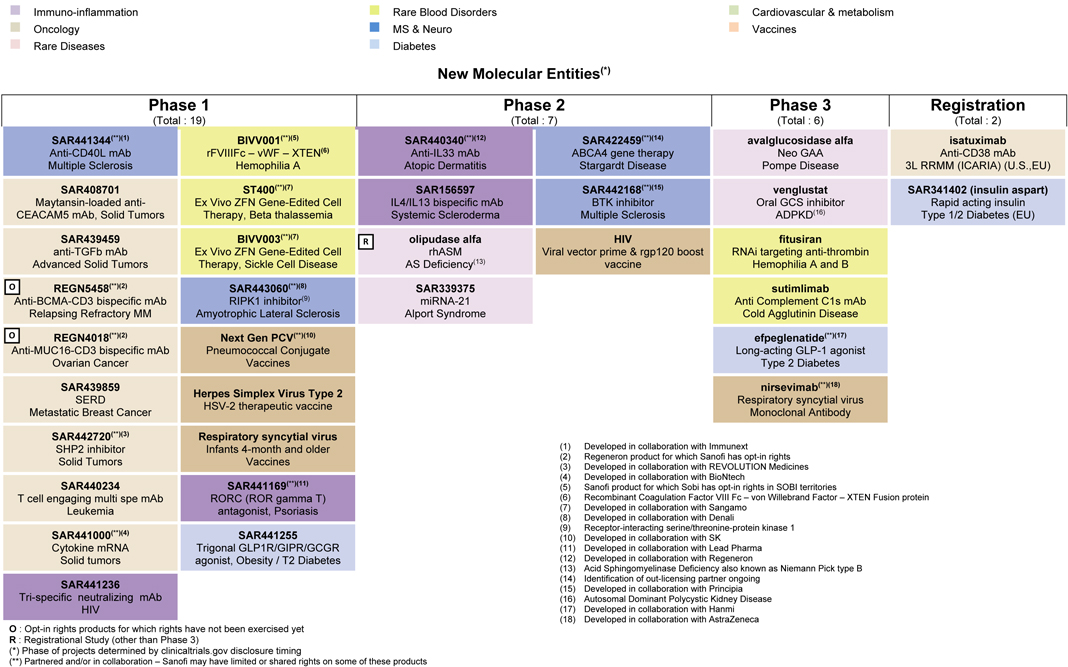
Immuno-inflammation Rare Blood Disorders Cardiovascular & metabolism Oncology MS & Neuro Vaccines Rare Diseases Diabetes New Molecular Entities(*) Phase 1 Phase 2 Phase 3 Registration (Total : 19) (Total : 7) (Total : 6) (Total : 2) SAR441344(**)(1) BIVV001(**)(5) SAR440340(**)(12) SAR422459(**)(14) avalglucosidase alfa isatuximab Anti-CD40L mAb rFVIIIFc – vWF – XTEN(6) Anti-IL33 mAb ABCA4 gene therapy Neo GAA Anti-CD38 mAb Multiple Sclerosis Hemophilia A Atopic Dermatitis Stargardt Disease Pompe Disease 3L RRMM (ICARIA) (U.S.,EU) SAR408701 ST400(**)(7) SAR156597 SAR442168(**)(15) venglustat SAR341402 (insulin aspart) Maytansin-loaded anti- Ex Vivo ZFN Gene-Edited Cell IL4/IL13 bispecific mAb BTK inhibitor Oral GCS inhibitor Rapid acting insulin CEACAM5 mAb, Solid Tumors Therapy, Beta thalassemia Systemic Scleroderma Multiple Sclerosis ADPKD(16) Type 1/2 Diabetes (EU) SAR439459 BIVV003(**)(7) olipudase alfa HIV fitusiran anti-TGFb mAb Ex Vivo ZFN Gene-Edited Cell R rhASM Viral vector prime & rgp120 boost RNAi targeting anti-thrombin Advanced Solid Tumors Therapy, Sickle Cell Disease AS Deficiency(13) vaccine Hemophilia A and B O REGN5458(**)(2) SAR443060(**)(8) SAR339375 sutimlimab Anti-BCMA-CD3 bispecific mAb RIPK1 inhibitor(9) miRNA-21 Anti Complement C1s mAb Relapsing Refractory MM Amyotrophic Lateral Sclerosis Alport Syndrome Cold Agglutinin Disease O REGN4018(**)(2) Next Gen PCV(**)(10) efpeglenatide(**)(17) Anti-MUC16-CD3 bispecific mAb Pneumococcal Conjugate Long-acting GLP-1 agonist Ovarian Cancer Vaccines Type 2 Diabetes SAR439859 Herpes Simplex Virus Type 2 nirsevimab(**)(18) SERD Respiratory syncytial virus HSV-2 therapeutic vaccine Metastatic Breast Cancer Monoclonal Antibody SAR442720(**)(3) Respiratory syncytial virus SHP2 inhibitor Infants 4-month and older (1) Developed in collaboration with Immunext (2) Regeneron product for which Sanofi has opt-in rights Solid Tumors Vaccines (3) Developed in collaboration with REVOLUTION Medicines (4) Developed in collaboration with BioNtech SAR440234 SAR441169(**)(11) (5) Sanofi product for which Sobi has opt-in rights in SOBI territories T cell engaging multi spe mAb RORC (ROR gamma T) (6) Recombinant Coagulation Factor VIII Fc – von Willebrand Factor – XTEN Fusion protein (7) Developed in collaboration with Sangamo Leukemia antagonist, Psoriasis (8) Developed in collaboration with Denali (9) Receptor-interacting serine/threonine-protein kinase 1 SAR441000(**)(4) SAR441255 (10) Developed in collaboration with SK Cytokine mRNA Trigonal GLP1R/GIPR/GCGR (11) Developed in collaboration with Lead Pharma Solid tumors agonist, Obesity / T2 Diabetes (12) Developed in collaboration with Regeneron (13) Acid Sphingomyelinase Deficiency also known as Niemann Pick type B (14) Identification of out-licensing partner ongoing SAR441236 (15) Developed in collaboration with Principia Tri-specific neutralizing mAb (16) Autosomal Dominant Polycystic Kidney Disease HIV (17) Developed in collaboration with Hanmi O : Opt-in rights products for which rights have not been exercised yet (18) Developed in collaboration with AstraZeneca R : Registrational Study (other than Phase 3) (*) Phase of projects determined by clinicaltrials.gov disclosure timing (**) Partnered and/or in collaboration – Sanofi may have limited or shared rights on some of these products
24
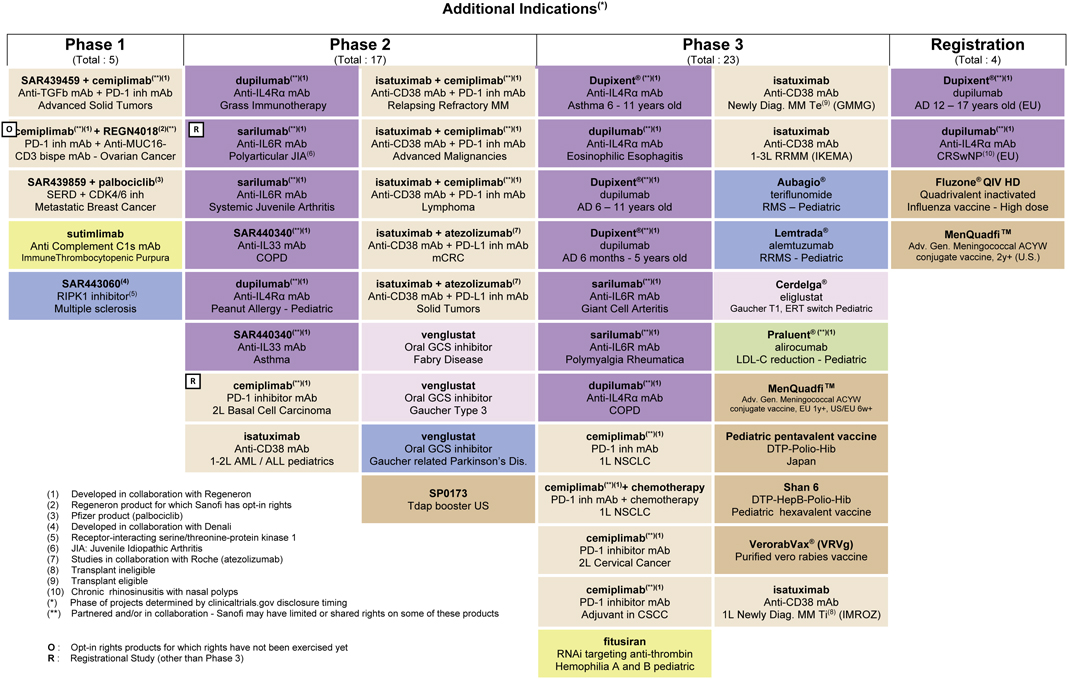
Additional Indications(*) Phase 1 Phase 2 Phase 3 Registration (Total : 5) (Total : 17) (Total : 23) (Total : 4) SAR439459 + cemiplimab(**)(1) dupilumab(**)(1) isatuximab + cemiplimab(**)(1) Dupixent® (**)(1) isatuximab Dupixent®(**)(1) Anti-TGFb mAb + PD-1 inh mAb Anti-IL4Rá mAb Anti-CD38 mAb + PD-1 inh mAb Anti-IL4Rá mAb Anti-CD38 mAb dupilumab Advanced Solid Tumors Grass Immunotherapy Relapsing Refractory MM Asthma 6 - 11 years old Newly Diag. MM Te(9) (GMMG) AD 12 – 17 years old (EU) O cemiplimab(**)(1) + REGN4018(2)(**) R sarilumab(**)(1) isatuximab + cemiplimab(**)(1) dupilumab(**)(1) isatuximab dupilumab(**)(1) PD-1 inh mAb + Anti-MUC16- Anti-IL6R mAb Anti-CD38 mAb + PD-1 inh mAb Anti-IL4Rá mAb Anti-CD38 mAb Anti-IL4Rá mAb CD3 bispe mAb - Ovarian Cancer Polyarticular JIA(6) Advanced Malignancies Eosinophilic Esophagitis 1-3L RRMM (IKEMA) CRSwNP(10) (EU) SAR439859 + palbociclib(3) sarilumab(**)(1) isatuximab + cemiplimab(**)(1) Dupixent®(**)(1) Aubagio® Fluzone® QIV HD SERD + CDK4/6 inh Anti-IL6R mAb Anti-CD38 mAb + PD-1 inh mAb dupilumab teriflunomide Quadrivalent inactivated Metastatic Breast Cancer Systemic Juvenile Arthritis Lymphoma AD 6 – 11 years old RMS – Pediatric Influenza vaccine - High dose sutimlimab SAR440340(**)(1) isatuximab + atezolizumab(7) Dupixent®(**)(1) Lemtrada® MenQuadfi TM Anti Complement C1s mAb Anti-IL33 mAb Anti-CD38 mAb + PD-L1 inh mAb dupilumab alemtuzumab Adv. Gen. Meningococcal ACYW ImmuneThrombocytopenic Purpura COPD mCRC AD 6 months - 5 years old RRMS - Pediatric conjugate vaccine, 2y+ (U.S.) SAR443060(4) dupilumab(**)(1) isatuximab + atezolizumab(7) sarilumab(**)(1) Cerdelga® RIPK1 inhibitor(5) Anti-IL4Rá mAb Anti-CD38 mAb + PD-L1 inh mAb Anti-IL6R mAb eliglustat Multiple sclerosis Peanut Allergy - Pediatric Solid Tumors Giant Cell Arteritis Gaucher T1, ERT switch Pediatric SAR440340(**)(1) venglustat sarilumab(**)(1) Praluent® (**)(1) Anti-IL33 mAb Oral GCS inhibitor Anti-IL6R mAb alirocumab Asthma Fabry Disease Polymyalgia Rheumatica LDL-C reduction - Pediatric R (**)(1) (**)(1) cemiplimab venglustat dupilumab MenQuadfi TM PD-1 inhibitor mAb Oral GCS inhibitor Anti-IL4Rá mAb Adv. Gen. Meningococcal ACYW 2L Basal Cell Carcinoma Gaucher Type 3 COPD conjugate vaccine, EU 1y+, US/EU 6w+ isatuximab venglustat cemiplimab(**)(1) Pediatric pentavalent vaccine Anti-CD38 mAb Oral GCS inhibitor PD-1 inh mAb DTP-Polio-Hib 1-2L AML / ALL pediatrics Gaucher related Parkinson’s Dis. 1L NSCLC Japan cemiplimab(**)(1)+ chemotherapy Shan 6 (1) Developed in collaboration with Regeneron SP0173 PD-1 inh mAb + chemotherapy DTP-HepB-Polio-Hib (2) Regeneron product for which Sanofi has opt-in rights Tdap booster US (3) Pfizer product (palbociclib) 1L NSCLC Pediatric hexavalent vaccine (4) Developed in collaboration with Denali (5) Receptor-interacting serine/threonine-protein kinase 1 cemiplimab(**)(1) VerorabVax® (VRVg) (6) JIA: Juvenile Idiopathic Arthritis PD-1 inhibitor mAb (7) Studies in collaboration with Roche (atezolizumab) Purified vero rabies vaccine 2L Cervical Cancer (8) Transplant ineligible (9) Transplant eligible (10) Chronic rhinosinusitis with nasal polyps cemiplimab(**)(1) isatuximab (*) Phase of projects determined by clinicaltrials.gov disclosure timing PD-1 inhibitor mAb Anti-CD38 mAb (**) Partnered and/or in collaboration - Sanofi may have limited or shared rights on some of these products (8) Adjuvant in CSCC 1L Newly Diag. MM Ti (IMROZ) fitusiran O : Opt-in rights products for which rights have not been exercised yet R : Registrational Study (other than Phase 3) RNAi targeting anti-thrombin Hemophilia A and B pediatric
25
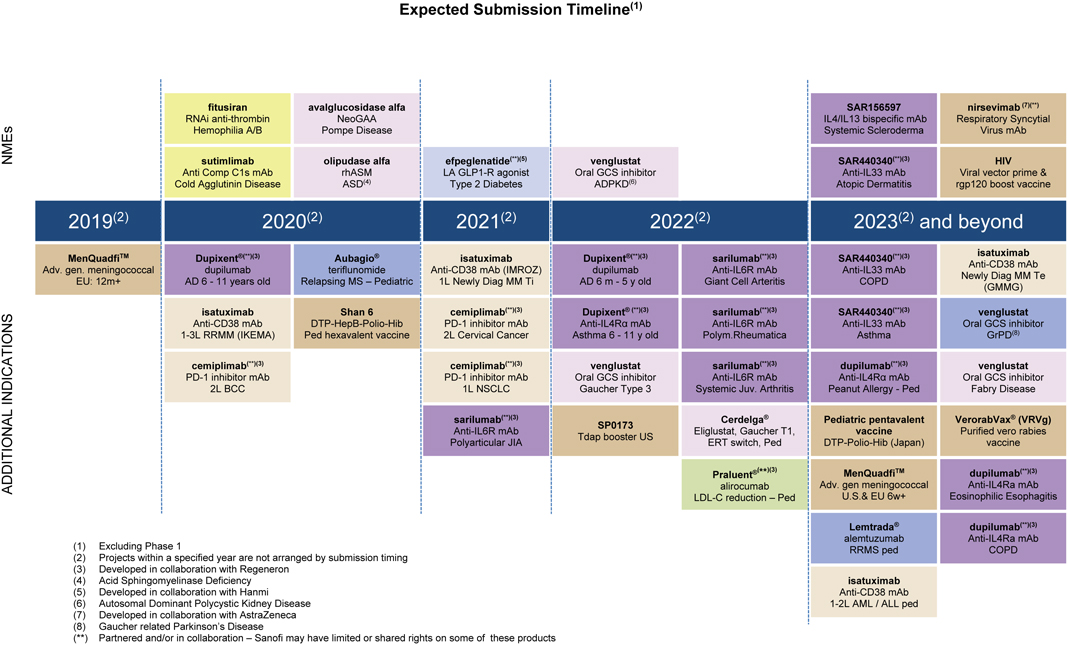
Expected Submission Timeline(1) fitusiran avalglucosidase alfa SAR156597 nirsevimab (7)(**) RNAi anti-thrombin NeoGAA IL4/IL13 bispecific mAb Respiratory Syncytial Hemophilia A/B Pompe Disease Systemic Scleroderma Virus mAb NMEs sutimlimab olipudase alfa efpeglenatide(**)(5) venglustat SAR440340(**)(3) HIV Anti Comp C1s mAb rhASM LA GLP1-R agonist Oral GCS inhibitor Anti-IL33 mAb Viral vector prime & Cold Agglutinin Disease ASD(4) Type 2 Diabetes ADPKD(6) Atopic Dermatitis rgp120 boost vaccine (2) (2) (2) (2) (2) 2019 2020 2021 2022 2023 and beyond TM ®(**)(3) ® ®(**)(3) (**)(3) (**)(3) isatuximab MenQuadfi Dupixent Aubagio isatuximab Dupixent sarilumab SAR440340 Anti-CD38 mAb Adv. gen. meningococcal dupilumab teriflunomide Anti-CD38 mAb (IMROZ) dupilumab Anti-IL6R mAb Anti-IL33 mAb Newly Diag MM Te EU: 12m+ AD 6 - 11 years old Relapsing MS – Pediatric 1L Newly Diag MM Ti AD 6 m - 5 y old Giant Cell Arteritis COPD (GMMG) isatuximab Shan 6 cemiplimab(**)(3) Dupixent® (**)(3) sarilumab(**)(3) SAR440340(**)(3) venglustat Anti-CD38 mAb DTP-HepB-Polio-Hib PD-1 inhibitor mAb Anti-IL4Rá mAb Anti-IL6R mAb Anti-IL33 mAb Oral GCS inhibitor 1-3L RRMM (IKEMA) Ped hexavalent vaccine 2L Cervical Cancer Asthma 6 - 11 y old Polym.Rheumatica Asthma GrPD(8) cemiplimab(**)(3) cemiplimab(**)(3) venglustat sarilumab(**)(3) dupilumab(**)(3) venglustat PD-1 inhibitor mAb PD-1 inhibitor mAb Oral GCS inhibitor Anti-IL6R mAb Anti-IL4Rá mAb Oral GCS inhibitor INDICATIONS 2L BCC 1L NSCLC Gaucher Type 3 Systemic Juv. Arthritis Peanut Allergy - Ped Fabry Disease sarilumab(**)(3) SP0173 Cerdelga® Pediatric pentavalent VerorabVax® (VRVg) Anti-IL6R mAb Eliglustat, Gaucher T1, vaccine Purified vero rabies Tdap booster US Polyarticular JIA ERT switch, Ped DTP-Polio-Hib (Japan) vaccine Praluent®(**)(3) MenQuadfiTM dupilumab(**)(3) alirocumab Adv. gen meningococcal Anti-IL4Ra mAb ADDITIONAL LDL-C reduction – Ped U.S.& EU 6w+ Eosinophilic Esophagitis Lemtrada® dupilumab(**)(3) alemtuzumab Anti-IL4Ra mAb (1) Excluding Phase 1 RRMS ped COPD (2) Projects within a specified year are not arranged by submission timing (3) Developed in collaboration with Regeneron (4) Acid Sphingomyelinase Deficiency isatuximab (5) Developed in collaboration with Hanmi Anti-CD38 mAb (6) Autosomal Dominant Polycystic Kidney Disease 1-2L AML / ALL ped (7) Developed in collaboration with AstraZeneca (8) Gaucher related Parkinson’s Disease (**) Partnered and/or in collaboration – Sanofi may have limited or shared rights on some of these products
26
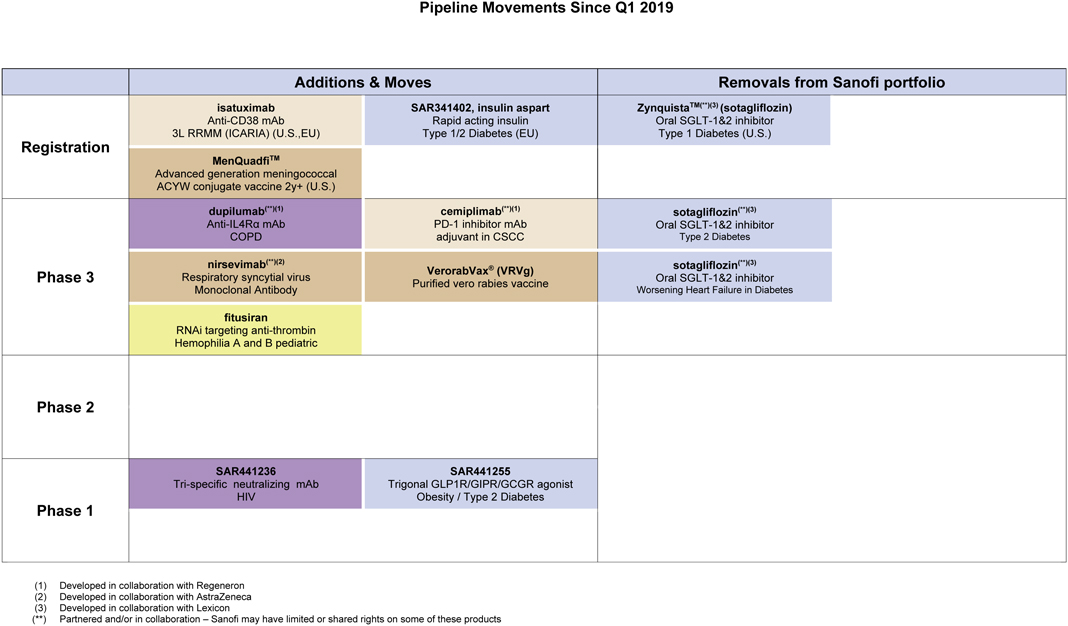
Pipeline Movements Since Q1 2019 Additions & Moves Removals from Sanofi portfolio isatuximab SAR341402, insulin aspart ZynquistaTM(**)(3) (sotagliflozin) Anti-CD38 mAb Rapid acting insulin Oral SGLT-1&2 inhibitor Registration 3L RRMM (ICARIA) (U.S.,EU) Type 1/2 Diabetes (EU) Type 1 Diabetes (U.S.) MenQuadfiTM Advanced generation meningococcal ACYW conjugate vaccine 2y+ (U.S.) dupilumab(**)(1) cemiplimab(**)(1) sotagliflozin(**)(3) Anti-IL4Rá mAb PD-1 inhibitor mAb Oral SGLT-1&2 inhibitor COPD adjuvant in CSCC Type 2 Diabetes nirsevimab(**)(2) VerorabVax® (VRVg) sotagliflozin(**)(3) Phase 3 Respiratory syncytial virus Oral SGLT-1&2 inhibitor Purified vero rabies vaccine Monoclonal Antibody Worsening Heart Failure in Diabetes fitusiran RNAi targeting anti-thrombin Hemophilia A and B pediatric Phase 2 SAR441236 SAR441255 Tri-specific neutralizing mAb Trigonal GLP1R/GIPR/GCGR agonist Phase 1 HIV Obesity / Type 2 Diabetes (1) Developed in collaboration with Regeneron (2) Developed in collaboration with AstraZeneca (3) Developed in collaboration with Lexicon (**) Partnered and/or in collaboration – Sanofi may have limited or shared rights on some of these products
27
Appendix 9: Expected R&D milestones
|
Products
|
Expected milestones
|
Timing
| ||
| SAR439859 (SERD) |
Proof of concept study read-out in metastatic Breast Cancer | Q3 2019 | ||
| Dupixent®(**) (1) |
EU regulatory decision in Atopic Dermatitis in Adolescent patients | Q3 2019 | ||
| sutimlimab |
Proof of concept study read-out in refractory ITP(2) | Q4 2019 | ||
| Fluzone® QIV HD |
U.S. regulatory decision for ³ 65-year old age group | Q4 2019 | ||
| sutimlimab |
Pivotal trial read-out in Cold Agglutinin Disease | Q4 2019 | ||
| Dupixent®(**)(1) |
Pivotal trial read-out in Atopic Dermatitis in 6-11 years | Q4 2019 | ||
| SAR440340 (anti-IL33 mAb)(**)(1) |
Proof of concept study read-out in Chronic Obstructive Pulmonary Disease | Q4 2019 | ||
| dupilumab(**) (1) |
EU regulatory decision in Chronic Rhinosinusitis with Nasal Polyps | Q1 2020 | ||
| isatuximab |
Pivotal trial read-out in 1-3L RRMM (IKEMA) | Q1 2020 | ||
| olipudase alfa |
Pivotal trial read-out in Acid Sphingomyelinase Deficiency | Q1 2020 | ||
| isatuximab |
U.S. regulatory decision in 3L Relapsed-Refractory Multiple Myeloma | Q2 2020 | ||
| isatuximab |
EU regulatory decision in 3L Relapsed-Refractory Multiple Myeloma | Q2 2020 | ||
| MenQuadfi™ |
U.S. regulatory decision for > 2 year old age group | Q2 2020 | ||
| Fluzone® QIV HD |
EU regulatory decision for ³ 65-years old age group | Q2 2020 | ||
| avalglucosidase alfa
|
Pivotal trial read-out in Pompe Disease
|
Q2 2020
| ||
| (1) | Developed in collaboration with Regeneron |
| (2) | Immune Thrombocytopenic Purpura |
| (**) | Partnered and/or in collaboration – Sanofi may have limited or shared rights on some of these products |
28
Appendix 10: Definitions of non-GAAP financial indicators
Company
“Company” corresponds to Sanofi and its subsidiaries
Company sales at constant exchange rates (CER)
When we refer to changes in our net sales “at constant exchange rates” (CER), this means that we exclude the effect of changes in exchange rates.
We eliminate the effect of exchange rates by recalculating net sales for the relevant period at the exchange rates used for the previous period.
Reconciliation of net sales to Company sales at constant exchange rates for the second quarter and first half 2019
|
€ million
|
Q2 2019
|
H1 2019
|
||||||
| Net sales |
8,628 | 17,019 | ||||||
| Effect of exchange rates |
131 | 289 | ||||||
| Company sales at constant exchange rates |
8,497 | 16,730 | ||||||
Business net income
Sanofi publishes a key non-GAAP indicator.
Business net income is defined as net income attributable to equity holders of Sanofi excluding:
| • | amortization of intangible assets, |
| • | impairment of intangible assets, |
| • | fair value remeasurement of contingent consideration related to business combinations or to disposals, |
| • | other impacts associated with acquisitions (including impacts of acquisitions on associates and joint ventures), |
| • | restructuring costs and similar items(1), |
| • | other gains and losses (including gains and losses on disposals of non-current assets(1)), |
| • | effects of IFRS16 on lease accounting, |
| • | costs or provisions associated with litigation(1), |
| • | tax effects related to the items listed above as well as effects of major tax disputes, |
| • | net income attributable to non-controlling interests related to the items listed above, |
| (1) | Reported in the line items Restructuring costs and similar items and Gains a losses on disposals, and litigation, which are defined in Notes B.19 and B.20. to our consolidated financial statements. |
29