UNITED STATES
SECURITIES AND EXCHANGE COMMISSION
Washington, D.C. 20549
FORM 6-K
REPORT OF FOREIGN PRIVATE ISSUER
PURSUANT TO RULE 13a-16 OR 15d-16
UNDER THE SECURITIES EXCHANGE ACT OF 1934
For the month of July 2018
Commission File Number: 001-31368
SANOFI
(Translation of registrants name into English)
54, rue La Boétie, 75008 Paris, FRANCE
(Address of principal executive offices)
Indicate by check mark whether the registrant files or will file annual reports under cover Form 20-F or Form 40-F.
Form 20-F ☒ Form 40-F ☐
Indicate by check mark if the registrant is submitting the Form 6-K in paper as permitted by Regulation S-T Rule 101(b)(1): ☐
Indicate by check mark if the registrant is submitting the Form 6-K in paper as permitted by Regulation S-T Rule 101(b)(7): ☐
Indicate by check mark whether the registrant by furnishing the information contained in this Form is also thereby furnishing the information to the Commission pursuant to Rule 12g3-2(b) under the Securities Exchange Act of 1934.
Yes ☐ No ☒
If Yes marked, indicate below the file number assigned to the registrant in connection with Rule 12g3-2(b): 82-
In July 2018, Sanofi issued the financial statements and half year management report attached hereto as Exhibit 99.1 and 99.2 which are incorporated herein by reference.
Exhibit List
Exhibit No. |
Description |
Exhibit 99.1 |
Condensed half-year consolidated financial statements for 2018 |
Exhibit 99.2 |
2018 Half-year management report |
Exhibit Index
Exhibit No. |
Description |
Exhibit 99.1 |
Condensed half-year consolidated financial statements for 2018 |
Exhibit 99.2 |
2018 Half-year management report |
SIGNATURES
Pursuant to the requirements of the Securities Exchange Act of 1934, the registrant has duly caused this report to be signed on its behalf by the undersigned, thereunto duly authorized.
Dated: July 31, 2018 | SANOFI | |||||
By | /s/ Alexandra Roger | |||||
Name: | Alexandra Roger | |||||
Title: | Head of Securities Law and Capital Markets |
EXHIBIT 99.1
2018
CONDENSED HALF-YEAR CONSOLIDATED FINANCIAL STATEMENTS
CONTENTS
1 CONDENSED HALF-YEAR CONSOLIDATED FINANCIAL STATEMENTS |
1 | |||
CONSOLIDATED BALANCE SHEETS ASSETS |
1 | |||
CONSOLIDATED BALANCE SHEETS EQUITY AND LIABILITIES |
2 | |||
CONSOLIDATED INCOME STATEMENTS |
3 | |||
CONSOLIDATED STATEMENTS OF COMPREHENSIVE INCOME |
4 | |||
CONSOLIDATED STATEMENTS OF CHANGES IN EQUITY |
5 | |||
CONSOLIDATED STATEMENTS OF CASH FLOWS |
8 | |||
NOTES TO THE CONDENSED HALF-YEAR CONSOLIDATED FINANCIAL STATEMENTS AS OF JUNE 30, 2018 |
10 | |||
INTRODUCTION |
10 | |||
A/ Basis of preparation of the half-year financial statements and accounting policies |
10 | |||
B/ Significant information for the first half of 2018 |
25 | |||
C/ Events subsequent to June 30, 2018 |
50 |
1 CONDENSED HALF-YEAR CONSOLIDATED FINANCIAL STATEMENTS
CONSOLIDATED BALANCE SHEETS ASSETS
( million) | Note | June 30, 2018 |
December 31, 2017 (a) |
|||||||||
Property, plant and equipment |
B.2. | 9,470 | 9,579 | |||||||||
Goodwill |
B.3. | 44,828 | 40,264 | |||||||||
Other intangible assets |
B.3. | 22,436 | 13,080 | |||||||||
Investments accounted for using the equity method |
B.5. | 2,964 | 2,847 | |||||||||
Other non-current assets |
B.6. | 3,133 | 3,364 | |||||||||
Deferred tax assets |
4,478 | 4,291 | ||||||||||
Non-current assets |
87,309 | 73,425 | ||||||||||
Inventories |
7,364 | 6,818 | ||||||||||
Accounts receivable |
B.7. | 6,602 | 7,216 | |||||||||
Other current assets |
2,477 | 2,005 | ||||||||||
Cash and cash equivalents |
B.9. | 7,493 | 10,315 | |||||||||
Current assets |
23,936 | 26,354 | ||||||||||
Assets held for sale or exchange |
B.21. | 1,533 | 34 | |||||||||
TOTAL ASSETS |
112,778 | 99,813 |
(a) | Includes the effects of first-time application of IFRS 15 on revenue recognition (see Note A.1.2.). |
The accompanying notes on pages 10 to 50 are an integral part of the condensed half-year consolidated financial statements.
1 | Sanofi 2018 HALF-YEAR FINANCIAL REPORT
CONSOLIDATED BALANCE SHEETS EQUITY AND LIABILITIES
( million) | Note | June 30, 2018 |
December 31, 2017 (a) |
|||||||||
Equity attributable to equity holders of Sanofi |
56,197 | 58,070 | ||||||||||
Equity attributable to non-controlling interests |
164 | 169 | ||||||||||
Total equity |
B.8. | 56,361 | 58,239 | |||||||||
Long-term debt |
B.9. | 22,788 | 14,326 | |||||||||
Non-current liabilities related to business combinations and to non-controlling interests |
B.11. | 1,018 | 1,026 | |||||||||
Non-current provisions and other non-current liabilities |
B.12. | 8,949 | 9,154 | |||||||||
Deferred tax liabilities |
3,784 | 1,605 | ||||||||||
Non-current liabilities |
36,539 | 26,111 | ||||||||||
Accounts payable |
4,582 | 4,633 | ||||||||||
Current liabilities related to business combinations and to non-controlling interests |
B.11. | 450 | 343 | |||||||||
Current provisions and other current liabilities |
8,422 | 9,212 | ||||||||||
Short-term debt and current portion of long-term debt |
B.9. | 6,153 | 1,275 | |||||||||
Current liabilities |
19,607 | 15,463 | ||||||||||
Liabilities related to assets held for sale or exchange |
B.21. | 271 | | |||||||||
TOTAL EQUITY AND LIABILITIES |
112,778 | 99,813 |
(a) | Includes the effects of first-time application of IFRS 15 on revenue recognition (see Note A.1.2.). |
The accompanying notes on pages 10 to 50 are an integral part of the condensed half-year consolidated financial statements.
2018 HALF-YEAR FINANCIAL REPORT Sanofi | 2
CONSOLIDATED INCOME STATEMENTS
( million) | Note | June 30, 2018 (6 months) |
June 30, 2017 (6 months) (a) |
December 31, 2017 (12 months) (a) |
||||||||||||
Net sales |
B.20.4. | 16,074 | 17,324 | 35,072 | ||||||||||||
Other revenues |
533 | 519 | 1,149 | |||||||||||||
Cost of sales |
(5,265 | ) | (5,671 | ) | (11,613 | ) | ||||||||||
Gross profit |
11,342 | 12,172 | 24,608 | |||||||||||||
Research and development expenses |
(2,755 | ) | (2,667 | ) | (5,472 | ) | ||||||||||
Selling and general expenses |
(4,819 | ) | (5,054 | ) | (10,072 | ) | ||||||||||
Other operating income |
B.15. | 323 | 173 | 237 | ||||||||||||
Other operating expenses |
B.15. | (165 | ) | (71 | ) | (233 | ) | |||||||||
Amortization of intangible assets |
B.3. | (999 | ) | (990 | ) | (1,866 | ) | |||||||||
Impairment of intangible assets |
B.4. | (101 | ) | (12 | ) | (293 | ) | |||||||||
Fair value remeasurement of contingent consideration |
B.6 B.11. | 10 | (100 | ) | (159 | ) | ||||||||||
Restructuring costs and similar items |
B.16. | (607 | ) | (364 | ) | (731 | ) | |||||||||
Other gains and losses, and litigation |
B.17. | (67 | ) | (7 | ) | (215 | ) | |||||||||
Operating income |
2,162 | 3,080 | 5,804 | |||||||||||||
Financial expenses |
B.18. | (202 | ) | (218 | ) | (420 | ) | |||||||||
Financial income |
B.18. | 97 | 95 | 147 | ||||||||||||
Income before tax and investments accounted for using the equity method |
2,057 | 2,957 | 5,531 | |||||||||||||
Income tax expense |
B.19. | (297 | ) | (612 | ) | (1,722 | ) | |||||||||
Share of profit/(loss) of investments accounted for using the equity method |
75 | 27 | 85 | |||||||||||||
Net income excluding the exchanged/held-for-exchange Animal Health business |
1,835 | 2,372 | 3,894 | |||||||||||||
Net income/(loss) of the exchanged/held-for-exchange Animal Health business(b) |
| 4,421 | 4,643 | |||||||||||||
Net income |
1,835 | 6,793 | 8,537 | |||||||||||||
Net income attributable to non-controlling interests |
57 | 64 | 121 | |||||||||||||
Net income attributable to equity holders of Sanofi |
1,778 | 6,729 | 8,416 | |||||||||||||
Average number of shares outstanding (million) |
B.8.7. | 1,247.8 | 1,260.3 | 1,256.9 | ||||||||||||
Average number of shares after dilution (million) |
B.8.7. | 1,254.9 | 1,270.6 | 1,266.8 | ||||||||||||
Basic earnings per share (in euros) |
1.42 | 5.34 | 6.70 | |||||||||||||
Basic earnings per share excluding the exchanged/held-for-exchange Animal Health business (in euros) |
1.42 | 1.83 | 3.00 | |||||||||||||
Diluted earnings per share (in euros) |
1.42 | 5.30 | 6.64 | |||||||||||||
Diluted earnings per share excluding the exchanged/held-for-exchange Animal Health business (in euros) |
1.42 | 1.82 | 2.98 |
(a) | Includes the effects of first-time application of IFRS 15 on revenue recognition (see Note A.1.2.). |
(b) | For 2017, the gain on the divestment of the Animal Health business is presented separately in accordance with IFRS 5, Non-Current Assets Held for Sale and Discontinued Operations; see Note D.36. to the consolidated financial statements for the year ended December 31, 2017. |
The accompanying notes on pages 10 to 50 are an integral part of the condensed half-year consolidated financial statements.
3 | Sanofi 2018 HALF-YEAR FINANCIAL REPORT
CONSOLIDATED STATEMENTS OF COMPREHENSIVE INCOME
( million) | Note | June 30, (6 months) |
June 30, (6 months) |
December 31, (12 months) |
||||||||||||
Net income |
1,835 | 6,793 | 8,537 | |||||||||||||
Attributable to equity holders of Sanofi |
1,778 | 6,729 | 8,416 | |||||||||||||
Attributable to non-controlling interests |
57 | 64 | 121 | |||||||||||||
Other comprehensive income: |
||||||||||||||||
Actuarial gains/(losses) |
B.8.8. | 118 | 282 | (28 | ) | |||||||||||
Change in fair value of equity instruments included in financial assets (b) |
B.8.8. | (213 | ) | | | |||||||||||
Tax effects |
B.8.8. | 12 | (60 | ) | (90 | ) | ||||||||||
Sub-total: items not subsequently reclassifiable to profit or loss (A) |
(83 | ) | 222 | (118 | ) | |||||||||||
Change in fair value of available-for-sale financial assets (b) |
B.8.8. | | 325 | 838 | ||||||||||||
Change in fair value of debt instruments included in financial assets (b) |
B.8.8. | (1 | ) | | | |||||||||||
Change in fair value of cash flow hedges |
B.8.8. | 5 | (28 | ) | (24 | ) | ||||||||||
Currency translation differences |
B.8.8. | 804 | (2,011 | ) | (3,239 | ) | ||||||||||
Tax effects |
B.8.8. | (2 | ) | (51 | ) | (137 | ) | |||||||||
Sub-total: items subsequently reclassifiable to profit or loss (B) |
806 | (1,765 | ) | (2,562 | ) | |||||||||||
Other comprehensive income for the period, net of taxes (A+B) |
723 | (1,543 | ) | (2,680 | ) | |||||||||||
Comprehensive income |
2,558 | 5,250 | 5,857 | |||||||||||||
Attributable to equity holders of Sanofi |
2,504 | 5,194 | 5,751 | |||||||||||||
Attributable to non-controlling interests |
54 | 56 | 106 |
(a) | Includes the effects of first-time application of IFRS 15 on revenue recognition (see Note A.1.2.). |
(b) | Following the first-time application of IFRS 9, the effects of changes in fair value of financial instruments that are presented in the single line item Change in fair value of available-for-sale financial assets for 2017 are presented in two separate line items for 2018: Change in fair value of equity instruments included in financial assets and Change in fair value of debt instruments included in financial assets. |
The accompanying notes on pages 10 to 50 are an integral part of the condensed half-year consolidated financial statements.
2018 HALF-YEAR FINANCIAL REPORT Sanofi | 4
CONSOLIDATED STATEMENTS OF CHANGES IN EQUITY
( million) |
Share capital |
Additional paid-in capital and retained earnings (a) |
Treasury shares |
Stock options and other share- based payments |
Other comprehensive income (a) |
Attributable to equity holders of Sanofi |
Attributable to non- controlling |
Total equity |
||||||||||||||||||||||||
Balance at January 1, 2016 per the published financial statements |
2,611 | 52,010 | (298 | ) | 2,814 | 912 | 58,049 | 161 | 58,210 | |||||||||||||||||||||||
First-time application of IFRS 15 (b) |
| (2 | ) | | | | (2 | ) | | (2 | ) | |||||||||||||||||||||
Balance at January 1, 2016 including the effects of IFRS 15 (b) |
2,611 | 52,008 | (298 | ) | 2,814 | 912 | 58,047 | 161 | 58,208 | |||||||||||||||||||||||
Other comprehensive income for the period |
| (127 | ) | | | 1,052 | 925 | 3 | 928 | |||||||||||||||||||||||
Net income for the period (b) |
| 4,709 | | | | 4,709 | 91 | 4,800 | ||||||||||||||||||||||||
Comprehensive income for the period (b) |
| 4,582 | | | 1,052 | 5,634 | 94 | 5,728 | ||||||||||||||||||||||||
Dividend paid out of 2015 earnings (2.93 per share) |
| (3,759 | ) | | | | (3,759 | ) | | (3,759 | ) | |||||||||||||||||||||
Payment of dividends to non-controlling interests |
| | | | | | (110 | ) | (110 | ) | ||||||||||||||||||||||
Share repurchase program (c) |
| | (2,905 | ) | | | (2,905 | ) | | (2,905 | ) | |||||||||||||||||||||
Reduction in share capital (c) |
(45 | ) | (1,655 | ) | 1,700 | | | | | | ||||||||||||||||||||||
Share-based payment plans: |
||||||||||||||||||||||||||||||||
Exercise of stock options |
7 | 212 | | | | 219 | | 219 | ||||||||||||||||||||||||
Issuance of restricted shares |
7 | (7 | ) | | | | | | | |||||||||||||||||||||||
Employee share ownership plan |
4 | 96 | | | | 100 | | 100 | ||||||||||||||||||||||||
Value of services obtained from employees |
| | | 227 | | 227 | | 227 | ||||||||||||||||||||||||
Tax effects of the exercise of stock options |
| | | (9 | ) | | (9 | ) | | (9 | ) | |||||||||||||||||||||
Change in non-controlling interests without loss of control |
| (2 | ) | | | | (2 | ) | 27 | 25 | ||||||||||||||||||||||
Change in non-controlling interests arising from divestment |
| | | | | | (2 | ) | (2 | ) | ||||||||||||||||||||||
Balance at December 31, 2016 (b) |
2,584 | 51,475 | (1,503 | ) | 3,032 | 1,964 | 57,552 | 170 | 57,722 |
5 | Sanofi 2018 HALF-YEAR FINANCIAL REPORT
( million) | Share capital |
Additional paid-in capital and retained earnings (a) |
Treasury shares |
Stock options and other share- based payments |
Other comprehensive income (a) |
Attributable to equity holders of Sanofi |
Attributable to non- controlling |
Total equity |
||||||||||||||||||||||||
Balance at January 1, 2017 (b) |
2,584 | 51,475 | (1,503 | ) | 3,032 | 1,964 | 57,552 | 170 | 57,722 | |||||||||||||||||||||||
Other comprehensive income for the period |
| 222 | | | (1,757 | ) | (1,535 | ) | (8 | ) | (1,543 | ) | ||||||||||||||||||||
Net income for the period (b) |
| 6,729 | | | | 6,729 | 64 | 6,793 | ||||||||||||||||||||||||
Comprehensive income for the period (b) |
| 6,951 | | | (1,757 | ) | 5,194 | 56 | 5,250 | |||||||||||||||||||||||
Dividend paid out of 2016 earnings (2.96 per share) |
| (3,710 | ) | | | | (3,710 | ) | | (3,710 | ) | |||||||||||||||||||||
Payment of dividends to non-controlling interests |
| | | | | | (55 | ) | (55 | ) | ||||||||||||||||||||||
Share repurchase program (c) |
| | (1,697 | ) | | | (1,697 | ) | | (1,697 | ) | |||||||||||||||||||||
Reduction in share capital (c) |
(73 | ) | (2,709 | ) | 2,782 | | | | | | ||||||||||||||||||||||
Share-based payment plans: |
||||||||||||||||||||||||||||||||
Exercise of stock options |
3 | 96 | | | | 99 | | 99 | ||||||||||||||||||||||||
Issuance of restricted shares |
7 | (7 | ) | | | | | | | |||||||||||||||||||||||
Value of services obtained from employees |
| | | 126 | | 126 | | 126 | ||||||||||||||||||||||||
Tax effects of the exercise of stock options |
| | | 13 | | 13 | | 13 | ||||||||||||||||||||||||
Other changes arising from issuance of restricted shares (d) |
| 16 | | | | 16 | | 16 | ||||||||||||||||||||||||
Change in non-controlling interests without loss of control |
| 27 | | | | 27 | (5 | ) | 22 | |||||||||||||||||||||||
Change in non-controlling interests arising from divestment |
| | | | | | (5 | ) | (5 | ) | ||||||||||||||||||||||
Balance at June 30, 2017 (b) |
2,521 | 52,139 | (418 | ) | 3,171 | 207 | 57,620 | 161 | 57,781 | |||||||||||||||||||||||
Other comprehensive income for the period (b) |
| (339 | ) | | | (791 | ) | (1,130 | ) | (7 | ) | (1,137 | ) | |||||||||||||||||||
Net income for the period (b) |
| 1,687 | | | | 1,687 | 57 | 1,744 | ||||||||||||||||||||||||
Comprehensive income for the period (b) |
| 1,348 | | | (791 | ) | 557 | 50 | 607 | |||||||||||||||||||||||
Payment of dividends to non-controlling interests |
| | | | | | (44 | ) | (44 | ) | ||||||||||||||||||||||
Share repurchase program (c) |
| | (462 | ) | | | (462 | ) | | (462 | ) | |||||||||||||||||||||
Reduction in share capital (c) |
(21 | ) | (845 | ) | 866 | | | | | | ||||||||||||||||||||||
Share-based payment plans: |
||||||||||||||||||||||||||||||||
Exercise of stock options |
5 | 119 | | | | 124 | | 124 | ||||||||||||||||||||||||
Employee share ownership plan |
3 | 103 | | | | 106 | | 106 | ||||||||||||||||||||||||
Value of services obtained from employees |
| | | 137 | | 137 | | 137 | ||||||||||||||||||||||||
Tax effects of the exercise of stock options |
| | | (10 | ) | | (10 | ) | | (10 | ) | |||||||||||||||||||||
Change in non-controlling interests without loss of control |
| (2 | ) | | | | (2 | ) | 4 | 2 | ||||||||||||||||||||||
Change in non-controlling interests arising from divestment |
| | | | | | (2 | ) | (2 | ) | ||||||||||||||||||||||
Balance at December 31, 2017 (b) |
2,508 | 52,862 | (14 | ) | 3,298 | (584 | ) | 58,070 | 169 | 58,239 |
2018 HALF-YEAR FINANCIAL REPORT Sanofi | 6
( million) | Share capital |
Additional paid-in capital and retained earnings (a) |
Treasury shares |
Stock options and other share- based payments |
Other comprehensive income (a) |
Attributable to equity holders of Sanofi |
Attributable -controlling |
Total equity |
||||||||||||||||||||||||
Balance at December 31, 2017 (b) |
2,508 | 52,862 | (14 | ) | 3,298 | (584 | ) | 58,070 | 169 | 58,239 | ||||||||||||||||||||||
First-time application of IFRS 9 (e) |
| 839 | | | (852 | ) | (13 | ) | | (13 | ) | |||||||||||||||||||||
Other comprehensive income for the period |
| (83 | ) | | | 809 | 726 | (3 | ) | 723 | ||||||||||||||||||||||
Net income for the period |
| 1,778 | | | | 1,778 | 57 | 1,835 | ||||||||||||||||||||||||
Comprehensive income for the period |
| 1,695 | | | 809 | 2,504 | 54 | 2,558 | ||||||||||||||||||||||||
Dividend paid out of 2017 earnings (3.03 per share) |
| (3,773 | ) | | | | (3,773 | ) | | (3,773 | ) | |||||||||||||||||||||
Payment of dividends to non-controlling interests |
| | | | | | (51 | ) | (51 | ) | ||||||||||||||||||||||
Share repurchase program (c) |
| | (729 | ) | | | (729 | ) | | (729 | ) | |||||||||||||||||||||
Reduction in share capital (c) |
(14 | ) | (498 | ) | 512 | | | | | | ||||||||||||||||||||||
Share-based payment plans: |
||||||||||||||||||||||||||||||||
Exercise of stock options |
| 6 | | | | 6 | | 6 | ||||||||||||||||||||||||
Issuance of restricted shares and vesting of existing restricted shares (f) |
4 | (83 | ) | 79 | | | | | | |||||||||||||||||||||||
Value of services obtained from employees |
| | | 151 | | 151 | | 151 | ||||||||||||||||||||||||
Tax effects of the exercise of stock options |
| | | 7 | | 7 | | 7 | ||||||||||||||||||||||||
Other changes arising from issuance of restricted shares (d) |
| 13 | | | | 13 | | 13 | ||||||||||||||||||||||||
Change in non-controlling interests without loss of control |
| (39 | ) | | | | (39 | ) | (8 | ) | (47 | ) | ||||||||||||||||||||
Balance at June 30, 2018 |
2,498 | 51,022 | (152 | ) | 3,456 | (627 | ) | 56,197 | 164 | 56,361 |
(a) | See Note B.8.8. |
(b) | Includes the effects of first-time application of IFRS 15 on revenue recognition (see Note A.1.2.). |
(c) | See Notes B.8.2. and B.8.3. |
(d) | Issuance of restricted shares to former employees of the Animal Health business subsequent to the date of divestment. |
(e) | See Note A.1.3. |
(f) | This line includes the use of existing shares to fulfill vested rights under restricted share plans. |
The accompanying notes on pages 10 to 50 are an integral part of the condensed half-year consolidated financial statements.
7 | Sanofi 2018 HALF-YEAR FINANCIAL REPORT
CONSOLIDATED STATEMENTS OF CASH FLOWS
( million) | Note | June 30, 2018 (6 months) |
June 30, 2017 (6 months) (a)/(b) |
December 31, 2017 (12 months) (a)/(b) |
||||||||||||
Net income attributable to equity holders of Sanofi |
1,778 | 6,729 | 8,416 | |||||||||||||
Net (income)/loss of the exchanged/held-for-exchange Animal Health business |
| (4,421 | ) | (4,643 | ) | |||||||||||
Non-controlling interests, excluding BMS (c) |
15 | 21 | 38 | |||||||||||||
Share of undistributed earnings from investments accounted for using the equity method |
(59 | ) | 2 | (47 | ) | |||||||||||
Depreciation, amortization and impairment of property, plant and equipment and intangible assets |
1,779 | 1,762 | 3,686 | |||||||||||||
Gains and losses on disposals of non-current assets, net of tax (d) |
(217 | ) | (79 | ) | (97 | ) | ||||||||||
Net change in deferred taxes |
(330 | ) | (268 | ) | (909 | ) | ||||||||||
Net change in non-current provisions and other non-current liabilities (e) |
(56 | ) | (204 | ) | 321 | |||||||||||
Cost of employee benefits (stock options and other share-based payments) |
152 | 126 | 263 | |||||||||||||
Impact of the workdown of acquired inventories remeasured at fair value |
100 | 176 | 166 | |||||||||||||
Other profit or loss items with no cash impact |
119 | (9 | ) | 38 | ||||||||||||
Operating cash flow before changes in working capital and excluding the exchanged/held-for-exchange Animal Health business |
3,281 | 3,835 | 7,232 | |||||||||||||
(Increase)/decrease in inventories |
(627 | ) | (500 | ) | (144 | ) | ||||||||||
(Increase)/decrease in accounts receivable |
571 | 150 | (529 | ) | ||||||||||||
Increase/(decrease) in accounts payable |
(219 | ) | 110 | 577 | ||||||||||||
Net change in other current assets and other current liabilities (f) |
(1,232 | ) | (1,039 | ) | 243 | |||||||||||
Net cash provided by/(used in) operating activities excluding the exchanged/held-for-exchange Animal Health business (f) |
1,773 | 2,556 | 7,379 | |||||||||||||
Net cash provided by/(used in) operating activities of the exchanged/held-for-exchange Animal Health business |
| | | |||||||||||||
Acquisitions of property, plant and equipment and intangible assets |
B.2. B.3. | (823 | ) | (998 | ) | (1,956 | ) | |||||||||
Acquisitions of consolidated undertakings and investments accounted for using the equity method (g)/(i) |
B.1. | (12,784 | ) | (381 | ) | (1,151 | ) | |||||||||
Acquisitions of other equity investments |
(32 | ) | (45 | ) | (61 | ) | ||||||||||
Proceeds from disposals of property, plant and equipment, intangible assets and other non-current assets, net of tax (h) |
486 | 440 | 535 | |||||||||||||
Net change in loans and other financial assets |
67 | (78 | ) | (263 | ) | |||||||||||
Net cash provided by/(used in) investing activities excluding the exchanged/held-for-exchange Animal Health business |
(13,085 | ) | (1,062 | ) | (2,896 | ) | ||||||||||
Net cash provided by/(used in) investing activities of the exchanged/held-for-exchange Animal Health business |
| | | |||||||||||||
Net cash inflow from the exchange of the Animal Health business for BIs Consumer Healthcare business (i) |
5 | 4,349 | 3,535 | |||||||||||||
Issuance of Sanofi shares |
B.8.1. | 19 | 99 | 319 | ||||||||||||
Dividends paid: |
||||||||||||||||
to shareholders of Sanofi |
(3,773 | ) | (3,710 | ) | (3,710 | ) | ||||||||||
to non-controlling interests, excluding BMS (c) |
(10 | ) | (11 | ) | (15 | ) | ||||||||||
Payments received/(made) on changes of ownership interest in a subsidiary without loss of control |
(45 | ) | (37 | ) | (37 | ) | ||||||||||
Additional long-term debt contracted |
B.9.1. | 9,674 | 1 | 41 | ||||||||||||
Repayments of long-term debt |
B.9.1. | (25 | ) | (7 | ) | (2,368 | ) | |||||||||
Net change in short-term debt |
3,383 | 173 | 30 | |||||||||||||
Acquisitions of treasury shares |
B.8.2. | (730 | ) | (1,700 | ) | (2,162 | ) | |||||||||
Disposals of treasury shares, net of tax |
| | | |||||||||||||
Net cash provided by/(used in) financing activities excluding the exchanged/held-for-exchange Animal Health business |
8,494 | (5,192 | ) | (7,902 | ) |
2018 HALF-YEAR FINANCIAL REPORT Sanofi | 8
( million) | Note | June 30, 2018 (6 months) |
June 30, 2017 (6 months) (a)/(b) |
December 31, 2017 (12 months) (a)/(b) |
||||||||||||
Net cash provided by/(used in) financing activities of the exchanged/held-for-exchange Animal Health business |
| | | |||||||||||||
Impact of exchange rates on cash and cash equivalents |
(9 | ) | (47 | ) | (74 | ) | ||||||||||
Net change in cash and cash equivalents |
(2,822 | ) | 604 | 42 | ||||||||||||
Cash and cash equivalents, beginning of period |
10,315 | 10,273 | 10,273 | |||||||||||||
Cash and cash equivalents, end of period |
B.9. | 7,493 | 10,877 | 10,315 |
(a) | For 2017, all of the cash flows generated by the exchange of the Animal Health business for the Consumer Healthcare business of Boehringer Ingelheim (BI) are described in note (i) below. |
(b) | Includes the effects of first-time application of IFRS 15 on revenue recognition (see Note A.1.2.). |
(c) | See Note C.2. to the financial statements for the year ended December 31, 2017. |
(d) | Includes other equity investments. |
(e) | This line item includes contributions paid to pension funds (see Note B.12.). |
(f) | Including: |
Income tax paid |
(1,061 | ) | (1,324 | ) | (1,734 | ) | ||||||
Interest paid (excluding cash flows on derivative instruments used to hedge debt) |
(144 | ) | (114 | ) | (347 | ) | ||||||
Interest received (excluding cash flows on derivative instruments used to hedge debt) |
31 | 30 | 56 | |||||||||
Dividends received from non-consolidated entities |
| 6 | 8 |
(g) | This line item includes payments made in respect of contingent consideration identified and recognized as a liability in business combinations. |
(h) | This line item includes proceeds from disposals of investments in consolidated entities and of other non-current financial assets. |
(i) | For the year ended December 31, 2017, this line item comprises (i) the receipt by Sanofi of a balancing cash payment of 4,207 million; (ii) reimbursements of intragroup accounts with Merial entities totaling 967 million; (iii) the 1,784 million payment of the tax due on the gain arising on the divestment; and (iv) the cash held by the BI subsidiaries acquired by Sanofi. The total consideration for the sale of the Animal Health business to BI was 10,557 million, and the consideration for the acquisition of BIs Consumer Healthcare business was 6,239 million (see Note D.1. to the consolidated financial statements for the year ended December 31, 2017). |
The accompanying notes on pages 10 to 50 are an integral part of the condensed half-year consolidated financial statements.
9 | Sanofi 2018 HALF-YEAR FINANCIAL REPORT
NOTES TO THE CONDENSED HALF-YEAR CONSOLIDATED FINANCIAL STATEMENTS AS OF JUNE 30, 2018
INTRODUCTION
Sanofi, together with its subsidiaries (collectively Sanofi or the Company), is a global healthcare leader engaged in the research, development and marketing of therapeutic solutions focused on patient needs.
Sanofi is listed in Paris (Euronext: SAN) and New York (NYSE: SNY).
The condensed consolidated financial statements for the six months ended June 30, 2018 were reviewed by the Sanofi Board of Directors at the Board meeting on July 30, 2018.
A/ BASIS OF PREPARATION OF THE HALF-YEAR FINANCIAL STATEMENTS AND ACCOUNTING POLICIES
A.1. INTERNATIONAL FINANCIAL REPORTING STANDARDS (IFRS)
The half-year consolidated financial statements have been prepared and presented in condensed format in accordance with IAS 34 (Interim Financial Reporting). The accompanying notes therefore relate to significant events and transactions of the period, and should be read in conjunction with the consolidated financial statements for the year ended December 31, 2017.
The accounting policies used in the preparation of the consolidated financial statements as of June 30, 2018 comply with international financial reporting standards (IFRS) as endorsed by the European Union and as issued by the International Accounting Standards Board (IASB). IFRS as endorsed by the European Union as of June 30, 2018 are available via the following web link:
https://www.efrag.org/Endorsement
IFRS 15 and IFRS 9 became applicable on January 1, 2018. Consequently, the accounting policies applied from that date are identical to those described in the published consolidated financial statements for the year ended December 31, 2017, except for the accounting policies presented in the notes relating to (i) net sales and other revenues and (ii) financial instruments, as described in Notes A.1.2. and A.1.3. below, respectively.
The other standards and interpretations issued by the IASB and endorsed by the European Union that became applicable on January 1, 2018 had no impact on the Sanofi consolidated financial statements.
A.1.1. UPDATE TO SIGNIFICANT ACCOUNTING POLICIES EFFECTIVE JANUARY 1, 2018
IFRS 15 and IFRS 9 became applicable on January 1, 2018, requiring Sanofi to update its accounting policies on revenue and financial instruments.
However, those updates do not materially affect the way in which Sanofi accounts for revenue or financial instruments.
As regards revenue, the concept of transfer of control, which is used primarily to determine the date of revenue recognition, does not call for any change in accounting for the majority of transactions with Sanofis customers. The concept of variable consideration does not materially alter the principles and methods used to measure net sales, which continue to be recognized net of customer incentives and discounts, and of certain sales-based payments paid or payable to the healthcare authorities.
As regards financial instruments, IFRS 9 changes the terminology used to classify some sub-categories of non-derivative financial assets without affecting the measurement principles applied to those assets, which continue to be measured at either fair value or amortized cost. The valuation models used by Sanofi are unchanged.
Finally, changes to the principles used in determining impairment of financial assets measured at amortized cost mean that an expected loss approach is now applied to such assets. In practice, this has an immaterial effect on the amount of impairment, and mainly affects accounts receivable.
The impacts of the first-time application of IFRS 15 are described in detail in Note A.1.2.
The impacts of the first-time application of IFRS 9 are described in detail in Note A.1.3.
With the exception of the policies presented in those two notes, the significant accounting policies applied effective January 1, 2018 are identical to those presented in the consolidated financial statements for the year ended December 31, 2017.
2018 HALF-YEAR FINANCIAL REPORT Sanofi | 10
A.1.2. IMPACTS OF THE FIRST-TIME APPLICATION OF IFRS 15
Sanofi is applying IFRS 15 retrospectively (in accordance with IAS 8) with effect from January 1, 2018, without applying any of the practical expedients permitted under IFRS 15. The impacts of the first-time application of IFRS 15 on the consolidated balance sheet with effect from January 1, 2016 are presented below. The main impacts relate to:
| Contracts with distributors: the concept of transfer of control as introduced by IFRS 15 has changed the date on which Sanofi recognizes revenue for a limited number of contracts with distributors. Some distributors that were previously treated as customers are now treated as agents: |
| sales that were previously recognized when the risks and rewards of ownership were transferred to the distributor are now recognized when control is transferred to the end customer; |
| the distributors commission, previously included within Net sales as a reduction of gross sales, is now recognized within the line item Selling and general expenses in the income statement. |
| Investments accounted for using the equity method: Sanofi accounts for its investment in Regeneron using the equity method. The changes introduced by IFRS 15 alter the date on which Regeneron recognizes the revenue from milestone payments under certain collaboration agreements. Such payments, which were previously recognized in revenue on a one-time basis, are now recognized in revenue on a percentage of completion basis. This adjustment is reflected in the carrying amount of investments accounted for using the equity method as of the transition date. |
Because those impacts do not represent cash inflows or outflows, cash generated by or used in operating activities for the comparative periods presented in the statements of cash flows have not been amended. Intermediate line items within the statements of cash flows have been adjusted accordingly.
The impacts on the consolidated balance sheet as of January 1, 2016 are set forth below:
January 1, 2016 | ||||||||||||
( million) | Published | Impact of IFRS 15 |
Including IFRS 15 |
|||||||||
Investments accounted for using the equity method |
2,676 | | 2,676 | |||||||||
Deferred tax assets |
4,714 | 1 | 4,715 | |||||||||
Non-current assets |
71,641 | 1 | 71,642 | |||||||||
Inventories |
6,516 | 1 | 6,517 | |||||||||
Current assets |
24,928 | 1 | 24,929 | |||||||||
TOTAL ASSETS |
102,321 | 2 | 102,323 | |||||||||
Equity attributable to equity holders of Sanofi |
58,049 | (2 | ) | 58,047 | ||||||||
Total equity |
58,210 | (2 | ) | 58,208 | ||||||||
Other current liabilities |
9,442 | 4 | 9,446 | |||||||||
Current liabilities |
16,825 | 4 | 16,829 | |||||||||
TOTAL EQUITY AND LIABILITIES |
102,321 | 2 | 102,323 |
11 | Sanofi 2018 HALF-YEAR FINANCIAL REPORT
The impacts on the consolidated balance sheet as of December 31, 2016 are set forth below:
December 31, 2016 | ||||||||||||
( million) | Published | Impact of IFRS 15 |
Including IFRS 15 |
|||||||||
Investments accounted for using the equity method |
2,890 | 2 | 2,892 | |||||||||
Deferred tax assets |
4,669 | 1 | 4,670 | |||||||||
Non-current assets |
71,564 | 3 | 71,567 | |||||||||
Inventories |
6,892 | 4 | 6,896 | |||||||||
Current assets |
26,687 | 4 | 26,691 | |||||||||
TOTAL ASSETS |
104,672 | 7 | 104,679 | |||||||||
Equity attributable to equity holders of Sanofi |
57,554 | (2 | ) | 57,552 | ||||||||
Total equity |
57,724 | (2 | ) | 57,722 | ||||||||
Other current liabilities |
10,175 | 9 | 10,184 | |||||||||
Current liabilities |
16,434 | 9 | 16,443 | |||||||||
TOTAL EQUITY AND LIABILITIES |
104,672 | 7 | 104,679 |
The impacts on the consolidated balance sheet as of December 31, 2017 are set forth below:
December 31, 2017 | ||||||||||||
( million) | Published | Impact of IFRS 15 |
Including IFRS 15 |
|||||||||
Investments accounted for using the equity method |
2,863 | (16 | ) | 2,847 | ||||||||
Deferred tax assets |
4,290 | 1 | 4,291 | |||||||||
Non-current assets |
73,440 | (15 | ) | 73,425 | ||||||||
Inventories |
6,816 | 2 | 6,818 | |||||||||
Current assets |
26,352 | 2 | 26,354 | |||||||||
TOTAL ASSETS |
99,826 | (13 | ) | 99,813 | ||||||||
Equity attributable to equity holders of Sanofi |
58,089 | (19 | ) | 58,070 | ||||||||
Total equity |
58,258 | (19 | ) | 58,239 | ||||||||
Other current liabilities |
9,206 | 6 | 9,212 | |||||||||
Current liabilities |
15,457 | 6 | 15,463 | |||||||||
TOTAL EQUITY AND LIABILITIES |
99,826 | (13 | ) | 99,813 |
2018 HALF-YEAR FINANCIAL REPORT Sanofi | 12
The impacts on the consolidated income statement for the year ended December 31, 2016 are set forth below:
December 31, 2016 | ||||||||||||
( million) | Published | Impact of IFRS 15 |
Including IFRS 15 |
|||||||||
Net sales |
33,821 | (12 | ) | 33,809 | ||||||||
Cost of sales |
(10,702 | ) | 1 | (10,701 | ) | |||||||
Gross profit |
24,006 | (11 | ) | 23,995 | ||||||||
Selling and general expenses |
(9,486 | ) | 8 | (9,478 | ) | |||||||
Operating income |
6,534 | (3 | ) | 6,531 | ||||||||
Income before tax and investments accounted for using the equity method |
5,678 | (3 | ) | 5,675 | ||||||||
Income tax expense |
(1,326 | ) | 1 | (1,325 | ) | |||||||
Share of profit/(loss) of investments accounted for using the equity method |
134 | 2 | 136 | |||||||||
Net income excluding the exchanged/held-for-exchange Animal Health business |
4,486 | | 4,486 | |||||||||
Net income |
4,800 | | 4,800 | |||||||||
Net income attributable to equity holders of Sanofi |
4,709 | | 4,709 | |||||||||
Basic earnings per share (in euros) |
3.66 | 3.66 |
The impacts on the consolidated income statement for the year ended December 31, 2017 are set forth below:
December 31, 2017 | ||||||||||||
( million) | Published | Impact of IFRS 15 |
Including IFRS 15 |
|||||||||
Net sales |
35,055 | 17 | 35,072 | |||||||||
Cost of sales |
(11,611 | ) | (2 | ) | (11,613 | ) | ||||||
Gross profit |
24,593 | 15 | 24,608 | |||||||||
Selling and general expenses |
(10,058 | ) | (14 | ) | (10,072 | ) | ||||||
Operating income |
5,803 | 1 | 5,804 | |||||||||
Income before tax and investments accounted for using the equity method |
5,530 | 1 | 5,531 | |||||||||
Income tax expense |
(1,722 | ) | | (1,722 | ) | |||||||
Share of profit/(loss) of investments accounted for using the equity method |
104 | (19 | ) | 85 | ||||||||
Net income excluding the exchanged/held-for-exchange Animal Health business |
3,912 | (18 | ) | 3,894 | ||||||||
Net income |
8,555 | (18 | ) | 8,537 | ||||||||
Net income attributable to equity holders of Sanofi |
8,434 | (18 | ) | 8,416 | ||||||||
Basic earnings per share (in euros) |
6.71 | 6.70 |
13 | Sanofi 2018 HALF-YEAR FINANCIAL REPORT
The impacts on the consolidated income statement for the six months ended June 30, 2017 are set forth below:
June 30, 2017 (6 months) | ||||||||||||
( million) | Published | Impact of IFRS 15 |
Including IFRS 15 |
|||||||||
Net sales |
17,311 | 13 | 17,324 | |||||||||
Cost of sales |
(5,670 | ) | (1 | ) | (5,671 | ) | ||||||
Gross profit |
12,160 | 12 | 12,172 | |||||||||
Selling and general expenses |
(5,046 | ) | (8 | ) | (5,054 | ) | ||||||
Operating income |
3,076 | 4 | 3,080 | |||||||||
Income before tax and investments accounted for using the equity method |
2,953 | 4 | 2,957 | |||||||||
Income tax expense |
(610 | ) | (2 | ) | (612 | ) | ||||||
Share of profit/(loss) of investments accounted for using the equity method |
38 | (11 | ) | 27 | ||||||||
Net income excluding the exchanged/held-for-exchange Animal Health business |
2,381 | (9 | ) | 2,372 | ||||||||
Net income |
6,802 | (9 | ) | 6,793 | ||||||||
Net income attributable to equity holders of Sanofi |
6,738 | (9 | ) | 6,729 | ||||||||
Basic earnings per share (in euros) |
5.35 | 5.34 |
The accounting policies on revenue recognition described in the consolidated financial statements for the year ended December 31, 2017 have been amended as follows:
Update to Note B.13.1. (Net sales) to the consolidated financial statements for the year ended December 31, 2017
Revenue arising from the sale of goods is presented in the income statement within Net sales. Net sales comprise revenue from sales of pharmaceutical products, consumer healthcare products, active ingredients and vaccines, net of sales returns, of customer incentives and discounts, and of certain sales-based payments paid or payable to the healthcare authorities.
In accordance with IFRS 15 (Revenue from Contracts with Customers), such revenue is recognized when Sanofi transfers control over the product to the customer; control of an asset refers to the ability to direct the use of, and obtain substantially all of the remaining benefits from, that asset. For the vast majority of contracts, revenue is recognized when the product is physically transferred, in accordance with the delivery and acceptance terms agreed with the customer.
For contracts entered into by Sanofi Pasteur, transfer of control is usually determined by reference to the terms of release (immediate or deferred) and acceptance of batches of vaccine.
In the case of contracts with distributors, Sanofi does not recognize revenue when the product is physically transferred to the distributor if the products are sold on consignment, or if the distributor acts as agent. In such cases, revenue is recognized when control is transferred to the end customer, and the distributors commission is presented within the line item Selling and general expenses in the income statement.
The amount of revenue recognized in Net sales reflects the various types of price reductions or rights of return offered by Sanofi to its customers on certain products. Such price reductions and rights of return qualify as variable consideration under IFRS 15.
In particular, products sold in the United States are covered by various governmental programs (such as Medicare and Medicaid) under which products are sold at a discount. Rebates are granted to healthcare authorities, and under contractual arrangements with certain customers. Some wholesalers are entitled to chargeback incentives based on the selling price to the end customer, under specific contractual arrangements. Cash discounts may also be granted for prompt payment. Returns, discounts, incentives and rebates, as described above, are recognized in the period in which the underlying sales are recognized as a reduction of gross sales.
These amounts are calculated as follows:
| the amount of chargeback incentives is estimated on the basis of the relevant subsidiarys standard sales terms and conditions, and in certain cases on the basis of specific contractual arrangements with the customer. |
| the amount of rebates based on attainment of sales targets is estimated and accrued as each of the underlying sales transactions is recognized; |
2018 HALF-YEAR FINANCIAL REPORT Sanofi | 14
| the amount of price reductions under Government and State programs, largely in the United States, is estimated on the basis of the specific terms of the relevant regulations or agreements, and accrued as each of the underlying sales transactions is recognized; |
| the amount of sales returns is calculated on the basis of managements best estimate of the amount of product that will ultimately be returned by customers. In countries where product returns are possible, Sanofi operates a returns policy that allows the customer to return products within a certain period either side of the expiry date (usually 12 months after the expiry date). The amount recognized for returns is estimated on the basis of past experience of sales returns. Sanofi also takes into account factors such as levels of inventory in its various distribution channels, product expiry dates, information about potential discontinuation of products, the entry of competing generics into the market, and the launch of over-the-counter medicines. Most product return clauses relate solely to date-expired products, which cannot be resold and are destroyed. Sanofi does not recognize a right of return asset in the balance sheet for contracts that allow for the return of time-expired products, since those products have no value. |
The estimated amounts described above are recognized in the income statement within Net sales as a reduction of gross sales, and within Other current liabilities in the balance sheet. They are subject to regular review and adjustment as appropriate based on the most recent data available to management. Sanofi believes that it has the ability to measure each of the above amounts reliably, using the following factors in developing its estimates:
| the nature and patient profile of the underlying product; |
| the applicable regulations or the specific terms and conditions of contracts with governmental authorities, wholesalers and other customers; |
| historical data relating to similar contracts, in the case of qualitative and quantitative rebates and chargeback incentives; |
| past experience and sales growth trends for the same or similar products; |
| actual inventory levels in distribution channels, monitored by Sanofi using internal sales data and externally provided data; |
| the shelf life of Sanofi products; and |
| market trends including competition, pricing and demand. |
Update to Note B.13.2. (Other revenues) to the consolidated financial statements for the year ended December 31, 2017
Other revenues mainly comprise royalties received from licensing intellectual property rights to third parties, and VaxServe sales of products sourced from third-party manufacturers.
Royalties received under licensing arrangements are recognized over the period during which the underlying sales are recognized.
VaxServe is a Vaccines segment entity whose operations include the distribution within the United States of vaccines and other products manufactured by third parties. VaxServe sales of products sourced from third-party manufacturers are presented within Other revenues.
15 | Sanofi 2018 HALF-YEAR FINANCIAL REPORT
A.1.3. IMPACTS OF THE FIRST-TIME APPLICATION OF IFRS 9
Sanofi is applying IFRS 9 with effect from January 1, 2018.
IFRS 9 changes the terminology used to classify some sub-categories of non-derivative financial assets without affecting the measurement principles applied to those assets, which continue to be measured at either fair value or amortized cost. The valuation models used by Sanofi are unchanged. In accordance with the transition provisions of IFRS 9, those reclassifications are made prospectively, and consequently do not require any restatement of published information for prior periods.
IFRS 9 does not alter the accounting treatment of financial liabilities or derivative instruments held by Sanofi.
The table below sets forth the reclassifications, and their impacts:
IAS 39 categories (December 31, 2017) | ||||||||||||||||||||||||||||
Available-for-sale financial assets |
Financial assets recognized under the fair value option |
Other comprehensive income |
||||||||||||||||||||||||||
IFRS 9 categories (January 1, 2018) ( million) |
Quoted instruments |
Unquoted instruments |
Contingent consideration receivable |
Assets held to meet obligations under post- employment benefit plans |
Assets held to meet obligations under deferred compensation plans |
|||||||||||||||||||||||
Total | 2,182 | 336 | 852 | |||||||||||||||||||||||||
1,560 | 123 | 292 | 207 | 336 | 852 | |||||||||||||||||||||||
Quoted equity investments | 1,327 | 1,327 | ||||||||||||||||||||||||||
Unquoted equity investments | 62 | 62 | ||||||||||||||||||||||||||
Total Equity instruments at fair value through OCI non-reclassifiable |
1,389 | 1,327 | 62 | |||||||||||||||||||||||||
Debt instruments | 199 | 199 | ||||||||||||||||||||||||||
Total Debt instruments at fair value through OCI reclassifiable |
199 | 199 | ||||||||||||||||||||||||||
Equity instruments |
44 | 34 | 10 | |||||||||||||||||||||||||
Debt instruments |
51 | 51 | ||||||||||||||||||||||||||
Contingent consideration receivable |
292 | 292 | ||||||||||||||||||||||||||
Assets held to meet obligations under post-employment benefit plans |
198 | 198 | ||||||||||||||||||||||||||
Assets held to meet obligations under deferred compensation plans |
345 | 9 | 336 | |||||||||||||||||||||||||
Total Other financial assets at fair value through profit or loss |
930 | 34 | 61 | 292 | 207 | 336 | ||||||||||||||||||||||
Additional paid-in capital and retained earnings |
852 | 852 |
Most of Sanofis equity investments have been classified as financial assets at fair value through other comprehensive income.
IFRS 9 also changes the way in which impairment losses are estimated; this mainly affects accounts receivable. With effect from January 1, 2018, impairment allowances cover expected losses, rather than (as previously) incurred losses. The impact of this new impairment methodology as of January 1, 2018 is to increase the total impairment allowance by 17 million (before tax effects), and to reduce retained earnings by a net amount of 13 million.
2018 HALF-YEAR FINANCIAL REPORT Sanofi | 16
The accounting policies on financial assets presented in the notes to the consolidated financial statements for the year ended December 31, 2017 have been amended. Note B.8. (Financial instruments) and Note B.18. (Fair value remeasurement of contingent consideration) have been updated as indicated below:
Update to Notes B.8.1. (Non-derivative financial assets) and B.8.2. (Impairment of non-derivative financial assets) to the consolidated financial statements for the year ended December 31, 2017
In accordance with IFRS 9 (Financial Instruments) and IAS 32 (Financial Instruments: Presentation), Sanofi has adopted the classification of non-derivative financial assets described below. The classification used depends on (i) the characteristics of the contractual cash flows (i.e. whether they represent interest or principal) and (ii) the business model for managing the asset applied at the time of initial recognition.
Financial assets at fair value through other comprehensive income mainly comprise:
| quoted and unquoted equity investments that Sanofi does not hold for trading purposes and that management has designated at fair value through other comprehensive income on initial recognition. Gains and losses arising from changes in fair value are recognized in equity within the statement of comprehensive income in the period in which they occur. When such instruments are derecognized, the previously-recognized changes in fair value remain within Other comprehensive income, as does the gain or loss on divestment. Dividends received are recognized in profit or loss for the period, within the line item Financial income. |
| debt instruments whose contractual cash flows represent payments of interest or repayments of principal, and which are managed with a view to collecting cash flows and selling the asset. Gains and losses arising from changes in fair value are recognized in equity within the statement of comprehensive income in the period in which they occur. When such assets are derecognized, the cumulative gains and losses previously recognized in equity are reclassified to profit or loss for the period within the line items Financial income or Financial expenses. |
Financial assets at fair value through profit or loss comprise:
| quoted and unquoted equity investments: equity instruments that are not held for trading and which management did not designate at fair value through other comprehensive income on initial recognition, and instruments that do not meet the IFRS definition of equity instruments; |
| instruments whose contractual cash flows represent payments of interest or repayments of principal, but which are managed other than with a view to collecting cash flows and/or selling the asset; |
| instruments that management has designated as fair value through profit or loss on initial recognition; |
| contingent consideration already carried in the books of an acquired entity or granted in connection with a business combination. |
Gains and losses arising from changes in fair value are recognized in profit or loss within the line items Financial income or Financial expenses. Dividends received are recognized in profit or loss for the period, within the line item Financial income.
Fair value of equity investments in unquoted entities
On initial recognition of an equity investment in an entity not quoted in an active market, the fair value of the investment is the acquisition cost. Cost ceases to be a representative measure of the fair value of an unquoted equity investment when Sanofi identifies significant changes in the investee, or in the environment in which it operates. In such cases, an internal valuation is carried out, based mainly on peer comparisons.
Financial assets at amortized cost comprise instruments whose contractual cash flows represent payments of interest or repayments of principal and which are managed with a view to collecting cash flows. The main assets in this category are loans and receivables. They are presented within the line items Other non-current assets, Other current assets, Accounts receivable and Cash and cash equivalents. Loans with a maturity of more than 12 months are presented in Long-term loans and advances within Other non-current assets. Those financial assets are measured at amortized cost using the effective interest method.
Impairment of financial assets measured at amortized cost
Accounts receivable are initially recognized at the amount invoiced to the customer. Impairment losses on trade accounts receivable are estimated using the expected loss method, in order to take account of the risk of payment default throughout the lifetime of the receivables. The expected credit loss is estimated collectively for all accounts receivable at each reporting date using an average expected loss rate, determined primarily on the basis of historical credit loss rates. However, that average expected loss rate may be adjusted if there are indications of a likely significant increase in credit risk. If a receivable is subject to a known credit risk, a specific impairment loss is recognized for that receivable. The amount of expected losses is recognized in the balance sheet as a reduction in the gross amount of accounts receivable. Impairment losses on accounts receivable are recognized within Selling and general expenses in the income statement.
17 | Sanofi 2018 HALF-YEAR FINANCIAL REPORT
Update to Note B.8.3. (Derivative instruments) to the consolidated financial statements for the year ended December 31, 2017
Derivative instruments that do not qualify for hedge accounting are initially and subsequently measured at fair value, with changes in fair value recognized in the income statement in Other operating income or in Financial income or Financial expenses, depending on the nature of the underlying economic item which is hedged.
Derivative instruments that qualify for hedge accounting are measured using the policies described in Note B.8.4. below.
IFRS 13 (Fair Value Measurement) requires counterparty credit risk to be taken into account when measuring the fair value of financial instruments. That risk is estimated on the basis of observable, publicly-available statistical data.
Policy on offsetting
In order for a financial asset and a financial liability to be presented as a net amount in the balance sheet under IAS 32, there must be:
(a) a legally enforceable right to offset; and
(b) the intention either to settle on a net basis, or to realize the asset and settle the liability simultaneously.
In addition, IFRS 7 (Financial Instruments: Disclosures) requires the notes to the financial statements to include a schedule showing a list of any offsets recognized under IAS 32 and of transactions for which only criterion (a) is met, i.e. potential offsets such as those specified in close out netting agreements (positions offset only in the event of default, as specified in the International Swaps and Derivatives Association (ISDA) standard).
Update to Note B.8.4. (Hedging) to the consolidated financial statements for the year ended December 31, 2017
As part of its overall market risk management policy, Sanofi enters into various hedging transactions involving derivative or non-derivative instruments; these may include forward contracts, currency swaps or options, interest rate swaps or options, cross-currency swaps, and debt placings or issues.
Such financial instruments are designated as hedging instruments and recognized using the hedge accounting principles of IFRS 9 when (a) there is formal designation and documentation of the hedging relationship, of how the effectiveness of the hedging relationship will be assessed, and of the underlying market risk management objective and strategy; (b) the hedged item and the hedging instrument are eligible for hedge accounting; and (c) there is an economic relationship between the hedged item and the hedging instrument, defined on the basis of a hedge ratio that is consistent with the underlying market risk management strategy, and the residual credit risk does not dominate the value changes that result from that economic relationship.
Fair value hedge
A fair value hedge is a hedge of the exposure to changes in fair value of an asset, liability or firm commitment that is attributable to one or more risk components and could affect profit or loss.
Changes in fair value of the hedging instrument and changes in fair value of the hedged item attributable to the hedged risk components are generally recognized in the income statement, within Other operating income for hedges related to operating activities, or within Financial income or Financial expenses for hedges related to investing or financing activities.
Cash flow hedge
A cash flow hedge is a hedge of the exposure to variability in cash flows from an asset, liability or highly probable forecast transaction that is attributable to one or more risk components and could affect profit or loss.
Changes in fair value of the hedging instrument attributable to the effective portion of the hedge are recognized directly in equity in the consolidated statement of comprehensive income. Changes in fair value attributable to the ineffective portion of the hedge are recognized in the income statement within Other operating income for hedges of operating activities, and within Financial income or Financial expenses for hedges of investing or financing activities.
Cumulative changes in fair value of the hedging instrument previously recognized in equity are reclassified to the income statement when the hedged transaction affects profit or loss. Those reclassified gains and losses are recognized within Other operating income for hedges related to operating activities, and within Financial income or Financial expenses for hedges related to investing or financing activities.
2018 HALF-YEAR FINANCIAL REPORT Sanofi | 18
When a forecast transaction results in the recognition of a non-financial asset or liability, cumulative changes in the fair value of the hedging instrument previously recognized in equity are incorporated in the initial carrying amount of that asset or liability.
When the hedging instrument expires or is sold, terminated or exercised, the cumulative gain or loss previously recognized in equity remains separately recognized in equity and is not reclassified to the income statement (or recognized as an adjustment to the initial cost of the related non-financial asset or liability) until the forecast transaction occurs. However, if Sanofi no longer expects the forecast transaction to occur, the cumulative gain or loss previously recognized in equity is recognized immediately in profit or loss.
Hedge of a net investment in a foreign operation
In a hedge of a net investment in a foreign operation, changes in the fair value of the hedging instrument attributable to the effective portion of the hedge are recognized directly in equity in the consolidated statement of comprehensive income. Changes in fair value attributable to the ineffective portion of the hedge are recognized in the income statement within Financial income or Financial expenses. When the investment in the foreign operation is sold, the changes in the fair value of the hedging instrument previously recognized in equity are reclassified to the income statement within Financial income or Financial expenses.
Cost of hedging
As part of its market risk management policy, Sanofi may designate currency or interest rate options as hedging instruments of which the effectiveness is measured on the basis of changes in intrinsic value. In such cases, the time value of the option is treated as a hedging cost and accounted for as follows:
| If the option includes a component that is not aligned on the critical features of the hedged item, the corresponding change in the time value is taken to profit or loss. |
| Otherwise, the change in the time value is taken to equity within the statement of comprehensive income, and then: |
| if the hedged item is linked to a transaction that results in the recognition of a financial asset or liability, the change in the time value is reclassified to profit or loss symmetrically with the hedged item; |
| if the hedged item is linked to a transaction that results in the recognition of a non-financial asset or liability, the change in the time value is incorporated in the initial carrying amount of that asset or liability; and |
| if the hedged item is linked to a period of time, the change in time value is reclassified to profit or loss on a straight line basis over the life of the hedging relationship. |
In the case of forward contracts and currency swaps, and of cross-currency swaps that qualify for hedge accounting on the basis of changes in spot rates, Sanofi may elect for each transaction to use the option whereby the premium/discount or foreign currency basis spread are treated in the same way as the time value of an option.
Discontinuation of hedge accounting
Hedge accounting is discontinued when the eligibility criteria are no longer met (in particular, when the hedging instrument expires or is sold, terminated or exercised), or if there is a change in the market risk management objective of the hedging relationship.
Update to Note B.8.5. (Non-derivative financial liabilities) to the consolidated financial statements for the year ended December 31, 2017
Borrowings and debt
Bank borrowings and debt instruments are initially measured at fair value of the consideration received, net of directly attributable transaction costs.
Subsequently, they are measured at amortized cost using the effective interest method. All costs related to the issuance of borrowings or debt instruments, and all differences between the issue proceeds net of transaction costs and the value on redemption, are recognized within Financial expenses in the income statement over the term of the debt using the effective interest method.
Liabilities related to business combinations and to non-controlling interests
These line items record the fair value of (i) contingent consideration payable in connection with business combinations and (ii) commitments to buy out equity holders of subsidiaries, including put options granted to non-controlling interests.
Adjustments to the fair value of commitments to buy out equity holders of subsidiaries, including put options granted to non-controlling interests, are recognized in equity.
19 | Sanofi 2018 HALF-YEAR FINANCIAL REPORT
Other non-derivative financial liabilities
Other non-derivative financial liabilities include trade accounts payable, which are measured at fair value (which in most cases equates to face value) on initial recognition, and subsequently at amortized cost.
Update to Note B.8.6. (Fair value of financial instruments) to the consolidated financial statements for the year ended December 31, 2017
Under IFRS 13 (Fair Value Measurement) and IFRS 7 (Financial Instruments: Disclosures), fair value measurements must be classified using a hierarchy based on the inputs used to measure the fair value of the instrument. This hierarchy has three levels:
| level 1: quoted prices in active markets for identical assets or liabilities (without modification or repackaging); |
| level 2: quoted prices in active markets for similar assets and liabilities, or valuation techniques in which all important inputs are derived from observable market data; |
| level 3: valuation techniques in which not all important inputs are derived from observable market data. |
2018 HALF-YEAR FINANCIAL REPORT Sanofi | 20
The table below shows the disclosures required under IFRS 7 relating to the measurement principles applied to financial instruments.
Method used to determine fair value | ||||||||||||||||
Market data | ||||||||||||||||
Note | Type of financial instrument |
Measurement principle |
Level in fair value hierarchy |
Valuation technique |
Valuation model |
Exchange rate |
Interest rate |
Volatilities | ||||||||
B.6. | Financial assets measured at fair value (quoted equity instruments) | Fair value | 1 | Market value | Quoted market price | N/A | ||||||||||
B.6. | Financial assets measured at fair value (quoted debt instruments) | Fair value | 1 | Revenue-based approach | Quoted market price | N/A | ||||||||||
B.6. | Financial assets measured at fair value (unquoted equity instruments) | Fair value | 3 | Amortized cost/ Peer comparison (primarily) | If cost ceases to be a representative measure of fair value, an internal valuation based primarily on peer comparison is used. | |||||||||||
B.6. | Financial assets at fair value (contingent consideration receivable): | Fair value | 3 | Revenue-based approach | Under IFRS 9, contingent consideration receivable on a divestment is a financial asset. The fair value of such assets is determined by adjusting the contingent consideration at the end of the reporting period using the method described in Note D.7. to the consolidated financial statements for the year ended December 31, 2017. | |||||||||||
B.6. | Long-term loans and advances and other non-current receivables | Amortized cost | N/A | N/A | The amortized cost of long-term loans and advances and other non-current receivables at the end of the reporting period is not materially different from their fair value. | |||||||||||
B.6. | Financial assets recognized under the fair value option(a) | Fair value | 1 | Market value | Net asset value | N/A | ||||||||||
B.10. | Forward currency contracts | Fair value | 2 | Present value of future cash flows | Mid Market Spot | < 1 year: Mid Money Market > 1 year: Mid Zero Coupon |
N/A | |||||||||
B.10. | Interest rate swaps | Fair value | 2 | Revenue-based approach | Present value of future cash flows | Mid Market Spot | < 1 year: Mid MoneyMarket > 1 year: Mid Zero Coupon |
N/A | ||||||||
B.10. | Cross-currency swaps | Fair value | 2 | Present value of future cash flows | Mid Market Spot | < 1 year: Mid Money Market > 1 year: Mid Zero Coupon |
N/A | |||||||||
B.9. | Investments in mutual funds | Fair value | 1 | Market value | Net asset value | N/A | ||||||||||
B.9. | Negotiable debt instruments, commercial paper, instant access deposits and term deposits | Amortized cost | N/A | N/A | Because these instruments have a maturity of less than 3 months, amortized cost is regarded as an acceptable approximation of fair value as disclosed in the notes to the consolidated financial statements. | |||||||||||
B.9. | Debt | Amortized cost (b) | N/A | N/A | In the case of debt with a maturity of less than 3 months, amortized cost is regarded as an acceptable approximation of fair value as reported in the notes to the consolidated financial statements.
For debt with a maturity of more than 3 months, fair value as reported in the notes to the consolidated financial statements is determined either by reference to quoted market prices at the end of the reporting period (quoted instruments) or by discounting the future cash flows based on observable market data at the end of the reporting period (unquoted instruments). | |||||||||||
B.11. | Liabilities related to business combinationsand to non-controlling interests (CVRs) | Fair value | 1 | Market value | Quoted market price | N/A | ||||||||||
B.11. | Liabilities related to business combinations and to non-controlling interests (other than CVRs) | Fair value (c) | 3 | Revenue-based approach | Under IAS 32, contingent consideration payable in a business combination is a financial liability. The fair value of such liabilities is determined by adjusting the contingent consideration at the end of the reporting period using the method described in Note B.11. |
(a) | These assets are held to fund a deferred compensation plan offered to certain employees. |
(b) | In the case of debt designated as a hedged item in a fair value hedging relationship, the carrying amount in the consolidated balance sheet includes changes in fair value attributable to the hedged risk(s). |
(c) | For business combinations completed prior to application of the revised IFRS 3, contingent consideration is recognized when payment becomes probable. See Note B.3.1. to the financial statements for the year ended December 31, 2017. |
Update to Note B.8.7. (Derecognition of financial instruments) to the consolidated financial statements for the year ended December 31, 2017
Financial assets are derecognized when the contractual rights to cash flows from the asset have ended or have been transferred and when Sanofi has transferred substantially all risks and rewards of ownership of the asset. If Sanofi has neither transferred nor retained substantially all the risks and rewards of ownership of a financial asset, it is derecognized if Sanofi does not retain control of the asset.
A financial liability is derecognized when Sanofis contractual obligations in respect of the liability are discharged, cancelled or extinguished.
21 | Sanofi 2018 HALF-YEAR FINANCIAL REPORT
Update to Note B.8.8. (Risks relating to financial instruments) to the consolidated financial statements for the year ended December 31, 2017
Market risks in respect of non-current financial assets, cash equivalents, derivative instruments and debt are described in the discussions of risk factors presented in Item 3.D. and Item 11 of Sanofis Annual Report on Form 20-F for 2017.
Credit risk is the risk that customers may fail to pay their debts. This risk also arises as a result of the concentration of Sanofis sales with its largest customers, in particular certain wholesalers in the United States, and is also described in the discussion of risk factors in the Annual Report on Form 20-F for 2017.
Update to Note B.18. (Fair value remeasurement of contingent consideration) to the consolidated financial statements for the year ended December 31, 2017
Changes in the fair value of contingent consideration that was (i) already carried in the books of an acquired entity, or (ii) granted in connection with a business combination and initially recognized as a liability in accordance with the revised IFRS 3, are reported in profit or loss. Such adjustments are reported separately in the income statement, in the line item Fair value remeasurement of contingent consideration.
This line item also includes changes in the fair value of contingent consideration receivable in connection with a divestment and classified as a financial asset at fair value through profit or loss.
Finally, it includes the effect of the unwinding of discount, and of exchange rate movements where the asset or liability is expressed in a currency other than the functional currency of the reporting entity.
A.2. USE OF ESTIMATES AND JUDGMENTS
The preparation of financial statements requires management to make reasonable estimates and assumptions based on information available at the date of the finalization of the financial statements. Those estimates and assumptions may affect the reported amounts of assets, liabilities, revenues and expenses in the financial statements, and disclosures of contingent assets and contingent liabilities as of the date of the review of the financial statements. Examples of estimates and assumptions include:
| amounts deducted from sales for projected sales returns, chargeback incentives, rebates and price reductions; |
| impairment of property, plant and equipment, intangible assets, and investments accounted for using the equity method; |
| the valuation of goodwill and the valuation and useful life of acquired intangible assets; |
| the measurement of contingent consideration receivable in connection with asset divestments; |
| the measurement of financial assets at amortized cost; |
| the measurement of equity investments in unquoted entities; |
| the amount of post-employment benefit obligations; |
| the amount of provisions for restructuring, litigation, tax risks and environmental risks; |
| the amount of deferred tax assets resulting from tax losses available for carry-forward and deductible temporary differences; |
| the direct and indirect impacts recorded in 2017 of the US tax reform (Tax Cuts and Jobs Act of 2017), including the estimated tax charge on deemed repatriation that is attributable to the accumulated earnings of non-US operations. The estimate of such tax charge will be finalized based on further analysis and, as the case may be, computations taking into account any future clarifications and supplementary guidance issued by the US Congress, the US Internal Revenue Service, the US Securities and Exchange Commission or other regulators; |
| the measurement of contingent consideration liabilities. |
Actual results could differ from these estimates.
For half-year financial reporting purposes, and as allowed under IAS 34, Sanofi has determined income tax expense on the basis of an estimate of the effective tax rate for the full financial year. This rate is applied to business operating income plus financial income and minus financial expenses, and before (i) the share of profit/loss of investments accounted for using the equity method and (ii) net income attributable to non-controlling interests. The estimated full-year effective tax rate is based on the tax rates that will be applicable to projected pre-tax profits or losses arising in the various tax jurisdictions in which Sanofi operates.
Management is also required to exercise judgment in assessing whether the criteria specified in IFRS 5 (Non-Current Assets Held for Sale and Discontinued Operations) are met, and hence whether a non-current asset or asset group should be classified as held for sale or exchange and whether a discontinued operation should be reported separately. Such assessments are reviewed at each reporting date based on the facts and circumstances.
2018 HALF-YEAR FINANCIAL REPORT Sanofi | 22
A.3. SEASONAL TRENDS
Sanofis activities are not subject to significant seasonal fluctuations.
A.4. CONSOLIDATION AND FOREIGN CURRENCY TRANSLATION OF THE FINANCIAL STATEMENTS OF SUBSIDIARIES IN HYPERINFLATIONARY ECONOMIES
In 2018, Sanofi is continuing to account for subsidiaries based in Venezuela using the full consolidation method, on the basis that the criteria for control as specified in IFRS 10 (Consolidated Financial Statements) are still met. Since the end of January 2018, changes to the Venezuelan foreign exchange system mean that the DICOM rate is now compulsory and applies to all transactions. The DIPRO rate, set at 10 bolivars per US dollar, has been discontinued. The DICOM rate is a floating exchange rate against the US dollar that initially stood at 206 bolivars per US dollar at the beginning of 2016 and was approximately 115,000 bolivars per US dollar as of June 30, 2018. Consequently, the contribution of Sanofis Venezuelan subsidiaries to the consolidated financial statements is immaterial.
In Argentina, the cumulative rate of inflation over the last three years is in excess of 100%, based on a combination of indices used to measure inflation in that country. Consequently, Sanofi intends to regard Argentina as a hyperinflationary economy from July 1, 2018 onwards and to apply IAS 29 (Financial Reporting in Hyperinflationary Economies). Under IAS 29, non-monetary balance sheet items must be restated using a general price index; monetary items are not restated. Items in the income statement and the statement of comprehensive income must be restated by applying the change in the general price index from the dates when the items of income and expenses were initially recorded in the financial statements.
The impact of hyperinflation on Sanofis Argentinean subsidiaries would be immaterial in the Sanofi financial statements for the six months ended June 30, 2018. The exchange rate used as of that date is 28.47 Argentinean pesos per US dollar.
A.5. NEW PRONOUNCEMENTS ISSUED BY THE IASB AND APPLICABLE FROM 2019 OR LATER
A.5.1. STANDARDS
In January 2016 the IASB issued IFRS 16 (Leases), which aligns the accounting treatment of operating leases with that already applied to finance leases (i.e. recognition in the balance sheet of a liability for future lease payments, and of an asset for the associated rights of use). The first-time application of IFRS 16 will also lead to a change in presentation:
| In the income statement: the rental expense currently recognized as a component of Operating income will, under IFRS 16, be recognized partly as depreciation expense within Operating income, and partly within Financial expenses. |
| In the statement of cash flows: the rental payments currently presented within Net cash provided by/(used in) operating activities will, under IFRS 16, be presented within Net cash provided by/(used in) financing activities to the extent that those payments are allocated to repayment of the lease liability. |
IFRS 16 is applicable to annual reporting periods beginning on or after January 1, 2019.
Most of the leases contracted by Sanofi are operating leases in which Sanofi is the lessee. The main assets leased are buildings, cars, and computer hardware. An impact assessment is ongoing. For information, Sanofis obligations under non-cancelable operating leases are disclosed in Note D.21. to the consolidated financial statements for the year ended December 31, 2017.
In addition, some supply and service contracts are also being assessed.
Sanofis IFRS 16 project is being led by a team composed of representatives from the various support functions involved (purchasing, real estate, information systems, finance, shared services). As of June 30, 2018, Sanofi has completed the inventorization of the vast majority of active leases.
For first-time application of IFRS 16, Sanofi expects to elect application as of January 1, 2019 with no restatement of prior periods, using the simplified retrospective method.
As of today and on the basis of current contracts, Sanofis preliminary estimate of the obligation for future lease payments, determined in accordance with IFRS 16, would lie between 1.2 billion and 1.6 billion.
Impact analysis is ongoing, and consequently that estimate may be subject to change.
23 | Sanofi 2018 HALF-YEAR FINANCIAL REPORT
A.5.2. AMENDMENTS, ANNUAL IMPROVEMENTS AND INTERPRETATIONS
Sanofi does not expect a material impact from the application of:
| Amendments issued under the Annual Improvements 2015-2017 program on December 12, 2017, and applicable from January 1, 2019 onwards subject to endorsement by the European Union. |
| Plan Amendment, Curtailment or Settlement (amendments to IAS 19), issued on February 7, 2018, will be applicable prospectively to plan amendments from January 1, 2019 onwards subject to endorsement by the European Union. |
| Amendments to References to the Conceptual Framework in IFRS Standards, issued on March 29, 2018, is applicable from January 1, 2020 onwards subject to endorsement by the European Union. This amendment updates references to the conceptual framework in various IFRS standards following publication of the new conceptual framework by the IASB in March 2018. In practice, Sanofi does not expect any material impact from this amendment, which alters the form but not the substance of the accounting principles contained in IFRS standards. |
Sanofi will not early adopt these pronouncements.
2018 HALF-YEAR FINANCIAL REPORT Sanofi | 24
B/ SIGNIFICANT INFORMATION FOR THE FIRST HALF OF 2018
B.1. CHANGES IN THE SCOPE OF CONSOLIDATION DUE TO ACQUISITIONS AND DIVESTMENTS
Acquisition of Bioverativ
On January 22, 2018, Sanofi and Bioverativ Inc. (Bioverativ), a biotechnology company focused on therapies for hemophilia and other rare blood disorders, entered into a definitive agreement under which Sanofi offered to acquire all of the outstanding shares of Bioverativ for $105 per share in cash, representing an equity value of approximately $11.6 billion (on a fully diluted basis). The transaction was unanimously approved by both the Sanofi and Bioverativ Boards of Directors. On February 7, 2018, Sanofi commenced a tender offer to acquire all of the outstanding shares of common stock of Bioverativ for $105 per share in cash, without interest thereon and net of any required tax withholding. On March 8, 2018, the acquisition of Bioverativ was completed, with Sanofi holding all the outstanding shares of Bioverativ on expiration of the tender offer.
The provisional purchase price allocation resulted in the recognition of goodwill amounting to 2,640 million, as indicated below:
( million) | Fair value at acquisition date |
|||
Other intangible assets |
8,154 | |||
Inventories |
145 | |||
Other current and non-current assets and liabilities |
445 | |||
True North Therapeutics contingent consideration liability |
(226 | ) | ||
Net deferred tax position |
(1,804 | ) | ||
Net assets of Bioverativ |
6,714 | |||
Goodwill |
2,640 | |||
Purchase price |
9,354 |
The other intangible assets recognized mainly comprise marketed hemophilia products (Eloctate®, Alprolix®), and development projects relating to treatments for rare hematological disorders.
Goodwill represents (i) the pipeline of future products in early-stage research and development not identified individually at the acquisition date; (ii) the capacity to draw on a specialized structure to refresh the existing product portfolio; (iii) the competencies of Bioverativ staff; (iv) the benefits derived from the creation of new growth platforms; and (v) the expected future synergies and other benefits from the combination of Bioverativ and Sanofi.
The goodwill arising on this acquisition is not tax deductible.
From the acquisition date, the contributions from Bioverativ to net sales and operating profit of the Pharmaceuticals segment (for a definition refer to Note D.35., Segment Information to the consolidated financial statements for the year ended December 31, 2017) amount to 321 million and 159 million, respectively. Over the same period, Bioverativ made a negative contribution of 163 million to net profit, including expenses charged during the period relating to the fair value remeasurement of assets recognized at the acquisition date. During the first half of 2018, Bioverativ generated net sales of 497 million.
Acquisition-related costs recognized in profit or loss for the period amounted to 25 million, and were recorded primarily within Other operating expenses.
The net cash outflow on this acquisition amounts to 8,932 million, and is recorded within Acquisitions of consolidated undertakings and investments accounted for using the equity method in the consolidated statements of cash flows.
25 | Sanofi 2018 HALF-YEAR FINANCIAL REPORT
Acquisition of Ablynx
In January 2018, Sanofi and Ablynx, a biopharmaceutical company engaged in the discovery and development of Nanobodies®, entered into a definitive agreement under which Sanofi offered to acquire all of the outstanding ordinary shares, including shares represented by American Depositary Shares (ADSs), warrants and convertible bonds of Ablynx, at a price per Ablynx share of 45 in cash, valuing Ablynx at approximately 3.9 billion (on a fully diluted basis). The transaction was unanimously approved by both the Sanofi and Ablynx Boards of Directors. On May 14, 2018, Sanofi and Ablynx announced that at the end of the initial acceptance period of the tender offer, Sanofi held 95.60% of the outstanding shares of Ablynx, of which more than 90% had been acquired through the offers. On June 19, 2018, after the end of the squeeze-out tender period, Sanofi announced that it held all the outstanding shares of Ablynx.
The provisional purchase price allocation resulted in the recognition of goodwill amounting to 2,301 million, as indicated below:
( million) | Fair value at acquisition date |
|||
Other intangible assets |
1,689 | |||
Other current and non-current assets and liabilities |
332 | |||
Net deferred tax position |
(422 | ) | ||
Net assets of Ablynx |
1,599 | |||
Goodwill |
2,301 | |||
Purchase price |
3,900 |
The impact of this acquisition on the business net income and net income of Sanofi for the first half of 2018 is immaterial.
Goodwill represents (i) the pipeline of future products in early-stage research and development not identified individually at the acquisition date; (ii) the capacity to draw on a specialized structure to refresh the existing product portfolio; (iii) the competencies of Ablynx staff; (iv) the benefits derived from the creation of new growth platforms; and (v) the expected future synergies and other benefits from the combination of Ablynx and Sanofi.
The goodwill arising on this acquisition is not tax deductible.
The net cash outflow on this acquisition amounts to 3,642 million, and is recorded within Acquisitions of consolidated undertakings and investments accounted for using the equity method in the consolidated statements of cash flows.
Divestment of the European Generics business
Further to the exclusivity agreement of April 17, 2018 between Sanofi and Advent International (Advent) under which Advent would acquire Zentiva, Sanofis European Generics business, for an enterprise value of 1,919 million, the two groups announced on June 28, 2018 that they had finalized their negotiations by signing a share purchase agreement. As of June 30, 2018, completion of the transaction is regarded as highly probable. Consequently, all assets of the European Generics business included in the sale, and all liabilities directly related to those assets, are presented in the line items Assets held for sale or exchange and Liabilities related to assets held for sale or exchange, respectively, in the consolidated balance sheet. The European Generics business is not an operating segment of Sanofi and does not qualify as a discontinued operation under IFRS 5.
The European Generics business is included in the Pharmaceuticals segment. For detailed information about the contribution of the European Generics business to the consolidated financial statements, refer to Note B.21.
Divestment of shares in Regeneron Pharmaceuticals Inc. (Regeneron)
During the first half of 2018, Sanofi divested 0.1 million shares in the biopharmaceutical company Regeneron at market value (32 million). As of June 30, 2018 Sanofis investment in Regeneron had a carrying amount of 2,624 million (see Note B.5.). This represents an equity interest of 22.0% as of that date, compared with 22.2% as at December 31, 2017.
B.2. PROPERTY, PLANT AND EQUIPMENT
Acquisitions of property, plant and equipment during the first half of 2018 amounted to 608 million. These included 387 million of investments in the Pharmaceuticals segment, primarily in industrial facilities (310 million). The Vaccines segment accounted for 167 million of investments during the period, and the Consumer Healthcare segment for 2 million.
Impairment losses of 31 million were charged against property, plant and equipment in the first half of 2018, primarily in the Pharmaceuticals segment.
Firm orders for property, plant and equipment stood at 584 million as of June 30, 2018.
2018 HALF-YEAR FINANCIAL REPORT Sanofi | 26
B.3. GOODWILL AND OTHER INTANGIBLE ASSETS
Movements in intangible assets other than goodwill during the first half of 2018 were as follows:
( million) | Acquired R&D |
Products, trademarks and other rights |
Software | Total other intangible assets |
||||||||||||
Gross value at January 1, 2018 |
3,679 | 53,638 | 1,368 | 58,685 | ||||||||||||
Changes in scope of consolidation |
3,383 | 6,460 | 1 | 9,844 | ||||||||||||
Acquisitions and other increases |
98 | 5 | 104 | 207 | ||||||||||||
Disposals and other decreases |
(21 | ) | (38 | ) | (14 | ) | (73 | ) | ||||||||
Currency translation differences |
160 | 1,191 | 6 | 1,357 | ||||||||||||
Transfers (a) |
(11 | ) | 9 | 3 | 1 | |||||||||||
Reclassification of the European Generics business |
(6 | ) | (617 | ) | (31 | ) | (654 | ) | ||||||||
Gross value at June 30, 2018 |
7,282 | 60,648 | 1,437 | 69,367 | ||||||||||||
Accumulated amortization & impairment at January 1, 2018 |
(2,204 | ) | (42,476 | ) | (925 | ) | (45,605 | ) | ||||||||
Amortization expense |
| (1,009 | ) | (53 | ) | (1,062 | ) | |||||||||
Impairment losses, net of reversals (b) | (17 | ) | (84 | ) | | (101 | ) | |||||||||
Disposals and other decreases | 2 | 37 | 14 | 53 | ||||||||||||
Currency translation differences | (36 | ) | (742 | ) | (4 | ) | (782 | ) | ||||||||
Reclassification of the European Generics business | 3 | 552 | 11 | 566 | ||||||||||||
Accumulated amortization & impairment at June 30, 2018 |
(2,252 | ) | (43,722 | ) | (957 | ) | (46,931 | ) | ||||||||
Carrying amount at December 31, 2017 |
1,475 | 11,162 | 443 | 13,080 | ||||||||||||
Carrying amount at June 30, 2018 |
5,030 | 16,926 | 480 | 22,436 |
(a) | The Transfers line mainly relates to acquired R&D that came into commercial use during the period and is being amortized from the date of marketing approval. |
(b) | See Note B.4. |
Acquisitions of other intangible assets (excluding software) in the first half of 2018 totaled 103 million. The principal items were upfront and milestone payments within the Vaccines segment and by Sanofi Genzyme. The item Products, trademarks and other rights mainly comprises:
| marketed products, with a carrying amount of 16.4 billion as of June 30, 2018 (versus 10.6 billion as of December 31, 2017) and a weighted average amortization period of approximately 10 years; |
| trademarks, with a carrying amount of 0.1 billion as of June 30, 2018 (versus 0.2 billion as of December 31, 2017) and a weighted average amortization period of approximately 13 years. |
The table below provides information about the principal marketed products, which represented approximately 89% of the carrying amount of that item as of June 30, 2018:
( million) | Gross value |
Accumulated amortization & impairment |
Carrying June 30, |
Amortization (years) (a) |
Residual (years) (b) |
Carrying December 31, |
||||||||||||||||||
Genzyme |
10,471 | (7,039 | ) | 3,432 | 10 | 5 | 3,834 | |||||||||||||||||
Boehringer Ingelheim Consumer Healthcare |
3,710 | (364 | ) | 3,346 | 16 | 15 | 3,442 | |||||||||||||||||
Aventis |
32,899 | (32,452 | ) | 447 | 9 | 3 | 584 | |||||||||||||||||
Chattem |
1,254 | (491 | ) | 763 | 23 | 15 | 766 | |||||||||||||||||
Bioverativ |
6,775 | (167 | ) | 6,608 | 13 | 13 | | |||||||||||||||||
Total: principal marketed products |
55,109 | (40,513 | ) | 14,596 | 8,626 |
(a) | Weighted averages. The amortization periods for these products vary between 1 and 25 years. |
(b) | Weighted averages. |
Goodwill amounted to 44,828 million as of June 30, 2018, versus 40,264 million as of December 31, 2017. Movements during the first half of 2018 were mainly due to the goodwill of 2,640 million and 2,301 million arising on the acquisitions of Bioverativ and Ablynx respectively, as described in Note B.1., and to currency translation differences. The reclassification of the European Generics business to Assets held for sale or exchange had an impact of 913 million on goodwill.
27 | Sanofi 2018 HALF-YEAR FINANCIAL REPORT
B.4. IMPAIRMENT OF INTANGIBLE ASSETS
The results of impairment tests on other intangible assets led to the recognition of an impairment loss of 101 million in the first half of 2018, mainly on Lemtrada®, a product marketed in the United States.
B.5. INVESTMENTS ACCOUNTED FOR USING THE EQUITY METHOD
Investments accounted for using the equity method consist of associates and joint ventures (see Note B.1. to the consolidated financial statements for the year ended December 31, 2017).
Investments accounted for using the equity method comprise:
( million) | % interest | June 30, 2018 |
December 31, 2017 (a) |
|||||||||
Regeneron Pharmaceuticals, Inc. |
22.0 | 2,624 | 2,496 | |||||||||
Onduo LLC |
50.0 | 135 | 141 | |||||||||
Infraserv GmbH & Co. Höchst KG (b) |
31.2 | 63 | 73 | |||||||||
Entities and companies managed by Bristol-Myers Squibb (c) |
49.9 | 39 | 38 | |||||||||
Other investments |
| 103 | 99 | |||||||||
Total |
2,964 | 2,847 |
(a) | Includes the effects of first-time application of IFRS 15 on revenue recognition (see Note A.1.2.). |
(b) | Joint venture. |
(c) | Under the terms of the agreements with BMS (see Note C.2. to the consolidated financial statements for the year ended December 31, 2017), Sanofis share of the net assets of entities majority-owned by BMS is recorded in Investments accounted for using the equity method. |
As of June 30, 2018, the market value of Sanofis investment in Regeneron was 7,040 million (based on a quoted stock market price of $344.99 per share as of that date), versus 7,487 million as of December 31, 2017 (based on a quoted stock market price of $375.96 per share as of that date).
The financial statements include commercial transactions between Sanofi and some equity-accounted investments that are classified as related parties. The main transactions and balances with related parties are summarized below:
( million) | June 30, 2018 |
June 30, 2017 (a) |
December 31, 2017 (a) |
|||||||||
Sales |
16 | 18 | 33 | |||||||||
Royalties and other income (b) |
66 | 37 | 100 | |||||||||
Accounts receivable and other receivables (b) |
35 | 29 | 85 | |||||||||
Purchases and other expenses (including research expenses) (b) |
385 | 410 | 777 | |||||||||
Accounts payable and other payables (b) |
221 | 215 | 217 |
(a) | Includes the effects of first-time application of IFRS 15 on revenue recognition (see Note A.1.2.). |
(b) | These amounts mainly comprise transactions with Regeneron. |
2018 HALF-YEAR FINANCIAL REPORT Sanofi | 28
B.6. OTHER NON-CURRENT ASSETS
Other non-current assets comprise:
( million) | June 30, 2018 |
December 31, 2017 |
||||||
Equity instruments at fair value through other comprehensive income (a) |
1,217 | 1,389 | ||||||
Debt instruments at fair value through other comprehensive income (a) |
219 | 199 | ||||||
Other financial assets at fair value through profit or loss (a) |
845 | 930 | ||||||
Pre-funded pension obligations |
59 | 53 | ||||||
Long-term loans and advances and other non-current receivables |
721 | 730 | ||||||
Derivative financial instruments |
72 | 63 | ||||||
Total |
3,133 | 3,364 |
(a) | Balance as of December 31, 2017 have been reclassified to the new financial asset categories required under IFRS 9, applicable with effect from January 1, 2018 (see Note A.1.3.). |
The line item Equity instruments at fair value through other comprehensive income includes in particular the following quoted and unquoted equity investments:
| an equity interest in Alnylam Pharmaceuticals, Inc., acquired at the start of 2014 in connection with the rare diseases development and collaboration agreement with that company. Based on quoted market prices, the carrying amount of the equity interest was 893 million as of June 30, 2018, versus 1,118 million as of December 31, 2017; |
| an equity injection into MyoKardia, Inc., initiated under a collaboration agreement signed with that company in September 2014, valued at 178 million as of June 30, 2018 and representing an equity interest of approximately 9% as of that date (versus 141 million and an equity interest of approximately 11% as of December 31, 2017); and |
| an equity injection into JHL Biotech, Inc. carried out under a collaboration agreement signed with that company on December 5, 2016, valued at 50 million as of June 30, 2018 and representing an equity interest of approximately 13% as of that date (versus 49 million and an equity interest of approximately 13% as of December 31, 2017). |
The line item Debt instruments at fair value through other comprehensive income includes quoted euro-denominated senior bonds amounting to 219 million as of June 30, 2018 (versus 199 million as of December 31, 2017).
The line item Other financial assets at fair value through profit or loss includes:
| contingent consideration receivable by Sanofi following the dissolution of the Sanofi Pasteur MSD joint venture (see Note D.7. to the consolidated financial statements for the year ended December 31, 2017). The amount of that receivable as of June 30, 2018 was 324 million, 269 million of which was non-current (compared with 342 million and a non-current portion of 292 million as of December 31, 2017). The fair value of the MSD contingent consideration is determined by applying the royalty percentage stipulated in the contract to discounted sales projections. Changes in the fair value of this asset are reported separately in the income statement, in the line item Fair value remeasurement of contingent consideration (see Note A.1.3.). The change in fair value recognized during the first half of 2018 was due primarily to a reassessment of the commercial prospects for MSD products; |
| financial assets held to meet obligations to employees under post-employment benefit plans, amounting to 138 million as of June 30, 2018 (versus 198 million as of December 31, 2017); |
| a portfolio of financial investments (amounting to 362 million) held to fund a deferred compensation plan provided to certain employees (versus 345 million as of December 31, 2017). |
The entire equity interest held by Sanofi in Voyager Therapeutics was divested during the first half of 2018. That investment had a carrying amount of 34 million as of December 31, 2017.
Sanofis equity interest in Impact Therapeutics, Inc. was divested in the first half of 2018. A financial gain was recognized on the divestment (see Note B.18.).
29 | Sanofi 2018 HALF-YEAR FINANCIAL REPORT
B.7. ACCOUNTS RECEIVABLE
Accounts receivable break down as follows:
( million) | June 30, 2018 |
December 31, 2017 |
||||||
Gross value |
6,786 | 7,405 | ||||||
Allowances |
(184 | ) | (189 | ) | ||||
Carrying amount |
6,602 | 7,216 |
The impact of allowances against accounts receivable in the first half of 2018 was a net expense of 3 million (versus 18 million for the first half of 2017).
The table below shows the aging profile of overdue accounts receivable, based on gross value:
Overdue accounts | Overdue | Overdue | Overdue | Overdue | Overdue | |||||||||||||||||||
( million) | gross value | <1 month | 1 to 3 months | 3 to 6 months | 6 to 12 months | > 12 months | ||||||||||||||||||
June 30, 2018 |
469 | 165 | 116 | 78 | 30 | 80 | ||||||||||||||||||
December 31, 2017 |
644 | 247 | 143 | 113 | 48 | 93 |
Some Sanofi subsidiaries have assigned receivables to factoring companies or banks without recourse. The amount of receivables that met the conditions described in Note B.8.7. to the consolidated financial statements for the year ended December 31, 2017 and hence were derecognized was 709 million as of June 30, 2018 (versus 437 million as of December 31, 2017). The residual guarantees relating to those transfers were immaterial as of June 30, 2018.
B.8. CONSOLIDATED SHAREHOLDERS EQUITY
B.8.1. SHARE CAPITAL
As of June 30, 2018, the share capital was 2,498,116,074 and consisted of 1,249,058,037 shares (the total number of shares outstanding) with a par value of 2.
Treasury shares held by Sanofi are as follows:
Number of shares | % of share capital | |||||||
(million) | for the period | |||||||
June 30, 2018 |
2.0 | 0.16 | % | |||||
December 31, 2017 |
0.2 | 0.01 | % | |||||
June 30, 2017 |
5.0 | 0.40 | % | |||||
January 1, 2017 |
20.0 | 1.55 | % |
A total of 131,018 shares were issued in the first half of 2018 as a result of the exercise of Sanofi stock subscription options.
In addition, a total of 3,333,488 shares vested and were issued in the first half of 2018 under restricted share plans.
B.8.2. REPURCHASE OF SANOFI SHARES
On May 2, 2018, the Annual General Meeting of Sanofi shareholders approved a share repurchase program for a period of 18 months. Under that program (and that program alone), Sanofi repurchased 1,879,789 of its own shares during the first half of 2018 for a total amount of 127 million.
On May 10, 2017, the Annual General Meeting of Sanofi shareholders approved a share repurchase program for a period of 18 months. Under that program (and that program alone), Sanofi repurchased 8,489,873 of its own shares during the first half of 2018 for a total amount of 600 million.
2018 HALF-YEAR FINANCIAL REPORT Sanofi | 30
B.8.3. REDUCTIONS IN SHARE CAPITAL
On April 26, 2018, the Board of Directors approved the cancellation of 7,239,803 treasury shares (512 million including additional paid-in capital), representing 0.58% of the share capital as of June 30, 2018.
Those cancellations have no net impact on the total amount of shareholders equity.
B.8.4. RESTRICTED SHARE PLANS
Restricted share plans are accounted for in accordance with the policies described in Note B.24.3. to the consolidated financial statements for the year ended December 31, 2017. The principal features of the plans awarded in 2018 are set forth below:
2018 | ||||
Type of plan | Performance share plan | |||
Date of Board meeting approving the plan |
May 2, 2018 | |||
Total number of shares subject to a 3-year service period |
4,390,216 | |||
Fair value per share awarded (a) |
56.59 | |||
Fair value of plan at the date of grant ( million) |
248 |
(a) | Quoted market price per share at the date of grant, adjusted for dividends expected during the vesting period. |
The total expense recognized for all restricted and performance share plans in the six months ended June 30, 2018 was 118 million, versus 103 million in the comparable period of 2017.
The number of shares not yet fully vested as of June 30, 2018 was 13,765,202, comprising 4,388,361 under the 2018 plans; 3,408,614 under the 2017 plans; 3,759,373 under the 2016 plans; and 2,208,854 under the 2015 plans.
B.8.5. CAPITAL INCREASES
On March 6, 2018, the Sanofi Board of Directors approved an employee share ownership plan in the form of a capital increase reserved for employees. Employees were offered the opportunity to subscribe to the capital increase at a price of 52.66 per share, representing 80% of the average of the opening quoted market prices of Sanofi shares during the 20 trading days preceding June 9, 2018.
The subscription period was open from June 11 through June 29, 2018. For each tranche of five shares applied for, the applicant received one additional new share by way of employers contribution; and for each application for 20 or more shares, the applicant received an additional four new shares by way of employers contribution. The plan resulted in a total of 2,298,783 shares being subscribed for, and the issuance of a further 102,401 shares as an employers contribution under the terms of the plan.
An expense of 32 million was recognized for this plan in the six months ended June 30, 2018. The shares will be issued, and the capital increase recognized in shareholders equity, on July 27, 2018.
On March 2, 2017, the Sanofi Board of Directors approved an employee share ownership plan in the form of a capital increase reserved for employees. Employees were offered the opportunity to subscribe to the capital increase at a price of 70.01 per share, representing 80% of the average of the opening quoted market prices of Sanofi shares during the 20 trading days preceding June 14, 2017.
The subscription period was open from June 19 through June 30, 2017. For each tranche of five shares applied for, the applicant received one additional new share by way of employers contribution; and for each application for 20 or more shares, the applicant received an additional four new shares by way of employers contribution.
The plan resulted in a total of 1,528,982 shares being subscribed for, and the issuance of a further 92,116 shares as an employers contribution under the terms of the plan. An expense of 21 million was recognized for this plan in the six months ended June 30, 2017.
31 | Sanofi 2018 HALF-YEAR FINANCIAL REPORT
B.8.6. STOCK SUBSCRIPTION OPTION PLANS
On May 2, 2018, the Board of Directors granted 220,000 stock subscription options at an exercise price of 65.84 per share. The vesting period is four years, and the plan expires on May 2, 2028.
Sanofi used the following assumptions in determining the fair value of the plan:
| dividend yield: 4.87%; |
| plan maturity: 7 years; |
| volatility of Sanofi shares, computed on a historical basis: 23.10%; |
| risk-free interest rate: 0.363%. |
On that basis, the fair value of one option is 6.32, and the fair value of the stock subscription option plan awarded in June 2018 is 1 million. That amount is recognized as an expense over the vesting period, with the corresponding amount recognized directly in equity.
The total expense recognized for all stock options in the six months ended June 30, 2018 was 1 million, versus 2 million in the comparable period of 2017.
The table below provides summary information about options outstanding and exercisable as of June 30, 2018:
Outstanding | Exercisable | |||||||||||||||||||
Average life |
Weighted per share |
||||||||||||||||||
Range of exercise prices | Number of options |
(years) | () | Number of options |
() | |||||||||||||||
From 30.00 to 40.00 per share |
99,621 | 0.75 | 38.08 | 99,621 | 38.08 | |||||||||||||||
From 40.00 to 50.00 per share |
1,605,816 | 0.67 | 45.09 | 1,605,816 | 45.09 | |||||||||||||||
From 50.00 to 60.00 per share |
3,430,945 | 2.04 | 54.21 | 3,430,945 | 54.21 | |||||||||||||||
From 60.00 to 70.00 per share |
220,000 | 9.85 | 65.84 | | | |||||||||||||||
From 70.00 to 80.00 per share |
1,796,920 | 5.87 | 73.64 | 1,395,420 | 72.99 | |||||||||||||||
From 80.00 to 90.00 per share |
770,004 | 7.91 | 89.18 | | | |||||||||||||||
Total |
7,923,306 | 6,531,802 |
B.8.7. NUMBER OF SHARES USED TO COMPUTE DILUTED EARNINGS PER SHARE
Diluted earnings per share is computed using the number of shares outstanding plus stock options with dilutive effect and restricted shares.
(million) | June 30, 2018 |
June 30, 2017 |
December 31, 2017 |
|||||||||
Average number of shares outstanding |
1,247.8 | 1,260.3 | 1,256.9 | |||||||||
Adjustment for stock options with dilutive effect |
1.2 | 3.2 | 2.7 | |||||||||
Adjustment for restricted shares |
5.9 | 7.1 | 7.2 | |||||||||
Average number of shares used to compute diluted earnings per share |
1,254.9 | 1,270.6 | 1,266.8 |
As of June 30, 2018, 2.8 million stock options were not taken into account in computing diluted earnings per share because they had no dilutive effect, compared with 0.8 million as of December 31, 2017 and 0.8 million as of June 30, 2017.
2018 HALF-YEAR FINANCIAL REPORT Sanofi | 32
B.8.8. OTHER COMPREHENSIVE INCOME
Movements within other comprehensive income are shown below:
( million) | June 30, 2018 (6 months) |
June 30, 2017 (6 months) |
December 31, (12 months) (a) |
|||||||||
Balance, beginning of period |
(1,707 | ) | 973 | 973 | ||||||||
Attributable to equity holders of Sanofi |
(1,673 | ) | 992 | 992 | ||||||||
Attributable to non-controlling interests |
(34 | ) | (19 | ) | (19 | ) | ||||||
Impact of first-time application of IFRS 9 on comprehensive income (b) |
(516 | ) | | | ||||||||
Actuarial gains/(losses): |
||||||||||||
Actuarial gains/(losses) excluding investments accounted for using the equity method |
118 | 282 | (30 | ) | ||||||||
Actuarial gains/(losses) of investments accounted for using the equity method, net of taxes |
| | 2 | |||||||||
Tax effects |
(38 | ) | (60 | ) | (90 | ) | ||||||
Equity instruments included in financial assets (b): |
||||||||||||
Change in fair value (excluding investments accounted for using the equity method) (c) |
(213 | ) | | | ||||||||
Change in fair value (investments accounted for using the equity method, net of taxes) |
| | | |||||||||
Tax effects |
50 | | | |||||||||
Items not subsequently reclassifiable to profit or loss |
(83 | ) | 222 | (118 | ) | |||||||
Available-for-sale financial assets: |
||||||||||||
Change in fair value (excluding investments accounted for using the equity method) (c) |
| 324 | 837 | |||||||||
Change in fair value (investments accounted for using the equity method, net of taxes) |
| 1 | 1 | |||||||||
Tax effects |
| (60 | ) | (145 | ) | |||||||
Debt instruments included in financial assets (b): |
||||||||||||
Change in fair value (excluding investments accounted for using the equity method) |
(1 | ) | | | ||||||||
Change in fair value (investments accounted for using the equity method, net of taxes) |
| | | |||||||||
Tax effects |
| | | |||||||||
Cash flow hedges: |
||||||||||||
Change in fair value (excluding investments accounted for using the equity method) (d) |
5 | (28 | ) | (24 | ) | |||||||
Change in fair value (investments accounted for using the equity method, net of taxes) |
| | | |||||||||
Tax effects |
(2 | ) | 9 | 8 | ||||||||
Change in currency translation differences: |
||||||||||||
Currency translation differences on foreign subsidiaries (excluding investments accounted for using the equity method) (d)(e) |
737 | (1,835 | ) | (2,956 | ) | |||||||
Currency translation differences (investments accounted for using the equity method) |
67 | (176 | ) | (283 | ) | |||||||
Items subsequently reclassifiable to profit or loss |
806 | (1,765 | ) | (2,562 | ) | |||||||
Balance, end of period |
(1,500 | ) | (570 | ) | (1,707 | ) | ||||||
Attributable to equity holders of Sanofi |
(1,463 | ) | (543 | ) | (1,673 | ) | ||||||
Attributable to non-controlling interests |
(37 | ) | (27 | ) | (34 | ) |
(a) | Includes the effects of first-time application of IFRS15 on revenue recognition (see Note A.1.2.). |
(b) | See Note A.1.3. |
(c) | Of which reclassified to profit or loss: immaterial amount in the six months ended June 30, 2017, (89) million in the year ended December 31, 2017. With effect from January 1, 2018, the financial asset category Available-for-sale financial assets is no longer applicable, in accordance with IFRS 9 (see Note A.1.3.). |
(d) | Of which reclassified to profit or loss: immaterial amount in the six months ended June 30, 2018, and (23) million in the six months ended June 30, 2017. |
(e) | Items subsequently reclassifiable to profit or loss and attributable to the Animal Health business, divested January 1, 2017: (170) million reclassified following the divestment, comprising (147) million of currency translation differences and (23) million of cash flow hedges. |
33 | Sanofi 2018 HALF-YEAR FINANCIAL REPORT
B.9. DEBT, CASH AND CASH EQUIVALENTS
Changes in financial position during the period were as follows:
( million) | June 30, 2018 |
December 31, 2017 |
||||||
Long-term debt |
22,788 | 14,326 | ||||||
Short-term debt and current portion of long-term debt |
6,153 | 1,275 | ||||||
Interest rate and currency derivatives used to hedge debt |
(170 | ) | (57 | ) | ||||
Total debt |
28,771 | 15,544 | ||||||
Cash and cash equivalents |
(7,493 | ) | (10,315 | ) | ||||
Interest rate and currency derivatives used to hedge cash and cash equivalents |
| | ||||||
Debt, net of cash and cash equivalents |
21,278 | 5,229 |
Debt, net of cash and cash equivalents is a financial indicator used by management and investors to measure Sanofis overall net indebtedness.
B.9.1. DEBT AT VALUE ON REDEMPTION
A reconciliation of the carrying amount of debt to value on redemption as of June 30, 2018 is shown below:
Value on redemption | ||||||||||||||||||||
( million) | Carrying amount at June 30, 2018 |
Amortized cost |
Adjustment to debt measured at fair value |
June 30, 2018 |
December 31, 2017 |
|||||||||||||||
Long-term debt |
22,788 | 118 | (73 | ) | 22,833 | 14,309 | ||||||||||||||
Short-term debt and current portion of long-term debt |
6,153 | 1 | | 6,154 | 1,275 | |||||||||||||||
Interest rate and currency derivatives used to hedge debt |
(170 | ) | | 61 | (109 | ) | (7 | ) | ||||||||||||
Total debt |
28,771 | 119 | (12 | ) | 28,878 | 15,577 | ||||||||||||||
Cash and cash equivalents |
(7,493 | ) | | | (7,493 | ) | (10,315 | ) | ||||||||||||
Interest rate and currency derivatives used to hedge cash and cash equivalents |
| | | | | |||||||||||||||
Debt, net of cash and cash equivalents |
21,278 | 119 | (12 | ) | 21,385 | 5,262 |
2018 HALF-YEAR FINANCIAL REPORT Sanofi | 34
The table below shows an analysis of debt, net of cash and cash equivalents by type, at value on redemption:
June 30, 2018 | December 31, 2017 | |||||||||||||||||||||||
( million) | non-current | current | Total | non-current | current | Total | ||||||||||||||||||
Bond issues |
22,725 | 2,138 | 24,863 | 14,195 | 820 | 15,015 | ||||||||||||||||||
Other bank borrowings |
74 | 3,702 | 3,776 | 81 | 203 | 284 | ||||||||||||||||||
Finance lease obligations |
21 | 4 | 25 | 20 | 11 | 31 | ||||||||||||||||||
Other borrowings |
13 | 3 | 16 | 13 | 4 | 17 | ||||||||||||||||||
Bank credit balances |
| 307 | 307 | | 237 | 237 | ||||||||||||||||||
Interest rate and currency derivatives used to hedge debt |
(20 | ) | (89 | ) | (109 | ) | (7 | ) | | (7 | ) | |||||||||||||
Total debt |
22,813 | 6,065 | 28,878 | 14,302 | 1,275 | 15,577 | ||||||||||||||||||
Cash and cash equivalents |
| (7,493 | ) | (7,493 | ) | | (10,315 | ) | (10,315 | ) | ||||||||||||||
Interest rate and currency derivatives used to hedge cash and cash equivalents |
| | | | | | ||||||||||||||||||
Debt, net of cash and cash equivalents |
22,813 | (1,428 | ) | 21,385 | 14,302 | (9,040 | ) | 5,262 |
Principal financing and debt reduction transactions during the period
In March 2018, an 8 billion bond issue under the Sanofi Euro Medium Term Notes (EMTN) program, in six tranches:
| 1 billion of floating-rate bonds maturing March 2020, with quarterly coupons and bearing interest at an annual rate of 3-month Euribor plus 15 basis points; |
| 500 million of fixed-rate bonds maturing March 2020, with annual coupons and bearing interest at an annual rate of 0.000%; |
| 1.75 billion of fixed-rate bonds maturing March 2023, with annual coupons and bearing interest at an annual rate of 0.500%; |
| 1.5 billion of fixed-rate bonds maturing March 2026, with annual coupons and bearing interest at an annual rate of 1.000%; |
| 2 billion of fixed-rate bonds maturing March 2030, with annual coupons and bearing interest at an annual rate of 1.375%; and |
| 1.25 billion of fixed-rate bonds maturing March 2038, with annual coupons and bearing interest at an annual rate of 1.875%. |
In June 2018, a $2 billion bond issue under the Sanofi shelf registration statement program, in two tranches:
| $1 billion of fixed-rate bonds maturing June 2023, with half-yearly coupons and bearing interest at an annual rate of 3.375%; |
| $1 billion of fixed-rate bonds maturing June 2028, with half-yearly coupons and bearing interest at an annual rate of 3.625%. |
In connection with the tender offer for Ablynx, Sanofi contracted a 4.2 billion credit facility with BNP Paribas Fortis on January 28, 2018. This facility was not drawn down by Sanofi, and was cancelled on June 26, 2018 in line with the contractual terms.
Sanofi had the following arrangements in place as of June 30, 2018 to manage its liquidity in connection with current operations:
| a syndicated credit facility of 4 billion, drawable in euros and in US dollars, due to expire on December 17, 2020 following the exercise of a second extension option in November 2015; and |
| a syndicated credit facility of 4 billion, drawable in euros and in US dollars, due to expire on December 3, 2021 following the exercise of a second extension option in November 2016. |
Sanofi has no further extension options for those credit facilities. As of June 30, 2018, there were no drawdowns under either facility.
Sanofi also has two commercial paper programs, of 6 billion in France and $10 billion in the United States. During the first half of 2018 only the US program was used, with an average drawdown of $5.9 billion.
35 | Sanofi 2018 HALF-YEAR FINANCIAL REPORT
The financing in place as of June 30, 2018 at the level of the holding company (which manages most of Sanofis financing needs centrally) is not subject to any financial covenants, and contains no clauses linking credit spreads or fees to the credit rating.
B.9.2. MARKET VALUE OF DEBT
The market value of debt, net of cash and cash equivalents and of derivatives and excluding accrued interest, amounted to 21,704 million as of June 30, 2018 (versus 5,718 million as of December 31, 2017). This compares with a value on redemption of 21,385 million (versus 5,262 million as of December 31, 2017).
B.10. DERIVATIVE FINANCIAL INSTRUMENTS
B.10.1. CURRENCY DERIVATIVES USED TO MANAGE OPERATING RISK EXPOSURES
The table below shows operating currency hedging instruments in place as of June 30, 2018. The notional amount is translated into euros at the relevant closing exchange rate.
Of which derivatives designated as cash flow hedges |
Of which derivatives not eligible for hedge accounting |
|||||||||||||||||||||||||||
June 30, 2018 ( million) | Notional amount |
Fair value |
Notional amount |
Fair value |
Of which recognized in equity |
Notional amount |
Fair value |
|||||||||||||||||||||
Forward currency sales |
3,338 | (1 | ) | | | | 3,338 | (1 | ) | |||||||||||||||||||
of which US dollar |
1,506 | (16 | ) | | | | 1,506 | (16 | ) | |||||||||||||||||||
of which Chinese yuan renminbi |
426 | 7 | | | | 426 | 7 | |||||||||||||||||||||
of which Japanese yen |
282 | (1 | ) | | | | 282 | (1 | ) | |||||||||||||||||||
of which Singapore dollar |
131 | | | | | 131 | | |||||||||||||||||||||
of which Russian rouble |
101 | | | | | 101 | | |||||||||||||||||||||
Forward currency purchases |
1,419 | (1 | ) | | | | 1,419 | (1 | ) | |||||||||||||||||||
of which Singapore dollar |
424 | 4 | | | | 424 | 4 | |||||||||||||||||||||
of which US dollar |
422 | (2 | ) | | | | 422 | (2 | ) | |||||||||||||||||||
of which Japanese yen |
99 | (1 | ) | | | | 99 | (1 | ) | |||||||||||||||||||
of which Chinese yuan renminbi |
76 | (1 | ) | | | | 76 | (1 | ) | |||||||||||||||||||
of which Canadian dollar |
52 | | | | | 52 | | |||||||||||||||||||||
Total |
4,757 | (2 | ) | | | | 4,757 | (2 | ) |
The above positions mainly hedge material foreign-currency cash flows arising after the end of the reporting period in relation to transactions carried out during the six months ended June 30, 2018 and recognized in the balance sheet at that date. Gains and losses on hedging instruments (forward contracts) are calculated and recognized in parallel with the recognition of gains and losses on the hedged items. Due to this hedging relationship, the commercial foreign exchange difference on those items (hedging instruments and hedged transactions) will be immaterial in the second half of 2018.
2018 HALF-YEAR FINANCIAL REPORT Sanofi | 36
B.10.2. CURRENCY AND INTEREST RATE DERIVATIVES USED TO MANAGE FINANCIAL EXPOSURE
The cash pooling arrangements for foreign subsidiaries outside the euro zone, and some of Sanofis financing activities, expose certain Sanofi entities to financial foreign exchange risk (i.e. the risk of changes in the value of loans and borrowings denominated in a currency other than the functional currency of the lender or borrower).
That foreign exchange exposure is hedged by Sanofi using firm financial instruments (usually currency swaps or forward contracts) contracted with banking counterparties.
The table below shows financial currency hedging instruments in place as of June 30, 2018. The notional amount is translated into euros at the relevant closing exchange rate.
June 30, 2018 | ||||||||||||
( million) | Notional amount |
Fair value |
Maximum expiry date |
|||||||||
Forward currency sales |
4,547 | (25 | ) | |||||||||
of which US dollar |
3,063 | (24 | ) | 2019 | ||||||||
of which Japanese yen |
587 | (1 | ) | 2019 | ||||||||
of which Australian dollar |
207 | | 2019 | |||||||||
Forward currency purchases |
8,639 | 60 | ||||||||||
of which US dollar |
4,624 | 101 | 2019 | |||||||||
of which Singapore dollar |
1,996 | 5 | 2019 | |||||||||
of which Canadian dollar |
651 | (30 | ) | 2018 | ||||||||
Total |
13,186 | 35 |
To limit risk and optimize the cost of its short-term and medium-term net debt, Sanofi uses derivative instruments that alter the interest rate and/or currency structure of its debt and cash.
The table below shows instruments of this type in place as of June 30, 2018:
Of which designated as fair value hedges |
Of which designated as cash flow hedges |
|||||||||||||||||||||||||||||||||||||||||||||||
( million) | 2019 | 2020 | 2021 | 2022 | 2023 | Total | Fair value |
Notional amount |
Fair value |
Notional amount |
Fair value |
Of which recognized in equity |
||||||||||||||||||||||||||||||||||||
Interest rate swaps |
||||||||||||||||||||||||||||||||||||||||||||||||
pay capitalized Eonia/receive 1.58% |
1,550 | 1,550 | 57 | 1,550 | 57 | | ||||||||||||||||||||||||||||||||||||||||||
pay capitalized Eonia/receive 0.07% |
2,000 | 2,000 | 8 | 2,000 | 8 | | ||||||||||||||||||||||||||||||||||||||||||
pay 1.81%/receive 3-month US dollar Libor |
429 | 429 | 7 | 429 | 7 | | ||||||||||||||||||||||||||||||||||||||||||
pay 3-month US dollar Libor/receive 2.22% |
429 | 429 | (3 | ) | 429 | (3 | ) | | ||||||||||||||||||||||||||||||||||||||||
pay capitalized Eonia/receive 1.48% (a) |
42 | 57 | 99 | (6 | ) | 99 | (6 | ) | | |||||||||||||||||||||||||||||||||||||||
Total |
1,550 | 858 | | 2,042 | 57 | 4,507 | 63 | 4,078 | 56 | 429 | 7 | |
(a) | These interest rate swaps hedge fixed-rate bonds with a nominal of 99 million held in a Professional Specialized Investment Fund dedicated to Sanofi and recognized within Loans, advances and other long-term receivables. |
37 | Sanofi 2018 HALF-YEAR FINANCIAL REPORT
B.11. LIABILITIES RELATED TO BUSINESS COMBINATIONS AND TO NON-CONTROLLING INTERESTS
For a description of the nature of the liabilities reported in the line item Liabilities related to business combinations and to non-controlling interests, refer to Note B.8.5. to the consolidated financial statements for the year ended December 31, 2017.
The liabilities related to business combinations and to non-controlling interests shown in the table below are level 3 instruments under the IFRS 7 fair value hierarchy (see Note A.1.3.), except for the CVRs issued in connection with the acquisition of Genzyme, which are level 1 instruments.
Movements in liabilities related to business combinations and to non-controlling interests during the first half of 2018 are shown below:
( million) | Liabilities related to non-controlling interests (a) & other items |
CVRs issued in connection with the acquisition of Genzyme (b) |
Bayer from the |
MSD contingent consideration (European business) |
Other | Total (c) | ||||||||||||||||||
Balance at January 1, 2018 |
92 | 75 | 701 | 420 | 81 | 1,369 | ||||||||||||||||||
New transactions (d) |
| | | | 228 | 228 | ||||||||||||||||||
Payments made |
| | (75 | ) | (57 | ) | (54 | ) | (186 | ) | ||||||||||||||
Fair value remeasurements through profit or loss: (gain)/loss (including unwinding of discount) (e) |
| 23 | (33 | ) | 32 | (1 | ) | 21 | ||||||||||||||||
Other movements |
1 | | | | (2 | ) | (1 | ) | ||||||||||||||||
Currency translation differences |
1 | 3 | 18 | (1 | ) | 16 | 37 | |||||||||||||||||
Balance at June 30, 2018 |
94 | 101 | 611 | 394 | 268 | 1,468 | ||||||||||||||||||
Of which: |
||||||||||||||||||||||||
Current portion |
450 | |||||||||||||||||||||||
Non-current portion |
1,018 |
(a) | Put options granted to non-controlling interests and commitment to future buyout of non-controlling interests held by BMS. |
(b) | Based on the quoted market price per CVR of $0.50 as of June 30, 2018 and $0.38 as of December 31, 2017. |
(c) | As of January 1, 2018, this comprised a non-current portion of 1,026 million and a current portion of 343 million. |
(d) | Includes 226 million for contingent consideration liabilities in favor of True North Therapeutics and 2 million of liabilities owed to Bioverativ employees at the acquisition date. |
(e) | Amounts reported within the income statement line item Fair value remeasurement of contingent consideration. |
As of June 30, 2018, Liabilities related to business combinations and to non-controlling interests mainly comprised the following items:
| Liability arising from the acquisition of True North Therapeutics by Bioverativ in March 2018. The former shareholders of True North Therapeutics are entitled to milestone payments contingent on the attainment of development, registration and sales objectives; the fair value of the resulting liability was measured at $189 million as of June 30, 2018. That fair value is determined based on the contractual terms and on development and sales projections which have been weighted to reflect the probability of success, and discounted. If the discount rate were to fall by 1 percentage point, the fair value of the contingent consideration would increase by approximately 2%. |
| Bayer contingent consideration liability arising from the acquisition of Genzyme in 2011. As of June 30, 2018, Bayer was still entitled to receive the following potential payments: |
| a percentage of sales of alemtuzumab up to a maximum of $1,250 million or over a maximum period of ten years, whichever is achieved first; |
| milestone payments based on specified levels of worldwide sales of alemtuzumab beginning in 2021, unless Genzyme exercises its right to buy out those milestone payments by making a one-time payment not exceeding $900 million. |
The fair value of this liability was measured at 611 million as of June 30, 2018, versus 701 million as of December 31, 2017. The fair value of the Bayer liability is determined by applying the above contractual terms to sales projections which have been weighted to reflect the probability of success, and discounted. If the discount rate were to fall by 1 percentage point, the fair value of the Bayer liability would increase by approximately 4%.
2018 HALF-YEAR FINANCIAL REPORT Sanofi | 38
| MSD contingent consideration liability arising from the 2016 acquisition of the Sanofi Pasteur activities carried on within the former Sanofi Pasteur MSD joint venture. This liability amounted to 394 million as of June 30, 2018 compared with 420 million as of December 31, 2017 (see Note D.18. to the consolidated financial statements for the year ended December 31, 2017). The fair value of this contingent consideration is determined by applying the royalty percentage stipulated in the contract to discounted sales projections. |
B.12. NON-CURRENT PROVISIONS AND OTHER NON-CURRENT LIABILITIES
Non-current provisions and other non-current liabilities break down as follows:
( million) | Provisions for pensions & other post- employment benefits |
Provisions for other long-term benefits |
Restructuring provisions |
Other provisions |
Other current |
Total | ||||||||||||||||||
Balance at January 1, 2018 |
3,959 | 750 | 514 | 2,881 | 1,050 | 9,154 | ||||||||||||||||||
Changes in scope of consolidation |
1 | | | 45 | 1 | 47 | ||||||||||||||||||
Increases in provisions and other liabilities |
115 | (a) | 82 | 223 | 141 | (b) | 130 | 691 | ||||||||||||||||
Provisions utilized |
(172 | )(a) | (69 | ) | (2 | ) | (92 | ) | (28 | ) | (363 | ) | ||||||||||||
Reversals of unutilized provisions |
(24 | ) | | (3 | ) | (127 | )(b) | | (154 | ) | ||||||||||||||
Transfers |
(81 | ) | | (126 | )(c) | (161 | )(c) | (10 | )(c) | (378 | ) | |||||||||||||
Reclassification of the European Generics business |
(9 | ) | (2 | ) | | (22 | ) | | (33 | ) | ||||||||||||||
Net interest related to employee benefits, and unwinding of discount |
34 | 2 | | 12 | 2 | 50 | ||||||||||||||||||
Currency translation differences |
23 | 8 | | (10 | ) | 32 | 53 | |||||||||||||||||
Actuarial gains and losses on defined-benefit plans |
(118 | ) | | | | | (118 | ) | ||||||||||||||||
Balance at June 30, 2018 |
3,728 | 771 | 606 | 2,667 | 1,177 | 8,949 |
(a) | In the case of Provisions for pensions and other post-employment benefits, the Increases in provisions line corresponds to rights vesting in employees during the period and past service cost, and the Provisions utilized line corresponds to contributions paid into pension funds and to plan settlements. |
(b) | Amounts charged and reversed during the first half of 2018 were largely due to reassessments of tax risks and the resolution of various procedures under way with the tax authorities of several countries. |
(c) | Includes transfers between current and non-current. |
As of June 30, 2018, a liability of 1,030 million was recognized, representing the estimated tax charge on deemed repatriation attributable to the accumulated earnings of non-US operations payable over 8 years (1,069 million as of 31 December 2017). Of this, 865 million falls due after more than one year and is presented within other non-current liabilities (708 million as of 31 December 2017).
Provisions for pensions and other post-employment benefits
For an analysis of the sensitivity of obligations in respect of pensions and other employee benefits, and the assumptions used as of December 31, 2017, see Note D.19.1. to the consolidated financial statements for the year ended December 31, 2017.
The principal assumptions used (in particular, changes in discount and inflation rates and in the market value of plan assets) for the euro zone, the United States and the United Kingdom were reviewed as of June 30, 2018 to take into account changes during the first half of the year.
Actuarial gains and losses arising on pensions and other post-employment benefits and recognized directly in equity are as follows (amounts reported before tax):
June 30, | June 30, | December 31, | ||||||||||
2018 | 2017 | 2017 | ||||||||||
( million) | (6 months) | (6 months) | (12 months) | |||||||||
Actuarial gains/(losses) on plan assets |
(162 | ) | 235 | 392 | ||||||||
Actuarial gains/(losses) on benefit obligations |
280 | (a) | 47 | (b) | (422 | ) |
(a) | Includes the effect of changes in discount rates (in a range between +0.25% and +0.50%) and in the euro zone inflation rate (+0.25%) in the first half of 2018. |
(b) | Includes the effect of a change in discount rates (in a range between -0.25% and +0.25%) in the first half of 2017. |
39 | Sanofi 2018 HALF-YEAR FINANCIAL REPORT
B.13. OFF BALANCE SHEET COMMITMENTS
Off balance sheet commitments to third parties arise under collaboration agreements entered into by Sanofi (see Note D.21.1. to the consolidated financial statements for the year ended December 31, 2017).
Agreements signed during the first half of 2018 gave rise to the following new commitments:
| Payments associated with projects in the research and development phase: 2.0 billion. |
| Payments contingent on the attainment of specified sales targets once a product reaches the market: 0.8 billion. |
| Potential milestone payments relating to development projects under collaboration agreements: 0.1 billion. |
The principal commitments entered into, amended or discontinued during the period are described below:
On January 7, 2018, Sanofi and Alnylam Pharmaceuticals, Inc. (Alnylam) announced a strategic restructuring of their alliance to develop RNAi therapeutics for the treatment of rare genetic diseases. Sanofi obtained global rights for the investigational therapeutic fitusiran in the treatment of hemophilia and other rare bleeding disorders. Alnylam obtained global rights for the programs relating to the investigational therapeutics programs patisiran and ALN-TTRsc02 in the treatment of ATTR amyloidosis. As of June 30, 2018, the right to receive and obligation to pay future royalties are not reflected in the Sanofi financial statements.
On January 7, 2018, Celgene Corporation announced the acquisition of Impact Biomedicines for $7 billion, comprising an upfront payment of $1.1 billion and variable consideration contingent on future performances totaling $5.9 billion dollars. In 2016, Sanofi sold all its rights to fedratinib (which it held following the 2010 acquisition of TargeGen Inc., an unquoted biotech company specializing in the treatment of blood disorders), and in exchange received a 10% equity interest in Impact Biomedicines.
On January 8, 2018, Sanofi and Regeneron announced (i) amendments to their collaboration agreement on the development and commercialization of human therapeutic antibodies; (ii) amendments to their IO License and Collaboration Agreement on the development of cemiplimab (REGN 2810) in the field of immuno-oncology; and (iii) a limited waiver and amendment of the Amended Investor Agreement pursuant to a letter agreement (the 2018 Letter Agreement). The announcement included a series of amendments to the collaboration agreements relating to the funding of additional programs to develop REGN2810 in extended indications, and of additional programs on Dupixent® and IL33 (REGN 3500/SAR 440340). The $650 million development budget for the PD-1 inhibitor antibody will be increased to $1.64 billion through 2022, funded equally by the two companies (i.e. from $325 million to $820 million for each partner).The additional programs on Dupixent® and IL33 (REGN 3500/SAR 440340) will focus on extending the current range of indications and finding new indications, and improving co-morbidity between multiple pathologies.
On February 8, 2018, Sanofi signed a partnership agreement with AnaBios Corporation to develop and commercialize new treatments for irregular heartbeat, primarily atrial fibrillation.
On February 12, 2018, Sanofi Pasteur signed a partnership agreement with SK Chemicals under which Sanofi acquires exclusive development and commercialization rights in the United States and Europe for vaccines derived from the cell-based technology developed by SK Chemicals.
On June 8, 2018, Sanofi signed a strategic partnership agreement in oncology with Revolution Medicines (Redwood City, California, United States), an innovative biotech company that develops targeted-action small molecules. Under the agreement, the two companies will jointly develop the principal candidate derived from Revolution Medicines biological research: RMC 4630, an inhibitor of SHP2 (PTPN11), a cellular enzyme in the protein tyrosine phosphatase family that plays an important role in multiple forms of cancer. The first-in-human clinical trials with RMC 4630 are expected later in 2018.
On June 11, 2018, Sanofi Pasteur entered into a partnership agreement with Translate Bio to develop messenger RNA (mRNA) vaccines derived from Translate Bio technology for five infectious disease pathogens, with an option to extend to additional pathogens. If that option is exercised, the total value of the transaction would rise to $805 million.
Sanofi and Avila Therapeutics Inc. (Avila, acquired by Celgene Corporation in 2012) have decided to end their research collaboration on anti-cancer treatments than began in 2010.
In addition, by acquiring all of the outstanding shares of Bioverativ on March 8, 2018 (see Note B.1.), Sanofi assumed the commitments made by that company to various partners under collaboration agreements, in particular:
| with Sangamo Therapeutics, Inc. (Sangamo) to research, develop, and commercialize therapeutics for hemoglobinopathies, in particular beta thalassemia and sickle cell disease, based on Sangamos gene therapy platform; |
| with Bicycle Therapeutics Ltd. (Bicycle) to discover, develop and commercialize innovative therapies for hemophilia and sickle cell disease. |
2018 HALF-YEAR FINANCIAL REPORT Sanofi | 40
Sanofi also assumed the commitments regarding contingent consideration entered into by Bioverativ when it acquired True North Therapeutics (see Note B.11.).
Finally, by acquiring all of the outstanding shares of Ablynx on June 19, 2018 (see Note B.1.), Sanofi assumed various commitments in favor of that company, mainly in respect of milestone payments relating to development projects and royalties under collaboration agreements between Ablynx and various partners, in particular:
| with Boehringer Ingelheim: in September 2007; |
| with Merck KGaa: in September 2008; |
| with Merck & Co, Inc.: in October 2012 and January 2014. |
B.14. LEGAL AND ARBITRAL PROCEEDINGS
Sanofi and its affiliates are involved in litigation, arbitration and other legal proceedings. These proceedings typically are related to product liability claims, intellectual property rights (particularly claims against generic companies seeking to limit the patent protection of Sanofi products), competition law and trade practices, commercial claims, employment and wrongful discharge claims, tax assessment claims, waste disposal and pollution claims, and claims under warranties or indemnification arrangements relating to business divestitures.
The matters discussed below constitute the most significant developments since publication of the disclosures concerning legal proceedings in the Companys financial statements for the year ended December 31, 2017.
B.14.1. PRODUCTS
PLAVIX® PRODUCT LITIGATION IN THE US
As of June 30, 2018, there are 328 pending lawsuits seeking recovery under US state law for personal injuries allegedly sustained in connection with the use of Plavix®. They involve 443 total plaintiffs (but 376 ingesting plaintiffs).
DEPAKINE® PRODUCT LITIGATION IN FRANCE
In July 2018, the French affiliate of Sanofi filed an administrative claim against the French Ministry of Health seeking compensation for the damages awarded by the Court of Appeals of Orléans (France) in the Carrère case on the grounds of incompleteness of information provided in the product leaflet.
B.14.2. PATENTS
PRALUENT® (ALIROCUMAB)-RELATED AMGEN PATENT LITIGATION IN THE US
In the US, the case has been sent back to the Delaware Court. The Court has set a jury trial on invalidity to begin in February 2019, with a jury trial on damages immediately to follow, should Sanofi and Regeneron lose on validity. The Delaware Court also allowed each side to file one summary judgment motion with oral argument to take place in January 2019.
In July 2018, Amgen filed a petition for certiorari with the US Supreme Court. Amgen is asking the Supreme Court to review and overturn the October 5, 2017 Federal Circuit decision, in particular the validity issues. This filing does not impact the ongoing proceedings in Delaware.
PRALUENT® (ALIROCUMAB)-RELATED AMGEN PATENT LITIGATION IN EUROPE
In the lawsuit filed in France by Amgen in 2016 alleging that alirocumab infringes its 124 (FR) patent, the judge postponed in June 2018 the oral hearing to February 2019.
The infringement case in Germany (Düsseldorf Regional Court) is currently stayed pending the decision of the European Patent Office (EPO) in the opposition challenging the validity of Amgens patent and requesting its revocation. After the Preliminary Opinion issued in December 2017 that favored Amgen and rejected Sanofis invalidity arguments, Amgen petitioned the Dusseldorf Regional Court to lift the stay in the infringement litigation. A hearing on the issue of the stay is scheduled for September 2018. In addition, in July 2018, Sanofi filed a new action in the German Federal Patent Court seeking a compulsory license to Amgens patent, including an urgent request for a provisional compulsory license.
41 | Sanofi 2018 HALF-YEAR FINANCIAL REPORT
DUPIXENT® (DUPILUMAB)-RELATED AMGEN PATENT OPPOSITION AND REVOCATION IN EUROPE
Early 2018, Immunex appealed the decision of the EPO revoking Immunex Patent EP2292665. EPO decision is suspended pending the appeal ruling.
B.14.3 CONTINGENCIES ARISING FROM CERTAIN BUSINESS DIVESTITURES
LLRICE601 AND LLRICE604 ARBITRATION
The evidentiary hearing took place in May 2018. Post-hearing briefs have to be submitted to the arbitral tribunal by each party by end of September and mid-November 2018.
BOEHRINGER INGELHEIM (BI) RETAINED LIABILITIES
Following the closing in January 2017 of the swap of Sanofis Animal Health business for BIs Consumer Healthcare (CHC) business, both parties have issued claims against one another for breaches of representations, payments for certain studies, withdrawal of products from particular markets, and claims related to liabilities arising before Closing. The asset swap deal was structured such that the Consumer Health sale and purchase agreement and the Animal Health sale and purchase agreement are nearly identical and have mirroring indemnification provisions. Accordingly, both agreements contain escalation procedures to be followed to resolve claims amicably in advance of formal dispute resolution. Sanofi is working to investigate the validity of BIs claims related to Animal Health and to pursue its claims pertaining to Consumer Health.
B.15. OTHER OPERATING INCOME AND EXPENSES
Other operating income amounted to 323 million in the first half of 2018 (versus 173 million in the first half of 2017), and Other operating expenses to 165 million (versus 71 million in the first half of 2017).
The main items included in Other operating income in the first half of 2018 were gains on disposals of assets and operations (226 million), including 15 million on disposals of Regeneron shares.
Other operating expenses for the first half of 2018 included 64 million of commercialization expenses incurred by Regeneron.
B.16. RESTRUCTURING COSTS AND SIMILAR ITEMS
Restructuring costs and similar items comprise the following:
June 30, 2018 |
June 30, 2017 |
December 31, 2017 |
||||||||||
( million) | (6 months) | (6 months) | (12 months) | |||||||||
Employee-related expenses |
206 | 124 | 336 | |||||||||
Expenses related to property, plant and equipment and to inventories |
80 | 154 | 221 | |||||||||
Compensation for early termination of contracts (other than contracts of employment) |
4 | 42 | 61 | |||||||||
Decontamination costs |
| 1 | (4 | ) | ||||||||
Other restructuring costs |
317 | 43 | 117 | |||||||||
Total |
607 | 364 | 731 |
Restructuring costs in the first half of 2018 mainly reflect (i) write-downs of industrial assets in the United States; (ii) employee-related expenses associated with headcount adjustment plans in Europe and Japan; and (iii) the costs of transferring the infectious diseases early stage R&D pipeline and research unit. Those transfer costs amount to 253 million and primarily consist of payments to Evotec over a five-year period, including an upfront payment of 60 million on finalization of the agreement in early July 2018.
2018 HALF-YEAR FINANCIAL REPORT Sanofi | 42
B.17. OTHER GAINS AND LOSSES, AND LITIGATION
In 2018, Other gains and losses, and litigation represent the separation costs associated with the divestment of the European Generics business, before tax effects.
B.18. FINANCIAL EXPENSES AND INCOME
An analysis of financial expenses and income is set forth below:
June 30, 2018 |
June 30, 2017 |
December 31, 2017 |
||||||||||
( million) | (6 months) | (6 months) (a) | (12 months) (a) | |||||||||
Cost of debt (b) |
(145 | ) | (140 | ) | (277 | ) | ||||||
Interest income (c) |
31 | 30 | 56 | |||||||||
Cost of debt, net of cash and cash equivalents |
(114 | ) | (110 | ) | (221 | ) | ||||||
Non-operating foreign exchange gains/(losses) |
(20 | ) | 1 | (21 | ) | |||||||
Unwinding of discounting of provisions (d) |
(13 | ) | (17 | ) | (33 | ) | ||||||
Net interest cost related to employee benefits |
(36 | ) | (47 | ) | (92 | ) | ||||||
Gains/(losses) on disposals of financial assets |
63 | 52 | 96 | |||||||||
Impairment losses on financial assets, net of reversals |
| (6 | ) | (7 | ) | |||||||
Other items |
15 | 4 | 5 | |||||||||
Net financial income/(expenses) |
(105 | ) | (123 | ) | (273 | ) | ||||||
comprising: Financial expenses |
(202 | ) | (218 | ) | (420 | ) | ||||||
Financial income |
97 | 95 | 147 |
(a) | For 2017, the results of the Animal Health business are presented separately in accordance with IFRS 5, Non-Current Assets Held for Sale and Discontinued Operations (see Note B.21.). |
(b) | Includes net gain/(loss) on interest rate and currency derivatives used to hedge debt: 67 million in the first half of 2018, 27 million in the first half of 2017, and 69 million over the whole of 2017. |
(c) | Includes net gain/(loss) on interest rate and currency derivatives used to hedge cash and cash equivalents: zero in the first half of 2018, (6) million in the first half of 2017, and zero over the whole of 2017. |
(d) | Primarily on provisions for environmental risks, restructuring provisions, and provisions for product-related risks (see Note B.12.). |
The impact of the ineffective portion of hedging relationships was not material in either 2018 or 2017.
B.19. INCOME TAX EXPENSE
Sanofi has elected for tax consolidations in a number of countries, principally France, Germany, the United Kingdom and the United States.
The table below shows the allocation of income tax expense between current and deferred taxes:
June 30, 2018 |
June 30, 2017 |
December 31, 2017 |
||||||||||
( million) | (6 months) | (6 months) (a)/(b) | (12 months) (a)/(b) | |||||||||
Current taxes |
(625 | ) | (879 | ) | (2,631 | ) | ||||||
Deferred taxes |
328 | 267 | 909 | |||||||||
Total |
(297 | ) | (612 | ) | (1,722 | ) | ||||||
Income before tax and investments accounted for using the equity method |
2,057 | 2,957 | 5,531 |
(a) | Includes the effects of first-time application of IFRS 15 on revenue recognition (see Note A.1.2.). |
(b) | For 2017, the results of the Animal Health business are presented separately in accordance with IFRS 5 (Non-Current Assets Held for Sale and Discontinued Operations); see Note B.21. |
43 | Sanofi 2018 HALF-YEAR FINANCIAL REPORT
The difference between the effective tax rate (on income before tax and investments accounted for using the equity method) and the standard corporate income tax rate applicable in France is explained as follows:
June 30, 2018 |
June 30, 2017 | December 31, 2017 |
||||||||||
(as a percentage) | (6 months) (b) | (6 months) (a)(b) | (12 months) (a) | |||||||||
Standard tax rate applicable in France |
34.4 | 34.4 | 34.4 | |||||||||
Difference between the standard French tax rate and the rates applicable to Sanofi (c) |
(22.0 | ) | (18.2 | ) | (19.2 | ) | ||||||
Tax rate differential on intragroup margin in inventory (d) |
2.5 | (0.5 | ) | | ||||||||
Tax effects of the share of profits reverting to BMS |
(0.7 | ) | (0.5 | ) | (0.5 | ) | ||||||
Contribution on distributed income (3%) (e) |
| 3.8 | (8.2 | ) | ||||||||
CVAE tax in France (f) |
1.8 | 1.4 | 1.3 | |||||||||
Revisions to tax exposures and settlements of tax disputes |
1.2 | 3.2 | 2.2 | |||||||||
Fair value remeasurement of contingent consideration liabilities |
0.9 | 0.2 | 1.1 | |||||||||
Impact of US tax reform (g) |
(5.0 | ) | | 21.6 | ||||||||
Other items (h) |
1.3 | (3.1 | ) | (1.6 | ) | |||||||
Effective tax rate |
14.4 | 20.7 | 31.1 |
(a) | For 2017, the results of the Animal Health business are presented separately in accordance with IFRS 5 (Non-Current Assets Held for Sale and Discontinued Operations); see Note B.21. |
(b) | Rate calculated on the basis of the estimated effective tax rate for the full financial year (see Note A.2.). |
(c) | The difference between the French tax rate and tax rates applicable to foreign subsidiaries reflects the fact that Sanofi has operations in many countries, most of which have lower tax rates than France. |
(d) | When internal margin included in inventory is eliminated, a deferred tax asset is recognized on the basis of the tax rate applicable to the subsidiary that holds the inventory, which may differ from the tax rate of the subsidiary that generated the eliminated intragroup margin. |
(e) | For 2017, this line includes the consequences of the French Constitutional Council ruling of October 6, 2017 on the additional 3% contribution on dividends paid out in cash. |
(f) | Net impact on the effective tax rate (current taxes, impact of the tax deduction, and deferred taxes). |
(g) | For 2018, this line comprises an adjustment of 102 million to the estimated tax charge on deemed repatriation attributable to the accumulated earnings of non-US operations. |
For 2017, this line includes an expense of 1,193 million for the consequences of US tax reform, comprising the estimated tax charge on deemed repatriation attributable to the accumulated earnings of non-US operations payable over 8 years (1,084 million) and a further expense of 109 million representing (i) the remeasurement of deferred taxes following the reduction in the corporate income tax rate and (ii) an adjustment to deferred taxes on the fair value of the reserves of Sanofi subsidiaries.
(h) | For 2018, Other items includes the net tax effect of taxable temporary differences associated with holdings in Sanofi subsidiaries. In determining the amount of the deferred tax liability for 2018 and 2017, Sanofi took into account changes in the ownership structure of certain subsidiaries. For 2017, the Other items line includes the impact of changes to tax rates in France, Belgium and the Netherlands. |
2018 HALF-YEAR FINANCIAL REPORT Sanofi | 44
B.20. SEGMENT INFORMATION
As indicated in Notes A.5. and B.26. to the consolidated financial statements for the year ended December 31, 2017, Sanofi has three operating segments: Pharmaceuticals, Consumer Healthcare and Human Vaccines (Vaccines).
The Pharmaceuticals segment comprises the commercial operations of the following global franchises: Specialty Care (Rare Diseases, Multiple Sclerosis, Oncology, Immunology), Diabetes & Cardiovascular, Established Prescription Products and Generics, together with research, development and production activities dedicated to our Pharmaceuticals segment. This segment also includes all associates whose activities are related to pharmaceuticals, in particular Regeneron.
The Consumer Healthcare segment comprises, for all geographical territories, the commercial operations for our Consumer Healthcare products, together with research, development and production activities dedicated to those products.
The Vaccines segment comprises, for all geographical territories (including from January 1, 2017 certain European territories previously included in the Sanofi Pasteur MSD joint venture), the commercial operations of Sanofi Pasteur, together with research, development and production activities dedicated to vaccines.
Inter-segment transactions are not material.
The costs of Sanofis global functions (Medical Affairs, External Affairs, Finance, Human Resources, Legal Affairs, Information Solutions & Technologies, Sanofi Business Services, etc.) are managed centrally at group-wide level. For the year ended December 31, 2017 and subsequent years, the costs of those functions are presented within the Other category. That category also includes other reconciling items such as retained commitments in respect of divested activities.
Consequently, the presentation of 2017 comparatives presented below, and the associated performance analysis, have been adjusted to reflect the new segmental reporting model.
B.20.1. SEGMENT RESULTS
Sanofi reports segment results on the basis of Business operating income. This indicator is used internally by Sanofis chief operating decision maker to measure the performance of each operating segment and to allocate resources.
Business operating income is derived from Operating income, adjusted as follows:
| the amounts reported in the line items Restructuring costs and similar items, Fair value remeasurement of contingent consideration and Other gains and losses, and litigation are eliminated; |
| amortization and impairment losses charged against intangible assets (other than software and other rights of an industrial or operational nature) are eliminated; |
| the share of profits/losses of investments accounted for using the equity method is added; |
| net income attributable to non-controlling interests is deducted; |
| other acquisition-related effects (primarily the workdown of acquired inventories remeasured at fair value at the acquisition date, and the impact of acquisitions on investments accounted for using the equity method) are eliminated; |
| restructuring costs relating to investments accounted for using the equity method are eliminated. |
45 | Sanofi 2018 HALF-YEAR FINANCIAL REPORT
Segment results are shown in the table below:
June 30, 2018 (6 months) | ||||||||||||||||||||
( million) | Pharmaceuticals | Consumer Healthcare |
Vaccines | Other | Total | |||||||||||||||
Net sales |
12,199 | 2,353 | 1,522 | | 16,074 | |||||||||||||||
Other revenues |
134 | | 399 | | 533 | |||||||||||||||
Cost of sales |
(3,230 | ) | (763 | ) | (1,068 | ) | (105 | ) | (5,166 | ) | ||||||||||
Research and development expenses |
(2,113 | ) | (58 | ) | (268 | ) | (316 | ) | (2,755 | ) | ||||||||||
Selling and general expenses |
(2,648 | ) | (788 | ) | (326 | ) | (1,047 | ) | (4,809 | ) | ||||||||||
Other operating income and expenses |
132 | 82 | | (56 | ) | 158 | ||||||||||||||
Share of profit/(loss) of investments accounted for using the equity method |
150 | | (1 | ) | | 149 | ||||||||||||||
Net income attributable to non-controlling interests |
(52 | ) | (6 | ) | | | (58 | ) | ||||||||||||
Business operating income |
4,572 | 820 | 258 | (1,524 | ) | 4,126 | ||||||||||||||
June 30, 2017 (6 months) (a) | ||||||||||||||||||||
( million) | Pharmaceuticals | Consumer Healthcare |
Vaccines | Other | Total | |||||||||||||||
Net sales |
13,038 | 2,486 | 1,800 | | 17,324 | |||||||||||||||
Other revenues |
148 | | 370 | 1 | 519 | |||||||||||||||
Cost of sales |
(3,419 | ) | (818 | ) | (1,123 | ) | (135 | ) | (5,495 | ) | ||||||||||
Research and development expenses |
(1,999 | ) | (52 | ) | (260 | ) | (356 | ) | (2,667 | ) | ||||||||||
Selling and general expenses |
(2,807 | ) | (880 | ) | (363 | ) | (1,004 | ) | (5,054 | ) | ||||||||||
Other operating income and expenses |
41 | 57 | 1 | 3 | 102 | |||||||||||||||
Share of profit/(loss) of investments accounted for using the equity method |
71 | | (1 | ) | | 70 | ||||||||||||||
Net income attributable to non-controlling interests |
(54 | ) | (11 | ) | | | (65 | ) | ||||||||||||
Business operating income |
5,019 | 782 | 424 | (1,491 | ) | 4,734 |
(a) | Includes the effects of first-time application of IFRS 15 on revenue recognition (see Note A.1.2.), and of the presentation of segment data using Sanofis new segmental reporting model. |
December 31, 2017 (12 months) (a) | ||||||||||||||||||||
( million) | Pharmaceuticals | Consumer Healthcare |
Vaccines | Other | Total | |||||||||||||||
Net sales |
25,173 | 4,798 | 5,101 | | 35,072 | |||||||||||||||
Other revenues |
287 | | 862 | | 1,149 | |||||||||||||||
Cost of sales |
(6,766 | ) | (1,612 | ) | (2,798 | ) | (271 | ) | (11,447 | ) | ||||||||||
Research and development expenses |
(4,056 | ) | (123 | ) | (557 | ) | (736 | ) | (5,472 | ) | ||||||||||
Selling and general expenses |
(5,649 | ) | (1,645 | ) | (728 | ) | (2,050 | ) | (10,072 | ) | ||||||||||
Other operating income and expenses |
34 | 94 | (107 | ) | (17 | ) | 4 | |||||||||||||
Share of profit/(loss) of investments accounted for using the equity method |
212 | 1 | 1 | | 214 | |||||||||||||||
Net income attributable to non-controlling interests |
(110 | ) | (15 | ) | | | (125 | ) | ||||||||||||
Business operating income |
9,125 | 1,498 | 1,774 | (3,074 | ) | 9,323 |
(a) | Includes the effects of first-time application of IFRS 15 on revenue recognition (see Note A.1.2.), and of the presentation of segment data using Sanofis new segmental reporting model. |
2018 HALF-YEAR FINANCIAL REPORT Sanofi | 46
The table below, presented in compliance with IFRS 8, shows a reconciliation between Business operating income and Income before tax and investments accounted for using the equity method:
June 30, 2018 |
June 30, 2017 (a) |
December 31, 2017 |
||||||||||
( million) | (6 months) | (6 months) | (12 months) (a) | |||||||||
Business operating income (b) |
4,126 | 4,734 | 9,323 | |||||||||
Share of profit/(loss) of investments accounted for using the equity method (a)/(c) |
(149 | ) | (70 | ) | (214 | ) | ||||||
Net income attributable to non-controlling interests (d) |
58 | 65 | 125 | |||||||||
Amortization and impairment of intangible assets |
(1,100 | ) | (1,002 | ) | (2,159 | ) | ||||||
Fair value remeasurement of contingent consideration |
10 | (100 | ) | (159 | ) | |||||||
Expenses arising from the impact of acquisitions on inventories |
(99 | ) | (176 | ) | (166 | ) | ||||||
Restructuring costs and similar items |
(607 | ) | (364 | ) | (731 | ) | ||||||
Other expenses related to business combinations |
(10 | ) | | | ||||||||
Other gains and losses, and litigation (e) |
(67 | ) | (7 | ) | (215 | ) | ||||||
Operating income |
2,162 | 3,080 | 5,804 | |||||||||
Financial expenses |
(202 | ) | (218 | ) | (420 | ) | ||||||
Financial income |
97 | 95 | 147 | |||||||||
Income before tax and investments accounted for using the equity method |
2,057 | 2,957 | 5,531 |
(a) | Includes the effects of first-time application of IFRS 15 on revenue recognition (see Note A.1.2.). |
(b) | For 2017, the gain on the divestment of the Animal Health business is presented separately in accordance with IFRS 5 (Non-Current Assets Held for Sale and Discontinued Operations). |
(c) | Excludes restructuring costs relating to investments accounted for using the equity method and expenses arising from the impact of acquisitions on investments accounted for using the equity method. |
(d) | Excludes (i) restructuring costs and (ii) other adjustments attributable to non-controlling interests |
(e) | For 2017, this line includes an adjustment to provisions for vendors liability guarantees relating to past divestments. |
B.20.2. OTHER SEGMENT INFORMATION
The tables below show the split by operating segment of (i) the carrying amount of investments accounted for using the equity method, (ii) acquisitions of property, plant and equipment, and (iii) acquisitions of intangible assets.
The principal investments accounted for using the equity method are: for the Pharmaceuticals segment, Regeneron Pharmaceuticals, Inc. (see Note D.2.2. to the consolidated financial statements for the year ended December 31, 2017), the entities majority-owned by BMS (see Note C.2. to the consolidated financial statements for the year ended December 31, 2017), and Infraserv GmbH & Co. Höchst KG; and for the Vaccines segment, Sanofi Pasteur MSD until March 8, 2016 (see Notes B.1. and D.2.3. to the consolidated financial statements for the year ended December 31, 2017).
Acquisitions of intangible assets and property, plant and equipment correspond to acquisitions paid for during the period.
June 30, 2018 | ||||||||||||||||||||
( million) | Pharmaceuticals | Consumer Healthcare |
Vaccines | Other | Total | |||||||||||||||
Investments accounted for using the equity method |
2,918 | 20 | 26 | | 2,964 | |||||||||||||||
Acquisitions of property, plant and equipment |
426 | 2 | 153 | 60 | 641 | |||||||||||||||
Acquisitions of other intangible assets |
76 | 6 | 38 | 62 | 182 |
June 30, 2017 | ||||||||||||||||
( million) | Pharmaceuticals (a) | Consumer Healthcare |
Vaccines | Total | ||||||||||||
Investments accounted for using the equity method (a) |
2,803 | 19 | 10 | 2,832 | ||||||||||||
Acquisitions of property, plant and equipment |
460 | 5 | 173 | 638 | ||||||||||||
Acquisitions of other intangible assets |
179 | 9 | 172 | 360 |
(a) | Includes the effects of first-time application of IFRS 15 on revenue recognition (see Note A.1.2.), and of the presentation of segment data using Sanofis new segmental reporting model. |
47 | Sanofi 2018 HALF-YEAR FINANCIAL REPORT
December 31, 2017 | ||||||||||||||||
( million) | Pharmaceuticals (a) | Consumer Healthcare |
Vaccines | Total | ||||||||||||
Investments accounted for using the equity method (a) |
2,815 | 19 | 13 | 2,847 | ||||||||||||
Acquisitions of property, plant and equipment |
1,033 | 9 | 346 | 1,388 | ||||||||||||
Acquisitions of other intangible assets |
367 | 9 | 192 | 568 |
(a) | Includes the effects of first-time application of IFRS 15 on revenue recognition (see Note A.1.2.), and of the presentation of segment data using Sanofis new segmental reporting model. |
B.20.3. INFORMATION BY GEOGRAPHICAL REGION
The geographical information on net sales provided below is based on the geographical location of the customer.
In accordance with IFRS 8, the non-current assets reported below exclude financial instruments, deferred tax assets, and pre-funded pension obligations.
June 30, 2018 | ||||||||||||||||||||||||
( million) | Total | Europe | of which France |
North America |
of which United States |
Other countries |
||||||||||||||||||
Net sales |
16,074 | 5,784 | 1,599 | 4,985 | 4,690 | 5,305 | ||||||||||||||||||
Non-current assets: |
||||||||||||||||||||||||
property, plant and equipment |
9,470 | 5,779 | 3,133 | 2,657 | 2,224 | 1,034 | ||||||||||||||||||
goodwill |
44,828 | | | | ||||||||||||||||||||
other intangible assets |
22,436 | 8,147 | 11,529 | 2,760 | ||||||||||||||||||||
June 30, 2017 | ||||||||||||||||||||||||
( million) | Total | Europe | of which France |
North America |
of which United States |
Other countries |
||||||||||||||||||
Net sales (a) |
17,324 | 4,761 | 1,166 | 5,861 | 5,562 | 6,702 | ||||||||||||||||||
Non-current assets: |
||||||||||||||||||||||||
property, plant and equipment |
9,633 | 5,895 | 3,243 | 2,599 | 2,204 | 1,139 | ||||||||||||||||||
goodwill |
40,964 | | | | ||||||||||||||||||||
other intangible assets |
13,849 | 3,522 | 4,853 | 5,474 |
(a) | Includes the effects of first-time application of IFRS 15 on revenue recognition (see Note A.1.2.). |
December 31, 2017 | ||||||||||||||||||||||||
( million) | Total | Europe | of which France |
North America |
of which United States |
Other countries |
||||||||||||||||||
Net sales (a) |
35,072 | 9,525 | 2,330 | 12,460 | 11,855 | 13,087 | ||||||||||||||||||
Non-current assets: |
||||||||||||||||||||||||
property, plant and equipment |
9,579 | 5,969 | 3,180 | 2,560 | 2,142 | 1,050 | ||||||||||||||||||
goodwill |
40,264 | | | | ||||||||||||||||||||
other intangible assets |
13,080 | 6,171 | 5,210 | 1,699 |
(a) | Includes the effects of first-time application of IFRS 15 on revenue recognition (see Note A.1.2.). |
As stated in Notes B.6.1. and D.5. to the consolidated financial statements for the year ended December 31, 2017, goodwill is not allocated by geographical region.
B.20.4. NET SALES AND CREDIT RISK
Sanofis three largest customers respectively accounted for approximately 10%, 6% and 4% of consolidated net sales in the first half of 2018, mostly in the Pharmaceuticals segment (versus approximately 10%, 6% and 5% in the first half of 2017).
Net sales
The disclosures on disaggregation of revenue required under IFRS 15 are provided in section C.3. Net sales of the Half-Year Management Report.
2018 HALF-YEAR FINANCIAL REPORT Sanofi | 48
B.21. ASSETS HELD FOR SALE OR EXCHANGE AND LIABILITIES RELATED TO ASSETS HELD FOR SALE OR EXCHANGE
Assets held for sale or exchange, and liabilities related to assets held for sale or exchange, comprise:
( million) | June 30, 2018 |
December 31, 2017 |
||||||
European Generics business |
1,462 | | ||||||
Other |
71 | 34 | ||||||
Assets held for sale or exchange |
1,533 | 34 | ||||||
European Generics business |
262 | | ||||||
Other |
9 | | ||||||
Liabilities related to assets held for sale or exchange |
271 | |
European Generics business
In accordance with IFRS 5 (see Note B.1.), all assets of the European Generics business included in the sale, and all liabilities directly related to those assets, are presented in the line items Assets held for sale or exchange and Liabilities related to assets held for sale or exchange, respectively, in the consolidated balance sheet as of June 30, 2018. An analysis of those line items is set forth below:
( million) | June 30, 2018 |
|||
Assets |
||||
Property, plant and equipment |
111 | |||
Goodwill |
913 | |||
Other intangible assets |
89 | |||
Other non-current assets |
1 | |||
Deferred tax assets |
21 | |||
Inventories |
132 | |||
Accounts receivable |
153 | |||
Other current assets |
36 | |||
Cash and cash equivalents |
6 | |||
Total assets held for sale or exchange |
1,462 | |||
Liabilities |
||||
Non-current provisions |
30 | |||
Deferred tax liabilities |
14 | |||
Short term debt |
1 | |||
Accounts payable |
57 | |||
Other current liabilities |
160 | |||
Total liabilities related to assets held for sale or exchange |
262 |
As of June 30, 2018, long term debt owed by European Generics entities to other consolidated entities amounted to 246 million. Accounts receivable and accounts payable respectively amounted to 443 million and 163 million. In accordance with the accounting policies described in Note B.7. to the consolidated financial statements for the year ended December 31, 2017, intercompany asset and liability accounts between European Generics entities and other consolidated entities are eliminated. As a consequence the balances related to those payables and receivables are not included in the table presented above.
49 | Sanofi 2018 HALF-YEAR FINANCIAL REPORT
C/ EVENTS SUBSEQUENT TO JUNE 30, 2018
On July 27, 2018, 2,401,184 shares (representing approximately 0.19% of the share capital) were issued in connection with the Action 2018 Sanofi worldwide employee share ownership plan, intended to give employees a greater stake in the future development and results of Sanofi.
2018 HALF-YEAR FINANCIAL REPORT Sanofi | 50
EXHIBIT 99.2
2018
HALF-YEAR MANAGEMENT REPORT
CONTENTS
2 HALF-YEAR MANAGEMENT REPORT |
51 | |||
A/ Significant events of the first half of 2018 |
51 | |||
B/ Events subsequent to June 30, 2018 |
55 | |||
C/ Consolidated financial statements for the first half of 2018 |
56 | |||
D/ Risk factors and related party transactions |
82 | |||
E/ Outlook |
82 | |||
F/ Appendix Research and Development Pipeline |
84 |
2 HALF-YEAR MANAGEMENT REPORT
A/ SIGNIFICANT EVENTS OF THE FIRST HALF OF 2018
A.1. PHARMACEUTICALS
A.1.1. ACQUISITIONS AND ALLIANCES
On January 22, 2018, Sanofi and Bioverativ Inc., a biotechnology company focused on therapies for hemophilia and other rare blood disorders, entered into a definitive agreement under which Sanofi offered to acquire all of the outstanding shares of Bioverativ for $105 per share in cash, representing an equity value of approximately $11.6 billion (on a fully diluted basis). The transaction was unanimously approved by both the Sanofi and Bioverativ Boards of Directors. The acquisition is expected to be immediately accretive to Sanofis business earnings per share in 2018, and up to 5% accretive in 2019. The minimum tender condition and all of the other conditions having been satisfied, on March 8, 2018 Sanofi and its wholly-owned subsidiaries Sanofi-Aventis NA Holding, Inc. and Blink Acquisition Corp. accepted all the shares validly tendered into the offer. Bioverativ remains in existence as an indirect, wholly-owned subsidiary of Sanofi.
In January 2018, Sanofi and Ablynx, a biopharmaceutical company engaged in the discovery and development of Nanobodies®, entered into a definitive agreement under which Sanofi offered to acquire all of the outstanding ordinary shares, including shares represented by American Depositary Shares (ADSs), warrants and convertible bonds of Ablynx, at a price per Ablynx share of 45 in cash, valuing Ablynx at approximately 3.9 billion (on a fully diluted basis). The transaction was unanimously approved by both the Sanofi and Ablynx Boards of Directors. On May 14, 2018, Sanofi and Ablynx announced that at the end of the initial acceptance period of the tender offer, Sanofi held 95.60% of the outstanding shares of Ablynx, of which more than 90% had been acquired through the offers. On June 19, 2018, after the end of the squeeze-out tender period, Sanofi announced that it held all the outstanding shares of Ablynx.
In January 2018, Sanofi and Regeneron announced that they were accelerating and expanding investment in the clinical development of (i) the PD-1 (programmed cell death protein 1) antibody cemiplimab in oncology, (ii) dupilumab in Type 2 allergic diseases and (iii) the anti-IL33 monoclonal antibody (REGN 3500/SAR 440340). Both of these breakthrough therapies have the potential to benefit a number of different patient populations, and these strategic investments will enable the companies to evaluate cemiplimab and dupilumab in broad clinical development programs.
Also in January 2018, Sanofi and Alnylam announced a strategic restructuring of their RNAi therapeutics alliance to streamline and optimize development and commercialization of certain products for the treatment of rare genetic diseases. Specifically:
| Sanofi obtains global development and commercialization rights to fitusiran, an investigational RNAi therapeutic currently in development for the treatment of people with hemophilia A and B. Global commercialization of fitusiran, upon approval, will be done by Sanofi Genzyme, Sanofis Specialty Care Global Business Unit. Alnylam will receive royalties based on net sales of fitusiran products. |
| Alnylam obtains global development and commercialization rights to its investigational RNAi therapeutics programs for the treatment of ATTR amyloidosis, including patisiran and ALN-TTRsc02. Sanofi will receive royalties based on net sales of those products. |
| With respect to other products falling under the RNAi therapeutics alliance, the material terms agreed between Alnylam and Sanofi Genzyme in 2014 remain unchanged. |
On March 8, 2018, Evotec AG and Sanofi entered into exclusive negotiations to accelerate infectious disease research and development by creating a new open innovation platform near Lyon, France, to be managed by Evotec. In support of this platform, Sanofi will license most of its infectious disease research and early-stage development portfolio and transfer its infectious disease research unit to Evotec. The transaction excludes the vaccine R&D unit and related projects. This joint initiative will bring together more than 150 scientists within Evotec, all of them experts in this field. Sanofi is to pay Evotec an initial, one-time, upfront cash payment of 60 million on the closing date of the deal, and will provide significant further long-term funding. Sanofi retains certain option rights on the development, manufacturing and commercialization of anti-infective products. Under the agreement, Evotec will integrate Sanofis infectious disease research unit, which includes more than 100 employees, into its global drug discovery and development operations. The transfer is backed by specific undertakings from Evotec to safeguard jobs for a five-year period and to maintain its activities in the Lyon region, to take advantage of the local scientific and medical ecosystem. Evotec will expand its existing long-term initiatives focused on innovation to fight infectious diseases; those initiatives include maintaining a portfolio of projects aimed at diseases affecting the developing world. The focus of drug discovery will be on new mode-of-action antimicrobials.
2018 HALF-YEAR FINANCIAL REPORT Sanofi | 51
In April 2018, Advent International (Advent) and Sanofi entered into exclusive negotiations under which Advent would acquire Zentiva, Sanofis European generics business for 1.9 billion1. Advents offer is firm, binding and fully financed. Advent is a global private equity firm, with over 25 years experience of investing in the healthcare sector. It has extensive experience of executing corporate carve-outs and will work collaboratively with Sanofi to form a new independent operation. Advent will support the Zentiva management team to invest in the companys operations, production facilities and R&D pipeline. On June 28, 2018, Sanofi and Advent announced that they had finalized negotiations for the acquisition. The signing of this agreement marked a critical step towards the closing of the deal and the transfer of the Zentiva business to Advent, which is expected to take place in the fourth quarter of 2018. The transaction is still subject to clearance from the relevant regulatory authorities, and is being conducted in strict compliance with obligations to consult employee representative bodies within Sanofi. As of June 30, 2018, completion of the transaction being regarded as highly probable, and the initial tender offer acceptance period having expired, all assets of the European Generics business included in the sale, and all liabilities directly related to those assets, are presented in the line items Assets held for sale or exchange and Liabilities related to assets held for sale or exchange, respectively, in the consolidated balance sheet. The operations of the held-for-sale European Generics business will continue to be presented within the relevant line items in the income statement until the effective date of sale, given that the business is not an operating segment of Sanofi and does not qualify as a discontinued operation under IFRS 5 (Non-Current Assets Held for Sale and Discontinued Operations).
A.1.2. FILINGS FOR MARKETING AUTHORIZATION FOR NEW PRODUCTS
In January 2018, Sanofi and Regeneron announced that the Ministry of Health, Labor and Welfare in Japan had granted manufacturing and marketing authorization for Dupixent® in moderate-to-severe atopic dermatitis in adults inadequately controlled by existing treatments.
In March 2018, the European Medicines Agency (EMA) accepted for review Sanofis marketing authorization application for sotagliflozin (developed in partnership with Lexicon Pharmaceuticals, Inc.) in the treatment of adults with type 1 diabetes. A license application for sotagliflozin in the treatment of type 1 diabetes has also been filed in the United States, and was accepted for review by the US Food and Drug Administration (FDA) in early June 2018. A decision from the FDA is expected in March 2019.
In April 2018, the EMA accepted for review Sanofis marketing authorization application for Dupixent® as an add-on maintenance treatment for inadequately controlled moderate-to-severe asthma in certain adults and adolescents. The FDA has also accepted for review a supplemental Biologics License Application for Dupixent® in the same indication. In accordance with the Prescription Drug User Fee Act, the FDA is expected to announce its decision on October 20, 2018.
In April 2018, the EMA accepted for review Sanofis marketing authorization application for cemiplimab in the treatment of metastatic cutaneous squamous cell carcinoma (CSCC) or patients with locally advanced CSCC who are not candidates for surgery. Also in April 2018, the FDA accepted for priority review a Biologics License Application for cemiplimab in the same indication; a decision is expected in October 2018. Advanced CSCC is the deadliest non-melanoma skin cancer. Cemiplimab is an investigational human monoclonal antibody targeting the PD-1 (programmed cell death 1) immune checkpoint inhibitor. It was granted Breakthrough Therapy designation status by the FDA in September 2017. Cemiplimab is being jointly developed by Sanofi and Regeneron under a global collaboration agreement. Cemiplimab is also undergoing clinical trials in the treatment of non small cell lung cancer, basal cell carcinoma and cervical cancer, and investigational studies are ongoing in the treatment of head and neck squamous cell carcinoma, melanoma, colorectal cancer, prostate cancer, and Hodgkins and non-Hodgkins lymphoma.
In June 2018, the EMAs Committee for Medicinal Products for Human Use (CHMP) recommended approval of CabliviTM (caplacizumab) in Europe for the treatment of adults experiencing an episode of acquired thrombotic thrombocytopenic purpura (aTTP), a rare blood-clotting disorder. The European Commission will review the CHMP recommendation, and a final decision on the marketing authorization application for CabliviTM in the European Union is expected in the coming months. Directed against von Willebrand Factor (vWF), CabliviTM is Ablynxs first Nanobody®-based medicine to receive a positive CHMP opinion and, if approved, will be the first therapeutic specifically indicated for the treatment of aTTP.
1 | Enterprise value of 1,919 million. |
52 | Sanofi 2018 HALF-YEAR FINANCIAL REPORT
In March 2018, the results of the ODYSSEY OUTCOMES trial were presented to the American College of Cardiology. The trial met its primary endpoint, showing that Praluent® (alirocumab, developed in collaboration with Regeneron) significantly reduced the risk of major adverse cardiovascular events in patients who had suffered a recent acute coronary syndrome event. In June 2018, the results of this trial were submitted to the EMA and the FDA. To help ensure more affordable and timely access to Praluent® for patients most in need, Sanofi and Regeneron will offer a further reduced net price to US payers that agree to reduce access barriers for high-risk patients. That net price will be in alignment with a new cost-effectiveness analysis for high-risk patients from the US Institute for Clinical and Economic Review (ICER). In keeping with ICERs established in confidence procedures, Sanofi and Regeneron provided early access to data from the ODYSSEY OUTCOMES trial to ICER an independent organization that evaluates the value of prescription drugs and other healthcare innovations to enable a revised assessment of the value of alirocumab incorporating the results from the trial. A Phase III study evaluating Praluent® in children with heterozygous familial hypercholesterolemia (HeFH) has also been initiated.
A.1.3. RESEARCH AND DEVELOPMENT
For an update on our research and development (R&D) pipeline, refer to the appendix in Section F of this half-year management report.
The principal R&D announcements during the first half of 2018 were as follows:
Phase III:
| On May 21, 2018, the New England Journal of Medicine (NEJM) published detailed results from two Phase III clinical trials for the investigational use of Dupixent® (dupilumab) in the treatment of moderate-to-severe asthma. The results showed that Dupixent® significantly reduced the risk of severe asthma attacks (exacerbations), improved lung function and reduced dependence on oral corticosteroids. The trials, known as QUEST and VENTURE, are part of the pivotal clinical trial program that evaluated Dupixent® in uncontrolled asthma patients. The data were simultaneously presented at the American Thoracic Society 2018 International Conference. |
| In May 2018, a pivotal Phase III trial evaluating Dupixent® (dupilumab) in the treatment of moderate-to-severe atopic dermatitis in adolescents aged 12 to 17 years met its primary endpoint, and a number of key secondary endpoints. In the trial, treatment with Dupixent® as monotherapy significantly improved measures of overall disease severity and also improved skin clearing, itching, and certain health-related quality of life measures. Dupixent® is the first and only biologic to show positive results in this patient population. |
| The ATLAS Phase III program evaluating fitusiran resumed in the first quarter of 2018. The ATLAS-INH study is evaluating fitusiran in adult and adolescent hemophilia A or B patients with inhibitors. |
| Mavacamten (SAR439152/MYK461, developed in collaboration with MyoKardia), a myosin inhibitor, entered Phase III in the treatment of obstructive hypertrophic cardiomyopathy (HCM). A Phase II trial in non-HCM patients has also begun. |
| A Phase III trial has begun to evaluate Cerdelga® in children with Gaucher disease type 1 as a substitute for enzyme replacement therapy (ERT). |
| Sotagliflozine (developed in collaboration with Lexicon) has moved into Phase III in diabetic patients with worsening heart failure. |
| A Phase II/III study evaluating venglustat, an orally administered GCS inhibitor, is under preparation in patients at risk of autosomal dominant polycystic kidney disease. |
| AMPLITUDE, a Phase III cardiovascular morbidity/mortality study on efpeglenatide, has been initiated. |
| In June 2018, positive non-inferiority results from the BRIGHT study, comparing Toujeo® to insulin degludec were presented to the American Diabetes Association (ADA). |
Phase II:
| ALX0171, an anti RSV Nanobody®, entered the pipeline in Phase II following our acquisition of Ablynx. |
| Phase I/II data for BIVV001, a long-acting Factor VIII, demonstrating a half-life of 37 hours, were presented to the World Federation of Hemophilia (WFH). |
| Development was halted on two programs: SAR566658 (a maytansine-loaded anti-CA6 monoclonal antibody) in triple negative breast cancer, and a recombinant tuberculosis vaccine. |
| ST400, a genome editing technology derived from a collaboration between Sangamo and Ablynx, entered Phase II in beta thalassemia. |
| SAR440340, an anti-IL33 monoclonal antibody (partnership with Regeneron), is in the process of being initiated in a Phase II study in chronic obstructive pulmonary disease (COPD). |
| A Phase II study evaluating dupilumab in grass immunotherapy has been initiated. |
2018 HALF-YEAR FINANCIAL REPORT Sanofi | 53
A.2. CONSUMER HEALTHCARE
At the end of June 2008, we sold a portfolio of 12 Sanofi Consumer Healthcare brands to Cooper-Vemedia, the European over-the-counter drug manufacturing and distribution subsidiary of Charterhouse Capital Partners, for 158 million. The sale sharpens the focus of Sanofi Consumer Healthcare on its four strategic fields: Pain; Allergy, Cough & Cold; Digestive; and Nutritionals.
A.3. HUMAN VACCINES (VACCINES) SEGMENT
In April 2018, Sanofi announced an investment of 350 million (CAD 500 million) in the construction of a new state-of-the-art vaccine manufacturing facility at the Sanofi Pasteur Canadian headquarters in Toronto, Ontario. The new facility will allow Sanofi Pasteur, Sanofis vaccines global business unit, to meet the growing demand for five-component acellular pertussis (5-acP) antigen. Upon completion in 2021, the new building will also be equipped to produce the antigens used in the manufacture of diphtheria and tetanus vaccines.
A.4. OTHER SIGNIFICANT EVENTS OF THE FIRST HALF OF 2018
A.4.1. CORPORATE GOVERNANCE
On January 19, 2018, Sanofi announced the appointment of Dominique Carouge as Executive Vice President Head of Business Transformation, effective February 15, 2018. In his new role, Mr Carouge is tasked with accelerating the transformation of Sanofi, and joins the Executive Committee. Previously, he served as Deputy CFO and Head of Finance Operations and Group Controlling from January 1, 2016.
Dr Elias Zerhouni, Head of Global Research and Development, retired from Sanofi on June 30, 2018, after more than nine years of distinguished service with the company. Dr John C. Reed, M.D., Ph.D., succeeded him effective July 1, 2018.
The Annual General Meeting of Sanofi shareholders was held in Paris on May 2, 2018. All of the resolutions submitted to the vote were adopted by the shareholders. The meeting approved a cash dividend of 3.03 per share, payable on May 15, 2018. It also approved the reappointment of Olivier Brandicourt, Patrick Kron and Christian Mulliez as directors, and appointed Emmanuel Babeau as an independent director, to serve for a four-year term expiring at the Annual General Meeting called to approve the 2021 financial statements. Robert Castaigne, who had been a Board member since 2000 and chaired the Audit Committee, did not seek re-election. Fabienne Lecorvaisier succeeded him as chair of the Audit Committee, which now comprises Fabienne Lecorvaisier, Emmanuel Babeau, Christian Mulliez and Diane Souza. The Board of Directors also announced the formation of a new Scientific Committee, chaired by Thomas Südhof. Following the meeting, the new Board of Directors still has 16 members, including six women and two employee representative directors. A substantial majority of the directors are independent.
In June 2018, Sanofi appointed Jean-Baptiste Chasseloup de Chatillon as Executive Vice President, Chief Financial Officer, and as a member of the Executive Committee. His appointment takes effect on October 1, 2018. He will join Sanofi on September 1 in order to ensure a smooth handover from Jérôme Contamine, who will retire on September 30 after more than nine years of distinguished service with the company.
A.4.2. LEGAL AND ARBITRATION PROCEEDINGS
For a description of the most significant developments in legal and arbitration proceedings since publication of the financial statements for the year ended December 31, 2017, refer to Note B.14. to the condensed half-year consolidated financial statements.
The following events have occurred in respect of litigation, arbitration and other legal proceedings in which Sanofi and its affiliates are involved:
PATENTS
| Co-Aprovel® Patent Infringement Actions (Europe) |
In Europe, pending damages claims in front of courts have been settled.
54 | Sanofi 2018 HALF-YEAR FINANCIAL REPORT
| Lantus® Merck Patent Litigation in the US |
In the patent infringement suit related to Lantus® filed by Sanofi against Merck Sharp and Dohme (Merck) in the United States District Court for the District of Delaware following Mercks NDA filed for an insulin glargine drug pen product, a bench trial took place in the second quarter of 2018. A trial ruling is currently expected.
GOVERNMENT INVESTIGATIONS AND RELATED LITIGATION
In March 2018, Sanofi filed a motion to dismiss plaintiffs second amended complaint in the putative class actions filed against Sanofi US and Sanofi GmbH in Federal Court in Massachusetts on behalf of direct-purchasers of Lantus® alleging certain antitrust violations.
In May 2018, Sanofi US filed a joint motion to dismiss the consolidated amended complaint filed on behalf of a putative class of diabetes patients alleging violations of the Racketeer Influenced and Corrupt Organizations Act and various state unfair/deceptive trade practices statutes in connection with the pricing of Lantus®.
A.4.3. OTHER EVENTS
On March 15, 2018, Sanofi announced that it had successfully placed an 8 billion bond issue in six tranches under the Euro Medium Term Note program. This issue reduces the average cost and extends the average maturity of Sanofis debt.
In June 2018, Sanofi successfully placed a $2 billion bond issue in two tranches under the public bond issue program (shelf registration statement) registered with the US Securities and Exchange Commission (SEC) on March 15, 2016.
Sanofi intends to use the net proceeds of those bond issues for general corporate purposes, including the financing of the Bioverativ and Ablynx acquisitions.
B/ EVENTS SUBSEQUENT TO JUNE 30, 2018
| On July 26, 2018, Sanofi announced that Roberto Pucci, Head of Human Resources, will retire from Sanofi after more than 9 years of service with the company. He will be succeeded in the post by Caroline Luscombe who will join Sanofi on October 1, 2018. |
| On July 27, 2018, 2,401,184 shares (representing approximately 0.19% of our share capital) were issued in connection with the Action 2018 Sanofi worldwide employee share ownership plan, intended to give our employees a greater stake in the future development and results of Sanofi. From June 11 through June 29, 2018, 27,680 employees signed up for the plan, subscribing for Sanofi shares at a price of 52.66 per share. For each tranche of five shares applied for, the applicant received one additional new share by way of employers contribution; and for each application for 20 or more shares, the applicant received an additional four new shares by way of employers contribution. |
2018 HALF-YEAR FINANCIAL REPORT Sanofi | 55
C/ CONSOLIDATED FINANCIAL STATEMENTS FOR THE FIRST HALF OF 2018
Unless otherwise indicated, all financial data in this report are presented in accordance with international financial reporting standards (IFRS), including international accounting standards and interpretations (see Note A.1. to the condensed half-year consolidated financial statements). Comparatives for 2017 have been restated in accordance with the new standard on revenue recognition, IFRS 15, which is applicable from January 1, 2018 onwards. The impacts of those restatements are described in detail in Note A.1.2. to the condensed half-year consolidated financial statements.
Consolidated income statements for the six months ended June 30, 2017 and June 30, 2018
( million) | June 30, 2018 (6 months) |
as % of net sales |
June 30, 2017 (6 months)(a) |
as % of net sales |
||||||||||||
Net sales |
16,074 | 100.0 | % | 17,324 | 100.0 | % | ||||||||||
Other revenues |
533 | 3.3 | % | 519 | 3.0 | % | ||||||||||
Cost of sales |
(5,265 | ) | (32.8 | %) | (5,671 | ) | (32.7 | %) | ||||||||
Gross profit |
11,342 | 70.6 | % | 12,172 | 70.3 | % | ||||||||||
Research and development expenses |
(2,755 | ) | (17.1 | %) | (2,667 | ) | (15.4 | %) | ||||||||
Selling and general expenses |
(4,819 | ) | (30.0 | %) | (5,054 | ) | (29.2 | %) | ||||||||
Other operating income |
323 | 173 | ||||||||||||||
Other operating expenses |
(165 | ) | (71 | ) | ||||||||||||
Amortization of intangible assets |
(999 | ) | (990 | ) | ||||||||||||
Impairment of intangible assets |
(101 | ) | (12 | ) | ||||||||||||
Fair value remeasurement of contingent consideration |
10 | (100 | ) | |||||||||||||
Restructuring costs and similar items |
(607 | ) | (364 | ) | ||||||||||||
Other gains and losses, and litigation |
(67 | ) | (7 | ) | ||||||||||||
Operating income |
2,162 | 13.5 | % | 3,080 | 17.8 | % | ||||||||||
Financial expenses |
(202 | ) | (218 | ) | ||||||||||||
Financial income |
97 | 95 | ||||||||||||||
Income before tax and investments accounted for using the equity method |
2,057 | 12.8 | % | 2,957 | 17.1 | % | ||||||||||
Income tax expense |
(297 | ) | (612 | ) | ||||||||||||
Share of profit/(loss) of investments accounted for using the equity method |
75 | 27 | ||||||||||||||
Net income excluding the exchanged/held-for-exchange Animal Health business |
1,835 | 11.4 | % | 2,372 | 13.7 | % | ||||||||||
Net income/(loss) of the exchanged/held-for-exchange Animal Health business(b) |
| 4,421 | ||||||||||||||
Net income |
1,835 | 6,793 | ||||||||||||||
Net income attributable to non-controlling interests |
57 | 64 | ||||||||||||||
Net income |
||||||||||||||||
Attributable to equity holders of Sanofi |
1,778 | 11.1 | % | 6,729 | 38.8 | % | ||||||||||
Average number of shares outstanding (million) |
1,247.8 | 1,260.3 | ||||||||||||||
Average number of shares after dilution (million) |
1,254.9 | 1,270.6 | ||||||||||||||
Basic earnings per share (in euros) |
1.42 | 5.34 | ||||||||||||||
Basic earnings per share excluding the exchanged/held-for-exchange Animal Health business (in euros) |
1.42 | 1.83 | ||||||||||||||
Diluted earnings per share (in euros) |
1.42 | 5.30 | ||||||||||||||
Diluted earnings per share excluding the exchanged/held-for-exchange Animal Health business (in euros) |
1.42 | 1.82 |
(a) | Includes the effects of first-time application of IFRS 15 on revenue recognition (see Note A.1.2. to the condensed half-year consolidated financial statements). |
(b) | For 2017, the gain on the divestment of the Animal Health business is presented separately in accordance with IFRS 5 (Non-Current Assets Held for Sale and Discontinued Operations); see Note D.36 to the consolidated financial statements for the year ended December 31, 2017. |
56 | Sanofi 2018 HALF-YEAR FINANCIAL REPORT
C.1. SEGMENT INFORMATION
C.1.1. OPERATING SEGMENTS
In accordance with IFRS 8 (Operating Segments), the segment information reported by Sanofi is prepared on the basis of internal management data provided to the Chief Executive Officer, who is the chief operating decision maker. The performance of those segments is monitored individually using internal reports and common indicators. The operating segment disclosures required under IFRS 8 are also provided in Note B.20. to the condensed half-year consolidated financial statements.
With effect from December 31, 2017 Sanofi has three operating segments: Pharmaceuticals, Consumer Healthcare and Human Vaccines (Vaccines).
The Pharmaceuticals segment comprises the commercial operations of the following global franchises: Specialty Care (Rare Diseases, Multiple Sclerosis, Oncology, Immunology), Diabetes & Cardiovascular, Established Prescription Products and Generics, together with research, development and production activities dedicated to our Pharmaceuticals segment. This segment also includes all associates whose activities are related to pharmaceuticals, in particular the share of profits from Regeneron.
The Consumer Healthcare segment comprises, for all geographical territories, the commercial operations for our Consumer Healthcare products, together with research, development and production activities dedicated to those products.
The Vaccines segment comprises, for all geographical territories (including from January 1, 2017 certain European territories previously included in the Sanofi Pasteur MSD joint venture), the commercial operations of Sanofi Pasteur, together with research, development and production activities dedicated to vaccines.
Inter-segment transactions are not material.
The costs of Sanofis global functions (Medical Affairs, External Affairs, Finance, Human Resources, Legal Affairs, Information Solutions & Technologies, Sanofi Business Services, etc.) are managed centrally at group-wide level. For the year ended December 31, 2017 and subsequent years, the costs of those functions are presented within the Other category. That category also includes other reconciling items such as retained commitments in respect of divested activities.
Consequently, the presentation of 2017 comparatives shown below, and the associated performance analysis, have been adjusted to reflect the new segmental reporting model.
C.1.2. BUSINESS OPERATING INCOME
Sanofi reports segment results on the basis of business operating income. This indicator is used internally by Sanofis chief operating decision maker to measure the performance of each operating segment and to allocate resources. For a definition of business operating income, and a reconciliation between that indicator and Income before tax and investments accounted for using the equity method, refer to Note B.20.1 to our condensed half-year consolidated financial statements.
C.2. BUSINESS NET INCOME
We believe that understanding of our operational performance by our management and our investors is enhanced by reporting business net income. This non-GAAP financial measure represents business operating income, less net financial expenses and the relevant income tax effects.
Business net income for the first half of 2018 was 3,156 million, 9.4% lower than in the first half of 2017 (3,482 million1). That represents 19.6% of net sales, compared with 20.1% in the first half of 2017.
We also report business earnings per share, a non-GAAP financial measure which we define as business net income divided by the weighted average number of shares outstanding.
Business earnings per share was 2.53 for the first half of 2018, 8.3% lower than the 2017 first-half figure of 2.76, based on an average number of shares outstanding of 1,247.8 million for the first half of 2018 and 1,260.3 million for the first half of 2017.
1 | Includes the effects of first-time application of IFRS 15 on revenue recognition (see Note A.1.2. to the condensed half-year consolidated financial statements). |
2018 HALF-YEAR FINANCIAL REPORT Sanofi | 57
The table below reconciles our business operating income to our business net income:
( million) | June 30, 2018 (6 months) |
June 30, 2017 (6 months)(a) |
December 31, 2017 (12 months)(a) |
|||||||||
Business operating income |
4,126 | 4,734 | 9,323 | |||||||||
Net financial expenses |
(105 | ) | (123 | ) | (273 | ) | ||||||
Income tax expense |
(865 | ) | (1,129 | ) | (2,107 | ) | ||||||
Business net income |
3,156 | 3,482 | 6,943 |
(a) | Includes the effects of first-time application of IFRS 15 on revenue recognition (see Note A.1.2. to the condensed half-year consolidated financial statements). |
We define business net income as Net income attributable to equity holders of Sanofi determined under IFRS, excluding the following items:
| amortization and impairment losses charged against intangible assets (other than software and other rights of an industrial or operational nature); |
| fair value remeasurements of contingent consideration relating to business combinations or divestments; |
| other impacts associated with acquisitions (including impacts of acquisitions on investments accounted for using the equity method); |
| restructuring costs and similar items1; |
| other gains and losses (including gains and losses on major disposals of non-current assets2); |
| other costs and provisions related to litigation2; |
| the tax effects of the items listed above; |
| the effects of major tax disputes; |
| the 3% tax levied on the distribution of dividends to equity holders of Sanofi in 2017; |
| the direct and indirect effects of the US tax reform enacted on December 22, 2017, and the consequences of the French Constitutional Council ruling of October 6, 2017 on the additional 3% levy on dividends paid out in cash; |
| those Animal Health items that are not included in business net income3; |
| the portion attributable to non-controlling interests of the items listed above. |
1 | Presented in the line item Restructuring costs and similar expenses in the consolidated income statement. |
2 | Presented in the line item Other gains and losses, and litigation in the consolidated income statement. |
3 | Comprises (i) impact of the discontinuation of depreciation and impairment of property, plant & equipment with effect from the start date of application of IFRS 5 (Discontinued and Held-for-Sale Operations) included in business net income; (ii) impact of the amortization and impairment of intangible assets until the start date of IFRS 5 application; (iii) costs directly incurred as a result of the divestment; and (iv) tax effects of those items. |
58 | Sanofi 2018 HALF-YEAR FINANCIAL REPORT
The table below reconciles our business net income to Net income attributable to equity holders of Sanofi:
( million) | June 30, (6 months) |
June 30,(a) (6 months) |
December 31, (a) (12 months) |
|||||||||
Net income attributable to equity holders of Sanofi |
1,778 | 6,729 | 8,416 | |||||||||
Amortization of intangible assets (b) |
999 | 990 | 1,866 | |||||||||
Impairment of intangible assets |
101 | 12 | 293 | |||||||||
Fair value remeasurement of contingent consideration |
(10 | ) | 100 | 159 | ||||||||
Expenses arising from the impact of acquisitions on inventories |
99 | 176 | 166 | |||||||||
Other expenses related to business combinations |
10 | | | |||||||||
Restructuring costs and similar items |
607 | 364 | 731 | |||||||||
Other gains and losses, and litigation(c) |
67 | 7 | 215 | |||||||||
Tax effects of the items listed above: |
(475 | ) | (628 | ) | (1,126 | ) | ||||||
- tax effects of amortization and impairment of intangible assets |
(275 | ) | (349 | ) | (719 | ) | ||||||
- tax effects of fair value remeasurement of contingent consideration |
11 | (31 | ) | 4 | ||||||||
- tax effects of expenses arising from the impact of acquisitions on inventories |
(23 | ) | (56 | ) | (52 | ) | ||||||
- tax effects of other expenses related to business combinations |
| | | |||||||||
- tax effects of restructuring costs and similar items |
(183 | ) | (126 | ) | (134 | ) | ||||||
- other tax effects |
(5 | ) | (66 | ) | (225 | ) | ||||||
Other tax items (d) |
(93 | ) | 111 | 741 | ||||||||
Share of items listed above attributable to non-controlling interests |
(1 | ) | (1 | ) | (4 | ) | ||||||
Investments accounted for using the equity method: restructuring costs and expenses arising from the impact of acquisitions |
74 | 43 | 129 | |||||||||
Items relating to the Animal Health business (e) |
| (4,421 | ) | (4,643 | ) | |||||||
Business net income |
3,156 | 3,482 | 6,943 | |||||||||
Average number of shares outstanding (million) |
1,247.8 | 1260.3 | 1,256.9 | |||||||||
Basic earnings per share (in euros) |
1.42 | 5.34 | 6.70 | |||||||||
Reconciling items per share (in euros) |
1.11 | (2.58 | ) | (1.18 | ) | |||||||
Business earnings per share (in euros) |
2.53 | 2.76 | 5.52 |
(a) | Includes the effects of first-time application of IFRS 15 on revenue recognition (see Note A.1.2. to the condensed half-year consolidated financial statements). |
(b) | Includes amortization expense generated by the remeasurement of intangible assets in connection with business combinations: 934 million in the six months ended June 30, 2018; 919 million in the six months ended June 30, 2017, and 1,726 million in the year ended December 31, 2017. |
(c) | For 2018, this line consists mainly of separation costs associated with the process of disinvesting from the Generics business in Europe, before any tax effects. For the year ended December 31, 2017, this line item also includes an additional charge to a provision for a vendors liability guarantee on a past divestment. |
(d) | In 2018, this line includes adjustments to our preliminary analysis of the direct and indirect impacts of US tax reform. In 2017, it shows the impact of the 3% tax on dividends in France. |
(e) | This line includes the gain on the divestment of the Animal Health business, which is presented separately in accordance with IFRS 5 (Non-Current Assets Held for Sale and Discontinued Operations), along with the residual impacts of that divestment. |
The most significant reconciling items between our business net income and Net income attributable to equity holders of Sanofi relate to (i) the purchase accounting effects of our acquisitions and business combinations, particularly the amortization and impairment of intangible assets (other than software and other rights of an industrial or operational nature) and (ii)) the impacts of events regarded as non-recurring, where the amounts involved are particularly significant. . We believe that excluding those non-cash or non-recurring charges enhances an investors understanding of our underlying economic performance, because we do not consider that the excluded charges reflect the combined entitys ongoing operating performance. Rather, we believe that each of the excluded charges reflects the decision to acquire the businesses concerned.
The principal purchase accounting effects of acquisitions and business combinations on net income are:
| amortization and net impairment losses charged against intangible assets (other than software and other rights of an industrial or operational nature), net of taxes and non-controlling interests; and |
| the incremental cost of sales incurred on the workdown of acquired inventories remeasured at fair value, net of taxes. |
2018 HALF-YEAR FINANCIAL REPORT Sanofi | 59
We believe (subject to the limitations described below) that disclosing our business net income enhances the comparability of our operating performance, for the following reasons:
| the elimination of charges related to the purchase accounting effect of our acquisitions and business combinations (particularly amortization and impairment of finite-lived intangible assets, other than software and other rights of an industrial or operational nature) enhances the comparability of our ongoing operating performance relative to our peers in the pharmaceutical industry that carry those intangible assets (principally patents and trademarks) at low book values either because they are the result of in-house research and development that has already been expensed in prior periods or because they were acquired through business combinations that were accounted for as poolings-of-interest; |
| the elimination of selected items such as the incremental cost of sales arising from the workdown of acquired inventories remeasured at fair value in business combinations, major gains and losses on disposals, and costs and provisions associated with major litigation and any other major non-recurring items, improves comparability from one period to the next; and |
| the elimination of restructuring costs and similar items enhances comparability because those costs are incurred in connection with reorganization and transformation processes intended to optimize our operations. |
We remind investors, however, that business net income should not be considered in isolation from, or as a substitute for, Net income attributable to equity holders of Sanofi reported in accordance with IFRS. In addition, we strongly encourage investors and potential investors not to rely on any single financial measure but to review our financial statements, including the notes thereto, carefully and in their entirety.
We compensate for the material limitations described above by using business net income only to supplement our IFRS financial reporting and by ensuring that our disclosures provide sufficient information for a full understanding of all adjustments included in business net income.
Because our business net income is not a standardized measure, it may not be directly comparable with the non-GAAP financial measures of other companies using the same or a similar non-GAAP financial measure.
60 | Sanofi 2018 HALF-YEAR FINANCIAL REPORT
C.3. NET SALES
Comparatives for 2017 have been restated in accordance with the new standard on revenue recognition, IFRS 15, which is applicable from January 1, 2018 onwards. The impacts of those restatements are described in detail in Note A.1.2. to the condensed half-year consolidated financial statements.
Consolidated net sales for the first half of 2018 amounted to 16,074 million, 7.2% lower than in the first half of 2017. Exchange rate fluctuations had a negative effect of 7.1 percentage points overall, due mainly to unfavorable trends in the exchange rate for the euro against the US dollar, Brazilian real and Argentinean peso. At constant exchange rates (CER, see definition below), net sales were virtually unchanged (-0.1% year-on-year, with lower sales for the Diabetes franchise and Established Prescription Products offset by a good performance from the Immunology franchise and by sales of Bioverativ products for rare blood disorders, consolidated from March 8, 2018 onwards. At constant exchange rates and on a constant structure basis (CER/CS, see definition below), net sales were down 1.8%.
Reconciliation of net sales to net sales at constant exchange rates and on a constant structure basis
( million) | June 30, 2018 (6 months) |
June 30, 2017 (6 months)(a) |
Change | |||||||||
Net sales |
16,074 | 17,324 | -7.2 | % | ||||||||
Effect of exchange rates |
1,227 | |||||||||||
Net sales at constant exchange rates |
17,301 | 17,324 | -0.1 | % | ||||||||
Impact of change in structure (Bioverativ)(b) |
303 | |||||||||||
Net sales at constant exchange rates and on a constant structure basis |
17,301 | 17,627 | -1.8 | % |
(a) | Includes the effects of first-time application of IFRS 15 on revenue recognition (see Note A.1.2. to the condensed half-year consolidated financial statements). |
(b) | Net sales of Bioverativ products (consolidated from March 8, 2018) for the period from March 9, 2017 through June 30, 2017. |
When we refer to changes in our net sales at constant exchange rates (CER), that means that we have excluded the effect of exchange rates by recalculating net sales for the relevant period using the exchange rates that were used for the previous period.
When we refer to changes in our net sales on a constant structure basis, that means that we eliminate the effect of changes in structure by restating the net sales for the previous period as follows:
| by including sales generated by entities or product rights acquired in the current period for a portion of the previous period equal to the portion of the current period during which we owned them, based on sales information we receive from the party from whom we make the acquisition; |
| similarly, by excluding sales for a portion of the previous period when we have sold an entity or rights to a product in the current period; and |
| for a change in consolidation method, by recalculating the previous period on the basis of the method used for the current period. |
To facilitate analysis and comparisons with prior periods, some figures are given at constant exchange rates and on a constant structure basis (CER/CS).
2018 HALF-YEAR FINANCIAL REPORT Sanofi | 61
C.3.1. NET SALES BY OPERATING SEGMENT
Our net sales comprise the net sales generated by our Pharmaceuticals, Consumer Healthcare and Human Vaccines (Vaccines) segments. Following the gradual integration of BIs Consumer Healthcare business, acquired on January 1, 2017, our Consumer Healthcare business represents a separate operating segment of Sanofi in accordance with IFRS 8. Consequently, we present our Consumer Healthcare net sales separately for the periods ended June 30, 2017 and June 30, 2018.
( million) | June 30, 2018 (6 months) |
June 30, 2017 (6 months)(a) |
Change | |||||||||
Pharmaceuticals |
12,199 | 13,038 | -6.4 | % | ||||||||
Consumer Healthcare |
2,353 | 2,486 | -5.3 | % | ||||||||
Vaccines |
1,522 | 1,800 | -15.4 | % | ||||||||
Net sales |
16,074 | 17,324 | -7.2 | % |
(a) | Includes the effects of first-time application of IFRS 15 on revenue recognition (see Note A.1.2. to the condensed half-year consolidated financial statements). |
C.3.2. NET SALES BY GLOBAL BUSINESS UNIT (GBU)
The table below presents net sales for our Global Business Units (GBUs). Note that Emerging Markets sales of Diabetes & Cardiovascular and Specialty Care products are included in the General Medicines & Emerging Markets GBU.
( million) | June 30, 2018 (6 months) |
June 30, 2017 (6 months)(a) |
Change on a reported basis |
Change at constant exchange rates |
||||||||||||
Sanofi Genzyme GBU (Specialty Care)(b)(c) |
3,268 | 2,817 | +16.0 | % | +24.8 | % | ||||||||||
Diabetes & Cardiovascular GBU(b) |
2,195 | 2,801 | -21.6 | % | -15.6 | % | ||||||||||
General Medicines & Emerging Markets GBU(d)(e) |
6,736 | 7,420 | -9.2 | % | -2.6 | % | ||||||||||
Total Pharmaceuticals |
12,199 | 13,038 | -6.4 | % | +0.5 | % | ||||||||||
Consumer Healthcare GBU |
2,353 | 2,486 | -5.3 | % | +3.0 | % | ||||||||||
Sanofi Pasteur (Vaccines) GBU |
1,522 | 1,800 | -15.4 | % | -9.3 | % | ||||||||||
Total net sales |
16,074 | 17,324 | -7.2 | % | -0.1 | % |
(a) | Includes the effects of first-time application of IFRS 15 on revenue recognition (see Note A.1.2. to the condensed half-year consolidated financial statements). |
(b) | Does not include Emerging Markets net sales. |
(c) | Rare Diseases, Multiple Sclerosis, Oncology and Immunology, and Rare Blood Disorder. |
(d) | Includes net sales in Emerging Markets of Specialty Care and Diabetes & Cardiovascular products. |
(e) | Emerging Markets: World excluding United States, Canada, Western and Eastern Europe (apart from Russia, Ukraine, Georgia, Belarus, Armenia and Turkey), Japan, South Korea, Australia, New Zealand and Puerto Rico. |
62 | Sanofi 2018 HALF-YEAR FINANCIAL REPORT
C.3.3. NET SALES BY FRANCHISE
The table below sets forth our 2018 first-half net sales by franchise in order to facilitate direct comparisons with our peers. For a detailed reconciliation of net sales by franchise and net sales by GBU for our Pharmaceuticals segment, refer to the table later in this report showing Pharmaceuticals segment net sales by geographical region.
( million) | June 30, 2018 (6 months) |
June 30, 2017 (6 months)(a) |
Change on a reported basis |
Change at exchange rates |
||||||||||||
Rare Diseases |
1,438 | 1,466 | -1.9 | % | +6.5 | % | ||||||||||
Multiple Sclerosis |
982 | 1,045 | -6.0 | % | +2.0 | % | ||||||||||
Oncology |
727 | 794 | -8.4 | % | -1.8 | % | ||||||||||
Immunology |
313 | 27 | +1,059.3 | % | +1,170.4 | % | ||||||||||
Rare Blood Disorder |
321 | | | | ||||||||||||
Total Specialty Care |
3,781 | 3,332 | +13.5 | % | +23.1 | % | ||||||||||
- of which Developed Markets (Sanofi Genzyme GBU) |
3,268 | 2,817 | +16.0 | % | +24.8 | % | ||||||||||
- of which Emerging Markets (b)(c) |
513 | 515 | -0.4 | % | +13.4 | % | ||||||||||
Diabetes |
2,722 | 3,313 | -17.8 | % | -10.9 | % | ||||||||||
Cardiovascular |
273 | 257 | +6.2 | % | +15.2 | % | ||||||||||
Total Diabetes & Cardiovascular |
2,995 | 3,570 | -16.1 | % | -9.0 | % | ||||||||||
- of which Developed Markets (Diabetes & Cardiovascular GBU) |
2,195 | 2,801 | -21.6 | % | -15.6 | % | ||||||||||
- of which Emerging Markets (b)(c) |
800 | 769 | +4.0 | % | +15.0 | % | ||||||||||
Established Prescription Products(b) |
4,586 | 5,230 | -12.3 | % | -7.1 | % | ||||||||||
Generics(b) |
837 | 906 | -7.6 | % | -0.3 | % | ||||||||||
Total Pharmaceuticals |
12,199 | 13,038 | -6.4 | % | +0.5 | % | ||||||||||
Consumer Healthcare (Consumer Healthcare GBU) |
2,353 | 2,486 | -5.3 | % | +3.0 | % | ||||||||||
Vaccines (Sanofi Pasteur GBU) |
1,522 | 1,800 | -15.4 | % | -9.3 | % | ||||||||||
Total net sales |
16,074 | 17,324 | -7.2 | % | -0.1 | % |
(a) | Includes the effects of first-time application of IFRS 15 on revenue recognition (see Note A.1.2. to the condensed half-year consolidated financial statements). |
(b) | These lines are aggregated to form the net sales of the General Medicines and Emerging Markets GBU. |
(c) | Emerging Markets: World excluding United States, Canada, Western and Eastern Europe (apart from Russia, Ukraine, Georgia, Belarus, Armenia and Turkey), Japan, South Korea, Australia, New Zealand and Puerto Rico. |
C.3.4. PHARMACEUTICALS SEGMENT
Net sales of the Pharmaceuticals segment (excluding Consumer Healthcare) were 12,199 million in the first half of 2018, down 6.4% on a reported basis but up 0.5% at constant exchange rates. At constant exchange rates and on a constant structure basis, net sales were down 1.7%.
The 839 million decrease in net sales compared with the first half of 2017 was mainly due to the 909 million negative effect of exchange rates. At constant exchange rates, the year-on-year change in net sales reflects the following impacts:
| positive performances from the Rare Blood Disorder franchise (+351 million) reflecting the inclusion of Bioverativ products in consolidated net sales from March 8, 2018, the Immunology franchise (+316 million), the Rare Diseases franchise (+95 million); the Cardiovascular franchise (+39 million), and the Multiple Sclerosis franchise (+21 million); |
| lower net sales for the Established Prescription Products franchise (-373 million), the Diabetes franchise (-362 million), the Oncology franchise (-14 million) and the Generics franchise (-3 million). |
Comments on the performances of our major Pharmaceuticals segment products are provided below.
2018 HALF-YEAR FINANCIAL REPORT Sanofi | 63
Net sales by product and franchise
( million) | Indication | June 30, 2018 (6 months) |
June 30, 2017 (6 months)(a) |
Change a reported basis |
Change at constant exchange |
|||||||||||||
Cerezyme® |
Gaucher disease | 356 | 370 | -3.8 | % | +6.2 | % | |||||||||||
Cerdelga® |
Gaucher disease | 74 | 62 | +19.4 | % | +29.0 | % | |||||||||||
Myozyme®/Lumizyme® |
Pompe disease | 405 | 394 | +2.8 | % | +9.4 | % | |||||||||||
Fabrazyme® |
Fabry disease | 358 | 367 | -2.5 | % | +6.5 | % | |||||||||||
Aldurazyme® |
Mucopolysaccharidosis | 103 | 110 | -6.4 | % | +1.8 | % | |||||||||||
Other |
142 | 163 | -12.9 | % | -5.5 | % | ||||||||||||
Total Rare Diseases |
1,438 | 1,466 | -1.9 | % | +6.5 | % | ||||||||||||
Aubagio® |
Multiple Sclerosis | 775 | 796 | -2.6 | % | +6.0 | % | |||||||||||
Lemtrada® |
Multiple Sclerosis | 207 | 249 | -16.9 | % | -10.8 | % | |||||||||||
Total Multiple Sclerosis |
982 | 1,045 | -6.0 | % | +2.0 | % | ||||||||||||
Jevtana® |
Prostate cancer | 202 | 197 | +2.5 | % | +10.2 | % | |||||||||||
Thymoglobulin® |
Organ rejection | 144 | 148 | -2.7 | % | +6.1 | % | |||||||||||
Eloxatin® |
Colorectal cancer | 90 | 90 | +0.0 | % | +5.6 | % | |||||||||||
Taxotere® |
Breast, lung, prostate, stomach, and head & neck cancers | 84 | 90 | -6.7 | % | -1.1 | % | |||||||||||
Mozobil® |
Hematologic malignancies | 82 | 80 | +2.5 | % | +10.0 | % | |||||||||||
Zaltrap® |
Colorectal cancer | 46 | 34 | +35.3 | % | +41.2 | % | |||||||||||
Other |
79 | 155 | -49.0 | % | -44.5 | % | ||||||||||||
Total Oncology |
727 | 794 | -8.4 | % | -1.8 | % | ||||||||||||
Eloctate® |
Hemophilia A | 219 | | | | |||||||||||||
Alprolix® |
Hemophilia B | 102 | | | | |||||||||||||
Total Rare Blood Disorder |
321 | | | | ||||||||||||||
Dupixent® |
Atopic dermatitis | 283 | 26 | +988.5 | % | +1,092.3 | % | |||||||||||
Kevzara® |
Rheumatoid arthritis | 30 | 1 | +2,900.0 | % | +3,200.0 | % | |||||||||||
Total Immunology |
313 | 27 | +1,059.3 | % | +1,170.4 | % | ||||||||||||
Total Specialty Care |
3,781 | 3,332 | +13.5 | % | +23.1 | % | ||||||||||||
Lantus® |
Diabetes | 1,802 | 2,425 | -25.7 | % | -19.1 | % | |||||||||||
Toujeo® |
Diabetes | 414 | 403 | +2.7 | % | +10.7 | % | |||||||||||
Apidra® |
Diabetes | 183 | 191 | -4.2 | % | +3.1 | % | |||||||||||
Amaryl® |
Diabetes | 170 | 173 | -1.7 | % | +5.8 | % | |||||||||||
Insuman® |
Diabetes | 47 | 56 | -16.1 | % | -12.5 | % | |||||||||||
Lyxumia® |
Diabetes | 11 | 14 | -21.4 | % | -14.3 | % | |||||||||||
Soliqua® 100/33 / SuliquaTM |
Diabetes | 26 | 9 | +188.9 | % | +222.2 | % | |||||||||||
Other |
Diabetes | 69 | 42 | +64.3 | % | +73.8 | % | |||||||||||
Total Diabetes |
2,722 | 3,313 | -17.8 | % | -10.9 | % | ||||||||||||
Multaq® |
Atrial fibrillation | 162 | 181 | -10.5 | % | -1.7 | % | |||||||||||
Praluent® |
Hypercholesterolemia | 111 | 76 | +46.1 | % | +55.3 | % | |||||||||||
Total Cardiovascular |
273 | 257 | +6.2 | % | +15.2 | % | ||||||||||||
Total Diabetes & Cardiovascular |
2,995 | 3,570 | -16.1 | % | -9.0 | % | ||||||||||||
Lovenox® |
Thrombosis | 768 | 817 | -6.0 | % | -1.5 | % | |||||||||||
Plavix® |
Atherothrombosis | 761 | 764 | -0.4 | % | +4.6 | % | |||||||||||
Aprovel® / Avapro® |
Hypertension | 343 | 382 | -10.2 | % | -4.7 | % | |||||||||||
Depakine® |
Epilepsy | 230 | 224 | +2.7 | % | +7.6 | % | |||||||||||
Renagel®/Renvela® |
Hyperphosphatemia | 201 | 494 | -59.3 | % | -55.7 | % | |||||||||||
Synvisc® / Synvisc-One® |
Arthritis | 160 | 206 | -22.3 | % | -14.6 | % | |||||||||||
Allegra® |
Allergic rhinitis, urticaria | 80 | 102 | -21.6 | % | -14.7 | % | |||||||||||
Stilnox®/Ambien®/Myslee® |
Sleep disorders | 116 | 137 | -15.3 | % | -8.0 | % | |||||||||||
Tritace® |
Hypertension | 115 | 124 | -7.3 | % | -2.4 | % | |||||||||||
Other |
1,812 | 1,980 | -8.5 | % | -3.1 | % | ||||||||||||
Total Established Prescription Products |
4,586 | 5,230 | -12.3 | % | -7.1 | % | ||||||||||||
Generics |
837 | 906 | -7.6 | % | -0.3 | % | ||||||||||||
Total Pharmaceuticals |
12,199 | 13,038 | -6.4 | % | +0.5 | % |
(a) | Includes the effects of first-time application of IFRS 15 on revenue recognition (see Note A.1.2. to the condensed half-year consolidated financial statements). |
64 | Sanofi 2018 HALF-YEAR FINANCIAL REPORT
RARE DISEASES FRANCHISE
In the first half of 2018, net sales for the Rare Diseases franchise were 1,438 million, down 1.9% on a reported basis but up 6.5% at constant exchange rates, reflecting stronger sales in all geographies but especially in Emerging Markets1 (+13.3% CER at 268 million), Europe2 (+6.8% CER at 502 million) and the United States (+3.5% CER at 509 million).
In the first half of 2018, net sales for the Gaucher disease franchise (Cerezyme® and Cerdelga®) reached 430 million, up 9.5% CER, on stronger sales of Cerezyme® in Emerging Markets (+25.0% CER at 120 million) and growing penetration of Cerdelga® in the United States (+10.4% CER at 47 million) and Europe (+100.0% CER at 22 million). In the first half of 2018, Cerezyme® posted net sales of 356 million (+6.2% CER), while net sales of Cerdelga® reached 74 million, up 29.0%.
Net sales of Myozyme® / Lumizyme® in Pompe disease rose by 9.4% CER in the first half of 2018 to 405 million, driven by sales growth in Europe (+11.8% CER, at 188 million) and in the United States (+9.6% CER, at 133 million). Sales also grew in Emerging Markets (+5.0% CER, at 56 million) and in the Rest of the World region3 (+3.3% CER at 28 million). This growth reflects the rising number of patients diagnosed with, and treated for, Pompe disease.
Fabrazyme® posted net sales growth of 6.5% CER to 358 million. Sales are advancing in many countries due to the rising number of patients diagnosed with, and treated for, Fabry disease. Net sales of the product advanced by 5.8% CER (to 179 million) in the United States and by 7.4% CER (to 87 million) in Europe.
MULTIPLE SCLEROSIS FRANCHISE
In the first half of 2018, the Multiple Sclerosis franchise generated net sales of 982 million, down 6.0% on a reported basis but up 2.0% CER, driven by growth for Aubagio®.
Aubagio® achieved net sales of 775 million in the first half of 2018, up 6.0% CER, supported by growth in the United States (+11.0% CER, at 541 million) and Emerging Markets (+52.6% CER, at 25 million). That more than offset lower sales in Europe (-9.8% CER, at 184 million), reflecting a tough comparative given that in the first half of 2017 Aubagio® was boosted by an order of nearly 30 million for use in clinical trials. In 2017, Sanofi reached settlement with all 20 generic Aubagio® Abbreviated New Drug Application (ANDA) first filers granting each a royalty-free license to enter the United States market on March 12, 2023.
In the first half of 2018, net sales of Lemtrada® were 207 million, down 10.8% CER on lower sales in the United States (-19.2% CER, at 93 million) due to increased competition and the need to rebuild the patient cohort in light of the products unique dosage profile and long-lasting effects. In Europe and Emerging Markets, net sales of Lemtrada® rose by 1.1% CER to 92 million and by 36.4% to 12 million, respectively.
ONCOLOGY FRANCHISE
In the first half of 2018, net sales for the Oncology franchise amounted to 727 million, down 8.4% on a reported basis and 1.8% CER. We divested Leukine® on January 31, 2018, as part of our portfolio refocusing strategy. Excluding Leukine®, Oncology franchise net sales increased by 4.3% CER in the first half, on strong performances from Jevtana® in the United States and from Jevtana® and Zaltrap® in the Rest of the World region.
Jevtana® reported net sales of 202 million in the first half of 2018, up 10.2% CER, mainly on sales growth in the United States (+16.0% CER, at 84 million), though sales were also stronger in Europe (+4.0% CER, at 78 million) and Japan (+21.7% CER, at 26 million).
In the first half of 2018, sales of Thymoglobulin® and Eloxatin® were boosted by China, where sales of the two products rose by 6.1% CER (to 144 million) and 5.6% CER (to 90 million), respectively.
Sales of Zaltrap® totaled 46 million in the first half of 2018, up 41.2% CER, driven by Japan (+900.0% CER, at 9 million).
1 | World excluding United States, Canada, Western and Eastern Europe (apart from Russia, Ukraine, Georgia, Belarus, Armenia and Turkey), Japan, South Korea, Australia, New Zealand and Puerto Rico. |
2 | Western Europe and Eastern Europe excluding Eurasia (Russia, Ukraine, Georgia, Belarus, Armenia and Turkey). |
3 | Japan, South Korea, Canada, Australia, New Zealand and Puerto Rico. |
2018 HALF-YEAR FINANCIAL REPORT Sanofi | 65
IMMUNOLOGY FRANCHISE
Dupixent® (developed in collaboration with Regeneron) was launched in the United States in April 2017 for moderate-to-severe atopic dermatitis in adults; further launches followed in Germany (December 2017) and in the Netherlands, Canada, Denmark, Sweden and Japan during the first half of 2018. Net sales of Dupixent® reached 283 million in the first half of 2018, of which 246 million was generated in the United States.
Kevzara® (developed in collaboration with Regeneron) was launched as a rheumatoid arthritis treatment in the United States in June 2017; in Germany, the United Kingdom and the Netherlands in the second half of 2017; and in Japan, Belgium, Sweden and Finland in the first half of 2018. First-half sales of Kevzara® amounted to 30 million, of which 23 million was generated in the United States.
RARE BLOOD DISORDER FRANCHISE
We have completed the acquisition of Bioverativ, which is consolidated with effect from March 9, 2018. Consolidated net sales for the Rare Blood Disorder franchise in the period from that date to June 30, 2018 amounted to 321 million, including 51 million of non-US sales (mainly in Japan). At constant exchange rates and on a constant structure basis, the franchise grew sales by 15.8%. After Colombia in the first quarter of 2018, further launches in Emerging Markets countries are anticipated later this year.
Consolidated sales of Eloctate® (a recombinant fusion protein that fuses human coagulation factor VIII to the Fc portion of IgG1, indicated in the treatment of hemophilia A) amounted to 219 million. At constant exchange rates and on a constant structure basis, sales of Eloctate® rose by 20.6%.
Consolidated sales of Alprolix® (a recombinant fusion protein that fuses human coagulation factor IX to the Fc portion of IgG1, indicated in the treatment of hemophilia B) reached 102 million. At constant exchange rates and on a constant structure basis, sales of Alprolix® rose by 6.7%.
DIABETES FRANCHISE
Net sales for the Diabetes franchise amounted to 2,722 million in the first half of 2018, down 17.8% on a reported basis and 10.9% at constant exchange rates. The main factor was a decrease in sales of Lantus® in the United States, where Diabetes franchise sales were down 28.3% CER at 1,059 million. That decrease reflects the exclusion of a number of diabetes treatments from the reimbursement list of some leading private healthcare providers; changes to the Medicare Part D welfare program; and the ongoing decline in average net prices for insulin glargines in the United States. Elsewhere in the world, net sales for the Diabetes franchise rose in Emerging Markets (+14.7% CER, at 793 million); remained stable in Europe (-0.3% CER, at 648 million), where a good performance by Toujeo® partly offset lower sales of Lantus®; and decreased in the Rest of the World region (-1.6% CER, at 222 million).
In the first half of 2018, net sales of our insulin glargines (Lantus® and Toujeo®) were down 21.6% on a reported basis and down 14.9% CER, at 2,216 million.
Net sales of Lantus® decreased by 19.1% CER in the first half to 1,802 million. In the United States, sales were down 32.4% CER, at 816 million, for the reasons explained above. Net sales in Europe decreased by 9.4% CER to 355 million, due largely to the launch of a biosimilar of Lantus® and the switching of patients to Toujeo®. In Emerging Markets, sales of Lantus® advanced by 4.8% CER to 492 million.
In the first half of 2018, the new-generation basal insulin Toujeo® posted net sales of 414 million, up 10.7% CER, driven by strong performances in Europe (+42.0%, at 142 million) and Emerging Markets (+100.0%, at 65 million). However sales were lower in in the United States (-19.0% CER, at 171 million), mainly as a result of a decrease in the net average selling price.
In the first half of 2018, net sales of Apidra® rose by 3.1% CER to 183 million. Lower sales in the United States (-19.6% CER, at 40 million) were compensated for by sales growth in Emerging Markets (+29.2% CER, at 54 million) and Europe (+4.5% CER, at 70 million).
In the first half of 2018, net sales of Amaryl® were up 5.8% CER at 170 million, of which 146 million was generated in Emerging Markets (+10.6% CER).
Soliqua® 100/33 and Suliqua (insulin glargine 100 units/ml and lixisenatide 33 mcg/ml injectable) were launched in the United States in January 2017, and various European and Emerging Markets countries during the rest of 2017. Sales of Soliqua® 100/33 / Suliqua amounted to 26 million in the first half of 2018.
66 | Sanofi 2018 HALF-YEAR FINANCIAL REPORT
CARDIOVASCULAR FRANCHISE
In the first half of 2018, sales of Praluent® (developed in collaboration with Regeneron) rose by 55.3% CER to 111 million (including 61 million in the United States, reflecting increased market access for the product, and 41 million in Europe).
As mentioned in Section A.1.3. of this half-year management report, Sanofi and Regeneron presented positive results from the ODYSSEY OUTCOMES trial in March 2018. Those results showed that Praluent® significantly reduced the risk of major adverse cardiovascular events in patients who had suffered a recent acute coronary syndrome event. Sanofi and Regeneron also announced measures to help ensure more affordable and timely access to Praluent® for high-risk patients with significant unmet needs. Discussions are ongoing with US payers to streamline the reimbursement criteria for Praluent®.
In the first half of 2018, net sales of Multaq® were 162 million, down 1.7% CER. Sales were generated primarily in the United States (net sales of 135 million, down 1.9% CER) and in Europe (21 million, down 4.5% CER).
ESTABLISHED PRESCRIPTION PRODUCTS
Net sales of Established Prescription Products in the first half of 2018 amounted to 4,586 million, down 12.3% on a reported basis and 7.1% at constant exchange rates. Stronger sales in Emerging Markets (+8.7% CER, at 1,958 million) failed to offset lower net sales in the United States due to competition from generics of Renvela®/Renagel®; the impact of generic competition in Japan, especially for Plavix® and Aprovel®; and a decrease in net sales in Europe (-3.9% CER, at 1,719 million). In the United States and the Rest of the World region, net sales of Established Prescription Products were down 44.1% CER (at 379 million) and 20.0% CER (at 530 million), respectively.
In the first half of 2018, net sales of Lovenox® totaled 768 million, down 1.5% CER; this reflects competition in Europe (-5.4% CER, at 471 million) with the arrival of biosimilars in the United Kingdom, Germany and Italy. This more than offset a good performance in Emerging Markets (+9.9% CER, at 236 million).
Net sales of Plavix® in the first half of 2018 were 761 million, a rise of 4.6% CER; this reflected competition from generics in Japan (-32.8% CER, at 79 million), although the effect was more than offset by another strong performance in Emerging Markets (+14.6% CER, at 575 million), especially China (+17.2%, at 441 million). Sales of Plavix® in the United States and Puerto Rico are handled by BMS under the terms of the Sanofi-BMS alliance1.
In the first half of 2018, net sales of Aprovel® /Avapro® amounted to 343 million, down 4.7% CER, reflecting competition from generics in Japan (-66.7% CER, at 22 million) and Europe (-8.3% CER, at 55 million). The effect was partly offset by stronger sales in Emerging Markets (+15.1% CER, at 242 million), especially China (+20.7% CER, at 157 million).
In the first half of 2018, net sales of Renvela® /Renagel® came to 201 million, down 55.7% CER, due largely to competition from generics in the United States (-67.5% CER, at 121 million) where the first generics of the product in powder form and pill form were authorized in June and July 2017, respectively. In October 2017, Sanofi launched its own authorized generic version of Renvela®/Renagel® in the United States. In Europe, sales of Renvela®/Renagel® were down 13.5% CER at 32 million, also due to generic competition.
GENERICS
Net sales of Generics for the first half of 2018 totaled 837 million, down 7.6% on a reported basis and 0.3% at constant exchange rates. Higher sales in Emerging Markets (+4.1% CER, at 351 million) and the Rest of the World region (+21.9% CER, at 71 million) failed to offset lower sales in Europe (-4.7% CER, at 367 million) and the United States (-21.7% CER, at 48 million).
In June 2018, Advent International and Sanofi announced that they had finalized negotiations with a view to Advent acquiring Zentiva, Sanofis European generics business, for an enterprise value of 1.9 billion. The transaction is expected to close in the fourth quarter of 2018, subject to clearance from the regulatory authorities (see Section A.1.1. of this Half-Year Management Report).
1 | See Note C.2 to our consolidated financial statements for the year ended December 31, 2017, on page F-33 of our Annual Report on Form 20-F; this document is available on our corporate website, www.sanofi.com. |
2018 HALF-YEAR FINANCIAL REPORT Sanofi | 67
2018 first-half Pharmaceuticals net sales by geographical region
( million) |
Total GBU |
Europe(a) | Change CER |
United States |
Change CER |
Rest of the world(b) |
Change CER |
Emerging Markets(c) |
Change CER |
Total Franchise |
Change CER |
|||||||||||||||||||||||||||||||||
Cerezyme® |
236 | 134 | -2.9 | % | 83 | +1.1 | % | 19 | -13.0 | % | 120 | +25.0 | % | 356 | +6.2 | % | ||||||||||||||||||||||||||||
Cerdelga® |
73 | 22 | +100.0 | % | 47 | +10.4 | % | 4 | +33.3 | % | 1 | | 74 | +29.0 | % | |||||||||||||||||||||||||||||
Myozyme®/Lumizyme® |
349 | 188 | +11.8 | % | 133 | +9.6 | % | 28 | +3.3 | % | 56 | +5.0 | % | 405 | +9.4 | % | ||||||||||||||||||||||||||||
Fabrazyme® |
320 | 87 | +7.4 | % | 179 | +5.8 | % | 54 | +9.3 | % | 38 | +4.7 | % | 358 | +6.5 | % | ||||||||||||||||||||||||||||
Aldurazyme® |
71 | 38 | +0.0 | % | 21 | +9.1 | % | 12 | +0.0 | % | 32 | +0.0 | % | 103 | +1.8 | % | ||||||||||||||||||||||||||||
Other |
121 | 33 | -2.9 | % | 46 | -21.3 | % | 42 | +6.7 | % | 21 | +9.1 | % | 142 | -5.5 | % | ||||||||||||||||||||||||||||
Total Rare Diseases |
1,170 | 502 | +6.8 | % | 509 | +3.5 | % | 159 | +4.2 | % | 268 | +13.3 | % | 1,438 | +6.5 | % | ||||||||||||||||||||||||||||
Aubagio® |
750 | 184 | -9.8 | % | 541 | +11.0 | % | 25 | -7.1 | % | 25 | +52.6 | % | 775 | +6.0 | % | ||||||||||||||||||||||||||||
Lemtrada® |
195 | 92 | +1.1 | % | 93 | -19.2 | % | 10 | -43.8 | % | 12 | +36.4 | % | 207 | -10.8 | % | ||||||||||||||||||||||||||||
Total Multiple Sclerosis |
945 | 276 | -6.4 | % | 634 | +5.2 | % | 35 | -20.5 | % | 37 | +46.7 | % | 982 | +2.0 | % | ||||||||||||||||||||||||||||
Jevtana® |
191 | 78 | +4.0 | % | 84 | +16.0 | % | 29 | +23.1 | % | 11 | -13.3 | % | 202 | +10.2 | % | ||||||||||||||||||||||||||||
Thymoglobulin® |
107 | 19 | -5.0 | % | 78 | +2.4 | % | 10 | +0.0 | % | 37 | +25.0 | % | 144 | +6.1 | % | ||||||||||||||||||||||||||||
Eloxatin® |
16 | 1 | -50.0 | % | | | 15 | +6.7 | % | 74 | +6.8 | % | 90 | +5.6 | % | |||||||||||||||||||||||||||||
Taxotere® |
17 | 2 | +0.0 | % | 1 | +0.0 | % | 14 | -17.6 | % | 67 | +2.9 | % | 84 | -1.1 | % | ||||||||||||||||||||||||||||
Mozobil® |
77 | 24 | +9.1 | % | 45 | +2.0 | % | 8 | +50.0 | % | 5 | +66.7 | % | 82 | +10.0 | % | ||||||||||||||||||||||||||||
Zaltrap® |
41 | 26 | +0.0 | % | 4 | +25.0 | % | 11 | | 5 | +50.0 | % | 46 | +41.2 | % | |||||||||||||||||||||||||||||
Other |
71 | 26 | -3.7 | % | 36 | -61.5 | % | 9 | -10.0 | % | 8 | +0.0 | % | 79 | -44.5 | % | ||||||||||||||||||||||||||||
Total Oncology |
520 | 176 | +1.1 | % | 248 | -15.2 | % | 96 | +20.0 | % | 207 | +8.3 | % | 727 | -1.8 | % | ||||||||||||||||||||||||||||
Eloctate® |
219 | | | 187 | | 32 | | | | 219 | | |||||||||||||||||||||||||||||||||
Alprolix® |
102 | | | 83 | | 19 | | | | 102 | | |||||||||||||||||||||||||||||||||
Total Rare Blood Disorder |
321 | | | 270 | | 51 | | | | 321 | | |||||||||||||||||||||||||||||||||
Dupixent® |
282 | 26 | | 246 | +950.0 | % | 10 | | 1 | | 283 | +1,092.3 | % | |||||||||||||||||||||||||||||||
Kevzara® |
30 | 5 | | 23 | +2,500.0 | % | 2 | | | | 30 | +3,200.0 | % | |||||||||||||||||||||||||||||||
Total Immunology |
312 | 31 | | 269 | +1,007.4 | % | 12 | | 1 | | 313 | +1,170.4 | % | |||||||||||||||||||||||||||||||
Sanofi Genzyme (Specialty Care) |
3,268 | 985 | +4.9 | % | 1,930 | +36.3 | % | 353 | +27.7 | % | 513 | +13.4 | % | 3,781 | +23.1 | % | ||||||||||||||||||||||||||||
Lantus® |
1,310 | 355 | -9.4 | % | 816 | -32.4 | % | 139 | -7.9 | % | 492 | +4.8 | % | 1,802 | -19.1 | % | ||||||||||||||||||||||||||||
Toujeo® |
349 | 142 | +42.0 | % | 171 | -19.0 | % | 36 | +31.0 | % | 65 | +100.0 | % | 414 | +10.7 | % | ||||||||||||||||||||||||||||
Apidra® |
129 | 70 | +4.5 | % | 40 | -19.6 | % | 19 | +0.0 | % | 54 | +29.2 | % | 183 | +3.1 | % | ||||||||||||||||||||||||||||
Amaryl® |
24 | 8 | -27.3 | % | 1 | +0.0 | % | 15 | -10.5 | % | 146 | +10.6 | % | 170 | +5.8 | % | ||||||||||||||||||||||||||||
Insuman® |
37 | 36 | -10.0 | % | 1 | +0.0 | % | | +0.0 | % | 10 | -20.0 | % | 47 | -12.5 | % | ||||||||||||||||||||||||||||
Lyxumia® |
10 | 7 | -12.5 | % | | | 3 | -20.0 | % | 1 | +0.0 | % | 11 | -14.3 | % | |||||||||||||||||||||||||||||
Soliqua® 100/33 / SuliquaTM |
25 | 2 | | 23 | +188.9 | % | | | 1 | | 26 | +222.2 | % | |||||||||||||||||||||||||||||||
Other |
45 | 28 | -12.5 | % | 7 | | 10 | +22.2 | % | 24 | +2,400 | % | 69 | +69.8 | % | |||||||||||||||||||||||||||||
Total Diabetes |
1,929 | 648 | -0.3 | % | 1,059 | -28.3 | % | 222 | -1.6 | % | 793 | +14.7 | % | 2,722 | -10.9 | % | ||||||||||||||||||||||||||||
Multaq® |
159 | 21 | -4.5 | % | 135 | -1.9 | % | 3 | +100.0 | % | 3 | +0.0 | % | 162 | -1.7 | % | ||||||||||||||||||||||||||||
Praluent® |
107 | 41 | +115.8 | % | 61 | +26.4 | % | 5 | +150.0 | % | 4 | +150.0 | % | 111 | +55.3 | % | ||||||||||||||||||||||||||||
Total Cardiovascular |
266 | 62 | +51.2 | % | 196 | +5.3 | % | 8 | +133.3 | % | 7 | +50.0 | % | 273 | +15.2 | % | ||||||||||||||||||||||||||||
Diabetes & Cardiovascular |
2,195 | 710 | +2.7 | % | 1,255 | -24.6 | % | 230 | +0.0 | % | 800 | +15.0 | % | 2,995 | -9.0 | % | ||||||||||||||||||||||||||||
Lovenox® |
768 | 471 | -5.4 | % | 20 | -24.1 | % | 41 | -4.3 | % | 236 | +9.9 | % | 768 | -1.5 | % | ||||||||||||||||||||||||||||
Plavix® |
761 | 76 | -2.6 | % | | | 110 | -25.3 | % | 575 | +14.6 | % | 761 | +4.6 | % | |||||||||||||||||||||||||||||
Aprovel® / CoAprovel® |
343 | 55 | -8.3 | % | 5 | -16.7 | % | 41 | -50.5 | % | 242 | +15.1 | % | 343 | -4.7 | % | ||||||||||||||||||||||||||||
Depakine® |
230 | 84 | +2.4 | % | | | 7 | -12.5 | % | 139 | +12.0 | % | 230 | +7.6 | % | |||||||||||||||||||||||||||||
Renagel®/Renvela® |
201 | 32 | -13.5 | % | 121 | -67.5 | % | 15 | -10.5 | % | 33 | +59.1 | % | 201 | -55.7 | % | ||||||||||||||||||||||||||||
Synvisc® / Synvisc-One® |
160 | 13 | -23.5 | % | 111 | -22.2 | % | 7 | -12.5 | % | 29 | +43.5 | % | 160 | -14.6 | % | ||||||||||||||||||||||||||||
Allegra® |
80 | 5 | -16.7 | % | | | 75 | -14.6 | % | | | 80 | -14.7 | % | ||||||||||||||||||||||||||||||
Stilnox®/Ambien®/Myslee® |
116 | 20 | +0.0 | % | 22 | -14.3 | % | 42 | -17.5 | % | 32 | +9.4 | % | 116 | -8.0 | % | ||||||||||||||||||||||||||||
Tritace® |
115 | 73 | -6.4 | % | | | 2 | +50.0 | % | 40 | +2.3 | % | 115 | -2.4 | % | |||||||||||||||||||||||||||||
Other |
1,812 | 890 | -2.6 | % | 100 | -2.7 | % | 190 | -12.2 | % | 632 | -0.8 | % | 1,812 | -3.1 | % | ||||||||||||||||||||||||||||
Total Established Prescription Products |
4,586 | 1,719 | -3.9 | % | 379 | -44.1 | % | 530 | -20.0 | % | 1,958 | +8.7 | % | 4,586 | -7.1 | % | ||||||||||||||||||||||||||||
Generics |
837 | 367 | -4.7 | % | 48 | -21.7 | % | 71 | +21.9 | % | 351 | +4.1 | % | 837 | -0.3 | % | ||||||||||||||||||||||||||||
Total Emerging MarketsSpecialty Care |
513 | 513 | +13.4 | % | ||||||||||||||||||||||||||||||||||||||||
Total Emerging MarketsDiabetes & Cardiovascular |
800 | 800 | +15.0 | % | ||||||||||||||||||||||||||||||||||||||||
General Medicines & Emerging Markets |
6,736 | 2,086 | -4.1 | % | 427 | -42.2 | % | 601 | -16.6 | % | 3,622 | +10.2 | % | |||||||||||||||||||||||||||||||
Total Pharmaceuticals |
12,199 | 3,781 | -0.6 | % | 3,612 | -5.4 | % | 1,184 | -3.5 | % | 3,622 | +10.2 | % | 12,199 | +0.5 | % |
(a) | Western Europe and Eastern Europe excluding Eurasia (Russia, Ukraine, Georgia, Belarus, Armenia and Turkey). |
(b) | Japan, South Korea, Canada, Australia, New Zealand and Puerto Rico. |
(c) | World excluding United States, Canada, Western and Eastern Europe (apart from Eurasia), Japan, South Korea, Australia, New Zealand and Puerto Rico. |
68 | Sanofi 2018 HALF-YEAR FINANCIAL REPORT
C.3.5. CONSUMER HEALTHCARE
During 2017, we gradually integrated the Consumer Healthcare operations of Boehringer Ingelheim (BI) into our Consumer Healthcare Global Business Unit (GBU). Following completion of the integration process and with effect from December 31, 2017, we have identified our Consumer Healthcare business as an operating segment. Consequently, the net sales of the Consumer Healthcare business are presented separately below.
Net sales of Consumer Healthcare products for the first half of 2018 were 2,353 million, down 5.3% on a reported basis but up 3.0% at constant exchange rates, driven by Emerging Markets (+12.3% CER, at 801 million) especially Latin America and by the Pain (+9.6% CER, at 628 million) and Digestive (+11.7% CER ,at 496 million) categories.
( million) | June 30, 2018 (6 months) |
June 30, 2017 (6 months)(a) |
Change on a reported basis |
Change at constant exchange |
||||||||||||
Allegra® |
229 | 250 | -8.4 | % | +2.0 | % | ||||||||||
Mucosolvan® |
49 | 46 | +6.5 | % | +13.0 | % | ||||||||||
Other |
302 | 363 | -16.8 | % | -10.7 | % | ||||||||||
Allergy, Cough & Cold |
580 | 659 | -12.0 | % | -4.2 | % | ||||||||||
Doliprane® |
161 | 156 | +3.2 | % | +4.5 | % | ||||||||||
Buscopan® |
104 | 83 | +25.3 | % | +42.2 | % | ||||||||||
Other |
363 | 385 | -5.7 | % | +4.7 | % | ||||||||||
Pain |
628 | 624 | +0.6 | % | +9.6 | % | ||||||||||
Dulcolax® |
109 | 103 | +5.8 | % | +12.6 | % | ||||||||||
Enterogermina® |
94 | 89 | +5.6 | % | +14.6 | % | ||||||||||
Essentiale® |
89 | 85 | +4.7 | % | +11.8 | % | ||||||||||
Zantac® |
62 | 57 | +8.8 | % | +21.1 | % | ||||||||||
Other |
142 | 144 | -1.4 | % | +5.6 | % | ||||||||||
Digestive |
496 | 478 | +3.8 | % | +11.7 | % | ||||||||||
Pharmaton® |
44 | 48 | -8.3 | % | +0.0 | % | ||||||||||
Other |
286 | 304 | -5.9 | % | +2.3 | % | ||||||||||
Nutritionals |
330 | 352 | -6.3 | % | +2.0 | % | ||||||||||
Gold Bond® |
97 | 100 | -3.0 | % | +9.0 | % | ||||||||||
Other |
222 | 273 | -18.7 | % | -11.0 | % | ||||||||||
Other products |
319 | 373 | -14.5 | % | -5.6 | % | ||||||||||
Total Consumer Healthcare |
2,353 | 2,486 | -5.3 | % | +3.0 | % |
(a) | Includes the effects of first-time application of IFRS 15 on revenue recognition (see Note A.1.2. to the condensed half-year consolidated financial statements). |
In Emerging Markets, Consumer Healthcare net sales reached 801 million in the first half, up 12.3% CER, boosted by Pain (+24.9% CER, at 239 million) and Digestive (+20.5% CER, at 211 million), and by strong performances in Brazil and Argentina.
In Europe, 2018 first-half Consumer Healthcare net sales remained stable at 706 million. A decline in sales of products in the Other category (-11.6% CER, at 60 million) was offset by growth for all our other Consumer Healthcare franchises.
Sales of Consumer Healthcare products in the United States totaled 541 million, down 5.3% CER versus the comparable period of 2017. The main franchise affected was Allergy, Cough & Cold (-19.4% CER, at 173 million), reflecting a lower incidence of seasonal allergies and competition from retailer own brands, especially in anti-allergy nasal sprays.
In the Rest of the World region, first-half net sales for the Consumer Healthcare business reached 305 million, up 2.5% CER, driven largely by sales in Japan (+5.6% CER, at 157 million).
2018 HALF-YEAR FINANCIAL REPORT Sanofi | 69
( million) | Total | Europe (a) | Change CER |
United States |
Change CER |
Rest of the world (b) |
Change CER |
Emerging Markets (c) |
Change CER | |||||||||||||||||||||
Allegra® |
229 | 15 | +50.0 | % | 122 | -4.8% | 29 | -3.2% | 63 | +12.5% | ||||||||||||||||||||
Mucosolvan® |
49 | 26 | +4.0 | % | | +0.0% | 1 | +0.0% | 22 | +19.0% | ||||||||||||||||||||
Other |
302 | 126 | -3.1 | % | 51 | -41.2% | 48 | +7.8% | 77 | +1.2% | ||||||||||||||||||||
Allergy, Cough & Cold |
580 | 167 | +1.2 | % | 173 | -19.4% | 78 | +4.9% | 162 | +7.6% | ||||||||||||||||||||
Doliprane® |
161 | 134 | +1.5 | % | | +0.0% | | +0.0% | 27 | +20.8% | ||||||||||||||||||||
Buscopan® |
104 | 39 | +14.7 | % | | +0.0% | 5 | +0.0% | 60 | +69.8% | ||||||||||||||||||||
Other |
363 | 81 | -4.7 | % | 78 | -2.2% | 52 | +5.8% | 152 | +13.3% | ||||||||||||||||||||
Pain |
628 | 254 | +1.2 | % | 78 | -2.2% | 57 | +5.2% | 239 | +24.9% | ||||||||||||||||||||
Dulcolax® |
109 | 50 | +8.7 | % | 31 | +9.7% | 11 | +9.1% | 17 | +33.3% | ||||||||||||||||||||
Enterogermina® |
94 | 35 | -2.8 | % | | +0.0% | | +0.0% | 59 | +24.5% | ||||||||||||||||||||
Essentiale® |
89 | 19 | +0.0 | % | | +0.0% | | -100.0% | 70 | +13.4% | ||||||||||||||||||||
Zantac® |
62 | | +0.0 | % | 55 | +19.2% | 7 | +40.0% | | +0.0% | ||||||||||||||||||||
Other |
142 | 59 | -1.7 | % | 9 | -9.1% | 9 | -23.1% | 65 | +21.7% | ||||||||||||||||||||
Digestive |
496 | 163 | +1.2 | % | 95 | +12.8% | 27 | +7.1% | 211 | +20.5% | ||||||||||||||||||||
Pharmaton® |
44 | 8 | -11.1 | % | | +0.0% | 1 | -100.0% | 35 | +5.3% | ||||||||||||||||||||
Other |
286 | 54 | +3.8 | % | 18 | -9.1% | 122 | +3.1% | 92 | +3.0% | ||||||||||||||||||||
Nutritionals |
330 | 62 | +1.6 | % | 18 | -9.1% | 123 | +2.3% | 127 | +3.6% | ||||||||||||||||||||
Gold Bond® |
97 | | +0.0 | % | 95 | +9.2% | 2 | +0.0% | | +0.0% | ||||||||||||||||||||
Other |
222 | 60 | -11.6 | % | 82 | -4.2% | 18 | -18.2% | 62 | -16.1% | ||||||||||||||||||||
Other products |
319 | 60 | -11.6 | % | 177 | +2.6% | 20 | -16.7% | 62 | -16.1% | ||||||||||||||||||||
Total Consumer Healthcare |
2,353 | 706 | +0.0 | % | 541 | -5.3% | 305 | +2.5% | 801 | +12.3% |
(a) | Western Europe and Eastern Europe excluding Eurasia (Russia, Ukraine, Georgia, Belarus, Armenia and Turkey). |
(b) | Japan, South Korea, Canada, Australia, New Zealand and Puerto Rico. |
(c) | World excluding United States, Canada, Western and Eastern Europe (apart from Eurasia), Japan, South Korea, Australia, New Zealand and Puerto Rico. |
C.3.6. HUMAN VACCINES (VACCINES) SEGMENT
In the first half of 2018, the Vaccines segment reported net sales of 1,522 million, down 15.4% on a reported basis and 9.3% at constant exchange rates. This mainly reflects the expected effect of the constraints on supplies of Pentaxim® in China, plus lower sales of Dengvaxia® (1 million, versus 18 million for the first half of 2017) following the announcement of product label updates in November 2017. Net sales for the Vaccines segment in Emerging Markets were down 16.7% CER at 569 million. In the United States, Vaccines sales were down 12.6% CER, at 524 million. In Europe, sales reached 271 million (+16.2% CER), driven by the Adult Booster Vaccines franchise.
( million) | June 30, 2018 (6 months) |
June 30, 2017(a) (6 months) |
Change on a reported basis |
Change exchange |
||||||||||||
Polio/Pertussis/Hib Vaccines (including Pentacel®, Pentaxim® & Imovax®) |
734 | 901 | -18.5 | % | -12.8 | % | ||||||||||
Meningitis/Pneumonia Vaccines (including Menactra®) |
205 | 290 | -29.3 | % | -22.1 | % | ||||||||||
Adult Booster Vaccines (including Adacel®) |
186 | 194 | -4.1 | % | +2.1 | % | ||||||||||
Travel and Other Endemics Vaccines |
228 | 219 | +4.1 | % | +9.6 | % | ||||||||||
Influenza Vaccines (including Vaxigrip® & Fluzone®) |
127 | 136 | -6.6 | % | +0.7 | % | ||||||||||
Dengvaxia® |
1 | 18 | -94.4 | % | -94.4 | % | ||||||||||
Other vaccines |
41 | 42 | -2.4 | % | +7.1 | % | ||||||||||
Total Vaccines |
1,522 | 1,800 | -15.4 | % | -9.3 | % |
(a) | Includes the effects of first-time application of IFRS 15 on revenue recognition (see Note A.1.2. to the condensed half-year consolidated financial statements). |
Polio/Pertussis/Hib vaccines posted 2018 first-half net sales of 734 million, down 12.8% CER, reflecting constraints on supplies of Pentaxim® in China and tough comparatives in the first half of 2017. Those factors meant that sales for the franchise in Emerging Markets decreased by 21.4% CER to 338 million. Net sales of Polio/Pertussis/Hib vaccines were also lower in the United States (-10.0% CER, at 176 million), due to fluctuations in inventories of Pentacel® and Daptacel®.
Net sales of Meningitis/Pneumonia vaccines totaled 205 million, down 22.1% CER, due mainly to lower sales of Menactra® on a tough 2017 first-half comparative that reflected trends in orders from the CDC in the United States and high sales in Australia following an outbreak of meningitis.
70 | Sanofi 2018 HALF-YEAR FINANCIAL REPORT
Travel and Other Endemics vaccines posted a 9.6% rise in net sales to 228 million in the first half of 2018, driven by growth in sales of the yellow fever vaccine and Typhim®.
First-half 2018 net sales of Adult Booster vaccines were 186 million, up 2.1% CER, reflecting increased sales in Europe (+43.5% CER, at 66 million) as limitations on supplies of Repevax® ended.
Sales of Influenza vaccines were stable at 127 million. Lower sales in Emerging Markets (-7.9% CER, at 98 million) due to delays in deliveries for the vaccination campaign in the southern hemisphere were partly offset by sales growth in other geographies.
2018 first-half Vaccines net sales by geographical region
( million) | Total | Europe (a) | Change CER |
United States |
Change CER |
Rest of World (b) |
Change CER |
Emerging Markets (c) |
Change CER |
|||||||||||||||||||||||||||
Polio/Pertussis/Hib Vaccines (including Pentacel®, Pentaxim® & Imovax®) |
734 | 139 | +0.7 | % | 176 | -10.0 | % | 81 | +4.8 | % | 338 | -21.4 | % | |||||||||||||||||||||||
Meningitis/Pneumonia Vaccines (including Menactra®) |
205 | | -100.0 | % | 157 | -21.0 | % | 7 | -63.6 | % | 41 | -6.3 | % | |||||||||||||||||||||||
Adult Booster Vaccines (including Adacel®) |
186 | 66 | +43.5 | % | 97 | -11.6 | % | 13 | +7.7 | % | 10 | -21.4 | % | |||||||||||||||||||||||
Travel and Other Endemics Vaccines |
228 | 59 | +37.2 | % | 62 | -5.6 | % | 28 | +7.1 | % | 79 | +9.1 | % | |||||||||||||||||||||||
Influenza Vaccines (including Vaxigrip® & Fluzone®) |
127 | 1 | +0.0 | % | 4 | +66.7 | % | 24 | +36.8 | % | 98 | -7.9 | % | |||||||||||||||||||||||
Dengvaxia® |
1 | | | | | | | 1 | -94.4 | % | ||||||||||||||||||||||||||
Other vaccines |
41 | 6 | +20.0 | % | 28 | | 5 | +20.0 | % | 2 | | |||||||||||||||||||||||||
Total Vaccines |
1,522 | 271 | +16.2 | % | 524 | -12.6 | % | 158 | +0.6 | % | 569 | -16.7 | % |
(a) | Western Europe and Eastern Europe excluding Eurasia (Russia, Ukraine, Georgia, Belarus, Armenia and Turkey). |
(b) | Japan, South Korea, Canada, Australia, New Zealand and Puerto Rico. |
(c) | World excluding United States, Canada, Western and Eastern Europe (apart from Eurasia), Japan, South Korea, Australia, New Zealand and Puerto Rico. |
2018 HALF-YEAR FINANCIAL REPORT Sanofi | 71
C.3.7. NET SALES BY GEOGRAPHICAL REGION
( million) | June 30, 2018 (6 months) |
June 30, 2017(a) (6 months) |
Change on a reported basis |
Change at constant exchange |
||||||||||||
United States |
4,677 | 5,562 | -15.9 | % | -6.3 | % | ||||||||||
Emerging Markets (b) |
4,992 | 5,185 | -3.7 | % | +6.8 | % | ||||||||||
- of which Asia (including South Asia(c)) |
1,993 | 1,929 | +3.3 | % | +9.2 | % | ||||||||||
- of which Latin America |
1,298 | 1,406 | -7.7 | % | +8.9 | % | ||||||||||
- of which Africa and Middle East |
1,030 | 1,167 | -11.7 | % | -4.3 | % | ||||||||||
- of which Eurasia (c) |
597 | 617 | -3.2 | % | +14.3 | % | ||||||||||
Europe(e) |
4,758 | 4,761 | -0.1 | % | +0.3 | % | ||||||||||
Rest of the World (f) |
1,647 | 1,816 | -9.3 | % | -2.1 | % | ||||||||||
- of which Japan |
875 | 1,001 | -12.6 | % | -5.4 | % | ||||||||||
- of which South Korea |
206 | 211 | -2.4 | % | +2.8 | % | ||||||||||
Total net sales |
16,074 | 17,324 | -7.2 | % | -0.1 | % |
(a) | Includes the effects of first-time application of IFRS 15 on revenue recognition (see Note A.1.2. to the condensed half-year consolidated financial statements). |
(b) | World excluding United States, Canada, Europe, Japan, South Korea, Australia, New Zealand and Puerto Rico. |
(c) | India, Bangladesh and Sri Lanka. |
(d) | Russia, Ukraine, Georgia, Belarus, Armenia and Turkey. |
(e) | Western Europe and Eastern Europe (excluding Eurasia). |
(f) | Japan, South Korea, Canada, Australia, New Zealand and Puerto Rico. |
2018 first-half net sales in the United States were 4,677 million, down 15.9% on a reported basis and down 6.3% on a constant structure basis and at constant exchange rates. The main factors were lower sales for the Diabetes franchise(-28.3% CER at 1,059 million) and the Established Prescription Products franchise (-44.1% CER, at 379 million, reflecting competition from generics of Renvela®/Renagel®). Those effects were partly offset by the performance of the Rare Blood Disorder franchise (270 million) following the inclusion of Bioverativ in the consolidation with effect from March 9, 2018, and by the Immunology franchise which posted net sales of 269 million with the recent launches of Dupixent® and Kevzara®.
Emerging Markets net sales for the first half of 2018 reached 4,992 million, down 3.7% on a reported basis but up 6.8% CER. All our franchises achieved sales growth in Emerging Markets except for Vaccines (-16.7 CER, at 569 million). The strongest-growing franchises were Multiple Sclerosis (+46.7% CER, at 37 million), Diabetes (+14.7% CER, at 793 million), Rare Diseases (+13.3% CER, at 268 million), Consumer Healthcare (+12.3% CER, at 801 million) and Established Prescription Products (+8.7% CER, at 1,958 million). In Asia, 2018 first-half net sales rose by 9.2% CER to 1,993 million, driven by a solid performance in China (+12.3%, at 1,254 million), despite local constraints affecting supplies of Pentaxim®. In Latin America, net sales for the first half were up 8.9% CER at 1,298 million, driven by Brazil (+7.0% CER, at 541 million), Argentina and Mexico. The best performers in this zone were Consumer Healthcare (+23.6% CER, at 334 million) and Established Prescription Products (+8.5% CER, at 347 million). In the Africa and Middle East region, 2018 first-half net sales amounted to 1,030 million, down 4.3% CER, due largely to the divestment of our majority equity interest in the Maphar site (Morocco) at the end of the second quarter of 2017, in line with our simplification strategy; sales from that business are no longer consolidated by Sanofi. Solid performances in Saudi Arabia (+34.6% CER) and Algeria (+9.0% CER) were dented by lower sales in Morocco (-41.6% CER) and South Africa (-35.6% CER). Net sales in the Eurasia region advanced by 14.3% CER to 597 million in the first half of 2018, the strongest performers being Turkey (+20.0% CER, at 237 million) and Russia (+11.4% CER, at 307 million).
In Europe, first-half net sales were stable year-on-year at 4,758 million. Higher sales for Vaccines (+16,2% CER, at 271 million), the Rare Diseases franchise (+6.8% CER, at 502 million), the Immunology franchise (31 million) and the Cardiovascular franchise (+51.2% CER, at 62 million) were offset by lower sales for Established Prescription Products (-3.9% CER, at 1,719 million) and Multiple Sclerosis (-6.4% CER, at 276 million).
In the Rest of the World region, net sales decreased by 2.1% CER to 1,647 million. In Japan, 2018 first-half net sales were 875 million (-5.4% CER) due to competition from generics of Plavix® and lower sales of Aprovel® and Allegra®, although the effect was partly offset by the performances of the Rare Blood Disorder, Oncology and Immunology franchises.
72 | Sanofi 2018 HALF-YEAR FINANCIAL REPORT
C.4. OTHER INCOME STATEMENT ITEMS
Comparatives for the six months ended June 30, 2017 and the year ended December 31, 2017 have been restated in accordance with the new standard on revenue recognition, IFRS 15, which is applicable from January 1, 2018 onwards. The impacts of those restatements are described in detail in Note A.1.2. to the condensed half-year consolidated financial statements; as well as affecting net sales, they also impact certain other items as discussed below.
The 2017 comparatives also reflect our new segmental reporting model. During 2017, we gradually integrated the Consumer Healthcare activities of Boehringer Ingelheim, which we acquired on January 1, 2017. The integration process having been completed on December 31, 2017, our Consumer Healthcare activities now constitute a separate operating segment. We have also realigned our management reporting structure to reflect changes to our organizational structure that took place in 2017. Consequently, the costs of our global functions (Medical Affairs, External Affairs, Finance, Human Resources, Legal Affairs, Information Solutions & Technologies, Sanofi Business Services, etc.) are now included as reconciling items within the Other segment.
C.4.1. OTHER REVENUES
Other revenues advanced by 2.7% to 533 million in the first half of 2018 (versus 519 million in the first half of 2017). This line item mainly comprises VaxServe sales of non-Sanofi products (397 million, versus 368 million for the first half of 2017, within the Vaccines segment), and revenues under our agreements with Swedish Orphan Biovitrum AB.
C.4.2. GROSS PROFIT
Gross profit amounted to 11,342 million in the first half of 2018, versus 12,172 million a year earlier, a decrease of 6.8%. Gross margin increased year-on-year, representing 70.6% of net sales in the first half of 2018 (versus 70.3% in the first half of 2017).
For the Pharmaceuticals segment, gross margin for the first half of 2018 was 0.3 of a percentage point lower at 74.6%. Good performances from the Immunology, Rare Diseases and Multiple Sclerosis franchises, plus the inclusion of Bioverativ products in the consolidation, failed to offset lower average net prices for insulin glargines in the United States, competition from generics of Renagel®/Renvela®, and unfavorable foreign exchange effects.
Gross margin for the Consumer Healthcare segment rose by 0.5 of a percentage point in the first half of 2018 to 67.6%, thanks largely to a good performance in Emerging Markets.
The Vaccines segment saw gross margin decrease by 2.2 percentage points in the first half of 2018 to 56.0%, largely as a result of restrictions on supplies of Pentaxim® in China.
C.4.3. RESEARCH AND DEVELOPMENT EXPENSES
Research and development expenses (R&D expenses) amounted to 2,755 million in the first half of 2018 (versus 2,667 million in the first half of 2017) and represented 17.1% of net sales (versus 15.4% in the first half of 2017). Overall, R&D expenses increased by 3.3%, mainly due to the acquisitions of Bioverativ and Ablynx and to spending on immuno-oncology and diabetes programs in the Pharmaceuticals segment.
C.4.4. SELLING AND GENERAL EXPENSES
Selling and general expenses were 4,819 million in the first half of 2018 (30.0% of net sales), compared with 5,054 million for the first half of 2017 (29.2% of net sales). The year-on-year decrease of 4.6% was mainly due to exchange rate effects. At constant exchange rates, selling and general expenses increased year-on-year, reflecting the first-time consolidation of Bioverativ and Ablynx and investment in immunology, partly offset by lower spending on Diabetes in the United States, within the Pharmaceuticals segment.
For the Consumer Healthcare segment, 2018 first-half selling and general expenses were 1.9 percentage points lower at 33.5% of net sales, versus 35.4% in the first half of 2017. This was mainly due to synergies realized following the integration of Boehringer Ingelheims Consumer Healthcare business, as well as the reduction in marketing expenses linked to the launch of Xyzal® in the US in March 2017.
C.4.5. OTHER OPERATING INCOME AND EXPENSES
Other operating income amounted to 323 million in the first half of 2018 (versus 173 million in the first half of 2017), and Other operating expenses to 165 million (versus 71 million in the first half of 2017).
2018 HALF-YEAR FINANCIAL REPORT Sanofi | 73
Overall, other operating income and expenses represented a net gain of 158 million in the first half of 2018, compared with a net gain of 102 million a year earlier, a net year-on-year improvement of 56 million.
( million) | June 30, 2018 |
June 30, 2017 |
Change | |||||||||
Other operating income |
323 | 173 | +150 | |||||||||
Other operating expenses |
(165 | ) | (71 | ) | -94 | |||||||
Other operating income/(expenses), net |
158 | 102 | +56 |
The overall year-on-year improvement of 56 million mainly reflected gains on disposals relating to ongoing operations (226 million in the first half of 2018, versus 57 million in the first half of 2017), arising on the divestment of some mature products in Latin America and certain Consumer Healthcare products in Europe. The effect was partly offset by a decrease in income from our pharmaceutical alliance partners (-57 million in the first half of 2018, +27 million in the first half of 2017), mainly relating to Regeneron following the launch of Dupixent® and Kevzara®, and by costs relating to the acquisitions of Bioverativ and Ablynx (recorded in Other for segmental reporting purposes).
C.4.6. AMORTIZATION OF INTANGIBLE ASSETS
Amortization charged against intangible assets in the first half of 2018 was 999 million, versus 990 million in the comparable period of 2017. This 9 million increase was due to (i) an increase in amortization expense generated by the intangible assets recognized in connection with the acquisitions of Bioverativ and Protein Sciences (161 million and 29 million, respectively), partly offset by reductions in amortization expense due to life cycle effects on assets recognized on the acquisitions of Genzyme (385 million in the first half of 2018, versus 458 million in the first half of 2017) and Aventis (145 million in the first half of 2018, versus 204 million in the first half of 2017).
C.4.7. IMPAIRMENT OF INTANGIBLE ASSETS
The results of impairment tests on other intangible assets led to the recognition of an impairment loss of 101 million in the first half of 2018, mainly on Lemtrada®, a product marketed in the United States.
In the first half of 2017 this line item showed an impairment loss of 12 million, mainly comprising a write-down of rights relating to the marketed product Leukine®.
C.4.8. FAIR VALUE REMEASUREMENT OF CONTINGENT CONSIDERATION
Fair value remeasurements of contingent consideration relating to acquisitions (in accordance with the revised IFRS 3) represented a net gain of 10 million in the first half of 2018 versus a net expense of 100 million in the first half of 2017. These remeasurements mainly relate to the contingent value rights (CVRs) issued in connection with the acquisition of Genzyme (23 million expense) and to contingent consideration payable to Bayer as a result of an acquisition made by Genzyme prior to the latters acquisition by Sanofi (gain of 33 million in the first half of 2018, versus expense of 84 million in the first half of 2017). See Note B.11. to our condensed half-year consolidated financial statements.
C.4.9. RESTRUCTURING COSTS AND SIMILAR ITEMS
Restructuring costs and similar items amounted to a charge of 607 million in the first half of 2018, compared with a charge of 364 million in the first half of 2017. Restructuring costs in the first half of 2018 mainly reflect (i) write-downs of industrial assets in the United States; (ii) employee-related expenses associated with headcount adjustment plans in Japan and Europe; and (iii) the costs of transferring the infectious diseases early stage R&D pipeline and research unit. Those transfer costs amount to 253 million and primarily consist of payments to Evotec over a five-year period, including an upfront payment of 60 million on finalization of the agreement in early July 2018.
C.4.10. OTHER GAINS AND LOSSES, AND LITIGATION
In the first half of 2018, the line item Other gains and losses, and litigation shows an expense of 67 million for separation costs associated with the process of disinvesting from the Generics business in Europe, before tax effects.
74 | Sanofi 2018 HALF-YEAR FINANCIAL REPORT
C.4.11. OPERATING INCOME
Operating income for the first half of 2018 was 2,162 million, 29.8% lower than the 2017 first-half figure of 3,080 million. This year-on-year change mainly reflects unfavorable foreign exchange effects on gross profit, including unfavorable foreign exchange effects on net sales.
C.4.12. FINANCIAL INCOME AND EXPENSES
Net financial expenses were 105 million for the first half of 2018, 18 million lower than the 2017 first-half figure of 123 million.
Financial expenses directly related to our debt, net of cash and cash equivalents (see the definition in Section C.5. below) increased slightly to 114 million, versus 110 million in the first half of 2017.
Other factors underlying the year-on-year change in net financial expense were:
| foreign exchange losses of 20 million, compared with foreign exchange gains of 1 million in the first half of 2017; |
| a higher level of gains on disposals of non-current financial assets (63 million, versus 52 million for the first half of 2017); and |
| a reduction in the net interest cost on pension plans (36 million, versus 47 million for the first half of 2017). |
C.4.13. INCOME BEFORE TAX AND INVESTMENTS ACCOUNTED FOR USING THE EQUITY METHOD
Income before tax and investments accounted for using the equity method for the first half of 2018 was 2,057 million, compared with 2,957 million for the first half of 2017, a decrease of 30.4%.
C.4.14. INCOME TAX EXPENSE
Income tax expense represented 297 million in the first half of 2018, versus 612 million in the first half of 2017, giving an effective tax rate (based on consolidated net income) of 14.4%, compared with 20.7% in the first half of 2017. The decrease in the effective tax rate can be attributed to Sanofis revised estimates in 2018 of direct and indirect impacts of the US tax reform (the Tax Cuts and Jobs Act of 2017). The effects of the US tax reform were based on a preliminary analysis of the Tax Cuts and Jobs Act of 2017. As more detailed information has become available adjustments have been made accordingly to reflect the progress of our analysis. In addition, 2017 included the additional 3% levy on dividends paid out in cash, which was annulled following the French Constitutional Council ruling of October 6, 2017.
Changes in the level of income tax expense are also significantly impacted by the tax effects of the amortization and impairment of intangible assets (275 million in the first half of 2018, versus 349 million in the first half of 2017) and of restructuring costs (183 million in the first half of 2018, versus 126 million in the first half of 2017).
The effective tax rate on our business net income is a non-GAAP financial measure. It is calculated on the basis of business operating income, minus net financial expenses and before (i) the share of profit/loss from investments accounted for using the equity method and (ii) net income attributable to non-controlling interests. We believe the presentation of this measure, used by our management, is also useful for investors as it provides a means to analyze the effective tax cost of our current business activities. It should not be seen as a substitute for the effective tax rate based on consolidated net income.
When calculated on business net income, our effective tax rate was 22% in the first half of 2018, compared with 24.5% in the first half of 2017 and 23.5 % for 2017 as a whole. The main impacts on this tax rate are the US tax reform (as explained above in our analysis of the change in the effective tax rate based on consolidated net income), as well as the geographical mix of the profits of Sanofi entities and the tax effects of the elimination of intragroup margin on inventory.
C.4.15. SHARE OF PROFIT/(LOSS) OF INVESTMENTS ACCOUNTED FOR USING THE EQUITY METHOD
Investments accounted for using the equity method contributed net income of 75 million in the first half of 2018, versus net income of 27 million in the comparable period of 2017. This line item mainly comprises our share of the profits and losses of Regeneron, which represented net income of 68 million in the first half of 2018 and 33 million in the first half of 2017.
2018 HALF-YEAR FINANCIAL REPORT Sanofi | 75
C.4.16. NET INCOME EXCLUDING THE EXCHANGED/HELD-FOR-EXCHANGE ANIMAL HEALTH BUSINESS
Net income excluding the exchanged/held-for-exchange Animal Health business amounted to 1,835 million in the first half of 2018, versus 2,372 million in the first half of 2017.
C.4.17. NET INCOME/(LOSS) OF THE EXCHANGED/HELD-FOR-EXCHANGE ANIMAL HEALTH BUSINESS
In accordance with IFRS 5, the net income or loss of the Animal Health business is presented within a separate line item, Net income/(loss) of the exchanged/held-for-exchange Animal Health business, for 2017. On January 2, 2017, Sanofi and Boehringer Ingelheim (BI) confirmed that they had finalized the strategic transaction agreed in June 2016, involving the exchange of Sanofis Animal Health business (Merial) for BIs Consumer Healthcare business. Consequently, for the first half of 2017 this line item shows the gain of 4,421 million on the divestment of the Animal Health business, net of taxes and before the impact of price adjustments and delayed business transfers.
C.4.18. NET INCOME
Net income amounted to 1,835 million in the first half of 2018, versus 6,793 million in the first half of 2017.
C.4.19. NET INCOME ATTRIBUTABLE TO NON-CONTROLLING INTERESTS
Net income attributable to non-controlling interests for the first half of 2018 was 57 million, against 64 million for the first half of 2017. This line item mainly comprises the share of pre-tax profits paid to BMS from territories managed by Sanofi (42 million, versus 43 million in the first half of 2017); the year-on-year decrease was directly related to competition from generics of clopidogrel (the active ingredient of Plavix®) and of irbesartan (the active ingredient of Aprovel®) in Europe.
C.4.20. NET INCOME ATTRIBUTABLE TO EQUITY HOLDERS OF SANOFI
Net income attributable to equity holders of Sanofi amounted to 1,778 million in the first half of 2018, compared with 6,729 million in the first half of 2017.
Basic earnings per share (EPS) was 1.42, compared with 5.34 for the first half of 2017, based on an average number of shares outstanding of 1,247.8 million for the first half of 2018 and 1,260.3 million for the first half of 2017. Diluted EPS was also 1.42, compared with 5.30 for the first half of 2017, based on an average number of shares after dilution of 1,254.9 million for the first half of 2018 and 1,270.6 million for the first half of 2017.
76 | Sanofi 2018 HALF-YEAR FINANCIAL REPORT
C.5. SEGMENT RESULTS
Business operating income (as defined in Note B.20.1. to the condensed half-year consolidated financial statements) amounted to 4,126 million in the first half of 2018 versus 4,734 million in the first half of 2017, a decrease of 12.8%. It represented 25.7% of net sales, compared with 27.3% in the first half of 2017.
The comparatives for the year ended December 31, 2017 and the six months ended June 30, 2017 as presented below reflect (i) the impact of the first-time application of IFRS 15 (see Note A.1.2. to our condensed half-year consolidated financial statements) and our new segmental reporting model (see Section C.1.1. of this Half-Year Management Report).
The table below shows business operating income for the six-month periods ended June 30, 2018 and 2017:
( million) | June 30, 2018 (6 months) |
June 30, 2017 (6 months)(a) |
Change | |||||||||
Pharmaceuticals segment |
4,572 | 5,019 | -8.9 | % | ||||||||
Consumer Healthcare segment |
820 | 782 | +4.9 | % | ||||||||
Vaccines segment |
258 | 424 | -39.2 | % | ||||||||
Other |
(1,524 | ) | (1,491 | ) | -2.2 | % | ||||||
Business operating income |
4,126 | 4,734 | -12.8 | % |
(a) | Includes the effects of first-time application of IFRS 15 on revenue recognition (see Note A.1.2. to our condensed half-year consolidated financial statements), and of the presentation of segment data using Sanofis new segmental reporting model. |
The following tables present our segment results for the first half of 2018, the first half of 2017, and the year ended December 31, 2017:
First half of 2018
June 30, 2018 (6 months) | ||||||||||||||||||||
( million) | Pharmaceuticals | Consumer Healthcare |
Vaccines | Other | Total | |||||||||||||||
Net sales |
12,199 | 2,353 | 1,522 | | 16,074 | |||||||||||||||
Other revenues |
134 | | 399 | | 533 | |||||||||||||||
Cost of sales |
(3,230 | ) | (763 | ) | (1,068 | ) | (105 | ) | (5,166 | ) | ||||||||||
Research and development expenses |
(2,113 | ) | (58 | ) | (268 | ) | (316 | ) | (2,755 | ) | ||||||||||
Selling and general expenses |
(2,648 | ) | (788 | ) | (326 | ) | (1,047 | ) | (4,809 | ) | ||||||||||
Other operating income and expenses |
132 | 82 | | (56 | ) | 158 | ||||||||||||||
Share of profit/(loss) of investments accounted for using the equity method |
150 | | (1 | ) | | 149 | ||||||||||||||
Net income attributable to non-controlling interests |
(52 | ) | (6 | ) | | | (58 | ) | ||||||||||||
Business operating income |
4,572 | 820 | 258 | (1,524 | ) | 4,126 |
First half of 2017(a)
June 30, 2017 (6 months) | ||||||||||||||||||||
( million) | Pharmaceuticals | Consumer Healthcare |
Vaccines | Other | Total | |||||||||||||||
Net sales |
13,038 | 2,486 | 1,800 | | 17,324 | |||||||||||||||
Other revenues |
148 | | 370 | 1 | 519 | |||||||||||||||
Cost of sales |
(3,419 | ) | (818 | ) | (1,123 | ) | (135 | ) | (5,495 | ) | ||||||||||
Research and development expenses |
(1,999 | ) | (52 | ) | (260 | ) | (356 | ) | (2,667 | ) | ||||||||||
Selling and general expenses |
(2,807 | ) | (880 | ) | (363 | ) | (1,004 | ) | (5,054 | ) | ||||||||||
Other operating income and expenses |
41 | 57 | 1 | 3 | 102 | |||||||||||||||
Share of profit/(loss) of investments accounted for using the equity method |
71 | | (1 | ) | | 70 | ||||||||||||||
Net income attributable to non-controlling interests |
(54 | ) | (11 | ) | | | (65 | ) | ||||||||||||
Business operating income |
5,019 | 782 | 424 | (1,491 | ) | 4,734 |
(a) | Includes the effects of first-time application of IFRS 15 on revenue recognition (see Note A.1.2. to our condensed half-year consolidated financial statements), and of the presentation of segment data using Sanofis new segmental reporting model. |
2018 HALF-YEAR FINANCIAL REPORT Sanofi | 77
Full year 2017(a)
December 31, 2017 (12 months) | ||||||||||||||||||||
( million) | Pharmaceuticals | Consumer Healthcare |
Vaccines | Other | Total | |||||||||||||||
Net sales |
25,173 | 4,798 | 5,101 | | 35,072 | |||||||||||||||
Other revenues |
287 | | 862 | | 1,149 | |||||||||||||||
Cost of sales |
(6,766 | ) | (1,612 | ) | (2,798 | ) | (271 | ) | (11,447 | ) | ||||||||||
Research and development expenses |
(4,056 | ) | (123 | ) | (557 | ) | (736 | ) | (5,472 | ) | ||||||||||
Selling and general expenses |
(5,649 | ) | (1,645 | ) | (728 | ) | (2,050 | ) | (10,072 | ) | ||||||||||
Other operating income and expenses |
34 | 94 | (107 | ) | (17 | ) | 4 | |||||||||||||
Share of profit/(loss) of investments accounted for using the equity method |
212 | 1 | 1 | | 214 | |||||||||||||||
Net income attributable to non-controlling interests |
(110 | ) | (15 | ) | | | (125 | ) | ||||||||||||
Business operating income |
9,125 | 1,498 | 1,774 | (3,074 | ) | 9,323 |
(a) | Includes the effects of first-time application of IFRS 15 on revenue recognition (see Note A.1.2. to our condensed half-year consolidated financial statements), and of the presentation of segment data using Sanofis new segmental reporting model. |
Pharmaceuticals segment first-half business operating income, 2018 and 2017 (a)
( million) | June 30, (6 months) |
as % of net sales |
June 30, (6 months)(a) |
as % of net sales |
Change | |||||||||||||||
Net sales |
12,199 | 100.0 | % | 13,038 | 100.0 | % | -6.4 | % | ||||||||||||
Other revenues |
134 | 1.1 | % | 148 | 1.1 | % | -9.5 | % | ||||||||||||
Cost of sales |
(3,230 | ) | (26.5 | )% | (3,419 | ) | (26.2 | )% | -5.5 | % | ||||||||||
Gross profit |
9,103 | 74.6 | % | 9,767 | 74.9 | % | -6.8 | % | ||||||||||||
Research and development expenses |
(2,113 | ) | (17.3 | )% | (1,999 | ) | (15.3 | )% | +5.7 | % | ||||||||||
Selling and general expenses |
(2,648 | ) | (21.7 | )% | (2,807 | ) | (21.5 | )% | -5.7 | % | ||||||||||
Other operating income and expenses |
132 | 41 | ||||||||||||||||||
Share of profit/(loss) of investments accounted for using the equity method |
150 | 71 | ||||||||||||||||||
Net income attributable to non-controlling interests |
(52 | ) | (54 | ) | ||||||||||||||||
Business operating income |
4,572 | 37.5 | % | 5,019 | 38.5 | % | -8.9 | % |
(a) | Includes the effects of first-time application of IFRS 15 on revenue recognition (see Note A.1.2. to our condensed half-year consolidated financial statements), and of the presentation of segment data using Sanofis new segmental reporting model. |
Consumer Healthcare segment first-half business operating income, 2018 and 2017 (a)
( million) | June 30, (6 months) |
as % of net sales |
June 30, (6 months)(a) |
as % of net sales |
Change | |||||||||||||||
Net sales |
2,353 | 100.0 | % | 2,486 | 100.0 | % | -5.3 | % | ||||||||||||
Other revenues |
| | | | | |||||||||||||||
Cost of sales |
(763 | ) | (32.4 | )% | (818 | ) | (32.9 | )% | -6.7 | % | ||||||||||
Gross profit |
1,590 | 67.6 | % | 1,668 | 67.1 | % | -4.7 | % | ||||||||||||
Research and development expenses |
(58 | ) | (2.5 | )% | (52 | ) | (2.1 | )% | +11.5 | % | ||||||||||
Selling and general expenses |
(788 | ) | (33.5 | )% | (880 | ) | (35.4 | )% | -10.5 | % | ||||||||||
Other operating income and expenses |
82 | 57 | ||||||||||||||||||
Share of profit/(loss) of investments accounted for using the equity method |
| | ||||||||||||||||||
Net income attributable to non-controlling interests |
(6 | ) | (11 | ) | ||||||||||||||||
Business operating income |
820 | 34.8 | % | 782 | 31.5 | % | +4.9 | % |
(a) | Includes the effects of first-time application of IFRS 15 on revenue recognition (see Note A.1.2. to our condensed half-year consolidated financial statements), and of the presentation of segment data using Sanofis new segmental reporting model. |
78 | Sanofi 2018 HALF-YEAR FINANCIAL REPORT
Vaccines segment first-half business operating income, 2018 and 2017 (a)
( million) | June 30, (6 months) |
as % of net sales |
June 30, (6 months)(a) |
as % of net sales |
Change | |||||||||||||||
Net sales |
1,522 | 100 | % | 1,800 | 100.0 | % | -15.4 | % | ||||||||||||
Other revenues |
399 | 26.2 | % | 370 | 20.6 | % | +7.8 | % | ||||||||||||
Cost of sales |
(1,068 | ) | (70.2 | )% | (1,123 | ) | (62.4 | )% | -4.9 | % | ||||||||||
Gross profit |
853 | 56.0 | % | 1,047 | 58.2 | % | -18.5 | % | ||||||||||||
Research and development expenses |
(268 | ) | (17.6 | )% | (260 | ) | (14.4 | )% | +3.1 | % | ||||||||||
Selling and general expenses |
(326 | ) | (21.4 | )% | (363 | ) | (20.2 | )% | -10.2 | % | ||||||||||
Other operating income and expenses |
| 1 | ||||||||||||||||||
Share of profit/(loss) of investments accounted for using the equity method |
(1 | ) | (1 | ) | ||||||||||||||||
Net income attributable to non-controlling interests |
| | ||||||||||||||||||
Business operating income |
258 | 17.0 | % | 424 | 23.6 | % | -39.2 | % |
(a) | Includes the effects of first-time application of IFRS 15 on revenue recognition (see Note A.1.2. to our condensed half-year consolidated financial statements), and of the presentation of segment data using Sanofis new segmental reporting model. |
2018 HALF-YEAR FINANCIAL REPORT Sanofi | 79
C.6. CONSOLIDATED STATEMENTS OF CASH FLOWS
Summarized consolidated statements of cash flows
( million) | June 30, 2018 (6 months) |
June 30, 2017 (6 months) |
December 31, 2017 (12 months) |
|||||||||
Net cash provided by/(used in) operating activities |
1,773 | 2,556 | 7,379 | |||||||||
Net cash provided by/(used in) investing activities |
(13,085 | ) | (1,062 | ) | (2,896 | ) | ||||||
Net cash inflow from the exchange of the Animal Health business for BIs Consumer Healthcare business |
5 | 4,349 | 3,535 | |||||||||
Net cash provided by/(used in) financing activities |
8,494 | (5,192 | ) | (7,902 | ) | |||||||
Impact of exchange rates on cash and cash equivalents |
(9 | ) | (47 | ) | (74 | ) | ||||||
Net change in cash and cash equivalents |
(2,822 | ) | 604 | 42 |
Net cash provided by operating activities came to 1,773 million in the first half of 2018, against 2,556 million in the first half of 2017.
Operating cash flow before changes in working capital for the first half of 2018 was 3,281 million, versus 3,835 million in the first half of 2017. Working capital requirements rose by 1,507 million in the first half of 2018, as opposed to an increase of 1,279 million in the first half of 2017, mainly as a result of movements in other current assets, current financial assets and other current liabilities (1,232 million).
Net cash used in investing activities totaled 13,085 million in the first half of 2018, compared with 1,062 million in the first half of 2017.
Acquisitions of property, plant and equipment and intangible assets totaled 823 million, versus 998 million in the first half of 2017. There were 641 million of acquisitions of property, plant and equipment, most of which (426 million) were in the Pharmaceuticals segment, primarily in industrial facilities . The Vaccines segment accounted for 153 million of acquisitions of property, plant and equipment during the period. Acquisitions of intangible assets (182 million, versus 360 million in the first half of 2017) mainly comprised contractual payments for intangible rights under license and collaboration agreements.
Acquisitions of investments during the first half of 2018 totaled 12,816 million, net of the cash of acquired entities and after including assumed liabilities and commitments; this compares with 426 million in the first half of 2017. The main acquisitions in the first half of 2018 were Bioverativ (8,932 million) and Ablynx (3,642 million).
After-tax proceeds from disposals amounted to 486 million in the first half of 2018, and arose mainly from the sale of some Consumer Healthcare products to Cooper-Vemedia (139 million), the divestment of equity interests in Impact Therapeutics (94 million) and the divestment of some mature products in Latin America (44 million). In the first half of 2017, after-tax proceeds from disposals amounted to 440 million, and arose mainly from the sale of some Consumer Healthcare products to Ipsen (83 million) and the divestment of the equity interest in SPMSD (127 million).
Net cash inflow from the exchange of the Animal Health business for BIs Consumer Healthcare business comprises the following items for 2017: (i) the receipt by Sanofi of a balancing cash payment of 4,207 million; (ii) reimbursements of intragroup accounts with Merial entities totaling 967 million; (iii) the 1,784 million payment of the tax due on the gain arising on the divestment; and (iv) the cash held by the BI subsidiaries acquired by Sanofi. After taking account of final enterprise value adjustments, the total consideration for the businesses effectively transferred in 2017 was 10,557 million for the sale of the Animal Health business to BI, and 6,239 million for the acquisition of BIs Consumer Healthcare business (see Note D.1. to the consolidated financial statements for the year ended December 31, 2017).
Net cash provided by/used in financing activities represented a net cash inflow of 8,494 million in the first half of 2018, compared with a net outflow of 5,192 million in the first half of 2017. The 2018 first-half figure includes the dividend payout to our shareholders of 3,773 million (versus 3,710 million in the first half of 2017), and the effect of changes in our share capital (repurchases of own shares, net of capital increases), amounting to 711 million (versus 1,601 million in the first half of 2017).
The net change in cash and cash equivalents in the first half of 2018 was a decrease of 2,822 million, compared with an increase of 604 million in the first half of 2017.
80 | Sanofi 2018 HALF-YEAR FINANCIAL REPORT
C.7. CONSOLIDATED BALANCE SHEET
Total assets were 112,778 million as of June 30, 2018, compared with 99,813 million as of December 31, 2017, an increase of 12,965 million.
Our debt, net of cash and cash equivalents was 21,278 million as of June 30, 2018, compared with 5,229 million as of December 31, 2017. We believe the presentation of this non-GAAP financial indicator, which is reviewed by our management, provides useful information to measure our overall liquidity and capital resources. We define debt, net of cash and cash equivalents as (i) the sum total of short term debt, long term debt, and interest rate derivatives and currency derivatives used to hedge debt, minus (ii) the sum total of cash and cash equivalents and interest rate derivatives and currency derivatives used to hedge cash and cash equivalents.
( million) | June 30, 2018 |
December 31, 2017 |
||||||
Long-term debt |
22,788 | 14,326 | ||||||
Short-term debt and current portion of long-term debt |
6,153 | 1,275 | ||||||
Interest rate and currency derivatives used to hedge debt |
(170 | ) | (57 | ) | ||||
Cash and cash equivalents |
(7,493 | ) | (10,315 | ) | ||||
Debt, net of cash and cash equivalents |
21,278 | 5,229 | ||||||
Total equity |
56,361 | 58,239 | ||||||
Gearing ratio |
37.8 | % | 9.0 | % |
To assess our financing risk, we use the gearing ratio, another non-GAAP financial measure. This ratio (which we define as the ratio of debt, net of cash and cash equivalents, to total equity) increased from 9.0% as of December 31, 2017 to 37.8% as of June 30, 2018. Analyses of our debt as of June 30, 2018 and December 31, 2017 are provided in Note B.9. to the condensed half-year consolidated financial statements. We expect that the future cash flows generated by our operating activities will be sufficient to repay our debt. The financing arrangements in place as of June 30, 2018 at the Sanofi parent company level are not subject to covenants regarding financial ratios and do not contain any clauses linking credit spreads or fees to Sanofis credit rating.
Other key movements in the balance sheet are described below.
Total equity was 56,361 million as of June 30, 2018, versus 58,239 million as of December 31, 2017. The year-on-year change reflects the following principal factors:
| increases: our net income for the first half of 2018 (1,835 million) and movements in currency translation differences (804 million, mainly on the US dollar); and |
| decreases: the dividend payout to our shareholders (3,773 million), and repurchases of our own shares (729 million). |
As of June 30, 2018 we held 2.0 million of our own shares, recorded as a deduction from equity and representing 0.16% of our share capital.
Goodwill and Other intangible assets (67,264 million in total) rose by 13,920 million year-on-year, the main factors being:
| increases: movements related to the acquisitions of Bioverativ (2,640 million of goodwill and 8,154 million of other intangible assets) and Ablynx (2,301 million of goodwill and 1,689 million of other intangible assets); and |
| decreases: amortization and impairment charged during the period (1,163 million). |
Investments accounted for using the equity method (2,964 million) increased by 117 million.
Other non-current assets were 231 million lower at 3,133 million. The main movement during the year was a decrease in the market value of the equity investment in Alnylam (225 million).
Net deferred tax assets were 694 million as of June 30, 2018 versus 2,686 million as of December 31, 2017, a decrease of 1,992 million. This mainly reflects deferred taxes arising on the remeasurement of acquired intangible assets (2,235 million).
Non-current provisions and other non-current liabilities (8,949 million) decreased by 205 million, mainly due to a reduction in provisions for pensions and other post-employment benefits.
Liabilities related to business combinations and to non-controlling interests increased by 99 million to 1,468 million. The main reason for changes in this item is the impact of new transactions (228 million), partly offset by contingent consideration payable to Bayer as a result of an acquisition made by Genzyme prior to the latters acquisition by Sanofi.
2018 HALF-YEAR FINANCIAL REPORT Sanofi | 81
D/ RISK FACTORS AND RELATED PARTY TRANSACTIONS
D.1. RISK FACTORS
The risk factors to which Sanofi is exposed are described in our Annual Report on Form 20-F for the year ended December 31, 2017, filed with the US Securities and Exchange Commission on March 7, 2018. The nature of those risks has not significantly changed during the first half of 2018. With respect to data protection laws referred to under the Claims and investigations relating to compliance, competition law, marketing practices, pricing, data privacy and other legal matters could adversely affect our business, results of operations and financial condition risk factor in our Annual Report, the General Data Protection Regulation (GDPR) has created a range of new compliance obligations since it came into force within the European Union in May 2018. Violations of the GDPR carry financial risks due to penalties for data breach or improper processing of personal data (including a possible fine of up to 4% of total worldwide annual turnover for the preceding financial year for the most serious infringements) and may also harm our reputation. Also some uncertainty remains around the legal and regulatory environment for these evolving privacy and data protection laws. All those risk factors may materialize during the second half of 2018 or during subsequent periods.
D.2. RELATED-PARTY TRANSACTIONS
Our principal related parties are defined in Note D.33. to the consolidated financial statements included at item 18 of our Annual Report on Form 20-F for the year ended December 31, 2017 (page F-101)1.
Note B.5. to the condensed half-year consolidated financial statements provides a description of the principal transactions and balances for the six months ended June 30, 2018 with equity-accounted entities that qualify as related parties.
Sanofi did not enter into any transactions with key management personnel during the first half of 2018.
Financial relations with the Groups principal shareholders fall within the ordinary course of business and were immaterial in the first half of 2018.
E/ OUTLOOK
At constant exchange rates, we expect growth in 2018 full-year business earnings per share2 (EPS) to be in a range from +3% to +5%, including the contribution from the Bioverativ and Ablynx acquisitions and barring major unforeseen adverse events. The impact of exchange rates on 2018 business EPS is estimated to be approximately -6%, based on July 2018 average exchange rates applied over the rest of the year.
Full-year business net income2 for 2017 was 6,943 million, giving business earnings per share of 5.523.
This guidance has been prepared using accounting methods consistent with those used in the preparation of our historical financial information. It draws upon assumptions defined by Sanofi and its subsidiaries, in particular regarding the following factors:
| growth in the national markets in which we operate; |
| healthcare reimbursement policies, pricing reforms, and other governmental measures affecting the pharmaceutical industry; |
| developments in the competitive environment, in terms of innovative products and the introduction of generics; |
| respect by others for our intellectual property rights; |
| progress on our research and development programs; |
| the impact of our operating cost control policy, and trends in our operating costs; |
| trends in exchange rates and interest rates; |
| the integration of contributions from our acquisitions; and |
| the average number of shares outstanding. |
Some of the information, assumptions and estimates concerned are derived from or based, in whole or in part, on judgments and decisions made by Sanofi management that may be liable to change or adjustment in future.
1 | This report is available on our corporate website: www.sanofi.com. |
2 | For a definition, see Section C.2., Business net income above. |
3 | Includes the effects of first-time application of IFRS 15 on revenue recognition (see Note A.1.2. to the condensed half-year consolidated financial statements). |
82 | Sanofi 2018 HALF-YEAR FINANCIAL REPORT
FORWARD-LOOKING STATEMENTS
This document contains forward-looking statements as defined in the US Private Securities Litigation Reform Act of 1995, as amended. Forward-looking statements are statements that are not historical facts. These statements include projections and estimates and their underlying assumptions, statements regarding plans, objectives, intentions and expectations with respect to future financial results, events, operations, services, product development and potential, and statements regarding future performance. Forward-looking statements are generally identified by the words expects, anticipates, believes, intends, estimates, plans and similar expressions. Although Sanofis management believes that the expectations reflected in such forward-looking statements are reasonable, investors are cautioned that forward-looking information and statements are subject to various risks and uncertainties, many of which are difficult to predict and generally beyond the control of Sanofi, that could cause actual results and developments to differ materially from those expressed in, or implied or projected by, the forward-looking information and statements.
These risks and uncertainties include among other things, the uncertainties inherent in research and development, future clinical data and analysis including post marketing, decisions by regulatory authorities such as the FDA or the EMA regarding whether and when to approve any drug, device or biological application that may be filed for any such product candidates as well as their decisions regarding labeling and other matters that could affect the availability or commercial potential of such product candidates, the absence of guarantee that the product candidates if approved will be commercially successful, the future approval and commercial success of therapeutic alternatives, Sanofis ability to benefit from external growth opportunities and/or obtain regulatory clearances, risks associated with intellectual property and current and future intellectual property litigation and the outcome thereof, trends in exchange rates and prevailing interest rates, the instability of economic conditions, the impact of cost containment initiatives and subsequent changes thereto, and the average number of shares outstanding, as well as those discussed or identified in the public filings with the Securities and Exchange Commission (SEC) and the Autorité des marchés financiers (AMF) made by Sanofi, including those listed under Risk Factors1 and Cautionary Statement Regarding Forward-Looking Statements in Sanofis annual report on Form 20-F for the year ended December 31, 2017. For an update on litigation, refer to Note B.14. Legal and arbitration proceedings to our condensed half-year consolidated financial statements for the six months ended June 30, 2018, and to section A.4.2. Legal and arbitration proceedings and section D/ Risk factors and related party transactions on pages 54 and 82 respectively of our half-year management report.
Other than as required by applicable law, Sanofi does not undertake any obligation to update or revise any forward-looking information or statements.
1 | See pages 4 to 18 of our 2017 Annual Report on Form 20-F, available on our corporate website: www.sanofi.com |
2018 HALF-YEAR FINANCIAL REPORT Sanofi | 83
F/ APPENDIX RESEARCH AND DEVELOPMENT PIPELINE
O : Opt-in rights products for which rights have not been exercised yet
R : Registrational Study (other than Phase 3)
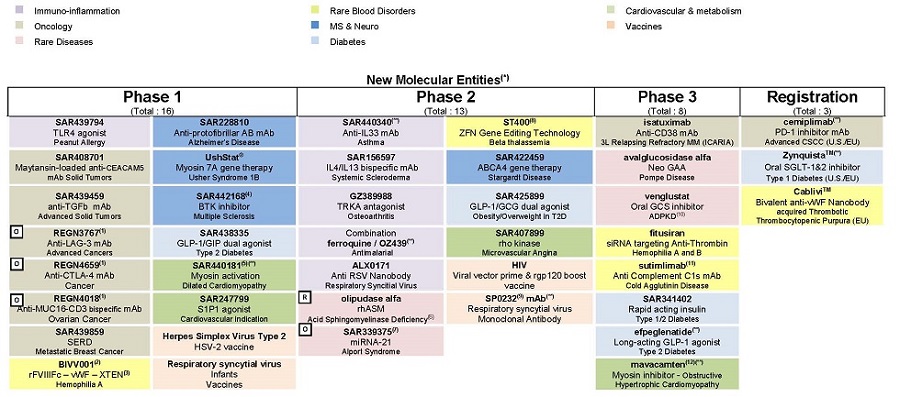
84 | Sanofi 2018 HALF-YEAR FINANCIAL REPORT
Additional Indications(*)
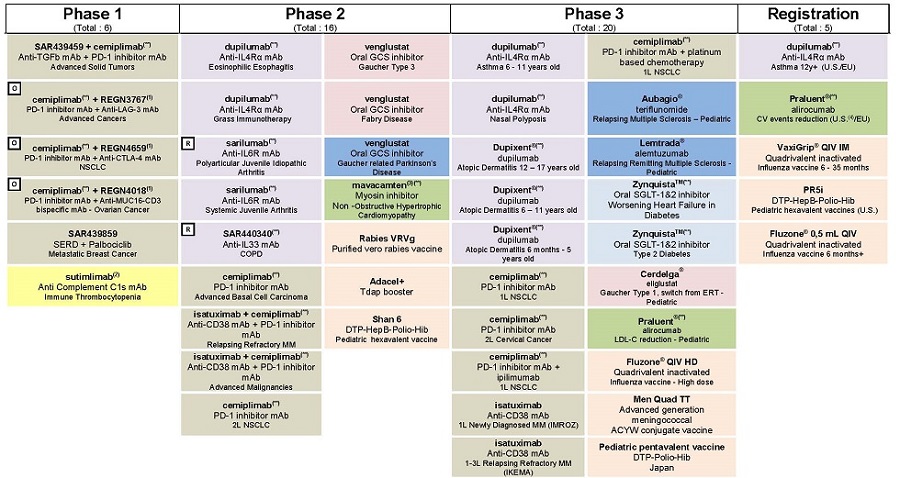
(1) | Regeneron product for which Sanofi has opt-in rights |
(2) | Also known as BIVV009 |
(3) | Also known as SAR439152 and MYK461 |
(4) | U.S. filing pending acceptance by FDA |
(*) | Data related to all studies published on clinicaltrials.gov |
(**) | Partnered and/or in collaboration - Sanofi may have limited or shared rights on some of these products |
2018 HALF-YEAR FINANCIAL REPORT Sanofi | 85
D!
M\@'Z @,"# (4 AT")@(O C@"00)+ E0"70)G G$">@*$ HX"F *B JP"M@+!
M LL"U0+@ NL"]0, PL#%@,A RT#. -# T\#6@-F W(#?@.* Y8#H@.N [H#
MQP/3 ^ #[ /Y! 8$$P0@!"T$.P1(!%4$8P1Q!'X$C 2:!*@$M@3$!-,$X03P
M!/X%#044%]@8&!A8&)P8W!D@&
M609J!GL&C :=!J\&P ;1!N,&]0<'!QD'*P<]!T\'80=T!X8'F0>L![\'T@?E
M!_@("P@?"#((1@A:"&X(@@B6"*H(O@C2".<(^PD0"24).@E/"60)>0F/":0)
MN@G/">4)^PH1"B<*/0I4"FH*@0J8"JX*Q0K<"O,+"PLB"SD+40MI"X +F NP
M"\@+X0OY#!(,*@Q##%P,=0R.#*<,P S9#/,-#0TF#4 -6@UT#8X-J0W##=X-
M^ X3#BX.20YD#G\.FPZV#M(.[@\)#R4/00]>#WH/E@^S#\\/[! )$"800Q!A
M$'X0FQ"Y$-<0]1$3$3$13Q%M$8P1JA')$>@2!Q(F$D429!*$$J,2PQ+C$P,3
M(Q-#$V,3@Q.D$\43Y10&%"<4211J%(L4K13.%/ 5$A4T%585>!6;%;T5X!8#
M%B86219L%H\6LA;6%OH7'1=!%V47B1>N%](7]Q@;&$ 891B*&*\8U1CZ&2 9
M11EK&9$9MQG=&@0:*AI1&G<:GAK%&NP;%!L[&V,;BANR&]H< APJ'%(<>QRC
M',P<]1T>'4<=:AZ4'KX>Z1\3'SX?:1^4'[\?ZB 5($$@
M;""8(,0@\"$<(4@A=2&A( &YXS'DJ>8EYYWI&
M>J5[!'MC>\)\(7R!?.%]07VA?@%^8G["?R-_A'_E@$> J($*@6N!S8(P@I*"
M](-7@[J$'82 A..%1X6KA@Z& -O
MVW/A?X?CU2'Q%X.DM=-O-,:/4[/4]!M5O;F>XO(5^PS0.?+D2:.=+IFDD*,F
M&.6(6O2/$/[(_@#6M"OK*#P_#ILMU:75K' E5R)ZW"U
MS\\/C)\'?VROB?J]II>KMKLOA^WT+3;;5O\ A'_%FDV=OJMU%:V%U)(IDO8W
M6[&I0W,3,+>%#$Q_?3QS 0]AJ_[-?[2'A?Q=-)X3U34HXYM5\0Z[IW]M^(+.
M?2M U*73_&-O82+"79_L_FWN@NZ!)/O;F3]U+L^WTO8U*[9%&WI\W2FKN@Z_X@\07,*06[7/\ :-W:,EK82!I2RJY4!/O-D;G
M/M\:_P#M5'_F6?V>_P#PI]8_^0*/[?\ VJA_S+/[/?\ X4^L?_(%? G[6?\
MP7+^-WPU_:3;1(KKX-_ _P $3>#]$\0>'M9^(7A?Q!JUAXMNKZR2YGC%]I^(
MK>"&0M 69=^Y> Q8K'U/[;W_ 7-\5^"_P!ISPS\*?AUXF^$?A58_!%IXQU_
MQKKFE:MXGTC47NU4V]KID.G*)7B()?[1+@,I PI7]X ?:+>(OVJDZ^&?V>_0
M?\5/K'_R!6=;?$_]I6\\0W>DPZ;^S3+JM@BR7-DGC#56N;96 (9XQ8[E!#*0
M2!G450_P""3?[=6O?M_?LC6?C;QAX5_P"$1\6:5JMUH&LVT,,\6GWES;",
MF\LA.!-]EF21)%$F63+(6?;O;\\?V@/V3?#?_!.W_@HO^S#KV@Z-KWAGP'??
M$%[GQ!\?]3\1+K6O^.=2U+SY5T.]$$T(2Q<*(3//$_"KM VS-<@'Z7_V_P#M
M5?\ 0L_L]_\ A3ZQ_P#(%']O_M5?]"S^SW_X4^L?_(%?0M% 'SU_;_[57_0L
M_L]_^%/K'_R!1_;_ .U5_P!"S^SW_P"%/K'_ ,@5]"T4 ?/7]O\ [57_ $+/
M[/?_ (4^L?\ R!1_;_[57_0L_L]_^%/K'_R!7T+10!\]?V_^U5_T+/[/?_A3
MZQ_\@4?V_P#M5?\ 0L_L]_\ A3ZQ_P#(%?0M% 'SU_;_ .U5_P!"S^SW_P"%
M/K'_ ,@4?V_^U5_T+/[/?_A3ZQ_\@5]"T4 ?/7]O_M5?]"S^SW_X4^L?_(%'
M]O\ [57_ $+/[/?_ (4^L?\ R!7T+10!\]?V_P#M5?\ 0L_L]_\ A3ZQ_P#(
M%']O?M5-_P RS^SW_P"%/K'_ ,@5]"T4 ?(_P5_:*_:8^.6G>(;K3?!OP'LE
M\,^(]2\-7*W/B?5
*/#M]X2\;7GC+PW
MX9O?$*Z4DVEK'>S6>F'5;FP:1;R2:VD2S2XG\RXMTAECM)?L\EPQ@27Z?\-Z
MI )],'A6QOH]-GOM/E&H*EPTHC:/]QO :$"625208XH)78!48C ^/
M?[)&A_&7PCX)T&WL/#>CZ'X)EU">STQ-'A^PQ/<:-J&FQ&&!5$<9AEOEG4A1
MCROEP2#7GFF_\$Q/#=S,^CZQJ#1^ 6\Z\_L+PVT_A\G49- TS0AZ41&1$(;%5;+XD?M(?$>WCOK>Y\;>$K/4KVYT^.UD^'96>TMAIF
MK7\-ZT=S )$=KBST^SVRJ #>["!*\8K[0FB,$\D?_/-MIP<]/\FFA$
M;S7+GXL>)M:\3_:M TS2=/@NM5:;3V4?:S
L?\ 02F_\<_PK#M-3M]0FNH[>ZM;B2SF\BY2&99&MI-H;9(%),;[64[6
MP<,#T.:L!&;^]T/;IZ_I1S,GV-/LC4_X3S5_^@E-_P".?X4?\)YJ_P#T$IO_
M !W_ K)C)D564LP?T&<_P"0* ^1PV1U!'((HYF4L/3_ )36_P"$]U?_ *"4
MW_CO^%'_ GNK_\ 02F_\=_PK)W_ .TWY4;_ /:;\J.9E>QI_P J-;_A/=7_
M .@E-_X[_A36\>ZP5_Y"4W_CO^%9>_\ VF_*@MQ]YORHYF2Z%/\ E1V7B3Q3
MJ%IH.AR174D(?%6I'Q9X
M#M;K3UL4\1VMWJOA>SO+N]UFV^T6WV%XY%;_ (F@>":VMU#,TA5T1]O7WW5_
MV??!>O\ PEUKP'?>&=+O/!WB)YYM2TF4.8+F6>?[1)+D,&63SOWJR(5:.14:
M,H5%
H>$=%O-%_X1UO")L9(
MW,)TAFC
D/_ 'V*3[=#_P ](?\ OL4>\',B<-D\X^@[>PH_B7ZU#]OB_P">D/\ W\%"
MWD+,/WD?7^\*GE871Z9H/_)"M._Z_)?_ $;+6,G$=:^C2J/@3IS;EV_;)#NS
MQ_KI/\:Q%O(U7_61_P#?5?99?_ BO)?DC./4\ _;Q_9=\1?M3ZY\,=-TF32[
M?1M(OM6N-:N-3MOMEG;K)8"*W+VHN(&G)D)V[6.S[QFO&_B3^S-^T+)XGF
M\&:7XH\8:Q\.])MM*TVUUJZ\1:?&9["TL]%BCG2(LMPNL+>V^L75Q-(B0R1.
MD8>5ML,?W%]IA)_UD?\ WT*<;J-?^6B<=,-^%='-::6#
M8XC]N@Y^$_@7_KYF_P#11KY@5L$__6KZ:_;NO(;;X2>!&EDCC4W,V"[A0?W/
MK7RZNM6H)_TNW_"5?\:_0N&)+Z@K]Y?F?G'$5_KDK=D>!_%#X.^/K_X^W6NZ
M+X=@U2]DU^RU#2/$%SJ<2V6D:7%96\4UA)#YZ7$,@NH;R;=%;W"3"[&\QJM<
M7H>F_M.:3X3\6R7FF^*-0O-6L]:M-&M_[?T=9-*N[F'118W19KZ4?9H)H=7"
M!7>3,Z?ND63,?U@NJV8_Y>K7_OXOX=Z!K-F#_P ?=OW_ .6@_P ??]:]"I@8
M3=U4:UOHVC"GF,HQY7%/Y'S3\1/A7\:O$BZSJ%A>>--/\1Z/9>+9=)N(_$6G
MBRO;Z06ITB*W16S'9R#17 0AHY"XC5_FVM"\"_'2_\?>)8]&_M#>!/C5>ZOKU]X#UW
M58%O?%EBEI:)
(;E+B#R(IE?[&X?
M%I-++*DTDB AVC(92K,IZ70/V%_A=X-O-#G\/V.M>&6\-W<$]@-)\0WEGLAA
MTO3M*2RD*R;IK7[)I&GJ8I68LT&XL2S9YX\]]=CJU(?$?[9;>$?C'XBT74O
M^J0^"?"OBS2_!&I^,TU>V:WM-3U'3]-O+;S++ G%L6U6RMVF0N4DEW&/8'9<
MX_\ !4'X&GP[#JR^,-7N+*:WNKPM;^#M
X\;V%UI_B.?Q/I_V+Q;J%LNE3W$S3W4%LJ2@0VEQ([M+
M;KA7W8)V@*,N_P#^":WPCWGAF>\TO6+V:_N[274)6CFDE@O('Z$$+
MY=]<8 (P74_PU7/3[LF-.IO9'*_M"_MB_!3P3\+_ S\=!I_A_Q!?>(-;B\(
MZ+J&M7$?AF2&\BBU5);>ZN-2$0L&MK:36@T=PJN6FDA5&EGC6O1? O[/?P=C
MU+P[KEEX%\):;KC:);2:?;/]FFN+:R%D+545(Y9(71;:3R&>,R1NA \V1=K%
M++]AWX?Z/\ _#WPWTVWU?1=#\*7PU31[K3-1:SU/3;W,N^YAN(POEO+'<7,4
MBHH1XKJ>,IL