UNITED STATES SECURITIES AND EXCHANGE COMMISSION
Washington, D.C. 20549
_______________________________
FORM 10-Q
QUARTERLY REPORT PURSUANT TO SECTION 13 OR 15(d) OF THE SECURITIES EXCHANGE ACT OF 1934 | ||||||||
For the quarterly period ended | ||||||||
OR | ||||||||
TRANSITION REPORT PURSUANT TO SECTION 13 OR 15(d) OF THE SECURITIES EXCHANGE ACT OF 1934 | ||||||||
For the transition period | from ________ to ________ | |||||||
Commission file number: 001-38855
___________________________________
(Exact name of registrant as specified in its charter)
| (State or Other Jurisdiction of Incorporation or Organization) | (I.R.S. Employer Identification No.) | ||||||||||
| (Address of Principal Executive Offices) | (Zip Code) | ||||||||||
Registrant’s telephone number, including area code: +1 212 401 8700
No Changes | ||
| (Former name, former address and former fiscal year, if changed since last report) | ||
Securities registered pursuant to Section 12(b) of the Act:
| Title of each class | Trading Symbol(s) | Name of each exchange on which registered | ||||||||||||
Indicate by check mark whether the registrant (1) has filed all reports required to be filed by Section 13 or 15(d) of the Securities Exchange Act of 1934 during the preceding 12 months (or for such shorter period that the registrant was required to file such reports), and (2) has been subject to such filing requirements for the past 90 days. Yes ☒ No ☐
Indicate by check mark whether the registrant has submitted electronically every Interactive Data File required to be submitted pursuant to Rule 405 of Regulation S-T (§232.405 of this chapter) during the preceding 12 months (or for such shorter period that the registrant was required to submit such files). Yes ☒ No ☐
Indicate by check mark whether the registrant is a large accelerated filer, an accelerated filer, a non-accelerated filer, a smaller reporting company, or an emerging growth company. See the definitions of “large accelerated filer,” “accelerated filer,” “smaller reporting company” and “emerging growth company” in Rule 12b-2 of the Exchange Act.
| ☒ | Accelerated filer | ☐ | |||||||||
| Non-accelerated filer | ☐ | Smaller reporting company | |||||||||
| Emerging growth company | |||||||||||
If an emerging growth company, indicate by check mark if the registrant has elected not to use the extended transition period for complying with any new or revised financial accounting standards provided pursuant to Section 13(a) of the Exchange Act. ☐
Indicate by check mark whether the registrant is a shell company (as defined in Rule 12b-2 of the Exchange Act). Yes ☐ No ☒
Indicate the number of shares outstanding of each of the issuer’s classes of common stock, as of the latest practicable date.
| Class | Outstanding at July 27, 2021 | ||||||||||
| Common Stock, $0.01 par value per share | shares | ||||||||||
Nasdaq, Inc.
Page | ||||||||
Part I. FINANCIAL INFORMATION | ||||||||
| Item 1. | ||||||||
| Item 2. | ||||||||
| Item 3. | ||||||||
| Item 4. | ||||||||
Part II. OTHER INFORMATION | ||||||||
| Item 1. | ||||||||
| Item 1A. | ||||||||
| Item 2. | ||||||||
| Item 3. | ||||||||
| Item 4. | ||||||||
| Item 5. | ||||||||
| Item 6. | ||||||||
i
About this Form 10-Q
Throughout this Form 10-Q, unless otherwise specified:
•“Nasdaq,” “we,” “us” and “our” refer to Nasdaq, Inc.
• “Nasdaq Baltic” refers to collectively, Nasdaq Tallinn AS, Nasdaq Riga, AS, and AB Nasdaq Vilnius.
• “Nasdaq BX” refers to the cash equity exchange operated by Nasdaq BX, Inc.
•“Nasdaq BX Options” refers to the options exchange operated by Nasdaq BX, Inc.
•“Nasdaq Clearing” refers to the clearing operations conducted by Nasdaq Clearing AB.
•“Nasdaq CXC” and “Nasdaq CX2” refer to the Canadian cash equity trading books operated by Nasdaq CXC Limited.
•“Nasdaq First North” refers to our alternative marketplaces for smaller companies and growth companies in the Nordic and Baltic regions.
•“Nasdaq GEMX” refers to the options exchange operated by Nasdaq GEMX, LLC.
•“Nasdaq ISE” refers to the options exchange operated by Nasdaq ISE, LLC.
•“Nasdaq MRX” refers to the options exchange operated by Nasdaq MRX, LLC.
•“Nasdaq Nordic” refers to collectively, Nasdaq Clearing AB, Nasdaq Stockholm AB, Nasdaq Copenhagen A/S, Nasdaq Helsinki Ltd, and Nasdaq Iceland hf.
•“Nasdaq PHLX” refers to the options exchange operated by Nasdaq PHLX LLC.
•“Nasdaq PSX” refers to the cash equity exchange operated by Nasdaq PHLX LLC.
•“The Nasdaq Options Market” refers to the options exchange operated by The Nasdaq Stock Market LLC.
•“The Nasdaq Stock Market” refers to the cash equity exchange and listing venue operated by The Nasdaq Stock Market LLC.
* * * * * *
Nasdaq also provides as a tool for the reader the following list of abbreviations and acronyms that are used throughout this Quarterly Report on Form 10-Q.
401(k) Plan: Voluntary Defined Contribution Savings Plan
2020 Credit Facility: $1.25 billion senior unsecured revolving credit facility, which matures on December 22, 2025
2022 Notes: $600 million aggregate principal amount of 0.445% senior unsecured notes due December 21, 2022
2023 Notes: €600 million aggregate principal amount of 1.75% senior unsecured notes due May 19, 2023
2024 Notes: $500 million aggregate principal amount of 4.25% senior unsecured notes due June 1, 2024
2026 Notes: $500 million aggregate principal amount of 3.85% senior unsecured notes due June 30, 2026
2029 Notes: €600 million aggregate principal amount of 1.75% senior unsecured notes due March 28, 2029
2030 Notes: €600 million aggregate principal amount of 0.875% senior unsecured notes due February 13, 2030
2031 Notes: $650 million aggregate principal amount of 1.650% senior unsecured notes due January 15, 2031
2033 Notes: €615 million aggregate principal amount of 0.900% senior unsecured notes due July 30, 2033
2040 Notes: $650 million aggregate principal amount of 2.500% senior unsecured notes due December 21, 2040
2050 Notes: $500 million aggregate principal amount of 3.25% senior unsecured notes due April 28, 2050
ASU: Accounting Standards Update
ASU 2016-13: Measurement of Credit Losses on Financial Instruments
ASR: Accelerated Share Repurchase
AUM: Assets Under Management
CCP: Central Counterparty
EMIR: European Market Infrastructure Regulation
Equity Plan: Nasdaq Equity Incentive Plan
ESG: Environmental, Social and Governance
ESPP: Nasdaq Employee Stock Purchase Plan
ETF: Exchange Traded Fund
ETP: Exchange Traded Product
Exchange Act: Securities Exchange Act of 1934, as amended
FICC: Fixed Income and Commodities Trading and Clearing
FINRA: Financial Industry Regulatory Authority
IPO: Initial Public Offering
LIBOR: London Interbank Offered Rate
ii
NFF: Nasdaq Financial Framework; Nasdaq's end-to-end technology solutions for market infrastructure operators, buy-side firms, sell-side firms and other non-financial markets
NPM: The NASDAQ Private Market, LLC
NSCC: National Securities Clearing Corporation
OCC: The Options Clearing Corporation
OTC: Over-the-Counter
PSU: Performance Share Unit
SaaS: Software as a Service
SEC: U.S. Securities and Exchange Commission
SERP: Supplemental Executive Retirement Plan
SFSA: Swedish Financial Supervisory Authority
S&P: Standard & Poor’s
S&P 500: S&P 500 Stock Index
SPAC: Special Purpose Acquisition Company
TSR: Total Shareholder Return
U.S. GAAP: U.S. Generally Accepted Accounting Principles
* * * * * *
NASDAQ, the NASDAQ logos, and other brand, service or product names or marks referred to in this report are trademarks or service marks, registered or otherwise, of Nasdaq, Inc. and/or its subsidiaries. FINRA and Trade Reporting Facility are registered trademarks of FINRA.
* * * * * *
This Quarterly Report on Form 10-Q includes market share and industry data that we obtained from industry publications and surveys, reports of governmental agencies and internal company surveys. Industry publications and surveys generally state that the information they contain has been obtained from sources believed to be reliable, but we cannot assure you that this information is accurate or complete. We have not independently verified any of the data from third-party sources nor have we ascertained the underlying economic assumptions relied upon therein. Statements as to our market position are based on the most currently available market data. For market comparison purposes, The Nasdaq Stock Market data in this Quarterly Report on Form 10-Q for IPOs is based on data generated internally by us; therefore, the data may not be comparable to other publicly-available IPO data. Data in this Quarterly Report on Form 10-Q for new listings of equity securities on The Nasdaq Stock Market is based on data generated internally by us, which includes issuers that switched from other listing venues, closed-end funds and ETPs. Data in this Quarterly Report on Form 10-Q for IPOs and new listings of equity securities on the Nasdaq Nordic and Nasdaq Baltic exchanges and Nasdaq First North also is based on data generated internally by us. IPOs and new listings data is presented as of period end. While we are not aware of any misstatements regarding industry data presented herein, our estimates involve risks and uncertainties and are subject to change based on various factors. We refer you to the “Risk Factors” section in our Form 10-K for the fiscal year ended December 31, 2020 that was filed with the SEC on February 23, 2021.
* * * * * *
Nasdaq intends to use its website, ir.nasdaq.com, as a means for disclosing material non-public information and for complying with SEC Regulation FD and other disclosure obligations.
iii
Forward-Looking Statements
The SEC encourages companies to disclose forward-looking information so that investors can better understand a company’s future prospects and make informed investment decisions. This Quarterly Report on Form 10-Q contains these types of statements. Words such as “may,” “will,” “could,” “should,” “anticipates,” “envisions,” “estimates,” “expects,” “projects,” “intends,” “plans,” “believes” and words or terms of similar substance used in connection with any discussion of future expectations as to industry and regulatory developments or business initiatives and strategies, future operating results or financial performance, and other future developments are intended to identify forward-looking statements. These include, among others, statements relating to:
•our strategic direction;
•the integration of acquired businesses, including accounting decisions relating thereto;
•the scope, nature or impact of acquisitions, divestitures, investments, joint ventures or other transactional activities;
•the effective dates for, and expected benefits of, ongoing initiatives, including transactional activities and other strategic, restructuring, technology, de-leveraging and capital return initiatives;
•our products and services;
•the impact of pricing changes;
•tax matters;
•the cost and availability of liquidity and capital;
•any litigation, or any regulatory or government investigation or action, to which we are or could become a party or which may affect us; and
•the potential impact of the COVID-19 pandemic and the response of governments and other third parties on our business, operations, results of operations, financial condition, workforce or the operations or decisions of our customers, suppliers or business partners.
Forward-looking statements involve risks and uncertainties. Factors that could cause actual results to differ materially from those contemplated by the forward-looking statements include, among others, the following:
•our operating results may be lower than expected;
•our ability to successfully integrate acquired businesses or divest sold businesses or assets, including the fact that any integration or transition may be more difficult, time consuming or costly than expected, and we may be unable to realize synergies from business combinations, acquisitions, divestitures or other transactional activities;
•loss of significant trading and clearing volumes or values, fees, market share, listed companies, market data customers or other customers;
•our ability to develop and grow our non-trading businesses, including our technology and analytics offerings;
•our ability to keep up with rapid technological advances and adequately address cybersecurity risks;
•economic, political and market conditions and fluctuations, including interest rate and foreign currency risk, inherent in U.S. and international operations;
•the performance and reliability of our technology and technology of third parties on which we rely;
•any significant error in our operational processes;
•our ability to continue to generate cash and manage our indebtedness; and
•adverse changes that may occur in the litigation or regulatory areas, or in the securities markets generally, or increased regulatory oversight domestically or internationally.
Most of these factors are difficult to predict accurately and are generally beyond our control. You should consider the uncertainty and any risk related to forward-looking statements that we make. These risk factors are more fully described in the “Risk Factors” section in our Form 10-K that was filed with the SEC on February 23, 2021. You are cautioned not to place undue reliance on these forward-looking statements, which speak only as of the date of this report. You should carefully read this entire Quarterly Report on Form 10-Q, including “Part I. Item 2. Management’s Discussion and Analysis of Financial Condition and Results of Operations” and the condensed consolidated financial statements and the related notes. Except as required by the federal securities laws, we undertake no obligation to update any forward-looking statement, release publicly any revisions to any forward-looking statements or report the occurrence of unanticipated events. For any forward-looking statements contained in any document, we claim the protection of the safe harbor for forward-looking statements contained in the Private Securities Litigation Reform Act of 1995.
1
PART I. FINANCIAL INFORMATION
Item 1. Financial Statements
Nasdaq, Inc.
Condensed Consolidated Balance Sheets
(in millions, except share and par value amounts)
| June 30, 2021 | December 31, 2020 | ||||||||||
| (unaudited) | |||||||||||
| Assets | |||||||||||
| Current assets: | |||||||||||
| Cash and cash equivalents | $ | $ | |||||||||
| Restricted cash and cash equivalents | |||||||||||
| Financial investments | |||||||||||
| Receivables, net | |||||||||||
| Default funds and margin deposits | |||||||||||
| Other current assets | |||||||||||
| Total current assets | |||||||||||
| Property and equipment, net | |||||||||||
| Goodwill | |||||||||||
| Intangible assets, net | |||||||||||
| Operating lease assets | |||||||||||
| Other non-current assets | |||||||||||
| Total assets | $ | $ | |||||||||
| Liabilities | |||||||||||
| Current liabilities: | |||||||||||
| Accounts payable and accrued expenses | $ | $ | |||||||||
| Section 31 fees payable to SEC | |||||||||||
| Accrued personnel costs | |||||||||||
| Deferred revenue | |||||||||||
| Other current liabilities | |||||||||||
| Default funds and margin deposits | |||||||||||
| Short-term debt | |||||||||||
| Total current liabilities | |||||||||||
| Long-term debt | |||||||||||
| Deferred tax liabilities, net | |||||||||||
| Operating lease liabilities | |||||||||||
| Other non-current liabilities | |||||||||||
| Total liabilities | |||||||||||
| Commitments and contingencies | |||||||||||
| Equity | |||||||||||
| Nasdaq stockholders’ equity: | |||||||||||
Common stock, $ | |||||||||||
| Additional paid-in capital | |||||||||||
Common stock in treasury, at cost: | ( | ( | |||||||||
| Accumulated other comprehensive loss | ( | ( | |||||||||
| Retained earnings | |||||||||||
| Total Nasdaq stockholders’ equity | |||||||||||
| Noncontrolling interests | |||||||||||
| Total equity | |||||||||||
| Total liabilities and equity | $ | $ | |||||||||
See accompanying notes to condensed consolidated financial statements.
2
Nasdaq, Inc.
Condensed Consolidated Statements of Income
(Unaudited)
(in millions, except per share amounts)
| Three Months Ended June 30, | Six Months Ended June 30, | ||||||||||||||||||||||
| 2021 | 2020 | 2021 | 2020 | ||||||||||||||||||||
| Revenues: | |||||||||||||||||||||||
| Market Services | $ | $ | $ | $ | |||||||||||||||||||
| Corporate Platforms | |||||||||||||||||||||||
| Investment Intelligence | |||||||||||||||||||||||
| Market Technology | |||||||||||||||||||||||
| Total revenues | |||||||||||||||||||||||
| Transaction-based expenses: | |||||||||||||||||||||||
| Transaction rebates | ( | ( | ( | ( | |||||||||||||||||||
| Brokerage, clearance and exchange fees | ( | ( | ( | ( | |||||||||||||||||||
| Revenues less transaction-based expenses | |||||||||||||||||||||||
| Operating expenses: | |||||||||||||||||||||||
| Compensation and benefits | |||||||||||||||||||||||
| Professional and contract services | |||||||||||||||||||||||
| Computer operations and data communications | |||||||||||||||||||||||
| Occupancy | |||||||||||||||||||||||
| General, administrative and other | |||||||||||||||||||||||
| Marketing and advertising | |||||||||||||||||||||||
| Depreciation and amortization | |||||||||||||||||||||||
| Regulatory | |||||||||||||||||||||||
| Merger and strategic initiatives | |||||||||||||||||||||||
| Restructuring charges | |||||||||||||||||||||||
| Total operating expenses | |||||||||||||||||||||||
| Operating income | |||||||||||||||||||||||
| Interest income | |||||||||||||||||||||||
| Interest expense | ( | ( | ( | ( | |||||||||||||||||||
| Net gain on divestiture of business | |||||||||||||||||||||||
| Other income | |||||||||||||||||||||||
| Net income from unconsolidated investees | |||||||||||||||||||||||
| Income before income taxes | |||||||||||||||||||||||
| Income tax provision | |||||||||||||||||||||||
| Net income attributable to Nasdaq | $ | $ | $ | $ | |||||||||||||||||||
| Per share information: | |||||||||||||||||||||||
| Basic earnings per share | $ | $ | $ | $ | |||||||||||||||||||
| Diluted earnings per share | $ | $ | $ | $ | |||||||||||||||||||
| Cash dividends declared per common share | $ | $ | $ | $ | |||||||||||||||||||
See accompanying notes to condensed consolidated financial statements.
3
Nasdaq, Inc.
Condensed Consolidated Statements of Comprehensive Income
(Unaudited)
(in millions)
| Three Months Ended June 30, | Six Months Ended June 30, | ||||||||||||||||||||||
| 2021 | 2020 | 2021 | 2020 | ||||||||||||||||||||
| Net income | $ | $ | $ | $ | |||||||||||||||||||
| Other comprehensive income (loss): | |||||||||||||||||||||||
| Foreign currency translation gains (losses) | ( | ( | |||||||||||||||||||||
Income tax benefit (expense)(1) | ( | ||||||||||||||||||||||
| Foreign currency translation, net | ( | ( | |||||||||||||||||||||
| Comprehensive income attributable to Nasdaq | $ | $ | $ | $ | |||||||||||||||||||
____________
(1) Primarily relates to the tax effect of unrealized gains and losses on Euro denominated notes.
See accompanying notes to condensed consolidated financial statements.
4
Nasdaq, Inc.
Condensed Consolidated Statements of Changes in Stockholders' Equity
(Unaudited)
(in millions)
| Three Months Ended June 30, | Six Months Ended June 30, | ||||||||||||||||||||||||||||||||||||||||||||||
| 2021 | 2020 | 2021 | 2020 | ||||||||||||||||||||||||||||||||||||||||||||
| Shares | $ | Shares | $ | Shares | $ | Shares | $ | ||||||||||||||||||||||||||||||||||||||||
| Common stock | |||||||||||||||||||||||||||||||||||||||||||||||
| Additional paid-in capital | |||||||||||||||||||||||||||||||||||||||||||||||
| Beginning balance | |||||||||||||||||||||||||||||||||||||||||||||||
| Share repurchase program | ( | ( | — | ( | ( | ( | ( | ( | |||||||||||||||||||||||||||||||||||||||
| Share-based compensation | — | ||||||||||||||||||||||||||||||||||||||||||||||
| Stock option exercises, net | — | — | — | — | — | ||||||||||||||||||||||||||||||||||||||||||
Other issuances of common stock, net(1) | — | — | |||||||||||||||||||||||||||||||||||||||||||||
| Ending balance | |||||||||||||||||||||||||||||||||||||||||||||||
| Common stock in treasury, at cost | |||||||||||||||||||||||||||||||||||||||||||||||
| Beginning balance | ( | ( | ( | ( | |||||||||||||||||||||||||||||||||||||||||||
| Other employee stock activity | — | ( | — | ( | — | ( | — | ( | |||||||||||||||||||||||||||||||||||||||
| Ending balance | ( | ( | ( | ( | |||||||||||||||||||||||||||||||||||||||||||
| Accumulated other comprehensive loss | |||||||||||||||||||||||||||||||||||||||||||||||
| Beginning balance | ( | ( | ( | ( | |||||||||||||||||||||||||||||||||||||||||||
| Other comprehensive income (loss) | ( | ( | |||||||||||||||||||||||||||||||||||||||||||||
| Ending balance | ( | ( | ( | ( | |||||||||||||||||||||||||||||||||||||||||||
| Retained earnings | |||||||||||||||||||||||||||||||||||||||||||||||
| Beginning balance | |||||||||||||||||||||||||||||||||||||||||||||||
Impact of adoption of | — | — | — | ( | |||||||||||||||||||||||||||||||||||||||||||
| Net income | |||||||||||||||||||||||||||||||||||||||||||||||
Cash dividends declared per common share | ( | ( | ( | ( | |||||||||||||||||||||||||||||||||||||||||||
| Ending balance | |||||||||||||||||||||||||||||||||||||||||||||||
| Total Nasdaq stockholders’ equity | |||||||||||||||||||||||||||||||||||||||||||||||
| Noncontrolling interests | |||||||||||||||||||||||||||||||||||||||||||||||
| Beginning balance | |||||||||||||||||||||||||||||||||||||||||||||||
Net activity related to noncontrolling interests | |||||||||||||||||||||||||||||||||||||||||||||||
| Ending balance | |||||||||||||||||||||||||||||||||||||||||||||||
| Total Equity | $ | $ | $ | $ | |||||||||||||||||||||||||||||||||||||||||||
____________
(1) Primarily relates to shares accelerated and issued upon the sale of our U.S. Fixed Income business. See “2021 Divestiture,” of Note 4, “Acquisitions and Divestiture,” for further discussion.
See accompanying notes to condensed consolidated financial statements.
5
Nasdaq, Inc.
Condensed Consolidated Statements of Cash Flows
(Unaudited)
(in millions)
| Six Months Ended June 30, | |||||||||||
| 2021 | 2020 | ||||||||||
| Cash flows from operating activities: | |||||||||||
| Net income | $ | $ | |||||||||
| Adjustments to reconcile net income to net cash provided by operating activities: | |||||||||||
| Depreciation and amortization | |||||||||||
| Share-based compensation | |||||||||||
| Deferred income taxes | ( | ||||||||||
| Extinguishment of debt | |||||||||||
| Net gain on divestiture of business | ( | ||||||||||
| Net income from unconsolidated investees | ( | ( | |||||||||
| Other reconciling items included in net income | |||||||||||
| Net change in operating assets and liabilities, net of effects of acquisitions: | |||||||||||
| Receivables, net | ( | ||||||||||
| Other assets | ( | ||||||||||
| Accounts payable and accrued expenses | ( | ( | |||||||||
| Section 31 fees payable to SEC | ( | ||||||||||
| Accrued personnel costs | ( | ( | |||||||||
| Deferred revenue | |||||||||||
Other liabilities(1) | ( | ||||||||||
| Net cash provided by operating activities | |||||||||||
| Cash flows from investing activities: | |||||||||||
| Purchases of securities | ( | ( | |||||||||
| Proceeds from sales and redemptions of securities | |||||||||||
| Proceeds from divestiture of business, net of cash divested | |||||||||||
| Acquisition of businesses, net of cash and cash equivalents acquired | ( | ( | |||||||||
| Purchases of property and equipment | ( | ( | |||||||||
| Other investing activities | ( | ( | |||||||||
| Net cash used in investing activities | ( | ( | |||||||||
| Cash flows from financing activities: | |||||||||||
| Proceeds from (repayments of) commercial paper, net | ( | ||||||||||
| Repayments of borrowings under our credit commitment and debt obligations | ( | ( | |||||||||
| Payment of debt extinguishment cost | ( | ||||||||||
| Proceeds from issuances of long-term debt, net of issuance costs and utilization of credit commitment | |||||||||||
| Repurchases of common stock | ( | ( | |||||||||
| Dividends paid | ( | ( | |||||||||
| Proceeds received from employee stock activity and other issuances | |||||||||||
| Payments related to employee shares withheld for taxes | ( | ( | |||||||||
| Other financing activities | |||||||||||
| Net cash used in financing activities | ( | ( | |||||||||
| Effect of exchange rate changes on cash and cash equivalents and restricted cash and cash equivalents | ( | ( | |||||||||
| Net increase (decrease) in cash and cash equivalents and restricted cash and cash equivalents | ( | ||||||||||
| Cash and cash equivalents and restricted cash and cash equivalents at beginning of period | |||||||||||
| Cash and cash equivalents and restricted cash and cash equivalents at end of period | $ | $ | |||||||||
| Supplemental Disclosure Cash Flow Information | |||||||||||
| Cash paid for: | |||||||||||
| Interest | $ | $ | |||||||||
Income taxes, net of refund(1) | $ | $ | |||||||||
(1) Includes payment of an acquired tax liability in the second quarter of 2021 related to the Verafin acquisition. See “2021 Acquisition,” of Note 4, “Acquisitions and Divestiture,” for further discussion
See accompanying notes to condensed consolidated financial statements.
6
Nasdaq, Inc.
Notes to Condensed Consolidated Financial Statements
(Unaudited)
1. ORGANIZATION AND NATURE OF OPERATIONS
Nasdaq is a global technology company serving the capital markets and other industries. Our diverse offerings of data, analytics, software and services enables clients to optimize and execute their business vision with confidence.
We manage, operate and provide our products and services in four business segments: Market Services, Corporate Platforms, Investment Intelligence and Market Technology.
Market Services
Our Market Services segment includes our Equity Derivative Trading and Clearing, Cash Equity Trading, FICC and Trade Management Services businesses. We operate multiple exchanges and other marketplace facilities across several asset classes, including derivatives, commodities, cash equity, debt, structured products and ETPs. In addition, in certain countries where we operate exchanges, we also provide broker services, clearing, settlement and central depository services. In January 2020, we commenced an orderly wind-down of our Nordic broker services operations business. We expect this wind-down to continue through 2021. Also, in June 2021, we sold our U.S. Fixed Income business. See “2021 Divestiture,” of Note 4, “Acquisitions and Divestiture,” for further discussion.
Our transaction-based platforms provide market participants with the ability to access, process, display and integrate orders and quotes. The platforms allow the routing and execution of buy and sell orders as well as the reporting of transactions, providing fee-based revenues.
In the U.S., we operate six options exchanges and three cash equity exchanges. The Nasdaq Stock Market, the largest of our cash equities exchanges, is the largest single venue of liquidity for trading U.S.-listed cash equities. We also operate a Canadian exchange for the trading of certain Canadian-listed securities. The U.S. portion of Nasdaq Fixed Income includes an electronic platform for trading of U.S. Treasuries; as noted above, in June 2021, we sold this business.
In Europe, we operate exchanges in Stockholm (Sweden), Copenhagen (Denmark), Helsinki (Finland), and Reykjavik (Iceland), as well as the clearing operations of Nasdaq Clearing, as Nasdaq Nordic. We also operate exchanges in Tallinn (Estonia), Riga (Latvia) and Vilnius (Lithuania) as Nasdaq Baltic. Collectively, Nasdaq Nordic and Nasdaq Baltic offer trading in cash equities, depository receipts, warrants, convertibles, rights, fund units and ETFs, as well as trading and clearing of derivatives and clearing of resale and repurchase agreements. Additionally, in June 2021, we completed the acquisition of a majority stake in Puro.earth, a Finnish-based leading marketplace for carbon removal.
The European portion of Nasdaq Fixed Income provides a wide range of products and services, such as trading and
clearing, for fixed income products in Sweden, Denmark, Finland, Iceland, Estonia, Lithuania and Latvia.
Nasdaq Commodities is the brand name for Nasdaq’s European commodity-related products and services. Nasdaq Commodities’ offerings include derivatives in power, natural gas and carbon emission markets, seafood, electricity certificates and clearing services. These products are listed on Nasdaq Oslo ASA, except for seafood, which is listed on Fishpool, a third party platform.
Through our Trade Management Services business, we provide market participants with a wide variety of alternatives for connecting to and accessing our markets. Our marketplaces may be accessed via a number of different protocols used for quoting, order entry, trade reporting, and connectivity to various data feeds. We also offer the Nasdaq Workstation, a browser-based, front-end interface that allows market participants to view data and enter orders, quotes and trade reports. In addition, we offer a variety of add-on compliance tools to help firms comply with regulatory requirements.
We provide colocation services to market participants, whereby we offer firms cabinet space and power to house their own equipment and servers within our data centers. Additionally, we offer a number of wireless connectivity offerings between select data centers using millimeter wave and microwave technology.
Our broker services operations business primarily offers technology and customized securities administration solutions to financial participants in the Nordic market. As noted above, we have commenced an orderly wind-down of our Nordic broker services operations business.
Corporate Platforms
Our Corporate Platforms segment includes our Listing Services and IR & ESG Services businesses. These businesses deliver critical capital market and ESG solutions across the lifecycle of public and private companies.
Our Listing Services business includes our U.S. and European Listing Services businesses. We operate a variety of listing platforms around the world to provide multiple global capital raising solutions for private and public companies. Our main listing markets are The Nasdaq Stock Market and the Nasdaq Nordic and Nasdaq Baltic exchanges. Through Nasdaq First North, our Nordic and Baltic operations also offer alternative marketplaces for smaller companies and growth companies. Our Listing Services business also includes NPM, which provides liquidity solutions for private companies to enable employees, investors, and companies to execute transactions. In July 2021 we contributed our NPM business to a standalone, independent company, of which we own the largest minority interest, alongside a consortium of banks.
We are continuing to grow our U.S. Corporate Bond exchange for the listing of corporate bonds. This exchange
7
operates pursuant to The Nasdaq Stock Market exchange license and is powered by the NFF. As of June 30, 2021, 104 corporate bonds were listed on the Corporate Bond exchange. We also continue to grow the Nasdaq Sustainable Bond Network, a platform for increased transparency in the global sustainable bond markets.
As of June 30, 2021, there were 3,817 total listings on The Nasdaq Stock Market, including 419 ETPs. The combined market capitalization was approximately $25.8 trillion. In Europe, the Nasdaq Nordic and Nasdaq Baltic exchanges, together with Nasdaq First North, were home to 1,152 listed companies with a combined market capitalization of approximately $2.4 trillion.
Our IR & ESG Services business includes our Investor Relations Intelligence and Governance Solutions businesses, which serve both public and private companies and organizations. Our public company clients can be companies listed on our exchanges or other U.S. and global exchanges. Our private company clients include a diverse group of organizations ranging from family owned companies, government organizations, law firms, privately held entities, various non-profit organizations to hospitals and health care systems. We help organizations enhance their ability to understand and expand their global shareholder base, improve corporate governance, and navigate the evolving ESG landscape through our suite of advanced technology, analytics, reporting and consultative services.
Investment Intelligence
Our Investment Intelligence segment includes our Market Data, Index and Analytics businesses.
Our Market Data business sells and distributes real-time and historical market data to the sell-side, the institutional investing community, retail online brokers, proprietary trading shops, other venues, internet portals and data distributors. Our market data products enhance transparency of market activity within our exchanges and provide critical information to professional and non-professional investors globally. Additionally, our Nasdaq Cloud Data Service provides a flexible and efficient method of delivery for real-time exchange data and other financial information.
Our Index business develops and licenses Nasdaq-branded indexes and financial products. We also license cash-settled options, futures and options on futures on our indexes. As of June 30, 2021, 359 ETPs listed in over 30 countries and exchanges tracked a Nasdaq index and accounted for $415 billion in AUM.
Our Analytics business provides asset managers, investment consultants and institutional asset owners with investment insights and workflow solutions. The eVestment platform provides asset owners and allocators with analytics to make data-driven investment decisions, enables asset managers to position institutional products worldwide and provides liquidity solutions for private funds. Together with Solovis, a cloud-based multi-asset portfolio management and risk solution, we provide a suite of cloud-based solutions that
help institutional investors and consultants conduct pre-investment due diligence, and monitor their portfolios post-investment.
Market Technology
Our Market Technology segment is a leading global technology solutions provider and partner to exchanges, clearing organizations, central securities depositories, regulators, banks, brokers, buy-side firms and corporate businesses. Our solutions are utilized by leading markets in the U.S., Europe and Asia as well as emerging markets in the Middle East, Latin America, and Africa. The Market Technology segment includes our Anti Financial Crime Technology business and our Marketplace Infrastructure Technology business.
Our Anti Financial Crime Technology business includes Nasdaq Trade Surveillance, a technology solution designed for brokers and other market participants to assist them in complying with market rules, regulations and internal market surveillance policies. We have added a cloud-deployed anti-money laundering offering with an automated investigator tool for retail banks, the Nasdaq Automated Investigator. Additionally, in February 2021, we completed the acquisition of Verafin, a SaaS technology provider of anti-financial crime management solutions that provides a cloud-based platform to help detect, investigate, and report money laundering and financial fraud. See “2021 Acquisition,” of Note 4, “Acquisitions and Divestiture,” for further discussion.
2. BASIS OF PRESENTATION AND PRINCIPLES OF CONSOLIDATION
8
As permitted under U.S. GAAP, certain footnotes or other financial information can be condensed or omitted in the interim condensed consolidated financial statements. The information included in this Quarterly Report on Form 10-Q should be read in conjunction with the consolidated financial statements and accompanying notes included in Nasdaq’s Form 10-K. The year-end condensed balance sheet data was derived from the audited financial statements, but does not include all disclosures required by U.S. GAAP.
Accounting Estimates
In preparing our condensed consolidated financial statements, we make assumptions, judgments and estimates that can have a significant impact on our revenue, operating income and net income, as well as on the value of certain assets and liabilities in our condensed consolidated balance sheets. At least quarterly, we evaluate our assumptions, judgments and estimates, and make changes as deemed necessary.
Subsequent Events
We have evaluated subsequent events through the issuance date of this Quarterly Report on Form 10-Q. For discussion of financing actions subsequent to June 30, 2021, see “0.900 % Senior Unsecured Notes Due 2033,” and “1.75 % Senior Unsecured Notes Due 2023,” of Note 8, “Debt Obligations.” For discussion of our ASR agreement, see "ASR Agreement," of Note 11, “Nasdaq Stockholders’ Equity.”
9
3. REVENUE FROM CONTRACTS WITH CUSTOMERS
Disaggregation of Revenue
The following tables summarize the disaggregation of revenue by major product and service and by segment for the three and six months ended June 30, 2021 and 2020:
| Three Months Ended June 30, 2021 | |||||||||||||||||||||||||||||
| Market Services | Corporate Platforms | Investment Intelligence | Market Technology | Consolidated | |||||||||||||||||||||||||
| (in millions) | |||||||||||||||||||||||||||||
Transaction-based trading and clearing, net | $ | $ | $ | $ | $ | ||||||||||||||||||||||||
Trade management services | |||||||||||||||||||||||||||||
Listing services | |||||||||||||||||||||||||||||
| IR & ESG Services | |||||||||||||||||||||||||||||
| Market data | |||||||||||||||||||||||||||||
Index | |||||||||||||||||||||||||||||
| Analytics | |||||||||||||||||||||||||||||
| Anti Financial Crime Technology | |||||||||||||||||||||||||||||
| Marketplace Infrastructure Technology | |||||||||||||||||||||||||||||
Revenues less transaction-based expenses | $ | $ | $ | $ | $ | ||||||||||||||||||||||||
| Three Months Ended June 30, 2020 | |||||||||||||||||||||||||||||
| Market Services | Corporate Platforms | Investment Intelligence | Market Technology | Consolidated | |||||||||||||||||||||||||
| (in millions) | |||||||||||||||||||||||||||||
Transaction-based trading and clearing, net | $ | $ | $ | $ | $ | ||||||||||||||||||||||||
Trade management services | |||||||||||||||||||||||||||||
Listing services | |||||||||||||||||||||||||||||
| IR & ESG Services | |||||||||||||||||||||||||||||
Market data | |||||||||||||||||||||||||||||
Index | |||||||||||||||||||||||||||||
| Analytics | |||||||||||||||||||||||||||||
| Anti Financial Crime Technology | |||||||||||||||||||||||||||||
| Marketplace Infrastructure Technology | |||||||||||||||||||||||||||||
Revenues less transaction-based expenses | $ | $ | $ | $ | $ | ||||||||||||||||||||||||
For the three months ended June 30, 2021, approximately 70.8 % of Market Services revenues were recognized at a point in time and 29.2 % were recognized over time. For the three months ended June 30, 2020, approximately 70.7 % of Market Services revenues were recognized at a point in time and 29.3 % were recognized over time. Substantially all revenues from the Corporate Platforms, Investment Intelligence and Market Technology segments were recognized over time for the three months ended June 30, 2021 and 2020.
10
| Six Months Ended June 30, 2021 | |||||||||||||||||||||||||||||
| Market Services | Corporate Platforms | Investment Intelligence | Market Technology | Consolidated | |||||||||||||||||||||||||
| (in millions) | |||||||||||||||||||||||||||||
Transaction-based trading and clearing, net | $ | $ | $ | $ | $ | ||||||||||||||||||||||||
Trade management services | |||||||||||||||||||||||||||||
Listing services | |||||||||||||||||||||||||||||
| IR & ESG Services | |||||||||||||||||||||||||||||
| Market data | |||||||||||||||||||||||||||||
Index | |||||||||||||||||||||||||||||
| Analytics | |||||||||||||||||||||||||||||
| Anti Financial Crime Technology | |||||||||||||||||||||||||||||
| Marketplace Infrastructure Technology | |||||||||||||||||||||||||||||
Revenues less transaction-based expenses | $ | $ | $ | $ | $ | ||||||||||||||||||||||||
| Six Months Ended June 30, 2020 | |||||||||||||||||||||||||||||
| Market Services | Corporate Platforms | Investment Intelligence | Market Technology | Consolidated | |||||||||||||||||||||||||
| (in millions) | |||||||||||||||||||||||||||||
Transaction-based trading and clearing, net | $ | $ | $ | $ | $ | ||||||||||||||||||||||||
Trade management services | |||||||||||||||||||||||||||||
Listing services | |||||||||||||||||||||||||||||
| IR & ESG Services | |||||||||||||||||||||||||||||
Market data | |||||||||||||||||||||||||||||
Index | |||||||||||||||||||||||||||||
| Analytics | |||||||||||||||||||||||||||||
| Anti Financial Crime Technology | |||||||||||||||||||||||||||||
| Marketplace Infrastructure Technology | |||||||||||||||||||||||||||||
Revenues less transaction-based expenses | $ | $ | $ | $ | $ | ||||||||||||||||||||||||
For the six months ended June 30, 2021, approximately 72.1 % of Market Services revenues were recognized at a point in time and 27.9 % were recognized over time. For the six months ended June 30, 2020, approximately 71.0 % of Market Services revenues were recognized at a point in time and 29.0 % were recognized over time. Substantially all revenues from the Corporate Platforms, Investment Intelligence and Market Technology segments were recognized over time for the six months ended June 30, 2021 and 2020.
* * * * * *
Contract Balances
Substantially all of our revenues are considered to be revenues from contracts with customers. The related accounts receivable balances are recorded in our Condensed Consolidated Balance Sheets as receivables, which are net of allowance for doubtful accounts of $18 million as of June 30, 2021 and $21 million as of December 31, 2020. The changes in the balance between periods were immaterial. We do not have obligations for warranties, returns or refunds to customers.
For the majority of our contracts with customers, except for our market technology and listings services contracts, our performance obligations are short-term in nature and there is no significant variable consideration.
We do not have a material amount of revenue recognized from performance obligations that were satisfied in prior periods. We do not provide disclosures about transaction price allocated to unsatisfied performance obligations if contract durations are less than one year. Excluding our market technology contracts, for contract durations that are one-year or greater, materially all of the transaction price allocated to unsatisfied performance obligations is included in deferred revenue. For our market technology contracts, the portion of transaction price allocated to unsatisfied performance obligations is shown in the table below. Deferred revenue primarily represents our contract liabilities related to our fees for annual and initial listings, Market Technology, IR & ESG services and Investment Intelligence contracts. Deferred revenue is the only significant contract asset or liability as of June 30, 2021.
11
See Note 7, “Deferred Revenue,” for our discussion on deferred revenue balances, activity, and expected timing of recognition.
Transaction Price Allocated to Remaining Performance Obligations
As stated above, for contract durations that are one-year or greater, we do not have a material portion of transaction price
allocated to unsatisfied performance obligations that are not included in deferred revenue other than for our market technology contracts.
* * * * * *
For our market technology contracts, the following table summarizes the amount of the transaction price allocated to performance obligations that are unsatisfied as of June 30, 2021:
| (in millions) | |||||
| Remainder of 2021 | $ | ||||
| 2022 | |||||
| 2023 | |||||
| 2024 | |||||
| 2025 | |||||
| 2026 and thereafter | |||||
| Total | $ | ||||
Market technology deferred revenue, as discussed in Note 7, “Deferred Revenue,” represents consideration received that is yet to be recognized as revenue for unsatisfied performance obligations.
4. ACQUISITIONS AND DIVESTITURE
We completed the following divestiture and acquisitions in 2021 and 2020. Financial results of each transaction are included in our condensed consolidated financial statements from the date of each acquisition.
2021 Divestiture
In June 2021, we sold our U.S. Fixed Income business which was part of our FICC business within our Market Services segment to Tradeweb Markets Inc., or Tradeweb. We recognized a pre-tax gain on the sale of $84 million, net of disposal costs. The pre-tax gain is included in net gain on divestiture of business in the Condensed Consolidated Statements of Income.
As part of the purchase price consideration related to this business when it was acquired in 2013, we agreed to future annual issuances of 992,247 shares of Nasdaq common stock, which approximated certain tax benefits associated with the transaction. Such contingent future issuances of Nasdaq common stock were to be issued annually through 2027 if Nasdaq’s total gross revenues equaled or exceeded $25 million in each such year. The contingent future issuances of
Nasdaq common stock were subject to anti-dilution protections and acceleration upon certain events.
Upon the consummation of the sale of our U.S. Fixed Income business, the aggregate number of Nasdaq shares remaining under the contingent obligation described above were reduced (pursuant to the discounting adjustment provisions set forth in the original purchase agreement for Nasdaq's acquisition of the business) and accelerated, resulting in an issuance of approximately 6.2 million shares of Nasdaq common stock to an assignee of the entity that sold this business to us in 2013.
Nasdaq intends to use the proceeds from the sale, available tax benefits and working and clearing capital of this business, as well as other sources of cash, to repurchase shares of Nasdaq common stock in order to offset the earnings per share dilution from the sale.
To facilitate these repurchases, the board of directors has authorized an increase to the share repurchase program. See "Share Repurchase Program," of Note 11, "Nasdaq Stockholders' Equity," for further discussion.
* * * * * *
2021 Acquisition
| Purchase Consideration | Total Net Liabilities Acquired | Acquired Intangible Assets | Goodwill | ||||||||||||||||||||
| (in millions) | |||||||||||||||||||||||
| Verafin | $ | $ | ( | $ | $ | ||||||||||||||||||
12
Acquisition of Verafin
In February 2021, we completed the acquisition of Verafin, a SaaS technology provider of anti-financial crime management solutions that provides a cloud-based platform to help detect, investigate, and report money laundering and financial fraud, for an aggregate purchase price of $2.75 billion, subject to certain adjustments. The $2.75 billion purchase price includes a cash payment of $102 million, reflected in cash from operating activities in our Condensed Consolidated Statements of Cash Flows, the release of which is subject to certain employment-related conditions over three years following the closing of the transaction. This payment was recorded as a prepaid expense and is recorded in other current and non-current assets in our Condensed Consolidated Balance Sheets and will be amortized to merger and strategic initiatives expense on a straight-line basis over a three-year period. Verafin is part of our Market Technology segment.
Nasdaq used the net proceeds from our offering of senior notes in December 2020, commercial paper issuances, and cash on hand to fund this acquisition. See “Commercial Paper Program,” and “Senior Unsecured Notes Due 2022, 2031 and 2040,” of Note 8, “Debt Obligations,” for further discussion.
As of June 30, 2021, the allocation of purchase price includes the effect of a $9 million measurement period adjustment recorded during the second quarter. This adjustment resulted in an increase to both total net liabilities acquired and goodwill. Additional adjustments to the provisional values may result before the end of the measurement period, a period not to exceed 12 months from the acquisition date. These adjustments, which may include tax and other estimates will be recorded in the reporting period in which the adjustment amounts are determined. Changes to amounts recorded as assets and liabilities may result in a corresponding adjustment to goodwill.
Intangible Assets
The following table presents the details of acquired intangible assets for Verafin at the date of acquisition. Acquired intangible assets with finite lives are amortized using the straight-line method.
Customer Relationships | Technology | Trade Name | Total Acquired Intangible Assets | |||||||||||
| Intangible asset value (in millions) | $ | $ | $ | $ | ||||||||||
| Discount rate used | % | % | % | |||||||||||
| Estimated average useful life | ||||||||||||||
Customer Relationships
Customer relationships represent the non-contractual and contractual relationships with customers.
Methodology
Customer relationships were valued using the income approach, specifically an excess earnings method. The excess earnings method examines the economic returns contributed by the identified tangible and intangible assets of a company, and then isolates the excess return that is attributable to the intangible asset being valued.
Discount Rate
The discount rate used reflects the amount of risk associated with the hypothetical cash flows for the customer relationships relative to the overall business. In developing a discount rate for the customer relationships, we estimated a weighted-average cost of capital for the overall business and we utilized this rate as an input when discounting the cash flows. The resulting discounted cash flows were then tax-effected at the applicable statutory rate.
For our acquisition of Verafin, a discounted tax amortization benefit was added to the fair value of the assets under the assumption that the customer relationships would be amortized for tax purposes over a period of 20 years.
Estimated Useful Life
We estimate the useful life based on the historical behavior of the customers and a parallel analysis of the customers using the excess earnings method.
Technology
As part of our acquisition of Verafin, we acquired developed technology.
Methodology
The developed technology was valued using the income approach, specifically the relief-from-royalty method, or RFRM. The RFRM is used to estimate the cost savings that accrue to the owner of an intangible asset who would otherwise have to pay royalties or license fees on revenues earned through the use of the asset. The royalty rate is applied to the projected revenue over the expected remaining life of the intangible asset to estimate royalty savings. The net after-tax royalty savings are calculated for each year in the remaining economic life of the technology and discounted to present value.
Discount Rate
The discount rates used reflect the amount of risk associated with the hypothetical cash flows for the developed technology relative to the overall business as discussed above in “Customer Relationships.”
Estimated Useful Life
We have estimated the useful life of the Verafin technology to be 7 years.
Trade Name
As part of our acquisition of Verafin, we acquired a trade name. The trade name is recognized in the industry and
13
carries a reputation for quality. As such, the reputation and positive recognition embodied in the trade name is a valuable asset to Nasdaq.
Methodology
The Verafin trade name was valued using the income approach, specifically the RFRM as discussed above in “Technology.”
Discount Rate
The discount rate used reflects the amount of risk associated with the hypothetical cash flows for the trade name relative to the overall business as discussed above in “Customer Relationships.”
Estimated Useful Life
We have estimated the useful life of the Verafin trade name to be 20 years and our intention is to continue to use it in the branding of products.
2020 Acquisition
Acquisition of Solovis
In March 2020, we acquired Solovis, a provider of multi-asset class portfolio management, analytics and reporting tools across public and private markets. Solovis is part of our Investment Intelligence segment.
Pro Forma Results and Acquisition-Related Costs
The condensed consolidated financial statements for the three and six months ended June 30, 2021 and 2020 include the financial results of the above acquisitions from the dates of these acquisitions. Pro forma financial results have not been presented since these acquisitions both individually and in the aggregate were not material to our financial results.
Acquisition-related costs for the transactions described above
were expensed as incurred and are included in merger and strategic initiatives expense in the Condensed Consolidated Statements of Income.
* * * * * *
5. GOODWILL AND ACQUIRED INTANGIBLE ASSETS
Goodwill
The following table presents the changes in goodwill by business segment during the six months ended June 30, 2021:
| Market Services | Corporate Platforms | Investment Intelligence | Market Technology | Total | |||||||||||||||||||||||||
| (in millions) | |||||||||||||||||||||||||||||
| Balance at December 31, 2020 | $ | $ | $ | $ | $ | ||||||||||||||||||||||||
| Goodwill acquired | |||||||||||||||||||||||||||||
Divestiture of business(1) | ( | ( | ( | ||||||||||||||||||||||||||
Other adjustments(2) | ( | ( | ( | ( | |||||||||||||||||||||||||
| Balance at June 30, 2021 | $ | $ | $ | $ | $ | ||||||||||||||||||||||||
__________
(1)Relates to the sale of our U.S. Fixed Income business. See “2021 Divestiture,” of Note 4, “Acquisitions and Divestiture,” for further discussion. In addition to revenues earned through Market Services, our U.S. Fixed Income business also earned fees from market data, which are included in our Investment Intelligence segment. Therefore, a portion of the goodwill was allocated to this segment.
(2)Includes foreign currency translation adjustment and a measurement period adjustment related to our acquisition of Verafin. See “2021 Acquisition,” of Note 4, “Acquisitions and Divestiture,” for further discussion.
* * * * * *
As of June 30, 2021, the amount of goodwill that is expected to be deductible for tax purposes in future periods is $1.9 billion.
Goodwill represents the excess of purchase price over the value assigned to the net assets, including identifiable intangible assets, of a business acquired. Goodwill is allocated to our reporting units based on the assignment of the fair values of each reporting unit of the acquired company. We test goodwill for impairment at the reporting unit level annually, or in interim periods if certain events
occur indicating that the carrying amount may be impaired, such as changes in the business climate, poor indicators of operating performance or the sale or disposition of a significant portion of a reporting unit. There was no
14
Acquired Intangible Assets
| June 30, 2021 | December 31, 2020 | ||||||||||||||||||||||||||||||||||
| Gross Amount | Accumulated Amortization | Net Amount | Gross Amount | Accumulated Amortization | Net Amount | ||||||||||||||||||||||||||||||
| (in millions) | (in millions) | ||||||||||||||||||||||||||||||||||
Finite-Lived Intangible Assets | |||||||||||||||||||||||||||||||||||
| Technology | $ | $ | ( | $ | $ | $ | ( | $ | |||||||||||||||||||||||||||
| Customer relationships | ( | ( | |||||||||||||||||||||||||||||||||
| Trade names and other | ( | ( | |||||||||||||||||||||||||||||||||
Foreign currency translation adjustment | ( | ( | ( | ( | |||||||||||||||||||||||||||||||
Total finite-lived intangible assets | $ | $ | ( | $ | $ | $ | ( | $ | |||||||||||||||||||||||||||
Indefinite-Lived Intangible Assets | |||||||||||||||||||||||||||||||||||
Exchange and clearing registrations | $ | $ | — | $ | $ | $ | — | $ | |||||||||||||||||||||||||||
| Trade names | — | — | |||||||||||||||||||||||||||||||||
| Licenses | — | — | |||||||||||||||||||||||||||||||||
Foreign currency translation adjustment | ( | — | ( | ( | — | ( | |||||||||||||||||||||||||||||
Total indefinite-lived intangible assets | $ | $ | — | $ | $ | $ | — | $ | |||||||||||||||||||||||||||
| Total intangible assets | $ | $ | ( | $ | $ | $ | ( | $ | |||||||||||||||||||||||||||
The change in the gross and net amounts for technology and trade names and other finite-lived intangible assets as of June 30, 2021 compared with December 31, 2020 is primarily related to our acquisition of Verafin. The change in the gross and net amounts for customer relationships as of June 30, 2021 compared with December 31, 2020 is related to our acquisition of Verafin as well as the divestiture of our U.S. Fixed Income business. See “2021 Acquisition,” and “2021 Divestiture,” of Note 4, “Acquisitions and Divestiture,” for further discussion of these transactions.
Amortization expense for acquired finite-lived intangible assets was $40 million for the three months ended June 30, 2021, $26 million for the three months ended June 30, 2020, $76 million for the six months ended June 30, 2021 and $50 million for the six months ended June 30, 2020. The increase in amortization expense for the three and six months ended June 30, 2021 compared with the same periods in 2020 was primarily due to additional amortization expense for acquired intangible assets related to our acquisition of Verafin. These amounts are included in depreciation and amortization expense in the Condensed Consolidated Statements of Income.
| (in millions) | |||||
| Remainder of 2021 | $ | ||||
| 2022 | |||||
| 2023 | |||||
| 2024 | |||||
| 2025 | |||||
| 2026 and thereafter | |||||
| Total | $ | ||||
6. INVESTMENTS
| June 30, 2021 | December 31, 2020 | ||||||||||
| (in millions) | |||||||||||
Financial investments | $ | $ | |||||||||
| Equity method investments | $ | $ | |||||||||
| Equity securities | $ | $ | |||||||||
Financial Investments
As of June 30, 2021, financial investments are comprised of trading securities, primarily highly rated European government debt securities and time deposits, of which $167 million are assets primarily utilized to meet regulatory capital requirements, mainly for our clearing operations at Nasdaq Clearing. As of December 31, 2020, financial investments are comprised of trading securities, primarily highly rated European government debt securities, of which $175 million are assets primarily utilized to meet regulatory capital requirements, mainly for our clearing operations at Nasdaq Clearing.
15
Equity Method Investments
We record our estimated pro-rata share of earnings or losses each reporting period and record any dividends as a reduction in the investment balance. As of June 30, 2021 and 2020, our equity method investments primarily included our 40.0
The carrying amounts of our equity method investments are included in other non-current assets in the Condensed Consolidated Balance Sheets. No material impairments were recorded for the three and six months end June 30, 2021 and 2020.
Net income recognized from our equity interest in the earnings and losses of these equity method investments, primarily OCC, was $27 million for the three months ended June 30, 2021, $26 million for the three months ended June 30, 2020, $84 million for the six months ended June 30, 2021
and $43 million for the six months ended June 30, 2020. For the six months ended June 30, 2021, higher equity earnings in OCC were primarily driven by elevated U.S. industry trading volumes.
Equity Securities
The carrying amounts of our equity securities are included in other non-current assets in the Condensed Consolidated Balance Sheets. We elected the measurement alternative for primarily all of our equity securities as they do not have a readily determinable fair value. No material adjustments were made to the carrying value of our equity securities for the three and six months ended June 30, 2021 and 2020. As of June 30, 2021 and December 31, 2020, our equity securities represent various strategic investments made through our corporate venture program as well as investments acquired through various acquisitions.
* * * * * *
7. DEFERRED REVENUE
Deferred revenue represents consideration received that is yet to be recognized as revenue. The changes in our deferred revenue during the six months ended June 30, 2021 are reflected in the following table:
| Initial Listing Revenues | Annual Listings Revenues | IR & ESG Services Revenues | Investment Intelligence Revenues | Market Technology Revenues | Other(1) | Total | |||||||||||||||||||||||||||||||||||
| (in millions) | |||||||||||||||||||||||||||||||||||||||||
| Balance at December 31, 2020 | $ | $ | $ | $ | $ | $ | $ | ||||||||||||||||||||||||||||||||||
Deferred revenue billed in the current period, net of recognition(2) | |||||||||||||||||||||||||||||||||||||||||
Revenue recognized that was included in the beginning of the period | ( | ( | ( | ( | ( | ( | ( | ||||||||||||||||||||||||||||||||||
| Foreign currency translation adjustment | ( | ( | ( | ||||||||||||||||||||||||||||||||||||||
| Balance at June 30, 2021 | $ | $ | $ | $ | $ | $ | $ | ||||||||||||||||||||||||||||||||||
____________
(1) Balance at June 30, 2021 primarily includes deferred revenue from non-U.S. listing of additional shares fees. Listing of additional shares fees are included in our Listing Services business.
(2) Market Technology revenues include deferred revenue acquired as part of the acquisition of Verafin.
As of June 30, 2021, we estimate that our deferred revenue will be recognized in the following years:
| Initial Listing Revenues | Annual Listings Revenues | IR & ESG Services Revenues | Investment Intelligence Revenues | Market Technology Revenues | Other(1) | Total | |||||||||||||||||||||||||||||||||||
| (in millions) | |||||||||||||||||||||||||||||||||||||||||
| Fiscal year ended: | |||||||||||||||||||||||||||||||||||||||||
| Remainder of 2021 | $ | $ | $ | $ | $ | $ | $ | ||||||||||||||||||||||||||||||||||
| 2022 | |||||||||||||||||||||||||||||||||||||||||
| 2023 | |||||||||||||||||||||||||||||||||||||||||
| 2024 | |||||||||||||||||||||||||||||||||||||||||
| 2025 | |||||||||||||||||||||||||||||||||||||||||
| 2026 and thereafter | |||||||||||||||||||||||||||||||||||||||||
| Total | $ | $ | $ | $ | $ | $ | $ | ||||||||||||||||||||||||||||||||||
____________
(1) For composition of “Other” see footnote (1) above.
The timing of recognition of our deferred market technology revenues is primarily dependent upon the completion of customization and any significant modifications made pursuant to existing market technology contracts. As such, as it relates to market technology revenues, the timing represents our best estimate.
16
8. DEBT OBLIGATIONS
| December 31, 2020 | Additions | Payments, Foreign Currency Translation and Accretion | June 30, 2021 | ||||||||||||||||||||
| (in millions) | |||||||||||||||||||||||
| Short-term debt - commercial paper | $ | $ | $ | ( | $ | ||||||||||||||||||
| Long-term debt: | |||||||||||||||||||||||
| ( | |||||||||||||||||||||||
| ( | |||||||||||||||||||||||
| ( | |||||||||||||||||||||||
$ | ( | ( | ( | ||||||||||||||||||||
| Total long-term debt | ( | ||||||||||||||||||||||
| Total debt obligations | $ | $ | $ | ( | $ | ||||||||||||||||||
Commercial Paper Program
Our U.S. dollar commercial paper program is supported by our 2020 Credit Facility which provides liquidity support for the repayment of commercial paper issued through this program. See “2020 Credit Facility” below for further discussion. The effective interest rate of commercial paper issuances fluctuates as short term interest rates and demand fluctuate. The fluctuation of these rates may impact our interest expense.
In February 2021, we issued $475 million of commercial paper to partially fund the acquisition of Verafin. For further discussion of the acquisition of Verafin, see “2021 Acquisition,” of Note 4, “Acquisitions and Divestiture.”
As of June 30, 2021, commercial paper notes in the table above reflect the aggregate principal amount outstanding, less the unamortized discount which is being accreted through interest expense over the life of the applicable notes. The original maturities of these notes range from 35 days to 65 days and the weighted-average maturity is 20 days. The weighted-average effective interest rate is 0.21 % per annum.
Senior Unsecured Notes
Our 2022 and 2040 Notes were issued at par. The remaining senior unsecured notes were issued at a discount. As a result of the discount, the proceeds received from each issuance were less than the aggregate principal amount. As of June 30, 2021, the amounts in the table above reflect the aggregate principal amount, less the unamortized debt discount and the unamortized debt issuance costs which are being accreted through interest expense over the life of the applicable notes.
For our Euro denominated notes, the “Payments, Foreign Currency Translation and Accretion” column also includes the impact of foreign currency translation. Our senior unsecured notes are general unsecured obligations which rank equally with all of our existing and future unsubordinated obligations and are not guaranteed by any of our subsidiaries. The senior unsecured notes were issued under indentures that, among other things, limit our ability to consolidate, merge or sell all or substantially all of our assets, create liens, and enter into sale and leaseback transactions.
Upon a change of control triggering event (as defined in the various note indentures), the terms require us to repurchase all or part of each holder’s notes for cash equal to 101 % of the aggregate principal amount purchased plus accrued and unpaid interest, if any.
In May 2014, Nasdaq issued the 2024 Notes. The 2024 Notes pay interest semiannually at a rate of 4.25 % per annum until June 1, 2024. Such interest rate may vary with Nasdaq’s debt rating, to the extent Nasdaq is downgraded below investment grade, up to a rate not to exceed 6.25 %.
In July 2021, we sent a redemption notice to the trustee of the 2023 Notes to redeem all €600 million aggregate principal amount outstanding at a cash redemption price to be calculated as provided in the indenture governing the 2023 Notes, plus accrued and unpaid interest, if any, to the redemption date of August 29, 2021. Upon completion of the redemption, no 2023 Notes will remain outstanding.
17
Payment of the redemption price will be made on or after the redemption date only upon presentation and surrender of the 2023 Notes to the trustee. Interest on the 2023 Notes called for redemption will cease to accrue from and after the redemption date.
Nasdaq issued the 2023 Notes in May 2016, and paid interest on these notes annually at a rate of 1.75 % per annum
The 2023 Notes were designated as a hedge of our net investment in certain foreign subsidiaries to mitigate the foreign exchange rate risk associated with certain investments in these subsidiaries. The decrease in the carrying amount of $21 million noted in the “Payments, Foreign Currency Translation and Accretion” column in the table above primarily reflects the translation of the 2023 Notes into U.S. dollars and is recorded in accumulated other comprehensive loss within stockholders’ equity in the Condensed Consolidated Balance Sheets as of June 30, 2021.
Nasdaq will primarily use the net proceeds from the sale of the 2033 Notes to redeem the 2023 Notes. For further discussion of the 2033 Notes, see "0.900 % Senior Unsecured Notes Due 2033" below.
In June 2016, Nasdaq issued the 2026 Notes. The 2026 Notes pay interest semi-annually at a rate of 3.85 % per annum until June 30, 2026. Such interest rate may vary with Nasdaq’s debt rating, to the extent Nasdaq is downgraded below investment grade, up to a rate not to exceed 5.85 %.
In April 2019, Nasdaq issued the 2029 Notes. The 2029 Notes pay interest annually at a rate of 1.75 % per annum until March 28, 2029. Such interest rate may vary with Nasdaq’s debt rating, to the extent Nasdaq is downgraded below investment grade, up to a rate not to exceed 3.75 %. The 2029 Notes may be redeemed by Nasdaq at any time, subject to a make-whole amount.
The 2029 Notes have been designated as a hedge of our net investment in certain foreign subsidiaries to mitigate the foreign exchange risk associated with certain investments in these subsidiaries. The decrease in the carrying amount of $21 million noted in the “Payments, Foreign Currency Translation and Accretion” column in the table above primarily reflects the translation of the 2029 Notes into U.S. dollars and is recorded in accumulated other comprehensive loss within stockholders’ equity in the Condensed Consolidated Balance Sheets as of June 30, 2021.
In February 2020, Nasdaq issued the 2030 Notes. The 2030 Notes pay interest annually in arrears, which began on February 13, 2021 and may be redeemed by Nasdaq at any time, subject to a make-whole amount. The interest rate of 0.875 % may vary with Nasdaq's debt rating, to the extent Nasdaq is downgraded below investment grade, up to a rate not to exceed 1.875 %.
The 2030 Notes were designated as a hedge of our net investment in certain foreign subsidiaries to mitigate the foreign exchange risk associated with certain investments in these subsidiaries. The decrease in the carrying amount of $21 million noted in the “Payments, Foreign Currency Translation and Accretion” column in the table above primarily reflects the translation of the 2030 Notes into U.S. dollars and is recorded in accumulated other comprehensive loss within stockholders’ equity in the Condensed Consolidated Balance Sheets as of June 30, 2021.
In April 2020, Nasdaq issued the 2050 Notes. The 2050 Notes pay interest semi-annually in arrears, which began on October 28, 2020 and may be redeemed by Nasdaq at any time, subject to a make-whole amount. The interest rate of 3.25 % may vary with Nasdaq's debt rating, to the extent Nasdaq is downgraded below investment grade, up to a rate not to exceed 5.25 %.
Senior Unsecured Notes Due 2022, 2031 and 2040
In December 2020, Nasdaq issued the 2022, 2031 and 2040 Notes. The net proceeds were used to partially finance the acquisition of Verafin. For further discussion of the acquisition of Verafin, see “2021 Acquisition,” of Note 4, “Acquisitions and Divestiture.”
The 2022 Notes pay interest semi-annually in arrears, beginning on June 21, 2021 and may be redeemed by Nasdaq at any time, subject to a make-whole amount. The interest rate of 0.445 % may vary with Nasdaq's debt rating, to the extent Nasdaq is downgraded below investment grade, up to a rate not to exceed 1.445 %.
The 2031 Notes pay interest semi-annually in arrears, which began on January 15, 2021 and may be redeemed by Nasdaq at any time, subject to a make-whole amount. The interest rate of 1.650 % may vary with Nasdaq's debt rating, to the extent Nasdaq is downgraded below investment grade, up to a rate not to exceed 2.65 %.
The 2040 Notes pay interest semi-annually in arrears, beginning on June 21, 2021 and may be redeemed by Nasdaq at any time, subject to a make-whole amount. The interest rate of 2.500 % may vary with Nasdaq's debt rating, to the extent Nasdaq is downgraded below investment grade, up to a rate not to exceed 3.50 %.
In July 2021, Nasdaq issued €615 million aggregate principal amount of 0.900 % senior notes due in 2033. The 2033 Notes pay interest annually in arrears, beginning on July 30, 2022 and may be redeemed by Nasdaq at any time, subject to a make-whole amount. The net proceeds from the 2033 Notes were approximately $720 million after deducting the
18
underwriting discount and expenses of the offering. We will use the net proceeds from the 2033 Notes to redeem the 2023 Notes, which is expected to occur in the third quarter of 2021. For further discussion of the 2023 Notes, see “1.75 % Senior Unsecured Notes Due 2023” above.
The 2033 Notes have been designated as a hedge of our net investment in certain foreign subsidiaries to mitigate the foreign exchange risk associated with certain investments in these subsidiaries.
Credit Facilities
2020 Credit Facility
In December 2020, Nasdaq entered into the 2020 Credit Facility. The 2020 Credit Facility consists of a $1.25 billion five-year revolving credit facility (with sublimits for non-dollar borrowings, swingline borrowings and letters of credit), which replaced a former credit facility. Nasdaq intends to use funds available under the 2020 Credit Facility for general corporate purposes and to provide liquidity support for the repayment of commercial paper issued through the commercial paper program. Nasdaq is permitted to repay borrowings under our 2020 Credit Facility at any time in whole or in part, without penalty.
As of June 30, 2021, no amounts were outstanding on the 2020 Credit Facility. The $(4 ) million balance represents unamortized debt issuance costs which are being accreted through interest expense over the life of the credit facility. Of the $1.25 billion that is available for borrowing, $221 million provides liquidity support for the commercial paper program. As such, as of June 30, 2021, the total remaining amount available under the 2020 Credit Facility was $1,029 million, excluding the amounts that support the commercial paper program. See “Commercial Paper Program” above for further discussion of our commercial paper program.
Under our 2020 Credit Facility, borrowings under the revolving credit facility and swingline borrowings bear interest on the principal amount outstanding at a variable interest rate based on either the LIBOR, the base rate (as defined in the credit agreement), or other applicable rate with respect to non-dollar borrowings, plus an applicable margin that varies with Nasdaq’s debt rating. We are charged commitment fees of 0.125 % to 0.350 %, depending on our credit rating, whether or not amounts have been borrowed. These commitment fees are included in interest expense and were not material for the three months ended June 30, 2021.
The 2020 Credit Facility contains financial and operating covenants. Financial covenants include a maximum leverage ratio. Operating covenants include, among other things, limitations on Nasdaq’s ability to incur additional indebtedness, grant liens on assets, dispose of assets and make certain restricted payments. The facility also contains customary affirmative covenants, including access to financial statements, notice of defaults and certain other material events, maintenance of properties and insurance, and customary events of default, including cross-defaults to our material indebtedness.
The 2020 Credit Facility includes an option for Nasdaq to increase the available aggregate amount by up to $625 million, subject to the consent of the lenders funding the increase and certain other conditions.
Other Credit Facilities
Certain of our European subsidiaries have several other credit facilities, which are available in multiple currencies, primarily to support our Nasdaq Clearing operations in Europe, as well as to provide a cash pool credit line for one subsidiary. These credit facilities, in aggregate, totaled $223 million as of June 30, 2021 and $232 million as of December 31, 2020 in available liquidity, none
These facilities include customary affirmative and negative operating covenants and events of default.
Debt Covenants
As of June 30, 2021, we were in compliance with the covenants of all of our debt obligations.
9. RETIREMENT PLANS
Defined Contribution Savings Plan
We sponsor a 401(k) Plan for U.S. employees. Employees are immediately eligible to make contributions to the plan and are also eligible for an employer contribution match at an amount equal to 100.0 6.0 3 7
Pension and Supplemental Executive Retirement Plans
We maintain non-contributory, defined-benefit pension plans, non-qualified SERPs for certain senior executives and other post-retirement benefit plans for eligible employees in the U.S. Our pension plans and SERPs are frozen. Future service and salary for all participants do not count toward an accrual of benefits under the pension plans and SERPs. Most employees outside the U.S. are covered by local retirement plans or by applicable social laws. Benefits under social laws are generally expensed in the periods in which the costs are incurred. The total expense for these plans is included in compensation and benefits expense in the Condensed Consolidated Statements of Income and was $7 million for the three months ended June 30, 2021, $6 million for the
19
10. SHARE-BASED COMPENSATION
We have a share-based compensation program for employees and non-employee directors. Share-based awards granted under this program include restricted stock (consisting of restricted stock units), PSUs and stock options. For accounting purposes, we consider PSUs to be a form of restricted stock.
Summary of Share-Based Compensation Expense
The following table shows the total share-based compensation expense resulting from equity awards and the 15.0
| Three Months Ended June 30, | Six Months Ended June 30, | ||||||||||||||||||||||
| 2021 | 2020 | 2021 | 2020 | ||||||||||||||||||||
| (in millions) | |||||||||||||||||||||||
Share-based compensation expense before income taxes | $ | $ | $ | $ | |||||||||||||||||||
| Income tax benefit | ( | ( | ( | ( | |||||||||||||||||||
Share-based compensation expense after income taxes | $ | $ | $ | $ | |||||||||||||||||||
Common Shares Available Under Our Equity Plan
As of June 30, 2021, we had approximately 9.4 million shares of common stock authorized for future issuance under our Equity Plan.
Restricted Stock
We grant restricted stock to most active employees. The grant date fair value of restricted stock awards is based on the closing stock price at the date of grant less the present value of future cash dividends. Restricted stock awards granted to employees below the manager level generally vest 33.3 % on the first anniversary of the grant date, 33.3 % on the second anniversary of the grant date, and 33.3 % on the third anniversary of the grant date. Restricted stock awards granted to employees at or above the manager level generally vest 33.3 % on the second anniversary of the grant date, 33.3 % on the third anniversary of the grant date, and 33.3 % on the fourth anniversary of the grant date.
Summary of Restricted Stock Activity
The following table summarizes our restricted stock activity for the six months ended June 30, 2021:
| Restricted Stock | |||||||||||
| Number of Awards | Weighted-Average Grant Date Fair Value | ||||||||||
| Unvested at January 1, 2021 | $ | ||||||||||
| Granted | |||||||||||
| Vested | ( | ||||||||||
| Forfeited | ( | ||||||||||
| Unvested at June 30, 2021 | $ | ||||||||||
As of June 30, 2021, $94 million of total unrecognized compensation cost related to restricted stock is expected to be recognized over a weighted-average period of 2.0 years.
PSUs
PSUs are based on performance measures that impact the amount of shares that each recipient will receive upon vesting. Prior to April 1, 2020, we had two performance-based PSU programs for certain officers, a one-year performance-based program and a three-year cumulative performance-based program that focuses on TSR. Effective April 1, 2020, to better align the equity programs for eligible officers, the one-year performance-based program was eliminated and all eligible officers now participate in the three-year cumulative performance-based program. While the performance periods are complete for all PSUs granted under the one-year performance-based program, some shares underlying these PSUs have not vested.
The grant date fair value of PSUs under the one-year performance-based program was based on the closing stock price at the date of grant less the present value of future cash dividends. Under this program, an eligible employee received a target grant of PSUs, but could have received from 0.0 % to 150.0 % of the target amount granted, depending on the achievement of performance measures. These awards vest ratably on an annual basis over a three-year period commencing with the end of the one-year performance period. Compensation cost is recognized over the performance period and the three-year vesting period based on the probability that such performance measures will be achieved, taking into account an estimated forfeiture rate.
Under the three-year performance-based program, each eligible individual receives PSUs, subject to market conditions, with a three-year cumulative performance period that vest at the end of the performance period. Compensation cost is recognized over the three-year performance period, taking into account an estimated forfeiture rate, regardless of whether the market condition is satisfied, provided that the requisite service period has been completed. Performance
20
will be determined by comparing Nasdaq’s TSR to two peer groups, each weighted 50.0 %. The first peer group consists of exchange companies, and the second peer group consists of all companies in the S&P 500. Nasdaq’s relative performance ranking against each of these groups will determine the final number of shares delivered to each individual under the program. The award issuance under this program will be between 0.0 % and 200.0 % of the number of PSUs granted and will be determined by Nasdaq’s overall performance against both peer groups. However, if Nasdaq’s TSR is negative for the three-year performance period, regardless of TSR ranking, the award issuance will not exceed 100.0 % of the number of PSUs granted. We estimate the fair value of PSUs granted under the three-year PSU program using the Monte Carlo simulation model, as these awards contain a market condition.
Grants of PSUs that were issued in 2018 with a three-year performance period exceeded the applicable performance parameters. As a result, an additional 150,290 units above the original target were granted in the first quarter of 2021 and were fully vested upon issuance.
Summary of PSU Activity
The following table summarizes our PSU activity for the six months ended June 30, 2021:
| PSUs | |||||||||||||||||||||||
| One-Year Program | Three-Year Program | ||||||||||||||||||||||
| Number of Awards | Weighted-Average Grant Date Fair Value | Number of Awards | Weighted-Average Grant Date Fair Value | ||||||||||||||||||||
| Unvested at January 1, 2021 | $ | $ | |||||||||||||||||||||
Granted(1) | |||||||||||||||||||||||
| Vested | ( | ( | |||||||||||||||||||||
| Forfeited | ( | ( | |||||||||||||||||||||
| Unvested at June 30, 2021 | $ | $ | |||||||||||||||||||||
____________
(1) Includes additional awards granted based on overachievement of performance parameters. Also includes target awards granted.
As of June 30, 2021, $2 million of total unrecognized compensation cost related to the one-year PSU program is expected to be recognized over a weighted-average period of 1.2 years. For the three-year PSU program, $54 million of total unrecognized compensation cost is expected to be recognized over a weighted-average period of 1.6 years.
Stock Options
A summary of stock option activity for the six months ended June 30, 2021 is as follows:
| Number of Stock Options | Weighted-Average Exercise Price | ||||||||||
| Outstanding at January 1, 2021 | $ | ||||||||||
Exercised(1) | ( | ||||||||||
Forfeited(1) | ( | ||||||||||
| Outstanding and exercisable at June 30, 2021 | $ | ||||||||||
The net cash proceeds from the exercise of 24,409 stock options for the six months ended June 30, 2021 was $1 million. The net cash proceeds from the exercise of 28,069 stock options for the three months ended June 30, 2020 and 55,265 stock options for the six months ended June 30, 2020 was $1
As of June 30, 2021, the aggregate pre-tax intrinsic value of the outstanding and exercisable stock options in the above table was $29 million and represents the difference between our closing stock price on June 30, 2021 of $175.80 and the exercise price, times the number of shares, which would have been received by the option holders had the option holders exercised their stock options on that date. This amount can change based on the fair market value of our common stock. As of June 30, 2021, the weighted-average remaining contractual term of the outstanding and exercisable stock options included in the above table was 5.5 years. As of June 30, 2020, 0.3 million outstanding stock options were exercisable and the weighted-average exercise price was $59.69 .
The total pre-tax intrinsic value of stock options exercised was $3 million for the three months ended June 30, 2020, $3 million for the six months ended June 30, 2021 and $5 million for the six months ended June 30, 2020.
ESPP
We have an ESPP under which approximately 4.3 million shares of our common stock were available for future issuance as of June 30, 2021. Under our ESPP, employees may purchase shares having a value not exceeding 10.0 % of their annual compensation, subject to applicable annual Internal Revenue Service limitations. We record compensation expense related to the 15.0 % discount that is given to our employees, which totaled $3 million for the three months ended June 30, 2021, $2 million for the three months ended June 30, 2020, $5 million for the six months ended June 30, 2021 and $3 million for the six months ended June 30, 2020.
21
11. NASDAQ STOCKHOLDERS' EQUITY
Common Stock
As of June 30, 2021, 300,000,000 shares of our common stock were authorized, 175,896,791 shares were issued and 169,227,636 shares were outstanding. As of December 31, 2020, 300,000,000 shares of our common stock were authorized, 171,278,761 shares were issued and 164,933,678 shares were outstanding. The holders of common stock are entitled to one 5.0
Common Stock in Treasury, at Cost
We account for the purchase of treasury stock under the cost method with the shares of stock repurchased reflected as a reduction to Nasdaq stockholders’ equity and included in common stock in treasury, at cost in the Condensed Consolidated Balance Sheets. Shares repurchased under our share repurchase program are currently retired and canceled and are therefore not included in the common stock in treasury balance. If treasury shares are reissued, they are recorded at the average cost of the treasury shares acquired. We held 6,669,155 shares of common stock in treasury as of June 30, 2021 and 6,345,083 shares as of December 31, 2020, most of which are related to shares of our common stock withheld for the settlement of employee tax withholding obligations arising from the vesting of restricted stock and PSUs.
Share Repurchase Program
As discussed in “2021 Divestiture,” of Note 4, “Acquisitions and Divestiture,” on June 16, 2021, our board of directors authorized an increase to our share repurchase program to an aggregate authorized amount of $1.5 billion. As of June 30, 2021, the remaining aggregate authorized amount under the existing share repurchase program was $1.46 billion.
These purchases may be made from time to time at prevailing market prices in open market purchases, privately-negotiated transactions, block purchase techniques or otherwise, as determined by our management. The purchases are primarily funded from existing cash balances. The share repurchase program may be suspended, modified or discontinued at any
time. The share repurchase program has no defined expiration date.
The following is a summary of our share repurchase activity, reported based on settlement date, for the six months ended June 30, 2021:
| Six Months Ended June 30, 2021 | ||||||||
Number of shares of common stock repurchased(1) | ||||||||
Average price paid per share | $ | |||||||
Total purchase price (in millions) | $ | |||||||
____________
(1) Excludes shares withheld upon vesting of restricted stock and PSUs of 324,072 for the six months ended June 30, 2021.
As discussed above in “Common Stock in Treasury, at Cost,” shares repurchased under our share repurchase program are currently retired and cancelled.
ASR Agreement
On July 21, 2021, we announced that we entered into an ASR agreement to repurchase $475 million of common stock, where we received an initial delivery of 2,039,940 shares of common stock on July 23, 2021. The ASR agreement was entered into pursuant to our $1.5 billion share repurchase authorization as discussed in "Share Repurchase Program," above. The final settlement under the ASR agreement is expected to be completed in the fourth quarter of 2021. At settlement, our counterparty may be required to deliver additional shares of common stock to us, or, under certain circumstances, we may be required to deliver shares of our common stock or may elect to make a cash payment to our counterparty.
Preferred Stock
Our certificate of incorporation authorizes the issuance of 30,000,000 0.01 no
* * * * * *
Cash Dividends on Common Stock
| Declaration Date | Dividend Per Common Share | Record Date | Total Amount Paid | Payment Date | ||||||||||||||||||||||
| (in millions) | ||||||||||||||||||||||||||
| January 27, 2021 | $ | March 12, 2021 | $ | March 26, 2021 | ||||||||||||||||||||||
| April 21, 2021 | June 11, 2021 | June 25, 2021 | ||||||||||||||||||||||||
| $ | ||||||||||||||||||||||||||
The total amount paid of $169 million was recorded in retained earnings in the Condensed Consolidated Balance Sheets at June 30, 2021.
22
In July 2021, the board of directors approved a regular quarterly cash dividend of $0.54 per share on our outstanding common stock. The dividend is payable on September 24, 2021 to shareholders of record at the close of business on September 10, 2021. The estimated amount of this dividend is $91 million. Future declarations of quarterly dividends and the establishment of future record and payment dates are subject to approval by the board of directors.
The board of directors maintains a dividend policy with the intention to provide stockholders with regular and growing dividends over the long term as earnings and cash flow grow.
12. EARNINGS PER SHARE
The following table sets forth the computation of basic and diluted earnings per share:
| Three Months Ended June 30, | Six Months Ended June 30, | ||||||||||||||||||||||
| 2021 | 2020 | 2021 | 2020 | ||||||||||||||||||||
| Numerator: | (in millions, except share and per share amounts) | ||||||||||||||||||||||
| Net income attributable to common shareholders | $ | $ | $ | $ | |||||||||||||||||||
| Denominator: | |||||||||||||||||||||||
Weighted-average common shares outstanding for basic earnings per share | |||||||||||||||||||||||
| Weighted-average effect of dilutive securities: | |||||||||||||||||||||||
Employee equity awards(1) | |||||||||||||||||||||||
Weighted-average common shares outstanding for diluted earnings per share | |||||||||||||||||||||||
Basic and diluted earnings per share: | |||||||||||||||||||||||
| Basic earnings per share | $ | $ | $ | $ | |||||||||||||||||||
| Diluted earnings per share | $ | $ | $ | $ | |||||||||||||||||||
____________
(1) PSUs, which are considered contingently issuable, are included in the computation of dilutive earnings per share on a weighted average basis when management determines that the applicable performance criteria would have been met if the performance period ended as of the date of the relevant computation.
Securities that were not included in the computation of diluted earnings per share because their effect was antidilutive were immaterial for the three months ended June 30, 2021 and for both six months ended June 30, 2021 and 2020. There were no securities excluded for the three months ended June 30, 2020.
13. FAIR VALUE OF FINANCIAL INSTRUMENTS
The following tables present our financial assets and financial liabilities that were measured at fair value on a recurring basis as of June 30, 2021 and December 31, 2020.
| June 30, 2021 | December 31, 2020 | ||||||||||||||||||||||||||||||||||||||||||||||
Total | Level 1 | Level 2 | Level 3 | Total | Level 1 | Level 2 | Level 3 | ||||||||||||||||||||||||||||||||||||||||
(in millions) | (in millions) | ||||||||||||||||||||||||||||||||||||||||||||||
Assets at Fair Value | |||||||||||||||||||||||||||||||||||||||||||||||
European government debt securities | $ | $ | $ | $ | $ | $ | $ | $ | |||||||||||||||||||||||||||||||||||||||
Corporate debt securities | |||||||||||||||||||||||||||||||||||||||||||||||
State owned enterprises and municipal securities | |||||||||||||||||||||||||||||||||||||||||||||||
Swedish mortgage bonds | |||||||||||||||||||||||||||||||||||||||||||||||
| Time deposits | |||||||||||||||||||||||||||||||||||||||||||||||
| Total assets at fair value | $ | $ | $ | $ | $ | $ | $ | $ | |||||||||||||||||||||||||||||||||||||||
Financial Instruments Not Measured at Fair Value on a Recurring Basis
Some of our financial instruments are not measured at fair value on a recurring basis but are recorded at amounts that approximate fair value due to their liquid or short-term
nature. Such financial assets and financial liabilities include: cash and cash equivalents, restricted cash and cash equivalents, receivables, net, certain other current assets, accounts payable and accrued expenses, Section 31 fees payable to SEC, accrued personnel costs, commercial paper and certain other current liabilities.
23
Our investment in OCC is accounted for under the equity method of accounting. We have elected the measurement alternative for the majority of our equity securities, which primarily represent various strategic investments made through our corporate venture program. See “Equity Method Investments,” and “Equity Securities,” of Note 6, “Investments,” for further discussion.
We also consider our debt obligations to be financial instruments. As of June 30, 2021, the majority of our debt obligations were fixed-rate obligations. We are exposed to changes in interest rates as a result of borrowings under our 2020 Credit Facility, as the interest rates on this facility have a variable rate depending on the maturity of the borrowing and the implied underlying reference rate. As of June 30, 2021, we had no outstanding borrowings under our 2020 Credit Facility. We are also exposed to changes in interest rates as a result of the amounts outstanding from the sale of commercial paper under our commercial paper program. The fair value of our debt obligations utilizing discounted cash flow analyses for our floating rate debt and prevailing market rates for our fixed rate debt was $5.9 billion as of June 30, 2021 and the fair value of our debt obligations utilizing prevailing market rates for our fixed rate debt was $5.9 billion as of December 31, 2020. The discounted cash flow analyses are based on borrowing rates currently available to us for debt with similar terms and maturities. The fair value of our commercial paper as of June 30, 2021 approximated the carrying value since the rates of interest on this short-term debt approximated market rates. Our commercial paper and our fixed rate and floating rate debt are categorized as Level 2 in the fair value hierarchy.
For further discussion of our debt obligations, see Note 8, “Debt Obligations.”
Non-Financial Assets Measured at Fair Value on a Non-Recurring Basis
Our non-financial assets, which include goodwill, intangible assets, and other long-lived assets, are not required to be carried at fair value on a recurring basis. Fair value measures of non-financial assets are primarily used in the impairment analysis of these assets. Any resulting asset impairment would require that the non-financial asset be recorded at its fair value. Nasdaq uses Level 3 inputs to measure the fair value of the above assets on a non-recurring basis. As of June 30, 2021 and December 31, 2020, there were no
14. CLEARING OPERATIONS
Nasdaq Clearing
Nasdaq Clearing is authorized and supervised under EMIR as a multi-asset clearinghouse by the SFSA. Such authorization is effective for all member states of the European Union and certain other non-member states that are part of the European Economic Area, including Norway. The clearinghouse acts as the CCP for exchange and OTC trades in equity derivatives, fixed income derivatives, resale and repurchase contracts,
power derivatives, emission allowance derivatives, and seafood derivatives.
Through our clearing operations in the financial markets, which include the resale and repurchase market, the commodities markets, and the seafood market, Nasdaq Clearing is the legal counterparty for, and guarantees the fulfillment of, each contract cleared. These contracts are not used by Nasdaq Clearing for the purpose of trading on its own behalf. As the legal counterparty of each transaction, Nasdaq Clearing bears the counterparty risk between the purchaser and seller in the contract. In its guarantor role, Nasdaq Clearing has precisely equal and offsetting claims to and from clearing members on opposite sides of each contract, standing as the CCP on every contract cleared. In accordance with the rules and regulations of Nasdaq Clearing, default fund and margin collateral requirements are calculated for each clearing member’s positions in accounts with the CCP. See “Default Fund Contributions and Margin Deposits” below for further discussion of Nasdaq Clearing’s default fund and margin requirements.
Nasdaq Clearing maintains four member sponsored default funds: one related to financial markets, one related to commodities markets, one related to the seafood market, and a mutualized fund. Under this structure, Nasdaq Clearing and its clearing members must contribute to the total regulatory capital related to the clearing operations of Nasdaq Clearing. This structure applies an initial separation of default fund contributions for the financial, commodities and seafood markets in order to create a buffer for each market’s counterparty risks. Simultaneously, a mutualized default fund provides capital efficiencies to Nasdaq Clearing’s members with regard to total regulatory capital required. See “Default Fund Contributions” below for further discussion of Nasdaq Clearing’s default fund. Power of assessment and a liability waterfall also have been implemented. See “Power of Assessment” and “Liability Waterfall” below for further discussion. These requirements align risk between Nasdaq Clearing and its clearing members.
Nasdaq Commodities Clearing Default
In September 2018, a member of the Nasdaq Clearing commodities market defaulted due to the inability to post sufficient collateral to cover increased margin requirements for the positions of the relevant member, which had experienced losses due to sharp adverse movements in the Nordic - German power market spread. Nasdaq Clearing followed default procedures and offset the future market risk on the defaulting member’s positions.
Immediately following the event, Nasdaq Clearing launched a comprehensive enhancement program to strengthen the resilience and robustness of the clearinghouse.
In December 2018, we initiated a capital relief program. The capital relief program was a voluntary program open to each commodities default fund participant; each such participant who agreed to the capital relief program received a proportion of the funds made available under the capital
24
relief program as reflected by their proportionate share of the aggregate of the clearing members' default fund replenishments.
Since the member default in 2018, Nasdaq Clearing has been working to maximize the recovery from the defaulted member. All funds recovered are applied towards the default fund participants on a pro rata basis. As of June 30, 2021, the expected recovery together with the capital relief program amounts to approximately 80 % of the initial loss, of which the majority has been paid and the remainder is expected to be paid during 2021.
In December 2018, the SFSA initiated a review of Nasdaq Clearing. In January 2021, the SFSA issued a warning combined with an administrative fine of approximately $35 million (SEK 300 million) to Nasdaq Clearing based on their review. Nasdaq Clearing has assessed the SFSA´s decision and has appealed the decision to the Administrative Court. As of June 30, 2021, no accrual has been recorded related to this matter as the outcome cannot be reasonably estimated.
Default Fund Contributions and Margin Deposits
As of June 30, 2021, clearing member default fund contributions and margin deposits were as follows:
| June 30, 2021 | |||||||||||||||||
| Cash Contributions | Non-Cash Contributions | Total Contributions | |||||||||||||||
| (in millions) | |||||||||||||||||
Default fund contributions | $ | $ | $ | ||||||||||||||
| Margin deposits | |||||||||||||||||
| Total | $ | $ | $ | ||||||||||||||
Of the total default fund contributions of $696 million, Nasdaq Clearing can utilize $636 million as capital resources in the event of a counterparty default. The remaining balance of $60 million pertains to member posted surplus balances.
Our clearinghouse holds material amounts of clearing member cash deposits which are held or invested primarily to provide security of capital while minimizing credit, market and liquidity risks. While we seek to achieve a reasonable rate of return, we are primarily concerned with preservation of capital and managing the risks associated with these deposits.
Clearing member cash contributions are maintained in demand deposits held at central banks and large, highly rated financial institutions or secured through direct investments, primarily central bank certificates and highly rated European government debt securities with original maturities primarily 1 year or less, reverse repurchase agreements and multilateral development bank debt securities. Investments in reverse repurchase agreements are secured with highly rated government securities with maturity dates that range from 1 day to 13 days. The carrying value of these securities approximates their fair value due to the short-term nature of the instruments and reverse repurchase agreements.
Nasdaq Clearing has invested the total cash contributions of $3,579 million as of June 30, 2021 and $3,942 million as of December 31, 2020, in accordance with its investment policy as follows:
| June 30, 2021 | December 31, 2020 | ||||||||||
| (in millions) | |||||||||||
| Demand deposits | $ | $ | |||||||||
| Central bank certificates | |||||||||||
European government debt securities | |||||||||||
Reverse repurchase agreements | |||||||||||
| Multilateral development bank debt securities | |||||||||||
Total | $ | $ | |||||||||
In the investment activity related to default fund and margin contributions, we are exposed to counterparty risk related to reverse repurchase agreement transactions, which reflect the risk that the counterparty might become insolvent and, thus, fail to meet its obligations to Nasdaq Clearing. We mitigate this risk by only engaging in transactions with high credit quality reverse repurchase agreement counterparties and by limiting the acceptable collateral under the reverse repurchase agreement to high quality issuers, primarily government securities and other securities explicitly guaranteed by a government. The value of the underlying security is monitored during the lifetime of the contract, and in the event the market value of the underlying security falls below the reverse repurchase amount, our clearinghouse may require additional collateral or a reset of the contract.
Default Fund Contributions
Required contributions to the default funds are proportional to the exposures of each clearing member. When a clearing member is active in more than one market, contributions must be made to all markets’ default funds in which the member is active. Clearing members’ eligible contributions may include cash and non-cash contributions. Cash contributions received are maintained in demand deposits held at central banks and large, highly rated financial institutions or invested by Nasdaq Clearing, in accordance with its investment policy, either in central bank certificates, highly rated government debt securities, reverse repurchase agreements with highly rated government debt securities as collateral, or multilateral development bank debt securities. Nasdaq Clearing maintains and manages all cash deposits related to margin collateral. All risks and rewards of collateral ownership, including interest, belong to Nasdaq Clearing. Clearing members’ cash contributions are included in default funds and margin deposits in the Condensed Consolidated Balance Sheets as both a current asset and a current liability. Non-cash contributions include highly rated government debt securities that must meet specific criteria approved by Nasdaq Clearing. Non-cash contributions are pledged assets that are not recorded in the Condensed
25
Consolidated Balance Sheets as Nasdaq Clearing does not take legal ownership of these assets and the risks and rewards remain with the clearing members. These balances may fluctuate over time due to changes in the amount of deposits required and whether members choose to provide cash or non-cash contributions. Assets pledged are held at a nominee account in Nasdaq Clearing’s name for the benefit of the clearing members and are immediately accessible by Nasdaq Clearing in the event of a default. In addition to clearing members’ required contributions to the liability waterfall, Nasdaq Clearing is also required to contribute capital to the liability waterfall and overall regulatory capital as specified under its clearinghouse rules. As of June 30, 2021, Nasdaq Clearing committed capital totaling $141 million to the liability waterfall and overall regulatory capital, in the form of government debt securities, which are recorded as financial investments in the Condensed Consolidated Balance Sheets. The combined regulatory capital of the clearing members and Nasdaq Clearing is intended to secure the obligations of a clearing member exceeding such member’s own margin and default fund deposits and may be used to cover losses sustained by a clearing member in the event of a default.
Margin Deposits
Nasdaq Clearing requires all clearing members to provide collateral, which may consist of cash and non-cash contributions, to guarantee performance on the clearing members’ open positions, or initial margin. In addition, clearing members must also provide collateral to cover the daily margin call if needed. See “Default Fund Contributions” above for further discussion of cash and non-cash contributions.
Similar to default fund contributions, Nasdaq Clearing maintains and manages all cash deposits related to margin collateral. All risks and rewards of collateral ownership, including interest, belong to Nasdaq Clearing and are recorded in revenues. These cash deposits are recorded in default funds and margin deposits in the Condensed Consolidated Balance Sheets as both a current asset and a current liability. Pledged margin collateral is not recorded in our Condensed Consolidated Balance Sheets as all risks and rewards of collateral ownership, including interest, belong to the counterparty. Assets pledged are held at a nominee account in Nasdaq Clearing’s name for the benefit of the clearing members and are immediately accessible by Nasdaq Clearing in the event of a default.
Nasdaq Clearing marks to market all outstanding contracts and requires payment from clearing members whose positions have lost value. The mark-to-market process helps identify any clearing members that may not be able to satisfy their financial obligations in a timely manner allowing Nasdaq Clearing the ability to mitigate the risk of a clearing member defaulting due to exceptionally large losses. In the event of a default, Nasdaq Clearing can access the defaulting member’s margin and default fund deposits to cover the defaulting member’s losses.
Regulatory Capital and Risk Management Calculations
Nasdaq Clearing manages risk through a comprehensive counterparty risk management framework, which is comprised of policies, procedures, standards and financial resources. The level of regulatory capital is determined in accordance with Nasdaq Clearing’s regulatory capital and default fund policy, as approved by the SFSA. Regulatory capital calculations are continuously updated through a proprietary capital-at-risk calculation model that establishes the appropriate level of capital.
As mentioned above, Nasdaq Clearing is the legal counterparty for each contract cleared and thereby guarantees the fulfillment of each contract. Nasdaq Clearing accounts for this guarantee as a performance guarantee. We determine the fair value of the performance guarantee by considering daily settlement of contracts and other margining and default fund requirements, the risk management program, historical evidence of default payments, and the estimated probability of potential default payouts. The calculation is determined using proprietary risk management software that simulates gains and losses based on historical market prices, extreme but plausible market scenarios, volatility and other factors present at that point in time for those particular unsettled contracts. Based on this analysis, excluding any liability related to the Nasdaq commodities clearing default (see discussion above), the estimated liability was nominal and no liability was recorded as of June 30, 2021.
Power of Assessment
To further strengthen the contingent financial resources of the clearinghouse, Nasdaq Clearing has power of assessment that provides the ability to collect additional funds from its clearing members to cover a defaulting member’s remaining obligations up to the limits established under the terms of the clearinghouse rules. The power of assessment corresponds to 230.0 % of the clearing member’s aggregate contribution to the financial, commodities and seafood markets’ default funds.
Liability Waterfall
The liability waterfall is the priority order in which the capital resources would be utilized in the event of a default where the defaulting clearing member’s collateral would not be sufficient to cover the cost to settle its portfolio. If a default occurs and the defaulting clearing member’s collateral, including cash deposits and pledged assets, is depleted, then capital is utilized in the following amount and order:
•junior capital contributed by Nasdaq Clearing, which totaled $38 million as of June 30, 2021;
•a loss sharing pool related only to the financial market that is contributed to by clearing members and only applies if the defaulting member’s portfolio includes interest rate swap products;
•specific market default fund where the loss occurred (i.e., the financial, commodities, or seafood market),
26
which includes capital contributions of the clearing members on a pro-rata basis;
•senior capital contributed to each specific market by Nasdaq Clearing, calculated in accordance with clearinghouse rules, which totaled $23 million as of June 30, 2021; and
•mutualized default fund, which includes capital contributions of the clearing members on a pro-rata basis.
If additional funds are needed after utilization of the liability waterfall, or if part of the waterfall has been utilized and needs to be replenished, then Nasdaq Clearing will utilize its power of assessment and additional capital contributions will be required by non-defaulting members up to the limits established under the terms of the clearinghouse rules.
In addition to the capital held to withstand counterparty defaults described above, Nasdaq Clearing also has committed capital of $80 million to ensure that it can handle an orderly wind-down of its operation, and that it is adequately protected against investment, operational, legal, and business risks.
Market Value of Derivative Contracts Outstanding
The following table includes the market value of derivative contracts outstanding prior to netting:
| June 30, 2021 | |||||
| (in millions) | |||||
Commodity and seafood options, futures and forwards(1)(2)(3) | $ | ||||
Fixed-income options and futures(1)(2) | |||||
Stock options and futures(1)(2) | |||||
Index options and futures(1)(2) | |||||
| Total | $ | ||||
____________
(1)We determined the fair value of our option contracts using standard valuation models that were based on market-based observable inputs including implied volatility, interest rates and the spot price of the underlying instrument.
(2)We determined the fair value of our futures contracts based upon quoted market prices and average quoted market yields.
(3)We determined the fair value of our forward contracts using standard valuation models that were based on market-based observable inputs including benchmark rates and the spot price of the underlying instrument.
Derivative Contracts Cleared
The following table includes the total number of derivative contracts cleared through Nasdaq Clearing for the six months ended June 30, 2021 and 2020:
| June 30, 2021 | June 30, 2020 | ||||||||||
Commodity and seafood options, futures and forwards(1) | |||||||||||
Fixed-income options and futures | |||||||||||
| Stock options and futures | |||||||||||
| Index options and futures | |||||||||||
| Total | |||||||||||
____________
(1) The total volume in cleared power related to commodity contracts was 456 Terawatt hours (TWh) for the six months ended June 30, 2021 and 475 TWh for the six months ended June 30, 2020.
The outstanding contract value of resale and repurchase agreements was $4.4 billion as of June 30, 2021 and $1.4 billion as of June 30, 2020. The total number of resale and repurchase agreements contracts cleared was 2,924,130 for the six months ended June 30, 2021 and was 2,635,348 for the six months ended June 30, 2020.
15. LEASES
We have operating leases which are primarily real estate leases predominantly for our U.S. and European headquarters and for general office space. The following table provides supplemental balance sheet information related to Nasdaq's operating leases:
| Leases | Balance Sheet Classification | June 30, 2021 | December 31, 2020 | |||||||||||||||||
| (in millions) | ||||||||||||||||||||
| Assets: | ||||||||||||||||||||
Operating lease assets | Operating lease assets | $ | $ | |||||||||||||||||
| Liabilities: | ||||||||||||||||||||
Current lease liabilities | $ | $ | ||||||||||||||||||
Non-current lease liabilities | Operating lease liabilities | |||||||||||||||||||
| Total lease liabilities | $ | $ | ||||||||||||||||||
27
The following table summarizes Nasdaq's lease cost:
| Three Months Ended June 30, | Six Months Ended June 30, | |||||||||||||||||||||||||
| 2021 | 2020 | 2021 | 2020 | |||||||||||||||||||||||
| (in millions) | ||||||||||||||||||||||||||
Operating lease cost(1) | $ | $ | $ | $ | ||||||||||||||||||||||
| Variable lease cost | ||||||||||||||||||||||||||
| Sublease income | ( | ( | ( | ( | ||||||||||||||||||||||
| Total lease cost | $ | $ | $ | $ | ||||||||||||||||||||||
____________
(1) Includes short-term lease cost, which was immaterial.
The following table reconciles the undiscounted cash flows for each of the first five years and total of the remaining years to the operating lease liabilities recorded in our Condensed Consolidated Balance Sheets.
| June 30, 2021 | ||||||||
| (in millions) | ||||||||
| Remainder of 2021 | $ | |||||||
| 2022 | ||||||||
| 2023 | ||||||||
| 2024 | ||||||||
| 2025 | ||||||||
| 2026 and thereafter | ||||||||
| Total lease payments | ||||||||
Less: interest(1) | ( | |||||||
Present value of lease liabilities(2) | $ | |||||||
____________
(1) Calculated using the interest rate for each lease.
(2) Includes the current portion of $43 million.
The following table provides information related to Nasdaq's lease term and discount rate:
| June 30, 2021 | ||||||||
Weighted-average remaining lease term (in years) | ||||||||
| Weighted-average discount rate | % | |||||||
The following table provides supplemental cash flow information related to Nasdaq's operating leases:
| Six Months End June 30, | ||||||||||||||
| 2021 | 2020 | |||||||||||||
| (in millions) | ||||||||||||||
Cash paid for amounts included in the measurement of operating lease liabilities | $ | $ | ||||||||||||
Lease assets obtained in exchange for new operating lease liabilities | $ | $ | ||||||||||||
16. INCOME TAXES
Income Tax Provision
The following table shows our income tax provision and effective tax rate:
| Three Months Ended June 30, | |||||||||||
| 2021 | 2020 | ||||||||||
| (in millions) | |||||||||||
| Income tax provision | $ | $ | |||||||||
| Effective tax rate | % | % | |||||||||
| Six Months Ended June 30, | |||||||||||
| 2021 | 2020 | ||||||||||
| (in millions) | |||||||||||
| Income tax provision | $ | $ | |||||||||
| Effective tax rate | % | % | |||||||||
The higher effective tax rate for the three and six months ended June 30, 2021 was primarily due to a tax benefit recorded in 2020 for compensation deductions which were previously disallowed, partially offset by 2021 tax benefits resulting from lower tax on foreign earnings mainly due to a decrease in the Swedish corporate tax rate and a higher tax benefit from vested share-based awards in the U.S.
The effective tax rate may vary from period to period depending on, among other factors, the geographic and business mix of earnings and losses. These same and other factors, including history of pre-tax earnings and losses, are taken into account in assessing the ability to realize deferred tax assets.
Tax Audits
Nasdaq and its eligible subsidiaries file a consolidated U.S. federal income tax return, applicable state and local income tax returns and non-U.S. income tax returns. We are subject to examination by federal, state and local, and foreign tax authorities. Federal income tax returns for the years 2012 through 2016 are currently under examination by the Internal Revenue Service and we are subject to examination by the Internal Revenue Service for 2017 through 2019. Several state tax returns are currently under examination by the respective tax authorities for the years 2012 through 2018, while 2019 is subject to examination. Non-U.S. tax returns are subject to examination by the respective tax authorities for the years 2015 through 2019.
We regularly assess the likelihood of additional assessments by each jurisdiction and have established tax reserves that we believe are adequate in relation to the potential for additional assessments. Examination outcomes and the timing of examination settlements are subject to uncertainty. Although the results of such examinations may have an impact on our unrecognized tax benefits, we do not anticipate that such impact will be material to our condensed consolidated financial position or results of operations, but may be material to our operating results for a particular period and the effective tax rate for that period. We do not expect the
28
17. COMMITMENTS, CONTINGENCIES AND GUARANTEES
Guarantees Issued and Credit Facilities Available
In addition to the default fund contributions and margin collateral pledged by clearing members discussed in Note 14, “Clearing Operations,” we have obtained financial guarantees and credit facilities which are guaranteed by us through counter indemnities, to provide further liquidity related to our clearing businesses. Financial guarantees issued to us totaled $5 223 million as of June 30, 2021 and $232 million as of December 31, 2020 in available liquidity, none
Other Guarantees
Through our clearing operations in the financial markets, Nasdaq Clearing is the legal counterparty for, and guarantees the performance of, its clearing members. See Note 14, “Clearing Operations,” for further discussion of Nasdaq Clearing performance guarantees.
We have provided a guarantee related to lease obligations for The Nasdaq Entrepreneurial Center, Inc., which is a not-for-profit organization designed to convene, connect and engage aspiring and current entrepreneurs. This entity is not included in the condensed consolidated financial statements of Nasdaq.
We believe that the potential for us to be required to make payments under these arrangements is unlikely. Accordingly, no contingent liability is recorded in the Condensed Consolidated Balance Sheets for the above guarantees.
Routing Brokerage Activities
One of our broker-dealer subsidiaries, Nasdaq Execution Services, provides a guarantee to securities clearinghouses and exchanges under its standard membership agreements, which require members to guarantee the performance of other members. If a member becomes unable to satisfy its obligations to a clearinghouse or exchange, other members would be required to meet its shortfalls. To mitigate these performance risks, the exchanges and clearinghouses often require members to post collateral, as well as meet certain minimum financial standards. Nasdaq Execution Services’ maximum potential liability under these arrangements cannot be quantified. However, we believe that the potential for Nasdaq Execution Services to be required to make payments under these arrangements is unlikely. Accordingly, no contingent liability is recorded in the Condensed Consolidated Balance Sheets for these arrangements.
Legal and Regulatory Matters
Litigation
As previously disclosed, we are named as one of many defendants in City of Providence v. BATS Global Markets, Inc., et al., 14 Civ. 2811 (S.D.N.Y.), which was filed on April 18, 2014 in the United States District Court for the Southern District of New York. The district court appointed lead counsel, who filed an amended complaint on September 2, 2014. The amended complaint names as defendants seven national exchanges, as well as Barclays PLC, which operated a private alternative trading system. On behalf of a putative class of securities traders, the plaintiffs allege that the defendants engaged in a scheme to manipulate the markets through high-frequency trading; the amended complaint asserts claims against us under Section 10(b) of the Exchange Act and Rule 10b-5, as well as under Section 6(b) of the Exchange Act. The plaintiffs seek injunctive and monetary relief of an unspecified amount. We filed a motion to dismiss the amended complaint on November 3, 2014. In response, the plaintiffs filed a second amended complaint on November 24, 2014, which names the same defendants and alleges essentially the same violations. We then filed a motion to dismiss the second amended complaint on January 23, 2015. On August 26, 2015, the district court entered an order dismissing the second amended complaint in its entirety. The plaintiffs appealed the judgment of dismissal to the United States Court of Appeals for the Second Circuit (although opting not to appeal the dismissal with respect to Barclays PLC or the dismissal of claims under Section 6(b) of the Exchange Act). On December 19, 2017, the Second Circuit issued an opinion vacating the district court’s judgment of dismissal and remanding to the district court for further proceedings. On May 18, 2018, the exchanges filed a motion to dismiss the amended complaint, raising issues not addressed in the proceedings to date. On May 28, 2019, the district court denied the exchanges’ renewed motion to dismiss, leading the parties to commence the discovery process. Discovery, focused on issues of whether the case can be certified as a class action and whether the plaintiffs’ claims are precluded by federal securities regulation, ended on April 26, 2021, and potentially dispositive motions regarding these issues were filed on May 28, 2021. Given the preliminary nature of the proceedings, we are unable to estimate what, if any, liability may result from this litigation. However, we believe that the claims are without merit and will continue to litigate vigorously.
Armenian Stock Exchange Investigation
As disclosed in our prior filings with the SEC, a former non-U.S. subsidiary of Nasdaq, NASDAQ OMX Armenia OJSC, operated the Armenian Stock Exchange and the Central Depository of Armenia, which are regulated by the Central Bank of Armenia under Armenian law. In accordance with the requirements of Armenian law, Mellat Bank SB CJSC, an Armenian entity that is designated under Executive Order 13382, was a market participant on the Armenian Stock Exchange and, as a result, paid participation and transaction
29
fees to the Armenian Stock Exchange during the period from 2012-2014. In 2014, we voluntarily self-disclosed this matter to the U.S. Department of Treasury’s Office of Foreign Assets Control, or OFAC, and received authorization from OFAC to continue, if necessary, certain activities pertaining to Mellat Bank SB CJSC in Armenia in a limited manner. In 2015, Nasdaq sold a majority of its ownership of Nasdaq OMX Armenia OJSC, with the remaining minority interest sold in 2018.
OFAC has been conducting an inquiry into the Armenian Stock Exchange matter described above and in our prior filings since 2016, and during the first quarter of 2021, we were advised that OFAC is considering a civil monetary penalty in connection with that matter. We are currently in discussions with OFAC.
While we believe our decision to voluntarily self-report this issue and our continued cooperation with OFAC, along with the permit we received from OFAC in connection with our transactions involving the Armenian Stock Exchange, will be mitigating factors with respect to the matter, any monetary fines or restrictions may nonetheless be material to our financial results in the period in which they are imposed. We cannot currently predict when our discussions with OFAC will conclude or the amount of any potential penalties imposed. Accordingly, we are unable to reasonably estimate any potential loss or range of loss and we have not accrued for a loss contingency.
Nasdaq Commodities Clearing Default
During September 2018, a clearing member of Nasdaq Clearing's commodities market was declared in default. In December 2018, the SFSA initiated a review of Nasdaq Clearing. We have been cooperating fully with the SFSA in their review. In January 2021, the SFSA issued a warning combined with an administrative fine of approximately $35 million (SEK 300 million) to Nasdaq Clearing relating to its review. Nasdaq Clearing has assessed the SFSA's decision and has appealed the decision to the Administrative Court. See “Nasdaq Commodities Clearing Default,” of Note 14, “Clearing Operations,” for further information.
Other Matters
Except as disclosed above and in prior reports filed under the Exchange Act, we are not currently a party to any litigation or proceeding that we believe could have a material adverse
effect on our business, condensed consolidated financial condition, or operating results. However, from time to time, we have been threatened with, or named as a defendant in, lawsuits or involved in regulatory proceedings.
In the normal course of business, Nasdaq discusses matters with its regulators raised during regulatory examinations or otherwise subject to their inquiries. Management believes that censures, fines, penalties or other sanctions that could result from any ongoing examinations or inquiries will not have a material impact on its condensed consolidated financial position or results of operations. However, we are unable to predict the outcome or the timing of the ultimate resolution of these matters, or the potential fines, penalties or injunctive or other equitable relief, if any, that may result from these matters.
Tax Audits
We are engaged in ongoing discussions and audits with taxing authorities on various tax matters, the resolutions of which are uncertain. Currently, there are matters that may lead to assessments, some of which may not be resolved for several years. Based on currently available information, we believe we have adequately provided for any assessments that could result from those proceedings where it is more likely than not that we will be assessed. We review our positions on these matters as they progress. See “Tax Audits,” of Note 16, “Income Taxes,” for further discussion.
18. BUSINESS SEGMENTS
We manage, operate and provide our products and services in four business segments: Market Services, Corporate Platforms, Investment Intelligence and Market Technology. See Note 1, “Organization and Nature of Operations,” for further discussion of our reportable segments.
Our management allocates resources, assesses performance and manages these businesses as four separate segments. We evaluate the performance of our segments based on several factors, of which the primary financial measure is operating income. Results of individual businesses are presented based on our management accounting practices and structure. Our chief operating decision maker does not review total assets or statements of income below operating income by segments as key performance metrics; therefore, such information is not presented below.
30
The following table presents certain information regarding our business segments for the three and six months ended June 30, 2021 and 2020:
| Market Services | Corporate Platforms | Investment Intelligence | Market Technology | Corporate Items | Consolidated | ||||||||||||||||||||||||||||||
| (in millions) | |||||||||||||||||||||||||||||||||||
| Three Months Ended June 30, 2021 | |||||||||||||||||||||||||||||||||||
| Total revenues | $ | $ | $ | $ | $ | $ | |||||||||||||||||||||||||||||
| Transaction-based expenses | ( | ( | |||||||||||||||||||||||||||||||||
| Revenues less transaction-based expenses | |||||||||||||||||||||||||||||||||||
| Operating income (loss) | ( | ||||||||||||||||||||||||||||||||||
| Three Months Ended June 30, 2020 | |||||||||||||||||||||||||||||||||||
| Total revenues | $ | $ | $ | $ | $ | $ | |||||||||||||||||||||||||||||
| Transaction-based expenses | ( | ( | |||||||||||||||||||||||||||||||||
| Revenues less transaction-based expenses | |||||||||||||||||||||||||||||||||||
| Operating income (loss) | ( | ||||||||||||||||||||||||||||||||||
| Six Months Ended June 30, 2021 | |||||||||||||||||||||||||||||||||||
| Total revenues | $ | $ | $ | $ | $ | $ | |||||||||||||||||||||||||||||
| Transaction-based expenses | ( | ( | |||||||||||||||||||||||||||||||||
| Revenues less transaction-based expenses | |||||||||||||||||||||||||||||||||||
| Operating income (loss) | ( | ||||||||||||||||||||||||||||||||||
| Six Months Ended June 30, 2020 | |||||||||||||||||||||||||||||||||||
| Total revenues | $ | $ | $ | $ | $ | $ | |||||||||||||||||||||||||||||
| Transaction-based expenses | ( | ( | |||||||||||||||||||||||||||||||||
| Revenues less transaction-based expenses | |||||||||||||||||||||||||||||||||||
| Operating income (loss) | ( | ||||||||||||||||||||||||||||||||||
Certain amounts are allocated to corporate items in our management reports as we believe they do not contribute to a meaningful evaluation of a particular segment's ongoing operating performance. These items, which are shown in the table below, include the following:
•Amortization expense of acquired intangible assets: We amortize intangible assets acquired in connection with various acquisitions. Intangible asset amortization expense can vary from period to period due to episodic acquisitions completed, rather than from our ongoing business operations. As such, if intangible asset amortization is included in performance measures, it is more difficult to assess the day-to-day operating performance of the segments, and the relative operating performance of the segments between periods. Management does not consider intangible asset amortization expense for the purpose of evaluating the performance of our segments or their managers or when making decisions to allocate resources. Therefore, we believe performance measures excluding intangible asset amortization expense provide management with a useful representation of our segments' ongoing activity in each period.
•Merger and strategic initiatives expense: We have pursued various strategic initiatives and completed acquisitions and divestitures in recent years that have
resulted in expenses which would not have otherwise been incurred. These expenses generally include integration costs, as well as legal, due diligence and other third party transaction costs. The frequency and the amount of such expenses vary significantly based on the size, timing and complexity of the transaction. Management does not consider merger and strategic initiatives expense for the purpose of evaluating the performance of our segments or their managers or when making decisions to allocate resources. Therefore, we believe performance measures excluding merger and strategic initiatives expense provide management with a useful representation of our segments' ongoing activity in each period.
•Restructuring charges: We initiated the transition of certain technology platforms to advance our strategic opportunities as a technology and analytics provider and continue the re-alignment of certain business areas. See Note 19, “Restructuring Charges,” for further discussion of our 2019 restructuring plan. We believe performance measures excluding restructuring charges provide management with a useful representation of our segments' ongoing activity in each period.
•Other significant items: We have included certain other charges or gains in corporate items, to the extent we believe they should be excluded when evaluating the
31
ongoing operating performance of each individual segment. For the three and six months ended June 30, 2020, other significant items included charitable donations made to the Nasdaq Foundation, COVID-19 response and relief efforts and social justice charities, which are recorded in general, administrative and other expense in our Condensed Consolidated Statements of
Income. The first six months of 2020 also included a loss on extinguishment of debt which is recorded in general, administrative and other expense in our Condensed Consolidated Statements of Income.
* * * * * *
A summary of our Corporate Items is as follows:
| Three Months Ended June 30, | Six Months Ended June 30, | ||||||||||||||||||||||
| 2021 | 2020 | 2021 | 2020 | ||||||||||||||||||||
| (in millions) | |||||||||||||||||||||||
| Expenses: | |||||||||||||||||||||||
Amortization expense of acquired intangible assets | $ | $ | $ | $ | |||||||||||||||||||
Merger and strategic initiatives expense | |||||||||||||||||||||||
| Restructuring charges | |||||||||||||||||||||||
| Extinguishment of debt | |||||||||||||||||||||||
| Charitable donations | |||||||||||||||||||||||
| Other | |||||||||||||||||||||||
| Total expenses | |||||||||||||||||||||||
| Operating loss | $ | ( | $ | ( | $ | ( | $ | ( | |||||||||||||||
For further discussion of our segments’ results, see "Segment Operating Results," of “Item 2. Management’s Discussion and Analysis of Financial Condition and Results of Operations.”
19. RESTRUCTURING CHARGES
In September 2019, we initiated the transition of certain technology platforms to advance the company's strategic opportunities as a technology and analytics provider and continue the re-alignment of certain business areas. In connection with these restructuring efforts, we retired certain elements of our marketplace infrastructure and technology product offerings as we implement NFF and other technologies internally and externally. This represented a fundamental shift in our strategy and technology as well as executive re-alignment. In June 2021, we completed our 2019 restructuring plan and recognized total pre-tax charges of $118 million over a two-year period. Total pre-tax charges related primarily to non-cash items such as asset impairments and accelerated depreciation, and third-party consulting costs. Severance and employee-related charges were also incurred.
The following table presents a summary of the 2019 restructuring plan charges in the Condensed Consolidated Statements of Income for the three and six months ended June 30, 2021 and 2020 which primarily consisted of consulting services, asset impairment charges primarily related to capitalized software that was retired, and accelerated depreciation expense on certain assets as a result of a decrease in their useful life.
| Three Months Ended June 30, | Six Months Ended June 30, | ||||||||||||||||||||||
| 2021 | 2020 | 2021 | 2020 | ||||||||||||||||||||
| (in millions) | |||||||||||||||||||||||
Asset impairment charges and accelerated depreciation expense | $ | $ | $ | $ | |||||||||||||||||||
| Consulting services | |||||||||||||||||||||||
| Contract terminations | |||||||||||||||||||||||
Severance and employee-related costs | |||||||||||||||||||||||
| Other | |||||||||||||||||||||||
| Total restructuring charges | $ | $ | $ | $ | |||||||||||||||||||
32
Item 2. MANAGEMENT'S DISCUSSION AND ANALYSIS OF FINANCIAL CONDITION AND RESULTS OF OPERATIONS
The following discussion and analysis of the financial condition and results of operations of Nasdaq should be read in conjunction with our condensed consolidated financial statements and related notes included in this Form 10-Q.
OVERVIEW
Nasdaq is a global technology company serving the capital markets and other industries. Our diverse offerings of data, analytics, software and services enables clients to optimize and execute their business vision with confidence.
We manage, operate and provide our products and services in four business segments: Market Services, Corporate Platforms, Investment Intelligence and Market Technology.
Second Quarter 2021 and Recent Developments
Cash Dividend on Common Stock
• In July 2021, the board of directors approved a regular quarterly cash dividend of $0.54 per share on our outstanding common stock.
• For the three months ended June 30, 2021, we returned $88 million to shareholders through dividend payments.
Share Repurchase Program
•In June 2021, our board of directors authorized an increase to our share repurchase program to an aggregate authorized amount of $1.5 billion to facilitate repurchases of shares of Nasdaq common stock in order to offset dilution related to the accelerated share issuance of approximately 6.2 million shares resulting from the sale of our U.S. Fixed Income business.
•During the three months ended June 30, 2021, we repurchased 1,501,931 common shares at a cost of $248 million. As of June 30, 2021, the remaining amount authorized for share repurchases under our share repurchase program was $1.46 billion.
•In July 2021, we entered into an ASR agreement to repurchase an additional $475 million of shares and received an initial delivery of 2,039,940 shares of common stock. We expect to receive the remaining shares in the fourth quarter of 2021. We expect the remaining planned repurchases related to the sale of our U.S. Fixed Income business to occur in 2022 and 2023.
Corporate Highlights
•In June 2021, we completed the sale of our U.S. Fixed Income business, which was part of our FICC business within our Market Services segment to Tradeweb Markets Inc., or Tradeweb and recognized a pre-tax gain on the sale of $84 million, net of disposal costs. This decision aligns with our corporate strategy to concentrate our resources and capital to maximize our potential as a major technology and analytics provider to the global capital markets.
•In June 2021, we acquired a majority stake in Puro.earth, a leading marketplace for carbon removal and the world's first marketplace to offer industrial carbon removal instruments that are verifiable and tradable through an open, online platform. We also launched the ESG Data Hub that connects investors with expert-led ESG data sets from leading providers across a wide spectrum of areas, including gender diversity, carbon emissions and climate risk.
•Overall AUM in ETPs benchmarked to our proprietary indexes totaled $415 billion as of June 30, 2021, an increase of 53% compared to June 30, 2020. Index and Analytics revenues saw increases of 57% and 14%, respectively, versus the second quarter of 2020. Index growth was driven by increased demand for both licensed ETPs and licensed index futures contracts, with 15 new licensed ETPs introduced in the quarter, including 12 ETPs that were launched outside the U.S., marking continued international growth.
•The Nasdaq Stock Market led U.S. exchanges with a 78% total IPO win rate. During the three months ended June 30, 2021, we welcomed 135 IPOs, representing $32 billion in capital raised, including 88 operating company IPOs, as well as 47 SPAC IPOs.
•Our U.S. options exchanges traded 782 million multiply-listed equity option contracts, an increase of 28% year over year, and led all exchanges during the period in total volume traded for options inclusive of both multiply-listed equity options and index options products.
33
NASDAQ'S OPERATING RESULTS
Key Drivers
The following table and charts include key drivers and other metrics for our Market Services, Corporate Platforms, Investment Intelligence and Market Technology segments. In evaluating the performance of our business, our senior management closely evaluates these key drivers.
| Three Months Ended June 30, | Six Months Ended June 30, | |||||||||||||||||||||||||
| 2021 | 2020 | 2021 | 2020 | |||||||||||||||||||||||
| Market Services | ||||||||||||||||||||||||||
| Equity Derivative Trading and Clearing | ||||||||||||||||||||||||||
| U.S. equity options | ||||||||||||||||||||||||||
| Total industry average daily volume (in millions) | 34.6 | 26.6 | 37.3 | 26.0 | ||||||||||||||||||||||
| Nasdaq PHLX matched market share | 12.7 | % | 11.4 | % | 12.8 | % | 12.1 | % | ||||||||||||||||||
| The Nasdaq Options Market matched market share | 8.4 | % | 10.4 | % | 8.1 | % | 10.5 | % | ||||||||||||||||||
| Nasdaq BX Options matched market share | 1.1 | % | 0.2 | % | 0.9 | % | 0.2 | % | ||||||||||||||||||
| Nasdaq ISE Options matched market share | 6.1 | % | 8.3 | % | 7.0 | % | 8.3 | % | ||||||||||||||||||
| Nasdaq GEMX Options matched market share | 6.1 | % | 5.6 | % | 6.0 | % | 4.7 | % | ||||||||||||||||||
| Nasdaq MRX Options matched market share | 1.5 | % | 0.5 | % | 1.4 | % | 0.5 | % | ||||||||||||||||||
| Total matched market share executed on Nasdaq’s exchanges | 35.9 | % | 36.4 | % | 36.2 | % | 36.3 | % | ||||||||||||||||||
| Nasdaq Nordic and Nasdaq Baltic options and futures | ||||||||||||||||||||||||||
Total average daily volume of options and futures contracts(1) | 262,890 | 292,551 | 311,016 | 377,201 | ||||||||||||||||||||||
| Cash Equity Trading | ||||||||||||||||||||||||||
| Total U.S.-listed securities | ||||||||||||||||||||||||||
| Total industry average daily share volume (in billions) | 10.6 | 12.4 | 12.6 | 11.7 | ||||||||||||||||||||||
| Matched share volume (in billions) | 114.2 | 142.7 | 266.8 | 269.9 | ||||||||||||||||||||||
| The Nasdaq Stock Market matched market share | 15.8 | % | 16.8 | % | 15.8 | % | 16.8 | % | ||||||||||||||||||
| Nasdaq BX matched market share | 0.7 | % | 0.9 | % | 0.6 | % | 1.1 | % | ||||||||||||||||||
| Nasdaq PSX matched market share | 0.7 | % | 0.6 | % | 0.7 | % | 0.6 | % | ||||||||||||||||||
| Total matched market share executed on Nasdaq’s exchanges | 17.2 | % | 18.3 | % | 17.1 | % | 18.5 | % | ||||||||||||||||||
| Market share reported to the FINRA/Nasdaq Trade Reporting Facility | 35.3 | % | 31.5 | % | 35.3 | % | 30.9 | % | ||||||||||||||||||
Total market share(2) | 52.5 | % | 49.8 | % | 52.4 | % | 49.4 | % | ||||||||||||||||||
| Nasdaq Nordic and Nasdaq Baltic securities | ||||||||||||||||||||||||||
| Average daily number of equity trades executed on Nasdaq’s exchanges | 1,019,162 | 937,245 | 1,056,726 | 980,637 | ||||||||||||||||||||||
| Total average daily value of shares traded (in billions) | $ | 6.6 | $ | 5.6 | $ | 6.8 | $ | 6.0 | ||||||||||||||||||
| Total market share executed on Nasdaq’s exchanges | 77.3 | % | 78.3 | % | 77.9 | % | 77.7 | % | ||||||||||||||||||
| FICC | ||||||||||||||||||||||||||
| Fixed Income | ||||||||||||||||||||||||||
| U.S. fixed income volume ($ billions traded) | $ | 1,799 | $ | 1,246 | $ | 4,292 | $ | 3,313 | ||||||||||||||||||
Total average daily volume of Nasdaq Nordic and Nasdaq Baltic fixed income contracts | 119,198 | 116,057 | 122,606 | 115,586 | ||||||||||||||||||||||
| Commodities | ||||||||||||||||||||||||||
Power contracts cleared (TWh)(3) | 206 | 184 | 456 | 475 | ||||||||||||||||||||||
___________
(1) Includes Finnish option contracts traded on Eurex for which Nasdaq and Eurex have a revenue sharing arrangement.
(2) Includes transactions executed on The Nasdaq Stock Market’s, Nasdaq BX’s and Nasdaq PSX’s systems plus trades reported through the FINRA/Nasdaq Trade Reporting Facility.
(3) Transactions executed on Nasdaq Commodities or OTC and reported for clearing to Nasdaq Commodities measured by Terawatt hours (TWh).
34
Key Drivers (Continued)
| Three Months Ended June 30, | Six Months Ended June 30, | |||||||||||||||||||||||||
| 2021 | 2020 | 2021 | 2020 | |||||||||||||||||||||||
| Corporate Platforms | ||||||||||||||||||||||||||
| IPOs | ||||||||||||||||||||||||||
The Nasdaq Stock Market(4) | 135 | 42 | 410 | 69 | ||||||||||||||||||||||
| Exchanges that comprise Nasdaq Nordic and Nasdaq Baltic | 62 | 9 | 86 | 16 | ||||||||||||||||||||||
| Total new listings | ||||||||||||||||||||||||||
The Nasdaq Stock Market(4) | 192 | 55 | 511 | 111 | ||||||||||||||||||||||
Exchanges that comprise Nasdaq Nordic and Nasdaq Baltic(5) | 72 | 13 | 104 | 22 | ||||||||||||||||||||||
| Number of listed companies | ||||||||||||||||||||||||||
The Nasdaq Stock Market(6) | 3,817 | 3,156 | 3,817 | 3,156 | ||||||||||||||||||||||
Exchanges that comprise Nasdaq Nordic and Nasdaq Baltic(7) | 1,152 | 1,042 | 1,152 | 1,042 | ||||||||||||||||||||||
| Investment Intelligence | ||||||||||||||||||||||||||
| Number of licensed ETPs | 359 | 323 | 359 | 323 | ||||||||||||||||||||||
| ETP AUM tracking Nasdaq indexes (in billions) | $ | 415 | $ | 272 | $ | 415 | $ | 272 | ||||||||||||||||||
TTM(8) net appreciation/ (depreciation) (in billions) | $ | 113 | $ | 34 | $ | 113 | $ | 34 | ||||||||||||||||||
TTM(8) net inflows in ETP AUM tracking Nasdaq indexes (in billions) | $ | 47 | $ | 35 | $ | 47 | $ | 35 | ||||||||||||||||||
| Market Technology | ||||||||||||||||||||||||||
Order intake (in millions)(9) | $ | 119 | $ | 38 | $ | 25 | $ | 116 | ||||||||||||||||||
(4) New listings include IPOs, including issuers that switched from other listing venues, closed-end funds and separately listed ETPs. For the three months ended June 30, 2021, of the 135 IPOs, 47 were SPACs, for the three months ended June 30, 2020, of the 42 IPOs, 7 were SPACs, for the six months ended June 30, 2021, of the 410 IPOs, 243 were SPACs and for the six months ended June 30, 2020, of the 69 IPOs, 14 were SPACs.
(5) New listings include IPOs and represent companies listed on the Nasdaq Nordic and Nasdaq Baltic exchanges and companies on the alternative markets of Nasdaq First North.
(6) Number of total listings on The Nasdaq Stock Market at period end, including 419 ETPs as of June 30, 2021 and 410 as of June 30, 2020.
(7) Represents companies listed on the Nasdaq Nordic and Nasdaq Baltic exchanges and companies on the alternative markets of Nasdaq First North.
(8) Trailing twelve months (excludes ETP sponsor switches of $17 billion).
(9) Total contract value of orders signed during the period, excluding Verafin.
35
The following chart summarizes our ARR (in millions):
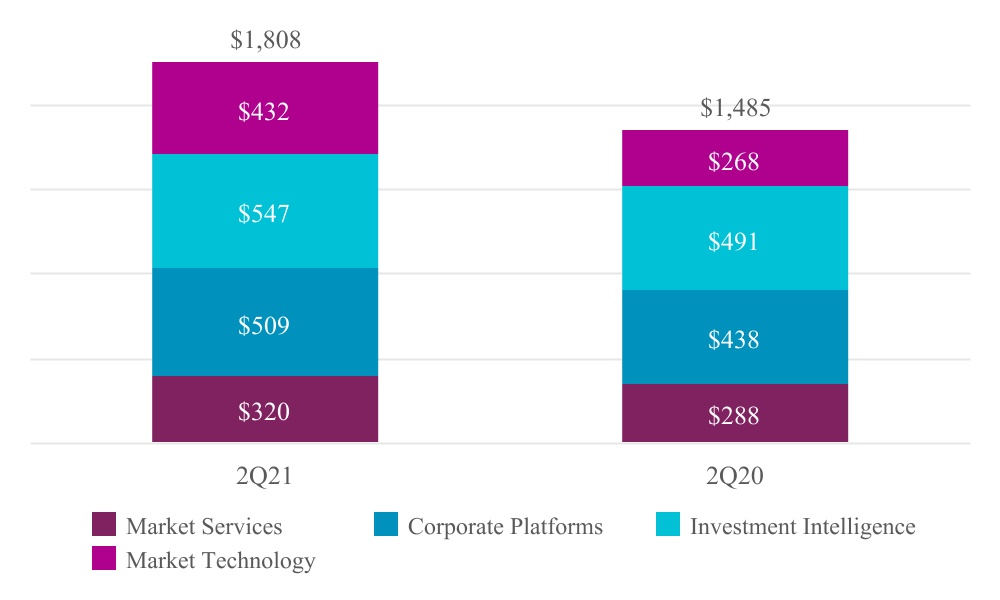
ARR for a given period is the annualized revenue derived from subscription contracts with a defined contract value. This excludes contracts that are not recurring, are one-time in nature, or where the contract value fluctuates based on defined metrics. ARR is currently one of our key performance metrics to assess the health and trajectory of our recurring business. ARR does not have any standardized definition and is therefore unlikely to be comparable to similarly titled measures presented by other companies. ARR should be viewed independently of revenue and deferred revenue and is not intended to be combined with or to replace either of those items. ARR is not a forecast and the active contracts at the end of a reporting period used in calculating ARR may or may not be extended or renewed by our customers.
_____________
Includes:
• | Trade Management Services business, excluding one-time service requests. | |||||||
• | U.S. and Nordic annual listing fees, IR and ESG products, including subscription contracts for IR Insight, Boardvantage and OneReport, and IR advisory services. | |||||||
• | Proprietary market data and index data subscriptions as well as subscription contracts for eVestment, Solovis, DWA tools and services, Nasdaq Fund Network and Quandl. Also includes guaranteed minimum on futures contracts within the Index business. | |||||||
• | Active Market Technology support and SaaS subscription contracts. | |||||||
The following chart summarizes our annualized SaaS revenues for the three months ended June 30, 2021 and 2020 (in millions):

36
Financial Summary
The following table summarizes our financial performance for the three and six months ended June 30, 2021 when compared to the same periods in 2020. The comparability of our results of operations between reported periods is impacted by the acquisition of Verafin in February 2021. See “2021 Acquisition,” of Note 4, “Acquisitions and Divestiture,” to the condensed consolidated financial statements for further discussion. For a detailed discussion of our results of operations, see “Segment Operating Results” below.
| Three Months Ended June 30, | Percentage Change | Six Months End June 30, | Percentage Change | |||||||||||||||||||||||||||||||||||
| 2021 | 2020 | 2021 | 2020 | |||||||||||||||||||||||||||||||||||
| (in millions, except per share amounts) | (in millions, except per share amounts) | |||||||||||||||||||||||||||||||||||||
Revenues less transaction-based expenses | $ | 846 | $ | 699 | 21.0 | % | $ | 1,697 | $ | 1,400 | 21.2 | % | ||||||||||||||||||||||||||
Operating expenses | 470 | 384 | 22.4 | % | 956 | 810 | 18.0 | % | ||||||||||||||||||||||||||||||
Operating income | 376 | 315 | 19.4 | % | 741 | 590 | 25.6 | % | ||||||||||||||||||||||||||||||
Net income attributable to Nasdaq | $ | 341 | $ | 241 | 41.5 | % | $ | 639 | $ | 444 | 43.9 | % | ||||||||||||||||||||||||||
Diluted earnings per share | $ | 2.05 | $ | 1.45 | 41.4 | % | $ | 3.83 | $ | 2.67 | 43.4 | % | ||||||||||||||||||||||||||
Cash dividends declared per common share | $ | 0.54 | $ | 0.49 | 10.2 | % | $ | 1.03 | $ | 0.96 | 7.3 | % | ||||||||||||||||||||||||||
In countries with currencies other than the U.S. dollar, revenues and expenses are translated using monthly average exchange rates. Impacts on our revenues less transaction-based expenses and operating income associated with fluctuations in foreign currency are discussed in more detail under “Item 3. Quantitative and Qualitative Disclosures about Market Risk.”
Segment Operating Results
The following table shows our revenues by segment, transaction-based expenses for our Market Services segment and total revenues less transaction-based expenses:
| Three Months Ended June 30, | Percentage Change | Six Months Ended June 30, | Percentage Change | |||||||||||||||||||||||||||||||||||
| 2021 | 2020 | 2021 | 2020 | |||||||||||||||||||||||||||||||||||
| (in millions) | (in millions) | |||||||||||||||||||||||||||||||||||||
| Market Services | $ | 878 | $ | 975 | (9.9) | % | $ | 2,017 | $ | 1,908 | 5.7 | % | ||||||||||||||||||||||||||
Transaction-based expenses | (566) | (699) | (19.0) | % | (1,367) | (1,351) | 1.2 | % | ||||||||||||||||||||||||||||||
Market Services revenues less transaction-based expenses | 312 | 276 | 13.0 | % | 650 | 557 | 16.7 | % | ||||||||||||||||||||||||||||||
| Corporate Platforms | 154 | 126 | 22.2 | % | 309 | 254 | 21.7 | % | ||||||||||||||||||||||||||||||
| Investment Intelligence | 263 | 213 | 23.5 | % | 521 | 424 | 22.9 | % | ||||||||||||||||||||||||||||||
Market Technology | 117 | 84 | 39.3 | % | 217 | 165 | 31.5 | % | ||||||||||||||||||||||||||||||
Total revenues less transaction-based expenses | $ | 846 | $ | 699 | 21.0 | % | $ | 1,697 | $ | 1,400 | 21.2 | % | ||||||||||||||||||||||||||
37
The following charts show our Market Services, Corporate Platforms, Investment Intelligence, and Market Technology segments as a percentage of our total revenues, less transaction-based expenses, of $846 million for the three months ended June 30, 2021, $699 million for the three months ended June 30, 2020, $1,697 million for the six months ended June 30, 2021 and $1,400 million for the six months ended June 30, 2020:

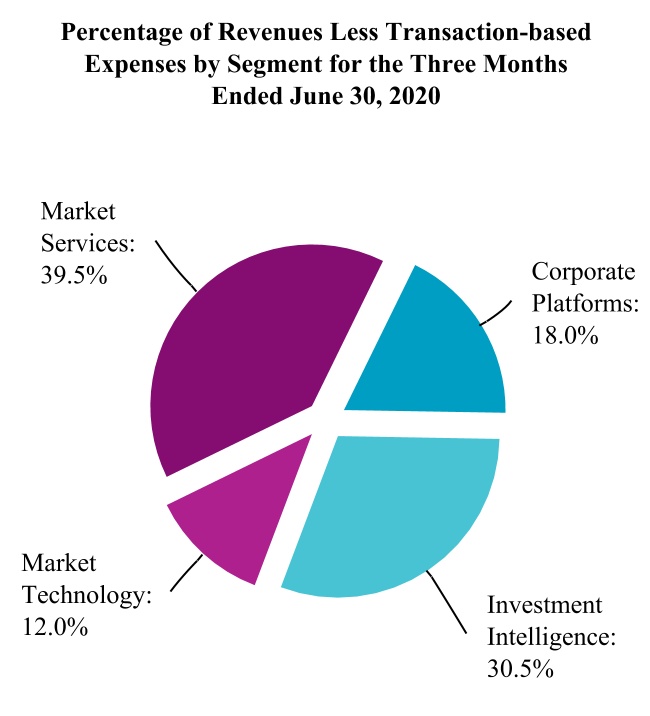
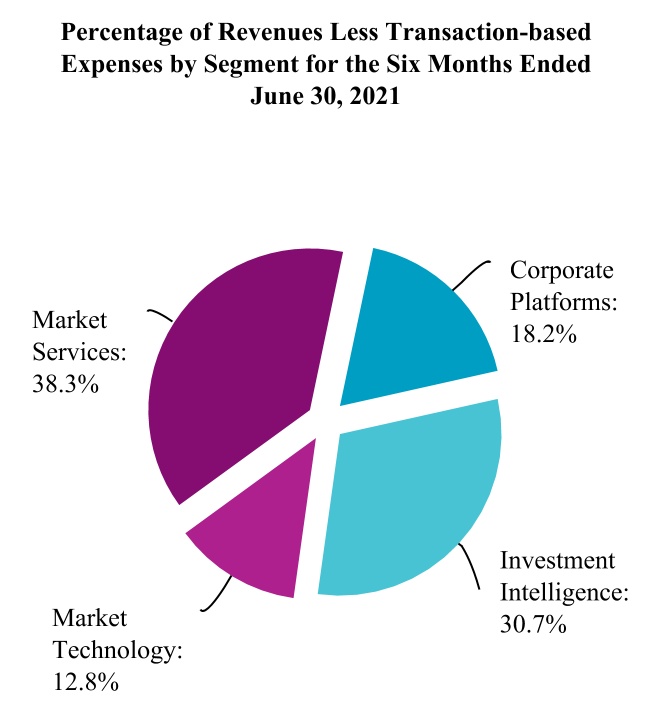
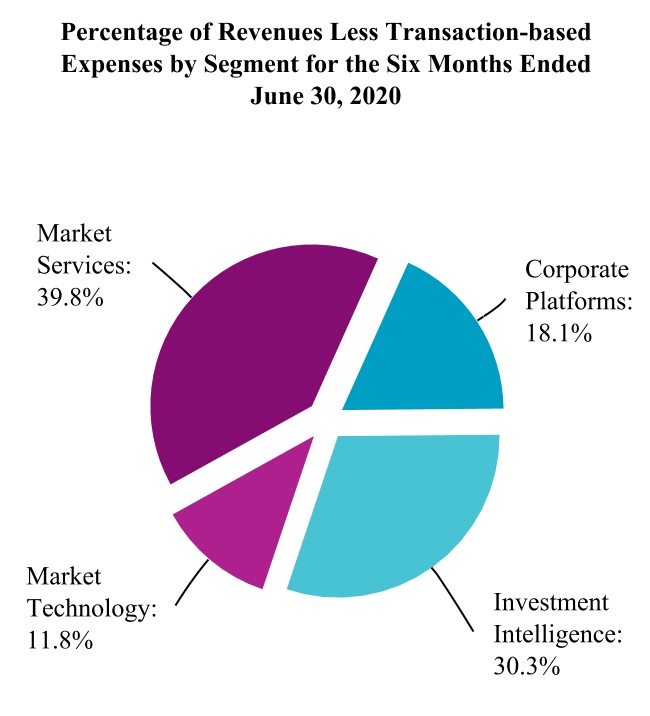
38
MARKET SERVICES
The following table shows total revenues, transaction-based expenses, and total revenues less transaction-based expenses from our Market Services segment:
| Three Months Ended June 30, | Percentage Change | Six Months Ended June 30, | Percentage Change | |||||||||||||||||||||||||||||||||||
| 2021 | 2020 | 2021 | 2020 | |||||||||||||||||||||||||||||||||||
| (in millions) | (in millions) | |||||||||||||||||||||||||||||||||||||
| Market Services Revenues: | ||||||||||||||||||||||||||||||||||||||
Equity Derivative Trading and Clearing Revenues(1) | $ | 364 | $ | 297 | 22.6 | % | $ | 785 | $ | 583 | 34.6 | % | ||||||||||||||||||||||||||
| Transaction-based expenses: | ||||||||||||||||||||||||||||||||||||||
| Transaction rebates | (255) | (199) | 28.1 | % | (550) | (371) | 48.2 | % | ||||||||||||||||||||||||||||||
Brokerage, clearance and exchange fees(1) | (6) | (15) | (60.0) | % | (26) | (35) | (25.7) | % | ||||||||||||||||||||||||||||||
Equity derivative trading and clearing revenues less transaction-based expenses | 103 | 83 | 24.1 | % | 209 | 177 | 18.1 | % | ||||||||||||||||||||||||||||||
Cash Equity Trading Revenues(2) | 415 | 590 | (29.7) | % | 1,033 | 1,147 | (9.9) | % | ||||||||||||||||||||||||||||||
| Transaction-based expenses: | ||||||||||||||||||||||||||||||||||||||
| Transaction rebates | (262) | (331) | (20.8) | % | (620) | (638) | (2.8) | % | ||||||||||||||||||||||||||||||
Brokerage, clearance and exchange fees(2) | (43) | (153) | (71.9) | % | (170) | (306) | (44.4) | % | ||||||||||||||||||||||||||||||
Cash equity trading revenues less transaction-based expenses | 110 | 106 | 3.8 | % | 243 | 203 | 19.7 | % | ||||||||||||||||||||||||||||||
FICC Revenues | 17 | 15 | 13.3 | % | 37 | 33 | 12.1 | % | ||||||||||||||||||||||||||||||
| Transaction-based expenses: | ||||||||||||||||||||||||||||||||||||||
| Brokerage, clearance and exchange fees | — | (1) | (100.0) | % | (1) | (1) | — | % | ||||||||||||||||||||||||||||||
FICC revenues less transaction-based expenses | 17 | 14 | 21.4 | % | 36 | 32 | 12.5 | % | ||||||||||||||||||||||||||||||
| Trade Management Services Revenues | 82 | 73 | 12.3 | % | 162 | 145 | 11.7 | % | ||||||||||||||||||||||||||||||
Total Market Services revenues less transaction-based expenses | $ | 312 | $ | 276 | 13.0 | % | $ | 650 | $ | 557 | 16.7 | % | ||||||||||||||||||||||||||
____________
(1) Includes Section 31 fees of $5 million in the second quarter of 2021, $22 million in the first six months of 2021, $14 million in the second quarter of 2020 and $31 million in the first six months of 2020. Section 31 fees are recorded as equity derivative trading and clearing revenues with a corresponding amount recorded in transaction-based expenses.
(2) Includes Section 31 fees of $36 million in the second quarter of 2021, $151 million in the first six months of 2021, $145 million in the second quarter of 2020 and $290 million in the first six months of 2020. Section 31 fees are recorded as cash equity trading revenues with a corresponding amount recorded in transaction-based expenses.
Equity Derivative Trading and Clearing Revenues
Equity derivative trading and clearing revenues and equity derivative trading and clearing revenues less transaction-based expenses increased in the second quarter and first six months of 2021 compared with the same periods in 2020. The increases in the second quarter of 2021 were primarily due to higher U.S. industry trading volumes. The increases in the first six months of 2021 were primarily due to higher U.S. industry trading volumes and higher U.S. gross capture rates partially offset by lower overall U.S. matched market share executed on Nasdaq's exchanges. The increase in equity derivative trading and clearing revenues was partially offset by lower Section 31 pass-through fee revenue.
Section 31 fees are recorded as equity derivative trading and clearing revenues with a corresponding amount recorded as
transaction-based expenses. In the U.S., we are assessed these fees from the SEC and pass them through to our customers in the form of incremental fees. Pass-through fees can increase or decrease due to rate changes by the SEC, our percentage of the overall industry volumes processed on our systems, and differences in actual dollar value of shares traded. Since the amount recorded in revenues is equal to the amount recorded as transaction-based expenses, there is no impact on our revenues less transaction-based expenses. Section 31 fees decreased in the second quarter and first six months of 2021 compared with the same periods in 2020 as lower average SEC fee rates was partially offset by higher dollar value traded on Nasdaq's exchanges.
Transaction rebates, in which we credit a portion of the per share execution charge to the market participant, increased in
39
the second quarter and first six months of 2021 compared with the same periods in 2020. The increase in the second quarter of 2021 was primarily due to higher U.S. industry trading volumes. The increase in the first six months of 2021 was primarily due to higher U.S. industry trading volumes and an increase in the U.S. rebate capture rate, partially offset by lower overall U.S. matched market share executed on Nasdaq's exchanges.
Brokerage, clearance and exchange fees decreased in the second quarter and first six months of 2021 compared with the same periods in 2020 primarily due to lower Section 31 pass-through fees, as discussed above.
Cash Equity Trading Revenues
Cash equity trading revenues decreased in the second quarter and first six months of 2021 compared with the same periods in 2020. The decrease in cash equity trading revenues in the second quarter was primarily due to lower Section 31 pass-through fee revenue, lower U.S. industry trading volumes and lower overall U.S. matched market share executed on Nasdaq's exchanges, partially offset by a higher U.S. gross capture rate and higher European value traded. The decrease in cash equity trading revenues in the first six months was primarily due to lower Section 31 pass-through fee revenue and lower overall U.S. matched market share executed on Nasdaq's exchanges, partially offset by higher U.S. industry trading volumes, higher U.S. and European gross capture rates and higher European value traded.
Cash equity trading revenues less transaction-based expenses increased in the second quarter and first six months of 2021 compared with the same periods in 2020. The increase in cash equity trading revenues less transaction based expenses in the second quarter was in part due to higher U.S. net capture rate and higher European value traded, partially offset by lower U.S. industry trading volumes and lower overall U.S. matched market share executed on Nasdaq's exchanges. The increase in cash equity trading revenues less transaction based expenses in the first six months was primarily due to higher U.S. and European net capture rates, higher U.S. industry trading volumes and higher European value traded, partially offset by lower overall U.S. matched market share executed on Nasdaq's exchanges.
In addition, the favorable impact from changes in foreign exchange rates of $4 million in the second quarter of 2021 and $9 million in the first six months of 2021 partially offsets the decreases in cash equity trading revenues and contributes to the increases in cash equity trading revenues less transaction based expenses for the second quarter and first six months of 2021.
Similar to equity derivative trading and clearing, in the U.S. we record Section 31 fees as cash equity trading revenues with a corresponding amount recorded as transaction-based expenses. We are assessed these fees from the SEC and pass them through to our customers in the form of incremental fees. Since the amount recorded as revenues is equal to the amount recorded as transaction-based expenses, there is no impact on our revenues less transaction-based expenses. Section 31 fees decreased in the second quarter and first six months of 2021 compared with the same periods in 2020 primarily due to lower average SEC fee rates, partially offset by higher dollar value traded on Nasdaq’s exchanges.
Transaction rebates decreased in the second quarter and first six months of 2021 compared with the same periods in 2020. For The Nasdaq Stock Market, Nasdaq PSX and Nasdaq CXC, we credit a portion of the per share execution charge to the market participant that provides the liquidity, and for Nasdaq BX and Nasdaq CX2, we credit a portion of the per share execution charge to the market participant that takes the liquidity. The decrease in the second quarter of 2021 was primarily due to lower U.S. industry trading volumes, lower overall U.S. matched market share executed on Nasdaq's exchanges and a lower rebate capture rate. The decrease in the first six months of 2021 was primarily due to lower overall U.S. matched market share executed on Nasdaq's exchanges and a lower rebate capture rate, partially offset by higher U.S. industry trading volumes.
Brokerage, clearance and exchange fees decreased in the second quarter and first six months of 2021 compared with the same periods in 2020 primarily due to lower Section 31 pass-through fees, as discussed above.
FICC Revenues
FICC revenues and FICC revenues less transaction-based expenses increased in the second quarter and first six months of 2021 compared with the same periods in 2020 primarily due to a favorable impact from foreign exchange rates. For the second quarter of 2021, the increase also reflected higher revenues from our European products.
Trade Management Services Revenues
Trade management services revenues increased in the second quarter and first six months of 2021 compared with the same periods in 2020 primarily due to higher demand for our connectivity solutions.
40
CORPORATE PLATFORMS
The following table shows revenues from our Corporate Platforms segment:
| Three Months Ended June 30, | Percentage Change | Six Months Ended June 30, | Percentage Change | ||||||||||||||||||||||||||||||||
| 2021 | 2020 | 2021 | 2020 | ||||||||||||||||||||||||||||||||
| (in millions) | (in millions) | ||||||||||||||||||||||||||||||||||
| Corporate Platforms: | |||||||||||||||||||||||||||||||||||
Listing Services | $ | 98 | $ | 74 | 32.4 | % | $ | 197 | $ | 149 | 32.2 | % | |||||||||||||||||||||||
| IR & ESG Services | 56 | 52 | 7.7 | % | 112 | 105 | 6.7 | % | |||||||||||||||||||||||||||
| Total Corporate Platforms | $ | 154 | $ | 126 | 22.2 | % | $ | 309 | $ | 254 | 21.7 | % | |||||||||||||||||||||||
Listing Services Revenues
Listing services revenues increased in the second quarter and first six months of 2021 compared with the same periods in 2020. The increase was primarily due to higher U.S. listings revenues due to an increase in the overall number of listed companies and higher NPM revenues due to an increase in private company transactions.
IR & ESG Services Revenues
Revenues increased in the second quarter and first six months of 2021 compared with the same periods in 2020, primarily due to an increase in IR services revenue from strong sales and higher retention rates along with increases across our ESG product offerings.
INVESTMENT INTELLIGENCE
The following table shows revenues from our Investment Intelligence segment:
| Three Months Ended June 30, | Percentage Change | Six Months Ended June 30, | Percentage Change | |||||||||||||||||||||||||||||||||||
| 2021 | 2020 | 2021 | 2020 | |||||||||||||||||||||||||||||||||||
| (in millions) | (in millions) | |||||||||||||||||||||||||||||||||||||
| Investment Intelligence: | ||||||||||||||||||||||||||||||||||||||
Market Data | $ | 106 | $ | 101 | 5.0 | % | $ | 214 | $ | 198 | 8.1 | % | ||||||||||||||||||||||||||
Index | 107 | 68 | 57.4 | % | 209 | 141 | 48.2 | % | ||||||||||||||||||||||||||||||
| Analytics | 50 | 44 | 13.6 | % | 98 | 85 | 15.3 | % | ||||||||||||||||||||||||||||||
| Total Investment Intelligence | $ | 263 | $ | 213 | 23.5 | % | $ | 521 | $ | 424 | 22.9 | % | ||||||||||||||||||||||||||
Market Data Revenues
Market data revenues increased in the second quarter and first six months of 2021 compared with the same periods in 2020 primarily due to organic growth in proprietary data products from new sales, including continued expansion geographically. The increase in the first six months of 2021 was also due to a favorable impact in foreign exchange rates of $4 million.
Index Revenues
Index revenues increased in the second quarter and first six months of 2021 compared with the same periods in 2020 primarily due to higher licensing revenues from higher average AUM in ETPs linked to Nasdaq indexes and higher licensing revenues from futures trading linked to the Nasdaq-100 Index.
Analytics Revenues
Analytics revenues increased in the second quarter and first six months of 2021 compared with the same periods in 2020 primarily due to the growth in our eVestment platform driven by new sales, strong retention, and higher average revenue per client from expanded offerings.
41
MARKET TECHNOLOGY
The following table shows revenues from our Market Technology segment:
| Three Months Ended June 30, | Percentage Change | Six Months Ended June 30, | Percentage Change | |||||||||||||||||||||||||||||||||||
| 2021 | 2020 | 2021 | 2020 | |||||||||||||||||||||||||||||||||||
| Market Technology: | (in millions) | (in millions) | ||||||||||||||||||||||||||||||||||||
| Anti Financial Crime Technology | $ | 62 | $ | 33 | 87.9 | % | $ | 109 | $ | 63 | 73.0 | % | ||||||||||||||||||||||||||
| Marketplace Infrastructure Technology | 55 | 51 | 7.8 | % | 108 | 102 | 5.9 | % | ||||||||||||||||||||||||||||||
| Market Technology | $ | 117 | $ | 84 | 39.3 | % | $ | 217 | $ | 165 | 31.5 | % | ||||||||||||||||||||||||||
Anti Financial Crime Technology Revenues
Anti-financial crime technology revenues increased in the second quarter and first six months of 2021 compared with the same periods in 2020 primarily due to the inclusion of revenues from our acquisition of Verafin and continued growth in surveillance solutions.
Marketplace Infrastructure Technology Revenues
Marketplace infrastructure technology revenues increased in the second quarter and first six months of 2021 compared with the same periods in 2020 primarily due to an increase in support licensing and SaaS revenues, and a favorable impact from foreign exchange rates of $2 million in the second quarter and $4 million in the first six months of 2021.
EXPENSES
Operating Expenses
The following table shows our operating expenses:
| Three Months Ended June 30, | Percentage Change | Six Months Ended June 30, | Percentage Change | |||||||||||||||||||||||||||||||||||
| 2021 | 2020 | 2021 | 2020 | |||||||||||||||||||||||||||||||||||
| (in millions) | (in millions) | |||||||||||||||||||||||||||||||||||||
| Compensation and benefits | $ | 231 | $ | 189 | 22.2 | % | $ | 470 | $ | 384 | 22.4 | % | ||||||||||||||||||||||||||
| Professional and contract services | 38 | 31 | 22.6 | % | 65 | 58 | 12.1 | % | ||||||||||||||||||||||||||||||
| Computer operations and data communications | 46 | 35 | 31.4 | % | 90 | 70 | 28.6 | % | ||||||||||||||||||||||||||||||
| Occupancy | 26 | 26 | — | % | 55 | 51 | 7.8 | % | ||||||||||||||||||||||||||||||
| General, administrative and other | 12 | 25 | (52.0) | % | 24 | 86 | (72.1) | % | ||||||||||||||||||||||||||||||
| Marketing and advertising | 9 | 4 | 125.0 | % | 19 | 14 | 35.7 | % | ||||||||||||||||||||||||||||||
| Depreciation and amortization | 68 | 50 | 36.0 | % | 131 | 98 | 33.7 | % | ||||||||||||||||||||||||||||||
| Regulatory | 7 | 7 | — | % | 14 | 14 | — | % | ||||||||||||||||||||||||||||||
| Merger and strategic initiatives | 12 | 4 | 200.0 | % | 57 | 10 | 470.0 | % | ||||||||||||||||||||||||||||||
| Restructuring charges | 21 | 13 | 61.5 | % | 31 | 25 | 24.0 | % | ||||||||||||||||||||||||||||||
Total operating expenses | $ | 470 | $ | 384 | 22.4 | % | $ | 956 | $ | 810 | 18.0 | % | ||||||||||||||||||||||||||
The increase in compensation and benefits expense in the second quarter of 2021 compared with the same period in 2020 was primarily driven by an increase in headcount as a result of our acquisition of Verafin, higher performance-linked compensation expense and an unfavorable impact from foreign exchange rates of $11 million. The increase in compensation and benefits expense in the first six months of 2021 compared with the same period in 2020 was primarily driven by higher performance-linked compensation expense, an increase in headcount as a result of our acquisition of Verafin, and an unfavorable impact from foreign exchange rates of $20 million.
Headcount increased to 5,696 employees as of June 30, 2021 from 4,670 as of June 30, 2020 primarily due to our recent
acquisition of Verafin and strategic initiatives, including growth in our Market Technology business.
Computer operations and data communications expense increased in the second quarter and first six months of 2021 compared with the same periods in 2020 primarily due to our acquisition of Verafin and higher software maintenance costs due to higher cloud storage costs.
Occupancy expense increased in the first six months of 2021 compared with the same period in 2020 primarily due to higher costs associated with additional facility and rent costs resulting from our acquisition of Verafin and an unfavorable impact from foreign exchange rates.
General, administrative and other expense decreased in the second quarter and first six months of 2021 compared with
42
the same periods in 2020 primarily due to charitable donations made to the Nasdaq Foundation, COVID-19 response and relief efforts, and social justice charities in 2020. The decrease in the first six months of 2021 was also due to lower travel costs and the absence of debt extinguishment costs in 2021.
Marketing and advertising expense increased in the second quarter and first six months of 2021 compared with the same periods in 2020 primarily due to an increase in marketing commitments predominantly driven by the increase in new listings.
Depreciation and amortization expense increased in the second quarter and first six months of 2021 compared with the same periods in 2020 primarily due to additional expense for acquired intangible assets related to our acquisition of Verafin.
Merger and strategic initiatives expense increased in the second quarter and first six months of 2021 compared with the same periods in 2020 primarily due to the acquisition of Verafin. We have pursued various strategic initiatives and completed acquisitions and divestitures in recent years which have resulted in expenses which would not have otherwise been incurred. These expenses generally include integration costs, as well as legal, due diligence and other third party transaction costs and will vary based on the size and frequency of the activities described above.
See Note 19, “Restructuring Charges,” to the condensed consolidated financial statements for further discussion of our 2019 restructuring plan and charges associated with this plan.
* * * * * *
Non-operating Income and Expenses
The following table shows our non-operating income and expenses:
| Three Months Ended June 30, | Percentage Change | Six Months Ended June 30, | Percentage Change | |||||||||||||||||||||||||||||||||||
| 2021 | 2020 | 2021 | 2020 | |||||||||||||||||||||||||||||||||||
| (in millions) | (in millions) | |||||||||||||||||||||||||||||||||||||
| Interest income | $ | — | $ | 1 | (100.0) | % | $ | 1 | $ | 3 | (66.7) | % | ||||||||||||||||||||||||||
| Interest expense | (33) | (26) | 26.9 | % | (62) | (52) | 19.2 | % | ||||||||||||||||||||||||||||||
| Net interest expense | (33) | (25) | 32.0 | % | (61) | (49) | 24.5 | % | ||||||||||||||||||||||||||||||
| Net gain on divestiture of business | 84 | — | N/M | 84 | — | N/M | ||||||||||||||||||||||||||||||||
| Other income | — | — | — | 1 | 5 | (80.0) | % | |||||||||||||||||||||||||||||||
Net income from unconsolidated investees | 27 | 26 | 3.8 | % | 84 | 43 | 95.3 | % | ||||||||||||||||||||||||||||||
| Total non-operating income (expenses) | $ | 78 | $ | 1 | 7,700.0 | % | $ | 108 | $ | (1) | (10,900.0) | % | ||||||||||||||||||||||||||
____________
N/M Not meaningful.
Interest Expense
Interest expense increased in the second quarter and first six months of 2021 compared with the same periods in 2020 primarily due to new issuances of senior notes in December 2020 and commercial paper issuances in the first quarter of 2021 to partially fund our acquisition of Verafin. See “2021 Acquisition,” of Note 4, “Acquisitions and Divestiture,” to the condensed consolidated financial statements for further discussion of the acquisition of Verafin. See Note 8, “Debt Obligations,” to the condensed consolidated financial statements for further discussion of our debt obligations.
The following table shows our interest expense:
| Three Months Ended June 30, | Percentage Change | Six Months Ended June 30, | Percentage Change | |||||||||||||||||||||||||||||||||||
| 2021 | 2020 | 2021 | 2020 | |||||||||||||||||||||||||||||||||||
| (in millions) | (in millions) | |||||||||||||||||||||||||||||||||||||
| Interest expense on debt | $ | 30 | $ | 24 | 25.0 | % | $ | 57 | $ | 48 | 18.8 | % | ||||||||||||||||||||||||||
| Accretion of debt issuance costs and debt discount | 2 | 1 | 100.0 | % | 4 | 3 | 33.3 | % | ||||||||||||||||||||||||||||||
Other fees | 1 | 1 | — | % | 1 | 1 | — | % | ||||||||||||||||||||||||||||||
| Interest expense | $ | 33 | $ | 26 | 26.9 | % | $ | 62 | $ | 52 | 19.2 | % | ||||||||||||||||||||||||||
43
Net Gain on Divestiture of Business
The net gain on divestiture of business in the second quarter and first six months of 2021 relates to the sale of our U.S. Fixed Income business, which is part of our FICC business within our Market Services segment, to Tradeweb. We recognized a pre-tax gain on the sale of $84 million, net of disposal costs. See “2021 Divestiture,” of Note 4, “Acquisitions and Divestiture,” to the condensed consolidated financial statements for further discussion.
Net Income from Unconsolidated Investees
Net income from unconsolidated investees increased in the second quarter and first six months of 2021 compared with the same periods in 2020 primarily due to an increase in income recognized from our equity method investment in OCC. See “Equity Method Investments,” of Note 6, “Investments,” to the condensed consolidated financial statements for further discussion.
Tax Matters
The following table shows our income tax provision and effective tax rate:
| Three Months Ended June 30, | Percentage Change | Six Months Ended June 30, | Percentage Change | |||||||||||||||||||||||||||||||||||
| 2021 | 2020 | 2021 | 2020 | |||||||||||||||||||||||||||||||||||
| ($ in millions) | ($ in millions) | |||||||||||||||||||||||||||||||||||||
Income tax provision | $ | 113 | $ | 75 | 50.7 | % | $ | 210 | $ | 145 | 44.8 | % | ||||||||||||||||||||||||||
Effective tax rate | 24.9 | % | 23.7 | % | 24.7 | % | 24.6 | % | ||||||||||||||||||||||||||||||
For further discussion of our tax matters, see Note 16, “Income Taxes,” to the condensed consolidated financial statements.
NON-GAAP FINANCIAL MEASURES
In addition to disclosing results determined in accordance with U.S. GAAP, we also have provided non-GAAP net income attributable to Nasdaq and non-GAAP diluted earnings per share. Management uses this non-GAAP information internally, along with U.S. GAAP information, in evaluating our performance and in making financial and operational decisions. We believe our presentation of these measures provides investors with greater transparency and supplemental data relating to our financial condition and results of operations. In addition, we believe the presentation of these measures is useful to investors for period-to-period comparisons of our ongoing operating performance.
These measures are not in accordance with, or an alternative to, U.S. GAAP, and may be different from non-GAAP measures used by other companies. In addition, other companies, including companies in our industry, may calculate such measures differently, which reduces their usefulness as comparative measures. Investors should not rely on any single financial measure when evaluating our business. This non-GAAP information should be considered as supplemental in nature and is not meant as a substitute for our operating results in accordance with U.S. GAAP. We recommend investors review the U.S. GAAP financial measures included in this Quarterly Report on Form 10-Q, including our condensed consolidated financial statements and the notes thereto. When viewed in conjunction with our U.S. GAAP results and the accompanying reconciliation, we believe these non-GAAP measures provide greater transparency and a more complete understanding of factors affecting our business than U.S. GAAP measures alone.
We understand that analysts and investors regularly rely on non-GAAP financial measures, such as non-GAAP net income attributable to Nasdaq and non-GAAP diluted earnings per share, to assess operating performance. We use
non-GAAP net income attributable to Nasdaq and non-GAAP diluted earnings per share because they highlight trends more clearly in our business that may not otherwise be apparent when relying solely on U.S. GAAP financial measures, since these measures eliminate from our results specific financial items that have less bearing on our ongoing operating performance. Non-GAAP net income attributable to Nasdaq for the periods presented below is calculated by adjusting for the following items:
•Amortization expense of acquired intangible assets: We amortize intangible assets acquired in connection with various acquisitions. Intangible asset amortization expense can vary from period to period due to episodic acquisitions completed, rather than from our ongoing business operations. As such, if intangible asset amortization is included in performance measures, it is more difficult to assess the day-to-day operating performance of the businesses, the relative operating performance of the businesses between periods, and the earnings power of Nasdaq. Performance measures excluding intangible asset amortization expense therefore provide investors with a useful representation of our businesses’ ongoing activity in each period.
•Merger and strategic initiatives expense: We have pursued various strategic initiatives and completed acquisitions and divestitures in recent years that have resulted in expenses which would not have otherwise been incurred. These expenses generally include integration costs, as well as legal, due diligence and other third party transaction costs. The frequency and the amount of such expenses vary significantly based on the size, timing and complexity of the transaction. Accordingly, we exclude these costs for purposes of calculating non-GAAP measures which provide a more meaningful analysis of Nasdaq’s ongoing operating
44
performance or comparisons in Nasdaq’s performance between periods.
•Restructuring charges: We initiated the transition of certain technology platforms to advance our strategic opportunities as a technology and analytics provider and continue the re-alignment of certain business areas. See Note 19, “Restructuring Charges,” to the condensed consolidated financial statements for further discussion of our 2019 restructuring plan. Charges associated with this plan represented a fundamental shift in our strategy and technology as well as executive re-alignment and were excluded for purposes of calculating non-GAAP measures as they are not reflective of ongoing operating performance or comparisons in Nasdaq's performance between periods.
•Net income from unconsolidated investee: See “Equity Method Investments,” of Note 6, “Investments,” to the condensed consolidated financial statements for further discussion. Our income on our investment in OCC may vary significantly compared to prior years due to the changes in OCC's capital management policy. Accordingly, we will exclude this income from current and prior periods for purposes of calculating non-GAAP measures which provide a more meaningful analysis of Nasdaq’s ongoing operating performance or comparisons in Nasdaq’s performance between periods.
•Other significant items: We have excluded certain other charges or gains, including certain tax items, that are the result of other non-comparable events to measure operating performance. We believe the exclusion of such
amounts allows management and investors to better understand the ongoing financial results of Nasdaq.
For the three and six months ended June 30, 2021, other significant items primarily included a net gain on divestiture of businesses which primarily represents our pre-tax net gain of $84 million on the sale of our U.S. Fixed Income business.
For the three and six months ended June 30, 2020, other significant items included charitable donations made to the Nasdaq Foundation, COVID-19 response and relief efforts, and social justice charities which are recorded in general, administrative and other expense in our Condensed Consolidated Statements of Income. The first six months of 2020 also included a loss on extinguishment of debt which is recorded in general, administrative and other expense in our Condensed Consolidated Statements of Income.
•Significant tax items: The non-GAAP adjustment to the income tax provision for the three and six months ended June 30, 2021 and 2020 included the tax impact of each non-GAAP adjustment and for the six months ended June 30, 2020, excess tax benefits related to employee share-based compensation to reflect the recognition of the income tax effects of share-based awards when awards vest or are settled. Beginning with the quarter ended March 31, 2021, such excess tax benefits are no longer included as a non-GAAP adjustment as they do not have a material impact on period over period comparison.
45
The following table shows reconciliations between U.S. GAAP net income attributable to Nasdaq and diluted earnings per share and non-GAAP net income attributable to Nasdaq and diluted earnings per share:
| Three Months Ended June 30, | Six Months End June 30, | ||||||||||||||||||||||
| 2021 | 0 | 2020 | 2021 | 2020 | |||||||||||||||||||
| ($ in millions, except share and per share amounts) | |||||||||||||||||||||||
| U.S. GAAP net income attributable to Nasdaq | $ | 341 | $ | 241 | $ | 639 | $ | 444 | |||||||||||||||
| Non-GAAP adjustments: | |||||||||||||||||||||||
Amortization expense of acquired intangible assets | 40 | 26 | 76 | 50 | |||||||||||||||||||
Merger and strategic initiatives expense | 12 | 4 | 57 | 10 | |||||||||||||||||||
| Restructuring charges | 21 | 13 | 31 | 25 | |||||||||||||||||||
| Net income from unconsolidated investee | (26) | (25) | (83) | (41) | |||||||||||||||||||
| Net gain on divestiture of business | (84) | — | (84) | — | |||||||||||||||||||
| Extinguishment of debt | — | — | — | 36 | |||||||||||||||||||
| Charitable donations | — | 12 | — | 17 | |||||||||||||||||||
| Other | 5 | 2 | 7 | 4 | |||||||||||||||||||
Total non-GAAP adjustments | (32) | 32 | 4 | 101 | |||||||||||||||||||
Adjustment to the income tax provision to reflect non-GAAP adjustments and other tax items | 7 | (17) | — | (36) | |||||||||||||||||||
Excess tax benefits related to employee share-based compensation | — | — | — | (3) | |||||||||||||||||||
Total non-GAAP tax adjustments | 7 | (17) | — | (39) | |||||||||||||||||||
Total non-GAAP adjustments, net of tax | (25) | 15 | 4 | 62 | |||||||||||||||||||
| Non-GAAP net income attributable to Nasdaq | $ | 316 | $ | 256 | $ | 643 | $ | 506 | |||||||||||||||
Weighted-average common shares outstanding for diluted earnings per share | 166,438,157 | 166,073,354 | 166,763,396 | 166,424,676 | |||||||||||||||||||
| U.S. GAAP diluted earnings per share | $ | 2.05 | $ | 1.45 | $ | 3.83 | $ | 2.67 | |||||||||||||||
| Total adjustments from non-GAAP net income | (0.15) | 0.09 | 0.02 | 0.37 | |||||||||||||||||||
| Non-GAAP diluted earnings per share | $ | 1.90 | $ | 1.54 | $ | 3.85 | $ | 3.04 | |||||||||||||||
LIQUIDITY AND CAPITAL RESOURCES
Historically, we have funded our operating activities and met our commitments through cash generated by operations, augmented by the periodic issuance of our common stock and debt. Currently, our cost and availability of funding remain healthy.
As of June 30, 2021, our sources and uses of cash were not materially impacted by COVID-19 and we have not identified any material liquidity deficiencies as a result of the COVID-19 pandemic.
We will continue to closely monitor and manage our liquidity and capital resources. In addition, we continue to prudently assess our capital deployment strategy through balancing acquisitions, internal investments, debt repayments, and shareholder return activity, including share repurchases and dividends.
In the near term, we expect that our operations and the availability under our revolving credit facility and commercial paper program will provide sufficient cash to fund our operating expenses, capital expenditures, debt repayments, any share repurchases, and any dividends.
In April 2021, we filed a universal shelf registration statement on Form S-3ASR (Automatic Shelf Registration) with the SEC to have the ability to sell various types of securities including debt securities, common stock, preferred stock, depository receipts, warrants, subscription rights, purchase contracts and purchase units. The specific terms of any securities to be sold would be described in supplemental filings with the SEC. The registration statement will expire in April 2024.
In July 2021, we issued the 2033 Notes and issued a redemption notice for the 2023 Notes. We will primarily use the net proceeds from the sale of the 2033 Notes to redeem the 2023 Notes. See “0.900% Senior Unsecured Notes Due 2033,” and "1.75% Senior Unsecured Notes Due 2023," of Note 8, “Debt Obligations,” to the condensed consolidated financial statements for further discussion of both the 2023 Notes and 2033 Notes.
The value of various assets and liabilities, including cash and cash equivalents, receivables, accounts payable and accrued expenses, the current portion of long-term debt, and commercial paper, can fluctuate from month to month. Working capital (calculated as current assets less current
46
liabilities) was $122 million as of June 30, 2021, compared with $2,736 million as of December 31, 2020, a decrease of $2,614 million. Current asset balance changes decreased working capital by $2,643 million, due to a decrease in cash and cash equivalents, primarily due to the utilization of cash to partially fund the acquisition of Verafin, a decrease in default funds and margin deposits and a decrease in accounts receivable, net, partially offset by increases in financial investments, other current assets and restricted cash and cash equivalents. Current liability balance changes increased working capital by $29 million, as decreases in default funds and margin deposits, accrued personnel costs, Section 31 fees payable to the SEC and accounts payable and accrued expenses, were partially offset by increases in short-term debt, deferred revenue and other current liabilities.
Principal factors that could affect the availability of our internally-generated funds include:
• deterioration of our revenues in any of our business segments;
• changes in regulatory and working capital requirements; and
• an increase in our expenses.
Principal factors that could affect our ability to obtain cash from external sources include:
• operating covenants contained in our credit facilities that limit our total borrowing capacity;
• increases in interest rates under our credit facilities;
• credit rating downgrades, which could limit our access to additional debt;
• a decrease in the market price of our common stock;
• volatility or disruption in the public debt and equity markets; and
• the impact of the COVID-19 pandemic on our business.
The following sections discuss the effects of changes in our financial assets, debt obligations, regulatory capital requirements, and cash flows on our liquidity and capital resources.
Financial Assets
The following table summarizes our financial assets:
| June 30, 2021 | December 31, 2020 | |||||||||||||
| (in millions) | ||||||||||||||
| Cash and cash equivalents | $ | 390 | $ | 2,745 | ||||||||||
| Restricted cash and cash equivalents | 40 | 37 | ||||||||||||
Financial investments | 235 | 195 | ||||||||||||
| Total financial assets | $ | 665 | $ | 2,977 | ||||||||||
Cash and Cash Equivalents and Restricted Cash and Cash Equivalents
Cash and cash equivalents includes all non-restricted cash in banks and highly liquid investments with original maturities
of 90 days or less at the time of purchase. The balance retained in cash and cash equivalents is a function of anticipated or possible short-term cash needs, prevailing interest rates, our investment policy, and alternative investment choices. As of June 30, 2021, our cash and cash equivalents of $390 million were primarily invested in bank deposits and money market funds. In the long-term, we may use both internally generated funds and external sources to satisfy our debt obligations and other long-term liabilities. Cash and cash equivalents as of June 30, 2021 decreased $2,355 million from December 31, 2020, primarily due to:
•cash paid for our acquisition of Verafin, net of cash and cash equivalents acquired;
•repurchases of our common stock;
•cash dividends paid on our common stock;
•purchases of property and equipment;
•other investing activities;
•payments related to employee shares withheld for taxes;
•net purchases of securities, partially offset by;
•net cash provided by operating activities;
•proceeds from commercial paper, net; and
•proceeds from divestiture of business, net of cash divested.
See “Cash Flow Analysis” below for further discussion.
Restricted cash and cash equivalents are restricted from withdrawal due to contractual or regulatory requirements or is not available for general use. Restricted cash and cash equivalents were $40 million as of June 30, 2021 and $37 million as of December 31, 2020, an increase of $3 million. Restricted cash and cash equivalents are classified as restricted cash and cash equivalents in the Condensed Consolidated Balance Sheets.
Repatriation of Cash
Our cash and cash equivalents held outside of the U.S. in various foreign subsidiaries totaled $189 million as of June 30, 2021 and $237 million as of December 31, 2020. The remaining balance held in the U.S. totaled $201 million as of June 30, 2021 and $2,508 million as of December 31, 2020.
Unremitted earnings of certain subsidiaries outside of the U.S. are used to finance our international operations and are considered to be indefinitely reinvested.
Share Repurchase Program
See “Share Repurchase Program,” of Note 11, “Nasdaq Stockholders’ Equity,” to the condensed consolidated financial statements for further discussion of our share repurchase program.
ASR Agreement
See “ASR Agreement,” of Note 11, “Nasdaq Stockholders’ Equity,” to the condensed consolidated financial statements for further discussion of our ASR agreement.
47
Cash Dividends on Common Stock
The following table shows quarterly cash dividends paid per common share on our outstanding common stock:
| 2021 | 2020 | ||||||||||
| First quarter | $ | 0.49 | $ | 0.47 | |||||||
| Second quarter | 0.54 | 0.49 | |||||||||
| Total | $ | 1.03 | $ | 0.96 | |||||||
See “Cash Dividends on Common Stock,” of Note 11, “Nasdaq Stockholders’ Equity,” to the condensed consolidated financial statements for further discussion of the dividends.
Financial Investments
Our financial investments totaled $235 million as of June 30, 2021 and were trading securities primarily comprised of highly rated European government debt securities and time deposits. As of December 31, 2020, financial investments totaled $195 million and were trading securities primarily comprised of highly rated European government debt securities. Of these securities, $167 million as of June 30, 2021 and $175 million as of December 31, 2020 are assets primarily utilized to meet regulatory capital requirements, mainly for our clearing operations at Nasdaq Clearing. See Note 6, “Investments,” to the condensed consolidated financial statements for further discussion.
* * * * * *
Debt Obligations
The following table summarizes our debt obligations by contractual maturity:
| Maturity Date | June 30, 2021 | December 31, 2020 | ||||||||||||||||||
| (in millions) | ||||||||||||||||||||
Short-term debt - commercial paper | Weighted-average maturity of 20 days | $ | 221 | $ | — | |||||||||||||||
Long-term debt: | ||||||||||||||||||||
| 0.445% senior unsecured notes | December 2022 | 598 | 597 | |||||||||||||||||
1.75% senior unsecured notes | May 2023 | 709 | 730 | |||||||||||||||||
4.25% senior unsecured notes | June 2024 | 498 | 498 | |||||||||||||||||
$1.25 billion senior unsecured revolving credit facility | December 2025 | (4) | (4) | |||||||||||||||||
3.85% senior unsecured notes | June 2026 | 497 | 497 | |||||||||||||||||
| 1.75% senior unsecured notes | March 2029 | 705 | 726 | |||||||||||||||||
| 0.875% senior unsecured notes | February 2030 | 705 | 726 | |||||||||||||||||
| 1.650% senior unsecured notes | January 2031 | 643 | 643 | |||||||||||||||||
| 2.500% senior unsecured notes | December 2040 | 643 | 643 | |||||||||||||||||
| 3.25% senior unsecured notes | April 2050 | 486 | 485 | |||||||||||||||||
Total long-term debt | $ | 5,480 | $ | 5,541 | ||||||||||||||||
Total debt obligations | $ | 5,701 | $ | 5,541 | ||||||||||||||||
In addition to the $1.25 billion revolving credit facility, we also have other credit facilities primarily to support our Nasdaq Clearing operations in Europe, as well as to provide a cash pool credit line for one subsidiary. These credit facilities, which are available in multiple currencies, totaled $223 million as of June 30, 2021 and $232 million as of December 31, 2020 in available liquidity, none of which was utilized.
As of June 30, 2021, we were in compliance with the covenants of all of our debt obligations.
See Note 8, “Debt Obligations,” to the condensed consolidated financial statements for further discussion of our debt obligations.
Regulatory Capital Requirements
Clearing Operations Regulatory Capital Requirements
We are required to maintain minimum levels of regulatory capital for the clearing operations of Nasdaq Clearing. The level of regulatory capital required to be maintained is dependent upon many factors, including market conditions and creditworthiness of the counterparty. As of June 30, 2021, our required regulatory capital of $141 million was comprised of highly rated European government debt securities that are included in financial investments in the Condensed Consolidated Balance Sheets.
48
Broker-Dealer Net Capital Requirements
Our broker-dealer subsidiaries, Nasdaq Execution Services, NPM Securities, SMTX, and Nasdaq Capital Markets Advisory, are subject to regulatory requirements intended to ensure their general financial soundness and liquidity. These requirements obligate these subsidiaries to comply with minimum net capital requirements. As of June 30, 2021, the combined required minimum net capital totaled $1 million and the combined excess capital totaled $24 million, substantially all of which is held in cash and cash equivalents in the Condensed Consolidated Balance Sheets. The required minimum net capital is included in restricted cash and cash equivalents in the Condensed Consolidated Balance Sheets.
Nordic and Baltic Exchange Regulatory Capital Requirements
The entities that operate trading venues in the Nordic and Baltic countries are each subject to local regulations and are
required to maintain regulatory capital intended to ensure their general financial soundness and liquidity. As of June 30, 2021, our required regulatory capital of $35 million was primarily invested in European debt securities that are included in financial investments in the Condensed Consolidated Balance Sheets and cash which is included in restricted cash and cash equivalents in the Condensed Consolidated Balance Sheets.
Other Capital Requirements
We operate several other businesses which are subject to local regulation and are required to maintain certain levels of regulatory capital. As of June 30, 2021, other required regulatory capital was $8 million and was primarily included in restricted cash in the Condensed Consolidated Balance Sheets.
* * * * * *
Cash Flow Analysis
The following table summarizes the changes in cash flows:
| Six Months Ended June 30, | Percentage Change | |||||||||||||||||||
| 2021 | 2020 | |||||||||||||||||||
| Net cash provided by (used in): | (in millions) | |||||||||||||||||||
| Operating activities | $ | 467 | $ | 821 | (43.1) | % | ||||||||||||||
| Investing activities | (2,435) | (145) | 1,579.3 | % | ||||||||||||||||
| Financing activities | (380) | (294) | 29.3 | % | ||||||||||||||||
| Effect of exchange rate changes on cash and cash equivalents and restricted cash and cash equivalents | (4) | (3) | 33.3 | % | ||||||||||||||||
Net increase (decrease) in cash and cash equivalents and restricted cash | (2,352) | 379 | (720.6) | % | ||||||||||||||||
| Cash and cash equivalents and restricted cash and cash equivalents at beginning of period | 2,782 | 362 | 668.5 | % | ||||||||||||||||
| Cash and cash equivalents and restricted cash and cash equivalents at end of period | $ | 430 | $ | 741 | (42.0) | % | ||||||||||||||
Net Cash Provided by Operating Activities
Net cash provided by operating activities primarily consists of net income adjusted for certain non-cash items such as: depreciation and amortization expense of property and equipment; amortization expense of acquired finite-lived intangible assets; expense associated with share-based compensation; and net income from unconsolidated investees.
Net cash provided by operating activities is also impacted by the effects of changes in operating assets and liabilities such as: accounts receivable which is impacted by the timing of customer billings and related collections from our customers; accounts payable and accrued expenses due to timing of payments; accrued personnel costs which are impacted by employee performance targets and the timing of payments related to employee bonus incentives; and Section 31 fees payable to the SEC, which is impacted by the timing of collections from customers and payments to the SEC.
Net cash provided by operating activities decreased $354 million for the six months ended June 30, 2021 compared
with the same period in 2020. The decrease was primarily driven by a cash payment of an acquisition-related tax obligation on behalf of Verafin of $221 million and a cash payment of $102 million, the release of which is subject to certain employment-related conditions over three years following the closing of the acquisition of Verafin, a decrease in Section 31 fees payable to the SEC due to lower average SEC fee rates and timing of payments. The remaining change was primarily due to other fluctuations in our working capital.
Net Cash Used in Investing Activities
Net cash used in investing activities for the six months ended June 30, 2021 primarily related to $2,430 million of cash used for acquisitions, net of cash and cash equivalents acquired of $221 million which was utilized to satisfy an acquisition-related tax obligation on behalf of Verafin, $81 million of purchases of property and equipment, other investing activities of $67 million and payments of $47 million from the net purchases of securities, partially offset by proceeds from divestiture of business, net of cash divested $190 million.
49
Net cash used in investing activities for the six months ended June 30, 2020 primarily related to $157 million of cash used for acquisitions, net of cash and cash equivalents acquired and $68 million of purchases of property and equipment, partially offset by $85 million of proceeds from the net sales of securities.
Net Cash Used in Financing Activities
Net cash used in financing activities for the six months ended June 30, 2021 primarily related to $410 million in repurchases of common stock and $169 million of dividend payments to our shareholders. partially offset by $221 million of proceeds from issuances of commercial paper, net.
Net cash used in financing activities for the six months ended June 30, 2020 primarily related to $1,470 million in repayments of borrowings under our credit commitment and debt obligations, $391 million of net repayments of commercial paper, $158 million of dividend payments to our shareholders, $152 million in repurchases of common stock, and a $36 million payment for debt extinguishment costs, partially offset by $1,928 million of proceeds from issuances of long-term debt and the utilization of our credit commitment.
See Note 4, “Acquisitions and Divestiture,” to the condensed consolidated financial statements for further discussion of our acquisitions and divestiture.
See Note 8, “Debt Obligations,” to the condensed consolidated financial statements for further discussion of our debt obligations.
See “Share Repurchase Program,” and “Cash Dividends on Common Stock,” of Note 11, “Nasdaq Stockholders’ Equity,” to the condensed consolidated financial statements for further discussion of our share repurchase program and cash dividends paid on our common stock.
Contractual Obligations and Contingent Commitments
For the three months ended June 30, 2021, there were no significant changes to our contractual obligations and contingent commitments from those disclosed in “Part I. Item 2. Management’s Discussion and Analysis of Financial Condition and Results of Operations” in our most recently filed Form 10-Q.
Off-Balance Sheet Arrangements
For discussion of off-balance sheet arrangements see:
• Note 14, “Clearing Operations,” to the condensed consolidated financial statements for further discussion of our non-cash default fund contributions and margin deposits received for clearing operations; and
• Note 17, “Commitments, Contingencies and Guarantees,” to the condensed consolidated financial statements for further discussion of:
◦Guarantees issued and credit facilities available;
◦Other guarantees;
◦Routing brokerage activities;
◦Legal and regulatory matters; and
◦Tax audits.
Item 3. QUANTITATIVE AND QUALITATIVE DISCLOSURES ABOUT MARKET RISK
As a result of our operating, investing and financing activities, we are exposed to market risks such as interest rate risk and foreign currency exchange rate risk. We are also exposed to credit risk as a result of our normal business activities.
We have implemented policies and procedures to measure, manage, monitor and report risk exposures, which are reviewed regularly by management and the board of directors. We identify risk exposures and monitor and manage such risks on a daily basis.
We perform sensitivity analyses to determine the effects of market risk exposures. We may use derivative instruments solely to hedge financial risks related to our financial positions or risks that are incurred during the normal course of business. We do not use derivative instruments for speculative purposes.
Interest Rate Risk
We are subject to the risk of fluctuating interest rates in the normal course of business. Our exposure to market risk for changes in interest rates relates primarily to our financial investments and debt obligations which are discussed below.
Financial Investments
As of June 30, 2021, our investment portfolio was primarily comprised of highly rated European government debt securities, which pay a fixed rate of interest. These securities are subject to interest rate risk and the fair value of these securities will decrease if market interest rates increase. If market interest rates were to increase immediately and uniformly by a hypothetical 100 basis points from levels as of June 30, 2021, the fair value of this portfolio would have declined by $6 million.
Debt Obligations
As of June 30, 2021, the majority of our debt obligations were fixed-rate obligations. Interest rates on certain tranches of notes are subject to adjustment to the extent our debt rating is downgraded below investment grade, as further discussed in Note 8, “Debt Obligations,” to the condensed consolidated financial statements. While changes in interest rates will have no impact on the interest we pay on fixed-rate obligations, we are exposed to changes in interest rates as a result of the amounts outstanding from the sale of commercial paper, which have variable interest rates and any borrowings under our 2020 Credit Facility, as the interest rate on this facility has a variable interest rate. As of June 30, 2021, we had principal amounts outstanding of $221 million of commercial paper and no amounts outstanding under our 2020 Credit Facility. A hypothetical 100 basis points increase in interest rates on our outstanding commercial paper would increase annual interest expense by approximately $2 million based on borrowings as of June 30, 2021.
We may utilize interest rate swap agreements to achieve a desired mix of variable and fixed rate debt.
50
Foreign Currency Exchange Rate Risk
We are subject to foreign currency exchange rate risk. Our primary transactional exposure to foreign currency denominated revenues less transaction-based expenses and operating income for the three and six months ended June 30, 2021 is presented in the following table:
| Euro | Swedish Krona | Other Foreign Currencies | U.S. Dollar | Total | ||||||||||||||||||||||||||||
| (in millions, except currency rate) | ||||||||||||||||||||||||||||||||
| Three Months End June 30, 2021 | ||||||||||||||||||||||||||||||||
| Average foreign currency rate to the U.S. dollar | 1.2052 | 0.1188 | # | N/A | N/A | |||||||||||||||||||||||||||
| Percentage of revenues less transaction-based expenses | 6.9 | % | 6.2 | % | 4.6 | % | 82.3 | % | 100.0 | % | ||||||||||||||||||||||
| Percentage of operating income | 11.0 | % | (2.1) | % | (9.0) | % | 100.1 | % | 100.0 | % | ||||||||||||||||||||||
Impact of a 10% adverse currency fluctuation on revenues less transaction-based expenses | $ | (6) | $ | (5) | $ | (4) | $ | — | $ | (15) | ||||||||||||||||||||||
Impact of a 10% adverse currency fluctuation on operating income | $ | (4) | $ | (1) | $ | (3) | $ | — | $ | (8) | ||||||||||||||||||||||
| Euro | Swedish Krona | Other Foreign Currencies | U.S. Dollar | Total | ||||||||||||||||||||||||||||
| (in millions, except currency rate) | ||||||||||||||||||||||||||||||||
| Six Months End June 30, 2021 | ||||||||||||||||||||||||||||||||
| Average foreign currency rate to the U.S. dollar | 1.2053 | 0.1190 | # | N/A | N/A | |||||||||||||||||||||||||||
| Percentage of revenues less transaction-based expenses | 7.1 | % | 6.4 | % | 5.0 | % | 81.5 | % | 100.0 | % | ||||||||||||||||||||||
| Percentage of operating income | 11.8 | % | (2.6) | % | (7.4) | % | 98.2 | % | 100.0 | % | ||||||||||||||||||||||
Impact of a 10% adverse currency fluctuation on revenues less transaction-based expenses | $ | (12) | $ | (11) | $ | (9) | $ | — | $ | (32) | ||||||||||||||||||||||
Impact of a 10% adverse currency fluctuation on operating income | $ | (9) | $ | (2) | $ | (5) | $ | — | $ | (16) | ||||||||||||||||||||||
____________
# Represents multiple foreign currency rates.
N/A Not applicable.
Our investments in foreign subsidiaries are exposed to volatility in currency exchange rates through translation of the foreign subsidiaries’ net assets or equity to U.S. dollars. Substantially all of our foreign subsidiaries operate in functional currencies other than the U.S. dollar. The financial statements of these subsidiaries are translated into U.S. dollars for consolidated reporting using a current rate of exchange, with net gains or losses recorded in accumulated other comprehensive loss within stockholders’ equity in the Condensed Consolidated Balance Sheets.
Our primary exposure to net assets in foreign currencies as of June 30, 2021 is presented in the following table:
| Net Assets | Impact of a 10% Adverse Currency Fluctuation | |||||||||||||
| (in millions) | ||||||||||||||
Swedish Krona(1) | $ | 3,451 | $ | 346 | ||||||||||
| British Pound | 205 | 20 | ||||||||||||
| Norwegian Krone | 173 | 17 | ||||||||||||
| Canadian Dollar | 158 | 16 | ||||||||||||
| Australian Dollar | 123 | 12 | ||||||||||||
| Euro | 91 | 9 | ||||||||||||
(1) Includes goodwill of $2,624 million and intangible assets, net of $632 million.
Credit Risk
Credit risk is the potential loss due to the default or deterioration in credit quality of customers or counterparties. We are exposed to credit risk from third parties, including customers, counterparties and clearing agents. These parties may default on their obligations to us due to bankruptcy, lack of liquidity, operational failure or other reasons. We limit our exposure to credit risk by evaluating the counterparties with which we make investments and execute agreements. For our investment portfolio, our objective is to invest in securities to preserve principal while maximizing yields, without significantly increasing risk. Credit risk associated with investments is minimized substantially by ensuring that these financial assets are placed with governments which have investment grade ratings, well-capitalized financial institutions and other creditworthy counterparties.
Our subsidiary, Nasdaq Execution Services, may be exposed to credit risk due to the default of trading counterparties in connection with the routing services it provides for our trading customers. System trades in cash equities routed to other market centers for members of our cash equity exchanges are routed by Nasdaq Execution Services for clearing to the NSCC. In this function, Nasdaq Execution Services is to be neutral by the end of the trading day, but
51
may be exposed to intraday risk if a trade extends beyond the trading day and into the next day, thereby leaving Nasdaq Execution Services susceptible to counterparty risk in the period between accepting the trade and routing it to the clearinghouse. In this interim period, Nasdaq Execution Services is not novating like a clearing broker but instead is subject to the short-term risk of counterparty failure before the clearinghouse enters the transaction. Once the clearinghouse officially accepts the trade for novation, Nasdaq Execution Services is legally removed from trade execution risk. However, Nasdaq has membership obligations to NSCC independent of Nasdaq Execution Services’ arrangements.
Pursuant to the rules of the NSCC and Nasdaq Execution Services’ clearing agreement, Nasdaq Execution Services is liable for any losses incurred due to a counterparty or a clearing agent’s failure to satisfy its contractual obligations, either by making payment or delivering securities. Adverse movements in the prices of securities that are subject to these transactions can increase our credit risk. However, we believe that the risk of material loss is limited, as Nasdaq Execution Services’ customers are not permitted to trade on margin and NSCC rules limit counterparty risk on self-cleared transactions by establishing credit limits and capital deposit requirements for all brokers that clear with NSCC. Historically, Nasdaq Execution Services has never incurred a liability due to a customer’s failure to satisfy its contractual obligations as counterparty to a system trade. Credit difficulties or insolvency, or the perceived possibility of credit difficulties or insolvency, of one or more larger or visible market participants could also result in market-wide credit difficulties or other market disruptions.
We have credit risk related to transaction and subscription-based revenues that are billed to customers on a monthly or quarterly basis, in arrears. Our potential exposure to credit losses on these transactions is represented by the receivable balances in our Condensed Consolidated Balance Sheets. We review and evaluate changes in the status of our counterparties’ creditworthiness. Credit losses such as those described above could adversely affect our condensed consolidated financial position and results of operations.
We also are exposed to credit risk through our clearing operations with Nasdaq Clearing. See Note 15, “Clearing Operations,” to the condensed consolidated financial statements for further discussion. Our clearinghouse holds material amounts of clearing member cash deposits which are held or invested primarily to provide security of capital while minimizing credit, market and liquidity risks. While we seek to achieve a reasonable rate of return, we are primarily concerned with preservation of capital and managing the risks associated with these deposits. As the clearinghouse may pass on interest revenues (minus costs) to the members, this could include negative or reduced yield due to market conditions. The following is a summary of the risks associated with these deposits and how these risks are mitigated.
•Credit Risk. When the clearinghouse has the ability to hold cash collateral at a central bank, the clearinghouse utilizes its access to the central bank system to minimize credit risk exposures. When funds are not held at a central bank, we seek to substantially mitigate credit risk by ensuring that investments are primarily placed in large, highly rated financial institutions, highly rated government debt instruments and other creditworthy counterparties.
•Liquidity Risk. Liquidity risk is the risk a clearinghouse may not be able to meet its payment obligations in the right currency, in the right place and the right time. To mitigate this risk, the clearinghouse monitors liquidity requirements closely and maintains funds and assets in a manner which minimizes the risk of loss or delay in the access by the clearinghouse to such funds and assets. For example, holding funds with a central bank where possible or investing in highly liquid government debt instruments serves to reduce liquidity risks.
•Interest Rate Risk. Interest rate risk is the risk that interest rates rise causing the value of purchased securities to decline. If we were required to sell securities prior to maturity, and interest rates had risen, the sale of the securities might be made at a loss relative to the latest market price. Our clearinghouse seeks to manage this risk by making short term investments of members' cash deposits. In addition, the clearinghouse investment guidelines allow for direct purchases or repurchase agreements with short dated maturities of high quality sovereign debt (for example, European government and U.S. Treasury securities), central bank certificates and multilateral development bank debt instruments.
•Security Issuer Risk. Security issuer risk is the risk that an issuer of a security defaults on its payment when the security matures. This risk is mitigated by limiting allowable investments and collateral under reverse repurchase agreements to high quality sovereign, government agency or multilateral development bank debt instruments.
Item 4. CONTROLS AND PROCEDURES
Disclosure controls and procedures. Nasdaq’s management, with the participation of Nasdaq’s President and Chief Executive Officer, and Executive Vice President and Chief Financial Officer, has evaluated the effectiveness of Nasdaq’s disclosure controls and procedures (as defined in Rule 13a-15(e) and Rule 15d-15(e) under the Exchange Act) as of the end of the period covered by this report. Based upon that evaluation, Nasdaq’s President and Chief Executive Officer and Executive Vice President and Chief Financial Officer, have concluded that, as of the end of such period, Nasdaq’s disclosure controls and procedures are effective.
52
Changes in internal control over financial reporting. There have been no changes in Nasdaq’s internal control over financial reporting (as defined in Rule 13a-15(f) and Rule 15d-15(f) under the Exchange Act) that occurred during the quarter ended June 30, 2021 that have materially affected, or are reasonably likely to materially affect, Nasdaq’s internal control over financial reporting.
PART II. OTHER INFORMATION
Item 1. LEGAL PROCEEDINGS
See “Legal and Regulatory Matters - Litigation,” of Note 17, “Commitments, Contingencies and Guarantees,” to the condensed consolidated financial statements, which is incorporated herein by reference.
Item 1A. RISK FACTORS
In addition to the other information set forth in this Quarterly Report on Form 10-Q, you should carefully consider the factors discussed under “Risk Factors” in our most recent Form 10-K. These risks could materially and adversely affect our business, financial condition and results of operations. The risks and uncertainties in our most recent Form 10-K are not the only ones facing us. Additional risks and uncertainties not presently known to us or that we currently believe to be immaterial may also adversely affect our business.
Item 2. UNREGISTERED SALE OF EQUITY SECURITIES AND USE OF PROCEEDS
Unregistered Issuance
In connection with the sale of our U.S. Fixed Income business in June 2021, we issued approximately 6.2 million shares of common stock to Newmark SPV I, LLC, an assignee of BGC.
The foregoing issuance did not involve any underwriters, any underwriting discounts or commissions, or any public offering. We believe the issuance of the above securities was exempt from registration under the Securities Act of 1933, as amended (the “Securities Act”) by virtue of Section 4(a)(2) of the Securities Act, because the issuance of securities to the recipients did not involve a public offering.
Issuer Purchases of Equity Securities
Share Repurchase Program
See “Share Repurchase Program,” of Note 11, “Nasdaq Stockholders’ Equity,” to the condensed consolidated financial statements for further discussion of our share repurchase program.
* * * * * *
Purchases of Equity Securities by the Issuer and Affiliated Purchasers
The table below represents repurchases made by or on behalf of us or any “affiliated purchaser” of our common stock during the fiscal quarter ended June 30, 2021:
| Period | (a) Total Number of Shares Purchased | (b) Average Price Paid Per Share | (c) Total Number of Shares Purchased as Part of Publicly Announced Plans or Programs | (d) Maximum Dollar Value of Shares that May Yet Be Purchased Under the Plans or Programs (in millions) | ||||||||||||||||||||||
| April 2021 | ||||||||||||||||||||||||||
Share repurchase program(1) | 318,459 | $ | 153.73 | 318,459 | $ | 199 | ||||||||||||||||||||
Employee transactions(2) | 46,606 | $ | 159.33 | N/A | N/A | |||||||||||||||||||||
| May 2021 | ||||||||||||||||||||||||||
Share repurchase program(1) | 567,828 | $ | 162.27 | 567,828 | $ | 107 | ||||||||||||||||||||
Employee transactions(2) | 917 | $ | 164.92 | N/A | N/A | |||||||||||||||||||||
| June 2021 | ||||||||||||||||||||||||||
Share repurchase program(1) | 615,644 | $ | 173.34 | 615,644 | $ | 1,459 | ||||||||||||||||||||
Employee transactions(2) | 3,353 | $ | 179.61 | N/A | N/A | |||||||||||||||||||||
| Total Quarter Ended June 30, 2021 | ||||||||||||||||||||||||||
| Share repurchase program | 1,501,931 | $ | 165.00 | 1,501,931 | $ | 1,459 | ||||||||||||||||||||
| Employee transactions | 50,876 | $ | 160.77 | N/A | N/A | |||||||||||||||||||||
N/A Not applicable.
(1) See “Share Repurchase Program,” of Note 11, “Nasdaq Stockholders’ Equity,” to the condensed consolidated financial statements for further discussion of our share repurchase program.
(2) Represents shares surrendered to us to satisfy tax withholding obligations arising from the vesting of restricted stock and PSUs issued to employees.
53
Item 3. DEFAULTS UPON SENIOR SECURITIES
None.
Item 4. MINE SAFETY DISCLOSURES
Not applicable.
Item 5. OTHER INFORMATION
None.
Item 6. EXHIBITS
| Exhibit Number | ||||||||
| 101 | The following materials from the Nasdaq, Inc. Quarterly Report on Form 10-Q for the quarter ended June 30, 2021, formatted in iXBRL (Inline eXtensible Business Reporting Language): (i) Condensed Consolidated Balance Sheets as of June 30, 2021 and December 31, 2020; (ii) Condensed Consolidated Statements of Income for the three and six months end June 30, 2021 and 2020; (iii) Condensed Consolidated Statements of Comprehensive Income for the three and six months end June 30, 2021 and 2020; (iv) Condensed Consolidated Statements of Changes in Stockholders' Equity for the three and six months end June 30, 2021 and 2020; (v) Condensed Consolidated Statements of Cash Flows for the six months end June 30, 2021 and 2020; and (vi) notes to condensed consolidated financial statements. | |||||||
| 104 | Cover Page Interactive Data File, formatted in iXBRL and contained in Exhibit 101. | |||||||
* Management contract or compensatory plan or arrangement.
54
SIGNATURES
Pursuant to the requirements of the Securities Exchange Act of 1934, the registrant has duly caused this report to be signed on its behalf by the undersigned, thereunto duly authorized.
| Nasdaq, Inc. | ||||||||||||||||||||
| (Registrant) | ||||||||||||||||||||
| Date: | August 4, 2021 | By: | /s/ Adena T. Friedman | |||||||||||||||||
| Name: | Adena T. Friedman | |||||||||||||||||||
| Title: | President and Chief Executive Officer | |||||||||||||||||||
| Date: | August 4, 2021 | By: | /s/ Ann M. Dennison | |||||||||||||||||
| Name: | Ann M. Dennison | |||||||||||||||||||
| Title: | Executive Vice President and Chief Financial Officer | |||||||||||||||||||
55
