false2022FY0001115128http://fasb.org/us-gaap/2022#AccountingStandardsUpdate202006Memberhttp://fasb.org/us-gaap/2022#AccountingStandardsUpdate202006Memberhttp://fasb.org/us-gaap/2022#OperatingExpenses0.05760370.001http://fasb.org/us-gaap/2022#OtherLiabilitiesCurrenthttp://fasb.org/us-gaap/2022#OtherLiabilitiesCurrent00011151282022-01-012022-12-3100011151282022-06-30iso4217:USD00011151282023-03-10xbrli:shares00011151282022-12-3100011151282021-12-31iso4217:USDxbrli:shares0001115128quot:SeriesAJuniorParticipatingPreferredStockMember2022-12-3100011151282021-01-012021-12-3100011151282020-01-012020-12-310001115128us-gaap:CommonStockMember2019-12-310001115128us-gaap:AdditionalPaidInCapitalMember2019-12-310001115128us-gaap:AccumulatedOtherComprehensiveIncomeMember2019-12-310001115128us-gaap:RetainedEarningsMember2019-12-3100011151282019-12-310001115128us-gaap:CommonStockMember2020-01-012020-12-310001115128us-gaap:AdditionalPaidInCapitalMember2020-01-012020-12-310001115128us-gaap:AccumulatedOtherComprehensiveIncomeMember2020-01-012020-12-310001115128us-gaap:RetainedEarningsMember2020-01-012020-12-310001115128us-gaap:CommonStockMember2020-12-310001115128us-gaap:AdditionalPaidInCapitalMember2020-12-310001115128us-gaap:AccumulatedOtherComprehensiveIncomeMember2020-12-310001115128us-gaap:RetainedEarningsMember2020-12-3100011151282020-12-310001115128us-gaap:CommonStockMember2021-01-012021-12-310001115128us-gaap:AdditionalPaidInCapitalMember2021-01-012021-12-310001115128us-gaap:AccumulatedOtherComprehensiveIncomeMember2021-01-012021-12-310001115128us-gaap:RetainedEarningsMember2021-01-012021-12-310001115128us-gaap:CommonStockMember2021-12-310001115128us-gaap:AdditionalPaidInCapitalMember2021-12-310001115128us-gaap:AccumulatedOtherComprehensiveIncomeMember2021-12-310001115128us-gaap:RetainedEarningsMember2021-12-310001115128us-gaap:CommonStockMember2022-01-012022-12-310001115128us-gaap:AdditionalPaidInCapitalMember2022-01-012022-12-310001115128srt:CumulativeEffectPeriodOfAdoptionAdjustmentMemberus-gaap:AdditionalPaidInCapitalMember2021-12-310001115128srt:CumulativeEffectPeriodOfAdoptionAdjustmentMemberus-gaap:RetainedEarningsMember2021-12-310001115128srt:CumulativeEffectPeriodOfAdoptionAdjustmentMember2021-12-310001115128us-gaap:AccumulatedOtherComprehensiveIncomeMember2022-01-012022-12-310001115128us-gaap:RetainedEarningsMember2022-01-012022-12-310001115128us-gaap:CommonStockMember2022-12-310001115128us-gaap:AdditionalPaidInCapitalMember2022-12-310001115128us-gaap:AccumulatedOtherComprehensiveIncomeMember2022-12-310001115128us-gaap:RetainedEarningsMember2022-12-310001115128quot:ComputerEquipmentAndSoftwareMember2022-01-012022-12-310001115128quot:AllOtherAssetMember2022-01-012022-12-310001115128quot:OnePointSevenFivePercentageConvertibleSeniorNotesDueTwoThousandTwentyTwoMember2017-11-30xbrli:pure00011151282022-07-012022-09-300001115128quot:PromotionServicesMember2022-01-012022-12-310001115128quot:PromotionServicesMember2021-01-012021-12-310001115128quot:PromotionServicesMember2020-01-012020-12-310001115128quot:MediaServicesMember2022-01-012022-12-310001115128quot:MediaServicesMember2021-01-012021-12-310001115128quot:MediaServicesMember2020-01-012020-12-31quot:segment00011151282022-01-012022-01-010001115128srt:CumulativeEffectPeriodOfAdoptionAdjustmentMemberus-gaap:RetainedEarningsMember2022-01-010001115128srt:RevisionOfPriorPeriodReclassificationAdjustmentMember2022-01-010001115128us-gaap:MoneyMarketFundsMemberus-gaap:FairValueInputsLevel1Memberus-gaap:FairValueMeasurementsRecurringMember2021-12-310001115128us-gaap:MoneyMarketFundsMemberus-gaap:FairValueMeasurementsRecurringMemberus-gaap:FairValueInputsLevel2Member2021-12-310001115128us-gaap:MoneyMarketFundsMemberus-gaap:FairValueInputsLevel3Memberus-gaap:FairValueMeasurementsRecurringMember2021-12-310001115128us-gaap:MoneyMarketFundsMemberus-gaap:FairValueMeasurementsRecurringMember2021-12-310001115128us-gaap:FairValueInputsLevel1Memberus-gaap:FairValueMeasurementsRecurringMember2021-12-310001115128us-gaap:FairValueMeasurementsRecurringMemberus-gaap:FairValueInputsLevel2Member2021-12-310001115128us-gaap:FairValueInputsLevel3Memberus-gaap:FairValueMeasurementsRecurringMember2021-12-310001115128us-gaap:FairValueMeasurementsRecurringMember2021-12-310001115128us-gaap:FairValueMeasurementsRecurringMember2022-12-310001115128quot:UbimoLimitedMember2019-12-310001115128quot:ElevaateLimitedMember2019-12-310001115128quot:AhalogyMember2019-12-310001115128quot:UbimoLimitedMember2020-01-012020-12-310001115128quot:ElevaateLimitedMember2020-01-012020-12-310001115128quot:AhalogyMember2020-01-012020-12-310001115128quot:UbimoLimitedMember2020-12-310001115128quot:ElevaateLimitedMember2020-12-310001115128quot:AhalogyMember2020-12-310001115128quot:UbimoLimitedMember2021-01-012021-12-310001115128quot:ElevaateLimitedMember2021-01-012021-12-310001115128quot:AhalogyMember2021-01-012021-12-310001115128quot:UbimoLimitedMember2021-12-310001115128quot:ElevaateLimitedMember2021-12-310001115128quot:AhalogyMember2021-12-310001115128quot:UbimoLimitedMember2022-01-012022-12-310001115128quot:ElevaateLimitedMember2022-01-012022-12-310001115128quot:AhalogyMember2022-01-012022-12-310001115128quot:UbimoLimitedMember2022-12-310001115128quot:ElevaateLimitedMember2022-12-310001115128quot:AhalogyMember2022-12-310001115128quot:ElevaateLimitedMember2018-10-262021-12-310001115128quot:AhalogyMember2018-06-012018-06-010001115128quot:AhalogyMember2018-06-012021-12-310001115128us-gaap:SoftwareAndSoftwareDevelopmentCostsMember2022-12-310001115128us-gaap:SoftwareAndSoftwareDevelopmentCostsMember2021-12-310001115128us-gaap:ComputerEquipmentMember2022-12-310001115128us-gaap:ComputerEquipmentMember2021-12-310001115128us-gaap:LeaseholdImprovementsMember2022-12-310001115128us-gaap:LeaseholdImprovementsMember2021-12-310001115128us-gaap:FurnitureAndFixturesMember2022-12-310001115128us-gaap:FurnitureAndFixturesMember2021-12-310001115128quot:UbimoLimitedMember2019-11-192019-11-190001115128quot:UbimoLimitedMember2019-11-190001115128quot:ElevaateLimitedMember2018-10-262018-10-260001115128quot:ElevaateLimitedMember2018-10-260001115128quot:SavingStarIncMember2018-08-272018-08-270001115128quot:SavingStarIncMember2018-08-270001115128quot:AhalogyMember2018-06-010001115128quot:MediaServiceRightsMember2022-12-310001115128quot:MediaServiceRightsMember2022-01-012022-12-310001115128us-gaap:TechnologyBasedIntangibleAssetsMember2022-12-310001115128us-gaap:TechnologyBasedIntangibleAssetsMember2022-01-012022-12-310001115128us-gaap:CustomerRelationshipsMember2022-12-310001115128us-gaap:CustomerRelationshipsMember2022-01-012022-12-310001115128us-gaap:MarketingRelatedIntangibleAssetsMember2022-12-310001115128us-gaap:MarketingRelatedIntangibleAssetsMember2022-01-012022-12-310001115128us-gaap:FranchiseRightsMember2022-12-310001115128us-gaap:FranchiseRightsMember2022-01-012022-12-310001115128us-gaap:TradeNamesMember2022-12-310001115128us-gaap:TradeNamesMember2022-01-012022-12-310001115128quot:SupplierRelationshipsMember2022-12-310001115128quot:SupplierRelationshipsMember2022-01-012022-12-310001115128us-gaap:PatentsMember2022-12-310001115128us-gaap:PatentsMember2022-01-012022-12-310001115128us-gaap:DatabasesMember2022-12-310001115128us-gaap:DatabasesMember2022-01-012022-12-310001115128quot:RegisteredUsersMember2022-12-310001115128quot:RegisteredUsersMember2022-01-012022-12-310001115128quot:MediaServiceRightsMember2021-12-310001115128quot:MediaServiceRightsMember2021-01-012021-12-310001115128us-gaap:TechnologyBasedIntangibleAssetsMember2021-12-310001115128us-gaap:TechnologyBasedIntangibleAssetsMember2021-01-012021-12-310001115128us-gaap:FranchiseRightsMember2021-12-310001115128us-gaap:FranchiseRightsMember2021-01-012021-12-310001115128us-gaap:CustomerRelationshipsMember2021-12-310001115128us-gaap:CustomerRelationshipsMember2021-01-012021-12-310001115128us-gaap:DatabasesMember2021-12-310001115128us-gaap:DatabasesMember2021-01-012021-12-310001115128us-gaap:MarketingRelatedIntangibleAssetsMember2021-12-310001115128us-gaap:MarketingRelatedIntangibleAssetsMember2021-01-012021-12-310001115128us-gaap:TradeNamesMember2021-12-310001115128us-gaap:TradeNamesMember2021-01-012021-12-310001115128quot:SupplierRelationshipsMember2021-12-310001115128quot:SupplierRelationshipsMember2021-01-012021-12-310001115128us-gaap:PatentsMember2021-12-310001115128us-gaap:PatentsMember2021-01-012021-12-310001115128quot:RegisteredUsersMember2021-12-310001115128quot:RegisteredUsersMember2021-01-012021-12-310001115128quot:OnePointSevenFivePercentageConvertibleSeniorNotesDueTwoThousandTwentyTwoMemberus-gaap:SeniorNotesMember2017-11-300001115128quot:OnePointSevenFivePercentageConvertibleSeniorNotesDueTwoThousandTwentyTwoMemberus-gaap:SeniorNotesMember2017-11-012017-11-300001115128quot:OneHundredThirtyPercentApplicableConversionPriceMemberquot:OnePointSevenFivePercentageConvertibleSeniorNotesDueTwoThousandTwentyTwoMemberus-gaap:SeniorNotesMembersrt:MinimumMember2017-11-012017-11-30utr:D0001115128quot:OneHundredThirtyPercentApplicableConversionPriceMemberquot:OnePointSevenFivePercentageConvertibleSeniorNotesDueTwoThousandTwentyTwoMembersrt:MaximumMemberus-gaap:SeniorNotesMember2017-11-012017-11-300001115128quot:OnePointSevenFivePercentageConvertibleSeniorNotesDueTwoThousandTwentyTwoMemberquot:NinetyEightPercentApplicableConversionPriceMemberus-gaap:SeniorNotesMember2017-11-012017-11-300001115128quot:OnePointSevenFivePercentageConvertibleSeniorNotesDueTwoThousandTwentyTwoMembersrt:MaximumMemberus-gaap:SeniorNotesMember2017-11-012017-11-300001115128quot:OnePointSevenFivePercentageConvertibleSeniorNotesDueTwoThousandTwentyTwoMemberus-gaap:SeniorNotesMember2021-12-310001115128srt:CumulativeEffectPeriodOfAdoptionAdjustmentMemberus-gaap:AccountingStandardsUpdate202006Member2021-12-310001115128us-gaap:SeniorNotesMemberus-gaap:AdditionalPaidInCapitalMember2021-12-310001115128quot:OnePointSevenFivePercentageConvertibleSeniorNotesDueTwoThousandTwentyTwoMember2022-12-310001115128quot:OnePointSevenFivePercentageConvertibleSeniorNotesDueTwoThousandTwentyTwoMember2021-12-310001115128quot:OnePointSevenFivePercentageConvertibleSeniorNotesDueTwoThousandTwentyTwoMemberus-gaap:SeniorNotesMember2022-01-012022-12-310001115128quot:OnePointSevenFivePercentageConvertibleSeniorNotesDueTwoThousandTwentyTwoMemberus-gaap:SeniorNotesMember2021-01-012021-12-310001115128quot:OnePointSevenFivePercentageConvertibleSeniorNotesDueTwoThousandTwentyTwoMemberus-gaap:SeniorNotesMember2020-01-012020-12-310001115128us-gaap:RevolvingCreditFacilityMember2021-11-170001115128us-gaap:LetterOfCreditMember2021-11-170001115128us-gaap:RevolvingCreditFacilityMember2022-08-050001115128us-gaap:RevolvingCreditFacilityMember2022-08-052022-08-050001115128us-gaap:RevolvingCreditFacilityMember2022-09-302022-09-300001115128quot:BTTermLoanFacilityMemberus-gaap:SecuredDebtMember2022-11-300001115128quot:BTTermLoanFacilityMemberus-gaap:LetterOfCreditMember2022-11-300001115128srt:ScenarioForecastMemberquot:BTTermLoanFacilityMemberus-gaap:SecuredDebtMember2023-03-310001115128quot:SecuredOvernightFinancingRateSOFRMemberquot:BTTermLoanFacilityMemberquot:ReferenceRateLoansMember2022-11-302022-11-300001115128quot:SecuredOvernightFinancingRateSOFRMemberquot:BTTermLoanFacilityMemberus-gaap:LineOfCreditMembersrt:MinimumMember2022-11-302022-11-300001115128quot:BTTermLoanFacilityMemberus-gaap:LineOfCreditMember2022-11-302022-11-300001115128quot:BTTermLoanFacilityMemberquot:ReferenceRateLoansMember2022-11-302022-11-300001115128quot:BTTermLoanFacilityMemberquot:FederalFundRatesMemberquot:ReferenceRateLoansMember2022-11-302022-11-300001115128quot:BTTermLoanFacilityMemberquot:ReferenceRateLoansMemberquot:SecuredOvernightFinancingRateSOFRPlusMember2022-11-302022-11-300001115128quot:BTTermLoanFacilityMemberquot:ReferenceRateLoansMemberquot:ForwardLookingTermRateMember2022-11-302022-11-300001115128quot:BTTermLoanFacilityMember2022-11-300001115128quot:BTTermLoanFacilityMemberus-gaap:SeniorNotesMember2022-01-012022-12-310001115128quot:BTTermLoanFacilityMemberus-gaap:SeniorNotesMember2022-12-310001115128quot:BTTermLoanFacilityMemberus-gaap:LetterOfCreditMember2022-11-302022-11-300001115128quot:BTTermLoanFacilityMemberus-gaap:LetterOfCreditMemberquot:SeventyFivePercentageExcessCashFlowMember2022-11-300001115128quot:BTTermLoanFacilityMemberquot:FiftyPercentageExcessCashFlowMemberus-gaap:LetterOfCreditMember2022-11-300001115128quot:BTTermLoanFacilityMemberquot:TwentyFivePercentageExcessCashFlowMemberus-gaap:LetterOfCreditMember2022-11-300001115128us-gaap:RevolvingCreditFacilityMemberquot:PNCRevolverFacilityMember2022-11-300001115128us-gaap:RevolvingCreditFacilityMemberquot:PNCRevolverFacilityMember2022-11-302022-11-300001115128quot:SecuredOvernightFinancingRateSOFRMemberquot:PNCRevolverFacilityMember2022-11-302022-11-300001115128us-gaap:RevolvingCreditFacilityMemberquot:SecuredOvernightFinancingRateSOFRMemberquot:PNCRevolverFacilityMembersrt:MinimumMember2022-11-302022-11-300001115128us-gaap:RevolvingCreditFacilityMemberquot:SecuredOvernightFinancingRateSOFRMemberquot:PNCRevolverFacilityMember2022-11-302022-11-300001115128quot:FederalFundRatesMemberquot:ReferenceRateLoansMemberquot:PNCRevolverFacilityMember2022-11-302022-11-300001115128quot:ReferenceRateLoansMemberquot:PNCRevolverFacilityMemberquot:SecuredOvernightFinancingRateSOFRPlusMember2022-11-302022-11-300001115128quot:PNCRevolverFacilityMember2022-01-012022-12-310001115128us-gaap:StockCompensationPlanMember2022-12-310001115128us-gaap:StockCompensationPlanMember2022-01-012022-12-310001115128us-gaap:StockCompensationPlanMembersrt:MinimumMember2022-01-012022-12-310001115128us-gaap:EmployeeStockOptionMember2022-01-012022-12-310001115128us-gaap:EmployeeStockOptionMember2021-01-012021-12-310001115128us-gaap:EmployeeStockOptionMember2020-01-012020-12-310001115128us-gaap:EmployeeStockOptionMembersrt:MinimumMember2022-01-012022-12-310001115128srt:MaximumMemberus-gaap:EmployeeStockOptionMember2022-01-012022-12-310001115128us-gaap:EmployeeStockMember2021-01-012021-12-310001115128quot:PerformanceBasedRestrictedStockUnitsMember2021-03-012021-03-010001115128quot:PerformanceBasedRestrictedStockUnitsMemberquot:A2022PerformanceBasedRestrictedStockUnitAwardsMember2022-03-012022-03-010001115128quot:PerformanceBasedRestrictedStockUnitsMemberquot:A2022PerformanceBasedRestrictedStockUnitAwardsMemberus-gaap:ShareBasedCompensationAwardTrancheOneMember2022-03-012022-03-010001115128quot:PerformanceBasedRestrictedStockUnitsMemberquot:A2022PerformanceBasedRestrictedStockUnitAwardsMemberus-gaap:ShareBasedCompensationAwardTrancheTwoMember2022-03-012022-03-010001115128quot:PerformanceBasedRestrictedStockUnitsMemberquot:A2022PerformanceBasedRestrictedStockUnitAwardsMemberus-gaap:ShareBasedCompensationAwardTrancheThreeMember2022-03-012022-03-010001115128quot:PerformanceBasedRestrictedStockUnitsMemberquot:A2022PerformanceBasedRestrictedStockUnitAwardsMember2022-08-012022-08-010001115128quot:PerformanceBasedRestrictedStockUnitsMemberquot:A2022PerformanceBasedRestrictedStockUnitAwardsMemberus-gaap:ShareBasedCompensationAwardTrancheOneMember2022-08-012022-08-010001115128quot:PerformanceBasedRestrictedStockUnitsMemberquot:A2022PerformanceBasedRestrictedStockUnitAwardsMemberus-gaap:ShareBasedCompensationAwardTrancheTwoMember2022-08-012022-08-010001115128quot:PerformanceBasedRestrictedStockUnitsMemberquot:A2022PerformanceBasedRestrictedStockUnitAwardsMemberus-gaap:ShareBasedCompensationAwardTrancheThreeMember2022-08-012022-08-010001115128quot:PerformanceBasedRestrictedStockUnitsMemberquot:A2022PerformanceBasedRestrictedStockUnitAwardsMember2022-01-012022-12-310001115128us-gaap:RestrictedStockUnitsRSUMember2020-12-310001115128us-gaap:RestrictedStockUnitsRSUMember2021-01-012021-12-310001115128us-gaap:RestrictedStockUnitsRSUMember2021-12-310001115128us-gaap:RestrictedStockUnitsRSUMember2022-01-012022-12-310001115128us-gaap:RestrictedStockUnitsRSUMember2022-12-310001115128us-gaap:RestrictedStockUnitsRSUMember2020-01-012020-12-310001115128quot:RangeOneMember2022-01-012022-12-310001115128quot:RangeOneMember2022-12-310001115128quot:RangeTwoMember2022-01-012022-12-310001115128quot:RangeTwoMember2022-12-310001115128quot:RangeThreeMember2022-01-012022-12-310001115128quot:RangeThreeMember2022-12-310001115128quot:RangeFourMember2022-01-012022-12-310001115128quot:RangeFourMember2022-12-310001115128quot:RangeFiveMember2022-01-012022-12-310001115128quot:RangeFiveMember2022-12-310001115128us-gaap:EmployeeStockMember2022-12-310001115128us-gaap:EmployeeStockMember2022-01-012022-12-310001115128quot:EmployeeStockPurchasePlanMember2022-01-012022-12-310001115128us-gaap:EmployeeStockMember2020-01-012020-12-310001115128us-gaap:EmployeeStockMembersrt:MinimumMember2022-01-012022-12-310001115128us-gaap:EmployeeStockMembersrt:MaximumMember2022-01-012022-12-310001115128us-gaap:EmployeeStockMembersrt:MinimumMember2021-01-012021-12-310001115128us-gaap:EmployeeStockMembersrt:MaximumMember2021-01-012021-12-310001115128us-gaap:EmployeeStockMembersrt:MinimumMember2020-01-012020-12-310001115128us-gaap:EmployeeStockMembersrt:MaximumMember2020-01-012020-12-310001115128us-gaap:CostOfSalesMember2022-01-012022-12-310001115128us-gaap:CostOfSalesMember2021-01-012021-12-310001115128us-gaap:CostOfSalesMember2020-01-012020-12-310001115128us-gaap:SellingAndMarketingExpenseMember2022-01-012022-12-310001115128us-gaap:SellingAndMarketingExpenseMember2021-01-012021-12-310001115128us-gaap:SellingAndMarketingExpenseMember2020-01-012020-12-310001115128us-gaap:ResearchAndDevelopmentExpenseMember2022-01-012022-12-310001115128us-gaap:ResearchAndDevelopmentExpenseMember2021-01-012021-12-310001115128us-gaap:ResearchAndDevelopmentExpenseMember2020-01-012020-12-310001115128us-gaap:GeneralAndAdministrativeExpenseMember2022-01-012022-12-310001115128us-gaap:GeneralAndAdministrativeExpenseMember2021-01-012021-12-310001115128us-gaap:GeneralAndAdministrativeExpenseMember2020-01-012020-12-310001115128quot:StockOptionsRSUsAndPSUsMember2022-04-012022-06-300001115128quot:PropertyAndEquipmentMember2022-01-012022-12-310001115128quot:PropertyAndEquipmentMember2021-01-012021-12-310001115128quot:PropertyAndEquipmentMember2020-01-012020-12-310001115128quot:StockBasedCompensationExpenseMember2022-12-310001115128us-gaap:EmployeeStockOptionMember2022-12-3100011151282014-03-31quot:votequot:class0001115128quot:FebruaryTwoThousandTwentyOneShareRepurchaseProgramMember2021-02-220001115128us-gaap:SeriesAPreferredStockMember2021-11-120001115128quot:QuotientTechnologyIncMember2021-11-102021-11-100001115128us-gaap:SeriesAPreferredStockMember2021-11-242021-11-2400011151282021-11-240001115128us-gaap:SeriesAPreferredStockMember2021-11-240001115128us-gaap:DomesticCountryMember2022-12-310001115128us-gaap:StateAndLocalJurisdictionMember2022-12-310001115128us-gaap:ForeignCountryMember2022-12-310001115128us-gaap:ResearchMemberus-gaap:DomesticCountryMember2022-12-310001115128us-gaap:ResearchMemberus-gaap:StateAndLocalJurisdictionMember2022-12-310001115128us-gaap:MinistryOfFinanceIndiaMember2022-12-310001115128us-gaap:EmployeeStockOptionMember2022-01-012022-12-310001115128us-gaap:EmployeeStockOptionMember2021-01-012021-12-310001115128us-gaap:EmployeeStockOptionMember2020-01-012020-12-310001115128us-gaap:RestrictedStockUnitsRSUMember2022-01-012022-12-310001115128us-gaap:RestrictedStockUnitsRSUMember2021-01-012021-12-310001115128us-gaap:RestrictedStockUnitsRSUMember2020-01-012020-12-310001115128quot:SharesRelatedToConvertibleSeniorNotesMember2022-01-012022-12-310001115128quot:SharesRelatedToConvertibleSeniorNotesMember2021-01-012021-12-310001115128quot:SharesRelatedToConvertibleSeniorNotesMember2020-01-012020-12-310001115128srt:MinimumMember2022-12-310001115128srt:MaximumMember2022-12-310001115128quot:ProfessionalSportsTeamSuiteMember2022-12-310001115128srt:ScenarioForecastMemberstpr:CAus-gaap:BuildingMember2023-03-31utr:sqft0001115128us-gaap:PurchaseCommitmentMember2022-01-012022-12-310001115128us-gaap:AccountsReceivableMemberus-gaap:CustomerConcentrationRiskMember2022-01-012022-12-31quot:customer0001115128us-gaap:AccountsReceivableMemberus-gaap:CustomerConcentrationRiskMember2021-01-012021-12-310001115128us-gaap:SalesRevenueNetMemberus-gaap:CustomerConcentrationRiskMember2021-01-012021-12-310001115128us-gaap:SalesRevenueNetMemberus-gaap:CustomerConcentrationRiskMember2020-01-012020-12-310001115128us-gaap:SalesRevenueNetMemberus-gaap:CustomerConcentrationRiskMember2022-01-012022-12-31
UNITED STATES
SECURITIES AND EXCHANGE COMMISSION
Washington, D.C. 20549
FORM 10-K
(Mark One)
☒ ANNUAL REPORT PURSUANT TO SECTION 13 OR 15(d) OF THE SECURITIES EXCHANGE ACT OF 1934
For the fiscal year ended December 31, 2022
OR
☐ TRANSITION REPORT PURSUANT TO SECTION 13 OR 15(d) OF THE SECURITIES EXCHANGE ACT OF 1934
For the transition period from to
Commission File Number 001-36331
Quotient Technology Inc.
(Exact name of registrant as specified in its Charter)
| | | | | | | | |
| Delaware | | 77-0485123 |
(State or other jurisdiction of
incorporation or organization) | | (I.R.S. Employer
Identification No.) |
1260 East Stringham Avenue, 6th Floor Salt Lake City, UT | | 84106 |
| (Address of principal executive offices) | | (Zip Code) |
Registrant’s telephone number, including area code: (650) 605-4600
(Former name, former address and former fiscal year, if changed since last report)
Securities Registered pursuant to Section 12(b) of the Act:
| | | | | | | | | | | | | | |
| Title of each class | | Trading Symbol | | Name of each exchange on which registered |
| Common Stock, $0.00001 par value per share | | QUOT | | New York Stock Exchange |
Indicate by check mark if the registrant is a well-known seasoned issuer, as defined in Rule 405 of the Securities Act. Yes ☐ No ☒
Indicate by check mark if the registrant is not required to file reports pursuant to Section 13 or 15(d) of the Act. Yes ☐ No ☒
Indicate by check mark whether the registrant: (1) has filed all reports required to be filed by Section 13 or 15(d) of the Securities Exchange Act of 1934 during the preceding 12 months (or for such shorter period that the registrant was required to file such reports), and (2) has been subject to such filing requirements for the past 90 days. Yes ☒ No ☐
Indicate by check mark whether the registrant has submitted electronically every Interactive Data File required to be submitted pursuant to Rule 405 of Regulation S-T (§232.405 of this chapter) during the preceding 12 months (or for such shorter period that the registrant was required to submit such files). Yes ☒ No ☐
Indicate by check mark whether the registrant is a large accelerated filer, an accelerated filer, a non-accelerated filer, a smaller reporting company, or an emerging growth company. See the definition of “large accelerated filer”, “accelerated filer”, “smaller reporting company”, and “emerging growth company” in Rule 12b-2 of the Exchange Act.:
| | | | | | | | | | | |
| Large accelerated filer | ☐ | Accelerated filer | ☒ |
| | | | |
| Non-accelerated filer | ☐
| Small reporting company | ☐ |
| | | | |
| Emerging growth company | ☐ | | |
If an emerging growth company, indicate by check mark if the registrant has elected not to use the extended transition period for complying with any new or revised financial accounting standards provided pursuant to Section 13(a) of the Exchange Act. ☐
Indicate by check mark whether the registrant has filed a report on and attestation to its management’s assessment of the effectiveness of its internal control over financial reporting under Section 404(b) of the Sarbanes-Oxley Act (15 U.S.C. 7262(b)) by the registered public accounting firm that prepared or issued its audit report. ☒
If securities are registered pursuant to Section 12(b) of the Act, indicate by check mark whether the financial statements
of the registrant included in the filing reflect the correction of an error to previously issued financial statements. ☐
Indicate by check mark whether any of those error corrections are restatements that required a recovery analysis of incentive-based compensation received by any of the registrant’s executive officers during the relevant recovery period pursuant to §240.10D-1(b). ☐
Indicate by check mark whether the registrant is a shell company (as defined in Rule 12b-2 of the Exchange Act). Yes ☐ No ☒
The aggregate market value of the voting and non-voting common equity held by non-affiliates of the registrant, as of June 30, 2022, the last business day of the registrant’s most recently completed second fiscal quarter, based on the closing price of $2.97 per share of the Registrant’s common stock as reported by the New York Stock Exchange on June 30, 2022, was $272.3 million. The calculation of the aggregate market value of voting and non-voting common equity excludes 4.6 million shares of the registrant held by executive officers, directors and stockholders that the registrant concluded were affiliates of the registrant on that date. Exclusion of such shares should not be construed to indicate that any such person possesses the power, direct or indirect, to direct or cause the direction of the management or policies of the registrant or that such person is controlled by or under common control with the registrant.
The number of shares of registrant’s Common Stock outstanding as of March 10, 2023 was 97,675,512.
DOCUMENTS INCORPORATED BY REFERENCE
Portions of the registrant’s Definitive Proxy Statement relating to the Annual Meeting of Stockholders are incorporated by reference into Part III of this Annual Report on Form 10-K where indicated. Such definitive Proxy Statement will be filed with the Securities and Exchange Commission within 120 days after the end of the registrant’s fiscal year ended December 31, 2022.
Table of Contents
| | | | | | | | |
| | | Page |
| | |
Item 1. | | |
Item 1A. | | |
Item 1B. | | |
Item 2. | | |
Item 3. | | |
Item 4. | | |
| | | |
Item 5. | | |
Item 6. | | |
Item 7. | | |
Item 7A. | | |
Item 8. | | |
Item 9. | | |
Item 9A. | | |
Item 9B. | | |
| | | |
Item 10. | | |
Item 11. | | |
Item 12. | | |
Item 13. | | |
Item 14. | | |
| | | |
Item 15. | | |
Item 16. | | |
Unless the context otherwise requires, the terms “Quotient,” “Coupons,” the “Company,” “we,” “us” and “our” in this Annual Report on Form 10-K refer to Quotient Technology Inc. and its consolidated subsidiaries.
Quotient, Ubimo, Ahalogy, Elevaate, SavingStar, Shopmium and our other registered or common law trademarks, service marks or trade names appearing in this Annual Report on Form 10-K are the property of Quotient and its subsidiaries. Other trademarks and trade names referred to in this Annual Report on Form 10-K are the property of their respective owners.
SPECIAL NOTE REGARDING FORWARD-LOOKING STATEMENTS
This Annual Report on Form 10-K contains forward-looking statements within the meaning of Section 27A of the Securities Act of 1933, as amended (the “Securities Act”) and Section 21E of the Securities Exchange Act of 1934, as amended (the “Exchange Act”). The words “anticipate,” “believe,” “continue,” “could,” “seek,” “might,” “estimate,” “expect,” “intend,” “may,” “plan,” “potential,” “predict,” “approximately,” “project,” “should,” “will,” “would” or the negative or plural of these words or similar expressions, as they relate to our company, business and management, are intended to identify forward-looking statements. Forward-looking statements contained in this Annual Report on Form 10-K include, but are not limited to, statements about:
•our financial performance, including our revenues, margins, costs, expenditures, growth rates and operating expenses, and our ability to generate positive cash flow and become profitable;
•our strategies relating to the growth of our platforms and our business, including the network effect we seek to develop, and our aim through executing on these strategies to attract and retain more retailers, consumer packaged goods (CPG) advertisers, and consumers;
•our expectations regarding trends in our industry, including the growth of retail media, the impact of the inflationary environment and supply chain constraints, and the shift to digital promotions and advertising from off-line channels;
•our expectations regarding the size of the addressable market for the solutions we offer;
•our belief that there has been a gap in the market for a central, transparent platform that aggregates individual retail media networks and simplifies ad planning, campaign, execution and measurement for CPGs across multiple retailers, and that we are well-positioned to help retailers monetize their properties while reducing complexity for CPGs as we continue to see retail media grow;
•our belief that the inflationary environment may eventually become a favorable tailwind for our promotions business as consumers seek out savings at an increasing level, and as CPGs look to combat threats from challenger and private label brands to acquire market share through offering consumers value through lower price points;
•our ability to successfully and timely implement changes in our business model, including transitioning the pricing of promotions offerings from cost-per-acquisition to duration-based pricing and increasing the proportion of self-service and automated solutions on our platforms;
•the rate at which transitions in our business model will occur, including pricing model changes, and the expected benefits of such transitions to advertisers and retail partners;
•our ability to maintain and grow the size of our targetable audience;
•our ability to expand the use of our media and promotions offerings by consumers;
•our ability to innovate our consumer solutions and experiences to retain and grow our consumer base;
•our belief in the growth opportunities associated with each of our four product families: promotions, direct-to-consumer (DTC), retail ad network, and digital-out-of-home (DOOH);
•our intent to expand our promotions business, which we believe will drive organic growth, and our intent to achieve this through driving net new category expansion, through further penetration within our existing CPG customer accounts, which represent some of the largest CPG manufacturers in the U.S., and through working with more small and mid-tier sized brands;
•our intent to invest in product innovation within our promotions product family, with the aim of increasing engagement from consumers, simplifying promotions planning and execution for brands, and providing better alignment of brand campaigns with retailer merchant strategies and calendars;
•our intent to invest in strategic growth initiatives built around a number of assets within our existing platform, where we believe we have differentiators and as to which differentiators—the Shopmium (DTC) app, our DOOH platform, and our Retail Ad Network offering—we see the potential for future market growth;
•our belief that, through executing on one or more of our strategic growth strategies, we will be able to grow content, consumer engagement and, ultimately, revenue in 2023;
•Our belief that moving more business to self-service and away from managed services will enable us to grow more profitably by utilizing the power of our cloud-based platform technology and reducing the manual effort and overhead expenses associated with managed-service campaign execution;
•Our belief that, as more retailers join the Retail Ad Network, the scale amassed by multiple retailers within the network will attract commensurate ad investment from brands, thus giving retailers of all sizes and classes of trade the opportunity to access a larger share of ad dollars;
•our ability to maintain and expand our data rights with our retailer network;
•our ability to demonstrate the value of our platforms through trusted measurement metrics;
•our ability to deploy, execute, and continue to develop our measurement and analytics capabilities;
•our intent to continue to invest in developing our differentiated and proprietary platforms aimed at solving the problems of CPGs and retailers;
•our ability to respond to changes in the legislative or regulatory environment, including with respect to privacy and data protection, or enforcement by government regulators, including fines, orders, or consent decrees;
•our ability to hire, integrate, train and retain talented personnel;
•our ability to successfully integrate any newly acquired companies into our business;
•our ability to effectively manage scaling and international expansion of our operations;
•our ability to successfully compete with existing and new competitors; and
•our ability to maintain, protect and enhance our brand and intellectual property.
We caution you that the foregoing list may not contain all of the forward-looking statements made in this Annual Report on Form 10-K.
We have based these forward-looking statements on our current expectations and projections about future events and financial trends affecting our business. Forward-looking statements should not be read as guarantees of future performance or results, and will not necessarily be accurate indications of the times at, or by, which such performance or results will be achieved. Forward-looking statements are based on information available to our management at the date of this Annual Report on Form 10-K and our management’s good faith belief as of such date with respect to future events, and are subject to risks and uncertainties that could cause actual performance or results to differ materially from those expressed in or suggested by the forward-looking statements. Forward-looking statements involve known and unknown risks, uncertainties and other factors that may cause our actual results, performance or achievements to be materially different from any future results, performance or achievements expressed or implied by the forward-looking statements. We discuss these risks in greater detail in “Item 1A: Risk Factors” and elsewhere in this Annual Report on Form 10-K. Forward-looking statements speak only as of the date of this Annual Report on Form 10-K. We caution you that the foregoing list of important factors may not contain all of the material factors that are important to you. Except as required by law, we assume no obligation to publicly update or revise any forward-looking statement to reflect actual results, changes in assumptions based on new information, future events or otherwise. If we update one or more forward-looking statements, no inference should be drawn that we will make additional updates with respect to those or other forward-looking statements. Given these risks and uncertainties, you are cautioned not to place undue reliance on such forward-looking statements.
Summary of Risk Factors
Our business is subject to a number of risks, including risks that may prevent us from achieving our business objectives or may adversely affect our business, financial condition, results of operations, cash flows, and prospects. These risks are discussed more fully under "Item 1A. Risk Factors" below and include, but are not limited to, risks related to:
Risks Related to Our Business
•We have incurred net losses since inception and we may not be able to generate sufficient revenues to achieve or subsequently maintain profitability.
•We may not achieve revenue growth, or may encounter unplanned fluctuations in our revenue, due to external factors such as global macroeconomic risk of slowdown or recession, which could negatively impact the spending of consumers, CPGs, and retailers and thus negatively impact our business.
•We may not achieve revenue growth, or may encounter unplanned fluctuations in our revenue, due to our business and pricing model changes, or as a result of other strategic initiatives we may choose to pursue, which could negatively affect our business.
•Our revenue and business will be negatively affected if we fail to retain and expand our relationships with retailers, if we fail to obtain commitment and support for our platforms from retailers, and if we do not successfully renegotiate or amend retailer agreements.
•Our revenue and business will be negatively affected if we fail to develop, increase the number of and expand relationships with network partners that contribute to the growth of audiences engaging on our platforms.
•The loss of or decrease in spending by any significant customer, or the loss of or decrease in support from any significant partner, could materially and adversely affect our revenues, results of operations and financial condition.
•If the distribution, revenue sharing or other fees that we pay increase, or if we are unable to meet contractual minimums under guaranteed distribution fee arrangements, our gross profit and business will be negatively affected.
•Our gross margins are dependent on many factors, some of which are not directly controlled by us.
•We expect a number of factors to cause our operating results to fluctuate on a quarterly and annual basis, which may make it difficult to predict our future performance.
•If we are unable to successfully respond to changes in the digital promotions market, our business could be negatively affected.
•If we fail to maintain and expand the use by consumers of digital promotions on our platforms, our revenues and business will be negatively affected.
•Competition presents an ongoing threat to the success of our business.
•We depend in part on advertising agencies as intermediaries, and if we fail to develop and maintain these relationships, our business may be negatively affected.
•Our failure to attract, integrate, motivate and retain highly qualified personnel in the future could harm our business, and in the near term is an increasing challenge due to market conditions and strategic transitions in our business.
•Acquisitions, joint ventures and strategic investments could result in operating difficulties, dilution and other harmful consequences.
•Failure to deal effectively with fraudulent or other improper transactions could harm our business.
•Indemnity provisions in various agreements and our corporate documents potentially expose us to substantial liability for intellectual property infringement and other claims.
•Our business depends on strong brands, and if we are not able to maintain and enhance our brands, or if we receive unfavorable media coverage, our ability to retain and expand our number of advertisers, retailers and consumers will be impaired and our business and operating results will be negatively affected.
•Our use of and reliance on international research and development resources and operations may expose us to unanticipated costs or events.
•If we fail to expand effectively in international markets, our revenues and our business may be negatively affected.
Risks Related to Government Regulation, Tax Law or Accounting Standards
•Our business is subject to complex and evolving laws, regulations and industry standards, and unfavorable interpretations of, or changes in, or our actual and perceived failure to comply with these laws, regulations and industry standards could substantially harm our business and results of operations.
•If our estimates or judgements relating to our critical accounting policies prove to be incorrect, our results of operations could be adversely affected.
•Failure to comply with federal, state and foreign privacy, data protection, marketing and consumer protection laws, regulations and industry standards, or the expansion of current or the enactment or adoption of new privacy, data protection, marketing and consumer protection laws, regulations or industry standards, could adversely affect our business.
Risks Related to Our Platforms, Technology and Intellectual Property
•If our security measures or information we collect and maintain are compromised or publicly exposed, advertisers, retailers and consumers may curtail or stop using our platforms and we could be subject to claims, penalties and fines.
•Our ability to generate revenue and properly capture the occurrence of certain revenue-generating events depends on the collection, reliability, and use of significant amounts of data from various sources, which may be restricted by consumer choice, restrictions imposed by retailers, publishers and browsers or other software developers, changes in technology, and new developments in laws, regulations and industry requirements or standards.
•If the use of mobile device identifiers, third-party cookies or other tracking technology is rejected by consumers, restricted by third parties outside of our control or otherwise subject to unfavorable regulation, the benefits of our offerings and solutions could diminish, our data and media acquisition costs could increase, and we could lose customers and revenue.
•Our business depends on our ability to maintain and scale the network infrastructure necessary to operate our platforms, including our websites and mobile applications, and any significant disruption in service could result in a loss of advertisers, retailers and consumers.
•We may not be able to adequately protect our intellectual property rights.
•We may be accused of infringing intellectual property rights of third parties.
Risks Related to Ownership of our Common Stock
•The market price of our common stock has been, and is likely to continue to be, subject to wide fluctuations and could subject us to litigation.
•Our business could be negatively affected as a result of the actions of stockholders.
Risks Related to Debt Financing Transactions
•We are leveraged financially, which could adversely affect our ability to adjust our business to respond to competitive pressures and to obtain sufficient funds to satisfy our future growth, business needs and development plans.
General Risks
•Our ability to raise capital in the future may be limited, and our failure to raise capital when needed could prevent us from growing.
PART I
Item 1. Business.
Overview
Quotient Technology Inc. is an industry leading promotions and media technology company that delivers targeted digital promotions and media for advertisers and retailers to reach consumers and drive action. Using our platforms and suite of omnichannel solutions, advertisers can plan, target, deliver and measure performance marketing to impact sales. Our vision is to build the world's leading performance marketing platform that programmatically delivers a variety of targeted digital marketing solutions that advertisers and retailers can purchase to drive measurable improvements in sales and customer loyalty.
Our customers consist primarily of consumer-packaged goods ("CPG") companies and their brand marketers (together referred to as "advertisers") who want to drive sales and positive brand engagement with shoppers. Our digital marketing platform is designed to produce returns on marketing investment for advertisers by utilizing consumer behavior, intent data and point of sale ("POS") data to deliver the right marketing message and call-to-action to the right consumer at the right time, through multiple touchpoints while consumers are engaged online, out of home and in-store. We partner with retailers, who primarily sell products through physical stores and eCommerce properties, as well as non-retailer publisher websites and other properties. We are primarily focused on the US-based grocery retail market and the advertisers who sell products through that channel, and we are expanding our platform to verticals outside of the grocery retail space.
By partnering with Quotient, retailers can monetize their proprietary sales data and offer effective marketing opportunities for their brand partners to engage consumers across multiple touchpoints, including through their owned and operated properties as well as offsite media ad inventory, with the aim of achieving higher sales through their physical stores and eCommerce sites.
Over the last five years, we have grown our platform capabilities and our network of marketing channels to reach shoppers through a combination of in-house innovation, partnerships, and acquisitions. Our network includes the digital properties of our retail partners, non-retail publisher partners and CPG customers, social media platforms, digital out-of-home ("DOOH") properties, and our consumer brand, Shopmium. This network provides Quotient with proprietary and licensed data, including retailers' POS shopper data, first-party consumer behavior and purchase intent data, and location intelligence. With such data powering our platforms, customers and partners use Quotient to leverage consumer insights, target and engage consumers via digital channels, and integrate marketing and merchandising programs to drive measurable sales results and consumer engagement.
Our network is made up of several different constituencies:
•Our advertiser customers consist of approximately 800 CPGs, representing over 2,100 brands, including some of the leading food, beverage, personal care and household product manufacturers;
•Our retail partners represent multiple classes of trade and verticals such as grocery retailers, drug, automotive, mass merchant, dollar, club, and convenience merchandise channels, where most CPGs' products are sold;
•Our publisher partners who invest in online consumer engagement and who help us to increase our network's reach to more US shoppers; and
•Millions of consumers who visit our owned websites, mobile properties and social channels, as well as those of our CPGs, retailer partners and other network partners.
Through these relationships, we believe we have created a network effect, which engages consumers and provides us a competitive advantage over both offline and online competitors. As our network expands and consumer audience increases, we generate more consumer data and insights, which further improves our ability to deliver targeted and personalized promotions and media, and also strengthens our measurement and data insight solutions. We believe this will make our platforms more valuable to advertisers and retailers for their digital marketing campaigns. We expect that the increasing breadth of promotion and media content delivered through Quotient platforms from leading brands will enable us to attract and retain more retailers and consumers.
Advertisers and retailers use our technology platforms to help achieve their digital marketing objectives in four distinct ways:
•Plan, buy and execute integrated promotions and media campaigns to reach the right shoppers;
•Target advertising, promotions and messaging to shoppers to maximize impact;
•Sell advertising space and activate the shopper data that retailers collect through loyalty programs and digital transactions; and
•Measure the impact of advertisements, promotions or messages that have been planned, sold or placed with "closed loop" measurement, defined as the use of consumer data to help understand and evaluate how certain digital campaigns impact our advertiser customers' and retailer partners' sales.
We deliver targeted and/or personalized digital promotions and media to shoppers through our network using shopper data from our retail partners as well as proprietary data from our audience segments. Our solutions help our customers and partners optimize the performance of their digital marketing campaigns as they continue to shift more of their marketing spend from traditional to digital channels. Our platforms measure performance by attribution of digital campaigns to retail purchases in near real time, demonstrating return on spend for our customers and partners.
Our promotions products include digital rebates, load-to-card loyalty offers, and digital print and paperless coupons. Our media solutions include display, social, DOOH, Retailer.com display and sponsored search, shoppable event pages, and audience segments. A growing number of campaigns that our customers purchase are integrated campaigns, which combine a mix of digital promotions and/or media solutions within a single campaign. Revenue we earn from these programs is generally determined through a duration-based (also known as time-based) pricing model, or on a cost-per-click, cost-per-impression or cost-per-acquisition basis.
We generally pay a distribution fee, or revenue share, to retailers and publishers for activations or redemptions of a digital promotion, for media campaigns, and for use of data targeting and/or measurement. We also pay a fee to third-party publishers for traffic acquisition, which consists of delivering campaigns on certain networks or properties. In cases where we control the digital promotion and media advertising inventory before it is transferred to our customers, these distribution, revenue share and third-party service fees are included in our cost of revenues. In cases where we do not control the digital promotion and media advertising inventory, we record revenues on a net basis, and the distribution, revenue-share and third-party service fees are deducted from gross revenues to arrive at net revenues.
During 2022, we generated revenues of $288.8 million, representing 45% decline over 2021, and a net loss of $76.5 million in 2022 as compared to a net loss of $45.6 million in 2021. See our Consolidated Financial Statements and accompanying notes for more information. For the years ended December 31, 2022, 2021, and 2020, there were no customers that accounted for greater than 10% of our total revenues during each respective period.
Our Industry
In our view, our near-term growth will be driven by how well we take advantage of, or how we are impacted by, several major market trends in our industry:
Growth of Retail Media – Retail media presents an opportunity for retailers to generate high-margin ad revenue and monetize their first-party shopper data. The retail media industry is going through a significant transformation, with the frequent introduction of new ad networks, and with many retailers with established retail media strategies bringing their formerly outsourced businesses in-house. While this trend of in-housing has driven a change in our relationships with several retailer partners, presenting challenges for us in recent quarters, the increasingly fragmented landscape presents an opportunity for us to adapt our strategy and take advantage of what we believe has been a gap in the market for a central, transparent platform that aggregates individual retail media networks and simplifies campaign ad planning, buying, execution and measurement for CPGs across multiple retailers. We believe we are well-positioned to help retailers monetize their properties while reducing complexity for CPGs as we continue to see retail media grow.
While retail media is traditionally considered as advertising through retailer-owned media inventory and other digital media to drive sales, Quotient’s vision is that retail media becomes a more comprehensive performance marketing approach that leverages both media and promotions, with promotions being an effective marketing tool for incentivizing action.
Inflationary Environment and Supply Chain Constraints – We continue to be impacted by supply chain challenges and input cost pressures affecting our customers and retailer partners as a result of the macro inflationary environment. As a result, many CPG brands have been cautious with allocating promotions and media budgets to prevent overselling. This uncertainty has adversely affected the volume of offers on our network in recent quarters. However, we believe the inflationary environment may eventually become a favorable tailwind for our promotions business as consumers seek out savings at an increasing level, and as CPGs look to combat threats from challenger and private label brands to acquire market share through offering consumers value through lower price points.
Continuing Migration of Marketing Budgets from Offline to Digital – Marketing methods that traditionally have been executed offline are continuing to move to online digital marketing. Historically, the vast majority of CPG's budgets have been spent in offline channels, such as the Free Standing Insert ("FSI") found in newspapers, direct mail, printed circulars, in-store aisle tags, end caps and television. These traditional offline channels are becoming less effective as consumers spend more time online, particularly through mobile devices, and a feature of this trend is the rising importance of using data to drive personalized and targeted content to consumers. To reach consumers at the right time and place, CPGs are increasingly shifting media and promotion dollars that have been historically spent in offline channels to digital channels. The vast majority of US grocery purchases are still made in-person in physical grocery retail stores. However, the COVID-19 pandemic has significantly accelerated the shift to eCommerce for grocery and other retail transactions. This has led retailers and brands to adopt an omnichannel approach to consumer engagement and buying behaviors. As a result, advertisers are moving advertising budgets to online channels in order to influence more shoppers throughout their path to purchase.
As the shift to digital promotions and media continues to grow, so does the importance placed on the use of data to target audiences and measure campaign performance. As a greater portion of grocery sales have shifted from offline to online, retailers are focused on implementing omnichannel strategies and technology-related solutions to meet consumer demands, and to compete effectively and to drive sales. This omnichannel approach, which leverages combined data from offline and online sales, is resulting in an increased number of digital touchpoints for retailers and their CPGs to target shoppers with relevant promotions and digital marketing. As retailers add more omnichannel capabilities, brands increasingly are able to shift more marketing dollars to digital.
Business Model Changes
In response to the market trends discussed above, during 2022 we accelerated the evolution of our business model, begun during 2021, to better align our offerings to the demand in the marketplace. Historically, we have taken a managed service approach to digital marketing by supporting our advertiser clients with services throughout the campaign’s planning, execution and measurement phases. Currently, we see an increasing percentage of CPGs, national advertising agencies and other advertisers looking for transparency in the pricing and execution features of a campaign, and also for more self-service capabilities whereby they have more control over the campaign. Over the past few years, we have developed self-service capabilities for several of our products, through which our customers determine campaign objectives, targeting strategy and ad placements.
We believe moving more business to self-service and away from managed services will enable us to grow more profitably by utilizing the power of our cloud-based platform technology and reducing the manual effort and overhead expenses associated with managed-service campaign execution. For example, during the fourth quarter of 2021, we introduced our retail business model with respect to non-duration based retailer specific (or shopper) promotion and media campaigns. Instead of being a marketing distribution partner, retailers use our proprietary platforms to set pricing and determine how such non-duration based shopper promotions and media campaigns are executed, and pay us for the use of our technology and services. This business model change was designed to provide several benefits to retailer customers including improved pricing transparency and control over the shopper marketing campaign’s prospects for success. Also, in this model, under generally accepted accounting principles, we recognize revenue net of third-party costs for such non-duration based shopper programs. See Management’s Discussion and Analysis of Financial Condition and Results of Operations – “Critical Accounting Policies and Estimates” for more information.
Our duration-based promotions solution and pricing model also responds to trends in our industry. This solution provides advertisers access to our proprietary platforms for a specific period of time (the campaign period) in exchange for a fixed fee. The fixed campaign period allows retailers and advertisers to coordinate merchandising calendars with the specific time periods during which the promotion is run. Duration-based pricing also more directly aligns with the traditional way in which promotions have been priced and executed using traditional physical coupons distributed through the FSI historically included in the daily or Sunday newspaper.
Promotions that are still run under our historical cost-per click or cost-per-acquisition model could result in a digital coupon or rebate that is available online for only the first few days of a campaign, if shopper activations are higher than expected. Under our duration-based pricing model, a promotional offer will be available for use during the entire planned start and end dates, which generally are between seven and twenty-eight days.
We believe this duration-based pricing and delivery model is beneficial to our retailer partners and advertisers as it aligns with their traditional methods of budgeting for marketing spend and executing on merchandising plans. We launched this pricing model in 2021 and continued to migrate advertiser clients to duration-based pricing throughout 2022.
Our Platforms and Solutions
We offer technology and solutions that power integrated digital promotions and media campaigns for brands and retailers. Our platforms enable our customers to plan, buy and execute measurable campaigns that target key shopper audiences to drive profitable sales, build loyalty and increase brand awareness and affinity. In our view, the scale of our network, our rich first and second party data, and our programmatic technology—which offer omnichannel execution, brand safety, and efficiency and transparency of ad buying—provide competitive differentiators and a strong foundation for driving profitable and sustainable growth.
To fully leverage the power of our network and to drive focused execution, we have aligned our organization around four key product families, each representing a distinct growth opportunity. The four key product areas are promotions, direct-to-consumer ("DTC"), Retail Ad Network, and DOOH.
Promotions
Our promotions business consists of a broad network of consumer touchpoints across our retailer and publisher properties as well as our DTC app through which we deliver savings to consumers. We continue to scale our network through building on existing partnerships, and securing new partnerships, which we believe represents growth potential as we offer consumers convenient ways to find value wherever they spend time and however they wish to save.
Our promotions platform offers consumers the ability to save through cash-back rebates, digital paperless promotions and digital print promotions, available across our distribution network. With digital paperless and rebates, shoppers add promotions directly to retailer loyalty accounts for automatic digital redemption, or use a mobile device to take a picture of a retailer receipt with the appropriate purchase for cash-back redemption. With digital print, shoppers select promotions and print them from their desktop or mobile device to redeem in-store.
Through this platform, brands and retailers can reach shoppers on the web and on mobile devices by offering digital promotions through our extensive network which includes:
•brand and retailer websites and mobile applications;
•thousands of third-party publisher websites and mobile applications; and
•the DTC Shopmium mobile application.
Promotions can be personalized and/or targeted to shoppers through a combination of data points including historical shopper purchase and intent data, promotion activations and redemptions, shopper interests, online click and search behavior, demographics, and location data. These techniques are designed to enable us to optimize the delivery of promotions across the network and drive campaign performance.
Our promotions platform is used by retailers in the grocery, drug, automotive, mass merchant, dollar, club and convenience merchandise channels to integrate into their POS systems or loyalty programs. This solution is
designed to function as a component of the retailer's digital marketing platform, to create a direct, digital relationship with shoppers, and to engage them through an omnichannel experience. Through our promotions platform, we use consumer data and insights to distribute personalized and targeted promotions and media, primarily funded by our advertiser customers, to help drive consumer loyalty and increase sales. Additional solutions on this platform that aim to increase visibility of promotions include personalized e-mails, digital grocery lists, branded event pages, and digital circulars.
Direct-to-Consumer (DTC)
Our direct-to-consumer properties play an important role in our network as an additional way for us to drive action from consumers. We provide CPGs and other parties access to our properties, namely the Shopmium app, to deliver cash back rebates to consumers and market advertisers' brands media and product placements.
In 2022, we launched Shopmium, our formerly solely EU-focused app, in the U.S. market. Shopmium is our premium DTC brand that provides a rich set of features and capabilities to our partner network and drives consumer engagement and savings. Shopmium is replacing Coupons.com as our DTC product in the U.S.
During 2022, we entered an agreement with CupoNation GmbH to sell the domain Coupons.com. Prior to 2022, Coupons.com was our flagship consumer brand with both mobile app and website properties that delivered savings to consumers. The transfer of the Coupons.com domain to CupoNation GmbH is planned to conclude in 2023.
Retail Ad Network
Our Retail Ad Network aims to address the previously discussed challenges facing brands and retailers due to the increasing fragmentation of the retail media ecosystem. The Retail Ad Network solution is designed to aggregate individual in-housed retail media networks to enable the planning, buying, execution and measurement of scaled yet targeted media campaigns, through one centralized platform. The platform-based solution aims to provide brands with a way to support multiple national and regional retailers with advertising without having to resource and navigate the individual networks of each retailer.
We believe that as more retailers join the Retail Ad Network, the scale amassed by multiple retailers within the network will attract commensurate ad investment from brands, thus giving retailers of all sizes and classes of trade the opportunity to access a larger share of ad dollars.
The Retail Ad Network is in its early stages, with several brands and retailers participating in our initial launch in late 2022. In 2023, we plan to continue to develop and scale the Retail Ad Network through adding new retailers and new channels.
Digital-out-of-Home (DOOH)
Our digital-out-of-home (DOOH) offering features proprietary location-based technology that allows marketing agencies and advertisers to target specific consumer segments, reach shoppers in and out of stores through digital screens located outside of the home—in places such as retail establishments and transportation hubs—and measure the direct impact on sales. Quotient's self-service platform is designed to address the unique challenges of the DOOH market.
We provide proprietary data and analytics capabilities as part of our offerings across all product families through our measurement platform, Quotient Analytics. This provides campaign analytics and measured sales results to brands and retailers, attributing digital promotions and/or media campaigns to in-store and online purchases. Through Quotient Analytics, we combine purchase data from select retailers across our network with online engagement and purchase-intent data from Quotient’s consumer properties and its publishing partners. Our campaign measurement tools are also designed to provide brands and retailers with flexibility to optimize their campaigns to drive greater efficiency with marketing dollars. This capability and analysis is provided to customers who utilize our promotions and/or media platforms. Our campaign measurement tools provide the basis for our calculations to CPGs regarding their Return-on-Ad-Spend and Return-on-Promotion-Spend. As our platforms, network impact and audience numbers expand, we believe that the value of our data and analytics increases.
Growth Strategy
We believe that we have made substantial progress in shifting our business model from a managed services company and outsourced agency for retailers to a higher-margin, platform-based solution for our network partners, which in our view sets us up for growth in the rapidly evolving programmatic marketplace. Broadly speaking, there are two thematic pillars of our growth strategy: (i) expanding our promotions network, and (ii) investing in strategic growth initiatives built around key areas of our existing platform.
Expanding our Promotions Network. The first part of our strategy is to expand our promotions business, which we believe will drive organic growth. We intend to do this through driving net new category expansion and new content, through further penetration within our existing CPG customer accounts, which represent some of the largest CPG manufacturers in the U.S., and through working with more small and mid-tier sized brands. We also plan to continue to grow the reach and engagement of our network through securing new and growing existing network partners, which includes both retailer partners and publisher partners.
Additionally, we plan to continue to invest in product innovation designed to increase engagement from consumers, simplify promotions planning and execution for brands, and provide better alignment of brand campaigns with retailer merchant strategies and calendars. This, we believe, will evolve the role of promotions in the marketing strategies of brands and retailers.
Investing in strategic growth initiatives. The second part of our growth strategy is to invest in strategic growth initiatives built around a number of assets within our existing platform, where we believe we have differentiators and see the potential for future market growth. These assets include the Shopmium app, our DOOH platform, and our Retail Ad Network solution.
Starting with Shopmium, we believe that this DTC product is an important extension of our promotions business as it provides incremental reach for our network and allows Quotient to establish a direct relationship with shoppers and their first-party shopper data.
Our next strategic growth initiative is DOOH where, according the 2022 "US Digital Out-of-Home Ad Spending" report by eMarketer, the market is expected to grow at 12% through 2026. We see an opportunity to scale our DOOH business through the continued penetration of brands and marketing agencies. In addition, we believe there exists an opportunity to work with retailers as a DOOH technology partner, enabling the retailer to "white label" and offer our platform as part of their retail media businesses. We believe this is an interesting proposition to retailers, as our DOOH location-based demand side platform enables access to DOOH ad inventory at a point of high intent nearby the store for both retailers and their brand partners looking to expand their consumer reach.
We believe our Retail Ad Network, another of our strategic growth initiatives, presents a unique solution to combine media campaigns with promotions and deliver a call-to-action to drive sales, while centralizing and simplifying campaign ad planning and execution across multiple retailers. We have seen positive reception both from brands facing challenges presented by the fragmented landscape of ad networks, and from retailers looking to compete with the scale of the largest networks. In 2023 we plan to scale the network further through adding further retailer partners and channels to the network.
We believe that through executing on one or more of these strategic growth strategies, we will be able to grow content, consumer engagement and, ultimately, revenue in 2023.
Fraud Prevention and Distribution Controls
Our platforms include a proprietary digital distribution management system designed to enable CPGs and retailers to securely control the number of coupons distributed by device. We have controls in place to limit the number of digital coupons that can be printed. Similar controls are in place for linking coupons to loyalty cards and other paperless solutions, which allows us to limit the number of coupons distributed and activated. In addition, each printed coupon carries a unique identifier (ID) that is encrypted, enabling us to trace each coupon from print to redemption. All of our digital print coupons can be authenticated and validated using this unique code. This unique identifier ("ID") also can be used to detect counterfeit or altered coupons. Our platforms allow us to systematically identify and respond to fraudulent and prohibited activities by restricting a device from printing coupons. We also have a proprietary rebate distribution solution with built-in authentication capabilities through phone and payment verification. Additionally, we have transactional level controls for rebates to enforce stacking rules and prevent receipt alteration and/or manipulation.
Sales and Marketing
We have a team of dedicated, skilled specialists focused on CPGs and retailers. We believe that our sales, integration, digital promotions and media campaign management and measurement capabilities, as well as our customer success and support capabilities, are difficult to replicate and are a key reason for the growth of our business. Our sales activity is focused on expanding the number of brands and marketing agencies we work with within existing and new CPG customers, including a focus on smaller CPGs and new categories. The team is also focused on expanding relationships within CPGs to new buyers such as shopper marketing and digital media teams, where we believe there is a large opportunity for growth. Additionally, we are focused on continuing to increase the size and breadth of our partner networks through growing existing partnerships and adding new partnerships with retailers and publishers.
In addition to sales support during the campaign planning process, our sales representatives provide additional support to CPGs and retailers with the aim of ensuring that their campaigns are launched and delivered within specified time frames. Representatives assigned to specific customers review performance metrics and share feedback with the advertiser.
We are focused on managing our brand, increasing market awareness and generating new revenue pipelines from both CPGs and retailers. We often present at industry conferences, create custom events and invest in public relations. In addition, our marketing team runs targeted digital marketing programs, develops data-led collateral and customer case studies, sponsors and conducts research, and delivers engaging content through social media channels.
Technology and Infrastructure
Since inception and primarily during 2022, we have made significant investments and have been focused on the development of new features and functionality of our technology. We plan to continue to invest in developing our differentiated and proprietary platforms aimed at solving the problems of CPGs and retailers in ways that traditional solutions cannot. We are focused on solutions that provide measurable results. We have assembled a team of highly skilled engineers and data scientists with deep expertise across a broad range of relevant disciplines. Key focus areas of our engineering team include:
•Scalable infrastructure. We use a combination of proprietary and open-source software in seeking to achieve a horizontally scalable, global, distributed and fault-tolerant architecture, with the goal of enabling us to ensure the continuity of our business regardless of local disruptions. Our computational infrastructure currently processes millions of events per day and is designed in a way that enables us to add significant capacity to our platforms. We use a combination of public and private cloud computing platforms. Our private cloud technology infrastructure is hosted across data centers in co-location facilities situated in California and Virginia.
•Redundancy. Our critical production infrastructure utilizes a hot failover configuration which allows us to switch server loads, be it a single server or an entire data center, to another data center within minutes. Data is continuously replicated between sites, and multiple copies at each site are designed to provide fast recovery whenever recovery is requested. Each single data center has been designed to handle an activity level in excess of our entire system needs, the goal of which is to enable us to perform platform maintenance, business resumption and disaster recovery without any customer impact.
•Reporting. Our user interface provides flexible reporting and interactive visualization of the key drivers of success for each campaign. We use these reporting and visualization products internally to manage campaigns and provide campaign insights.
•AdTech. Our media delivery is largely powered by proprietary ad servers, creative and social platforms, workflow automation tools, and data management tools. We develop and use these platforms with a range of differentiated features that are specialized for the CPG and retail industries.
•Security. Our security policy adheres to established policies that are designed to ensure that all data, code, and production infrastructure are secure and protected. Our data centers are SSAE 16 Type II certified. We use our internal team and third parties to test, audit, and review our entire production environment to protect it.
Competition
We compete against a variety of companies with respect to different aspects of our business.
Promotions:
•Direct-to-Consumer apps such as iBotta, Inc. and Fetch Rewards, which offer cash back rebate and rewards solutions;
•Other providers of digital promotions such as Valassis Communications, Inc., Catalina Marketing Corporation’s Cellfire; Inmar/You Technology; and Neptune Retail Solutions;
•Offline coupon and discount services, as well as newspapers, magazines and other traditional media companies that provide coupon promotions and discounts on products and services in FSIs or other forms, including Valassis Communications, Inc., Neptune Retail Solutions and Catalina Marketing Corporation;
Media:
•Retailers who develop and manage, with or without a third-party vendor, retail media or data products in-house, such as the Albertsons Media Collective, or The Kroger Company ("Kroger") with its wholly owned subsidiary of 84.51°; and
•Companies offering digital advertising technology, inventory, data, and services solutions and channels for advertisers and retailers including: Meta Platforms, Inc. (doing business as Facebook), Alphabet, Inc. ("Alphabet"), Pinterest, Inc., Amazon.com, Inc. ("Amazon"), Adobe Inc., The Trade Desk, Inc., Oracle Corporation, Criteo S.A., Microsoft Corporation, Publicis Groupe's CitrusAd and others.
In certain instances, we have entered into, and in the future we may enter into, strategic alliances or partnerships with companies that are competitors in other areas of our business. We believe the principal factors that generally determine a company’s competitive advantage in our market include the following:
•scale and effectiveness of reach in connecting advertisers and retailers to consumers in a digital manner;
•scale and reach of a company's retailer and publisher network;
•scale and reach of a company's targetable audience data;
•ability to attract consumers, retailers and CPGs to a company's platform and solutions;
•breadth, quality and relevance of a company's solutions and ability to innovate;
•platform security, usability, scalability, reliability and availability;
•integration with retailer applications, POS systems, and consumer channels;
•access to and quality of consumer data, including transaction data;
•ability to measure, and measurement that demonstrates the effectiveness of campaigns;
•quality of tools, reporting and analytics for planning, development and optimization of digital marketing campaigns;
•integration of products and solutions;
•ability to rapidly deploy products and services for customers;
•ability to deliver high quality and increasing numbers of digital promotions that are widely available and easy to use in consumers’ preferred form;
•brand recognition and reputation; and
•ability to recruit, retain, and train employees.
While we believe we compete effectively with respect to the factors identified above, we may face increasing competition from larger, more-established and greater-resourced companies that seek to enter our market, or from smaller companies that launch new products, solutions and services that could gain market acceptance.
Human Capital Resources
Our plan for long-term business success is driven by technological innovation, superior customer service, and operational excellence. We operate under a single purpose: transforming shopping to make life better for consumers, brands, retailers and our employees. Attracting, developing and retaining top talent are critical to our long-term business goals and to fulfilling our Company purpose. We know that investing in our people is just as important as investing in our products.
After nearly two years of working remotely, we reopened our offices in early 2022 and began operating in a hybrid environment. To enhance employee productivity and drive collaboration, we encouraged employees back to the office and recommenced company travel for in-person interaction. In the U.S., a vaccination policy was in effect for most of the year as an added precaution for employee health and safety as concerns about COVID-19 persisted.
As office utilization changed in a post-COVID environment, the Company re-evaluated its real estate footprint, opting to exit offices in San Francisco and Nashville, and deciding not to proceed with a new office in Santa Clara. Flexible alternatives to traditional (leased) office space are being considered as part of our ongoing real estate strategy.
As our business model continued to evolve, it was necessary to take actions to right size the Company to be more in line with a leading promotions and media technology company. In the second half of 2022, we took actions to reduce our workforce. Employees impacted were provided a transition period and a comprehensive severance package.
As of December 31, 2022, we had 880 full-time employees, consisting of 466 employees in the United States and 414 employees internationally. Voluntary workforce turnover was 32% in 2022. As of December 31, 2022, our global workforce was 48% female, and nearly 41% of our employees holding a "manager or above" title were women. As of such date, women represented 40% of our senior leadership team.
We strive to create an environment that welcomes and supports diversity and promotes equity and inclusion across all levels of the Company. In 2022, we continued our ongoing partnership with an external learning platform focused on diversity, equity & inclusion (DEI awareness) and education, reaching nearly 900 employees globally. We believe that this platform has built greater awareness, maximized employee connections, and elevated decision-making in the workplace.
We believe that investing in our employees' development is pivotal to ensuring sustainable performance success as a high-growth global technology company. We are committed to providing training and development that supports employees in their current roles and beyond. Through our current Learning Management System, employees can choose learning that appeals to them with over 16,000 content and expert-led courses. In addition, we created content and required compliance training, all of which can be easily accessed on the platform. Employees completed over 2,000 hours of learning in 2022.
Our talent and performance process aligns performance to reward and provides actionable feedback to employees. Twice a year, leaders commit to a comprehensive organization and talent review, covering key elements such as organization structure, employee performance and potential, succession planning and employee development.
We have a long-standing culture of helping local communities and neighbors through our philanthropic program. "Quotient for Change" is committed to providing communities with tangible outcomes through our three key pillars: Economic Stability, Technological Equity and Environmental Sustainability. We also maintain our matching gift program, which offers full-time employees a monetary match on their charitable donations. We donated over $0.1 million during the year ended December 31, 2022, supporting nearly 400 charities globally, and logged over 1,500 volunteer hours.
Intellectual Property
We protect our intellectual property by relying on federal, state, and common law rights in the United States and equivalent rights in other jurisdictions, as well as contractual restrictions. We control access to our proprietary technology and algorithms by entering into confidentiality and invention assignment agreements with our employees and contractors, and confidentiality agreements with third parties.
In addition to these contractual arrangements, we also rely on a combination of trade secrets, patents, copyrights, trademarks, service marks and domain names to protect our intellectual property. We pursue the registration of our copyrights, trademarks, service marks and domain names in the United States and in certain locations outside the United States. As of December 31, 2022, we hold or have exclusive rights to 52 active issued patents in the United States and 36 active patents that have been issued outside of the United States with terms expiring between 2024 and 2040.
Circumstances outside our control could pose a threat to our intellectual property rights. For example, effective intellectual property protection may not be available in the United States or in other countries in which we operate. Also, the efforts we have taken to protect our proprietary rights may not be sufficient or effective, or may require significant expenditures and other resources to enforce. Any significant impairment of our intellectual property rights or unauthorized disclosure or use of our intellectual property could harm our business and our operating results, or our ability to compete.
Companies in Internet-related and other industries may own large numbers of patents, copyrights and trademarks, and may frequently request license agreements, threaten litigation or file suit against us based on allegations of infringement or other violations of intellectual property rights. We have been subject to in the past, and we expect that we may face in the future, allegations that we have infringed the trademarks, copyrights, patents and other intellectual property rights of third parties, including our competitors and non-practicing entities. As we face increasing competition and as our business grows, we will likely face more claims of infringement.
Corporate Information
We changed our name to Quotient Technology Inc. on October 20, 2015. Our corporate website address is www.quotient.com. Information contained on, or that can be accessed through, our website does not constitute part of this report and inclusions of our website address in this report are inactive textual references only. Quotient, the Quotient logo, the Coupons.com logo, the SavingStar logo, Elevaate, Shopmium, the Shopmium logo, Ahalogy, and Ubimo are trademarks or registered trademarks of Quotient Technology Inc. and its subsidiaries in the United States and other countries. During 2022, we entered an agreement to sell the domain Coupons.com to CupoNation GmbH, with the transfer of the Coupons.com domain, along with the associated logo, to CupoNation GmbH being planned to conclude in 2023. Other marks are property of their respective owners.
Available Information
We file annual, quarterly and other reports, proxy statements and other information with the Securities and Exchange Commission (SEC) under the Exchange Act. We also make available, free of charge on the investor relations portion of our website at investors.quotient.com, our annual report on Form 10-K, quarterly reports on Form 10-Q, current reports on Form 8-K, and amendments to those reports filed or furnished pursuant to Section 13(a) or 15(d) of the Exchange Act, each as soon as reasonably practicable after filed electronically with the SEC. The SEC also maintains an Internet website at http://www.sec.gov/ where you can obtain most of our SEC filings. You can also obtain paper copies of these reports, without charge, by contacting Investor Relations at (650) 605-4600 (option 7).
Webcasts of our earnings calls and certain events we participate in or host with members of the investment community are available on our investor relations website at http://investors.quotient.com/. Additionally, we
announce investor information—including news and commentary about our business and financial performance, SEC filings, notices of investor events, and our press and earnings releases—on our investor relations website, as well as through press releases, SEC filings, public conference calls, our corporate blog and social media in order to achieve broad, non-exclusionary distribution of information to the public. We encourage our investors and others to review the information that we make public in these locations, as such information could be deemed to be material information. Please note that this list may be updated from time to time. Investors and others can receive notifications of new information posted on our investor relations website in real time by signing up for email alerts. Further corporate governance information, including our corporate governance guidelines, board committee charters, corporate social responsibility report, and code of conduct, is also available on our investor relations website under the heading “Governance.” The contents of our websites, blog, press releases, public conference calls and social media are not incorporated by reference into this Annual Report on Form 10-K or in any other report or document we file with the SEC (and the contents of other SEC filings are not incorporated by reference into this Annual Report on Form 10-K or any other report or document we file with the SEC except as required by law or to the extent we expressly incorporate such SEC filing into this Annual Form 10-K or other report or document we file with the SEC). Any references to our websites are intended to be inactive textual references only.
Item 1A. Risk Factors.
Our operations and financial results are subject to various risks and uncertainties, including those described below, which could adversely affect our business, results of operations, cash flows, financial conditions, and the trading price of our common stock. The risks described below are not the only risk facing us. Risks and uncertainties not currently known to us or that we currently deem to be immaterial also may materially affect our business, financial condition, results of operations and prospects.
Risks Related to Our Business
We have incurred net losses since inception and we may not be able to generate sufficient revenues to achieve or subsequently maintain profitability.
We have incurred net losses of $76.5 million, $45.6 million and $65.4 million in 2022, 2021 and 2020 respectively. We have an accumulated deficit of $533.7 million as of December 31, 2022. We anticipate that our costs and expenses will increase in the foreseeable future as we continue to invest in:
•retailer partnerships;
•network growth;
•sales and marketing;
•research and development, including new product development;
•our technology infrastructure, business processes, and automation;
•general administration, including legal and accounting expenses related to our growth and continued expenses;
•expanding into new markets and verticals; and
•strategic opportunities and commercial relationships.
For example, we have incurred and expect to continue to incur expenses in developing and retaining retailer partnerships and developing self-service capabilities and automation. We also plan to incur expenses relating to our strategic growth initiatives that are designed to drive growth. We may not succeed in increasing our revenues sufficiently to offset these expenses.
If we are unable to execute our growth strategy and gain efficiencies in our operating costs, our business could be adversely impacted. We cannot be certain that we will be able to attain or maintain profitability on a quarterly or annual basis. If we are unable to effectively manage these risks and difficulties as we encounter them, our business, financial condition and results of operations may suffer.
We may not achieve revenue growth, or may encounter unplanned fluctuations in our revenue, due to external factors such as global macroeconomic risk of slowdown or recession, which could negatively impact the spending of consumers, CPGs, and retailers and thus negatively impact our business.
Our business has been and may continue to be affected by a number of factors that are beyond our control, such as general geopolitical, economic and business conditions; conditions in the financial markets; and changes in the overall demand for, or supply of, CPG products. A severe and/or prolonged economic downturn could adversely affect our customers' financial condition and reduce their levels of marketing spend on our platform.
Similarly, weakness in, and uncertainty about, global economic conditions may cause advertisers and retailers to postpone marketing initiatives in response to tighter credit, negative financials news and/or declines in income or asset values. If inflation were to persist or increase, advertisers and retailers could face higher manufacturing, supply chain or related input costs associated with the goods they produce and offer for sale, which could make them less apt to spend on advertising. These macroeconomic factors may result in lower expected advertising spend on our solutions and negatively impact our business.
Some forecasters are anticipating a year-over-year reduction in global media spending for fiscal 2023. Advertising spend is one of the most flexible and easiest to cut and advertisers can change their spending without notice, which can result in our inability to anticipate such fluctuations. For example unspent budgets at the end of a CPG's fiscal year, or budget pressures including those related to inflation and continuing supply chain issues, may lead to, respectively, unexpected increased or reduced spending on our platforms. And, while promotions spend has historically increased in times of an economic downturn—which many forecasters are predicting will materialize in the near future—we nevertheless have seen certain advertisers reduce promotions spending where, due to ancillary macro-economic maladies such as supply-constraint-caused product shortages on shelves, consumers have continued to purchase products. The net impact of these factors may have an adverse impact on our business, revenues, and ability to achieve our financial targets.
We may not achieve revenue growth, or may encounter unplanned fluctuations in our revenue, due to our business and pricing model changes, or as a result of other strategic initiatives we may choose to pursue, which could negatively affect our business.
We have been transforming our business model from primarily managed services to more self-service and automated solutions through our platforms. We also implemented transitions in our promotions pricing, from a cost-per-acquisition model to a duration-based model, and we may continue to implement different pricing models in the future.
Business and pricing model changes such as these carry operational risks, and our expectations regarding the execution, success, timing, and impact of these changes may not be met. For example, an operational risk relating to our shift to self-service and automated solutions is that these offerings may not be preferred by advertisers and retailers to alternative offerings from our competitors.
There are also financial risks, such as our ability to establish metrics and forecast performance targets associated with these business model changes. We may not, accordingly, realize financial targets based on the business model changes, and as a result our results of operations could be negatively impacted. For example, as a result of our shift away from a lower-margin, labor-intensive managed services business and towards more self-service and platform-based solutions, and the application of the accounting rules relating to such changes, we are recognizing certain media revenue on a net basis as compared to the prior recognition on a gross basis.
Decisions by advertisers or retailers to delay or reduce their digital marketing on our platforms or choose a solution from one of our competitors; changes in our fee arrangements with CPGs, retailers and other commercial partners; or changes in or termination of a partnership with a retailer, such as the termination during 2022 of our relationship with Albertsons Companies (Albertsons) and the in-housing of retail media, could also slow our revenue growth or reduce our revenues.
More generally, we believe that our continued revenue growth will depend on our ability to:
•successfully execute on our shift away from a lower-margin, labor-intensive services business and towards more self-service and platform-based solutions;
•increase our share of advertiser spend on promotions and media through our platforms, increase the number of brands that are using our platforms within each advertiser or CPG, and expand our advertiser or CPG base;
•expand the number, variety, quality, and relevance of promotions available on our platforms and through our network;
•scale our national promotions network;
•successfully execute and expand our promotions solutions in national promotions, targeted promotions, national rebates, and loyalty rewards programs;
•expand the use by consumers of our media and promotions offerings;
•successfully execute and expand our digital media solutions in retail media, social influencer marketing, sponsored product search, DOOH, and programmatic media;
•successfully evolve our retail media business in light of industry trends, including the in-housing of retail media and how CPGs leverage retail media solutions;
•maintain and grow retailers in our network, increase the number of publisher partners in our network, and expand our network with new verticals;
•maintain and expand our data rights with our retailer network;
•successfully grow and scale our DTC offering, Shopmium;
•innovate our consumer solutions and experiences to retain and grow our customer base;
•maintain and grow the size of our targetable audience;
•demonstrate the value of our platforms through trusted measurement metrics;
•deploy, execute, and continue to develop our analytics capabilities;
•succeed with recently-implemented changes in pricing models, such as our shift to time-based (e.g., duration-based) promotions pricing or any future variations of our pricing models that we may opt to implement;
•adapt to changes in marketing goals, strategies and budgets of advertisers and retailers, and the timing of their marketing spend;
•capitalize on the shift from offline to digital marketing and growth in e-commerce;
•respond to changes in the legislative or regulatory environment, including with respect to privacy and data protection, or enforcement by government regulators, including fines, orders, or consent decrees;
•successfully integrate our acquired companies into our business;
•increase the awareness of our brands, and earn and build our reputation;
•hire, integrate, train and retain talented personnel;
•effectively manage scaling and international expansion of our operations; and
•successfully compete with existing and new competitors.
However, we cannot provide assurance that we will successfully accomplish any of these actions. Failure to do so could negatively impact our business. Our business is complex and evolving. We may offer new capabilities, service models, process and delivery methods to advertisers and retailers. These new capabilities may change the way we generate and/or recognize revenue, which likewise could introduce variability to our revenue performance, or if such initiatives are unsuccessful, could cause our revenue to decline.
Our revenue and business will be negatively affected if we fail to retain and expand our relationships with retailers, if we fail to obtain commitment and support for our platforms from retailers, and if we do not successfully renegotiate or amend retailer agreements.
The success and scale of our platforms depend on our strategic relationships with retailers. The success and scale of our platforms also depends on the level of commitment and support for our platforms from retailers. For example, retailers are increasingly interested in bringing retail media and shopper programs in house. If we are unable to adapt to this evolution of retail media and maintain and grow retailer support for our platforms and solutions, such as our retail ad network, our business and revenue will be adversely impacted.
Renewals or amendments of existing retailer relationships may become more challenging for us in light of our business model and pricing changes and the evolution of retail media. These changes require restructuring our agreements and the way we operate with retailers and revenue arrangements for certain services. There is no assurance that retailers will agree to such changes, or that renewals or amendments will occur at all or on terms as favorable as the pre-renewal or pre-amendment terms. Should any such circumstance occur, our business could be adversely affected. More generally, if we do not expand these relationships, if we lose significant retailers, or if we do not add new retailers to our platforms, our business will be negatively affected.
For instance, our revenue and growth may be adversely impacted if retailers do not support our platforms. The success of our platforms requires integration with a retailer’s POS, loyalty programs and consumer channels. Certain platform capabilities may require integration with other retailer systems as well. This integration requires time and effort from the retailer, and may require us to work with a retailer’s third-party service providers, some of whom may be our competitors. In addition, the success of our platforms requires consumer and advertiser adoption which requires significant marketing and other support from retailers, including retailer programs that drive more advertiser spend on our platforms. If retailers do not provide sufficient or timely resources and support, platform launches could be delayed and consumer and/or advertiser adoption could be slow or minimal, which would negatively impact our revenue, costs of revenue, and recoverability of certain assets. As an example, our revenue was negatively affected in the first half of 2020 when retailers mostly paused or delayed, and in some cases cancelled, marketing campaigns on our platforms in response to supply-chain challenges and out-of-stock product at shelf, consumer purchasing behavior changes, and other issues resulting from the COVID-19 pandemic.
The success of our platforms also depends in part on our use of consumer sales data provided by retailers, our access to retailer consumer channels, the size and quality of retailer audiences, and the national scale and reach of our retailer network. If we fail to secure, or are found to be in violation of the terms of, such data, access and scale, we could lose access to retailer data and audience, and our network and platforms would be less valuable to advertisers and other business partners.
In addition, we depend on retailers to comply with laws, regulations and industry standards relating to privacy and the use of consumer data. If we and our retail partners cannot timely respond to legal, regulatory and industry changes, or if retailers decide to limit or prohibit use of their data to comply with such changes, our revenue and growth would be impaired. For instance, if in response to changes in state privacy laws such as the California Consumer Privacy Act of 2018 and the amendments thereto under the California Privacy Rights Act, ("the CPRA") (collectively, the "CCPA"), business partners contractually prohibit the "sale" (as defined in the CCPA) or "sharing" (as defined in the CPRA) of loyalty program data, or if retailers otherwise materially restrict our use of sales and loyalty card data in light of the CCPA, the Virginia Consumer Data Protection Act, or similar laws or regulations, our business will be negatively affected. See the risk factor below titled “Our business is subject to complex and evolving laws, regulations and industry standards, and unfavorable interpretations of, or changes in, or failure by us to comply with these laws, regulations and industry standards could substantially harm our business and results of operations” for additional information.
Our sales cycle with retailers tends to be long. We may make investments and incur significant expenses before an agreement or renewal with a retailer is reached, if at all, and before we are able to generate any revenue from such agreement or renewal. There are no guarantees that we will be able to recoup such investments and expenses, which would have an adverse effect on our business, financial condition and results of operations.
Our revenue and business will be negatively affected if we fail to develop, increase the number of and expand relationships with network partners that contribute to the growth of audiences engaging on our platforms.
The success and scale of our platforms also depends on growing our network of retailer and publisher partners. These network partners are a significant factor in our effort to increase audience and volume on our platforms and thereby enable our network to deliver the scale and reach that advertisers, and the advertising agencies that sometimes act on their behalf, are seeking. These partners can also be important in connection with the launch and marketing of new offerings, such as our self-service and automated solutions. If we are unable to grow our network or our network partners do not increase our aggregate audience reach and drive volume on our platforms, our revenue and business may be negatively impacted.
The loss of or decrease in spending by any significant customer, or the loss or decrease in support from any significant partner, could materially and adversely affect our revenues, results of operations and financial condition.
Our business is exposed to risks related to customer concentration, particularly among advertisers, and partner concentration, particularly among retailers. The loss of or decrease in spending by any of our significant customers, or the loss of or decrease in support from any of our significant partners, or a deterioration or change in our relationships with any of them, could materially and adversely affect our revenues, results of operations and financial condition. As an example, the loss of a retailer, or retailer support, such as the termination of our partnership with Albertsons or retailers taking retail media in-house, negatively impacts the amount that advertisers spend on our platforms.
If the distribution, revenue sharing or other fees that we pay increase, or if we are unable to meet contractual minimums under guaranteed distribution fee arrangements, our gross profit and business will be negatively affected.
We generally pay a distribution fee to retailer and publisher partners in our network when we deliver media and promotions on their digital properties or through their loyalty programs. We also pay fees to retailers for use of their data to power our platforms. Such fees have increased as a percentage of our revenue in recent periods. As we renew agreements or enter into new ones, we may face pressure to pay higher distribution fees. If such fees continue to increase, our cost of revenue could increase and our operating results would be adversely affected. In addition, calculations of such fees are complex, and if network partners disagree with our calculations in an audit, the result of such disagreement could have an adverse impact on our business.
In addition, some of our agreements with retailers include certain upfront fees/payments or guaranteed distribution fees, which, in some cases, may apply to multiple annual periods. If the adoption and usage of our platforms do not meet projections or minimums, these fees may not be recoverable and any shortfall, if applicable, may be payable by us at the end of the applicable period. We consider various factors in our assessment of whether these upfront or guaranteed distribution fees may not be recoverable, including our historical experience with the transaction volumes through the retailer and comparative retailers, ongoing communications with the retailer to increase its marketing efforts to promote our digital platforms, as well as the projected revenue, and associated revenue share payments.
Our gross margins are dependent on many factors, some of which are not directly controlled by us.
The factors potentially affecting our gross margins include:
•impacts of changes in our business model including pricing model changes and the degree and timing of advertiser and retailer response to such changes, and also increasing the proportion of self-service and automated offerings;
•business model or solution delivery changes, with respect to a portion of our offerings, that result in revenue being recognized on a net, as opposed to a gross, basis;
•our product mix, since we have significant variations in our gross margin among products and, accordingly, any substantial change in product mix could change our aggregate gross margin;
•growth and expansion of our lower-margin media products, including programmatic ads delivered through third-party ad-tech partners and publishers;
•our efforts to add higher-margin solutions to our suite of offerings;
•our ability to meet contractual minimums under guaranteed distribution fee arrangements;
•increasing costs of maintaining, expanding and adding retailer and other network partner relationships;
•increasing data acquisition and media acquisition costs;
•evolving fee arrangements with advertisers, as well as with retailer and other network partners, which might have an impact on our gross margins;
•success of our pricing strategies, including not only current duration-based pricing strategies but also future variations of our pricing models that we may choose to implement;
•our decision to exit higher margin non-strategic products or business lines;
•success of our investments in technology and automation, or through acquisitions to gain cost efficiencies;
•increasing pricing pressures from competitors, advertisers and agencies representing advertisers; and
•success of higher-margin new products.
We have seen pressure on our gross margins, which we principally attribute to the factors described above, and we expect this pressure to continue while our growth strategy evolves and our product mix continues to change. For instance, we face margin pressure arising from increased media and data acquisition costs due, in part, to reduced inventory and increased consumer ability to opt out of permitting their personal information to be used for marketing purposes. See Risk Factor below entitled "If the use of mobile device identifiers, third-party cookies or other tracking technology is rejected by consumers, restricted by third parties outside of our control, or otherwise subject to unfavorable regulation, the benefits of our offerings and solutions could diminish, our data and media acquisition costs could increase and we could lose customers and revenue". Although we expect to gain leverage as our business expands, our platforms transition to self-service, and through automation, there is no guarantee that we will succeed.
We expect a number of factors to cause our operating results to fluctuate on a quarterly and annual basis, which may make it difficult to predict our future performance.
Growth forecasts are subject to significant uncertainty and are based on assumptions and estimates that may not prove to be accurate. Historically, our revenue growth has varied from quarter-to-quarter and year-to-year, and we expect that variability to continue. In addition, our operating costs and expenses have fluctuated in the past, and we anticipate that our costs and expenses will increase over time as we continue to invest in growing our business. Our operating results could vary significantly from quarter-to-quarter and year-to-year as a result of these and other factors, many of which are outside of our control, and as a result we have a limited ability to forecast the amount of future revenue and expenses, which may adversely affect our ability to predict financial results accurately. Our ability to forecast our future results of operations is subject to a number of uncertainties, including our ability to effectively plan for and model future growth, and especially uncertainty relating to our business and pricing model changes. We have encountered in the past, and may encounter in the future, risks and uncertainties frequently experienced by growing companies in changing industries. Our results of operations may fall below our estimates or the expectations of public market analysts and investors. Fluctuations in our quarterly operating results may lead analysts to change their long-term models for valuing our common stock, cause us to face short-term liquidity issues, impact our ability to retain or attract key personnel or cause other unanticipated issues, all of which could cause our stock price to decline. As a result of the potential variations in our quarterly revenue and operating results, we believe that quarter-to-quarter comparisons of our revenues and operating results may not be meaningful, and the results of any one quarter or historical patterns should not be considered indicative of our future sales activity, expenditure levels or performance.
In addition to other factors discussed in this section, factors that may contribute to the variability of our quarterly and annual results include:
•impacts of changes in our business model, including pricing model changes, and the degree of advertiser and retailer response to this transition, and increasing the proportion of self-service and automated offerings;
•business model changes that result in differences in accounting treatment, including whether revenue is recognized on a net or gross basis;
•a reduction in overall advertising spend by advertisers in reaction to rising inflation, continuing supply chain disruption and economic uncertainty, particularly in verticals that comprise a significant portion of our revenue such as the food category;
•our ability to adapt to changes in marketing goals, strategies and budgets of advertisers and retailers, and the timing of their marketing spend;
•our ability to maintain and grow the retailer component of our network, expand our network with new verticals, and increase our number of network partners and publishers;
•our ability to maintain and expand our data rights with our retailer network;
•our ability to leverage retailer demands to increase CPG spend on retailer performance media;
•adapt to industry changes in, and the evolution of, retail media networks as well as how CPGs leverage such networks;
•the impact of competitors or competitive products and services, and our ability to compete in digital marketing;
•the impact of pricing pressures from our competitors, advertisers or CPGs, and agencies representing advertisers or CPGs;
•the impact of increasing media acquisition and data acquisition costs;
•the impact of litigation involving us, our industry or both, including investigations by regulators or claims made by our competitors or other third parties;
•reduction in demand or volatility in demand for one or more of our products, which may be caused by, among other things: delay or cancellation of marketing campaigns by advertisers and retailers as they focus on manufacturing in-demand products, replenishing out-of-stock items, adjusting to changes in consumer purchasing behavior, and contending with supply-chain challenges;
•our ability to grow existing consumer usage of, and attract new consumers to, our digital promotion offerings and more generally to interactions with our platforms, including through our retailer partner sites and our publisher network;
•our ability to obtain and increase the number of high quality promotions;
•changes in consumer behavior with respect to digital promotions and media, how consumers access digital promotions and media, and our ability to develop applications that are widely accepted and generate revenues for advertisers, retailers and us;
•our ability to control costs including the costs of obtaining consumer data, and of investing, maintaining and enhancing our technology infrastructure;
•increased legal and compliance costs associated with data protection laws and regulations in various jurisdictions, including state privacy laws like the CCPA, which went into effect on January 1, 2020, and its amendments under the CPRA which went into effect on January 1, 2023; the Virginia Consumer Data Protection Act, which also went into effect on January 1, 2023; and new state laws in Colorado and Connecticut, which will go into effect in July 2023, and in Utah, which go into effect in December 2023; the invalidation of the EU-U.S. Privacy Shield framework and Swiss-U.S. Privacy Shield Framework in July 2020 and September 2020, respectively; and new follow-on compliance obligations;
•the costs of developing new products, solutions and enhancements to our platforms;
•whether new products successfully launch on time;
•our ability to manage our growth, including scaling our platforms;
•our ability to manage innovation, including extent of investments in and success in deploying new offerings, and our ability to manage transitions from legacy platforms and solutions to new platforms and solutions such as those with self-service and automation capabilities;
•the success of our sales and marketing efforts;
•the costs of successfully integrating acquired companies and employees into our operations;
•changes in the legislative or regulatory environment, including with respect to privacy and data protection, or enforcement by government regulators, including fines, orders, or consent decrees;
•our ability to deal effectively with fraudulent transactions or customer disputes;
•our ability to collect payment for services in a timely manner, as an economic downturn, supply chain challenges, and inflation may cause liquidity issues for some of our customers;
•the attraction and retention of qualified employees and key personnel, whether or not related to changes in U.S. immigration policies;
•the effectiveness of our internal controls; and
•changes in accounting rules, tax laws or interpretations thereof.
The effects of these factors individually or in combination, supply-chain issues, inflation-related impacts, our business and pricing model changes and the resulting accounting changes, could cause our quarterly and annual operating results to fluctuate, as well as affect our ability to forecast those results and our ability to achieve those forecasts. As a result, comparing our operating results on a period-to-period basis may not be meaningful. You should not rely on our past results as an indication of our future performance. This variability and unpredictability could also result in our failing to meet or exceeding the expectations of our investors or financial analysts for any period. In addition, we may release guidance in our quarterly earnings conference calls, quarterly earnings releases, investor day, or otherwise, based on predictions of our management, which are necessarily uncertain in nature. The guidance provided depends on our predictions relating to demand for our platforms, the rate and extent of market acceptance to our business and pricing model changes, maintaining and growing our retailer network and the cost of maintaining retailer partnerships, and the expansion of our network audience through publishing distribution and other partnerships, which predictions can fluctuate greatly and are beyond our control. Our guidance may vary materially from actual results. If our revenue or operating results, or the rate of growth of our revenue or operating results, fall below or above the expectations of our investors or financial analysts, or below or above any forecasts or guidance we may provide to the market, or if the forecasts we provide to the market are below or above the expectations of analysts or investors, the price of our common stock could decline or increase substantially. Such a stock price decline or increase could occur even when we have met our own or other publicly stated revenue or earnings forecasts. Failure to meet our publicly stated revenue or earnings forecasts, or even when we meet our own forecasts but fall short of analyst or investor expectations, could cause our stock price to decline and expose us to costly lawsuits, including securities class action suits. Such litigation against us could impose substantial costs and divert our management’s attention and resources. If we exceed our own or other publicly stated revenue or earnings forecasts, or even when we meet our own forecasts but exceed analyst or investor expectations, our stock price could increase.
If we are unable to successfully respond to changes in the digital promotions market, our business could be negatively affected.
As consumer demand for digital promotions has increased, promotion spending has shifted from traditional promotions through traditional offline or analog channels, such as newspapers and direct mail, to digital promotions. Although we expect advertisers to reduce and eventually stop spending on the offline, free standing insert ("FSI"), our expectations regarding the timing of such change or our expectations that advertisers will shift some of their FSI budgets to our platforms, or about the timing of such shifts, may not be accurate. It is also difficult to predict whether advertisers will decide to shift FSI budgets to other marketing channels if digital promotions lose favor with advertisers, retailers or consumers. In the event of these or any other changes to the market, our continued success will depend on our ability to successfully adjust our strategy to meet the changing market dynamics. We will need to continue to grow demand for our platforms by advertisers, retailers and consumers, including through continued innovation and implementation of new initiatives associated with digital promotions. If a retailer decides not to accept digital promotions, if advertisers reduce spend in digital promotions, or if advertisers choose our competitors’ products and services, our business could be negatively affected.
If the demand for digital promotions does not continue to grow as we expect, or if we fail to successfully address this demand, our business will be harmed. For example, the growth of our revenue and gross margins require increasing or maintaining the number of brands that are using our promotions platforms within each CPG. If our projections regarding the adoption and usage of our promotions platforms by retailers, advertisers (including CPGs) and consumers do not occur or are slower than expected, our business, financial condition, results of operations and prospects will be harmed. Even if we are successful in driving the adoption and usage of promotions platforms by retailers, advertisers and consumers, if our fee arrangements (including those resulting from pricing changes) or transaction volumes, or the mix and quality of offers, change or do not meet our projections, our revenues may be negatively affected. We expect that the market will evolve in ways which may be difficult to predict.
For example, if consumer demand for our national and shopper promotions or our DTC mobile application, Shopmium, does not grow as we expect or decreases, our business may be negatively affected. Also, the success of our having transitioned the pricing of promotions offerings from cost-per-acquisition to duration-based pricing depends on meeting forecasted campaign outcomes, and if we do not deliver the forecasted outcomes, advertisers may not respond to this pricing model transition to the degree we anticipate, and our business could be adversely impacted. More generally, if we are unable to grow or successfully respond to changes in digital promotions, our business could be negatively affected and our results of operations could be negatively impacted. Our revenues may also be negatively affected if we are unable to manage pricing model transitions.
If we fail to maintain and expand the use by consumers of digital promotions on our platforms, our revenues and business will be negatively affected.
We must continue to maintain and expand the use by consumers of digital promotions on our owned-and-operated sites, on retailer sites and on our publisher network in order to increase the attractiveness of our platforms to advertisers and retailers, and to increase revenues and achieve profitability. If consumers do not perceive that we offer a broad selection of relevant and high-quality digital promotions, or that the usage of digital promotions is easy and convenient through our platforms, we may not be able to attract or retain consumers. In addition, as consumer behavior in accessing digital promotions changes and new distribution channels emerge, if we do not successfully respond and do not develop products or solutions that are widely accepted, we may be unable to retain consumers or attract new consumers and as a result our business may suffer. One of our growth strategies is to increase the number of consumers using digital promotions on our platforms through growth and expansion of our publisher network. If we do not add new network partners or our partners do not experience increased consumer use of digital promotions on our platforms as expected, our revenues and business will be harmed. We also depend on our retail and other network partners to devote sufficient time, resources or funds to the promotion of our platforms and the marketing of our digital promotions to consumers. If we are unable to maintain and expand the use by consumers of digital promotions on our platforms and consumer properties, as well as the digital properties and channels of retailers and other publishers in our network, or if we do not do so to a greater extent than our competitors, advertisers may find that offering digital promotions on our platforms do not reach consumers with the scale and effectiveness that is compelling to them. Likewise, if retailers find that use of our platforms does not increase sales of the promoted products and consumer loyalty to the retailer to the extent they expect, the revenues we generate may not increase to the extent we expect, or may decrease. Any of these could harm our business. To the extent consumers do and do not find our products compelling given changed consumer buying behavior, our business could be harmed.
Competition presents an ongoing threat to the success of our business.
We expect competition in digital marketing to continue to increase. This industry is competitive, fragmented and rapidly changing. We compete against a variety of companies with respect to different aspects of our business, including:
•Direct-to-consumer apps such as iBotta, Inc. and Fetch Rewards, which offer cash back rebate and rewards solutions;
•other providers of digital promotions such as Valassis Communications, Inc.; Catalina Marketing Corporation’s Cellfire;, Inmar/You Technology; and Neptune Retail Solutions;
•offline coupon and discount services, as well as newspapers, magazines and other traditional media companies that provide coupon promotions and discounts on products and services in FSIs or other forms, including Valassis Communications, Inc., Neptune Retail Solutions and Catalina Marketing Corporation;
•retailers who develop and manage, with or without a third-party vendor, retail media or data products in-house, such as the Albertsons Media Collective, or The Kroger Company ("Kroger") with its wholly owned subsidiary of 84.51°;
•companies offering digital advertising technology, inventory, data, and services solutions and channels for advertisers and retailers including: Meta Platforms, Inc. (doing business as Facebook), Alphabet, Inc. ("Alphabet"), Pinterest, Inc., Amazon.com, Inc. ("Amazon"), Adobe Inc., The Trade Desk Inc., Oracle Corporation, Criteo S.A., Microsoft Corporation, Publicis Groupe's CitrusAd, and others.
In certain instances, we have entered into, and in the future we may enter into, strategic alliances or partnerships with companies that are competitors in other areas of our business. We believe the principal factors that generally determine a company’s competitive advantage in our market include the following:
•scale and effectiveness of reach in connecting advertisers and retailers to consumers in a digital manner;
•scale and reach of a company's retailer and publisher network;
•scale and reach of a company's targetable audience data;
•ability to attract consumers, retailers and CPGs to a company's platform and solutions;
•breadth, quality and relevance of a company's solutions and ability to innovate;
•platform security, usability, scalability, reliability and availability;
•integration with retailer applications, POS systems, and consumer channels;
•access to and quality of consumer data, including transaction data;
•ability to measure, and measurement that demonstrates the effectiveness of campaigns;
•quality of tools, reporting and analytics for planning, development and optimization of digital marketing campaigns;
•integration of products and solutions;
•ability to rapidly deploy products and services for customers;
•ability to deliver high quality and increasing numbers of digital promotions that are widely available and easy to use in consumers’ preferred form;
•brand recognition and reputation; and
•ability to recruit, retain and train employees.
We are subject to competition from large, well-established companies which have significantly greater financial, marketing and other resources than we do, and which have offerings that compete with our platforms or may choose to offer digital promotions and media and audiences as an add-on to their core business on their own or in partnership with one of our competitors that would directly compete with ours. Many of our larger actual and potential competitors have the resources to significantly change the nature of the digital promotions industry to their advantage, which could materially disadvantage us. For example, Alphabet and Facebook, retailers such as Kroger and online retailers such as Amazon have highly trafficked industry platforms which they have leveraged, or could leverage, to distribute digital promotions and media that could negatively affect our business. In addition, these potential competitors may have greater access to first-party data, and may be able to respond more quickly than we can to new or emerging technologies and changes in consumer habits. These competitors may engage in more extensive research and development efforts, undertake more far-reaching marketing campaigns and adopt more aggressive pricing policies, which may allow them to attract more consumers and, as a result, more advertisers and retailers, and thereby generate revenues more effectively than we do. Our competitors may offer digital promotions or targeted media campaigns that are similar to the digital promotions and targeted media campaigns we offer or that achieve greater market acceptance than those we offer. We are also subject to competition from smaller companies that launch similar or new products and services that we do not offer and that could gain market acceptance. We may also face claims or lawsuits from our competitors. For example, in February 2021, Catalina Marketing Corporation filed a complaint against us, alleging that we engaged in predatory pricing practices and misleading communications with potential customers in connection with our in-lane promotions solution, and in June 2021, Result Marketing Group, Ltd. filed a complaint against us, alleging misappropriation of trade secrets, interference with contract, interference with prospective business relationships and unjust enrichment. While we believe that these claims are without merit, these matters could cause us to incur substantial costs and resources defending against the claims, could distract our management from our business and could cause uncertainty among our customers or prospective customers, all of which could have an adverse effect on our business, operating results and financial condition.
Our success depends on the effectiveness of our platforms in connecting advertisers and retailers with consumers, and in attracting consumer use of the digital promotions and media delivered through our platforms. To the extent we fail to provide digital promotions and media for high quality, relevant products, or otherwise fail to successfully reach consumers on their mobile devices or elsewhere, consumers may become dissatisfied with our platforms and decide not to use our digital promotions, not interact with our digital media, and/or elect to use or view instead the digital promotions and media distributed by one of our competitors. As a result of these factors, our advertisers and retailers may not receive the benefits they expect, advertisers may opt to use the offerings of one of our competitors, and retailers may elect to handle promotions and media themselves or exclude us from integrating with their in-store and POS systems or with consumer channels. In any of these circumstances, our operating results would be adversely affected. Similarly, if retailers elect to use a competitive distribution network or platform, or develop their own solution in-house and we do not have, or fail to maintain, an agreement to distribute content through that network or platform, advertisers may elect to provide digital promotions and media directly to that network or platform, instead of through our platforms. Additionally, if retailers and advertisers require our platforms to integrate with competitive offerings instead of using our products, we could lose some of our competitive advantage and our business could be negatively affected.
We also face significant competition for trade promotion and marketing spending. We compete against online and mobile businesses, including those referenced above, and traditional advertising outlets, such as television, radio and print, for marketing dollar spending (also referred to as "spend"). In order to grow our revenues and improve our operating results, we must increase our share of advertiser spending on digital promotions and media relative to traditional sources and relative to our competitors, many of whom are larger companies that offer more traditional and widely accepted media products.
We also directly compete with retailers who develop and manage, with or without a third-party vendor, retail media and data products in-house, such as the Albertsons Media Collective, or The Kroger Company with its wholly owned subsidiary of 84.51. Specifically, many retailers market and offer their own digital advertising solutions, including retail media, targetable audiences and sponsored search, directly to advertisers. We also compete with retailers directly and indirectly for consumer traffic. Retailers will market promotions and media directly to consumers using their own websites, email newsletters and alerts, mobile applications and social media channels. Additionally, some retailers also market and offer their own digital promotions and media directly to consumers using our platforms for which we earn no revenue. Our retailers could be more successful than we are at marketing their own digital promotions and media, develop or expand their own in-house capabilities or decide to manage retailer performance media in-house, and accordingly could decide to terminate their relationship with us or renew the relationship on less favorable terms than existed previously.
We may face competition from companies we do not yet know about. If existing or new companies develop, market or offer competitive digital promotions solutions, acquire one of our existing competitors or form a strategic alliance with one of our competitors, our ability to compete effectively could be significantly compromised and our operating results could be negatively affected.
We depend in part on advertising agencies as intermediaries, and if we fail to develop and maintain these relationships, our business may be negatively affected.
A growing portion of our business is conducted with advertising agencies acting on behalf of advertisers and retailers. Advertising agencies are instrumental in assisting advertisers and retailers to plan, manage and purchase media and promotions, and each advertising agency generally allocates media and promotion spend from advertisers and retailers across numerous channels. As advertising agencies represent the marketing budgets of multiple advertisers and retailers, we expect they will be able to exert more pricing pressure on us. We are still developing relationships with, and do not have exclusive relationships with, advertising agencies, and we depend in part on advertising agencies to work with us as they manage marketing campaigns for advertisers and retailers. While in most cases we have developed relationships directly with advertisers and retailers, we nevertheless depend in part on advertising agencies to present to their advertiser and retailer clients the merits of our platforms.
Because they act on behalf of our advertiser customers, advertising agencies are an area of business focus for us. Lack of support from or negative recommendations by advertising agencies regarding use of our offerings; or failure by advertising agencies to mention our platforms at all could hurt our business. In addition, if an advertising agency is disappointed with our platforms on a particular campaign or generally, we risk losing the business of the advertiser or retailer for whom the campaign was run, and the business of other advertisers and retailers represented by that agency. Since many advertising agencies are affiliated with other advertising agencies in a larger corporate structure, if we fail to develop and maintain good relations with one advertising agency in such an organization, we may lose business from the affiliated advertising agencies as well.
Our sales could be adversely impacted by industry changes relating to the use of advertising agencies. Moreover, to the extent that we do not have a direct relationship with advertisers or retailers, the value we provide to advertisers and retailers may be attributed to the advertising agency rather than to us, further limiting our ability to develop long-term relationships directly with advertisers and retailers. Advertisers and retailers may move from one advertising agency to another, and we may lose the underlying business. The presence of advertising agencies as intermediaries between us and the advertisers and retailers thus creates a challenge to building our own brand awareness and affinity with the advertisers and retailers that are the ultimate source of our revenues. In addition, advertising agencies conducting business with us could develop similar digital marketing solutions. As such, these advertising agencies are, or may become, our competitors. If they further develop their own capabilities they may be more likely to offer their own solutions to advertisers, and our ability to compete effectively could be significantly compromised and our business, financial condition and operating results could be adversely affected.
Our failure to attract, integrate, motivate and retain highly qualified personnel in the future could harm our business, and in the near term is an increasing challenge due to market conditions and strategic transitions in our business.
As an industry-leading digital promotions and media company we compete for executive sales, engineering and other talent in a highly competitive environment against large, well-established technology companies and well-funded start-ups, which have significantly greater financial and other resources than we do. If we do not succeed in attracting, hiring and integrating qualified personnel, or motivating and retaining existing personnel, we may be unable to grow effectively and our operating results may be harmed. We initiated reduction-in-force actions in each of July 2022, which impacted 7% of our global workforce, and in November 2022, which impacted 9% of our global workforce. At present we have imposed limits on new hiring. As we continue pursuing our current business transformation strategy, which includes a focus on cost management, we may undergo further restructuring initiatives.
Following the easing of the COVID-19 pandemic restrictions in 2021 and continuing thereafter, we have experienced higher employee attrition and an increasingly competitive market for talent. Factors such as turnover within our executive leadership ranks during 2022 and in early 2023, the significant decline in our stock price during the past several quarters, uncertainty surrounding the impact of stockholder activist campaigns, and continuing industry demand for talent in certain key areas collectively have made it challenging for us to retain talent as well as backfill vacant certain roles with qualified new hires. In addition, if changes in our business such as the transformation of our business strategy and business model, and the related operational changes in various areas of our business, cause us to continue to experience a higher-than-anticipated attrition in certain key areas of our business or if we are unable to hire and ramp up new talent quickly enough to materially meet operational needs, particularly in key product areas such as consumer and key functional areas such as engineering and sales, our results of operations could be negatively impacted.
We may be limited in our ability to recruit global talent by U.S. immigration laws, including those related to H1-B visas. The demand for H1-B visas to fill highly-skilled technology and computer science jobs is greater than the number of H-1B visas available each year. To the extent that the immigration-related regulatory environment, including H1-B visa availability, hampers our ability to recruit, hire and retain qualified skilled personnel, our business, operating results and financial condition could be adversely impacted.
The effects of health epidemics, including the COVID-19 pandemic, have had, and in the future may potentially have, an adverse impact on our business, operations and the markets and communities in which we and our partners operate.
Our business and operations have been, and in the future may potentially be, adversely affected by health epidemics, including the recent COVID-19 pandemic, impacting the markets and communities in which we and our partners operate. In December 2019, a novel strain of coronavirus, SARS-CoV-2, causing a disease referred to as COVID-19, was reported to have surfaced in Wuhan, China. Since then, COVID-19 spread to many countries worldwide, including the United States, and remains a continuing global problem due to the rise of variant strains of the virus.
In response to the COVID-19 pandemic, many state, local and foreign governments put in place, quarantines, executive orders, shelter-in-place orders and similar government orders and restrictions in order to control the spread of the disease. Such orders or restrictions, or the perception that such orders or restrictions could occur, have resulted in business closures, work stoppages, slowdowns and delays, work-from-home policies, travel restrictions and cancellation of events, among other effects, that negatively impacted productivity and disrupted our operations and those of our partners. Although as of the end of 2022 the extent of restriction-lifting has been widespread, any significant worsening of COVID-19 or other health-related epidemics could once again negatively impact the productivity of our employee base and have a disproportionately negative impact on our sales and operations functions, which could have an adverse effect on our business, operating results, and financial condition.
Acquisitions, joint ventures and strategic investments could result in operating difficulties, dilution and other harmful consequences.
We have acquired a number of businesses, and expect to continue to evaluate and consider a wide array of potential strategic transactions, including acquisitions and dispositions of businesses, joint ventures, technologies, services, products and other assets and strategic investments. At any given time, we may be engaged in discussions or negotiations with respect to one or more of these types of transactions. Any of these transactions
could be material to our financial condition and results of operations. The process of integrating any acquired business may create unforeseen operating difficulties and expenditures, and is itself risky. The areas where we may face difficulties include:
•expected and unexpected costs incurred in identifying and pursuing strategic transactions and performing due diligence regarding potential strategic transactions that may or may not be successful;
•failure of an acquired company to achieve anticipated revenue, earnings, cash flows or other desired technological and business goals;
•effectiveness of our due diligence review and our ability to evaluate the results of such due diligence, which are dependent upon the accuracy and completeness of statements and disclosures made by the acquired company;
•diversion of management time, as well as a shift of focus, from operating the businesses to issues related to integration and administration;
•disputes as a result of certain terms and conditions of our transactions, such as payment of contingent consideration, compliance with covenants, or closing adjustments;
•the need to integrate technical operations and security protocols, which may lead to significant security breaches of, technical difficulties with, or interruptions to, the delivery and use of our products and services;
•the need to integrate the acquired company’s accounting, management, information, human resource and other administrative systems to permit effective management, and the lack of control if such integration is delayed or not implemented;
•retention of key employees from the acquired company and cultural challenges associated with integrating employees from the acquired company into our organization;
•the need to implement or improve, to standards appropriate for a public company, controls, procedures and policies of acquired companies that, prior to acquisition, had lacked such controls, procedures and policies;
•in some cases, the need to transition operations and customers onto our existing platforms;
•in certain instances, the ability to exert control of acquired businesses that include earnout provisions in the agreements relating to such acquisitions or the potential obligation to fund an earnout for, or fulfill other obligations related to, a product that has not met expectations;
•the need to integrate operations across different geographies, cultures and languages, and to address the particular economic, currency, political and regulatory risks associated with specific countries;
•liability for activities of the acquired company before the acquisition, including violations of laws, rules and regulations, commercial disputes, tax liabilities, and other known and unknown liabilities;
•difficulties valuing intangibles related to acquired businesses, which could lead to write-offs or charges related to acquired assets or goodwill; and
•litigation or other claims in connection with the acquired company, including claims from terminated employees, users, former stockholders or other third parties, and intellectual property infringement claims.
For example, we have acquired businesses whose technologies are new to us and with which we did not have significant experience. We have made and are making investments of resources to support such acquisitions, which will result in ongoing operating expenses and may divert resources and management attention from other areas of our business. In addition, we have been subject to litigation and disputes related to our acquisitions. For example, in August 2021, Fortis filed a complaint in the Delaware Court of Chancery alleging breach of contract, declaratory judgment, and in the alternative, breach of the implied covenant of good faith and fair dealing. The complaint alleged that the Company ceased to make generally available the SavingStar CRM business, which would trigger an earnout payment of $8.5 million under the terms of the SavingStar, Inc. acquisition agreement. In June 2022, the parties, without admitting to any liability, reached a settlement. We may experience future claims or settlements, which could impact our liquidity and financial condition. In addition, we cannot provide assurance
that these investments and the integration of these acquisitions will be successful. If we fail to successfully integrate the companies we acquire, we may not realize the benefits expected from the transaction and our business may be negatively impacted.
Our failure to address these risks or other problems encountered in connection with our past or future acquisitions and investments could cause us to fail to realize the anticipated benefits of any or all of our acquisitions or joint ventures, or we may not realize them within the expected time frame, or could cause us to incur unanticipated liabilities, in any or all such instances potentially harming our business. Future acquisitions or joint ventures may require us to issue dilutive additional equity securities, spend a substantial portion of our available cash, incur debt or contingent liabilities, amortize expenses related to intangible assets or incur incremental operating expenses or write-offs of goodwill or impaired acquired intangible assets, which could adversely affect our results of operations and harm our business.
If we fail to effectively manage our growth, our business and financial performance may suffer.
We have significantly expanded our operations and anticipate expanding further to pursue our growth strategy. Through acquisitions we have added multiple additional offices within the last four years, and during that period we moved our principal executive offices to Salt Lake City, Utah from Mountain View, California. Such expansion, together with workplace transitions including maintaining remote and hybrid working arrangements for a significant portion of our employees increases the complexity of our business and places significant demands on our management, operations, technical performance, financial resources and internal control over financial reporting functions. Continued growth could strain our ability to deliver solutions on our platforms; develop and improve our operational, financial, legal and management controls; and enhance our reporting systems and procedures. Failure to manage our expansion may limit our growth, damage our reputation and negatively affect our financial performance and harm our business.
To effectively manage this growth, we will need to continue to improve our operational, financial and management controls, and our reporting systems and procedures. If we do not effectively manage the growth of our business and operations, the scalability of our business and our operating results could suffer.
Our current and planned personnel, systems, procedures and controls may not be adequate to support and effectively manage our future operations. We may not be able to hire, train, retain, motivate and manage required personnel. As we strive to grow, we must effectively integrate, develop and motivate a large number of new employees. In time, we intend to continue to expand our research and development, sales and marketing, and general and administrative organizations, and expand our international operations. To attract top talent, we have had to offer, and believe we will need to continue to offer, highly competitive compensation packages before we can validate the productivity of those employees. If we fail to effectively manage our hiring needs and successfully integrate our new hires, our efficiency and ability to meet our forecasts and our employee morale, productivity and retention could suffer, and our business and operating results could be adversely affected.
Providing our products and services to our advertisers, retailers and consumers is costly, and we expect our expenses to continue to increase in the future as we grow our business with existing and new advertisers, agencies and retailers, and as we develop new products and services that require enhancements to our technology infrastructure. In addition, our operating expenses, such as our sales, marketing and engineering expenses, are expected to continue to grow to support our anticipated future growth. As a result of the requirements of being a public company we incur significant legal, accounting and other expenses. Our expenses may grow faster than our revenues, and our expenses may be greater than we anticipate. Managing our growth will require significant expenditures and allocation of valuable management resources. If we fail to achieve the necessary level of efficiency in our organization as it grows, our business, operating results and financial condition would be negatively affected.
Failure to deal effectively with fraudulent or other improper transactions could harm our business.
Digital promotions can be in the form of redeemable coupons, coupon codes with unique identifiers, loyalty card linked offers, and national rebates. It is possible that third parties may create counterfeit digital coupons, coupon codes and accounts, submit fraudulent receipts or the same receipts multiple times, or exceed print or use limits in order to improperly claim discounts, cash, credits, or other rewards for redemption. If we are unable to identify fraudulent national rebates claims before we pay out cash or other rewards for these claims, we might be unable to get reimbursement from our customers as we are responsible for processing rebate redemption. It is possible that individuals will circumvent our anti-fraud systems using increasingly sophisticated methods or methods that our anti-fraud systems are not able to counteract. Further, we may not detect any of these unauthorized activities in a timely manner. Third parties who succeed in circumventing our anti-fraud systems may sell the fraudulent or fraudulently obtained digital promotions on social networks or claim discounts, credits, rebates or other rewards that they are not entitled to, which would damage our brand and relationships with advertisers and harm
our business. Legal measures we take or attempt to take against these third parties may be costly and may not be ultimately successful. In addition, our service could be subject to employee fraud or other internal security breaches, and we may be required to reimburse advertisers and retailers for any funds stolen or revenues lost as a result of such breaches. Our advertisers and retailers could also request reimbursement, or stop using our platforms and products, if they are affected by buyer fraud or other types of fraud. We may incur significant losses from fraud and counterfeit digital coupons and receipts. If our anti-fraud technical and legal measures do not succeed, our business may suffer.
Indemnity provisions in various agreements and our corporate documents potentially expose us to substantial liability for intellectual property infringement and other claims.
Our agreements with advertisers, retailers and other third parties may include indemnification provisions under which we agree to indemnify them for losses suffered or incurred as a result of claims of intellectual property infringement or other liabilities relating to or arising from our products, services or other contractual obligations including those relating to data use and consumer consent. The term of these indemnity provisions generally survives termination or expiration of the applicable agreement.
In addition, in accordance with our bylaws and pursuant to indemnification agreements entered into with directors, officers and certain employees, we have indemnification obligations for claims brought against these persons arising out of certain events or occurrences while they are serving at our request in such capacities. For example, our founder and former CEO is subject to a claim from a third party, alleging that he owes certain amounts to the third party in connection with fundraising activities for Quotient that occurred between 1998 and 2006. (Our founder and former CEO left the Company for unrelated reasons in June 2022). We agreed to advance certain defense costs, subject to an undertaking to repay us such amounts if, and to the extent that, it is ultimately determined that he is not entitled to indemnification. In October 2022, the parties, without admitting any liability, reached a settlement of the third-party lawsuit, and the settlement agreement has been approved by the U.S. Bankruptcy Court. The Company has expensed $4.5 million related to the settlement agreement.
Large indemnity payments, individually or in the aggregate, could have a material impact on our financial position.
Our business depends on strong brands, and if we are not able to maintain and enhance our brands, or if we receive unfavorable media coverage, our ability to retain and expand our number of advertisers, retailers and consumers will be impaired and our business and operating results will be negatively affected.
We believe that the brand identity that we have developed has significantly contributed to the success of our business. We also believe that maintaining and enhancing our brand is critical to expanding our base of advertisers, retailers and consumers. Maintaining and enhancing our brands may require us to make substantial investments and these investments may not be successful. If we fail to promote and maintain our brands, or if we incur excessive expenses in this effort, our business would be negatively affected. We anticipate that, as our market becomes increasingly competitive, maintaining and enhancing our brands may become increasingly difficult and expensive.
Unfavorable publicity or consumer perception of our websites, mobile applications, platforms, practices or service offerings, or the offerings of our advertisers and retailers, could adversely affect our reputation, resulting in difficulties in recruiting, decreased revenues and a negative impact on the number of advertisers and retailers we feature, our user base, the loyalty of our consumers, and the number and variety of digital promotions that we offer. As a result, our business could be negatively affected.
Our use of and reliance on international research and development resources and operations may expose us to unanticipated costs or events.
We have research and development centers in India, France, and Israel. We expect to increase our headcount, development, and operations activity in Israel. There is no assurance that our reliance upon international research and development resources and operations will enable us to achieve our research and development and operational goals or enable us to achieve greater resource efficiency. Further, our international research and development and operations efforts involve significant risks, including:
•difficulty hiring and retaining appropriate personnel due to intense competition for such resources and resulting wage inflation in the cities where our research and development activities and operations are located;
•different labor regulations, especially in the European Union ("EU"), where labor laws are generally more advantageous to employees as compared to United States, including deemed hourly wage and overtime regulations in these locations;
•exposure to liabilities under anti-corruption and anti-money laundering laws, including the U.S. Foreign Corrupt Practices Act of 1977, as amended, and similar applicable laws and regulations in other jurisdictions;
•delays and inefficiencies caused by geographical separation of our international research and development activities and operations, as well as other challenges inherent to efficiently managing an increased number of employees over large geographic distances, including the need to implement appropriate systems, policies, benefits and compliance programs;
•the knowledge transfer related to our technology and the resulting exposure to misappropriation of intellectual property or information that is proprietary to us, our customers and other third parties;
•heightened exposure to change in the economic, security and political conditions in the countries where our research and development activities and operations are located;
•fluctuations in currency exchange rates and regulatory compliance in the countries where our research and development activities and operations are located; and
•interruptions to our operations in the countries where our research and development activities and operations are located as a result of floods and other natural catastrophic events, as well as other events beyond our control such as power disruptions, terrorism or a potential worsening of COVID-19.
Difficulties resulting from the factors above could increase our research and development or operational expenses, delay the introduction of new products, or impact our product quality, the occurrence of any of which could adversely affect our business and operating results.
If we fail to expand effectively in international markets, our revenues and our business may be negatively affected.
We currently generate almost all of our revenues from the United States. We also operate to a limited extent in the United Kingdom, France and other countries in Europe. Many advertisers and retailers on our platforms have global operations, and we plan to grow our operations and offerings through expansion in existing international markets and by partnering with our advertisers and retailers to enter new geographies that are important to them. For example, our plan to further expand into international markets will require management attention and resources, and we have limited experience entering new geographic markets. Entering new foreign markets will require us to localize our services to conform to a wide variety of local cultures, business practices, laws and policies. The different commercial, privacy and Internet infrastructure frameworks in other countries may make it more difficult for us to replicate our business model in non-U.S. locations. In some countries, we will compete with local companies that understand the local market better than we do, and we may not benefit from first-to-market advantages. We may not be successful in expanding into particular international markets or in generating revenues from foreign operations. As we expand internationally, we will be subject to risks of doing business internationally, including the following:
•competition with strong local competitors and preference for local providers, or competition with foreign companies entering the same markets;
•the cost and resources required to localize our platforms;
•burdens of complying with a wide variety of different laws and regulations, including intellectual property laws and regulation of digital coupons and media, Internet services, privacy and data protection; marketing and consumer protection laws; anti-competition regulations; and different liability standards, any of which may limit or prevent us from offering of our solutions in some jurisdictions or limit our ability to enforce contractual obligations;
•differences in how trade marketing spend is allocated;
•differences in the way digital promotions and media are delivered and how consumers access and use digital promotions;
•technology compatibility;
•difficulties in recruiting and retaining qualified employees and managing foreign operations;
•different employee/employer relationships and the existence of workers’ councils and labor unions;
•shorter payment cycles, different accounting practices and greater problems in collecting accounts receivable;
•higher product return rates;
•seasonal reductions in business activity;
•adverse tax effects and foreign exchange controls making it difficult to repatriate earnings and cash; and
•political and economic instability.
Our planned corporate structure and intercompany arrangements will be implemented in a manner we believe is in compliance with current prevailing tax laws. However, the tax benefits which we intend to eventually derive could be undermined if we are unable to adapt the manner in which we operate our business in response to changing tax laws.
Our failure to manage these risks and challenges successfully could materially and adversely affect our business, financial condition and results of operations.
Risks Related to Government Regulation, Tax Law or Accounting Standards
Our business is subject to complex and evolving laws, regulations and industry standards, and unfavorable interpretations of, or changes in, or our actual and perceived failure to comply with these laws, regulations and industry standards could substantially harm our business and results of operations.
We collect, receive, access, generate, store, disclose, share, make accessible, protect, secure, and dispose of, and use (collectively "Process" or "Processing") business and personal information belonging to our users and customers. Because of this, we are subject to a variety of foreign, federal, state, local and municipal laws, regulations and industry standards that relate to privacy, electronic communications, data protection, intellectual property, eCommerce, competition, price discrimination, consumer protection, taxation and the use of promotions. The number and scope of such laws, regulations, and industry standards are changing, are subject to differing applications and interpretations and may be inconsistent among countries, or may conflict with other rules, laws or data protection obligations. Several new privacy laws recently went or will go into effect in 2023, and legislators in other U.S. states and in foreign countries are considering additional new privacy laws and regulations. We expect that there will continue to be new data protection laws and data protection obligations, and we cannot yet determine the impact such future laws and obligations may have on our business.
Many of these laws, regulations, and standards are still evolving and being tested in courts, and industry standards are still developing. As a result, the regulatory framework for privacy, information security, data protection and data Processing worldwide is, and is likely to remain, uncertain for the foreseeable future, and it is possible that these or other actual or alleged obligations may be interpreted and applied in a manner that is inconsistent from one jurisdiction to another and may conflict with other rules or practices. Our business, including our ability to operate and expand, could be adversely affected if legislation, regulations or industry standards are adopted, interpreted or implemented in a manner that is inconsistent with our current business practices and that require changes to these practices or the design of our platforms. Existing and future laws, regulations and industry standards could restrict our operations, and our ability to retain or increase our advertisers and retailers and consumers’ use of digital promotions delivered on our platforms may be adversely affected, and we may not be able to maintain or grow our revenues as anticipated.
For example, California has enacted the CCPA, which affords consumers expanded privacy protections, has required us to modify our data processing practices and policies as well as caused us to incur substantial costs and expenses in an effort to comply. For example, the CCPA requires companies that process information on California residents to make disclosures to consumers about their data collection, use and sharing practices, allows consumers to opt out of the sale of personal information with third parties, and provides a private right of action and
statutory damages for data breaches. The CCPA also provides for civil penalties for violations, as well as a private right of action for data breaches that may increase the risk of data breach litigation, all of which may increase our compliance costs and potential liability. The amendments to the CCPA under the CPRA also expanded consumer rights and disclosure obligations. For example, the CPRA gives California residents the ability to opt out of sharing any personal information, limits the use of their sensitive information, provides for penalties for CPRA violations concerning California residents under the age of 16, and establishes a new California Privacy Protection Agency to implement and enforce the law.
The enactment of the CCPA prompted a wave of similar legislative developments in other states in the United States, which could create the potential for a patchwork of overlapping but different state laws. New and more stringent privacy legislation in the United States could increase our potential liability and adversely affect our business, results of operations, and financial condition. For example, the Virginia Consumer Data Protection Act went into effect on January 1, 2023 and affords consumers similar rights to the CCPA, along with additional rights such as the right to opt out of processing for profiling and targeted advertising purposes. Additionally, Colorado, Utah and Connecticut have passed comprehensive privacy legislation that will go into effect later in 2023 and that impose obligations similar to, but not exactly the same as, California and Virginia laws, and many other states are considering their own privacy legislation. Compliance with any newly enacted privacy and data security laws or regulations may be challenging, costly and time-intensive, and we may be required to put in place additional mechanisms to comply with applicable legal requirements. Additional legislative initiatives in other states, to the extent that they become privacy and data security laws or regulations in such states, may have potentially conflicting requirements that would make compliance challenging. Some countries also are considering, or have passed legislation requiring, local storage and Processing of data, or similar requirements, which could increase the cost and complexity of operating our products and services and other aspects of our business.
Compliance with these and any other applicable privacy, data protection, data security, marketing and consumer protection guidelines, laws and regulations is a rigorous and time-intensive process, and we may be required to put in place additional mechanisms to ensure compliance with them. We believe our policies and practices comply in material respects with these guidelines, laws and regulations. However, if our belief or interpretations of the law are incorrect, if these guidelines, laws or regulations or their interpretations change, or if new legislation or regulations are enacted, we may face significant fines and penalties that could adversely affect our business, financial condition and result of operations. Further, we could be compelled to provide additional disclosures to our consumers, obtain additional consents from our consumers before collecting, using, or disclosing their information, or implement new safeguards or business processes to help individuals manage our use of their information. We also cannot control our retail partners’ approach or interpretation of evolving state or other new and emerging privacy laws and regulations, which may impact their willingness or ability to provide us data that our platforms and solutions are dependent upon, or the terms on which they are willing or able to provide it. Changes to our data sources may restrict our ability to maintain or grow our revenues as anticipated.
If our estimates or judgements relating to our critical accounting policies prove to be incorrect, our results of operations could be adversely affected.
The preparation of financial statements in conformity with U.S. generally accepted accounting principles ("U.S. GAAP") requires management to make estimates and assumptions that affect the amounts reported in our financial statements and accompanying notes. We base our estimates on historical experience and on various other assumptions that we believe to be reasonable under the circumstances, as provided in the section of this Report titled “Management’s Discussion and Analysis of Financial Condition and Results of Operations.” The results of these estimates form the basis for making judgments about the carrying values of assets, liabilities and equity, and the amount of revenue and expenses that are not readily apparent from other sources. Significant assumptions and estimates used in preparing our consolidated financial statements include those related to business combinations, goodwill and intangible assets, revenue recognition, promotion revenue, media revenue, gross versus net revenue reporting, arrangements with multiple performance obligations, stock-based compensation and provision for income taxes. For example, the recognition of our revenue is governed by certain criteria that determine whether we report revenue either on a gross basis, as a principal, or on a net basis, as an agent, depending upon the nature of the sales transaction. Historically, our media products revenue has generally been recognized on a gross basis. However, beginning the second quarter of 2020 and continuing thereafter, we have been making changes to the manner in which we process and deliver certain media products. These business changes, over time, have led to our recognizing a greater proportion of our media revenues on a net basis, as compared to the prior recognition on a gross basis, and we expect this will cause a decrease in our revenue growth and impact our revenues. At the same time, we continue to have gross reporting for other portions of our media products, as well as for other
revenue. Our determinations are made in light of the evolution of our existing business practices, development of new products, acquisitions, or changes in accounting standards or interpretations, with transactions being evaluated for characteristics that dictate, as appropriate, gross or net reporting. It is also possible that revenue reporting for existing businesses may change from gross to net or vice versa as a result of changes in contract terms or transaction mechanics. We may experience significant fluctuations in revenue in future periods depending upon, in part, the nature of our sales and our reporting of such revenue and related accounting treatment, without proportionate correlation to our underlying activity or net income. Any combination of net and gross revenue reporting would require us to make estimates and assumptions about the mix of gross and net-reported transactions based upon the volumes and characteristics of the transactions that we believe will comprise the total mix of revenue in the period covered by the projection. Those estimates and assumptions may be inaccurate when made, or may be rendered inaccurate by subsequent circumstances, such as changing the characteristics of our offerings or particular transactions in response to client demands, market developments, regulatory pressures, acquisitions and other factors. Even apparently minor changes in transaction terms from those initially envisioned can result in different accounting conclusions from those foreseen. In addition, we may incorrectly extrapolate, to future transactions, revenue recognition treatment of prior transactions that initially we believe to be similar but later are determined to have sufficiently different characteristics as to require a different revenue reporting treatment. These factors may make our financial reporting more complex and difficult for investors to understand, may make comparison of our results of operations to prior periods or other companies more difficult, may make it more difficult for us to give accurate guidance, and could increase the potential for reporting errors.
Our results of operations may be adversely affected if our assumptions change or if actual circumstances differ from those in our assumptions, which could cause our results of operations to fall below the expectations of securities analysts and investors, and thereby result in a decline in the trading price of our common stock.
Failure to comply with federal, state and foreign privacy, data protection, marketing and consumer protection laws, regulations and industry standards, or the expansion of current or the enactment or adoption of new privacy, data protection, marketing and consumer protection laws, regulations or industry standards, could adversely affect our business.
We Process data about consumers, including personally identifiable information or personal data, as well as other confidential or proprietary information necessary to operate our business, for legal and marketing purposes, and for other business-related purposes. We collect such information from individuals located both in the United States and abroad, and may store or Process such information outside the country in which it was collected.
The legal and regulatory framework for privacy and security issues is rapidly evolving across the globe, and is expected to increase our compliance costs and exposure to liability. We and our service providers and partners are subject to a variety of federal, state and foreign laws, regulations and industry standards regarding privacy, data protection, data security, marketing and consumer protection, which address the Processing of data relating to individuals, as well as the tracking of consumer behavior and other consumer data (“Data Protection Laws”). We are also subject to laws, regulations and industry standards relating to endorsements and influencer marketing. Many of these laws, regulations and industry standards are changing and expanding, including those that offer consumers additional privacy rights with regard to profiling and online behavioral advertising. These laws, regulations and industry standards may be subject to differing interpretations, may be inconsistent among countries, may be costly to comply with or inconsistent among jurisdictions, or may conflict with other rules, laws or Data Protection Obligations (defined below).
Various industry standards on privacy and data security have been developed and are expected to continue to develop, which standards may be adopted by industry participants at any time. We have committed to comply, and generally require our customers and partners to comply, with applicable self-regulatory principles such as the Network Advertising Initiative’s Code of Conduct and the Digital Advertising Alliance’s Self-Regulatory Principles for Online Behavioral Advertising in the U.S. Trade associations and industry self-regulatory groups have also promulgated best practices and other industry standards relating to targeted advertising. Our efforts to comply with these self-regulatory principles include offering Internet users notice and choices about when advertising is served to them based, in part, on their interests. If we, our clients or partners make mistakes in the implementation of these principles, if self-regulatory bodies expand these guidelines or government authorities issue different guidelines regarding Internet-based advertising, if opt out mechanisms fail to work as designed, or if Internet users misunderstand our technology or our commitments with respect to these principles, we may be subject to negative publicity, government investigation, government or private litigation, or investigation by self-regulatory bodies or other accountability groups. Any such action against us or investigations of us, even if meritless, could be costly and
time consuming, require us to change our business practices, cause us to divert management’s attention and our resources away from business activities, and be damaging to our brand, reputation, and business. In addition, privacy advocates and industry groups may propose new and different self-regulatory standards that legally apply to us. We cannot yet determine the impact such future standards may have on our business.
We are or may also be subject to the terms of our external and internal privacy and security policies, codes, representations, certifications, industry standards, publications and frameworks (“Privacy Policies”). We are also subject to contractual obligations to third parties related to privacy, data protection, and information security and Processing, including contractual obligations to indemnify and hold harmless third parties from the costs or consequences of non-compliance with Data Protection Laws or other obligations (“Data Protection Obligations”). Our solutions depend in part on our ability to use data that we obtain in connection with our offerings, and our ability to use this data may be subject to restrictions in our commercial agreements and subject to the privacy policies of the entities that provide us with this data. Our service providers or our partners’ failure to adhere to these third-party restrictions on data use may result in claims, proceedings or actions against us by our business counterparties or other parties, or may result in our incurring other liabilities, including loss of business, reputational damage, and remediation costs, which could adversely affect our business.
We expect that there will continue to be new Data Protection Laws and Data Protection Obligations, and we cannot yet determine the impact such future Data Protection Laws and Data Protection Obligations may have on our business. Any significant change to Data Protection Laws and Data Protection Obligations, including without limitation the manner in which the express or implied consent of customers for Processing is obtained, could increase our costs and require us to modify our operations, possibly in a material manner, which we may be unable to complete and which may limit our ability to store and Process data and operate our business. In particular, it should be noted that the AdTech industry has in the last few years received increased scrutiny from consumers, media outlets, regulators and lawmakers. This has been demonstrated by the €250,000 fine imposed on the Interactive Advertising Bureau Europe by the Belgian Data Protection Authority in February 2022, following an investigation into its Transparency and Consent Framework (“TCF”)—a framework adopted widely for the collection/management of consent to the use of cookies for targeted advertising in the EU. This decision will require us to reassess our reliance on the TCF.
Data Protection Laws and data protection worldwide is, and is likely to remain, uncertain for the foreseeable future, and our actual or perceived failure to address or comply with these laws could result in the following: increase our compliance and operational costs; limit our ability to market our products or services and attract new and retain current customers; limit or eliminate our ability to Process data; expose us to regulatory scrutiny, actions, investigations, fines and penalties; result in reputational harm; lead to a loss of business result in litigation and liability, including class action litigation; cause to incur significant costs, expenses and fees (including attorney fees); cause a material adverse impact to business operations or financial results; and otherwise result in other material harm to our business (“Adverse Data Protection Impact”).
We are subject to Data Protection Laws, Privacy Policies and Data Protection Obligations as well as applicable foreign, federal, state, local and municipal laws, regulations and industry standards that relate to electronic communications, intellectual property, eCommerce, competition, price discrimination, consumer protection, taxation, and the use of promotions. We strive to comply with applicable laws, policies, contractual and other legal obligations as well as industry standards of conduct relating to privacy, data security, data protection, marketing and consumer protection to the extent possible, but we may at times fail to do so, or may be perceived to have failed to do so. These obligations and standards of conduct often are complex, vague, and difficult to comply with fully, and it is possible that these obligations and standards of conduct may be interpreted and applied in new ways and/ or in a manner that is inconsistent with each other or with new laws, regulations or other obligations that may be enacted.
Moreover, despite our efforts, we may not be successful in achieving compliance if our employees, partners or vendors do not comply with applicable Data Protection Laws, Privacy Policies and Data Protection Obligations. We may be subject to, and may experience, an Adverse Data Protection Impact if we fail (or are perceived to have failed) to comply with applicable Data Protection Laws, Privacy Policies and Data Protection Obligations, or if our Privacy Policies are, in whole or part, found to be inaccurate, incomplete, deceptive, unfair, or misrepresentative of our actual practices. In addition, any such failure or perceived failure could result in public statements against us by consumer advocacy groups, the media or others, which may cause us material reputational harm. Our actual or perceived failure to comply with Data Protection Laws, Privacy Policies and Data Protection Obligations could also subject us to litigation, claims, proceedings or actions, or to investigations by governmental entities, authorities or
regulators, which could result in an Adverse Data Protection Impact including requiring changes to our business practices, causing the diversion of resources and the attention of management from our business, triggering regulatory oversights and audits, discontinuance of necessary Processing, or imposing other remedies that adversely affect our business.
We also expect that there will continue to be new laws, regulations, and industry standards concerning privacy, data protection, and information security proposed and enacted in various jurisdictions. In Europe, the General Data Protection Regulation (2016/679) (“EU GDPR”) went into effect in May 2018 and introduced strict requirements for Processing the personal data of data subjects. The EU GDPR governs the collection, use, disclosure, transfer or other processing of personal data and has direct effect in all EU Member States and has extraterritorial effect where organizations outside of the European Economic Area ("EEA") Process personal data of individuals in the EEA in relation to the offering of goods or services to those individuals (“targeting test”) or the monitoring of their behavior (“monitoring test”). As such, the EU GDPR applies to us to the extent we are established in an EU Member State, we are Processing personal data in the context of an establishment in the EU, or we meet the requirements of either the targeting test or the monitoring test. Companies that must comply with the EU GDPR face increased compliance obligations and risk, including more robust regulatory enforcement of data protection requirements, an order prohibiting Processing of personal data of data subjects, and potential fines for noncompliance of up to €20 million, or 4% of consolidated annual worldwide gross revenues, whichever is greater. The EU also confers a private right of action on data subjects and consumer associations to lodge complaints with supervisory authorities, seek judicial remedies, and obtain compensation for damages resulting from violations of the EU GDPR.
Under the EU GDPR, we may be required to put in place additional mechanisms to ensure compliance. These include, among other things: (i) accountability and transparency requirements, and enhanced requirements for obtaining valid consent; (ii) obligations to consider data protection as any new products or services are developed, and to limit the amount of personal data processed; (iii) obligations to implement appropriate technical and organizational measures to safeguard personal data and to report certain personal data breaches to the supervisory authority without undue delay (and no later than 72 hours where feasible); and (iv) obligations to provide individuals with various data protection rights (e.g., the right to erasure of personal data).
European data protection laws including the EU GDPR generally also prohibit the transfer of personal data from Europe to the United States and other countries ("third countries") that are not recognized as having “adequate” data protection laws unless the parties to the transfer have implemented specific safeguards to protect the transferred personal data. One of the primary safeguards allowing U.S. companies to import personal data from Europe has historically been certification to the EU-U.S. Privacy Shield and Swiss-U.S. Privacy Shield frameworks administered by the U.S. Department of Commerce. However, the Court of Justice of the European Union, in the “Schrems II” ruling in 2020, invalidated the EU-U.S. Privacy Shield framework for purposes of international transfers. The Swiss Federal Data Protection and Information Commissioner also opined that the Swiss-U.S. Privacy Shield is inadequate for transfers of personal data from Switzerland to the U.S. On October 7, 2022, the U.S. President introduced an executive order to facilitate a new Trans-Atlantic Data Privacy Framework, which will act as a successor to the invalidated Privacy Shield. On December 13, 2022, the European Commission also published its draft adequacy decision which stated that the new executive order and Trans-Atlantic Data Privacy Framework is able to meet the concerns raised in Schrems II. If the draft adequacy decision is approved and implemented, the agreement will facilitate the transatlantic flow of personal data and provide additional safeguards to data transfer mechanisms (including EU Standard Contractual Clauses and Binding Corporate Rules) for companies transferring personal data from the EU to the U.S. However, before parties rely on the new Framework, there are still legislative and regulatory steps that must be undertaken in both the U.S. and in the EU. The Schrems II decision also led to a requirement for companies to carry out a transfer privacy impact assessment which, among other things, assesses laws governing access to personal data in the recipient country and considers whether supplementary measures that provide privacy protections additional to those provided under SCCs will need to be implemented to ensure an essentially equivalent level of data protection to that afforded in the EU. Therefore, at present the new EU SCCs are still the primary safeguard available for personal data transfers from the EU to the U.S. As such, the current legal position may have implications for our cross-border data flows and may result in increased compliance costs.
Further to Schrems II, the European Commission adopted new EU SCCs in June 2021 which impose onerous obligations on the contracting parties. These new EU SCCs must be used in all new contracts going forward (where there are restricted transfers of personal data), with existing contracts entered into before September 27, 2021 required to be updated by December 27, 2022. As such, any transfers by us or our vendors of personal data from
Europe may not comply with European data protection law; may increase our exposure to the EU GDPR’s heightened sanctions for violations of its cross-border data transfer restrictions; and may reduce demand from companies subject to European data protection laws. Moreover, where we rely on SCCs, we must in certain cases now evaluate and implement supplementary measures that provide privacy protections additional to those provided under SCCs. This evaluation will, in particular, include an assessment as to whether the types of personal data transferred pursuant to SCCs may be subject to government surveillance in the data importer’s country, and an assessment as to whether the data importer can meet its contractual obligations under the SCCs. Additionally, other countries outside of Europe have enacted, or are considering enacting, similar cross-border data transfer restrictions and laws requiring local data residency, which could increase the cost and complexity of delivering our products and operating our business.
Compliance with the EU GDPR involves rigorous and time-intensive processes that may increase our cost of doing business or require us to change our business practices. There may also be a risk that the measures will not be implemented correctly or that individuals within the business will not be fully compliant with the required procedures.
Further, following the UK's exit from the EU ("Brexit"), the EU GDPR’s data protection obligations continue to apply to the United Kingdom in substantially unvaried form under the so called “UK GDPR” (i.e., the EU GDPR as it continues to form part of law in the UK by virtue of section 3 of the European Union (Withdrawal) Act 2018, as amended (including by the various Data Protection, Privacy and Electronic Communications (EU Exit) Regulations)). The UK GDPR exists alongside the UK Data Protection Act 2018 that implements certain derogations in the UK GDPR into UK law. Under the UK GDPR, companies not established in the UK but who process personal information in relation to the offering of goods or services to individuals in the UK, or to monitor their behavior, will be subject to the UK GDPR – the requirements of which are (at this time) largely aligned with those under the EU GDPR, and as such may lead to similar compliance and operational costs with potential fines of up to £17.5 million or 4% of global turnover. As a result we are potentially exposed to two parallel data protection regimes, each of which authorizes fines and the potential for divergent enforcement actions. It should also be noted that the UK Government has published its own form of EU SCCs known as the UK International Data Transfer Agreement (IDTA) together with an International Data Transfer Addendum (UK Addendum) to the new EU SCCs. The UK Information Commissioner’s Office (ICO) has also published its version of the transfer impact assessment and international guidance on international transfers, although entities may choose to adopt either the EU or UK style transfer impact assessment. In terms of international data transfers between the U.K. and the U.S., it is understood that the U.K. and the U.S. are negotiating an adequacy agreement.
Any failure or perceived failure by us to comply with applicable laws and regulations or any of our other legal obligations relating to privacy, data protection, or information security may result in governmental investigations or enforcement actions, litigation, claims, or public statements against us, Any of the foregoing could also result in significant liability or cause our customers to lose trust in us, any of which could have an adverse effect on our reputation, operations, financial performance and business. Furthermore, the costs of compliance with, and other burdens imposed by, the laws, regulations, and policies that are applicable to the businesses of our customers may limit the adoption and use of, and reduce the overall demand for, our products and services.
In the United States, Data Protection Laws include rules and regulations promulgated under the authority of the Federal Trade Commission, the Electronic Communications Privacy Act, the Computer Fraud and Abuse Act, the CCPA and other similar state comprehensive privacy laws, and other state and federal laws relating to privacy and data security. The CCPA requires companies that process information on California residents to make disclosures to consumers about their data collection, use and selling/sharing practices, allows consumers to opt out of the sale and sharing of personal information with third parties, and provides a private right of action and statutory damages for data breaches. The CCPA, including its amendments under the CPRA, may increase our compliance costs and potential liability. Additionally, the Virginia Consumer Data Protection Act went into effect on January 1, 2023 and affords consumers similar rights to the CCPA, along with additional rights, such as the right to opt-out of processing for profiling and targeted advertising purposes. Colorado, Utah and Connecticut have also passed comprehensive privacy legislation, which impose obligations similar to but not exactly the same as the California and Virginia laws, that will go into effect in 2023. Additionally, in August 2022, the Federal Trade Commission ("FTC") announced that it is exploring rules to limit commercial surveillance that it views harmful, along with potential for additional information security regulations. New privacy laws and regulations could create the potential for a patchwork of overlapping but different privacy obligations and more stringent United States privacy requirements, which in turn could increase our potential liability and adversely affect our business, results of
operations, and financial condition. Compliance with the increasing number of newly enacted privacy and data security laws and regulations may be challenging, costly and time-intensive, and we may be required to put in place additional mechanisms to comply with applicable legal requirements. Additional legislative initiatives, to the extent that they become privacy and data security laws or regulations in various states, may have potentially conflicting requirements that would make compliance challenging. Some countries also are considering or have passed legislation requiring local storage and Processing of data, or similar requirements, which could increase the cost and complexity of providing our products and services and other aspects of our business.
We expect that there will continue to be new proposed laws, regulations and industry standards concerning privacy, data protection and information security in the United States and other jurisdictions, and we cannot yet determine the impact such future laws, regulations and standards may have on our business. With laws and regulations in the EU, the United Kingdom, the United States, and other global jurisdictions imposing new and potentially costly or disruptive obligations, and with substantial uncertainty over the interpretation and application of these and other laws and regulations, there is a risk that the requirements of these laws and regulations, or of contractual or other obligations relating to privacy, data protection, or information security, could be interpreted or applied in a manner that is, or is alleged to be, inconsistent with our management and Processing practices, our policies or procedures, or our products and services.
Given the increased focus on the use of data for advertising, the anticipation and expectation of future laws, regulations, standards and other obligations could impact us and our existing and potential business partners and delay certain business partnerships or deals until there is greater certainty. In addition, as we expand our data analytics and other data-related product offerings, there may be increased scrutiny on our use of data, and we may be subject to new and unexpected regulations, including proposals for regulation of artificial intelligence. Future laws, regulations, standards and other obligations could, for example, impair our ability to collect or use information that we utilize to provide targeted digital promotions and media to consumers, advertisers and retailers, thereby impairing our ability to maintain and grow our total customers and increase revenues. Future restrictions on the collection, use, sharing or disclosure of our users’ data, or additional requirements for express or implied consent of users for the use and disclosure of such information, could require us to modify our solutions, possibly in a material manner, and could limit our ability to develop or outright prohibit new solutions and features.
We may face challenges in addressing the requirements of any such new laws, regulations, other legal obligations or industry standards, or any changed interpretation of existing laws, regulations or other standards and making necessary changes to our policies and practices, and such changes may require us to incur additional costs and restrict our business operations. Although we endeavor to comply with our Privacy Policies and other privacy, data protection or information security-related obligations, we may at times fail to do so or may be perceived to have failed to do so. Moreover, despite our efforts, we may not be successful in achieving compliance if our employees or vendors do not comply with our Privacy Policies and other privacy, data protection or information security obligations. Any failure or perceived failure by us to comply with our Privacy Policies and our privacy, data protection, or information security-related obligations to customers or other third parties, or our failure to comply with any of our other legal obligations relating to privacy, data protection, information security, marketing or consumer protection could subject us to litigation, regulatory investigations, fines or other liabilities, as well as negative publicity or public statements against us by consumer advocacy groups or others and could result in significant liability or cause a loss of trust in us, which could have an adverse effect on our reputation and business. Furthermore, the costs of compliance with, and other burdens imposed by, the laws, regulations, and policies that are applicable to the businesses of our customers may limit the adoption and use of, and reduce the overall demand for, our products and services. Moreover, if future laws, regulations, other legal obligations or industry standards, or any changed interpretations of the foregoing limit users’, advertisers’ or retailers’ ability to use and share personally identifiable information or our ability to store, process and share personally identifiable information or other data, demand for our solutions could decrease, our costs could increase, our revenue growth could slow, and our business, financial condition and operating results could be harmed.
Additionally, if third parties we work with, such as vendors or developers, violate Data Protection Laws, Privacy Policies and Data Protection Obligations, such violations may also put our customers’ content at risk and could in turn have an adverse effect on our business. Any significant change to Data Protection Laws, Data Protection Obligations or industry practices regarding the collection, use, retention, security or disclosure of our customers’ content, or regarding the manner in which the express or implied consent of customers for the collection, use, retention or disclosure of such content is obtained, could increase our costs and require us to modify our
products and services, possibly in a material manner, which we may be unable to complete and which may limit our ability to store and Process customer data or develop new applications and features.
We may be required to record a significant charge to earnings if our goodwill or amortizable intangible assets become impaired.
We are required under U.S. GAAP to review our amortizable intangible assets for impairment when events or changes in circumstances indicate the carrying value may not be recoverable. Goodwill is required to be tested for impairment at least annually. Conditions that would necessitate an impairment assessment include a significant decline in the observable market value of an asset, a significant change in the extent or manner in which an asset is used, or any other significant adverse change that would indicate that the carrying amount of an asset or group of assets may not be recoverable. The events and circumstances we consider include the business climate, legal factors, operating performance indicators and competition. In the future we may be required to record a significant charge to earnings in our consolidated financial statements during the period in which any impairment of our goodwill or amortizable intangible assets is determined. The determination and recording of a significant impairment charge could adversely impact our results of operations, as for example occurred during the third quarter of 2021 in connection with the circumstances surrounding the termination of our partnership with Albertsons, and also could harm our business.
Changes to financial accounting standards or the SEC’s rules and regulations may affect our financial statements and cause us to change our business practices.
We prepare our financial statements to conform to U.S. GAAP. These accounting principles are subject to interpretation by the FASB, American Institute of Certified Public Accountants (“AICPA”), the SEC and various bodies formed to interpret and create appropriate accounting policies. A change in those policies can have a significant effect on our reported results and may affect our reporting of transactions completed before a change is announced. Changes to those rules or the questioning of current practices may adversely affect our reported financial results or the way we conduct our business.
If we fail to maintain an effective system of disclosure controls and internal control over financial reporting, our ability to produce timely and accurate financial statements or comply with applicable regulations could be impaired.
We are subject to the reporting requirements of the Exchange Act, Sarbanes-Oxley ("SOX"), and the rules and regulations of the New York Stock Exchange, or the NYSE. We expect that the requirements of these rules and regulations will continue to increase our legal, accounting and financial compliance costs, make some activities more difficult, time consuming and costly, and place significant strain on our personnel, systems and resources.
SOX requires, among other things, that we maintain effective disclosure controls and procedures and internal control over financial reporting. Our ability to comply with internal control reporting requirements depends on the effectiveness of our financial reporting and data systems and controls across our company. We are continuing to develop and refine our disclosure controls and other procedures that are designed to ensure that information required to be disclosed by us in the reports that we will file with the SEC is recorded, processed, summarized and reported within the time periods specified in SEC rules and forms, and that information required to be disclosed in reports under the Exchange Act is accumulated and communicated to our principal executive and financial officers. We are also continuing to improve our internal control over financial reporting. In order to maintain and improve the effectiveness of our disclosure controls and procedures and internal control over financial reporting, we have expended, and anticipate that we will continue to expend, significant resources, including accounting-related costs and significant management oversight. Any failure to implement and maintain effective internal control over financial reporting also could adversely affect the results of periodic management evaluations and annual independent registered public accounting firm attestation reports regarding the effectiveness of our internal control over financial reporting that we will be required to include in our periodic reports we will file with the SEC under Section 404 of SOX. In the event that we are not able to demonstrate compliance with Section 404 of SOX, that our internal control over financial reporting is perceived as inadequate or that we are unable to produce timely or accurate financial statements, investors may lose confidence in our operating results and our stock price could decline.
Our current controls and any new controls that we develop may become inadequate because of changes in conditions in our business. Further, weaknesses in our disclosure controls or our internal control over financial reporting may be discovered in the future. Any failure to develop or maintain effective controls, or any difficulties encountered in their implementation or improvement, could harm our operating results or cause us to fail to meet
our reporting obligations and could result in a restatement of our financial statements for prior periods. Any failure to implement and maintain effective internal control over financial reporting also could adversely affect the results of management evaluations and independent registered public accounting firm audits of our internal control over financial reporting that we will eventually be required to include in our periodic reports that will be filed with the SEC. Ineffective disclosure controls and procedures and internal control over financial reporting could also cause investors to lose confidence in our reported financial and other information, which would likely have a negative effect on the trading price of our common stock. In addition, if we are unable to continue to meet these requirements, our common stock may not be able to remain listed on the NYSE.
Any failure to maintain effective disclosure controls and internal control over financial reporting could have a material and adverse effect on our business and operating results, and cause a decline in the price of our common stock.
State and foreign laws regulating money transmission could impact our rebates solutions.
Many states and certain foreign jurisdictions impose license and registration obligations on those companies engaged in the business of money transmission, with varying definitions of what constitutes money transmission. If our rebates solutions were to subject us to any applicable state or foreign laws, it could subject us to increased compliance costs and delay our ability to offer this product in certain jurisdictions pending receipt of any necessary licenses or registrations. If we need to make product and operational changes in light of these laws, the growth and adoption of these products may be adversely impacted, and our revenues may negatively affected.
Our ability to use our net operating losses to offset future taxable income may be subject to certain limitations.
In general, under Section 382 of the U.S. Internal Revenue Code of 1986, as amended, or the Code, and similar state law provisions, a corporation that undergoes an “ownership change” is subject to limitations on its ability to utilize its pre-change net operating losses, or NOLs, to offset post-change taxable income. If we have experienced an ownership change our existing NOLs may be subject to limitations under Section 382 of the Code. Future changes in our stock ownership also could result in an ownership change under Section 382 of the Code. Additionally, our NOLs arising in certain prior tax years beginning prior to January 1, 2018 are subject to expiration and may expire prior to being utilized. Under the 2017 Tax Cuts and Jobs Act (the "Tax Act"), as modified by the Coronavirus Aid, Relief and Economic Security Act (the "CARES Act"), NOLs arising in tax years beginning after December 31, 2017, are not subject to expiration and may be carried forward indefinitely, but the deductibility of such NOLs in tax years beginning after December 31, 2020, is limited to 80% of taxable income. It is uncertain if and to what extent various states will conform to the Tax Act or the CARES Act.
There is also a risk that our NOLs could otherwise be unavailable to offset future income tax liabilities due to changes in the law, including regulatory changes, such as suspensions on the use of NOLs or other unforeseen reasons. In addition, at the state level, there may be periods during which the use of net operating loss carryforwards is suspended or otherwise limited, which could accelerate or permanently increase state taxes owed. We do not expect this to have a material impact on our financial statements because we currently maintain a full valuation allowance on our U.S. deferred tax assets. For these reasons, we may not be able to utilize all of our NOLs, even if we attain profitability.
Changes in the U.S. and foreign tax law or challenges by taxing authorities of the jurisdictions in which we operate could increase our worldwide effective tax rate and have a negative effect on our financial position and results of operations.
Changes in the U.S. taxation of international activities may increase our worldwide effective tax rate and harm our financial condition and results of operations. The taxing authorities of the jurisdictions in which we operate may challenge our methodologies for valuing developed technology or intercompany arrangements, including our transfer pricing, or determine that the manner in which we operate our business does not achieve the intended tax consequences, which could increase our worldwide effective tax rate and harm our financial position and results of operations. Significant judgment will be required in evaluating our tax positions and determining our provision for income taxes. During the ordinary course of business, there will be many transactions and calculations for which the ultimate tax determination is uncertain. As we expand our business to operate in numerous taxing jurisdictions, the application of tax laws may be subject to diverging and sometimes conflicting interpretations by tax authorities of these jurisdictions. It is not uncommon for taxing authorities in different countries to have conflicting views. In addition, tax laws are dynamic and subject to change as new laws are passed and new interpretations of the law
are issued or applied. New income, sales, use or other tax laws, statutes, rules, regulations or ordinances could be enacted at any time, which could adversely affect our business operations and financial performance.
Further, existing tax laws, statutes, rules, regulations or ordinances could be interpreted, changed, modified or applied adversely to us. For example, the Tax Act enacted many significant changes to the U.S. tax laws. Future guidance from the Internal Revenue Service and other tax authorities with respect to the Tax Act may affect us, and certain aspects of the Tax Act could be repealed or modified in future legislation. For example, the CARES Act modified certain provisions of the Tax Act. In addition, it is uncertain if and to what extent various states will conform to the Tax Act, the CARES Act, or any newly enacted federal tax legislation. Changes in corporate tax rates, the realization of net deferred tax assets relating to our operations, the taxation of foreign earnings, and the deductibility of expenses under the Tax Act or future reform legislation could have a material impact on the value of our deferred tax assets, could result in significant one-time charges, and could increase our future U.S. income tax expense.
Risks Related to Our Platforms, Technology and Intellectual Property
If our security measures or information we collect and maintain are compromised or publicly exposed, advertisers, retailers and consumers may curtail or stop using our platforms and we could be subject to claims, penalties and fines.
We process data about consumers, including personally identifiable information or personal data, as well as other confidential or proprietary information necessary to operate our business, for legal and marketing purposes, and for other business-related purposes.
While we and our third-party service providers have implemented security measures designed to protect against security breaches, like all businesses that use computer systems and the Internet, our security measures, as well as those of companies we may acquire and our third-party service providers and partners, could fail or may be insufficient, resulting in the unauthorized disclosure, modification, misuse, unavailability, destruction, or loss of our or our customers’ data or other sensitive information. Any security breach of our operational systems, physical facilities, or the systems of our third-party partners, or the perception that one has occurred, could result in litigation, indemnity obligations, regulatory enforcement actions, investigations, fines, penalties, mitigation and remediation costs, disputes, reputational harm, diversion of management’s attention, and other liabilities and damage to our business. Even though we do not control the security measures of third parties, we may be responsible for any breach of such measures or suffer reputational harm even where we do not have recourse to the third party that caused the breach. In addition, any failure by our retail partners or other third-party partners to comply with applicable law or regulations could result in proceedings against us by governmental entities or others.
Cyberattacks, denial-of-service attacks, ransomware attacks, business email compromises, computer malware, viruses, social engineering (including phishing) and other malicious internet-based activity are prevalent in our industry, and our customers and partners’ industries, and continue to increase. In addition, we may experience software or other code vulnerabilities, attacks, unavailable systems, unauthorized access or disclosure due to employee or other theft or misuse, denial-of-service attacks, sophisticated attacks by nation-state and nation-state supported actors, and advanced persistent threat intrusions. We and our third party service providers regularly defend against and respond to a variety of cybersecurity attacks and incidents. Despite our efforts to ensure the security, privacy, integrity, confidentiality, availability and authenticity of the information technology (IT) networks and systems, processing and information, we may not be able to anticipate or to implement effective preventive and remedial measures against, or adequately respond to mitigate the impact of, all data security and privacy threats and attacks. We cannot guarantee that the recovery systems, security protocols, network protection mechanisms and other security measures that we have integrated into our systems, networks and physical facilities, which are designed to protect against, detect and minimize security breaches, will be adequate to prevent or detect service interruption, system failure data loss or theft, or other material adverse consequences. No security solution, strategy, or measures can address all possible security threats or block all methods of penetrating a network or otherwise perpetrating a security incident. The risk of unauthorized circumvention of our security measures, or those of our third-party providers, clients and partners, has been heightened by advances in computer and software capabilities and the increasing sophistication of hackers who employ complex techniques, including without limitation the theft or misuse of personal and financial information, counterfeiting, “phishing” attacks (including those directed toward SMS/texting services) or social engineering incidents, ransomware, extortion, publicly announcing security breaches, account takeover attacks, denial or degradation of service attacks, malware, fraudulent payment and identity theft. The techniques used to sabotage, disrupt or to obtain unauthorized access to our applications, systems, networks, or physical facilities in which data is stored or through which data is transmitted change
frequently, and we may be unable to implement adequate preventative measures or stop security breaches while they are occurring. The recovery systems, security protocols, network protection mechanisms and other security measures that we have integrated into our applications, systems, networks and physical facilities, which are designed to protect against, detect and minimize security breaches, may not be adequate to prevent or detect service interruption, system failure or data loss. Additionally, to provide protection against the occurrence of a cybersecurity event, we rely on the IT professionals within our organization to monitor, diagnose and remediate threats arising within our network. To the extent we experience attrition in this area and are required to shift workloads, or acquire and train supplementary IT talent, we could face increased risks of experiencing a materially harmful cybersecurity event.
In addition, our applications, systems, networks, and physical facilities could be breached, or personal information could be otherwise compromised, due to employee error or malfeasance if, for example, third parties attempt to fraudulently induce our employees, customers or partners to disclose information or user names and/or passwords, or otherwise compromise the security of our networks, systems and/or physical facilities. Third parties may also exploit vulnerabilities in, or obtain unauthorized access to, platforms, applications, systems, networks and/or physical facilities utilized by our vendors. We have been, and may in the future become, the target of cyber-attacks by third parties seeking unauthorized access to our or our customers or partners’ data or to disrupt our operations or ability to provide our services. While we have been successful in preventing such unauthorized access and disruption in the past, we may not continue to be successful against these or other attacks in the future.
A significant percentage of our employees continue to work under remote or hybrid working arrangements, which may pose additional data security risks. These risks will continue as we continue to operate both remote and hybrid arrangements for employees. If we, or our service providers and partners, experience compromises to security that result in performance or availability problems, or experience the complete shutdown of one or more of our platforms, digital properties and mobile applications, or suffer the misuse, loss or unauthorized access to or disclosure of confidential information, personally identifiable information or other personal or proprietary data, advertisers, retailers, and consumers may lose trust and confidence in us and decrease their use of our platforms or stop using our platforms entirely. Such compromises to personal or sensitive information or proprietary data could lead to litigation or other adversarial actions by business partners such as retailers or consumers.
The costs to respond to a security breach and/or to mitigate any security vulnerabilities that may be identified could be significant, our efforts to address these problems may not be successful, and these problems could result in unexpected interruptions, delays, cessation of service, negative publicity, and other harm to our business and our competitive position. We could be required to fundamentally change our business activities and practices in response to a security breach or related regulatory actions or litigation, which could have an adverse effect on our business.
We have contractual and legal obligations to notify relevant stakeholders of security breaches. Most jurisdictions have enacted laws requiring companies to notify individuals, regulatory authorities, and others of security breaches involving certain types of data. In addition, our agreements with certain customers and partners may require us to notify them in the event of a security breach involving customer or partner data on our systems or those of subcontractors processing customer or partner data on our behalf. Such mandatory disclosures are costly, could lead to negative publicity, may cause our customers to lose confidence in the effectiveness of our security measures, and require us to expend significant capital and other resources to respond to or alleviate problems caused by the actual or perceived security breach may cause us to breach customer contracts. Depending on the facts and circumstances of such an incident, these damages, penalties and costs could be significant and may not be covered by insurance, or could exceed our applicable insurance coverage limits. Such an event also could harm our reputation and result in litigation against us. Any of these results could materially adversely affect our financial performance. Our agreements with certain customers may require us to use industry-standard, reasonable, or other specified measures to safeguard sensitive personal information or confidential information, and any actual or perceived breach of such measures may increase the likelihood and frequency of customer audits under our agreements, which is likely to increase the costs of doing business. An actual or perceived security breach could lead to claims by our customers or other relevant stakeholders that we have failed to comply with such legal or contractual obligations. As a result, we could be subject to legal action or our customers could end their relationships with us. There can be no assurance that any limitations of liability in our contracts, which we have in certain agreements, would be enforceable or adequate or would otherwise protect us from liabilities or damages.
Litigation resulting from security breaches may adversely affect our business. Unauthorized access to our applications, systems, networks, or physical facilities could result in litigation with our customers or other relevant
stakeholders. These proceedings could force us to spend money in defense or settlement, divert management’s time and attention, increase our costs of doing business, or adversely affect our reputation. We could be required to fundamentally change our business activities and practices, or to modify our business and operational capabilities in response to such litigation, which could have an adverse effect on our business. If a security breach were to occur, and the confidentiality, integrity or availability of our data or the data of our partners or our customers were to be disrupted, we could incur significant liability, or our applications, systems or networks may be perceived as less desirable, which could negatively affect our business and damage our reputation.
If we fail to detect or remediate a security breach in a timely manner, or a breach otherwise affects a large amount of data of one or more of our customers or partners, or if we suffer a cyberattack that impacts our ability to operate our applications, systems or networks, we may suffer material damage to our reputation, business, financial condition and results of operations. Further, we may not have adequate insurance coverage for security incidents or breaches, including fines, judgments, settlements, penalties, costs, attorney fees and other impacts that arise out of incidents or breaches. Depending on the facts and circumstances of such an incident, the damages, penalties and costs could be significant and may not be covered by insurance, or could exceed our applicable insurance coverage limits. If the impacts of a security incident or breach, or the successful assertion of one or more large claims against us that exceeds our available insurance coverage, or results in changes to our insurance policies (including premium increases or the imposition of large deductible or co-insurance requirements), it could have an adverse effect on our business. In addition, we cannot be sure that our existing insurance coverage and coverage for errors and omissions will continue to be available on acceptable terms or that our insurers will not deny coverage as to all or part of any future claim or loss. Our risks are likely to increase as we continue to expand our applications, systems, or networks, grow our customer base, and Process, store, and transmit increasingly large amounts of proprietary and sensitive data.
Remediation of any potential cybersecurity breach may involve significant time, resources and expenses, which may result in potential regulatory inquiries, litigation or other investigations, and could affect our financial and operational condition.
Our ability to generate revenue and properly capture the occurrence of certain revenue-generating events depends on the collection, reliability, and use of significant amounts of data from various sources, which may be restricted by consumer choice, restrictions imposed by retailers, publishers and browsers or other software developers, changes in technology, and new developments in laws, regulations and industry requirements or standards.
Our ability to generate revenue, and properly capture the occurrence of certain revenue-generating events, depends on the collection, reliability, and use of significant amounts of data from various sources, including data that we receive from retailers and other parties. Additionally, our ability to deliver our solutions depends on our ability to successfully leverage data, including data that we collect from consumers, data we receive from retailers and other parties, and data from our own operating history. Using loyalty card numbers both online and in-store, device identifiers (including Google AdID and Apple IDFA), cookies, and other tracking technologies, we, our retail partners and other data providers collect information about the interactions of consumers with our retail partners’ digital and in-store, with our owned and operated properties, and with certain other publisher sites and mobile applications, as well as other data such as location. We may enhance this data with other data, such as demographic information that we obtain from data providers.
As an example, for certain media campaigns, we receive tracking information from the systems of retailers, their service providers, and other third parties. If those parties fail to provide us information, fail to provide information in a timely fashion, or provide incorrect information, or if for other reasons we are unable to properly track such information, our results of operations and our ability to timely determine our revenue share payment obligation to retailers could be adversely impacted. Additionally, our ability to successfully leverage such data depends on our continued ability to access and use data from various sources, which can be restricted by a number of factors, including consumer choice, the success in obtaining consumer consent; restrictions imposed by our retail and other data partners or other third parties, publishers and web browser developers or other software developers; changes in technology, including changes in web browser technology; and new developments in, or new interpretations of laws, regulations and industry standards. Consumer resistance to the collection and sharing of the data used to deliver targeted advertising, increased visibility of consent or “do not track” mechanism as a result of industry regulatory and/or legal developments, the adoption by consumers of browsers settings or “ad-blocking” software and the development and deployment of new technologies could materially impact our ability to collect data or reduce our ability to deliver relevant promotions or media, which could materially impair the results of our
operations. See the risk factor above titled “Our business is subject to complex and evolving laws, regulations and industry standards, and unfavorable interpretations of, or changes in, or failure by us to comply with these laws, regulations and industry standards could substantially harm our business and results of operations” for additional information.
In addition, unfavorable publicity and negative public perception about our industry, or data collection and use, could adversely affect our business and operating results. With the growth of online advertising and eCommerce, there is increasing awareness and concern among the general public, privacy advocates, mainstream media, governmental bodies and others regarding marketing, advertising, and privacy matters, particularly as they relate to individual privacy interests. Any unfavorable publicity or negative public perception about our use of data, or about data-focused industries, could affect our business and results of operations, and may lead digital publishers like Facebook to change their business practices or trigger additional regulatory scrutiny or lawmaking that could affect us. Negative public attention could cause advertisers or our retail partners to discontinue using our targeted advertising solutions and limit our ability to measure campaigns delivered through our platforms. This public scrutiny may also lead to general distrust of data and marketing companies, consumer reluctance to share and permit use of personal data, and increased consumer opt-out rates, any of which circumstances could negatively influence, change or reduce our current and prospective customers’ demand for our products and services and adversely affect our business and operating results.
If the use of mobile device identifiers, third-party cookies or other tracking technology is rejected by consumers, restricted by third parties outside of our control, or otherwise subject to unfavorable regulation, the benefits of our offerings and solutions could diminish, our data and media acquisition costs could increase and we could lose customers and revenue.
We and our third-party partners use, or might opt to use, a number of technologies to collect information used to deliver our solutions. For instance, mobile device identifiers such as Apple IDFA and Google AdID help us and our third-party partners identify, target and measure relevant promotions and media to consumers. Advertising shown on mobile applications can also be affected by blocking or restricting use of mobile device identifiers. Data regarding interactions between users and devices are tracked mostly through stable, pseudonymous advertising identifiers that are built into the device operating system with privacy controls that allow users to express a preference with respect to data collection for advertising, including to disable the identifier. These identifiers and privacy controls are defined by the developers of the platforms through which the applications are accessed and could be changed by the platforms in ways that could impair our ability to target, deliver, or measure the effectiveness of our solutions, any of which may negatively impact our business. In addition, mobile operating system and browser providers have implemented product changes and may in the future implement changes to limit the ability of websites and application developers to collect and use these mobile device identifiers and other data to target and measure advertising. This shift from enabling user opt-out to an opt-in requirement has had a negative impact on the mobile advertising ecosystem, the quality and volume of user data, and data and media acquisition costs, and accordingly could harm our growth.
Our platforms use location data to localize and deliver geographically relevant content to shoppers. For instance, our DOOH solution tracks a mobile device user’s geographical proximity to the public DOOH display so that localized relevant marketing campaigns will be displayed to the user when they are nearby. Our ability to obtain and use location data could also become limited by consumer choice and subject to privacy-related restrictions. If such restrictions and regulations negatively impact our ability to use location data in our solutions, such as our ability to track identifiable mobile device users within the proximity of DOOH display screens, there could be less customer demand for our platforms and solutions and our business and revenue would be negatively impacted.
We also use small text files (referred to as "cookies"), placed through an Internet browser on a consumer's machine which corresponds to a data set that we keep on our servers, to gather important data to help deliver our solutions. Certain of our cookies, including those that we predominantly use in delivering our solutions through Internet browsers, are known as "third-party" cookies because they are delivered by third parties rather than by us. Our cookies collect information, such as when a consumer views an advertisement, clicks on an advertisement or visits one of our advertisers' websites. In some countries, including countries in the European Economic Area, and certain states within the United States such as California and Virginia, this information may be considered personal information under applicable data protection laws. When a consumer interacts with our solutions on a mobile device, we may also obtain location-based information about the user's device through our cookies or other tracking technologies. We use these technologies to achieve our customers' campaign goals, to ensure that the same consumer does not unintentionally see the same media too frequently, to report aggregate information to our
customers regarding the performance of their digital promotions and marketing campaigns, and to detect and prevent fraudulent activity throughout our network. We also use data from cookies to help us decide whether and how much to bid on an opportunity to place an advertisement in a certain Internet location and at a given time in front of a particular consumer. A lack of data associated with or obtained from third-party cookies may detract from our ability to make decisions about which inventory to purchase for a customer's campaign, and thereby may adversely affect the effectiveness of our solution and harm our business.
Cookies may be deleted or blocked by consumers. The most commonly used Internet browsers (including Chrome, Firefox, and Safari) allow their users to prevent cookies from being accepted by their browsers. Consumers can also delete cookies from their computers. Some consumers also download "ad blocking" software that prevents cookies from being stored on a user's computer. If more consumers adopt these settings or delete their cookies more frequently than they currently do, our business could be negatively affected. In addition, certain web browsers may block third-party cookies by default. For example, Apple previously released an update to its Safari browser that limits the use of cookies, and other browsers may do so in the future. Unless such default settings in browsers are altered by consumers to permit the placement of third-party cookies, we would be able to set fewer of our cookies in users’ browsers, which reduces our ability to achieve our customers' campaign goals, measure performance of these campaigns, and detect fraudulent activity, any of which could adversely affect our business. In addition, companies such as Google have publicly disclosed their intention to move away from cookies to another form of persistent unique identifier, or ID, to identify individual consumers or Internet-connected devices in the bidding process on advertising exchanges. Companies not using shared IDs across the entire ecosystem, could have a negative impact on our ability to find the same user across different web properties, and thereby reduce the effectiveness of our solutions.
In addition, the EU Directive 2009/136/EC, amending Directive 2002/22/EC, (collectively referred to as the "Cookie Directive") directs EU Member States to ensure that collecting information on a consumer's computer, such as through a non-essential cookie, is allowed only if the consumer has appropriately given his or her prior freely given, specific, informed and unambiguous consent. Similarly, this Cookie Directive, which also contains specific rules for the sending of marketing communications, limits the use of marketing texts messages and e-mails. Additionally, the "e-Privacy Regulation", which will replace the Cookie Directive with requirements that could be stricter in certain respects, will apply directly to activities within the EU without the need to be transposed in each Member State’s Law, and could impose stricter requirements regarding the use of cookies, marketing e-mails and text messages. Additional penalties for noncompliance have been proposed in connection with the e-Privacy Regulation, although at this time it is unclear whether the e-Privacy Regulation will be approved as it is currently drafted or when its requirements will be effective. We may experience challenges in obtaining appropriate consent to our use of cookies from consumers or to send marketing communications to consumers within the EU, which may affect our ability to run promotions and our operating results and business in European markets, and we may not be able to develop or implement additional tools that compensate for the lack of data associated with cookies. Moreover, even if we are able to do so, such additional tools may be subject to further regulation, may be time consuming to develop or costly to obtain, and may be less effective than our current use of cookies.
We allow our clients and partners to utilize application programming interfaces ("APIs"), with our platforms, which could result in outages or security breaches and negatively impact our business, financial condition and results of operations.
The use of APIs by our customers, as well as by retailer and other network partners, has significantly increased in recent years. Our APIs allow customers, as well as retailer and other network partners, to integrate their own business system with our platforms. The increased use of APIs increases security and operational risks to our systems, including risks relating to management of system access controls such as timely retirement of network user IDs as well as the risks of intrusion attacks, data theft, or denial of service attacks. Furthermore, while APIs allow greater ease and power in accessing our platforms, they also increase the risk of overusing our systems, potentially causing outages. While we have taken measures intended to decrease security and outage risks associated with the use of APIs, we cannot guarantee that such measures will be successful. Our failure to prevent outages or security breaches resulting from API use could result in government enforcement actions against us, claims for damages by consumers and other affected individuals, costs associated with investigation and remediation damage to our reputation and loss of goodwill, any of which could harm our business, financial condition and results of operations.
Our business relies in part on electronic messaging, including emails and SMS text messages, and any technical, legal or other restrictions on the sending of electronic messages or an inability to timely deliver such communications could harm our business.
Our business is in part dependent upon electronic messaging. We provide emails, mobile alerts and other messages to consumers informing them of digital promotion availability, and we believe these communications help generate a significant portion of our revenues. We also use electronic messaging as part of the consumer sign-up and verification process. Because electronic messaging services are important to our business, if we are unable to successfully deliver electronic messages to consumers, if there are legal restrictions on delivering these messages to consumers, or if consumers do not or cannot open our messages, our revenues and profitability could be adversely affected. Changes in how webmail applications or other email management tools organize and prioritize email may result in our emails being delivered or routed to a less prominent location in a consumer’s inbox, or may be viewed as “spam” by consumers, and thereby may reduce the likelihood of that consumer opening our emails. Actions taken by third parties that block, impose restrictions on, or charge for the delivery of, electronic messages could also harm our business. From time to time, Internet service providers or other third parties may block bulk email transmissions or otherwise experience technical difficulties that result in our inability to successfully deliver emails or other messages to consumers.
Changes in laws or regulations, or changes in interpretations of existing laws or regulations, including the Telephone Consumer Protection Act ("TCPA") in the United States and laws regarding commercial electronic messaging in other jurisdictions, that would limit our ability to send such communications or impose additional requirements upon us in connection with sending such communications could also adversely impact our business. For example, the Federal Communications Commission in recent years amended certain of its regulations under the TCPA in a manner that could increase our exposure to liability for certain types of telephonic communication with customers, including but not limited to text messages to mobile phones. Under the TCPA, plaintiffs may seek actual monetary loss or statutory damages per violation, whichever is greater, and courts may treble the damage award for willful or knowing violations. Given the enormous number of communications we send to consumers, the actual or perceived improper sending of communications, or a determination that there have been violations of the TCPA or other communications-based statutes, could subject us to potential risks including liabilities or claims relating to consumer protection laws, and could expose us to significant damage awards that could, individually or in the aggregate, materially harm our business. Moreover, even if we prevail, such litigation against us could impose substantial costs and divert our management’s attention and resources.
We also rely on social networking messaging services to send communications. Changes to these social networking services’ terms of use or terms of service that limit promotional communications; restrictions that would limit our ability or our customers’ ability to send communications through their services, disruptions or downtime experienced by these social networking services; or reductions in the use of or engagement with social networking services by customers and potential customers could also harm our business.
We rely on a third-party service for the delivery of daily emails and other forms of electronic communication, and delay or errors in the delivery of such emails or other messaging we send may occur and be beyond our control, which could damage our reputation or harm our business, financial condition and operating results. If we were to be unable to use our current electronic messaging services, alternate services are available; however, we believe our sales could be impacted for some period as we transition to a new provider, and the new provider may be unable to provide equivalent or satisfactory electronic messaging service. Any disruption or restriction on the distribution of our electronic messages, termination or disruption of our relationship with our messaging service providers, including our third-party service that delivers our daily emails, or any increase in our costs associated with our email and other messaging activities, could harm our business.
Our business depends on our ability to maintain and scale the network infrastructure necessary to operate our platforms, including our websites and mobile applications, and any significant disruption in service could result in a loss of advertisers, retailers and consumers.
We deliver digital promotions and media via our platforms, including over our websites and mobile applications, as well as through the websites and mobile applications of our advertisers, retailers and publishers, and other third parties. Our reputation and ability to acquire, retain and serve advertisers and retailers, as well as consumers who use digital promotions or view media on our platforms, are dependent upon the reliable performance of our platforms. As the number of our advertiser customers, retailers and consumers; the number of digital promotions, digital media and information shared through our platforms; and the number of network endpoints (for example, DOOH display screens) continue to grow, we will need an increasing amount of network capacity and computing power. Our technology infrastructure and platforms are hosted across two data centers in co-location facilities in California and Virginia. We also operate our applications and services on industry-leading cloud platforms. We have spent and expect to continue to spend substantial amounts in our data centers, cloud platforms, and equipment and related network infrastructure to handle the traffic on our platforms. The operation of these systems is expensive and complex, and could result in operational failures and/or slow remediation response times in the event of a network incident. In the event that the number of transactions or the amount of traffic on our platforms grows more quickly than anticipated, we may be required to incur significant additional costs. In addition, as we scale, we must continually invest in our information technology, and also continue to invest in information security, infrastructure and automation as we strive to reduce complexities and siloed elements of our platforms. Deployment of new software or processes, whether or not relating to the transition from legacy to new IT systems, may adversely affect the performance of our services and harm the customer experience. If we fail to support our platforms or provide a strong customer experience, our ability to retain and attract customers may be negatively affected. Interruptions in these systems or service disruptions, whether due to system failures, computer viruses, malware, ransomware, denial of service attacks, attempts to degrade or disrupt services, or physical or electronic break-ins, could affect the security or availability of our websites and platforms and mobile applications, and prevent advertisers, retailers or consumers from accessing our platforms. A substantial portion of our network infrastructure is hosted by third-party providers. Any disruption in these services or any failure of these providers to handle existing or increased traffic could significantly harm our business. Any financial or other difficulties these providers face may adversely affect our business, and furthermore we exercise little control over these providers, which increases our vulnerability to problems with the services they provide. If we do not maintain or expand our network infrastructure successfully or if we experience operational failures, we could lose current and potential advertisers, retailers and consumers, which could harm our operating results and financial condition.
We are dependent on technology systems and electronic communications networks that are supplied and managed by third parties, which could result in our inability to prevent or respond to disruptions in our services.
Our ability to provide services to consumers depends on our ability to communicate with advertisers, retailers and consumers through the public Internet, mobile devices and electronic networks that are owned and operated by third parties. Our solutions and services also depend on the ability of our users to access the public Internet and mobile devices. In addition, in order to provide services promptly, our computer equipment and network servers must be functional 24 hours per day, which requires access to telecommunications facilities managed by third parties and the availability of electricity, neither of which we control. Severe disruptions, outages, defects, or other security performance and quality problems with one or more of these networks, including as a result of utility or third-party system interruptions, or any material change in our contractual and other business relationships with third-party providers, could impair our ability to process information, which in turn could impede our ability to provide digital promotions and media to consumers; harm our reputation; increase expenses, including significant, unplanned capital investments and/or contractual obligations; and result in a loss of consumers or advertisers and retailers, any of which could adversely affect our business, financial condition, and operating results.
For example, our employees work under remote or hybrid work arrangements, and accordingly are dependent upon their respective internet service providers to be able to access the internet, our systems and systems of our service providers. In other words, our business workflows now rely on availability of residential broadband bandwidth as well as connectivity which is currently under considerable strain. If the residential broadband and internet access break down under strain, our business and operations would be negatively affected.
We may not be able to adequately protect our intellectual property rights.
We regard our trademarks, service marks, copyrights, patents, trade dress, trade secrets, proprietary technology, and similar intellectual property as critical to our success.
We strive to protect our intellectual property rights in a number of jurisdictions, a process that is expensive and may not be successful or which we may not pursue in every location. We strive to protect our intellectual property rights by relying on federal, state and common law rights, contractual restrictions, and rights provided under foreign laws. Applicable laws are subject to change at any time and could further restrict our ability to protect our intellectual property rights.
We also may not be able to acquire or maintain appropriate domain names in all countries in which we do business. Furthermore, regulations governing domain names may not protect our trademarks and similar proprietary rights. We may be unable to prevent third parties from acquiring domain names that are similar to, infringe upon, or diminish the value of our trademarks and other proprietary rights.
We typically enter into confidentiality and invention assignment agreements with our employees and contractors, and confidentiality agreements with parties with whom we conduct business in order to limit access to, and disclosure and use of, our proprietary information. Also, from time to time, we make our intellectual property rights available to others under license agreements. However, these contractual arrangements and the other steps we have taken to protect our intellectual property may not prevent the misappropriation or disclosure of our proprietary information, infringement of our intellectual property rights or deter independent development of similar technologies by others, and may not provide an adequate remedy in the event of such misappropriation or infringement. Third parties that license our proprietary rights also may take actions that diminish the value of our proprietary rights or reputation.
Obtaining and maintaining effective intellectual property rights is expensive, including the costs of defending our rights. Even where we have such rights, they may be later found to be unenforceable or have a limited scope of enforceability. We may not be able to discover or determine the extent of any unauthorized use of our proprietary rights. Litigation may be necessary to enforce our intellectual property rights, protect our trade secrets, or determine the validity and scope of proprietary rights claimed by others. Any litigation of this nature, regardless of outcome or merit, could result in substantial costs and diversion of management and technical resources, any of which could adversely affect our business and operating results. If we fail to maintain, protect and enhance our intellectual property rights, our business and operating results may be negatively affected.
We may be accused of infringing intellectual property rights of third parties.
Other parties may claim that we infringe their proprietary rights. We are, have been subject to, and expect to continue to be subject to, claims and legal proceedings regarding alleged infringement by us of the intellectual property rights of third parties. Such claims, whether or not meritorious, may result in the expenditure of significant financial and managerial resources, injunctions against us, or the payment of damages, including to satisfy indemnification obligations. We may need to obtain licenses from third parties who allege that we have infringed their rights, but such licenses may not be available on terms acceptable to us or at all. In addition, we may not be able to obtain or utilize on terms that are favorable to us, or at all, licenses or other rights with respect to intellectual property we do not own. These risks have been amplified by the increase in third parties whose sole or primary business is to assert such claims.
We may be unable to continue to use the domain names that we use in our business, or prevent third parties from acquiring and using domain names that infringe on, are similar to, or otherwise decrease the value of our brand or our trademarks or service marks.
We may lose significant brand equity in our “Quotient.com” domain name, our Shopmium.com domain name, and other valuable domain names. We plan to complete the transfer of coupons.com to CupoNation GmbH in 2023. If we lose the ability to use a domain name or brand names, whether due to trademark claims, failure to renew an applicable registration, or any other cause, we may be forced to market our products under new domain names or brand names, which could cause us substantial harm, or we may be forced to incur significant expense in order to purchase rights to the domain names or brand names in question. In addition, our competitors and others could attempt to capitalize on our brand recognition by using domain names or brand names similar to ours. We also may not be able to acquire or maintain appropriate domain names or trademarks in all countries in which we do business. Domain names similar to ours have been registered in the United States and elsewhere. We may be unable to prevent third parties from acquiring and using domain names or brand names that infringe on, are similar to, or otherwise decrease the value of our brand or our trademarks or service marks. Protecting and enforcing our
rights in our domain names or brand names may require litigation, which could result in substantial costs and diversion of management’s attention, and thereby harm our business.
Some of our solutions contain open source software, which may pose particular risks to our proprietary software and solutions.
We use open source software in our solutions and plan to use open source software in the future. From time to time, we may face claims from third parties claiming ownership of, or demanding release of, the open source software and/or derivative works that we developed using such software (which could include our proprietary source code), or that are otherwise seeking to enforce the terms of the applicable open source license. These claims could result in litigation and could require us to purchase a costly license or cease offering the implicated solutions unless and until we can re-engineer them to avoid infringement. This re-engineering process could require significant additional research and development resources. In addition to risks related to license requirements, use of certain open source software can lead to greater risks than use of third-party commercial software, as open source licensors generally do not provide warranties or controls on the origin of software. Any of these risks could be difficult to eliminate or manage and, if not addressed, could have a negative effect on our business and operating results.
Risks Related to Ownership of our Common Stock
The market price of our common stock has been, and is likely to continue to be, subject to wide fluctuations and could subject us to litigation.
The price of our common stock may change in response to variations in our operating results and also may change in response to other factors, including factors specific to technology companies, many of which are beyond our control. As a result, our stock price may experience significant volatility. Among other factors that could affect our stock price are:
•the financial projections that we or analysts may choose to provide to the public, any changes in these projections or our failure for any reason to meet these projections;
•actual or anticipated changes or fluctuations in our results of operations;
•whether our results of operations meet the expectations of securities analysts or investors;
•addition or loss of significant customers or commercial business partners;
•price and volume fluctuations in the overall stock market from time to time;
•fluctuations in the trading volume of our shares or the size of our public float;
•success of competitive products or services;
•the public’s response to press releases or other public announcements by us or others, including our filings with the SEC;
•disputes or other developments related to proprietary rights, including patents, litigation matters, or our ability to obtain intellectual property protection for our technologies;
•announcements relating to litigation;
•speculation about our business in the press or the investment community;
•reports, guidance and ratings issued by securities or industry analysts;
•future sales of our common stock by our significant stockholders, officers and directors;
•changes in our capital structure, such as future issuances of debt or equity securities;
•our entry into new markets;
•regulatory developments in the United States or foreign countries;
•strategic actions by us or our competitors, such as acquisitions or restructurings;
•business model or solution delivery changes that result in differences in accounting treatment, including whether revenue is recognized on a net or gross basis;
•actions instituted by activist stockholders or others;
•any significant changes in our management or our board of directors; and
•changes in accounting principles.
If any of the foregoing occurs, it could cause our stock price or trading volume to decline. In addition, the stock market in general has experienced substantial price and volume volatility that is often seemingly unrelated to the operating results of any particular companies. Moreover, if the market for technology stocks or the stock market in general experiences uneven investor confidence, the market price of our common stock could decline for reasons unrelated to our business, operating results or financial condition. The market price for our stock might also decline in reaction to events that affect other companies within, or outside, our industry, even if these events do not directly affect us. Some companies that have experienced volatility in the trading price of their stock have been subject of securities litigation. If we are the subject of such litigation, it could result in substantial costs and a diversion of management’s attention and resources.
Our business could be negatively affected as a result of actions of stockholders.
We value constructive input from investors and regularly engage in dialogue with our stockholders regarding strategy and performance. Our board of directors and management team are committed to acting in the best interests of all of our stockholders. There is no assurance that the actions taken by our board of directors and management in seeking to maintain constructive engagement with certain stockholders will be successful.
On April 13, 2022, Engaged Capital Flagship Master Fund, LP, together with certain affiliates (collectively “Engaged”), filed a preliminary proxy statement seeking to solicit proxies in favor of the election of two director candidates to our board of directors at our 2022 annual meeting of stockholders ("2022 Annual Meeting"). Engaged also made public statements critical of our board of directors, management and operations. On May 16, 2022, the Company and Engaged entered into a Cooperation Agreement, which expired by its terms on March 1, 2023. The amounts of time, attention and resources that were required of our company and its board and executive leadership to address Engaged-related matters, including the potential proxy contest with Engaged and the settlement with Engaged, were substantial, and the residual impact of this diversion of the Company's resources and leadership away from operational matters on the Company's business and financial performance is uncertain.
Moreover, responding to any future actions by Engaged, or by other activist stockholders likewise could be costly and time-consuming, disruptive to our operations, and distracting to our management, our board of directors and our employees. Any future contested election with respect to the company's directors could require us to incur substantial legal, public relations and other advisory fees and proxy solicitation expenses. Further, in such situation we may choose to initiate, or may become subject to, litigation as a result of proposals by activist stockholders or proxy contests or matters relating thereto, which would serve as a further distraction to our board of directors and management and could require us to incur significant additional costs.
Additionally, perceived uncertainties as to our future direction as a result of stockholder activism or changes to the composition of our board of directors may lead to the perception of a change in the direction of our business or other instability, which may be exploited by our competitors and/or other activist stockholders and cause concern to our current or potential customers, employees, investors, partners and other constituencies, which could result in lost sales and the loss of business opportunities and make it more difficult to attract and retain qualified personnel and business partners. If customers choose to delay, defer or reduce business with us or do business with our competitors instead of us, then our business, financial condition and operating results would be adversely affected. In addition, our share price could experience periods of increased volatility as a result of stockholder activism.
Substantial future sales of shares by our stockholders could negatively affect our stock price.
Sales of a substantial number of shares of our common stock in the public market could depress the market price of our common stock and could impair our ability to raise capital through the sale of additional equity securities. We have approximately 97,149,665 shares of common stock outstanding as of December 31, 2022, assuming no exercise of our outstanding options or vesting of our outstanding RSUs.
Our equity incentive plans allow us to issue, among other things, stock options, restricted stock and restricted stock units, and we have filed a registration statement under the Securities Act to cover the issuance of shares upon the exercise or vesting of awards granted under those plans.
The concentration of our common stock ownership with our executive officers, directors and owners of 5% or more of our outstanding common stock will limit our ability to influence corporate matters.
Our executive officers, directors and owners of 5% or more of our outstanding common stock together beneficially own approximately 43% of our outstanding common stock, based on the number of shares outstanding as of December 31, 2022. These stockholders therefore have significant influence over management and affairs, and over all matters requiring stockholder approval, including the election of directors and significant corporate transactions, such as a merger or other sale of our company or its assets, for the foreseeable future. This concentrated control limits stockholders' ability to influence corporate matters and, as a result, we may take actions that our stockholders do not view as beneficial. This ownership could affect the value of a stockholder's shares of common stock.
If securities analysts do not publish research or if securities analysts or other third parties publish inaccurate or unfavorable research about us, the price of our common stock could decline.
The trading market for our common stock will rely in part on the research and reports that securities analysts and other third parties choose to publish about us. We do not control these analysts or other third parties. The price of our common stock could decline if one or more securities analysts downgrade our common stock or if one or more securities analysts or other third parties publish inaccurate or unfavorable research about us or cease publishing reports about us.
We do not intend to pay dividends for the foreseeable future.
We intend to retain all of our earnings for the foreseeable future to finance the operation and expansion of our business, and do not anticipate paying cash dividends on our common stock. As a result, a stockholder can expect to receive a return on the stockholder's investment in our common stock only if the market price of the stock increases.
Provisions in our charter documents and under Delaware law could discourage a takeover that stockholders may consider favorable.
Provisions in our certificate of incorporation and by-laws may have the effect of delaying or preventing a change of control or changes in our management. Amongst other things, these provisions:
•authorize the issuance of “blank check” preferred stock that could be issued by our Board of Directors to defend against a takeover attempt;
•require that directors only be removed from office for cause and only upon a majority stockholder vote;
•provide that vacancies on the Board of Directors, including newly created directorships, may be filled only by a majority vote of directors then in office rather than by stockholders;
•prevent stockholders from calling special meetings; and
•prohibit stockholder action by written consent, requiring all actions to be taken at a meeting of the stockholders.
In addition, we are governed by the provisions of Section 203 of the Delaware General Corporation Law, which generally prohibits a Delaware corporation from engaging in a broad range of business combinations with any “interested” stockholder for a period of three years following the date on which the stockholder becomes an “interested” stockholder.
Risks Related to Debt Financing Transactions
We are leveraged financially, which could adversely affect our ability to adjust our business to respond to competitive pressures and to obtain sufficient funds to satisfy our future growth, business needs and development plans.
On November 30, 2022, we as the borrower, and certain of our subsidiaries as guarantors (the “Guarantors”), entered into (i) a Financing Agreement (the “ABL Agreement”) with PNC Bank, N.A. (“PNC”), pursuant to which PNC provides the Company with a senior secured asset-based revolving credit facility in an aggregate principal amount of $50 million (including a $5 million sub-facility for letters of credit) (the “ABL Facility”) and (ii) a Financing Agreement (the “Term Loan Agreement”) with Blue Torch Capital LP (“BT”), pursuant to which BT agrees to provide the Company with senior secured term loans on the closing date in an aggregate principal amount of $55 million (the “Term Loan Facility”, with the Term Loan Agreement and the ABL Agreement being collectively referred to as the “Financing Agreements”).
The obligations under the Financing Agreements are guaranteed by the Guarantors and each Financing Agreement is secured by a split-lien on substantially all assets of the Company, with the ABL Agreement being secured by a first priority lien on all accounts receivable and other related assets of the Company and the Guarantors, and the Term Loan Agreement being secured by a first priority lien on all other assets of the Company and the Guarantors, including equity interests and intellectual property assets held by the Company and each Guarantor.
Our leveraged capital structure could have negative consequences, including, but not limited to, the following:
•our ability to maintain compliance with the financial covenants under the Financing Agreements is dependent upon our future operating performance and future financial condition, both of which are subject to various risks and uncertainties;
•we may be more vulnerable to economic downturns, less able to withstand competitive pressures, and less flexible in responding to changing business and economic conditions;
•our ability to obtain additional financing in the future for working capital, capital expenditures, acquisitions, general corporate or other purposes may be limited;
•a substantial portion of our cash flow from operations in the future may be required for the payment of the principal amount of our existing indebtedness when it becomes due; and
•in the event of a failure by us to meet our payment or other obligations with respect to one or both of the Financing Agreements, the lenders could, pursuant to applicable security agreements relating to the Financing Agreements, acquire our accounts receivable, intellectual property, equity interests and other assets, and our subsidiaries' assets that are serving as security for the ABL Facility and the Term Loan Facility, which could significantly impair our business operations.
Our ability to meet our payment obligations under our notes, as well as maintain compliance with financial covenants under the ABL Facility and the Term Loan Facility, depends on our ability to generate significant cash flow in the future. This, to some extent, is subject to general economic, financial, competitive, legislative, and regulatory factors as well as other factors that are beyond our control. There can be no assurance that our business will generate cash flow from operations, or that additional capital will be available to us, in an amount sufficient to enable us to meet our debt payment obligations and to fund other liquidity needs. If we are unable to generate sufficient cash flow to service our debt obligations, we may need to refinance or restructure our debt, reduce or delay capital investments, or seek to raise additional capital. If we were unable to implement one or more of these alternatives, we may be unable to meet our debt payment obligations, which could have a material adverse effect on our business, results of operations, or financial condition.
General Risks
Our business is subject to interruptions, delays or failures resulting from earthquakes, other natural catastrophic events or terrorism.
Our headquarters is located in Salt Lake City, Utah. Our current technology infrastructure is hosted across two data centers in co-location facilities in California and Virginia. In addition, we use industry-leading cloud providers to host our applications and services. Our services, operations and the data centers from which we provide our
services are vulnerable to damage or interruption from earthquakes, fires, floods, public health crises such as pandemics and epidemics, power losses, telecommunications failures, terrorist attacks, acts of war, human errors, break-ins and similar events (such as the COVID-19 pandemic). A significant natural disaster, such as an earthquake, fire or flood, could have a material adverse impact on our business, financial condition and results of operations, and our insurance coverage may be insufficient to compensate us for losses that may occur. In addition, global climate change could result in certain types of natural disasters occurring more frequently or with more intense effects. Acts of terrorism could cause disruptions to the Internet, our business or the economy as a whole. We may not have sufficient protection or recovery plans in certain circumstances, such as natural disasters affecting areas where data centers upon which we rely are located, and our business interruption insurance may be insufficient to compensate us for losses that may occur. Such disruptions could negatively impact our ability to run our platforms, which could harm our business.
Our ability to raise capital in the future may be limited, and our failure to raise capital when needed could prevent us from growing.
We may in the future be required to raise additional capital through public or private financing or other arrangements. Such financing may not be available on acceptable terms, or at all, and our failure to raise capital when needed could harm our business. Additional equity or equity-linked financing, may dilute the interests of our stockholders, and additional debt financing, if available, may involve restrictive covenants and could reduce our profitability. If we cannot raise funds on acceptable terms, we may not be able to grow our business. In addition, there various global risks, such as the uncertain state of the global economy and possible future impacts relating to the ongoing Russia-Ukraine military conflict in Ukraine, that could result in significant disruption to global financial markets, reducing our ability to access capital, which could negatively affect our liquidity in the future.
Item 1B. Unresolved Staff Comments.
None.
Item 2. Properties.
Our principal executive office is located in Salt Lake City, UT, totaling approximately 25,610 rentable square feet under lease expiring in May 2029. We have additional principal office space in Cincinnati, Ohio, totaling approximately 32,006 square feet under a lease arrangement expiring in June 2024. Given our shift to a more hybrid work-friendly environment, we exited occupancy of our leased office spaces in San Francisco, California and Santa Clara, California, and a portion of our leased office space in New York, New York. We maintain additional leased spaces in New York, New York, Bangalore, India, Paris, France, London, United Kingdom, and Tel Aviv, Israel. We believe our properties are generally suitable to meet our needs for the foreseeable future. In addition, to the extent we require additional space in the future, we believe that it would be readily available on commercially reasonable terms.
Item 3. Legal Proceedings.
We do not list all routine litigation matters with which we are a party. We discuss below certain pending matters. In determining whether to discuss a pending matter, we consider both quantitative and qualitative factors to assess materiality, such as, among others, the amount of damages alleged and the nature of other relief sought, if specified; our view of the merits of the claims and of the strength of our defenses; and whether the action purports to be, or is, a class action the jurisdiction in which the proceeding is pending.
Catalina Marketing Corp. v. Quotient Technology Inc. On February 24, 2021, Catalina Marketing Corporation filed a complaint in the Florida Circuit Court of the Sixth Judicial District against the Company asserting claims for unlawful and unfair trade practices; tortious interference with business relationship; and tortious interference with prospective business relationship. The complaint alleges that the Company engaged in predatory pricing practices and misleading communications with potential customers in connection with its in-lane coupon solution. The complaint seeks unspecified compensatory and punitive damages and injunctive relief. While it is not possible at this time to predict with any degree of certainty the ultimate outcome of this action, the Company believes that Catalina’s claims lack merit.
Result Marketing Group, Ltd. v. Southeastern Grocers et al. On June 17, 2021, Result Marketing Group, Ltd. (“RMG”) filed a complaint in the U.S. District Court for the Middle District of Florida, against Southeastern Grocers, LLC, Bio-Lo, LLC, Winn-Dixie Stores, Inc. (collectively, "SEG") and the Company, which complaint was amended by RMG on September 13, 2021 (the "First Amended Complain"). SEG and the Company (the "Defendants") filed motions to dismiss. Specifically, the Court dismissed counts IV (civil theft) and VII (unjust enrichment) of the First Amended Complaint without prejudice and denied the motions with respect to the other counts. On September 19, 2022, RMG filed its second amended complaint. In the second amended complaint, RMG dropped its civil theft claim and unjust enrichment claim against the Company. The second amended complaint alleges that (i) SEG breached its non-disclosure agreement with RMG by providing the Company with RMG's trade secrets, including the business concept of and "playbook" for a retail media hub; (ii) the Company and SEG misappropriated such trade secrets to develop the SEG Media Hub, and that the Company further misappropriated such trade secrets to develop its "retail performance media platform", which it sells to end users; and (iii) the Company interfered with RMG's contract and prospective business relationship with SEG. RMG contends that SEG defrauded it of no less than $59 million, and seeks compensatory and punitive damages, a constructive trust, and attorney's fees. On October 7, 2022, the Company answered the second amended complaint denying all claims alleged by RMG and asserting affirmative defenses. While it is not possible at this time to predict with any degree of certainty the ultimate outcome of this action, the Company believes that RMG’s claims lack merit.
Fortis Advisors LLC v. Quotient Technology, Inc. On August 20, 2021, Fortis Advisors LLC, as the SavingStar stockholder representative, ("Fortis") filed a complaint in the Delaware Court of Chancery alleging breach of contract, declaratory judgment, and in the alternative, breach of the implied covenant of good faith and fair dealing. The complaint alleges that the Company ceased to make generally available the SavingStar customer relationship management (CRM) business, which would trigger an earnout payment of $8.5 million under the terms of the Agreement and Plan of Merger, dated August 23, 2018, between Quotient Technology Inc. and SavingStar, Inc. While the Company continues to believe the allegations underlying Fortis's complaint lack merit, in June 2022 the parties, without admitting any liability, reached a settlement for an amount that did not have a material impact on the Company's future business, operating results, or financial condition.
Albertsons Companies, Inc. v. Quotient Technology, Inc. On November 16, 2021, the Company informed Albertsons Companies, Inc. (“Albertsons”) that, in light of Albertsons' failure to cure its material breach of the Services and Data Agreement ("the Agreement"), it was terminating the Agreement effective November 19, 2021. The Company offered to continue to provide certain services beyond the termination date for the benefit of its CPG customers. On November 19, 2021, Albertsons filed a complaint against the Company in the Superior Court of the State of California, County of Santa Clara alleging claims of breach of contract and breach of implied covenant of good faith and fair dealing. On November 22, 2021, consistent with the Company's offer in its November 16, 2021 termination letter, the parties entered into a stipulation, where the Company agreed to sell campaigns through December 15, 2021, and provide services and support for those campaigns through February 26, 2022 so long as Albertsons provided the necessary logistical steps to enable the Company to deliver the services and support. The Company also agreed to support the In-Lane Tool through December 10, 2021. On September 26, 2022, the Company filed its answer, denying all claims alleged by Albertsons, and filed a cross-complaint. In the cross complaint, the Company claimed that Albertsons failed to meet its obligations under the SOW, including its failure to make the In-Lane Tool commercially available in all required stores and its failure to support sales of In-Lane to CPGs. The Company further alleged that Albertsons breached the Agreement and SOW by terminating the Agreement and SOW early without cause and sought restitution for amounts paid and damages caused by Albertsons’ breaches. While the Company believes Albertsons' claims lacked merit and that the Company's claims were valid, the parties reached a settlement on December 8, 2022, and the Court entered an order dismissing the case on January 19, 2023. In connection with the settlement, the Company did not recognize any charges in the fourth quarter of 2022, nor does it expect to recognize charges in any future period.
Item 4. Mine Safety Disclosures.
None.
PART II
Item 5. Market for Registrant’s Common Equity, Related Stockholder Matters and Issuer Purchases of Equity Securities.
Market Information
Our common stock, $0.00001 par value, began trading on the New York Stock Exchange under the symbol “COUP” on March 7, 2014, the date of our IPO. We changed our name to Quotient Technology Inc. on October 20, 2015. Our common stock began trading on the New York Stock Exchange under the symbol “QUOT” on October 21, 2015.
Holders
As of March 10, 2023, there were 43 holders of record of our common stock. Because most of our shares of common stock are held by brokers and other institutions on behalf of stockholders, we are unable to estimate the total number of beneficial stockholders represented by these record holders.
Dividend Policy
We have never declared or paid any dividends on our common stock and do not anticipate that we will pay any dividends to holders of our common stock in the foreseeable future. Instead, we currently plan to retain any earnings to finance the growth of our business. Any future determination relating to dividend policy will be made at the discretion of our Board of Directors and will depend on our financial condition, results of operations and capital requirements as well as other factors deemed relevant by our Board of Directors.
Issuer Purchases of Equity Securities
In February 2021, the Company’s Board of Directors authorized a one-year share repurchase program ("February 2021 Program") for the Company to repurchase up to $50.0 million of its common stock from February 2021 through February 2022. Under the February 2021 Program, stock repurchases were permitted to be made from time to time in open market transactions or privately negotiated transactions, and the Company was permitted to use a plan intended to meet the requirements of SEC Rule 10b5-1 to enable stock repurchases to occur during periods when the trading window would otherwise be closed. Pursuant to the February 2021 Program, the Company was permitted to suspend, modify or terminate the February 2021 Program at any time without prior notice. During the year ended December 31, 2022, the Company did not repurchase any shares of its common stock, nor did the Company repurchase any of its common stock thereafter. The Company terminated the February 2021 Program prior to its expiration.
Performance Graph
The following shall not be deemed “filed” for purposes of Section 18 of the Exchange Act, or incorporated by reference into any of our other filings under the Exchange Act or the Securities Act, except to the extent we specifically incorporate it by reference into such filing.
This chart compares the cumulative total return on our common stock with that of the Russell 3000 and the S&P North American Technology Sector Index. The chart assumes $100 was invested at the close of market on December 31, 2017, in our common stock, the Russell 3000 and the S&P North American Technology Sector Index, and assumes the reinvestment of any dividends. The stock price performance on the following graph is not necessarily indicative of future stock price performance.
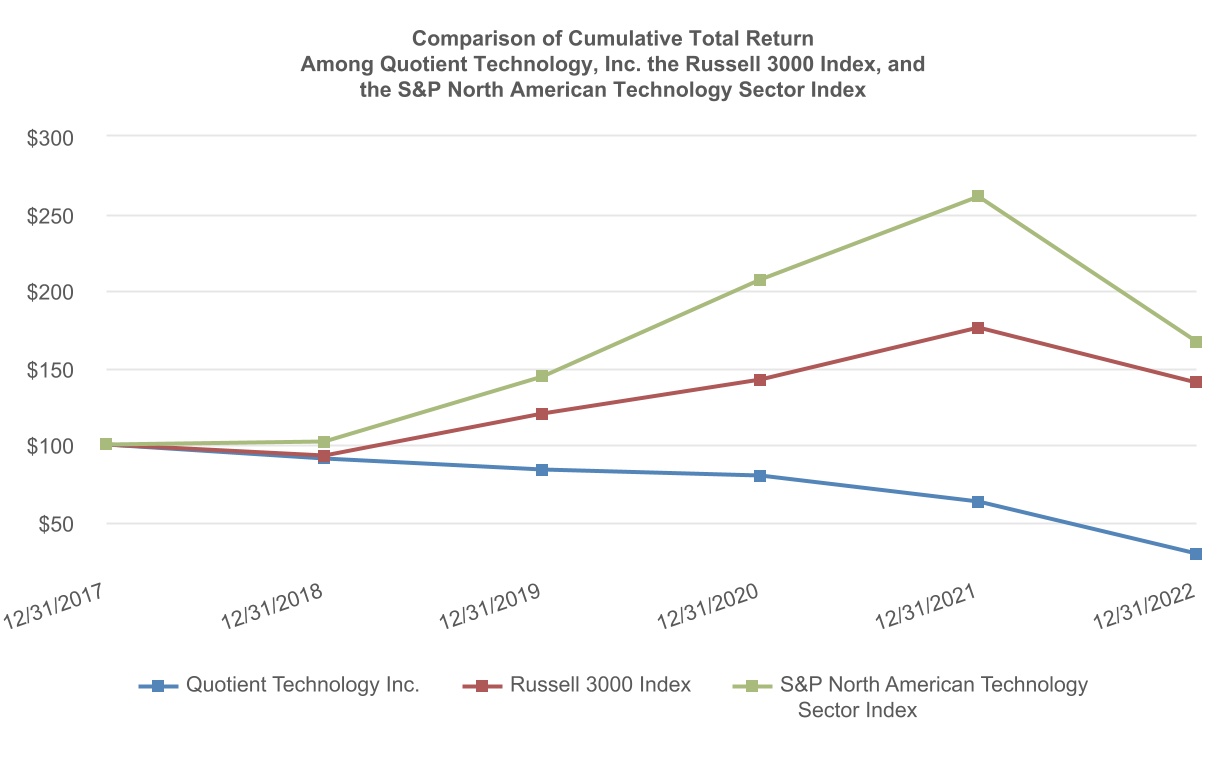
| | | | | | | | | | | | | | | | | | | | | | | | | | | | | | | | | | | | | | |
| | INDEXED RETURNS
Quarter Ending |
| Company / Index | | 12/31/2017 | | 12/31/2018 | | 12/31/2019 | | 12/31/2020 | | 12/31/2021 | | 12/31/2022 |
| Quotient Technology Inc. | | $ | 100 | | | $ | 91 | | | $ | 84 | | | $ | 80 | | | $ | 63 | | | $ | 29 | |
| Russell 3000 Index | | $ | 100 | | | $ | 93 | | | $ | 120 | | | $ | 142 | | | $ | 176 | | | $ | 140 | |
S&P North American
Technology Sector Index | | $ | 100 | | | $ | 102 | | | $ | 144 | | | $ | 207 | | | $ | 261 | | | $ | 167 | |
Unregistered Sales of Equity Securities
Not applicable.
Item 6. Reserved.
Item 7. Management’s Discussion and Analysis of Financial Condition and Results of Operations.
You should read the following discussion and analysis of our financial condition and results of operations in conjunction with the consolidated financial statements and the related notes to consolidated financial statements included elsewhere in this annual report on Form 10-K. In addition to historical financial information, the following discussion contains forward-looking statements that reflect our plans, estimates, beliefs and expectations that involve risks and uncertainties. Our actual results and the timing of events could differ materially from those discussed in these forward-looking statements. Factors that could cause or contribute to these differences include those discussed below and elsewhere in this prospectus, particularly in “Risk Factors” and “Special Note Regarding Forward-Looking Statements.”
Overview
Quotient Technology Inc. is an industry leading promotions and media technology company that delivers targeted digital promotions and media for advertisers and retailers to reach consumers and drive action. Using our platforms and suite of omnichannel solutions, advertisers can plan, target, deliver and measure performance marketing and brand marketing to impact sales. Our vision is to build the world's leading performance marketing
platform that programmatically delivers a variety of targeted digital marketing solutions which advertisers and retailers can purchase to drive measurable improvements in sales and customer loyalty.
Our customers consist primarily of consumer-packaged goods ("CPG") companies and their brand marketers (together referred to as "advertisers") who want to drive sales and positive brand engagement with shoppers. Our digital marketing platform is designed to produce returns on marketing investment for advertisers by utilizing consumer behavior and intent data and point of sale ("POS") data to deliver the right marketing message and call-to-action to the right consumer at the right time, through multiple touchpoints while consumers are engaged online, out of home and in-store. We partner with retailers, who primarily sell products through physical stores as well as through eCommerce properties. We are primarily focused on the US-based grocery retail market and the advertisers who sell products through that channel, and we are expanding our platform to verticals outside of the grocery retail space.
By partnering with Quotient, retailers can monetize their proprietary sales data and offer effective marketing opportunities for their brand partners to engage consumers across multiple touchpoints, including through their owned and operated properties as well as offsite media ad inventory, with the aim of achieving higher sales through their physical stores and eCommerce sites.
Over the last five years, we have grown our platform capabilities and our network of marketing channels to reach shoppers through a combination of in-house innovation, partnerships, and acquisitions. Our network includes the digital properties of our retail partners, non-retail publisher partners and CPG customers, social media platforms, digital-out-of-home ("DOOH") properties, and our consumer brand, Shopmium. This network provides Quotient with proprietary and licensed data, including retailers' POS shopper data, first-party consumer behavior and purchase intent data, and location intelligence. With such data powering our platforms, customers and partners use Quotient to leverage consumer insights, target and engage consumers via digital channels, and integrate marketing and merchandising programs to drive measurable sales results and consumer engagement.
Our network is made up of several different constituencies:
•Our advertiser customers consist of approximately 800 CPGs, representing over 2,100 brands, including some of the leading food, beverage, personal care and household product manufacturers;
•Our retail partners represent multiple classes of trade and verticals such as grocery retailers, drug, automotive, mass merchant, dollar, club, and convenience merchandise channels, where most CPGs' products are sold;
•Our publisher partners who invest heavily in online consumer engagement and who help us increase our network's reach to more US shoppers; and
•Millions of consumers who visit our owned websites, mobile properties and social channels, as well as those of our CPGs, retailer partners and other network partners.
Through these relationships, we believe we have created a network effect, which engages consumers and provides us a competitive advantage over both offline and online competitors. As our network expands and our consumer audience increases, we generate more consumer data and insights, which further improves our ability to deliver targeted and personalized promotions and media, and also strengthens our measurement and data insight solutions. We believe this will make our platforms more valuable to advertisers and retailers for their digital marketing campaigns. We expect that the increasing breadth of promotion and media content delivered through Quotient platforms from leading brands will enables us to attract and retain more retailers and consumers.
Advertisers and retailers use our technology platforms to help achieve their digital marketing objectives in four distinct ways:
•Plan, buy and execute integrated promotions and media campaigns to reach the right shoppers;
•Target advertising, promotions and messaging to shoppers to maximize impact;
•Sell advertising space and activate the shopper data that retailers collect through loyalty programs and digital transactions; and
•Measure the impact of advertisements, promotions or messages that have been planned, sold or placed with "closed loop" measurement, defined as the use of consumer data to help understand and evaluate how certain digital campaigns impact our advertiser customers' and retailer partners' sales.
We deliver targeted and/or personalized digital media and promotions to shoppers through our network using shopper data from our retail partners as well as proprietary data from our audience segments. Our solutions help our customers and partners optimize the performance of their digital marketing campaigns as they continue to shift more of their marketing from traditional to digital channels. Our platforms measure performance by attribution of digital campaigns to retail purchases in near real time, demonstrating return on spend for our customers and partners.
Our promotions products include digital rebates, load-to-card loyalty offers, and digital print and paperless coupons. Our media solutions include display, social, DOOH, Retailer.com display and sponsored search, shoppable event pages, and audience segments. A growing number of campaigns that our customers purchase are integrated campaigns, which combine a mix of digital promotions and/or media solutions within a single campaign. Revenue we earn from these programs is generally determined through a duration-based (also known as time-based) pricing model, or on a cost-per-click, cost-per-impression or cost-per-acquisition basis.
We generally pay a distribution fee, or revenue share, to retailers and publishers for activations or redemptions of a digital promotion, for media campaigns, and for use of data for targeting or measurement. We also pay a fee to third-party publishers for traffic acquisition, which consists of delivering campaigns on certain networks or properties. In cases where we control the digital promotion and media advertising inventory before it is transferred to our customers, these distribution, revenue share and third-party service fees are included in our cost of revenues. In cases where we do not control the digital promotion and media advertising inventory, we record revenues on a net basis, and the distribution, revenue-share and third-party service fees are deducted from gross revenues to arrive at net revenues.
We expect our operating expenses to decline in absolute dollars as we remove costs from the business. However, we also expect operating expenses to increase as a percentage of revenue as more of our future revenue is recognized on a net basis compared to the prior periods due to our business model changes. When revenues begin to grow again, we expect to increase spending to support that growth.
For 2022, 2021 and 2020, our revenues were $288.8 million, $521.5 million, and $445.9 million, respectively. Our net loss for 2022, 2021 and 2020 was $76.5 million, $45.6 million, and $65.4 million, respectively.
Seasonality
Some of the Company’s products experience seasonal sales and buying patterns mirroring those in the CPG, retail, advertising, and eCommerce markets, including back-to-school and holiday campaigns, where demand increases during the second half of the Company’s fiscal year. Seasonality may also be affected by CPG annual budget cycles, as some large CPGs have fiscal years ending in June. We believe that this seasonality pattern has affected, and will continue to affect, our business and the associated revenues during the first half and second half of our fiscal year. We recognized 49%, 54% and 59% of our annual revenue during the second half of 2022, 2021 and 2020, respectively. We believe the 2022 results were negatively impacted by the wind down of our relationship with a large partner and our shift to net revenue recognition, resulting in a lower percentage of revenues in the second half of the year than we have experienced in the past.
Impact of COVID-19
Although as of the end of 2022 the extent of restriction-lifting has been widespread, we remain cognizant of the ongoing COVID-19 pandemic and the continuing global implications including a potential worsening of the COVID-19 situation. We intend to continue to monitor the pandemic situation and may take further actions that alter our business operations as may be resumed by federal, state, local or foreign authorities, or that we determine are in the best interests of our employees, customers, partners and stockholders. In any event, if brands or retailers pause, delay, or cancel campaigns due to any COVID-19 related resumption of significant supply-chain disruption, or due to a further extension of the consumer purchasing behavior changes brought on by the onset of the COVID-19 pandemic, there may be an adverse impact on our promotion and media revenue, and, accordingly, the growth of our business. See Part I, Item 1A, Risk Factors, for an additional discussion of risks related to COVID-19.
Non-GAAP Financial Measure and Key Operating Metrics
Adjusted Earnings Before Interest, Taxes, Depreciation and Amortization (“Adjusted EBITDA”), a non-U.S. GAAP financial measure, is a key metric used by our management and our Board of Directors to understand and
evaluate our core operating performance and trends, to prepare and approve our annual budget, to develop short and long-term operational plans, and to determine bonus payouts. In particular, we believe that the exclusion of certain income and expenses in calculating Adjusted EBITDA can provide a useful measure for period-to-period comparisons of our core business. Additionally, Adjusted EBITDA is a key financial metric used by the compensation committee of our Board of Directors in connection with the determination of compensation for our executive officers. Accordingly, we believe that Adjusted EBITDA provides useful information to investors and others in understanding and evaluating our operating results in the same manner as for our management and Board of Directors.
Adjusted EBITDA excludes non-cash charges, such as depreciation, amortization and stock-based compensation, because such non-cash expenses in any specific period may not directly correlate to the underlying performance of our business operations and can vary significantly between periods. Additionally, it excludes the effects of interest expense; income taxes; other (income) expense, net; change in fair value contingent consideration; impairment of certain long-lived and right-of-use assets; litigation settlements; restructuring charges; shareholder activism response costs; certain business transformation and strategic growth initiatives costs; impairment of certain intangible assets; a loss contingency/settlement related to a contract dispute; and certain acquisition related costs. We exclude certain items because we believe that these costs (benefits) do not reflect expected future operating expenses. Additionally, certain items are inconsistent in amounts and frequency, making it difficult to contribute to a meaningful evaluation of our current or past operating performance.
Net loss and Adjusted EBITDA for each of the periods presented were as follows:
| | | | | | | | | | | | | | | | | |
| Year Ended December 31, |
| 2022 | | 2021 | | 2020 |
| (in thousands) |
| Net loss | $ | (76,511) | | | $ | (45,568) | | | $ | (65,381) | |
| Adjusted EBITDA | $ | 14,857 | | | $ | 41,551 | | | $ | 46,037 | |
Our use of Adjusted EBITDA has limitations as an analytical tool, and one should not consider it in isolation or as a substitute for analysis of our results as reported under U.S. GAAP. Some of these limitations are:
•although depreciation and amortization are non-cash charges, the assets being depreciated and amortized may have to be replaced in the future, and Adjusted EBITDA does not reflect cash capital expenditure requirements for such replacements or for new capital expenditure requirements;
•Adjusted EBITDA does not reflect changes in, or cash requirements for, our working capital needs;
•Adjusted EBITDA does not reflect interest and tax payments that may represent a reduction in cash available to us;
•Adjusted EBITDA also does not include the effects of stock-based compensation; depreciation; amortization of acquired intangible assets; change in fair value of contingent consideration; interest expense; other (income) expense, net; provision for income taxes; impairment of certain long-lived and right-of-use assets; litigation settlements; restructuring charges; shareholder activism response costs; certain business transformation and strategic growth initiatives costs; impairment of certain intangible assets; a loss contingency/settlement related to a contract dispute; and certain acquisition related costs; and
•other companies, including companies in our industry, may calculate Adjusted EBITDA differently, which reduces its usefulness as a comparative measure.
A reconciliation of Adjusted EBITDA to net loss, the most directly comparable U.S. GAAP financial measure, for each of the periods presented is set forth as follows:
| | | | | | | | | | | | | | | | | |
| Year Ended December 31, |
| 2022 | | 2021 | | 2020 |
| (in thousands) |
| Net loss | $ | (76,511) | | | $ | (45,568) | | | $ | (65,381) | |
| Adjustments: | | | | | |
| Stock-based compensation | 32,453 | | | 22,812 | | | 28,371 | |
| Depreciation and amortization | 17,929 | | | 29,464 | | | 36,352 | |
| Other (1) | 35,851 | | | 14,433 | | | 12,361 | |
Change in fair value of contingent
consideration | — | | | 1,392 | | | 20,234 | |
| Interest expense | 5,641 | | | 15,177 | | | 14,521 | |
| Other income (expense), net | (1,028) | | | 210 | | | (1,140) | |
| Provision for income taxes | 522 | | | 3,631 | | | 719 | |
| Total adjustments | $ | 91,368 | | | $ | 87,119 | | | $ | 111,418 | |
| | | | | |
| Adjusted EBITDA | $ | 14,857 | | | $ | 41,551 | | | $ | 46,037 | |
(1)For the year ended December 31, 2022, Other includes a charge of $11.4 million related to the impairment of certain long-lived and right-of-use assets; $9.3 million related to litigation settlements; $8.9 million related to restructuring charges; $4.9 million related to shareholder activism response costs, and $1.3 million related to certain business transformation and strategic growth initiatives costs which includes $1.0 million related to the launch and scaling of Shopmium in the U.S. to replace coupons.com as our direct-to-consumer offering. For the year ended December 31, 2021, Other includes a charge of $9.1 million related to the impairment of certain intangible assets due to the circumstances surrounding the termination of our partnership with Albertsons, restructuring charges of $2.7 million, acquisition related costs of $1.7 million and $0.9 million in adjusted shareholder activism response costs. For the year ended December 31, 2020, Other includes a $8.8 million loss contingency/settlement related to a contract dispute with Albertsons associated with a guaranteed distribution fee arrangement, acquisition related costs of $2.0 million and restructuring charges of $1.5 million. Restructuring charges primarily relate to severance for impacted employees. Acquisition related costs primarily include certain bonuses contingent upon the acquired company meeting certain financial metrics over the contingent consideration period, together with diligence, accounting, and legal expenses incurred related to certain acquisitions. Additionally, beginning Q1 2022, shareholder activism response costs were excluded from Adjusted EBITDA. Prior period results have been revised for comparability which impacted Adjusted EBITDA for the year ended December 31, 2021.
This non-GAAP financial measure is not intended to be considered in isolation from, as substitute for, or as superior to, the corresponding financial measure prepared in accordance with U.S. GAAP. Because of these and other limitations, Adjusted EBITDA should be considered along with U.S. GAAP-based financial performance measures, including various cash flow metrics, net loss, and our other U.S. GAAP financial results.
Trends in Our Industry
In our view, our near term growth will be driven by how well we take advantage of, or how we are impacted by, several major market trends in our industry:
Growth of Retail Media – Retail media presents an opportunity for retailers to generate high-margin ad revenue and monetize their first-party shopper data. The retail media industry is going through a significant transformation, with the frequent introduction of new ad networks, and with many retailers with established retail media strategies bringing their formerly outsourced businesses in-house. While this trend of in-housing has driven a change in our relationships with several retailer partners, presenting challenges for us in recent quarters, the increasingly fragmented landscape presents an opportunity for us to adapt our strategy and take advantage of what we believe has been a gap in the market for a central, transparent platform that aggregates individual retail media networks and simplifies campaign ad planning, buying, execution and measurement for CPGs across multiple retailers. We believe we are well-positioned to help retailers monetize their properties while reducing complexity for CPGs as we continue to see retail media grow.
While retail media is traditionally considered as advertising through retailer-owned media inventory and other digital media to drive sales, Quotient’s vision is that retail media becomes a more comprehensive performance marketing approach that leverages both media and promotions, with promotions being an effective marketing tool for incentivizing action.
Inflationary Environment and Supply Chain Constraints – We continue to be impacted by supply chain challenges and input cost pressures affecting our customers and retailer partners as a result of the macro inflationary environment. As a result, many CPG brands have been cautious with allocating promotions and media budgets to prevent overselling. This uncertainty has adversely affected the volume of offers on our network in recent quarters. However, we believe the inflationary environment may eventually become a favorable tailwind for our promotions business as consumers seek out savings at an increasing level, and as CPGs look to combat threats from challenger and private label brands to acquire market share through offering consumers value through lower price points.
Continuing Migration of Marketing Budgets from Offline to Digital – Marketing methods that traditionally have been executed offline are continuing to move to online digital marketing. Historically, the vast majority of CPG's budgets have been spent in offline channels, such as the Free Standing Insert ("FSI") found in newspapers, direct mail, printed circulars, in-store aisle tags, end caps and television. These traditional offline channels are becoming less effective as consumers spend more time online, particularly through mobile devices, and a feature of this trend is the rising importance of using data to drive personalized and targeted content to consumers. To reach consumers at the right time and place, CPGs are increasingly shifting media and promotion dollars that have been historically spent in offline channels to digital channels. The vast majority of US grocery purchases are still made in-person in physical grocery retail stores. However, the COVID-19 pandemic has significantly accelerated the shift to eCommerce for grocery and other retail transactions. This has led retailers and brands to adopt an omnichannel approach to consumer engagement and buying behaviors. As a result, advertisers are moving advertising budgets to online channels in order to influence more shoppers throughout their path to purchase.
As the shift to digital promotions and media continues to grow, so does the importance placed on the use of data to target audiences and measure campaign performance. As a greater portion of grocery sales have shifted from offline to online, retailers are focused on implementing omnichannel strategies and technology-related solutions to meet consumer demands, and to compete effectively and to drive sales. This omnichannel approach, which leverages combined data from offline and online sales, is resulting in an increased number of digital touchpoints for retailers and their CPGs to target shoppers with relevant promotions and digital marketing. As retailers add more omnichannel capabilities, brands increasingly are able to shift more marketing dollars to digital.
Factors Affecting Our Performance
In our view, several Company-specific factors will impact our revenue performance over the near term, including the following:
Ability to grow our network. The success and scale of our platforms and our ability to grow revenue will depend on our ability to grow our retailer and publisher network, expand our reach to engaged consumers, and drive volume of transactions on our platforms. If we do not add network partners or expand our relationship with existing network partners, or if network partners do not deliver active users to our platforms, our business and revenue growth will be negatively impacted.
Obtaining high quality promotions, increasing the number of brand-authorized activations, and capitalizing on new pricing/revenue models for promotions. Our ability to grow revenue will depend upon our ability to shift more dollars to our platforms from our brand customers, to continue to obtain high quality promotions, to increase the number of brand-authorized activations available through our platforms, and to capitalize on new pricing/revenue models for promotions, such as duration-based pricing. If we are unable to do any of these, growth in our revenue may be adversely affected.
Increasing revenue from advertisers on our platforms. Our ability to grow our revenue in the future depends upon our ability to continue to increase revenues from existing and new advertisers on our platforms through national brand promotions, targeted media and measurement, and increasing the number of brands that are using our platforms within each advertiser.
Variability in promotional and media spend by advertisers or brands. Our revenues may fluctuate due to changes in promotional or media spending budgets of advertisers as well as the timing of their promotional and media spending. Decisions by major advertisers, whether or not due to the ongoing impact of COVID-19 and related supply chain and inflation input-cost issues, to delay or reduce their promotional and media spending, move campaigns, or divert spending away from digital promotions or media, could slow our revenue growth or reduce our revenues.
Ability to retain and expand our relationships with retailers, obtain commitment and support for our platforms from retailers, and successfully renegotiate or amend retailer agreements. The success and scale of our platforms depend on our strategic relationships with retailers. The success and scale of our platforms also depends on the level of commitment and support for our platforms from retailers. Renewals or amendments of existing retailer relationships may become more challenging for us in light of our business model and pricing changes. These changes require restructuring our agreements and the way we operate with retailers and revenue arrangements for certain services. If we do not expand these relationships, if we do not renew or amend these relationships on as favorable terms as were in place immediately prior to renewal or amendment, if we lose significant retailers, or if we do not add new retailers to our platforms, our business will be negatively affected. In the near term, we expect the termination of our relationship with Albertsons, as well as retailers bringing retail media in-house, to continue to have a negative impact on our financial performance.
Innovation in our media and promotions offerings, expansion of our consumer reach and growth of our data analytics capabilities. Our ability to grow our revenue in the future will depend on our ability to (i) innovate and invest in promotion and media solutions, particularly with regard to automation and self-service offerings; and (ii) invest in solutions around our data and analytic capabilities, referred to as Quotient Analytics and Audiences, for advertisers and retailers.
International Growth and Acquisitions. Our ability to grow our revenues will also depend on our ability to grow our operations and offerings in existing international markets and expand our business through selective acquisitions, similar to our acquisitions of MLW Squared Inc. ("Ahalogy"), Crisp Media, Inc. ("Crisp"), Elevaate, SavingStar Inc. ("SavingStar"), Shopmium SAS ("Shopmium"), and Ubimo, and our ability to integrate such acquisitions with the core business of the Company.
Components of Our Results of Operations
Revenues
We primarily generate revenue by providing digital promotions and digital media solutions to our customers which consist of advertisers, retail partners and advertising agencies whereby we use our proprietary technology platforms to create, target, deliver and analyze these solutions.
Digital Promotions. Our digital promotions solutions include our national promotions offering which is non-retailer specific, and our shopper promotions offering which is retailer specific. Our digital promotions are generally sold on a cost-per-click basis or based on duration of the campaign (i.e., Duration-Based National Promotions Solution or Duration-Based Shopper Promotions Solution). For a cost-per-click offering, a click refers to the consumer’s action of activating a digital promotion through our proprietary technology platforms by either saving it to a retailer’s loyalty account for automatic digital redemption or printing it for physical redemption at a retailer. Beginning the first quarter of 2021, we introduced, our Duration-Based National Promotions Solution, and beginning the first quarter of 2022, we introduced our Duration-Based Shopper Promotions Solution. These duration-based offerings provide advertisers access to our proprietary technology platforms for a specific period of time (i.e., the campaign period) in exchange for a fixed fee. The campaign period in duration-based offerings is generally between seven and twenty-eight days.
The pricing of digital promotions solutions typically includes both promotion setup fees and digital promotion campaign fees. Promotion setup fees are related to the creation of digital promotions and set up of the underlying campaign on our proprietary technology platforms.
Through the third quarter of 2022, we had determined that promotion setup activities along with the related digital promotion campaigns, represented a single combined performance obligation because the customer could not benefit from the promotion setup services either on their own or with resources that were readily available to the customer. Accordingly, revenue related to cost-per-click agreements were typically recognized as clicks occurred and revenue related to duration-based campaigns, which provide the customer access to our proprietary technology platforms each day during the campaign period, were typically recognized ratably over the campaign period.
Beginning the fourth quarter of 2022, because of technological enhancements in our proprietary technology, customers and third parties can benefit from the promotion setup services with readily available resources. More specifically, our proprietary technology now support independent setup services that can be performed by customers or third parties. As a result, we have determined that our digital promotion offerings include multiple performance obligations, including the promotion setup services and related digital promotion campaigns. Beginning the fourth quarter of 2022, revenue from promotion setup services for both cost-per-click and duration-based campaigns are recognized as services are performed. Revenue from digital promotion campaigns is recognized as clicks occur for cost-per-click agreements, and ratably over the campaign period for duration-based campaigns.
Digital Media. Our digital media solutions are comprised of national media offerings, shopper media offerings, DOOH offerings and sponsored search offerings. Our media offerings enable advertisers and retailers to distribute digital media to promote their brands and products on our retailers' websites, and mobile applications, and through open exchange inventory sources that display our media offerings, including on websites, mobile applications, or digital screens. Pricing for media campaigns is usually determined on a cost-per-impression, cost-per-click or cost-per-acquisition basis. We recognize revenue each time a digital media is displayed or each time a user clicks on the media ad displayed on our websites, mobile applications or on third-party websites.
For our digital promotions and media solutions, we evaluate whether we are the principal (i.e. reports revenues on a gross basis) or agent (i.e. reports revenues on a net basis) in relation to the services provided. The conclusion may vary from contract to contract depending on the way we process and deliver promotions and media as well as the contractual responsibilities we undertake with retailers or partners.
Cost of Revenues
Cost of revenues includes some costs resulting from distribution fees or revenue share for arrangements in which we report revenue on a gross basis. If we deliver a digital promotion or media on a retailer’s website or mobile applications, or through its loyalty program, or through the website or mobile applications of a publisher, we generally pay a distribution fee or revenue share to the retailers or publisher which is included in our cost of
revenues. These costs are expensed as incurred. We generally do not pay a distribution fee for a coupon, rebate or code which is offered through the website of the advertiser or retailer that is offering the coupon, rebate or coupon code. From time to time, we have entered into arrangements pursuant to which we have agreed to the payment of minimum distribution or other service fees that are included in our cost of revenues.
Cost of revenues also includes personnel compensation costs; depreciation and amortization expense of equipment; software and acquired intangible assets associated with revenue producing technologies; amortization of certain exclusivity rights acquired under strategic partnerships; data center costs; third-party service fees including traffic acquisition costs which consists of payments related to delivering campaigns on certain networks; and purchase of third-party data. Personnel costs related to costs of revenues include salaries, bonuses, stock-based compensation and employee benefits. These costs are primarily attributable to individuals maintaining our data centers and members of our network operations group which initiates, sets up and delivers digital promotion and media campaigns. We capitalize costs related to software that is developed or obtained for internal use. Costs incurred in connection with internal software development for revenue-producing technologies are capitalized and are amortized in cost of revenues over the useful life of the internal-use software. The amortization of these costs begins when the internally developed software is ready for its intended use.
Operating Expenses
We classify our operating expenses primarily into three categories: sales and marketing, research and development, and general and administrative. Our operating expenses consist primarily of personnel compensation costs and, to a lesser extent, professional fees and facilities expense. Personnel costs for each category of operating expenses generally include salaries, bonuses, stock-based compensation, and employee benefits.
Sales and marketing. Our sales and marketing expenses consist primarily of personnel compensation costs (including salaries and benefits, sales commissions, and stock-based compensation) provided to our sales and marketing personnel. Sales and marketing expenses also include facility costs and other related overhead costs; marketing programs; amortization of acquired intangible assets; and travel costs. We expect to continue to invest in sales and marketing in order to support our growth and business objectives, while also continuing to optimize our investment in promotional and advertising activities.
Research and development. Our research and development expenses consist primarily of personnel compensation costs (including salaries and benefits, bonuses and stock-based compensation) provided to our engineering personnel; facility costs and other related overhead costs; overhead costs related to the development of new features and functionality of our technology; fees for design, testing and consulting activities; and other related services.
We believe that continued investment in technology, as well as business process and automation, is critical to attaining our strategic objectives, and we intend to balance our investment in research and development with our continued operational and cost optimization efforts. We intend to continue to expand our tools and products that will enable our business to scale and provide more offering to our customers.
General and administrative. Our general and administrative expenses consist primarily of personnel compensation costs (including salaries and benefits, bonuses and stock-based compensation) provided to our executives, finance, legal, human resource, and administrative personnel; facility costs and other related overhead costs; fees paid for professional services including legal, tax, accounting services; and other related expenses.
We intend to continue to balance our investment in corporate infrastructure with our continued operational and cost optimization efforts.
Change in fair value of contingent consideration. The change in fair value of contingent consideration is due to the re-measurement of contingent consideration liabilities resulting from acquisitions based on the expected achievement of certain financial metrics over each acquisition’s respective contingent consideration period.
Interest expense
Interest expense consists of cash coupon interest, accretion of debt discounts and issuance costs and primarily relates to our debt obligations under our convertible senior notes issued during the fourth quarter of 2017 and our term loan facility entered during the fourth quarter of 2022.
Other Income (Expense), Net
Other income (expense), net, includes interest income on U.S. Treasury Bills held as cash equivalents and foreign currency exchange gains and losses.
Provision for Income Taxes
We recorded a provision for income taxes of $0.5 million, $3.6 million, and $0.7 million for the years ended December 31, 2022, 2021 and 2020, respectively. The provision for income taxes for the year ended December 31, 2022 was primarily due to decreased earnings in foreign jurisdictions.
Results of Operations
The following tables set forth our consolidated results of operations and our consolidated results of operations as a percentage of revenues for the periods presented.
| | | | | | | | | | | | | | | | | | | | | | | | | | | | | | | | | | | |
| Year Ended December 31, |
| 2022 | | 2021 | | 2020 |
| (in thousands, except percentages) |
| Revenues | $ | 288,766 | | | 100.0 | % | | $ | 521,494 | | | 100.0 | % | | $ | 445,887 | | | 100.0 | % |
| Cost of revenues | 154,878 | | 53.6 | % | | 332,672 | | 63.8 | % | | 277,914 | | 62.3 | % |
| Gross profit | 133,888 | | | 46.4 | % | | 188,822 | | | 36.2 | % | | 167,973 | | | 37.7 | % |
| Operating expenses: | | | | | | | | | | | |
| Sales and marketing | 84,079 | | | 29.1 | % | | 112,263 | | | 21.5 | % | | 104,527 | | | 23.4 | % |
| Research and development | 26,299 | | | 9.1 | % | | 44,941 | | | 8.6 | % | | 40,316 | | | 9.0 | % |
| General and administrative | 94,886 | | | 32.9 | % | | 56,776 | | | 10.9 | % | | 54,177 | | | 12.2 | % |
Change in fair value of contingent
consideration | — | | | — | % | | 1,392 | | | 0.3 | % | | 20,234 | | | 4.5 | % |
| Total operating expenses | 205,264 | | | 71.1 | % | | 215,372 | | | 41.3 | % | | 219,254 | | | 49.2 | % |
| Loss from operations | (71,376) | | | (24.7) | % | | (26,550) | | | (5.1) | % | | (51,281) | | | (11.5) | % |
| Interest expense | (5,641) | | | (2.0) | % | | (15,177) | | | (2.9) | % | | (14,521) | | | (3.3) | % |
| Other income (expense), net | 1,028 | | | 0.4 | % | | (210) | | | — | % | | 1,140 | | | 0.3 | % |
| Loss before income taxes | (75,989) | | | (26.3) | % | | (41,937) | | | (8.0) | % | | (64,662) | | | (14.5) | % |
| Provision for income taxes | 522 | | | 0.2 | % | | 3,631 | | | 0.7 | % | | 719 | | | 0.2 | % |
| Net loss | $ | (76,511) | | | (26.5) | % | | $ | (45,568) | | | (8.7) | % | | $ | (65,381) | | | (14.7) | % |
Disaggregated Revenue
The following table presents the Company’s revenues disaggregated by type of services. The majority of the Company’s revenue is generated from sales within the United States.
| | | | | | | | | | | | | | | | | | | | | | | | | | | | | | | | | | | | | | | | | |
| | Year Ended December 31, | | 2021 to 2022 | | 2020 to 2021 |
| (in thousands, except percentages) | 2022 | | 2021 | | 2020 | | $ Change | | % Change | | $ Change | | % Change |
| Promotion | $ | 184,394 | | | $ | 252,831 | | | $ | 237,385 | | | $ | (68,437) | | | (27) | % | | $ | 15,446 | | | 7 | % |
| Media | 104,372 | | | 268,663 | | | 208,502 | | | (164,291) | | | (61) | % | | 60,161 | | | 29 | % |
| Total revenue | $ | 288,766 | | | $ | 521,494 | | | $ | 445,887 | | | $ | (232,728) | | | (45) | % | | $ | 75,607 | | | 17 | % |
Revenues
| | | | | | | | | | | | | | | | | | | | | | | | | | | | | | | | | | | | | | | | | |
| Year Ended December 31, | | 2021 to 2022 | | 2020 to 2021 |
| (in thousands, except percentages) | 2022 | | 2021 | | 2020 | | $ Change | | % Change | | $ Change | | % Change |
| Revenues | $ | 288,766 | | | $ | 521,494 | | | $ | 445,887 | | | $ | (232,728) | | | (45) | % | | $ | 75,607 | | | 17 | % |
Revenues decreased by $232.7 million, or 45%, during the year ended December 31, 2022, as compared to 2021 and include the recognition of $3.3 million of revenue previously deferred that should have been recognized in prior periods as the underlying performance obligations were satisfied in prior periods. The decrease in digital promotion revenues was primarily due to the termination of our partnership with Albertsons, and as a result of recognizing more revenue on a net basis due to business model changes. The decrease in media revenues was primarily due to the termination of our partnership with Albertsons; as a result of recognizing more revenue on a net basis due to business model changes; and due to certain retail partners bringing media services in-house, partially offset by an increase in media revenues of $7.0 million from the agreement with CupoNation GmbH, which includes the sale of our domain Coupons.com. During 2022, revenues from digital promotion and media campaigns were 64% and 36% of total revenues, respectively, as compared to 48% and 52% of total revenues, respectively, for 2021.
During 2022, promotion revenue was negatively impacted as we recognized a higher proportion of our revenue on a net basis. We expect promotion revenue during 2023 to increase as the market improves and we reposition ourselves to focus on growing the promotions business. We expect media revenue during 2023 to continue to be negatively impacted due to retail partners bringing media services in-house.
Cost of Revenues and Gross Profit
| | | | | | | | | | | | | | | | | | | | | | | | | | | | | | | | | | | | | | | | | |
| Year Ended December 31, | | 2021 to 2022 | | 2020 to 2021 |
| (in thousands, except percentages) | 2022 | | 2021 | | 2020 | | $ Change | | % Change | | $ Change | | % Change |
| Cost of revenues | $ | 154,878 | | | $ | 332,672 | | | $ | 277,914 | | | $ | (177,794) | | | (53) | % | | $ | 54,758 | | | 20 | % |
| Gross profit | $ | 133,888 | | | $ | 188,822 | | | $ | 167,973 | | | $ | (54,934) | | | (29) | % | | $ | 20,849 | | | 12 | % |
| Gross margin | 46 | % | | 36 | % | | 38 | % | | | | | | | | |
Cost of revenues for the year ended December 31, 2022 decreased by $177.8 million, or 53%, as compared to the same period in 2021. The decrease was primarily due to (i) a net decrease of $149.9 million in distribution fees paid to our partners for media and promotion revenues delivered through their platforms, associated with the decrease in revenues as discussed previously, as well as data and traffic acquisition costs for offsite media on non-owned-and-operated properties; (ii) a decrease in amortization expense of $11.5 million related to acquired intangible assets; (iii) the benefit of a non-recurring charges during the year ended December 31, 2021 of $9.1 million related to the impairment of certain intangible assets due to circumstances surrounding the termination of our partnership with Albertsons; (iv) a decrease in overhead expenses of $5.2 million related to facilities and infrastructure support; and (v) a decrease in compensation costs of $4.6 million, partially offset by a charge of $1.4 million related to the impairment of certain capitalized software assets, an increase in restructuring charges of $1.0 million, and an increase in certain business transformation and strategic growth initiatives costs of $0.1 million.
Gross margin for the year ended December 31, 2022 increased to 46% from 36%, as compared to the same period in 2021. The increase was primarily due to lower amortization expense related to acquired intangible assets and a higher proportion of revenue recognized net of certain costs.
We expect the cost of revenues during 2023 to continue to decline, in absolute dollars, as we expect a higher proportion of our revenue to be recognized on a net basis. We recognize revenue on a net basis for arrangements when we are act as an agent and do not control the service provided by the retailer or the price charged by the partner. CPGs and retailers are responsible for the determination of where a campaign is delivered and retailers are responsible for providing the underlying services.
Sales and Marketing
| | | | | | | | | | | | | | | | | | | | | | | | | | | | | | | | | | | | | | | | | |
| Year Ended December 31, | | 2021 to 2022 | | 2020 to 2021 |
| (in thousands, except percentages) | 2022 | | 2021 | | 2020 | | $ Change | | % Change | | $ Change | | % Change |
| Sales and marketing | $ | 84,079 | | | $ | 112,263 | | | $ | 104,527 | | | $ | (28,185) | | | (25) | % | | $ | 7,736 | | | 7 | % |
| Percent of revenues | 29 | % | | 22 | % | | 23 | % | | | | | | | | |
Sales and marketing expenses decreased by $28.2 million, or 25%, during the year ended December 31, 2022 as compared to the same period in 2021. The decrease was primarily the result of a decrease in
compensation costs of $19.3 million related to lower personnel costs in connection with our expense management efforts; and a decrease of $10.7 million in promotional, advertising and other costs; offset by an increase of $0.9 million in certain business transformation and strategic growth initiatives costs, and an increase in restructuring charges of $0.9 million.
We expect sales and marketing expenses to remain relatively flat, in absolute dollars, as we continue to invest in sales and marketing in order to support our growth and business objectives.
Research and Development
| | | | | | | | | | | | | | | | | | | | | | | | | | | | | | | | | | | | | | | | | |
| Year Ended December 31, | | 2021 to 2022 | | 2020 to 2021 |
| (in thousands, except percentages) | 2022 | | 2021 | | 2020 | | $ Change | | % Change | | $ Change | | % Change |
| Research and development | $ | 26,299 | | | $ | 44,941 | | | $ | 40,316 | | | $ | (18,642) | | | (41) | % | | $ | 4,625 | | | 11 | % |
| Percent of revenues | 9 | % | | 9 | % | | 9 | % | | | | | | | | |
Research and development expenses decreased by $18.6 million, or 41%, during the year ended December 31, 2022, as compared to the same period in 2021. The decrease was primarily due to an increase in capitalization of internal use software development costs of $10.3 million; a decrease in compensation of $8.3 million related to lower personnel costs in connection with our expense management efforts; and a decrease of $0.1 million in restructuring charges; partially offset by an increase in overhead expenses related to facilities and infrastructure support of $0.1 million.
During the year ended December 31, 2022, we capitalized internal use software development costs of $19.1 million, as compared to $12.0 million during the year ended December 31, 2021.
During 2022, we have been primarily focused on the development of new features and functionality of our technology which has increased our overall capitalization of internal use software development costs. The development includes focus on our technology for U.S. Shopmium and our Quotient Media, Rebates, and Promotion Platforms.
We believe that continued investment in technology is critical to attaining our strategic objectives, and we intend to balance our investment in research and development with our continued operational and cost optimization efforts. We expect research and development expenses to remain relatively flat, in absolute dollars, as we continue to expand our tools and products that will enable our business to scale and provide more offerings to our customers.
General and Administrative
| | | | | | | | | | | | | | | | | | | | | | | | | | | | | | | | | | | | | | | | | |
| Year Ended December 31, | | 2021 to 2022 | | 2020 to 2021 |
| (in thousands, except percentages) | 2022 | | 2021 | | 2020 | | $ Change | | % Change | | $ Change | | % Change |
| General and administrative | $ | 94,886 | | | $ | 56,776 | | | $ | 54,177 | | | $ | 38,111 | | | 67 | % | | $ | 2,599 | | | 5 | % |
| Percent of revenues | 33 | % | | 11 | % | | 12 | % | | | | | | | | |
General and administrative expenses increased by $38.1 million, or 67%, during the year ended December 31, 2022, as compared to the same period in 2021. The increase was primarily due to an increase in stock-based compensation costs of $12.0 million related to the stock option, RSU award and PSU award modifications for our former CEO in connection with his separation agreement; an impairment charge related to certain long-lived and right-of-use assets of $10.0 million due to the exit of occupancy of office spaces; an increase of $9.3 million related to litigation settlements; shareholder activism response costs of $4.0 million; an increase in restructuring charges of $4.2 million primarily related to severance for impacted employees; an increase in professional service fees of $0.7 million including higher legal fees due to litigation matters; an increase of $0.2 million related to certain business transformation and strategic growth initiatives costs; and an increase in compensation costs of $0.4 million; partially offset by a decrease in other administrative expenses of $1.0 million and a decrease in acquisition related costs of $1.7 million.
We expect general and administrative expenses, in absolute dollars, to decrease in future periods as we balance our investment in corporate infrastructure with our continued operational and cost optimization efforts.
Change in Fair Value of Contingent Consideration
| | | | | | | | | | | | | | | | | | | | | | | | | | | | | | | | | | | | | | | | | |
| Year Ended December 31, | | 2021 to 2022 | | 2020 to 2021 |
| (in thousands, except percentages) | 2022 | | 2021 | | 2020 | | $ Change | | % Change | | $ Change | | % Change |
| Change in fair value of contingent consideration | $ | — | | | $ | 1,392 | | | $ | 20,234 | | | $ | (1,392) | | | (100) | % | | $ | (18,842) | | | (93) | % |
During the year ended December 31, 2022, we did not record any charge related to the change in fair value of contingent consideration. As of December 31, 2021, Ubimo's contingent consideration period ended upon achieving certain financial metrics. During the first quarter of 2022, we paid $24.7 million and, as such, no liability existed as of December 31, 2022.
Interest Expense and Other Income (Expense), Net
| | | | | | | | | | | | | | | | | | | | | | | | | | | | | | | | | | | | | | | | | |
| Year Ended December 31, | | 2021 to 2022 | | 2020 to 2021 |
| (in thousands, except percentages) | 2022 | | 2021 | | 2020 | | $ Change | | % Change | | $ Change | | % Change |
| Interest expense | $ | (5,641) | | | $ | (15,177) | | | $ | (14,521) | | | $ | 9,536 | | | (63) | % | | $ | (656) | | | 5 | % |
| Other income (expense), net | 1,028 | | | (210) | | | 1,140 | | | 1,238 | | | (588) | % | | (1,350) | | | (118) | % |
| $ | (4,613) | | | $ | (15,387) | | | $ | (13,381) | | | $ | 10,774 | | | (70) | % | | $ | (2,006) | | | 15 | % |
Interest expense is primarily related to the convertible senior notes, promissory note, term loan facility and finance lease obligations. Interest expense for the year ended December 31, 2022 decreased by $9.5 million primarily due to the adoption of ASU 2020-06, under which guidance the Company no longer incurs interest expense related to the accretion of the debt discount associated with our convertible senior notes. Refer to Note 2 for further details related to the adoption of the new standard.
Other income (expense), net consists primarily of interest income on U.S. Treasury Bills held as cash equivalents and banking-related fees. The increase in other income (expense), net during the year ended December 31, 2022, as compared to the same period in 2021, was due to the effect of re-measuring balances in foreign currency due to exchange rate fluctuations.
Provision for Income Taxes
| | | | | | | | | | | | | | | | | | | | | | | | | | | | | | | | | | | | | | | | | |
| Year Ended December 31, | | 2021 to 2022 | | 2020 to 2021 |
| (in thousands, except percentages) | 2022 | | 2021 | | 2020 | | $ Change | | % Change | | $ Change | | % Change |
| Provision for income taxes | $ | 522 | | | $ | 3,631 | | | $ | 719 | | | $ | (3,109) | | | (86) | % | | $ | 2,912 | | | 405 | % |
The provision for income taxes of $0.5 million for the year ended December 31, 2022 was primarily due to decreased earnings in foreign jurisdictions.
Liquidity and Capital Resources
We have financed our operations and capital expenditures through cash flows from operations as well as from the proceeds from the issuance of convertible senior notes in 2017 and proceeds from the term loan facility in 2022. As of December 31, 2022, our principal source of liquidity was cash and cash equivalents of $56.9 million, which was held for working capital purposes. Our cash equivalents are comprised primarily of money market funds.
We have incurred and expect to continue to incur legal, accounting, regulatory compliance and other costs in future periods as we continue to invest in corporate infrastructure and in connection with litigation matters. As a result of legal matters settled previously, we expect to pay approximately $9.3 million, of which $7.0 million was paid during the fourth quarter of 2022.
We intend to continue to manage our operating expenses in line with our existing cash and available financial resources. In each of July and November 2022, we initiated a workforce reduction plan in connection with our
ongoing business transformation efforts. Under this plan, we eliminated approximately 7% and 9% of our regular, full-time, global workforce in July and November 2022, respectively.
Some of our agreements with retailers include an upfront payment for exclusive rights for the term of the agreement. These payments are generally recognized as an expense or as a contra-revenue item over the term of the exclusive right benefit.
In addition, some of our agreements with retailers include certain guaranteed distribution fees which, in some cases, may apply to multiple annual periods. If the adoption and usage of our platforms do not meet projections or minimums, these guaranteed distribution fees may not be recoverable and any shortfall, if applicable, may be payable by us at the end of the applicable period. We considered various factors in our assessment of whether these guaranteed distribution fees may not be recoverable, including our historical experience with the transaction volumes through the retailer and comparative retailers, ongoing communications with the retailer to increase its marketing efforts to promote our digital platforms, as well as projected revenue and associated revenue share payments.
In November 2017, we issued $200.0 million aggregate principal amount of 1.75% convertible senior notes due 2022 in a private placement to qualified institutional buyers pursuant to Rule 144A under the Securities Act of 1933, as amended, (the “notes”). The notes are unsecured obligations of the company and bear interest at a fixed rate of 1.75% per annum, payable semi-annually in arrears on June 1 and December 1 of each year, commencing on June 1, 2018. On December 1, 2022, we repaid the notes in full.
On November 30, 2022, we entered into a Financing Agreement (the "BT Financing Agreement") with Blue Torch Finance LLC. The BT Financing Agreement provides for an asset-backed term facility ("BT Term Loan Facility") in an aggregate principal amount of up to $55.0 million. We drew the entire $55.0 million aggregate commitment amount in November 2022. The proceeds of the loans made under the BT Financing Agreement are required to be used (i) to refinance the Convertible Senior Notes of the Borrower issued November 17, 2017 and (ii) to pay all fees, commissions and expenses related to the BT Financing Agreement. Amounts borrowed under the BT Term Loan Facility may be repaid prior to the maturity date. The BT Term Loan Facility matures and all outstanding amounts, if any, become due and payable on November 30, 2026.
On November 30, 2022, we entered into a Financing Agreement (the "PNC Financing Agreement") with PNC Bank, N.A., a national banking association. The PNC Financing Agreement provides for an asset-based revolving credit facility (“PNC Revolver Facility”) for available borrowings up to $50.0 million with the actual amount dependent on a “borrowing base” number consisting of the sum of various categories of eligible accounts receivables (the lesser of such number and $50.0 million, the “Line Cap”). The PNC Revolver Facility includes a letter of credit sub-facility in the aggregate availability of $5.0 million as a sublimit of the PNC Revolver Facility. Proceeds from the PNC Revolver Facility are to be used for general corporate purposes. Amounts borrowed under the PNC Revolver Facility may be repaid and, prior to the maturity date, reborrowed. The PNC Revolver Facility matures and all outstanding amounts, if any, become due and payable on September 1, 2026. During the year ended December 31, 2022, there were no borrowings or repayments under the PNC Revolver Facility.
We did not have any off-balance sheet arrangements as of December 31, 2022.
We believe our existing cash, cash equivalents, and cash flow from operations, and access to financing sources, will be sufficient to meet our existing and expected future working capital and capital expenditure needs for the next 12 months and beyond. To the extent that current and anticipated future sources of liquidity are insufficient to fund our future business activities and requirements, we may be required to seek additional equity or debt financing. During the period of uncertainty and volatility related to external factors such as global macroeconomic risk of slowdown or recession, we will continue to monitor our liquidity. See Part I, Item 1A, Risk Factors, for an additional discussion of risks related to these macroeconomic factors.
Our material cash requirements from known contractual and other obligations primarily relate to our purchase obligations, debt, and lease obligations. Expected timing of those payments are as follows (in thousands):
| | | | | | | | | | | | | | | | | |
| Total | | Next 12 Months | | Beyond 12 Months |
| Debt (1) | $ | 50,784 | | | $ | 2,750 | | | $ | 48,034 | |
| Operating leases (2) | 27,546 | | | 6,332 | | | 21,214 | |
| Purchase obligations (3) | 24,943 | | | 2,425 | | | 22,518 | |
| Total | $ | 103,273 | | | $ | 11,507 | | | $ | 91,766 | |
(1) Represents aggregate principal amount and estimated interest obligation of the term loan facility. See Note 9 Debt Obligations in the accompanying notes to our consolidated financial statements for further details.
(2) We have various lease office facilities, including our corporate headquarters in Salt Lake City, Utah, and various sales offices under operating lease agreements that expire on various dates through and including January 2031.
(3) We have an unconditional purchase commitment through 2034 in the amount of $5.0 million for marketing arrangements relating to the purchase of a 20-year suite license for a professional sports team which we use for sales and marketing purposes. We have unconditional purchase commitments, primarily related to distribution fees, ongoing software license fees and marketing services collectively totaling $19.9 million.
Cash Flows
The following table summarizes our cash flows for the periods presented (in thousands):
| | | | | | | | | | | | | | | | | |
| Year Ended December 31, |
| 2022 | | 2021 | | 2020 |
| Cash flows (used in) provided by operating activities | $ | (312) | | | $ | 26,010 | | | $ | 26,465 | |
| Cash flows used in investing activities | (19,608) | | | (14,720) | | | (11,369) | |
| Cash flows (used in) provided by financing activities | (160,973) | | | 3,309 | | | (17,174) | |
| Effects of exchange rates on cash | 367 | | | 66 | | | 66 | |
| Net (decrease) increase in cash and cash equivalents | $ | (180,526) | | | $ | 14,665 | | | $ | (2,012) | |
Operating Activities
Cash (used in) provided by operating activities is a result of our net income or loss for the period, adjusted for net non-cash income or expenses and changes in our operating assets and liabilities.
During 2022, net cash used in operating activities of $0.3 million reflected our net loss of $76.5 million, adjusted for net non-cash expenses of $68.9 million and cash used as a result of changes in working capital of $7.3 million. Non-cash expenses included depreciation and amortization; stock-based compensation; amortization of debt discount and issuance costs; allowance (recovery) for credit losses; deferred income taxes; change in fair value of contingent consideration; impairment of long-lived and right-of-use assets; impairment of certain intangible assets; and other non-cash expenses including amortization of right-of-use asset, amortization of deferred cost and loss on disposal of property and equipment. The primary use of cash from working capital items included a decrease in accounts payable and other liabilities of $33.7 million due to timing of services and payments including payment for a deferred cost related to a retailer agreement, a Ubimo contingent consideration payment of $19.0 million related to the changes in fair value over the contingent consideration period, a decrease in deferred revenues of $11.3 million due to reduced billings for campaigns, a decrease in accrued compensation and benefits of $8.3 million due to annual bonus payouts, and an increase in prepaid expenses and other assets of $1.2 million, partially offset by a decrease in accounts receivable of $80.8 million due to timing of invoicing and collections.
Investing Activities
Purchases of property and equipment may vary from period-to-period due to the timing of the expansion of our operations, the addition of headcount, and the development activities related to our future offerings. We expect to continue to invest in property and equipment, and in the further development and enhancement of our software platforms for the foreseeable future. In addition, from time to time, we may consider potential acquisitions that would complement our existing offerings, enhance our technical capabilities, or expand our marketing and sales presence. Any such future transaction could require potentially significant amounts of capital or could require us to issue our stock and dilute existing stockholders.
During 2022, net cash used in investing activities of $19.6 million reflected purchase of property and equipment, which includes capitalized software development costs, and technology hardware and software to support our growth.
Financing Activities
Our financing activities have consisted primarily of payments made for shares withheld to cover payroll withholding taxes and the issuance of shares of common stock upon the exercise of stock options. During 2022, drew on our term loan facility to repay our convertible senior notes in full.
During 2022, net cash used in financing activities of $161.0 million reflected $200.0 million in repayment of our convertible senior notes issued in 2017, $5.7 million in payments for Ubimo contingent consideration (initially measured and included as part of purchase consideration on the date of acquisition), payments made for shares withheld to cover the required payroll withholding taxes of $4.4 million, $2.6 million in debt issuance costs related to the asset-based revolving credit facility, and payments on promissory note and finance lease obligations of $0.4 million. These items were partially offset by $50.7 million proceeds from borrowing on the term loan facility, net of issuance costs and $1.4 million of proceeds received from issuance of common stock.
Critical Accounting Policies and Estimates
Our consolidated financial statements are prepared in accordance with U.S. GAAP. The preparation of these consolidated financial statements requires us to make estimates and assumptions that affect the reported amounts of assets, liabilities, revenues, expenses and related disclosures. We evaluate our estimates and assumptions on an ongoing basis. Our estimates are based on historical experience and various other assumptions that we believe to be reasonable under the circumstances. Our actual results could differ from these estimates.
We believe that the assumptions and estimates associated with revenue recognition and goodwill and intangible assets have the greatest potential impact on our consolidated financial statements. Therefore, we consider these to be our critical accounting policies and estimates. For further information on all of our significant accounting policies, see the notes to our consolidated financial statements.
Revenue Recognition
We primarily generate revenue by providing digital promotions and media and solutions to our customers which consist of advertisers, retail partners and advertising agencies whereby we use our proprietary technology platforms to create, target, deliver, and analyze these solutions. Revenues are recognized when control of the promised goods or services is transferred to our customers, and collectability of an amount that reflects the consideration we expect to be entitled to in exchange for those goods or services is probable.
In the normal course of business, we deliver digital promotions and media retailers’ websites and mobile applications through retailers’ loyalty programs, and on the websites of digital publishers. In these situations, we evaluate whether we are the principal (i.e., reports revenues on a gross basis) or agent (i.e., reports revenues on a net basis).
In the case of national promotions and media offerings, we have determined that we are the principal in these arrangements as we control the digital promotion and media advertising inventory before it is transferred to our customers. Our control is evidenced by our sole ability to monetize the digital coupon and media advertising inventory, being primarily responsible to our customers, having discretion in establishing pricing for the delivery of the digital coupons and media, or a combination of these. Under these arrangements, we report revenue on a gross basis, that is, the amounts billed to our customers are recorded as revenues, and distribution fees paid to retailers or digital publishers are recorded as cost of revenues.
With regards to non-duration based shopper promotions and media campaign offerings, we have determined that we are an agent in these arrangements as we do not control these shopper promotions and media programs or set the pricing. Our obligation in these arrangements is to provide use of our proprietary technology platforms to the customers. The retailer determines how shopper promotions and media programs are executed through our proprietary technology platforms. Under these arrangements, we report revenue on a net basis, that is, the costs for digital advertising inventory are deducted from gross revenues to arrive at net revenues.
With regards to duration-based shopper promotions, we have determined that we are the principal because we have discretion in establishing pricing for the delivery of the digital coupons. Under these arrangements, we report revenue on a gross basis.
In the case of DOOH and sponsored search, we have determined that we are typically an agent in these arrangements because we generally do not have control of the digital advertising inventory before it is transferred to the customer and do not set prices. Our obligation is to provide the use of our proprietary technology platforms that enables customers to bid on real-time digital advertising inventory, use of data and other add-on features in designing and executing our campaigns. We charge our customers a platform fee based on a percentage of the price paid by the purchaser of the related digital advertising inventory. Accordingly, we generally report revenue on a net basis for the platform fees charged to customers.
Goodwill
Goodwill
Goodwill is tested for impairment at least annually, and more frequently upon the occurrence of certain events that may indicate that the carrying value of goodwill may not be recoverable. Events or circumstances that could trigger an impairment test include, but are not limited to, a significant adverse change in the business climate or in legal factors; an adverse action or assessment by a regulator; a loss of key personnel; significant changes in our use of the acquired assets or the strategy for our overall business; significant negative industry or economic trends; significant underperformance relative to operating performance indicators; downward revisions to internal forecasts; a significant decline in market capitalization; and significant changes in competition. We operate in a single reporting unit, and we typically complete our annual impairment test during the fourth quarter of each year.
In the third quarter of 2022, we determined that a goodwill triggering event had occurred. We performed a quantitative assessment to evaluate goodwill. In performing our quantitative impairment assessment, we estimated the fair value of our reporting unit using the income approach and market approach. The income approach uses projected operating results and cash flows that are discounted using a market-participant discount rate based on a weighted-average cost of capital. The financial projections reflect management's best estimate of economic and market conditions over the projected period including forecasted revenue growth rate, earnings before interest, taxes, depreciation and amortization ("EBITDA") margin, tax rate, capital expenditures, depreciation and amortization and changes to working capital requirements. The market approach estimates fair value by using comparable industry multiples, such as multiples of revenue and EBITDA.
The key assumptions used in the discounted cash flow model included forecasted growth rate, forecasted EBITDA margins and discount rate. The interim test resulted in our determination that the fair value of its reporting unit exceeded its carrying value and therefore, its goodwill was not impaired.
In the fourth quarter of 2022, we performed an annual impairment test and based on the results of our assessment, we determined that the fair value of the reporting unit exceeded our carrying value and therefore, our goodwill was not impaired. There were no changes in the carrying value of goodwill and as of December 31, 2022 and 2021, goodwill was $128.4 million. There was no impairment of goodwill for the years ended December 31, 2022, 2021 and 2020. We will continue to monitor the operating results, cash forecasts and challenges from declines in current business and market conditions, as well as impacts of COVID-19 for possible future goodwill impairments to our reporting unit.
Recently Issued Accounting Pronouncements
See Part II, Item 8, Consolidated Financial Statements and Supplementary Data, and Note 2, Summary of Significant Accounting Policies, of the Notes to Consolidated Financial Statements for a full description of recent accounting pronouncements, including the actual and expected dates of adoption and estimated effects on our consolidated results of operations and financial condition, which is incorporated herein by reference.
Item 7A. Quantitative and Qualitative Disclosures About Market Risk.
We have operations both within the United States and internationally, and we are exposed to market risks in the ordinary course of our business. These risks include primarily interest rate risk, foreign exchange risks and inflation risk. We do not hold or issue financial instruments for trading purposes.
Interest Rate Fluctuation Risk
Our cash and cash equivalents consist of cash, money market funds, and U.S. Treasury Bills. Our borrowings under finance lease obligations are generally at fixed interest rates.
The primary objective of our investment activities is to preserve principal, while also maximizing income without significantly increasing risk. Because our cash and cash equivalents have a relatively short maturity, our portfolio’s fair value is relatively insensitive to interest rate changes. We do not believe that an increase or decrease in interest rates of 100 basis points would have a material effect on our operating results or financial condition. In future periods, we will continue to evaluate our investment policy in order to ensure that we continue to meet our overall objectives.
Market Risk and Market Interest Risk
In November 2017, we issued $200.0 million aggregate principal amount of 1.75% convertible senior notes due 2022. The fair value of our convertible senior notes is subject to interest rate risk, market risk and other factors due to the convertible feature. The fair value of the convertible senior notes will generally increase as our common stock price increases and will generally decrease as our common stock price declines in value. The interest and market value changes affect the fair value of our convertible senior notes, but those factors do not impact our financial position, cash flows or results of operations due to the fixed nature of the debt obligation. On December 1, 2022, we repaid our convertible senior notes in full.
Foreign Currency Exchange Risk
We have limited foreign currency risks related to our revenues and operating expenses denominated in currencies other than the U.S. dollar, the foreign currencies being principally the British Pound Sterling and the Euro. The volatility of exchange rates depends on many factors that we cannot forecast with reliable accuracy. Although we have experienced and will continue to experience fluctuations in (i) our net income (loss) as a result of transaction gains (losses) related to revaluing certain cash balances, and (ii) trade accounts receivable balances and intercompany balances that are denominated in currencies other than the U.S. dollar, we believe such fluctuations will not have a material impact on our results of operations. In the event our foreign sales and expenses increase, our operating results may be more greatly affected by fluctuations in the exchange rates of the currencies in which we do business. Although we may in the future, at this time we do not enter into derivatives or other financial instruments in an attempt to hedge our foreign currency exchange risk. It is difficult to predict the impact hedging activities would have on our results of operations.
Item 8. Financial Statements and Supplementary Data.
Financial Statements
INDEX TO CONSOLIDATED FINANCIAL STATEMENTS
| | | | | | | | |
| | |
| | | |
| Consolidated Financial Statements: | | |
| | | |
| | |
| | | |
| | |
| | | |
| | |
| | | |
| | |
| | | |
| | |
| | | |
| | |
Report of Independent Registered Public Accounting Firm
To the Stockholders and the Board of Directors of Quotient Technology Inc.
Opinion on the Financial Statements
We have audited the accompanying consolidated balance sheets of Quotient Technology Inc.(the Company) as of December 31, 2022 and 2021, the related consolidated statements of operations, comprehensive loss, stockholders' equity and cash flows for each of the three years in the period ended December 31, 2022, and the related notes (collectively referred to as the "consolidated financial statements"). In our opinion, the consolidated financial statements present fairly, in all material respects, the financial position of the Company at December 31, 2022 and 2021, and the results of its operations and its cash flows for each of the three years in the period ended December 31, 2022, in conformity with U.S. generally accepted accounting principles.
We also have audited, in accordance with the standards of the Public Company Accounting Oversight Board (United States) (PCAOB), the Company's internal control over financial reporting as of December 31, 2022, based on criteria established in Internal Control-Integrated Framework issued by the Committee of Sponsoring Organizations of the Treadway Commission (2013 framework), and our report dated March 16, 2023 expressed an unqualified opinion thereon.
Basis for Opinion
These financial statements are the responsibility of the Company's management. Our responsibility is to express an opinion on the Company's financial statements based on our audits. We are a public accounting firm registered with the PCAOB and are required to be independent with respect to the Company in accordance with the U.S. federal securities laws and the applicable rules and regulations of the Securities and Exchange Commission and the PCAOB.
We conducted our audits in accordance with the standards of the PCAOB. Those standards require that we plan and perform the audit to obtain reasonable assurance about whether the financial statements are free of material misstatement, whether due to error or fraud. Our audits included performing procedures to assess the risks of material misstatement of the financial statements, whether due to error or fraud, and performing procedures that respond to those risks. Such procedures included examining, on a test basis, evidence regarding the amounts and disclosures in the financial statements. Our audits also included evaluating the accounting principles used and significant estimates made by management, as well as evaluating the overall presentation of the financial statements. We believe that our audits provide a reasonable basis for our opinion.
Critical Audit Matter
The critical audit matter communicated below is a matter arising from the current period audit of the financial statements that was communicated or required to be communicated to the audit committee and that: (1) relates to accounts or disclosures that are material to the financial statements and (2) involved our especially challenging, subjective or complex judgments. The communication of the critical audit matter does not alter in any way our opinion on the consolidated financial statements, taken as a whole, and we are not, by communicating the critical audit matter below, providing a separate opinion on the critical audit matter or on the accounts or disclosures to which it relates.
| | | | | |
| | Revenue Recognition-Principal versus Agent |
| Description of the Matter | As described in Note 2 to the consolidated financial statements, the Company provides digital promotions and media solutions to its customers which consist of advertisers, retail partners and advertising agencies. The Company applies judgement in determining who represents the customer, in the identification of the performance obligations and whether the Company is the principal (i.e., report revenues on a gross basis) or agent (i.e., report revenues on a net basis) with respect to each identified performance obligation. Auditing the Company’s contracts with customers was challenging and involved auditor judgement to analyze the Company’s various services and contract agreements and assessing the Company’s role as principal or agent. |
| How We Addressed the Matter in Our Audit | We obtained an understanding, evaluated the design, and tested the operating effectiveness of internal controls over the Company’s accounting for revenue from contracts with customers. For example, we tested controls over management’s review of customer contracts, including the determination of the customer which in certain agreements is the retail partner and in other agreements is the advertiser, the identification of specified performance obligations and whether the Company reports revenue on gross or net basis of cost associated with placing promotions or media on third party owned web properties. To test the Company’s accounting for revenue from contracts with customers, we performed substantive audit procedures that included, among others, testing a sample of customer contracts, and evaluated management’s determination of who represents the customer, the identification of specified performance obligations and the principal versus agent considerations and conclusions. We also assessed the adequacy of the Company’s disclosures in respect to the accounting policies on revenue recognition. |
/s/ Ernst & Young LLP
We have served as the Company’s auditor since 2009.
San Jose, California
March 16, 2023
Report of Independent Registered Public Accounting Firm
To the Stockholders and the Board of Directors of Quotient Technology Inc.
Opinion on Internal Control Over Financial Reporting
We have audited Quotient Technology Inc.’s internal control over financial reporting as of December 31, 2022, based on criteria established in Internal Control—Integrated Framework issued by the Committee of Sponsoring Organizations of the Treadway Commission (2013 framework), (the COSO criteria). In our opinion, Quotient Technology Inc. (the Company) maintained, in all material respects, effective internal control over financial reporting as of December 31, 2022, based on the COSO criteria.
We also have audited, in accordance with the standards of the Public Company Accounting Oversight Board (United States) (PCAOB), the consolidated balance sheets of the Company as of December 31, 2022 and 2021, the related consolidated statements of operations, comprehensive loss, stockholders’ equity and cash flows for each of the three years in the period ended December 31, 2022, and the related notes and our report dated March 16, 2023 expressed an unqualified opinion thereon.
Basis for Opinion
The Company’s management is responsible for maintaining effective internal control over financial reporting and for its assessment of the effectiveness of internal control over financial reporting included in the accompanying Management’s Annual Report on Internal Control Over Financial Reporting. Our responsibility is to express an opinion on the Company’s internal control over financial reporting based on our audit. We are a public accounting firm registered with the PCAOB and are required to be independent with respect to the Company in accordance with the U.S. federal securities laws and the applicable rules and regulations of the Securities and Exchange Commission and the PCAOB.
We conducted our audit in accordance with the standards of the PCAOB. Those standards require that we plan and perform the audit to obtain reasonable assurance about whether effective internal control over financial reporting was maintained in all material respects.
Our audit included obtaining an understanding of internal control over financial reporting, assessing the risk that a material weakness exists, testing and evaluating the design and operating effectiveness of internal control based on the assessed risk, and performing such other procedures as we considered necessary in the circumstances. We believe that our audit provides a reasonable basis for our opinion.
Definition and Limitations of Internal Control Over Financial Reporting
A company’s internal control over financial reporting is a process designed to provide reasonable assurance regarding the reliability of financial reporting and the preparation of financial statements for external purposes in accordance with generally accepted accounting principles. A company’s internal control over financial reporting includes those policies and procedures that (1) pertain to the maintenance of records that, in reasonable detail, accurately and fairly reflect the transactions and dispositions of the assets of the company; (2) provide reasonable assurance that transactions are recorded as necessary to permit preparation of financial statements in accordance with generally accepted accounting principles, and that receipts and expenditures of the company are being made only in accordance with authorizations of management and directors of the company; and (3) provide reasonable assurance regarding prevention or timely detection of unauthorized acquisition, use, or disposition of the company’s assets that could have a material effect on the financial statements.
Because of its inherent limitations, internal control over financial reporting may not prevent or detect misstatements. Also, projections of any evaluation of effectiveness to future periods are subject to the risk that controls may become inadequate because of changes in conditions, or that the degree of compliance with the policies or procedures may deteriorate.
/s/ Ernst & Young LLP
San Jose, California
March 16, 2023
QUOTIENT TECHNOLOGY INC.
CONSOLIDATED BALANCE SHEETS
(in thousands, except share and per share data)
| | | | | | | | | | | |
| | December 31, |
| | 2022 | | 2021 |
| Assets | | | |
| Current assets: | | | |
| Cash and cash equivalents | $ | 56,891 | | | $ | 237,417 | |
Accounts receivable, net of allowance for credit losses of $706 and $2,500 at December 31, 2022 and 2021, respectively | 98,049 | | | 177,216 | |
| Prepaid expenses and other current assets | 19,791 | | | 19,312 | |
| Total current assets | 174,731 | | | 433,945 | |
| Property and equipment, net | 28,773 | | | 22,660 | |
| Operating lease right-of-use assets | 14,475 | | | 23,874 | |
| Intangible assets, net | 4,494 | | | 13,003 | |
| Goodwill | 128,427 | | | 128,427 | |
| Other assets | 12,259 | | | 13,571 | |
| Total assets | $ | 363,159 | | | $ | 635,480 | |
| Liabilities and Stockholders’ Equity | | | |
| Current liabilities: | | | |
| Accounts payable | $ | 30,027 | | | $ | 18,021 | |
| Accrued compensation and benefits | 12,060 | | | 20,223 | |
| Other current liabilities | 53,255 | | | 95,279 | |
| Deferred revenues | 15,519 | | | 26,778 | |
| Contingent consideration related to acquisitions | — | | | 22,275 | |
| Short-term debt | 2,750 | | | — | |
| Convertible senior notes, net | — | | | 188,786 | |
| Total current liabilities | 113,611 | | | 371,362 | |
| Operating lease liabilities | 21,221 | | | 26,903 | |
| Other non-current liabilities | 468 | | | 522 | |
| Long-term debt | 48,034 | | | — | |
| Deferred tax liabilities | 2,030 | | | 1,991 | |
| Total liabilities | 185,364 | | | 400,778 | |
| Commitments and contingencies (Note 15) | — | | | — | |
| Stockholders’ equity: | | | |
Preferred stock, $0.00001 par value—10,000,000 shares authorized; 250,000 shares designated as Series A Junior Participating Preferred Stock; and no shares issued or outstanding at December 31, 2022 and 2021 | — | | | — | |
Common stock, $0.00001 par value—250,000,000 shares authorized; 97,149,665 and 94,779,442 shares issued and outstanding at December 31, 2022 and 2021, respectively | 1 | | | 1 | |
| Additional paid-in capital | 713,201 | | | 731,672 | |
| Accumulated other comprehensive loss | (1,756) | | | (1,099) | |
| Accumulated deficit | (533,651) | | | (495,872) | |
| Total stockholders’ equity | 177,795 | | | 234,702 | |
| Total liabilities and stockholders’ equity | $ | 363,159 | | | $ | 635,480 | |
See Accompanying Notes to Consolidated Financial Statements
QUOTIENT TECHNOLOGY INC.
CONSOLIDATED STATEMENTS OF OPERATIONS
(in thousands, except per share data)
| | | | | | | | | | | | | | | | | |
| | Year Ended December 31, |
| | 2022 | | 2021 | | 2020 |
| Revenues | $ | 288,766 | | | $ | 521,494 | | | $ | 445,887 | |
| Cost of revenues | 154,878 | | | 332,672 | | | 277,914 | |
| Gross profit | 133,888 | | | 188,822 | | | 167,973 | |
| Operating expenses: | | | | | |
| Sales and marketing | 84,079 | | | 112,263 | | | 104,527 | |
| Research and development | 26,299 | | | 44,941 | | | 40,316 | |
| General and administrative | 94,886 | | | 56,776 | | | 54,177 | |
| Change in fair value of contingent consideration | — | | | 1,392 | | | 20,234 | |
| Total operating expenses | 205,264 | | | 215,372 | | | 219,254 | |
| Loss from operations | (71,376) | | | (26,550) | | | (51,281) | |
| Interest expense | (5,641) | | | (15,177) | | | (14,521) | |
| Other income (expense), net | 1,028 | | | (210) | | | 1,140 | |
| Loss before income taxes | (75,989) | | | (41,937) | | | (64,662) | |
| Provision for income taxes | 522 | | | 3,631 | | | 719 | |
| Net loss | $ | (76,511) | | | $ | (45,568) | | | $ | (65,381) | |
| | | | | |
| Net loss per share, basic and diluted | $ | (0.80) | | | $ | (0.49) | | | $ | (0.72) | |
Weighted-average number of common shares used in computing
net loss per share, basic and diluted | 95,869 | | | 93,686 | | | 90,412 | |
See Accompanying Notes to Consolidated Financial Statements
QUOTIENT TECHNOLOGY INC.
CONSOLIDATED STATEMENTS OF COMPREHENSIVE LOSS
(in thousands)
| | | | | | | | | | | | | | | | | |
| | Year Ended December 31, |
| | 2022 | | 2021 | | 2020 |
| Net loss | $ | (76,511) | | | $ | (45,568) | | | $ | (65,381) | |
| Other comprehensive income (loss): | | | | | |
| Foreign currency translation adjustments | (657) | | | (98) | | | (85) | |
| Comprehensive loss | $ | (77,168) | | | $ | (45,666) | | | $ | (65,466) | |
See Accompanying Notes to Consolidated Financial Statements
QUOTIENT TECHNOLOGY INC.
CONSOLIDATED STATEMENTS OF STOCKHOLDERS’ EQUITY
(in thousands, except share data)
| | | | | | | | | | | | | | | | | | | | | | | | | | | | | | | | | | | |
| | Common Stock | | Additional Paid-In Capital | | | | Accumulated Deficit | | Total Stockholders' Equity |
| | Shares | | Amount | | | Accumulated Other Comprehensive Loss | | |
| Balance as of December 31, 2019 | 89,371,199 | | | $ | 1 | | | $ | 671,060 | | | $ | (916) | | | $ | (384,923) | | | $ | 285,222 | |
| Exercise of employee stock options | 331,007 | | | — | | | 2,714 | | | — | | | — | | | 2,714 | |
| Vesting of restricted stock units | 2,293,593 | | | — | | | — | | | — | | | — | | | — | |
| Issuance of common stock for services provided | 117,210 | | | — | | | 689 | | | — | | | — | | | 689 | |
| Issuance of common stock, stock purchase plan | 474,178 | | | — | | | 2,289 | | | — | | | — | | | 2,289 | |
| Payments for taxes related to net share settlement of equity awards | (843,885) | | | — | | | (7,203) | | | — | | | — | | | (7,203) | |
| Stock-based compensation | — | | | — | | | 28,784 | | | — | | | — | | | 28,784 | |
| Other comprehensive loss | — | | | — | | | — | | | (85) | | | — | | | (85) | |
| Net loss | — | | | — | | | — | | | — | | | (65,381) | | | (65,381) | |
| Balance as of December 31, 2020 | 91,743,302 | | | $ | 1 | | | $ | 698,333 | | | $ | (1,001) | | | $ | (450,304) | | | $ | 247,029 | |
| Exercise of employee stock options | 1,245,453 | | | — | | | 13,199 | | | — | | | — | | | 13,199 | |
| Vesting of restricted stock units | 1,904,217 | | | — | | | — | | | — | | | — | | | — | |
| Issuance of common stock for services provided | 35,535 | | | — | | | 223 | | | — | | | — | | | 223 | |
| Issuance of common stock, stock purchase plan | 477,283 | | | — | | | 3,020 | | | — | | | — | | | 3,020 | |
| Payments for taxes related to net share settlement of equity awards | (626,348) | | | — | | | (6,333) | | | — | | | — | | | (6,333) | |
| Stock-based compensation | — | | | — | | | 23,230 | | | — | | | — | | | 23,230 | |
| Other comprehensive loss | — | | | — | | | — | | | (98) | | | — | | | (98) | |
| Net loss | — | | | — | | | — | | | — | | | (45,568) | | | (45,568) | |
| Balance as of December 31, 2021 | 94,779,442 | | | $ | 1 | | | $ | 731,672 | | | $ | (1,099) | | | $ | (495,872) | | | $ | 234,702 | |
| Vesting of restricted stock units | 3,146,095 | | | — | | | — | | | — | | | — | | | — | |
| Issuance of common stock, stock purchase plan | 429,273 | | | — | | | 1,375 | | | — | | | — | | | 1,375 | |
| Cumulative-effect adjustment due to adoption of ASU 2020-06 | — | | | — | | | (49,090) | | | — | | | 38,732 | | | (10,358) | |
| Payments for taxes related to net share settlement of equity awards | (1,205,145) | | | — | | | (4,406) | | | — | | | — | | | (4,406) | |
| Stock-based compensation | — | | | — | | | 33,650 | | | — | | | — | | | 33,650 | |
| Other comprehensive loss | — | | | — | | | — | | | (657) | | | — | | | (657) | |
| Net loss | — | | | — | | | — | | | — | | | (76,511) | | | (76,511) | |
| Balance as of December 31, 2022 | 97,149,665 | | | $ | 1 | | | $ | 713,201 | | | $ | (1,756) | | | $ | (533,651) | | | $ | 177,795 | |
See Accompanying Notes to Consolidated Financial Statements
QUOTIENT TECHNOLOGY INC.
CONSOLIDATED STATEMENTS OF CASH FLOWS
(in thousands)
| | | | | | | | | | | | | | | | | |
| | Year Ended December 31, |
| | 2022 | | 2021 | | 2020 |
| Cash flows from operating activities: | | | | | |
| Net loss | $ | (76,511) | | | $ | (45,568) | | | $ | (65,381) | |
| Adjustments to reconcile net loss to net cash provided by operating activities: | | | | | |
| Depreciation and amortization | 17,929 | | | 29,464 | | | 36,352 | |
| Stock-based compensation | 32,453 | | | 22,812 | | | 28,371 | |
| Amortization of debt discount and issuance cost | 1,808 | | | 11,618 | | | 11,011 | |
| Impairment of long-lived and right-of-use assets | 11,448 | | | — | | | — | |
| Impairment of intangible assets | — | | | 9,086 | | | — | |
| Allowance (recovery) for credit losses | (1,595) | | | 568 | | | 888 | |
| Deferred income taxes | 39 | | | 138 | | | 719 | |
| Change in fair value of contingent consideration | — | | | 1,392 | | | 20,234 | |
| Other non-cash expenses | 6,790 | | | 5,465 | | | 3,275 | |
| Changes in operating assets and liabilities: | | | | | |
| Accounts receivable | 80,761 | | | (40,135) | | | (13,232) | |
| Prepaid expenses and other assets | (1,150) | | | (14,326) | | | 3,164 | |
| Accounts payable and other liabilities | (33,728) | | | 27,576 | | | 15,554 | |
| Payments for contingent consideration and bonuses | (19,008) | | | (2,901) | | | (15,418) | |
| Accrued compensation and benefits | (8,289) | | | 6,070 | | | (197) | |
| Deferred revenues | (11,259) | | | 14,751 | | | 1,125 | |
| Net cash (used in) provided by operating activities | (312) | | | 26,010 | | | 26,465 | |
| | | | | |
| Cash flows from investing activities: | | | | | |
| Purchases of property and equipment | (19,608) | | | (14,720) | | | (8,351) | |
| Purchases of intangible assets | — | | | — | | | (3,018) | |
| Net cash used in investing activities | (19,608) | | | (14,720) | | | (11,369) | |
| | | | | |
| Cash flows from financing activities: | | | | | |
| Proceeds from issuances of common stock under stock plans | 1,375 | | | 16,219 | | | 5,002 | |
| Proceeds from borrowing on term loan, net of issuance costs | 50,694 | | | — | | | — | |
| Debt issuance costs for line of credit | (2,554) | | | — | | | — | |
| Repayment of convertible senior notes | (200,000) | | | — | | | — | |
| Payments for taxes related to net share settlement of equity awards | (4,406) | | | (6,333) | | | (7,203) | |
| Principal payments on promissory note and finance lease obligations | (396) | | | (456) | | | (391) | |
| Payments of contingent consideration | (5,686) | | | (6,121) | | | (14,582) | |
| Net cash (used in) provided by financing activities | (160,973) | | | 3,309 | | | (17,174) | |
| Effect of exchange rates on cash and cash equivalents | 367 | | | 66 | | | 66 | |
| Net (decrease) increase in cash and cash equivalents | (180,526) | | | 14,665 | | | (2,012) | |
| Cash and cash equivalents at beginning of period | 237,417 | | | 222,752 | | | 224,764 | |
| Cash and cash equivalents at end of period | $ | 56,891 | | | $ | 237,417 | | | $ | 222,752 | |
| | | | | |
| Supplemental disclosures of cash flow information | | | | | |
| Cash paid for income taxes | $ | 5,030 | | | $ | 287 | | | $ | 220 | |
| Cash paid for interest | $ | 3,520 | | | $ | 3,533 | | | $ | 3,510 | |
| Supplemental disclosures of noncash investing and financing activities | | | | | |
| Intangible asset acquisitions not yet paid | $ | — | | | $ | — | | | $ | 1,250 | |
| Fixed asset purchases not yet paid | $ | 740 | | | $ | 20 | | | $ | 1,757 | |
| Computer equipment acquired under promissory note | $ | — | | | $ | — | | | $ | 1,107 | |
See Accompanying Notes to Consolidated Financial Statements
QUOTIENT TECHNOLOGY INC.
Notes to Consolidated Financial Statements
1. Background
Description of Business
Quotient Technology Inc. (together with its subsidiaries, the “Company” or "Quotient"), is an industry leading promotions and media technology company that delivers targeted digital promotions and media for advertisers and retailers to reach consumers and drive action. Using its platforms and suite of omnichannel solutions, advertisers can plan, target, deliver and measure performance marketing and brand marketing to impact sales. The Company's network includes the digital properties of retail partners, non-retail publisher partners and CPG customers, social media platforms, its consumer brand, Shopmium, and its digital out-of-home ("DOOH") properties. This network provides the Company with proprietary and licensed data, including retailers’ in-store point-of-sale ("POS") shopper data, first-party consumer behavior and purchase intent data, and location intelligence. With such data powering its platforms, customers and partners use Quotient to leverage consumer insights, target and engage consumers via digital channels, and integrate marketing and merchandising programs to drive measurable sales results and consumer engagement.
2. Summary of Significant Accounting Policies
Basis of Presentation and Consolidation
The accompanying consolidated financial statements have been prepared in accordance with U.S. generally accepted accounting principles (“U.S. GAAP”). The Company’s consolidated financial statements include the accounts of the Company and its wholly-owned subsidiaries. All significant intercompany transactions and balances have been eliminated.
Use of Estimates
The preparation of financial statements in conformity with U.S. GAAP requires management to make estimates and assumptions that affect the reported amounts of assets and liabilities and disclosure of contingent liabilities at the date of the financial statements as well as the reported amounts of revenues and expenses during the reporting period. Such management estimates include, but are not limited to, revenue recognition, collectability of accounts receivable, useful lives of intangible assets, estimates related to recoverability of long-lived assets and goodwill, stock-based compensation, legal contingencies, deferred income taxes and associated valuation allowances and distribution fee commitments. These estimates generally require judgments, may involve the analysis of historical and prediction of future trends, and are subject to change from period to period. Actual results may differ from the Company’s estimates, and such differences may be material to the accompanying consolidated financial statements.
Cash and Cash Equivalents
The Company considers all highly liquid investments with original maturities of three months or less at the time of purchase to be cash equivalents. The Company classifies all cash equivalents as available-for-sale, which are recorded at fair value. Unrealized gains and losses are included in accumulated other comprehensive (loss) income in stockholders’ equity. Realized gains and losses are included in other income (expense), net.
Accounts Receivable, Net of Allowance for Credit Losses
Trade and other receivables are included in accounts receivables and primarily comprised of trade receivables that are recorded at invoiced amounts, net of an allowance for credit losses and do not bear interest. Other receivables included unbilled receivables related to digital media and promotions advertising contracts with customers. The Company generally does not require collateral and performs ongoing credit evaluations of its customers and maintains allowances for potential credit losses. The Company maintains an allowance for credit losses based upon the expected collectability of its accounts receivable. The Company assesses collectability by reviewing accounts receivable on a collective basis where similar characteristics exist and on an individual basis when we identify specific customers with known disputes or collectability issues. In determining the amount of the allowance for credit losses, the Company reviewed credit profiles of its customers, contractual terms and conditions, current economic trends, reasonable and supportable forecasts of future economic conditions, and historical payment experience.
Property and Equipment, net
Property and equipment, net, are stated at cost less accumulated depreciation and amortization. Depreciation and amortization are computed using the straight-line method over the estimated useful lives of the assets, which are three years for computer equipment and software and five years for all other asset categories except leasehold improvements, which are amortized over the shorter of the lease term or the expected useful life of the improvements.
Internal-Use Software Development Costs
For costs incurred for computer software developed or obtained for internal use, the Company begins to capitalize its costs to develop software when preliminary development efforts are successfully completed, management has authorized and committed project funding, and it is probable that the project will be completed and the software will be used as intended. These costs are amortized to cost of revenues over the estimated useful life of the related asset, generally estimated to be three years. Costs related to preliminary project activities and post implementation activities, including training and maintenance are expensed as incurred and recorded in research and development expense on the Company’s consolidated statements of operations.
Leases
The Company determines if an arrangement is a lease at inception. Right-of-use (“ROU”) assets represent the Company’s right to use an underlying asset for the lease term and lease liabilities represent the Company’s obligation to make lease payments arising from the lease. The Company has elected the practical expedient not to recognize ROU assets and lease liabilities for short-term leases with terms of twelve months or less. Operating lease ROU assets and liabilities are recognized at commencement date based on the present value of lease payments over the lease term. As the rate implicit in each lease is not readily determinable, the Company uses an incremental borrowing rate to determine the present value of the lease payments at commencement date. The operating lease ROU asset also includes any lease payments made and excludes lease incentives. The lease terms may include options to extend or terminate the lease when it is reasonably certain that the Company will exercise that option. The Company accounts for lease and non-lease components as a single lease component. Operating lease expense is recognized on a straight-line basis over the lease term.
Operating ROU assets and lease liabilities are included on the Company’s consolidated balance sheet. Operating ROU assets are included as operating lease right-of-use assets. The current portion of the operating lease liabilities is included in other current liabilities and the long-term portion is included in other non-current liabilities on the Company’s consolidated balance sheet.
Goodwill and Intangible Assets
Intangible assets with a finite life are amortized over their estimated useful lives. Goodwill is not subject to amortization but is tested for impairment at least annually, and more frequently upon the occurrence of certain events that may indicate that the carrying value of goodwill may not be recoverable. The Company, which operates in a single reporting unit, completes its annual impairment test during the fourth quarter of each year.
Long-Lived assets are reviewed for impairment whenever events or changes in circumstances indicate that the carrying amount of such assets may not be recoverable.
The Company evaluates intangible assets for potential impairment indicators at least quarterly and more frequently upon the occurrence of events that could impact prior conclusions. Judgment regarding the existence of impairment indicators is based on market conditions as well as the operational performance of its businesses. Additionally, future events could cause the Company to conclude that impairment indicators exist, and therefore long-lived assets could be impaired.
The Company considers the following to be some examples of indicators that may trigger an impairment review: (i) actual undiscounted cash flows significantly below historical or projected future undiscounted cash flows for the associated assets; (ii) significant changes in the manner or use of the assets or in our overall strategy with respect to the manner or use of the acquired assets or changes in its overall business strategy; (iii) significant negative industry or economic trends; (iv) increased competitive pressures; and (v) a significant decline in its stock price for a sustained period of time.
Once the Company determines that a potential impairment indicator exists, it performs the test for recoverability by comparing the estimated future undiscounted cash flows associated with the intangible assets with the intangible asset’s carrying amount. Where the carrying value of the intangible asset exceeds the future undiscounted cash flows associated with the intangible assets, it is determined that the value of those intangible assets cannot be recovered. For an intangible asset failing the recoverability test, an impairment charge is recorded for the difference between the carrying value and the estimated fair value.
The key assumptions used in the Company's estimates of projected cash flow of its intangible assets deal largely with forecasts of sales levels, gross margins, and operating costs. These forecasts are typically based on historical trends and take into account recent developments as well as its plans and intentions. Any material change in the Company's assumptions could significantly impact projected future cash flows of the intangible assets and these factors are considered in evaluating impairment. Other factors, such as increased competition or a decrease in the desirability of our products, could lead to lower projected sales levels, which would adversely impact cash flows. A significant decrease in cash flows in the future could result in an impairment of its intangible assets or long-lived assets.
During the second quarter of 2022, the Company performed an assessment of its long-lived assets to determine if any indicators of impairment existed and determined that there were changes in circumstances that indicated that the carrying amount of a long-lived asset group was not recoverable. During the year ended December 31, 2022, the Company recorded an impairment charge of $1.4 million, related to capitalized software.
Fair Value of Financial Instruments
The carrying values of the Company’s financial instruments, including cash equivalents, accounts receivable, accounts payable, accrued compensation and benefits, and other current liabilities, approximate fair value due to their short-term nature. The Company records money market funds, short-term investments and contingent consideration at fair value. See Note 3 (Fair Value Measurements).
Convertible Senior Notes
In November 2017, the Company issued $200.0 million aggregate principal amount of 1.75% convertible senior notes due 2022 (the “notes”). In accounting for the issuance of the notes, prior to the adoption of ASU 2020-06 on January 1, 2022, the Company separated the notes into liability and equity components. The carrying amount of the liability component was calculated by measuring the fair value of a similar liability that does not have an associated convertible feature. The carrying amount of the equity component representing the conversion option was determined by deducting the fair value of the liability component from the par value of the notes as a whole. This difference represents a debt discount that is amortized to interest expense over the terms of the notes. The equity component was not remeasured as long as it continued to meet the conditions for equity classification. In accounting for the issuance costs related to the notes, the Company allocated the total amount incurred to the liability and equity components. Issuance costs attributable to the liability components are being amortized to expense over the contractual term of the notes, and issuance costs attributable to the equity component were netted with the equity component in additional paid-in capital.
Prior to the adoption of ASU 2020-06 on January 1, 2022, the Company allocated the total debt issuance costs to the liability and equity components of the notes in proportion to the respective values. Issuance costs attributable to the liability component were amortized expense using the effective interest method over the contractual term of the notes. Issuance costs attributable to the equity component were netted with the equity component in additional paid-in capital. Subsequent to the adoption of ASU 2020-06 on January 1, 2022, which the Company elected to adopt using the modified retrospective method, the Company removed the impact of recognizing the equity component of the notes (at issuance and subsequent accounting impact of additional interest expense from debt discount amortization).
On December 1, 2022, the Company repaid the notes in full, including accrued interest.
Revenue Recognition
The Company primarily generates revenue by providing digital promotions and media solutions to its customers which consist of advertisers, retail partners and advertising agencies whereby it uses its proprietary technology platforms to create, target, deliver and analyze these solutions.
Revenues are recognized when control of the promised goods or services is transferred to the Company’s customers, and collectability of an amount that reflects the consideration the Company expects to be entitled to in exchange for those goods or services is probable.
The Company determines revenue recognition through the following steps:
•Identification of the contract, or contracts, with a customer
•Identification of the performance obligations in the contract
•Determination of the transaction price
•Allocation of the transaction price to the performance obligations in the contract
•Recognition of revenue when, or as, the Company satisfies a performance obligation
Digital Promotions
The Company's digital promotions solutions include its national promotions offering which is non-retailer specific, and its shopper promotions offering which is retailer specific. The Company's digital promotions are generally sold on a cost-per-click basis or based on duration (i.e., Duration-Based National Promotions Solution or Duration-Based Shopper Promotions Solution). For a cost-per-click offering, a click refers to the consumer's action of activating a digital promotion through the Company’s proprietary technology platforms by either saving it to a retailer’s loyalty account for automatic digital redemption, or printing it for physical redemption at a retailer. Beginning the first quarter of 2021, the Company introduced its Duration-Based National Promotions Solution, and beginning the first quarter of 2022, the Company introduced its Duration-Based Shopper Promotions Solution. These duration-based offerings provide advertisers access to the Company's proprietary platforms for a specific period of time (i.e., the campaign period) in exchange for a fixed fee. The campaign period in duration-based offerings is generally between seven and twenty-eight days.
The pricing of digital promotions programs typically includes both promotion setup fees and digital promotion campaign fees. Promotion setup fees are related to the creation of digital promotions and set up of the underlying campaign on Quotient’s proprietary platforms.
Through the third quarter of 2022, the Company had determined that setup activities, along with the related digital promotion campaigns, represented a single combined performance obligation because the customer could not benefit from the promotion setup services either on their own or with resources that were readily available to the customer. Accordingly, revenue related to cost-per-click agreements were typically recognized as clicks occurred and revenue related to duration-based campaigns, which provide the customer access to the Company’s proprietary technology platforms each day during the campaign period, were typically recognized ratably over the campaign period.
Beginning the fourth quarter of 2022, because of technological enhancements in the Company's proprietary technology, customers and third parties can benefit from the promotion setup services with readily available resources. More specifically, the Company's proprietary technology now support independent setup services that
can be performed by customers or third parties. As a result, the Company has determined that its digital promotion offerings include multiple performance obligations, including the promotion setup services and related digital promotion campaigns. Beginning the fourth quarter of 2022, revenue from promotion setup services for both cost-per-click and duration-based campaigns are recognized as the services are performed. Revenue from digital promotion campaigns is recognized as clicks occur for cost-per-click agreements, and ratably over the campaign period for duration-based campaigns.
Digital Media
Digital media solutions are comprised of national media offerings, shopper media offerings, DOOH offerings and sponsored search offerings. The Company's media offerings enable advertisers and retailers to distribute digital media to promote their brands and products on its retailers' websites, and mobile applications, and through open exchange inventory sources that display its media offerings, including on websites, mobile applications, or digital screens. Pricing for media campaigns is usually determined on a cost-per-impression, cost-per-click or cost-per-acquisition basis. The Company recognizes revenue each time a digital media is displayed or each time a user clicks on the media ad displayed on the Company's websites, mobile applications or on third-party websites.
Gross versus Net Revenue Reporting
In the normal course of business, the Company delivers digital promotions and media on retailers’ websites and mobile applications through retailers’ loyalty programs, and on the websites of digital publishers. In these situations, the Company evaluates whether it is the principal (i.e., reports revenues on a gross basis) or agent (i.e., reports revenues on a net basis).
In the case of national promotions and media offerings, the Company has determined that it is the principal in these arrangements as the Company controls the digital promotion and media advertising inventory before it is transferred to its customers. The Company’s control is evidenced by its sole ability to monetize the digital coupon and media advertising inventory, being primarily responsible to its customers, having discretion in establishing pricing for the delivery of the digital coupons and media, or a combination of these. Under these arrangements, the Company reports revenue on a gross basis, that is, the amounts billed to its customers are recorded as revenues, and distribution fees paid to retailers or digital publishers are recorded as cost of revenues.
With regards to non-duration based shopper promotions and media campaign offerings, the Company has determined that it is an agent in these arrangements as the Company does not control these shopper promotions and media programs or sets the pricing. The Company’s obligation in these arrangements is to provide the use of its proprietary technology platforms to the customers. The retailer determines how shopper promotions and media programs are executed through the Company’s proprietary technology platforms. Under these arrangements, the Company reports revenue on a net basis, that is, the costs for digital advertising inventory are deducted from gross revenues to arrive at net revenues.
With regards to duration-based shopper promotions, the Company has determined that it is the principal because it has discretion in establishing pricing for the delivery of the digital coupons. Under these arrangements, the Company reports revenue on a gross basis.
In the case of DOOH and sponsored search, the Company has determined that it is typically an agent in these arrangements because it generally does not have control of the digital advertising inventory before it is transferred to the customer and does not set prices. The Company’s obligation is to provide the use of its proprietary technology platforms that enables customers to bid on real-time digital advertising inventory, use of data and other add-on features in designing and executing their campaigns. The Company charges its customers a platform fee based on a percentage of the price paid by the purchaser of the related digital advertising inventory. Accordingly, the Company generally reports revenue on a net basis for the platform fees charged to customers.
Arrangements with Multiple Performance Obligations
The Company’s contracts with customers may include multiple performance obligations. For these contracts, the Company accounts for individual performance obligations separately. The transaction price is allocated to the separate performance obligations on a relative standalone selling price basis. The Company determines its best estimate of its standalone selling prices based on its overall pricing objectives, taking into consideration market conditions and other factors, including the value of its contracts and characteristics of targeted customers.
Deferred Revenues
Deferred revenues primarily relate to cash received or billings to customers associated with promotion setup fees, promotion campaign fees and digital media fees that are expected to be recognized upon click, delivery of media impressions, or campaign duration, which generally occur within the succeeding twelve months. The Company records deferred revenues when cash payments are received or become due in advance of the Company satisfying its performance obligations. The decrease in the deferred revenue balance for year ended December 31, 2022 was due to $59.9 million of recognized revenue, partially offset by cash payments of $48.6 million received or due in advance of satisfying our performance obligations. Revenue recognized include $3.3 million in revenue which the Company determined should have been recognized in prior periods as the underlying performance obligations were satisfied in prior periods. Management determined these amounts were not material to the previously issued annual and interim financial statements.
The Company’s payment terms vary by the type and size of its customers. For certain products or services and customer types, we require payment before the products or services are delivered to the customer.
Disaggregated Revenue
The following table presents the Company’s revenues disaggregated by type of services (in thousands). The majority of the Company’s revenue is generated from sales within the United States.
| | | | | | | | | | | | | | | | | |
| | Year Ended December 31, |
| | 2022 | | 2021 | | 2020 |
| Promotion | $ | 184,394 | | | $ | 252,831 | | | $ | 237,385 | |
| Media | 104,372 | | | 268,663 | | | 208,502 | |
| Total Revenue | $ | 288,766 | | | $ | 521,494 | | | $ | 445,887 | |
Practical Expedients and Exemptions
The Company does not disclose the value of unsatisfied performance obligations for (i) contracts with an original expected length of one year or less and (ii) contracts for which it recognizes revenue for an amount where it has the right to invoice for services performed.
Cost of Revenues
Cost of revenues consist primarily of distribution fees, personnel costs, depreciation related to data center equipment, and amortization expense related to capitalized internal use software, acquisition related intangible assets and purchased intangible assets, data center costs, third-party service fees including traffic acquisition costs and purchase of third-party data. Distribution fees consist of payments to partners within the Company’s network for their digital coupon publishing services. Personnel costs include salaries, bonuses, stock-based awards and employee benefits, and are primarily attributable to individuals maintaining the Company’s data centers and operations, which initiate, sets up and deliver digital coupon media campaigns.
Sales Commissions
The Company generally incurs and expenses sales commissions upon recognition of revenue for related goods and services, which typically occurs within one year or less. Sales commissions earned related to revenues for initial contracts are commensurate with sales commissions related to renewal contracts. These costs are included in sales and marketing expenses within the consolidated statements of operations.
Research and Development Expense
The Company expenses the cost of research and development as incurred. Research and development expense consists primarily of personnel and related headcount costs and costs of professional services associated with the ongoing development of the Company’s technology.
Stock-Based Compensation
The Company accounts for stock-based compensation for all stock-based awards made to employees and directors, including stock options, restricted stock units, performance-based restricted stock units, and employee stock purchase plan using the fair value method. This method requires the Company to measure the stock-based compensation based on the grant-date fair value of the awards and recognize the compensation expense over the requisite service period. The fair values of stock options and shares pursuant to the Employee Stock Purchase Plan (“ESPP”) are estimated at the date of grant using the Black-Scholes-Merton option pricing model, which includes assumptions for the dividend yield, expected volatility, risk-free interest rate, and expected life. The fair values of restricted stock and restricted stock units are determined based upon the fair value of the underlying common stock at the date of grant. The Company performs an analysis quarterly to determine if the stock options or restricted stock awards granted are spring-loaded and therefore require an adjustment to the fair values. The Company expenses stock-based compensation using the straight-line method over the vesting term of all awards except for performance-based restricted stock units, which are expensed using the accelerated attribution method.
Advertising Expense
Advertising costs are expensed when incurred and are included in sales and marketing expense on the accompanying consolidated statements of operations. The Company incurred $1.8 million, $1.8 million and $2.0 million of advertising costs during the years ended December 31, 2022, 2021 and 2020, respectively. Advertising costs consist primarily of online marketing costs, such as advertising on social networking sites, e-mail marketing campaigns, loyalty programs, and affiliate programs.
Income Taxes
The Company accounts for income taxes in accordance with authoritative guidance, which requires the use of the liability method. Under this method, deferred income tax assets and liabilities are determined based upon the difference between the consolidated financial statement carrying amounts and the tax basis of assets and liabilities and are measured using the enacted tax rate expected to apply to taxable income in the years in which the differences are expected to reverse. A valuation allowance is provided when it is more likely than not that the deferred tax assets will not be realized. The Company recognizes liabilities for uncertain tax positions based upon a two-step process. To the extent a tax position does not meet a more-likely-than-not level of certainty, no benefit is recognized in the consolidated financial statements. If a position meets the more-likely-than-not level of certainty, it is recognized in the consolidated financial statements at the largest amount that has a greater than 50% likelihood of being realized upon ultimate settlement. The Company accounts for any applicable interest and penalties as a component of income tax expense.
Foreign Currency
Foreign currency denominated assets and liabilities of foreign subsidiaries, where the local currency is the functional currency, are translated into U.S. Dollars using the exchange rates in effect at the balance sheet dates, and income and expenses are translated using average exchange rates during the period. The resulting foreign currency translation adjustments are recorded in accumulated other comprehensive loss, a component of stockholders’ equity.
Gains and losses from foreign currency transactions are included in other income (expense), net in the accompanying consolidated statements of operations. Foreign currency transaction gains (losses) were immaterial for all the periods presented in the accompanying consolidated financial statements.
Other Comprehensive Income (Loss)
Other comprehensive income (loss) consists of foreign currency translation adjustments.
Net Income (Loss) per Share
The Company’s basic net income (loss) per share attributable to common stockholders is computed by dividing the net income (loss) by the weighted-average number of shares of common stock outstanding during the period. The diluted net income (loss) per share is computed by giving effect to all potentially dilutive common share equivalents outstanding during the period. The dilutive effect of dilutive common share equivalents is reflected in
diluted net income (loss) per share by application of the treasury stock method. Since the Company intended to settle the principal amount of its outstanding convertible senior notes in cash, the Company used the treasury stock method for calculating any potential dilutive effect of the conversion spread on diluted net income per share, if applicable. The effects of options to purchase common stock, RSUs, and convertible senior notes are excluded from the computation of diluted net loss per share attributable to common stockholders because their effect is antidilutive.
Segments
The Company’s chief operating decision maker (“CODM”), who is the Chief Executive Officer, reviews the Company’s financial information presented on a consolidated basis for purposes of allocating resources and evaluating its financial performance. There are no segment managers who are held accountable by the CODM, or anyone else, for operations, operating results, and planning for levels or components below the consolidated unit level. Accordingly, the Company has determined that it operates in one single reporting segment.
Concentration of Credit Risk
Financial instruments that potentially subject the Company to concentrations of credit risk consist primarily of cash, cash equivalents, short-term investments and accounts receivable. For cash, cash equivalents and short-term investments, the Company is exposed to credit risk in the event of default by the financial institutions to the extent of the amounts recorded on the accompanying consolidated balance sheets. Credit risk with respect to accounts receivable is dispersed due to the large number of customers. The Company does not require collateral for accounts receivable.
Recently Issued Accounting Pronouncements
Accounting Pronouncements Recently Adopted
In August 2020, the Financial Accounting Standards Board (“FASB”) issued ASU 2020-06, Debt—Debt with Conversion and Other Options (Subtopic 470-20) and Derivatives and Hedging—Contracts in Entity’s Own Equity (Subtopic 815-40): Accounting for Convertible Instruments and Contracts in an Entity’s Own Equity ("ASU 2020-06"). The guidance simplifies an issuer's accounting for convertible debt instruments and its application of the derivatives scope exception for contracts in its own entity. The guidance eliminates two of the three models in ASC 470-20 that require separate accounting for embedded conversion features. The Company adopted this standard effective January 1, 2022 using modified retrospective approach. Therefore, the consolidated financial statements for the year ended December 31, 2022 are presented under the new standard, while the comparative periods presented are not adjusted and continue to be reported in accordance with the Company's historical accounting policy.
In connection with the adoption of this standard, the Company recognized a cumulative effect adjustment of $38.7 million to retained earnings on the Company’s condensed consolidated balance sheet as of January 1, 2022. This adjustment was primarily driven by the derecognition of interest expense related to the accretion of the debt discount associated with the embedded conversion option recorded in the prior period as required under the legacy guidance. In addition, the Company reclassified $50.7 million and issuance costs of $1.6 million from additional paid-in-capital to convertible senior notes, net on the Company’s condensed consolidated balance sheet as of January 1, 2022. The reclassification was recorded in order to combine the two legacy units of account into a single instrument classified as a liability since the bifurcation of the instrument into two units of account is no longer required under the new standard. Under the new guidance, the Company will no longer incur interest expense related to the accretion of the debt discount associated with the embedded conversion option. The Company will use the if-converted method to calculate diluted earnings-per-share (EPS). If the Company makes an irrevocable election to settle the principal of the convertible senior notes in cash and the excess conversion spread in shares, the if-converted method will result in a reduced number of shares issued to reflect only the excess conversion. Since the Company had a net loss for the year ended December 31, 2022, the convertible senior notes were determined to be anti-dilutive and therefore had no impact to basic or diluted net loss per share for the period as a result of adopting ASU 2020-06.
3. Fair Value Measurements
The fair value is defined as the price that would be received to sell an asset or paid to transfer a liability in an orderly transaction between market participants at the measurement date. Fair value is estimated by applying the following hierarchy, which prioritizes the inputs used to measure fair value into three levels and bases the categorization within the hierarchy upon the lowest level of input that is available and significant to the fair value measurement:
Level 1—Quoted prices (unadjusted) in active markets for identical assets or liabilities.
Level 2—Observable inputs other than quoted prices in active markets for identical assets and liabilities, quoted prices for similar assets or liabilities in active or inactive markets, or other inputs that are observable or can be corroborated by observable market data for substantially the full term of the assets or liabilities.
Level 3—Inputs that are generally unobservable and typically reflect management’s estimate of assumptions that market participants would use in pricing the asset or liability.
Assets and Liabilities Measured at Fair Value on a Recurring Basis
The Company’s fair value hierarchy for its financial assets and liabilities that are measured at fair value on a recurring basis are as follows (in thousands):
| | | | | | | | | | | | | | | | | | | | | | | |
| | December 31, 2021 |
| | Level 1 | | Level 2 | | Level 3 | | Total |
| Assets: | | | | | | | |
| Cash equivalents: | | | | | | | |
| Money market funds | $ | 105,004 | | | — | | | — | | | $ | 105,004 | |
| Total | $ | 105,004 | | | $ | — | | | $ | — | | | $ | 105,004 | |
| Liabilities: | | | | | | | |
| Contingent consideration related to acquisitions | — | | | — | | | 22,275 | | | 22,275 | |
| Total | $ | — | | | $ | — | | | $ | 22,275 | | | $ | 22,275 | |
There were no assets or liabilities measured at fair value as of December 31, 2022. The valuation technique used to measure the fair value of money market funds includes using quoted prices in active markets.
As of December 31, 2021, the contingent consideration relates to the acquisition of Ubimo, Ltd. (“Ubimo”). As of December 31, 2021, there was no contingent consideration relating to the acquisition of Elevaate, Ltd. ("Elevaate"). The fair values of contingent consideration are based on the expected achievement of certain financial metrics as defined under the acquisition agreements and was estimated using an option pricing method with significant inputs that are not observable in the market, thus classified as a Level 3 instrument. The inputs included the expected achievement of certain financial metrics over the contingent consideration period, volatility and discount rate. The fair value of the contingent consideration is classified as a liability and is re-measured each reporting period. Refer to Note 6 for further details related to the acquisitions.
The following table represents the change in the contingent consideration (in thousands):
| | | | | | | | | | | | | | | | | | | | | | | |
| | Ubimo | | Elevaate | | Ahalogy | | |
| | Level 3 | | Level 3 | | Level 3 | | Total |
| Balance as of December 31, 2019 | 5,686 | | | 3,534 | | | 27,000 | | | 36,220 | |
| Change in fair value during the period | 15,244 | | | 4,990 | | | — | | | 20,234 | |
| Payments made during the period | — | | | — | | | (27,000) | | | (27,000) | |
| Balance as of December 31, 2020 | 20,930 | | | 8,524 | | | — | | | 29,454 | |
| Change in fair value during the period | 1,345 | | | 47 | | | — | | | 1,392 | |
| Payments made during the period | — | | | (8,571) | | | — | | | (8,571) | |
| Balance as of December 31, 2021 | 22,275 | | | — | | | — | | | 22,275 | |
| Payments made during the period | (22,275) | | | — | | | — | | | (22,275) | |
| Balance as of December 31, 2022 | $ | — | | | $ | — | | | $ | — | | | $ | — | |
During the years ended December 31, 2022, 2021, and 2020, the Company recorded a charge of zero, $1.4 million, and $20.2 million, respectively, for the re-measurement of the fair values of contingent consideration related to acquisitions, as a component of operating expenses in the accompanying consolidated statements of operations.
During the year ended December 31, 2022, the Company paid $22.3 million related to Ubimo's achievement of financial metrics subject to contingent consideration during the measurement period ending December 31, 2021, and as a result, no liability existed as of December 31, 2022. Out of the total consideration paid, $5.7 million was originally measured and recorded on the acquisition date, and $16.6 million was recorded subsequent to the acquisition date through changes in fair value of contingent consideration within the consolidated statements of operations.
During the year ended December 31, 2021, the Company paid $8.6 million related to Elevaate's achievement of certain financial metrics subject to contingent consideration during the measurement period ending January 31, 2021. Out of the total consideration paid, $6.1 million was originally measured and recorded on the acquisition date and $2.5 million was recorded subsequent to the acquisition date through changes in fair value of contingent consideration within the consolidated statements of operations. In May 2021, the Company received a letter from certain former shareholders of Elevaate claiming that the Company owes additional contingent consideration. The Company believes that the claim is without merit.
During the year ended December 31, 2020, the Company paid $27.0 million related to Ahalogy’s achievement of financial metrics, and as a result, no liability existed as of December 31, 2020. Out of the total consideration paid, $14.6 million was originally measured and recorded on the acquisition date as part of consideration transferred, and $12.4 million was recorded subsequent to the acquisition date through changes in fair value of contingent consideration within the consolidated statements of operations.
4. Allowance for Credit Losses
The summary of activities in the allowance for credit losses is as follows (in thousands):
| | | | | | | | | | | | | | | | | |
| | Year Ended December 31, |
| | 2022 | | 2021 | | 2020 |
| Balance at beginning of period | $ | 2,500 | | | $ | 2,070 | | | $ | 2,021 | |
| Change in provision for expected credit losses | (1,594) | | | 568 | | | 888 | |
| Write-offs charged against the allowance | (200) | | | (138) | | | (839) | |
| Balance at end of period | $ | 706 | | | $ | 2,500 | | | $ | 2,070 | |
5. Balance Sheet Components
Property and Equipment, Net
Property and equipment consist of the following (in thousands):
| | | | | | | | | | | |
| | December 31, |
| | 2022 | | 2021 |
| Software | $ | 73,054 | | | $ | 51,093 | |
| Computer equipment | 18,625 | | | 23,696 | |
| Leasehold improvements | 5,740 | | | 8,362 | |
| Furniture and fixtures | 2,304 | | | 2,552 | |
| Total | 99,723 | | | 85,703 | |
| Accumulated depreciation and amortization | (70,982) | | | (68,052) | |
| Projects in process | 32 | | | 5,009 | |
| Property and equipment, net | $ | 28,773 | | | $ | 22,660 | |
Depreciation and amortization expense of property and equipment was $9.4 million, $7.7 million and $7.2 million for the years ended December 31, 2022, 2021 and 2020, respectively.
The Company capitalized internal use software development and enhancement costs, which is included in Software within "Property and equipment, net" on the consolidated balance sheets of $19.1 million, $12.0 million, and $7.5 million during the years ended December 31, 2022, 2021 and 2020, respectively. During the years ended December 31, 2022, 2021 and 2020, the Company had $6.3 million, $4.1 million and $3.4 million, respectively, in amortization expense related to internal use software, which is included in property and equipment depreciation and amortization expense, and which is recorded as cost of revenues. The unamortized capitalized internal use software development costs were $22.9 million and $11.6 million as of December 31, 2022 and 2021, respectively.
During the year ended December 31, 2022, the Company determined that there were changes in circumstances that indicated that the carrying amount of a long-lived asset group was not recoverable; as such, the Company recorded an impairment charge of $1.4 million, related to capitalized software.
Accrued Compensation and Benefits
Accrued compensation and benefits consist of the following (in thousands):
| | | | | | | | | | | |
| | December 31, |
| | 2022 | | 2021 |
| Payroll and related expenses | $ | 5,031 | | | $ | 4,253 | |
| Commissions | 3,526 | | | 5,838 | |
| Bonus | 2,363 | | | 9,045 | |
| Vacation | 1,140 | | | 1,087 | |
| Accrued compensation and benefits | $ | 12,060 | | | $ | 20,223 | |
Other Current Liabilities
Other current liabilities consist of the following (in thousands):
| | | | | | | | | | | |
| | December 31, |
| | 2022 | | 2021 |
| Distribution fees | 23,061 | | | 46,313 | |
| Operating lease liabilities | 6,325 | | | 4,935 | |
| Traffic acquisition cost | 4,804 | | | 12,033 | |
| Prefunded liability | 3,071 | | | 4,782 | |
| Liability related to litigation settlement | 2,250 | | | — | |
| Rebate liability | 1,163 | | | 2,444 | |
| Marketing expenses | 1,007 | | | 636 | |
| Deferred cost related to a retailer agreement | — | | | 8,000 | |
| Interest payable | — | | | 292 | |
| Other | 11,574 | | | 15,844 | |
| Other current liabilities | $ | 53,255 | | | $ | 95,279 | |
6. Acquisitions
Acquisition of Ubimo
On November 19, 2019, the Company acquired all outstanding shares of Ubimo, a leading data and media activation company. The total acquisition consideration of $20.7 million consisted of $15.0 million in cash and contingent consideration of up to $24.8 million payable in cash with an estimated fair value of $5.7 million as of the acquisition date. During the year ended December 31, 2022, the Company paid $22.3 million related to Ubimo's achievement of certain financial metrics subject to contingent consideration during the measurement period ending December 31, 2021. Refer to Note 3 for the changes in fair value of contingent consideration.
Acquisition of Elevaate
On October 26, 2018, the Company acquired all the outstanding shares of Elevaate, a sponsored search company for retail partners and CPG brands. The total acquisition consideration of $13.3 million consisted of $7.2 million in cash and contingent consideration of up to $18.5 million payable in cash with an estimated fair value of $6.1 million as of the acquisition date. During the year ended December 31, 2021, the Company paid $8.6 million related Elevaate's achievement of certain financial metrics subject to contingent consideration during the measurement period ending January 31, 2021. Refer to Note 3 for the changes in fair value of contingent consideration.
Acquisition of SavingStar, Inc.
On August 27, 2018, the Company acquired all the outstanding shares of SavingStar, Inc. (“SavingStar”), a digital promotions company with a customer relationship management (CRM) platform designed to help brands build and track loyalty programs with their consumers. The total acquisition consideration at closing consisted of $7.5 million in cash. In addition, SavingStar could have earned potential contingent consideration of up to $10.6 million payable in all cash, subject to achieving certain financial metrics between closing through February 29, 2020. At the date of acquisition, the contingent consideration’s fair value was determined to be zero using an option pricing model. As of February 29, 2020, the date that the contingent consideration period ended, SavingStar did not achieve certain financial metrics for payout and the fair value was concluded to be zero. Accordingly, the Company determined that no payout was required when the contingent consideration period ended.
Acquisition of Ahalogy
On June 1, 2018, the Company acquired all the outstanding shares of Ahalogy, an influencer marketing firm that delivers premium content across social media channels for CPG brands. The acquisition enhances the Company’s performance media solutions for CPGs and retailers, adding social media expertise and a roster of influencers. The total acquisition consideration of $36.4 million consisted of $21.8 million in cash and contingent consideration of up to $30.0 million payable in all cash with an estimated fair value of $14.6 million as of the acquisition date. During the year ended December 31, 2020, the Company paid $27.0 million related to Ahalogy's achievement of certain financial metrics subject to contingent consideration during the measurement period ending December 31, 2019. Refer to Note 3 for the changes in fair value of contingent consideration.
Each of these acquisitions were accounted for as a business combination. Accordingly, assets acquired and liabilities assumed were recorded at their estimated fair values as of the acquisition date when control was obtained. The Company expensed all transaction costs in the period in which they were incurred. The Company acquired various intangible assets resulting from these acquisitions, such as, customer relationships, vendor relationships, developed technologies and trade names. The fair value of the customer relationships was determined by using a discounted cash flow model. The fair value of the vendor relationships was determined by using a cost approach. The fair value of developed technologies was determined by using the relief from royalty method or the with-and-without method. The fair value of trade names was determined by using the relief from royalty method. The excess of the consideration paid over the fair value of the net tangible assets and liabilities and identifiable intangible assets acquired is recorded as goodwill. The goodwill arising from the acquisitions are largely attributable to the synergies expected to be realized. None of the goodwill recorded from the acquisitions will be deductible for income tax purposes.
7. Goodwill and Intangible Assets
Goodwill:
Goodwill represents the excess of the consideration paid over the fair value of the net tangible and identifiable intangible assets acquired in a business combination.
In the third quarter of 2022, the Company, which operates in a single reporting unit, determined that a goodwill impairment analysis triggering event had occurred. The Company performed a quantitative assessment to evaluate goodwill. In performing its quantitative impairment assessment, the Company estimated the fair value of its reporting unit using the income approach and market approach. The income approach uses projected operating results and cash flows that are discounted using a market-participant discount rate based on a weighted-average cost of capital. The financial projections reflect management's best estimate of economic and market conditions over the projected period including forecasted revenue growth rate, earnings before interest, taxes, depreciation and amortization ("EBITDA") margin, tax rate, capital expenditures, depreciation and amortization and changes to working capital requirements. The market approach estimates fair value by using comparable industry multiples, such as multiples of revenue and EBITDA.
The key assumptions used in the discounted cash flow model included forecasted growth rate, forecasted EBITDA margins and discount rate. The interim test resulted in the Company’s determination that the fair value of its reporting unit exceeded its carrying value and therefore, its goodwill was not impaired.
In the fourth quarter of 2022, the Company performed its annual impairment test and based on the results of its assessment, the Company determined that the fair value of the reporting unit exceeded its carrying value and, therefore, its goodwill was not impaired. There were no changes in the carrying value of goodwill and as of December 31, 2022 and 2021, goodwill was $128.4 million. There was no impairment of goodwill for the years ended December 31, 2022, 2021 and 2020. The Company will continue to monitor the operating results, cash forecasts and challenges from declines in current business and market conditions, as well as impacts of COVID-19 for possible future goodwill impairments to its reporting unit.
Intangible Assets:
The following table summarizes the gross carrying amount and accumulated amortization for the intangible assets (in thousands):
| | | | | | | | | | | | | | | | | | | | | | | |
| | December 31, 2022 |
| | Gross | | Accumulated
Amortization | | Net | | Weighted
Average
Amortization
Period
(Years) |
| Media service rights | $ | 29,551 | | | $ | (29,551) | | | $ | — | | | 0.0 |
| Developed technologies | 27,080 | | | (24,900) | | | 2,180 | | | 0.8 |
| Customer relationships | 22,588 | | | (20,626) | | | 1,962 | | | 1.4 |
| Domain names | 5,939 | | | (5,587) | | | 352 | | | 0.0 |
| Promotion service rights | 3,018 | | | (3,018) | | | — | | | 0.0 |
| Trade names | 2,818 | | | (2,818) | | | — | | | 0.0 |
| Vendor relationships | 2,510 | | | (2,510) | | | — | | | 0.0 |
| Patents | 975 | | | (975) | | | — | | | 0.0 |
| Data access rights | — | | | — | | | — | | | 0.0 |
| Registered users | 409 | | | (409) | | | — | | | 0.0 |
| | $ | 94,888 | | | $ | (90,394) | | | $ | 4,494 | | | 1.1 |
| | | | | | | | | | | | | | | | | | | | | | | |
| | December 31, 2021 |
| | Gross | | Accumulated
Amortization | | Net | | Weighted
Average
Amortization
Period
(Years) |
| Media service rights | $ | 35,582 | | | $ | (32,282) | | | $ | 3,300 | | | 0.7 |
| Developed technologies | 27,170 | | | (22,235) | | | 4,935 | | | 1.7 |
| Promotion service rights | 24,426 | | | (23,419) | | | 1,007 | | | 0.6 |
| Customer relationships | 22,690 | | | (19,311) | | | 3,379 | | | 2.4 |
| Data access rights | 10,206 | | | (10,206) | | | — | | | 0.0 |
| Domain names | 5,948 | | | (5,596) | | | 352 | | | 0.0 |
| Trade names | 2,823 | | | (2,823) | | | — | | | 0.0 |
| Vendor relationships | 2,510 | | | (2,510) | | | — | | | 0.0 |
| Patents | 975 | | | (945) | | | 30 | | | 0.8 |
| Registered users | 420 | | | (420) | | | — | | | 0.0 |
| | $ | 132,750 | | | $ | (119,747) | | | $ | 13,003 | | | 1.5 |
As of December 31, 2022 and 2021, the Company has a domain name with a gross value of $0.4 million with an indefinite useful life that is not subject to amortization.
Intangible assets subject to amortization are amortized over their useful lives as shown in the table above. Amortization expense related to intangible assets subject to amortization was $8.5 million, $21.8 million and $29.1 million for the years ended December 31, 2022, 2021 and 2020, respectively. Estimated future amortization expense related to intangible assets as of December 31, 2022 is as follows (in thousands):
| | | | | |
| | Total |
| 2023 | $ | 3,583 | |
| 2024 | 559 | |
| 2025 | — | |
| 2026 | — | |
| 2027 | — | |
| Thereafter | — | |
| Total estimated amortization expense | $ | 4,142 | |
8. Restructuring Charges
The Company has carried out certain restructuring activities to further drive operational efficiencies and to align its resources with its business strategies. Restructuring charges include severance and benefit costs related to headcount reduction recorded on the consolidated statement of operations based on the impacted employees function, and contract termination costs. During the year ended December 31, 2022, the Company recognized restructuring expense of $6.7 million, of which $6.4 million related to severance and benefit costs and $0.3 million related to contract termination costs. During the years ended December 31, 2021, and 2020, the Company recognized restructuring expense of $2.7 million, and $1.5 million, respectively, which related to severance and benefit costs.
9. Debt Obligations
2017 Convertible Senior Notes
In November 2017, the Company issued and sold $200.0 million aggregate principal amount of 1.75% convertible senior notes due December 2022 in a private placement to qualified institutional buyers pursuant to Rule 144A under the Securities Act of 1933, as amended, (the “notes”). The notes were unsecured obligations of the Company and bore interest at a fixed rate of 1.75% per annum, payable semi-annually in arrears on June 1 and December 1 of each year, commencing on June 1, 2018. The total net proceeds from the debt offering, after deducting transaction costs, were approximately $193.8 million. On December 1, 2022, the Company repaid the notes in full, including accrued interest.
The conversion rate for the notes was initially 57.6037 shares of the Company’s common stock per $1,000 principal amount of notes, which is equivalent to an initial conversion price of approximately $17.36 per share of common stock, subject to adjustment upon the occurrence of specified events. The terms of the notes provided that the holders of the notes were entitled to convert their notes at their option at any time prior to the close of business on the business day immediately preceding September 1, 2022, only under the following circumstances: (1) during any calendar quarter commencing after the calendar quarter ending on March 31, 2018 (and only during such calendar quarter), if the last reported sale price of the Company’s common stock for at least 20 trading days (whether or not consecutive) during a period of 30 consecutive trading days ending on, and including, the last trading day of the immediately preceding calendar quarter is greater than or equal to 130% of the conversion price on each applicable trading day; (2) during the five-business day period after any five consecutive trading day period (the “measurement period”) in which the trading price per $1,000 principal amount of notes for each trading day of the measurement period was less than 98% of the product of the last reported sale price of the Company’s common stock and the conversion rate for the notes on each such trading day; (3) if the Company calls any or all of the notes for redemption, at any time prior to the close of business on the scheduled trading day immediately preceding the redemption date; or (4) upon the occurrence of specified corporate events. The terms of the notes further provided that, on or after September 1, 2022, holders were entitled to convert all or any portion of their notes at any time prior to the close of business on the scheduled trading day immediately preceding the maturity date regardless of the foregoing conditions. During the fourth quarter of 2022, the Company settled the principal amount of the notes with cash.
In accounting for the issuance of the notes, prior to the adoption of ASU 2020-06 on January 1, 2022, the Company separated the notes into liability and equity components. The carrying amount of the liability component of $149.3 million was calculated by measuring the fair value of a similar debt instrument that does not have an associated convertible feature. The carrying amount of the equity component of $50.7 million, representing the conversion option, was determined by deducting the fair value of the liability component from the par value of the notes. The excess of the principal amount of the liability component over its carrying amount (“debt discount”) was amortized to interest expense over the term of the notes at an effective interest rate of 5.8%.
Prior to the adoption of ASU 2020-06 on January 1, 2022, the Company allocated the total debt issuance costs incurred of $6.2 million to the liability and equity components of the notes in proportion to the respective values. Issuance costs attributable to the liability component of $4.6 million were amortized to interest expense using the effective interest method over the contractual terms of the notes. Issuance costs attributable to the equity component of $1.6 million were netted with the equity component in additional paid-in capital.
Subsequent to the adoption of ASU 2020-06 on January 1, 2022, which the Company elected to adopt using the modified retrospective method, the Company removed the impact of recognizing the equity component of the notes (at issuance and subsequent accounting impact of additional interest expense from debt discount amortization). The cumulative effect of the accounting change as of January 1, 2022 was an increase to the carrying amount of the convertible notes of $10.4 million, an increase to beginning retained earnings of $38.7 million, and a reduction to additional paid-in capital of $49.1 million.
The net carrying amount of the liability component of the notes recorded in convertible senior notes, net on the consolidated balance sheets was as follows (in thousands):
| | | | | | | | | | | |
| | December 31, 2022 | | December 31, 2021 |
| Principal | $ | — | | | $ | 200,000 | |
| Unamortized debt discount | — | | | (10,358) | |
| Unamortized debt issuance costs | — | | | (856) | |
| Net carrying amount of the liability component | $ | — | | | $ | 188,786 | |
The following table sets forth the interest expense related to the notes recognized in interest expense on the consolidated statements of operations (in thousands): | | | | | | | | | | | | | | | | | |
| | Year Ended December 31, |
| | 2022 | | 2021 | | 2020 |
| Contractual interest expense | $ | 3,208 | | | $ | 3,500 | | | $ | 3,500 | |
| Amortization of debt discount | — | | | 10,689 | | | 10,086 | |
| Amortization of debt issuance costs | 856 | | | 929 | | | 925 | |
| Total interest expense related to the Notes | $ | 4,064 | | | $ | 15,118 | | | $ | 14,511 | |
ABL Credit Agreement
On November 17, 2021, the Company, as borrower, and certain subsidiaries of the Company as guarantors, entered into a Loan, Guaranty and Security Agreement (the "ABL Credit Agreement") with Bank of America, N.A., a national banking association, and certain other financial institutions from time to time that may become parties to the agreement (the "Lenders").
Prior to the First Amendment and Limited Waiver to Loan, Guaranty and Security Agreement dated August 5, 2022 (the "First Amendment"), (as more fully described below), the ABL Credit Agreement provided for an asset-based revolving credit facility (the "ABL Facility") for available borrowings up to $100.0 million with the actual amount dependent on a "borrowing base" number consisting of the sum of various categories of eligible accounts receivable (the lesser of such number and $100.0 million, the "Line Cap"). Prior to the First Amendment, the ABL Credit Agreement provided that the ABL Facility was to mature and all outstanding amounts, if any, become due and payable on November 17, 2026 ("fixed ABL maturity date"). Prior to the First Amendment, the ABL Credit Agreement provided that the commitments of the Lenders under the ABL Facility would terminate and outstanding borrowings
under the ABL Facility would mature on the fifth anniversary of the closing of the ABL Facility or sooner as described above.
Prior to the First Amendment, the ABL Credit Agreement included conditions to borrowings, representations and warranties, affirmative and negative covenants and events of default customary for financings of this type and size, and provided that, in the event of default, all obligations will be automatically due and payable and all commitments will terminate. Prior to the First Amendment, the ABL Credit Agreement required the Company to maintain a minimum fixed charge coverage ratio at all times and limited the Company’s and its subsidiaries’ ability to, among other things, incur additional indebtedness, create liens on any assets, pay dividends or make certain restricted payments, consummate certain assets sales and merge, consolidate and/or sell or dispose of certain assets. Prior to the First Amendment, the ABL Credit Agreement also required that if the Company's Excess Availability (defined as the Line Cap less borrowed amounts or issued letters of credit) were less than the greater of (i) the Line Cap and (ii) $10.0 million, the Company will maintain a fixed coverage charge ratio of at least 1.00 to 1.00. In addition, the ABL Credit Agreement included customary events of default. Prior to the First Amendment, borrowings under the ABL Facility initially would bear interest at a rate equal to, for BSBY Loans, the BSBY Rate plus the Applicable Margin or, for Base Rate Loans, the Base Rate plus the Applicable Margin. The Applicable Margin was to be determined based on average daily borrowing availability.
As of June 30, 2022, the Company was not in compliance with the above covenants; however, on August 5, 2022, the Company entered into the First Amendment. Pursuant to the First Amendment, the Company was provided a waiver of a covenant violation for the quarter ended June 30, 2022. In addition, the terms of the ABL Facility were amended to reduce the aggregate value of the credit facility to $50.0 million, modify the FCCR covenant conditions for the next three fiscal quarters, revise the springing maturity date, and impose a temporary reduction of $5.0 million in funding available based on the Company's FCCR.
On September 1, 2022, the ABL Credit Agreement, as modified by the First Amendment, terminated pursuant to its own terms. During the year ended December 31, 2022, there had been no borrowings or repayments under the ABL Facility.
Term Loan Facility
On November 30, 2022, the Company, as borrower, and certain subsidiaries of the Company as guarantors, entered into a Financing Agreement (the "BT Financing Agreement") with Blue Torch Finance LLC, and certain other financial institutions from time to time that may become parties to the agreement (the "Lenders").
The BT Financing Agreement provides for a term facility (“BT Term Loan Facility") in an aggregate principal amount of up to $55.0 million. The Company drew the entire $55.0 million aggregate commitment amount in November 2022. The proceeds of the loans made under the BT Financing Agreement are required to be used (i) to refinance the Convertible Senior Notes of the Borrower issued November 17, 2017 and (ii) to pay all fees, commissions and expenses related to the BT Financing Agreement. Amounts borrowed under the BT Term Loan Facility may be repaid prior to the maturity date. Beginning with the quarter ended March 31, 2023, the BT Term Loan Facility requires quarterly principal payments of $0.7 million until it matures and all remaining outstanding amounts, if any, become due and payable on November 30, 2026. Substantially all of the Company's assets serve as collateral in an event of default per the terms of the financing agreement.
Interest rates for borrowings under the BT Term Loan Facility are determined by whether the Company elects a secured overnight financing rate loan (“SOFR Loan”) or reference rate loan (”Reference Rate Loan”). For SOFR Loans, the interest rate is based upon the sum of (a) the applicable margin (8.00%), (b) the forward-looking term rate based on SOFR, subject to a floor of 1.50%, and (c) 0.26161%. For Reference Rate Loans, the interest rate is based upon the sum of the applicable margin (7.00%), and the highest of the Prime Rate, Federal Funds Rate plus 0.50%, forward-looking term rate based on SOFR plus 1.00%, or 2.50%.
The Company incurred $4.3 million of debt issuance costs and fees paid to the lenders in relation to the BT Term Loan Facility, which are capitalized and deferred when incurred and subsequently amortized over the term of the BT Term Loan Facility. Interest expense in relation to the BT Term Loan Facility, including debt discount and debt issuance cost amortization, was $0.7 million for the year ended December 31, 2022. The effective interest rate of the Term Loan, including amortization of debt issuance costs for the year ended December 31, 2022 was approximately 15.50%.
There were no repayments under the BT Term Loan Facility during the year ended December 31, 2022.
The BT Term Loan Facility includes conditions to borrowings, representations and warranties, affirmative and negative covenants and events of default customary for financings of this type and size. The Term Loan Facility requires the Company to maintain a maximum leverage ratio, minimum fixed charge coverage ratio, and minimum liquidity of $25.0 million at all times. The BT Term Loan facility requires mandatory prepayments equal to 75% of Excess Cash Flow (as defined in the BT Financing Agreement) when the Company's maximum leverage ratio is greater than 1.75:1.00, mandatory prepayments equal to 50% of Excess Cash Flow when the maximum leverage ratio is less than or equal to 1.75:1.00 and greater than 1.00:1.00 and mandatory prepayments equal to 25% of Excess Cash Flow when the maximum leverage ratio is less than or equal to 1.00:1.00. The BT Term Loan Facility limits the Company’s and its subsidiaries’ ability to, among other things, incur additional indebtedness, create liens on any assets, pay dividends or make certain restricted payments. The BT Term Loan Facility includes customary events of default, which may require the Company to pay an additional 2% interest on the outstanding loans under the BT Term Loan Facility. As of December 31, 2022, the Company was in compliance with its debt covenants under the BT Financing Agreement.
Asset-Based Revolving Credit Facility
On November 30, 2022, the Company, as borrower, and certain subsidiaries of the Company as guarantors, entered into a Financing Agreement (the "PNC Financing Agreement") with PNC Bank, N.A., a national banking association, and certain other financial institutions from time to time that may become parties to the agreement (the "Lenders").
The PNC Financing Agreement provides for an asset-based revolving credit facility (“PNC Revolver Facility”) for available borrowings up to $50.0 million with the actual amount dependent on a “borrowing base” number consisting of the sum of various categories of eligible accounts receivables (the lesser of such number and $50.0 million, the “Line Cap”). The PNC Revolver Facility includes a letter of credit sub-facility in the aggregate availability of $5.0 million as a sublimit of the PNC Revolver Facility. Proceeds from the PNC Revolver Facility are to be used for general corporate purposes. Amounts borrowed under the PNC Revolver Facility may be repaid and, prior to the maturity date, reborrowed. The PNC Revolver Facility matures and all outstanding amounts, if any, become due and payable on September 1, 2026. Substantially all of the Company's assets serve as collateral in an event of default per the terms of the financing agreement.
Interest rates for draws upon the PNC Revolver Facility are determined by whether the Company elects a secured overnight financing rate loan (“SOFR Loan”) or reference rate loan (”Reference Rate Loan”). For SOFR Loans, the interest rate is based upon the forward-looking term rate based on SOFR plus an applicable margin (1.75%), subject to a floor of 0.00% plus a SOFR adjustment. For Reference Rate Loans, the interest rate is based upon the sum of (a) the applicable margin (0.75%) and (b) the highest of the overnight bank funding rate plus 0.50%, the sum of daily simple SOFR plus 1.00%, or the commercial lending rate of PNC Bank, N.A.
In addition to paying interest on outstanding principal under the PNC Revolver Facility, the Company is required to pay a facility fee to the lender under the PNC Revolver Facility in respect of the unused commitments thereunder. The facility fee rate is based on the daily unused amount of the PNC Revolver Facility and is one-half of one percent (0.5%) per annum based on the unused facility amount, or three-eighths of one percent (0.375%) per annum if the aggregate amount of cash held in deposit accounts as the depository bank for each day in such calendar quarter is at least $20.0 million.
The Company incurred $2.5 million of debt issuance costs and fees paid to the lenders in relation to the PNC Revolver Facility, and are capitalized and deferred when incurred and subsequently amortized on a straight-line basis over the term of the PNC Revolver Facility, within other assets on the accompanying consolidated balance sheets.
During the year ended December 31, 2022, there were no borrowings or repayments under the PNC Revolver Facility.
The PNC Revolver Facility includes conditions to borrowings, representations and warranties, affirmative and negative covenants and events of default customary for financings of this type and size. The PNC Revolver Facility requires the Company to maintain minimum liquidity of $15.0 million at all times and to maintain a fixed charge coverage ratio whenever liquidity is less than $20.0 million . The PNC Revolver Facility limits the Company’s and its
subsidiaries’ ability to, among other things, incur additional indebtedness, create liens on any assets, pay dividends or make certain restricted payments. The PNC Revolver Facility includes customary events of default, which may require the Company to pay an additional 2% interest on the outstanding loans under the PNC Revolver Facility. As of December 31, 2022, the Company was in compliance with its debt covenants under the PNC Financing Agreement.
10. Stock-based Compensation
2013 Equity Incentive Plan
In October 2013, the Company adopted the 2013 Equity Incentive Plan (the “2013 Plan”), which became effective in March 2014 and serves as the successor to the Company’s 2006 Stock Plan (the “2006 Plan”). Pursuant to the 2013 Plan, 4,000,000 shares of common stock were initially reserved for grant, plus (1) any shares that were reserved and available for issuance under the 2006 Plan at the time the 2013 Plan became effective, (2) any shares that become available upon forfeiture or repurchase by the Company under the 2006 Plan and (3) any shares added to the 2013 Plan pursuant to the next paragraph.
Under the 2013 Plan, the Company may grant stock options, stock appreciation rights, restricted stock, restricted stock units ("RSUs"), and performance-based stock units ("PSUs") to employees, directors and consultants. The shares available will be increased at the beginning of each year by the lesser of (i) 4% of outstanding common stock on the last day of the immediately preceding year, or (ii) such number determined by the Board of Directors and subject to additional restrictions relating to the maximum number of shares issuable pursuant to incentive stock options. Under the 2013 Plan, both the incentive stock options (ISOs) and non-qualified stock options (NSOs) are granted at a price per share not less than 100% of the fair market value on the effective date of the grant. The Board of Directors determines the vesting period for each option award on the grant date, and the options generally expire 10 years from the grant date or such shorter term as may be determined by the Board of Directors.
Stock Options
The fair value of each option was estimated using Black-Scholes model on the date of grant for the periods presented using the following assumptions:
| | | | | | | | | | | | | | | | | |
| | Year Ended December 31, |
| | 2022 | | 2021 | | 2020 |
| Expected life (in years) | 6.02 | | 0.00 | | 6.02 |
| Risk-free interest rate | 2.90% - 2.96% | | — | % | | 0.96% |
| Volatility | 50 | % | | — | % | | 50 | % |
| Dividend yield | — | | | — | | | — | |
The weighted-average grant-date fair value of options granted were $1.85 and $4.26 per share during the years ended December 31, 2022, and 2020, respectively. There were no option grants during the year ended December 31, 2021.
Restricted Stock Units and Performance-Based Restricted Stock Units
The fair value of RSUs equals the market value of the Company’s common stock on the date of the grant. The RSUs are excluded from issued and outstanding shares until they are vested.
On March 1, 2021, the Company granted a total of 938,831 performance-based restricted stock units (“2021 PSU Awards”), under the 2013 Equity Incentive Plan, to certain executive leaders with a grant date fair value of $13.28. The PSU Award represents the right to receive shares of the Company’s common stock upon meeting certain vesting conditions. The 2021 PSU Awards will vest in three years subject to the achievement of certain operating performance goals, stock performance goals and continued employment. The fair value of the 2021 PSU Award was measured using a Monte Carlo simulation. As of December 31, 2022, the Company performed an assessment and determined that the likelihood of achievement of certain operating performance goals was not deemed probable. As such, during the year ended December 31, 2022, no compensation expense was recognized in the Company's consolidated financial statements related to the 2021 PSU Awards. During the second quarter of
2022, certain of the 2021 PSU Awards were modified in connection with a separation agreement between the Company and its former chief executive officer ("former CEO"). Refer to "Stock-based Compensation Expense" below for further details.
On March 1, 2022, (“2022 Grant Date”), the Company granted a total of 1,171,494 performance-based restricted stock units (“2022 PSU Awards”), under the 2013 Equity Incentive Plan, to certain executive leaders with a grant date fair value of $4.82, $3.87 and $3.14, for each respective tranche. On August 1, 2022, the Company granted an additional 2022 PSU Award of 470,383 shares to an executive with a grant date fair value of $1.14, $0.81, and $0.60 for each respective tranche. The 2022 PSU Awards represent the right to receive shares of the Company’s common stock upon meeting certain vesting conditions. The 2022 PSU Awards vest subject to the achievement of stock performance goals and the awardee being an employee at the time of vesting. Any unvested portion of the 2022 PSU Awards will be forfeited on the third anniversary of the 2022 Grant Date. The fair value of the PSU Award was measured using a Monte Carlo simulation. During the year ended December 31, 2022, the expense recognized in the Company's consolidated financial statements related to the 2022 PSU Awards was $3.1 million. During the second quarter of 2022, certain of the 2022 PSU Awards were modified in connection with a separation agreement between the Company and its former CEO. Refer to "Stock-based Compensation Expense" below for further details.
A summary of the Company’s stock option and RSU, including PSU, award activity under the 2013 Plan are as follows:
| | | | | | | | | | | | | | | | | | | | | | | | | | | | | | | | | | | | | | | | | |
| | | | Options Outstanding | | RSUs Outstanding |
| | Shares
Available
for Grant | | Number of Shares | | Weighted
Average
Exercise
Price | | Weighted
Average
Remaining
Contractual
Term (Years) | | Aggregate
Intrinsic
Value
(in thousands) | | Number of
Shares | | Weighted
Average
Grant
Date Fair
Value |
| Balance as of December 31, 2020 | 8,467,143 | | | 8,160,221 | | | $ | 11.21 | | | 5.03 | | $ | 7,100 | | | 4,708,854 | | | 9.09 | |
| Increase in shares authorized | 3,669,732 | | | — | | | — | | | — | | | — | | | — | | | — | |
| Options exercised | — | | | (1,245,453) | | | $ | 10.60 | | | — | | | $ | 3,777 | | | — | | | — | |
| Options canceled or expired | 16,775 | | | (16,775) | | | $ | 10.53 | | | — | | | — | | | — | | | — | |
| RSUs granted | (3,970,802) | | | — | | | — | | | — | | | — | | | 3,970,802 | | | 11.98 | |
| RSUs released | — | | | — | | | — | | | — | | | — | | | (1,939,752) | | | 9.85 | |
| RSUs canceled or expired | 1,358,865 | | | — | | | — | | | — | | | — | | | (1,358,865) | | | 9.75 | |
| RSUs vested and withheld for taxes | 626,348 | | | — | | | — | | | — | | | — | | | — | | | — | |
| Balance as of December 31, 2021 | 10,168,061 | | | 6,897,993 | | | $ | 11.32 | | | 4.89 | | $ | 1,596 | | | 5,381,039 | | | 10.78 | |
| Increase in shares authorized | 3,791,177 | | | — | | | — | | | — | | | — | | | — | | | — | |
| Options granted | (1,125,000) | | | 1,125,000 | | | $ | 3.64 | | | — | | | — | | | — | | | — | |
| Options canceled or expired | 598,763 | | | (598,763) | | | $ | 7.83 | | | — | | | — | | | — | | | — | |
| RSUs granted | (7,239,055) | | | — | | | — | | | — | | | — | | | 7,239,055 | | | 3.87 | |
| RSUs released | — | | | — | | | — | | | — | | | — | | | (3,146,095) | | | 8.49 | |
| RSUs canceled or expired | 2,395,032 | | | — | | | — | | | — | | | — | | | (2,395,032) | | | 8.63 | |
| RSUs vested and withheld for taxes | 1,205,145 | | | — | | | — | | | — | | | — | | | — | | | — | |
| Balance as of December 31, 2022 | 9,794,123 | | | 7,424,230 | | | $ | 6.61 | | | 4.38 | | $ | 121 | | | 7,078,967 | | | 5.45 | |
| Vested and exercisable as of December 31, 2022 | | | 6,049,050 | | | $ | 7.00 | | | 3.39 | | $ | 13 | | | | | |
The aggregate intrinsic value disclosed in the table above is based on the difference between the exercise price of the options and the fair value of the Company’s common stock.
The aggregate total fair value of shares vested during the years ended December 31, 2022, 2021, and 2020 was $3.6 million, $5.1 million and $7.5 million, respectively.
Additional information for options outstanding and exercisable as of December 31, 2022 is as follows:
| | | | | | | | | | | | | | | | | | | | | | | | | | | | | | | | |
| | | Options Outstanding | | Options Exercisable |
| Exercise Prices | | Number of
Shares | | Weighted Average Remaining Contractual Term (Years) | | Weighted
Average
Exercise
Price | | Number of
Shares | | Weighted
Average
Exercise
Price |
$3.20 - $4.03 | | 1,365,000 | | | 7.81 | | $ | 3.65 | | | 369,687 | | | $ | 3.69 | |
$4.19 | | 2,776,990 | | | 2.49 | | 4.19 | | | 2,776,990 | | | 4.19 | |
$5.48 - $8.51 | | 1,811,151 | | | 5.02 | | 7.61 | | | 1,599,801 | | | 7.65 | |
$8.95 - $16.00 | | 871,089 | | | 6.14 | | 10.19 | | | 702,572 | | | 10.48 | |
$16.25 | | 600,000 | | | 0.87 | | $ | 16.25 | | | 600,000 | | | $ | 16.25 | |
| | | 7,424,230 | | | | | | | 6,049,050 | | | |
Employee Stock Purchase Plan
The Company’s Board of Directors adopted the 2013 Employee Stock Purchase Plan (“ESPP”), which became effective in March 2014, pursuant to which 1,200,000 shares of common stock were reserved for future issuance. In addition, the ESPP provides for annual increases in the number of shares available for issuance on the first day of each year equal to the least of (i) 0.5% of the outstanding shares of common stock on the last day of the immediately preceding year, (ii) 400,000 shares or (iii) such other amount as may be determined by the Board of Directors. Eligible employees can enroll and elect to contribute up to 15% of their base compensation through payroll withholdings in each offering period, subject to certain limitations. Each offering period is six months in duration. The purchase price of the stock is the lower of 85% of the fair market value on (a) the first day of the offering period or (b) the purchase date.
The fair value of the option feature is estimated using the Black-Scholes model for the period presented based on the following assumptions:
| | | | | | | | | | | | | | | | | |
| | Year Ended December 31, |
| | 2022 | | 2021 | | 2020 |
| Expected life (in years) | 0.5 | | 0.5 | | 0.5 |
| Risk-free interest rate | 0.07% - 4.54% | | 0.03% - 0.12% | | 0.12% - 1.59% |
| Volatility | 60% - 80% | | 60% - 75% | | 55% - 60% |
| Dividend yield | — | % | | — | % | | — | % |
During the year ended December 31, 2022, a total of 2,830,970 shares of common stock were issued under the 2013 Employee Stock Purchase Plan (“ESPP”), since inception of the plan. As of December 31, 2022, a total of 1,569,030 shares are available for issuance under the ESPP.
Stock-based Compensation Expense
The following table sets forth the total stock-based compensation expense resulting from stock options, RSUs, and ESPP shares included in the Company’s consolidated statements of operations (in thousands):
| | | | | | | | | | | | | | | | | |
| | Year Ended December 31, |
| | 2022 | | 2021 | | 2020 |
| Cost of revenues | $ | 1,899 | | | $ | 1,905 | | | $ | 1,743 | |
| Sales and marketing | 3,213 | | | 5,012 | | | 5,311 | |
| Research and development | 2,413 | | | 3,876 | | | 3,831 | |
| General and administrative | 24,928 | | | 12,019 | | | 17,486 | |
| Total stock-based compensation expense | $ | 32,453 | | | $ | 22,812 | | | $ | 28,371 | |
In the second quarter of 2022, the Company recorded $12.0 million of stock-based compensation expense related to the modification of stock options, RSUs and PSUs granted to the Company's former CEO pursuant to a
separation agreement between the Company and its former CEO entered into during the second quarter of 2022. Under the original terms of the grant agreements, the unvested stock options, RSUs and PSUs were to be forfeited upon termination of the former CEO's employment. The separation agreement extended the period over which the vested options can be exercised, repriced certain stock options, and allowed for accelerated vesting of unvested stock options, RSUs and PSUs upon the former CEO's termination of employment, which occurred on June 29, 2022. The expense was included in general and administrative expense in the Company's consolidated statement of operations. Such modification of these options and awards resulted in a change to deferred tax assets fully offset by a valuation allowance.
During the years ended December 31, 2022, 2021, and 2020 the Company capitalized stock-based compensation cost of $1.2 million, $0.4 million, and $0.4 million, respectively, of stock-based compensation expense associated with projects in process and recorded as part of property and equipment, net on the accompanying consolidated balance sheets.
As of December 31, 2022, there was $31.4 million unrecognized stock-based compensation expense of which $3.3 million is related to stock options and ESPP and $28.1 million is related to RSUs. The total unrecognized stock-based compensation expense related to stock options and ESPP as of December 31, 2022 will be amortized over a weighted-average period of 2.26 years. The total unrecognized stock-based compensation expense related to RSUs as of December 31, 2022 will be amortized over a weighted-average period of 2.54 years.
11. Stockholders’ Equity
Amended and Restated Certificate of Incorporation
In March 2014, the Company filed an amended and restated certificate of incorporation, which became effective immediately following the completion of the Company’s IPO. Under the restated certificate of incorporation, the authorized capital stock consists of 250,000,000 shares of common stock and 10,000,000 shares of preferred stock.
Common Stock. The rights, preferences and privileges of the holders of common stock are subject to the rights of the holders of shares of any series of preferred stock which the Company may issue in the future. Subject to the foregoing, for as long as such stock is outstanding, the holders of common stock are entitled to receive ratably any dividends as may be declared by the Board of Directors out of funds legally available for dividends. Holders of common stock are entitled to one vote per share on any matter to be voted upon by stockholders. The amended and restated certificate of incorporation establishes a classified Board of Directors that is divided into three classes with staggered three years terms. Only the directors in one class will be subject to election at each annual meeting of stockholders, with the directors in other classes continuing for the remainder of their three year terms. Upon liquidation, dissolution or winding-up, the assets legally available for distribution to the Company’s stockholders would be distributable ratably among the holders of common stock and any participating preferred stock outstanding at that time, subject to prior satisfaction of all outstanding debt and liabilities and the preferential rights of and the payment of liquidation preferences, if any, on any outstanding shares of preferred stock.
Preferred Stock. The Board of Directors is authorized to issue undesignated preferred stock in one or more series without stockholder approval and to determine for each such series of preferred stock the voting powers, designations, preferences, and special rights, qualifications, limitations, or restrictions as permitted by law, in each case without further vote of action by the stockholders. The Board of Directors can also increase or decrease the number of shares of any series of preferred stock, but not below the number of shares of that series then outstanding, without any further vote or action by the stockholders. The Board of Directors may authorize the issuance of preferred stock with voting or conversion rights that could adversely affect the voting power or other rights of the holders of common stock.
Amendment. The amendment of the provisions in the restated certificate requires approval by holders of at least 66 2/3% of the Company’s outstanding capital stock entitled to vote generally in the election of directors.
Common Stock Repurchases
The Board of Directors has approved programs for the Company to repurchase shares of its common stock. In February 2021, the Company’s Board of Directors authorized the Company to repurchase up to $50.0 million of its common stock from February 2021 through February 2022 (the "February 2021 Program"). During the year ended December 31, 2022, the Company did not repurchase any shares of its common stock, nor did the Company repurchase any of its common stock thereafter. The Company terminated the February 2021 Program prior to its expiration.
Series A Junior Participating Preferred Stock
On November 12, 2021, the Company filed with the Delaware Secretary of State, a Certificate of Designation designating 250,000 shares of Series A Junior Participating Preferred Stock ("Series A Preferred Stock”), $0.00001 per share par value. The Company designated the Series A Preferred Stock in connection with the Company’s Board’s approval on November 10, 2021 of a Tax Benefits Preservation Plan, as discussed below.
Tax Benefits Preservation Plan
On November 10, 2021, the Company’s Board of Directors approved the Company's entering into the Tax Benefits Preservation Plan. The Tax Benefits Preservation Plan is designed to protect the Company against a possible limitation of the Company's ability to use its net operating losses (the "NOLs") and certain other tax attributes to reduce potential future U.S. federal income tax obligations. The NOLs and certain other tax attributes are valuable assets to the Company, which may inure to the benefit of the Company and its stockholders. However, if the Company experiences an “ownership change,” as defined in Section 382 of the Internal Revenue Code of 1986, as amended (the “Code”), its ability to fully utilize the NOLs and certain other tax attributes will be substantially limited and the timing of the usage of the NOLs and other tax attributes could be substantially delayed, which could significantly impair the value of those assets. Generally, an “ownership change” occurs if the percentage of the Company’s stock owned by one or more of its “5-percent shareholders” (as such term is defined in Section 382 of the Code) increases by more than 50 percentage points over the lowest percentage of stock owned by such stockholder or stockholders at any time over a three-year period. The Tax Benefits Preservation Plan is intended to prevent against such an “ownership change” by deterring any person or group, together with its affiliates and associates, from acquiring beneficial ownership of 4.9% or more of the Company’s securities.
Pursuant to the Tax Benefits Preservation Plan, the Company’s Board declared of a dividend of one preferred share purchase right (“Right”) for each outstanding share of Company common stock, par value $0.00001 per share, to stockholders of record at the close of business on November 24, 2021. Each Right entitles its holder to purchase one one-thousandth of a share of the Company's newly-designated Series A Junior Preferred Stock, par value $0.00001 per share at an exercise price of $28.00 per Right, subject to adjustment.
Subject to certain exceptions, the Rights become exercisable and trade separately from Common Stock only upon the "Distribution Time", which occurs upon the earlier of: (i) the close of business on the tenth (10th) day after the “Stock Acquisition Date” (which is (a) the first date of public announcement that any person or group has become an “Acquiring Person,” which is defined as a person or group that, together with its affiliates and associates, beneficially owns 4.9% or more of the outstanding shares of Common Stock (with certain exceptions, including those described below) or (b) such other date, as determined by the Board, on which a person or group has become an Acquiring Person), or (ii) the close of business on the tenth (10th) business day (or such later date as may be determined by the Board prior to such time as any person or group becomes an Acquiring Person) after the commencement of a tender offer or exchange offer that, if consummated, would result in a person or group becoming an Acquiring Person.
The Board may determine that any person is an Acquiring Person if such person becomes the beneficial owner of 4.9% or more of the then-outstanding shares of Common Stock under the regulations promulgated under the Code.
The Rights will expire on the earliest to occur of: (a) the close of business on November 11, 2024, (b) the time at which the Rights are redeemed or exchanged by the Company, (c) (i) the close of business on the first business day following the certification of the voting results of the Company’s 2022 annual meeting of stockholders, if stockholder approval of the Tax Benefits Preservation Plan has been proposed and not obtained at such meeting or (ii) November 11, 2022, if stockholder approval of the Tax Benefits Preservation Plan has not been obtained by such
date, (d) upon the closing of any merger or other acquisition transaction involving the Company pursuant to a merger or other acquisition agreement that has been approved by the Board before any person or group becomes an Acquiring Person and (e) the time at which the Board determines that the NOLs and certain other tax attributes are utilized in all material respects or that an ownership change under Section 382 of the Code would not adversely impact in any material respect the time period in which the Company could use the NOLs and other tax attributes or materially impair the amount of NOLs and other tax attributes that could be used by the Company in any particular time period, for applicable tax purposes. On April 29, 2022, the Company amended the Tax Benefits Preservation Plan changing the final expiration time of the Tax Benefits Preservation Plan from 5:00 p.m. New York City time on November 11, 2024 to 5:00 p.m. New York City time on January 2, 2023. Pursuant to the terms of the Tax Benefits Preservation Plan, since January 2, 2023 was a holiday, the Rights were in fact set to expire at 5:00 p.m. New York City time on January 3, 2023, the first business day after January 2, 2023.
On January 3, 2023, the Rights expired pursuant to the Tax Benefits Preservation Plan. As a result, all shares of preferred stock previously designated as Series A Junior Participating Preferred Stock were eliminated and returned to the status of authorized but unissued shares of preferred stock, without designation.
12. Income Taxes
The components of the Company’s loss before provision for income taxes were as follows (in thousands):
| | | | | | | | | | | | | | | | | |
| | Year Ended December 31, |
| | 2022 | | 2021 | | 2020 |
| Domestic | $ | 52,181 | | | $ | 45,991 | | | $ | 44,237 | |
| Foreign | 23,808 | | | (4,054) | | | 20,425 | |
| Total | $ | 75,989 | | | $ | 41,937 | | | $ | 64,662 | |
The components of the provision for income taxes are as follows (in thousands):
| | | | | | | | | | | | | | | | | |
| | Year Ended December 31, |
| | 2022 | | 2021 | | 2020 |
| Current: | | | | | |
| Federal | $ | 147 | | | $ | 436 | | | $ | 133 | |
| State | 156 | | | 45 | | | 34 | |
| Foreign | 180 | | | 3,012 | | | 642 | |
| Total current income tax expense | 483 | | | 3,493 | | | 809 | |
| Deferred: | | | | | |
| Federal | (3) | | | 93 | | | 93 | |
| State | (19) | | | 114 | | | 10 | |
| Foreign | 61 | | | (69) | | | (193) | |
| Total deferred income tax expense (benefit) | 39 | | | 138 | | | (90) | |
| Total | $ | 522 | | | $ | 3,631 | | | $ | 719 | |
A reconciliation of the federal statutory income tax rate to the Company’s effective tax rate is as follows:
| | | | | | | | | | | | | | | | | |
| | Year Ended December 31, |
| | 2022 | | 2021 | | 2020 |
| Federal tax | (21.00) | % | | (21.00) | % | | (21.00) | % |
| State income tax, net of federal tax benefit | 0.20 | % | | 0.38 | % | | 0.07 | % |
| Tax credits | (0.41) | % | | (1.09) | % | | (0.78) | % |
| Stock-based compensation | 4.97 | % | | 2.00 | % | | 4.31 | % |
| Foreign income taxes at other than U.S. rates | (0.97) | % | | 9.65 | % | | (2.15) | % |
| Acquisition related costs | — | % | | — | % | | 0.02 | % |
| 162(m) | 5.11 | % | | 2.35 | % | | 1.39 | % |
| GILTI Inclusion | — | % | | 1.42 | % | | — | % |
| Other | 0.98 | % | | 0.12 | % | | 0.44 | % |
| Valuation allowance, net | 11.83 | % | | 14.82 | % | | 18.81 | % |
| Effective tax rate | 0.71 | % | | 8.65 | % | | 1.11 | % |
The Company recorded a provision for income taxes of $0.5 million, $3.6 million and $0.7 million for the years ended December 31, 2022, 2021 and 2020, respectively. The provision for income taxes for the year ended December 31, 2022 was primarily due to decreased earnings in foreign jurisdictions. The provision for income taxes for the years ended December 31, 2021 was primarily due to increased earnings in foreign jurisdictions. The provision for income taxes for the years ended December 31, 2020 was primarily attributable to the impact of the indefinite lived deferred tax liabilities related to tax deductible goodwill, change in the geographical mix of earnings in foreign jurisdictions and state taxes.
As a result of meeting certain employment and capital investment actions under Section 10AA of the India Income Tax Act, the Company’s India subsidiary is wholly exempt from income tax for tax years beginning April 1, 2014 through March 31, 2019 and partially exempt from income tax for tax years beginning April 1, 2019 through March 31, 2024.
The components of the Company’s deferred tax assets and liabilities are as follows (in thousands):
| | | | | | | | | | | |
| | Year Ended December 31, |
| | 2022 | | 2021 |
| Deferred tax assets: | | | |
| Credits and net operating loss carryforward | $ | 120,004 | | | $ | 114,758 | |
| Accrued compensation | 348 | | | 644 | |
| Deferred revenues | 254 | | | 603 | |
| Stock-based compensation | 2,195 | | | 4,571 | |
| Property and equipment | 506 | | | 538 | |
| Purchased intangible assets | 2,348 | | | 9,211 | |
| Operating lease | 6,800 | | | 7,770 | |
| Other deferred tax assets | 1,611 | | | 2,124 | |
| Capitalized research expenditures | 12,720 | | | — | |
| Total deferred tax assets | 146,786 | | | 140,219 | |
| Valuation allowance | (142,927) | | | (130,823) | |
| Deferred tax liabilities: | | | |
| Basis difference on purchased intangible assets | 546 | | | 1,044 | |
| Operating lease | 3,359 | | | 5,670 | |
| Other deferred tax liabilities | — | | | 2,667 | |
| Tax deductible goodwill | 1,984 | | | 2,006 | |
| Total deferred tax liabilities | 5,889 | | | 11,387 | |
| Net deferred tax liabilities | $ | (2,030) | | | $ | (1,991) | |
Other deferred tax assets and liabilities are primarily comprised of the tax effects of charitable contributions, and other miscellaneous accruals. As of December 31, 2022 and 2021, the Company had gross deferred tax assets of $146.8 million and $140.2 million, respectively. The Company also had deferred tax liabilities of $5.9 million and $11.4 million as of December 31, 2022 and 2021, respectively. Realization of the deferred tax assets is dependent upon the generation of future taxable income, if any, the amount and timing is uncertain. Based on the available objective evidence, management believes it is more likely than not that all U.S. and certain foreign deferred tax assets are not realizable. Accordingly, the net deferred tax assets have been fully offset by a valuation allowance. The net valuation allowance increased by $12.1 million and increased by $8.9 million for the years ended December 31, 2022 and 2021, respectively.
As of December 31, 2022, the Company had federal NOL carryforwards of approximately $285.5 million which will begin to expire in the year 2023. The Company also had state and foreign net operating loss carryforwards for income tax purposes of approximately $279.8 million and $53.3 million, respectively. As of December 31, 2022, the Company has research credit carryforwards for federal income tax purposes of approximately $17.7 million which will begin to expire in the year 2032. The Company also had state net research credit carryforwards for income tax purposes of approximately $20.9 million which can be carried forward indefinitely. The Company also had MAT credit carry forwards for Indian income tax purposes of approximately $0.7 million which will begin to expire in the year 2030.
A reconciliation of the gross unrecognized tax benefit is as follows (in thousands):
| | | | | | | | | | | | | | | | | |
| | Year Ended December 31, |
| | 2022 | | 2021 | | 2020 |
| Unrecognized tax benefit - beginning balance | $ | 9,951 | | | $ | 9,260 | | | $ | 8,840 | |
| Increases for tax positions taken in prior years | — | | | 317 | | | — | |
| Increases for tax positions taken in current year | 279 | | | 374 | | | 420 | |
| Unrecognized tax benefit - ending balance | $ | 10,230 | | | $ | 9,951 | | | $ | 9,260 | |
The unrecognized tax benefits, if recognized, would not impact the Company's effective tax rate as the recognition of these tax benefits would be offset by changes in the Company's valuation allowance. The Company does not believe these will be any material changes in its unrecognized tax benefits over the next twelve months.
The Company’s policy to recognize interest and penalties related to income tax matters in income tax expense. As of December 31, 2022 and 2021, the Company had no accrued interest or penalties related to uncertain tax positions. Due to the Company’s historical loss position, all tax years from inception through December 31, 2022 remain open due to unutilized net operating losses.
The Company files income tax returns in the United States and various states and foreign jurisdictions and is subject to examination by various taxing authorities including major jurisdiction like the United States. As such, all its net operating loss and research credit carryforwards that may be used in future years are subject to adjustment, if and when utilized.
Utilization of the net operating loss carryforwards and credits may be subject to a substantial annual limitation due to the ownership change limitations provided by the Internal Revenue Code of 1986, as amended, and similar state provisions. The annual limitation may result in the expiration of net operating losses and credits before their utilization. The most recent analysis of the Company's historical ownership changes was completed through October 31, 2021. Based on the analysis, the Company does not anticipate a current limitation on the tax attributes.
13. Net Income (Loss) per Share
Net Loss per Share Attributable to Common Stockholders
The computation of the Company’s basic and diluted net loss per share is as follows (in thousands, except per share data):
| | | | | | | | | | | | | | | | | |
| | Year Ended December 31, |
| | 2022 | | 2021 | | 2020 |
| Net loss | $ | (76,511) | | | $ | (45,568) | | | $ | (65,381) | |
| | | | | |
Weighted-average number of shares used to
compute net loss per share, basic and diluted | 95,869 | | | 93,686 | | | 90,412 | |
| | | | | |
| Net loss per share, basic and diluted | $ | (0.80) | | | $ | (0.49) | | | $ | (0.72) | |
Basic and diluted net loss per share is the same for each period presented, as the inclusion of all potential common shares outstanding would have been anti-dilutive.
The outstanding common equivalent shares excluded from the computation of the diluted net loss per share for the periods presented because including them would have been antidilutive are as follows (in thousands):
| | | | | | | | | | | | | | | | | |
| | Year Ended December 31, |
| | 2022 | | 2021 | | 2020 |
| Stock options and ESPP | 7,474 | | | 6,956 | | | 8,229 | |
| Restricted stock units | 7,079 | | | 5,381 | | | 4,709 | |
| Shares related to convertible senior notes | — | | | 11,521 | | | 11,521 | |
| | 14,553 | | | 23,858 | | | 24,459 | |
14. Leases
The Company has entered into operating leases primarily for office facilities. These leases have terms which typically range from 1 year to 10 years, and often include options to renew. These renewal terms can extend the lease term up to 6 years, and are included in the lease term when it is reasonably certain that the Company will exercise the option. These operating leases are included as operating lease right-of-use assets on the consolidated balance sheets, and represent the Company’s right to use the underlying asset for the lease term. The present
value of the Company’s obligation to make lease payments is included in other current liabilities and other non-current liabilities on the consolidated balance sheets.
The Company has entered into short-term leases primarily for office facilities with an initial term of twelve months or less, and a professional sports team suite with a 20-year term, which it uses for sales and marketing purposes. The effective lease term for the professional sports team suite is based on the cumulative days available for use throughout the 20-year contractual term, which is less than twelve months and therefore is classified as a short-term lease. As of December 31, 2022, the Company’s lease commitment of $5.0 million, relating to the professional sports team suite, expires in 2034, and does not reflect short-term lease costs. These leases are not recorded on the Company's consolidated balance sheet due to the accounting policy election as discussed under Note 2 to the consolidated financial statements.
All operating lease expense is recognized on a straight-line basis over the lease term. During the year ended December 31, 2022, the Company recognized $5.1 million in total lease costs, which is comprised of $4.9 million in operating lease costs for right-of-use assets and $0.2 million in short-term lease costs related to short-term operating leases.
Because the rate implicit in each lease is not readily determinable, the Company uses its incremental borrowing rate to determine the present value of the lease payments. The Company has certain contracts for office facilities which may contain lease and non-lease components which it has elected to be treated as a single lease component due to the accounting policy election as discussed under Note 2 to the consolidated financial statements.
During the first quarter of 2022, the Company exited occupancy of its leased office space in San Francisco, California. During the second quarter of 2022, the Company exited occupancy of a leased office space in Santa Clara, California, and a portion of its leased office space in New York, New York. The exits of these leased office spaces are intended to align with the Company's continued operational and cost optimization efforts. The Company has the ability and intent to sublease these office spaces for the remainder of the respective lease terms. The Company determined that a triggering event had occurred that required an interim impairment assessment for certain of its long-lived and right-of-use assets. The Company performed an interim impairment assessment in the first and second quarter of 2022. In measuring the estimated amount of long-lived and right-of-use asset impairment, the Company considered estimated future sublease income including the consideration of local real estate market conditions. The Company also factored the time to identify a tenant and to enter into an agreement. Based on a discounted cash flow analysis, the Company concluded that the carrying value of certain long-lived and right-of-use assets was not recoverable. As such, during the year ended December 31, 2022, the Company recorded an impairment charge of $10.0 million, within general and administrative expenses on its consolidated statements of operations.
Beginning Q1 2023, the Company has subleased its San Francisco, California office space. The lease term is approximately fifty-four months for approximately 15,607 rentable square feet.
Supplemental cash flow information related to operating leases was as follows (in thousands):
| | | | | | | | |
| | Year Ended December 31, |
| | 2022 | 2021 |
| Cash paid for operating lease liabilities | $ | 6,236 | | $ | 4,808 | |
| Right-of-use assets obtained in exchange for lease obligations | — | | 12,021 | |
Supplemental balance sheet information related to operating leases was as follows (in thousands, except lease term and discount rate):
| | | | | | | | |
| | December 31, 2022 | December 31, 2021 |
| Operating right-of-use assets reported as: | | |
| Operating lease right-of-use assets | $ | 14,475 | | $ | 23,874 | |
| | | |
| Operating lease liabilities reported as: | | |
| Other current liabilities | $ | 6,325 | | $ | 4,935 | |
| Other non-current liabilities | 21,221 | | 26,903 | |
| Total operating lease liabilities | $ | 27,546 | | $ | 31,838 | |
| | | |
| Weighted average remaining lease term (in years) | 5.3 | 6.2 |
| Weighted average discount rate | 5.0 | % | 5.0 | % |
Maturities of operating lease liabilities were as follows (in thousands):
| | | | | |
| | Operating Leases |
| 2023 | $ | 7,552 | |
| 2024 | 6,188 | |
| 2025 | 4,802 | |
| 2026 | 3,344 | |
| 2027 | 2,710 | |
| 2028 and thereafter | 7,127 | |
| Total lease payments | $ | 31,723 | |
| | |
| Less: Imputed Interest | (4,177) | |
| Total | $ | 27,546 | |
15. Commitments and Contingencies
Purchase Obligations
The Company has unconditional purchase commitments, primarily related to distribution fees, software license fees and marketing services of $19.9 million as of December 31, 2022.
Some of our agreements with retailers include certain guaranteed distribution fees which, in some cases, may apply to multiple annual periods. If the adoption and usage of our platforms do not meet projections or minimums, these guaranteed distribution fees may not be recoverable and any shortfall may be payable by us at the end of the applicable period. We considered various factors in our assessment including our historical experience with the transaction volumes through the retailer and comparative retailers, ongoing communications with the retailer to increase its marketing efforts to promote the digital platform, as well as the projected revenues, and associated revenue share payments. For example, in 2020 the Company's efforts to implement, with Albertsons Companies, Inc. ("Albertsons"), one of the Company’s solutions resulted in multiple disputes being raised by each of the parties against the other, one of which disputes resulted in the Company not being able to meet the contractual minimum at the end of the applicable period under the agreement. In order to resolve certain of the disputes regarding the parties' respective obligations, the Company recognized a loss of $8.8 million during the year ended December 31, 2020. This loss was included in cost of revenues on our consolidated statements of operations.
During the second quarter of 2021, the Company notified Albertsons that due to Albertsons' failure to meet certain obligations under the agreement, the Company was not obligated to meet the contractual minimums for the period that ended in October 2021. In connection with renewal discussions between the parties, the Company received a letter in October 2021 from Albertsons notifying us of their intent to early terminate the agreement with
the Company related to the delivery of promotions and media campaigns, effective December 31, 2021. The Company informed Albertsons that we disputed their right to terminate the agreement prior to March 31, 2022. On November 16, 2021, the Company notified Albertsons it was terminating the Agreement effective November 18, 2021, due to Albertsons' failure to cure its material breach of the Agreement. Consistent with its offer, the Company continued to provide certain services past the termination date for the benefit of its CPG customers; and ceased providing the last of such services on February 26, 2022. The parties reached a settlement on December 8, 2022, in which the parties have agreed to settle and dismiss all outstanding litigation between them and generally release all claims that existed or may have existed at the time.
Indemnification
In the normal course of business, to facilitate transactions related to the Company’s operations, the Company indemnifies certain parties, including CPGs, advertising agencies, retailers and other third parties. The Company has agreed to hold certain parties harmless against losses arising from claims of intellectual property infringement or other liabilities relating to or arising from our products or services, or other contractual infringement. The term of these indemnity provisions generally survive termination or expiration of the applicable agreement. To date, the Company has not recorded any liabilities related to these agreements. We also have entered into indemnification agreements with our officers and directors, and our Amended and Restated Bylaws also contain provisions relating to circumstances under which the Company may indemnify certain other parties.
The Company’s founder and former CEO, Steven Boal, is subject to a claim from a third party, alleging that he owes certain amounts to the third party in connection with fundraising activities for Quotient that occurred between 1998 and 2006. The Company agreed to advance certain defense costs, subject to an undertaking to repay such amounts if, and to the extent that, it is ultimately determined that he is not entitled to indemnification. In October 2022, the parties, without admitting any liability, reached a settlement of the third-party lawsuit, and the settlement agreement has been approved by the U.S. Bankruptcy Court. The Company expensed $4.5 million related to the settlement agreement.
Litigation
In the ordinary course of business, the Company may be involved in lawsuits, claims, investigations, and proceedings consisting of intellectual property, commercial, employment, and other matters. The Company records a provision for these claims when it is both probable that a liability has been incurred and the amount of the loss, or a range of the potential loss, can be reasonably estimated. These provisions are reviewed regularly and adjusted to reflect the impacts of negotiations, settlements, rulings, advice of legal counsel, and other information or events pertaining to a particular case. In the event that one or more of these matters were to result in a claim against the Company, an adverse outcome, including a judgment or settlement, may cause a material adverse effect on the Company’s future business, operating results, or financial condition.
The Company reached a settlement of an existing claim and therefore recorded an accrual as of December 31, 2022, in addition to the accrual related to the settlement agreement described in "Indemnification" above. The Company believes that material liabilities associated with other existing claims are remote, and therefore, the Company has not recorded any additional accrual for the other existing claims as of December 31, 2022 and 2021. The Company expenses legal fees in the period in which they are incurred.
16. Employee Benefit Plan
The Company maintains a defined-contribution plan in United States that is intended to qualify under Section 401(k) of the Internal Revenue Code. The 401(k) plan provides retirement benefits for eligible employees. Eligible employees may elect to contribute to the 401(k) plan. The Company provides a match of up to the lesser of 3% of each employee’s annual salary or $6,000, which vests immediately for employees with tenure of over a year of continuous employment. The Company’s matching contribution expense was $2.1 million, $2.5 million and $2.2 million for the years ended December 31, 2022, 2021 and 2020, respectively.
17. Concentrations
As of December 31, 2022 and 2021, there was no customer with an accounts receivable balance greater than 10% of total accounts receivable.
For the years ended December 31, 2022, 2021, and 2020, there was no customer that accounted for revenues greater than 10% of revenues for each respective period.
18. Information About Geographic Areas
Revenues generated outside of the United States were insignificant for all periods presented. Additionally, as the Company’s assets are primarily located in the United States, information regarding geographical location is not presented, as such amounts are immaterial to these consolidated financial statements taken as a whole.
Item 9. Changes in and Disagreements with Accountants on Accounting and Financial Disclosure.
None.
Item 9A. Controls and Procedures.
Evaluation of Disclosure Controls and Procedures
The phrase “disclosure controls and procedures” refers to controls and procedures designed to ensure that information required to be disclosed in our reports filed or submitted under the Exchange Act, such as this Annual Report on Form 10-K, is recorded, processed, summarized and reported within the time periods specified in the rules and forms of the U.S. Securities and Exchange Commission (SEC). Disclosure controls and procedures are also designed to ensure that such information is accumulated and communicated to our management, including our chief executive officer (CEO) and chief financial officer (CFO), as appropriate to allow timely decisions regarding required disclosure.
Our management, under the supervision and with the participation of our CEO and CFO, evaluated the effectiveness of the design and operation of our disclosure controls and procedures (as defined in Rules 13a-15(e) and 15d- 15(e) under the Exchange Act), as of the end of the period covered by this Annual Report on Form 10-K. Based upon such evaluation, our CEO and CFO concluded that as of December 31, 2022, our disclosure controls and procedures were effective to provide reasonable assurance that information we are required to disclose in reports that we file or submit under the Exchange Act is recorded, processed, summarized, and reported within the time periods specified by the SEC, and that such information is accumulated and communicated to our management, including our CEO and CFO, as appropriate, to allow timely decisions regarding required disclosure.
Management’s Annual Report on Internal Controls Over Financial Reporting
Our management is responsible for establishing and maintaining adequate internal control over financial reporting (as defined in Rules 13a-15(f) and 15d-15(f) under the Exchange Act). Management conducted an assessment of the effectiveness of our internal control over financial reporting based on the criteria set forth in Internal Control—Integrated Framework issued by the Committee of Sponsoring Organizations of the Treadway Commission (2013 framework). Based on the assessment, management has concluded that its internal control over financial reporting was effective as of December 31, 2022 to provide reasonable assurance regarding the reliability of financial reporting and the preparation of financial statements in accordance with U.S. GAAP.
Our independent registered public accounting firm, Ernst & Young LLP, independently assessed the effectiveness of our internal control over financial reporting, as stated in their attestation report, which is included in Part II, Item 8 of this Form 10-K.
Changes in Internal Control over Financial Reporting
There were no changes in our internal control over financial reporting identified in management’s evaluation pursuant to Rules 13a-15(d) or 15d-15(d) of the Exchange Act during the fourth quarter of 2022 that materially affected, or are reasonably likely to materially affect, our internal control over financial reporting.
Limitations on Effectiveness of Controls and Procedures
In designing and evaluating the disclosure controls and procedures, management recognizes that any controls and procedures, no matter how well designed and operated, can provide only reasonable assurance of achieving the desired control objectives. In addition, the design of disclosure controls and procedures must reflect the fact that there are resource constraints and that management is required to apply judgment in evaluating the benefits of possible controls and procedures relative to their costs.
Item 9B. Other Information.
None.
PART III
Item 10. Directors, Executive Officers, and Corporate Governance
The information called for by this item will be set forth in our Proxy Statement for the Annual Meeting of Stockholders to be filed with the SEC within 120 days after the end of the fiscal year ended December 31, 2022 and is incorporated herein by reference.
Our Board of Directors has adopted a code of business conduct and ethics that applies to all of our employees, officers and directors, including our Chief Executive Officer, Chief Financial Officer and other executive and senior financial officers. The full text of our code of business conduct and ethics is posted on the investor relations page on our website which is located at http://investor.quotient.com. We will post any amendments to our code of business conduct and ethics, or waivers of its requirements, on our website.
Item 11. Executive Compensation
The information called for by this item will be set forth in our Proxy Statement and is incorporated herein by reference.
Item 12. Security Ownership of Certain Beneficial Owners and Management and Related Stockholder Matters
The information required by this item will be set forth in our Proxy Statement and is incorporated herein by reference.
Item 13. Certain Relationships and Related Transactions, and Director Independence
The information, if any, required by this item will be set forth in our Proxy Statement and is incorporated herein by reference.
Item 14. Principal Accountant Fees and Services
The information required by this item will be set forth in our Proxy Statement and is incorporated herein by reference.
PART IV
Item 15. Exhibits, Financial Statement Schedules.
Documents filed as part of this report are as follows:
1.Consolidated Financial Statements
Our consolidated financial statements are listed in the “Index To Consolidated Financial Statements” in Part II, Item 8 of this Annual Report on Form 10-K.
2.Financial Statement Schedules
Financial statement schedules have been omitted because they are not applicable or the required information has been provided in the consolidated financial statements or in the notes thereto of this Annual Report on
Form 10-K.
3.Exhibits
The exhibits listed in the accompanying “Index to Exhibits” are filed or incorporated by reference as part of this report.
Exhibit Index
| | | | | | | | | | | | | | | | | | | | | | | | | | | | | | | | | | | | | | |
| | | | | Incorporated by Reference |
Exhibit
Number | | Exhibit Description | | Form | | File No. | | Exhibit | | Filing
Date | | Filed
Herewith |
| 3.1 | | | | 10-K | | 001-36331 | | 3.1 | | 3/11/2016 | | |
| 3.2 | | | | 8-A | | 001-36331 | | 3.1 | | 11/12/2021 | | |
| 3.3 | | | | 8-K | | 001-36331 | | 3.1 | | 6/30/2022 | | |
| 3.4 | | | | 8-K | | 001-36331 | | 3.1 | | 1/3/2023 | | |
| 3.5 | | | | 10-Q | | 001-36331 | | 3.4 | | 8/9/2022 | | |
| 4.1 | | | | S-1/A | | 333-193692 | | 4.1 | | 2/25/2014 | | |
| 4.2 | | | | S-1 | | 333-193692 | | 4.2 | | 1/31/2014 | | |
| 4.3 | | | | 8-A | | 001-36331 | | 4.1 | | 11/12/2021 | | |
| 4.4 | | | | 8-K | | 001-36331 | | 4.2 | | 4/29/2022 | | |
| 4.5 | | | | | | | | | | | | X |
| 10.1† | | | | S-1/A | | 333-193692 | | 10.1 | | 2/14/2014 | | |
| 10.2† | | | | S-1 | | 333-193692 | | 10.2 | | 1/31/2014 | | |
| 10.3† | | | | S-1 | | 333-193692 | | 10.3 | | 1/31/2014 | | |
| 10.4† | | | | S-1 | | 333-193692 | | 10.4 | | 1/31/2014 | | |
| 10.5† | | | | 10-Q | | 001-36331 | | 10.6 | | 11/8/2016 | | |
| 10.6† | | | | 10-Q | | 001-36331 | | 10.1 | | 11/3/2017 | | |
| 10.7† | | | | 10-Q | | 001-36331 | | 10.7 | | 11/8/2016 | | |
| 10.8† | | | | 10-Q | | 001-36331 | | 10.8 | | 11/8/2016 | | |
| 10.9† | | | | 10-Q | | 001-36331 | | 10.1 | | 11/9/2018 | | |
| 10.10† | | | | 10-Q | | 001-36331 | | 10.2 | | 11/3/2017 | | |
| 10.11† | | | | 10-Q | | 001-36331 | | 10.3 | | 11/3/2017 | | |
| 10.12† | | | | 10-Q | | 001-36331 | | 10.1 | | 5/5/2017 | | |
| 10.13† | | | | S-1 | | 333-193692 | | 10.9 | | 2/25/2014 | | |
| 10.14† | | | | 10-Q | | 001-36331 | | 10.2 | | 11/8/2019 | | |
| | | | | | | | | | | | | | | | | | | | | | | | | | | | | | | | | | | | | | |
| | | | | Incorporated by Reference |
Exhibit
Number | | Exhibit Description | | Form | | File No. | | Exhibit | | Filing
Date | | Filed
Herewith |
| 10.15† | | | | 10-K | | 001-36331 | | 10.18 | | 3/2/2020 | | |
| 10.16† | | | | 10-Q | | 001-36331 | | 10.2 | | 5/10/2021 | | |
| 10.17† | | | | 10-Q | | 001-36331 | | 10.1 | | 5/5/2022 | | |
| 10.18† | | | | 10-Q | | 001-36331 | | 10.5 | | 8/9/2022 | | |
| 10.19† | | | | 10-Q | | 001-36331 | | 10.3 | | 11/8/2016 | | |
| 10.20† | | | | 10-Q | | 001-36331 | | 10.3 | | 11/8/2019 | | |
| 10.21† | | | | 10-Q | | 001-36331 | | 10.3 | | 5/5/2022 | | |
| 10.22† | | | | 10-Q | | 001-36331 | | 10.9 | | 8/9/2022 | | |
| 10.23† | | | | 10-K | | 001-36331 | | 10.26 | | 3/2/2020 | | |
| 10.24† | | | | 10-Q | | 001-36331 | | 10.3 | | 5/10/2021 | | |
| 10.25† | | | | 10-Q | | 001-36331 | | 10.4 | | 5/10/2021 | | |
| 10.26† | | | | 10-Q | | 001-36331 | | 10.4 | | 5/5/2022 | | |
| 10.27† | | | | 10-Q | | 001-36331 | | 10.11 | | 8/9/2022 | | |
| 10.28† | | | | 10-Q | | 001-36331 | | 10.2 | | 5/5/2022 | | |
| 10.29† | | | | 10-Q | | 001-36331 | | 10.6 | | 8/9/2022 | | |
| 10.30† | | | | 10-Q | | 001-36331 | | 10.7 | | 8/9/2022 | | |
| 10.31† | | | | 10-Q | | 001-36331 | | 10.3 | | 8/9/2019 | | |
| 10.32† | | | | 10-Q | | 001-36331 | | 10.4 | | 8/9/2022 | | |
| 10.33† | | | | 10-Q | | 001-36331 | | 10.3 | | 8/9/2022 | | |
| 10.34† | | | | 8-K | | 001-36331 | | 10.1 | | 5/18/2022 | | |
| 10.35 | | | | 10-Q | | 001-36331 | | 10.1 | | 8/5/2020 | | |
| 10.36 | | | | 8-K | | 001-36331 | | 10.1 | | 2/10/2021 | | |
| 10.37 | | | | 8-K | | 001-36331 | | 10.1 | | 12/6/2022 | | |
| 10.38 | | | | 8-K | | 001-36331 | | 10.2 | | 12/6/2022 | | |
| | | | | | | | | | | | | | | | | | | | | | | | | | | | | | | | | | | | | | |
| | | | | Incorporated by Reference |
Exhibit
Number | | Exhibit Description | | Form | | File No. | | Exhibit | | Filing
Date | | Filed
Herewith |
| 21.1 | | | | | | | | | | | | X |
| 23.1 | | | | | | | | | | | | X |
| 24.1 | | | | | | | | | | | | X |
| 31.1 | | | | | | | | | | | | X |
| 31.2 | | | | | | | | | | | | X |
| 32.1* | | | | | | | | | | | | X |
| 32.2* | | | | | | | | | | | | X |
| 101.INS | | Inline XBRL Instance Document the instance document does not appear in the Interactive Data File because its XBRL tags are embedded within the Inline XBRL Document | | | | | | | | | | X |
| 101.SCH | | Inline XBRL Taxonomy Extension Schema Document | | | | | | | | | | X |
| 101.CAL | | Inline XBRL Taxonomy Extension Calculation Linkbase Document | | | | | | | | | | X |
| 101.DEF | | Inline XBRL Taxonomy Extension Definition Linkbase Document | | | | | | | | | | X |
| 101.LAB | | Inline XBRL Taxonomy Extension Label Linkbase Document | | | | | | | | | | X |
| 101.PRE | | Inline XBRL Taxonomy Extension Presentation Linkbase Document | | | | | | | | | | X |
| 104 | | Cover Page Interactive Data File (formatted as inline XBRL with applicable taxonomy extension information contained in Exhibits 101) | | | | | | | | | | X |
| | | | | |
†
| Indicates a management contract or compensatory plan or arrangement. |
| * | The certifications attached as Exhibit 32.1 and 32.2 that accompany this Annual Report on Form 10-K are not deemed filed with the Securities and Exchange Commission and are not to be incorporated by reference into any filing of Quotient under the Securities Act of 1933, as amended, or the Securities Exchange Act of 1934, as amended, whether made before or after the date of this Form 10-K, irrespective of any general incorporation language contained in such filing. |
Item 16. Form 10-K Summary.
None.
SIGNATURES
Pursuant to the requirements of Section 13 or 15(d) of the Securities Exchange Act of 1934, as amended, the Registrant has duly caused this Report to be signed on its behalf by the undersigned, thereunto duly authorized.
| | | | | | | | |
| | Quotient Technology Inc. |
| Date: March 16, 2023 | By: | /s/ Matt Krepsik |
| | | Matt Krepsik |
| | | Chief Executive Officer |
POWER OF ATTORNEY
KNOW ALL PERSONS BY THESE PRESENTS, that each person whose signature appears below constitutes and appoints Matt Krepsik, Yuneeb Khan and Connie Chen, jointly and severally, his attorney-in-fact, each with the full power of substitution, for such person, in any and all capacities, to sign any and all amendments to this Annual Report on Form 10-K, and to file the same, with all exhibits thereto and other documents in connection therewith, with the Securities and Exchange Commission, granting unto said attorney-in-fact and agent full power and authority to do and perform each and every act and thing requisite and necessary to be done in connection therewith, as fully to all intents and purposes as he might do or could do in person hereby ratifying and confirming all that each of said attorneys-in-fact and agents, or his substitute, may do or cause to be done by virtue hereof.
Pursuant to the requirements of the Securities Exchange Act of 1934, as amended, this Report has been signed below by the following persons on behalf of the Registrant in the capacities and on the dates indicated.
| | | | | | | | | | | | | | |
| Name | | Title | | Date |
| | | | | |
| /s/ Matt Krepsik | | Chief Executive Officer and Director (Principal Executive Officer) | | March 16, 2023 |
| Matt Krepsik | | | | |
| /s/ Yuneeb Khan | | Chief Operating Officer and Chief Financial Officer and Treasurer (Principal Financial Officer and Principal Accounting Officer) | | March 16, 2023 |
| Yuneeb Khan | | | | |
| /s/ Kimberly Anstett | | Director | | March 16, 2023 |
| Kimberly Anstett | | | | |
| /s/ Andrew J. Gessow | | Director | | March 16, 2023 |
| Andrew J. Gessow | | | | |
| /s/ Lorraine Hariton | | Director | | March 16, 2023 |
| Lorraine Hariton | | | | |
| /s/ Alison Hawkins | | Director | | March 16, 2023 |
| Alison Hawkins | | | | |
| /s/ Eric Higgs | | Director | | March 16, 2023 |
| Eric Higgs | | | | |
| /s/ Robert McDonald | | Director | | March 16, 2023 |
| Robert McDonald | | | | |
| /s/ David Oppenheimer | | Director | | March 16, 2023 |
| David Oppenheimer | | | | |
| /s/ Joseph Reece | | Director | | March 16, 2023 |
| Joseph Reece | | | | |
| /s/ Michael H. Wargotz | | Director | | March 16, 2023 |
| Michael H. Wargotz | | | | |