UNITED STATES
SECURITIES AND EXCHANGE COMMISSION
Washington, D.C. 20549
FORM 10-K
(Mark One)
For the fiscal year ended December 31 , 2021
OR
For the transition period from ____________ to ____________
Commission file number 001-15827
(Exact name of registrant as specified in its charter)
| State of | |||||||||||
| (State or other jurisdiction of incorporation or organization) | (I.R.S. Employer Identification No.) | ||||||||||
| (Address of principal executive offices) | (Zip code) | ||||||||||
Registrant’s telephone number, including area code: (800 )-VISTEON
Securities registered pursuant to Section 12(b) of the Act:
| Title of Each Class | Trading Symbol(s) | Name of Each Exchange on which Registered | ||||||
Securities registered pursuant to Section 12(g) of the Act:
Indicate by check mark if the registrant is a well-known seasoned issuer, as defined in Rule 405 of the Securities Act. Yes ☑ No ☐
Indicate by check mark if the registrant is not required to file reports pursuant to Section 13 or Section 15(d) of the Exchange Act.
Yes ☐ No ☑
Indicate by check mark whether the registrant (1) has filed all reports required to be filed by Section 13 or 15(d) of the Securities Exchange Act of 1934 during the preceding 12 months (or for such shorter period that the registrant was required to file such reports), and (2) has been subject to such filing requirements for the past 90 days. Yes ☑ No ☐
Indicate by check mark whether the registrant has submitted electronically, every Interactive Data File required to be submitted pursuant to Rule 405 of Regulation S-T (Section 232.405 of this chapter) during the preceding 12 months (or for such shorter period that the registrant was required to submit such files). Yes ☑ No ☐
Indicate by check mark whether the registrant is a large accelerated filer, an accelerated filer, a non-accelerated filer, a smaller reporting company or an emerging growth company. See the definitions of “large accelerated filer," "accelerated filer,” "smaller reporting company" and "emerging growth company" in Rule 12b-2 of the Exchange Act.
If an emerging growth company, indicate by check mark if the registrant has elected not to use the extended transition period for complying with any new or revised financial accounting standards provided pursuant to Section 13(a) of the Exchange Act. ☐
Indicate by check mark whether the registrant has filed a report on and attestation to its management’s assessment of the effectiveness of its internal control over financial reporting under Section 404(b) of the Sarbanes-Oxley Act (15 U.S.C. 7262(b)) by the registered public accounting firm that prepared or issued its audit report. ☑
Indicate by check mark whether the registrant is a shell company (as defined in Rule 12b-2 of the Act). ☐ Yes ☑ No
The aggregate market value of the registrant’s voting and non-voting common equity held by non-affiliates of the registrant on June 30, 2021 (the last business day of the most recently completed second fiscal quarter) was approximately $3.4 billion.
As of February 10, 2022, the registrant had outstanding 28,004,059 shares of common stock.
Document Incorporated by Reference
| Document | Where Incorporated | ||||
| 2022 Proxy Statement | Part III (Items 10, 11, 12, 13 and 14) | ||||
1
Visteon Corporation and Subsidiaries
Index
Part I | Page | |||||||
Item 1A. Risk Factors | ||||||||
Item 1B. Unresolved Staff Comments | ||||||||
Item 2. Properties | ||||||||
Part II | ||||||||
Item 7A. Quantitative and Qualitative Disclosures About Market Risk | ||||||||
Item 9A. Controls and Procedures | ||||||||
Part III | ||||||||
Item 11. Executive Compensation | ||||||||
Part IV | ||||||||
Signatures | ||||||||
2
Part I
Item 1.Business
Description of Business
Visteon Corporation (the "Company" or "Visteon") a global automotive technology company serving the mobility industry, dedicated to creating more enjoyable, connected, and safe driving experiences. Our platforms leverage proven, scalable hardware and software solutions that enable the digital, electric, and autonomous evolution of our global automotive customers, including Ford, BMW, Mazda, Volkswagen, Renault, Nissan, Daimler, General Motors, Stellantis, and Jaguar/Land Rover. Visteon products align with key industry trends and include digital instrument clusters, displays, Android-based infotainment systems, domain controllers, advanced driver assistance systems ("ADAS"), and battery management systems. Visteon is headquartered in Van Buren Township, Michigan, and has an international network of manufacturing operations, technical centers, and joint venture operations dedicated to the design, development, manufacture, and support of its product offerings and its global customers. The Company's manufacturing and engineering footprint is principally located in China, India, Japan, Portugal, Slovakia, and Mexico.
The Company’s Industry
The Company operates in the automotive industry, which is cyclical and highly sensitive to general economic conditions. The Company believes that future success in the automotive industry is, in part, dependent on alignment with customers to support their efforts to effectively meet the challenges associated with the following significant trends and developments in the global automotive industry:
•Electronic content and connectivity - The electronic content of vehicles continues to increase due to various regulatory requirements and consumer demand for increased vehicle performance and functionality. The use of electronic components can reduce weight, expedite assembly, enhance fuel economy, improve emissions, increase safety, and enhance vehicle performance. These benefits coincide with vehicles becoming more electric, connected, and automated. Additionally, digital and portable technologies have dramatically influenced the lifestyle of today’s consumers, who expect products that enable such a lifestyle. Consequently, the vehicle cockpit is transforming into a fully digital environment with multi-display systems incorporating larger, curved, and complex displays and the consolidation of discrete electronic control units into a multi-core domain controller.
•Electric vehicles – The trend towards electrification continues to accelerate, driven by government incentives and standards, announced restrictions of internal combustion engine vehicles in multiple cities and countries, and the significant increase of investment in electrification by Original Equipment Manufacturers ("OEMs"). The shift to electric vehicles increases the digital content of a vehicle as the majority of cockpit electronics will be all-digital to support the new electrical architecture. In addition, all battery electric vehicles will require a battery management system to manage the rechargeable battery pack.
•Advanced driver assistance systems and autonomous driving - The industry continues to advance toward semi-autonomous and autonomous vehicles. The Society of Automotive Engineers has defined five levels of autonomy ranging from levels one and two with driver-assist functions whereby the driver is responsible for monitoring the environment, to level five with full autonomy under all conditions. Levels one and two are already popular in the market while levels three and above utilize a combination of sensors, radars, cameras and LiDARs, requiring sensor fusion and machine learning technologies, as the system assumes the role of monitoring the environment. Level three includes features such as highway pilot and parking assist technology, for which an increased market penetration rate is expected over the next several years.
•Safety and security - Governments continue to focus regulatory efforts on safer transportation. Accordingly, OEMs are working to improve occupant and pedestrian safety by incorporating more safety-oriented technology in their vehicles. Additionally, in-vehicle connectivity has increased the need for robust cybersecurity systems to protect data, applications, and associated infrastructure. Security features are evolving with advances in sensors and suppliers must enable the security/safety initiatives of their customers including the development of such new advances.
•Vehicle standardization - OEMs continue to standardize vehicle platforms on a global basis, resulting in a lower number of individual vehicle platforms, design cost savings, and further scale of economies through the production of a greater number of models from each platform. Having operations in the geographic markets in which OEMs produce global platforms enables suppliers to meet OEMs’ needs more economically and efficiently, thus making global coverage a source of significant competitive advantage for suppliers with a diversified global footprint. Additionally, OEMs are looking to
3
suppliers for increased collaboration to lower costs, reduce risks, and decrease overall time to market. Suppliers that can provide fully engineered systems and pre-assembled combinations of component parts are positioned to leverage the trend toward system sourcing. As vehicles become more connected and cockpits more digitized, suppliers that can deliver modular hardware architectures, “open” software architectures, and a software platform approach will be poised to help OEMs achieve greater reuse of validated hardware circuitry, design scalability, and faster development cycles.
Financial Information about Segments
The Company’s reportable segment is Electronics. The Company's Electronics segment provides automotive electronics products to customers, including instrument clusters, information displays, audio and infotainment systems, battery management systems, telematics solutions, domain controllers, advanced driver assistance systems.
Refer to Note 20, “Segment Information and Revenue Recognition” to the Company's consolidated financial statements included in Part II, Item 8 of this Form 10-K for more information about the Company’s reportable segment.
The Company’s Products
The Company designs and manufactures innovative automotive electronics and connected car solutions further described below:
Instrument Clusters
The Company offers a full line of instrument clusters, from standard analog gauge clusters to high-resolution, all-digital, fully reconfigurable, 2-D and 3-D display-based devices. The Company uses a platform approach to accelerate development and manage multiple vehicle variants. These clusters can use a wide range of display technologies, graphic capabilities, decorative elements, and free-form and curved displays. Premium clusters support complex 3-D graphics and feature embedded functionality such as driver monitoring, camera inputs, and ambient lighting.
Information Displays
The Company offers a range of information displays for various applications within the cockpit, incorporating a sleek profile, high perception quality displays and touch sensors designed to deliver high performance for the automotive market. These displays can integrate a range of user interface technologies and graphics management capabilities, such as 3-D, active privacy, TrueColorTM enhancement, cameras, optics, haptic feedback, and light effects. The Company offers a new generation of large, curved, complex multi-display modules with optical performance designed to be competitive with mobile devices. The Company's microZone™ display technology offers high contrast and brightness and a wide color gamut that enables automotive displays to cost-effectively achieve life-like imaging capability on par with consumer mobile devices, without sacrificing reliability or life span. The Company also developed the first bendable glass multi-display cockpit in the automotive industry.
Audio and Infotainment Systems
The Company offers a range of infotainment and connected car solutions, including scalable Android infotainment for seamless connectivity including integration with Android Auto and Apple CarPlay technology for wireless smartphone projection. Phoenix™, the company's display audio and embedded infotainment platform that is based on Android automotive operating system, enables third-party developers to create apps easily through a software development kit and software simulation of the target hardware system. Additionally, Visteon offers an onboard artificial intelligence ("AI")-based voice assistant with natural language understanding.
Battery Management Systems (“BMS”)
The Company offers configurable battery management systems that support both wired and wireless battery sensing and control. Visteon’s wireless BMS reliably and securely replaces wired communication between battery modules to improve the lifetime enterprise cost, battery weight, and packaging efficiency, and facilitates second-life battery repurposing. By providing a platform approach that can support multiple charging protocols and flexible battery pack architectures, Visteon provides a robust design-to-production strategy that enables advanced features that are fast-to-market.
4
Telematics Solutions
The Company provides a cost-optimized, high-speed telematics control unit to enable secure connected car services, software updates, and data. The Company’s telematics solution uses a single hardware and flexible software architecture to support regional telematics service providers and mobile networks. The Company’s wireless gateway platform is designed to meet future connectivity requirements.
SmartCore Cockpit Domain Controller
The Company offers SmartCore™, an automotive-grade, integrated domain controller approach, which can independently operate the infotainment system, instrument cluster, head-up display, rear-seat displays, and other features on a single, multi-core chip to improve efficiency, create a unified experience across products, and reduce power consumption and cost. The SmartCore domain controller includes: SmartCore Runtime, middleware, enabling communication between domains and apps to be shown on any display; and SmartCore Studio, a PC-based configuration tool to generate hypervisor configurations. The latest generation of SmartCore seamlessly connects the human machine interaction ("HMI") across an increasing number of display domains, such as surround view and in-cabin sensing of driver drowsiness, attentiveness, and facial recognition.
DriveCore Advanced Safety Driving Controller
DriveCore™ is an open, scalable platform for addressing multiple levels of vehicle automation, with a focus on Level 2-plus. DriveCore consists of the centralized computing unit, middleware framework, and software applications process AI/machine learning algorithms for Level 2-plus functionality. DriveCore provides an open platform for the development of sensor-based solutions for the auto industry, including:
•Compute - A modular and scalable cost-efficient computing hardware platform designed to be adapted to Level 2-plus and above levels of automated driving; and
•Runtime - In-vehicle middleware that provides a secure framework enabling applications and algorithms to communicate in a real time, high-performance environment
Body Domain Controller
The Company offers a range of body domain modules which integrate several functions such as central gateway, body controls, comfort and vehicle access solutions into one device. This computing module allows our customers’ to implement in-house applications software into body controls for brand and market differentiation.
The Company’s Customers
The Company's ultimate customers are global vehicle manufacturers including BMW, Daimler, Ford, General Motors, Jaguar/Land Rover, Mazda, Nissan, Renault, Stellantis, and Volkswagen.
The following is a summary of customers with a percentage of net sales greater than 10 percent:
| Percentage of Total Net Sales | ||||||||||||||||||||
| December 31, | ||||||||||||||||||||
| 2021 | 2020 | 2019 | ||||||||||||||||||
| Ford | 22 | % | 22 | % | 22 | % | ||||||||||||||
| BMW | 11 | % | 11 | % | 8 | % | ||||||||||||||
The Company typically supplies products to OEM customers through purchase orders, which are generally governed by general terms and conditions established by each OEM. Although the terms and conditions vary from customer to customer, they typically contemplate a relationship under which customers place orders for their requirements of specific components supplied for particular vehicles but are not required to purchase any minimum quantities. Individual purchase orders can be cancelled for cause, non-performance, and, in most cases, insolvency or certain change in control events. Additionally, many of our OEM customers have the option to terminate contracts for convenience; this option permits the OEM customers to impose pressure on pricing during the life of the vehicle program or issue purchase orders for less than the duration of the vehicle program. This has the potential to reduce the Company’s profit margin and increases the risk of loss of future sales under those purchase contracts.
5
The Company manufactures and ships based on customer release schedules, normally provided on a weekly basis, which can vary based on OEM automotive production or dealer inventory levels. Although customer programs typically extend to future periods, and although there is an expectation that the Company will supply certain levels of OEM production in those future periods, customer agreements (including the applicable terms and conditions) do not necessarily constitute firm orders.
The price related to these products are typically negotiated on an annual basis. Any subsequent price reductions are intended to take into account expected annual cost reductions to the Company of providing products and services to the customer, through such factors as manufacturing productivity enhancements, material cost reductions and design-related cost improvements. Certain products may be excluded from such reductions or experience price increases due to shortages of material or other increases in supply chain or other related costs. The Company has an aggressive cost control program that focuses on reducing its total costs intended to offset customer price reductions or negotiating recoveries for increases. However, there can be no assurance that the Company’s cost reduction or recovery efforts will be sufficient to fully offset such price changes. These relationships may extend over the life of the related vehicle.
The terms and conditions generally require a warranty on products sold; in most cases, the warranty period is the same as the warranty offered by the OEM to the ultimate customer. The Company may also be required to share in all or part of recall costs if the OEM recalls vehicles for defects attributable to Visteon products.
The Company’s Competition
The automotive sector continues to remain highly competitive resulting from the ongoing industry consolidation. OEMs rigorously evaluate suppliers on the basis of financial viability, product quality, price competitiveness, technical expertise, development capability, new product innovation, reliability and timeliness of delivery, product design, manufacturing capability, flexibility, customer service, and overall management. The Company's primary independent competitors include, but are not limited to, Alpine Electronics, Aptiv PLC, Continental AG, Denso Corporation, Faurecia, Harman International Industries, Incorporated (a subsidiary of Samsung Electronics Co. Ltd.), Hitachi Ltd., Hyundai Mobis, Innolux Corporation, Marelli Holdings Co., Ltd., Nippon Seiki, Panasonic Corporation, Preh GmbH, Robert Bosch GmbH, and Vitesco Technologies.
The Company’s Business Seasonality and Cyclicality
Historically, the Company’s business has been moderately seasonal because its largest North American customers typically cease production for approximately two weeks in July for model year changeovers and approximately one week in December during the winter holidays. Customers in Europe historically shut down vehicle production during a portion of August and one week in December. In China, customers typically shut down approximately one week in early October and one week in January or February. Additionally, third-quarter automotive production is traditionally lower as new vehicle models enter production. However, in 2021 the standard cyclicality of the business was altered due to supply chain challenges creating roll shutdowns amongst multiple customer production facilities throughout the year.
Environmental, Social, and Governance
Attract and Retain
The Company’s ability to sustain and grow its business requires the recruitment, retention and development of a highly skilled and diverse workforce. The Company’s Chief Human Resources Officer ("CHRO"), reporting directly to Chief Executive Officer ("CEO"), oversees its global talent processes to attract, develop and retain its employees. To attract the best talent, the Company offers market competitive compensation and benefits around the globe, annual and long-term incentive programs, as well as health and wellness benefits. The Company also provides a variety of resources to help its employees grow in their current roles and build new skills. Hundreds of online courses are available in the Company’s learning management system where individual development is emphasized as part of the annual goal setting process. The Company continues to build tools to be used leaders to develop employees in their current role and create new opportunities within the organization to learn and grow. Because retention of the employee base is significant to its business strategy, executive management discusses it with the Board of Directors on a regular basis.
Workforce
Visteon’s strength comes from a workforce of approximately 10,000 employees operating in approximately 18 countries globally. Our workforce is globally distributed with 26% of employees located in the Americas, 32% in Europe, 19% in China,
6
and 23% in the Asia Pacific region. Visteon believes that all employees are leaders and expects leaders to drive operational and financial results and build strong teams.
Many of the Company’s employees are members of industrial trade unions and confederations within their respective countries. Often these organizations operate under collectively bargained contracts that are not specific to any one employer. The Company constantly works to establish and maintain positive, cooperative relations with its unions and work representatives around the world.
Diversity and Inclusion
Diversity represents an environment where the contributions of all employees are encouraged and valued. As a global organization, the Company embraces human differences and harnesses the power of its employees’ varied backgrounds, cultures and experiences because it is the right thing to do for our people and it creates a competitive business advantage. As of December 31, 2021, the percentage of our global workforce represented by females was approximately 40%. The Company encourages many forms of communication such as global town hall employee meetings, informal small-group employee discussions, and an open-door policy so all employees have direct access to senior leadership and have the opportunity to ask questions, make suggestions, and provide input. As stated in one of our four core beliefs and values, “We treat each other with respect and embrace our differences.”
Workplace Safety
The Company requires protective equipment, enforces comprehensive safety policies and procedures, and encourages its employees and leaders to continually look for ways to improve workplace safety. It has implemented and maintains a health and safety management system that is certified to the OHSAS 18001 or ISO 45001 standard. The Company provides regular health and safety reports to the Board of Directors including updates on the return to work health and safety protocols globally as a result of COVID-19. To protect its employees and maintain operations during the COVID-19 pandemic, the Company implemented a number of new health-related measures including a requirement to wear face-masks at all times while on its property, increased hygiene, cleaning and sanitizing procedures, social-distancing, restrictions on visitors to its facilities, and limiting in-person meetings.
Regulation
Visteon operates in a constantly evolving global regulatory environment and is subject to numerous and varying regulatory requirements for its product performance and material content. Visteon’s strives to identify potential regulatory and quality risks early in the design and development process and proactively manage them throughout the product lifecycle through the use of routine assessments, protocols, standards, performance measures, and audits. New regulations and changes to existing regulations are managed in collaboration with the OEM customers and implemented through Visteon’s global systems and procedures designed to ensure compliance with existing laws and regulations.
Visteon works collaboratively with a number of stakeholder groups including government agencies, customers, and suppliers to proactively engage in federal, state, and international public policy processes.
Environmental, Health, Safety, and Legal Matters
Visteon is involved in various lawsuits, claims and proceedings related to the operation of its businesses, including those pertaining to product liability, environmental, safety and health, intellectual property, employment, commercial and contractual matters, tax, and various other matters. Although the outcome of such lawsuits, claims and proceedings cannot be predicted with certainty and some may be disposed of unfavorably to Visteon, it is management's opinion that none of these will have a material adverse effect on Visteon's financial position, results of operations, or cash flows. Costs related to such matters were not material to the periods presented. Further details are provided in Part II, Item 8 of this Form 10-K in Note 19, "Commitments and Contingencies," of the notes to consolidated financial statements.
Board Oversight of Environmental, Social, and Governance Practices
The Company and its Board of Directors believe positive environmental, social and governance-related business practices strengthens the Company, increases its connection with the stockholders and helps it to better serve its customers and the communities in which it operates. The Company’s commitment to social responsibility extends to the environment, anti-corruption and trade compliance, responsible sourcing, human rights, labor practices, and worker health and safety. In light of the continued importance of these matters, the Board of Directors and Management have developed a multi-year road map to
7
enhance the Company’s environmental, social and governance-related programs and disclosures, including assessment of the potential risks associated with climate change. This road map includes environmental targets for 2025 aimed at reducing energy consumption, solid waste, water and the reduction of scope 1 and scope 2 CO2 emissions through the use of renewable energy. Management provides regular reports and presentations to the Corporate Sustainability and Governance Committee and the full Board of Directors has oversight of the Company’s environmental and social initiatives.
The Company’s Product Research and Development
The Company’s research and development efforts are intended to maintain leadership positions in core products and provide the Company with a competitive edge as it seeks additional business with new and existing customers. The Company also works with technology development partners, including customers, to develop technological capabilities and new products and applications.
The Company’s Intellectual Property
The Company owns significant intellectual property, including a number of patents, copyrights, proprietary tools and technologies, trade secrets, and numerous licensing arrangements. Although the Company’s intellectual property plays an important role in maintaining its competitive position, no single patent, copyright, proprietary tool or technology, trade secret or license, or group of related patents, copyrights, proprietary tools or technologies, trade secrets or licenses is, in the opinion of management, of such value to the Company that its business would be materially affected by the expiration or termination thereof. The Company’s general policy is to apply for patents on an ongoing basis, in appropriate countries, on its patentable developments that are considered to have commercial significance. The Company also views its name and mark as significant to its business as a whole. In addition, the Company holds rights in a number of other trade names and marks applicable to certain of its businesses and products that it views as important to such businesses and products.
The Company’s International Operations
Financial information about sales and net property by major geographic region can be found in Note 20, "Segment Information and Revenue Recognition," to the Company's consolidated financial statements included in Part II, Item 8 of this Form 10-K.
The Company’s Raw Materials and Suppliers
Raw materials used by the Company in the manufacture of its products include electronics components, resins, and precious metals. While generally the supply of the materials used are available from numerous sources, semiconductor suppliers and silicon wafer production is concentrated. In general, the Company does not carry inventories of raw materials in excess of those reasonably required to meet production and shipping schedules. The Company monitors its supply base and endeavors to work with suppliers and customers to mitigate the impact of potential material shortages and supply disruptions.
The Company, along with automotive companies around the world, has experienced a shortage in semiconductors as a result of suppliers inability to rapidly reallocate production to serve the automotive industry during a time of increased demand. The Company's semiconductor suppliers, along with most automotive component supply companies that use semiconductors, have been unable to fully meet the vehicle production demands of our customers due to events which are outside the Company's control, including but not limited to, the COVID-19 pandemic, the global semiconductor shortage, and other extraordinary events. The Company is working closely with suppliers and customers to attempt to minimize potential adverse impacts of these events.
The automotive supply industry is subject to inflationary pressures with respect to raw materials, labor and associated freight costs, which can place operational and financial burdens on the entire supply chain. Accordingly, the Company continues to take actions with its customers and suppliers to mitigate the impact of these inflationary pressures in the future. Actions to mitigate inflationary pressures with customers include collaboration on alternative product designs and material specifications, contractual price escalation clauses, and negotiated customer recoveries. Actions to mitigate inflationary pressures with suppliers include aggregation of purchase requirements to achieve optimal volume benefits, negotiation of cost-reductions, and identification of more cost competitive suppliers. While these actions are designed to offset the impact of inflationary pressures, the Company cannot provide assurance that it will be successful in fully offsetting increased costs resulting from inflationary pressures.
8
The Company’s Website and Access to Available Information
The Company’s current and periodic reports filed with the United States Securities and Exchange Commission (“SEC”), including amendments to those reports, may be obtained through its internet website at www.visteon.com free of charge as soon as reasonably practicable after the Company files these reports with the SEC. A copy of the Company’s code of business conduct and ethics for directors, officers and employees of Visteon and its subsidiaries, entitled “Ethics and Integrity Policy,” the Corporate Governance Guidelines adopted by the Company’s Board of Directors and the charters of each committee of the Board of Directors are also available on the Company’s website. A printed copy of the Company’s Ethics and Integrity Policy may be requested by contacting the Company’s Investor Relations department in writing at One Village Center Drive, Van Buren Township, MI 48111; by phone (734) 710-7893; or via email at investor@visteon.com.
Item 1A.Risk Factors
The risks and uncertainties described below are not the only ones facing the Company. Risks attributable to all registrants are not included below. Additional risks and uncertainties, including those not presently known or that the Company believes to be immaterial, also may adversely affect the Company’s results of operations and financial condition. Should any such risks and uncertainties develop into actual events, these developments could have material adverse effects on the Company’s business and financial results.
Operations Related Risk Factors
The Company could be negatively impacted by the supplier shortages, other supplier distress, or suppliers pricing increases
In an effort to manage and reduce the costs of purchased goods and services, the Company, like many suppliers and automakers, has been consolidating its supply base. As a result, the Company is dependent on single or limited sources of supply for certain components used in the manufacture of its products including semiconductor chips which are integral components of new vehicles and are embedded in multiple vehicle systems including automotive and cockpit electronics. In 2021, the Company experienced semiconductor shortages and expects such shortages to continue in 2022. If such shortages of semiconductors or other critical components from other suppliers continue longer than anticipated, or worsen, it will impact the Company's ability to meet its production schedules for some of its key products or to ship such products to its customers in a timely fashion. Furthermore, unfavorable economic or industry conditions could result in financial distress within the Company's supply base, thereby increasing the risk of supply disruption.
Such disruptions could be caused by any one of a myriad of potential problems, such as closures of one of the Company’s or its suppliers’ plants or critical manufacturing lines due to strikes, mechanical breakdowns, electrical outages, fires, explosions, or political upheaval, as well as logistical complications due to weather, global climate change, volcanic eruptions, or other natural or nuclear disasters, mechanical failures, delayed customs processing, the spread of an infectious disease, virus or other widespread illness and more. Additionally, as the Company grows in best cost countries, the risk for such disruptions is heightened. The lack of even a single small subcomponent necessary to manufacture one of the Company’s products, for whatever reason, could force the Company to cease production, even for a prolonged period. Similarly, a potential quality issue could force the Company to halt deliveries while it validates the products. Even where products are ready to be shipped, or have been shipped, delays may arise before they reach the customer. The Company’s customers may halt or delay production for the same reason if one of their other suppliers fails to deliver necessary components. This may cause the Company’s customers, in turn to suspend their orders, or instruct us to suspend delivery, of our products, which may adversely affect our financial performance.
If the Company were to fail to make timely deliveries in accordance with contractual obligations, the Company generally must absorb its own costs for identifying and solving the “root cause” problem as well as expeditiously producing replacement components or products. Generally, the Company must also carry the costs associated with “catching up,” such as overtime and premium freight. Additionally, if the Company is the cause for a customer being forced to halt production, the customer may seek to recoup all of its losses and expenses from the Company. These losses and expenses could be significant, and may include consequential losses such as lost profits. Any supply-chain disruption, however small, could potentially cause the complete shutdown of an assembly line of one of the Company’s customers, and any such shutdown could lead to material claims of compensation.
The Company continues to work closely with suppliers and customers to minimize any potential adverse impacts of the semiconductor supply shortage and monitor the availability of semiconductor microchips and other component parts and raw materials, customer vehicle production schedules and any other supply chain inefficiencies that may arise, due to this or any
9
other issue. However, if the Company is not able to mitigate the semiconductor shortage impact, any direct or indirect supply chain disruptions may have a material adverse impact on our financial condition, results of operations or cash flows.
The Company has experienced and may in the future experience supplier price increases that could negatively affect our operations and profitability. The price increases are often driven by raw material pricing and availability, component or part availability, manufacturing capacity, industry allocations, logistics capacity, natural disasters or pandemics, the effects of climate change, and significant changes in the financial or business condition of our suppliers.
The Company’s business, results of operations, and financial condition have been, and may continue to be, adversely affected by the recent COVID-19 pandemic
The COVID-19 pandemic poses the risk that the Company or its affiliates and joint ventures, employees, suppliers, customers, and others may be restricted or prevented from conducting business activities for indefinite or intermittent periods of time, including as a result of employee health and safety concerns, shutdowns, shelter in place orders, travel restrictions, and other actions and restrictions that may be requested or mandated by governmental authorities. In addition, the Company has experienced, and may continue to experience, disruptions or delays in our supply chain as a result of such actions, which is likely to result in higher supply chain costs to us in order to maintain the supply of materials and components for our products. While the Company has implemented measures to mitigate the impact on its results of operations, there can be no assurance that these measures will be successful. The Company cannot predict the degree to which, or the period over which, its financials and operations will be affected by this outbreak and preventative measures, and the effects could be material.
The Company may also experience impacts from market downturns and changes in consumer behavior related to pandemic fears and impacts on its workforce as a result of COVID-19. The extent to which the COVID-19 outbreak continues to impact the Company’s financial condition will depend on future developments that are highly uncertain and cannot be predicted, including new government actions or restrictions, new information that may emerge concerning the severity of COVID-19, the longevity of COVID-19, mutation of COVID-19 variants, and the impact of COVID-19 on economic activity. Even after the COVID-19 pandemic subsides, the Company may continue to experience adverse impacts on its business and financial performance as a result of its global economic impact. To the extent the COVID-19 pandemic materially adversely affects the Company’s business and financial results, it may also have the effect of significantly heightening many of the other risks associated with the Company’s business, liquidity, and indebtedness.
The Company’s substantial international operations make it vulnerable to risks associated with doing business in foreign countries
The Company has manufacturing and distribution facilities in many foreign locations. International operations are subject to certain risks inherent in doing business abroad, including, but not limited to:
•changes to international trade agreements;
•local economic conditions, expropriation and nationalization, foreign exchange rate fluctuations, and currency controls;
•withholding, border, and other taxes on remittances and other payments by subsidiaries;
•investment restrictions or requirements;
•export and import restrictions, including increases in border tariffs;
•the ability to effectively enforce intellectual property rights;
•new or additional governmental sanctions on doing business with or in certain countries or with certain persons; and
•increases in working capital requirements related to long supply chains.
Additionally, the Company’s global operations may also be adversely affected by political events, domestic or international terrorist events, and hostilities or complications due to natural or other disasters. These or any further political or governmental developments or health concerns in Mexico, China, or other countries in which the Company operates or where its suppliers are located could result in social, economic, and labor instability. These uncertainties could have a material adverse effect on the continuity of the Company’s business, results of operations, and financial condition.
Despite recent trade negotiations between the U.S. and Chinese governments and between the U.S. and European governments, given the uncertainty regarding the scope and duration of the imposed tariffs, as well as the potential for additional tariffs or
10
trade barriers by the U.S., China or other countries, the Company can provide no assurance that any strategies we implement to mitigate the impact of such tariffs or other trade actions will be successful.
The Company has invested significantly and is expected to continue to invest significantly in joint ventures with other parties to conduct business in China and elsewhere in Asia. These investments may include manufacturing operations, and technical centers as well as research and development activities, to support anticipated growth in the region. If the Company is not able to strengthen existing relationships, secure additional customers, and develop market-relevant electrification, advanced driver assistance and autonomous vehicle technologies, it may fail to realize expected rates of return on these investments. The Company’s ability to repatriate funds from these joint ventures depends not only upon their uncertain cash flows and profits but also upon the terms of particular agreements with the Company’s joint venture partners and maintenance of the legal and political status quo. As a result, the Company’s exposure to the risks described above is substantial. The likelihood of such occurrences and its potential effect on the Company vary from country to country and are unpredictable. However, any such occurrences could be harmful to the Company’s business, profitability, and financial condition.
The Company’s ability to effectively operate could be hindered if it fails to attract and retain key personnel
The Company’s ability to operate its business and implement its strategies effectively depends, in part, on the efforts of its executive officers and other key employees. In addition, the Company’s future success will depend on, among other factors, the ability to attract and retain qualified personnel, particularly engineers and other employees with critical expertise and skills that support key customers and products or in emerging regions. The loss of the services of any key employees or the failure to attract or retain other qualified personnel could have a material adverse effect on the Company’s business.
The Company may incur significant restructuring charges
The Company has taken, and expects to take, restructuring actions to realign its engineering organization and to realign and resize its production capacity and cost structure to meet current and projected operational and market requirements. The extent to which these strategies will achieve the desired efficiencies and goals in 2022 and beyond is uncertain because their success depends on a number of factors, some of which are beyond the Company’s control. Charges related to these actions could have a material adverse effect on the Company's financial condition, operating results, and cash flows. Moreover, there can be no assurances that any future restructuring will be completed as planned or achieve the desired results.
Work stoppages and similar events could significantly disrupt the Company’s business
Because the automotive industry relies heavily on just-in-time delivery of components during the assembly and manufacture of vehicles, a work stoppage at one or more of the Company’s manufacturing and assembly facilities could have material adverse effects on the business. Similarly, if one or more of the Company’s customers were to experience a work stoppage, that customer would likely halt or limit purchases of the Company’s products, which could result in the shutdown of the related manufacturing facilities. A significant disruption in the supply of a key component due to a work stoppage at one of the Company’s suppliers or any other supplier could have the same consequences, and accordingly, have a material adverse effect on the Company’s financial results.
Industry and Competition Related Risk Factors
The Company may not realize sales represented by awarded business
The Company estimates awarded business using certain assumptions, including projected future sales volumes. The OEM customers generally do not guarantee production volumes. In addition, awarded business may include business under arrangements that OEM customers have the right to terminate without penalty. Therefore, the Company’s actual sales volumes, and thus the ultimate amount of revenue that it derives from such sales, are not committed. If actual production orders from its customers are not consistent with the projections used by the Company in calculating the amount of its awarded business, the Company could realize substantially less revenue over the life of these projects than the projected estimate.
The Company must continue to develop, introduce, and achieve market acceptance of new and enhanced products in order to grow its sales in the future
11
The growth of the Company's business will be dependent on the demand for innovative automotive electronics products, including but not limited to electrification, advanced driver assistance and autonomous vehicle technologies. In order to increase sales in current markets and gain entry into new markets, the Company must innovate to maintain and improve existing products, including software, while successfully developing and introducing distinctive new and enhanced products that anticipate changing customer and consumer preferences and capitalize upon emerging software technologies. However, the Company may experience difficulties that delay or prevent the development, introduction, or market acceptance of its new or enhanced products, or undiscovered software errors, bugs, and defects in its products may injure the Company's reputation. Furthermore, these new technologies have also attracted increased competition from outside the traditional automotive industry, and any of these competitors may develop and introduce technologies that gain greater customer or consumer acceptance, which could adversely affect the future growth of the Company.
The automotive industry is cyclical and significant declines in the production levels of the Company’s major customers could reduce the Company’s sales and harm its profitability
Demand for the Company’s products is directly related to the automotive vehicle production of the Company’s major customers. Automotive sales and production are cyclical and can be affected by general economic or industry conditions, labor relations issues, fuel prices, regulatory requirements, government initiatives, trade agreements, the cost and availability of credit, and other factors. Due to overall global economic conditions, including semiconductor shortages, in 2021, the automotive industry experienced constrained production schedules.
The discontinuation or loss of business, or lack of commercial success, with respect to a particular product for which the Company is a significant supplier could reduce the Company’s sales and harm its profitability
Although the Company has purchase orders from many of its customers, these purchase orders generally provide for the supply of a customer’s annual requirements for a particular vehicle model and assembly plant, or in some cases, for the supply of a customer’s requirements for the life of a particular vehicle model, rather than for the purchase of a specific quantity of products. In addition, certain customers have communicated an intent to manufacture components internally that are currently produced by outside suppliers, such as the Company. If the Company's OEM customers successfully insource products currently manufactured by the Company the discontinuation or loss of business for products which the Company is a significant supplier could reduce the Company’s sales and harm the Company’s profitability.
Escalating price pressures from customers may adversely affect the Company’s business
Downward pricing pressures by automotive manufacturers, while characteristic of the automotive industry, are increasing. Virtually all automakers have implemented aggressive price-reduction initiatives and objectives each year with their suppliers, and such actions are expected to continue in the future. In addition, estimating such amounts is subject to risk and uncertainties because any price reductions are a result of negotiations and other factors. Accordingly, suppliers must be able to reduce their operating costs in order to maintain profitability. The Company has taken steps to reduce its operating costs and other actions to offset customer price reductions; however, price reductions have impacted the Company’s sales and profit margins and are expected to continue to do so in the future. If the Company is unable to offset customer price reductions in the future through improved operating efficiencies, new manufacturing processes, sourcing alternatives, and other cost-reduction initiatives, the Company’s results of operations and financial condition will likely be adversely affected.
The Company is highly dependent on Ford Motor Company and decreases in this customer’s vehicle production volumes would adversely affect the Company
Ford is one of the Company’s largest ultimate customers and accounted for 22% of sales for each of the years 2021, 2020 and 2019, respectively. Accordingly, any change in Ford's vehicle production volumes may have a significant impact on the Company’s sales volume and profitability.
Product Related Risk Factors
The Company's inability to effectively manage the timing, quality, and costs of new program launches could adversely affect its financial performance
12
In connection with the award of new business, the Company often obligates itself to deliver new products and services that are subject to its customers’ timing, performance, and quality standards. Additionally, as a Tier 1 supplier, the Company must effectively coordinate the activities of numerous suppliers in order to launch programs successfully. Given the complexity of new program launches, especially involving new and innovative technologies, the Company may experience difficulties managing product quality, timeliness, and associated costs. In addition, new program launches require a significant ramp up of costs; however, the sales related to these new programs generally are dependent upon the timing and success of the introduction of new vehicles by the Company's customers. The Company's inability to effectively manage the timing, quality, and costs of these new program launches could adversely affect its results of operations, financial condition, and cash flows from operations.
Warranty claims, product liability claims, and product recalls could harm the Company’s business, results of operations, and financial condition
The Company faces the inherent business risk of exposure to warranty and product liability claims in the event that its products fail to perform as expected or such failure results, or is alleged to result, in bodily injury or property damage (or both). In addition, if any of the Company’s designed products are defective or are alleged to be defective, the Company may be required to participate in a recall campaign. The Company’s products contain increasingly significant amounts of software and a successful cyberattack on such products could cause materially adverse effects on the Company’s business, results of operations, and reputation. In addition, as the Company expands its electrification product offering such products may present a different risk profile. As suppliers become more integrally involved in the vehicle design process and assume more of the vehicle assembly functions, automakers are increasingly expecting them to warrant their products and are increasingly looking to suppliers for contributions when faced with product liability claims or recalls. A successful warranty or product liability claim against the Company, or a requirement that the Company participate in a product recall campaign, could have materially adverse effects on the Company’s business, results of operations, and financial condition.
Developments or assertions by or against the Company relating to intellectual property rights could materially impact its business
The Company owns significant intellectual property, including a number of patents, trademarks, copyrights, and trade secrets and is involved in numerous licensing arrangements. The Company’s intellectual property plays an important role in maintaining its competitive position in a number of the markets served. The Company may utilize intellectual property in its products that requires a license from a third-party. While the Company believes that such licenses generally can be obtained, there is no assurance that the necessary licenses can be obtained on commercially acceptable terms or at all. Failure to obtain the right to use third-party intellectual property could preclude the Company from selling certain products and have materially adverse effects on the Company’s business, results of operations, and financial condition. Developments or assertions by or against the Company relating to intellectual property rights could materially impact the Company’s business.
The Company also derives significant revenue from countries outside the U.S. (including China) and significant intellectual property assets are licensed to joint ventures and customers in foreign jurisdictions. While the Company is not aware of any material intellectual property theft or forced transfer and believes it has appropriate protections in place, if such action were to occur it could materially and adversely affect the Company’s business, results of operations, and financial condition. In addition, the Company has continued to see an increase in patent claims related to connectivity-enabled products where other patent-holding companies are seeking royalties and often enter into litigation based on patent infringement allegations. Significant technological developments by others also could materially and adversely affect the Company’s business, results of operations, and financial condition.
Privacy and security concerns relating to the Company's current or future products and services could damage its reputation and deter current and potential users from using them
The Company may gain access to sensitive, confidential, or personal data or information that is subject to privacy and security laws, regulations, and customer-imposed controls. Concerns about the Company's practices with regard to the collection, use, disclosure, or security of personal information or other privacy related matters, even if unfounded, could damage its reputation and adversely affect its operating results.
Furthermore, regulatory authorities around the world are considering a number of legislative and regulatory proposals concerning cybersecurity and data protection. In addition, the interpretation and application of consumer and data protection laws in the U.S., Europe, and elsewhere are often uncertain and in flux. Complying with these various laws could cause the Company to incur substantial costs.
13
Tax Related Risk Factors
The Company’s expected annual effective tax rate could be volatile and could materially change as a result of changes in mix of earnings and other factors, including changes in tax laws and tax audits.
We are subject to income taxes in the U.S. and various international jurisdictions. Changes in tax rates or tax laws by U.S. and international jurisdictions and tax audits could adversely impact Visteon’s financial results. The Company is in a position whereby losses incurred in certain tax jurisdictions generally provide no current financial statement benefit. In addition, certain jurisdictions have statutory rates greater than or less than the United States statutory rate. As such, changes in the mix and source of earnings between jurisdictions, including changes in tax rates in those jurisdictions, could have a significant impact on the Company’s overall effective tax rate in future periods. Additionally, in the ordinary course of business, we are subject to examinations by various tax authorities. Tax authorities in various jurisdictions could also open new examinations and expand existing examinations for which the outcomes cannot be predicted with certainty. Furthermore, changes in U.S. or foreign tax laws and regulations, or their interpretation and application, could also have a significant impact on the Company’s overall effective rate in future periods.
The Company may not be able to fully utilize its U.S. net operating losses and other tax attributes
The Company has net operating losses ("NOLs") and other tax attributes which could be limited if there is a subsequent change of ownership. If the Company were to have a change of ownership within the meaning of IRC Sections 382 and 383, its NOLs and other tax attributes could be limited to an amount equal to its market capitalization at the time of the ownership change multiplied by the federal long-term tax exempt rate. The Company cannot provide any assurance that such an ownership change will not occur, in which case the availability of the Company's NOLs and other tax attributes could be significantly limited or possibly eliminated. Certain tax benefit preservation provisions of its corporate documents could delay or prevent a change of control, even if that change would be beneficial to stockholders.
Market Related Risk Factors
The Company is subject to significant foreign currency risks and foreign exchange exposure
As a result of Visteon's global presence, a significant portion of the Company's revenues and expenses are denominated in currencies other than the U.S. dollar. The Company is therefore subject to foreign currency risks and foreign exchange exposure. The Company's primary exposures are to the euro, Chinese renminbi, Brazilian real, Indian rupee, and Bulgarian lev. While the Company employs financial instruments to mitigate transactional foreign exchange exposure, including multi-year contracts, exchange rates are difficult to predict, and such actions may not completely insulate the Company from those exposures. As a result, volatility in certain exchange rates could adversely impact Visteon financial results and comparability of results from period to period.
General Risk Factors
A disruption in the Company's information technology systems could adversely affect its business and financial performance
The Company relies on the accuracy, capacity, and security of its information technology systems as well as those of its customers, suppliers, partners, and service providers to conduct its business. Despite the security and risk-prevention measures the Company has implemented, the Company's systems could be breached, damaged, or otherwise interrupted by a system failure, cyber-attack, malicious computer software (malware), unauthorized physical or electronic access, or other natural or
14
man-made incidents or disasters. The Company is also susceptible to security breaches that may go undetected. Such a breach or interruption could result in business disruption, theft of the Company intellectual property or trade secrets, and unauthorized access to personal information. To the extent that business is interrupted or data is lost, destroyed, or inappropriately used or disclosed, such disruptions could adversely affect the Company’s competitive position, relationships with customers, financial condition, operating results, and cash flows.
The Company is involved from time to time in legal proceedings and commercial or contractual disputes, which could have an adverse effect on its business, results of operations, and financial position
The Company is involved in legal proceedings and commercial or contractual disputes that, from time to time, are significant. These are typically claims that arise in the normal course of business including, without limitation, commercial or contractual disputes (including disputes with suppliers), intellectual property matters, personal injury claims, and employment matters. No assurances can be given that such proceedings and claims will not have a material adverse impact on the Company’s profitability and financial position.
Climate change, climate change regulations and greenhouse effects could adversely impact the Company’s operations and markets
Increased attention to climate change and its association with greenhouse gas emissions, expectations for companies to establish short and long-term emissions reduction targets, and changes in consumer preferences may result in increased costs, reduced profits, risks associated with new regulatory requirements and the potential for increased litigation and governmental investigations. The U.S. federal government, certain U.S. states, and certain other countries and regions have adopted or are considering legislation or regulation imposing overall caps or taxes on greenhouse gas emissions from certain sectors including automotive. Failure to comply with any legislation or regulation could potentially result in substantial fines, criminal sanctions, or operational changes. Moreover, even without such legislation or regulation, increased awareness of, or any adverse publicity regarding, the effects of greenhouse gases could harm the Company’s reputation or reduce customer demand for our products and services.
Additionally, as severe weather events become increasingly common, operations of the Company, its customers, and/or suppliers may be disrupted, which could result in increased operational costs or reduced demand for products and services. While the Company has invested in administration of programs and physical loss prevention improvements to mitigate the risk of natural disasters causing disruption to its ability to serve its customers and communities in times of need, extended periods of disruptions could have an adverse effect on its results of operations.
The Company’s pension expense and funding levels of pension plans could materially deteriorate, or the Company may be unable to generate sufficient excess cash flow to meet increased pension benefit obligations
The Company’s assumptions used to calculate pension obligations as of the annual measurement date directly impact the expense to be recognized in future periods. While the Company’s management believes that these assumptions are appropriate, significant differences in actual experience or significant changes in these assumptions may materially affect the Company’s pension obligations and future expense. For more information on sensitivities to changing assumptions, please see “Critical Accounting Estimates” in Item 7 and Note 12, “Employee Benefit Plans” in Part II, Item 8 of this Form 10-K.
Item 1B. Unresolved Staff Comments
None
Item 2. Properties
The Company's principal executive offices are located in Van Buren Township, Michigan. At December 31, 2021, the Company and its consolidated subsidiaries owned or leased approximately:
•30 corporate offices, technical and engineering centers and customer service centers in 14 countries around the world, all of which were leased.
•15 manufacturing and/or assembly facilities in Brazil, China, India, Japan, Mexico, Portugal, Russia, Slovakia, Tunisia, and Thailand, of which 12 were leased and 3 were owned.
15
In addition, the Company's non-consolidated affiliates operate approximately 6 manufacturing and/or assembly locations, primarily in the Asia Pacific region. The Company considers its facilities to be adequate for its current uses.
Item 3.Legal Proceedings
Certain legal proceedings in which the Company is involved are discussed in Note 19, "Commitments and Contingencies" to the Company's consolidated financial statements included in Part II, Item 8 of this Form 10-K, "Financial Statements and Supplementary Data" and should be considered an integral part of Part I, Item 3, "Legal Proceedings."
Item 4.Mine Safety Disclosures
None
16
Item 4A. Executive Officers
The following table shows information about the executive officers of the Company as of February 1, 2022:
| Name | Age | Position | ||||||||||||
| Sachin S. Lawande | 54 | Director, President and Chief Executive Officer | ||||||||||||
| Jerome J. Rouquet | 54 | Senior Vice President and Chief Financial Officer | ||||||||||||
| Abigail S. Fleming | 40 | Vice President and Chief Accounting Officer | ||||||||||||
| Brett D. Pynnonen | 53 | Senior Vice President and Chief Legal Officer | ||||||||||||
| Joao Paulo Ribeiro | 52 | Senior Vice President, Manufacturing, Supply Chain and Purchasing | ||||||||||||
| Kristin E. Trecker | 56 | Senior Vice President and Chief Human Resources Officer | ||||||||||||
| Robert R. Vallance | 61 | Senior Vice President, Customer Business Groups | ||||||||||||
Sachin S. Lawande has been Visteon’s Chief Executive Officer, President and a director of the Company since June 29, 2015. Before joining Visteon, Mr. Lawande served as Executive Vice President and President, Infotainment Division of Harman International Industries, Inc., an automotive supplier, from July 2013 to June 2015. From July 2011 to June 2013, he served as Executive Vice President and President of Harman’s Lifestyle Division, and from July 2010 to June 2011 as Executive Vice President and Co-President, Automotive Division. Prior to that he served as Harman’s Executive Vice President and Chief Technology Officer since February 2009. Mr. Lawande joined Harman International in 2006, following senior roles at QNX Software Systems and 3Com Corporation. He also serves on the board of directors of Cognex Corporation, a leading worldwide provider of machine vision products that are widely used in automotive, consumer electronics, life sciences and logistics industries. Within the last five years, he also served on the board of directors of DXC Technology Company.
Jerome J. Rouquet has been Visteon’s Senior Vice President and Chief Financial Officer since February 2020 (after joining the Company as Senior Vice President, Finance in January 2020). Prior to that, he held leadership roles of increasing responsibility at Federal-Mogul (a global supplier of automotive and industrial products), including Senior Vice President and Chief Financial Officer from January 2016 to September 2018, Chief Accounting Officer and Controller from July 2010 to January 2016, and Finance Director from March 1999 to July 2010. Following the acquisition of Federal-Mogul by Tenneco, Inc., he most recently served as Senior Vice President Finance, Motorparts from October 2018 to December 2019. From 1990 to 1996, Mr. Rouquet served in various roles at Imaje SA, from Logistics Manager to Financial Controller.
Abigail S. Fleming has been Visteon’s Vice President and Chief Accounting Officer since joining the Company in August 2020. Prior to joining Visteon, Ms. Fleming was Executive Director and Assistant Controller of Tenneco Inc. (formerly Federal-Mogul, LLC), an automotive supplier, from March 2017 to August 2020, and Director, Capital Markets and Accounting Advisory Services at PricewaterhouseCoopers LLP from March 2015 to March 2017. Ms. Fleming began her career at PricewaterhouseCoopers in August 2004, and is a certified public accountant.
Brett D. Pynnonen has been Visteon’s Senior Vice President and Chief Legal Officer since December 2016. Prior to that, he was Vice President and General Counsel since joining the Company in March 2016. Before joining Visteon he was Senior Vice President, General Counsel and Corporate Secretary of Federal-Mogul Holdings Corporation, a global automotive supplier, from November 2007 to March 2016. Prior to that, he was General Counsel and Secretary of Covansys Corporation, a technology services company, and an attorney at the law firm of Butzel Long.
Joao Paulo Ribeiro has been Visteon’s Senior Vice President, Manufacturing, Supply Chain and Purchasing since November 2021. Prior to that he Since Vice President, Manufacturing and Supply Chain since March 2020, Vice President, Manufacturing Operations since March 2014, and Managing Director, European Operations from October 2010 to March 2014. During his career with Visteon and Ford Motor Company, he has held management positions of increasing responsibility in manufacturing and operations.
Kristin E. Trecker has been Visteon’s Senior Vice President and Chief Human Resources Officer ("CHRO") since joining the Company in May 2018. Before joining Visteon, she served as Executive Vice President and CHRO for Integer Holdings Corp. (formerly Greatbatch, Inc.), a medical device outsource manufacturer, from November 2015 to May 2017, and as Senior Vice President and CHRO of MTS Systems Corp., a global engineering firm, from February 2012 to October 2015. Prior to that Ms. Trecker spent 16 years with Lawson Software, Inc. in roles of increasing responsibility, ranging from Director of Compensation and Benefits to Senior Vice President of Human Resources.
17
Robert R. Vallance has been Visteon’s Senior Vice President, Customer Business Groups since December 2016. Prior to that, he was Vice President, Customer Business Groups upon rejoining the Company in July 2014. From February 2008 to June 2015, he served as Vice President, Electronics Business Group of Johnson Controls, Inc., an automotive supplier. Prior to that, he spent 23 years at Ford Motor Company and Visteon in product development, program and commercial management, strategy and planning, product marketing and manufacturing.
18
Part II
Item 5.Market for Registrant’s Common Equity, Related Stockholder Matters and Issuer Purchases of Equity Securities
As of February 10, 2022, the Company had 28,004,059 shares of its common stock, $0.01 par value per share, outstanding, which were owned by 3,176 shareholders of record.
No dividends were paid by the Company on its common stock during the years ended December 31, 2021 and 2020. The Company’s Board evaluates the Company’s dividend policy based on all relevant factors. The Company’s credit agreements limit the amount of cash payments for dividends that may be made. Additionally, the ability of the Company’s subsidiaries to transfer assets is subject to various restrictions, including regulatory requirements and governmental restraints.
No sales of the Company’s common stock were made by or on behalf of the Company or an affiliated purchaser during the fourth quarter of 2021.
The following information in Item 5 is not deemed to be “soliciting material” or be “filed” with the SEC or subject to Regulation 14A or 14C under the Securities Exchange Act of 1934 (“Exchange Act”) or to the liabilities of Section 18 of the Exchange Act, and will not be deemed to be incorporated by reference into any filing under the Securities Act of 1933 or the Exchange Act, except to the extent the Company specifically incorporates it by reference into such a filing.
19
Performance Graph
The following graph compares the cumulative total stockholder return from December 31, 2016, through December 31, 2021, for Visteon's existing common stock, the S&P 500 Index and the Dow Jones U.S. Auto Parts Index. The graph below assumes that $100 was invested on December 31, 2016, in each of the Company's common stock, the stocks comprising the S&P 500 Index and the stocks comprising the Dow Jones U.S. Auto Parts Index, and that all that dividends have been.
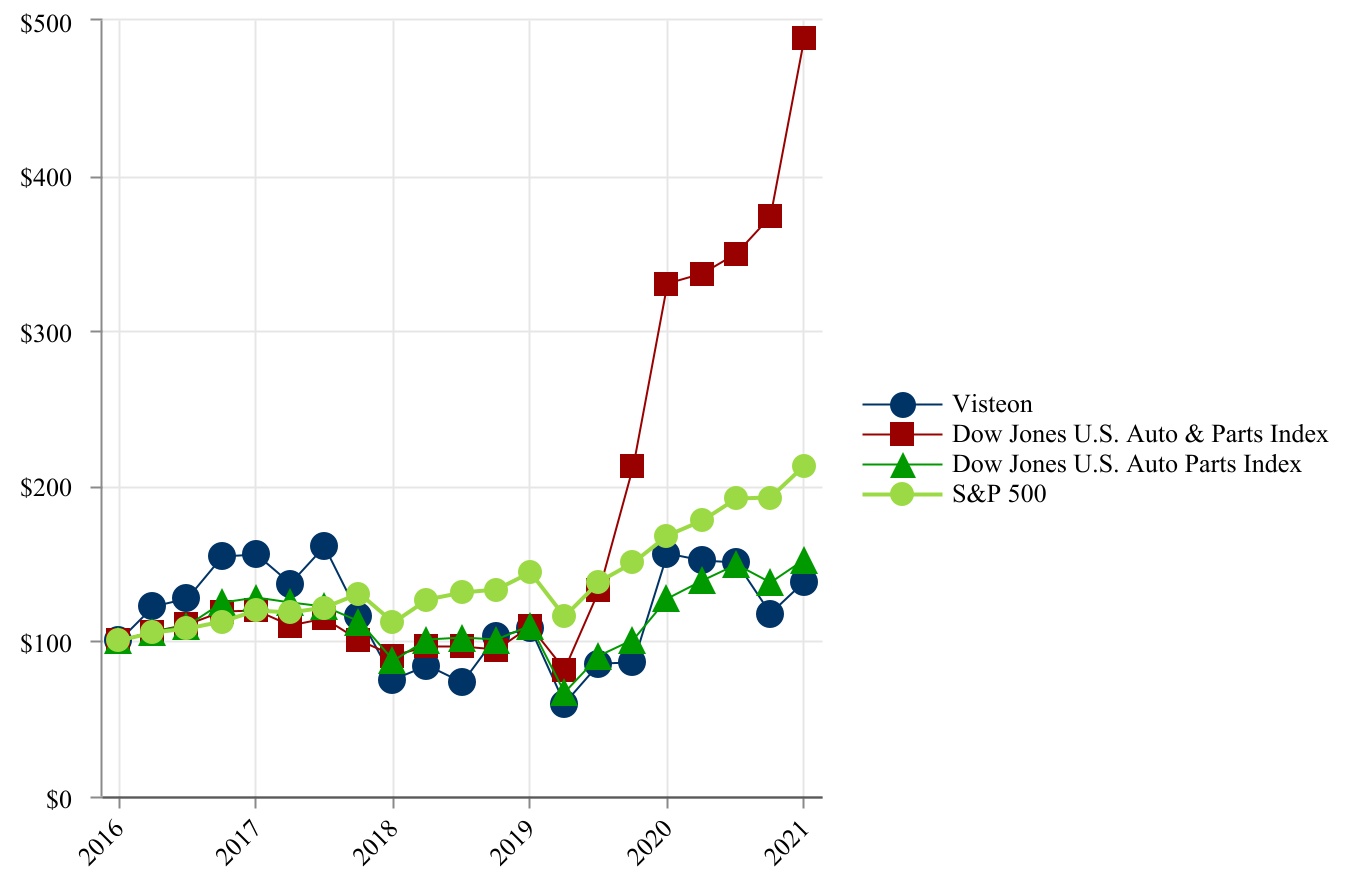
| December 31, 2016 | December 31, 2017 | December 31, 2018 | December 31, 2019 | December 31, 2020 | December 31, 2021 | |||||||||||||||
| Visteon Corporation | $100.00 | $155.76 | $75.03 | $107.78 | $156.24 | $138.34 | ||||||||||||||
Dow Jones U.S. Auto & Parts Index(1) | $100.00 | $119.76 | $90.56 | $109.25 | $330.39 | $488.69 | ||||||||||||||
Dow Jones U.S. Auto Parts Index(1) | $100.00 | $128.03 | $87.45 | $109.54 | $127.09 | $152.28 | ||||||||||||||
| S&P 500 | $100.00 | $119.42 | $111.97 | $144.31 | $167.77 | $212.89 | ||||||||||||||
(1) In 2021, the Company determined that the Dow Jones U.S. Auto Parts Index provides a more meaningful comparison of stock performance than our previously selected index. The Dow Jones U.S. Auto & Parts Index has been used in previous periods.
The above comparisons are required by the Securities and Exchange Commission and are not intended to forecast or be indicative of possible future performance of the Company's common stock or the referenced indices.
Item 6. Selected Financial Data
None
20
Item 7.Management's Discussion and Analysis of Financial Condition and Results of Operations
Management’s Discussion and Analysis (“MD&A”) is intended to help the reader understand the results of operations, financial condition, and cash flows of the Company. MD&A is provided as a supplement to, and should be read in conjunction with, the Company’s consolidated financial statements and related notes appearing in Item 8 of this Form 10-K “Financial Statements and Supplementary Data”.
Executive Summary
Strategic Priorities
Visteon is a global automotive technology company serving the mobility industry, dedicated to creating more enjoyable, connected, and safe driving experiences. Our platforms leverage proven, scalable hardware and software solutions that enable the digital, electric and autonomous evolution of our global automotive customers. The automotive mobility market is expected to grow faster than underlying vehicle production volumes as the vehicle shifts from analog to digital and towards device and cloud connected, electric vehicles, and vehicles with more advanced safety features.
The Company has laid out the following strategic priorities:
•Technology Innovation - The Company is an established global leader in cockpit electronics and is positioned to provide solutions as the industry transitions to the next generation automotive cockpit experience. The cockpit is becoming fully digital, connected, automated, learning, and voice enabled. Visteon's broad portfolio of cockpit electronics technology, the industry's first wireless battery management system, and the development of the DriveCore™ advanced safety platform positions Visteon to support these macro trends in the automotive industry.
•Long-Term Growth - The Company has continued to win business at a rate that exceeds current sales levels by demonstrating product quality, technical and development capability, new product innovation, reliability, timeliness, product design, manufacturing capability, and flexibility, as well as overall customer service.
•Enhance Shareholder Returns While Maintaining a Strong Balance Sheet - The Company has returned approximately $3.3 billion to shareholders since 2015. In addition, the Company has continued to maintain a strong balance sheet to withstand near-term industry volatility while providing a foundation for future growth and shareholder returns.
21
Financial Results
The pie charts below highlight the sales breakdown for Visteon for the year ended December 31, 2021.
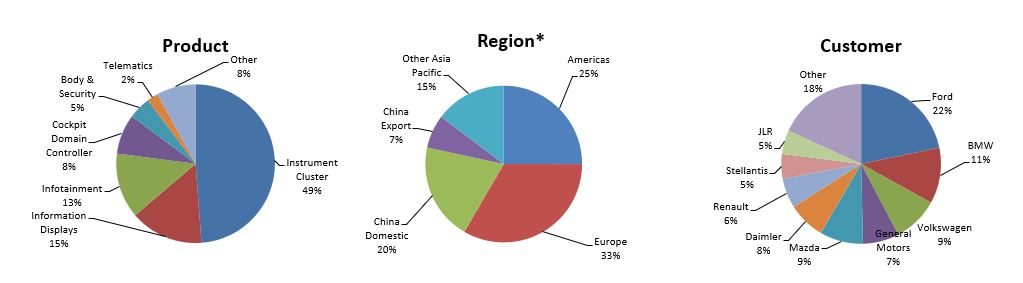
*Regional sales are based on the geographic region where sale originates and not where customer is located (excludes inter-regional eliminations).
Global Automotive Market Conditions and Production Levels
The automotive industry has been negatively impacted by the COVID-19 pandemic and the ongoing semiconductor shortage. Throughout 2020, demand for semiconductors changed significantly as a result of the pandemic. Automotive demand dropped sharply in the first half of 2020 due to COVID-related shutdowns. At the same time, demand for consumer electronics increased due to work from home and the proliferation of connected devices. In the second half of 2020, automotive production recovered faster than expected resulting in demand for 200-millimeter wafers exceeding supply and setting the stage for a tight supply environment in 2021.
In the first half of 2021, semiconductor supply was further impacted by a winter storm in Texas and a fire at the facility of a semiconductor supplier in Japan. In addition, COVID outbreaks in the middle of 2021 in Southeast Asia caused several back-end processing facilities that perform assembly and test of semiconductors to be negatively impacted.
Industry vehicle volumes are expected to increase in 2022 due to strong consumer demand and historically low inventory levels at auto dealerships. However, vehicle production volumes will continue to be negatively impacted due to on-going shortages of semiconductors. The magnitude of the impact on the financial statements and results of operations and cash flows will depend on the evolution of the semiconductor supply shortage, related plant production schedules, and supply chain impacts.
Company Highlights
Visteon continued to focus on execution throughout 2021, building a foundation of sustainable growth, margin expansion, and cash flow generation. To address the near-term challenges created from the worldwide semiconductor and supply chain shortages, Visteon implemented a series of proactive initiatives aimed at increasing product availability for our customers while minimizing the impact of incremental costs to the business.
Early in 2021, Visteon set up a cross-functional task force which implemented several actions including the purchase of semiconductors through brokers and distributors, expedited logistics, and engineering redesigns while leading calls with customers and suppliers to minimizing manufacturing downtime. In addition, Visteon worked with our customers to pass along the elevated costs caused by semiconductor shortages.
As a result of these actions, Visteon reported sales of $2,773 million, a year-over-year increase of 7% when excluding the positive impact from currency. This represents a continued out-performance compared to industry and customer production volumes. Adjusted EBITDA was $228 million, or 8.2% of sales. Visteon continued to build the foundation for sustainable growth launching 43 new products during 2021 including the industry's first wireless battery management system ("BMS"). Visteon's next-generation products continue to be featured on our customer's key vehicles and platforms. Additionally, Visteon was awarded $5.1 billion in new business wins with strong performance in all product categories. Wins included our newly introduced MicroZone display product, multiple SmartCore™ domain wins with lifetime revenue in excess of $1 billion, discrete cluster wins of more than $2 billion, and an additional battery management system win, representing Visteon's third BMS customer.
22
In addition, Visteon developed a proprietary app store, debuted at CES in January 2022. The AllGo branded App Store offers native applications as well as the ability to download popular mobility apps. This solution provides the opportunity for developers to create new and OEM-proprietary applications.
Results of Operations
Year ended December 31, 2021 Compared to Year ended December 31, 2020
The Company's consolidated results of operations for the years ended December 31, 2021 and 2020 were as follows:
| Year Ended December 31, | |||||||||||||||||
| (In millions) | 2021 | 2020 | Change | ||||||||||||||
| Net sales | $ | 2,773 | $ | 2,548 | $ | 225 | |||||||||||
| Cost of sales | (2,519) | (2,303) | (216) | ||||||||||||||
| Gross margin | 254 | 245 | 9 | ||||||||||||||
| Selling, general and administrative expenses | (175) | (193) | 18 | ||||||||||||||
| Restructuring and impairment expense | (14) | (76) | 62 | ||||||||||||||
| Interest expense, net | (8) | (11) | 3 | ||||||||||||||
| Equity in net income of non-consolidated affiliates | 6 | 6 | — | ||||||||||||||
| Other income, net | 18 | 9 | 9 | ||||||||||||||
| Income (loss) before income taxes | 81 | (20) | 101 | ||||||||||||||
| Provision for income taxes | (31) | (28) | (3) | ||||||||||||||
| Net income (loss) from continuing operations | 50 | (48) | 98 | ||||||||||||||
| Net income (loss) from discontinued operations, net of tax | — | — | — | ||||||||||||||
| Net income (loss) | 50 | (48) | 98 | ||||||||||||||
| Net (income) loss attributable to non-controlling interests | (9) | (8) | (1) | ||||||||||||||
| Net income (loss) attributable to Visteon Corporation | $ | 41 | $ | (56) | $ | 97 | |||||||||||
| Adjusted EBITDA* | $ | 228 | $ | 192 | $ | 36 | |||||||||||
* Adjusted EBITDA is a Non-U.S. GAAP financial measure, as defined in Note 20, "Segment Information and Revenue Recognition" to the Company's consolidated financial statements included in Item 8 of this Form 10-K. | |||||||||||||||||
Net Sales and Cost of Sales
| (In millions) | Net Sales | Cost of Sales | Gross Margin | ||||||||||||||
| December 31, 2020 | $ | 2,548 | $ | (2,303) | $ | 245 | |||||||||||
Volume, mix, and net new business | 185 | (168) | 17 | ||||||||||||||
Customer pricing, net | 8 | — | 8 | ||||||||||||||
Currency | 52 | (41) | 11 | ||||||||||||||
| Engineering costs, net | — | 20 | 20 | ||||||||||||||
Cost performance, design changes and other | (20) | (27) | (47) | ||||||||||||||
| December 31, 2021 | $ | 2,773 | $ | (2,519) | $ | 254 | |||||||||||
Net sales for the year ended December 31, 2021 totaled $2,773 million, which represents an increase of $225 million compared with 2020. Favorable volumes and net new business increased net sales by $185 million. Customer pricing increased net sales by $8 million, primarily due to customer recoveries. Favorable currency increased net sales by $52 million, primarily attributable to the euro, Brazilian real, and Chinese renminbi. Other cost performance, primarily related to design changes, reduced sales by $20 million.
Cost of sales increased $216 million for the year ended December 31, 2021, when compared with 2020. Volume, mix and net new business increased cost of sales by $168 million. Foreign currency increased cost of sales by $41 million, primarily
23
attributable to the euro, Brazilian real, and Chinese renminbi. Net engineering costs, excluding currency, decreased cost of sales by $20 million. Unfavorable cost performance, design changes and other increased cost of sales by $27 million primarily due supply chain and material cost impacts associated with the worldwide semiconductor supply shortage and the non-recurrence of certain 2020 temporary austerity measures.
A summary of net engineering costs is shown below:
| Year Ended December 31, | |||||||||||
| (In millions) | 2021 | 2020 | |||||||||
| Gross engineering costs | $ | (325) | $ | (335) | |||||||
| Engineering recoveries | 134 | 134 | |||||||||
| Engineering costs, net | $ | (191) | $ | (201) | |||||||
Gross engineering costs relate to forward model program development and advanced engineering activities and exclude contractually reimbursable engineering costs. Net engineering costs of $191 million for the year ended December 31, 2021, including the impacts of currency, were $10 million lower than the same period of 2020. This decrease is primarily related to the benefits of previously announced restructuring actions and ongoing cost reduction efforts, partially offset by the reclassification of expenses in 2021 related to program management from selling, general, and administrative to align with the Company's optimized structure.
Selling, General and Administrative Expenses
Selling, general, and administrative expenses were $175 million, or 6.3% of net sales, and $193 million, or 7.6% of net sales, during the years ended December 31, 2021 and 2020, respectively. Selling, general, and administrative expenses decreased due to the reclassification of expenses in 2021 related to program management to gross engineering costs to align with the Company's optimized structure and restructuring savings, partially offset by the non-recurrence of 2020 temporary austerity measures.
Restructuring and Impairment
During 2021, the Company approved various global restructuring actions impacting engineering, administrative, and manufacturing functions primarily in South America and Europe to improve efficiency and rationalize the Company's footprint. The Company recorded $4 million of restructuring expense for cash severance, and termination costs for the year ended December 31, 2021 related to these programs.
During 2020, the Company approved various restructuring programs impacting engineering, administrative, and manufacturing functions to improve efficiency and rationalize the Company’s footprint. The Company recorded $1 million and $76 million of restructuring expense for cash severance, retention, and termination costs for the years ended December 31, 2021 and 2020, respectively related to these programs.
During the fourth quarter of 2021, the Company identified an impairment of certain long-lived assets in Brazil due to rising costs and deteriorating business conditions. As a result, the Company recorded a non-cash impairment charge of $9 million to write-down property and equipment to its fair value as of December 31, 2021.
Interest Expense, Net
Net interest expense for the year ended December 31, 2021, was $8 million, representing a decrease of $3 million as compared to 2020. The decrease is primarily due to 2020 interest expense related to borrowings on the Company's $400 million revolving credit facility.
24
Equity in Net Income of Non-Consolidated Affiliates
Equity in net income of non-consolidated affiliates was $6 million for the years ended December 31, 2021 and 2020.
Other Income, Net
Other income, net consists of the following:
| Year Ended December 31, | |||||||||||
| (In millions) | 2021 | 2020 | |||||||||
| Pension financing benefits, net | $ | 18 | $ | 14 | |||||||
| Pension settlement charge | — | (5) | |||||||||
| $ | 18 | $ | 9 | ||||||||
During 2020, the Company transferred a portion of the benefit obligation related to its defined benefit U.S. pension plan to a third-party issuer. The transaction met the criteria for settlement accounting, and accordingly the Company recognized a $5 million pension settlement charge in the fourth quarter of 2020.
Income Taxes
The Company's provision for income taxes was $31 million for year ended December 31, 2021, an increase of $3 million when compared with 2020. The increase in tax expense reflects $7 million attributable to changes in the year-over-year mix of earnings and differing tax rates between jurisdictions which reflects the overall increase in earnings in jurisdictions where the Company is profitable and withholding taxes, as well as $3 million related to the year-over-year impact of various tax law changes primarily in India and uncertain tax positions. The increases described above were partially offset by the non-recurrence of $7 million related to the reassessment of the valuation allowances in connection with the realization of deferred tax assets in Germany and Brazil. Other changes in the Company’s deferred tax asset valuation allowances did not materially impact net tax expense during the years ended December 31, 2021 or 2020.
Net Income (Loss) Attributable to Visteon
Net income attributable to Visteon was $41 million for the year ended December 31, 2021, compared to net loss of $56 million for 2020. The increase of $97 million is primarily related to an increase in gross margin of $9 million, decrease in selling, general, and administrative expense of $18 million, and a decrease in restructuring expense of $71 million. Other one time changes include a 2021 impairment which reduced net income by $9 million partially offset by the non-recurrence of a 2020 pension settlement charge of $5 million.
Adjusted EBITDA
Adjusted EBITDA was $228 million for the year ended December 31, 2021, representing an increase of $36 million when compared with Adjusted EBITDA of $192 million for 2020. Favorable volumes and mix increased Adjusted EBITDA by $17 million. Foreign currency increased Adjusted EBITDA by $7 million, primarily attributable to the euro, Brazilian real, and Chinese renminbi. Increased costs, primarily due to supply chain and material cost impacts associated with the worldwide semiconductor supply shortage, partially offset by customer recoveries, decreased Adjusted EBITDA by $13 million. Lower warranty expense and net engineering costs, excluding currency, increased Adjusted EBITDA by $5 million and $20 million, respectively.
25
The reconciliation of Adjusted EBITDA to net income attributable to Visteon for the years ended December 31, 2021 and 2020 is as follows:
| Year Ended December 31, | |||||||||||||||||
| (In millions) | 2021 | 2020 | Change | ||||||||||||||
| Net income (loss) attributable to Visteon Corporation | $ | 41 | $ | (56) | $ | 97 | |||||||||||
| Depreciation and amortization | 108 | 104 | 4 | ||||||||||||||
| Restructuring and impairment expense | 14 | 76 | (62) | ||||||||||||||
| Provision for income taxes | 31 | 28 | 3 | ||||||||||||||
| Non-cash, stock-based compensation expense | 18 | 18 | — | ||||||||||||||
| Interest expense, net | 8 | 11 | (3) | ||||||||||||||
| Net (income) loss attributable to non-controlling interests | 9 | 8 | 1 | ||||||||||||||
| Equity in net income of non-consolidated affiliates | (6) | (6) | — | ||||||||||||||
| Other, net | 5 | 9 | (4) | ||||||||||||||
| Adjusted EBITDA | $ | 228 | $ | 192 | $ | 36 | |||||||||||
Year ended December 31, 2020 Compared to Year ended December 31, 2019
The Company's consolidated results of operations for the years ended December 31, 2020 and 2019 were as follows:
| Year Ended December 31, | |||||||||||||||||
| (In millions) | 2020 | 2019 | Change | ||||||||||||||
| Net sales | $ | 2,548 | $ | 2,945 | $ | (397) | |||||||||||
| Cost of sales | (2,303) | (2,621) | 318 | ||||||||||||||
| Gross margin | 245 | 324 | (79) | ||||||||||||||
| Selling, general and administrative expenses | (193) | (221) | 28 | ||||||||||||||
| Restructuring expense | (76) | (4) | (72) | ||||||||||||||
| Interest expense, net | (11) | (9) | (2) | ||||||||||||||
| Equity in net income of non-consolidated affiliates | 6 | 6 | — | ||||||||||||||
| Other income, net | 9 | 10 | (1) | ||||||||||||||
| Income (loss) before income taxes | (20) | 106 | (126) | ||||||||||||||
| Provision for income taxes | (28) | (24) | (4) | ||||||||||||||
| Net income (loss) from continuing operations | (48) | 82 | (130) | ||||||||||||||
| Net income (loss) from discontinued operations, net of tax | — | (1) | 1 | ||||||||||||||
| Net income (loss) | (48) | 81 | (129) | ||||||||||||||
| Net (income) loss attributable to non-controlling interests | (8) | (11) | 3 | ||||||||||||||
| Net income (loss) attributable to Visteon Corporation | $ | (56) | $ | 70 | $ | (126) | |||||||||||
| Adjusted EBITDA* | $ | 192 | $ | 234 | $ | (42) | |||||||||||
* Adjusted EBITDA is a Non-U.S. GAAP financial measure, as defined in Note 20, "Segment Information and Revenue Recognition" to the Company's consolidated financial statements included in Item 8 of this Form 10-K. | |||||||||||||||||
26
Net Sales and Cost of Sales
| (In millions) | Net Sales | Cost of Sales | Gross Margin | ||||||||||||||
| December 31, 2019 | $ | 2,945 | $ | (2,621) | $ | 324 | |||||||||||
Volume, mix, and net new business | (318) | 128 | (190) | ||||||||||||||
Customer pricing, net | (58) | — | (58) | ||||||||||||||
Currency | (13) | 5 | (8) | ||||||||||||||
| Engineering costs, net | — | 93 | 93 | ||||||||||||||
Cost performance, design changes and other | (8) | 92 | 84 | ||||||||||||||
| December 31, 2020 | $ | 2,548 | $ | (2,303) | $ | 245 | |||||||||||
Net sales for the year ended December 31, 2020 totaled $2,548 million, which represents a decrease of $397 million compared with 2019. Unfavorable volumes, primarily due to the impacts of COVID-19, and mix, partially offset by net new business, decreased net sales by $318 million. Customer pricing decreased net sales by $58 million. Unfavorable currency decreased net sales by $13 million, primarily attributable to the euro, Chinese renminbi, Brazilian real and Indian rupee. Other cost performance, primarily related to design changes, reduced sales by $8 million.
Cost of sales decreased $318 million for the year ended December 31, 2020, when compared with 2019. Lower volumes, primarily due to the impacts of COVID-19, partially offset by unfavorable product mix, decreased cost of sales by $128 million. Engineering costs, excluding currency, decreased cost of sales by $93 million. Foreign currency decreased cost of sales by $5 million primarily attributable to the euro, Chinese renminbi, Indian rupee, Brazilian real, and Bulgarian lev. Favorable cost performance including material design, usage, and economics decreased cost of sales by $92 million.
A summary of net engineering costs is shown below:
| Year Ended December 31, | |||||||||||
| (In millions) | 2020 | 2019 | |||||||||
| Gross engineering costs | $ | (335) | $ | (440) | |||||||
| Engineering recoveries | 134 | 140 | |||||||||
| Engineering costs, net | $ | (201) | $ | (300) | |||||||
Gross engineering includes program development costs and advanced engineering activities, excluding contractually reimbursable engineering costs. Net engineering costs of $201 million for the year ended December 31, 2020, including the impacts of currency, were $99 million lower than 2019, primarily related to short-term and long-term cost reduction initiatives including the benefits of previously announced restructuring actions implemented to optimize the structure while supporting future growth.
Selling, General and Administrative Expenses
Selling, general, and administrative expenses were $193 million, or 7.6% of net sales, and $221 million, or 7.5% of net sales, during the years ended December 31, 2020 and 2019, respectively. The decrease of $28 million is primarily related to temporary austerity measures in 2020, other cost reduction initiatives, and the impacts of previously announced restructuring actions.
Restructuring Expense
Restructuring actions initiated during 2020 include the following:
•In January, the Company approved a plan primarily related to European engineering and administrative functions to improve the Company’s efficiency and rationalize its footprint. The Company incurred $26 million of net restructuring expense for cash severance, retention, and termination costs related to this plan.
•In March, the Company approved a global restructuring plan impacting engineering, administrative and manufacturing functions to improve the Company’s efficiency and rationalize its footprint. The Company incurred $16 million of net restructuring expense for cash severance, retention, and termination costs related to this plan.
27
•In September, the Company approved a plan to respond to COVID-19 impacts while at the same time improving efficiency and rationalizing the Company’s footprint. The Company has incurred $32 million of net restructuring expense related to this plan.
•In December, the Company approved a plan related to engineering, administrative, and manufacturing functions in Asia to improve the Company's efficiency and rationalize its footprints. The Company has incurred $2 million in restructuring costs relation to this plan.
During 2019, the Company recorded approximately $4 million of net restructuring expenses related to end of life of certain products and the optimization of certain operations.
Interest Expense, Net
Net interest expense for the year ended December 31, 2020, was $11 million, representing an increase of $2 million as compared to 2019. The increase is primarily due to the first quarter 2020 borrowing of $400 million under the Company's revolving credit facility. The Company fully repaid the amount borrowed during the third quarter of 2020 following stronger than expected industry recovery and improved Company performance.
Equity in Net Income of Non-Consolidated Affiliates
Equity in net income of non-consolidated affiliates was $6 million for the years ended December 31, 2020 and 2019.
Other Income, Net
Other income, net consists of the following:
| Year Ended December 31, | |||||||||||
| (In millions) | 2020 | 2019 | |||||||||
| Pension financing benefits, net | $ | 14 | $ | 10 | |||||||
| Pension settlement charge | (5) | — | |||||||||
| $ | 9 | $ | 10 | ||||||||
During 2020, the Company transferred a portion of the benefit obligation related to its defined benefit U.S. pension plan to a third-party issuer. The transaction met the criteria for settlement accounting, and accordingly the Company recognized a $5 million pension settlement charge in the fourth quarter of 2020.
Income Taxes
The Company's provision for income taxes was $28 million for year ended December 31, 2020, a $4 million increase when compared with 2019. The increase in tax expense reflects the reassessment of the 2020 valuation allowances in connection with the realization of deferred tax assets in Germany and Brazil, as well as the non-recurrence of a 2019 discrete income tax valuation allowance release in Germany, resulting in an increase in income tax expense of $19 million. Other changes in the Company’s deferred tax asset valuation allowances did not materially impact net tax expense during the years ended December 31, 2020 or 2019. The increases described above were partially offset by approximately $15 million decrease in income tax expense primarily due to changes in the mix of earnings and differing tax rates between jurisdictions which reflects the overall decrease in earnings in jurisdictions where the Company is profitable and withholding taxes.
Discontinued Operations
During 2019, the Company recorded a $1 million charge for legal expenses related to former employees at a closed plant in Brazil.
28
Net Income (Loss) Attributable to Visteon
Net loss attributable to Visteon was $56 million for the year ended December 31, 2020, compared to net income of $70 million for 2019. The decrease of $126 million is related to a decrease in gross margin of $79 million, higher restructuring expense of $72 million, and higher provision for income taxes of $4 million. These decreases were partially offset by lower selling, general and administrative expense of $28 million, and lower other income, net of $1 million.
Adjusted EBITDA
Adjusted EBITDA was $192 million for the year ended December 31, 2020, representing a decrease of $42 million when compared with Adjusted EBITDA of $234 million for 2019. Unfavorable volumes, primarily due to the impacts of COVID-19, and mix reduced Adjusted EBITDA by $190 million. Foreign currency decreased Adjusted EBITDA by $7 million, primarily attributable to the euro, Chinese renminbi, Brazilian real and Japanese yen, partially offset by the Mexican peso and Bulgarian lev. Lower net engineering costs, excluding currency, increased Adjusted EBITDA by $93 million. Favorable cost performance of $128 million, including material, design, and usage economics, lower manufacturing costs, lower selling and general and administrative expenses more than offset annual customer pricing of $58 million.
The reconciliation of Adjusted EBITDA to net income attributable to Visteon for the years ended December 31, 2020 and 2019 is as follows:
| Year Ended December 31, | |||||||||||||||||
| (In millions) | 2020 | 2019 | Change | ||||||||||||||
| Net income (loss) attributable to Visteon Corporation | $ | (56) | $ | 70 | $ | (126) | |||||||||||
| Depreciation and amortization | 104 | 100 | 4 | ||||||||||||||
| Restructuring expense | 76 | 4 | 72 | ||||||||||||||
| Provision for income taxes | 28 | 24 | 4 | ||||||||||||||
| Non-cash, stock-based compensation expense | 18 | 17 | 1 | ||||||||||||||
| Interest expense, net | 11 | 9 | 2 | ||||||||||||||
| Net (income) loss attributable to non-controlling interests | 8 | 11 | (3) | ||||||||||||||
| Net income (loss) from discontinued operations, net of tax | — | 1 | (1) | ||||||||||||||
| Equity in net income of non-consolidated affiliates | (6) | (6) | — | ||||||||||||||
| Other, net | 9 | 4 | 5 | ||||||||||||||
| Adjusted EBITDA | $ | 192 | $ | 234 | $ | (42) | |||||||||||
Liquidity
Overview
The Company's primary sources of liquidity are cash flows from operations, existing cash balances, and borrowings under available credit facilities. As we continue to evaluate ongoing supply chain impacts associated with the semiconductor supply shortage and other supply chain impacts related to the COVID-19 pandemic, the Company believes funds generated from these sources will continue to sufficiently sustain ongoing operations and support investment in differentiating technologies. The Company will continue to closely monitor its available liquidity and maintain access to additional liquidity to weather these challenging conditions. The Company's intra-year needs are normally impacted by seasonal effects in the industry, such as mid-year shutdowns, the ramp-up of new model production, and year-end shutdowns at key customers. The ongoing COVID-19 pandemic and related semiconductor supply shortage may exacerbate the intra-year requirements.
A substantial portion of the Company's cash flows from operations are generated by operations located outside of the United States. Accordingly, the Company utilizes a combination of cash repatriation strategies, including dividends and distributions, royalties, and other intercompany arrangements to provide the funds necessary to meet obligations globally. The Company’s ability to access funds from its subsidiaries is subject to, among other things, customary regulatory and statutory requirements and contractual arrangements including joint venture agreements and local credit facilities. Moreover, repatriation efforts may be modified by the Company according to prevailing circumstances.
On March 19, 2020, the Company borrowed the entire $400 million amount available under the revolving credit facility. On September 24, 2020, the Company fully repaid the amount borrowed under the Revolving Credit Facility following stronger than expected industry recovery and improved Company performance in the third quarter of 2020.
29
Access to additional capital through the debt or equity markets is influenced by the Company's credit ratings. As of December 31, 2021, the Company’s corporate credit rating is Ba3 and BB- by Moody’s and Standard & Poor’s, respectively. See Note 11, "Debt" in the Company's consolidated financial statements included in Item 8 of this Form 10-K for a comprehensive discussion of the Company's debt facilities. Incremental funding requirements of the Company's consolidated foreign entities are primarily accommodated by intercompany cash pooling structures. Affiliate working capital lines, which are utilized by the Company's consolidated joint ventures, had availability of $168 million and the Company had $400 million of available credit under the revolving credit facility, as of December 31, 2021.
Cash Balances
As of December 31, 2021, the Company had total cash and equivalents of $455 million, including $3 million of restricted cash. Cash balances totaling $338 million were located in jurisdictions outside of the United States, of which approximately $135 million is considered permanently reinvested for funding ongoing operations outside of the U.S. If such permanently reinvested funds were repatriated to the U.S., no U.S. federal taxes would be imposed on the distribution of such foreign earnings due to U.S. tax reform enacted in December 2017, but the Company would be required to accrue additional tax expense, primarily related to foreign withholding taxes.
Other Items Affecting Liquidity
During the year ended December 31, 2021, cash contributions to the Company's U.S. defined benefit pension plans were $12 million and $8 million related to its non-U.S. employee retirement plans. Contributions related to certain non-U.S. plans of approximately $2 million have been deferred until 2024 due to COVID-19 relief measures. Additionally, the Company expects to make contributions to its non-US defined benefit pension plans of $4 million during 2022.
During the year ended December 31, 2021, the Company paid $34 million related to restructuring activities. Additional discussion regarding the Company's restructuring activities is provided in Note 4, "Restructuring Activities" in the Company's consolidated financial statements included in Item 8 of this Form 10-K.
The Company has committed to make investments totaling $15 million in two entities principally focused on the automotive sector pursuant to limited partnership agreements. As of December 31, 2021, the Company has contributed $9 million toward the aggregate investment commitments. As a limited partner in each entity, the Company will periodically make capital contributions toward this total commitment amount.
Purchase Obligations
As of December 31, 2021, the Company has contractual purchase obligations of approximately $71 million through 2024.
Leases
The Company has operating leases primarily for corporate offices, technical and engineering centers, customer centers, vehicles, and certain equipment with future lease obligations ranging from 2022 to 2033. Additional discussion regarding the Company's restructuring activities is provided in Note 9, "Leases" in the Company's consolidated financial statements included in Item 8 of this Form 10-K.
Taxes
The Company may be required to make significant cash outlays related to its unrecognized tax benefits, including interest and penalties. As of December 31, 2021, the Company had unrecognized tax benefits, including interest and penalties, that would be expected to result in a cash outlay of $8 million. Given the number of years, jurisdictions and positions subject to examination, the Company is unable to estimate the period of cash settlement, if any, with the respective taxing authorities. For further information related to the Company’s unrecognized tax benefits, see Note 14, “Income Taxes,” to the consolidated financial statements included in this Report.
30
Cash Flows
Operating Activities
The Company generated $58 million of cash from operating activities during the year ended December 31, 2021, as compared to $168 million during 2020 representing a $110 million decrease.
Lower cash flow from operating activities is primarily due to lower working capital outflows partially offset by increased net income. Working capital out flows of $178 million are primarily related to higher inventory levels resulting from the worldwide semiconductor supply shortage and increased accounts receivable due to higher volume and higher than anticipated customer receipts during December 2020 of $40 million. These unfavorable impacts were partially offset by higher net income of $98 million and dividends received from non-consolidated affiliates of $18 million.
The Company generated $168 million of cash from operating activities during the year ended December 31, 2020, as compared to $183 million during 2019, representing a $15 million decrease in cash provided from operations. Favorable changes in accounts receivable, partially attributable to $40 million of higher than anticipated customer receipts during the final month of 2020, were more than offset by unfavorable changes in inventory and accounts payable balances resulting in lower trade working capital of $17 million in 2020 as compared to 2019. These unfavorable impacts were partially offset by lower cash tax payments, higher net recoveries of reimbursable taxes and higher net proceeds received from customers to fund the Company's pre-production design, engineering and tooling costs necessary to support current and future programs.
Investing Activities
Net cash used by investing activities during the year ended December 31, 2021 totaled $63 million, as compared to $98 million in 2020, representing a decrease of $35 million. The decrease is primarily due to lower cash paid for capital expenditures of $34 million.
Net cash used by investing activities during the year ended December 31, 2020 totaled $98 million, as compared to $128 million in 2019, representing a decrease of $30 million. This decrease is primarily due to lower capital expenditures of $38 million partially offset by lower loan repayments received from a non-consolidated affiliate of $9 million.
Financing Activities
Net cash used by financing activities during the year ended December 31, 2021 totaled $29 million, as compared to $58 million for 2020, representing a decrease of $29 million. The decrease is primarily due to 2020 share repurchases of $16 million and debt repayments of $37 million partially offset by higher dividends paid to non-controlling interests of $28 million.
Net cash used by financing activities during the year ended December 31, 2020 totaled $58 million, as compared to $49 million for 2019, representing an increase of $9 million. Higher net cash used by financing activities during the year ended December 31, 2020 as compared to 2019 is primarily attributable to an increase in short-term debt repayment of $18 million partially offset by lower stock 2020 stock repurchases of $4 million and lower dividends paid to non-controlling interests of $2 million.
Debt and Capital Structure
See "Liquidity" above and also see Note 11, "Debt" and Note 15, "Stockholders' Equity and Non-controlling Interests" to the Company's consolidated financial statements included in Item 8 of this Form 10-K for further information.
Fair Value Measurements
See Note 17, "Fair Value Measurements" to the Company's consolidated financial statements included in Item 8 of this Form 10-K for additional information.
Critical Accounting Estimates
The Company’s significant accounting policies have been disclosed in the consolidated financial statements and accompanying notes under Note 1, “Summary of Significant Accounting Policies” to the Company's consolidated financial statements included in Item 8 of this Form 10-K for further information. Certain policies relate to estimates that involve matters that are highly uncertain at the time the accounting estimate is made and different estimates or changes to an estimate could have a material impact on the reported financial position, changes in financial condition or results of operations. Such critical estimates are discussed below. For these, materially different amounts could be reported under varied conditions and assumptions. Other
31
items in the Company's consolidated financial statements require estimation, however, in our judgment, they are not as critical as those discussed below.
Impairment of Long-lived Assets
The Company monitors long-lived assets for impairment indicators on an ongoing basis. If an impairment indicator exists, the Company will test the long-lived asset group for recoverability by comparing the undiscounted cash flows expected to be generated from the long-lived assets compared to the related net book values. If the net book value of the asset group exceeds the undiscounted cash flows, the asset group is written down to its fair value and an impairment loss recognized. Fair value is determined using appraisals, management estimates or discounted cash flow calculations.
During the fourth quarter of 2021, the Company recorded an impairment of certain long-lived assets in Brazil due to rising costs and deteriorating business conditions. As a result, the Company recorded a non-cash impairment charge of $9 million to write-down property and equipment to its fair value as of December 31, 2021. The Company did not record impairment charges for the year ended December 31, 2020. See Note 4, "Restructuring and Impairment” in the Company's consolidated financial statements included in Item 8 of this Form 10-K for additional information.
Revenue Recognition
Revenue is measured based on the transaction price and the quantity of parts specified in a contract with a customer. Discrete price adjustments may occur during the vehicle production period in order for the Company to remain competitive with market prices or based on changes in product specifications. Some of these price adjustments are non-routine in nature and require estimation. In the event the Company concludes that a portion of the revenue for a given part may vary from the purchase order, the Company records consideration at the most likely amount to which the Company expects to be entitled based on historical experience and input from customer negotiations. See Note 1, "Summary of Significant Accounting Policies” in the Company's consolidated financial statements included in Item 8 of this Form 10-K for additional information.
Product Warranty and Recall
The Company accrues for warranty obligations for products sold based on management estimates, with support from the Company’s sales, engineering, quality, and legal functions, of the amount that eventually will be required to settle such obligations. This accrual is based on several factors including contractual arrangements, past experience, current claims, production changes, industry developments, and various other considerations. The Company accrues for product recall claims related to potential financial participation in customer actions to provide remedies as a result of actual or threatened regulatory or court actions or the Company’s determination of the potential for such actions. The Company's accrual for recall claims is based on specific facts and circumstances underlying individual claims with support from the Company’s engineering, quality, and legal functions. Amounts accrued are based upon management’s best estimate of the amount that will ultimately be required to settle such claims. See Note 19, "Commitments and Contingencies" in the Company's consolidated financial statements included in Item 8 of this Form 10-K for additional information.
Restructuring
The Company accrues costs in connection with its restructuring of the engineering, administration, and manufacturing organizations. These accruals include estimates primarily related to employee headcount, local statutory benefits, and other employee termination costs. Actual costs may vary from these estimates. These accruals are reviewed on a quarterly basis and changes to restructuring actions are appropriately recognized when identified. See Note 4, “Restructuring and Impairments” in the Company's consolidated financial statements included in Item 8 of this Form 10-K for additional information.
Pension Plans
Certain Company employees participate in defined benefit pension plans or retirement/termination indemnity plans. The Company has approximately $177 million in unfunded net pension liabilities as of December 31, 2021, of which approximately $136 million and $41 million are attributable to U.S. and non-U.S. pension plans, respectively. The determination of the Company’s obligations and expense for its pension plans is dependent on assumptions set by the Company used by actuaries in calculating such amounts. Assumptions are described in Note 12, “Employee Benefit Plans” to the Company’s consolidated financial statements included in Item 8 of this Form 10-K, which are incorporated herein by reference, including the discount rate, expected long-term rate of return on plan assets, and rate of increase in compensation.
32
Actual results that differ from assumptions used are accumulated and amortized over future periods and, accordingly, generally affect recognized expense in future periods. Therefore, assumptions used to calculate benefit obligations as of the annual measurement date directly impact the expense to be recognized in future periods. The primary assumptions affecting the Company’s accounting for employee benefits, as of December 31, 2021, are as follows:
Expected long-term rate of return on plan assets
The expected long-term rate of return is used to calculate net periodic pension cost. The required use of the expected long-term rate of return on plan assets may result in recognized returns that are greater or less than the actual returns on those plan assets in any given year. Over time the expected long-term rate of return on plan assets is designed to approximate actual returns. The expected long-term rate of return for pension assets has been estimated based on various inputs, including historical returns for the different asset classes held by the Company’s trusts and its asset allocation, as well as inputs from internal and external sources regarding expected capital market returns, inflation, and other variables.
| U.S. Plans | Non-U.S. Plans | ||||||||||||||||
| 2021 | 2020 | 2021 | 2020 | ||||||||||||||
Expected Rate of Return | 6.15% | 6.60% | 2.00% to 7.00% | 2.00% to 7.25% | |||||||||||||
Long-Term Rates of Return | 6.23% | 6.15% | 2.00% to 7.00% | 2.00% to 7.0% | |||||||||||||
| Weighted Average Discount Rates | 2.93% | 2.60% | 2.31% | 1.78% | |||||||||||||
The Company has set the long-term rates of return assumptions for its 2022 pension expense which range from 2.0% to 7.0% outside the U.S. and 6.23% in the U.S.
Discount rate
The Company uses the spot rate method to estimate the service and interest components of net periodic benefit cost for pension benefits for its U.S. and certain non-U.S. plans. The Company has elected to utilize an approach that discounts individual expected cash flows underlying interest and service costs using the applicable spot rates derived from the yield curve used to determine the benefit obligation to the relevant projected cash flows. The discount rate assumption is based on market rates for a hypothetical portfolio of high-quality corporate bonds rated Aa or better with maturities closely matched to the timing of projected benefit payments for each plan at its annual measurement date.
| 2021 | 2020 | 2019 | |||||||||
| Actual Rates of Return | 9.40% | 15.00% | 20% | ||||||||
| Discount Rates | 0.8% to 8.75% | 0.8% to 8.75% | 0.8% to 8.75% | ||||||||
While the Company believes that these assumptions are appropriate, significant differences in actual experience or significant changes in these assumptions may materially affect the Company’s pension benefit obligations and its future expense. The following table illustrates the sensitivity to a change in certain assumptions for Company sponsored U.S. and non-U.S. pension plans on its 2021 funded status and 2022 pretax pension expense.
| Impact on U.S. 2022 Pretax Pension Expense | Impact on U.S. Plan 2021 Funded Status | Impact on Non-U.S. 2022 Pretax Pension Expense | Impact on Non-U.S. Plan 2021 Funded Status | ||||||||||||||||||||
25 basis point decrease in discount rate (a)(b) | Less than -$1 million | -$26 million | Less than -$1 million | -$14 million | |||||||||||||||||||
25 basis point increase in discount rate (a)(b) | Less than +$1 million | +$25 million | Less than +$1 million | +$13 million | |||||||||||||||||||
25 basis point decrease in expected return on assets (a) | +$1.6 million | Less than +$1 million | |||||||||||||||||||||
25 basis point increase in expected return on assets (a) | -$1.6 million | Less than -$1 million | |||||||||||||||||||||
| (a) Assumes all other assumptions are held constant. | |||||||||||||||||||||||
| (b) Excludes impact of assets used to hedge discount rate volatility. | |||||||||||||||||||||||
33
Income Taxes
The Company is subject to income taxes in the U.S. and numerous non-U.S. jurisdictions. Significant judgment is required in determining the Company’s worldwide provision for income taxes, deferred tax assets and liabilities, and valuation allowances recorded against the Company’s net deferred tax assets. Deferred tax assets and liabilities are recorded for the future tax consequences attributable to differences between financial statement carrying amounts of existing assets and liabilities and their respective tax bases and operating loss and tax credit carry forwards.
Deferred tax assets and liabilities are measured using enacted tax rates expected to apply to taxable income in the years in which those temporary differences are expected to be recovered or settled. The Company records a valuation allowance to reduce deferred tax assets when it is more likely than not that such assets will not be realized. In the event our operating performance improves or deteriorates in a filing jurisdiction or entity, future assessments could conclude a smaller or larger valuation allowance will be needed. Due to the complexity of some of these uncertainties, the ultimate resolution may be materially different from the current estimate.
In the ordinary course of the Company’s business, there are many transactions and calculations where the final tax determination is uncertain. The Company is regularly audited by tax authorities. Where appropriate, the Company accrues for contingencies related to income tax risks and non-income tax risks. See Note 14, "Income Taxes" in the Company's consolidated financial statements included in Item 8 of this Form 10-K for additional information.
Fair Value Measurements
The Company uses fair value measurements in the preparation of its financial statements, utilizing various inputs including those that can be readily observable, indirectly observable or are unobservable. The Company utilizes market-based data and valuation techniques that maximize the use of observable inputs. Additionally, the Company applies assumptions that market participants would use in pricing an asset or liability, including assumptions about risk. See Note 17, "Fair Value Measurements" and Note 7, "Property and Equipment" in the Company's consolidated financial statements included in Item 8 of this Form 10-K for additional information.
Recent Accounting Pronouncements
See Note 1, “Summary of Significant Accounting Policies” to the Company's consolidated financial statements under Item 8 of this Form 10-K for a discussion of recent accounting pronouncements.
Forward-Looking Statements
Certain statements contained or incorporated in this Annual Report on Form 10-K which are not statements of historical fact constitute “Forward-Looking Statements” within the meaning of the Private Securities Litigation Reform Act of 1995 (the “Reform Act”). Forward-looking statements give current expectations or forecasts of future events. Words such as “anticipate”, “expect”, “intend”, “plan”, “believe”, “seek”, “estimate” and other words and terms of similar meaning in connection with discussions of future operating or financial performance signify forward-looking statements. These statements reflect the Company’s current views with respect to future events and are based on assumptions and estimates, which are subject to risks and uncertainties including those discussed in Item 1A under the heading “Risk Factors” and elsewhere in this Form 10-K. Accordingly, undue reliance should not be placed on these forward-looking statements. Also, these forward-looking statements represent the Company’s estimates and assumptions only as of the date of this Form 10-K. The Company does not intend to update any of these forward-looking statements to reflect circumstances or events that occur after the statement is made and qualifies all of its forward-looking statements by these cautionary statements.
You should understand that various factors, in addition to those discussed elsewhere in this document, could affect the Company’s future results and could cause results to differ materially from those expressed in such forward-looking statements, including:
•Significant or prolonged shortage of critical components from Visteon’s suppliers including, but not limited to semiconductors and those components from suppliers who are sole or primary sources.
•Continued and future impacts of the coronavirus ("COVID-19") pandemic on the Visteon’s financial condition and business operations including global supply chain disruptions, market downturns, reduced consumer demand, and new government actions or restrictions.
34
•Significant changes in the competitive environment in the major markets where Visteon procures materials, components, or supplies or where its products are manufactured, distributed, or sold.
•Visteon’s ability to satisfy its future capital and liquidity requirements; Visteon’s ability to access the credit and capital markets at the times and in the amounts needed and on terms acceptable to Visteon; Visteon’s ability to comply with covenants applicable to it; and the continuation of acceptable supplier payment terms.
•Visteon’s ability to access funds generated by its foreign subsidiaries and joint ventures on a timely and cost-effective basis.
•Changes in the operations (including products, product planning and part sourcing), financial condition, results of operations, or market share of Visteon’s customers.
•Changes in vehicle production volume of Visteon’s customers in the markets where it operates.
•Increases in commodity costs or disruptions in the supply of commodities, including resins, copper, fuel, and natural gas.
•Visteon’s ability to generate cost savings to offset or exceed agreed-upon price reductions or price reductions to win additional business and, in general, improve its operating performance; to achieve the benefits of its restructuring actions; and to recover engineering and tooling costs and capital investments.
•Visteon’s ability to compete favorably with automotive parts suppliers with lower cost structures and greater ability to rationalize operations; and to exit non-performing businesses on satisfactory terms, particularly due to limited flexibility under existing labor agreements.
•Restrictions in labor contracts with unions that restrict Visteon’s ability to close plants, divest unprofitable, noncompetitive businesses, change local work rules and practices at a number of facilities, and implement cost-saving measures.
•The costs and timing of facility closures or dispositions, business or product realignments, or similar restructuring actions, including potential asset impairment or other charges related to the implementation of these actions or other adverse industry conditions and contingent liabilities.
•Legal and administrative proceedings, investigations and claims, including shareholder class actions, inquiries by regulatory agencies, product liability, warranty, employee-related, environmental and safety claims, and any recalls of products manufactured or sold by Visteon.
•Changes in economic conditions, currency exchange rates, changes in foreign laws, regulations or trade policies, or political stability in foreign countries where Visteon procures materials, components, or supplies or where its products are manufactured, distributed, or sold.
•Shortages of materials or interruptions in transportation systems, labor strikes, work stoppages, or other interruptions to or difficulties in the employment of labor in the major markets where Visteon purchases materials, components, or supplies to manufacture its products or where its products are manufactured, distributed, or sold.
•Visteon’s ability to satisfy its pension and other postretirement employee benefit obligations, and to retire outstanding debt and satisfy other contractual commitments, all at the levels and times planned by management.
•Changes in laws, regulations, policies, or other activities of governments, agencies and similar organizations, domestic and foreign, that may tax or otherwise increase the cost of, or otherwise affect, the manufacture, licensing, distribution, sale, ownership, or use of Visteon’s products or assets.
•Possible terrorist attacks or acts of war, which could exacerbate other risks such as slowed vehicle production, interruptions in the transportation system, changes in fuel prices, and disruptions of supply.
•The cyclical and seasonal nature of the automotive industry.
35
•Visteon’s ability to comply with environmental, safety, and other regulations applicable to it and any increase in the requirements, responsibilities and associated expenses and expenditures of these regulations.
•Visteon’s ability to protect its intellectual property rights and to respond to changes in technology and technological risks and to claims by others that Visteon infringes their intellectual property rights.
•Visteon’s ability to quickly and adequately remediate control deficiencies in its internal control over financial reporting.
•Other factors, risks and uncertainties detailed from time to time in Visteon’s Securities and Exchange Commission filings.
Item 7A.Quantitative and Qualitative Disclosures About Market Risk
The primary market risks to which the Company is exposed include changes in foreign currency exchange rates, interest rates and certain commodity prices. The Company manages these risks through derivative instruments and various operating actions including fixed price contracts with suppliers and cost sourcing arrangements with customers. The Company's use of derivative instruments is limited to mitigation of market risks, including hedging activities. However, derivative instruments are not used for speculative or trading purposes, as per clearly defined risk management policies. Additionally, the Company's use of derivative instruments creates exposure to credit loss in the event of non-performance by the counter-party to the derivative financial instruments. The Company limits this exposure by entering into agreements directly with a variety of major financial institutions with high credit standards and that are expected to fully satisfy their obligations under the contracts. Additionally, the Company's ability to utilize derivatives to manage market risk is dependent on credit conditions and market conditions given the current economic environment.
Foreign Currency Risk
The Company’s net cash inflows and outflows exposed to the risk of changes in foreign currency exchange rates arise from the sale of products in countries other than the manufacturing source, foreign currency denominated supplier payments, debt and other payables, subsidiary dividends, investments in subsidiaries, and anticipated foreign currency denominated transaction proceeds. Where possible, the Company utilizes derivative financial instruments to manage foreign currency exchange rate risks. Forward and option contracts may be utilized to reduce the impact to the Company's cash flow from adverse movements in exchange rates. Foreign currency exposures are reviewed periodically and any natural offsets are considered prior to entering into a derivative financial instrument. The Company’s primary hedged foreign currency exposures include the euro and Brazilian real. Where possible, the Company utilizes a strategy of partial coverage for transactions in these currencies. The Company's policy requires that hedge transactions relate to a specific portion of the exposure not to exceed the aggregate amount of the underlying transaction.
In addition to the transactional exposure described above, the Company's operating results are impacted by the translation of its foreign operating income into U.S. dollars. The Company does not enter into foreign exchange contracts to mitigate this exposure. The hypothetical pretax gain or loss in fair value from a 10% favorable or adverse change in quoted currency exchange rates would be approximately $29 million and $31 million for foreign currency derivative financial instruments as of December 31, 2021 and 2020, respectively. These estimated changes assume a parallel shift in all currency exchange rates and include the gain or loss on financial instruments used to hedge investments in subsidiaries. Because exchange rates typically do not all move in the same direction, the estimate may overstate the impact of changing exchange rates on the net fair value of the Company's financial derivatives. It is also important to note that gains and losses indicated in the sensitivity analysis would generally be offset by gains and losses on the underlying exposures being hedged.
36
Interest Rate Risk
See Note 18, "Financial Instruments" to the Company's consolidated financial statements included in Item 8 of this Form 10-K for additional information.
Commodity Risk
The Company's exposures to market risk from changes in the price of production material are managed primarily through negotiations with suppliers and customers, although there can be no assurance that the Company will recover all such costs. The Company continues to evaluate derivatives available in the marketplace and may decide to utilize derivatives in the future to manage select commodity risks if an acceptable hedging instrument is identified for the Company's exposure level at that time, as well as the effectiveness of the financial hedge among other factors.
37
Item 8.Financial Statements and Supplementary Data
Visteon Corporation and Subsidiaries
Index to Consolidated Financial Statements
| Page No. | |||||
Consolidated Statements of Operations for the years ended December 31, 2021, 2020 and 2019 | |||||
38
Management's Report on Internal Control Over Financial Reporting
Management is responsible for establishing and maintaining adequate internal control over financial reporting as such term is defined under Rule 13a-15(f) of the Securities Exchange Act of 1934. Under the supervision and with the participation of the principal executive and financial officers of the Company, an evaluation of the effectiveness of internal control over financial reporting was conducted based on the framework in Internal Control – Integrated Framework issued by the Committee of Sponsoring Organizations (“the COSO 2013 Framework”) of the Treadway Commission.
Based on the evaluation performed under the COSO 2013 Framework as of December 31, 2021, management has concluded that the Company’s internal control over financial reporting is effective. Additionally, Ernst & Young LLP, an independent registered public accounting firm, has audited the effectiveness of the Company’s internal control over financial reporting as of December 31, 2021, as stated in their report which is included herein.
39
Report of Independent Registered Public Accounting Firm
To the Stockholders and the Board of Directors of Visteon Corporation
Opinion on the Financial Statements
We have audited the accompanying consolidated balance sheets of Visteon Corporation and subsidiaries (the Company) as of December 31, 2021 and 2020, the related consolidated statements of operations, comprehensive income (loss), cash flows and changes in equity for each of the three years in the period ended December 31, 2021, and the related notes and financial statement schedule included in Item 15(a)(2) (collectively referred to as the "consolidated financial statements"). In our opinion, the consolidated financial statements present fairly, in all material respects, the financial position of the Company at December 31, 2021 and 2020, and the results of its operations and its cash flows for each of the three years in the period ended December 31, 2021, in conformity with U.S. generally accepted accounting principles.
We also have audited, in accordance with the standards of the Public Company Accounting Oversight Board (United States) (PCAOB), the Company’s internal control over financial reporting as of December 31, 2021, based on criteria established in Internal Control-Integrated Framework issued by the Committee of Sponsoring Organizations of the Treadway Commission (2013 framework), and our report dated February 17, 2022 expressed an unqualified opinion thereon.
Basis for Opinion
These financial statements are the responsibility of the Company's management. Our responsibility is to express an opinion on the Company’s financial statements based on our audits. We are a public accounting firm registered with the PCAOB and are required to be independent with respect to the Company in accordance with the U.S. federal securities laws and the applicable rules and regulations of the Securities and Exchange Commission and the PCAOB.
We conducted our audits in accordance with the standards of the PCAOB. Those standards require that we plan and perform the audit to obtain reasonable assurance about whether the financial statements are free of material misstatement, whether due to error or fraud. Our audits included performing procedures to assess the risks of material misstatement of the financial statements, whether due to error or fraud, and performing procedures that respond to those risks. Such procedures included examining, on a test basis, evidence regarding the amounts and disclosures in the financial statements. Our audits also included evaluating the accounting principles used and significant estimates made by management, as well as evaluating the overall presentation of the financial statements. We believe that our audits provide a reasonable basis for our opinion.
Critical Audit Matters
The critical audit matters communicated below are matters arising from the current period audit of the consolidated financial statements that were communicated or required to be communicated to the audit committee and that: (1) relate to accounts or disclosures that are material to the consolidated financial statements and (2) involved especially challenging, subjective, or complex judgments. The communication of critical audit matters does not alter in any way our opinion on the consolidated financial statements, taken as a whole, and we are not, by communicating the critical audit matters below, providing a separate opinion on the critical audit matters or on the accounts or disclosures to which they relate.
40
| Revenue Recognition | ||||||||
| Description of the Matter | As discussed in Note 1, Summary of Significant Accounting Policies, the Company’s sales contracts with its customers may provide for discrete price adjustments during the vehicle production period in order for the Company to remain competitive with market prices or based on changes in production specifications. Some of these price adjustments are non-routine in nature and require estimation. In the event the Company concludes that a portion of the revenue for a given part may vary from the purchase order, the Company records consideration at the most likely amount to which the Company expects to be entitled based on historical experience and input from customer negotiations. Auditing the consideration the Company expects to be entitled to in exchange for certain of its products which are subject to non-routine price adjustments is highly judgmental due to changes in production specifications and commercial negotiations with customers throughout the life of the production periods. | |||||||
| How We Addressed the Matter in Our Audit | We identified and tested controls relating to the identification and evaluation of non-routine pricing adjustments including management’s evaluation of the commercial facts and circumstances to support the most likely consideration to which the Company expects to be entitled. Our audit procedures included, among others, inspecting communications between the Company and its customers related to the pricing arrangements, making inquiries of the sales representatives who are responsible for negotiations with customers, testing any subsequent adjustments for appropriate amount and timing, obtaining written representations from management regarding customer agreements, and performing retrospective reviews of management’s estimates to identify any contrary evidence. | |||||||
| Impairment of Long-lived Assets - Property and Equipment | ||||||||
| Description of the Matter | As of December 31, 2021, the Company's property and equipment, net balance was $388 million. As discussed in Note 4, Restructuring and Impairments, during the fourth quarter of 2021, the Company recorded an impairment of certain long-lived assets in Brazil due to rising costs and deteriorating business conditions. The Company evaluated its property and equipment in Brazil for recoverability and concluded that certain assets were impaired. The Company recognized a $9 million impairment charge, which is the amount by which the carrying value exceeded the estimated fair value of these assets. Auditing the Company’s impairment measurement involved a high degree of judgment as estimates underlying the determination of fair value of the long-lived assets were based on assumptions affected by current market and economic conditions. To determine the fair value of the long-lived asset group, the Company utlized a cost and market approach, measuring fair value on the standalone basis value premise. | |||||||
| How We Addressed the Matter in Our Audit | We identified and tested controls relating to the determination of the asset group's fair value and measurement of the related impairment. We also tested controls over the Company's review of the significant assumptions and methodologies used in the calculation of fair value of the related assets. Our audit procedures included, among others, evaluating the valuation methodology, significant assumptions and data used in the valuation, and testing the mathematical accuracy of the impairment charge. We also involved our valuation specialists to assist in evaluating the approach and key assumptions used to estimate the fair value. | |||||||
/s/ Ernst & Young LLP
We have served as the Company’s auditor since 2012.
February 17, 2022
41
Report of Independent Registered Public Accounting Firm
To the Stockholders and the Board of Directors of Visteon Corporation
Opinion on Internal Control Over Financial Reporting
We have audited Visteon Corporation and subsidiaries’ internal control over financial reporting as of December 31, 2021, based on criteria established in Internal Control-Integrated Framework issued by the Committee of Sponsoring Organizations of the Treadway Commission (2013 framework) (the COSO criteria). In our opinion, Visteon Corporation and subsidiaries (the Company) maintained, in all material respects, effective internal control over financial reporting as of December 31, 2021, based on the COSO criteria.
We also have audited, in accordance with the standards of the Public Company Accounting Oversight Board (United States) (PCAOB), the 2021 consolidated financial statements of the Company and our report dated February 17, 2022 expressed an unqualified opinion thereon.
Basis for Opinion
The Company’s management is responsible for maintaining effective internal control over financial reporting and for its assessment of the effectiveness of internal control over financial reporting included in the accompanying Management’s Report on Internal Control Over Financial Reporting. Our responsibility is to express an opinion on the Company’s internal control over financial reporting based on our audit. We are a public accounting firm registered with the PCAOB and are required to be independent with respect to the Company in accordance with the U.S. federal securities laws and the applicable rules and regulations of the Securities and Exchange Commission and the PCAOB.
We conducted our audit in accordance with the standards of the PCAOB. Those standards require that we plan and perform the audit to obtain reasonable assurance about whether effective internal control over financial reporting was maintained in all material respects.
Our audit included obtaining an understanding of internal control over financial reporting, assessing the risk that a material weakness exists, testing and evaluating the design and operating effectiveness of internal control based on the assessed risk, and performing such other procedures as we considered necessary in the circumstances. We believe that our audit provides a reasonable basis for our opinion.
Definition and Limitations of Internal Control Over Financial Reporting
A company’s internal control over financial reporting is a process designed to provide reasonable assurance regarding the reliability of financial reporting and the preparation of financial statements for external purposes in accordance with generally accepted accounting principles. A company’s internal control over financial reporting includes those policies and procedures that (1) pertain to the maintenance of records that, in reasonable detail, accurately and fairly reflect the transactions and dispositions of the assets of the company; (2) provide reasonable assurance that transactions are recorded as necessary to permit preparation of financial statements in accordance with generally accepted accounting principles, and that receipts and expenditures of the company are being made only in accordance with authorizations of management and directors of the company; and (3) provide reasonable assurance regarding prevention or timely detection of unauthorized acquisition, use, or disposition of the company’s assets that could have a material effect on the financial statements.
Because of its inherent limitations, internal control over financial reporting may not prevent or detect misstatements. Also, projections of any evaluation of effectiveness to future periods are subject to the risk that controls may become inadequate because of changes in conditions, or that the degree of compliance with the policies or procedures may deteriorate.
/s/ Ernst & Young LLP
Detroit, Michigan
February 17, 2022
42
VISTEON CORPORATION AND SUBSIDIARIES
CONSOLIDATED STATEMENTS OF OPERATIONS
(In millions, except per share amounts)
| Year Ended December 31, | |||||||||||||||||
| 2021 | 2020 | 2019 | |||||||||||||||
Net sales | $ | $ | $ | ||||||||||||||
Cost of sales | ( | ( | ( | ||||||||||||||
Gross margin | |||||||||||||||||
Selling, general and administrative expenses | ( | ( | ( | ||||||||||||||
Restructuring and impairment expense | ( | ( | ( | ||||||||||||||
Interest expense | ( | ( | ( | ||||||||||||||
Interest income | |||||||||||||||||
Equity in net income of non-consolidated affiliates | |||||||||||||||||
Other income, net | |||||||||||||||||
Income (loss) before income taxes | ( | ||||||||||||||||
Provision for income taxes | ( | ( | ( | ||||||||||||||
Net income (loss) from continuing operations | ( | ||||||||||||||||
Net income (loss) from discontinued operations, net of tax | ( | ||||||||||||||||
Net income (loss) | ( | ||||||||||||||||
Net (income) loss attributable to non-controlling interests | ( | ( | ( | ||||||||||||||
Net income (loss) attributable to Visteon Corporation | $ | $ | ( | $ | |||||||||||||
Basic earnings (loss) per share: | |||||||||||||||||
Continuing operations | $ | $ | ( | $ | |||||||||||||
Discontinued operations | ( | ||||||||||||||||
Basic earnings (loss) per share attributable to Visteon Corporation | $ | $ | ( | $ | |||||||||||||
Diluted earnings (loss) per share: | |||||||||||||||||
Continuing operations | $ | $ | ( | $ | |||||||||||||
Discontinued operations | ( | ||||||||||||||||
Diluted earnings (loss) per share attributable to Visteon Corporation | $ | $ | ( | $ | |||||||||||||
See accompanying notes to the consolidated financial statements.
43
VISTEON CORPORATION AND SUBSIDIARIES
CONSOLIDATED STATEMENTS OF COMPREHENSIVE INCOME (LOSS)
(In millions)
| Year Ended December 31, | |||||||||||||||||
| 2021 | 2020 | 2019 | |||||||||||||||
Net income (loss) | $ | $ | ( | $ | |||||||||||||
Foreign currency translation adjustments | ( | ( | |||||||||||||||
Net investment hedge | ( | ||||||||||||||||
Benefit plans, net of tax (a) | ( | ( | |||||||||||||||
Unrealized hedging gains (losses), net of tax (b) | ( | ( | |||||||||||||||
Other comprehensive income (loss), net of tax | ( | ( | |||||||||||||||
Comprehensive income (loss) | ( | ||||||||||||||||
Comprehensive income (loss) attributable to non-controlling interests | |||||||||||||||||
Comprehensive income (loss) attributable to Visteon Corporation | $ | $ | ( | $ | |||||||||||||
(a) Benefit plans, net of tax reflects tax expense of $4 million for the year ended December 31, 2021, tax expense of less than $1 million for the year ended December 31,2020, and tax benefit of $5 million for the year ended December 31, 2019.
(b) Unrealized hedging gains (losses), net of tax reflects no
See accompanying notes to the consolidated financial statements.
44
VISTEON CORPORATION AND SUBSIDIARIES
CONSOLIDATED BALANCE SHEETS
(In millions)
| December 31, | |||||||||||
| 2021 | 2020 | ||||||||||
| ASSETS | |||||||||||
Cash and equivalents | $ | $ | |||||||||
Restricted cash | |||||||||||
Accounts receivable, net | |||||||||||
Inventories, net | |||||||||||
Other current assets | |||||||||||
Total current assets | |||||||||||
Property and equipment, net | |||||||||||
Intangible assets, net | |||||||||||
Right-of-use assets | |||||||||||
Investments in non-consolidated affiliates | |||||||||||
Other non-current assets | |||||||||||
Total assets | $ | $ | |||||||||
| LIABILITIES AND EQUITY | |||||||||||
Short-term debt | $ | $ | |||||||||
Accounts payable | |||||||||||
Accrued employee liabilities | |||||||||||
Current lease liability | |||||||||||
Other current liabilities | |||||||||||
Total current liabilities | |||||||||||
Long-term debt, net | |||||||||||
Employee benefits | |||||||||||
Non-current lease liability | |||||||||||
Deferred tax liabilities | |||||||||||
Other non-current liabilities | |||||||||||
Stockholders’ equity: | |||||||||||
Preferred stock (par value $ | |||||||||||
Common stock (par value $ | |||||||||||
Additional paid-in capital | |||||||||||
Retained earnings | |||||||||||
Accumulated other comprehensive loss | ( | ( | |||||||||
Treasury stock | ( | ( | |||||||||
Total Visteon Corporation stockholders’ equity | |||||||||||
Non-controlling interests | |||||||||||
Total equity | |||||||||||
Total liabilities and equity | $ | $ | |||||||||
See accompanying notes to the consolidated financial statements.
45
VISTEON CORPORATION AND SUBSIDIARIES
CONSOLIDATED STATEMENTS OF CASH FLOWS
(In millions)
| Year Ended December 31, | |||||||||||||||||
| 2021 | 2020 | 2019 | |||||||||||||||
Operating Activities | |||||||||||||||||
Net income (loss) | $ | $ | ( | $ | |||||||||||||
Adjustments to reconcile net income (loss) to net cash provided from operating activities: | |||||||||||||||||
Depreciation and amortization | |||||||||||||||||
Non-cash stock-based compensation | |||||||||||||||||
Equity in net income of non-consolidated affiliates, net of dividends remitted | ( | ( | |||||||||||||||
Impairments | |||||||||||||||||
Other non-cash items | |||||||||||||||||
Changes in assets and liabilities: | |||||||||||||||||
Accounts receivable | ( | ( | |||||||||||||||
Inventories | ( | ( | |||||||||||||||
Accounts payable | ( | ||||||||||||||||
Other assets and other liabilities | ( | ( | |||||||||||||||
Net cash provided from operating activities | |||||||||||||||||
Investing Activities | |||||||||||||||||
Capital expenditures, including intangibles | ( | ( | ( | ||||||||||||||
| Contributions to equity method investments | ( | ( | ( | ||||||||||||||
| Net investment hedge transactions | |||||||||||||||||
Loan repayments from non-consolidated affiliates | |||||||||||||||||
Other, net | ( | ||||||||||||||||
Net cash used by investing activities | ( | ( | ( | ||||||||||||||
Financing Activities | |||||||||||||||||
Borrowings on debt | |||||||||||||||||
Principal payments on debt | ( | ||||||||||||||||
Repurchase of common stock | ( | ( | |||||||||||||||
Short-term debt, net | ( | ( | |||||||||||||||
Dividends paid to non-controlling interests | ( | ( | ( | ||||||||||||||
Other | ( | ||||||||||||||||
Net cash used by financing activities | ( | ( | ( | ||||||||||||||
Effect of exchange rates | ( | ( | |||||||||||||||
Net increase (decrease) in cash, equivalents, and restricted cash | ( | ||||||||||||||||
Cash, equivalents, and restricted cash at beginning of the period | |||||||||||||||||
Cash, equivalents, and restricted cash at end of the period | $ | $ | $ | ||||||||||||||
Supplemental Disclosures: | |||||||||||||||||
Cash paid for interest | $ | $ | $ | ||||||||||||||
Cash paid for income taxes, net of refunds | $ | $ | $ | ||||||||||||||
See accompanying notes to the consolidated financial statements.
46
VISTEON CORPORATION AND SUBSIDIARIES
CONSOLIDATED STATEMENTS OF CHANGES IN EQUITY
(In millions)
| Total Visteon Corporation Stockholders' Equity | |||||||||||||||||||||||||||||||||||||||||||||||
| Common Stock | Additional Paid-In Capital | Retained Earnings | Accumulated Other Comprehensive Income (Loss) | Treasury Stock | Total Visteon Corporation Stockholders' Equity | Non-Controlling Interests | Total Equity | ||||||||||||||||||||||||||||||||||||||||
| December 31, 2018 | $ | $ | $ | $ | ( | $ | ( | $ | $ | $ | |||||||||||||||||||||||||||||||||||||
Net income (loss) | — | — | — | — | |||||||||||||||||||||||||||||||||||||||||||
Other comprehensive income (loss) | — | — | — | ( | — | ( | ( | ( | |||||||||||||||||||||||||||||||||||||||
Stock-based compensation, net | — | — | — | — | |||||||||||||||||||||||||||||||||||||||||||
Repurchase of shares of common stock | — | — | — | — | ( | ( | — | ( | |||||||||||||||||||||||||||||||||||||||
Cash dividends | — | — | — | — | — | — | ( | ( | |||||||||||||||||||||||||||||||||||||||
| Acquisition of non-controlling interest | — | — | — | — | ( | ||||||||||||||||||||||||||||||||||||||||||
| December 31, 2019 | $ | $ | $ | $ | ( | $ | ( | $ | $ | $ | |||||||||||||||||||||||||||||||||||||
Net income (loss) | — | — | ( | — | — | ( | ( | ||||||||||||||||||||||||||||||||||||||||
Other comprehensive income (loss) | — | — | — | ( | — | ( | ( | ||||||||||||||||||||||||||||||||||||||||
Stock-based compensation, net | — | — | — | — | |||||||||||||||||||||||||||||||||||||||||||
Repurchase of shares of common stock | — | — | — | — | ( | ( | — | ( | |||||||||||||||||||||||||||||||||||||||
Cash dividends | — | — | — | — | — | — | ( | ( | |||||||||||||||||||||||||||||||||||||||
| December 31, 2020 | $ | $ | $ | $ | ( | $ | ( | $ | $ | $ | |||||||||||||||||||||||||||||||||||||
Net income (loss) | — | — | — | — | |||||||||||||||||||||||||||||||||||||||||||
Other comprehensive income (loss) | — | — | — | ||||||||||||||||||||||||||||||||||||||||||||
Stock-based compensation, net | — | — | — | — | |||||||||||||||||||||||||||||||||||||||||||
Cash dividends | — | — | — | — | — | — | ( | ( | |||||||||||||||||||||||||||||||||||||||
| December 31, 2021 | $ | $ | $ | $ | ( | $ | ( | $ | $ | $ | |||||||||||||||||||||||||||||||||||||
See accompanying notes to the consolidated financial statements.
47
VISTEON CORPORATION AND SUBSIDIARIES
NOTES TO CONSOLIDATED FINANCIAL STATEMENTS
NOTE 1. Summary of Significant Accounting Policies
48
The Company’s contracts with customers involve various governing documents (sourcing agreements, master purchase agreements, terms and conditions agreements, etc.) which do not reach the level of a performance obligation of the Company until the Company receives either a purchase order and/or a customer release for a specific number of parts at a specified price, at which point the collective group of documents represent an enforceable contract. While the long-term supply agreements generally range from three to five years, customers make no commitments to volumes, and pricing or specifications can change prior to or during production. The Company recognizes revenue when control of the parts produced are transferred to the customer according to the terms of the contract, which is usually when the parts are shipped or delivered to the customer’s premises. Customers are generally invoiced upon shipment or delivery and payment generally occurs within 45 to 90 days and do not include significant financing components. Customers in China are often invoiced one month after shipment or delivery. Customer returns, when they occur, relate to quality rework issues and are not connected to any repurchase obligation of the Company. As of December 31, 2021, all unfulfilled performance obligations are expected to be fulfilled within the next twelve months .
Revenue is measured based on the transaction price and the quantity of parts specified in a contract with a customer. Discrete price adjustments may occur during the vehicle production period in order for the Company to remain competitive with market prices or based on changes in product specifications. Some of these price adjustments are non-routine in nature and require estimation. In the event the Company concludes that a portion of the revenue for a given part may vary from the purchase order, the Company records consideration at the most likely amount to which the Company expects to be entitled based on historical experience and input from customer negotiations. The Company records such estimates within Net sales and Accounts receivable, net, within the Consolidated Statements of Operations and Consolidated Balance Sheets, respectively. The Company adjusts its pricing reserves at the earlier of when the most likely amount of consideration changes or when the consideration becomes fixed. In 2021, revenue recognized related to performance obligations satisfied in previous periods represented less than 1 % of consolidated net sales.
Taxes assessed by a governmental authority that are both imposed on and concurrent with a specific revenue-producing transaction that are collected by the Company from a customer are excluded from revenue. Shipping and handling costs associated with outbound freight after control of the parts has transferred to a customer are accounted for as a fulfillment cost and are included in Cost of Sales.
49
The allowance for doubtful accounts related to accounts receivable and related activity are summarized below:
| December 31, | |||||||||||||||||
| (In millions) | 2021 | 2020 | 2019 | ||||||||||||||
| Balance at beginning of year | $ | $ | $ | ||||||||||||||
| Provision | |||||||||||||||||
| Recoveries | ( | ( | |||||||||||||||
| Write-offs charged against the allowance | ( | ( | |||||||||||||||
| Balance at end of year | $ | $ | $ | ||||||||||||||
Provision for estimated uncollectible accounts receivable are included in Selling, general and administrative expenses in the Company's Consolidated Statements of Operations.
50
Property and Equipment: Property and equipment is stated at cost or fair value for impaired assets. Property and equipment is depreciated principally using the straight-line method of depreciation over the related asset's estimated useful life.
Asset impairment charges are recorded for assets held-in-use when events and circumstances indicate that such assets may not be recoverable and the undiscounted net cash flows estimated to be generated by those assets are less than their carrying amounts. If estimated future undiscounted cash flows are not sufficient to recover the carrying value of the assets, an impairment charge is recorded for the amount by which the carrying value of the assets exceeds fair value. Fair value is determined using appraisals, management estimates or discounted cash flow calculations. For further detail on the Company’s impairments see Note 4, "Restructuring and Impairments."
Income Taxes: Deferred tax assets and liabilities are recognized for the future tax consequences attributable to differences between financial statement carrying amounts of existing assets and liabilities and their respective tax bases and operating loss and tax credit carryforwards. Deferred tax assets and liabilities are measured using enacted tax rates expected to apply to taxable income in the years in which those temporary differences are expected to be recovered or settled. The Company records a valuation allowance to reduce deferred tax assets when it is more likely than not that such assets will not be realized. This assessment requires judgment, and must be done on a jurisdiction-by-jurisdiction basis. In determining the need for a valuation allowance, all available positive and negative evidence, including historical and projected financial performance, is considered along with any other pertinent information.
Value Added Taxes: The Company reports value added taxes collected from customers and remitted to government authorities, on a net basis within Cost of sales.
51
Recently Adopted Accounting Pronouncements
Reference Rate Reform - In March 2020, the FASB issued ASU 2020-04, "Reference Rate Reform (Topic 848) - Facilitation of the Effects of Reference Rate Reform on Financial Reporting." Subsequently, in 2021, the FASB issued ASU 2021-01, "Reference Rate Reform", to further clarify and expand certain aspects of ASC 848. ASU 2020-04 and ASU 2021-01 provide optional expedients and exceptions related to certain contract modifications and hedging relationships that reference the London Interbank Offered Rate ("LIBOR") or another rate that is expected to be discontinued. The guidance was effective upon issuance and is generally applied to applicable contract modifications and hedge relationships prospectively through December 31, 2022. The adoption of the guidance did not have a material impact on the Company’s consolidated financial statements.
Government Assistance - In November 2021, the FASB issued ASU 2021-10, "Government Assistance (Topic 832) - Disclosures by Business Entities about Government Assistance." to increase the transparency of government assistance including the disclosure of the types of assistance, an entity’s accounting for the assistance, and the effect of the assistance on an entity’s financial statements. The amendments in this update are effective for all entities within their scope for financial statements issued for annual periods beginning after December 15, 2021. The Company is current evaluating the impact of the adoption of Topic 848.
NOTE 2. Discontinued Operations
During 2014 and 2015, the Company completed its divestiture of the majority of its global Interiors business (the "Interiors Divestiture") and completed the sale of its Argentina and Brazil interiors operations on December 1, 2016. Separately, the Company completed the sale of the majority of its global Climate business (the "Climate Transaction") during 2015. These transactions met the conditions required to qualify for discontinued operations reporting and accordingly the results of operations and the settlement of retained contingencies have been classified in income (loss) from discontinued operations, net of tax, in the Consolidated Statements of Operations.
There were no discontinued operations during 2021 or 2020. During 2019 the Company recognized approximately $2 million of cost of sales for corrections of judicial deposits related to former employees at a closed plant in Brazil and recorded a $1 million release of restructuring expense due to a change in estimate.
NOTE 3. Non-Consolidated Affiliates
Non-Consolidated Affiliate Transactions
Visteon and Yangfeng Automotive Trim Systems Co. Ltd. ("YF") each own 50 49 % direct ownership in Yanfeng Visteon Automotive Electronics Co., Ltd ("YFVE") a consolidated joint venture of the Company ("The YFVIC Transaction"). The purchase by YFVIC was financed through a shareholder loan from YF and external borrowings, guaranteed by Visteon, which were paid in 2019.
The Company has committed to make investments totaling $15 million in two entities principally focused on the automotive sector pursuant to limited partnership agreements. As a limited partner in each entity, the Company will periodically make capital contributions toward this total commitment amount. Through December 31, 2021, the Company had contributed approximately $9 million to these entities. These investments are classified as equity method investments.
Investments in Affiliates
The Company recorded equity in the net income of non-consolidated affiliates of $6 million for each of the years ended December 31, 2021, 2020 and 2019, respectively.
The Company monitors its investments in affiliates for indicators of other-than-temporary declines in value on an ongoing basis. If the Company determines that an other-than-temporary decline in value has occurred, an impairment loss will be recorded, which is measured as the difference between the recorded book value and the fair value of the investment. As of December 31, 2021, the Company determined that no such indicators were present.
Variable Interest Entities
The Company determined that YFVIC is a VIE. The Company holds a variable interest in YFVIC primarily related to its ownership interests and subordinated financial support. The Company and YF each own 50
52
the power to control the operations of YFVIC; therefore, the Company is not the primary beneficiary of YFVIC and does not consolidate the joint venture.
A summary of the Company's investments in non-consolidated equity method affiliates is provided below:
| December 31, | |||||||||||
| (In millions) | 2021 | 2020 | |||||||||
YFVIC ( | $ | $ | |||||||||
| Limited partnerships | |||||||||||
Others | |||||||||||
Total investments in non-consolidated affiliates | $ | $ | |||||||||
A summary of transactions with affiliates is shown below:
| Year Ended December 31, | |||||||||||
| (In millions) | 2021 | 2020 | |||||||||
Billings to affiliates (a) | $ | $ | |||||||||
| Purchases from affiliates (b) | $ | $ | |||||||||
(a) Primarily relates to parts production and engineering reimbursement | |||||||||||
(b) Primarily relates to engineering services as well as selling, general and administrative expenses | |||||||||||
A summary of the Company's investments in YFVIC is provided below:
| December 31, | |||||||||||
| (In millions) | 2021 | 2020 | |||||||||
Payables due to YFVIC | $ | $ | |||||||||
Exposure to loss in YFVIC | |||||||||||
Investment in YFVIC | $ | $ | |||||||||
Receivables due from YFVIC | |||||||||||
Subordinated loan receivable | |||||||||||
Maximum exposure to loss in YFVIC | $ | $ | |||||||||
NOTE 4. Restructuring and Impairments
Given the economically-sensitive and highly competitive nature of the automotive electronics industry, the Company continues to closely monitor current market factors and industry trends, including potential impacts related to COVID-19, taking action as necessary which may include restructuring actions. However, there can be no assurance that any such actions will be sufficient to fully offset the impact of adverse factors on the Company or its results of operations, financial position and cash flows.
Current restructuring actions include the following:
•During 2021 the Company approved various restructuring programs, primarily impacting Europe and Brazil in order to improve efficiencies and rationalize the Company's footprint. Accordingly, the Company recorded $4 million of restructuring expense related to these actions. As of December 31, 2021, $3 million remains accrued related to these programs.
•During 2020 the Company approved various restructuring programs impacting engineering, administrative and manufacturing functions to improve efficiency and rationalize the Company’s footprint. The Company recorded $1 million and $76 million of net restructuring expenses for cash severance, retention, and termination costs for the years ended December 31, 2021 and December 31, 2020, respectively related to these programs. As of December 31, 2021, $12 million remains accrued related to these programs.
•During 2019, the Company approved a restructuring program impacting two European manufacturing facilities due to the end of certain product lines. During the year ended December 31, 2019, the Company recorded net restructuring expense of $2 million related to this program
53
•During 2018, the Company approved a restructuring program impacting legacy employees at a South America facility due to the wind-down of certain products. As of December 31, 2021, $1 million remains accrued related to this program.
As of December 31, 2021, the Company retained restructuring reserves as part of the Company's divestiture of the majority of its Interiors Divestiture of $2 million associated with completed programs for the fundamental reorganization of operations at facilities in Brazil and France.
Restructuring Reserves
Restructuring reserve balances of $16 million and $2 million as of December 31, 2021 are classified as Other Current Liabilities and Other non-current liabilities, respectively. Restructuring reserve balances of $39 million and $10 million as of December 31, 2020 are classified as Other current liabilities and Other non-current liabilities, respectively. The Company anticipates that the activities associated with the current restructuring reserve balance will be substantially complete by end of 2022.
The Company’s consolidated restructuring reserves and related activity are summarized below, including amounts associated with discontinued operations.
| (In millions) | |||||
| December 31, 2018 | $ | ||||
| Expense | $ | ||||
| Change in estimates | $ | ( | |||
| Utilization | $ | ( | |||
| Foreign currency | $ | ( | |||
| December 31, 2019 | $ | ||||
| Expense | $ | ||||
| Change in estimates | $ | ||||
| Utilization | $ | ( | |||
| Foreign currency | $ | ||||
| December 31, 2020 | $ | ||||
| Expense | $ | ||||
| Change in estimates | $ | ||||
| Utilization | $ | ( | |||
| Foreign currency and other | $ | ( | |||
| December 31, 2021 | $ | ||||
Impairment of Long-lived Assets
The Company evaluates its long-lived assets for impairment whenever events or circumstances indicate the value of these long-lived asset groups are not recoverable. During the fourth quarter of 2021, the Company concluded impairment triggers had occurred for a long-lived asset group in Brazil due to rising costs and deteriorating business conditions. The Company determined the cash flows related to certain long-lived assets were not sufficient to recover the carrying value. As such, the Company estimated the fair values of this asset group at December 31, 2021 and compared the fair value to its net carrying value. As the net carrying value of the long-lived asset group exceeded the fair value, the Company recorded a non-cash impairment charge of $9 million to write-down property and equipment to its fair value as of December 31, 2021.
54
NOTE 5. Inventories
Inventories, net consist of the following components:
| December 31, | |||||||||||
| (In millions) | 2021 | 2020 | |||||||||
Raw materials | $ | $ | |||||||||
Work-in-process | |||||||||||
Finished products | |||||||||||
| $ | $ | ||||||||||
NOTE 6. Other Assets
Other current assets are comprised of the following components:
| December 31, | |||||||||||
| (In millions) | 2021 | 2020 | |||||||||
Joint venture receivables | $ | $ | |||||||||
Recoverable taxes | |||||||||||
Contractually reimbursable engineering costs | |||||||||||
Prepaid assets and deposits | |||||||||||
Royalty agreements | |||||||||||
China bank notes | |||||||||||
| Derivative financial instruments | |||||||||||
Other | |||||||||||
| $ | $ | ||||||||||
The Company receives bank notes from certain customers in China to settle trade accounts receivable. The collection of such bank notes are included in operating cash flows based on the substance of the underlying transactions, which are operating in nature. The Company redeemed $149 million and $163 million of China bank notes during the years ended December 31, 2021 and 2020, respectively. Remaining amounts outstanding at third-party institutions relate to sold bank notes will mature by June 30, 2022.
Other non-current assets are comprised of the following components:
| December 31, | |||||||||||
| (In millions) | 2021 | 2020 | |||||||||
Deferred tax assets | $ | $ | |||||||||
| Contractually reimbursable engineering costs | |||||||||||
| Recoverable taxes | |||||||||||
| Pension assets | |||||||||||
| Royalty agreements | |||||||||||
Joint venture note receivables | |||||||||||
Other | |||||||||||
| $ | $ | ||||||||||
Current and non-current contractually reimbursable engineering costs are related to pre-production design and development costs incurred pursuant to long-term supply arrangements that are contractually guaranteed for reimbursement by customers. The Company expects to receive cash reimbursement payments of approximately $34 million in 2022, $24 million in 2023, $8 million in 2024, $2 million in 2025 and less than $1 million in 2026 and beyond.
55
NOTE 7. Property and Equipment
Property and equipment, net consists of the following:
| December 31, | |||||||||||||||||
| (In millions) | Estimated Useful Life (years) | 2021 | 2020 | ||||||||||||||
Land | $ | $ | |||||||||||||||
Buildings and improvements | |||||||||||||||||
Machinery, equipment and other | |||||||||||||||||
| Product tooling | |||||||||||||||||
Construction in progress | |||||||||||||||||
Total property and equipment | |||||||||||||||||
Accumulated depreciation and amortization | ( | ( | |||||||||||||||
Property and equipment, net | $ | $ | |||||||||||||||
Depreciation and product tooling amortization expenses are summarized as follows:
| Year Ended December 31, | |||||||||||||||||
| (In millions) | 2021 | 2020 | 2019 | ||||||||||||||
| Depreciation | $ | $ | $ | ||||||||||||||
| Amortization | |||||||||||||||||
| $ | $ | $ | |||||||||||||||
The net book value of capitalized internal use software costs was approximately $12 million and $18 million as of December 31, 2021 and 2020, respectively. Related amortization expense was approximately $8 million, $9 million and $9 million for the years ended 2021, 2020 and 2019, respectively. Amortization expense of approximately $5 million, $3 million, $2 million, $1 million, and $1 million is expected for the annual periods ended December 31, 2022, 2023, 2024, 2025, and 2026 respectively.
NOTE 8. Intangible Assets
Intangible assets consisted of the following:
| December 31, 2021 | December 31, 2020 | ||||||||||||||||||||||||||||||||||||||||
| (In millions) | Estimated Useful Life | Estimated Weighted Average Useful Life (years) | Gross Intangibles | Accumulated Amortization | Net Intangibles | Gross Intangibles | Accumulated Amortization | Net Intangibles | |||||||||||||||||||||||||||||||||
| Definite-Lived: | |||||||||||||||||||||||||||||||||||||||||
| Developed technology | $ | $ | ( | $ | $ | $ | ( | $ | |||||||||||||||||||||||||||||||||
| Customer related | ( | ( | |||||||||||||||||||||||||||||||||||||||
| Capitalized software development | ( | ( | |||||||||||||||||||||||||||||||||||||||
| Other | ( | ( | |||||||||||||||||||||||||||||||||||||||
| Subtotal | ( | ( | |||||||||||||||||||||||||||||||||||||||
| Indefinite-Lived: | |||||||||||||||||||||||||||||||||||||||||
| Goodwill | — | — | |||||||||||||||||||||||||||||||||||||||
| Total | $ | $ | ( | $ | $ | $ | ( | $ | |||||||||||||||||||||||||||||||||
56
Capitalized software development consists of software development costs intended for integration into customer products.
The Company recorded approximately $14 million, $14 million, and $16 million of amortization expense related to definite-lived intangible assets for the years ended December 31, 2021, 2020, and 2019, respectively. The Company currently estimates annual amortization expense to be $16 million for 2022, $15 million 2023, $9 million for both 2024 and 2025, and $7 million for 2026.
NOTE 9. Leases
The Company has operating leases primarily for corporate offices, technical and engineering centers, customer centers, vehicles, and certain equipment. As of December 31, 2021 and 2020 assets and related accumulated depreciation recorded under finance leasing arrangements were not material.
Certain of the Company's lease agreements include rental payments adjusted periodically primarily for inflation. The Company’s lease agreements do not contain any material residual value guarantees or material restrictive covenants. The Company subleases certain real estate to third parties, which primarily consists of operating leases in the United States, Germany, and Brazil.
For the years ended December 31, 2021 and 2020, the weighted average remaining lease term and discount rate were 6 years and 4.01 % and 6 years and 4.1 %, respectively.
The components of lease expense are as follows:
| Year Ended December 31, | |||||||||||
| (In millions) | 2021 | 2020 | |||||||||
| Operating lease expense (includes immaterial variable lease costs) | $ | ( | $ | ( | |||||||
| Short-term lease expense | ( | ( | |||||||||
| Sublease income | |||||||||||
| Total lease expense | $ | ( | $ | ( | |||||||
Other information related to leases is as follows:
| Year Ended December 31, | |||||||||||
| (In millions) | 2021 | 2020 | |||||||||
| Cash flows from operating leases | $ | $ | |||||||||
| Right-of-use assets obtained in exchange for lease obligations | $ | $ | |||||||||
Future minimum lease payments under non-cancellable leases is as follows:
| (In millions) | |||||
| 2022 | $ | ||||
| 2023 | |||||
| 2024 | |||||
| 2025 | |||||
| 2026 | |||||
| 2027 and thereafter | |||||
| Total future minimum lease payments | |||||
| Less imputed interest | ( | ||||
| Total lease liabilities | $ | ||||
57
NOTE 10. Other Liabilities
Other current liabilities are summarized as follows:
| December 31, | |||||||||||
| (In millions) | 2021 | 2020 | |||||||||
| Deferred income | $ | $ | |||||||||
Product warranty and recall accruals | |||||||||||
| Non-income taxes payable | |||||||||||
Joint venture payables | |||||||||||
| Restructuring reserves | |||||||||||
Royalty reserves | |||||||||||
Income taxes payable | |||||||||||
Other | |||||||||||
| $ | $ | ||||||||||
Other non-current liabilities are summarized as follows:
| December 31, | |||||||||||
| (In millions) | 2021 | 2020 | |||||||||
Product warranty and recall accruals | $ | $ | |||||||||
| Deferred income | |||||||||||
Derivative financial instruments | |||||||||||
Income tax reserves | |||||||||||
Royalty agreements | |||||||||||
| Restructuring reserves | |||||||||||
Other | |||||||||||
| $ | $ | ||||||||||
NOTE 11. Debt
The Company’s short and long-term debt consists of the following:
| Weighted Average Interest Rate | Carrying Value | ||||||||||||||||||||||
| (In millions) | 2021 | 2020 | 2021 | 2020 | |||||||||||||||||||
| Short-Term Debt: | |||||||||||||||||||||||
Short-term borrowings | $ | $ | — | ||||||||||||||||||||
| Long-Term Debt: | |||||||||||||||||||||||
| Term facility, net | $ | $ | |||||||||||||||||||||
Short-Term Debt
Short-term borrowings are related to affiliate borrowings and are primarily payable in Brazilian real and the Chinese renminbi. As of December 31, 2021, the Company has $4 million short-term borrowing and there is $168 million available capacity under affiliate credit facilities.
Long-Term Debt
As of December 31, 2021, the Company has an amended credit agreement ("Credit Agreement") which includes a $350 million Term Facility maturing March 24, 2024 and a $400 million Revolving Credit Facility which matures the earlier of (i) December 24, 2024, (ii) 90 days prior to the scheduled maturity of the Term Facility, or (iii) the date of the termination of the Company's credit agreement.
58
On March 19, 2020, the Company borrowed the entire amount of revolving loans available under the Revolving Credit Facility to increase its cash position and maximize its flexibility in response to unprecedented uncertainty related to the impact of COVID-19. On September 24, 2020, the Company fully repaid the amount borrowed under the Revolving Credit Facility following stronger than expected industry recovery and improved Company performance in the third quarter of 2020. The Company has no outstanding borrowings on the Revolving Credit Facility as of December 31, 2021 and 2020.
Interest on the Term Facility loan accrue at a rate equal to a LIBOR-based rate plus an applicable margin of 1.75 % per annum. Loans under the Company's Revolving Credit Facility accrue interest at a rate equal to a LIBOR-based rate plus an applicable margin of between 1.00 % - 2.00 %, as determined by the Company's total gross leverage ratio.
The Credit Agreement requires compliance with customary affirmative and negative covenants and contains customary events of default. The Revolving Credit Facility also requires that the Company maintain a total net leverage ratio no greater than 3.50 :1.00 . During any period when the Company’s corporate and family ratings meet investment grade ratings, certain of the negative covenants are suspended. As of December 31, 2021, the Company was in compliance with all its debt covenants.
The Revolving Credit Facility also provides $75 million availability for the issuance of letters of credit and a maximum of $20 million for swing line borrowings. Any amount of the facility utilized for letters of credit or swing line loans outstanding will reduce the amount available under the existing Revolving Credit Facility. The Company may request increases in the limits under the Credit Agreement and may request the addition of one or more term loan facilities. Outstanding borrowings may be prepaid without penalty (other than borrowings made for the purpose of reducing the effective interest rate margin or weighted average yield of the loans). There are mandatory prepayments of principal in connection with: (i) excess cash flow sweeps above certain leverage thresholds, (ii) certain asset sales or other dispositions, (iii) certain refinancing of indebtedness and (iv) over-advances under the Revolving Credit Facility. There are no excess cash flow sweeps required at the Company’s current leverage level.
All obligations under the Credit Agreement and obligations with respect to certain cash management services and swap transaction agreements between the Company and its lenders are unconditionally guaranteed by certain of the Company’s subsidiaries. Under the terms of the Credit Agreement, any amounts outstanding are secured by a first-priority perfected lien on substantially all property of the Company and the subsidiaries party to the security agreement, subject to certain limitations.
Other
The Company has a $5 million letter of credit facility, whereby the Company is required to maintain a cash collateral account equal to 103 % (110 % for non-U.S. dollar denominated letters) of the aggregate stated amount of issued letters of credit and must reimburse any amounts drawn under issued letters of credit. The Company had $2 million of outstanding letters of credit issued under this facility secured by restricted cash, as of December 31, 2021. Additionally, the Company had $10 million of locally issued letters of credit with less than $1 million of collateral as of December 31, 2021 to support various tax appeals, customs arrangements, and other obligations at its local affiliates.
59
NOTE 12. Employee Benefit Plans
Defined Benefit Plans
The Company sponsors pay related benefit plans for employees in the U.S., UK, Germany, Brazil, France, Mexico, Japan, and Canada. Employees in the U.S. and UK are no longer accruing benefits under the Company's defined benefit plans as these plans were frozen. The Company’s defined benefit plans are partially funded with the exception of certain supplemental benefit plans for executives and certain non-U.S. plans, primarily in Germany, which are unfunded.
The Company's expense for all defined benefit pension plans, is as follows:
| U.S. Plans | Non-U.S. Plans | ||||||||||||||||||||||||||||||||||
| Year Ended December 31, | Year Ended December 31, | ||||||||||||||||||||||||||||||||||
| (In millions, except percentages) | 2021 | 2020 | 2019 | 2021 | 2020 | 2019 | |||||||||||||||||||||||||||||
| Costs Recognized in Income: | |||||||||||||||||||||||||||||||||||
| Pension service cost: | |||||||||||||||||||||||||||||||||||
Service cost | $ | $ | $ | $ | ( | $ | ( | $ | ( | ||||||||||||||||||||||||||
Pension financing benefit (cost): | |||||||||||||||||||||||||||||||||||
Interest cost | ( | ( | ( | ( | ( | ( | |||||||||||||||||||||||||||||
| Expected return on plan assets | |||||||||||||||||||||||||||||||||||
Amortization of losses and other | ( | ( | ( | ( | ( | ||||||||||||||||||||||||||||||
Settlements and curtailments | ( | ||||||||||||||||||||||||||||||||||
Restructuring related pension cost: | |||||||||||||||||||||||||||||||||||
Special termination benefits (a) | ( | ( | ( | ( | |||||||||||||||||||||||||||||||
| Net pension income (expense) | $ | $ | $ | $ | ( | $ | ( | $ | ( | ||||||||||||||||||||||||||
| Weighted Average Assumptions: | |||||||||||||||||||||||||||||||||||
Discount rate | % | % | % | % | % | % | |||||||||||||||||||||||||||||
Compensation increase | N/A | N/A | N/A | % | % | % | |||||||||||||||||||||||||||||
Long-term return on assets | % | % | % | % | % | % | |||||||||||||||||||||||||||||
(a) Primarily related to restructuring actions | |||||||||||||||||||||||||||||||||||
The Company's total accumulated benefit obligations for all defined benefit plans was $1,121 million and $1,199 million as of
December 31, 2021 and 2020, respectively.The benefit plan obligations for employee retirement plans with accumulated benefit obligations in excess of plan assets were as follows:
December 31, 2021 and 2020, respectively.
| Year Ended December 31, | |||||||||||
| (In millions) | 2021 | 2020 | |||||||||
| Accumulated benefit obligation | $ | $ | |||||||||
| Projected benefit obligation | $ | $ | |||||||||
| Fair value of plan assets | $ | $ | |||||||||
Assumptions used by the Company in determining its defined benefit pension obligations as of December 31, 2021 and 2020 are summarized in the following table:
| U.S. Plans | Non-U.S. Plans | |||||||||||||||||||||||||
| Year Ended December 31, | Year Ended December 31, | |||||||||||||||||||||||||
| Weighted Average Assumptions | 2021 | 2020 | 2021 | 2020 | ||||||||||||||||||||||
| Discount rate | % | % | % | % | ||||||||||||||||||||||
| Rate of increase in compensation | N/A | N/A | % | % | ||||||||||||||||||||||
60
The Company’s obligation for all defined benefit pension plans, is as follows:
| U.S. Plans | Non-U.S. Plans | ||||||||||||||||||||||
| Year Ended December 31, | Year Ended December 31, | ||||||||||||||||||||||
| (In millions) | 2021 | 2020 | 2021 | 2020 | |||||||||||||||||||
Change in Benefit Obligation: | |||||||||||||||||||||||
Benefit obligation — beginning | $ | $ | $ | $ | |||||||||||||||||||
Service cost | |||||||||||||||||||||||
Interest cost | |||||||||||||||||||||||
Actuarial loss (gain) | ( | ( | |||||||||||||||||||||
| Settlements | ( | ( | ( | ||||||||||||||||||||
Special termination benefits | |||||||||||||||||||||||
Foreign exchange translation | ( | ||||||||||||||||||||||
Benefits paid and other | ( | ( | ( | ( | |||||||||||||||||||
Benefit obligation — ending | $ | $ | $ | $ | |||||||||||||||||||
Change in Plan Assets: | |||||||||||||||||||||||
Plan assets — beginning | $ | $ | $ | $ | |||||||||||||||||||
Actual return on plan assets | |||||||||||||||||||||||
Sponsor contributions | |||||||||||||||||||||||
Settlements | ( | ( | ( | ||||||||||||||||||||
Foreign exchange translation | ( | ||||||||||||||||||||||
Benefits paid and other | ( | ( | ( | ( | |||||||||||||||||||
Plan assets — ending | $ | $ | $ | $ | |||||||||||||||||||
Total funded status at end of period | $ | ( | $ | ( | $ | ( | $ | ( | |||||||||||||||
Balance Sheet Classification: | |||||||||||||||||||||||
Other non-current assets | $ | $ | $ | ||||||||||||||||||||
Accrued employee liabilities | ( | ( | |||||||||||||||||||||
Employee benefits | ( | ( | ( | ( | |||||||||||||||||||
Accumulated other comprehensive loss: | |||||||||||||||||||||||
Actuarial loss | |||||||||||||||||||||||
Tax effects/other | $ | ( | ( | ||||||||||||||||||||
| $ | $ | $ | $ | ||||||||||||||||||||
Components of the net change in AOCI related to all defined benefit pension plans, exclusive of amounts attributable to non-controlling interests on the Company’s Consolidated Statements of Changes in Equity for the years ended December 31, 2021 and 2020, are as follows:
| U.S. Plans | Non-U.S. Plans | ||||||||||||||||||||||
| Year Ended December 31, | Year Ended December 31, | ||||||||||||||||||||||
| (In millions) | 2021 | 2020 | 2021 | 2020 | |||||||||||||||||||
| Actuarial (gain) loss | $ | ( | $ | $ | ( | $ | |||||||||||||||||
| Deferred taxes | |||||||||||||||||||||||
| Currency/other | |||||||||||||||||||||||
| Reclassification to net income | ( | ( | ( | ( | |||||||||||||||||||
| Settlements | ( | ||||||||||||||||||||||
| $ | ( | $ | $ | ( | $ | ||||||||||||||||||
Actuarial loss for the year ended December 31, 2021 is primarily related to a decrease in discount rates partially offset by an increase in return on assets. Actuarial gains and losses are amortized using the 10% corridor approach representing 10% times the greater of plan assets and the projected benefit obligation. Generally, the expected return is determined using a market-related value of assets where gains (losses) are recognized in a systematic manner over five years. For less significant plans, fair value is used.
61
During 2020 the Company transferred a portion of the benefit obligation related to its defined benefit U.S. pension plan to a third-party issuer. The transaction met the criteria for settlement accounting, and accordingly, the Company recognized a $5 million pension settlement charge.
Benefit payments, which reflect expected future service, are expected to be paid by the Company plans as follows:
| (In millions) | U.S. Plans | Non-U.S. Plans | |||||||||
| 2022 | $ | $ | |||||||||
| 2023 | |||||||||||
| 2024 | |||||||||||
| 2025 | |||||||||||
| 2026 | |||||||||||
| Years 2027 - 2031 | |||||||||||
During the year ended December 31, 2021, the Company contributed $12 million to its U.S. employee retirement pension plans and $8 million to its non-U.S. employee retirement pension plans. Contributions related to certain non-U.S. plans of approximately $2 million have been deferred until 2024 due to COVID-19 relief measures. Additionally, the Company expects to make contributions to its non-US defined benefit pension plans of $4 million during 2022.
Substantially all of the Company’s defined benefit pension plan assets are managed by external investment managers and held in trust by third-party custodians. The selection and oversight of these external service providers is the responsibility of the investment committees of the Company and their advisers. The selection of specific securities is at the discretion of the investment manager and is subject to the provisions set forth by written investment management agreements and related policy guidelines regarding permissible investments, risk management practices, and the use of derivative securities. Derivative securities may be used by investment managers as efficient substitutes for traditional securities, to reduce portfolio risks, or to hedge identifiable economic exposures. The use of derivative securities to engage in unrelated speculation is expressly prohibited.
The primary objective of the pension funds is to pay the plans’ benefit and expense obligations when due. Given the long-term nature of these plan obligations and their sensitivity to interest rates, the investment strategy is intended to improve the funded status of its U.S. and non-U.S. plans over time while maintaining a prudent level of risk. Risk is managed primarily by diversifying each plan’s target asset allocation across equity, fixed income securities, and alternative investment strategies, and then maintaining the allocation within a specified range of its target. In addition, diversification across various investment subcategories within each plan is also maintained within specified ranges.
The Company’s retirement plan asset allocation as of December 31, 2021 and 2020 and target allocation for 2022 are as follows:
| Target Allocation | Percentage of Plan Assets | ||||||||||||||||||||||||||||||||||
| U.S. | Non-U.S. | U.S. | Non-U.S. | ||||||||||||||||||||||||||||||||
| 2022 | 2022 | 2021 | 2020 | 2021 | 2020 | ||||||||||||||||||||||||||||||
| Equity securities | % | % | % | % | % | % | |||||||||||||||||||||||||||||
| Fixed income | % | % | % | % | % | % | |||||||||||||||||||||||||||||
| Alternative strategies | % | % | % | % | % | % | |||||||||||||||||||||||||||||
| Cash | % | % | % | % | % | % | |||||||||||||||||||||||||||||
| Other | % | % | % | % | % | % | |||||||||||||||||||||||||||||
| % | % | % | % | % | % | ||||||||||||||||||||||||||||||
The expected long-term rate of return for defined benefit pension plan assets was selected based on various inputs, including returns projected by various external sources for the different asset classes held by and to be held by the Company’s trusts and its targeted asset allocation. These projections incorporate both historical returns and forward-looking views regarding capital market returns, inflation, and other variables. Pension plan assets are valued at fair value using various inputs and valuation techniques. A description of the inputs and valuation techniques used to measure the fair value for each class of plan assets is included in Note 17, "Fair Value Measurements."
62
Discount Rate for Estimated Service and Interest Cost
The Company uses the spot rate method to estimate the service and interest components of net periodic benefit cost for pension benefits for its U.S. and certain non-U.S. plans. The Company has elected to utilize an approach that discounts individual expected cash flows underlying interest and service costs using the applicable spot rates derived from the yield curve used to determine the benefit obligation to the relevant projected cash flows. The discount rate assumption is based on market rates for a hypothetical portfolio of high-quality corporate bonds rated Aa or better with maturities closely matched to the timing of projected benefit payments for each plan at its annual measurement date. The Company used discount rates ranging from 0.8 % to 8.75 % to determine its pension and other benefit obligations as of December 31, 2021.
Defined Contribution Plans
Most U.S. salaried employees and certain non-U.S. employees are eligible to participate in defined contribution plans by contributing a portion of their compensation which is partially matched by the Company. Matching contributions for the U.S. defined contribution plan are 100 % on the first 6 % of pay contributed. Matching contributions were suspended from May 1, 2020 to September 30, 2020 as a part of the cost saving actions in response to the COVID-19 pandemic. The expense related to all matching contributions was approximately $6 million in 2021, $5 million in 2020, and $8 million in 2019.
Other Postretirement Employee Benefit Plans
In Canada, the Company has a financial obligation for the cost of providing other postretirement health care and life insurance benefits to certain of its employees under Company-sponsored plans. These plans generally pay for the cost of health care and life insurance for retirees and dependents, less retiree contributions and co-pays. Other postretirement benefit obligations were $1 million and $1 million at December 31, 2021 and 2020, respectively.
NOTE 13. Stock-Based Compensation
The Visteon Corporation 2010 Incentive Plan (the “2010 Incentive Plan”) provided for the grant of up to 4.75 million shares of common stock for restricted stock awards (“RSAs”), restricted stock units (“RSUs”), non-qualified stock options ("Stock Options"), stock appreciation rights (“SARs”), performance based share units ("PSUs"), and other stock based awards. At the Company’s annual meeting of shareholders in June 2020, the shareholders approved the Visteon Corporation 2020 Incentive Plan (the “2020 Incentive Plan”), replacing the 2010 Incentive Plan. Pursuant to the 2020 Incentive Plan, the Company may grant up to 1.5 million shares of common stock for RSA, RSUs, Stock Options, SARs, PSUs, and other stock based awards. The Company's stock-based compensation instruments are accounted for as equity awards or liability awards based on settlement intention as follows:
•For equity settled stock-based compensation instruments, compensation cost is measured based on grant date fair value of the award and is recognized over the applicable service period. For equity settled stock-based compensation instruments, the delivery of Company shares may be on a gross settlement basis or a net settlement basis. The Company's policy is to deliver such shares using treasury shares or issuing new shares.
•Cash settled stock-based compensation instruments are subject to liability accounting. At the end of each reporting period, the vested portion of the obligation for cash settled stock-based compensation instruments is adjusted to fair value based on the period-ending market prices of the Company's common stock. Related compensation expense is recognized based on changes to the fair value over the applicable service period.
Generally, the Company's stock-based compensation instruments are subject to graded vesting and recognized on an accelerated basis. The settlement intention of the awards is at the discretion of the Organization and Compensation Committee of the Company's Board of Directors. These stock-based compensation awards generally provide for accelerated vesting upon a change-in-control, which is defined in the 2020 Incentive Plan, which requires a double-trigger. Accordingly, the Company may be required to accelerate recognition of related expenses in future periods in connection with the change-in-control events and subsequent changes in employee responsibilities, if any.
63
The total recognized and unrecognized stock-based compensation expense is as follows:
| Year Ended December 31, | Unrecognized Stock-Based Compensation Expense | ||||||||||||||||||||||
| (In millions) | 2021 | 2020 | 2019 | December 31, 2021 | |||||||||||||||||||
| Performance based share units | $ | $ | $ | $ | |||||||||||||||||||
| Restricted stock units | |||||||||||||||||||||||
| Stock options | |||||||||||||||||||||||
| Total stock-based compensation expense | $ | $ | $ | $ | |||||||||||||||||||
Performance Based Share Units
The number of PSUs that will vest is based on the Company's achievement of a pre-established relative total shareholder return goal compared to its peer group of companies over a period of three years which may range from 0% to 200% of the target award.
| A summary of PSU activity is provided below: | PSUs | Weighted Average Grant Date Fair Value | |||||||||
| (In thousands) | |||||||||||
Non-vested as of December 31, 2018 | $ | ||||||||||
| Granted | |||||||||||
| Vested | ( | ||||||||||
| Forfeited | ( | ||||||||||
Non-vested as of December 31, 2019 | |||||||||||
| Granted | |||||||||||
| Vested | ( | ||||||||||
| Forfeited | ( | ||||||||||
Non-vested as of December 31, 2020 | |||||||||||
| Granted | |||||||||||
| Vested | ( | ||||||||||
| Forfeited | ( | ||||||||||
Non-vested as of December 31, 2021 | $ | ||||||||||
The grant date fair value for PSUs was determined using the Monte Carlo valuation model. Unrecognized compensation expense as of December 31, 2021 for PSUs to be settled in shares of the Company's common stock was $8 million for the non-vested portion and will be recognized over the remaining vesting period of approximately 1.8 years. The Company made cash settlement payments of less than $1 1 million for the non-vested portion of these awards and will be recognized over the remaining vesting period of approximately 1.6 years.
The Monte Carlo valuation model requires management to make various assumptions including the expected volatility, risk-free interest rate and dividend yield. Volatility is based on the Company’s stock history using daily stock prices over a period commensurate with the expected life of the award. The risk-free rate was based on the U.S. Treasury yield curve in relation to the contractual life of the stock-based compensation instrument. The dividend yield was based on historical patterns and future expectations for Company dividends.
64
Weighted average assumptions used to estimate the fair value of PSUs granted during the years ended as of December 31, 2021 and 2020 are as follows:
| Year Ended December 31, | |||||||||||
| 2021 | 2020 | ||||||||||
| Expected volatility | % | % | |||||||||
| Risk-free rate | % | % | |||||||||
| Expected dividend yield | % | % | |||||||||
Restricted Stock Units
The grant date fair value of RSUs is measured as the market closing price of the Company's common stock on the date of grant. These awards generally vest in one-third increments on the grant date anniversary over a three year vesting period.
The Company granted 110,000 , 223,000 and 133,000 RSUs, expected to be settled in shares, during the years ended December 31, 2021, 2020 and 2019, respectively, at a weighted average grant date fair value of $116.71 , $75.52 and $79.88 per share, respectively. Unrecognized compensation expense as of December 31, 2021 was $11 million for non-vested RSUs and will be recognized over the remaining vesting period of approximately 1.5 years.
The Company granted 6,000 8,000 and 8,000 RSUs, expected to be settled in cash, during each of the years ended December 31, 2021, 2020 and 2019, respectively, at a weighted average grant date fair value of $112.52 , $76.27 and $75.02 per share, respectively. The Company made cash settlement payments of less than $1 1 million for non-vested RSUs and will be recognized on a weighted average basis over the remaining vesting period of approximately 1.6 years.
A summary of RSU activity is provided below:
| RSUs | Weighted Average Grant Date Fair Value | ||||||||||
| (In thousands) | |||||||||||
Non-vested as of December 31, 2018 | $ | ||||||||||
Granted | |||||||||||
Vested | ( | ||||||||||
Forfeited | ( | ||||||||||
Non-vested as of December 31, 2019 | |||||||||||
| Granted | |||||||||||
Vested | ( | ||||||||||
Forfeited | ( | ||||||||||
Non-vested as of December 31, 2020 | |||||||||||
| Granted | |||||||||||
| Vested | ( | ||||||||||
| Forfeited | ( | ||||||||||
Non-vested as of December 31, 2021 | $ | ||||||||||
Additionally, as of December 31, 2021, the Company has approximately 64,000 outstanding RSU's awarded at a weighted average grant date fair value of $103.02 under the Non-Employee Director Stock Unit Plan which vested immediately but are not settled until the participant terminates board service. Beginning in the third quarter 2020, non-employee director RSU awards were granted under the terms and conditions of the 2020 Incentive Plan, and these awards vest approximately one year from the date of grant. Activity related to non-employee director grants under the 2020 Incentive Plan is included in RSU table above.
65
Stock Options and Stock Appreciation Rights
Stock Options and SARs are recorded with an exercise price equal to the average of the high and low market price of the Company's common stock on the date of grant. The grant date fair value of these awards is measured using the Black-Scholes option pricing model. Stock Options and SARs generally vest in one-third increments on the grant date anniversary over a -year vesting period and have an expiration date 7 or 10 years from the date of grant.
The Company received payments of $2 million, $2 million and less than $1 million related to the exercise of Stock Options with total intrinsic value of options exercised of $1 million, less than $1 million, and less than $1 million during the years ended December 31, 2021, 2020, and 2019, respectively. Unrecognized compensation expense for non-vested Stock Options as of December 31, 2021 was less than $1 million and is expected to be recognized over a weighted average period of 0.9 years.
The Black-Scholes option pricing model requires management to make various assumptions including the expected term, risk-free interest rate, dividend yield, and expected volatility. The expected term represents the period of time that granted awards are expected to be outstanding and is estimated based on considerations including the vesting period, contractual term, and anticipated employee exercise patterns. The risk-free rate is based on the U.S. Treasury yield curve in relation to the contractual life of the stock-based compensation instrument. The dividend yield is based on historical patterns and future expectations for Company dividends. Volatility is based on the Company’s stock history using daily stock prices over a period commensurate with the expected life of the award.
Weighted average assumptions used to estimate the fair value of awards granted during the years ended December 31, 2020 and 2019 are as follows:
| 2020 | 2019 | ||||||||||
| Expected term (in years) | |||||||||||
| Expected volatility | % | % | |||||||||
| Risk-free interest rate | % | % | |||||||||
| Expected dividend yield | % | % | |||||||||
No stock options were granted in 2021.
A summary of Stock Options and SAR activity is provided below:
| Stock Options | Weighted Average Exercise Price | SARs | Weighted Average Exercise Price | ||||||||||||||||||||
| (In thousands) | (In thousands) | ||||||||||||||||||||||
| December 31, 2018 | $ | $ | |||||||||||||||||||||
Granted | |||||||||||||||||||||||
Exercised | ( | — | |||||||||||||||||||||
Forfeited or expired | ( | ||||||||||||||||||||||
| December 31, 2019 | |||||||||||||||||||||||
Granted | |||||||||||||||||||||||
Exercised | ( | ( | |||||||||||||||||||||
Forfeited or expired | ( | ||||||||||||||||||||||
| December 31, 2020 | |||||||||||||||||||||||
| Exercised | ( | ( | |||||||||||||||||||||
| Forfeited or expired | ( | ||||||||||||||||||||||
| December 31, 2021 | $ | — | $ | — | |||||||||||||||||||
Exercisable at December 31, 2021 | $ | $ | |||||||||||||||||||||
66
| Stock Options and SARs Outstanding | ||||||||||||||||||||
| Exercise Price | Number Outstanding | Weighted Average Remaining Life | Weighted Average Exercise Price | |||||||||||||||||
| (In thousands) | (In years) | |||||||||||||||||||
$ | $ | |||||||||||||||||||
$ | $ | |||||||||||||||||||
$ | $ | |||||||||||||||||||
NOTE 14. Income Taxes
Income Tax Provision
Details of the Company's income tax provision from continuing operations are provided in the table below:
| Year Ended December 31, | |||||||||||||||||
| (In millions) | 2021 | 2020 | 2019 | ||||||||||||||
Income (Loss) Before Income Taxes: (a) | |||||||||||||||||
U.S | $ | ( | $ | ( | $ | ||||||||||||
Non-U.S | |||||||||||||||||
| Total income (loss) before income taxes | $ | $ | ( | $ | |||||||||||||
Current Tax Provision: | |||||||||||||||||
Non-U.S | $ | $ | |||||||||||||||
Deferred Tax Provision (Benefit): | |||||||||||||||||
Non-U.S | ( | ||||||||||||||||
Total deferred tax provision (benefit) | ( | ||||||||||||||||
Provision for income taxes | $ | $ | $ | ||||||||||||||
(a) Income (loss) before income taxes excludes equity in net income from non-consolidated affiliates. | |||||||||||||||||
A summary of the differences between the provision for income taxes calculated at the U.S. statutory tax rate of 21 % and the consolidated income tax provision from continuing operations is shown below:
| Year Ended December 31, | |||||||||||||||||
| (In millions) | 2021 | 2020 | 2019 | ||||||||||||||
Tax provision (benefit) at U.S. statutory rate of | $ | $ | ( | $ | |||||||||||||
Impact of foreign operations | ( | ||||||||||||||||
Non-U.S withholding taxes | |||||||||||||||||
Tax holidays in foreign operations | ( | ( | ( | ||||||||||||||
Tax reserve adjustments | |||||||||||||||||
Change in valuation allowance | ( | ( | |||||||||||||||
Impact of U.S. tax reform | ( | ||||||||||||||||
Impact of tax law change | — | ||||||||||||||||
Research credits | ( | ( | ( | ||||||||||||||
Other | |||||||||||||||||
Provision for income taxes | $ | $ | $ | ||||||||||||||
The Company’s provision for income taxes for continuing operations was $31 million for the year ended December 31, 2021. The tax expense related to foreign operations of $18 million reflects $9 million related to U.S. income taxes in connection with global intangible low-tax income ("GILTI") and Subpart F inclusions; $6 million related to income tax expense, net of foreign tax credits, associated with income from foreign subsidiaries treated as branches for U.S. income tax purposes; net $2 million
67
income tax expense related primarily to adjusting prior year tax returns to deduct foreign taxes prior to expiration; and $1 million tax expense on foreign earnings taxed at rates higher than the U.S. statutory rate. Of the $18 million income tax expense items above, $17 million were offset by a corresponding income tax benefit associated with a reduction in the U.S. valuation allowance.
On December 22, 2017, the Tax Cuts and Jobs Act of 2017 (the “Act”) was signed into law making significant changes to the U.S. Internal Revenue Code. Changes included, but were not limited to, a corporate tax rate decrease from 35% to 21% effective January 1, 2018, and require a one-time transition tax on accumulated, unremitted non-U.S. earnings. During 2019, the Company further adjusted its estimate of the impact of U.S. tax reform primarily related to assumptions made in calculating its 2018 GILTI inclusion resulting in an $18 million income tax benefit, the impact of which was entirely offset by a corresponding income tax charge associated with an increase in the U.S. valuation allowance. The Company has made policy elections to account for the GILTI as a period cost when incurred and apply the incremental cash tax savings approach when analyzing the impact GILTI could have on its U.S. valuation allowance assessment.
Items impacting the Company’s 2020 effective tax rate include tax benefits related to foreign operations of $15 million which reflects $10 million income tax benefit related to electing to deduct expiring foreign tax credits previously derecognized; and $5 million income tax benefit to reflect reduction in outside basis deferred tax liabilities and foreign tax credits associated with income from foreign subsidiaries treated as branches for U.S. income tax purposes. These amounts were entirely offset by a corresponding $15 million income tax expense associated with an increase in the U.S. valuation allowance.
Items impacting the Company’s 2019 effective tax rate include tax expense related to foreign operations of $23 million which reflects $6 million tax expense on foreign earnings taxed at rates higher than the U.S. statutory rate; $8 million related to income tax expense, net of foreign tax credits, associated with income from foreign subsidiaries treated as branches for U.S. income tax purposes; and $9 million related to U.S. income taxes in connection with GILTI and Subpart F inclusions, net of foreign tax credits, excluding the transition tax on the deemed repatriation of foreign earnings described above. These amounts were offset by a corresponding $17 million income tax benefit associated with a reduction in the U.S. valuation allowance. Tax reserve adjustments of $2 million primarily relates to certain transfer pricing positions taken between affiliates in Europe and the U.S.
Deferred Income Taxes and Valuation Allowances
The Company recorded deferred tax liabilities, net of valuation allowances, for U.S. and non-U.S. income taxes and non-U.S. withholding taxes of approximately $24 million and $27 million as of December 31, 2021 and 2020, respectively, on the undistributed earnings of certain consolidated and unconsolidated foreign affiliates as such earnings are intended to be repatriated in the foreseeable future. The amount the Company expects to repatriate is based upon a variety of factors including current year earnings of the foreign affiliates, foreign investment needs, and the cash flow needs the Company has in the U.S. and this practice has not changed following incurring the transition tax under the Act. The Company has not provided for deferred income taxes or foreign withholding taxes on the remainder of undistributed earnings from consolidated foreign affiliates because such earnings are considered to be permanently reinvested. It is not practicable to determine the amount of deferred tax liability on such earnings as the actual tax liability, if any, is dependent on circumstances existing when remittance occurs.
The Company evaluates its deferred income taxes quarterly to determine if valuation allowances are required or should be adjusted. This assessment considers, among other matters, the nature, frequency, and amount of recent losses, the duration of statutory carryforward periods, and tax planning strategies. In making such judgments, significant weight is given to evidence that can be objectively verified. If (i) recent improvements to financial results continue in the U.S., or (ii) recovery of the global economy after the COVID-19 pandemic including the semiconductor shortages occurs faster than expected, the Company believes it is possible that sufficient positive evidence may be available to release all, or a portion, of its U.S. valuation allowance in the next twelve to 24 months.
In March 2019, the closure of tax audits in Germany allowed the Company to initiate a tax planning strategy previously determined not to be prudent. This strategy provided the necessary positive evidence to support the future utilization of a portion of the Company's deferred tax assets in Germany resulting in a $12 million valuation allowance release during the first quarter of 2019. In September 2020, the Company approved a restructuring program impacting engineering and administrative functions globally, including German operations. The September action, combined with earlier 2020 actions, necessitated a reassessment of the future utilization of deferred tax assets in Germany resulting in recording a $4 million discrete income tax expense adjustment during the third quarter of 2020 to increase the valuation allowance. During the fourth quarter of 2020, the Company completed an analysis related to its Brazil affiliate, Visteon Amazonas (“Amazonas”), resulting in the permanent
68
exclusion of certain incentive income from taxable profits. Consequently, the Company concluded the generation of future taxable income is no longer sufficient to realize the Company’s net deferred tax assets at Amazonas resulting in recording a $3 million valuation allowance during the fourth quarter of 2020.
The components of deferred income tax assets and liabilities are as follows:
| December 31, | |||||||||||
| (In millions) | 2021 | 2020 | |||||||||
Deferred Tax Assets: | |||||||||||
Net operating losses and credit carryforwards | $ | $ | |||||||||
Employee benefit plans | |||||||||||
| Lease liability | |||||||||||
Fixed assets and intangibles | |||||||||||
Warranty | |||||||||||
Inventory | |||||||||||
Restructuring | |||||||||||
Capitalized expenditures for tax reporting | |||||||||||
Deferred income | |||||||||||
Other | |||||||||||
Valuation allowance | ( | ( | |||||||||
Total deferred tax assets | $ | $ | |||||||||
Deferred Tax Liabilities: | |||||||||||
Outside basis investment differences, including withholding tax | $ | $ | |||||||||
Right-of-use assets | |||||||||||
Fixed assets and intangibles | |||||||||||
All other | |||||||||||
Total deferred tax liabilities | |||||||||||
Net deferred tax assets | $ | $ | |||||||||
Consolidated Balance Sheet Classification: | |||||||||||
Other non-current assets | $ | $ | |||||||||
Deferred tax liabilities non-current | |||||||||||
Net deferred tax assets | $ | $ | |||||||||
At December 31, 2021, the Company had available non-U.S. net operating loss carryforwards and capital loss carryforwards of $1.4 billion and $17 million, respectively, which have remaining carryforward periods ranging from 1 year to indefinite. The Company had available U.S. federal net operating loss carryforwards of $1.8 billion at December 31, 2021, which have remaining carryforward periods ranging from 6 years to indefinite. U.S. foreign tax credit carryforwards are $375 million at December 31, 2021, which have remaining carryforward periods ranging from 1 to 8 years. U.S. research tax credit carryforwards are $22 million at December 31, 2021. These credits will begin to expire in 2030. The Company had available tax-effected U.S. state operating loss carryforwards of $32 million at December 31, 2021, which will expire at various dates between 2022 and 2041.
In connection with the Company's emergence from bankruptcy and resulting change in ownership on the Effective Date, an annual limitation was imposed on the utilization of U.S. net operating losses, U.S. credit carryforwards and certain U.S. built-in losses (collectively referred to as “tax attributes”) under Internal Revenue Code (“IRC”) Sections 382 and 383. The collective limitation is approximately $120 million per year on tax attributes in existence at the date of change in ownership. Additionally, the Company has approximately $375 million of U.S. foreign tax credits and approximately $26 million of U.S. federal net operating loss carryforwards that are not subject to any current limitation since they were realized after the Effective Date.
Unrecognized Tax Benefits, Inclusive of Discontinued Operations
The Company operates in multiple jurisdictions throughout the world and the income tax returns of its subsidiaries in various tax jurisdictions are subject to periodic examination by respective tax authorities. The Company regularly assesses the status of
69
these examinations and the potential for adverse and/or favorable outcomes to determine the adequacy of its provision for income taxes. The Company believes that it has adequately provided for tax adjustments that it believes are more likely than not to be realized as a result of any ongoing or future examination. Accounting estimates associated with uncertain tax positions require the Company to make judgments regarding the sustainability of each uncertain tax position based on its technical merits. If the Company determines it is more likely than not a tax position will be sustained based on its technical merits, the Company records the largest amount that is greater than 50% likely of being realized upon ultimate settlement. These estimates are updated at each reporting date based on the facts, circumstances and information available. Due to the complexity of these uncertainties, the ultimate resolution may result in a payment that is materially different from the Company's current estimate of the liabilities recorded.
Gross unrecognized tax benefits at December 31, 2021 and 2020 were $16 million and $14 million, respectively. Of these amounts, approximately $9 million and $7 million, respectively, represent the amount of unrecognized benefits that, if recognized, would impact the effective tax rate. The gross unrecognized tax benefit differs from that which would impact the effective tax rate due to uncertain tax positions embedded in other deferred tax attributes carrying a full valuation allowance. During 2021 and 2020, the Company recorded a $2 million and $1 million, respectively, net increase in tax expense related to uncertain tax positions attributable to certain related party transactions. The Company records interest and penalties related to uncertain tax positions as a component of income tax expense and related amounts accrued at December 31, 2021 and 2020 was $2
With few exceptions, the Company is no longer subject to U.S. federal tax examinations for years before 2014, or state, local or non-U.S. income tax examinations for years before 2003, although U.S. net operating losses carried forward into open tax years technically remain open to adjustment. Although it is not possible to predict the timing of the resolution of all ongoing tax audits with accuracy, it is reasonably possible that certain tax proceedings in the U.S., Europe, Asia and Mexico could conclude within the next twelve months and result in a significant increase or decrease in the balance of gross unrecognized tax benefits. Given the number of years, jurisdictions and positions subject to examination, the Company is unable to estimate the full range of possible adjustments to the balance of unrecognized tax benefits. The long-term portion of uncertain income tax positions (including interest) in the amount of $8 million is included in Other non-current liabilities on the Consolidated Balance Sheet, while $3 million is reflected as a reduction of a deferred tax asset related to a net operating loss included in Other non-current assets on the Consolidated Balance Sheets.
A reconciliation of the beginning and ending amount of unrecognized tax benefits including amounts attributable to discontinued operations is as follows:
| Year Ended December 31, | |||||||||||
| (In millions) | 2021 | 2020 | |||||||||
| Beginning balance | $ | $ | |||||||||
| Tax positions related to current period | |||||||||||
Additions | — | ||||||||||
| Tax positions related to prior periods | |||||||||||
Additions | |||||||||||
Reductions | ( | — | |||||||||
| Ending balance | $ | $ | |||||||||
During 2012, Brazil tax authorities issued tax assessment notices to Visteon Sistemas Automotivos (“Sistemas”) related to the sale of its chassis business, and in connection with this assessment the Company recorded a long-term tax income tax deposit during 2013. During 2021, the Company received a favorable judgement related to this deposit. Adjusted for currency impacts and interest, the Company received net $9 million cash settlement from the Brazilian government during the fourth quarter of 2021, while $2 million was applied against other long-term labor-related tax debts pursuant to the judgement. Income tax refund claims associated with other jurisdictions, total $7 million as of December 31, 2021, and are included in Other non-current assets on the condensed consolidated balance sheets.
70
NOTE 15. Stockholders’ Equity and Non-controlling Interests
Share Repurchase Program
In January 2018, the Company's Board of Directors authorized a total of $700 million of share repurchases which expired on December 31, 2020. A total of 3,361,420 shares at an average price of $99.91 for an aggregate purchase amount of $336 million was purchased from third-party financial institutions under this authorization.
Treasury Stock
As of December 31, 2021 and 2020, respectively, the Company held 27,014,711 and 27,156,537 shares of common stock in treasury which may be used for satisfying obligations under employee incentive compensation arrangements. The Company values shares of common stock held in treasury at cost.
Non-Controlling Interests
Non-controlling interests in Visteon Corporation are as follows:
| December 31, | |||||||||||
| (In millions) | 2021 | 2020 | |||||||||
| Yanfeng Visteon Automotive Electronics Co., Ltd. | $ | $ | |||||||||
Shanghai Visteon Automotive Electronics Co., Ltd. | |||||||||||
| Changchun Visteon FAWAY Automotive Electronics Co., Ltd. | |||||||||||
Other | |||||||||||
| $ | $ | ||||||||||
Stock Warrants
In October 2010, the Company issued ten-year warrants at an exercise price of $9.66 per share. Pursuant to the Ten-Year Warrant Agreement, the original exercise price of $9.66 for the ten-year warrants was subject to adjustment as a result of the special distribution of $43.40 per share to shareholders at the beginning of 2016. Remaining warrants of 909 expired unexercised as of December 31, 2020.
71
Accumulated Other Comprehensive Income (Loss)
Changes in AOCI and reclassifications out of AOCI by component includes:
| Year Ended December 31, | |||||||||||
| (In millions) | 2021 | 2020 | |||||||||
Changes in AOCI: | |||||||||||
Beginning balance | $ | ( | $ | ( | |||||||
Other comprehensive income (loss) before reclassification, net of tax | ( | ||||||||||
Amounts reclassified from AOCI | |||||||||||
Ending balance | $ | ( | $ | ( | |||||||
Changes in AOCI by component: | |||||||||||
Foreign currency translation adjustments | |||||||||||
Beginning balance | $ | ( | $ | ( | |||||||
Other comprehensive income (loss) before reclassification (a) | ( | ||||||||||
Ending balance | ( | ( | |||||||||
Net investment hedge | |||||||||||
Beginning balance | ( | ||||||||||
Other comprehensive income (loss) before reclassification (a) | ( | ||||||||||
Amounts reclassified from AOCI (b) | ( | ( | |||||||||
Ending balance | ( | ||||||||||
Benefit plans | |||||||||||
Beginning balance | ( | ( | |||||||||
Other comprehensive income (loss) before reclassification, net of tax (c) | ( | ||||||||||
Amounts reclassified from AOCI | |||||||||||
Ending balance | ( | ( | |||||||||
Unrealized hedging gain (loss) | |||||||||||
Beginning balance | ( | ( | |||||||||
Other comprehensive income (loss) before reclassification, net of tax (d) | ( | ||||||||||
Amounts reclassified from AOCI | |||||||||||
Ending balance | ( | ( | |||||||||
AOCI ending balance | $ | ( | $ | ( | |||||||
(a) There were no income tax effects for either period due to the valuation allowance.
(b) Amounts are included in "Interest expense" within the Consolidated Statements of Operations.
(c) Amount included in the computation of net periodic pension cost. (See Note 12, "Employee Benefit Plans" for additional details.) Net of tax expense of $4 million, and tax benefit of less than $1 million related to benefit plans for the years ended December 31, 2021 and 2020, respectively.
(d) There were no
72
NOTE 16. Earnings Per Share
A summary of information used to compute basic and diluted earnings per share attributable to Visteon is as follows:
| Year Ended December 31, | |||||||||||||||||
| (In millions, except per share amounts) | 2021 | 2020 | 2019 | ||||||||||||||
Numerator: | |||||||||||||||||
Net income (loss) from continuing operations attributable to Visteon | $ | $ | ( | $ | |||||||||||||
Net income (loss) from discontinued operations attributable to Visteon | ( | ||||||||||||||||
Net income (loss) attributable to Visteon | $ | $ | ( | $ | |||||||||||||
Denominator: | |||||||||||||||||
Average common stock outstanding - basic | |||||||||||||||||
Dilutive effect of performance based share units and other | — | ||||||||||||||||
Diluted shares | |||||||||||||||||
Basic and Diluted Per Share Data: | |||||||||||||||||
Basic earnings (loss) per share attributable to Visteon: | |||||||||||||||||
Continuing operations | $ | $ | ( | $ | |||||||||||||
Discontinued operations | ( | ||||||||||||||||
| $ | $ | ( | $ | ||||||||||||||
Diluted earnings (loss) per share attributable to Visteon: | |||||||||||||||||
Continuing operations | $ | $ | ( | $ | |||||||||||||
Discontinued operations | ( | ||||||||||||||||
| $ | $ | ( | $ | ||||||||||||||
For the year ended December 31, 2020, performance based share units of approximately 276,000 were excluded from the calculation of diluted loss per share because the effect of including them would have been anti-dilutive.
NOTE 17. Fair Value Measurements
Fair Value Hierarchy
The Company uses a three-level fair value hierarchy that categorizes assets and liabilities measured at fair value based on the observability of the inputs utilized in the valuation. The fair value hierarchy gives the highest priority to the quoted prices in active markets for identical assets and liabilities and lowest priority to unobservable inputs.
•Level 1 – Financial assets and liabilities whose values are based on unadjusted quoted market prices for identical assets and liabilities in an active market that the Company has the ability to access.
•Level 2 – Financial assets and liabilities whose values are based on quoted prices in markets that are not active or model inputs that are observable for substantially the full term of the asset or liability.
•Level 3 – Financial assets and liabilities whose values are based on prices or valuation techniques that require inputs that are both unobservable and significant to the overall fair value measurement.
Assets which are valued at net asset value per share ("NAV"), or its equivalent, as a practical expedient are reported outside the fair value hierarchy, but are included in the total assets for reporting and reconciliation purposes.
73
The fair value hierarchy for assets and liabilities measured at fair value on a recurring basis are as follows:
| December 31, 2021 | ||||||||||||||||||||||||||||||||
| (In millions) | Level 1 | Level 2 | Level 3 | NAV | Total | |||||||||||||||||||||||||||
| Asset Category: | ||||||||||||||||||||||||||||||||
| Retirement plan assets | $ | $ | $ | $ | $ | |||||||||||||||||||||||||||
| Foreign currency instruments | ||||||||||||||||||||||||||||||||
| Liability Category: | ||||||||||||||||||||||||||||||||
| Foreign currency instruments | $ | $ | $ | $ | $ | |||||||||||||||||||||||||||
| Interest rate swaps | $ | $ | $ | $ | $ | |||||||||||||||||||||||||||
| December 31, 2020 | ||||||||||||||||||||||||||||||||
| (In millions) | Level 1 | Level 2 | Level 3 | NAV | Total | |||||||||||||||||||||||||||
| Asset Category: | ||||||||||||||||||||||||||||||||
| Retirement plan assets | $ | $ | $ | $ | $ | |||||||||||||||||||||||||||
| Foreign currency instruments | $ | $ | $ | $ | $ | |||||||||||||||||||||||||||
| Liability Category: | ||||||||||||||||||||||||||||||||
| Foreign currency instruments | $ | $ | $ | $ | $ | |||||||||||||||||||||||||||
| Interest rate swaps | $ | $ | $ | $ | $ | |||||||||||||||||||||||||||
Foreign currency instruments and interest rate swaps are valued using industry-standard models that consider various assumptions, including time value, volatility factors, current market, and contractual prices for the underlying and non-performance risk. Substantially all of these assumptions are observable in the marketplace throughout the full term of the instrument, can be derived from observable data, or are supported by observable levels at which transactions are executed in the marketplace. The carrying amounts of all other non-retirement plan financial instruments approximate their fair values due to their relatively short-term maturities.
Retirement plan assets pertain to a diverse set of securities and investment vehicles held by the Company’s defined benefit pension plans. These assets possess varying fair value measurement attributes such that certain portions are categorized within each level of the fair value hierarchy as based upon the level of observability of the inputs utilized in the valuation of the particular asset. The Company may, as a practical expedient, estimate the fair value of certain investments using NAV of the investment as of the reporting date. This practical expedient generally deals with investments that permit an investor to redeem its investment directly with, or receive distributions from, the investee at times specified in the investee’s governing documents. Examples of these investments (often referred to as alternative investments) may include ownership interests in real assets, certain credit strategies, and hedging and diversifying strategies. They are commonly in the form of limited partnership interests. The Company uses NAV as a practical expedient when valuing investments in alternative asset classes and funds which are a limited partnership or similar investment vehicle.
Retirement Plan Assets
Retirement plan assets consist of the following:
•Short-term investments, such as cash and cash equivalents, are immediately available or are highly liquid and not subject to significant market risk. Assets comprised of cash, short-term sovereign debt, or high credit-quality money market securities and instruments held directly by the plan are categorized as Level 1. Assets in a registered money market fund are reported as registered investment companies. Assets in a short-term investment fund ("STIF") are categorized as Level 2. Cash and cash equivalent assets denominated in currencies other than the U.S. dollar are reflected in U.S. dollar terms at the exchange rate prevailing at the balance sheet dates.
•Registered investment companies are mutual funds that are registered with the Securities and Exchange Commission. Mutual funds may invest in various types of securities or combinations thereof including equities, fixed income securities, and other assets that are subject to varying levels of market risk and are categorized as Level 1. The share prices for mutual funds are published at the close of each business day.
74
•Treasury and government securities consist of debt securities issued by the U.S. and non-U.S. sovereign governments and agencies, thereof. Assets with a high degree of liquidity and frequent trading activity are categorized as Level 1 while others are valued by independent valuation firms that employ standard methodologies associated with valuing fixed-income securities and are categorized as Level 2.
•Corporate debt securities consist of fixed income securities issued by corporations. Assets with a high degree of liquidity and frequent trading activity are categorized as Level 1 while others are valued by independent valuation firms that employ standard methodologies associated with valuing fixed-income securities and are categorized as Level 2.
•Common and preferred stocks consist of shares of equity securities. These are directly-held assets that are generally publicly traded in regulated markets that provide readily available market prices and are categorized as Level 1.
•Common trust funds are comprised of shares or units in commingled funds that are not publicly traded. The underlying assets in these funds, including equities and fixed income securities, are generally publicly traded in regulated markets that provide readily available market prices. The entire balance of an investment in a common trust fund that does not have a readily observable market prices as available on a third-party information source, notwithstanding whether the investment has daily liquidity, is categorized as Level 2; unless the investment fund has investment holdings significant to its valuation that are considered as Level 3; or the fund is considered as an alternative strategy (including hedge and diversifying strategies) for which valuation is established by NAV as a practical expedient.
•Liability Driven Investing (“LDI”) is an investment strategy that utilizes certain instruments and securities, interest-rate swaps and other financial derivative instruments intended to hedge a portion of the changes in pension liabilities associated with changes in the actuarial discount rate as applied to the plan’s liabilities. The instruments and securities used typically include total return swaps and other financial derivative instruments. The valuation methodology of the financial derivative instruments contained in this category of assets utilizes standard pricing models associated with fixed income derivative instruments and are categorized as Level 2.
•Other investments include miscellaneous assets and liabilities and are primarily comprised of pending transactions and collateral settlements and are categorized as Level 2.
•Limited partnerships and hedge funds represent investment vehicles with underlying exposures in alternative credit, hedge and diversifying strategies (including hedge fund of funds), real assets, and certain equity exposures. The underlying assets in these funds may include securities transacted in active markets as well as other assets that have values less readily observable and may require valuation techniques that require inputs that are not readily observable. Investment in these funds may be subject to a specific notice period prior to the intended transaction date. In addition, transactions in these funds may require longer settlement terms than traditional mutual funds. These assets are valued based on their respective NAV as a practical expedient to estimate fair value due to the absence of readily available market prices.
•Insurance contracts are reported at cash surrender value and have significant unobservable inputs and are categorized as Level 3.
75
The fair values of the Company’s U.S. retirement plan assets are as follows:
| (In millions) | December 31, 2021 | |||||||||||||||||||||||||
| Asset Category | Level 1 | Level 2 | NAV | Total | ||||||||||||||||||||||
| Common trust funds | ||||||||||||||||||||||||||
| LDI | ||||||||||||||||||||||||||
| Limited partnerships and hedge funds | ||||||||||||||||||||||||||
| Cash and cash equivalents | ||||||||||||||||||||||||||
Total | $ | $ | $ | $ | ||||||||||||||||||||||
| (In millions) | December 31, 2020 | |||||||||||||||||||||||||
| Asset Category | Level 1 | Level 2 | NAV | Total | ||||||||||||||||||||||
| Registered investment companies | $ | $ | $ | $ | ||||||||||||||||||||||
| Common trust funds | — | |||||||||||||||||||||||||
| LDI | ||||||||||||||||||||||||||
| Limited partnerships and hedge funds | ||||||||||||||||||||||||||
| Cash and cash equivalents | ||||||||||||||||||||||||||
Total | $ | $ | $ | $ | ||||||||||||||||||||||
The fair values of the Company’s Non-U.S. retirement plan assets are as follows:
| (In millions) | December 31, 2021 | |||||||||||||||||||||||||||||||
| Asset Category | Level 1 | Level 2 | Level 3 | NAV | Total | |||||||||||||||||||||||||||
| Registered investment companies | $ | — | $ | $ | $ | $ | ||||||||||||||||||||||||||
| Treasury and government securities | — | |||||||||||||||||||||||||||||||
| Cash and cash equivalents | ||||||||||||||||||||||||||||||||
| Corporate debt securities | ||||||||||||||||||||||||||||||||
| Common and preferred stock | ||||||||||||||||||||||||||||||||
| Common trust funds | ||||||||||||||||||||||||||||||||
| Limited partnerships | ||||||||||||||||||||||||||||||||
| Insurance contracts | ||||||||||||||||||||||||||||||||
| Derivative instruments | ||||||||||||||||||||||||||||||||
Total | $ | $ | $ | $ | $ | |||||||||||||||||||||||||||
| (In millions) | December 31, 2020 | |||||||||||||||||||||||||||||||
| Asset Category | Level 1 | Level 2 | Level 3 | NAV | Total | |||||||||||||||||||||||||||
| Registered investment companies | $ | $ | $ | $ | $ | |||||||||||||||||||||||||||
| Treasury and government securities | ||||||||||||||||||||||||||||||||
| Cash and cash equivalents | — | |||||||||||||||||||||||||||||||
| Corporate debt securities | ||||||||||||||||||||||||||||||||
| Common and preferred stock | ||||||||||||||||||||||||||||||||
| Common trust funds | ||||||||||||||||||||||||||||||||
| Limited partnerships | ||||||||||||||||||||||||||||||||
| Insurance contracts | ||||||||||||||||||||||||||||||||
| Derivative instruments | ( | ( | ||||||||||||||||||||||||||||||
Total | $ | $ | $ | $ | $ | |||||||||||||||||||||||||||
76
The change in fair value of insurance contracts which used significant unobservable inputs was primarily due to purchases during the years ended December 31, 2021.
Items Measured at Fair Value on a Non-recurring Basis
The Company measures certain assets and liabilities at fair value on a non-recurring basis, which are not included in the table above. As these non-recurring fair value measurements are generally determined using unobservable inputs, these fair value measurements are classified within Level 3 of the fair value hierarchy.
The Company evaluates its long-lived assets for impairment whenever events or circumstances indicate the value of these long-lived asset groups are not recoverable. During the fourth quarter of 2021, the Company recognized an impairment charge of $9 million . The fair value measurements related to the long-lived asset group rely primarily on Company-specific inputs and the Company’s assumptions about the use of the assets, as observable inputs are not available (Level 3). To determine the fair value of the long-lived asset group, the Company utilized a cost and market approach, measuring fair value on the standalone basis value premise. The Company believes the assumptions and estimates used to determine the estimated fair value of the long-lived asset group is reasonable; however, these estimates and assumptions are subject to a high degree of uncertainty. Due to many variables inherent in estimating fair value, differences in assumptions could have a material effect on the analysis.
As the net carrying value of the long-lived asset group in Brazil exceeded its fair values, the Company recorded a long-lived asset impairment charge of $9 million related to property and equipment during the year ended December 31, 2021. Refer to Note 4, “Restructuring and Impairment” for additional information on asset impairments. No impairment charges were recorded for the year ended December 31, 2020.
Fair Value of Debt
NOTE 18. Financial Instruments
The Company is exposed to various market risks including, but not limited to, changes in foreign currency exchange rates and market interest rates. The Company manages these risks, in part, through the use of derivative financial instruments. The maximum length of time over which the Company hedges the variability in the future cash flows for forecast transactions, excluding those forecast transactions related to the payment of variable interest on existing debt, is eighteen months from the date of the forecast transaction. The maximum length of time over which the Company hedges forecast transactions related to the payment of variable interest on existing debt is the term of the underlying debt. The use of derivative financial instruments creates exposure to credit loss in the event of nonperformance by the counter-party to the derivative financial instruments. The Company limits this exposure by entering into agreements including master netting arrangements directly with a variety of major financial institutions with high credit standards that are expected to fully satisfy their obligations under the contracts. Additionally, the Company’s ability to utilize derivatives to manage risks is dependent on credit and market conditions. The Company presents its derivative positions and any related material collateral under master netting arrangements that provide for the net settlement of contracts, by counterparty, in the event of default or termination. Derivative financial instruments designated and non-designated as hedging instruments are included in the Company’s Consolidated Balance Sheets at fair value. The Company is not required to maintain cash collateral with its counterparties in relation to derivative transactions.
Accounting for Derivative Financial Instruments
Derivative financial instruments are measured at fair value on a recurring basis under an income approach using industry-standard models that consider various assumptions, including time value, volatility factors, current market and contractual prices for the underlying and non-performance risk. Substantially all of these assumptions are observable in the marketplace throughout the full term of the instrument or may derived from observable data. Accordingly, the Company's currency instruments are classified as Level 2, "Other Observable Inputs" in the fair value hierarchy.
For a designated cash flow hedge, the effective portion of the change in the fair value of the derivative instrument is recorded in AOCI in the Consolidated Balance Sheets. When the underlying hedged transaction is realized, the gain or loss previously included in AOCI is recorded in earnings and reflected in the Consolidated Statements of Operations on the same line as the gain or loss on the hedged item attributable to the hedged risk. The gain or loss associated with changes in the fair value of
77
undesignated cash flow hedges are recorded immediately in the Consolidated Statements of Operations, on the same line as the associated risk. For a designated net investment hedge, the effective portion of the change in the fair value of the derivative instrument is recorded as a cumulative translation adjustment in AOCI in the Consolidated Balance Sheets. Derivatives not designated as a hedge are adjusted to fair value through operating results. Cash flows associated with designated hedges are reported in the same category as the underlying hedged item. Cash flows associated with derivatives are reported in net cash provided from operating activities in the Company’s Consolidated Statements of Cash Flows except for cash flows associated with net investment hedges, which are reported in net cash used by investing activities.
The Company presents its derivative positions and any related material collateral under master netting arrangements that provide for the net settlement of contracts, by counterparty, in the event of default or termination. Derivative financial instruments are included in the Company’s Consolidated Balance Sheets. There is no cash collateral on any of these derivatives.
Foreign Currency Exchange Rate Risk
The Company is exposed to various market risks including, but not limited to, changes in currency exchange rates arising from the sale of products in countries other than the manufacturing source, foreign currency denominated supplier payments, debt, dividends and investments in subsidiaries. The Company manages these risks, in part, through the use of derivative financial instruments. The maximum length of time over which the Company hedges the variability in the future cash flows related to transactions, excluding those transactions as related to the payment of variable interest on existing debt, is eighteen months . The maximum length of time over which the Company hedges forecasted transactions related to variable interest payments is the term of the underlying debt.
Currency Exchange Rate Instruments: The Company primarily uses forward contracts denominated in euro, Japanese yen, Thai baht and Mexican peso intended to mitigate the variability of cash flows denominated in currency other than the hedging entity's functional currency.
As of December 31, 2021 and 2020, the Company had foreign currency hedge economic derivative instruments, with notional amounts of approximately $32 million and $18 million, respectively. The aggregate fair value of these derivatives is a liability of less than $1 million and an asset of $1 million as of December 31, 2021 and 2020, respectively. The difference between the gross and net value of these derivatives after offset by counter party is not material.
Cross Currency Swaps: The Company has executed cross-currency swap transactions intended to mitigate the variability of the U.S. dollar value of its investment in certain of its non-U.S. entities. These transactions are designated as net investment hedges and the Company has elected to assess hedge effectiveness under the spot method. Accordingly, periodic changes in the fair value of the derivative instruments attributable to factor other than spot exchange rate variability are excluded from the measure of hedge ineffectiveness and reported directly in earnings each reporting period.
As of December 31, 2021 and 2020, the Company had cross currency swaps with an aggregate notional value of $250 million. The aggregate fair value of these derivatives is an asset of $2 million and a non-current liability of $9 million as of December 31, 2021 and a non-current liability of $27 million as of December 31, 2020. As of December 31, 2021, a gain of approximately $4 million is expected to be reclassified out of accumulated other comprehensive income into earnings within the next 12 months.
Interest Rate Risk
The Company utilizes interest rate swap instruments to manage its exposure and to mitigate the impact of interest rate variability. The instruments are designated as cash flow hedges, accordingly, the effective portion of the periodic changes in fair value is recognized in accumulated other comprehensive income, a component of shareholders' equity. Subsequently, the accumulated gains and losses recorded in equity are reclassified to income in the period during which the hedged cash flow impacts earnings.
As of December 31, 2021 and 2020, the Company had interest rate swaps with an aggregate notional value of $300 million. The aggregate fair value of these derivative transactions is a non-current liability of approximately $4 million and $11 million, as of December 31, 2021 and 2020, respectively. As of December 31, 2021, a loss of approximately $4 million is expected to be reclassified out of accumulated other comprehensive income into earnings within the next 12 months.
78
Financial Statement Presentation
Gains and losses on derivative financial instruments for the years ended December 31, 2021 and 2020 are as follows:
| Amount of Gain (Loss) | |||||||||||||||||||||||||||||||||||
| Recorded Income (Loss) in AOCI, net of tax | Reclassified from AOCI into Income (Loss) | Recorded in Income (Loss) | |||||||||||||||||||||||||||||||||
| (In millions) | 2021 | 2020 | 2021 | 2020 | 2021 | 2020 | |||||||||||||||||||||||||||||
Foreign currency risk – Cost of sales: | |||||||||||||||||||||||||||||||||||
Cash flow hedges | |||||||||||||||||||||||||||||||||||
Interest rate risk - Interest expense, net: | |||||||||||||||||||||||||||||||||||
Net investment hedges | ( | ||||||||||||||||||||||||||||||||||
Interest rate swap | ( | ( | ( | ||||||||||||||||||||||||||||||||
| $ | $ | ( | $ | $ | $ | $ | |||||||||||||||||||||||||||||
Concentrations of Credit Risk
Financial instruments including cash equivalents, derivative contracts, and accounts receivable, expose the Company to counter-party credit risk for non-performance. The Company’s counterparties for cash equivalents and derivative contracts are banks and financial institutions that meet the Company’s requirement of high credit standing. The Company’s counterparties for derivative contracts are substantially investment and commercial banks with significant experience using such derivatives. The Company manages its credit risk through policies requiring minimum credit standing and limiting credit exposure to any one counter-party and through monitoring counter-party credit risks. The Company’s concentration of credit risk related to derivative contracts as of December 31, 2021 and 2020 is not material.
The following is a summary of the percentage of net sales and accounts receivable from the Company's customers with a percentage of net sales greater than 10 percent:
| Percentage of Total Net Sales | Percentage of Total Accounts Receivable | ||||||||||||||||||||||||||||
| December 31, | December 31, 2021 | December 31, 2020 | |||||||||||||||||||||||||||
| 2021 | 2020 | 2019 | |||||||||||||||||||||||||||
| Ford | % | % | % | % | % | ||||||||||||||||||||||||
| BMW | % | % | % | % | % | ||||||||||||||||||||||||
NOTE 19. Commitments and Contingencies
Litigation and Claims
In 2003, the Local Development Finance Authority of the Charter Township of Van Buren, Michigan issued approximately $28 million in bonds finally maturing in 2032, the proceeds of which were used at least in part to assist in the development of the Company’s U.S. headquarters located in the Township. During January 2010, the Company and the Township entered into a settlement agreement (the “Settlement Agreement”) that, among other things, reduced the taxable value of the headquarters property to current market value. The Settlement Agreement also provided that the Company would negotiate in good faith with the Township in the event that property tax payments were inadequate to permit the Township to meet its payment obligations with respect to the bonds. In October 2019, the Township notified the Company that the Township had incurred a shortfall under the bonds of less than $1 million and requested that the Company meet to discuss payment. The parties met in November 2019 but no agreement was reached. On December 9, 2019, the Township commenced litigation against the Company in Michigan’s Wayne County Circuit Court claiming damages of $28 million related to what the Township alleges to be the current shortfall and projected future shortfalls under the bonds. The Company disputes the factual and legal assertions made by the Township and will defend the matter vigorously. The Company is not able to estimate the possible loss or range of loss in connection with this matter.
In November 2013, the Company and Halla Visteon Climate Corporation ("HVCC"), jointly filed an Initial Notice of Voluntary Self-Disclosure statement with the U.S. Treasury Department’s Office of Foreign Assets Control (“OFAC”) regarding certain
79
sales of automotive HVAC components by a minority-owned, Chinese joint venture of HVCC into Iran. The Company updated that notice in December 2013, and subsequently filed a voluntary self-disclosure regarding these sales with OFAC in March 2014. In May 2014, the Company voluntarily filed a supplementary self-disclosure identifying additional sales of automotive HVAC components by the Chinese joint venture, as well as similar sales involving an HVCC subsidiary in China, totaling approximately $12 million, and filed a final voluntary-self disclosure with OFAC on October 17, 2014. OFAC is currently reviewing the results of the Company’s investigation. Following that review, OFAC may conclude that the disclosed sales resulted in violations of U.S. economic sanctions laws and warrant the imposition of civil penalties, such as fines, limitations on the Company's ability to export products from the United States, and/or referral for further investigation by the U.S. Department of Justice. Any such fines or restrictions may be material to the Company’s financial results in the period in which they are imposed, but is not able to estimate the possible loss or range of loss in connection with this matter. Additionally, disclosure of this conduct and any fines or other action relating to this conduct could harm the Company’s reputation and have a material adverse effect on our business, operating results and financial condition. The Company cannot predict when OFAC will conclude its own review of our voluntary self-disclosures or whether it may impose any of the potential penalties described above.
The Company's operations in Brazil are subject to highly complex labor, tax, customs and other laws. While the Company believes that it is in compliance with such laws, it is periodically engaged in litigation regarding the application of these laws. As of December 31, 2021, the Company maintained accruals of approximately $8 million for claims aggregating approximately $51 million in Brazil. The amounts accrued represent claims that are deemed probable of loss and are reasonably estimable based on the Company's assessment of the claims and prior experience with similar matters.
The adverse impacts of the COVID-19 pandemic led to a significant reduction in vehicle production in the first half of 2020, which was followed by increased consumer demand and vehicle production schedules in the second half of 2020. Because semiconductor suppliers have been unable to rapidly reallocate production to serve the automotive industry, the surge in demand has led to a worldwide semiconductor supply shortage. The Company's semiconductor suppliers, along with most automotive component supply companies that use semiconductors, have been unable to fully meet the vehicle production demands of our customers due to events which are outside the Company's control, including but not limited to, the COVID-19 pandemic, the global semiconductor shortage, a fire at a semiconductor fabrication facility in Japan, significant weather events impacting semiconductor supplier facilities in the southern United States, and other extraordinary events. The Company is working closely with suppliers and customers to attempt to minimize potential adverse impacts of these events. Certain customers have communicated that they expect the Company to absorb some of the financial impact of their reduced production and are reserving their rights to claim damages arising from supply shortages, however, the Company believes it has a number of legal defenses to such claims and intends to defend any such claims vigorously. The Company has also notified semiconductor suppliers that it will seek compensation from them for failure to deliver sufficient quantities. The Company is not able to estimate the possible loss or range of loss in connection with this matter at this time.
While the Company believes its accruals for litigation and claims are adequate, the final amounts required to resolve such matters could differ materially from recorded estimates and the Company's results of operations and cash flows could be materially affected.
Product Warranty and Recall
Amounts accrued for product warranty and recall provisions are based on management’s best estimates of the amounts that will ultimately be required to settle such items. The Company’s estimates for product warranty and recall obligations are developed with support from its sales, engineering, quality and legal functions and include due consideration of contractual arrangements, past experience, current claims and related information, production changes, industry and regulatory developments and various other considerations. These estimates do not include amounts which may ultimately be recovered from the Company's suppliers. The Company can provide no assurances that it will not experience material obligations in the future or that it will not incur significant costs to defend or settle such obligations beyond the amounts accrued or beyond what the Company may recover from its suppliers.
80
The following table provides a reconciliation of changes in the product warranty and recall liability:
| Year Ended December 31, | |||||||||||
| (In millions) | 2021 | 2020 | |||||||||
| Beginning balance | $ | $ | |||||||||
| Provisions | |||||||||||
Change in estimates | ( | ( | |||||||||
Currency/other | ( | ||||||||||
Settlements | ( | ( | |||||||||
| Ending balance | $ | $ | |||||||||
Guarantees and Commitments
As part of the agreements of the Climate Transaction and Interiors Divestiture, the Company continues to provide lease guarantees to divested Climate and Interiors entities. As of December 31, 2021, the Company has approximately $2 million and $2 million of outstanding guarantees, related to the divested Climate and Interiors entities, respectively. The guarantees represent the maximum potential amount that the Company could be required to pay under the guarantees in the event of default by the guaranteed parties. These guarantees will generally cease upon expiration of current lease agreement which expire in 2026 and 2024 for the Climate and Interiors entities, respectively.
Other Contingent Matters
Various legal actions, governmental investigations and proceedings and claims are pending or may be instituted or asserted in the future against the Company, including those arising out of alleged defects in the Company’s products; customs classifications, governmental regulations relating to safety; employment-related matters; customer, supplier and other contractual relationships; intellectual property rights; product warranties; product recalls; tax matters; and environmental matters. Some of the foregoing matters may involve compensatory, punitive or antitrust or other treble damage claims in very large amounts, or demands for recall campaigns, environmental remediation programs, sanctions, or other relief which, if granted, would require very large expenditures. The Company enters into agreements that contain indemnification provisions in the normal course of business for which the risks are considered nominal and impracticable to estimate.
Contingencies are subject to many uncertainties, and the outcome of individual litigated matters is not predictable with assurance. Reserves have been established by the Company for matters discussed in the immediately foregoing paragraph where losses are deemed probable and reasonably estimable. It is possible, however, that some of the matters discussed in the foregoing paragraph could be decided unfavorably to the Company and could require the Company to pay damages or make other expenditures in amounts, or a range of amounts, that cannot be estimated as of December 31, 2021 and that are in excess of established reserves. The Company does not reasonably expect, except as otherwise described herein, based on its analysis, that any adverse outcome from such matters would have a material effect on the Company’s financial condition, results of operations or cash flows, although such an outcome is possible.
NOTE 20. Segment Information and Revenue Recognition
The Company’s reportable segment is Electronics. The Electronics segment provides vehicle cockpit electronics products to customers, including instrument clusters, information displays, infotainment systems, audio systems, telematics solutions, battery monitoring systems, and head-up displays. As the Company has one reportable segment, net sales, total assets, depreciation, amortization and capital expenditures are equal to consolidated results.
Financial results for the Company's reportable segment have been prepared using a management approach, which is consistent with the basis and manner in which financial information is evaluated by the Company's chief operating decision maker in allocating resources and in assessing performance. The Company’s chief operating decision maker, the Chief Executive Officer, evaluates the performance of the Company’s segment primarily based on net sales, before elimination of inter-company shipments, Adjusted EBITDA (a non-U.S. GAAP financial measure, as defined below) and operating assets.
The accounting policies for the reportable segments are the same as those described in the Note 1, "Summary of Significant Accounting Policies” to the Company’s consolidated financial statements.
81
Segment Adjusted EBITDA
The Company defines Adjusted EBITDA as net income attributable to the Company adjusted to eliminate the impact of depreciation and amortization, restructuring and impairment expense, net interest expense, equity in net income of non-consolidated affiliates, loss on divestiture, provision for income taxes, discontinued operations, net income attributable to non-controlling interests, non-cash stock-based compensation expense, and other gains and losses not reflective of the Company's ongoing operations.
Adjusted EBITDA is presented as a supplemental measure of the Company's financial performance that management believes is useful to investors because the excluded items may vary significantly in timing or amounts and/or may obscure trends useful in evaluating and comparing the Company's operating activities across reporting periods. Not all companies use identical calculations and, accordingly, the Company's presentation of Adjusted EBITDA may not be comparable to other similarly titled measures of other companies. Adjusted EBITDA is not a recognized term under U.S. GAAP and does not purport to be a substitute for net income as an indicator of operating performance or cash flows from operating activities as a measure of liquidity. Adjusted EBITDA has limitations as an analytical tool and is not intended to be a measure of cash flow available for management's discretionary use, as it does not consider certain cash requirements such as interest payments, tax payments and debt service requirements. In addition, the Company uses Adjusted EBITDA (i) as a factor in incentive compensation decisions, (ii) to evaluate the effectiveness of the Company's business strategies and (iii) the Company's credit agreements use measures similar to Adjusted EBITDA to measure compliance with certain covenants.
Segment Adjusted EBITDA was $228 million, $192 million and $234 million for the years ended December 31, 2021, 2020 and 2019.
The reconciliation of Adjusted EBITDA to Net income attributable to Visteon for the years ended December 31, 2021, 2020 and 2019 is as follows:
| Year Ended December 31, | |||||||||||||||||
| (In millions) | 2021 | 2020 | 2019 | ||||||||||||||
| Net income (loss) attributable to Visteon Corporation | $ | $ | ( | $ | |||||||||||||
| Depreciation and amortization | |||||||||||||||||
| Restructuring and impairment expense | |||||||||||||||||
| Provision for income taxes | |||||||||||||||||
| Non-cash, stock-based compensation expense | |||||||||||||||||
| Interest expense, net | |||||||||||||||||
| Net income attributable to non-controlling interests | |||||||||||||||||
| Net (income) loss from discontinued operations, net of tax | |||||||||||||||||
| Equity in net income of non-consolidated affiliates | ( | ( | ( | ||||||||||||||
| Other, net | |||||||||||||||||
| Adjusted EBITDA | $ | $ | $ | ||||||||||||||
82
Financial Information by Geographic Region
Financial information about net sales and net tangible long-lived assets by country are as follows:
Net Sales (a) | Tangible Long-Lived Assets, Net (b) | ||||||||||||||||||||||||||||
| Year Ended December 31, | December 31, | ||||||||||||||||||||||||||||
| (In millions) | 2021 | 2020 | 2019 | 2021 | 2020 | ||||||||||||||||||||||||
United States | $ | $ | $ | $ | $ | ||||||||||||||||||||||||
Mexico | |||||||||||||||||||||||||||||
Total North America | |||||||||||||||||||||||||||||
Portugal | |||||||||||||||||||||||||||||
Slovakia | |||||||||||||||||||||||||||||
Tunisia | |||||||||||||||||||||||||||||
Other Europe | |||||||||||||||||||||||||||||
Total Europe | |||||||||||||||||||||||||||||
China Domestic | |||||||||||||||||||||||||||||
China Export | |||||||||||||||||||||||||||||
Total China | |||||||||||||||||||||||||||||
Japan | |||||||||||||||||||||||||||||
India | |||||||||||||||||||||||||||||
Other Asia-Pacific | |||||||||||||||||||||||||||||
Total Other Asia-Pacific | |||||||||||||||||||||||||||||
South America | |||||||||||||||||||||||||||||
Eliminations | ( | ( | ( | ||||||||||||||||||||||||||
| $ | $ | $ | $ | $ | |||||||||||||||||||||||||
| (a) Company sales based on geographic region where sale originates and not where customer is located. | |||||||||||||||||||||||||||||
(b) Tangible long-lived assets include property, plant and equipment and right-of-use assets. | |||||||||||||||||||||||||||||
Disaggregated revenue by product lines is as follows:
| Year Ended December 31, | |||||||||||
| (In millions) | 2021 | 2020 | |||||||||
| Product Lines | |||||||||||
| Instrument clusters | $ | $ | |||||||||
| Infotainment | |||||||||||
| Information displays | |||||||||||
| Cockpit domain controller | |||||||||||
| Body and security | |||||||||||
| Telematics | |||||||||||
| Other | |||||||||||
| $ | $ | ||||||||||
83
NOTE 21. Other Income, Net
| Year Ended December 31, | |||||||||||||||||
| (In millions) | 2021 | 2020 | 2019 | ||||||||||||||
| Pension financing benefits, net | $ | $ | $ | ||||||||||||||
| Pension settlement charge | ( | ||||||||||||||||
| $ | $ | $ | |||||||||||||||
Pension financing benefits, net include return on assets net of interest costs and other amortization.
84
Item 9.Changes in and Disagreements With Accountants on Accounting and Financial Disclosure
None.
Item 9A.Controls and Procedures
Disclosure Controls and Procedures
The Company maintains disclosure controls and procedures that are designed to ensure that information required to be disclosed in periodic reports filed with the SEC under the Securities Exchange Act of 1934 is recorded, processed, summarized, and reported within the time periods specified in the SEC’s rules and forms, and that such information is accumulated and communicated to the Company’s management, including its Chief Executive Officer and Chief Financial Officer, as appropriate, to allow timely decisions regarding required disclosure.
At December 31, 2021, an evaluation was performed under the supervision and with the participation of the Company’s management, including its Chief Executive and Financial Officers, of the effectiveness of the design and operation of disclosure controls and procedures. Based on that evaluation, the Chief Executive Officer and the Chief Financial Officer concluded that the Company’s disclosure controls and procedures were effective as of December 31, 2021.
Internal Control over Financial Reporting
Management’s report on internal control over financial reporting is presented in Item 8 of this Form 10-K “Financial Statements and Supplementary Data” of this Annual Report on Form 10-K along with the attestation report of Ernst & Young LLP, the Company’s independent registered public accounting firm, on the effectiveness of internal control over financial reporting as at December 31, 2021. There were no changes in the Company's internal control over financial reporting during the three months ended December 31, 2021 that have materially affected, or are reasonably likely to materially affect, the Company's internal control over financial reporting.
Part III
Item 10.Directors, Executive Officers and Corporate Governance
Except as set forth herein, the information required by Item 10 regarding its directors is incorporated by reference from the information under the captions “Item - Election of Directors,” “Corporate Governance,” and "2022 Stockholder Proposals and Nominations" in its 2022 Proxy Statement. The information required by Item 10 regarding its executive officers appears as Item 4A under Part I of this Form 10-K.
The Company has a code of ethics, as such phrase is defined in Item 406 of Regulation S-K, that applies to all directors, officers and employees of the Company and its subsidiaries, including the Chief Executive Officer, the Chief Financial Officer and the Chief Accounting Officer. The code, entitled “Ethics and Integrity Policy,” is available on the Company's website at www.visteon.com.
Item 11.Executive Compensation
The information required by Item 11 is incorporated by reference from the information under the captions “Compensation Committee Report,” “Executive Compensation” and “Director Compensation” in its 2022 Proxy Statement.
85
Item 12.Security Ownership of Certain Beneficial Owners and Management and Related Stockholder Matters
The information required by Item 12 is incorporated by reference from the information under the caption “Security Ownership of Certain Beneficial Owners and Management” in its 2022 Proxy Statement.
Item 13.Certain Relationships and Related Transactions, and Director Independence
The information required by Item 13 is incorporated by reference from the information under the captions “Corporate Governance - Director Independence” and “Transactions with Related Persons” in its 2022 Proxy Statement.
Item 14.Principal Accountant Fees and Services
The information required by Item 14 is incorporated by reference from the information under the captions “Audit Fees” and “Audit Committee Pre-Approval Process and Policies” in its 2022 Proxy Statement.
86
Part IV
Item 15.Exhibits and Financial Statement Schedules
(a) The following documents are filed as part of this Form 10-K:
1. Financial Statements
See “Index to Consolidated Financial Statements” in Part II, Item 8 of this Form 10-K hereof.
2. Financial Statement Schedules
Schedule II — Valuation and Qualifying Accounts
All other financial statement schedules are omitted because they are not required or applicable under instructions contained in Regulation S-X or because the information called for is shown in the financial statements and notes thereto.
3. Exhibits
The exhibits listed on the "Exhibit Index" on page 91 hereof are filed with this Form 10-K or incorporated by reference as set forth herein.
87
VISTEON CORPORATION AND SUBSIDIARIES
SCHEDULE II — VALUATION AND QUALIFYING ACCOUNTS
| (In millions) | Balance at Beginning of Period | (Benefits)/ Charges to Income | Deductions(a) | Other( b) | Balance at End of Period | ||||||||||||||||||||||||
Year Ended December 31, 2021: | |||||||||||||||||||||||||||||
Allowance for doubtful accounts | $ | $ | $ | $ | $ | ||||||||||||||||||||||||
Valuation allowance for deferred taxes | ( | ( | |||||||||||||||||||||||||||
Year Ended December 31, 2020: | |||||||||||||||||||||||||||||
Allowance for doubtful accounts | $ | $ | ( | $ | ( | $ | $ | ||||||||||||||||||||||
Valuation allowance for deferred taxes | |||||||||||||||||||||||||||||
Year Ended December 31, 2019: | |||||||||||||||||||||||||||||
Allowance for doubtful accounts | $ | $ | $ | ( | $ | $ | |||||||||||||||||||||||
Valuation allowance for deferred taxes | ( | ( | |||||||||||||||||||||||||||
____________
(a)Deductions represent uncollectible accounts charged off.
(b)Deferred taxes valuation allowance - represents adjustments recorded through other comprehensive income, exchange, expiration of tax attribute carryforwards, and various tax return true-up adjustments, all of which impact deferred taxes and the related valuation allowances. In 2021, $46 million other decrease in the valuation allowance for deferred taxes is comprised of $28 million related to exchange and $18 million primarily related to other comprehensive income. In 2020, the $85 million other increase in the valuation allowance for deferred taxes is comprised of $49 million related to valuation allowance benefits allocated to discontinued operations associated with electing to deduct expiring foreign tax credits previously derecognized for which a valuation allowance is maintained; $20 million related to exchange; and $16 million primarily related to other comprehensive income. In 2019, the $2 million overall decrease in the valuation allowance for deferred taxes is comprised of $7 million related to exchange, partially offset by $5 million related to other comprehensive income.
88
Exhibit Index
| Exhibit No. | Description | |||||||
Form of Restricted Stock Unit Grant Agreement (2021) under the Visteon Corporation 2020 Incentive Plan.* | ||||||||
89
| Exhibit No. | Description | |||||||
| 101.INS | XBRL Instance Document.** | |||||||
| 101.SCH | XBRL Taxonomy Extension Schema Document.** | |||||||
| 101.CAL | XBRL Taxonomy Extension Calculation Linkbase Document.** | |||||||
| 101.LAB | XBRL Taxonomy Extension Label Linkbase Document.** | |||||||
| 101.PRE | XBRL Taxonomy Extension Presentation Linkbase Document.** | |||||||
| 101.DEF | XBRL Taxonomy Extension Definition Linkbase Document.** | |||||||
* Indicates that exhibit is a management contract or compensatory plan or arrangement.
** Pursuant to Rule 406T of Regulation S-T, the Interactive Data Files as Exhibit 101 hereto are deemed not filed or part of a registration statement or prospectus for purposes of Sections 11 or 12 of the Securities Act of 1933, as amended, are deemed not filed for purposes of Section 18 of the Securities and Exchange Act of 1934, as amended, and otherwise are not subject to liability under those sections.
In lieu of filing certain instruments with respect to long-term debt of the kind described in Item 601(b)(4) of Regulation S-K, Visteon agrees to furnish a copy of such instruments to the Securities and Exchange Commission upon request.
90
Signatures
Pursuant to the requirements of Section 13 of the Securities Exchange Act of 1934, Visteon Corporation has duly caused this Form 10-K to be signed on its behalf by the undersigned, thereunto duly authorized.
| VISTEON CORPORATION | ||||||||
| By: | /s/ ABIGAIL S. FLEMING | |||||||
| Abigail S. Fleming | ||||||||
| Vice President and Chief Accounting Officer | ||||||||
Date: February 17, 2022
91
Pursuant to the requirements of the Securities Exchange Act of 1934, this Form 10-K has been signed below by the following persons on behalf of the registrant and in the capacities and the dates indicated.
| Signature | Title | |||||||
| /s/ SACHIN LAWANDE | Director, President and Chief Executive Officer | |||||||
| Sachin Lawande | (Principal Executive Officer) | |||||||
| /s/ JEROME J. ROUQUET | Senior Vice President and Chief Financial Officer | |||||||
| Jerome J. Rouquet | (Principal Financial Officer) | |||||||
| /s/ ABIGAIL S. FLEMING | Vice President and Chief Accounting Officer | |||||||
| Abigail S. Fleming | (Principal Accounting Officer) | |||||||
| /s/ JAMES J. BARRESE* | Director | |||||||
| James J. Barrese | ||||||||
| /s/ NAOMI M. BERGMAN* | Director | |||||||
| Naomi M. Bergman | ||||||||
| /s/ JEFFREY D. JONES* | Director | |||||||
| Jeffrey D. Jones | ||||||||
| /s/ JOANNE M. MAGUIRE* | Director | |||||||
| Joanne M. Maguire | ||||||||
| /s/ ROBERT J. MANZO* | Director | |||||||
| Robert J. Manzo | ||||||||
| /s/ FRANCIS M. SCRICCO* | Director | |||||||
| Francis M. Scricco | ||||||||
| /s/ DAVID L. TREADWELL* | Director | |||||||
| David L. Treadwell | ||||||||
| Director | ||||||||
Bunsei Kure | ||||||||
| *By: | /s/ BRETT PYNNONEN | |||||||
| Brett Pynnonen | ||||||||
| Attorney-in-Fact | ||||||||
92

 VISTEON CORPORATION 2020 INCENTIVE PLAN