8 years4 years4 years5 years14230000002047256000000falseFYPTRPETROCHINA CO LTD0001108329--12-31trueNYSEIn 2020, domestic oil and gas field companies adjusted the discount period with reference to the remaining life corresponding to the proved developed reserves in each block, updated various oil and gas assets retirement standards based on the latest legal requirements, technology and price levels, reviewed the adopted discount rate, and then recalculate and adjust the provision for the asset retirement expense of oil and gas properties at the end of the year. The changes in related accounting estimates and new liabilities provided resulted in a reduction in estimated liabilities of RMB 24,059. 0001108329 2021-12-31 0001108329 2020-12-31 0001108329 2021-01-01 2021-12-31 0001108329 2020-01-01 2020-12-31 0001108329 2019-01-01 2019-12-31 0001108329 2019-12-31 0001108329 2021-09-17 2021-09-17 0001108329 2020-09-22 2020-09-22 0001108329 2019-09-24 2019-09-24 0001108329 1999-11-05 0001108329 2020-08-27 2020-08-27 0001108329 2000-04-07 2000-04-07 0001108329 2020-12-22 0001108329 2020-12-22 2020-12-22 0001108329 2020-07-23 0001108329 2022-01-01 2022-12-31 0001108329 2023-01-01 2023-12-31 0001108329 2024-01-01 2024-12-31 0001108329 2025-01-01 2025-12-31 0001108329 2026-01-01 2026-12-31 0001108329 2011-08-25 2011-08-25 0001108329 2018-12-31 0001108329 ptr:OilAndGasPropertiesMember ptr:ExplorationAndProductionMember 2019-01-01 2019-12-31 0001108329 ptr:AssociatesAndJointVenturesMember 2019-01-01 2019-12-31 0001108329 ifrs-full:SubsidiariesMember 2019-01-01 2019-12-31 0001108329 ifrs-full:ExplorationAndEvaluationAssetsMember ifrs-full:ConstructionInProgressMember 2019-01-01 2019-12-31 0001108329 ptr:SupervisorsMember 2019-01-01 2019-12-31 0001108329 ptr:DirectorsMember 2019-01-01 2019-12-31 0001108329 ptr:SeniorManagementsMember 2019-01-01 2019-12-31 0001108329 ptr:AssociatesAndJointVenturesDisposalMember 2019-01-01 2019-12-31 0001108329 ptr:ExplorationAndProductionLicensesMember 2019-01-01 2019-12-31 0001108329 ptr:ChinaNationalPetroleumCorporationAndItsFellowSubsidiariesAssociatesAndJointVenturesMember 2019-01-01 2019-12-31 0001108329 ptr:MainlandChinaMember 2019-01-01 2019-12-31 0001108329 ptr:OtherCountriesMember 2019-01-01 2019-12-31 0001108329 ptr:ConsolidatedEntitiesMember 2019-01-01 2019-12-31 0001108329 ptr:AggregatedIndividuallyImmaterialAssociatesAndJointVenturesMember 2019-01-01 2019-12-31 0001108329 ptr:SeniorManagementOneMember 2019-01-01 2019-12-31 0001108329 ptr:ChinaPetroleumChemicalCorporationAndItsFellowSubsidiariesMember 2019-01-01 2019-12-31 0001108329 ptr:CnpcAndItsFellowSubsidiariesMember 2019-01-01 2019-12-31 0001108329 ifrs-full:MajorCustomersMember 2019-01-01 2019-12-31 0001108329 ifrs-full:NoncontrollingInterestsMember 2019-01-01 2019-12-31 0001108329 ifrs-full:EquityAttributableToOwnersOfParentMember 2019-01-01 2019-12-31 0001108329 ifrs-full:RetainedEarningsMember 2019-01-01 2019-12-31 0001108329 ptr:OthersMember 2019-01-01 2019-12-31 0001108329 ifrs-full:OtherReservesMember 2019-01-01 2019-12-31 0001108329 ptr:MainlandChinaMember ptr:ConsolidatedEntitiesMember 2019-01-01 2019-12-31 0001108329 ptr:OtherCountriesMember ptr:ConsolidatedEntitiesMember 2019-01-01 2019-12-31 0001108329 srt:OilReservesMember ptr:ConsolidatedEntitiesMember 2019-01-01 2019-12-31 0001108329 srt:NaturalGasReservesMember ptr:ConsolidatedEntitiesMember 2019-01-01 2019-12-31 0001108329 ptr:CNPCExplorationAndDevelopmentCompanyLimitedMember 2019-01-01 2019-12-31 0001108329 ptr:PetrochinaSichuanPetrochemicalCompanyLimitedMember 2019-01-01 2019-12-31 0001108329 ptr:Mr.RenLixinMember ptr:ExecutiveDirectorMember 2019-01-01 2019-12-31 0001108329 ptr:LiWendongMember ptr:SupervisorsMember 2019-01-01 2019-12-31 0001108329 ptr:LiuXianhuaMember ptr:SupervisorsMember 2019-01-01 2019-12-31 0001108329 ptr:DirectorsAndSupervisorsMember 2019-01-01 2019-12-31 0001108329 ptr:ExecutiveDirectorMember 2019-01-01 2019-12-31 0001108329 ptr:LinBoqiangMember ptr:NonExecutiveDirectorsMember 2019-01-01 2019-12-31 0001108329 ptr:NonExecutiveDirectorsMember ptr:ZhangBiyiMember 2019-01-01 2019-12-31 0001108329 ptr:ElsieLeungOisieMember ptr:NonExecutiveDirectorsMember 2019-01-01 2019-12-31 0001108329 ptr:NonExecutiveDirectorsMember ptr:TokuchiTatsuhitoMember 2019-01-01 2019-12-31 0001108329 ptr:SimonHenryMember ptr:NonExecutiveDirectorsMember 2019-01-01 2019-12-31 0001108329 ptr:NonExecutiveDirectorsMember 2019-01-01 2019-12-31 0001108329 ptr:FuSuotangMember ptr:SupervisorsMember 2019-01-01 2019-12-31 0001108329 ptr:LiJiaminMember ptr:SupervisorsMember 2019-01-01 2019-12-31 0001108329 ptr:CNPCCaptiveInsuranceCoLtdMember 2019-01-01 2019-12-31 0001108329 ptr:ChinaPetroleumFinanceCoLtdMember 2019-01-01 2019-12-31 0001108329 ptr:OtherCountriesMember 2019-01-01 2019-12-31 0001108329 ptr:MainlandChinaMember 2019-01-01 2019-12-31 0001108329 ptr:EquityMethodInvesteeMember 2019-01-01 2019-12-31 0001108329 ptr:OtherCountriesMember ptr:EquityMethodInvesteeMember 2019-01-01 2019-12-31 0001108329 ptr:RefiningAndChemicalsMember ifrs-full:EliminationOfIntersegmentAmountsMember 2019-01-01 2019-12-31 0001108329 ptr:MarketingMember ifrs-full:EliminationOfIntersegmentAmountsMember 2019-01-01 2019-12-31 0001108329 ptr:NaturalGasAndPipelineMember ifrs-full:EliminationOfIntersegmentAmountsMember 2019-01-01 2019-12-31 0001108329 ptr:HeadOfficeAndOtherMember ifrs-full:EliminationOfIntersegmentAmountsMember 2019-01-01 2019-12-31 0001108329 ifrs-full:EliminationOfIntersegmentAmountsMember 2019-01-01 2019-12-31 0001108329 ptr:ExplorationAndProductionMember 2019-01-01 2019-12-31 0001108329 ptr:RefiningAndChemicalsMember 2019-01-01 2019-12-31 0001108329 ptr:MarketingMember 2019-01-01 2019-12-31 0001108329 ptr:NaturalGasAndPipelineMember 2019-01-01 2019-12-31 0001108329 ptr:HeadOfficeAndOtherMember 2019-01-01 2019-12-31 0001108329 ptr:ExplorationAndProductionMember ifrs-full:OperatingSegmentsMember 2019-01-01 2019-12-31 0001108329 ptr:RefiningAndChemicalsMember ifrs-full:OperatingSegmentsMember 2019-01-01 2019-12-31 0001108329 ptr:MarketingMember ifrs-full:OperatingSegmentsMember 2019-01-01 2019-12-31 0001108329 ptr:NaturalGasAndPipelineMember ifrs-full:OperatingSegmentsMember 2019-01-01 2019-12-31 0001108329 ptr:HeadOfficeAndOtherMember ifrs-full:OperatingSegmentsMember 2019-01-01 2019-12-31 0001108329 ifrs-full:OperatingSegmentsMember 2019-01-01 2019-12-31 0001108329 ptr:ExplorationAndProductionMember ifrs-full:EliminationOfIntersegmentAmountsMember 2019-01-01 2019-12-31 0001108329 ptr:ChinaMarineBunkerPetrochinaCoLtdMember 2019-01-01 2019-12-31 0001108329 ptr:MangistauInvestmentBvMember 2019-01-01 2019-12-31 0001108329 ptr:TransAsiaGasPipelineCoLtdMember 2019-01-01 2019-12-31 0001108329 srt:OilReservesMember ptr:ExplorationAndProductionMember ifrs-full:OperatingSegmentsMember 2019-01-01 2019-12-31 0001108329 srt:OilReservesMember ptr:MarketingMember ifrs-full:OperatingSegmentsMember 2019-01-01 2019-12-31 0001108329 srt:OilReservesMember ifrs-full:OperatingSegmentsMember 2019-01-01 2019-12-31 0001108329 srt:NaturalGasReservesMember ptr:ExplorationAndProductionMember ifrs-full:OperatingSegmentsMember 2019-01-01 2019-12-31 0001108329 ifrs-full:OperatingSegmentsMember ptr:MarketingMember srt:NaturalGasReservesMember 2019-01-01 2019-12-31 0001108329 srt:NaturalGasReservesMember ptr:NaturalGasAndPipelineMember ifrs-full:OperatingSegmentsMember 2019-01-01 2019-12-31 0001108329 srt:NaturalGasReservesMember ifrs-full:OperatingSegmentsMember 2019-01-01 2019-12-31 0001108329 ifrs-full:OperatingSegmentsMember ptr:RefiningAndChemicalsMember ptr:RefinedProductsMember 2019-01-01 2019-12-31 0001108329 ptr:RefinedProductsMember ptr:MarketingMember ifrs-full:OperatingSegmentsMember 2019-01-01 2019-12-31 0001108329 ptr:RefinedProductsMember ifrs-full:OperatingSegmentsMember 2019-01-01 2019-12-31 0001108329 ptr:ChemicalProductsMember ptr:RefiningAndChemicalsMember ifrs-full:OperatingSegmentsMember 2019-01-01 2019-12-31 0001108329 ptr:ChemicalProductsMember ptr:MarketingMember ifrs-full:OperatingSegmentsMember 2019-01-01 2019-12-31 0001108329 ptr:ChemicalProductsMember ifrs-full:OperatingSegmentsMember 2019-01-01 2019-12-31 0001108329 ifrs-full:OperatingSegmentsMember ptr:NaturalGasAndPipelineMember ptr:PipelineTransportationBusinessMember 2019-01-01 2019-12-31 0001108329 ptr:PipelineTransportationBusinessMember ifrs-full:OperatingSegmentsMember 2019-01-01 2019-12-31 0001108329 ifrs-full:OperatingSegmentsMember ptr:MarketingMember ptr:NonoilSalesInGasStationsMember 2019-01-01 2019-12-31 0001108329 ptr:NonoilSalesInGasStationsMember ifrs-full:OperatingSegmentsMember 2019-01-01 2019-12-31 0001108329 ptr:OtherGoodsAndServicesMember ifrs-full:OperatingSegmentsMember ptr:ExplorationAndProductionMember 2019-01-01 2019-12-31 0001108329 ptr:OtherGoodsAndServicesMember ifrs-full:OperatingSegmentsMember ptr:RefiningAndChemicalsMember 2019-01-01 2019-12-31 0001108329 ptr:OtherGoodsAndServicesMember ifrs-full:OperatingSegmentsMember ptr:MarketingMember 2019-01-01 2019-12-31 0001108329 ptr:OtherGoodsAndServicesMember ifrs-full:OperatingSegmentsMember ptr:NaturalGasAndPipelineMember 2019-01-01 2019-12-31 0001108329 ptr:OtherGoodsAndServicesMember ifrs-full:OperatingSegmentsMember ptr:HeadOfficeAndOtherMember 2019-01-01 2019-12-31 0001108329 ptr:OtherGoodsAndServicesMember ifrs-full:OperatingSegmentsMember 2019-01-01 2019-12-31 0001108329 ptr:MainlandChinaMember ptr:ExplorationAndProductionMember 2019-01-01 2019-12-31 0001108329 ptr:RefiningAndChemicalsMember ptr:MainlandChinaMember 2019-01-01 2019-12-31 0001108329 ptr:MainlandChinaMember ptr:MarketingMember 2019-01-01 2019-12-31 0001108329 ptr:NaturalGasAndPipelineMember ptr:MainlandChinaMember 2019-01-01 2019-12-31 0001108329 ptr:MainlandChinaMember ptr:HeadOfficeAndOtherMember 2019-01-01 2019-12-31 0001108329 ptr:OtherCountriesMember ptr:ExplorationAndProductionMember 2019-01-01 2019-12-31 0001108329 ptr:OtherCountriesMember ptr:MarketingMember 2019-01-01 2019-12-31 0001108329 ifrs-full:BottomOfRangeMember ptr:OthersMember 2019-01-01 2019-12-31 0001108329 ptr:OthersMember ifrs-full:TopOfRangeMember 2019-01-01 2019-12-31 0001108329 ifrs-full:AccumulatedDepreciationAndAmortisationMember 2019-01-01 2019-12-31 0001108329 ifrs-full:AccumulatedDepreciationAndAmortisationMember ifrs-full:OtherAssetsMember 2019-01-01 2019-12-31 0001108329 ifrs-full:AccumulatedDepreciationAndAmortisationMember ifrs-full:MachineryMember 2019-01-01 2019-12-31 0001108329 ifrs-full:AccumulatedDepreciationAndAmortisationMember ifrs-full:BuildingsMember 2019-01-01 2019-12-31 0001108329 ifrs-full:AccumulatedDepreciationAndAmortisationMember ifrs-full:LandMember 2019-01-01 2019-12-31 0001108329 ptr:ExplorationAndProductionMember ptr:OilAndGasPropertiesMember 2020-01-01 2020-12-31 0001108329 ptr:CNPCCaptiveInsuranceCoLtdMember 2020-01-01 2020-12-31 0001108329 ptr:ChinaPetroleumFinanceCoLtdMember 2020-01-01 2020-12-31 0001108329 ptr:PipeChinaMember 2020-01-01 2020-12-31 0001108329 ptr:TransAsiaGasPipelineCoLtdMember 2020-01-01 2020-12-31 0001108329 ptr:ChinaMarineBunkerPetrochinaCoLtdMember 2020-01-01 2020-12-31 0001108329 ptr:MangistauInvestmentBvMember 2020-01-01 2020-12-31 0001108329 ptr:AssociatesAndJointVenturesMember 2020-01-01 2020-12-31 0001108329 ptr:CNPCExplorationAndDevelopmentCompanyLimitedMember 2020-01-01 2020-12-31 0001108329 ptr:PetrochinaSichuanPetrochemicalCompanyLimitedMember 2020-01-01 2020-12-31 0001108329 ifrs-full:SubsidiariesMember 2020-01-01 2020-12-31 0001108329 ifrs-full:ExplorationAndEvaluationAssetsMember ifrs-full:ConstructionInProgressMember 2020-01-01 2020-12-31 0001108329 ifrs-full:BuildingsMember ifrs-full:GrossCarryingAmountMember 2020-01-01 2020-12-31 0001108329 ifrs-full:OilAndGasAssetsMember ifrs-full:GrossCarryingAmountMember 2020-01-01 2020-12-31 0001108329 ptr:EquipmentAndMachineryMember ifrs-full:GrossCarryingAmountMember 2020-01-01 2020-12-31 0001108329 ifrs-full:MotorVehiclesMember ifrs-full:GrossCarryingAmountMember 2020-01-01 2020-12-31 0001108329 ifrs-full:GrossCarryingAmountMember ifrs-full:OtherPropertyPlantAndEquipmentMember 2020-01-01 2020-12-31 0001108329 ifrs-full:ConstructionInProgressMember ifrs-full:GrossCarryingAmountMember 2020-01-01 2020-12-31 0001108329 ifrs-full:GrossCarryingAmountMember 2020-01-01 2020-12-31 0001108329 ptr:SupervisorsMember 2020-01-01 2020-12-31 0001108329 ptr:SeniorManagementsMember 2020-01-01 2020-12-31 0001108329 ifrs-full:BuildingsMember ifrs-full:AccumulatedDepreciationAmortisationAndImpairmentMember 2020-01-01 2020-12-31 0001108329 ifrs-full:OilAndGasAssetsMember ifrs-full:AccumulatedDepreciationAmortisationAndImpairmentMember 2020-01-01 2020-12-31 0001108329 ptr:EquipmentAndMachineryMember ifrs-full:AccumulatedDepreciationAmortisationAndImpairmentMember 2020-01-01 2020-12-31 0001108329 ifrs-full:MotorVehiclesMember ifrs-full:AccumulatedDepreciationAmortisationAndImpairmentMember 2020-01-01 2020-12-31 0001108329 ifrs-full:OtherPropertyPlantAndEquipmentMember ifrs-full:AccumulatedDepreciationAmortisationAndImpairmentMember 2020-01-01 2020-12-31 0001108329 ifrs-full:AccumulatedDepreciationAmortisationAndImpairmentMember 2020-01-01 2020-12-31 0001108329 ptr:AssociatesAndJointVenturesDisposalMember 2020-01-01 2020-12-31 0001108329 ptr:ExplorationAndProductionLicensesMember 2020-01-01 2020-12-31 0001108329 ptr:ChinaNationalPetroleumCorporationAndItsFellowSubsidiariesAssociatesAndJointVenturesMember 2020-01-01 2020-12-31 0001108329 ptr:OtherCountriesMember 2020-01-01 2020-12-31 0001108329 ptr:MainlandChinaMember 2020-01-01 2020-12-31 0001108329 ptr:ConsolidatedEntitiesMember 2020-01-01 2020-12-31 0001108329 ptr:AggregatedIndividuallyImmaterialAssociatesAndJointVenturesMember 2020-01-01 2020-12-31 0001108329 ptr:SeniorManagementOneMember 2020-01-01 2020-12-31 0001108329 ptr:SeniorManagementTwoMember 2020-01-01 2020-12-31 0001108329 ptr:SeniorManagementThirdMember 2020-01-01 2020-12-31 0001108329 ptr:SeniorManagementFourMember 2020-01-01 2020-12-31 0001108329 ptr:CnpcAndItsFellowSubsidiariesMember 2020-01-01 2020-12-31 0001108329 ptr:ChinaPetroleumChemicalCorporationAndItsFellowSubsidiariesMember 2020-01-01 2020-12-31 0001108329 ifrs-full:MajorCustomersMember 2020-01-01 2020-12-31 0001108329 ifrs-full:StatutoryReserveMember 2020-01-01 2020-12-31 0001108329 ifrs-full:NoncontrollingInterestsMember 2020-01-01 2020-12-31 0001108329 ifrs-full:EquityAttributableToOwnersOfParentMember 2020-01-01 2020-12-31 0001108329 ifrs-full:RetainedEarningsMember 2020-01-01 2020-12-31 0001108329 ifrs-full:ConstructionInProgressMember ifrs-full:AccumulatedDepreciationAmortisationAndImpairmentMember 2020-01-01 2020-12-31 0001108329 ptr:OthersMember 2020-01-01 2020-12-31 0001108329 ifrs-full:ReserveOfDiscretionaryParticipationFeaturesMember 2020-01-01 2020-12-31 0001108329 ifrs-full:OtherReservesMember 2020-01-01 2020-12-31 0001108329 ptr:MainlandChinaMember ptr:ConsolidatedEntitiesMember 2020-01-01 2020-12-31 0001108329 ptr:OtherCountriesMember ptr:ConsolidatedEntitiesMember 2020-01-01 2020-12-31 0001108329 srt:OilReservesMember ptr:ConsolidatedEntitiesMember 2020-01-01 2020-12-31 0001108329 ifrs-full:ReserveOfExchangeDifferencesOnTranslationMember 2020-01-01 2020-12-31 0001108329 ptr:NonExecutiveDirectorsMember ptr:DuanLiangweiMember 2020-01-01 2020-12-31 0001108329 ptr:LiuXianhuaMember ptr:SupervisorsMember 2020-01-01 2020-12-31 0001108329 ptr:DirectorsAndSupervisorsMember 2020-01-01 2020-12-31 0001108329 ptr:ExecutiveDirectorMember 2020-01-01 2020-12-31 0001108329 ptr:LinBoqiangMember ptr:NonExecutiveDirectorsMember 2020-01-01 2020-12-31 0001108329 ptr:ZhangBiyiMember ptr:NonExecutiveDirectorsMember 2020-01-01 2020-12-31 0001108329 ptr:ElsieLeungOisieMember ptr:NonExecutiveDirectorsMember 2020-01-01 2020-12-31 0001108329 ptr:TokuchiTatsuhitoMember ptr:NonExecutiveDirectorsMember 2020-01-01 2020-12-31 0001108329 ptr:SimonHenryMember ptr:NonExecutiveDirectorsMember 2020-01-01 2020-12-31 0001108329 ptr:NonExecutiveDirectorsMember 2020-01-01 2020-12-31 0001108329 ptr:SupervisorsMember ptr:FuSuotangMember 2020-01-01 2020-12-31 0001108329 ptr:SupervisorsMember ptr:LiJiaminMember 2020-01-01 2020-12-31 0001108329 ptr:LiWendongMember ptr:SupervisorsMember 2020-01-01 2020-12-31 0001108329 ptr:OtherMiscellaneousReservesMember 2020-01-01 2020-12-31 0001108329 ptr:OtherCountriesMember ptr:EquityMethodInvesteeMember 2020-01-01 2020-12-31 0001108329 ptr:EquityMethodInvesteeMember 2020-01-01 2020-12-31 0001108329 ptr:MainlandChinaMember 2020-01-01 2020-12-31 0001108329 ptr:OtherCountriesMember 2020-01-01 2020-12-31 0001108329 ptr:MarketingMember 2020-01-01 2020-12-31 0001108329 ptr:RefiningAndChemicalsMember 2020-01-01 2020-12-31 0001108329 ptr:ExplorationAndProductionMember 2020-01-01 2020-12-31 0001108329 ifrs-full:EliminationOfIntersegmentAmountsMember 2020-01-01 2020-12-31 0001108329 ifrs-full:EliminationOfIntersegmentAmountsMember ptr:HeadOfficeAndOtherMember 2020-01-01 2020-12-31 0001108329 ptr:NaturalGasAndPipelineMember ifrs-full:EliminationOfIntersegmentAmountsMember 2020-01-01 2020-12-31 0001108329 ptr:MarketingMember ifrs-full:EliminationOfIntersegmentAmountsMember 2020-01-01 2020-12-31 0001108329 ptr:RefiningAndChemicalsMember ifrs-full:EliminationOfIntersegmentAmountsMember 2020-01-01 2020-12-31 0001108329 ptr:ExplorationAndProductionMember ifrs-full:EliminationOfIntersegmentAmountsMember 2020-01-01 2020-12-31 0001108329 ifrs-full:OperatingSegmentsMember 2020-01-01 2020-12-31 0001108329 ptr:HeadOfficeAndOtherMember ifrs-full:OperatingSegmentsMember 2020-01-01 2020-12-31 0001108329 ptr:NaturalGasAndPipelineMember ifrs-full:OperatingSegmentsMember 2020-01-01 2020-12-31 0001108329 ptr:MarketingMember ifrs-full:OperatingSegmentsMember 2020-01-01 2020-12-31 0001108329 ptr:RefiningAndChemicalsMember ifrs-full:OperatingSegmentsMember 2020-01-01 2020-12-31 0001108329 ptr:ExplorationAndProductionMember ifrs-full:OperatingSegmentsMember 2020-01-01 2020-12-31 0001108329 ptr:HeadOfficeAndOtherMember 2020-01-01 2020-12-31 0001108329 ptr:NaturalGasAndPipelineMember 2020-01-01 2020-12-31 0001108329 srt:NaturalGasReservesMember ptr:ConsolidatedEntitiesMember 2020-01-01 2020-12-31 0001108329 ptr:RefiningAndChemicalsMember ifrs-full:OperatingSegmentsMember ptr:RefinedProductsMember 2020-01-01 2020-12-31 0001108329 ptr:MarketingMember ifrs-full:OperatingSegmentsMember ptr:RefinedProductsMember 2020-01-01 2020-12-31 0001108329 ptr:RefiningAndChemicalsMember ifrs-full:OperatingSegmentsMember ptr:ChemicalProductsMember 2020-01-01 2020-12-31 0001108329 ptr:ChemicalProductsMember ifrs-full:OperatingSegmentsMember ptr:MarketingMember 2020-01-01 2020-12-31 0001108329 ptr:NaturalGasAndPipelineMember ifrs-full:OperatingSegmentsMember ptr:PipelineTransportationBusinessMember 2020-01-01 2020-12-31 0001108329 ptr:MarketingMember ifrs-full:OperatingSegmentsMember ptr:NonoilSalesInGasStationsMember 2020-01-01 2020-12-31 0001108329 ptr:ExplorationAndProductionMember ifrs-full:OperatingSegmentsMember ptr:OtherGoodsAndServicesMember 2020-01-01 2020-12-31 0001108329 ptr:RefiningAndChemicalsMember ifrs-full:OperatingSegmentsMember ptr:OtherGoodsAndServicesMember 2020-01-01 2020-12-31 0001108329 ptr:MarketingMember ifrs-full:OperatingSegmentsMember ptr:OtherGoodsAndServicesMember 2020-01-01 2020-12-31 0001108329 ptr:NaturalGasAndPipelineMember ifrs-full:OperatingSegmentsMember ptr:OtherGoodsAndServicesMember 2020-01-01 2020-12-31 0001108329 ptr:NaturalGasAndPipelineMember ptr:MainlandChinaMember 2020-01-01 2020-12-31 0001108329 ptr:ExplorationAndProductionMember ptr:OtherCountriesMember 2020-01-01 2020-12-31 0001108329 ptr:MarketingMember ptr:OtherCountriesMember 2020-01-01 2020-12-31 0001108329 srt:OilReservesMember ifrs-full:OperatingSegmentsMember ptr:ExplorationAndProductionMember 2020-01-01 2020-12-31 0001108329 ptr:MarketingMember ifrs-full:OperatingSegmentsMember srt:OilReservesMember 2020-01-01 2020-12-31 0001108329 srt:NaturalGasReservesMember ifrs-full:OperatingSegmentsMember ptr:ExplorationAndProductionMember 2020-01-01 2020-12-31 0001108329 srt:NaturalGasReservesMember ifrs-full:OperatingSegmentsMember ptr:MarketingMember 2020-01-01 2020-12-31 0001108329 ptr:NaturalGasAndPipelineMember ifrs-full:OperatingSegmentsMember srt:NaturalGasReservesMember 2020-01-01 2020-12-31 0001108329 ptr:MarketingMember ptr:MainlandChinaMember 2020-01-01 2020-12-31 0001108329 ptr:MainlandChinaMember ptr:RefiningAndChemicalsMember 2020-01-01 2020-12-31 0001108329 ptr:MainlandChinaMember ptr:ExplorationAndProductionMember 2020-01-01 2020-12-31 0001108329 ifrs-full:OperatingSegmentsMember srt:OilReservesMember 2020-01-01 2020-12-31 0001108329 ifrs-full:OperatingSegmentsMember srt:NaturalGasReservesMember 2020-01-01 2020-12-31 0001108329 ifrs-full:OperatingSegmentsMember ptr:RefinedProductsMember 2020-01-01 2020-12-31 0001108329 ifrs-full:OperatingSegmentsMember ptr:ChemicalProductsMember 2020-01-01 2020-12-31 0001108329 ifrs-full:OperatingSegmentsMember ptr:PipelineTransportationBusinessMember 2020-01-01 2020-12-31 0001108329 ptr:NonoilSalesInGasStationsMember ifrs-full:OperatingSegmentsMember 2020-01-01 2020-12-31 0001108329 ifrs-full:OperatingSegmentsMember ptr:OtherGoodsAndServicesMember 2020-01-01 2020-12-31 0001108329 ifrs-full:OperatingSegmentsMember ptr:HeadOfficeAndOtherMember ptr:OtherGoodsAndServicesMember 2020-01-01 2020-12-31 0001108329 ptr:MainlandChinaMember ptr:HeadOfficeAndOtherMember 2020-01-01 2020-12-31 0001108329 ptr:OtherCountriesMember ptr:HeadOfficeAndOtherMember 2020-01-01 2020-12-31 0001108329 ptr:OthersMember ifrs-full:BottomOfRangeMember 2020-01-01 2020-12-31 0001108329 ifrs-full:TopOfRangeMember ptr:OthersMember 2020-01-01 2020-12-31 0001108329 ifrs-full:AccumulatedDepreciationAndAmortisationMember ifrs-full:LandMember 2020-01-01 2020-12-31 0001108329 ifrs-full:AccumulatedDepreciationAndAmortisationMember ifrs-full:BuildingsMember 2020-01-01 2020-12-31 0001108329 ifrs-full:AccumulatedDepreciationAndAmortisationMember ifrs-full:MachineryMember 2020-01-01 2020-12-31 0001108329 ifrs-full:AccumulatedDepreciationAndAmortisationMember ifrs-full:OtherAssetsMember 2020-01-01 2020-12-31 0001108329 ifrs-full:AccumulatedDepreciationAndAmortisationMember 2020-01-01 2020-12-31 0001108329 ifrs-full:GrossCarryingAmountMember ifrs-full:OtherAssetsMember 2020-01-01 2020-12-31 0001108329 ifrs-full:MachineryMember ifrs-full:GrossCarryingAmountMember 2020-01-01 2020-12-31 0001108329 ifrs-full:BuildingsMember ifrs-full:GrossCarryingAmountMember 2020-01-01 2020-12-31 0001108329 ifrs-full:LandMember ifrs-full:GrossCarryingAmountMember 2020-01-01 2020-12-31 0001108329 ifrs-full:LaterThanTwoYearsAndNotLaterThanThreeYearsMember 2020-01-01 2020-12-31 0001108329 ifrs-full:LaterThanOneYearMember 2020-01-01 2020-12-31 0001108329 ifrs-full:NotLaterThanOneYearMember 2020-01-01 2020-12-31 0001108329 ifrs-full:CurrentMember 2020-01-01 2020-12-31 0001108329 ifrs-full:LaterThanThreeYearsMember 2020-01-01 2020-12-31 0001108329 ptr:InterimDividendsMember 2021-12-31 0001108329 ptr:FinalDividendsMember 2021-12-31 0001108329 ifrs-full:ConstructionInProgressMember 2021-12-31 0001108329 ifrs-full:GrossCarryingAmountMember 2021-12-31 0001108329 ifrs-full:AccumulatedImpairmentMember 2021-12-31 0001108329 ifrs-full:LaterThanThreeYearsMember 2021-12-31 0001108329 ifrs-full:LaterThanTwoYearsAndNotLaterThanThreeYearsMember 2021-12-31 0001108329 ifrs-full:LaterThanOneYearAndNotLaterThanTwoYearsMember 2021-12-31 0001108329 ifrs-full:NotLaterThanOneYearMember 2021-12-31 0001108329 ifrs-full:AtFairValueMember 2021-12-31 0001108329 ifrs-full:GuaranteesMember 2021-12-31 0001108329 ifrs-full:LaterThanTwoYearsAndNotLaterThanFiveYearsMember 2021-12-31 0001108329 ifrs-full:LaterThanFiveYearsMember 2021-12-31 0001108329 ptr:HSharesMember 2021-12-31 0001108329 ptr:ASharesMember 2021-12-31 0001108329 ifrs-full:GrossCarryingAmountMember ptr:ReceivablesAndInventoriesMember 2021-12-31 0001108329 ifrs-full:GrossCarryingAmountMember ifrs-full:UnusedTaxLossesMember 2021-12-31 0001108329 ifrs-full:GrossCarryingAmountMember ptr:ImpairmentDepreciationAndDepletionOfLongtermAssetsMember 2021-12-31 0001108329 ifrs-full:GrossCarryingAmountMember ptr:OtherDeferredTaxMember 2021-12-31 0001108329 ifrs-full:OtherEnvironmentRelatedContingentLiabilityMember 2021-12-31 0001108329 ifrs-full:LaterThanThreeYearsAndNotLaterThanFourYearsMember 2021-12-31 0001108329 ifrs-full:LaterThanFourYearsAndNotLaterThanFiveYearsMember 2021-12-31 0001108329 ptr:ConsolidatedEntitiesMember ptr:MainlandChinaMember srt:NaturalGasReservesMember 2021-12-31 0001108329 ptr:ConsolidatedEntitiesMember ptr:OtherCountriesMember srt:NaturalGasReservesMember 2021-12-31 0001108329 srt:NaturalGasReservesMember 2021-12-31 0001108329 ptr:ConsolidatedEntitiesMember ptr:OtherCountriesMember 2021-12-31 0001108329 ptr:ConsolidatedEntitiesMember ptr:MainlandChinaMember 2021-12-31 0001108329 ptr:PetroChinaHongKongLimitedMember 2021-12-31 0001108329 ptr:KunlunEnergyCompanyLimitedMember 2021-12-31 0001108329 ptr:DaqingOilfieldCompanyLimitedMember 2021-12-31 0001108329 ptr:CNPCExplorationAndDevelopmentCompanyLimitedMember 2021-12-31 0001108329 ptr:PetroChinaInternationalInvestmentCompanyLimitedMember 2021-12-31 0001108329 ptr:PetroChinaInternationalCompanyLimitedMember 2021-12-31 0001108329 ptr:PetrochinaSichuanPetrochemicalCompanyLimitedMember 2021-12-31 0001108329 ptr:AssociatesAndJointVenturesDisposalMember 2021-12-31 0001108329 ptr:ChinaMarineBunkerPetrochinaCoLtdMember 2021-12-31 0001108329 ptr:TransAsiaGasPipelineCoLtdMember 2021-12-31 0001108329 ptr:MangistauInvestmentBvMember 2021-12-31 0001108329 ptr:CNPCCaptiveInsuranceCoLtdMember 2021-12-31 0001108329 ptr:ChinaPetroleumFinanceCoLtdMember 2021-12-31 0001108329 ptr:PipeChinaMember 2021-12-31 0001108329 ifrs-full:BottomOfRangeMember 2021-12-31 0001108329 ifrs-full:TopOfRangeMember 2021-12-31 0001108329 srt:OilReservesMember 2021-12-31 0001108329 ptr:ConsolidatedEntitiesMember ptr:MainlandChinaMember srt:OilReservesMember 2021-12-31 0001108329 ptr:ConsolidatedEntitiesMember ptr:OtherCountriesMember srt:OilReservesMember 2021-12-31 0001108329 ptr:ChinaNationalPetroleumCorporationAndItsFellowSubsidiariesAssociatesAndJointVenturesMember 2021-12-31 0001108329 ifrs-full:GrossCarryingAmountMember ptr:AcceleratedTaxDepreciationMember 2021-12-31 0001108329 ptr:MortgageLoansMember 2021-12-31 0001108329 ptr:ConsolidatedEntitiesMember 2021-12-31 0001108329 ptr:ChengduHuaqiHoupuHoldingCoLtdMember 2021-12-31 0001108329 ptr:ChinaPacificInsuranceGroupCoLtdMember 2021-12-31 0001108329 ptr:OtherInvestmentCompanysMember 2021-12-31 0001108329 ptr:MainlandChinaMember 2021-12-31 0001108329 ptr:OtherCountriesMember 2021-12-31 0001108329 currency:CNY 2021-12-31 0001108329 currency:USD 2021-12-31 0001108329 ptr:OtherCurrencyMember 2021-12-31 0001108329 ifrs-full:GrossCarryingAmountMember ifrs-full:TechnologybasedIntangibleAssetsMember 2021-12-31 0001108329 ifrs-full:AccumulatedDepreciationAmortisationAndImpairmentMember ifrs-full:TechnologybasedIntangibleAssetsMember 2021-12-31 0001108329 ifrs-full:TechnologybasedIntangibleAssetsMember 2021-12-31 0001108329 ifrs-full:GrossCarryingAmountMember ifrs-full:ComputerSoftwareMember 2021-12-31 0001108329 ifrs-full:AccumulatedDepreciationAmortisationAndImpairmentMember ifrs-full:ComputerSoftwareMember 2021-12-31 0001108329 ifrs-full:ComputerSoftwareMember 2021-12-31 0001108329 ifrs-full:GrossCarryingAmountMember ifrs-full:GoodwillMember 2021-12-31 0001108329 ifrs-full:AccumulatedDepreciationAmortisationAndImpairmentMember ifrs-full:GoodwillMember 2021-12-31 0001108329 ifrs-full:GoodwillMember 2021-12-31 0001108329 ifrs-full:GrossCarryingAmountMember ifrs-full:OtherIntangibleAssetsMember 2021-12-31 0001108329 ifrs-full:AccumulatedDepreciationAmortisationAndImpairmentMember ifrs-full:OtherIntangibleAssetsMember 2021-12-31 0001108329 ifrs-full:OtherIntangibleAssetsMember 2021-12-31 0001108329 ifrs-full:AccumulatedDepreciationAmortisationAndImpairmentMember 2021-12-31 0001108329 ptr:EquityMethodInvesteeMember 2021-12-31 0001108329 ptr:ChinaOilGasPipingNetworkCorporationpipechinaMember 2021-12-31 0001108329 ptr:InterestFreeBorrowingsMember 2021-12-31 0001108329 ifrs-full:FixedInterestRateMember 2021-12-31 0001108329 ifrs-full:FloatingInterestRateMember 2021-12-31 0001108329 ptr:BankLoansMember ifrs-full:WeightedAverageMember 2021-12-31 0001108329 ptr:CorporateDebenturesMember ifrs-full:WeightedAverageMember 2021-12-31 0001108329 ptr:MediumTermNotes1Member ifrs-full:WeightedAverageMember 2021-12-31 0001108329 ptr:OtherLoansMember ifrs-full:WeightedAverageMember 2021-12-31 0001108329 srt:OilReservesMember ptr:ConsolidatedEntitiesMember 2021-12-31 0001108329 srt:NaturalGasReservesMember ptr:ConsolidatedEntitiesMember 2021-12-31 0001108329 ptr:ExplorationAndProductionMember 2021-12-31 0001108329 ptr:RefiningAndChemicalsMember 2021-12-31 0001108329 ptr:MarketingMember 2021-12-31 0001108329 ptr:NaturalGasAndPipelineMember 2021-12-31 0001108329 ptr:HeadOfficeAndOtherMember 2021-12-31 0001108329 ifrs-full:EliminationOfIntersegmentAmountsMember 2021-12-31 0001108329 ptr:ExplorationAndProductionMember ifrs-full:OperatingSegmentsMember 2021-12-31 0001108329 ptr:RefiningAndChemicalsMember ifrs-full:OperatingSegmentsMember 2021-12-31 0001108329 ptr:MarketingMember ifrs-full:OperatingSegmentsMember 2021-12-31 0001108329 ptr:NaturalGasAndPipelineMember ifrs-full:OperatingSegmentsMember 2021-12-31 0001108329 ptr:HeadOfficeAndOtherMember ifrs-full:OperatingSegmentsMember 2021-12-31 0001108329 ifrs-full:OperatingSegmentsMember 2021-12-31 0001108329 ptr:ASharesMember 2021-12-31 0001108329 ptr:HSharesMember 2021-12-31 0001108329 ifrs-full:LaterThanThreeYearsAndNotLaterThanFiveYearsMember 2021-12-31 0001108329 ptr:DerivativeFinancialLiabilitiesMember 2021-12-31 0001108329 ptr:BankLoansMember 2021-12-31 0001108329 ptr:CorporateDebenturesMember 2021-12-31 0001108329 ptr:MediumTermNotesMember 2021-12-31 0001108329 ptr:OtherLoansMember 2021-12-31 0001108329 ptr:ChinaPetroleumChemicalCorporationMember 2021-12-31 0001108329 ifrs-full:PropertyPlantAndEquipmentMember 2021-12-31 0001108329 ptr:IntangiblesAndOtherNoncurrentAssetsMember 2021-12-31 0001108329 ifrs-full:DerivativesMember ptr:AccountsReceivableMember ifrs-full:Level1OfFairValueHierarchyMember 2021-12-31 0001108329 ifrs-full:DerivativesMember ptr:AccountsReceivableMember ifrs-full:Level2OfFairValueHierarchyMember 2021-12-31 0001108329 ifrs-full:DerivativesMember ptr:AccountsReceivableMember 2021-12-31 0001108329 ptr:BillsReceivableMember ifrs-full:FinancialAssetsMeasuredAtFairValueThroughOtherComprehensiveIncomeCategoryMember ifrs-full:Level3OfFairValueHierarchyMember 2021-12-31 0001108329 ptr:BillsReceivableMember ifrs-full:FinancialAssetsMeasuredAtFairValueThroughOtherComprehensiveIncomeCategoryMember 2021-12-31 0001108329 ptr:OtherInvestmentsMember ifrs-full:FinancialAssetsMeasuredAtFairValueThroughOtherComprehensiveIncomeCategoryMember ifrs-full:Level1OfFairValueHierarchyMember 2021-12-31 0001108329 ptr:OtherInvestmentsMember ifrs-full:FinancialAssetsMeasuredAtFairValueThroughOtherComprehensiveIncomeCategoryMember ifrs-full:Level3OfFairValueHierarchyMember 2021-12-31 0001108329 ptr:OtherInvestmentsMember ifrs-full:FinancialAssetsMeasuredAtFairValueThroughOtherComprehensiveIncomeCategoryMember 2021-12-31 0001108329 ifrs-full:FinancialAssetsMeasuredAtFairValueThroughOtherComprehensiveIncomeCategoryMember ifrs-full:Level1OfFairValueHierarchyMember 2021-12-31 0001108329 ifrs-full:FinancialAssetsMeasuredAtFairValueThroughOtherComprehensiveIncomeCategoryMember ifrs-full:Level2OfFairValueHierarchyMember 2021-12-31 0001108329 ifrs-full:FinancialAssetsMeasuredAtFairValueThroughOtherComprehensiveIncomeCategoryMember ifrs-full:Level3OfFairValueHierarchyMember 2021-12-31 0001108329 ifrs-full:FinancialAssetsMeasuredAtFairValueThroughOtherComprehensiveIncomeCategoryMember 2021-12-31 0001108329 ifrs-full:Level1OfFairValueHierarchyMember ptr:AccountsPayableAndAccruedLiabilitiesMember ifrs-full:DerivativesMember 2021-12-31 0001108329 ifrs-full:DerivativesMember ptr:AccountsPayableAndAccruedLiabilitiesMember ifrs-full:Level2OfFairValueHierarchyMember 2021-12-31 0001108329 ifrs-full:DerivativesMember ptr:AccountsPayableAndAccruedLiabilitiesMember 2021-12-31 0001108329 ptr:AccountsPayableAndAccruedLiabilitiesMember ifrs-full:Level1OfFairValueHierarchyMember 2021-12-31 0001108329 ptr:AccountsPayableAndAccruedLiabilitiesMember ifrs-full:Level2OfFairValueHierarchyMember 2021-12-31 0001108329 ptr:AccountsPayableAndAccruedLiabilitiesMember 2021-12-31 0001108329 ifrs-full:CurrentMember 2021-12-31 0001108329 ifrs-full:NotLaterThanOneYearMember 2021-12-31 0001108329 ifrs-full:LaterThanOneYearMember 2021-12-31 0001108329 ifrs-full:LaterThanTwoYearsAndNotLaterThanThreeYearsMember 2021-12-31 0001108329 ifrs-full:LaterThanThreeYearsMember 2021-12-31 0001108329 ptr:OilAndGasPropertiesMember ptr:ExplorationAndProductionMember 2021-01-01 2021-12-31 0001108329 ptr:PipeChinaMember 2021-01-01 2021-12-31 0001108329 ptr:CNPCCaptiveInsuranceCoLtdMember 2021-01-01 2021-12-31 0001108329 ptr:ChinaPetroleumFinanceCoLtdMember 2021-01-01 2021-12-31 0001108329 ptr:ChinaMarineBunkerPetrochinaCoLtdMember 2021-01-01 2021-12-31 0001108329 ptr:MangistauInvestmentBvMember 2021-01-01 2021-12-31 0001108329 ptr:AssociatesAndJointVenturesMember 2021-01-01 2021-12-31 0001108329 ptr:DaqingOilfieldCompanyLimitedMember 2021-01-01 2021-12-31 0001108329 ptr:CNPCExplorationAndDevelopmentCompanyLimitedMember 2021-01-01 2021-12-31 0001108329 ptr:PetroChinaHongKongLimitedMember 2021-01-01 2021-12-31 0001108329 ptr:PetroChinaInternationalInvestmentCompanyLimitedMember 2021-01-01 2021-12-31 0001108329 ptr:PetroChinaInternationalCompanyLimitedMember 2021-01-01 2021-12-31 0001108329 ptr:PetrochinaSichuanPetrochemicalCompanyLimitedMember 2021-01-01 2021-12-31 0001108329 ptr:KunlunEnergyCompanyLimitedMember 2021-01-01 2021-12-31 0001108329 ifrs-full:SubsidiariesMember 2021-01-01 2021-12-31 0001108329 ifrs-full:ExplorationAndEvaluationAssetsMember ifrs-full:ConstructionInProgressMember 2021-01-01 2021-12-31 0001108329 ifrs-full:BuildingsMember ifrs-full:GrossCarryingAmountMember 2021-01-01 2021-12-31 0001108329 ifrs-full:OilAndGasAssetsMember ifrs-full:GrossCarryingAmountMember 2021-01-01 2021-12-31 0001108329 ptr:EquipmentAndMachineryMember ifrs-full:GrossCarryingAmountMember 2021-01-01 2021-12-31 0001108329 ifrs-full:MotorVehiclesMember ifrs-full:GrossCarryingAmountMember 2021-01-01 2021-12-31 0001108329 ifrs-full:OtherPropertyPlantAndEquipmentMember ifrs-full:GrossCarryingAmountMember 2021-01-01 2021-12-31 0001108329 ifrs-full:GrossCarryingAmountMember ifrs-full:ConstructionInProgressMember 2021-01-01 2021-12-31 0001108329 ifrs-full:GrossCarryingAmountMember 2021-01-01 2021-12-31 0001108329 ifrs-full:TopOfRangeMember ifrs-full:BuildingsMember 2021-01-01 2021-12-31 0001108329 ifrs-full:TopOfRangeMember ptr:EquipmentAndMachineryMember 2021-01-01 2021-12-31 0001108329 ifrs-full:TopOfRangeMember ifrs-full:MotorVehiclesMember 2021-01-01 2021-12-31 0001108329 ifrs-full:TopOfRangeMember ifrs-full:OtherPropertyPlantAndEquipmentMember 2021-01-01 2021-12-31 0001108329 ifrs-full:BottomOfRangeMember ifrs-full:BuildingsMember 2021-01-01 2021-12-31 0001108329 ifrs-full:BottomOfRangeMember ptr:EquipmentAndMachineryMember 2021-01-01 2021-12-31 0001108329 ifrs-full:BottomOfRangeMember ifrs-full:MotorVehiclesMember 2021-01-01 2021-12-31 0001108329 ifrs-full:BottomOfRangeMember ifrs-full:OtherPropertyPlantAndEquipmentMember 2021-01-01 2021-12-31 0001108329 ptr:SupervisorsMember 2021-01-01 2021-12-31 0001108329 ptr:SeniorManagementsMember 2021-01-01 2021-12-31 0001108329 ifrs-full:BuildingsMember ifrs-full:AccumulatedDepreciationAmortisationAndImpairmentMember 2021-01-01 2021-12-31 0001108329 ifrs-full:OilAndGasAssetsMember ifrs-full:AccumulatedDepreciationAmortisationAndImpairmentMember 2021-01-01 2021-12-31 0001108329 ptr:EquipmentAndMachineryMember ifrs-full:AccumulatedDepreciationAmortisationAndImpairmentMember 2021-01-01 2021-12-31 0001108329 ifrs-full:AccumulatedDepreciationAmortisationAndImpairmentMember ifrs-full:MotorVehiclesMember 2021-01-01 2021-12-31 0001108329 ifrs-full:OtherPropertyPlantAndEquipmentMember ifrs-full:AccumulatedDepreciationAmortisationAndImpairmentMember 2021-01-01 2021-12-31 0001108329 ifrs-full:AccumulatedDepreciationAmortisationAndImpairmentMember 2021-01-01 2021-12-31 0001108329 ptr:AssociatesAndJointVenturesDisposalMember 2021-01-01 2021-12-31 0001108329 ptr:ExplorationAndProductionLicensesMember 2021-01-01 2021-12-31 0001108329 ptr:ChinaNationalPetroleumCorporationAndItsFellowSubsidiariesAssociatesAndJointVenturesMember 2021-01-01 2021-12-31 0001108329 ptr:MainlandChinaMember 2021-01-01 2021-12-31 0001108329 ptr:OtherCountriesMember 2021-01-01 2021-12-31 0001108329 ptr:ConsolidatedEntitiesMember 2021-01-01 2021-12-31 0001108329 ptr:AggregatedIndividuallyImmaterialAssociatesAndJointVenturesMember 2021-01-01 2021-12-31 0001108329 ifrs-full:BuildingsMember 2021-01-01 2021-12-31 0001108329 ifrs-full:MotorVehiclesMember 2021-01-01 2021-12-31 0001108329 ifrs-full:OtherPropertyPlantAndEquipmentMember 2021-01-01 2021-12-31 0001108329 ptr:SeniorManagementFourMember 2021-01-01 2021-12-31 0001108329 ptr:SeniorManagementOneMember 2021-01-01 2021-12-31 0001108329 ptr:SeniorManagementTwoMember 2021-01-01 2021-12-31 0001108329 ptr:SeniorManagementThirdMember 2021-01-01 2021-12-31 0001108329 ptr:CnpcAndItsFellowSubsidiariesMember 2021-01-01 2021-12-31 0001108329 ptr:ChinaPetroleumChemicalCorporationAndItsFellowSubsidiariesMember 2021-01-01 2021-12-31 0001108329 ifrs-full:MajorCustomersMember 2021-01-01 2021-12-31 0001108329 ifrs-full:StatutoryReserveMember 2021-01-01 2021-12-31 0001108329 ifrs-full:NoncontrollingInterestsMember 2021-01-01 2021-12-31 0001108329 ifrs-full:EquityAttributableToOwnersOfParentMember 2021-01-01 2021-12-31 0001108329 ifrs-full:RetainedEarningsMember 2021-01-01 2021-12-31 0001108329 ifrs-full:ConstructionInProgressMember ifrs-full:AccumulatedDepreciationAmortisationAndImpairmentMember 2021-01-01 2021-12-31 0001108329 ptr:OthersMember 2021-01-01 2021-12-31 0001108329 ifrs-full:ReserveOfDiscretionaryParticipationFeaturesMember 2021-01-01 2021-12-31 0001108329 ptr:ElsieLeungOisieMember ptr:NonExecutiveDirectorsMember 2021-01-01 2021-12-31 0001108329 ptr:NonExecutiveDirectorsMember ptr:TokuchiTatsuhitoMember 2021-01-01 2021-12-31 0001108329 ptr:SimonHenryMember ptr:NonExecutiveDirectorsMember 2021-01-01 2021-12-31 0001108329 ptr:NonExecutiveDirectorsMember 2021-01-01 2021-12-31 0001108329 ptr:DirectorsAndSupervisorsMember 2021-01-01 2021-12-31 0001108329 ptr:NonExecutiveDirectorsMember ptr:Mr.CaiJinyongMember 2021-01-01 2021-12-31 0001108329 ptr:NonExecutiveDirectorsMember ptr:Mr.JiangXiaomingMember 2021-01-01 2021-12-31 0001108329 ifrs-full:OtherReservesMember 2021-01-01 2021-12-31 0001108329 ptr:MainlandChinaMember ptr:ConsolidatedEntitiesMember 2021-01-01 2021-12-31 0001108329 ptr:OtherCountriesMember ptr:ConsolidatedEntitiesMember 2021-01-01 2021-12-31 0001108329 srt:OilReservesMember ptr:ConsolidatedEntitiesMember 2021-01-01 2021-12-31 0001108329 ifrs-full:ReserveOfExchangeDifferencesOnTranslationMember 2021-01-01 2021-12-31 0001108329 ptr:ExecutiveDirectorMember ptr:Mr.HuangYongzhangMember 2021-01-01 2021-12-31 0001108329 ptr:Mr.RenLixinMember ptr:ExecutiveDirectorMember 2021-01-01 2021-12-31 0001108329 ptr:ExecutiveDirectorMember 2021-01-01 2021-12-31 0001108329 ptr:DuanLiangweiMember ptr:ExecutiveDirectorMember 2021-01-01 2021-12-31 0001108329 ptr:FuSuotangMember ptr:SupervisorsMember 2021-01-01 2021-12-31 0001108329 ptr:LiJiaminMember ptr:SupervisorsMember 2021-01-01 2021-12-31 0001108329 ptr:SupervisorsMember ptr:LiWendongMember 2021-01-01 2021-12-31 0001108329 ptr:LiuXianhuaMember ptr:SupervisorsMember 2021-01-01 2021-12-31 0001108329 ptr:ChinaOilGasPipingNetworkCorporationpipechinaMember 2021-01-01 2021-12-31 0001108329 ptr:TransAsiaGasPipelineCoLtdMember 2021-01-01 2021-12-31 0001108329 ptr:OtherMiscellaneousReservesMember 2021-01-01 2021-12-31 0001108329 ptr:LinBoqiangMember ptr:NonExecutiveDirectorsMember 2021-01-01 2021-12-31 0001108329 ptr:ZhangBiyiMember ptr:NonExecutiveDirectorsMember 2021-01-01 2021-12-31 0001108329 ptr:OtherCountriesMember ptr:EquityMethodInvesteeMember 2021-01-01 2021-12-31 0001108329 ptr:EquityMethodInvesteeMember 2021-01-01 2021-12-31 0001108329 ptr:MainlandChinaMember 2021-01-01 2021-12-31 0001108329 ptr:OtherCountriesMember 2021-01-01 2021-12-31 0001108329 ptr:ExplorationAndProductionMember ifrs-full:OperatingSegmentsMember 2021-01-01 2021-12-31 0001108329 ptr:RefiningAndChemicalsMember ifrs-full:OperatingSegmentsMember 2021-01-01 2021-12-31 0001108329 ptr:MarketingMember ifrs-full:OperatingSegmentsMember 2021-01-01 2021-12-31 0001108329 ptr:NaturalGasAndPipelineMember ifrs-full:OperatingSegmentsMember 2021-01-01 2021-12-31 0001108329 ptr:HeadOfficeAndOtherMember ifrs-full:OperatingSegmentsMember 2021-01-01 2021-12-31 0001108329 ifrs-full:OperatingSegmentsMember 2021-01-01 2021-12-31 0001108329 ptr:ExplorationAndProductionMember ifrs-full:EliminationOfIntersegmentAmountsMember 2021-01-01 2021-12-31 0001108329 ptr:RefiningAndChemicalsMember ifrs-full:EliminationOfIntersegmentAmountsMember 2021-01-01 2021-12-31 0001108329 ptr:MarketingMember ifrs-full:EliminationOfIntersegmentAmountsMember 2021-01-01 2021-12-31 0001108329 ptr:NaturalGasAndPipelineMember ifrs-full:EliminationOfIntersegmentAmountsMember 2021-01-01 2021-12-31 0001108329 ptr:HeadOfficeAndOtherMember ifrs-full:EliminationOfIntersegmentAmountsMember 2021-01-01 2021-12-31 0001108329 ifrs-full:EliminationOfIntersegmentAmountsMember 2021-01-01 2021-12-31 0001108329 ptr:ExplorationAndProductionMember 2021-01-01 2021-12-31 0001108329 ptr:RefiningAndChemicalsMember 2021-01-01 2021-12-31 0001108329 ptr:MarketingMember 2021-01-01 2021-12-31 0001108329 ptr:NaturalGasAndPipelineMember 2021-01-01 2021-12-31 0001108329 ptr:HeadOfficeAndOtherMember 2021-01-01 2021-12-31 0001108329 srt:NaturalGasReservesMember ptr:ConsolidatedEntitiesMember 2021-01-01 2021-12-31 0001108329 ifrs-full:OperatingSegmentsMember ptr:RefiningAndChemicalsMember ptr:ChemicalProductsMember 2021-01-01 2021-12-31 0001108329 ifrs-full:OperatingSegmentsMember ptr:MarketingMember ptr:ChemicalProductsMember 2021-01-01 2021-12-31 0001108329 ifrs-full:OperatingSegmentsMember ptr:ChemicalProductsMember 2021-01-01 2021-12-31 0001108329 ifrs-full:OperatingSegmentsMember ptr:NaturalGasAndPipelineMember ptr:PipelineTransportationBusinessMember 2021-01-01 2021-12-31 0001108329 ifrs-full:OperatingSegmentsMember ptr:PipelineTransportationBusinessMember 2021-01-01 2021-12-31 0001108329 ptr:NonoilSalesInGasStationsMember ptr:MarketingMember ifrs-full:OperatingSegmentsMember 2021-01-01 2021-12-31 0001108329 ifrs-full:OperatingSegmentsMember ptr:NonoilSalesInGasStationsMember 2021-01-01 2021-12-31 0001108329 ifrs-full:OperatingSegmentsMember ptr:ExplorationAndProductionMember ptr:OtherGoodsAndServicesMember 2021-01-01 2021-12-31 0001108329 ifrs-full:OperatingSegmentsMember ptr:RefiningAndChemicalsMember ptr:OtherGoodsAndServicesMember 2021-01-01 2021-12-31 0001108329 ifrs-full:OperatingSegmentsMember ptr:MarketingMember ptr:OtherGoodsAndServicesMember 2021-01-01 2021-12-31 0001108329 ifrs-full:OperatingSegmentsMember ptr:NaturalGasAndPipelineMember ptr:OtherGoodsAndServicesMember 2021-01-01 2021-12-31 0001108329 ptr:OtherGoodsAndServicesMember ptr:HeadOfficeAndOtherMember ifrs-full:OperatingSegmentsMember 2021-01-01 2021-12-31 0001108329 ifrs-full:OperatingSegmentsMember ptr:OtherGoodsAndServicesMember 2021-01-01 2021-12-31 0001108329 ptr:MainlandChinaMember ptr:ExplorationAndProductionMember 2021-01-01 2021-12-31 0001108329 ptr:RefiningAndChemicalsMember ptr:MainlandChinaMember 2021-01-01 2021-12-31 0001108329 ptr:MarketingMember ptr:MainlandChinaMember 2021-01-01 2021-12-31 0001108329 ptr:NaturalGasAndPipelineMember ptr:MainlandChinaMember 2021-01-01 2021-12-31 0001108329 ptr:HeadOfficeAndOtherMember ptr:MainlandChinaMember 2021-01-01 2021-12-31 0001108329 ptr:OtherCountriesMember ptr:ExplorationAndProductionMember 2021-01-01 2021-12-31 0001108329 ptr:MarketingMember ptr:OtherCountriesMember 2021-01-01 2021-12-31 0001108329 ifrs-full:OperatingSegmentsMember ptr:ExplorationAndProductionMember srt:OilReservesMember 2021-01-01 2021-12-31 0001108329 srt:OilReservesMember ptr:MarketingMember ifrs-full:OperatingSegmentsMember 2021-01-01 2021-12-31 0001108329 ifrs-full:OperatingSegmentsMember srt:OilReservesMember 2021-01-01 2021-12-31 0001108329 ifrs-full:OperatingSegmentsMember ptr:ExplorationAndProductionMember srt:NaturalGasReservesMember 2021-01-01 2021-12-31 0001108329 ifrs-full:OperatingSegmentsMember ptr:MarketingMember srt:NaturalGasReservesMember 2021-01-01 2021-12-31 0001108329 ifrs-full:OperatingSegmentsMember ptr:NaturalGasAndPipelineMember srt:NaturalGasReservesMember 2021-01-01 2021-12-31 0001108329 ifrs-full:OperatingSegmentsMember srt:NaturalGasReservesMember 2021-01-01 2021-12-31 0001108329 ifrs-full:OperatingSegmentsMember ptr:RefiningAndChemicalsMember ptr:RefinedProductsMember 2021-01-01 2021-12-31 0001108329 ifrs-full:OperatingSegmentsMember ptr:MarketingMember ptr:RefinedProductsMember 2021-01-01 2021-12-31 0001108329 ifrs-full:OperatingSegmentsMember ptr:RefinedProductsMember 2021-01-01 2021-12-31 0001108329 dei:AdrMember 2021-01-01 2021-12-31 0001108329 ptr:HSharesMember 2021-01-01 2021-12-31 0001108329 dei:BusinessContactMember 2021-01-01 2021-12-31 0001108329 ptr:OthersMember ifrs-full:BottomOfRangeMember 2021-01-01 2021-12-31 0001108329 ptr:OthersMember ifrs-full:TopOfRangeMember 2021-01-01 2021-12-31 0001108329 ifrs-full:MachineryMember ifrs-full:GrossCarryingAmountMember 2021-01-01 2021-12-31 0001108329 ifrs-full:OtherAssetsMember ifrs-full:GrossCarryingAmountMember 2021-01-01 2021-12-31 0001108329 ifrs-full:BuildingsMember ifrs-full:GrossCarryingAmountMember 2021-01-01 2021-12-31 0001108329 ifrs-full:LandMember ifrs-full:GrossCarryingAmountMember 2021-01-01 2021-12-31 0001108329 ifrs-full:AccumulatedDepreciationAndAmortisationMember 2021-01-01 2021-12-31 0001108329 ifrs-full:AccumulatedDepreciationAndAmortisationMember ifrs-full:OtherAssetsMember 2021-01-01 2021-12-31 0001108329 ifrs-full:AccumulatedDepreciationAndAmortisationMember ifrs-full:MachineryMember 2021-01-01 2021-12-31 0001108329 ifrs-full:AccumulatedDepreciationAndAmortisationMember ifrs-full:BuildingsMember 2021-01-01 2021-12-31 0001108329 ifrs-full:AccumulatedDepreciationAndAmortisationMember ifrs-full:LandMember 2021-01-01 2021-12-31 0001108329 ptr:MainlandChinaMember ptr:EquityMethodInvesteeMember 2021-01-01 2021-12-31 0001108329 ifrs-full:LaterThanThreeYearsMember 2021-01-01 2021-12-31 0001108329 ifrs-full:LaterThanTwoYearsAndNotLaterThanThreeYearsMember 2021-01-01 2021-12-31 0001108329 ifrs-full:LaterThanOneYearMember 2021-01-01 2021-12-31 0001108329 ifrs-full:NotLaterThanOneYearMember 2021-01-01 2021-12-31 0001108329 ifrs-full:CurrentMember 2021-01-01 2021-12-31 0001108329 ptr:InterimDividendsMember 2020-12-31 0001108329 ptr:FinalDividendsMember 2020-12-31 0001108329 ifrs-full:ConstructionInProgressMember 2020-12-31 0001108329 ifrs-full:GrossCarryingAmountMember 2020-12-31 0001108329 ifrs-full:AccumulatedImpairmentMember 2020-12-31 0001108329 ifrs-full:LaterThanThreeYearsMember 2020-12-31 0001108329 ifrs-full:LaterThanTwoYearsAndNotLaterThanThreeYearsMember 2020-12-31 0001108329 ifrs-full:LaterThanOneYearAndNotLaterThanTwoYearsMember 2020-12-31 0001108329 ifrs-full:NotLaterThanOneYearMember 2020-12-31 0001108329 ifrs-full:AtFairValueMember 2020-12-31 0001108329 ifrs-full:GuaranteesMember 2020-12-31 0001108329 ifrs-full:LaterThanTwoYearsAndNotLaterThanFiveYearsMember 2020-12-31 0001108329 ifrs-full:LaterThanFiveYearsMember 2020-12-31 0001108329 ptr:HSharesMember 2020-12-31 0001108329 ptr:ASharesMember 2020-12-31 0001108329 ifrs-full:GrossCarryingAmountMember ptr:ReceivablesAndInventoriesMember 2020-12-31 0001108329 ifrs-full:GrossCarryingAmountMember ifrs-full:UnusedTaxLossesMember 2020-12-31 0001108329 ifrs-full:GrossCarryingAmountMember ptr:ImpairmentDepreciationAndDepletionOfLongtermAssetsMember 2020-12-31 0001108329 ifrs-full:GrossCarryingAmountMember ptr:OtherDeferredTaxMember 2020-12-31 0001108329 ifrs-full:LaterThanThreeYearsAndNotLaterThanFourYearsMember 2020-12-31 0001108329 ifrs-full:LaterThanFourYearsAndNotLaterThanFiveYearsMember 2020-12-31 0001108329 ptr:ConsolidatedEntitiesMember ptr:MainlandChinaMember srt:NaturalGasReservesMember 2020-12-31 0001108329 ptr:ConsolidatedEntitiesMember ptr:OtherCountriesMember srt:NaturalGasReservesMember 2020-12-31 0001108329 srt:NaturalGasReservesMember 2020-12-31 0001108329 ptr:ConsolidatedEntitiesMember ptr:OtherCountriesMember 2020-12-31 0001108329 ptr:ConsolidatedEntitiesMember ptr:MainlandChinaMember 2020-12-31 0001108329 ptr:AssociatesAndJointVenturesDisposalMember 2020-12-31 0001108329 ptr:TransAsiaGasPipelineCoLtdMember 2020-12-31 0001108329 ptr:MangistauInvestmentBvMember 2020-12-31 0001108329 ptr:ChinaMarineBunkerPetrochinaCoLtdMember 2020-12-31 0001108329 ptr:CNPCCaptiveInsuranceCoLtdMember 2020-12-31 0001108329 ptr:ChinaPetroleumFinanceCoLtdMember 2020-12-31 0001108329 ptr:PipeChinaMember 2020-12-31 0001108329 ifrs-full:BottomOfRangeMember 2020-12-31 0001108329 ifrs-full:TopOfRangeMember 2020-12-31 0001108329 srt:OilReservesMember 2020-12-31 0001108329 ptr:ConsolidatedEntitiesMember ptr:MainlandChinaMember srt:OilReservesMember 2020-12-31 0001108329 ptr:ConsolidatedEntitiesMember ptr:OtherCountriesMember srt:OilReservesMember 2020-12-31 0001108329 ptr:ChinaNationalPetroleumCorporationAndItsFellowSubsidiariesAssociatesAndJointVenturesMember 2020-12-31 0001108329 ifrs-full:GrossCarryingAmountMember ptr:AcceleratedTaxDepreciationMember 2020-12-31 0001108329 ptr:MortgageLoansMember 2020-12-31 0001108329 ptr:CNPCExplorationAndDevelopmentCompanyLimitedMember 2020-12-31 0001108329 ptr:PetrochinaSichuanPetrochemicalCompanyLimitedMember 2020-12-31 0001108329 ptr:ConsolidatedEntitiesMember 2020-12-31 0001108329 ptr:ChengduHuaqiHoupuHoldingCoLtdMember 2020-12-31 0001108329 ptr:ChinaPacificInsuranceGroupCoLtdMember 2020-12-31 0001108329 ptr:OtherInvestmentCompanysMember 2020-12-31 0001108329 ptr:MainlandChinaMember 2020-12-31 0001108329 ptr:OtherCountriesMember 2020-12-31 0001108329 currency:CNY 2020-12-31 0001108329 currency:USD 2020-12-31 0001108329 ptr:OtherCurrencyMember 2020-12-31 0001108329 ifrs-full:GrossCarryingAmountMember ifrs-full:TechnologybasedIntangibleAssetsMember 2020-12-31 0001108329 ifrs-full:AccumulatedDepreciationAmortisationAndImpairmentMember ifrs-full:TechnologybasedIntangibleAssetsMember 2020-12-31 0001108329 ifrs-full:TechnologybasedIntangibleAssetsMember 2020-12-31 0001108329 ifrs-full:GrossCarryingAmountMember ifrs-full:ComputerSoftwareMember 2020-12-31 0001108329 ifrs-full:AccumulatedDepreciationAmortisationAndImpairmentMember ifrs-full:ComputerSoftwareMember 2020-12-31 0001108329 ifrs-full:ComputerSoftwareMember 2020-12-31 0001108329 ifrs-full:GoodwillMember ifrs-full:GrossCarryingAmountMember 2020-12-31 0001108329 ifrs-full:AccumulatedDepreciationAmortisationAndImpairmentMember ifrs-full:GoodwillMember 2020-12-31 0001108329 ifrs-full:GoodwillMember 2020-12-31 0001108329 ifrs-full:GrossCarryingAmountMember ifrs-full:OtherIntangibleAssetsMember 2020-12-31 0001108329 ifrs-full:AccumulatedDepreciationAmortisationAndImpairmentMember ifrs-full:OtherIntangibleAssetsMember 2020-12-31 0001108329 ifrs-full:OtherIntangibleAssetsMember 2020-12-31 0001108329 ifrs-full:AccumulatedDepreciationAmortisationAndImpairmentMember 2020-12-31 0001108329 ptr:EquityMethodInvesteeMember 2020-12-31 0001108329 ptr:InterestFreeBorrowingsMember 2020-12-31 0001108329 ifrs-full:FixedInterestRateMember 2020-12-31 0001108329 ifrs-full:FloatingInterestRateMember 2020-12-31 0001108329 ptr:BankLoansMember ifrs-full:WeightedAverageMember 2020-12-31 0001108329 ptr:CorporateDebenturesMember ifrs-full:WeightedAverageMember 2020-12-31 0001108329 ptr:MediumTermNotes1Member ifrs-full:WeightedAverageMember 2020-12-31 0001108329 ptr:OtherLoansMember ifrs-full:WeightedAverageMember 2020-12-31 0001108329 srt:OilReservesMember ptr:ConsolidatedEntitiesMember 2020-12-31 0001108329 srt:NaturalGasReservesMember ptr:ConsolidatedEntitiesMember 2020-12-31 0001108329 ptr:ExplorationAndProductionMember 2020-12-31 0001108329 ptr:RefiningAndChemicalsMember 2020-12-31 0001108329 ptr:MarketingMember 2020-12-31 0001108329 ptr:NaturalGasAndPipelineMember 2020-12-31 0001108329 ptr:HeadOfficeAndOtherMember 2020-12-31 0001108329 ifrs-full:EliminationOfIntersegmentAmountsMember 2020-12-31 0001108329 ptr:RefiningAndChemicalsMember ifrs-full:OperatingSegmentsMember 2020-12-31 0001108329 ptr:MarketingMember ifrs-full:OperatingSegmentsMember 2020-12-31 0001108329 ptr:NaturalGasAndPipelineMember ifrs-full:OperatingSegmentsMember 2020-12-31 0001108329 ptr:HeadOfficeAndOtherMember ifrs-full:OperatingSegmentsMember 2020-12-31 0001108329 ifrs-full:OperatingSegmentsMember 2020-12-31 0001108329 ptr:ExplorationAndProductionMember ifrs-full:OperatingSegmentsMember 2020-12-31 0001108329 ifrs-full:LaterThanThreeYearsAndNotLaterThanFiveYearsMember 2020-12-31 0001108329 ifrs-full:PropertyPlantAndEquipmentMember 2020-12-31 0001108329 ptr:ShortTermAndLongTermBorrowingsMember 2020-12-31 0001108329 ptr:AccountsPayableAndOtherPayablesMember 2020-12-31 0001108329 ptr:DerivativeFinancialLiabilitiesMember 2020-12-31 0001108329 ifrs-full:OtherEnvironmentRelatedContingentLiabilityMember 2020-12-31 0001108329 ptr:BankLoansMember 2020-12-31 0001108329 ptr:CorporateDebenturesMember 2020-12-31 0001108329 ptr:MediumTermNotesMember 2020-12-31 0001108329 ptr:OtherLoansMember 2020-12-31 0001108329 ptr:ChinaPetroleumChemicalCorporationMember 2020-12-31 0001108329 ifrs-full:DerivativesMember ptr:AccountsReceivableMember ifrs-full:Level1OfFairValueHierarchyMember 2020-12-31 0001108329 ifrs-full:DerivativesMember ptr:AccountsReceivableMember ifrs-full:Level2OfFairValueHierarchyMember 2020-12-31 0001108329 ifrs-full:DerivativesMember ptr:AccountsReceivableMember 2020-12-31 0001108329 ptr:BillsReceivableMember ifrs-full:FinancialAssetsMeasuredAtFairValueThroughOtherComprehensiveIncomeCategoryMember ifrs-full:Level3OfFairValueHierarchyMember 2020-12-31 0001108329 ptr:BillsReceivableMember ifrs-full:FinancialAssetsMeasuredAtFairValueThroughOtherComprehensiveIncomeCategoryMember 2020-12-31 0001108329 ptr:OtherInvestmentsMember ifrs-full:FinancialAssetsMeasuredAtFairValueThroughOtherComprehensiveIncomeCategoryMember ifrs-full:Level1OfFairValueHierarchyMember 2020-12-31 0001108329 ptr:OtherInvestmentsMember ifrs-full:FinancialAssetsMeasuredAtFairValueThroughOtherComprehensiveIncomeCategoryMember ifrs-full:Level3OfFairValueHierarchyMember 2020-12-31 0001108329 ptr:OtherInvestmentsMember ifrs-full:FinancialAssetsMeasuredAtFairValueThroughOtherComprehensiveIncomeCategoryMember 2020-12-31 0001108329 ifrs-full:FinancialAssetsMeasuredAtFairValueThroughOtherComprehensiveIncomeCategoryMember ifrs-full:Level1OfFairValueHierarchyMember 2020-12-31 0001108329 ifrs-full:FinancialAssetsMeasuredAtFairValueThroughOtherComprehensiveIncomeCategoryMember ifrs-full:Level2OfFairValueHierarchyMember 2020-12-31 0001108329 ifrs-full:FinancialAssetsMeasuredAtFairValueThroughOtherComprehensiveIncomeCategoryMember ifrs-full:Level3OfFairValueHierarchyMember 2020-12-31 0001108329 ifrs-full:FinancialAssetsMeasuredAtFairValueThroughOtherComprehensiveIncomeCategoryMember 2020-12-31 0001108329 ptr:AccountsPayableAndAccruedLiabilitiesMember ifrs-full:DerivativesMember ifrs-full:Level1OfFairValueHierarchyMember 2020-12-31 0001108329 ptr:AccountsPayableAndAccruedLiabilitiesMember ifrs-full:DerivativesMember ifrs-full:Level2OfFairValueHierarchyMember 2020-12-31 0001108329 ptr:AccountsPayableAndAccruedLiabilitiesMember ifrs-full:DerivativesMember 2020-12-31 0001108329 ptr:AccountsPayableAndAccruedLiabilitiesMember ifrs-full:Level1OfFairValueHierarchyMember 2020-12-31 0001108329 ptr:AccountsPayableAndAccruedLiabilitiesMember ifrs-full:Level2OfFairValueHierarchyMember 2020-12-31 0001108329 ptr:AccountsPayableAndAccruedLiabilitiesMember 2020-12-31 0001108329 ifrs-full:LaterThanThreeYearsMember 2020-12-31 0001108329 ifrs-full:CurrentMember 2020-12-31 0001108329 ifrs-full:NotLaterThanOneYearMember 2020-12-31 0001108329 ifrs-full:LaterThanOneYearMember 2020-12-31 0001108329 ifrs-full:LaterThanTwoYearsAndNotLaterThanThreeYearsMember 2020-12-31 0001108329 ptr:InterimDividendsMember 2019-12-31 0001108329 ptr:FinalDividendsMember 2019-12-31 0001108329 ptr:ConsolidatedEntitiesMember ptr:MainlandChinaMember srt:NaturalGasReservesMember 2019-12-31 0001108329 ptr:ConsolidatedEntitiesMember ptr:OtherCountriesMember srt:NaturalGasReservesMember 2019-12-31 0001108329 srt:NaturalGasReservesMember 2019-12-31 0001108329 ptr:ConsolidatedEntitiesMember ptr:OtherCountriesMember 2019-12-31 0001108329 ptr:ConsolidatedEntitiesMember ptr:MainlandChinaMember 2019-12-31 0001108329 ptr:AssociatesAndJointVenturesDisposalMember 2019-12-31 0001108329 ifrs-full:BottomOfRangeMember 2019-12-31 0001108329 ifrs-full:TopOfRangeMember 2019-12-31 0001108329 srt:OilReservesMember 2019-12-31 0001108329 ptr:ConsolidatedEntitiesMember ptr:MainlandChinaMember srt:OilReservesMember 2019-12-31 0001108329 ptr:ConsolidatedEntitiesMember ptr:OtherCountriesMember srt:OilReservesMember 2019-12-31 0001108329 ptr:ConsolidatedEntitiesMember 2019-12-31 0001108329 ptr:EquityMethodInvesteeMember 2019-12-31 0001108329 ptr:ConsolidatedEntitiesMember srt:OilReservesMember 2019-12-31 0001108329 srt:NaturalGasReservesMember ptr:ConsolidatedEntitiesMember 2019-12-31 0001108329 ptr:ExplorationAndProductionMember 2019-12-31 0001108329 ptr:RefiningAndChemicalsMember 2019-12-31 0001108329 ptr:MarketingMember 2019-12-31 0001108329 ptr:NaturalGasAndPipelineMember 2019-12-31 0001108329 ptr:HeadOfficeAndOtherMember 2019-12-31 0001108329 ptr:ExplorationAndProductionMember ifrs-full:OperatingSegmentsMember 2019-12-31 0001108329 ptr:RefiningAndChemicalsMember ifrs-full:OperatingSegmentsMember 2019-12-31 0001108329 ptr:MarketingMember ifrs-full:OperatingSegmentsMember 2019-12-31 0001108329 ptr:NaturalGasAndPipelineMember ifrs-full:OperatingSegmentsMember 2019-12-31 0001108329 ptr:HeadOfficeAndOtherMember ifrs-full:OperatingSegmentsMember 2019-12-31 0001108329 ifrs-full:OperatingSegmentsMember 2019-12-31 0001108329 ifrs-full:EliminationOfIntersegmentAmountsMember 2019-12-31 0001108329 ifrs-full:PropertyPlantAndEquipmentSubjectToOperatingLeasesMember ifrs-full:LandMember 2020-08-27 2020-08-27 0001108329 ifrs-full:PropertyPlantAndEquipmentSubjectToOperatingLeasesMember ifrs-full:BuildingsMember 2020-08-27 2020-08-27 0001108329 ifrs-full:PropertyPlantAndEquipmentSubjectToOperatingLeasesMember ifrs-full:LandMember 2020-08-27 0001108329 ifrs-full:BuildingsMember ifrs-full:PropertyPlantAndEquipmentSubjectToOperatingLeasesMember 2020-08-27 0001108329 ptr:DisposalOfPipelineMember 2020-09-30 2020-09-30 0001108329 ptr:DisposalOfPipelineMember 2020-09-30 0001108329 ptr:HSharesMember 2000-04-07 2000-04-07 0001108329 ptr:AmericanDepositarySharesMember 2000-04-07 2000-04-07 0001108329 ptr:HSharesMember 2005-09-01 2005-09-01 0001108329 ptr:ASharesMember 2007-10-01 2007-10-31 0001108329 ptr:AmericanDepositarySharesMember 2000-04-06 2000-04-06 0001108329 ptr:ChinaPetroleumChemicalCorporationMember ptr:NewBuildingLeaseAgreementMember 2017-08-24 2017-08-24 0001108329 ptr:ChinaNationalPetroleumCorporationAndItsFellowSubsidiariesAssociatesAndJointVenturesMember 2011-08-25 2011-08-25 0001108329 ptr:PipeChinaMember 2020-07-23 0001108329 ptr:PipeChinaMember 2020-10-01 2020-12-31 0001108329 ptr:PetroChinaBeijingGasPipelineCoLtdMember 2020-12-22 2020-12-22 0001108329 ptr:PetroChinaDalianLngCompanyLimitedMember 2020-12-22 2020-12-22 0001108329 ifrs-full:ConstructionInProgressMember ifrs-full:ExplorationAndEvaluationAssetsMember 2018-12-31 0001108329 ifrs-full:NoncontrollingInterestsMember 2018-12-31 0001108329 ifrs-full:EquityAttributableToOwnersOfParentMember 2018-12-31 0001108329 ifrs-full:OtherReservesMember 2018-12-31 0001108329 ifrs-full:RetainedEarningsMember 2018-12-31 0001108329 ifrs-full:IssuedCapitalMember 2018-12-31 0001108329 ptr:ConsolidatedEntitiesMember 2018-12-31 0001108329 ifrs-full:ExplorationAndEvaluationAssetsMember ifrs-full:ConstructionInProgressMember 2019-12-31 0001108329 srt:OilReservesMember ptr:ConsolidatedEntitiesMember 2018-12-31 0001108329 srt:NaturalGasReservesMember ptr:ConsolidatedEntitiesMember 2018-12-31 0001108329 srt:OilReservesMember ptr:EquityMethodInvesteeMember 2019-12-31 0001108329 ptr:CNPCExplorationAndDevelopmentCompanyLimitedMember 2018-12-31 0001108329 ptr:PetrochinaSichuanPetrochemicalCompanyLimitedMember 2018-12-31 0001108329 srt:NaturalGasReservesMember ptr:EquityMethodInvesteeMember 2019-12-31 0001108329 ptr:PetrochinaSichuanPetrochemicalCompanyLimitedMember 2019-12-31 0001108329 ptr:CNPCExplorationAndDevelopmentCompanyLimitedMember 2019-12-31 0001108329 ifrs-full:LandMember ifrs-full:GrossCarryingAmountMember 2018-12-31 0001108329 ifrs-full:BuildingsMember ifrs-full:GrossCarryingAmountMember 2018-12-31 0001108329 ifrs-full:MachineryMember ifrs-full:GrossCarryingAmountMember 2018-12-31 0001108329 ifrs-full:GrossCarryingAmountMember ifrs-full:OtherAssetsMember 2018-12-31 0001108329 ptr:NetBookValueMember 2018-12-31 0001108329 ifrs-full:GrossCarryingAmountMember 2018-12-31 0001108329 ifrs-full:AccumulatedDepreciationAndAmortisationMember ifrs-full:LandMember 2018-12-31 0001108329 ifrs-full:AccumulatedDepreciationAndAmortisationMember ifrs-full:BuildingsMember 2018-12-31 0001108329 ifrs-full:AccumulatedDepreciationAndAmortisationMember ifrs-full:MachineryMember 2018-12-31 0001108329 ifrs-full:AccumulatedDepreciationAndAmortisationMember ifrs-full:OtherAssetsMember 2018-12-31 0001108329 ifrs-full:AccumulatedDepreciationAndAmortisationMember 2018-12-31 0001108329 ptr:NetBookValueMember ifrs-full:LandMember 2018-12-31 0001108329 ptr:NetBookValueMember ifrs-full:BuildingsMember 2018-12-31 0001108329 ptr:NetBookValueMember ifrs-full:MachineryMember 2018-12-31 0001108329 ptr:NetBookValueMember ifrs-full:OtherAssetsMember 2018-12-31 0001108329 ifrs-full:IssuedCapitalMember 2019-12-31 0001108329 ifrs-full:RetainedEarningsMember 2019-12-31 0001108329 ifrs-full:OtherReservesMember 2019-12-31 0001108329 ifrs-full:EquityAttributableToOwnersOfParentMember 2019-12-31 0001108329 ifrs-full:NoncontrollingInterestsMember 2019-12-31 0001108329 ifrs-full:BuildingsMember ifrs-full:GrossCarryingAmountMember 2019-12-31 0001108329 ifrs-full:OilAndGasAssetsMember ifrs-full:GrossCarryingAmountMember 2019-12-31 0001108329 ptr:EquipmentAndMachineryMember ifrs-full:GrossCarryingAmountMember 2019-12-31 0001108329 ifrs-full:MotorVehiclesMember ifrs-full:GrossCarryingAmountMember 2019-12-31 0001108329 ifrs-full:OtherPropertyPlantAndEquipmentMember ifrs-full:GrossCarryingAmountMember 2019-12-31 0001108329 ifrs-full:ConstructionInProgressMember ifrs-full:GrossCarryingAmountMember 2019-12-31 0001108329 ifrs-full:GrossCarryingAmountMember 2019-12-31 0001108329 ifrs-full:BuildingsMember ifrs-full:AccumulatedDepreciationAmortisationAndImpairmentMember 2019-12-31 0001108329 ifrs-full:OilAndGasAssetsMember ifrs-full:AccumulatedDepreciationAmortisationAndImpairmentMember 2019-12-31 0001108329 ptr:EquipmentAndMachineryMember ifrs-full:AccumulatedDepreciationAmortisationAndImpairmentMember 2019-12-31 0001108329 ifrs-full:MotorVehiclesMember ifrs-full:AccumulatedDepreciationAmortisationAndImpairmentMember 2019-12-31 0001108329 ifrs-full:AccumulatedDepreciationAmortisationAndImpairmentMember ifrs-full:OtherPropertyPlantAndEquipmentMember 2019-12-31 0001108329 ifrs-full:ConstructionInProgressMember ifrs-full:AccumulatedDepreciationAmortisationAndImpairmentMember 2019-12-31 0001108329 ifrs-full:AccumulatedDepreciationAmortisationAndImpairmentMember 2019-12-31 0001108329 ifrs-full:StatutoryReserveMember 2019-12-31 0001108329 ifrs-full:ReserveOfDiscretionaryParticipationFeaturesMember 2019-12-31 0001108329 ifrs-full:ReserveOfExchangeDifferencesOnTranslationMember 2019-12-31 0001108329 ptr:OtherMiscellaneousReservesMember 2019-12-31 0001108329 ifrs-full:CapitalReserveMember 2019-12-31 0001108329 ifrs-full:ExplorationAndEvaluationAssetsMember ifrs-full:ConstructionInProgressMember 2020-12-31 0001108329 ifrs-full:BuildingsMember ifrs-full:GrossCarryingAmountMember 2020-12-31 0001108329 ifrs-full:OilAndGasAssetsMember ifrs-full:GrossCarryingAmountMember 2020-12-31 0001108329 ptr:EquipmentAndMachineryMember ifrs-full:GrossCarryingAmountMember 2020-12-31 0001108329 ifrs-full:MotorVehiclesMember ifrs-full:GrossCarryingAmountMember 2020-12-31 0001108329 ifrs-full:OtherPropertyPlantAndEquipmentMember ifrs-full:GrossCarryingAmountMember 2020-12-31 0001108329 ifrs-full:GrossCarryingAmountMember ifrs-full:ConstructionInProgressMember 2020-12-31 0001108329 ifrs-full:BuildingsMember ifrs-full:AccumulatedDepreciationAmortisationAndImpairmentMember 2020-12-31 0001108329 ifrs-full:OilAndGasAssetsMember ifrs-full:AccumulatedDepreciationAmortisationAndImpairmentMember 2020-12-31 0001108329 ptr:EquipmentAndMachineryMember ifrs-full:AccumulatedDepreciationAmortisationAndImpairmentMember 2020-12-31 0001108329 ifrs-full:MotorVehiclesMember ifrs-full:AccumulatedDepreciationAmortisationAndImpairmentMember 2020-12-31 0001108329 ifrs-full:OtherPropertyPlantAndEquipmentMember ifrs-full:AccumulatedDepreciationAmortisationAndImpairmentMember 2020-12-31 0001108329 ifrs-full:ConstructionInProgressMember ifrs-full:AccumulatedDepreciationAmortisationAndImpairmentMember 2020-12-31 0001108329 ifrs-full:BuildingsMember 2020-12-31 0001108329 ifrs-full:OilAndGasAssetsMember 2020-12-31 0001108329 ptr:EquipmentAndMachineryMember 2020-12-31 0001108329 ifrs-full:MotorVehiclesMember 2020-12-31 0001108329 ifrs-full:OtherPropertyPlantAndEquipmentMember 2020-12-31 0001108329 srt:OilReservesMember ptr:EquityMethodInvesteeMember 2020-12-31 0001108329 srt:NaturalGasReservesMember ptr:EquityMethodInvesteeMember 2020-12-31 0001108329 ifrs-full:CapitalReserveMember 2020-12-31 0001108329 ptr:OtherMiscellaneousReservesMember 2020-12-31 0001108329 ifrs-full:OtherReservesMember 2020-12-31 0001108329 ifrs-full:StatutoryReserveMember 2020-12-31 0001108329 ifrs-full:ReserveOfDiscretionaryParticipationFeaturesMember 2020-12-31 0001108329 ifrs-full:ReserveOfExchangeDifferencesOnTranslationMember 2020-12-31 0001108329 ifrs-full:LandMember ifrs-full:GrossCarryingAmountMember 2019-12-31 0001108329 ptr:NetBookValueMember 2019-12-31 0001108329 ptr:NetBookValueMember ifrs-full:OtherAssetsMember 2019-12-31 0001108329 ptr:NetBookValueMember ifrs-full:MachineryMember 2019-12-31 0001108329 ptr:NetBookValueMember ifrs-full:BuildingsMember 2019-12-31 0001108329 ptr:NetBookValueMember ifrs-full:LandMember 2019-12-31 0001108329 ifrs-full:AccumulatedDepreciationAndAmortisationMember 2019-12-31 0001108329 ifrs-full:AccumulatedDepreciationAndAmortisationMember ifrs-full:OtherAssetsMember 2019-12-31 0001108329 ifrs-full:AccumulatedDepreciationAndAmortisationMember ifrs-full:MachineryMember 2019-12-31 0001108329 ifrs-full:MachineryMember ifrs-full:GrossCarryingAmountMember 2019-12-31 0001108329 ifrs-full:BuildingsMember ifrs-full:GrossCarryingAmountMember 2019-12-31 0001108329 ifrs-full:AccumulatedDepreciationAndAmortisationMember ifrs-full:BuildingsMember 2019-12-31 0001108329 ifrs-full:AccumulatedDepreciationAndAmortisationMember ifrs-full:LandMember 2019-12-31 0001108329 ifrs-full:OtherAssetsMember ifrs-full:GrossCarryingAmountMember 2019-12-31 0001108329 ifrs-full:AccumulatedDepreciationAndAmortisationMember 2020-12-31 0001108329 ifrs-full:AccumulatedDepreciationAndAmortisationMember ifrs-full:OtherAssetsMember 2020-12-31 0001108329 ptr:NetBookValueMember ifrs-full:OtherAssetsMember 2020-12-31 0001108329 ifrs-full:MachineryMember ptr:NetBookValueMember 2020-12-31 0001108329 ptr:NetBookValueMember ifrs-full:BuildingsMember 2020-12-31 0001108329 ptr:NetBookValueMember ifrs-full:LandMember 2020-12-31 0001108329 ifrs-full:AccumulatedDepreciationAndAmortisationMember ifrs-full:MachineryMember 2020-12-31 0001108329 ifrs-full:AccumulatedDepreciationAndAmortisationMember ifrs-full:BuildingsMember 2020-12-31 0001108329 ifrs-full:AccumulatedDepreciationAndAmortisationMember ifrs-full:LandMember 2020-12-31 0001108329 ptr:NetBookValueMember 2020-12-31 0001108329 ifrs-full:GrossCarryingAmountMember ifrs-full:OtherAssetsMember 2020-12-31 0001108329 ifrs-full:MachineryMember ifrs-full:GrossCarryingAmountMember 2020-12-31 0001108329 ifrs-full:BuildingsMember ifrs-full:GrossCarryingAmountMember 2020-12-31 0001108329 ifrs-full:LandMember ifrs-full:GrossCarryingAmountMember 2020-12-31 0001108329 ifrs-full:IssuedCapitalMember 2020-12-31 0001108329 ifrs-full:RetainedEarningsMember 2020-12-31 0001108329 ifrs-full:EquityAttributableToOwnersOfParentMember 2020-12-31 0001108329 ifrs-full:NoncontrollingInterestsMember 2020-12-31 0001108329 ifrs-full:ExplorationAndEvaluationAssetsMember ifrs-full:ConstructionInProgressMember 2021-12-31 0001108329 ifrs-full:BuildingsMember ifrs-full:GrossCarryingAmountMember 2021-12-31 0001108329 ifrs-full:OilAndGasAssetsMember ifrs-full:GrossCarryingAmountMember 2021-12-31 0001108329 ptr:EquipmentAndMachineryMember ifrs-full:GrossCarryingAmountMember 2021-12-31 0001108329 ifrs-full:GrossCarryingAmountMember ifrs-full:MotorVehiclesMember 2021-12-31 0001108329 ifrs-full:OtherPropertyPlantAndEquipmentMember ifrs-full:GrossCarryingAmountMember 2021-12-31 0001108329 ifrs-full:ConstructionInProgressMember ifrs-full:GrossCarryingAmountMember 2021-12-31 0001108329 ifrs-full:BuildingsMember ifrs-full:AccumulatedDepreciationAmortisationAndImpairmentMember 2021-12-31 0001108329 ifrs-full:OilAndGasAssetsMember ifrs-full:AccumulatedDepreciationAmortisationAndImpairmentMember 2021-12-31 0001108329 ptr:EquipmentAndMachineryMember ifrs-full:AccumulatedDepreciationAmortisationAndImpairmentMember 2021-12-31 0001108329 ifrs-full:MotorVehiclesMember ifrs-full:AccumulatedDepreciationAmortisationAndImpairmentMember 2021-12-31 0001108329 ifrs-full:OtherPropertyPlantAndEquipmentMember ifrs-full:AccumulatedDepreciationAmortisationAndImpairmentMember 2021-12-31 0001108329 ifrs-full:ConstructionInProgressMember ifrs-full:AccumulatedDepreciationAmortisationAndImpairmentMember 2021-12-31 0001108329 ifrs-full:BuildingsMember 2021-12-31 0001108329 ifrs-full:OilAndGasAssetsMember 2021-12-31 0001108329 ptr:EquipmentAndMachineryMember 2021-12-31 0001108329 ifrs-full:MotorVehiclesMember 2021-12-31 0001108329 ifrs-full:OtherPropertyPlantAndEquipmentMember 2021-12-31 0001108329 srt:OilReservesMember ptr:EquityMethodInvesteeMember 2021-12-31 0001108329 srt:NaturalGasReservesMember ptr:EquityMethodInvesteeMember 2021-12-31 0001108329 ifrs-full:CapitalReserveMember 2021-12-31 0001108329 ptr:OtherMiscellaneousReservesMember 2021-12-31 0001108329 ifrs-full:OtherReservesMember 2021-12-31 0001108329 ifrs-full:StatutoryReserveMember 2021-12-31 0001108329 ifrs-full:ReserveOfDiscretionaryParticipationFeaturesMember 2021-12-31 0001108329 ifrs-full:ReserveOfExchangeDifferencesOnTranslationMember 2021-12-31 0001108329 ifrs-full:MachineryMember ifrs-full:GrossCarryingAmountMember 2021-12-31 0001108329 ifrs-full:OtherAssetsMember ifrs-full:GrossCarryingAmountMember 2021-12-31 0001108329 ifrs-full:AccumulatedDepreciationAndAmortisationMember ifrs-full:LandMember 2021-12-31 0001108329 ifrs-full:LandMember ifrs-full:GrossCarryingAmountMember 2021-12-31 0001108329 ifrs-full:BuildingsMember ifrs-full:GrossCarryingAmountMember 2021-12-31 0001108329 ifrs-full:AccumulatedDepreciationAndAmortisationMember ifrs-full:BuildingsMember 2021-12-31 0001108329 ifrs-full:AccumulatedDepreciationAndAmortisationMember ifrs-full:MachineryMember 2021-12-31 0001108329 ifrs-full:AccumulatedDepreciationAndAmortisationMember ifrs-full:OtherAssetsMember 2021-12-31 0001108329 ifrs-full:AccumulatedDepreciationAndAmortisationMember 2021-12-31 0001108329 ptr:NetBookValueMember 2021-12-31 0001108329 ptr:NetBookValueMember ifrs-full:LandMember 2021-12-31 0001108329 ptr:NetBookValueMember ifrs-full:BuildingsMember 2021-12-31 0001108329 ptr:NetBookValueMember ifrs-full:MachineryMember 2021-12-31 0001108329 ptr:NetBookValueMember ifrs-full:OtherAssetsMember 2021-12-31 0001108329 ifrs-full:IssuedCapitalMember 2021-12-31 0001108329 ifrs-full:RetainedEarningsMember 2021-12-31 0001108329 ifrs-full:EquityAttributableToOwnersOfParentMember 2021-12-31 0001108329 ifrs-full:NoncontrollingInterestsMember 2021-12-31 xbrli:pure iso4217:CNY xbrli:shares utr:Day utr:Year utr:MMBoe utr:Bcfe iso4217:HKD utr:MMBbls utr:bbl iso4217:USD utr:sqm iso4217:CNY xbrli:shares ptr:Employee iso4217:HKD xbrli:shares iso4217:USD xbrli:shares
Table of Contents
 
 
UNITED STATES
SECURITIES AND EXCHANGE COMMISSION
Washington, D.C. 20549
 
 
Form
20-F
 
 
(Mark One)
REGISTRATION STATEMENT PURSUANT TO SECTION 12(b) OR 12(g) OF THE SECURITIES EXCHANGE ACT OF 1934
or
 
ANNUAL REPORT PURSUANT TO SECTION 13 OR 15(d) OF THE SECURITIES EXCHANGE ACT OF 1934
 

For the fiscal year ended December 31, 2021.
or
 
TRANSITION REPORT PURSUANT TO SECTION 13 OR 15(d) OF THE SECURITIES EXCHANGE ACT OF 1934
or
 
SHELL COMPANY REPORT PURSUANT TO SECTION 13 OR 15(d) OF THE SECURITIES EXCHANGE ACT OF 1934
 
  
Date of event requiring this shell company report


For the transition period from
                    
to
                    
Commission File Number
1-15006


(Exact name of Registrant as specified in its charter)
 
 
PetroChina Company Limited
(Translation of Registrant’s name into English)
 
 
The People’s Republic of China
(Jurisdiction of incorporation or organization)
 
 
9 Dongzhimen North Street
Dongcheng District, Beijing 100007
The People’s Republic of China,
(Address of principal executive offices)
 
 
Chai Shouping
Telephone number: (8610) 59982622
Facsimile number: (8610) 62099557
Email address:
 
zhouyunpeng@petrochina.com.cn
Address: 9 Dongzhimen North Street, Dongcheng District, Beijing 100007, The People’s Republic of China
Wei Fang
Telephone number: (852) 2899 2010
Facsimile number: (852) 2899 2390
Email address: hko@petrochina.com.hk
Address: Suite 3705, Tower 2, Lippo Centre, 89 Queensway, Hong Kong
(Name, telephone,
e-mail
and/or facsimile number and address of registrant’s contact person)
 
 
Securities registered or to be registered pursuant to Section 12(b) of the Act.
 
Title of Each Class
 
Trading Symbol
 
Name of Each Exchange on Which Registered
American Depositary Shares, each representing 100
H Shares, par value RMB1.00 per share*
H Shares, par value RMB1.00 per share
 
PTR
 
New York Stock Exchange, Inc.
New York Stock Exchange, Inc.**
Securities registered or to be registered pursuant to Section 12(g) of the Act.
None
(Title of Class)
Securities for which there is a reporting obligation pursuant to Section 15(d) of the Act.
None
(Title of Class)
 
 
Indicate the number of outstanding shares of each of the issuer’s classes of capital or common stock as of the close of the period covered by the annual report:
 
A Shares, par value RMB1.00 per share***
  161,922,077,818
(1)
H Shares, par value RMB1.00 per share
  21,098,900,000****
 
(1)
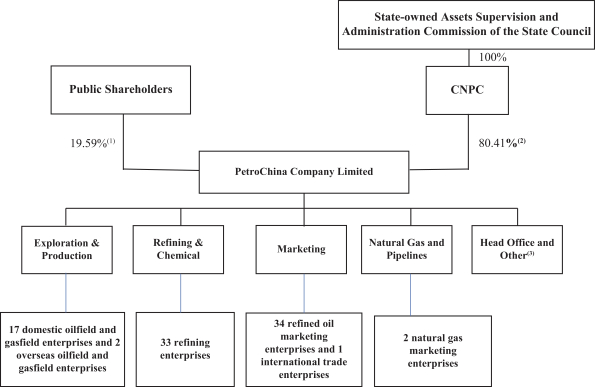
Includes 146,882,339,136 A Shares held by CNPC and 15,039,738,682 A Shares held by the public shareholders.
Indicate by check mark if the registrant is a
well-known
seasoned issuer, as defined in Rule 405 of the Securities Act.    Yes  ☒    No  ☐
If this is an annual or transition report, indicate by check mark if the registrant is not required to file reports pursuant to Section 13 or 15(d) of the Securities Exchange Act of 1934.    Yes  ☐    No  ☒
Note — Checking the box above will not relieve any registrant required to file reports pursuant to Section 13 or 15(d) of the Securities Exchange Act of 1934 from their obligations under those Sections.
Indicate by check mark whether the registrant (1) has filed all reports required to be filed by Section 13 or 15(d) or the Securities Exchange Act of 1934 during the preceding 12 months (or for such shorter period that the registrant was required to file such reports), and (2) has been subject to such filing requirements for the past 90 days.    Yes  ☒    No  ☐
Indicate by check mark whether the registrant has submitted electronically, every Interactive Data File required to be submitted pursuant to Rule 405 of Regulation
S-T
(§232.405 of this chapter) during the preceding 12 months (or for such shorter period that the registrant was required to submit such files).    Yes  ☒    No  ☐
Indicate by check mark whether the registrant is a large accelerated filer, an accelerated filer, a
non-accelerated
filer, or an emerging growth company. See the definitions of “large accelerated filer,” “accelerated filer,” and “emerging growth company” in Rule
12b-2
of the Exchange Act:
 
Large Accelerated Filer  ☒   Accelerated Filer  ☐   
Non-Accelerated
Filer  ☐
  Emerging Growth company  
If an emerging growth company that prepares its financial statements in accordance with U.S. GAAP, indicate by check mark if the registrant has elected not to use the extended transition period for complying with any new or revised financial accounting standards† provided pursuant to Section 13(a) of the Exchange Act.  ☐
The term “new or revised financial accounting standard” refers to any update issued by the Financial Accounting Standards Board to its Accounting Standards Codification after April 5, 2012.
Indicate by check mark whether the registrant has filed a report on and attestation to its management’s assessment of the effectiveness of its internal control over financial reporting under Section 404(b) of the Sarbanes-Oxley Act (15 U.S.C. 7262(b)) by the registered public accounting firm that prepared or issued its audit report.  
Indicate by check mark which basis of accounting the registrant has used to prepare the financial statements included in this filing:
 
☐    U.S. GAAP
   ☒    International Financial Reporting Standards as issued by the International Accounting Standards Board    ☐    Other
 
If “Other” has been checked in response to the previous question, indicate by check mark which financial statement item the registrant has elected to follow. Item 17  ☐    Item 18  ☐
If this is an annual report, indicate by check mark whether the registrant is a shell company (as defined in Rule
12b-2
of the Exchange Act).    Yes  ☐    No  
(APPLICABLE ONLY TO ISSUERS INVOLVED IN BANKRUPTCY PROCEEDINGS DURING THE PRECEDING FIVE YEARS)
Indicate by check mark whether the registrant has filed all documents and reports required to be filed by Sections 12, 13 or 15(d) of the Securities Exchange Act of 1934 subsequent to the distribution of securities under a plan confirmed by a court.    Yes  ☐    No  ☐
 
 
*    PetroChina’s H Shares are listed and traded on The Stock Exchange of Hong Kong Limited.
**    Not for trading, but only in connection with the registration of American Depository Shares.
***    PetroChina’s A Shares became listed on the Shanghai Stock Exchange on November 5, 2007.
****    Includes
902,243,200
 H Shares represented by American Depositary Shares.


Table of Contents
Table of Contents
 
    
Page
 
     1  
     5  
     7  
Item 1
          Identity of Directors, Senior Management and Advisors      7  
Item 2
          Offer Statistics and Expected Timetable      7  
Item 3
          Key Information      7  
      Risk Factors      7  
Item 4
          Information on the Company      23  
      Introduction      23  
      Exploration and Production      25  
      Refining and Chemicals      36  
      Marketing      39  
      Natural Gas and Pipeline      41  
      Competition      42  
      Environmental Matters      44  
      Properties, Plants and Equipment      45  
      Intellectual Property      45  
      Regulatory Matters      46  
Item 4 A
          Unresolved Staff Comments      55  
Item 5
          Operating and Financial Review and Prospects      55  
      General      55  
      Operating Results      60  
      Liquidity and Capital Resources      65  
      Off-Balance Sheet Arrangements      70  
           70  
      Assets Retirement Obligation      70  
      Research and Development      71  
      Trend Information      72  
      Recent development      74  
      Other Information      74  
Item 6
          Directors, Senior Management and Employees      74  
      Directors, Senior Management and Supervisors      74  
      Compensation      85  
      Board Practices      85  
      Employees      88  
      Share Ownership      88  
Item 7
          Major Shareholders and Related Party Transactions      89  
      Major Shareholders      89  
      Related Party Transactions      89  
      Interests of Experts and Counsel      95  
Item 8
          Financial Information      95  
      Financial Statements      95  
      Legal Proceedings      95  
      Dividend Policy      95  
      Significant Changes      97  
Item 9
          The Offer and Listing      97  
      Trading Market Information      97  
Item 10
          Additional Information      98  
 
i

Table of Contents
    
Page
 
      Memorandum and Articles of Association      98  
      Material Contracts      102  
      Foreign Exchange Regulation      103  
      Taxation      103  
      Documents on Display      109  
Item 11
          Quantitative and Qualitative Disclosures About Market Risk      109  
Item 12
          Description of Securities Other Than Equity Securities      112  
     113  
Item 13
          Defaults, Dividends Arrearages and Delinquencies      113  
Item 14
          Material Modifications to the Rights to Security Holders and Use of Proceeds      113  
Item 15
          Controls and Procedures      113  
Item 16 A
          Audit Committee Financial Expert      113  
Item 16 B
          Code of Ethics      114  
Item 16 C
          Principal Accountant Fees and Services      114  
Item 16 D
          Exemptions from Listing Standards for Audit Committees      115  
Item 16 E
          Purchases of Equity Securities by the Issuer and Affiliated Purchasers      115  
Item 16 F
          Change in Registrant’s Certifying Accountant      115  
Item 16 G
          Corporate Governance      116  
Item 16 H
          Mine Safety Disclosure      117  
Item 16 I
          Disclosure Regarding Foreign Jurisdictions that Prevent Inspections      117  
     118  
Item 17
          Financial Statements      118  
Item 18
          Financial Statements      118  
Item 19
          Exhibits      118  
     120  
    
F-1
 
 
ii

Table of Contents
CERTAIN TERMS AND CONVENTIONS
Conventions Which Apply to this Annual Report
Unless the context otherwise requires, references in this annual report to:
 
   
“CNPC” or “CNPC group” are to our parent, China National Petroleum Corporation and its affiliates and subsidiaries, excluding PetroChina, its subsidiaries and its interests in
long-term
investments, and where the context refers to any time prior to the establishment of CNPC, those entities and businesses which were contributed to CNPC upon its establishment.
 
   
“PetroChina”, “we”, “our”, “our company”, “the Company” and “us” are to: PetroChina Company Limited, a joint stock company incorporated in the People’s Republic of China with limited liability and its subsidiaries and branch companies.
 
   
“PRC” or “China” are to the People’s Republic of China, but does not apply to its Hong Kong, Macau and Taiwan for purposes of this annual report.
We publish our consolidated financial statements in Renminbi or RMB. In this annual report, IFRS refers to International Financial Reporting Standards as issued by the International Accounting Standards Board.
Conversion Table
 
1
barrel-of-oil
equivalent
  
= 1 barrel of crude oil
  = 6,000 cubic feet of natural gas
1 cubic meter
  
= 35.315 cubic feet
 
1 ton of crude oil
  
= 1 metric ton of crude oil
  = 7.389 barrels of crude oil (assuming an API gravity of 34 degrees)
Certain Oil and Gas Terms
Unless the context indicates otherwise, the following terms have the meanings shown below:
 
“acreage”
The total area, expressed in acres, over which an entity has interests in exploration or production. Net acreage is the entity’s interest, expressed in acres, in the relevant exploration or production area.
 
“condensate”
Light hydrocarbon substances produced with natural gas that condense into liquid at normal temperatures and pressures associated with surface production equipment.
 
“crude oil”
Crude oil, including condensate and natural gas liquids.
 
“developed reserves”
Under the reserves rules of the Securities and Exchange Commission, or SEC, developed reserves are reserves of any category that can be expected to be recovered:
 
  (i) through existing wells with existing equipment and operating methods or in which the cost of the required equipment is relatively minor compared to the cost of a new well; and
 
  (ii) through installed extraction equipment and infrastructure operational at the time of the reserves estimate if the extraction is by means not involving a well.
 
1

Table of Contents
“development cost”
For a given period, costs incurred to obtain access to proved reserves and to provide facilities for extracting, treating, gathering and storing the oil and gas.
 
“finding cost”
For a given period, costs incurred in identifying areas that may warrant examination and in examining specific areas that are considered to have prospects of containing oil and gas reserves, including costs of drilling exploratory wells and
exploratory-type
test wells. Finding cost is also known as exploration cost.
 
“lifting cost”
For a given period, costs incurred to operate and maintain wells and related equipment and facilities, including applicable operating costs of support equipment and facilities and other costs of operating and maintaining those wells and related equipment and facilities. Lifting cost is also known as production cost.
 
“natural gas liquids”
Hydrocarbons that can be extracted in liquid form during natural gas production. Ethane and pentanes are the predominant components, with other heavier hydrocarbons also present in limited quantities.
 
“offshore”
Areas under water with a depth of five meters or greater.
 
“onshore”
Areas of land and areas under water with a depth of less than five meters.
 
“primary distillation capacity”
At a given point in time, the maximum volume of crude oil a refinery is able to process in its basic distilling units.
 
“proved reserves”
Under the SEC reserves rules, proved reserves are those quantities of oil and gas, which, by analysis of geoscience and engineering data, can be estimated with reasonable certainty to be economically producible — from a given date forward, from known reservoirs, and under existing economic conditions, operating methods, and government regulations — prior to the time at which contracts providing the right to operate expire, unless evidence indicates that renewal is reasonably certain, regardless of whether deterministic or probabilistic methods are used for the estimation. The project to extract the hydrocarbons must have commenced or the operator must be reasonably certain that it will commence the project within a reasonable time.
 
  (i) The area of the reservoir considered as proved includes:
 
  (A) The area identified by drilling and limited by fluid contacts, if any, and (B) Adjacent undrilled portions of the reservoir that can, with reasonable certainty, be judged to be continuous with it and to contain economically producible oil or gas on the basis of available geoscience and engineering data.
 
  (ii) In the absence of data on fluid contacts, proved quantities in a reservoir are limited by the lowest known hydrocarbons (LKH) as seen in a well penetration unless geoscience, engineering, or performance data and reliable technology establishes a lower contact with reasonable certainty.
 
2

Table of Contents
  (iii) Where direct observation from well penetrations has defined a highest known oil (HKO) elevation and the potential exists for an associated gas cap, proved oil reserves may be assigned in the structurally higher portions of the reservoir only if geoscience, engineering, or performance data and reliable technology establish the higher contact with reasonable certainty.
 
  (iv) Reserves which can be produced economically through application of improved recovery techniques (including, but not limited to, fluid injection) are included in the proved classification when:
 
  (A) Successful testing by a pilot project in an area of the reservoir with properties no more favorable than in the reservoir as a whole, the operation of an installed program in the reservoir or an analogous reservoir, or other evidence using reliable technology establishes the reasonable certainty of the engineering analysis on which the project or program was based; and (B) The project has been approved for development by all necessary parties and entities, including governmental entities.
 
  (v) Existing economic conditions include prices and costs at which economic producibility from a reservoir is to be determined. The price shall be the average price during the
12-month
period prior to the ending date of the period covered by the report, determined as an unweighted arithmetic average of the
first-day-of-the-month
price for each month within such period, unless prices are defined by contractual arrangements, excluding escalations based upon future conditions.
 
“reserves-to-production
ratio”
For any given well, field or country, the ratio of proved reserves to annual production of crude oil or, with respect to natural gas, to wellhead production excluding flared gas.
 
“natural gas for sale”
Marketable production of gas on an “as sold” basis, excluding flared gas, injected gas and gas consumed in operations.
 
“undeveloped reserves”
Under the SEC reserves rules, undeveloped reserves are reserves of any category that are expected to be recovered from new wells on undrilled acreage, or from existing wells where a relatively major expenditure is required for recompletion.
 
  (i) Reserves on undrilled acreage shall be limited to those directly offsetting development spacing areas that are reasonably certain of production when drilled, unless evidence using reliable technology exists that establishes reasonable certainty of economic producibility at greater distances.
 
  (ii) Undrilled locations can be classified as having undeveloped reserves only if a development plan has been adopted indicating that they are scheduled to be drilled within five years, unless the specific circumstances, justify a longer time.
 
3

Table of Contents
  (iii) Under no circumstances shall estimates for undeveloped reserves be attributable to any acreage for which an application of fluid injection or other improved recovery technique is contemplated, unless such techniques have been proved effective by actual projects in the same reservoir or an analogous reservoir, or by other evidence using reliable technology establishing reasonable certainty.
References to:
 
   
BOE is to
barrels-of-oil
equivalent,
 
   
Mcf is to thousand cubic feet, and
 
   
Bcf is to billion cubic feet.
 
4

Table of Contents
FORWARD-LOOKING
STATEMENTS
This annual report contains
“forward-looking
statements” within the meaning of Section 27A of the Securities Act of 1933, as amended, and Section 21E of the Securities and Exchange Act of 1934, as amended. These
forward-looking
statements are, by their nature, subject to significant risks and uncertainties. These
forward-looking
statements include, without limitation, statements relating to:
 
   
the amounts and nature of future exploration, development and other capital expenditures;
 
   
future prices and demand for crude oil, natural gas, refined products and chemical products;
 
   
development projects;
 
   
exploration prospects;
 
   
reserves potential;
 
   
production of oil and gas and refined and chemical products;
 
   
development and drilling potential;
 
   
expansion and other development trends of the oil and gas industry;
 
   
the planned development of our natural gas operations;
 
   
the planned expansion of our refined product marketing network;
 
   
the planned expansion of our natural gas infrastructure;
 
   
the prospects of our new energy business;
 
   
the anticipated benefit from our ongoing arrangements with PipeChina;
 
   
the anticipated benefit from the acquisition of certain overseas assets from CNPC, our parent company;
 
   
the plan to continue to pursue attractive business opportunities outside China;
 
   
our future overall business development and economic performance;
 
   
our anticipated financial and operating information regarding, and the future development and economic performance of, our business;
 
   
our anticipated market risk exposure arising from future changes in interest rates, foreign exchange rates and commodity prices; and
 
   
other prospects of our business and operations.
The words “anticipate”, “believe”, “could”, “estimate”, “expect”, “intend”, “may”, “plan”, “seek”, “will” and “would” and similar expressions, as they related to us, are intended to identify a number of these
forward-looking
statements.
By their nature,
forward-looking
statements involve risks and uncertainties because they relate to events and depend on circumstances that will occur in the future and are beyond our control. The
forward-looking
statements reflect our current views with respect to future events and are not a guarantee of future performance. Actual results may differ materially from information contained in the
forward-looking
statements as a result of a number of factors, including, without limitation, the risk factors set forth in this annual report and the following:
 
   
fluctuations in crude oil and natural gas prices;
 
   
effects of the
COVID-19
pandemic;
 
   
failure to achieve continued exploration success;
 
   
failures or delays in achieving production from development projects;
 
5

Table of Contents
   
continued availability of capital and financing;
 
   
acquisitions and other business opportunities that we may pursue;
 
   
general economic, market and business conditions, including volatility in interest rates, changes in foreign exchange rates and volatility in commodity markets;
 
   
liability for remedial actions under environmental regulations;
 
   
the actions of competitors;
 
   
wars and acts of terrorism or sabotage;
 
   
changes in policies, laws or regulations of the PRC, including changes in applicable tax rates;
 
   
the other changes in global economic and political conditions, including those affecting the production, supply and demand and pricing of crude oil, refined products, petrochemical products and natural gas; and
 
   
the other risk factors discussed in this annual report, and other factors beyond our control.
You should not place undue reliance on any
forward-looking
statements.
 
6

Table of Contents
PART I
Item 1
— IDENTITY OF DIRECTORS, SENIOR MANAGEMENT AND ADVISORS
Not applicable. See “Item 6 — Directors, Senior Management and Employees — Directors, Senior Management and Supervisors” and “Item 16C — Principal Accountant Fees and Services”.
Item 2
— OFFER STATISTICS AND EXPECTED TIMETABLE
Not applicable.
Item 3
— KEY INFORMATION
Risk Factors
Our business is subject to various changing competitive, economic, social, political and regulatory and other related conditions. Such changing conditions entail certain risks, which are described below.
Risks Related to Government Regulation
Our operations in China currently contribute the large majority of our revenue. Accordingly, we are extensively affected and regulated by the economic and industrial policies, laws and regulations adopted in China. This may in turn adversely affect our financial condition, operation results, liquidity, and the value of our ADSs. These effects are reflected mainly in the following respects:
(1)
In terms of general economic policies
: The Chinese government regulates China’s economic development by setting general economic policies such as monetary and financial policy, fiscal and tax policy and foreign exchange policy. The application of any policy to us may affect our business decisions, production plans and strategy executions, which in turn may have an impact on our financial condition, operating results and value of our ADSs.
(2)
In terms of industrial policies, laws and regulations
: The sector in which we operate is subject to extensive regulation and regulatory control by the Chinese government. The regulation and regulatory control relate to many material aspects of our operations. As a result, we may face constraints and restrictions on our ability to implement our business strategies, to develop or expand our business operations or to maximize our profitability. For example:
 
   
Energy transition policy
: In order to address climate change concerns, the Chinese government has set the goal to hit carbon peak by 2030 and achieve carbon neutrality by 2060. To achieve that goal, China has introduced and is expected to introduce a series of economic policies and supporting laws and regulations. These regulations would pose severe challenges to traditional oil extraction and refining operations, and drive us to adjust our operational strategies and initiate steps to expand into new energy business while continuing to develop our traditional business with high quality. If our efforts to address climate change fail to produce satisfactory results, the overall operations, liquidity, profitability and the value of the ADSs of our company may suffer an adverse effect.
 
   
Product pricing mechanism
: In China, the pricing of gasoline, diesel and natural gas products is subject to government regulation and we cannot freely set prices for these products. We are required to price these products in compliance with the Chinese government’s pricing mechanism. As a major supplier of essential energy sources in China, we are not permitted to cease supply to the market even if market prices are not favorable and we cannot exceed the pricing limit set by the government.
 
7

Table of Contents
   
Crude oil special gain levy
: China collects a crude oil special gain levy on all oil production companies that sell crude oil produced from China. At present, we are required to pay the crude oil special gain levy for the excessive revenue received by us from the sale of domestically produced crude oil above US$65 per barrel.
 
   
Mineral rights granting system
: We are subject to various requirements under the
Mineral Resources Law of the PRC
and supporting laws and regulations, including those requirements relating to exploration licenses, production licenses, mineral rights fees, and minimum investment into mining blocks.
 
   
Ecological and environmental protection and safety production
: We are subject to a series of ecological and environmental protection and safety production laws and standards, which have become increasingly stringent over recent years in China with respect to the oil and gas industries.
 
   
Project approvals
: In China, the construction of significant refining and petrochemical facilities is subject to governmental approval. We presently have several significant projects pending approval from the relevant government authorities and will need approvals from the relevant government authorities in connection with several other significant projects. We do not have control over the timing and outcome of the final project approvals.
 
   
Oil and gas production targets
: The National Energy Administration of the PRC publishes certain guiding targets for annual production of domestic energy companies. For example, for 2022, the National Energy Administration announced that its target is to procure China’s annual production of domestic crude oil to increase to about 200 million tons, annual production of domestic natural gas to increase to about 214 billion cubic meters, and the share of
non-fossil
energy in China’s domestic energy consumption to increase to about 17.3%. Although failure to achieve these targets will not subject us or other relevant companies to fines, these targets themselves would have an effect on our business decisions, hence, driving our management to make plans to work towards achievement of the
pre-set
targets.
(3)
In terms of generally applicable business laws and regulations
: We are subject to generally applicable business laws and regulations, including, without limitation, corporate governance, securities regulation, employee benefits, information protection, anti-monopoly and anti-money-laundering laws and regulations. We are required to continue to invest substantial management resources to ensure compliance with all these laws and regulations. Any noncompliance with any of these laws or regulations will subject our company to penalties and reputational risks, and in turn harm the interests of our investors (including investors of our ADSs). For example:
 
   
Anti-monopoly
: We are subject to anti-monopoly laws and regulations. We are prohibited from entering into or implementing anti-competitive agreements or abusing our market position, or conducting any concentration of business operators which has or may have the effect of excluding or limiting competition. Occupying a leading position in the oil and gas industry, we are more susceptible to anti-monopoly compliance risks. See the “Risks Related to Anti-Monopoly Initiatives” for a more detailed discussion of this risk.
 
   
Corporate governance and securities regulatory compliance
: Our securities are currently traded on the Shanghai Stock Exchange, Hong Kong Stock Exchange and New York Stock Exchange, or the NYSE. Accordingly, we are subject to all the applicable requirements under the listing rules, disclosure rules, securities laws as well as corporate governance and compliance rules adopted by all three markets. As a result, we are required to continue to invest substantial management resources to ensure compliance with all these requirements.
(4)
In terms of regulation and supervision of state-owned assets
: We are a company with controlling shares ultimately owned by the state. Our controlling shareholder CNPC is a state-owned enterprise. Although the State-owned Assets Supervision and Administration Commission of the State Council (“SASAC”) does not exert influence directly on us, it is positioned to make decisions on significant matters of CNPC in its capacity as
 
8

Table of Contents
shareholder and CNPC can in turn resolve on significant matters of our company in its capacity as shareholder (see the provisions regarding shareholders’ rights and obligations in our Articles of Association). As a consolidated subsidiary of CNPC, we are subject to certain regulations in relation to state-owned assets. For example, we are subject to the audits by the National Audit Office of the PRC relating to our business, finance and staff. For material merger and acquisition transactions, we are required to retain external asset appraisal firms to evaluate the target assets. All these would increase our compliance burden. Please see “Item 7 — Major Shareholders and Related Party Transactions — Related Party Transactions” and “Item 3 — Key Information — Risk Factors — Risks Related to Controlling Shareholder” for a detailed description of our transactions and relationships with our controlling shareholder.
(5)
Impact of rapid evolution of PRC laws and regulations
: PRC laws, regulations and legal requirements dealing with economic matters have experienced rapid development during the decades after China’s adoption of the reform and
opening-up
policy, especially during the most recent two decades. Some laws having a material effect on our company may be put into force or implementation without any transitional period or only after a very short transitional period, which have required us to quickly adjust our operation and compliance strategies in order to comply with the new rules.
See also “Item 4 — Information on the Company — Regulatory Matters” and the other relevant risk factors disclosed in this section, including without limitation, “Risks Related to Marco Economic Conditions”, “Risks Related to Competition”, “Risks Related to Financial Reporting Differences”, “Risks Related to Pricing and Exchange Rate”, “Risks Related to Environmental Protection and Safety Production”, and “Risks Related to Climate Change”, “Risks Related to Audit Reports Prepared by an Auditor Who Is Not Inspected by the Public Company Accounting Oversight Board”, “Risks Related to China’s Anti-Monopoly Initiatives”, and “Risks Related to Liquidity and Value of ADSs.”
Risks Related to Economic Sanctions and Trade Controls
CNPC, our controlling shareholder, has for a long time engaged in international oil and gas operations. Some of these operations are located in countries sanctioned by the U.S. government, the European Union or other governments or international organizations. Some operations involve certain entities, which are subject to sanctions. Certain of our business operations has direct or indirect ties with certain sanctioned entities in Russia or Venezuela. In addition, in recent years, many Chinese companies and individuals have become subject to various sanctions.
Sanctions and trade controls may pose the following risks to us:
 
   
Divestment
: Some investors (including U.S. investors) are prohibited from investing or may not wish to invest and have proposed or adopted divestment or similar initiatives regarding investments in companies that do business in countries or have trade or investment ties with entities that are subject to sanctions. These investors may also divest their investment in us because of our and/or CNPC’s (including its subsidiaries) investments and operations in certain sanctioned countries and our and/or CNPC’s (including its subsidiaries) trade and investment ties with certain sanctioned companies. As a result, the trading price of our ADSs may be materially and adversely affected.
 
   
Trade disruptions and wind-down of operations
: Since certain U.S. sanctions programs have extraterritorial effect or effect on
non-US
persons, such as certain secondary sanctions administered by the Office of Foreign Assets Control (“OFAC”) of the US Department of the Treasury, and certain trade controls administered by the Bureau of Industry and Security of the U.S. Commerce Department, especially under the “foreign direct product rules”, in certain circumstances, we and certain of our business partners may need to exercise business judgment to wind down certain existing projects or abandon or change some business plans. As a result, we may suffer adverse consequences, such as supply disruptions, increased costs of raw materials, impairment of assets or loss of profit-making opportunities.
 
9

Table of Contents
   
Risks of being sanctioned or implicated in sanctions
: We have always endeavored to prevent our direct or indirect ties with any sanctioned target from violating the sanctions rules of the U.S. or any other countries or organizations. However, we cannot assure you that any future sanctions will not target or implicate CNPC or even our company.
 
   
Reputation risks
: Although most of the sanctions programs do not prohibit us or our parent company (as Chinese companies) from carrying on existing operations in sanctioned countries, or from maintaining direct or indirect ties with any sanctioned entity, to maintain such operations may have an adverse impact on our reputation.
 
   
Compliance risks
: Due to the high sensitivity and complexity of sanctions issues and capriciousness of sanctions programs, we are required to invest substantial resources in compliance management. Any
non-compliance
of sanctions may subject us to penalties.
Set forth below, please see our disclosure on a
country-by-country
basis of CNPC’s and our operations in certain sanctioned countries and business ties with certain sanctioned entities.
About Iran
In 2018, the United States government withdrew from the Joint Comprehensive Plan of Action (“JCPOA”) and reimposed certain sanctions against Iran, which were conditionally lifted in 2015 following entry into the JCPOA. These reimposed sanctions have implications for
non-U.S.
companies, including requiring foreign companies to cease participation in projects in certain sectors of Iran (including the energy sector), and prohibiting or restricting oil imports from Iran, except for eight countries and regions (including China) which were granted a Significant Reduction Exception (“SRE”) to be able to continue to import limited oil until May 2019. Pursuant to section 13(r) to the U.S. Securities Exchange Act of 1934, reporting issuers are required to disclose whether they or any of their affiliates have knowingly engaged in certain activities, transactions, or dealings related to Iran during the reporting period, including activities not prohibited by U.S. or other law. Based on CNPC’s response to our inquiries, a subsidiary of CNPC (the “CNPC Sub”) held interests in certain oil and gas development projects in Iran, namely, (i) the MIS oilfields in which the CNPC Sub obtained a 100% interest in 2010, and (ii) the North Azadegan oilfield, in which the CNPC Sub obtained a 100% interest in 2009. From the
re-imposition
of U.S. sanctions, the CNPC Sub has been providing minimal support and services to the two oilfields. Since May 2019 when the SRE expired, the two oilfields have suspended lifting oil for recovery and did not generate any revenue for the CNPC Sub.
In July 2012, OFAC added Bank of Kunlun Co., Ltd., or Kunlun Bank, an affiliate of our company due to common control by CNPC, to its “List of Foreign Financial Institutions Subject to Part 561”, which was replaced by the list of Correspondent Account of Payable-Through Account Sanctions, pursuant to the
Comprehensive Iran Sanctions, Accountability, and Divestment Act of 2010
. According to OFAC, Kunlun Bank allegedly provided financial services to at least six Iranian banks that were on OFAC’s sanctions list during 2012. These financial services included holding accounts, making transfers and paying letters of credit on behalf of the designated banks. Since 2018, Kunlun Bank’s settlement business involving Iran has been limited to settlement of humanitarian materials and other business activities that are not subject to sanctions. We have no involvement in or control over such activities of Kunlun Bank or CNPC and CNPC subsidiaries and affiliates, and we have never received any revenue or profit derived from these activities.
About Russia
Since July 2014, the United States government has adopted economic sanctions against certain Russian persons and entities, including various entities operating in the financial, energy and defense sectors, such as Rosneft, Gazprom, Transneft, and OAO Novatek as well as those companies in which the foregoing companies independently or jointly hold a 50% or more interest. These sanctions prohibit U.S. persons from transacting in,
 
10

Table of Contents
providing financing for or otherwise dealing in debt issuance by certain of these entities, or exporting, transferring, or providing certain technologies, equipment or services to certain
oil-development
projects in Russia.
Since February 2022, the U.S. government has expanded the sanctions against Russia. These sanctions include designating a large number of Russian top officials, corporations, financial institutions and certain other persons as sanctioned targets, prohibiting importation of Russian oil and gas and other energy products, and prohibiting or restricting U.S. persons from conducting investment, trade, financing, settlement or other transactions with the sanctioned entities. In conjunction with such measures by the U.S. government, certain other countries have also announced different levels of sanctions against Russia. In addition to governments, certain companies and organizations have announced their plans to exit from operations involving Russia.
Pursuant to certain
pre-existing
agreements or arrangements, CNPC has for a long time imported crude oil and natural gas from Russia and held investment interests in certain projects in Russia. Our company also has direct or indirect business ties with certain sanctioned Russian entities. Both CNPC and our company have been continuously assessing the risks related to operations involving Russia. We cannot assure you that the U.S. or any other government will not impose any restrictions on those operations, or that our business partners will not terminate the business relationship with us due to their negative impression of our company or otherwise as a result of such situation. These operations include the following:
 
   
CNPC indirectly holds 20% equity interest in OAO Yamal LNG and 10% equity interest in Arctic LNG 2, both of which are more than 50% owned by OAO Novatek.
 
   
CNPC has long-term agreements with Rosneft, Transneft, Gazprom and Arctic LNG 2, all of which are subject to OFAC-administered sanctions, to import crude oil, natural gas or LNG from Russia. CNPC has resold, and will for the foreseeable future resell, all or a substantial portion of the imported crude oil under the crude oil agreements to us.
 
   
Our company has for a long time imported natural gas from Gazprom, and LNG from a subsidiary of OAO Yamal LNG.
In 2021, the share of revenue derived from Russia-related operations in our total revenue was 4.5%.
About Venezuela
In August 2017, the United States imposed economic sanctions against the Government of Venezuela and certain state-owned entities, including Petroleos de Venezuela, S.A. (“PdVSA”). These sanctions prohibit U.S. persons from transacting in, providing financing for or otherwise dealing in “new debt” issued by these entities on or after August 25, 2017, with certain exceptions for short-term debt. Neither CNPC nor PetroChina purchased such new debt securities issued by the Government of Venezuela or by PdVSA, nor did they provide any assistance to third parties in this regard. In 2019, the United States issued enhanced sanction measures against Venezuela, which included blocking the property of Venezuelan government and its controlled entities (including PdVSA), and introducing new restrictions on Venezuela’s oil sector. Under these programs, persons determined to be operating in the oil sector of the Venezuelan economy, or to have materially assisted, sponsored, or provided financial, material, or technological support for, or goods or services to or in support of, any person included on the list of SDNs and Blocked Persons, may also be subject to risk of being designated for sanctions. CNPC had long-standing trading and investment activities in Venezuela, but it has ceased oil product trading activities and oilfield services in Venezuela. In 2008, CNPC Exploration and Development Company Limited (“CNPC E&D”), a joint venture held as to 50% by us and 50% by CNPC, established a joint venture with PdVSA (the “JV”) to operate the Sinovensa block located in Carabobo, Monagas State, Venezuela, which block produces and sells heavy oil. CNPC E&D holds a 40% interest in the JV and PdVSA holds the remaining 60%. In the past two years, CNPC E&D contributed no new investment in the JV. We also indirectly hold minority interests in a few other small projects in Venezuela. For the year ended December 31, 2021, the share of
 
11

Table of Contents
net profit from the Sinovensa block and the other projects in aggregate accounted for approximately 0.6% of our net profit attributable to owners of the company.
About Other Countries and Regions
As a major supplier of essential energy sources in China, we may in the ordinary course of our business, develop ties with certain Chinese entities or individuals who are currently or in the future will be subject to various sanctions. We also have certain oil and gas assets in China’s Xinjiang region (as discussed in further detail in other sections of this annual report). There are currently no sanctions programs subjecting our business operations to material restrictions. In performing daily compliance work, on the one hand, we take great care to identify and assess risks related to having business dealings with sanctioned targets, and on the other hand, we strive to comply with PRC anti-sanctions and anti-boycott laws and regulations. When faced with the situation where foreign sanctions conflict with China’s anti-sanctions and anti-boycott rules, we may be obligated to comply with China’s rules. Hence, we may be unable to completely prevent all sanctions compliance risks.
Our controlling shareholder, CNPC, may have some operations in certain other countries and regions sanctioned by the U.S. to different extents. Our company has no involvement in or control over such activities of CNPC and CNPC’s subsidiaries and affiliates, and we have never received any revenue or profit derived from these activities. None of such activities result in us violating any U.S. or any other international sanctions.
Risks Related to Liquidity and Value of ADSs
In addition to the factors that have been included in this “Risk Factor” section and elsewhere of this annual report that have a potential impact on the liquidity and value of our ADSs, we foresee certain risks relating to the liquidity and value of our ADSs arising from potential changes in the legal environment and regulatory requirements in the countries we operate and where our securities are listed, including but not limited to, in the following respects:
Firstly, if in the future any restrictions are imposed, or any negative comments or warnings are made, by any government or governmental authorities on the flow of capital into China or China-based companies, or any escalation of geopolitical tensions or any news or rumors thereof, or if investment restrictions are imposed on us or we are threatened with investment restrictions, it may make potential investors shun away from our securities (including our ADSs) and/or certain of our existing investors (including ADS investors) may divest from us. As a result, the liquidity and value of our securities (including our ADSs) may be materially and adversely affected.
Secondly, if in the future, the Chinese government introduces new rules relating to “information security”, “data security” and/or “national security” with respect to overseas offerings and listings by China-based issuers and/or with respect to China-based issuers that are already listed, which results in our company being covered to any extent by any such new rules, we cannot rule out the risk that it may have an impact on the liquidity and value of our securities (including our ADSs). For example, in December 2021, the Chinese government published the
Provisions on the Administration of Overseas Securities Offering and Listing of Domestic Companies (Draft for Comments)
(the “Draft Overseas Listing Provisions”). The Draft Overseas Listing Provisions provides that if any domestic company proposes to conduct an overseas securities offering and listing, and (i) where it involves China’s foreign investment, cybersecurity, or data security rules, the company is obligated to take action to protect national security; (ii) where it involves security review rules, the company must go through the review process in accordance with applicable laws; and (iii) the competent department under the State Council may require the company to divest relevant businesses and/or assets to eliminate the impacts on national security, and if the filing of a proposed overseas offering and listing has been cleared, the filing may be rescinded. CSRC stated at the release of the Draft Overseas Listing Provisions that the rules after becoming effective will apply to initial offerings and listings,
follow-on
offerings and refinancing, while the application of these rules to other overseas listed companies will be arranged at a later stage, thus providing a sufficient transitional period to those other overseas listed companies. We understand that these draft rules will implicate
 
12

Table of Contents
the applicable laws and regulations in relation to national security review, and (i) if the rules are enacted in the end, (ii) if our company is determined to be an operator of critical information infrastructure in the energy sector, (iii) if the companies in the energy sector are required to undertake the national security review in relation to their overseas listing, and (iv) if after its review according to the relevant laws and regulations, the competent PRC regulator determines that for the sake of protecting relevant data from disclosure, companies operating in the sector in which we operate are no longer suitable for being listed overseas, then the PRC government may prohibit or restrict overseas listing of domestic companies operating in our sector (such as our company). In that case,
 
   
we may be delisted from the U.S., whether voluntarily or by mandatory requirements, and investors of our ADSs will then have to sell their ADSs or convert the ADSs into our H Shares;
 
   
the market price of our ADSs may be materially and adversely affected by the risk aversion and other negative market sentiment, regardless of our actual operating conditions;
 
   
if any investor of our ADSs does not convert the ADSs held by him/her into our H Shares for any reason, those ADSs may eventually lose all market value due to the loss of liquidity on the NYSE;
 
   
affected by the decline in the market value of ADSs, the prices of our H Shares, the underlying securities of ADSs, may drop significantly;
 
   
the conversion of ADSs into H Shares will incur some costs and cause some inconvenience; and
 
   
if in the future we propose to conduct a
follow-on
offering overseas, the proposed offering may be hindered by the occurrence of any one or more of the foregoing events.
See also other risks disclosed in this “Risk Factors” section, such as “Risks Related to Audit Reports Prepared by an Auditor Who Is Not Inspected by the Public Company Accounting Oversight Board”, “Risks Related to Government Regulation”, “Risks Related to Outbound Investments and Trading”, “Risks Related to Sanctions and Trade Controls”, “Risks Related to Macro Economic Conditions” and “Risks Related to Pricing and Exchange Rate.”
Risks Related to Macro Economic Conditions
Our operations may be adversely affected by international and domestic economic conditions. As the oil and gas industry is sensitive to
macro-economic
trends, oil and gas prices tend to fluctuate along with changes in
macro-economic
conditions. We may experience pricing pressure on our refined products in recessionary periods, which would have an adverse effect on our profitability
.
Changes in macro-economic conditions can affect the demand for certain of our products. These factors may also lead to intensified competition for market share, with consequential potential adverse effects on sales volumes. Inflation may lead to increase in our operating costs. Notwithstanding the measures taken by the PRC government to control inflation, China may experience an increase in inflation in the future and our operating costs may become higher than anticipated. The financial, economic or political situation may also have a negative impact on third parties with whom we do business, and may impact their ability to perform contractual obligations to us. In addition, other factors that affect the macro economy, such as declining population growth rates, geopolitical tensions, conflicts and wars, trade and tariff policies, and major public health events, such as the
COVID-19
pandemic, may have an adverse impact on oil and gas and petrochemical industries, including us. Any of these factors may adversely affect our financial condition, results of operations and liquidity.
Risks Related to Competition
The oil, gas and petrochemicals industries are highly competitive. There is strong competition, both within the oil and gas industry and with other industries, in supplying the fuel needs of commercial, industrial and residential markets. In recent years, with the intensive reform of China’s petroleum, refining and chemical, natural gas, LNG and refined oils sales industries, we have been facing increasingly intense competition in the
 
13

Table of Contents
exploration, refinery, chemical, sales, and oil and gas service sectors from privately-owned companies, foreign-invested enterprises and other state-owned enterprises that recently entered the oil and gas industries. Alternative energy sources and new products also pose strong competition against the oil and gas and petrochemical industries. In particular, the booming of the new energy vehicle industry confronts the oil industry with tough challenges. In October 2020, the State Council issued the New Energy Vehicle Industry Development Plan (for 2021-2035), according to which, China expects that the share of new energy vehicles out of total vehicle sales in China to rise to 20% by 2025 and pure electric vehicles to account for the majority of vehicle sales by 2035. We expect to see continued rapid development of the new energy vehicle industry, which will adversely affect the consumption of refined oil products. Competition puts pressure on product prices, affects oil products marketing and requires continuous management focus on identifying new trends, reducing unit costs and improving efficiency. The implementation of our growth strategy requires continued technological advances and innovation, including advances in exploration & production, and refining & chemicals manufacturing technology and advances in technology related to energy usage. Our performance could be impeded if competitors developed or acquired intellectual property rights to technology that we required or if our innovation lagged the industry.
The Eastern and Southern regions of China have a higher demand for refined products and chemical products than the Western and Northern regions. Although we have strived to increase our refinery capacity in the Southern regions of China over recent years, most of our refineries and chemical plants are located in the Northeastern and Northwestern regions of China. We incur relatively higher transportation costs for delivery of our refined products and chemical products to certain areas of the Eastern and Southern regions from our refineries and chemical plants in Western and Northern China. We face strong competition from other traditional domestic oil companies, local independent refineries and other competitors. As a result, we expect that we will continue to encounter difficulty in increasing our sales of refined products and chemical products in these regions.
Risks Related to Outbound Investments and Trading
We are subject to various political, legal and regulatory environments in foreign countries in which we have investments or with which we conduct trading transactions. The legal and regulatory regimes of some of those countries may not be as developed or sophisticated and may differ in many significant respects from those prevailing in developed countries. Expansion into new international markets requires significant resources, management attention and increased legal compliance costs and subjects us to regulatory, economic, tax and political risks. We are also subject to general risks inherent in international operations, such as fluctuations in exchange rates, changes in trade policies, tariff regulations, embargoes and customs clearances, or other trade restrictions, as well political or social unrest or economic instability in regions in which we operate.
As we continue to expand our business and geographic footprint, including in countries with regulatory and compliance regimes with which we are unfamiliar, we will need to adapt and implement compliance and operational protocols to ensure compliance in each such market. The laws and regulations of various countries in which we currently operate or may operate in the future are evolving. Consequently, such laws and regulations may change and sometimes may conflict with each other, making it more difficult for us to be compliant and sometimes may be at odds such that we must make a strategic decision to abandon or scale back operations in some markets. At any time, authorities in the countries where we currently operate may require us to obtain additional, or extend existing, licenses, permits or approvals. However, there is no guarantee that we will be able to obtain these in a timely and cost-effective manner. Authorities may revoke existing licenses, and we may not be able to appeal any such revocations in a timely and/or effective manner, or at all.
Risks Related to Controlling Shareholder
We are a company with controlling shares ultimately owned by the state. CNPC, which is controlled by SASAC, is our controlling shareholder. SASAC’s control over CNPC and CNPC’s control over us are mainly shareholding relationships. SASAC holds the equity interests in state-owned enterprises (such as CNPC) on
 
14

Table of Contents
behalf of the Chinese government. As a result, in the corporate governance structure SASAC is a shareholder and accordingly has to comply with the shareholder’s rights and obligations under the PRC Company Law. Likewise, CNPC’s control over us is also subject to the shareholder’s rights and obligations under the PRC Company Law. Although SASAC does not exert direct influence over us, it can make decisions on significant matters relating to CNPC in its capacity as CNPC’s shareholder and CNPC can in turn resolve on significant matters of our company in its capacity as our shareholder (see the provisions in relation to shareholders’ rights and obligations in our Articles of Association). As a consolidated subsidiary of CNPC, we are subject to certain regulations in relation to state-owned assets. For example, we are subject to the audits by the National Audit Office of the PRC on the compliance of our business, finance and staff. For material merger and acquisition transactions, we are required to retain external asset appraisal firms to evaluate the target assets.
As of December 31, 2021, CNPC beneficially owned approximately 80.41% of our share capital. As a result, CNPC can vote on significant matters relating to our company by exercising its rights as our controlling shareholder, as set forth in detail in our Articles of Association. Accordingly, CNPC is in a position to:
 
   
direct our policies, management and other various affairs;
 
   
subject to applicable PRC laws and regulations and provisions of our Articles of Association, affect the timing and amount of dividend payments and adopt amendments to certain of the provisions of our Articles of Association; and
 
   
otherwise determine the outcome of most corporate actions and, subject to the regulatory requirements of the jurisdictions in which our shares are listed, cause our company to effect corporate transactions without the approval of minority shareholders.
CNPC’s interests may occasionally conflict with those of some or all of our minority shareholders. We cannot assure you that CNPC, as our controlling shareholder, will always vote its shares in a way that benefits our minority shareholders.
In addition to its relationship with us as our controlling shareholder, CNPC by itself or through its affiliates also provides us with certain services and products necessary for our business activities, such as construction and technical services, production services, materials supply services, social services and financial services. The interests of CNPC and its affiliates as providers of these services and products to us may conflict with our interests.
Risks Related to Pricing and Exchange Rate
Our operations are affected by the volatility of prices for crude oil, refined products and natural gas. We set our crude oil median prices monthly based on the international trading prices for crude oil.
In recent years, international prices for crude oil have fluctuated substantially in response to changes in global and regional economy, politics and supply and demand for crude oil. We do not have, and will not have, control over factors affecting international prices for crude oil. For example, in 2020, due to the outbreak of
COVID-19
pandemic and some other reasons, there was a rarely seen drastic drop in oil prices with an unprecedented negative oil price, while in 2022, due to the conflict between Russia and Ukraine and other reasons, crude oil prices rose significantly. Fluctuations and volatility in crude oil prices have a significant impact on our results of operations. The decline in international crude oil prices would have a material adverse effect on our upstream business profits, and also have an impact on our downstream business profits through China’s pricing mechanism of refined oil products, thereby adversely affecting our overall sales revenue and profits. Further, if crude oil prices remain at a low level for a prolonged period, we would be required to determine and estimate whether our oil and gas assets may suffer impairment and, if so, the amount of the impairment. An increase in crude oil prices may, however, increase the production costs of refined products, reduce demand for our products and affect our operating profits.
 
15

Table of Contents
Under the current refined oil pricing mechanism implemented by the PRC government, when there is a change in the average crude oil price in the international market during a given time period, the PRC government can adjust refined oil prices. When international crude oil price experiences significant increases or volatility, the PRC government may strengthen its control over the refined oil prices. As a result, the regulation on refined product prices by the PRC government may reduce our profit and cause our refining assets to suffer impairment.
We negotiate the actual settlement price with natural gas users within the price range permitted by the PRC government. When the domestic price is lower than the international natural gas price, the cost of our imported natural gas will be higher than the sales price of our natural gas, which may reduce our revenues and profit, or result in losses, cause our natural gas assets to suffer impairment.
Currently, the Renminbi is not a freely convertible currency. Exchange and remittance of foreign currencies in China are subject to the supervision of the PRC government’s foreign exchange administrative agencies, such as through filings and/or approval requirements. We maintain a portion of cash and cash equivalents in foreign currencies in the course of our international business, while we receive most of our revenues in Renminbi. We convert foreign currencies from time to time to meet our foreign currency obligations, including repayment of foreign
currency-denominated
debt, payment of overseas capital expenditures and equity investment, import of oil, gas, equipment and materials, and payment of dividends declared with respect to the H Shares and ADSs. The requirements of the PRC government such as filings and approvals with respect to foreign exchange transactions may impose restrictions on our international business.
The value of Renminbi against U.S. dollar and other currencies may fluctuate and is affected by, among other things, changes in China’s political and economic conditions. The PRC government has implemented a floating exchange rate system to allow the value of the Renminbi to fluctuate within a regulated band based on market supply and demand and by reference to a basket of foreign currencies. Because a substantial part of our imports and our outbound investments are settled in foreign currencies, the exchange rates between RMB and U.S. dollars and any other relevant foreign currencies may have an effect on our purchase costs and our investment costs.
Risks Related to Climate Change
In recent years, the oil industry has faced increasingly severe challenges posed by global climate change. Numerous international, domestic and regional treaties and agreements which restrict carbon emissions have been executed and become effective. China and some other countries in which we operate have adopted, or are considering the adoption of, regulations to reduce carbon emissions. These include the adoption of carbon emissions “cap and trade” regimes, carbon taxes, more stringent efficiency standards, and incentives or mandates for clean energy. The Chinese government has announced that China strives to hit carbon peak by 2030 and achieve carbon neutrality by 2060. These policies and measures will bring opportunities to our new energy business, but may lead to changes to our oil extraction and refining businesses. We will continue to enhance our oil and gas exploration and development while seek to explore and use new energy sources, aiming to achieve an integrated development of fossil energy and clean energy. Our proposed initiatives to pursue this strategy will include: to put more efforts into the development and exploitation of geothermal energy, solar energy, wind energy, hydrogen energy and other new energy; to promote the substitution of energy used for our operation with clean energy; to promote the development of
gas-to-power
business; to increase investments in R&D of new energies; to enhance carbon capture, utilization and storage (CCUS) measures; and to improve the overall refinery yield of crude oil. We will endeavor to hit carbon peak by around 2025, achieve an equal share among new energy, oil and gas in our total production capacity (i.e., each accounting for
one-third)
by around 2035, and achieve near-zero emissions by around 2050. In the course of striving to achieve this goal, we expect to encounter the following major risks:
 
   
In terms of market position
: As a result of the acceleration of energy transition in China, clean energy players are expected to be offered more development opportunities and become increasingly
 
16

Table of Contents
 
competitive. On the contrary, the share of fossil fuels in primary energy consumption is expected to decrease. The Chinese government plans to increase the share of
non-fossil
fuels in primary energy consumption from 15% in 2019 to around 25% by 2030. This would have an effect on our position in the refined oil market and the development strategies for the new energy market that we are currently implementing.
 
   
In terms of liquidity
: In order to achieve a success in relation to energy transition initiatives, we expect to spend more on developing and obtaining new technologies and investing in and implementing our business expansion strategy. This will require our company to maintain an appropriate level of liquidity sufficient to support our transition strategies.
 
   
In terms of compliance
: the Chinese government is expected to introduce more stringent policies and standards relating to climate change (mainly relating to energy conservation and carbon emission reduction), which could increase our compliance cost. Any noncompliance may subject us to government investigation or penalties.
 
   
In terms of legal proceedings
: as advised by our PRC legal counsel, at present, under existing PRC laws, the legal basis for initiating any environment-related litigation mainly relates to the laws governing natural resources, environmental or ecological protection. Whether such legal basis is directly applicable to climate change-related litigation remains subject to clarification by further legislation or judicial interpretation. There have only been a few cases in China that are directly or indirectly related to climate change and they are not typical enough to be referred to as precedents. As a result, the potential impact of climate change-related litigation in China on us is not estimable at this stage. Despite that, we have noticed that the Chinese government is working on building a comprehensive legal regime with respect to climate change, and hence we cannot rule out the risk of potential legal proceedings involving oil and gas companies or petrochemical companies in the future.
 
   
In terms of reputation
: A low carbon profile has become an important indication of the influence of energy companies and a major concern for stakeholders. If we fail to meet our
low-carbon
development goals, our reputation may be affected adversely.
 
   
In terms of physical impact
: Natural disasters such as typhoons, rainstorms, floods, and landslides caused by climate change may directly damage our assets and business operations, and the resulting tentative disruption to the supply chain will indirectly affect our operations. As we are an integrated oil and gas operator, with operations extending from upstream to downstream, any tentative supply chain disruption will primarily impact the supply among different segments within our company, and to a lesser extent, the supply to external customers and suppliers. The aforementioned natural disasters may result in, among others, flooding of oil and gas wells, limitations on our ability to operate certain facilities, pipelines exposure, road disruptions and shipping suspensions, any of which can reduce the production of our oil and gas fields, the workload of our refineries and/or the sales volumes of our sales enterprises, and also adversely affect our external suppliers and customers. In extreme scenarios, it may cause tentative disruption of delivery and supply at various parts of the supply chains and adversely affect us and our external suppliers and customers.
See also “Risk Factors — Risks Related to Environmental Protection and Safety Production”.
Risks Related to Environmental Protection and Safety Production
Compliance with changes in laws, regulations and obligations relating to environmental protection and safety production could result in substantial expenditures and reduced profitability from increases in operating costs. In recent years, the PRC government has implemented environmental protection and safety production laws and regulations and has gradually improved refined oil standards which have stricter requirements for our business, and led to an increase in our operating costs. In the future, the PRC government will implement more stringent environmental protection and safety production regulations and impose higher standards on refined oil products. Compliance with these new regulations and standards will increase our costs and expenses.
 
17

Table of Contents
Our oil and gas exploration and production activities shall comply with relevant PRC environmental protection laws and regulations governing abandonment and disposal processes for oil and gas exploration and production activities. We have established standard abandonment procedures pursuant to these laws and regulations. We have included under our asset retirement obligations the costs for these abandonment activities and this asset retirement obligation is based on our best estimate of future abandonment expenditures. In addition, PRC national or local governments may enact stricter environmental protection regulations and our abandonment costs may increase as a result.
Exploring for, producing and transporting crude oil and natural gas and producing and transporting refined products and chemical products involve many hazards. These hazards may result in fires, explosions, spills, blow-outs and other unexpected or dangerous conditions causing personal injuries or death, property damage, environmental damage and interruption of operations.
Some of our oil and natural gas fields and production facilities are surrounded by residential areas or located in areas where natural disasters, such as earthquakes, floods and sandstorms, tend to occur more frequently than in other areas. Any natural disaster or accident encountered by our oil or natural gas fields or production facilities would aggravate any personal injuries, deaths and property damage.
Significant operating hazards and natural disasters such as earthquake, tsunami and health epidemics such as the
COVID-19
pandemic, may cause partial interruptions to our operations, property damage, personal injuries or deaths and environmental damage that could have an adverse impact on our production and operations and financial condition.
Risks Related to Oil and Gas Reserves
The crude oil and natural gas reserves data in this annual report are only estimates. The reliability of reserves estimates depends on a number of factors, assumptions and variables, such as the quality and quantity of our technical and economic data and the prevailing oil and gas prices applicable to our production, some of which are beyond our control and may prove to be incorrect over time. Results of drilling, testing and production after the date of estimates may require substantial upward or downward revisions in our reserves data. Our actual production, revenues and expenditures with respect to our reserves may differ materially from these estimates because of these revisions.
We are actively pursuing business opportunities outside China to improve our international operations. We cannot assure you, however, that we can successfully locate sufficient, if any, alternative sources of crude oil supply due to the complexity of the international political, economic and other conditions. If we fail to obtain sufficient alternative sources of crude oil supply, our results of operations and financial condition may be materially and adversely affected.
Risks Related to Liquidity
We have made best endeavors to ensure an appropriate level of liquidity and financing ability. However, as we are currently making our efforts to find high-quality large-scale reserves, strengthening capacity building in key areas, constructing new, expanding and upgrading some existing, refinery and petrochemical facilities and expanding the oil and gas terminal markets, we may have to make substantial capital expenditures and investments. In addition, we are endeavoring to advance energy transition and striving to achieve our
pre-set
goals (see also “Risks Related to Climate Change”). We cannot assure you that the cash generated by our operations will be sufficient to fund these development plans or that our actual future capital expenditures and investments will not significantly exceed our current planned amounts. If either of these conditions arises, we may have to seek external financing to satisfy our capital needs. Our inability to obtain sufficient funding for our development plans could adversely affect our business, financial condition and results of operations.
 
18

Table of Contents
Risks Related to Audit Reports Prepared by an Auditor who is not Inspected by the Public Company Accounting Oversight Board
As a company with shares registered with the SEC, and traded publicly in the United States, our independent registered public accounting firm is required under the laws of the United States to be registered with the Public Company Accounting Oversight Board, or the PCAOB, and undergo regular inspections by the PCAOB to assess its compliance with the laws of the United States and professional standards. Under PRC laws, however, the PCAOB is currently unable to inspect a registered public accounting firm’s audit work relating to a company’s operations in China without the approval of relevant Chinese authorities. The CSRC also stated that cross-border audit supervision should be realized through regulatory cooperation between China and the United States. Our independent registered public accounting firm’s audit of our operations in China is not subject to PCAOB inspections for the time being. In 2020, the Holding Foreign Companies Accountable Act, or the HFCAA, was signed into law. According to the HFCAA, where a covered foreign company listed in the U.S. retains an auditor who has a branch or office located in a foreign jurisdiction, and the PCAOB is unable to completely inspect or investigate the auditor for three consecutive years because of a position taken by an authority in the foreign jurisdiction, the SEC may prohibit securities of such covered foreign company from being traded on any national securities exchange or
over-the-counter
market in the U.S. and such covered foreign company is required to satisfy certain additional disclosure requirements. In December 2021, the SEC issued the rules to implement the requirements of the HFCAA. According to the rules, starting from the first half of 2022, the SEC will identify, determine and publish a list of the issuers identified by the SEC as subject to the HFCAA (a “covered issuer”); starting from 2024, SEC will impose a trading prohibition on issuers that remain covered issuers for three consecutive years. In December 2021, PCAOB issued the list of accounting firms that it is unable to inspect or investigate completely as determined by it. Both our current external auditor and our former external auditor were included in that list. It is possible that our company could be identified as a covered issuer shortly after the filing of this Form
20-F.
Further, the United States may enact other laws that may include similar rules seeking to address the PCAOB inspection issue. For example, the Senate has passed the Accelerating Holding Foreign Companies Accountable Act, which, if enacted, would shorten the number of
“non-inspection
years” from three years to two years. Although the Chinese and U.S. regulators are currently having dialogues in order to reach a regulatory agreement, we cannot predict whether the dialogues will produce the desired results, and if any, whether they will arrive timely. Implementation of the HFCAA or other efforts to increase U.S. regulatory access to audit information could expose us and the investors of our ADSs to a series of risks. For example,
 
   
the trading of our ADSs on the NYSE may be prohibited or our ADSs may be mandatorily delisted from the NYSE. If that happens, the investors of our ADSs will be forced to sell their ADSs or convert the ADSs into our H Shares;
 
   
the market price of our ADSs may be materially and adversely affected by the risk aversion and other negative market sentiment, regardless of our actual operating conditions;
 
   
if any investor of our ADSs does not convert the ADSs held by him/her into our H Shares for any reason, those ADSs may eventually lose all market value due to the loss of liquidity on the NYSE;
 
   
affected by the decline in the market value of ADSs, the prices of our H Shares, the underlying securities of ADSs, may drop down significantly; and
 
   
the conversion of ADSs into H Shares will incur some costs and cause some inconvenience.
The PCAOB has conducted inspections of independent registered public accounting firms outside of China and has at times identified deficiencies in the audit procedures and quality control procedures of those accounting firms. Such deficiencies may be addressed in those accounting firms’ future inspection process to improve their audit quality. Due to the inability of PCAOB to conduct regular inspections of audit work undertaken in China for the time being, PCAOB is unable to assess the compliance of our independent registered public accounting firm according to applicable U.S. laws and professional standards. This may cause the investors to lose confidence in our financial statements and reports to a certain extent.
 
19

Table of Contents
Risks Related to SEC Litigation Against the “Big Four”
PRC-based
Accounting Firms
On January 22, 2014, Judge Cameron Elliot, an SEC administrative law judge, issued an initial decision suspending the Chinese member firms of the “Big Four” accounting firms, including our independent registered public accounting firm, from, among other things, practicing before the SEC for six months. In February 2014, the initial decision was appealed. While under appeal and in February 2015, the Chinese member firms of “Big Four” accounting firms reached a settlement with the SEC. As part of the settlement, each of the Chinese member firms of “Big Four” accounting firms agreed to settlement terms that include a censure, undertakings to make a payment to the SEC, procedures and undertakings as to future requests for documents by the SEC and possible additional proceedings and remedies should those undertakings not be adhered to.
Had the settlement terms not been adhered to, the Chinese member firms of “Big Four” accounting firms could have been suspended from practicing before the SEC, which could in turn prevent the timely filing of our financial statements with the SEC. In addition, it could be difficult for us to timely identify and engage another registered public accounting firm to audit and issue an opinion on our financial statements and our internal control over financial reporting. A delinquency in our filing of the annual report with the SEC may result in the NYSE initiating delisting procedures, which could harm our reputation and have other material adverse effects on our overall growth and prospect.
Risks Related to Effectiveness of Internal Control over Financial Reporting
The SEC, as required by Section 404 of the
Sarbanes-Oxley
Act of 2002, has adopted rules requiring every public company in the United States to include a management report on such company’s internal control over financial reporting in its annual report, which contains management’s assessment of the effectiveness of our internal control over financial reporting. In addition, an independent registered public accounting firm must attest to and report on the effectiveness of our internal control over financial reporting. Although our management concluded that our internal control over our financial reporting as of December 31, 2021 was effective, and our independent registered public accounting firm has issued an attestation report, which concluded that our internal control over financial reporting was effective in all material aspects as of December 31, 2021, we may discover other deficiencies in the course of our future evaluation of our internal control over our financial reporting and may be unable to remediate such deficiencies in a timely manner. If we fail to maintain the adequacy of our internal control over financial reporting, we may not be able to conclude that we have effective internal control over financial reporting on an ongoing basis, in accordance with the
Sarbanes-Oxley
Act. Moreover, effective internal control is necessary for us to produce reliable financial reports and is important to prevent fraud. As a result, our failure to maintain effective internal control over financial reporting could result in the loss of investor confidence in the reliability of our financial statements, which in turn could harm our business and negatively impact the trading prices of our shares.
Risks Relating Financial Reporting Differences
As a foreign private issuer, we are exempt from certain disclosure requirements under the U.S. Exchange Act, which may afford less protection to you than you would enjoy if we were a domestic U.S. company. As a foreign private issuer, we are exempt from, among other things, the rules prescribing the furnishing and content of proxy statements under the U.S. Exchange Act and the rules relating to selective disclosure of material nonpublic information under Regulation FD under the U.S. Exchange Act. In addition, our executive officers, directors and principal shareholders are exempt from the reporting and short-swing profit and recovery provisions contained in Section 16 of the U.S. Exchange Act. We are also not required under the U.S. Exchange Act to file periodic reports and financial statements with the SEC as frequently or as promptly as domestic U.S. companies with securities registered under the U.S. Exchange Act. For example, in addition to annual reports with audited financial statements, domestic U.S. companies are required to file with the SEC quarterly reports that include interim financial statements reviewed by an independent registered public accounting firm and certified by the companies’ principal executive and financial officers. By contrast, as a foreign private issuer, we
 
20

Table of Contents
are not required to file such quarterly reports with the SEC or to provide quarterly certifications by our principal executive and financial officers. Although we are required by the listing rules of Shanghai Stock Exchange with respect to our A Shares to publish quarterly and semi-annual reports and also required by listing rules of Hong Kong Stock Exchange with respect to our H Shares to publish semi-annual reports, and such reports are furnished to the SEC on Form
6-K,
our financial statements included in the reports are not reviewed by our independent registered public accounting firms, and are only reviewed and signed by all our directors, president and CFO.
Risks Related to the Enforceability of Securities Law Liabilities against Our Officers and Directors
PRC laws and regulations have their foundation in written laws, and PRC laws, regulations and legal requirements dealing with economic matters continue to evolve. PRC laws and regulations are different in certain material areas such as legislation, judicial system, and enforcement from those in the United States and other common law jurisdictions. Because of the
non-binding
nature of prior court decisions in China, the enforcement of laws, regulations and legal requirements involve some degree of uncertainty. The PRC laws and regulations with respect to companies, securities and litigation are different in certain important aspects from those in the United States and other common law jurisdictions, and most of our assets are located in the PRC and most of our directors and substantially all of our executive officers reside in the PRC. As a result, it may be difficult for our shareholders (including investors of our ADSs) to enforce any judgments against our assets or the assets of our directors and officers in an event that they believe their rights have been infringed and even if they successfully bring an action against us or our directors and officers and they are successful in an action of this kind.
Furthermore, due to jurisdictional limitations, the ability of U.S. government agencies, such as the U.S. Securities and Exchange Commission, or the SEC, and the U.S. Department of Justice, or the DOJ, to investigate and bring enforcement actions against us may be limited. PRC laws may constrain the ability of our company and our directors and officers to cooperate with such an investigation or action. For example, according to Article 177 of the PRC Securities Law, no overseas securities regulator is allowed to directly conduct investigations or evidence collection activities within the territory of the PRC. Without the consent of the securities regulatory department of the State Council and other competent authorities under the State Council, no organization or individual may provide documents or materials relating to securities business activities to overseas parties. As a result of the foregoing, our shareholders (including investors of our ADSs) may have difficulty in protecting their interests through actions against our company, directors, officers or our majority shareholder. Shareholder protection through actions initiated by the SEC, DOJ and other U.S. government agencies may also be limited. All these may have an adverse effect on the exercise of rights by the investors of our ADSs.
Risks Related to Anti-Monopoly Initiatives
The Anti-Monopoly Law of the PRC (the “Anti-Monopoly Law”) prohibits the entry into or implementation of any horizontal or vertical monopoly agreements, the taking of any action by abusing dominant market position, and any concentration of business operators that has or may have the effect of excluding or limiting competition. Penalties for violations of the Anti-Monopoly Law include, inter alia, confiscation of illegal gains and imposition of penalties as high as 10% of the sales revenue in the preceding year. We have directed our headquarter office and subsidiaries not to take any action in violation of the Anti-Monopoly Law or any of its supporting laws and regulation in their conduct of business, and have monitored company-wide anti-monopoly compliance through our internal compliance system. Despite that, we cannot assure you that our company can prevent all anti-monopoly compliance risks due to the fact that our company occupies a leading market position, the large scale of our business operations and our company has a large number of subsidiaries and branches. If in the future our company is determined to have deficiencies in the anti-monopoly compliance, or any business model adopted or particular transaction conducted by our company is determined, for example, to have abused our market position, entered into monopoly agreements, or implemented a concentration of business operators in violation of anti-monopoly requirements, we may be subject to investigations or enforcement actions by the government. In the case of such determination, in addition to being subject to a substantial fine, we may need to adjust our business model accordingly or make corresponding changes to a particular transaction structure. All of
 
21

Table of Contents
these would have a material adverse effect on our business operations, financial condition, operating results and corporate reputation, and may reduce the value of our securities and the profits distributable to our shareholders (including investors of our ADSs).
Risks Related to Employee Misconduct
We may not be able to detect or prevent employee misconduct, including misconduct by senior management, and such misconduct may damage our reputation and could adversely affect the trading price of our ordinary shares and ADSs.
We have gradually reinforced and enhanced our internal control and corporate governance policies and procedures in order to strengthen our ability to detect and prevent employee misconduct. We cannot assure you, however, that we will be able to detect or prevent such misconduct in a timely fashion, or at all. If we fail to prevent employee misconduct, our reputation may be harmed, and the trading price of our ordinary shares and ADSs could be adversely affected.
Risks Related to
COVID-19
Since 2020, affected by the
COVID-19
pandemic, the global oil supply and demand have undergone material changes, resulting in a drastic fluctuation in oil prices, creating heavy pressure on the oil and gas industry, which in turn posed a tough challenge to our operations.
In the past two years, many countries’ governments have imposed stringent restrictions to help avoid, or slow down, the spreading of
COVID-19,
including, for example, restrictions on international and local travel, public gatherings and participation in meetings, as well as closures of universities, schools, stores and restaurants, with some countries imposing strict curfews. In China, various forms of restrictions were imposed and certain of them continue to be in place, and there can be no assurance that these restrictions will not be extended further on one or more occasions. Although certain restrictions have been lifted, they may be reinstated in response to resurgence of the
COVID-19
pandemic. These measures have led to a significant decline in demand for, and prices of, our refined oil products, and the restrictions had an adverse effect in the short to medium-term on our oil and gas business chains. Globally, these widespread restrictions in various countries across the world resulted in a decrease in demand for oil, thereby also putting pressure on global oil prices.
Going forward, the impact of the
COVID-19
pandemic on our business will depend on a range of factors which we are not able to accurately predict, including the duration, severity and demographic and geographic scope of the pandemic, including any variants or resurgence and efficacy of any vaccines, the impact of the pandemic on economic activity in China and globally, and the nature and aggressiveness of measures adopted by governments. These factors include, but are not limited to:
 
   
The deterioration of socio-economic conditions and disruptions to our operations, such as our supply chain, refining or distribution capabilities, which may result in increased costs due to the need for more complex supply chain arrangements, to expand existing facilities or to maintain inefficient facilities, or in a reduction of our sales volumes.
 
   
Reductions or volatility in demand for crude oil and refined and petrochemical products due to quarantine or other travel restrictions, economic hardship, retail closures or illness, which may impact our revenue and market share.
 
   
Significant volatility in financial markets (including exchange rate volatility) and measures adopted by governments and central banks that further restrict liquidity, which may limit our access to funds, lead to shortages of cash or increase the cost of raising funds.
 
   
An adverse impact on our ability to engage in new, or consummate pending, strategic transactions on the agreed terms and timetable or at all.
 
22

Table of Contents
As of the date of this report, there is significant uncertainty relating to the severity of the long-term adverse impact of the
COVID-19
pandemic on the global economy, global financial markets and the Chinese economy, and we are unable to accurately predict the long-term impact of the
COVID-19
pandemic on our business. To the extent the
COVID-19
pandemic will adversely affect our business and financial results, it may also have the effect of heightening many of the other risks described in this “Risk Factors” section, such as those relating to macro-economic conditions, pricing and liquidity. See also “Risk Factors — Risks Related to Marco Economic Conditions”, “Risk Factors — Risks Related to Pricing and Exchange Rate.” and “Risk Factors — Risks Related to Liquidity”.
Risks Related to Cyber Security
In recent years, we have increased the utilization of artificial intelligence, cloud computing, big data, Internet of Things, and other types of information technology (“IT”) in our production and operations, our activities are therefore heavily dependent on the reliability and security of our IT systems. Our IT systems may suffer disruptions due to technical failure and disruptions, cyber-attack, computer intrusions and viruses, power and network outages or natural disasters. We have adopted multi-layer technological measures for prevention and detection of cybersecurity problems, and we also train our employees in order to improve their awareness and ability to detect and respond to cybersecurity situations. If our measures prove to be insufficient, deficiencies in any processes could adversely affect or disrupt our normal operations or result in incidents or property loss or personal injuries. Cyberattacks may also result in proprietary information being altered, lost, or stolen; result in employee, customer, or third-party information or material intellectual property being breached, or otherwise disrupt our business operations. In case we suffer any grave cybersecurity incident, we could face regulatory actions, third party litigations or reputational harm in addition to being required to make compensation for direct losses resulting from the incident. As a result, we and our customers, employees, or third parties could be adversely affected, potentially having a material adverse effect on our business and financial conditions.
Risks Related to Insurance
Due to the fact that oil industry is susceptible to high and
industry-specific
risks in nature, the current ordinary commercial insurance cannot cover all the risks we are exposed to. We maintain insurance coverage against liability risks relating to assets that have significant operational risks, auto risks, and third-party liabilities for personal, property, and environmental risks, but not all, potential losses. We may suffer material losses resulting from uninsurable or uninsured risks or insufficient insurance coverage.
Item 4
— INFORMATION ON THE COMPANY
Introduction
History and Development of Our Company
Our legal name is “
中国石油天然气股份有限公司
” and its English translation is PetroChina Company Limited.
We were established as a joint stock company with limited liability under the Company Law of the PRC on November 5, 1999 as part of a restructuring in which CNPC transferred to us most of the assets and liabilities of CNPC relating to its exploration and production, refining and marketing, chemicals and natural gas businesses. In April 2000, we completed a global offering of H Shares and ADSs. In September 2005, we completed a
follow-on
offering of over 3 billion H Shares. In October 2007, we issued 4 billion A Shares. The A Shares were listed on the Shanghai Stock Exchange in November 2007. As of December 31, 2021, CNPC beneficially owned 146,882,339,136 A Shares and 291,518,000 H Shares in us, representing approximately 80.41% of our share capital in aggregate. The H Shares held by CNPC were through Fairy King Investments Limited, an overseas wholly owned subsidiary of CNPC.
 
23

Table of Contents
We are the largest oil and gas producer and seller occupying a leading position in the oil and gas industry in China, one of the largest companies in China in terms of sales revenue, and also one of the largest companies in the world. Currently, our principal business lines include the exploration, development, transmission, production and marketing of crude oil and natural gas; the refining of crude oil and petroleum products, as well as the production and marketing of basic petrochemical products, derivative chemical products and other chemical products; the marketing and trading of refined oil products and
non-oil
products; and the sale of natural gas. Going foward, we will actively develop new energy and new materials businesses.
Currently, substantially all of our crude oil and natural gas reserves and
production-related
assets are located in China. Our exploration, development and production activities commenced in the early 1950s. For seven decades, we have conducted crude oil and natural gas exploration activities in many regions of China. We commenced limited refining operations in the
mid-1950s.
Our chemicals operations commenced in the early 1950s. Our natural gas transmission and marketing activities commenced in Sichuan in Southwestern China in the 1950s. In the early 1960s, we began producing ethylene.
We have continued to pursue attractive business opportunities outside China as part of our business growth strategy to utilize both domestic and international resources to strengthen our competitiveness. Since 2005, we have acquired interests in various oil and natural gas assets in several countries, which significantly expanded our overseas operations and effectively increased our oil and gas reserves and production volumes. At the same time, we have been maintaining certain proportion of imported crude oil and natural gas in accordance with our needs. In 2021, we imported approximately 583.1million barrels of crude oil, as compared to 711.0 million barrels and 679.3 million barrels of crude oil in 2019 and 2020, respectively.
To address climate change concerns, we have adopted an energy transition plan. Pursuant to the plan, we will endeavor to hit carbon peak by around 2025, achieve an equal share among new energy, oil and gas (i.e., each accounting for
one-third)
in our total production capacity by around 2035, and achieve near-zero emissions by around 2050. To that end, we will devote more resources to the development of and the promotion of the utilization of the wind, photovoltaic, thermal, electric power, hydrogen and other types of new energy sources and the promotion of gas power stations.
Our headquarters are located at 9 Dongzhimen North Street, Dongcheng District, Beijing, China, 100007, and our telephone number at this address is
(86-10)
5998-2622.
Our website address is www.petrochina.com.cn. The information on our website is not part of this annual report. We file our annual reports on Form
20-F,
interim reports on Form
6-K
and other documents required to be filed with the SEC on the SEC’s website www.sec.gov.
 
24

Table of Contents
Our Corporate Organization Structure
The following chart illustrates our corporate organization structure as of December 31, 2021.


(1)
Indicates approximate shareholding.
(2)
Indicates approximate shareholding, including the 291,518,000 H Shares indirectly held by CNPC as of December 31, 2021 through Fairy King Investments Limited, a wholly owned overseas subsidiary of CNPC.
(3)
Includes PetroChina Exploration & Development Research Institute, PetroChina Planning & Engineering Institute, PetroChina Petrochemical Research Institute and several other companies.
 
*
Our major subsidiaries, all included in the chart above, are classified into different business segments based on the nature of their principal business activities. See Note 18 to our financial statements for a detailed discussion on this. Other than the major subsidiaries, companies in which we have equity interest mainly include China Oil & Gas Pipeline Network Corporation, CNPC Finance Co., Ltd., CNPC Captive Insurance Company Limited and other associate companies and joint ventures as well as other equity investments measured at fair value through other comprehensive income. See Note 16 and Note 17 to our financial statements for a detailed discussion.
For information on capital expenditures, please see “Item 5 — Operating and Financial Review and Prospects — Liquidity and Capital Resources — Capital Expenditures and Investments.”
Exploration and Production
We engage in crude oil and natural gas exploration, development and production. Substantially all of our total estimated proved crude oil and natural gas reserves are located in China, principally in Northeastern, Northern, Southwestern and Northwestern China. Meanwhile, we have enhanced our overseas cooperation and expanded our strategic presence in five major overseas oil and gas cooperation regions by conducting new project development.
 
25

Table of Contents
In 2021, we adhered to innovation-driven development in the domestic exploration and development business, vigorously enhanced the exploration and development of oil and gas, and endeavored to promote profitable exploration and increase oil and gas reserves and output. We achieved multiple breakthroughs and important discoveries in Ordos, Tarim, Junggar, Sichuan and other key basins, confirmed various large-scale reserves areas, thereby significantly improving the reserves replacement ratio. We implemented the strategy to maintain stable production in old oil and gas fields and undertook construction of profitable capacity in new fields. We continued to maintain the stable output of oil while increasing that of natural gas, as a result of which, the proportion of the natural gas output continuously rose. In 2021, our domestic operations achieved (i) a crude oil output of 753.4 million barrels, representing an increase of 1.3% as compared with last year, (ii) a marketable natural gas output of 4,222.2 Bcf, representing an increase of 5.7% as compared with last year, and (iii) an oil and natural gas equivalent output of 1,457.4 million barrels, representing an increase of 3.4% as compared with last year. We endeavored to expedite our transition to a green and
low-carbon
energy producer, including by investing significant efforts in the development of our new energy business, establishing the Shenzhen New Energy Research Institute, actively promoting the development of new energy and new industry-related projects and continuing to improve the development capability and increase the utilization of new energy sources. The Yumen photovoltaic power generation project with a capacity of 200,000 KW was completed and put into operation, a breakthrough which marked the start of external clean electricity supply for our exploration and production business. The Beijing-Tianjin-Hebei geothermal heating demonstration base, and a series of wind and photovoltaic power generation projects and CCUS projects in Jilin, Daqing, Changqing and Jidong proceeded steadily.
In 2021, our overseas oil and gas business developed steadily. Important discoveries have been made in various projects such as Niger and Chad, promoting the development of oil and gas exploration in those regions in an orderly manner. We completed the construction and commenced the production of multiple newly-built overseas projects such as the PSA project in Chad, and acquired partial interests in Rumaila project. A number of low profitability projects were transferred and disposed. As a result, the structure of our overseas oil and gas assets was continuously optimized. In 2021, (i) the crude oil output from overseas operations amounted to 134.5 million barrels, representing a decrease of 24.4% as compared with last year, (ii) the output of marketable natural gas was 197.8 Bcf, representing a decrease of 12.9% as compared with last year, and (iii) the output of oil and gas equivalent was 167.4 million barrels, representing a decrease of 22.4% as compared with last year. In 2021, the crude oil and natural gas produced by us at overseas regions accounted for 15.1%% and 4.5% of our total production of crude oil and natural gas, respectively, and accounted for 10.3% of our total oil and natural gas equivalent output. The decrease in overseas oil and gas production was mainly due to the impact of the increase in international oil prices, the decrease in product sharing of certain overseas projects and the production restriction policies in some resource-rich countries.
In 2021, our crude oil output amounted to 887.9 million barrels, representing a decrease of 3.7% as compared with last year. The marketable natural gas output reached 4,420.0 Bcf, representing an increase of 4.7% as compared with last year. The oil and natural gas equivalent output amounted to 1,624.8 million barrels, generally remaining the same as last year.
As of December 31, 2021, we hold exploration and exploitation licenses for oil and gas (including coalbed methane) covering a total area of approximately 263.4 million acres, including the exploration licenses covering a total area of approximately 227.0 million acres and the production licenses covering a total area of approximately 36.4 million acres.
 
26

Table of Contents
The following table sets forth the financial and operating data of our exploration and production segment for each of the years ended December 31, 2019, 2020 and 2021:
 
    
Year Ended December 31,
 
    
2019
    
2020
    
2021
 
Revenue (RMB in millions)
     676,320        530,807        688,334  
Profit from operations (RMB in millions)
     96,097        23,092        68,452  
Proved developed and undeveloped reserves Crude oil (million barrels)
     7,253.3        5,206.1        6,063.8  
Natural gas (Bcf)
     76,236.0        76,437.1        74,915.9  
Production
        
Crude oil (million barrels)
     909.3        921.8        887.9  
Natural gas for sale (Bcf)
     3,908.0        4,221.0        4,420.0  
Reserves
As of December 31, 2021, our total estimated proved reserves of crude oil was approximately 6,063.8 million barrels and our total estimated proved reserves of natural gas was approximately 74,915.9 Bcf. As of December 31, 2021, proved developed reserves for crude oil and natural gas accounted for 88.6% and 56.8% of our total proved crude hydrocarbon reserves, respectively. Total proved hydrocarbon reserves, including our overseas crude oil reserves of 778.2 million barrels and overseas natural gas reserves of 1,455.9 Bcf, increased by 3.4% from approximately 17,945.6 million BOE as of December 31, 2020 to approximately 18,549.8 million BOE as of December 31, 2021. Natural gas as a percentage of total proved hydrocarbon reserves was 67.3% as of December 31, 2021.
Approximately 54%, 54% and 57% of our estimated proved reserves as of December 31, 2019, 2020 and 2021, respectively, were assessed by our internal assessment team and audited by our independent engineering consultants. Other information regarding our estimated proved reserves was based on the reserves reports prepared by our independent engineering consultants in accordance with the reserves assessment methodology generally adopted in the U.S. The reserves assessments and reports of our company were performed and prepared in compliance with SEC’s oil and gas reserves reporting rules. Our reserves estimates include only crude oil and natural gas which we believe can be reasonably produced within the current terms of our production licenses or within the terms of the licenses which we are reasonably certain to be renewed. See “Regulatory Matters — Exploration Licenses and Production Licenses” for a discussion of our production licenses. Also see “Item 3 — Key Information — Risk Factors — Risks Related to Oil and Gas Reserves” for a discussion of the uncertainty inherent in the estimation of proved reserves.
We have adopted methods generally accepted in the industry to assess our proved reserves, including production decline curve analysis methods, volumetric methods, material balance methods, and reservoir simulation methods, or a combination of these methods, and took into account economic conditions in performing the assessments. Basic information used by us to assess our proved reserves estimates include geological, geophysical, engineering and financial data as well as other relevant data. In order to satisfy the requirements for establishing a reasonable certainty for proved reserves, including material increase in proved reserves estimates, we adopted field-tested repeatable and consistent reliable technologies, including, among others, logging, 3D seismic data, rock core analyses, static or dynamic pressure tests and production well testing. To the extent that appropriate analogous reservoirs are available, we use analogous reservoir parameters to enhance the quality of our reserves assessment results so as to be consistent with the reliable results required for proved reserves assessment as specified in applicable SEC rules.
Internal Controls Over Reserves Estimates
We have appointed a reserves management committee. The leader of the committee is our president.
 
27

Table of Contents
We have implemented a practicing professional certification regime to supervise our employees engaged in oil and gas reserves evaluation and auditing functions. We have set up a team of reserves auditors covering our headquarter office and regional companies to perform reserves evaluation and audits. Meanwhile, we have established a special reserves management department in our exploration and production segment. Each of the officers and employees of that department has over 20 years of experience in oil industry and many years of experience in
SEC-guided
reserves evaluation. All of the members of that department hold national certified qualifications for handling reserves matters. Each regional company has established a reserves management committee and a
multi-disciplinary
reserves research office. Mr. Duan Xiaowen from the Reserves Administration Division of our exploration and production branch company, is the person in charge of our reserves estimation. Mr. Duan holds a bachelor’s degree in geology and a master’s degree in business administration. He has many years of work experience in oil and gas exploration and development industry and has been engaged in reserves estimate and management for a long time. Since 2008, Mr. Duan has been involved in the supervision of reserves estimation and management in our company. In 2016, Mr. Duan became the division head primarily responsible for overseeing the preparation of the reserves estimates, estimation technology and management. The reserves research offices of the regional companies are responsible for estimating newly discovered reserves and updating the estimates of existing reserves. The results of our oil and gas reserves assessment are subject to a
two-level
review by both the regional companies and our exploration and production branch company, with final examination and approval of the reserves management committee.
In addition, we commissioned independent assessment firms to independently reassess or audit our annually assessed proved reserves in accordance with relevant SEC rules. We disclose the reserves in accordance with the SEC’s oil and gas reporting rules.
The independent engineering consultants providing us with reserves audit and/or assessment for 2021 were DeGolyer and MacNaughton, Ryder Scott Company L.P., GLJ Petroleum Consultants and McDaniel & Associates Consultants Ltd. None of them or their partners, senior officers or employees has any direct or indirect financial interest in our company and the remunerations to the firms are not in any way contingent upon reported reserves estimates. The summaries of the reserves assessment reports and audit reports issued to us by the foregoing independent engineering consultants have been included as exhibits 15.1 through 15.5 to this annual report on Form
20-F.
The following table sets forth our estimated proved reserves (including proved developed reserves and proved undeveloped reserves), proved developed reserves and proved undeveloped reserves of crude oil and natural gas and the changes therein as of December 31, 2019, 2020 and 2021.
 
    
Crude Oil and
Condensate
(1)
   
Natural Gas 
(2)
   
Combined
 
    
(Million barrels)
   
(Bcf)
   
(BOE, in millions)
 
Proved developed and undeveloped reserves
      
On a consolidated basis:
      
Reserves as of December 31, 2018
     7,640.8       76,467.0       20,385.3  
Revisions of previous estimates
     (49.7     (765.6     (177.1
Extensions and discoveries
     480.6       4,442.6       1,221.0  
Improved recovery
     90.9       —         90.9  
Production for the year
     (909.3     (3,908.0     (1,560.8
Reserves as of December 31, 2019
     7,253.3       76,236.0       19,959.3  
Revisions of previous estimates
     (1,553.1     (595.3     (1,652.2
Extensions and discoveries
     385.2       4,976.1       1,214.6  
Improved recovery
     107.7       —         107.7  
Purchased
     15.0       106.9       32.8  
Sold
     (80.2     (65.6     (91.1
Production for the year
     (921.8     (4,221.0     (1,625.5
Reserves as of December 31, 2020
     5,206.1       76,437.1       17,945.6  
Revisions of previous estimates
     1,159.1       (2,011.6     824.1  
 
28

Table of Contents
    
Crude Oil and
Condensate
(1)
   
Natural Gas 
(2)
   
Combined
 
    
(Million barrels)
   
(Bcf)
   
(BOE, in millions)
 
Extensions and discoveries
     472.3       4,885.3       1,286.5  
Improved recovery
     116.7       27.0       121.2  
Purchased
     —         —         —    
Sold
     (2.5     (1.9     (2.8
Production for the year
     (887.9     (4,420.0     (1,624.8
Reserves as of December 31, 2021
     6,063.8       74,915.9       18,549.8  
Proved developed reserves
      
As of December 31, 2018
     5,843.1       40,128.2       12,531.1  
Of which: domestic
     5,203.4       38,433.2       11,609.0  
Overseas
     639.7       1,695.0       922.1  
As of December 31, 2019
     5,473.8       39,869.6       12,118.7  
Of which: domestic
     4,840.0       38,376.3       11,236.0  
Overseas
     633.8       1,493.3       882.7  
As of December 31, 2020
     4,653.6       42,076.7       11,666.4  
Of which: domestic
     3,987.0       40,732.3       10,775.8  
Overseas
     666.6       1,344.4       890.6  
As of December 31, 2021
     5,374.8       42,575.6       12,470.7  
Of which: domestic
     4,799.6       41,343.5       11,690.2  
Overseas
     575.2       1,232.1       780.5  
Proved undeveloped reserves
      
As of December 31, 2018
     1,797.7       36,338.8       7,854.2  
Of which: domestic
     1,626.4       36,046.9       7,634.2  
Overseas
     171.3       291.9       220.0  
As of December 31, 2019
     1,779.5       36,366.4       7,840.6  
Of which: domestic
     1,659.8       36,156.8       7,686.0  
Overseas
     119.7       209.6       154.6  
As of December 31, 2020
     552.5       34,360.4       6,279.2  
Of which: domestic
     387.9       34,062.0       6,064.9  
Overseas
     164.6       298.4       214.3  
As of December 31, 2021
     689.0       32,340.3       6,079.1  
Of which: domestic
     486.0       32,116.5       5,838.8  
Overseas
     203.0       223.8       240.3  
Share of proved developed and undeveloped reserves in associates and joint ventures calculated by the equity method
      
As of December 31, 2018
     321.4       429.4       392.9  
As of December 31, 2019
     287.1       393.6       352.7  
As of December 31, 2020
     195.5       362.7       256.0  
As of December 31, 2021
     208.5       511.4       293.7  
 
(1)
The crude oil and condensate oil reserves as of December 31, 2021 include 278.9 million barrels of NGLs.
(2)
Represents natural gas remaining after field separation for condensate removal and reduction for flared gas.
As of December 31, 2019, 2020 and 2021, our total proved developed and undeveloped reserves on consolidated basis and on equity method, were 20,312 million BOE, 18,202 million BOE and 18,844 million BOE, including 7,540 million, 5,402 million and 6,272 million barrels of crude oil and condense, and 76,629.6 Bcf, 76,799.8 Bcf and 75,427.3 Bcf of natural gas.
Our proved undeveloped reserves were 6,079.1million BOE as of December 31, 2021, representing a decrease of 3.2% as compared to 2020. The main changes in our proved undeveloped reserves in 2021 included
 
29

Table of Contents
(i) an increase of 1,286.5 million BOE through extensions and discoveries; (ii) an increase of 121.2 million BOE through improved recovery; (iii) a reduction of 332.4 million BOE due to certain downward adjustments primarily for purposes of optimizing investment in proved undeveloped reserves; and (iv) the conversion of 1,275.4 million BOE of proved undeveloped reserves into proved developed reserves. In 2021, we spent RMB124,587 million on developing proved undeveloped reserves.
The overwhelming majority of our proved undeveloped reserves are situated around the oil fields that are currently producing. Some of our proved undeveloped reserves of natural gas are scheduled for development more than five years after their initial disclosure primarily due to the effect of
long-term
natural gas supply contracts. The sale of natural gas produced from our reserves located in China is subject to our
long-term
contractual obligations to provide a stable supply of natural gas to customers. We sell all of the natural gas under
long-term
supply arrangements with customers.
There are mainly two types of
long-term
supply arrangements. The first is
multi-year
supply contracts with terms ranging from 20 to 30 years that can be extended upon mutual agreement. The second type is renewable annual contracts. The majority of the natural gas produced in our gas fields in China is put into the nationwide,
long-range
pipeline system to be sold to customers who have entered into
multi-year
supply contracts with us in the areas where the
long-range
pipeline system covers. A small portion of the natural gas produced by our company is put into local pipeline systems to be sold to customers in the areas adjacent to our gas fields. These customers typically have formed
de-facto
long-term
relationships with our company over the years and enter into supply contracts with us before the year end to determine the amount of gas to be purchased for the next year, with such contracts being renewed every year. In general, our supply relationships with customers under the annual contracts have existed for more than ten years.
Mainly as a result of our contractual obligations to ensure a
long-term,
stable supply of natural gas to customers, we must maintain a relatively large amount of proved undeveloped natural gas reserves and develop them over an extended period of time (in some cases, longer than five years).
Most of our proved reserves are located in China and no individual country, region or continent outside of China contains 15% or more of our total proved reserves. In the years ended December 31, 2019, 2020 and 2021, our overseas proved reserves, taken together, accounted for 5.2%, 6.2% and 5.5% of our total proved reserves, respectively.
 
30

Table of Contents
The following tables set forth our crude oil and natural gas proved reserves and proved developed reserves by region as of December 31, 2019, 2020 and 2021.
 
    
As of December 31,
 
    
2019
    
2020
    
2021
 
    
Proved
Developed
and
Undeveloped
    
Proved
Developed
    
Proved
Developed
and
Undeveloped
    
Proved
Developed
    
Proved
Developed
and
Undeveloped
    
Proved
Developed
 
Crude oil reserves (Million barrels)
                 
Daqing
     1,300.9        1,137.4        928.6        881.5        960.1        936.6  
Changqing
     2,098.7        1,376.2        1,262.5        1,185.8        1,516.1        1,380.4  
Xinjiang
     975.8        834.3        717.2        677.8        825.9        774.1  
Other regions in China
     2,140.6        1,506.1        1,479.6        1,254.9        1,983.5        1,708.5  


Overseas
     737.3        619.8        818.2        653.6        778.2        575.2  


Total
     7,253.3        5,473.8        5,206.1        4,653.6        6,063.8        5,374.8  


Natural gas Reserves
(1)
(Bcf)
  
Changqing
     25,589.5        9,362.5        25,969.8        10,700.7        25,467.6        10,910.4  
Tarim
     22,633.8        14,184.2        22,680.6        15,091.9        21,128.9        14,711.3  
Chuanyu
     14,421.5        7,953.2        14,933.6        8,316.5        15,580.2        9,074.3  
Other regions in China
     11,890.5        6,878.3        11,212.0        6,624.9        11,283.3        6,647.5  


Overseas
     1,700.7        1,491.4        1,641.1        1,342.7        1,455.9        1,232.1  


Total
     76,236.0        39,869.6        76,437.1        42,076.7        74,915.9        42,575.6  


(1)
Represents natural gas remaining after field separation for condensate removal and reduction for flared gas.
Exploration and Development
We currently conduct exploration and development in 12 provinces, two municipalities under the direct administration of the central government and three autonomous regions in China as well as in certain regions in other countries.
The following table sets forth the number of wells we drilled, or in which we participated, and the results thereof, in 2019, 2020 and 2021.
 
Year
      
Daqing
   
Xinjiang
   
Changqing
   
Tarim
   
Other
regions in
China
(1)
   
Overseas
   
Total
 
2019                 
  
Net exploratory wells drilled
(2)
    211       157       584       51       576       34.6       1,613.6  
   Crude oil     195       148       359       15       366       23.5       1,106.5  
   Natural gas     2       9       49       13       96       1.8       170.8  
   Dry
(3)
    14       —         176       23       114       9.3       336.3  
  
Net
 
development wells drilled
(2)
    3,008       1,274       5,948       126       4,147       478.8       14,981.8  
   Crude oil     2,990       1,270       4,319       71       3,172       469.2       12,291.2  
   Natural gas     12       4       1,586       47       960       9.6       2,618.6  
   Dry
(3)
    6       —         43       8       15       —         72.0  
 
31

Table of Contents
Year
      
Daqing
   
Xinjiang
   
Changqing
   
Tarim
   
Other
regions in
China
(1)
   
Overseas
   
Total
 
2020                 
  
Net exploratory wells drilled
(2)
    166       151       661       35       526       24.0       1,563.0  
   Crude oil     142       120       380       11       345       17.9       1,015.9  
   Natural gas     9       9       53       8       65       1.8       145.8  
   Dry
(3)
    15       22       228       16       116       4.3       401.3  
  
Net development wells drilled
(2)
    3,264       1,048       4,630       123       2,998       210.5       12,273.5  
   Crude oil     3,240       1,040       3,082       57       2,349       209.5       9,977.5  
   Natural gas     11       8       1,512       59       642       1.0       2,233.0  
   Dry
(3)
    13       —         36       7       7       —         63.0  
2021                 
  
Net exploratory wells drilled
(2)
    207       149       604       39       457       23.3       1,479.3  
   Crude oil     160       86       371       15       265       15.6       912.6  
   Natural gas     17       17       43       8       90       1.1       176.1  
   Dry
(3)
    30       46       190       16       102       6.6       390.6  
  
Net development wells drilled
(2)
    3,387       736       4,034       75       3,124       266.4       11,622.4  
   Crude oil     3,370       732       2,483       42       2,497       262.2       9,386.2  
   Natural gas     6       4       1,518       30       620       4.2       2,182.2  
   Dry
(3)
    11       —         33       3       7       —         54.0  
 
(1)
Represents the Liaohe, Jilin, Huabei, Dagang, Southwest, Tuha, Qinghai, Jidong, Yumen, Zhejiang, Southern and other oil regions.
(2)
“Net” wells refer to the wells after deducting interests of others.
(3)
“Dry” wells are wells with insufficient reserves to sustain commercial production.
As of December 31, 2021,we had 615 net wells in the process of being drilled, including 6.1 net wells located outside of China. As of December 31, 2021, we had 7,172 net wells with multiple completions, including 61.0 net wells located outside of China.
Oil-and-Gas
Properties
The following table sets forth our interests in developed and undeveloped acreage by oil region and in productive crude oil and natural gas wells as of December 31, 2021.
 
                  
Acreage
(1)

(Thousand acres)
 
    
Productive Wells
(1)
    
Developed
    
Undeveloped
 
Oil Region
  
Crude Oil
    
Natural
Gas
    
Crude Oil
    
Natural Gas
    
Crude Oil
    
Natural Gas
 
Daqing
     77,085        636        1,361.84        190.25        478.04        323.37  
Changqing
     68,494        22,979        2,005.33        7,871.47        958.12        2,510.27  
Xinjiang
     34,559        303        471.31        65.55        210.86        24.84  
Tarim
     1,636        816        379.78        304.54        395.25        277.14  


Other regions
(2)
     75,852        14,829        1,517.00        2,013.15        699.64        1,912.02  


Overseas Total
     8,185.4        227.3        288.08        38.64        23.60        10.68  


Total
     265,811.4        39,790.3        6,023.34        10,483.6        2,765.51        5,058.32  


(1)
Includes all wells and acreage in which we have an interest.
 
32

Table of Contents
(2)
Represents the Liaohe, Jilin, Huabei, Dagang, Southwestern, Tuha, Qinghai, Jidong, Yumen, Zhejiang, Southern and other oil regions.
The term of our production licenses covering our acreage located in China varies from 10 to 30 years, depending on the actual size of the blocks. The production licenses with respect to our oil and gas acreage located in China are renewable upon application prior to expiration. Our developed and undeveloped acreage located outside China relates to multiple concessions, blocks and leases, which have materially different contractual terms and conditions. The term of our licenses for acreage development outside China generally varies from 20 to 30 years, and the contracts for certain projects are renewable on a preferred basis upon application prior to expiration. Our decision as to whether to apply for a renewal of any production license for any project located outside China depends on our assessment of the prospects of such project and the need of our development strategies. None of our undeveloped acreage located outside China will expire in the near future.
Production
The following table sets forth our historical average net daily crude oil and natural gas production by region and our average sales price for the years ended December 31, 2019, 2020 and 2021.
 
    
For the Year Ended
December 31,
    
% of

2021
 
    
2019
    
2020
    
2021
 
Crude oil production
(1)
           
(thousand barrels per day, except percentages or otherwise indicated)
           
Daqing
     608.7        595.7        596.3        24.5  
Changqing
     488.8        497.7        513.0        21.1  
Xinjiang
     252.1        262.2        273.6        11.2  
Other
(2)
     1,141.6        1,162.9        1,049.7        43.2  


Total
     2,491.2        2,518.5        2,432.6        100.0  


Annual production (million barrels)
     909.3        921.8        887.9     
Domestic
     739.7        743.8        753.4     
Overseas
     169.6        178.0        134.5     
Average sales price (US$ per barrel)
     60.96        40.33        65.58     
Natural gas production
(1)(3)
           
(million cubic feet per day, except percentages or otherwise indicated)
           
Changqing
     3,481.3        3,757.6        3,916.9        32.3  
Tarim
     2,535.2        2,748.0        2,820.6        23.3  
Chuanyu
     2,375.6        2,793.7        3,140.3        25.9  
Other
(4)
     2,314.9        2,233.5        2,231.8        18.5  


Total
     10,707.0        11,532.8        12,109.6        100.0  


Annual production (Bcf)
     3,908.0        4,221.0        4,420.0     
Domestic
     3,633.0        3,993.8        4,222.2     
Overseas
     275.0        227.2        197.8     
Average realized price (US$ per Mcf)
     5.39        4.80        7.59     
 
(1)
Production volumes for each region include our share of the production from all of our cooperative projects with foreign companies in that region.
(2)
Represents production from the Liaohe, Jilin, Huabei, Dagang, Tarim, Tuha, Qinghai, Jidong, Yumen, Southern and other oil regions and our share of overseas production as a result of our acquisition of overseas assets.
(3)
Represents production of natural gas for sale.
 
33

Table of Contents
(4)
Represents production from the Daqing, Qinghai, Tuha, Xinjiang, Liaohe, Huabei, Dagang, Jilin, Jidong, Yumen, Zhejiang, Southern and other oil and gas regions and our share of overseas production as a result of our acquisition of overseas assets.
In 2021, we supplied a substantial majority of our total crude oil sales to our own refineries. In addition, we and Sinopec supply crude oil to each other’s refineries to allow supplies to be easily obtained from nearby resources.
The following table sets forth our average sales prices and average lifting costs of crude oil and natural gas of our company on an overall basis and those in China in 2019, 2020 and 2021.
 
    
Crude Oil Average
Realized Prices
(RMB/ton)
    
Natural Gas
Average Realized Prices
(RMB/Kilostere)
    
Average Lifting
Cost

(US$/BOE)
 
2019
        
Overall
     3,107        1,313        12.11  
— China
     3,097        1,437        13.29  
2020
        
Overall
     2,056        1,170        11.10  
— China
     2,111        1,314        12.19  
2021
        
Overall
     3,126        1,729        12.30  
— China
     3,140        1,426        13.06  
Principal Oil and Gas Regions
Daqing Oil Region
In 1950s, we discovered the Daqing oil region. The Daqing oil region is our largest oil and gas producing property, located in the Songliao basin and consisting of 40 oilfields. In 2021, the Daqing oil region produced an average of 596.3 thousand barrels of crude oil per day, representing approximately 24.5% of our total daily crude oil production.
As of December 31, 2021, our proved crude oil reserves in the Daqing oil region were 960.1 million barrels, representing 15.8% of our total proved crude oil reserves. As of December 31, 2021, the crude oil
reserves-to-production
ratio of the Daqing oil region was approximately 4 years.
Daqing’s crude oil has low sulfur and high paraffin content. As many refineries in China, particularly those in Northeastern China, primarily refine Daqing crude oil, we have a stable market for the crude oil we produce in the Daqing oil region.
Changqing Oil and Gas Region
In the early 1990s, we discovered the Changqing oil and gas region, which covers parts of Shaanxi Province, Gansu Province, Ningxia, Inner Mongolia and Shanxi Province and consists of 47 oil and gas producing blocks. In 2021, the Changqing oil region produced an average of 513.0 thousand barrels of crude oil per day and an average of 3.9 Bcf of natural gas for sale per day, respectively, representing approximately 21.1% of our total daily crude oil production, and approximately 32.3% of our total daily natural gas for sale, respectively.
As of December 31, 2021, the Changqing oil and gas region had total proved crude oil reserves of 1,516.1 million barrels and total proved natural gas reserves of 25,467.6 Bcf, respectively, representing 25.0% of our total proved crude oil reserves and 34.0% of our total proved natural gas reserves, respectively. As of December 31, 2021, the crude oil and gas
reserves-to-production
ratio at the Changqing oil region was approximately 14 years.
 
34

Table of Contents
In January 2001, we discovered the Sulige gas field in the Changqing oil and gas region, which had total proved natural gas reserves of 14,793.7 Bcf as of December 31, 2021. Sulige gas field is currently the largest gas field in China.
Changqing crude oil has low sulfur content and is paraffin-based. We have configured the Changqing oil region with refineries specializing in the refining of Changqing crude oil located in the adjacent area. Sinopec also has refineries nearby. In addition, supporting railway facilities have been built for outgoing transportation of relevant products from the Changqing oil and gas region. We therefore have a stable market for the crude oil we produce in the Changqing oil region. The majority of the natural gas produced at the Changqing oil and gas region has been transmitted to Beijing, Tianjin and Hebei regions and a small portion is offered for sale in Shaanxi, Inner Mongolia, Gansu, Ningxia and other parts of Northwestern China.
Xinjiang Oil Region
We commenced operations in the Xinjiang oil region in 1951. The Xinjiang oil region is located in the Junggar basin in Northwestern China, consisting of 29 oil producing blocks. In 2021, our crude oil production fields in the Xinjiang oil region produced an average of 273.6 thousand barrels per day, representing approximately 11.2% of our total daily crude oil production.
As of December 31, 2021, our proved crude oil reserves in the Xinjiang oil region were 825.9 million barrels, representing 13.6% of our total proved crude oil reserves. As of December 31, 2021, the crude oil
reserves-to-production
ratio at the Xinjiang oil region was approximately 8 years.
Xinjiang crude oil comes in multiple varieties, namely light crude oils, medium crude oils and heavy crude oils. We have configured Xinjiang oilfields with refineries located in the adjacent area and pipelines for crude oil outgoing transportation so that the crude oil produced in the Xinjiang oil region can be delivered to other refineries located in the western region. We therefore have a stable market for the crude oil we produce in the Xinjiang oil region.
Tarim Oil and Gas Region
In 1980s, we discovered Tarim oil and gas region. The Tarim oil and gas region is located in the Tarim basin in Northwestern China, consisting of 14 oil producing blocks. In 2021, the Tarim oil and gas region produced an average of 128.9 thousand barrels of crude oil per day and an average of 2.8 Bcf of natural gas for sale per day, respectively, representing approximately 5.3% of our total daily crude oil production, and approximately 23.3% of our total daily natural gas for sale, respectively.
As of December 31, 2021, the Tarim oil and gas region had total proved crude oil reserves of 483.8 million barrels and total proved natural gas reserves of 21,128.9 Bcf, respectively, representing 8.0% of our total proved crude oil reserves and 28.2% of our total proved natural gas reserves, respectively. As of December 31, 2021, the oil and natural gas
reserves-to-production
ratio in the Tarim oil and gas region was approximately 18 years.
We deliver natural gas in the Tarim oil and gas region through gas pipelines to the central and eastern regions of China where there is strong demand for natural gas.
Chuanyu Gas Region
We commenced natural gas exploration and production in the Chuanyu gas region in the 1950s. The Chuanyu gas region is located in the Sichuan basin in Southwestern China, consisting of 117 gas producing blocks.
In 2021, the Chuanyu gas region produced an average of 3.1 Bcf of natural gas for sale per day, representing approximately 25.9% of our total daily natural gas for sale. As of December 31, 2021, our proved natural gas
 
35

Table of Contents
reserves in the Chuanyu gas region were 15,580.2 Bcf, representing 20.8% of our total proved natural gas reserves. As of December 31, 2021, the natural gas
reserves-to-production
ratio in the Chuanyu gas region was approximately 14 years.
In 2019, we discovered the Sichuan shale gas field in the Chuanyu gas region. As of December 31, 2021, the proved reserves in the Sichuan shale gas field were 1,804.1 Bcf.
The majority of the natural gas produced at the Chuanyu gas region is offered for sale in the Chuanyu region and only a small portion is transmitted to Central and South China.
Refining and Chemicals
We now operate 33 enterprises located in nine provinces, four autonomous regions and three municipalities to engage in refining of crude oil and petroleum products, as well as the production and marketing of basic petrochemical products, derivative chemical products and other chemical products.
The following table sets forth the financial and operating data of our refining and chemicals segment for each of the years ended December 31, 2019, 2020 and 2021.
 
    
Year Ended December 31,
 
    
2019
    
2020
   
2021
 
Revenue (RMB in millions)
     1,000,062        774,775       974,972  
Profit from operations/(loss) (RMB in millions)
     16,077        (1,834     49,740  
Crude oil processed (million barrels)
     1,228.4        1,177.5       1,225.0  
Crude oil primary distillation capacity (million barrels/year)
     1,463.0        1,492.6       1,492.6  
Production of refined oil products (thousand tons)
     117,791        107,042       108,712  
Refining
Refined Products
We produce a wide range of refined products at our refineries. Some of the refined products are for our internal consumption and used as raw materials in our petrochemical operation. The table below sets forth production volumes for our principal refined products for each of the years ended December 31, 2019, 2020 and 2021.
 
    
Year Ended December 31,
 
Principal Products
  
2019
    
2020
    
2021
 
    
(In thousand tons)
 
Diesel
     54,628        50,719        48,245  
Gasoline
     50,430        46,280        49,388  
Kerosene
     12,733        10,043        11,079  
Lubricants
     1,630        1,575        1,964  
Fuel oil
     1,672        4,086        6,662  
Naphtha
     12,829        12,706        12,878  
Our Refineries
Most of our refineries are strategically located close to our crude oil production and storage bases along the crude oil and refined product transmission pipelines and railways, which provide our refineries with secure supplies of crude oil and facilitate our distribution of refined products to the domestic markets.
 
36

Table of Contents
In 2021, we developed our refining business by adhering to the market-orientated principle and closely aligning production with sales. We endeavored to pursue the strategy to reduce oil refining and increase chemical production, including by further reducing the yield of refined oil and optimizing the refining product mix. We reduced the ratio of diesel to gasoline in our production to 0.98 by December 31, 2021, and substantially increased the output of aviation kerosene, lube base oil and paraffin in 2021. We continuously optimized the allocation of resources by following the principle to allocate more crude oil resources to enterprises which contributed more profits.
In 2019, 2020 and 2021, our exploration and production operations supplied approximately 55.7%,57.6% and 55.8%, respectively, of the crude oil processed in our refineries.
In 2021, Daqing Petrochemical, Jilin Petrochemical, Fushun Petrochemical, Lanzhou Petrochemical, Dushanzi Petrochemical, Dalian Petrochemical, Dalian West Pacific, Liaoyang Petrochemical, Huabei Petrochemical, Urumqi Petrochemical, Guangxi Petrochemical, Sichuan Petrochemical and Yunnan Petrochemical were our principal refineries in terms of both primary distillation capacity and refining throughput. The table below sets forth the primary distillation capacity and refining throughput of our principal refineries as of December 31, 2019, 2020 and 2021.
 
    
As of December 31,
 
    
2019
    
2020
    
2021
 
Primary distillation capacity
(1)
(thousand barrels per day)
        
Daqing Petrochemical
     121.5        202.4        202.4  
Jilin Petrochemical
     198.4        198.4        198.4  
Fushun Petrochemical
     222.7        222.7        222.7  
Lanzhou Petrochemical
     212.6        212.6        212.6  
Dushanzi Petrochemical
     202.4        202.4        202.4  
Dalian Petrochemical
     415.0        415.0        415.0  
Dalian West Pacific
     202.4        202.4        202.4  
Liaoyang Petrochemical
     182.2        182.2        182.2  
Huabei Petrochemical
     202.4        202.4        202.4  
Urumqi Petrochemical
     172.1        172.1        172.1  
Guangxi Petrochemical
     202.4        202.4        202.4  
Sichuan Petrochemical
     202.4        202.4        202.4  
Yunnan Petrochemical
     263.2        263.2        263.2  
Other refineries
     1,208.6        1,208.7        1,208.7  


Total
     4,008.3        4,089.3        4,089.3  


(1)
Represents the primary distillation capacity of crude oil and condensate.
 
37

Table of Contents
    
As of December 31,
 
    
2019
    
2020
    
2021
 
Refining throughput
(thousand barrels per day)
        
Daqing Petrochemical
     122.3        122.6        163.6  
Jilin Petrochemical
     186.1        178.8        158.7  
Fushun Petrochemical
     176.4        162.8        145.2  
Lanzhou Petrochemical
     185.2        183.7        182.4  
Dushanzi Petrochemical
     124.9        143.6        147.6  
Dalian Petrochemical
     324.4        269.0        317.8  
Dalian West Pacific
     146.0        166.0        166.9  
Liaoyang Petrochemical
     170.5        173.3        165.9  
Huabei Petrochemical
     128.9        110.4        123.5  
Urumqi Petrochemical
     117.6        123.2        125.4  
Guangxi Petrochemical
     196.5        157.5        197.2  
Sichuan Petrochemical
     177.2        207.3        166.9  
Yunnan Petrochemical
     216.9        154.8        197.0  
Other refineries
     1,092.7        1,072.9        1,098.0  


Total
     3,365.6        3,225.9        3,356.1  


In 2021, The Changqing and Tarim
ethane-to-ethylene
projects were completed and put into operation, and the construction of Guangdong Petrochemical and other key projects was accelerated.
The table below sets forth the major indicators of the realized productivity of our refineries in each of 2019, 2020 and 2021.
 
    
2019
    
2020
    
2021
 
Average utilization rate of primary distillation capacity (%)
     85.1        80.0        82.5  
Average yield for principal refined products (%)
(1) (2)
     71.8        68.2        66.8  
Overall refining yield (%)
     93.5        93.5        93.9  
 
(1)
Principal refined products include gasoline, kerosene, diesel and lubricant.
(2)
“Yield” represents the number of tons of a refined product expressed as a percentage of the number of tons of crude oil from which that product is processed.
Chemicals
Most of our chemical plants are close to our refineries and are connected to the refineries by pipelines, providing additional production flexibility and opportunities for cost competitiveness. The raw materials required by our chemicals operations are mainly supplied by our own refineries.
In 2021, we maintained high-load operation of our chemical plants, and increased production and sales of
high-end
and high-value-added chemical products when appropriate, by closely monitoring market demand and price changes and forecasting market trends. We endeavored to promote the new materials business, including by establishing the Shanghai Institute for New Materials, enhancing scientific and technological innovation, launching a number of technological research and actively carrying out R&D of new chemical products and new materials. We also proactively adjusted the operation philosophy, developed marketing strategies for chemical products on a
region-by-region
basis, promoted the online operation of “PetroChina
e-Chemical”,
actively expanded
high-end
market and
end-customer
channel of chemical products. In 2021, the volume of our chemical products for sale increased by 6.7% as compared with last year. The output of products, such as ethylene, synthetic resin, synthetic rubber and urea, increased to some extent as compared with last year. The output of functional synthetic resin, high-performance synthetic rubber, special fibers,
high-end
carbon materials and other new materials increased significantly in 2021.
 
38

Table of Contents
Our Chemical Products
The table below sets forth the production volumes of our principal chemical products for each of the years ended December 31, 2019, 2020 and 2021.
 
    
Year Ended December 31,
 
    
2019
    
2020
    
2021
 
    
(In thousand tons)
 
Basic petrochemicals
        
Ethylene
     5,863        6,345        6,713  
Derivative petrochemicals
        
Synthetic resin
     9,580        10,287        10,903  
Synthetic fiber raw materials and polymers
     1,309        1,278        1,146  
Synthetic rubber
     910        1,001        1,044  
Other chemicals
        
Urea
     1,208        2,163        2,422  
We are one of the major producers of ethylene in China. We use the bulk of the ethylene we produce as a principal feedstock for the production of many chemical products, such as polyethylene. As of December 31, 2021, our annual ethylene production capacity was 7,410 thousand tons. We produce a number of synthetic resin products, including polyethylene, polypropylene and ABS. As of December 31, 2021, our annual production capacities for polyethylene, polypropylene and ABS were 6,460 thousand tons, 4,220 thousand tons and 710 thousand tons, respectively.
Marketing of Chemicals
Our chemical products are distributed to a number of industries including the automotive, construction, electronics, pharmaceutical, printing, electrical appliances, household products, insulation, packaging, paper, textile, paint, footwear, agriculture and furniture industries.
The following table sets forth the sales volumes of our chemical products by principal product category for each of the years ended December 31, 2019, 2020 and 2021.
 
    
Year Ended December 31,
 
Products
  
2019
    
2020
    
2021
 
    
(In thousand tons)
 
Derivative petrochemicals
  
Synthetic resin
     9,777.8        10,912.8        11,302.1  
Synthetic fiber
     39.1        25.2        22.7  
Synthetic rubber
     1,011.1        1,098.4        1,066.4  
Intermediates
     11,354.7        12,929.0        13,525.6  
Other chemicals
        
Urea
     1,561.2        2,596.9        2,399.1  
Marketing
We engage in the marketing of refined products through 34 regional sales companies including two distribution branch companies and one convenience store chain company, PetroChina uSmile Company Limited, operated under the trade name “uSmile”. These operations include the transportation and storage of the refined products, the wholesale, retail and export of gasoline, diesel, kerosene and other refined products, and
non-oil
business. In addition, with respect to our international trading sector, we have optimized the import and export resources, focused on synergies, actively expanded into the
high-end
markets, and maintained growth in trading volume and improved operation results.
 
39

Table of Contents
The following table sets forth the financial and operating data of our marketing segment for each of the years ended December 31, 2019, 2020 and 2021:
 
    
Year Ended December 31,
 
    
2019
   
2020
   
2021
 
Revenue (RMB in millions)
     2,075,044       1,497,533       2,170,062  
(Loss)/profits from operations (RMB in millions)
     (2,878     (2,906     13,277  
External sales volume of gasoline, kerosene and diesel (thousand tons)
     187,712       161,230       163,307  
With respect to our domestic sales business, we market a wide range of refined products, including gasoline, diesel, kerosene and lubricants, through an extensive network of sales personnel and independent distributors and a broad wholesale and retail distribution network across China. Our marketing network consists of:
 
   
Nationwide wholesale distribution outlets. Almost all of these outlets are located in high demand areas across China, particularly in the coastal areas, along major railways and along the Yangtze River. We sell refined products both directly and through distributors to various wholesale markets, as well as to utility, commercial, petrochemical, aviation, agricultural, fishery and transportation companies in China. Our gasoline and diesel sales also include the amount we sold to our retail operations; and
 
   
Service stations owned and operated by us and franchised service stations owned and operated by third parties across China including Hong Kong.
In relation to domestic marketing, in 2021 we further enhanced our domestic marketing efforts, and used every endeavor to expand our sales and improve profitability while ensuring the smooth operations of the business chain. We actively innovated the business model of our domestic marketing business, accelerated the promotion and application of direct wholesale apps, flexibly adjusted gasoline and diesel marketing strategies, put into use the first batch of commercial intelligent fueling robots and continued to improve the quality and efficiency of retailing business. We invested efforts into the development of gas stations in the markets where we have an advantage or higher profitability. The number of gas stations in operation reached 22,800. Development of our new energy business was accelerated, with the first integrated service demonstration station to offer oil, gas, hydrogen, electricity and
non-fueling
products completed and put into operation in Beijing. Furthermore, a series of hydrogen refueling stations, battery-swap stations and photovoltaic stations were put into operation. We strengthened our integrated and mutual marketing efforts for oil and
non-oil
businesses, promoted the marketing of our own commodities, poverty alleviation commodities and specialty commodities, and the gross profit of
non-oil
business increased significantly as compared with last year.
In relation to international trade, in 2021 we focused on domestic and overseas resources and markets, deepened global integration and cooperation, optimized supply chain management, enhanced the marketing efforts for oil and gas, optimized the pace of refined oil exports, and expanded overseas markets for refining and chemical products.
The PRC government and other institutional customers, including railway, transportation and fishery operators, are
long-term
purchasers of the gasoline and diesel that we produce. We sell gasoline and diesel to these customers based on the supply prices for special customers prescribed by the PRC government. See “— Regulatory Matters — Pricing — Refined Products” for a discussion of refined product pricing.
 
40

Table of Contents
The following table sets forth information relating to our sales for each of the years ended December 31, 2019, 2020 and 2021 in the marketing segment:
 
    
As of December 31,
 
    
2019
    
2020
    
2021
 
Sales volume of gasoline, kerosene and diesel (thousand tons)
     187,712        161,230        163,307  
Of which: Gasoline
     76,366        66,084        65,981  
Kerosene
     21,183        14,350        15,598  
Diesel
     90,163        80,796        81,728  
Domestic sales volume of gasoline, kerosene and diesel (thousand tons)
     118,995        105,896        112,493  
Of which: gasoline
     53,546        49,188        52,626  
Kerosene
     8,696        8,331        9,005  
Diesel
     56,753        48,377        50,862  
Lubricants (thousand tons)
     977        1,404        1,565  
Market share in domestic refined oil market (%
     36.7        35.9        35.3  
Number of service stations
     22,365        22,619        22,800  
Of which: owned service stations
     20,955        21,042        20,734  
Sales volume per service station (tons/day)
     10.08        8.48        8.05  
Number of convenience stores
     20,021        20,212        20,178  
Natural Gas and Pipeline
We are China’s largest natural gas seller. We sell natural gas primarily to industrial companies, power plants, fertilizer and chemical companies, commercial users and municipal utilities owned by local governments.
In 2021, we developed the business of the natural gas and pipeline segment by seizing the favourable opportunities of recovery in market demand, vigorously developing wholesale and retail markets as well as direct supply and sales customers, strengthening the efforts to promote the combination of oil with gas, integration of gas and power and integration of gas fired power and new energy, and actively carried out online bidding transactions. We continued to optimize the structure of gas resources, and effectively ensured the safe and stable supply of natural gas. The construction of key projects proceeded in an orderly manner. The Tangshan LNG emergency peak regulation safeguarding project, the third phase of the Jiangsu LNG terminal stations and related branch pipelines were completed and put into operation.
The following table sets forth the financial and operating data of our natural gas and pipeline segment for each of the years ended December 31, 2019, 2020 and 2021:
 
    
As of December 31,
 
    
2019
    
2020
    
2021
 
Revenue (RMB in millions)
     391,023        370,771        417,022  
Profit from operations (RMB in millions)
     26,108        72,410        43,965  
Total length of natural gas pipelines (km)
     53,291        22,555        17,329  
Total length of crude oil pipeline (km)
     20,091        7,190        7,340  
Total length of refined oil products pipeline (km)
     13,762        1,406        1,407  
Total volume of natural gas sold (Bcf)
     9,149.8        8,784.4        9,675.4  
Our Principal Markets for Natural Gas
We sell our natural gas across China. Our natural gas supply covers all provinces, municipalities under direct administration of the central government, autonomous regions and Hong Kong of China, except Macau
 
41

Table of Contents
and Taiwan. The Bohai Rim, the Yangtze River Delta and the Southwestern region in China are our principal markets for natural gas. In addition, provinces such as Inner Mongolia, and Anhui consume more and more natural gas and have become another significant natural gas market of us. We supply natural gas to these regions primarily through pipelines except for Tibet where we supply natural gas by LNG tanker trucks.
Driven by environmental and efficiency concerns, the PRC government is increasingly encouraging industrial and residential use of natural gas. The PRC government has adopted a number of laws, regulations and policy goals to encourage the use of clean energy, such as natural gas and liquefied petroleum gas, to reduce environmental pollution. The PRC government has granted preferential tax rate to natural gas operations. The current value-added tax rate for natural gas is 9%, while the value-added tax rate for crude oil and refined oil products is 13%. In 2017, the PRC government issued a new policy to accelerate the large-scale and high-efficient utilization of natural gas in urban gas, industrial fuel,
gas-fired
power generation and transportation, and to significantly increase the proportion of use of natural gas in primary energy consumption. The overall goal of the policy is that the proportion of natural gas in the primary energy consumption to reach around 10% by 2020 and 15% by 2030, and the underground gas storage to form an effective working gas volume of over 14.4 billion cubic meters by 2020 and over 35 billion cubic meters by 2030. We believe that these favorable policies will continue to benefit our natural gas business.
Pipeline Business
In 2020, we sold our interests in certain branch companies, subsidiaries and associated companies, which together held our major pipeline assets to PipeChina in exchange for 29.9% of the equity interests in PipeChina and a cash consideration. The assets included our major oil and gas pipelines, certain gas storage facilities, oil storage facilities, LNG terminals and ancillary facilities, and the initial oil and gas inventory contained therein. In 2021, our subsidiary Kunlun Energy sold its equity interests in two entities holding pipeline assets to PipeChina for a cash consideration. Upon completion of the transactions, PipeChina has become the operator of the pipeline assets, providing us and other customers with pipeline transmission services. Pursuant to our agreements with PipeChina, PipeChina warranted that after completion of the transactions, the target assets shall remain in normal operations, and the quality of the services provided to us to be no lower than the previous level. Furthermore, PipeChina undertook that it will not take any action or allow any nonaction that may adversely affect our continuous normal use of any target assets in our production and operation. The pipeline assets retained by us after completion of the transactions mainly consist of the internal pipelines within our oil and gas fields and the pipelines connecting our oilfields to our refineries. As a shareholder of PipeChina, we participate in the corporate governance of PipeChina in accordance with its articles of association and we coordinate with PipeChina on our requirements and proposals with respect to the pipeline operations according to the agreements entered into between PipeChina and us.
During the past three years, we have not experienced any delays in delivering natural gas, crude oil and refined products due to pipeline capacity constraints.
Competition
As an oil and gas company operating in a competitive industry, we compete in each of our business segments in both China and international markets for desirable business prospects and for customers. At present, our principal competitors in China are China Petrochemical Corporation, or Sinopec Group, and China National Offshore Oil Corporation, or CNOOC.
Exploration and Production Operations
We are the largest onshore oil and gas company in China in terms of proved crude oil and natural gas reserves as well as crude oil and natural gas production and sales. However, we compete with other domestic oil
 
42

Table of Contents
and gas companies for the acquisition of desirable crude oil and natural gas prospects. Similarly, we face some competition in the development of offshore oil and gas resources. In 2019, the Chinese government lifted the restrictions on foreign investment in oil and gas exploration and development, which had been limited to joint ventures and cooperation, introduced market competition mechanisms in the oil and gas industry to support private enterprises participating in oil and gas exploration and development. These policy changes mean that the barriers to entering the area of oil and gas exploration have been removed, and our exploration and development business may face heightened competition from foreign capital and private enterprises. In addition, the competition of international energy supply has intensified, the crude oil market continues to fluctuate, and price volatility has become frequent. We believe that our experience in crude oil and natural gas exploration and production and our advanced exploration and development technologies that are suitable for the diverse geological conditions in China will enable us to maintain our leading position in discovering and developing crude oil and natural gas reserves in China.
Refining and Chemicals Operations and Marketing Operations
We compete with our primary competitor Sinopec in our refining and chemicals operations and marketing operations on the basis of price, quality and customer service. Most of our refineries and chemical plants are located in the Northeastern and Northwestern regions of China where we have the significant market share for refined products and chemical products. We sell the remainder of our refined products and chemical products to the Eastern, Southern, Southwestern and
Central-southern
regions of China, where our products have a considerable market share. The Eastern and Southern regions of China, where refined products and chemical products are in higher demand, are important markets for our refined products and chemical products. Sinopec has a strong presence in the Eastern and Southern regions of China in competition with us, and most of Sinopec’s refineries, chemical plants and distribution networks are located in these regions in close proximity to these markets. Moreover, as the newly constructed facilities of CNOOC commenced operation in the same region, large quantity of chemical products have been marketed into that area, which made the competition even intense. We expect that we will continue to face competition in our refined products and chemical products sales in these regions.
In recent years, China has gradually liberalized the restrictions on market access for the refining and chemical industry. The refining and chemical industry led by us and Sinopec has been rapidly transformed into diversified market participants. Some large state-owned enterprises and private enterprises have entered the refining and chemical industry. Local refineries have rapidly emerged, and international refining and chemical companies have recently opened large refineries in China. The restrictions on foreign investment in wholesale and retail chains of refined oil have been further liberalized. In 2019, the Chinese government issued policies to further liberalize market access for private enterprises, encouraging private enterprises to enter the industries of refineries and sales, and to construct storage and transportation infrastructure for refined oil, and encourage qualified enterprises to participate in crude oil imports and refined oil exports. We expect to continue to face strong market competition.
We also face competition from imported refined products and chemical products in terms of price and quality. In recent years, competition from foreign producers of refined products and chemical products has increased as a result of changes in China’s tariff policies toward imported refined products and chemical products. In response, we have sought to reduce our production costs, improve the quality of our products and optimize our product mix.
In addition, we also face competition from alternative energy. Alternative energy is developing rapidly in China, and electric power, liquefied gas, natural gas and biodiesel have increasingly become effective alternatives to refined oil, continually reducing the demand for refined oil. Among them, vehicular natural gas is still the main substitute for refined oil. Driven by the national policy and breakthroughs in battery and self-driving technologies, China’s electric vehicle industry has developed rapidly, which has led to a rapid growth in the number of electric cars in China. Electricity is expected to replace vehicular natural gas as the primary
 
43

Table of Contents
alternative energy source for refined oils and will continuously reduce the importance of refined oils as a major energy source. In October 2020, the State Council issued the New Energy Vehicle Industry Development Plan (for 2021-2035), according to which China expects that the share of new energy vehicles out of total vehicle sales in China will rise to 20% by 2025 and pure electric vehicles will account for the majority of vehicle sales by 2035.
Natural Gas and Pipeline Operations
We are the largest natural gas supplier in the PRC in terms of sales volume. Currently, we mainly face competition from Sinopec, CNOOC,
coal-based
natural gas producers and importers of natural gas and LNG in the supply of natural gas to Beijing, Tianjin, Hebei Province, Shanghai, Jiangsu Province, Anhui Province, Henan Province, Hubei Province, Hunan Province and the Northwestern regions of China, our existing principal markets for natural gas. Currently, Sinopec has natural gas fields in Sichuan Province and Chongqing Municipality and sells natural gas to users in places such as Sichuan Province, Chongqing, Hunan Province, Jiangsu Province, Zhejiang Province and Shanghai. We have also expanded into the coastal regions in Eastern and Southern China where we face competition from CNOOC and Sinopec. Over the recent years, as the reform of the oil and gas regulatory system has continuously progressed amidst macro-economic changes, the reshaping of the oil and gas industry has accelerated in China. In addition to us, Sinopec and CNOOC, more and more other companies are expected to join the competition in the natural gas resources sector and oil and gas terminal business. In 2020, PipeChina acquired certain major pipeline assets from our company and several other oil and gas companies, making it the largest pipeline operator in China and enabling it to provide market participants with equal access to pipeline resources. This is expected to have a far reaching effect on the competitive landscape of the oil and gas industry in China and is expected to intensify the competition at the upstream resources segment and the downstream sales segment. We believe that our advantages in natural gas resources, production, sales and technologies will enable us to maintain our position as a leading player in the natural gas markets in China. See “Item 3 — Risk Factors — Risks Related to Government Regulation”, “Item 3 — Key Information — Risk Factors — Risks Related to Competition”, “Item 4 — Information on the Company — Natural Gas and Pipeline” and “Item 5 — Operating and Financial Review and Prospects — Trend Information”.
Environmental Matters
We are subject to numerous national, regional and local environmental laws and regulations promulgated by the governments in those jurisdictions. These laws and regulations concern our oil and gas exploration and production operations, petroleum and petrochemical products and other activities. In particular, some of these laws and regulations:
 
   
require an environmental impact evaluation report to be submitted and approved prior to the commencement of exploration, production, refining and chemical projects;
 
   
restrict the type, quantities, and concentration of various substances that can be released into the environment in connection with drilling and production activities;
 
   
limit or prohibit drilling activities within protected areas and certain other areas; and
 
   
impose penalties for pollution resulting from oil, natural gas and refining operations, including criminal and civil liabilities for serious pollution.
These laws and regulations may also restrict the emissions into the air and discharges into water from our gas processing plants, chemical plants, refineries, pipeline systems and other facilities that we own or operate. In addition, our operations are subject to laws and regulations relating to the generation, handling, storage, transportation, disposal and treatment of solid waste materials.
In 2019, 2020 and 2021, we paid a total environmental protection tax of approximately RMB139 million, RMB143 million and RMB155 million, respectively.
 
44

Table of Contents
To meet future environmental obligations, we are engaged in a continuous program to develop effective environmental protection measures. These measures include:
 
   
building eco-friendly projects;
 
   
improving the quality of refined oil products and reducing toxic substances in refined oil products;
 
   
improving the utilization efficiency of energy sources, water, land, raw materials and other resources, and continuously reducing emissions and effluents from operations;
 
   
strengthening the automated monitoring and control of effluents and emissions;
 
   
adopting clean production technologies and enhancing the comprehensive utilization of oil containing wastes and other similar solid wastes; and
 
   
deploying across our company on a world-wide basis a centralized HSE management system and risk management platform to identify environmental risks, and implementing strict hierarchical management and level by level prevention of environmental risks.
Our capital expenditures on environmental programs in 2019, 2020 and 2021 were approximately RMB2.30 billion, RMB2.94 billion and RMB3.92 billion, respectively.
Because a number of our production facilities are located in populated areas, we have established a series of preventative measures to improve the safety of our employees and surrounding residents and minimize disruptions or other adverse effects on our business. These measures include:
 
   
providing the residents surrounding our production facilities with printed materials to explain and illustrate safety and protection knowledge and skills; and
 
   
enhancing the implementation of various effective safety production measures we have adopted previously.
We believe that these preventative measures have helped reduce the possibility of incidents that may result in serious casualties and environmental consequences. In addition, the adoption of these preventative measures has not required significant capital expenditures to date, and therefore, will not have a material adverse effect on our results of operations and financial condition.
See “Item 3 — Key Information — Risk Factors — Risks Related to Environmental Protection and Safety” and “Item 3 — Key Information — Risk Factors — Risks Related to Climate Change”.
Properties, Plants and Equipment
We own substantially all of our properties, plants and equipment relating to our business activities. We hold exploration and production licenses covering all of our interests in developed and undeveloped acreage, oil and natural gas wells and relevant facilities.
See the description of our properties, plants and equipment relating to our business activities included elsewhere in this “Item 4 — Information on the Company” and “Item 7 — Major Shareholders and Related Party Transactions — Related Party Transactions”.
Intellectual Property
Our logo “
” is jointly owned by us and CNPC and has been used since December 26, 2004. Together with CNPC, we have applied for trademark registrations of the logo both in China and abroad. We have received 506 International Trademark Registration Certificates for our logo covering more than 50 jurisdictions
.
 
45

Table of Contents
As of December 31, 2021, we owned approximately 19,145 patents in China and other jurisdictions. We were granted 1,983 patents in 2021.
Regulatory Matters
Overview
China’s oil and gas industry is subject to extensive regulation by the PRC government with respect to exploration, production, transmission and marketing of crude oil and natural gas as well as production, transportation and marketing of refined products and chemical products. The central government authorities which exercise control over China’s oil and gas industry include, but not be limited to:
 
   
The National Energy Administration, or the NEA, which is primarily responsible for the formulation of energy development plans and annual directive plans, approving major energy-related projects and facilitating the implementation of sustainable development of energy strategies, coordinating the development and utilization of renewable energy and new energy, and organizing matters relating to energy conservation and comprehensive utilization as well as environmental protection for the energy industries.
 
   
The Ministry of Natural Resources, or the MNR, which has the authority to grant, examine and approve mineral resources exploration and production licenses, and to oversee the registration and transfer of exploration and production licenses;
 
   
The Ministry of Commerce, or the MOFCOM, which
 
   
sets and grants import and export volume quotas for crude oil and refined products in accordance with the market supply and demand in China as well as WTO requirements for China;
 
   
issues import and export licenses for crude oil and refined products to oil and gas companies that have obtained import and export quotas;
 
   
is responsible for the record-filing of Sino-foreign joint venture contracts, and monitoring the foreign investors’ oil and gas exploration projects in the PRC; and
 
   
is responsible for approving and filing of overseas investment projects by PRC enterprises.
 
   
The National Development and Reform Commission, or the NDRC, which
 
   
is responsible for industry administration, industry policy and policy coordination over China’s oil and gas industry;
 
   
publishes guidance prices for natural gas and maximum retail prices for gasoline and diesel;
 
   
formulates the plan for aggregate import and export volume of crude oil and refined products in accordance with the market supply and demand in China;
 
   
approves significant petroleum, natural gas, oil refinery and chemical projects set forth under the Catalogs of Investment Projects Subject to Approval of the Central Government; and
 
   
approves
Sino-foreign
equity and cooperative projects of certain types.
 
   
The Ministry of Ecology and Environment, which
 
   
is responsible for taking measures to address climate change concerns, proposing and formulating significant strategies, plans and policies to address climate change concerns and reduce greenhouse emissions, and supervising the achievement of emissions compliance targets;
 
   
is responsible for supervising and administering the prevention and treatment of environmental pollution, and guiding, coordinating and supervising the protection and restoration of the ecological environment;
 
46

Table of Contents
   
is responsible for supervising and administering the ecological and environmental access, evaluating the environmental impact of critical economic and technological policies and development plans, and significant economic development programs entrusted to it by the State Council; examines and approves or reviews environmental impact evaluation documents for critical development or construction areas, plans or projects; and formulates and organizes the implementation of the ecological and environment access lists;
 
   
The National Anti-Monopoly Bureau, which
 
   
is responsible for proposing and formulating anti-monopoly rules, measures and guidelines;
 
   
is responsible for organizing the implementation of anti-monopoly enforcement actions; and
 
   
is responsible for organizing and guiding the fair competition reviews.
Exploration Licenses and Production Licenses
The
Mineral Resources Law
authorizes the MNR to exercise administrative authority over the exploration and production of mineral resources within the PRC. The
Mineral Resources Law
and its supplementary regulations provide the basic legal framework under which exploration licenses and production licenses are granted. License applicants must be companies approved by the State Council to engage in oil and gas exploration and production activities.
Applicants for exploration licenses must first register the blocks that they intend to engage in exploration activities with the MNR. The holder of an exploration license is obligated to make a progressively increasing annual minimum exploration investment in each corresponding block. Investments range from RMB2,000 per square kilometer for the initial year to RMB5,000 per square kilometer for the second year, and to RMB10,000 per square kilometer for the third and subsequent years. Additionally, the holder has to pay royalty fees that starts at RMB100 per square kilometer per year for each of the first three years and increases by an additional RMB100 per square kilometer per year for subsequent years up to a maximum of RMB500 per square kilometer per year. The maximum term of an oil and natural gas exploration license is seven years, subject to renewal upon expiration of the original term, with each renewal being up to two years. At the exploration stage, an applicant can also apply for a progressive exploration and production license that allows the holder to test and develop reserves not yet fully proven. Upon the detection and confirmation of the quantity of reserves in a certain block, the holder must apply for a production license based on economic evaluation, market conditions and development planning in order to shift into the production phase in a timely fashion. In addition, the holder needs to obtain the right to use that block of land. Generally, the holder of a full production license must obtain a land use rights certificate for industrial land use covering that block of land.
The MNR issues production licenses to applicants on the basis of the reserves reports approved by the relevant authorities. Production license holders are required to pay a royalty of RMB1,000 per square kilometer per year. Administrative rules issued by the State Council provide that the maximum term of a production license is 30 years, 20 years, or 10 years as applicable to large, medium and small mineral blocks, respectively. In accordance with a special approval from the State Council, the MNR has issued production licenses with terms coextensive with the projected productive life of the assessed proven reserves as discussed above. Each of our production licenses is renewable upon our application 30 days prior to expiration. If oil and gas prices increase, the productive life of our crude oil and natural gas reservoirs may be extended beyond the current terms of the relevant production licenses.
The MNR comprehensively promotes the manner which mining rights are granted through competitive ways, such as bidding, auction or listing, while strictly limits the
non-competitive
ways.
China has implemented the regulation of unified licensing of oil and gas exploration and production, pursuant to which, if an oil and gas exploration license holder discovers any oil and gas reservoir available for
 
47

Table of Contents
production, it may commence production immediately after having submitted a report to the local natural resource authorities, and is not required to obtain a separate oil and gas production license. If such oil and gas exploration license holder has since then conducted oil and gas production activities, it is required to enter into a mining rights grant contract and complete the mining rights registration in accordance with applicable laws within five years thereafter.
Among the major PRC oil and gas companies, the exploration licenses and production licenses held by us, Sinopec and CNOOC account for the majority of mining rights in China. Among those companies, we and Sinopec primarily engage in onshore exploration and production, while CNOOC primarily engages in offshore exploration and production. According to the new policies of the Chinese government, private enterprises and foreign-invested enterprises are allowed to obtain exploration licenses.
Pricing
In recent years, the pricing of gasoline, diesel, natural gas and pipeline transmission services, depending on the situation, has either been subject to government guiding prices or government set prices, while the pricing of crude oil and other refined oil products is not subject to government regulation.
Gasoline and Diesel
According to the
Measures for Administration of Petroleum Products Pricing issued
by the NDRC on January 13, 2016, (i) the retail prices and wholesale prices of gasoline and diesel, and the prices for supply of gasoline and oil to special customers such as social wholesale enterprises, railway and other transportation operators are expected to follow government guiding prices, and (ii) the supply prices for supply of gasoline and diesel to the country’s Strategic Petroleum Reserve and Xinjiang Production and Construction Corps are expected to follow government set prices. The ceiling retail prices of gasoline and diesel are determined on the basis of international crude oil prices, by taking into consideration the average domestic processing cost, tax, reasonable circulation costs and appropriate profit margin. Further, when the international crude oil prices drop to US$40 per barrel or below, the prices of refined oil products in China will be calculated as if the crude oil price were still US$40 per barrel and by taking into consideration a normal processing profit margin. When the international crude oil prices rise to the range between US$40 per barrel (exclusive) and US$80 per barrel (inclusive), the prices of refined oil products in China will be calculated by taking into consideration a normal processing profit margin. When the international crude oil prices surge to more than US$80 per barrel, the processing profit margin used to determine the prices of refined oil products will be reduced until to zero. When the international crude oil prices surge to US$130 per barrel or above, appropriate financial and taxation policies will be adopted to ensure the production and supply of refined oil products but the prices of gasoline and diesel will in principle remain unadjusted or will only be slightly adjusted upwards in principle by adhering to the principle of taking into account the interests of both the producers and the consumers so as to maintain the smooth operation of the national economy. The government would adjust the gasoline and diesel prices every 10 working days in line with fluctuations in international crude oil prices. Refined oil retail enterprises have freedom to set their own specific retail prices as long as their retail prices do not exceed the ceiling prices set by the government. The ceiling supply prices of gasoline and diesel to be supplied to special customers such as railway, transportation and other business operators by domestic refined oil production and marketing enterprises are determined by reducing the ceiling national average retail price by RMB400 per ton. Domestic refined oil production and marketing enterprises may determine the specific supply prices with special customers such as railway, transportation and other business operators through negotiations subject to the ceiling supply prices published by the government. When market retail prices drop, the supply prices set for special customers will be adjusted downward accordingly. The
so-called
“special customers” means big customers who have for historical reasons established their own independent oil supply system, as identified in a list formulated by the NDRC. The supply prices of gasoline and diesel to be supplied to the country’s Strategic Petroleum Reserve and Xinjiang Production and Construction Corps by domestic refined oil production and marketing enterprises are determined by deducting circulation markup from the ceiling national average retail price.
 
48

Table of Contents
On March 13, 2020, the NDRC issued the updated version of the
Central Pricing Catalogue
. According to the updated Catalogue, in the interim, prices of refined oil products will continue to be determined by the existing pricing mechanism, as adjusted in line with the fluctuations in international oil prices. The updated Catalogue indicates that based on the progress of the oil and gas reform, China will fully liberalize the pricing of refined oil products and allow it to be entirely market-based in due course.
On May 18, 2021, the NDRC issued the
Notice on the Action Plan for Deepening the Pricing Reform During the 14th Five-Year Plan Period
. In the Notice, the NDRC stated that during the 14
th
Five-Year Plan period, the Chinese government will conduct research to enhance the pricing mechanism for refined oil products in line with the changes in the domestic and international energy market conditions and the progress in the domestic energy pricing system.
Natural Gas
According to the updated Central Pricing Catalogue issued by the NDRC on March 13, 2020, the prices of offshore gas, shale gas, coal bed methane, coal gas, LNG, gas supplied directly to certain customers, gas supplied to and resold by gas storage facilities, gas publicly traded on trading platforms, gas imported through pipelines put into operation after 2015, and citygate gas prices in those provinces possessing conditions for determining citygate gas prices through competition should become market based. The prices of other domestically produced onshore pipeline gas and the citygate prices of the gas imported through pipelines put into operation before the end of 2014 should in the interim continue to be determined by the existing pricing mechanism, and will be liberalized and become market-based in due course as the reform to marketize the natural gas sector progresses. Pursuant to the natural gas pricing reform programs issued by the NDRC in recent years, at present, the PRC government regulates natural gas pricing mainly through the citygate benchmark price. Under this regime, gas suppliers and purchasers would determine the specific citygate prices for their transactions through negotiations by using the citygate benchmark prices published by the relevant local governments as the base and then adjusting the base either upwards by no more than 20% or downwards without limit. The NDRC also rolled out seasonal natural gas prices to encourage market-oriented pricing. Natural gas production and marketing enterprises and users are encouraged to proactively trade on natural gas trading platforms. Prices of natural gas publicly traded on natural gas exchanges such as Shanghai Oil and Gas Exchange and Chongqing Oil and Gas Exchange are entirely driven by market conditions.
On May 18, 2021, the NDRC issued the
Notice on the Action Plan for Deepening the Pricing Reform During the 14th Five-Year Plan Period
. In the Notice, the NDRC stated that during the 14
th
Five-Year Plan period, China would steadily advance the oil and natural gas pricing reform. By following the guidelines “to control the middle and liberalize the two ends” and in line with the progress in the independent operation of natural gas pipeline network and diversification of the entities operating in oil and gas exploration and development, gas supply and gas sales sectors, the market-oriented citygate gas pricing reform will be steadily pushed forward, enhancing the mechanism to synchronize the terminal selling prices with the purchasing costs. Meanwhile, great effort will be made to coordinate the boosting of fair access to urban gas distribution networks, reduce the gas distribution levels, tighten the monitoring over the gas distribution pricing, and explore ways to advance the marketization of the pricing of the natural gas supplied to end users.
Pipeline Transmission Tariff
Pipeline transmission tariffs for crude oil, refined oil and natural gas are set by the government. Cross province transmission tariffs are set by the NDRC and provincial transmission tariffs are set by the provincial level branches of the NDRC.
For those pipelines constructed prior to 1984, which were funded by the government, the transmission tariff is a uniform flat tariff determined based on the principle of minimum profit margin. For those pipelines constructed with the funds of the enterprises after 1984, the tariffs must be submitted to the NDRC for examination and approval on a case by case basis and based on the capital investment made in the pipeline, the operation period for the pipeline and a reasonable profit margin.
 
49

Table of Contents
On October 9, 2016, the NDRC issued
Regulation on Administration of the Pipeline Transmission Tariff for Natural Gas (on trial)
and
Rules on Supervision and Review of the Costs Used in Setting the Pipeline Transmission Tariff (on trial)
, which provides that effective January 1, 2017, the pipeline transmission tariff for natural gas shall be reviewed and determined on the principle of “permissible costs plus reasonable margins”, and the rules intended to regulate the tariff charged by companies engaged in cross-province pipeline transmission operation.
On March 27, 2019, the NDRC issued the N
otice on Adjusting the Inter-provincial Pipeline Natural Ga
s
Transmission Tariff
, which adjusted the transmission tariff for 13 inter-provincial pipelines companies including PetroChina Beijing Natural Gas Pipeline Co., Ltd. and others.
On June 7, 2021, the NDRC issued the
Regulation on Administration of the Pipeline Transmission Tariff for Natural Gas (Interim)
and the
Rules on Supervision and Review of the Costs Used in Setting the Pipeline Transmission Tariff (Interim).
The Regulations and the Rules generally simplified the current mechanism for setting the natural gas pipeline transmission tariffs by reducing the number of China’s pipeline price zones from 15 to 4. According to the Regulations and the Rules, going forward, the rates of return allowed for natural gas pipeline network transmission businesses shall be adjusted dynamically by taking into account China’s national strategic requirements and industrial development needs and users’ bearing capacity. The Regulation and Rules further state that the initially approved rate of return shall be 8% and the depreciable life of the pipelines used for setting the natural pipeline transmission tariffs shall be extended from 30 years to 40 years.
Production and Marketing
Crude Oil
Each year, the NDRC publishes the projected target for the production and process of crude oil in China based on the domestic consumption estimates submitted by domestic producers, including but not limited to us, Sinopec and CNOOC, the production of these companies as well as the forecast of international crude oil prices. The actual production volumes are determined by the producers themselves and may vary from estimates. The MOFCOM and its local branches were previously responsible for supervising and managing the crude oil market. Enterprises that meet certain operating conditions may apply for the permit for crude oil sales and warehousing business. On December 3, 2019, the MOFCOM issued the
Notice on Proper Implementation of the Reform to “Streamline Administration, Delegate Power, Strengthen Regulation and Improve Services” in the Administration of Circulation of Refined Petroleum Products
. According to the Notice, MOFCOM offices will no longer accept applications for qualifications for crude oil marketing or warehousing business, or for amendment, renewal or cancellation of the certificates of such qualifications, and such certificates shall expire automatically upon expiration and will not be taken back. This means that the operation of crude oil marketing and warehousing business will no longer be subject to MOFCOM approval.
Refined Products
Historically, only we and Sinopec had the right to conduct gasoline and diesel wholesale business. Other companies, including foreign invested companies, were not allowed to engage in wholesale of gasoline and diesel in China’s domestic market. In general, only domestic companies, including
Sino-foreign
joint venture companies, were permitted to engage in retail of gasoline and diesel. Since December 11, 2004, wholly
foreign-owned
enterprises are permitted to conduct refined oil retail business. Since January 1, 2007, when the
Measures on the Administration of the Refined Products
Market
became effective, all entities meeting certain requirements are allowed to submit applications to the MOFCOM to conduct refined oil products wholesale, retail and storage businesses. On July 28, 2018, the PRC government removed the restriction that a Chinese partner must hold a majority share in the construction and operation of a retail oil station chain which has more than 30 outlets and sells refined products of different types and brands supplied through multiple channels. On August 27, 2019, the State Council canceled government approval of qualifications for operation of refined oil wholesale warehousing and delegated the approval of refined oil retail qualifications to local municipal governments.
 
50

Table of Contents
On December 3, 2019, the MOFCOM issued the
Notice on Proper Implementation of the Reform to “Streamline Administration, Delegate Power, Strengthen Regulation and Improve Services” in the Administration of Circulation of Refined Petroleum Products.
According to the Notice, any market player proposed to engage in the refined petroleum product wholesale and warehousing activities may commence and carry out such activities in accordance with applicable laws and regulations after they meet relevant criteria and obtain relevant qualifications or pass relevant acceptance tests and is not required to obtain operating licenses from MOFCOM. On December 31, 2020, the General Office of the MOFCOM issued the
Guidelines for the Administration of the Refined Petroleum Product Circulation Sector
. According to the Guidelines, any market player engaged in refined petroleum product wholesale and warehousing business activities shall comply with laws and regulations and criteria related to enterprise registration, land and resources administration, planning and construction, oil product quality, safety production, environmental protection, firefighting, terrorism-fighting, tax, transportation, meteorology, metering, etc., obtain relevant qualifications or pass relevant acceptance tests, and shall carry out business operation in accordance with laws and regulations. This means that the operation of refined oil marketing and warehousing business will no longer be subject to MOFCOM approval.
Natural Gas
The NDRC determines each year the annual national natural gas production target based on the natural gas production targets submitted by domestic natural gas producers. Domestic natural gas producers determine their annual natural gas production targets on the basis of consumption estimates. The actual production volume of each producer is determined by the producer itself, which may deviate from the production target submitted by it. The NDRC also formulates the annual natural gas supply guideline, which requires natural gas producers to distribute a specified amount of natural gas to the designated key municipalities and key enterprises.
Foreign Investments
Cooperation in Exploration and Production with Foreign Companies
Currently, CNPC is one of the few Chinese companies that have the right to cooperate with foreign companies in onshore crude oil and natural gas exploration and production in China. CNOOC has the right to cooperate with foreign companies in offshore crude oil and natural gas exploration and production in China.
Sino-foreign
cooperation projects and foreign parties in onshore oil and gas exploration and production in China are generally selected through open bids and bilateral negotiations. Those projects are generally conducted through production sharing contracts. The MOFCOM must approve those contracts.
As authorized by the Regulations of the PRC on Exploration of Onshore Petroleum Resources in Cooperation with Foreign Enterprises, CNPC has the right to enter into joint cooperation arrangements with foreign oil and gas companies for onshore crude oil and natural gas exploration and production. We do not have the capacity to enter into production sharing contracts directly with foreign oil and gas companies under existing PRC law. Accordingly, CNPC will enter into production sharing contracts. After signing a production sharing contract, CNPC will, subject to approval of the MOFCOM, assign to us most of its commercial and operational rights and obligations under the production sharing contract as required by the
Non-competition
Agreement between CNPC and us.
In 2019, the Chinese government lifted the restrictions on foreign investment in oil and gas exploration. As a result, foreign companies are allowed to enter the oil and gas exploration and production sector by wholly-owned enterprises.
Transportation and Refining
Since December 1, 2007, PRC regulations have encouraged foreign investment in the construction and operation of oil and gas pipelines and storage facilities. On March 10, 2015, PRC lifted the restrictions on foreign
 
51

Table of Contents
investment in refineries with a production capacity of below 10 million tons per annum. Furthermore, when appropriate, projects must receive necessary approvals from relevant PRC government agencies. See “Item 3 — Key Information — Risk Factors — Risks Related to Government Regulation.”
The State Further Liberalized Oil And Gas Market Access
On June 30, 2019, the NDRC and the MOFCOM jointly issued
Special Management Measures for Foreign Investment Access (Negative List) (2019 Edition)
, pursuant to which, the restrictions on oil and gas exploration and development that were previously limited to joint ventures and cooperation were lifted.
On December 4, 2019, the Chinese government issued the
Opinions on Creating a Better Development Environment to Support the Reform and Development of Private Enterprises
, which further liberalized market access for private enterprises. It states that in key industries and fields such as power, telecommunications, railways, oil and gas, the state liberalizes competitive businesses and further introduces market competition mechanisms. It encourages private enterprises to enter the industries of oil and gas exploration and development, refining and sales, and construction of infrastructures such as storage, transportation and pipeline transportation of crude oil, natural gas and refined oil. It encourages qualified enterprises to participate in crude oil imports and refined oil exports.
Import and Export
Since January 1, 2002,
state-owned
trading companies have been allowed to import crude oil under an automatic licensing system.
Non-state-owned
trading companies have been allowed to import crude oil and refined products subject to quotas. The export of crude oil and refined oil products by both
state-owned
trading companies and
non-state-owned
trading companies is subject to quota control. The MOFCOM has granted us the right to conduct crude oil and refined product import and export business.
Capital Investment and Financing
Capital investments in exploration and production of crude oil and natural gas made by Chinese oil and gas companies are subject to approval by or filing with relevant government authorities. The following projects are subject to approval by the NDRC or the competent local authorities:
 
   
facilities for taking delivery of and storing liquefied petroleum gas (excluding accessory projects of oil or gas fields or refineries);
 
   
new facilities for taking delivery of or storing imported liquefied natural gas (including expansion on a different site other than the original facilities);
 
   
oil or gas transmission pipeline networks (excluding gathering and transmission pipeline networks of oil or gas fields);
 
   
new refineries, expansion of existing primary processing refineries;
 
   
new ethylene, paraxylene (PX), diphenylmethane diisocyanate (MDI) projects
and
 
   
new
coal-to-olefins
projects, new coal to paraxylene (PX) projects, and new
coal-to-methanol
projects with a capacity of 1 million tons per annum or more.
 
52

Table of Contents
Taxes, Fees and Royalties
We are subject to a variety of taxes, fees and royalties. The table below sets forth the major taxes, fees and royalty fees payable in China by us or by Sino-foreign oil and gas exploration and development cooperative projects. Our subsidiaries which have legal person status should report and pay enterprise income tax to the relevant tax authorities based on the applicable laws and regulations.
 
Tax Item
  
Tax Base
  
Tax Rate
Enterprise income tax
   Taxable income    Standard rate is 25%; from January 1, 2021 to December 31, 2030, the corporate income tax on enterprises incorporated in encouraged industries in the western region of China will be levied at a reduced rate of 15%.
Value-added
tax
   Revenue   
9% for liquefied natural gas, natural gas, liquefied petroleum gas, agricultural film and fertilizers and 13% for oil products and other products.
 
From January 1, 2021 to December 31, 2025, (1) for natural gas imported under the long-term trade gas contracts signed before the end of 2014 and confirmed by the NDRC, the import value-added tax will be refunded at a rate of 70%; and (2) for other types of natural gas, if the import price is higher than the reference benchmark value, the import value-added tax will be refunded at a rate equal to a fraction, of which the numerator is equal to the import price less the reference benchmark value, and the denominator is the import price.
Consumption tax
   Aggregate volume sold or
self-consumed
   RMB1.52 per liter for gasoline, naphtha, solvent naphtha and lubricant and RMB1.2 per liter for diesel, aviation kerosene and fuel oil.
Resource tax
   Sales   
The standard rate is 6%; but exemption or reduction may apply if qualified.
 
From April 1, 2018 to December 31, 2023, shale gas production enjoys a 30% reduction.
Crude oil special gain levy
   Sales amount above specific threshold   
Five-level
progressive tax rates from 20% to 40%, taxable if the crude oil price reaches the threshold of US$65 per barrel.
Environmental protection tax
   Air pollution equivalent, water pollution equivalent, solid waste pollution equivalent and noise exceeding the standard decibel   
Effective January 1, 2018, the PRC government started to impose environmental protection tax. Different emissions apply their corresponding tax rates.
 
If a taxpayer’s emission of taxable atmospheric pollutants or water pollutants is less than 30% of the national and local pollutant discharge standards, the environmental protection tax shall be levied at 75%. If the taxpayer’s emission of taxable atmospheric pollutants or water pollutants is less than 50% of the national and local pollutant discharge standards, the environmental protection tax shall be levied at 50%.
Mining right royalty
   Area    RMB100 to RMB500 per square kilometer per year for exploration; RMB1,000 per square kilometer per year for production.
Royalty fee
(1)
   Production volume    Progressive rate of
0-12.5%
for crude oil and
0-3%
for natural gas.
 
53

Table of Contents
 
(1)
It shall be paid in cash and is only applicable to Sino-foreign oil and gas exploration and development cooperative projects in China. However, effective December 1, 2010, the royalty fee payable by new Sino-foreign oil and gas exploration and development cooperative projects in Western regions was replaced by the resource tax, while those cooperative projects under contracts signed before December 1, 2010 continue to be subject to the royalty fee until the contracts expire. Effective November 1, 2011, the royalty fee payable by new Sino-foreign oil and gas exploration and development cooperative projects in the whole country was replaced by the resource tax, while those cooperative projects under contracts signed before November 1, 2011 continue to be subject to the royalty fee until the contracts expire.
Environmental Regulations
We are subject to various PRC national environmental laws and regulations and also environmental regulations promulgated by the local governments in whose jurisdictions we have operations. The PRC government has adopted extensive environmental laws and regulations that affect the operation of the oil and gas industry. There are national and local standards applicable to emissions control, discharges to surface and subsurface water and disposal, generation, handling, storage, transportation, treatment and disposal of solid waste materials, reduction of carbon emission and upgrade of the standards for refined products.
The environmental regulations require a company, such as us, to register or file an environmental impact report with the relevant environmental authority for approval before it undertakes any construction of a new production facility or any major expansion or renovation of an existing production facility. The new facility or the expanded or renovated facility will not be permitted to operate unless the relevant environmental authority has inspected the environmental equipment installed at the facility and decides it satisfies the environmental protection requirements. Companies that need to discharge pollutants, whether in the form of gas, water or solid wastes, must submit application for pollutant discharge permits. The application must state in detail the types of discharge, discharge outlet, types of pollutants, concentration and amount of discharge. After reviewing the application materials, the relevant environmental administrative department will determine to issue a discharge permit to the company, specifying the types of permitted pollutants, the permitted concentration and amount. If a company’s discharges deviated from what were permitted, the relevant administrative department may impose fines on the company or order the company to suspend or close down its operation for resolving the issues. In addition, companies discharging taxable pollutants should declare and pay corresponding environmental protection taxes in accordance with the PRC Environmental Protection Tax Law and its implementing regulations.
In order to reduce environmental pollution, the Chinese government has also raised the standards of oil products several times in recent years. After several years of upgrading and renovating our oil refining facilities, we have satisfied the relevant standards on time. In addition, we are also required to comply with relevant laws and regulations regarding management of hazardous chemicals.
Policies, Regulations and Rules to Address Climate Change Concerns
On September 22, 2021, the Chinese government issued the
Opinions on Fully, Accurately and Comprehensively Implementing the New Development Philosophy and Procuring Satisfactory Performance of the Work Aiming at Achievement of the Carbon Peak and Carbon Neutrality Goals
(the “Opinions”), in which a series of milestones to be achieved and steps to be taken for finally achieving the carbon peak and carbon neutrality goals are set. The milestones for phased increase of the share of
non-fossil
fuels in primary energy consumption set in the Opinions are to increase the share to about 20% by 2025, about 25% by 2030, and more than 80% by 2060. According to the Opinions, China’s petroleum consumption will reach its peak plateau during the 15
th
Five-Year Plan period and the Chinese government will strictly control the investments in petrochemical and other high carbon projects by then.
 
54

Table of Contents
On October 24, 2021, the State Council issued the
Action Plan for Hitting Carbon Peak by 2030
(the “Action Plan”), which sets forth in great detail the initiatives proposed to be pursued for achieving the goal to hit carbon peak by 2030. The initiatives related to petroleum, natural gas, petrochemicals and new energy mainly include the following:
 
   
putting more effort into the development of wind energy, solar energy, and other
non-fossil
energy sources and increasing the total installed capacity of wind power and solar power facilities to more than 1,200,000 MW;
 
   
reasonably adjusting and regulating oil and gas consumption; using great efforts to promote the replacement of conventional fuel oil with biological liquid fuels and sustainable aviation fuels so as to improve the energy efficiency of the
end-use
fuel oil products; and expediting the large-scale development of shale gas, coalbed methane, tight oil (gas) and other unconventional oil and gas resources;
 
   
guiding natural gas consumption in an orderly manner by optimizing the structure of natural gas usage, prioritizing the supply of natural gas required for ensuring people’s livelihood and striving to promote the integrated development of natural gas together with multiple other energy sources; and supporting the use of LNG as fuel for vehicles and ships;
 
   
for the petrochemical sector, boosting the phasing out of obsolete production capacity and strictly controlling the increase of new refining capacity with an aim to control the domestic crude oil primary processing capacity at no more than 1 billion tons by 2025; and
 
   
extending the use of electric power, hydrogen energy, natural gas, advanced biological liquid fuels and other new energy and clean energy sources in the transportation sector with an aim to procure that by 2030, the share of incremental vehicles fueled by new and clean energy will reach around 40%, carbon emission intensity of commercial vehicles measured on the basis of converted turnover will be cut by about 9.5% compared with 2020, and comprehensive energy consumption of the national railways per unit of converted turnover will be cut by 10% compared with 2020; and striving to hit peak for petroleum consumption in the land transportation sector by 2030.
Anti-Monopoly
We are subject to the
Anti-Monopoly Law of the PRC
and other related PRC laws and regulations. Those laws and regulations prohibit dominant operators from abusing their position, or operators entering into monopoly agreements or conducting any concentration of business operators which has or may have the effect of excluding or limiting competition. Violators can be ordered to cease illegal activities, confiscated of illegal gains, and imposed a fine or other restrictive measures. The anti-monopoly law enforcement agency is the National Anti-Monopoly Bureau.
Item 4
A — UNRESOLVED STAFF COMMENTS
None.
Item 5
— OPERATING
A
ND FINANCIAL REVIEW
A
ND PROSPECTS
General
You should read the following discussion together with our consolidated financial statements and their notes included elsewhere in this annual report. Our consolidated financial statements have been prepared in accordance with IFRS. This Item 5 does not include the comparison of 2020 to 2019, which can be found in our Form
20-F
filed with the SEC on April 29, 2021.
 
55

Table of Contents
Overview
Currently, we are engaged in a broad range of petroleum and natural gas related activities, including:
 
   
exploration, development, production and sale of crude oil and natural gas;
 
   
refining of crude oil and petroleum products, and production and marketing of primary petrochemical products, derivative chemical products and other chemical products;
 
   
marketing and trading of refined oil products and
non-oil
products; and
 
   
sale of natural gas.
Going forward, we will actively develop new energy and new material businesses.
We are China’s largest producer of crude oil and natural gas and are one of the largest companies in China in terms of revenue. In 2021, we produced approximately 887.9 million barrels of crude oil and approximately 4,420.0 Bcf of natural gas for sale. Our refineries processed approximately 1,225.0 million barrels of crude oil in 2021. In 2021, our revenue was RMB2,614,349 million and net profit attributable to owners of the company was RMB92,170 million.
Factors Affecting Results of Operations
Our results of operations and the
period-to-period
comparability of our financial results are affected by a number of external factors, including changes in the prices, production and sales volume of our principal products, operating costs and the regulatory environment.
Prices of Principal Products
The fluctuations in the prices of crude oil, refined oil products, chemical products and natural gas have a significant impact on our revenue.
The table below sets forth the average realized prices of our principal products in 2019, 2020 and 2021.
 
    
2019
    
2020
    
2021
 
Crude oil (US$/barrel)
     60.96        40.33        65.58  
Natural gas (US$/thousand cubic feet)
     5.39        4.80        7.59  
Gasoline (US$/barrel)
     110.63        94.86        127.97  
Kerosene (US$/barrel)
     78.08        48.67        71.84  
Diesel (US$/barrel)
     102.16        81.59        111.50  
Production and Sales Volume for Oil and Gas Products
Our results of operations are also affected by production and sales volumes. Our crude oil and natural gas production volumes depend primarily on the level of the proved developed reserves in the fields in which we have an interest, as well as other factors such as the general macroeconomic environment and market supply and demand conditions, while the sales of crude oil, natural gas, refined oil and chemical products are subject to marketing capabilities and competitive environment.
Operating costs
The general macroeconomic environment and market supply and demand conditions may also affect our operating costs. For example, labor costs and the price index (CPI) in general in the countries where we operate are affected by the global and local macroeconomic environment. Changes in commodity prices may also affect our operating costs, as it would affect our ability to pass on the change in such commodity prices through a change in the prices of our products.
 
56

Table of Contents
Regulatory Environment
Our operating activities are subject to extensive regulation by the PRC government, including but not limited to the issuance of exploration and production licenses, the imposition of industry-specific taxes or
product-specific
taxes and levies and the implementation of environmental policies and safety standards. Our results of operations will be affected by any future changes of such regulatory environment.
Critical Accounting Policies
The preparation of our consolidated financial statements requires our management to select and apply significant accounting policies, the application of which may require management to make judgments and estimates that affect the reported amounts of assets and liabilities, disclosure of contingent assets and liabilities as of the date of our financial statements, and the reported amounts of revenue and expenses during the reporting period. Notwithstanding the presentation of our principal accounting policies in Note 3 to our consolidated financial statements included elsewhere in this annual report, we have identified the accounting policies below as most critical to our business operations and the understanding of our financial condition and results of operations presented in accordance with IFRS. Although these estimates are based on our management’s best knowledge of current events and actions, actual results ultimately may differ from those estimates.
Accounting for Oil and Gas Exploration and Production Activities
We use the successful efforts method of accounting, with specialized accounting rules that are unique to the oil and gas industry, for oil and gas exploration and production activities. Under this method, geological and geophysical costs incurred are expensed when incurred. However, all costs for developmental wells, support equipment and facilities, and proved mineral interests in oil and gas properties are capitalized. Costs of exploratory wells are capitalized as construction in progress pending determination of whether the wells find proved reserves. For exploratory wells located in regions that do not require substantial capital expenditures before the commencement of production, the evaluation of the economic benefits of the reserves in such wells will be completed within one year following the completion of the exploration drilling. Where such evaluation indicates that no economic benefits can be obtained, the relevant costs of exploratory wells will be converted to dry well exploration expenses. The relevant costs will be classified as oil and gas assets and go through impairment review if the evaluation indicates that economic benefits can be obtained. For wells with economically viable reserves in areas where a major capital expenditure would be required before production can begin, the related well costs remain capitalized only if additional drilling is under way or firmly planned. Otherwise, the well costs are expensed as dry wells. We have no material costs of unproved properties capitalized in oil and gas properties.
Oil and Gas Reserves
The estimation of the quantities of recoverable oil and gas reserves in oil and gas fields is integral to effective management of our exploration and production operations. Because of the subjective judgments involved in developing and assessing such information, engineering estimates of the quantities of recoverable oil and gas reserves in oil and gas fields are inherently imprecise and represent only approximate amounts.
Before estimated oil and gas reserves are designated as “proved”, certain engineering criteria must be met in accordance with industry standards and the regulations of the SEC. Proved oil and gas reserves are the estimated quantities of crude oil and natural gas, which, by analysis of geoscience and engineering data, can be estimated with reasonable certainty to be economically producible from a given date forward, from known reservoirs, and under existing economic conditions, operating methods, and government regulation before the time at which contracts providing the right to operate expire, unless evidence indicates that renewal is reasonably certain, regardless of whether the estimate is a deterministic estimate or probabilistic estimate. Therefore, these estimates do not include probable or possible reserves. Our proved reserves estimates are assessed or audited annually by
 
57

Table of Contents
independent, qualified and experienced oil and gas reserves engineering firms in the United States and Canada. Our oil and gas reserves engineering department has policies and procedures in place to ensure that these estimates are consistent with these authoritative guidelines. Among other factors required by authoritative guidelines, this estimation takes into account recent information about each field, including production and seismic information, estimated recoverable reserves of each well, and oil and gas prices and operating costs as of the date the estimate is made. The price shall be the average price during the
12-month
period before the ending date of the period covered by this report, determined as an unweighted arithmetic average of the
first-day-of-the-month
price for each month within such period, unless prices are defined by contractual arrangements, excluding escalations based upon future conditions. The costs shall be that prevailing at the end of the period.
Despite the inherent imprecision in these engineering estimates, estimated proved oil and gas reserves quantity has a direct impact on certain amounts reported in the financial statements. In addition to the capitalization of costs related to oil and gas properties on the balance sheet discussed earlier, estimated proved reserves also impact the calculation of depreciation, depletion and amortization expenses of oil and gas properties. The cost of oil and gas properties is amortized at the field level on the unit of production method. Unit of production rates are based on the total oil and gas reserves estimated to be recoverable from existing facilities based on the current terms of our production licenses. Our reserves estimates include only crude oil and natural gas which the management believes can be reasonably produced within the current terms of the production licenses that are granted by the Ministry of Natural Resources, ranging from 30 years to 55 years from the effective date of issuance in March 2000, renewable upon application 30 days prior to expiration. Consequently, the impact of changes in estimated proved reserves is reflected prospectively by amortizing the remaining book value of the oil and gas property assets over the expected future production. If proved reserves estimates are revised downward, earnings could be affected by higher depreciation expense or an immediate
write-down
of the property’s book value had the downward revisions been significant See “— Property, Plant and Equipment” below. Given our large number of producing properties in our portfolio, and the estimated proved reserves, it is unlikely that any changes in reserves estimates will have a significant effect on prospective charges for depreciation, depletion and amortization expenses.
In addition, due to the importance of these estimates in understanding the perceived value and future cash flows of a company’s oil and gas operations, we have also provided supplemental disclosures of “proved” oil and gas reserves estimates prepared in accordance with authoritative guidelines elsewhere in this annual report.
Property, Plant and Equipment
Where it is probable that property, plant and equipment, including oil and gas properties, will generate future economic benefits, their costs are initially recorded in the consolidated statement of financial position as assets. Cost represents the purchase price of the asset and other costs incurred to bring the asset into expected use. Subsequent to their initial recognition, property, plant and equipment are carried at cost less accumulated depreciation, depletion and amortization (including any impairment).
Depreciation, to write off the cost of each asset, other than oil and gas properties, to their residual values over their estimated useful lives is calculated using the
straight-line
method.
We use the following useful lives for depreciation purposes:
 
Buildings and plants
    
8-40 years
 
Equipment and machinery
    
4-30
years
 
Motor vehicles
    
4-14
years
 
Other
    
5-12
years
 
No depreciation is provided on construction in progress until the assets are completed and ready for use.
 
58

Table of Contents
The assets’ residual values and useful lives are reviewed, and adjusted as appropriate, at the end of each reporting period.
Property, plant and equipment, including oil and gas properties, are reviewed for possible impairments when events or changes in circumstances indicate that the carrying amount may not be recoverable. Determination as to whether and how much an asset is impaired involves management estimates and judgments such as future crude oil prices, prices of refined products and chemical products, the operation costs, the product mix, production volumes and the oil and gas reserves. Certain estimates and assumptions adopted by the management in the impairment reviews and calculations are formed by the internal professional team (including operations and finance teams) by reference to external institutions’ analysis reports and taking into account current economic conditions. The other estimates and assumptions are consistent with the assumptions used in our business plans.
In forming the relevant estimates and assumptions for impairment tests by our management, our internal professional team (including operations and finance teams) forms a preliminary conclusion by reference to the external institutions’ analysis reports and our historical financial data, and taking into account current economic conditions and our business plans. Then, the preliminary conclusion is reviewed and approved by the management. The approved estimates and assumptions are then utilized by our subsidiaries and branches to perform the impairment tests.
When determining whether there are indications of impairment for oil and gas properties, we consider internal factors, mainly including the decline of production and reserves volumes at the late development stage of certain oil blocks and a significant drop in economic benefits of certain oil blocks resulting from the lower price of crude oil, and external factors, mainly including a significant drop in international prices of crude oil, resulting from the imbalance of supply and demand of crude oil. When an indication of impairment of certain oil blocks is identified, we will perform the impairment tests on the oil blocks. An impairment loss is recognized for the amount by which the carrying amount of the cash-generating unit exceeds the higher of its fair value less costs to sell and its value in use. Value in use is determined by reference to the discounted expected future cash flows to be derived from the cash-generating unit.
The expected
medium-to-long-term
future international prices of crude oil utilized by us when estimating the expected future cash flows are determined mainly based upon the forecast of the international prices of crude oil made by principal international investment institutions combined with the judgment and analysis of the future trends of international prices of crude oil made by us. We calculated the expected future cash flows of each oil block according to the estimates of future production volume levels per year stated in the oil and gas reserves reports, the estimates of operation costs of oil and gas made by us, and taking into account our future capital expenditure plan. We refer to the weighted average cost of capital of the oil and gas industry when determining the discount rate and makes relevant adjustments according to specific risks in different countries or regions. In the years ended December 31, 2019, 2020 and 2021, the after-tax discount rates adopted by most of our oil and gas regions were in the range of 6.4% - 15.4%,
5.9%-12.0%,
and 7.6%
-15.0%,
respectively.
Given the broad scope of our property, plant and equipment, the impairment test involves numerous assumptions, which are interrelated to each other to a certain extent. For example, the estimates and judgments with respect to the product mix, production costs and oil and gas reserves may vary along with the changes in crude oil prices. The sensitivity analysis performed after taking into account the interrelationship among all of the estimates and judgments would be neither cost efficient nor time efficient. As a result, the management believes that a sensitivity analysis of relevant assumptions on impairment is not practicable. Favorable changes to some assumptions might have avoided the need to impair any assets or make it necessary to reverse an impairment loss recognized in prior periods, whereas unfavorable changes might have caused an additional unknown number of other assets to become impaired, or resulted in larger impacts on impaired assets.
 
59

Table of Contents
Our operating results in the following fiscal year may deviate from management’s estimates or judgments. This would require an adjustment to the provision for impairment of the property, plant and equipment disclosed in Note 15 to the consolidated financial statements.
Gains and losses on disposals of property, plant and equipment are determined by reference to their carrying amounts and are recorded in the consolidated profit or loss.
Interest and other costs on borrowings to finance the purchase and construction of property, plant and equipment are capitalized during the period of time that is required to complete and prepare the asset for its intended use. Costs for repairs and maintenance activities are expensed as incurred except for costs of components that result in improvements or betterments which are capitalized as part of property, plant and equipment and depreciated over their useful lives.
Asset Retirement Obligation
Provision is recognized for the future decommissioning and restoration of oil and gas properties. The amounts of the provision recognized are the present values of the estimated future expenditures. The estimation of the future expenditures is based on current local conditions and requirements, including legal requirements, technology, price level, etc. In addition to these factors, the present values of these estimated future expenditures are also impacted by the estimation of the economic lives of oil and gas properties. Changes in any of these estimates will impact our operating results and the financial position over the remaining economic lives of the oil and gas properties.
Operating Results
The following discussion is based on our historical results of operations. As a result of the factors discussed above, such results of operations may not be indicative of our future operating performance.
Our statement of comprehensive income for each of the years ended December 31, 2019, 2020 and 2021 is summarized in the table below.
 
    
Year Ended December 31,
 
    
2019
   
2020
   
2021
 
    
(RMB in millions)
 
Revenue
     2,516,810       1,933,836       2,614,349  
Operating expenses
     (2,395,048     (1,857,899     (2,453,196
Profit from operations
     121,762       75,937       161,153  
Exchange gain, net
     1       108       538  
Interest expense, net
     (26,778     (23,505     (16,755
Share of profit of affiliates and joint ventures
     8,229       3,533       13,267  
Profit before income tax expense
     103,214       56,073       158,203  
Income tax expense
     (36,199     (22,588     (43,507
Profit for the year attributable to
non-controlling
interests
     21,333       14,479       22,526  
Profit for the year attributable to owners of the Company
     45,682       19,006       92,170  
 
60

Table of Contents
The table below sets forth our revenue by business segment for each of the years ended December 31, 2019, 2020 and 2021 as well as the percentage changes in revenue for the periods shown.
 
    
2019
   
2020
   
2020
vs.
2019
   
2021
   
2021
vs.
2020
 
    
(RMB in millions, except percentages)
 
Revenue
          
Exploration and production
     676,320       530,807       (21.5 )%      688,334       29.7
Refining and chemicals
     1,000,062       774,775       (22.5 )%      974,972       25.8
Marketing
     2,075,044       1,497,533       (27.8 )%      2,170,062       44.9
Natural gas and pipeline
     391,023       370,771       (5.2 )%      417,022       12.5
Headquarters and others
     3,700       3,547       (4.1 )%      3,894       9.8


Total
     4,146,149       3,177,433       (23.4 )%      4,254,284       33.9
Less: elimination
     (1,629,339     (1,243,597     (23.7 )%      (1,639,935     31.9


Consolidated net sales from operations
     2,516,810       1,933,836       (23.2 )%      2,614,349       35.2


The table below sets forth our operating income by business segment for each of the years ended December 31, 2019, 2020 and 2021, as well as the percentage changes in operating income for the periods shown. Loss from operations for headquarters and others shown below consists of expenses for research and development, business services and infrastructure support to our operating business segments.
 
    
2019
   
2020
   
2020
vs.
2019
   
2021
   
2021
vs.
2020
 
    
(RMB in millions, except percentages)
 
Profit/(loss) from operations
          
Exploration and production
     96,097       23,092       (76.0 )%      68,452       196.4
Refining and chemicals
     16,077       (1,834     (111.4 )%      49,740       —    
Marketing
     (2,878     (2,906     —         13,277       —    
Natural gas and pipeline
     26,108       72,410       177.3     43,965       (39.3 )% 
Headquarters and others
     (13,642     (14,825     —         (14,281     —    


Total
     121,762       75,937       (37.6 )%      161,153       112.2


Year Ended December 31, 2021 Compared to Year Ended December 31, 2020
Consolidated Results of Operations
Overview
In 2021, we achieved a revenue of RMB2,614,349 million, representing an increase of 35.2% as compared with last year. Net profit attributable to owners of the company was RMB92,170 million, representing an increase of 385.0% as compared with last year. Basic earnings per share were RMB0.50 yuan, representing an increase of RMB0.40 yuan as compared with last year.
 
61

Table of Contents
Revenue
Our revenue was RMB2,614,349 million for 2021, representing an increase of 35.2% as compared with last year. This was primarily due to the increase in the sales volume, the sharp rise in selling prices of most of our oil and gas products, and the outstanding work results of quality and profitability enhancement. The table below sets out external sales volume and average realized prices for major products sold by us in 2021 and 2020 and their respective percentage of change:
 
    
Sales Volume (‘000 ton)
   
Average Realized Price
(RMB/ton)
 
    
2021
    
2020
    
Percentage of
Change (%)
   
2021
    
2020
    
Percentage of
Change (%)
 
Crude oil*
     158,342        158,266       
Generally
even
 
 
    3,198        2,070        54.5  
Natural gas (hundred million cubic meters, RMB/’000 cubic meters)**
     2,739.74        2,487.45        10.1       1,729        1,170        47.8  
Gasoline
     65,981        66,084        (0.2     7,018        5,561        26.2  
Diesel
     81,728        80,796        1.2       5,395        4,221        27.8  
Kerosene
     15,598        14,350        8.7       3,661        2,652        38.0  
Polyethylene
     5,808        5,659        2.6       7,835        6,725        16.5  
Polypropylene
     4,272        4,200        1.7       7,830        7,002        11.8  
Lubricant
     1,565        1,404        11.5       6,858        6,426        6.7  
 
*
The crude oil listed above represents all our external sales volume of crude oil.
**
The natural gas listed above represents all our external sales volume of natural gas. The substantial increase in average realized prices was mainly due to a significant increase in overseas
re-export
trade prices. The domestic sales price of natural gas increased by 6.5% as compared with last year.
Operating Expenses
Operating expenses for 2021 were RMB2,453,196 million, representing an increase of 32.0% as compared with last year, of which:
Purchases, Services and Other Expenses
Purchases, services and other expenses for 2021 were RMB1,770,019 million, representing an increase of 39.6% as compared with last year. This was primarily due to the increase in the expenses for purchasing oil and gas products and trading expenses, as a result of the increase in the sales volume of the oil and gas products and in the prices of the raw materials.
Employee Compensation Costs
Employee compensation costs (including salaries of permanent employees and cost of market-oriented temporary and seasonal contractors, various types of insurance, housing provident funds, training fees and other additional costs) for 2021 were RMB154,835 million, representing an increase of 4.9% as compared with last year. This was primarily due to the fact that the Chinese government introduced temporary preferential policies for social insurance fees in 2020 in response to the
COVID-19
pandemic, which expired in 2021, and employee compensation in 2021 was adjusted in line with our operating results.
Exploration Expenses
Exploration expenses for 2021 were RMB24,248 million, representing an increase of 25.4% as compared with last year. This was primarily due to the fact that we strengthened our exploration and development efforts and vigorously promoted the increase in both our reserves and production of oil and gas.
Depreciation, Depletion and Amortisation
Depreciation, depletion and amortisation for 2021 was RMB231,269 million, representing an increase of 8.1% as compared with last year. This was primarily due to an increase in assets and the structural change in oil and gas resources, partially offset by the impairment in assets.
Selling, General and Administrative Expenses
Selling, general and administrative expenses for 2021 were RMB57,802 million, representing a decrease of 10.2% as compared with last year. This was primarily due to our further promoting the improvement of quality and profitability and the decrease in
non-production
expenses.
 
62

Table of Contents
Taxes other than Income Taxes
Taxes other than income taxes for 2021 were RMB228,003 million, representing an increase of 16.4% as compared with last year, among which the consumption tax for 2021 was RMB161,623 million, representing an increase of 11.1% as compared with last year; the resource tax for 2021 was RMB23,723 million, representing an increase of 28.5% as compared with last year; and crude oil special gain levy for 2021 was RMB4,655 million, representing an increase of RMB4,477 million as compared with last year.
Other Income, net
Other income, net for 2021 was RMB12,980 million, representing a decrease of 74.5% as compared with last year, primarily due to the
one-time
gain from the Company’s pipeline assets restructuring recorded in 2020 and the
one-time
gain from the pipeline assets transaction of Kunlun Energy Company Limited (“Kunlun Energy”), a subsidiary of our company, recorded in 2021.
Profit from Operations
The profit from operations for 2021 was RMB161,153 million, representing an increase of 112.2% as compared with last year.
Net Exchange Gain
Net exchange gain for 2021 was RMB538 million, representing an increase of 398.1% as compared with last year. This was primarily due to the impact of fluctuations in the exchange rate of US Dollar against Renminbi.
Net Interest Expense
Net interest expense for 2021 was RMB16,755 million, representing a decrease of 28.7% as compared with last year, primarily due to the Company’s control of the size of its interest-bearing debts, optimization of its debt structure, and reduction of the cost of its debts.
Profit Before Income Tax Expense
Profit before income tax expense for 2021 was RMB158,203 million, representing an increase of 182.1% as compared with last year.
Income Tax Expense
The income tax expense for 2021 was RMB43,507 million, representing an increase of 92.6% as compared with last year, which was primarily due to the sharp increase in our profit before income tax expense over the same period last year.
Profit for the Year
Net profit for 2021 was RMB114,696 million, representing an increase of 242.5% as compared with last year.
Profit Attributable to
Non-controlling
Interests
Profit attributable to
non-controlling
interests for 2021 was RMB22,526 million, representing an increase of 55.6% as compared with last year, which was primarily due to the sharp increase of profits of subsidiaries of our company as a result of the rise in oil and gas prices over the same period last year.
Profit Attributable to Owners of the Company
Profit attributable to owners of the company for 2021 was RMB92,170 million, representing an increase of 385.0% as compared with last year.
Segment Results
Exploration and Production
Revenue
The realized revenue of the exploration and production segment for 2021 was RMB688,334 million, representing an increase of 29.7% as compared with last year, which was primarily due to the increase in the prices of oil and gas products and the rise in the sales volume of natural gas. In 2021, the crude oil imported by our exploration and production segment amounted to 37.13 million tons, representing a decrease of 4.9% as compared with last year. The revenue from the sales was RMB119,547 million for 2021, representing an increase of 40.5% as compared with last year.
The average realized crude oil price of the Company in 2021 was US$65.58 per barrel, representing an increase of 62.6% as compared with last year.
 
63

Table of Contents
Operating Expenses
Operating expenses of the exploration and production segment for 2021 were RMB619,882 million, representing an increase of 22.1% as compared with last year, which was primarily due to the increase in procurement expenses and taxes other than income taxes. In 2021, the cost for importing crude oil incurred by our exploration and production segment amounted to RMB119,354 million, representing an increase of 38.2% as compared with last year.
In 2021, the unit oil and gas lifting cost of our company was US$12.30 per barrel, representing an increase of 10.8% as compared with last year. Excluding the impact of exchange rate of US Dollar against Renminbi, the
year-on-year
increase rate was 3.6%.
Profit from Operations
In 2021, by actively working to meet the requirements of “carbon peaking and carbon neutrality” targets in our domestic business, the exploration and production segment, steadily promoted the transition of the oil and gas business to green and
low-carbon
operation. This segment continuously optimized the structure of oil and gas products, vigorously strengthened natural gas exploration and development efforts, maintained a rapid growth of natural gas production, thus having achieved an increase in both production and profits. In overseas business, we actively carried out
follow-up
evaluation of the profitability of oil and gas projects, and strived to optimize the asset structure. We continued to strengthen cost management and continuously endeavored to enhance our ability to generate profits. In 2021, the exploration and production segment realized operating profits of RMB68,452 million, representing an increase of 196.4% as compared with last year.
Refining and Chemicals
Revenue
The revenue of the refining and chemicals segment for 2021 was RMB974,972 million, representing an increase of 25.8% as compared with last year, primarily due to the increase in the price of the refined and chemical products, and the increase in the sales volume of certain products. The revenue from our refining business for 2021 was RMB736,004 million, representing an increase of 23.9% as compared with last year and the revenue from our chemical business for 2021 was RMB238,968 million, representing an increase of 32.2% as compared with last year.
Operating Expenses
Operating expenses of the refining and chemicals segment for 2021 were RMB925,232 million, representing an increase of 19.1% as compared with last year, primarily due to the increase in the procurement costs of crude oil and feedstock, as well as the increase in taxes other than income taxes.
In 2021, the cash processing cost of our refineries was RMB166.65 yuan per ton, representing an increase of 1.7% as compared with last year, primarily due to the increase in the price of fuel power.
Profit from Operations
In 2021, the refining and chemicals segment adhered to the market orientation principle, continued optimizing the production and operations and improving profitability, and significantly strengthened the control over costs and expenses. The refining and chemicals segment realized operating profits of RMB49,740 million in 2021, representing an increase of RMB51,574 million from last year. The operating profit recorded by our refining business was RMB37,730 million in 2021, increasing by RMB50,531 million from last year and the operating profit realized by our chemical business was RMB12,010 million in 2021, representing an increase of RMB1,043 million as compared with last year.
Marketing
Revenue
The revenue of the marketing segment for 2021 was RMB2,170,062 million, representing an increase of 44.9% as compared with last year, primarily due to the increase in the price and sales volume of refined oil.
 
64

Table of Contents
Operating Expenses
Operating expenses of the marketing segment for 2021 were RMB2,156,785 million, representing an increase of 43.7% as compared with last year, primarily due to the increase in the expenditures incurred for the external purchase of refined oil.
Profit from Operations
In 2021, the marketing segment, by taking advantage of the gradual recovery of the demand for refined oil in domestic market, significantly strengthened its efforts in targeted marketing and actively developed its retail and end customers. By aligning the domestic market with the international market, we reasonably arranged for the wholesale and export of refined oil. In addition to optimizing the allocation and distribution of refined oil, we also endeavored to control the marketing expenses. In 2021, the marketing segment recorded an operating profit of RMB13,277 million, representing an increase of RMB16,183 million, as compared with last year.
Natural Gas and Pipeline
Revenue
The revenue of the natural gas and pipeline segment amounted to RMB417,022 million for 2021, representing an increase of 12.5% as compared with last year, primarily due to the increase in both sales volume and price of natural gas.
Operating Expenses
Operating expenses of the natural gas and pipeline segment amounted to RMB373,057 million for 2021, representing an increase of 25.0% as compared with last year, primarily due to the increase in the natural gas purchase expenditure.
Profit from Operations
In 2021, the natural gas and pipeline segment, by taking advantage of stable growth of domestic economy and market demand recovery, actively developed direct sales and end customers, continuously improved service quality, and strived to increase sales volume. We significantly strengthened our control over the natural gas procurement cost and continued to improve sales profitability. We successfully completed the closing of the transfer of interests in the pipeline assets of Kunlun Energy. The operating profit realized by this segment was RMB43,965 million in 2021, representing a decrease of 39.3% as compared with last year, which was primarily due to the decrease in the profit derived from the pipeline asset restructuring as compared with 2020. In 2021, the imported natural gas business of the company recorded a loss of RMB7,212 million, representing a reduction in loss of RMB6,947 million as compared with last year. We will continue to take effective measures to control losses from our imported natural gas business.
In 2021, our international operations
(Note)
realized a revenue of RMB987,733 million, accounting for 37.8% of our total revenue. Profit before income tax expenses amounted to RMB8,836 million, accounting for 5.6% of our profit before taxes. Our international operations maintained a stable development with continuous improvement in our abilities of international operation.
Note: Our four operating segments are exploration and production, refining and chemicals, marketing as well as natural gas and pipeline. International operations do not constitute a separate operating segment of the company. The financial data of international operations are included in the financial data of respective operating segments mentioned above.
Liquidity and Capital Resources
Our primary sources of funding include cash generated by operating activities and
short-term
and
long-term
borrowings, which are expected to be adequate to meet our requirements for cash in the next 12 months and thereafter under existing agreements and other known obligations. Our primary uses of funds were for operating activities, capital expenditures, repayment of
short-term
and
long-term
borrowings and distributions of dividends to shareholders. Our payments to CNPC are limited to dividends and payments for the goods and services provided, and land and real properties leased, to us by CNPC. See “Item 7 — Major Shareholders and Related Party Transactions — Related Party Transactions — Continuing Related Party Transactions” and Note 38 to our consolidated financial statements included elsewhere in this annual report.
 
65

Table of Contents
For 2021, we have distributed interim dividends of RMB23,870 million to our shareholders. Based on an overall consideration of various factors, including our operating performance, financial status and cash flows, our board of directors recommended the final dividends for 2021 of RMB17,610 million, which would result in the aggregate dividends for 2021 to amount to RMB41,480 million. See “Item 8 — Financial Information — Dividend Policy” for a discussion of factors which may affect the determination by our board of directors of the appropriate level of dividends.
Our financing ability may be limited by our financial condition, our results of operations and the international and domestic capital markets. Prior to accessing the international and domestic capital markets, we generally need to obtain approval from the relevant PRC government authorities. In general, we need to obtain PRC government approval for any project involving significant capital investment for our refining and chemicals, marketing and natural gas and pipeline segments. For a more detailed discussion of factors which may affect our ability to satisfy our financing requirements, see “Item 3 — Key Information — Risk Factors — Risks Related to Liquidity”.
We plan to fund the capital and related expenditures described in this annual report principally through cash from operating activities,
short-term
and
long-term
borrowings and cash and cash equivalents. Net cash flows from operating activities in the year ended December 31, 2021 was RMB341,469 million. As of December 31, 2021, we had cash and cash equivalents of RMB136,789 million. While each of the projects described in this annual report for which significant capital expenditures will be required is important to our future development, we do not believe that failure to implement any one of these projects would have a material adverse effect on our financial condition or results of operations. If the price of crude oil declines sharply in the future, it is likely that we would delay or reduce the scale of the capital expenditures for each segment.
We currently do not have any outstanding options, warrants or other rights for any person to require us to issue any common stock at a price below its market value. We do not currently intend to issue any such rights or to otherwise issue any common stock for a price below its market value. There are currently no restrictions on the ability of our subsidiaries to transfer funds to our company in the form of cash dividends, loans or advances, which restriction, if imposed, have had or would be expected to have the effect of limiting our ability to meet our cash obligations.
In addition, as of December 31, 2021, we did not have any transactions, arrangements or other relationships with unconsolidated entities or other persons that are reasonably likely to materially affect the liquidity or availability of or requirements for our capital resources.
The table below sets forth our net cash flows for each of the years ended December 31, 2019, 2020 and 2021 and the balance of our cash and cash equivalents at the end of each of such years.
 
    
Year Ended December 31,
 
    
2019
   
2020
   
2021
 
    
(RMB in millions)
 
Net cash flows from operating activities
     359,610       318,575       341,469  
Net cash flows used for investing activities
     (332,948     (181,986     (213,032
Net cash flows used for financing activities
     (27,276     (99,400     (107,971
Currency translation difference
     1,069       (4,967     (2,308
Cash and cash equivalents
     86,409       118,631       136,789  
Our cash and cash equivalents increased by 15.3% from RMB118,631 million as of December 31, 2020 to RMB136,789 million as of December 31, 2021. The cash and cash equivalents were mainly denominated in US Dollar and Renminbi (approximately 58.5% were denominated in Renminbi, approximately 36.7% were denominated in US Dollar, approximately 3.8% were denominated in HK Dollar and approximately 1.0% were denominated in other currencies).
 
66

Table of Contents
Net Cash Flows from Operating Activities
Our net cash flows from operating activities amounted to RMB341,469 million in 2021, representing an increase of 7.2% from RMB318,575 million in 2020. This was mainly due to a combination of an increase in profit for the year and changes in working capital. In 2021, as a result of both a steady increase in oil prices and successful containment of the COVID-19 pandemic in China and recovery therefrom, our profit for the year recorded remarkable improvement, which contributed to an increase in net cash flows from operating activities. In addition, as a result of a significant increase in the prices of crude oil, refined oil products and other chemical products, our inventories at the end of the reporting period increased as compared to 2020, which decreased our working capital, and resulted in a decrease in net cash flows from operating activities.
Net Cash Flows Used for Investing Activities
Our net cash flows used for investing activities in 2021 amounted to RMB213,032 million, representing an increase of 17.1% from RMB181,986 million in 2020. The increase was primarily due to the increase in capital expenditures of RMB13,241 million, partially offset by a decrease in proceeds from pipeline restructuring of RMB49,547 million, due to the recording of proceeds from pipeline restructuring from our sale of interests to PipeChina in 2020 of RMB80,621 million as compared to the recording of proceeds from pipeline restructuring from our subsidiary Kunlun Energy’s sale of its interests to PipeChina in 2021 of RMB31,074 million.
Net Cash Flows Used for Financing Activities
Our net cash used for financing activities in 2021 was RMB107,971 million, representing an increase of 8.6% from RMB99,400 million in 2020. This was primarily due to the optimization of our debt structure, an overall decrease of long-term and short-term borrowings.
Our net borrowings as of December 31, 2019, 2020 and 2021 were as follows:
 
    
As of December 31,
 
    
2019
    
2020
    
2021
 
    
(RMB in millions)
 
Short-term
borrowings (including current portion of
long-term
borrowings)
     175,840        117,542        53,275  
Long-term
borrowings
     290,882        251,379        287,175  


Total borrowings
     466,722        368,921        340,450  


Less: cash and cash equivalents
     86,409        118,631        136,789  


Net borrowings
     380,313        250,290        203,661  


The following table sets out the remaining contractual maturity of borrowings as of December 31, 2020 and 2021 according to the earliest contractual maturity dates. The amounts set out below are contractual undiscounted cash flows, including principal and interest:
 
    
As of December 31,
 
    
2020
    
2021
 
    
(RMB in million)
 
Within 1 year
     124,777        58,923  
Between 1 and 2 years
     53,526        53,250  
Between 2 and 5 years
     188,012        226,124  
After 5 years
     27,894        28,053  


Total
     394,209        366,350  


67

Table of Contents
Our total borrowings as of December 31, 2021 consisted of approximately 38.7% of fixed-rate loans and approximately 61.3% of floating-rate loans. Of our borrowings as of December 31, 2021, approximately 70.0% were denominated in Renminbi, approximately 27.9% were denominated in US Dollars and approximately 2.1% were denominated in other currencies.
Our debt to capital ratio (calculated by dividing
interest-bearing
debts by the aggregate of
interest-bearing
debts and shareholder’s equity; interest-bearing debts including various long and short term borrowings) as of December 31, 2019, 2020 and 2021 was 24.4%, 21.3% and 19.5%.
As of December 31, 2021, the outstanding amount of our debts secured by CNPC and its subsidiaries and other third parties was RMB13,558 million.
Capital Expenditures and Investments
In 2021, our capital expenditures amounted to RMB251,178 million, representing an increase of 1.9% from RMB246,493 million in 2020.
The table below sets forth our capital expenditures and investments by business segment for each of the years ended December 31, 2019, 2020 and 2021, and the estimated amounts for 2022.
 
    
2019
    
2020
    
2021
    
2022 (estimated)
 
    
(RMB in
millions)
    
%
    
(RMB in
millions)
    
%
    
(RMB in
millions)
    
%
    
(RMB in
millions)
    
%
 
Exploration and production
(1)
     230,117        77.54        186,620        75.71        178,259        70.97        181,200        74.88  
Refining and chemicals
     21,823        7.35        21,810        8.85        54,487        21.69        44,500        18.39  
Marketing
     17,074        5.76        16,294        6.61        10,982        4.37        7,500        3.10  
Natural gas and pipeline
     27,004        9.10        21,143        8.58        6,750        2.69        8,000        3.30  
Headquarters and others
     758        0.25        626        0.25        700        0.28        800        0.33  


Total
     296,776        100.00        246,493        100.00        251,178        100.00        242,000        100.00  


(1)
If investments related to geological and geophysical exploration costs are included, the capital expenditures and investments for the exploration and production segment in each of 2019, 2020, 2021, and estimated amount for 2022 would be RMB241,992 million, RMB197,019 million, RMB189,951 million and RMB193,200 million, respectively.
In 2021, we have fully accelerated the new energy, new materials and new business development and invested approximately RMB3 billion in those areas. In particular, we have made substantial progress in the geothermal and hydrogen areas. In 2021, we have completed the construction of 39 new energy projects and achieved an increase in our new energy development and utilization capacity of 3.5 million tons of standard coal equivalent, thus having increased our new energy development and utilization capacity to 7 million tons of standard coal equivalent in total. The capital expenditures we expect for the new energy, new materials and new business development in 2022 will be approximately RMB10 billion.
As of December 31, 2021, the capital commitments contracted but not paid by us were approximately RMB882 million, mainly related to property, plant and equipment.
Exploration and Production
A majority of our capital expenditures and investments relate to our exploration and production segment. For the years ended December 31, 2019, 2020 and 2021, the capital expenditures in relation to the exploration and production segment amounted to RMB230,117, RMB186,620 million and RMB178,259 million, respectively. In 2021, our capital expenditures were primarily used for exploration and development activities to increase our scale in the key basins such as Songliao Basin, Erdos Basin, Junggar Basin, Tarim Basin, Sichuan
 
68

Table of Contents
Basin and Bohai Bay Basin, devoting greater efforts in the exploration of unconventional resources such as shale gas and shale oil, promoting the replacement with clean energy and other new energy projects; and exploration, development and operation of existing projects in overseas cooperation areas in the Middle East, Central Asia, the Americas and the Asia Pacific region.
We estimate that our capital expenditures for the exploration and production segment for 2022 will be RMB181,200 million, which is expected to be primarily used for our continuous exploration and development to increase our scale and maximize our profitability in key domestic basins such as Songliao, Ordos, Junggar, Tarim, Sichuan and Bohai Bay. We intend to devote greater efforts in the exploration of unconventional resources such as shale gas and shale oil and to promote new energy projects including clean electricity and CCUS. By adhering to the principle of optimized development, our overseas operations will continue to focus on the operation of existing projects in cooperation areas such as the Middle East, Central Asia, the Americas and the Asia Pacific region, while seeking opportunities to obtain new projects of high quality.
Refining and Chemicals
Our capital expenditures for our refining and chemicals segment for each of the years ended December 31, 2019, 2020 and 2021 were RMB21,823 million, RMB21,810 million and RMB54,487 million, respectively. In 2021, our capital expenditures were primarily used for the Guangdong Petrochemical integrated refining and chemical project, Changqing and Tarim
ethane-to-ethylene
projects, and expansion and construction of other large-scale refining and chemical projects for producing such products as ethylene, as well as transformation and upgrading projects for reducing refining capacity and increasing chemicals production capacity, and new materials and new technologies.
It is estimated that the capital expenditures for the refining and chemicals segment for 2022 will be RMB44,500 million, which is expected to be used primarily for the Guangdong Petrochemical integrated refining and chemical project, the construction of large-scale refining and chemical projects at Jilin Petrochemical and Guangxi Petrochemical for producing such products as ethylene, as well as transformation and upgrading projects for reduction of refining capacity and increasing of chemicals production capacity, and new materials and new technologies.
Marketing
Our capital expenditures for our marketing segment for each of the years ended December 31, 2019, 2020 and 2021 were RMB17,074 million, RMB16,294 million and RMB10,982 million, respectively. In 2021, our capital expenditures were primarily used for the construction of our sale network for
end-products
within domestic refined oil markets, expansion of new energy projects such as hydrogen refueling stations, and the construction of overseas oil and gas storage and sales facilities.
It is estimated that the capital expenditures for the marketing segment for 2022 will be RMB7,500 million, which is expected to be used primarily for the construction of our sales network for
end-products
within domestic refined oil markets, expansion of new energy projects such as hydrogen refueling stations, and the construction of overseas oil and gas storage and sales facilities.
Natural Gas and Pipeline
Our capital expenditures for the natural gas and pipeline segment for each of the three years ended December 31, 2019, 2020 and 2021 were RMB27,004 million, RMB21,143 million and RMB6,750 million, respectively. Our capital expenditures for the natural gas and pipeline segment in 2021 were mainly used for construction of LNG receiving stations, natural gas branch lines, development of urban gas
end-use
markets, and integration of new energy with natural gas power generation.
 
69

Table of Contents
We estimate that our capital expenditures for the natural gas and pipeline segment for 2022 will be RMB8,000 million, which is expected to be used primarily for the construction of LNG receiving stations, natural gas branch lines, development of urban gas
end-use
markets, and the integration of natural gas power generation with new energy.
Headquarters and Others
Our
non-segment
capital expenditures for each of the years ended December 31, 2019, 2020 and 2021 were RMB758 million, RMB626 million and RMB700 million, respectively, which were primarily used for the improvement of scientific research facilities and construction of our IT system.
We estimate that our capital expenditures for the head office and other segments for 2022 will be RMB800 million, which is expected to be used primarily for the enhancement of research facilities and construction of our IT systems.
Off-Balance
Sheet Arrangements
As of December 31, 2021, we had no
off-balance
sheet arrangements with unconsolidated entities or persons that had or were reasonably likely to have a material current or future effect on our financial condition, changes in financial condition, revenues or expenses, results of operations, working capital, cash requirements or sources of funds.
Long-Term
Contractual Obligations and Other Commercial Commitments and Payment Obligations
All information that is not historical in nature disclosed under “Item 5 — Operating and Financial Review and Prospects —
Long-Term
Contractual Obligations and Other Commercial Commitments and Payment Obligations” is deemed to be a forward-looking statement. See
“Forward-Looking
Statements” for additional information.
The tables below set forth our
long-term
contractual obligations as of December 31, 2021.
 
    
Payment Due by Period
 
Contractual Obligations
  
Total
    
Less Than
1 Year
    
1-3

Years
    
3-5 Years
    
After
5 Years
 
    
(RMB in millions)
 
Long-term
debt
     300,440        13,264        211,007        59,113        17,056  
Lease obligations
     208,853        12,495        21,416        20,306        154,636  
Capital commitments
     882        855        27        —          —    
Debt-related
interest
     23,716        5,414        13,057        2,786        2,459  


Total
     533,891        32,028        245,507        82,205        174,151  


In the next five years, we estimate that we are obligated to pay to the Ministry of Natural Resources RMB500 million each year with respect to our exploration and production licenses.
Assets Retirement Obligation
Most of the provinces and regions in which our oil and gas exploration and production activities are located have promulgated environmental protection regulations, which set forth specific abandonment and disposal processes for oil and gas exploration and production activities. We have established standard abandonment procedures, including plugging all retired wells, dismantling all retired metering stations and other related facilities and performing site restoration, in response to the issuance of these provincial and regional regulations. As of December 31, 2021, the balance of assets retirement obligation was RMB129,405 million.
 
70

Table of Contents
Research and Development
We have three research institutions under the supervision of our research and development management department at our headquarters. Except for those branch companies which are engaged in marketing activities, each of our other branch companies has its own research and development management department. Most of our branch companies have their own research institutions. Our research and development management departments are mainly responsible for managing and coordinating the research and development activities conducted by each of the research institutions. As of December 31, 2021, we had 29,803 employees in our research and development departments and institutions.
In each of the years ended December 31, 2019, 2020 and 2021, our total expenditures for research and development (including capitalized expenditures) were approximately RMB21,410 million, RMB22,921 million and RMB23,731 million, respectively.
Exploration and Production
Most of China’s major oil and gas fields are characterized by a broad range of geological conditions, and a majority of China’s oil and gas fields are in continental sedimentary basins with complex structures. Our research and development efforts with respect to our exploration and production business focus on:
 
   
theories and technologies of crude oil and natural gas exploration;
 
   
oil and gas development theories and technologies;
 
   
engineering technologies and equipment;
 
   
theories and technologies for oil and gas storage and transportation; and
 
   
technologies for security, energy conservation and environmental protection.
Refining and Chemicals
Currently, our research and development efforts in the refining and chemicals segment are focusing on the following areas:
 
   
technologies for clean refined oil products;
 
   
technologies for unqualified heavy oil processing;
 
   
refining-chemical
integration technologies;
 
   
technologies for production of olefin aromatics;
 
   
technologies for new products of synthetic resin and synthetic rubber;
 
   
new catalyst and catalytic materials; and
 
   
technologies for safety, energy saving and environmental protection.
New Energy and New Materials
We expect to increase our efforts into the research and development of new energy and new materials technologies. In 2021, we established the Shenzhen New Energy Research Institute and the Shanghai New Energy Research Institute. We will continue to increase investment into the technology research and development to provide technical support for the development of new energy, new materials and new business.
 
71

Table of Contents
Trend Information
In 2022, the global economy is expected to continue to recover but at a slower growth pace. Affected by the changing situation in terms of the supply of and demand for oil and gas, geopolitical turmoil and other factors, international oil and gas prices are expected to remain at the
high-end,
while fluctuating in a wider range and more frequently. The fundamentals supporting the Chinese economy’s continuous growth over a long term are expected to remain unchanged, and the natural gas market under China’s
low-carbon
strategy is expected to maintain a relatively rapid growth under the
low-carbon
strategy. Faced with various opportunities and challenges, we will adhere to our new development philosophy, actively integrate ourselves into the new development landscape and implement the requirements for high-quality development, by vigorously carrying out the five development strategies, i.e., innovation, resource conservation, marketization, internationalization and green and
low-carbon
transition. We will endeavor to develop our principal business lines, strengthen our enterprise management, carry out reform and innovation, improve quality and enhance profitability, promote green transformation, digital transformation and risk prevention, and strive to create value for shareholders.
In terms of our exploration and production business, we will endeavor to achieve high-efficiency exploration, continue to stabilize oil production and increase gas production, increase risk exploration efforts in key areas, and strengthen the concentrated exploration activities in reserve-increasing areas such as Ordos Mesozoic conventional oil, Songliao Gulong shale oil, Tarim
Bozi-Dabei
and the northern slope of the central Sichuan paleo-uplift conventional gas. We will also focus on exploration in Shawan New Formation of Mahu Lake Junggar, Sichuan Qixia-Maokou and other strategic replacement areas, and carry out exploration activities with our best efforts to achieve strategic discoveries and breakthroughs, endeavoring to improve the reserves replacement rate. By adhering to profitable development, striving to control the decline rate, improving the recovery rate, focusing on optimizing the production capacity structure and layout, and building capacity on a centralized and profitability-focused basis, and constructing key capacity projects, such as Mahu, Fuman, Hetao, and Sulige, in a high-quality manner, we will strive to realize the steady increase of crude oil production and rapid increase of natural gas production. We will promote the construction of shale oil demonstration zones such as Qingcheng, Jimsar, and Gulong, with high standards, and make every effort to organize the large-scale and stable production of shale gas in southern Sichuan. In 2022, we plan to achieve the crude oil output of 898.6 million barrels and the marketable natural gas output of 4,625.1 Bcf, with a total oil and natural gas equivalent output of 1,669.7 million barrels.
In terms of our refining and chemicals business, we intend to keep up with the changes in market demands, continue to promote transformation and upgrading, coordinate to optimize resource allocation and operation organization, flexibly control the
diesel-to-gasoline
ratio in production, promote the growth of production and mutual supply of raw material for chemicals, and strive to maintain high-load operation of chemical plants. We expect to increase the production and sales of high-profitability refined products, specialty products and marketable chemical products with high added value. We expect to strengthen production control and benchmarking management, keep operating on a low inventory basis, organize enterprise maintenance to avoid peak production, strive to ensure that our units operate on a stable, long lasting and optimal basis, as a result of which we expect the primary technical and economic indicators will continue to improve. We will actively promote the new materials business, build
high-end
carbon materials devices, deepen joint-venture-based cooperation in polycarbon and polyoxymethylene, and strive to increase the output of new materials. We will improve the marketing network for chemicals, actively expand our overseas markets, promote the “basic +
high-end”
brand building, make good use of the “PetroChina
e-Chemical”
platform, and promote the increase in both sales volume and profit. We will focus on the construction of key projects, including the completion and commencement of production at the Guangdong Petrochemical project, commencement of the construction of Jilin and Guangxi ethylene projects, acceleration of the progress of the Tarim Phase II ethylene project and the preliminary work of the four ethylene transformation projects in Sichuan, Daqing, Fushun and Lanzhou. In 2022, we plan to refine crude oil of 1,269.4 million barrels.
In terms of our marketing business, we will continue to closely monitor market changes, strengthen our marketing efforts, expand our sales and improve our profitability. We will strengthen our oil price forecast ability
 
72

Table of Contents
and closely follow the development of
oil-consumption
industries. We will strive to increase our market share by monitoring new demand and enhancing customer development efforts. We intend to develop differentiated marketing strategies by industry, region and product, systematically promote the renovation and upgrading of existing gas stations, accelerate the improvement of integrated operation mechanisms such as “retail + wholesale and direct sales” and “sales + service”, and strive to increase sales. We will flexibly adopt asset-light models such as joint ventures, franchises, and lease extension to develop refueling stations for oil and gas, control the development of conventional stations, especially outside-district and high-priced stations, and speed up the construction of new energy stations such as photovoltaic stations, charging and swapping stations, and hydrogen refueling stations (comprehensive energy service stations). We will promote the construction of a gas station management 3.0 system and create a digital and intelligent marketing and service platform. We will innovate the business model of our
non-oil
business, speed up the construction of our
e-commerce
platform, strengthen the marketing of convenience stores and cross-business marketing, and strive to improve the unit store sales revenue and gross profit. We will also carefully organize our international trade business, increase the development of
high-end
and high-profitability markets and cross-region markets, and strive to improve the export profitability of refined oil and chemical products.
In terms of our natural gas and pipeline business, we will optimize our resources and markets, and continue to maintain our competitive advantage. We will selectively develop high-quality projects, deploy potential projects in advance and strengthen market development on a
province-by-province
basis and optimize the distribution of resources, striving to increase the share in high-profitability markets and our
end-customer
market share. We will increase efforts to implement precision marketing, by classifying customers precisely, improving customer service system, optimizing resource structure in the principle of profitability, reducing procurement costs, optimizing the directions of sales flow, pipeline transportation routes and facility utilization, and allocating more resources to high-profitability markets and new industrial areas, chemical parks, new districts in cities and other areas. We will improve the market trading system, promote the market-orientation reform of natural gas pricing, flexibly optimize pricing strategies and online transactions, and promote the reduction of marketing costs and the increase the value of our resources. We will study and assess market changes scientifically, explore a tailored contract mechanism to combine long-term with short-term contracts and improve our marketing management.
In terms of our international business, we will continue to optimize the structure of our overseas assets, business structure and regional deployment, and strive to continuously improve the profitability of our investments. We will strengthen the precision exploration efforts in mature exploration areas, expand the discovery scale of new areas, and confirm the reserves of more large-scale oil and gas fields of high quality. We will actively promote the construction of key projects, reinforce the development of new projects in high-profitability core areas overseas, increase the efforts to optimize existing assets, and endeavor to carry out with due care the closing and
follow-up
operation of the Rumaila project. We will make efforts to procure the extension of high-quality projects and implement the transfer of rights and interests of newly discovered projects, so as to achieve the optimal allocation of assets and continuous improvement of investment returns.
In terms of green and
low-carbon
transformation, we will comprehensively promote clean production, strengthen the dual control of energy consumption intensity and total volume, focus on the treatment of volatile organic compounds and methane emissions, and achieve synergy between energy saving, pollution reduction and carbon reduction. We will promote the construction of new energy bases in “desert, sand dunes, wasteland” areas to integrate wind, solar and gas with battery storage, accelerate the development of geothermal resources in Beijing, Tianjin, Hebei, Shandong and other areas, striving to contribute clean and
low-carbon
energy to the public.
Other than as disclosed above and elsewhere in this annual report, we are not aware of any trends, uncertainties, demands, commitments or events for the periods covered in this annual report that are reasonably likely to have a material effect on our net sales revenue or income, continuous operating revenue, profitability, liquidity or capital resources, or that would cause the disclosed financial information to be misleading.
 
73

Table of Contents
Recent Development
Starting from January 1, 2022, our “natural gas and pipeline segment” was renamed to “natural gas marketing”. The scope of business, and the assets of, and the nature of products or services offered by that segment remain the same after the name change.
Other Information
Inflation
In 2021, the Renminbi in which our financial statements are presented did not experience hyperinflation. Inflation did not have a significant impact on our results of operations for the year ended December 31, 2021.
Related Party Transactions
For a discussion of related party transactions, see “Item 7 — Major Shareholders and Related Party Transactions — Related Party Transactions” and Note 38 to our consolidated financial statements included elsewhere in this annual report.
Recent Developments in IFRS
For a detailed discussion of recent developments in IFRS, see Note 2 to our consolidated financial statements.
Item 6
— DIRECTORS, SENIOR MANAGEMENT AND EMPLOYEES
Directors, Senior Management and Supervisors
As of the date of this report, our board of directors consists of 12 directors, five of whom are independent
non-executive
directors. Directors are appointed at our general meetings for a three-year term. The directors may be
re-appointed
upon the expiration of his/her term of office. The functions and duties conferred on the board of directors include:
 
   
convening shareholders’ meetings and reporting its work to the shareholders’ meeting;
 
   
implementing the resolutions of the shareholders’ meeting;
 
   
determining our business plans and investment programs;
 
   
formulating our annual budget and final accounts;
 
   
formulating our profit distribution and loss recovery proposals;
 
   
formulating proposals for the increase or reduction of our registered capital and the issuance of our debentures or other securities and listings;
 
   
proposing to redeem shares, merge,
spin-off,
dissolve or otherwise change the form of the Company;
 
   
deciding on our internal management structure;
 
   
appointing or dismissing the president of the Company, and upon the nomination of the president, appointing or dismissing vice president, senior vice president, chief financial officer, or CFO, and other senior management, and determining matters relating to their remuneration;
 
   
formulating our basic management system;
 
   
preparing amendments to our Articles of Association;
 
74

Table of Contents
   
managing the information disclosures of our company; and
 
   
exercising any other powers and duties conferred by the shareholders at general meetings.
Seven of our directors are affiliated with CNPC or its subsidiaries other than us.
The PRC Company Law requires a joint stock company with limited liability to establish a supervisory committee. This requirement is reflected in our Articles of Association. The supervisory committee is responsible for monitoring our financial matters and overseeing the corporate actions of our board of directors and our senior management personnel. As of the date of this report, the supervisory committee consists of eight supervisors, five of whom were elected, and may be removed, by the shareholders in a general meeting, and three of whom are employees representatives who were elected by our staff, and may be removed, by our staff. The term of office of our supervisors is three years. The supervisors may be
re-elected
and
re-appointed.
A supervisor cannot concurrently hold the position of a director, president, senior vice president, vice president or CFO in our company.
The supervisory committee shall be responsible to the shareholders’ meeting and shall exercise the following functions and powers in accordance with law:
 
   
to review the periodic reports prepared by the board of directors and issue written opinions in connection with such review;
 
   
to review our financial condition;
 
   
to oversee the performance of duties by the directors, the president, senior vice presidents, vice presidents, the CFO and other senior officers of the Company and to propose the removal of any of the foregoing persons who acts in contravention of any law, regulation, the Company’s Articles of Association or any resolutions of the shareholders’ meeting;
 
   
to demand any director, the president, senior vice president, vice president, the CFO or any other senior officer who acts in a manner which is harmful to the Company’s interest to rectify such behavior;
 
   
to check the financial information such as the financial report, business report and plans for distribution of profits to be submitted by the board of directors at the shareholders’ meetings and to authorize, in the Company’s name, publicly certified and practicing auditors to assist in the
re-examination
of such information should any doubt arise in respect thereof;
 
   
to propose the convening of an extraordinary shareholders’ meeting, and convene and preside over a shareholders’ meeting when the board fails to perform its duties to do so as set forth in the PRC Company Law;
 
   
to submit proposals at the shareholders’ meetings;
 
   
to confer with any director, or initiate legal proceedings on behalf of the Company against any director, the president, senior vice president, vice president, the CFO or any other senior officer in accordance with Article 152 of the PRC Company Law;
 
   
to initiate investigations upon being aware of any extraordinary development in the operational conditions of the Company;
 
   
together with the audit committee of the board of directors, to review the performance of the outside auditors on a yearly basis, and to propose the engagement, renewal of engagement and termination of engagement of the outside auditors, as well as the service fees with respect to the audit services;
 
   
to oversee the compliance of related party transactions; and
 
   
other functions and powers as set forth in the Articles of Association of the Company.
Supervisors shall attend meetings of the board of directors as observers.
 
75

Table of Contents
In the event that any action of our directors adversely affects our interests, supervisors shall confer with or initiate legal proceedings against such directors on our behalf. A resolution proposed at any meeting of the supervisory committee shall be adopted only if it is approved by
two-thirds
or more of our supervisors.
Our senior management is appointed by and serves at the supervision of our board of directors. The board of directors will review, evaluate and supervise the performance of the management and reward or punish the members of the management in accordance with relevant rules and regulations.
Directors
Information on our current directors is as set out below:
 
Name
  
Gender
  
Age
    
Position
  
Term
 
Dai Houliang
   M      58      Chairman     
2020.03-2023.03
 
Hou Qijun
   M      55      Vice Chairman     
2021.10-2023.06
 
Duan Liangwei
   M      54     
Non-executive
Director
    
2017.06-2023.06
 
Liu Yuezhen
   M      60     
Non-executive
Director
    
2014.05-2023.06
 
Jiao Fangzheng
   M      59     
Non-executive
Director
    
2019.06-2022.06
 
Huang Yongzhang
   M      55      Executive Director, President     
2020.09-2023.06
 
Ren Lixin
   M      54      Executive Director, Senior Vice President     
2021.10-2023.06
 
Elsie Leung
Oi-sie
   F      82      Independent
non-executive
Director
    
2017.06-2023.06
 
Tokuchi Tatsuhito
   M      69      Independent
non-executive
Director
    
2017.06-2023.06
 
Simon Henry
   M      60      Independent
non-executive
Director
    
2017.06-2023.06
 
Cai Jinyong
   M      62      Independent
non-executive
Director
    
2020.06-2023.06
 
Jiang, Simon X.
   M      68      Independent
non-executive
Director
    
2020.06-2023.06
 
Dai Houliang
,
age 58, is the chairman of our company, and concurrently the secretary of the CPC Leadership Group of CNPC and the chairman of CNPC. Mr. Dai is a professor-level senior engineer with a doctorate degree, an alternate member of the 19
th
CPC Central Committee, and an academician of the Chinese Academy of Engineering. He has extensive work experience in China’s petroleum and petrochemical industry. In December 1997, he was appointed as vice president of Yangzi Petrochemical Corporation, and appointed as a director and vice president of Yangzi Petrochemical Co., Ltd. (“YPC”) in April 1998. In July 2002, he was appointed as the vice chairman, president, and a member of the standing committee of the CPC Committee, of YPC, and a director of Yangzi Petrochemical Corporation. From December 2003, he served as the chairman, president, and a member of the standing committee of the CPC Committee, of YPC and concurrently as the chairman of Yangzi Petrochemical Corporation, and from November 2004 concurrently as the chairman of
BASF-YPC
Company Limited. From September 2005, he served as the deputy CFO of China Petroleum & Chemical Corporation (“Sinopec”), and from November 2005 as a vice president and deputy CFO of Sinopec, and from May 2006 as a director, senior vice president and CFO of Sinopec. From June 2008, he served concurrently as a member of the CPC Leadership Group of China Petrochemical Corporation (“Sinopec Group”). From May 2016, he served concurrently as the president, a director, and the deputy secretary of the CPC Leadership Group, of Sinopec Group, and from August 2016 as the vice chairman and president of Sinopec, and from May 2018 as the chairman and the president of Sinopec. From July 2018, he served concurrently as the chairman, and the secretary of the CPC Leadership Group, of Sinopec Group. In January 2020, Mr. Dai was appointed as the chairman, and the secretary of the CPC Leadership Group, of CNPC. In March 2020, Mr. Dai was appointed as a director and the chairman of our company.
Hou Qijun
, age 55, is the vice chairman of our company, and concurrently a director, the general manager, and deputy secretary of the CPC Leadership Group of CNPC. Mr. Hou is a professor-level senior engineer with a doctorate degree, who has extensive working experience in China’s petroleum and natural gas industry. Mr. Hou served as a director and vice president of Daqing Oilfield from October 2002, and as the president and deputy secretary of the CPC Committee of Jilin Oilfield Company from October 2004. He served as the secretary of the
 
76

Table of Contents
CPC Committee and vice president of PetroChina Natural Gas and Pipeline Company from September 2011, and concurrently as the director general and deputy secretary of the CPC Committee of Beijing Oil & Gas Control Center from March 2012. Mr. Hou served as the general manager of the Planning Department of our company from November 2013 and as a deputy general manager of CNPC from March 2017, and concurrently as the deputy secretary of the CPC Committee and general manager of PetroChina Exploration and Production Company from April 2017. Mr. Hou was appointed as a director and vice president of our company in June 2017. He was appointed as the president of our company in March 2019. Mr. Hou served as a director, the general manager, and the deputy secretary of the CPC Leadership Group, of PipeChina from October 2021. He was appointed as a director, the general manager, and deputy secretary of the CPC Leadership Group, of CNPC in July 2021. In October 2021, he was appointed as a director and the vice chairman of our company.
Duan Liangwei
, age 54, is a
non-executive
director of our company, and a director of CNPC, the deputy secretary of the CPC Leadership Group of CNPC and the secretary of the CPC Committee of CNPC as a unit directly under the CPC Central Committee. Mr. Duan is a professor-level senior engineer and holds a doctorate degree. He has extensive work experience in China’s petrochemical industry. From February 2006, Mr. Duan served as a deputy general manager, the chief safety officer, and a member of the CPC Committee, of Jilin Petrochemical Company. From March 2010, he served concurrently as the secretary of the CPC Committee, and the general manager, of Jilin Fuel Ethanol Company Limited. From September 2011, he served as the general manager, the deputy secretary of the CPC committee, of Dagang Petrochemical Company. From July 2013, he served as the general manager, and the deputy secretary of the CPC Committee, of PetroChina Dalian Petrochemical Company, the manager of Dalian Petrochemical Corporation, and the director of Dalian Regional Companies Coordination Group. He was appointed as a deputy general manager of CNPC in March 2017. Mr. Duan has served concurrently as the chief safety officer of CNPC since April 2017. Mr. Duan was appointed as a director of our company in June 2017 and the president of our company in March 2020. From September 2019, Mr. Duan has served concurrently as a member of the CPC Leadership Group of CNPC. From September 2020, Mr. Duan has served concurrently as a director, and the deputy secretary of the CPC Leadership Group, of CNPC, and from October 2020, the secretary of the CPC Committee of CNPC as a unit directly under the CPC Central Committee.
Liu Yuezhen
, age 60, is a
non-executive
director of our company. Mr. Liu is a professor-level senior accountant, holds a master’s degree and has extensive financial and accounting experience. He served as deputy general manager and chief accountant of AVIC Jianghan Aviation Life-saving Appliance Corporation since March 1996. In February 2000, he was promoted to general manager of Jianghan Aviation Life-saving Appliance Corporation and served concurrently as the director of the 610 Research Institute. Mr. Liu served as the chairman of the board of directors and general manager of AVIC Beijing Qingyun Aviation Instruments Co., Ltd. from May 2003 and as the chief accountant, and a member of the CPC Leadership Group, of CASIC (Group) Company from November 2006. He served as the chief accountant, and a member of the CPC Leadership Group, of CASIC (Group) Company from December 2007. Mr. Liu served a member of the CPC Leadership Group and the chief accountant of CNPC from December 2013. Mr. Liu was appointed as a director of our company in May 2014.
Jiao Fangzheng
, age 59,
is a
non-executive
director of our company, and concurrently a vice president, and a member of the CPC Leadership Group, of CNPC. Mr. Jiao is a professor-level senior engineer, holds a doctorate degree, and has extensive work experience in China’s petroleum and petrochemical industry. Mr. Jiao served as the chief geologist in Zhongyuan Petroleum Exploration Administration of Sinopec Group from January 1999, as the deputy manager and chief geologist of Sinopec Zhongyuan Oilfield Company, a branch of Sinopec from February 2000, as the deputy director general, and a member of the CPC Committee, of Sinopec Petroleum Exploration & Development Research Institute from July 2000, the deputy director general of Exploration & Production Department from March 2001, as the director general, and deputy secretary of the CPC Committee, of Northwest Petroleum Administration of Sinopec Group and as the general manager of Sinopec Northwest Oilfield Company from June 2004. He served as a vice president of Sinopec from October 2006, concurrently as the director general of Sinopec Petroleum Exploration & Production Department from July 2010,
 
77

Table of Contents
as the deputy general manager, and a member of the CPC Leadership Group, of Sinopec Group from July 2014, concurrently as the chairman of Sinopec Oilfield Service Corporation from September 2014, and concurrently as a director and a senior vice president of Sinopec from May 2015. Mr. Jiao has been a member of the CPC Leadership Group and a vice president of CNPC since June 2018. In June 2019, Mr. Jiao was appointed as a
non-executive
director of our company.
Huang Yongzhang
, age 55, is an executive director and the president of our company, and concurrently a member of the CPC Leadership Group, and vice president and chief safety officer, of CNPC. Mr. Huang is a professor-level senior engineer and holds a doctorate degree. He has extensive work experience in China’s petroleum and natural gas industry. He previously served as the vice president of CNPC International (Nile) Ltd., vice president and concurrently as chief safety officer of China National Oil Exploration and Development Corporation, and the executive vice president of CNPC Middle East Corporation. He served as the leader of the coordination group of CNPC Middle East and president of CNPC Middle East Corporation from January 2018. He was appointed as a member of the CPC Leadership Group and vice president of CNPC in April 2020, and a director of our company in September 2020. Mr. Huang has served concurrently as the chief safety officer of CNPC from February 2021. He was appointed as the president of our company in March 2021.
Ren Lixin
, age 54, is an executive director and the senior vice president of our company, and concurrently a member of the CPC Leadership Group, and the deputy general manager, of CNPC. Mr. Ren is a professor-level senior engineer with a bachelor’s degree, who has extensive working experience in China’s petroleum and petrochemical industry. Mr. Ren served as a member of the CPC Committee and the vice president of PetroChina Dushanzi Petrochemical Company from September 2005, and then as the president, deputy secretary of CPC Committee and chief safety director of PetroChina Dushanzi Petrochemical Company from October 2018 while concurrently serving as the executive director and president of Xinjiang Dushanzi Petrochemical Co., Ltd. Mr. Ren was appointed as the president and deputy secretary of the CPC Committee of PetroChina Refining and Chemical Company in March 2021. He was appointed as a member of the CPC Committee and a deputy general manager of CNPC in June 2021. In August 2021, Mr. Ren was appointed as the senior vice president of our company, and in October 2021, as a director of our company.
Elsie Leung
 Oi-sie
, age 82, is an independent
non-executive
director of our company. She is a consultant of Iu, Lai & Li Solicitors & Notaries, and an
independent non-executive director
of China Life Insurance Company Limited and China Resources Power Holdings Co., Ltd. Ms. Leung obtained her LLM degree from the University of Hong Kong, and is an academician of College of International Marriage Law. She holds the practicing qualifications for attorney of Hong Kong and Britain. Ms. Leung was the first Secretary for Justice of the Hong Kong Special Administrative Region, and a member of Executive Council of HKSAR. Ms. Leung was appointed as the Justice of the Peace, the Notary Public, and the China-Appointed Attesting Officer, and was awarded a Grand Bauhinia Medal. Ms. Leung was appointed as an independent
non-executive
director of our company in June 2017.
Tokuchi Tatsuhito
, age 69, is an independent
non-executive
director of our company, and concurrently an independent
non-executive
director of Daiwa Securities (China) Co., Ltd. He is also the executive director & research fellow of the Center for Industrial Development and Environment Governance (CIDEG), Tsinghua University, and the senior fellow of Rebuild Japan Initiative Foundation. Mr. Tokuchi graduated from the Department of Chinese Language and Literature, Peking University, and received his master’s degree in East Asian Economy from the Center for East Asian Studies of Stanford University. He was a former member & expert advisor to the Foreign Advisory Committee of State Administration of Foreign Experts Affairs of the PRC, and previously held various positions in multiple companies such as the general manager of Investment Banking Division of Daiwa Securities SMBC Co., Ltd., the president of Daiwa Securities Singapore Limited, the Executive Vice President of Daiwa Securities (Hong Kong) Inc., a vice president of Daiwa Securities (America) Inc., the vice chairman of Singapore Investment Banking Association, a deputy general manager, the managing director, and Investment Banking Committee chairman, of CITIC Securities Co., Ltd., and the chairman of CITIC Securities International Co., Ltd. In 2009, Mr. Tokuchi was awarded the China Friendship Award, China’s award for foreigners. Mr. Tokuchi was appointed as an independent
non-executive
director of our company in June 2017.
 
78

Table of Contents
Simon Henry
, age 60, is an independent
non-executive
director of our company. Mr. Henry is a fellow of the UK Chartered Institute of Management Accountants, and has extensive experience in areas of finance management, strategic planning, marketing and investor relations. Mr. Simon Henry obtained a first class bachelor’s degree in mathematics from Cambridge University in 1982 and was awarded a master’s degree in 1986 from Cambridge. He joined Royal Dutch Shell in 1982. He worked for 8 years until March 2017 as the CFO and executive director of the board of Royal Dutch Shell. He now serves as a
non-executive
director and chairman of the audit committee of the board of Rio Tinto plc. From April 2021, he joined the board of Harbour Energy plc. Mr. Simon Henry was appointed as an independent
non-executive
director of our company in June 2017.
Cai Jinyong
, age 62, is an independent
non-executive
director of our company. Mr. Cai is a partner of Global Infrastructure Partners (GIP) and concurrently a board member of Aon Corporation. Mr. Cai received bachelor’s degree in science from Peking University and doctorate degree in economics from Boston University. Mr. Cai has over 30 years’ work experience in finance service industry, and before joining GIP in 2019, he worked at TPG Group, World Bank Group, Goldman Sachs Group, Inc. and Morgan Stanley. Mr. Cai worked at Central Europe Bureau of the Head Office of the World Bank in charge of energy sectors from 1990 to 1994. From 1994 to 2000, he served in Morgan Stanley and was a member of the team which established China International Capital Corporation Limited (the first domestic joint venture investment bank in the PRC). From 2000 to 2012, he worked in Goldman Sachs Group, Inc., where he was in charge of the PRC Investment Banking Business. From 2012 to 2016, he served as CEO of International Finance Corporation of the World Bank Group. From 2016 to 2018, he led the infrastructure business in emerging economies at TPG. In June 2020, Mr. Cai was appointed as an independent
non-executive
director of our company.
Jiang, Simon X.
, age 68, is an independent
non-executive
director of our company. Mr. Jiang has been an independent
non-executive
director of COSCO Shipping International (Hong Kong) Co., Ltd. since April 2007. He is the chairman of Cyber City International Limited. Mr. Jiang is also a director of China Foundation for Disabled Persons, and a senior associate at the Judge Business School of Cambridge University of England. He is currently a member of the United Nations Investments Committee. Mr. Jiang received his bachelor’s degree from Beijing Foreign Studies University, master’s degree from Australian National University and M.Phil and Ph.D degree in Economics from Cambridge University of England. Mr. Jiang has investment management experience. Mr. Jiang was a former deputy chief of United Nations Joint Staff Pension Fund Investment Management and then works as a member of its Investment Committee till now. He was a member of the 11th and 12th Sessions of the National Committee of the Chinese People’s Political Consultative Conference, an independent director of China Oilfield Services Limited (“COSL”), Greenland Hong Kong Holdings Limited, Sinopec Corp., and Nokia Corporation. In June 2020, Mr. Jiang was appointed as an independent
non-executive
director of our company.
Supervisors
Information on our current supervisors is as set out below:
 
Name
  
Gender
    
Age
    
Position
  
Term
 
Lv Bo
     M        59      Chairman of the Supervisory Committee     
2020.11-2023.11
 
Zhang Fengshan
     M        60      Supervisor     
2014.05-2023.06
 
Jiang Lifu
     M        58      Supervisor     
2014.10-2023.06
 
Lu Yaozhong
     M        56      Supervisor     
2017.06-2023.06
 
Wang Liang
     M        59      Supervisor     
2017.10-2023.06
 
Fu Suotang
     M        59      Supervisor appointed by employees’ representatives     
2017.06-2023.06
 
Li Jiamin
     M        58      Supervisor appointed by employees’ representatives     
2014.05-2023.06
 
Liu Xianhua
     M        58      Supervisor appointed by employees’ representatives     
2016.05-2023.06
 
Lv Bo
, age 59, is the chairman of the supervisory committee of our company. Mr. Lv is a senior economist with a master’s degree. He has extensive work experience in China’s oil and gas industry. In January 2002,
 
79

Table of Contents
Mr. Lv was appointed as director-general of Human Resources Department of CNOOC. He was appointed as the assistant president of CNOOC in November 2006 and a member of the CPC Leadership Group of CNOOC in November 2007, and concurrently as the secretary of the CPC Committee of CNOOC as a unit directly under the CPC Central Committee in October 2008. From April 2010, he served as a vice president, and a member of the CPC Committee, of CNOOC, and from December 2012 concurrently as the chairman of CNOOC Energy Technology & Services Limited, from May 2015 concurrently as the president of CNOOC Party School, and from December 2016 concurrently as the chairman of Offshore Oil Engineering Co. Ltd. and COSL. Mr. Lv served as a vice president, and a member of the CPC Leadership Group, of CNPC from November 2019. He served as a director of our company from March 2020 to October 2020. He was appointed as a supervisor and the chairman of the supervisory committee of our company in November 2020. In September 2021, Mr. Lv was appointed as a full-time external director for central enterprises.
Zhang Fengshan
, age 60, is a supervisor of our company. Mr. Zhang is a professor-level senior engineer, holds a master’s degree and has extensive experience in China’s oil and gas industry. He was appointed as a deputy director and a standing member of the CPC Committee of Liaohe Oil Exploration Bureau in July 2000, the safety director of Liaohe Oil Exploration Bureau in May 2002, the director and deputy secretary of the CPC Committee of Liaohe Petroleum Exploration Bureau in August 2004, and the general manager and deputy secretary of the CPC Committee of Great Wall Drilling and Exploration Company Ltd. in February 2008, where he also served as an executive director from July 2008. Mr. Zhang has been the general manager of the Security, Environment, and Energy Conservation Department of our company and of CNPC since June 2012. Mr. Zhang was appointed as a supervisor of our company in May 2014. In July 2014, Mr. Zhang was appointed as the chief safety officer of our company and the deputy chief safety officer of CNPC. In December 2015, Mr. Zhang was appointed as the director of the Security, Environmental Protection Supervision Center of CNPC. From December 2016 to June 2021, Mr. Zhang served as the general manager of our Quality, Security and Environmental Protection Department and concurrently as the general manager of the Quality, Security and Environmental Protection Department of CNPC.
Jiang Lifu
, age 58, is a supervisor of our company, and concurrently the assistant to the general manager of CNPC. Mr. Jiang is a professor-level senior economist, holds a doctorate degree and has extensive work experience in China’s oil and gas industry. He was appointed as a deputy general manager of our Capital Operation Department in August 2003, a deputy director of CNPC’s Planning Department in May 2005, a deputy general manager of our Planning Department in June 2007 and a deputy director of CNPC’s Planning Department. From April 2014, Mr. Jiang served as the general manager of the Enterprise Management Department of our company and the general manager of the Enterprise Management Department of CNPC. Mr. Jiang was appointed as a supervisor of our company in October 2014. In April 2015, Mr. Jiang was appointed as the general manager of our Reform and Enterprise Management Department and the general manager of the Reform and Enterprise Management Department of CNPC. Mr. Jiang was appointed as the assistant to the general manager of CNPC in April 2021.
Lu Yaozhong
, age 56, is a supervisor of our company, and concurrently the general manager of Kunlun Capital. Mr. Lu is a professor-level senior accountant and holds a master’s degree. He has extensive work experience in China’s oil and gas industry. He served as the chief accountant and a member of the CPC Committee of PetroChina Kazakhstan Company from December 2009 and the chief accountant of Overseas Exploration and Development Branch Company of China National Oil and Gas Exploration and Development Corporation from August 2013. Mr. Lu served as the general manager of the Capital Operation Department of our company and concurrently the general manager of the Capital Operation Department of CNPC from April 2017. Mr. Lu was appointed as a supervisor of our company in June 2017 and as the general manager of Kunlun Capital in October 2021.
Wang Liang
, age 59, is a supervisor of our company, the general manager of our Audit Department, and concurrently the general manager of the Audit Department, and director and deputy secretary of the CPC Committee of the Audit Service Center, of CNPC. Mr. Wang is a professor-level senior accountant and holds a
 
80

Table of Contents
bachelor’s degree. He has extensive work experience in China’s oil and gas industry. He served as a director, chief accountant and member of the CPC Committee of CNPC Offshore Engineering Company Limited from January 2005, a member of the CPC Leadership Group and deputy director of Liaoning Provincial Finance Department from April 2006, the chairman of the board of directors Generali China Insurance Co., Ltd. from April 2007, the chief accountant and a member of the CPC Committee of CNPC Chuanqing Drilling Engineering Company Limited from February 2008, the general manager and deputy secretary of the CPC Committee of CNPC Assets Management Co., Ltd. from October 2009, the chairman of the board of directors, general manager, and deputy secretary of the CPC Committee of Kunlun Trust Co., Ltd. from March 2014, the chairman of the board of directors, secretary of the CPC Committee, secretary of the discipline inspection commission, and chairman of the Labor Union of CNPC Assets Management Co., Ltd. from July 2014, and the secretary of the CPC Committee, secretary of the Discipline Inspection Commission, chairman of the Labor Union and deputy general manager of China Petroleum Finance Co., Ltd. from July 2016. In May 2017, he was appointed as the general manager of our Audit Department, and concurrently the general manager of the Audit Department of CNPC, the director and secretary of the CPC Committee of the Audit Service Center of CNPC. Mr. Wang was appointed as a supervisor of our company in October 2017. And then in November 2017, he was appointed as the general manager of our Audit Department, the general manager of the Audit Department of CNPC, the director and deputy secretary of the CPC Committee of the Audit Service Center of CNPC.
Fu Suotang
, age 59, is an employee representative supervisor of our company. Mr. Fu is a professor-level senior engineer and holds a doctorate degree. He has extensive work experience in China’s oil and gas industry. He served as the chief geologist and a member of the CPC Committee of PetroChina Qinghai Oilfield Company from April 2007. He served as the general manager and deputy secretary of the CPC Committee of PetroChina Qinghai Oilfield Company and concurrently the director of Qinghai Petroleum Management Bureau from April 2014. In April 2017, he was appointed as the general manager and deputy secretary of the CPC Committee of PetroChina Changqing Oilfield Company and concurrently the director of Changqing Petroleum Exploration Bureau. Mr. Fu was appointed as an employee representative supervisor of our company in June 2017. In April 2018, he was appointed the general manager and the secretary of the CPC Committee of PetroChina Changqing Oilfield Company, and concurrently an executive director and the general manager of Changqing Oilfield Exploration Bureau Co., Ltd. From October 2020, Mr. Fu served as an executive director and the secretary of the CPC Committee of PetroChina Changqing Oilfield Company and concurrently as an executive director and the general manager of Changqing Oilfield Exploration Bureau Co., Ltd. In June 2021, Mr. Fu was appointed as a standing vice director of the Consulting Center of CNPC.
Li Jiamin
, age 58, is an employee representative supervisor and the director of the Party and Masses’ Affairs Department of our company, and concurrently the director of the Party and Masses’ Affairs Department, the deputy secretary of the CPC Committee (of CNPC as a unit directly under the CPC Central Committee), and the deputy director of the CPC Leadership Group, of CNPC. Mr. Li is a professor-level senior engineer and holds a master’s degree. He has extensive work experience in China’s oil and petrochemical industry. He was appointed as a deputy general manager, the chief safety officer and a member of the CPC Committee of Lanzhou Petroleum & Chemical Company in August 2004. He was appointed as the general manager and deputy secretary of the CPC Committee of PetroChina Lanzhou Petrochemical Company and the general manager Lanzhou Petroleum & Chemical Company in March 2012. Mr. Li was appointed as an employee representative supervisor of our company in May 2014. In November 2017, he was appointed the general manager and the secretary of the CPC Committee of PetroChina Lanzhou Petrochemical Company, and the executive director and general manager of Lanzhou Petroleum & Chemical Company. In August 2020, Mr. Li was appointed as the general manager of the Corporate Culture Department of our company, and concurrently the general manager of the Ideological and Political Work Department (and the chief of the CPC Leadership Group Propaganda Department, the general manager of the Corporate Culture Department and the director of the Press Office) of CNPC. From December 2020, Mr. Li has served as the director of the Party and Masses’ Affairs Department of our company, and concurrently as the director of the Party and Masses’ Affairs Department, the deputy secretary of the CPC Committee (of CNPC as a unit directly under the CPC Central Committee), and the deputy director of the CPC Leadership Group, of CNPC.
 
81

Table of Contents
Liu Xianhua,
age 58
,
 is an employee representative supervisor of our company, and concurrently the chairman of PetroChina Xinjiang Sales Company Limited. He is also the chairman of PetroChina Xinjiang Marketing Company. Mr. Liu is a professor-level senior economist and holds a master’s degree. He has extensive work experience in China’s oil and petrochemical industry. In May 2005, he was appointed as the general manager and deputy secretary of the CPC Committee of PetroChina Shandong Marketing Company. In March 2012, he was appointed as the general manager and deputy secretary of the CPC Committee of PetroChina Northeast Marketing Company. In December 2015, he was appointed as the general manager and deputy secretary of the CPC Committee of PetroChina Liaoning Marketing Company, and the general manager of CNPC Liaoning Petroleum Corporation. Mr. Liu was appointed as an employee representative supervisor of our company in May 2016. From 2017, he served as the general manager and deputy secretary of the CPC Committee of PetroChina Liaoning Marketing Company, and concurrently as an executive director and the general manager of CNPC Liaoning Petroleum Marketing Company. Mr. Liu was appointed as the chairman of PetroChina Xinjiang Sales Company Limited in November 2021.
Senior Management Team Members other than Executive Directors
Information on current members of our senior management team other than executive directors is as set out below:
 
Name
  
Gender
    
Age
    
Position
  
Term
 
Sun Longde
     M        59      Vice President and Chief Geologist      2007.06-  
Li Luguang
     M        59      Vice President      2018.06-  
Tian Jinghui
     M        59      Vice President      2015.11-  
Chai Shouping
     M        60      Chief Financial Officer, Secretary to the Board      2017.01-  
Yang Jigang
     M        58      Vice President and Chief Engineer      2017.12-  
Zhang Minglu
     M        58      Chief Safety Officer      2021.07-  
Zhu Guowen
     M        55      Vice President      2021.07-  
Sun Longde
, age 59, is a vice president and the chief geologist of our company. Mr. Sun is a professor-level senior engineer and holds a doctorate degree. Mr. Sun is an academician of the Chinese Academy of Engineering. He has extensive work experience in China’s oil and geological industry. Mr. Sun was appointed as the manager of Exploration & Development Company of the Shengli Petroleum Administration Bureau in September 1997, the chief geologist and a member of the CPC Committee of Tarim Petroleum Exploration & Development Headquarters in November 1997, a deputy general manager and a member of the CPC Committee of PetroChina Tarim Oilfield Company in September 1999, and the general manager and secretary of the CPC Committee of PetroChina Tarim Oilfield Company in July 2002. Mr. Sun was appointed as a vice president of our company in June 2007. He was elected as an academician of the Chinese Academy of Engineering in December 2011. In April 2014, Mr. Sun was appointed as the director of the consultancy center of CNPC. In July 2015, Mr. Sun was appointed as the general manager of our Science and Technology Management Company and the general manager of the Science and Technology Department of CNPC. He was appointed as an executive director and the general manager of Daqing Oilfield Company Ltd., the director of Daqing Petroleum Administration Bureau, and a deputy secretary of the CPC Committee of Daqing Oilfield in March 2016. In October 2018, he was appointed as an executive director and the secretary of the CPC Committee of Daqing Oilfield Company Ltd., and concurrently an executive director of Daqing Petroleum Administration Bureau Co., Ltd., and he stepped down from all those three positions in June 2021. In July 2021, Mr. Sun was appointed as the chief geologist of our company.
Li Luguang
, age 59, is a vice president of our company. Mr. Li is a professor-level senior engineer and holds a doctor degree. He has extensive work experience in China’s oil and gas industry. From September 1999, Mr. Li served as the deputy general manager and Party member of PetroChina Southwest Oil and Gas Field Company, and from September 2003, as the general manager and deputy secretary of the CPC Committee of PetroChina Southwest Oil and Gas Field Company. From November 2005, he served as the general manager and
 
82

Table of Contents
secretary of the CPC Committee of PetroChina Southwest Oil and Gas Field Company, and from April 2014, as the assistant to the general manager of CNPC, and from October 2016, concurrently as the general manager and deputy secretary of the CPC Committee of PetroChina Tarim Oilfield Company. From April 2017, Mr. Li served as the general manager and secretary of the CPC Committee of PetroChina Tarim Oilfield Company, and from April 2018, as the general manager and deputy secretary of the CPC Committee of PetroChina Exploration and Production Company. Mr. Li was appointed as a vice president of our company in June 2018. From October 2020, he concurrently served as an executive director and the general manager and secretary of the CPC Committee of PetroChina Exploration and Production Company.
Tian Jinghui
, age 59, is a vice president of our company, and concurrently the secretary of the CPC Committee and an executive director of PetroChina International Company Ltd., and the chairman of China National United Oil Corporation. Mr. Tian is a professor-level senior economist and holds a master’s degree. He has extensive experience in China’s oil and gas industry. In May 1998, he was appointed as the chief of the Preparatory Group of PetroChina Northwest Marketing Company. He was appointed as a deputy general manager and member of the CPC Committee of our Refining & Marketing Company from December 1999, a deputy general manager, chief safety officer and member of the CPC Committee of PetroChina Marketing Company from November 2007. In June 2009, he was appointed as the secretary of the CPC Committee and deputy general manager of PetroChina Marketing Company. In August 2013, he was appointed as the general manager and secretary of the CPC Committee of PetroChina Marketing Company. Mr. Tian was appointed as a vice president of our company in November 2015. From April 2017, Mr. Tian has served as the general manager and deputy secretary of the CPC Committee of PetroChina Marketing Company, the secretary of the CPC Committee and an executive director of PetroChina International Company Ltd., and the chairman of China National United Oil Corporation.
Chai Shouping
, age 60, is the CFO and the secretary to the board of directors of our company. Mr. Chai is a professor-level senior accountant and holds a master’s degree. He has extensive work experience in financial operations and management in China’s oil and petrochemical industry. In April 2002, he was appointed as a deputy general manager of the Finance Department of our company. From September 2012, Mr. Chai served as the chief accountant, and a member of the CPC Committee, of China National Oil and Gas Exploration and Development Corporation (overseas exploration and development branch), the deputy general manager and the CFO of CNPC Exploration and Development Company Limited, and the CFO of PetroChina International Investment Company Limited. In March 2013, he was appointed as the general manager of the Finance Department of our company. In January 2017, he was appointed as our CFO. In August 2020, Mr. Chai was appointed as the manager of the Board of Directors Office of our company. Mr. Chai was appointed as the secretary to the board of directors of our company in October 2020.
Yang Jigang
, age 58, is a vice president and the chief engineer of our company. Mr. Yang is a professor-level senior engineer and holds a master’s degree. He has extensive experience in China’s petroleum and petrochemical industry. From August 1997, Mr. Yang served as the deputy manager of Lanzhou Chemical Industry Corporation, and from November 1998, as the chief engineer of the Oil Refinery and Chemical Engineering Department of CNPC. From September 1999, Mr. Yang served as a member of the preparatory group for the establishment of our Refining and Chemicals Marketing Company, and from December 1999, as the chief engineer, and member of the CPC Committee, of our Refinery and Marketing Branch Company. From August 2000, Mr. Yang served as a deputy general manager, chief engineer, and member of the CPC Committee, of our Chemical Engineering and Marketing Company, and from May 2005, as the general manager, and deputy secretary of the CPC Committee, of PetroChina Daqing Petrochemical Company. From December 2009, Mr. Yang served as the secretary of the CPC Committee and deputy general manager of our Refinery and Chemical Engineering Company. From November 2017, Mr. Yang has served as the secretary of the CPC Committee and the general manager of PetroChina Refinery and Chemical Engineering Company. He was appointed as the executive director of PetroChina Refining and Chemical Company in March 2021. Mr. Yang has served as a vice president of our company since December 2017. He was appointed as the chief engineer of our company in April 2021.
 
83

Table of Contents
Zhang Minglu
,
aged 58, is the chief safety officer of our company and the general manager of the Quality, Health, Safety and Environment Department of our company, and concurrently the deputy chief safety officer of CNPC and the general manager of the Quality, Health, Safety and Environment Department of CNPC. Mr. Zhang is a professor-level senior engineer with a doctorate degree, and has extensive experience in the oil and gas industry in the PRC. From June 2008, he served as the chief geologist of PetroChina Changqing Oilfield Company. From July 2014, he served as the deputy general manager of PetroChina Changqing Oilfield Company, and from January 2015 concurrently as the chief safety officer of PetroChina Changqing Oilfield Company. From January 2019, Mr. Zhang served as general manager of PetroChina Qinghai Oilfield Company, and the executive director and general manager of Qinghai Petroleum Administration Bureau Co., Ltd. From March 2021, Mr. Zhang has served as the general manager of the Quality, Health, Safety and Environmental Department of our company and concurrently as the general manager of the Quality, Health, Safety and Environmental Department of CNPC. In June 2021, Mr. Zhang was appointed as the deputy safety director of CNPC and then in July 2021 as the chief safety officer of our company.
Zhu Guowen
, age 55, is a vice president of our company, and concurrently the executive director of Daqing Oilfield Co., Ltd., and executive director of Daqing Petroleum Administration Bureau Co., Ltd. Mr. Zhu is a professor-level senior engineer with a doctorate degree, and has extensive experience in the oil and gas industry in the PRC. From March 2010, Mr. Zhu served as the plant manager of the First Production Plant of Daqing Oilfield Co., Ltd. From April 2013, he served as the deputy general manager of Daqing Oilfield Co., Ltd. and deputy director general of Daqing Petroleum Administration Bureau. From October 2018, he served as the general manager of PetroChina Zhejiang Oilfield Company. From October 2020, he served as the general manager of Daqing Oilfield Co., Ltd. and concurrently as the general manager of Daqing Petroleum Administration Bureau Co., Ltd. From June 2021, he has served as the executive director of Daqing Oilfield Co., Ltd. and concurrently as the executive director of Daqing Petroleum Administration Bureau Co., Ltd. Mr. Zhu was appointed as a vice president of our company in July 2021.
Changes in Directors, Supervisors and Senior Management Team
The following changes have taken place to our board of directors, supervisors and senior management team since we filed our last annual report on Form
20-F:
 
   
On April 29, 2021, Mr. Yang Jigang was appointed as the chief engineer of our company (concurrent position).
 
   
On May 10, 2021, Mr. Li Fanrong resigned from the position of
non-executive
director and vice chairman of our board of directors and simultaneously the chairman of the investment and development committee under our board of directors due to work arrangement.
 
   
On May 28, 2021, Mr. Li Wendong resigned from his position as an employee representative supervisor of our company due to work arrangement.
 
   
On July 20, 2021, Mr. Sun Longde was appointed as the chief geologist (concurrent position), Mr. Zhang Minglu was appointed as the chief safety officer of our company, Mr. Zhu Guowen was appointed as a vice president of our company.
 
   
On August 26, 2021, Mr. Ren Lixin was appointed as the senior vice president of our company.
 
   
On September 3, 2021, Mr. Ling Xiao resigned from his position as vice president of our company due to personal reasons.
 
   
On October 21, 2021, Mr. Hou Qijun and Mr. Ren Lixin were appointed as directors of our company.
 
   
On October 28, 2021, Mr. Hou Qijun was appointed as the vice chairman of our company.
 
84

Table of Contents
Compensation
The senior management members’ compensation consists of fixed salaries and variable compensation. The variable compensation, which accounts for approximately 75% of the total compensation package, is linked to the attainment of specific performance targets, such as our income for the year, return on capital and the individual performance evaluation results. All of our senior management members have entered into performance contracts with us.
Our directors and supervisors, who hold senior management positions or are otherwise employed by us and other senior management of our company receive compensation in the form of salaries, insurance and other benefits in kind, including our contribution to the pension plans for them.
The aggregate amount of salaries and other compensation, insurance and other benefits in kind paid by us to our directors, who hold senior management positions or are otherwise employed by us, during the year ended December 31, 2021 was RMB840 thousand which does not include the fees totaling RMB2,732 thousand paid to our independent directors. The aggregate amount of salaries or other compensation, insurance and other benefits in kind paid by us to our supervisors, who hold senior management position or are otherwise employed by us during the year ended December 31, 2021 was RMB3,383 thousand. The aggregate amount of salaries or other compensation, insurance and other benefits in kind paid by us to other senior management during the year ended December 31, 2021 was RMB8,188 thousand.
In 2021, we paid RMB1,568 thousand as our contribution to the pension plans for our directors and supervisors, who hold senior management positions or are otherwise employed by us and other senior management of our company.
Save as disclosed, no other payments have been paid or are payable, with respect to the year ended December 31, 2021, by us or any of our subsidiaries to our directors. In addition, we have no service contracts with our directors that provide for benefits to our directors upon the termination of their employment with us.
For discussions about the compensations of our individual directors and supervisors, please see Note 11 to our consolidated financial statements included elsewhere in this annual report.
Board Practices
Our board of directors has five committees, namely, the nominating committee, the audit committee, the investment and development committee, the evaluation and remuneration committee and the sustainable development committee.
Nominating Committee
Our nominating committee is composed of Mr. Dai Houliang, as chairman of the committee, and Mr. Cai Jinyong and Mr. Jiang, Simon X., as members. The nominating committee’s major responsibilities include:
 
   
reviewing and discussing the structure, size and composition of the board of directors regularly, and making recommendations on changes to the board to follow the Company’s corporate strategy;
 
   
considering the criteria and procedures for selection of directors, president and other senior management, and making recommendations to the board of directors;
 
   
considering the board diversity policy and the training systems for directors and management;
 
   
extensively selecting qualified candidates for directorship and members of senior management, reviewing the qualifications of candidates for directorship and president, and making recommendations;
 
85

Table of Contents
   
reviewing the proposals on candidates nominated by the nominators who have the nominating rights under the Articles of Association;
 
   
reviewing and making assessment on the independence of independent
non-executive
directors; and
 
   
attending the shareholders’ meeting and answer the investor’s consultation on the work of the nomination committee, as well as the relevant laws, regulations, listing rules and other matters authorized by the board of directors.
Audit Committee
Our audit committee is composed of two independent
non-executive
directors, Mr. Cai Jinyong and Mr. Jiang, Simon X., and one
non-executive
director, Mr. Liu Yuezhen. Mr. Cai Jinyong serves as the chairman of the committee. Under our audit committee charter, the chairman of the committee must be an independent director and all resolutions of the committee must be approved by independent directors. The audit committee’s major responsibilities include:
 
   
reviewing and supervising the engagement of external auditors and their performance;
 
   
reviewing and ensuring the completeness of annual reports, interim reports and quarterly reports, if any, and related financial statements and accounts, and reviewing any material opinion contained in the aforesaid statements and reports with respect to financial reporting;
 
   
reporting to the board of directors in writing on the financial reports of the Company and related information, having considered the issues raised by external auditors;
 
   
reviewing and scrutinizing the work conducted by the internal audit department in according with the applicable PRC and international rules;
 
   
monitoring the financial reporting system and internal control procedures of the Company, as well as checking and assessing matters relating to, among others, the financial operations, internal control and risk management of the Company;
 
   
receiving, keeping and dealing with complaints or anonymous reports regarding accounting, internal accounting control or audit matters and ensuring the confidentiality of such complaints or reports;
 
   
reporting regularly to the board of directors with respect to any significant matters which may affect the financial position of the Company and its operations and with respect to the
self-evaluation
of the committee on the performance of their duties; and
 
   
performing other responsibilities as may be required under relevant laws, regulations and the listing rules of the stock exchanges where our shares are listed (as amended from time to time).
Investment and Development Committee
Our investment and development committee is composed of Mr. Hou Qijun, as chairman of the committee, and Mr. Duan Liangwei and Mr. Simon Henry, as members. The investment and development committee’s major responsibilities include:
 
   
studying the long-term development strategies of the Company proposed by our president and making recommendations to the board of directors;
 
   
studying the annual investment budget and the adjustment proposal regarding the investment plan as proposed by our president and making recommendations to the board of directors;
 
   
reviewing feasibility studies and preliminary feasibility studies for investment or financing proposals, capital operation projects and asset operation projects of great significance to our company subject to the approval of the board of directors and making recommendations to the board of directors;
 
86

Table of Contents
   
deliberating on other significant matters that may have an effect on the development of our company and making recommendations to the board of directors; and
 
   
addressing issues related to relevant laws, regulations and listing rules and requirements of the stock exchanges on which our shares are listed and handing other matters as delegated by the board of directors.
Evaluation and Remuneration Committee
Our evaluation and remuneration committee is composed of Ms. Elsie Leung
Oi-sie,
as chairman of the committee, and Mr. Liu Yuezhen and Mr. Tokuchi Tatsuhito, as members. The evaluation and remuneration committee’s major responsibilities include:
 
   
studying the evaluation criteria for directors and senior officers, conducting the evaluations and proposing suggestions;
 
   
studying and evaluating the remuneration policies and plans for directors and senior officers (including the compensation in connection with the removal or retirement of the director and senior officers);
 
   
organizing the evaluation of the performance of our president and reporting the evaluation result to the board of directors, supervising the evaluation of the performance of our senior vice presidents, vice presidents, CFO and other senior management members conducted under the leadership of the president;
 
   
studying our incentive plan and compensation plan, supervising and evaluating the implementation of these plans and making recommendations for improvements to and perfection of such plans; and
 
   
studying the relevant laws, regulations and the listing rules of the stock exchanges where the shares of the Company are listed (as amended from time to time) and other matters authorized by the board of directors.
Sustainable Development Committee
In March 2021, our health, safety and environment committee was renamed to “sustainable development committee”, and was charged with more responsibilities. Our sustaintability committee is composed of Mr. Huang Yongzhang, as chairman of the committee, and Mr. Jiao Fangzheng and Mr. Ren Lixin, as members. The sustainability committee’s major responsibilities include:
 
   
studying the sustainable development (including but not limited to environment, society and governance) matters of the Company, identifying and assessing major risks and impacts on the sustainable development of the Company, strengthening risk management in respect of environment, social responsibility and corporate governance and making proposals to the board of directors;
 
   
supervising the Company’s commitments and performance on key issues such as response to climate change, safeguarding of health and safety and fulfilment of social responsibilities, and making proposals to the board of directors;
 
   
reviewing the relevant guidelines, strategies, objectives, measures and relevant important issues related to the sustainable development of the Company, and supervising and checking the implementation of the sustainable development objectives of the Company against the corresponding sustainable development objectives that have been set;
 
   
reviewing the Company’s annual reports on environment, social responsibility and governance and the reports on quality, safety and environmental protection and making proposals to the board of directors;
 
   
paying attention to the important information of sustainable development matters related to the Company’s business, determining the potential material effect that the environmental, society and governance matters may have on the stakeholders, supervising and studying the material safety and
 
87

Table of Contents
 
environmental risks facing the Company and recommending response measures, and making corresponding proposals to the board of directors;
 
   
other matters delegated by the board of directors.
Employees
As of December 31, 2019, 2020 and 2021, we had 460,724, 432,003 and 417,173 employees (not including the temporary employees), respectively. During 2021, we employed 251,132 temporary employees on an average. As of December 31, 2021, we had 248,405 temporary employees. The table below sets forth the number of our employees by business segment as of December 31, 2021.
 
    
Employees
    
% of Total
 
Exploration and production
     241,692        57.94  
Refining and chemicals
     128,785        30.87  
Marketing
     37,134        8.90  
Natural gas and pipeline
     3,928        0.94  
Headquarters and others
(1)
     5,634        1.35  
Total
     417,173        100.00  


(1)
Including the numbers of employees of the management of our headquarters, specialized companies, PetroChina Exploration & Development Research Institute, PetroChina Planning & Engineering Institute, Petrochemical Research Institute and other units.
Our employees participate in various basic social insurance plans organized by municipal and provincial governments whereby we are required to make monthly contributions to these plans at certain rates of the employees’ salary as stipulated by relevant local regulations. Expenses incurred by us in connection with the retirement benefit plans were approximately RMB20,196 million, RMB16,833 million and RMB19,939 million, respectively, for the years ended December 31, 2019, 2020 and 2021, respectively.
In 2021, we did not experience any strikes, work stoppages, labor disputes or actions that affected the operation of any of our businesses.
Share Ownership
As of December 31, 2021 our directors, senior officers and supervisors did not have share ownership in us or any of our affiliates.
 
88

Table of Contents
Item 7
— MAJOR SHAREHOLDERS AND RELATED PARTY TRANSACTIONS
Major Shareholders
We were established on November 5, 1999 with CNPC as its sole promoter. As of March 31, 2022, CNPC beneficially owned 147,173,857,136 shares, which include 291,518,000 H Shares indirectly held by CNPC through Fairy King Investments Limited, an overseas wholly owned subsidiary of CNPC, representing approximately 80.41% of the share capital of us, and, accordingly, CNPC is our controlling shareholder. The following table sets forth the major shareholders of our A Shares and H Shares as of March 31, 2022:
 
Name of Shareholders
 
Class of
Shares
 
Number of Shares
Held
 
Capacity
 
Percentage of

Such Share in

That Class of
the

Issued Shares

Capital (%)
   
Percentage in
the Total
Share
Capital (%)
 
CNPC
  A Shares   146,882,339,136 (long position)   Beneficial Owner     90.71       80.25  
  H Shares   291,518,000 (long position)
(1)
 
Interest of Corporation
Controlled by the
Substantial Shareholder
    1.38       0.16  
The Bank of New York Mellon Corporation
(2)
  H Shares   1,267,777,801 (long position)   Interest of Corporation     6.01       0.69  
    892,090,100 (short position)  
Controlled by the
Substantial
    4.23       0.49  
    345,286,695 (shares available for lending)   Shareholder/Approved Lending Agent     1.64       0.19  
BlackRock, Inc.
(3)
  H Shares   1,277,733,984 (long position)  
Interest of Corporation
Controlled by the
    6.06       0.70  
    1,490,000 (short position)   Substantial Shareholder     0.01       0.0008  
 
(1)
Held by Fairy King Investments Limited, an overseas
wholly-owned
subsidiary of CNPC.
(2)
The Bank of New York Mellon Corporation, through various subsidiaries, had an interest in the H Shares of the Company.
(3)
Blackrock, Inc., through various subsidiaries, had an interest in the H Shares of the Company.
Related Party Transactions
CNPC is a controlling shareholder of our company. We have extensive business dealings with CNPC and other members of the CNPC group, all of which constitute related party transactions for us. We also continued to carry out existing continuing transactions with other related parties in 2021.
Continuing Related Party Transactions
Since 2000, our company has engaged a variety of continuing related party transactions with CNPC. CNPC provides various services to us and our company also provides specific products and services to CNPC. These transactions are governed by several agreements between CNPC and us, including the comprehensive products and services agreement, land lease, building lease, intellectual property licensing contracts and contract for the transfer of rights under Sino-foreign cooperative production sharing contracts, as amended.
1. The comprehensive products and services agreement between CNPC and us
The comprehensive products and services agreement (the “Comprehensive Agreement”) entered into between CNPC and us is updated every three years. The latest Comprehensive Agreement (the “New
 
89

Table of Contents
Comprehensive Agreement”) was signed in 2020, which covers the period from January 1, 2021 to December 31, 2023. The New Comprehensive Agreement revised the previous Comprehensive Agreement mainly as follows: (1) updated the pricing basis for refining products, natural gas, power supply, and gas supply services provided by us to CNPC and jointly-held entities; (2) updated the pricing basis for project design, project supervision, power supply, and gas supply services provided by CNPC to us; and (3) added the sharing services to the services provided by CNPC to us. Other terms and conditions remain unchanged. The New Comprehensive Agreement was approved at the extraordinary general meeting held on November 5, 2020.
Under the New Comprehensive Agreement, we and CNPC will provide the following products and services to each other:
(A) Products and services to be provided by us to CNPC mainly include: refined oil products, chemical products, crude oil, natural gas, water supply, electricity supply, gas supply and heating supply, metering and measuring, and commissioned operations, supply of materials, financial services, and other products and services that CNPC and jointly held companies may request us to provide from time to time for itself to consume, use or sell. In addition, we will provide financial services to jointly held companies, including provision of entrusted loans, guarantees and other financial services.
(B) Products and services to be provided by CNPC/jointly held companies to us mainly include:
 
   
construction and technical services, including but not limited to exploration technology service, downhole operation service, oilfield construction service, refinery construction service and engineering and design service;
 
   
production services, which will be mainly the products and services provided in light of the requirements for our daily operations, including but not limited to crude oil, natural gas, refined oil products, chemical products, water supply, electricity supply, gas supply and communications;
 
   
supply of materials services not included in the foregoing construction and technical services or production services due to difference in nature, which will be mainly materials procurement agency services, including but not limited to procurement of materials, quality inspection, storage of materials and delivery of materials;
 
   
social and ancillary services, including but not limited to security systems, staff canteens and training centers; and
 
   
financial services, including loans and other financial aids, deposit services, entrusted loans, settlement services, finance lease services and other financial services.
The general principle of the New Comprehensive Agreement is that all products and services provided by each party shall be of good quality and fair and reasonable price. If a third party provides similar products or services or participates in similar transactions, it shall not be inferior to the conditions provided by the third party for such products or services. The pricing of the products and services to be provided under the New Comprehensive Agreement shall be either following government-prescribed price, market price, cost price, or contractual price, depending on the circumstances. The deposit and loan interest rates of financial services shall be subject to the interest rates and relevant charging standards for the same period as published by the People’s Bank of China or relevant financial regulatory agencies, and shall not be inferior to the interest rates, charging standards and other conditions for the party to obtain funds and services from an independent third party. The New Comprehensive Agreement is not exclusive, and the parties may provide to and purchase products and services from third parties. Each party may terminate the performance of on or more products or services by giving at least six months’ written notice. However, if we are unable to easily obtain services that CNPC provides from a third party, CNPC shall not terminate the provision of such services unless it get our written consent.
 
90

Table of Contents
2. Specific product and service implementation agreements
According to the current arrangements contemplated under the New Comprehensive Agreement, from time to time and when necessary, the parties may enter into implementation agreements for specific products and services. The specific product and service implementation agreements shall not violate the principles, terms and conditions of the New Comprehensive Agreement in any material respect.
Since a specific product and service implementation agreements is only a further elaboration of the products and services as contemplated by the New Comprehensive Agreement, they do not constitute new categories of related party transactions.
3. Land Use Rights Lease Agreement
We entered into a Land Use Rights Lease Agreement with CNPC in March 2000, pursuant to which, CNPC leased to us land use right across China totaling approximately 1,145 million square meters, which were related to our various operations and businesses, for a term of 50 years at an annual rent of RMB2 billion. The rent may, as at the expiration of
10-year
term of the Land Use Rights Lease Agreement, be adjusted to reflect market conditions prevalent at such time of adjustment, including the then prevailing market prices, inflation or deflation (as applicable) and such other relevant factors.
We entered into a supplementary agreement to the Land Use Rights Lease Agreement with CNPC on August 25, 2011, whereby we adjusted the area and the rent to be effective from January 1, 2012. Thereafter, the parties adjusted the area and rent every three years. The latest adjustment happened on August 27, 2020, whereby the parties adjusted the area to 1,142 million square meters and the annual rent to approximately RMB5,673 million (exclusive of taxes) for the three years since January 1, 2021.
All of the amendments and adjustment were approved by the relevant general meetings. The latest adjustment was approved by the extraordinary general meeting of our company on November 5, 2020.
4.
Buildings Lease Agreement
We entered into a buildings lease agreement with CNPC in March 2000, pursuant to the lease, CNPC leased buildings across China to us for our business operations. Both parties agreed to adjust the area and rent of leased buildings every three years based on our needs and the changes in the market price. On August 24, 2017, we entered into a new agreement with CNPC, pursuant to which, the area of the leased building should be 1,152,968 square meters, and the annual rent should be no more than RMB730 million. The agreement took effect on January 1, 2018, with a term of 20 years.
The parties may adjust the area of building leased and the rent fees every three years as appropriate by reference to the status of the production and operations and the prevailing market price, but the adjusted rent fees shall not exceed the comparable fair market price. On August 27, 2020, the parties confirmed that effective from January 1, 2021, the area of the leased buildings should be adjusted to 1,287,486.41 square meters and the annual rent be adjusted to approximately RMB713 million. All of the amendments and adjustments were approved by the relevant general meetings. The latest adjustment was approved by the extraordinary general meeting of our company on November 5, 2020.
5. Intellectual Property Licensing Contracts
We and CNPC continue to implement the three intellectual property licensing contracts entered on March 10, 2000, namely the Trademark Licensing Contract, the Patent and
Know-how
Licensing Contract and the Computer Software Licensing Contract. CNPC has agreed to extend the term of the Computer Software Licensing Contract to the expiry date of the statutory protection period of the relevant software or when such software enters the public domain. Pursuant to these licensing contracts, CNPC has granted us the exclusive right to use certain trademarks, patents,
know-how
and computer software of CNPC at no cost.
 
91

Table of Contents
6. Contract for the Transfer of Rights under Sino-Foreign Cooperative Production Sharing Contracts
We and CNPC continue to implement the Contract for the Transfer of Rights under Sino-Foreign Cooperative Production Sharing Contracts dated December 23, 1999. As part of the restructuring to organize our company, CNPC transferred to us relevant rights and obligations under 28 production sharing contracts executed with international oil and natural gas companies, except the rights and obligations relating to CNPC’s supervisory functions.
As of December 31, 2021, a total of 29 projects were being executed by CNPC under the production sharing contracts. CNPC has assigned to us at nil consideration all of its rights and obligations under the production sharing contracts and all the related interests vested in CNPC pursuant to applicable PRC laws and regulations, except the rights and obligations relating to CNPC’s supervisory functions.
7. Ongoing connected transactions with CNPC Finance
CNPC Finance Co., Ltd. (“CPF”) is an internal finance company of CNPC. CNPC, CNPC Capital Co., Ltd. and the Company each hold 40%, 28% and 32% equity interest in CPF, respectively. In 2021, the beginning balance of our deposits with CPF was RMB33,275 million, with cash inflow of RMB3,616,743 million and cash outflow of RMB3,619,890 million during the reporting period, and the
end-of-period
balance was RMB30,128 million; the deposit interest rate range of RMB was from 0.35% to 4.26%. The beginning balance of the loans provided by CPF to us was RMB68,045 million, with new loans of RMB85,195 million and repaid loans of RMB82,673 million during the reporting period, and the
end-of-period
balance was RMB70,567 million. The loan interest rate range of RMB was from 3.2% to 4.28%. In 2021, the amount of acceptance bills issued and discounting of bills undertaken by CPF for us was RMB13,615 million and RMB3,671 million, respectively.
8. Caps for the Continuing Related Party Transactions
We and CNPC update the aggregate annual amount proposed for each category of continuing related party transactions every three years based on the historical transactions and transaction amounts for the provision of such category of products and services by us, CNPC and our jointly held companies to each other during the prior periods, and by taking into account the business development of our company, CNPC and the jointly held companies, and the possible magnitude of fluctuation of the prices of crude oil, petrochemical products, natural gas, and other petroleum products and services on international markets and China market, which amount, after being approved by the shareholders at the relevant general meeting, should be adopted as the proposed annual cap for the corresponding category of continuing related party transactions for each of the next three years. The transaction amounts of all the historical continuing related party transactions as described above were all within the corresponding proposed annual caps.
 
92

Table of Contents
The proposed annual caps for the continuing related party transactions during the period from January 1, 2021 to December 31, 2023 are as set out in the following table:
 
Category of Products and Services
  
2021
    
2022
    
2023
 
    
RMB (in millions)
 
(i) Products and services provided by us to the CNPC and jointly-held companies
     150,000        147,200        144,600  
(ii)  Products and services provided by CNPC and jointly-held companies to us
        
(a)   Construction and technical services
     198,200        197,500        197,000  
(b)   Production services
     207,700        205,500        204,500  
(c)   Supply of materials services
     35,300        35,300        35,300  
(d)   Social and ancillary services
     5,800        5,800        5,800  
(e)   Financial Services
        
—   Aggregate of the daily highest amount of deposits of our company in CNPC and the total amount of interest received in respect of these deposits
     55,000        55,000        55,000  
—   Insurance fees, handling charges for entrusted loans, and fees and charges for settlement services and other intermediary business
     2,400        2,400        2,400  
—   Rents and other payments made under financial leasing loans, and fees and charges for settlement services and other intermediary business
     5,000        5,000        5,000  
(iii)  Financial services provided by us to the jointly-held companies
     22,000        22,000        22,000  
(iv) Land leases provided to us by CNPC
     16,578        11,019        5,685  
(v)   Building leases provided to us by CNPC
     2,083        1,384        714  
* The proposed annual caps for the land and property provided by CNPC to us for lease for the period from 2021 to 2023 shall be determined by reference to the annual value of the
right-of-use
assets.
9. Independent
Non-Executive
Directors’ Confirmation
In relation to the continuing connected transactions undertaken by the Company in 2021, the independent
non-executive
directors of the Company confirmed that:
 
   
the connected transactions disclosed above have been made in the ordinary course of business of the Company;
 
   
the connected transactions disclosed above have been made on normal commercial terms or better terms;
 
   
the connected transactions disclosed above have been conducted in accordance with the agreements governing such transactions and their terms are fair and reasonable and consistent with the interests of shareholders as a whole.
10. Auditor’s Confirmation
The auditor of the Company has audited the transactions disclosed above and has provided our board of directors with a letter indicating that:
 
   
all the connected transactions have been approved by our board of directors;
 
   
all the connected transactions have been conducted in compliance with the pricing policies of the Company in all material respects if the transactions involve the provision of goods or services by the Company;
 
93

Table of Contents
   
all the connected transactions have been carried out in accordance with the terms of the corresponding agreements; and
 
   
all the transactions have been concluded within the annual caps disclosed above, if applicable.
Loans and Guarantees
In 2021, we did not provide any guarantee to or for the benefit of CNPC and its subsidiaries. As of December 31, 2021, the total outstanding guarantee we provided to or for the benefit of our subsidiaries, associates and affiliates other than CNPC and its subsidiaries was RMB188,192 million.
For a detailed discussion of continuing related party transactions, please refer to Note 38 to our consolidated financial statements included in this annual report.
One-off
Related Party Transactions
1. Kunlun Energy Pipeline Assets Transaction
On December 22, 2020, the board of directors of the Company approved the sale to PipeChina of the 60% equity interest in PetroChina Beijing Gas Pipeline Co., Ltd. and the 75% equity interest in PetroChina Dalian LNG Co., Ltd. held by Kunlun Energy, a subsidiary of the Company. In view of the fact that the two directors appointed by the Company to PipeChina are the incumbent director and a senior management member of the Company and one of them is a senior management member of CNPC (the controlling shareholder of the Company), this transaction constitutes a related party transaction of the Company. The conditions precedent of the transaction were satisfied on March 31, 2021, and all the rights, obligations and liabilities in relation to the target assets were transferred to PipeChina as at 24:00 on March 31, 2021.
2. Increase of Capital of CNPC Finance Co., Ltd.
On June 13, 2019, our board of directors passed a resolution on the increase of capital contributions to CNPC Finance Co., Ltd. (“CPF”) by CNPC, CNPC Capital Co., Ltd. (“CNPC Capital”) and us in proportion to the parties’ respective shareholding percentages in CPF. CNPC, CNPC Capital and we currently hold 40%, 28% and 32% equity interests in CPF, respectively. After completion of this transaction, the registered capital of CPF will be increased from RMB8,331,250,000 to RMB16,395,273,100 by converting RMB8,064,023,100 out of the capital reserves of CPF into its registered capital and the increase in the registered capital will be allocated to the parties in proportion to the parties’ respective shareholding percentages in CPF prior to the increase. After completion of the transaction, the parties’ shareholding percentages in CPF remain unchanged. This transaction has been completed in 2021.
3. Establishment of Kunlun Capital Co., Ltd.
On April 29, 2021, the board of directors of the Company approved the establishment of CNPC Kunlun Capital Co., Ltd. (“Kunlun Capital”) by and among the Company, CNPC and CNPC Capital Co., Ltd., with each party to contribute to Kunlun Capital RMB2.9 billion, RMB5.1 billion and RMB2 billion in cash, in exchange for 29%, 51% and 20% of Kunlun Capital shares, respectively. Kunlun Capital has been established in June 2021, and all parties will complete the capital contribution by the end of 2023 in three instalments. Kunlun Capital will focus on equity investment in new energy, new materials, energy conservation and environmental protection sectors.
 
94

Table of Contents
Interests of Experts and Counsel
Not applicable.
Item 8
— FINANCIAL INFORMATION
Financial Statements
See the F-pages following Item 19.
Legal Proceedings
We are involved in several legal proceedings concerning matters arising in the ordinary course of our business and due to other reasons. We believe, based on currently available information, that these proceedings, individually or in the aggregate, will not have a material adverse effect on our profitability or financial condition.
Dividend Policy
Our Articles of Association provided that if our net profit attributable to owners of the company and the accumulated undistributed profit for a year are positive, and our cash flow can satisfy our normal operation and sustainable development, the amount of cash dividend to be distributed shall not be less than 30% of the net profit attributable to owners of the company realized in that year. We distribute dividends twice a year. Distribution of final dividends needs to be passed at the general meeting by ordinary resolution. The general meeting can, by ordinary resolution, authorize the board of directors to determine the distribution of interim dividends. Since the listing of our ADSs and our shares, we have distributed dividends to the shareholders by strictly complying with the Articles of Association and other relevant regulatory requirements, and adhering to the principle of bringing returns to shareholders, and after an overall consideration of various factors, including our operating performance, financial status, and cash flows. The total dividend for 2021 accounted for 45% of our net profit attributable to owners of the Company of 2021.
Our board of directors will declare dividends, if any, in Renminbi on a per share basis. Dividends payable to the holders of A Shares shall be paid in Renminbi. Save for the H Shares traded through the Southbound Trading Link, dividends payable to the holders of H Shares shall be paid in HK dollar. The Bank of New York will convert the HK dollar dividends and distribute them to holders of ADSs in U.S. dollars, less expenses of conversion. The holders of the A Shares and H Shares will share proportionately on a per share basis in all dividends and other distributions declared by our board of directors.
We will take into account factors including the following for declaration of dividends:
 
   
general business conditions;
 
   
our financial results;
 
   
capital requirements;
 
   
contractual restrictions on the payment of dividends by us to our shareholders or by our subsidiaries to us;
 
   
our shareholders’ interests;
 
   
the effect on our debt ratings; and
 
   
other factors our board of directors may deem relevant.
We may only distribute dividends after we have made allowances for:
 
   
recovery of losses, if any;
 
95

Table of Contents
   
allocations to the statutory common reserve fund; and
 
   
allocations to a discretionary common reserve fund if approved by our shareholders.
The allocation to the statutory funds is 10% of profit for the year attributable to owners of the company determined in accordance with PRC accounting rules. Under PRC law, our distributable earnings will be equal to our profit for the year attributable to owners of the company determined in accordance with PRC accounting rules or IFRS, whichever is lower, less allocations to the statutory and discretionary funds.
We believe that our dividend policy strikes a balance between two important goals:
 
   
providing our shareholders with a competitive return on investment; and
 
   
assuring sufficient reinvestment of profits to enable us to achieve our strategic objectives.
After an overall consideration of factors, including our operating performance, financial status and cash flows, we paid an interim dividend of RMB23,866 million in aggregate, representing RMB0.1304 per share (inclusive of applicable taxes), for the six months ended June 30, 2021, to our A shareholders and H shareholders (including ADS holders). The board of directors recommended a final dividend of RMB17,610 million in aggregate, representing RMB0.09622 per share (inclusive of applicable taxes) for the second half of 2021. The final dividend for the year ended December 31, 2021 is subject to the approval by the annual general meeting to be held on June 9, 2022, and shall be paid to our shareholders listed on our shareholder register as of the close of business on June 27, 2022. The register of members of H Shares will be closed from June 22, 2022 to June 27, 2022 (both days inclusive) during which period no transfer of H Shares will be registered. The final dividends for A Shares and H Shares (including ADSs) for 2021 will be paid on or about June 28, 2022 and July 29, 2022, respectively.
In accordance with the relevant provisions of the Articles of Association of the Company and relevant laws and regulations, dividends payable to the Company’s shareholders shall be declared in Renminbi. Dividends payable to the holders of A Shares shall be paid in Renminbi, and for the A Shares of the Company listed on the Shanghai Stock Exchange and invested by the investors through the Hong Kong Stock Exchange, dividends shall be paid in Renminbi to the accounts of the nominal shareholders through CSDC. Save for the H Shares of the Company listed on the Hong Kong Stock Exchange and invested by the investors through the Shanghai Stock Exchange and the Shenzhen Stock Exchange (the “H Shares under the Southbound Trading Link”), dividends payable to the holders of H Shares shall be paid in Hong Kong Dollar. The applicable exchange rate shall be the average of the medium exchange rates for Renminbi to Hong Kong Dollar as announced by the People’s Bank of China in the week prior to the declaration of the dividends at the annual general meeting of the Company to be held on June 9, 2022. Dividends payable to the holders of H Shares under the Southbound Trading Link shall be paid in Renminbi. In accordance with the Agreement on Payment of Cash Dividends on the H Shares under the Southbound Trading Link between the Company and CSDC, CSDC will receive the dividends payable by the Company to holders of the H Shares under the Southbound Trading Link as a nominal holder of the H Shares under the Southbound Trading Link on behalf of investors and assist the payment of dividends on the H Shares under the Southbound Trading Link to investors thereof.
According to the
Law on Corporate Income Tax of the People’s Republic of China
and its implementing rules which came into effect on January 1, 2008, amended on February 24, 2017 and December 29, 2018, the Company is required to withhold corporate income tax at the rate of 10% before distributing dividends to
non-resident
enterprise shareholders whose names appear on the register of members of H Shares of the Company. Any H Shares registered in the name of
non-individual
shareholders, including HKSCC Nominees Limited, other nominees, trustees or other groups and organisations will be treated as being held by
non-resident
enterprise shareholders and therefore will be subject to the withholding of the corporate income tax. Should any holder of H Shares wish to change their shareholder status, please consult their agent or trust institution over the relevant procedures. The Company will withhold and pay the corporate income tax strictly in accordance with the relevant laws or requirements of the relevant governmental departments and strictly based on the information registered on the Company’s H Share register of members on June 27, 2022.
 
96

Table of Contents
According to the applicable requirements of the State General Administration of Taxation of the PRC, the Company is required to withhold and pay the individual income tax for its individual H shareholders and an individual H shareholder is entitled to certain tax preferential treatments according to the tax agreements between the country where the individual H shareholder is resident and China and the provisions in the tax arrangements between China’s mainland and Hong Kong (Macau). The Company would withhold and pay the individual income tax at the tax rate of 10% on behalf of the individual H shareholders who are Hong Kong residents, Macau residents or residents of those countries having agreements with China for individual income tax on dividend at a rate equal to 10%. For individual H shareholders who are residents of those countries having agreements with China for individual income tax on dividend at a rate lower than 10%, the Company would make applications on their behalf to seek entitlement of the relevant agreed preferential treatments pursuant to the applicable provisions of the State General Administration of Taxation of the PRC. For individual H shareholders who are residents of those countries having agreements with China for individual income tax on dividend at a rate higher than 10% but lower than 20%, the Company would withhold the individual income tax at the agreed-upon effective tax rate. For individual H shareholders who are residents of those countries without any tax agreements with China or having agreements with China for individual income tax on dividend at a rate of 20% or in other situations, the Company would withhold the individual income tax at a tax rate of 20%.
The Company will determine the country of domicile of the individual H shareholders based on the registered address as recorded in the register of members of the Company (the “Registered Address”) on June 27, 2022, and will accordingly withhold and pay the individual income tax. If the country of domicile of an individual H shareholder is not the same as the Registered Address, the individual H shareholder shall notify the share registrar of the Company’s H Shares and provide relevant supporting documents on or before 4:30 p.m. June 21, 2022 (address: Hong Kong Registrars Limited, Shops 1712-1716, Hopewell Centre, 183 Queen’s Road East, Wanchai, Hong Kong). If the individual H shareholder does not provide the relevant supporting documents to the share registrar of the Company’s H Shares within the period stated above, the Company will determine the country of domicile of the individual H shareholder based on the recorded Registered Address on June 27, 2022.
The Company will not entertain any claims arising from and assume no liability whatsoever in respect of any delay in or inaccurate determination of the country of domicile of any shareholder of the Company or any disputes over the withholding and payment of tax.
With regard to the dividends earned by the investors (including enterprises and individuals) from investment in the A Shares of the Company listed on Shanghai Stock Exchange through the Hong Kong Stock Exchange, the Company will withhold income tax at the rate of 10%, and file tax withholding returns with the competent tax authority. Where any Hong Kong investor is a tax resident of a foreign country and the rate of income tax on dividends is less than 10%, as provided for in the tax treaty between the country and the PRC, the enterprise or individual may personally, or designate a withholding agent to, file an application for the tax treatment under the tax treaty with the competent tax authority of the Company. Upon review, the competent tax authority will refund tax based on the difference between the amount of tax having been collected and the amount of tax payable calculated at the tax rate as set out in the tax treaty.
Significant Changes
None.
Item 9
— THE OFFER AND LISTING
Trading Market Information
Our ADSs, each representing 100 H Shares, par value RMB1.00 per H Share, have been listed and traded on the New York Stock Exchange since April 6, 2000 under the symbol “PTR”. Our H Shares have been listed and
 
97

Table of Contents
traded on the Hong Kong Stock Exchange since April 7, 2000 under the symbol “857”. In September 2005, our company issued an additional 3,196,801,818 H Shares. CNPC also sold 319,680,182
state-owned
shares it held concurrently with our issuance of new H Shares in September 2005. In October 2007, we issued 4 billion A Shares and these shares were listed on the Shanghai Stock Exchange on November 5, 2007 under the symbol “601857”. Following the issuance of A Shares, all the domestic shares of our company existing prior to the issuance of A Shares, i.e. the shares held by CNPC (our controlling shareholder) in our company, have been registered with China Securities Depository and Clearing Corporation Limited as tradable A Shares. The New York Stock Exchange, the Hong Kong Stock Exchange and Shanghai Stock Exchange are the principal trading markets for our ADSs, H Shares and A Shares, respectively.
As of December 31, 2021, there were 21,098,900,000 H Shares and 161,922,077,818 A Shares issued and outstanding. As of December 31, 2021, there were 142 registered holders of American depositary receipts evidencing 9,022,432 ADSs representing 902,243,200 H Shares. The depositary of the ADSs is the Bank of New York Mellon.
Item 10
— ADDITIONAL INFORMATION
Memorandum and Articles of Association
Our Articles of Association Currently in Effect
The following is a summary based on the significant provisions of our Articles of Association. For details, you should read our amended and restated Articles of Association filed with SEC on June 11, 2020.
Objectives and Purposes
We are a joint stock limited company established in accordance with the PRC Company Law and certain other laws and regulations of the PRC. We are registered with the PRC State Administration for Industry and Commerce with a business license number being 1000001003252. Article 10 of our Articles of Association provides that our objectives are to comply with the rules of the market, to continuously explore business models which are suitable for the development of the Company, to fully utilize every resource of the Company, to place emphasis on personnel training and technological development, to provide the society with competitive products, and to use its best endeavors to maximize its profits. Article 11 of our Articles of Association provides that our scope of businesses includes, among other things, the exploration, exploitation and sales of resources including crude oil, natural gas, coalbed methane, shale gas, shale oil and gas hydrate; the exploration, exploitation and utilization of geothermal energy; storage and sale of crude oil and refined oil; production, sale and storage of refined oil, petrochemical and chemical products; import and export; construction and operation of oil and natural gas pipelines; technical development, consultation and service for oil exploration and production, petrochemistry and related engineering; sale of materials, equipment and machines necessary for production and construction of oil and gas, petrochemicals and pipelines construction; the sale and warehousing of lubricating oil, fuel oil, bitumen, chemical fertilizers, auto parts, commodities and agricultural materials, etc.
Directors
Our directors shall be elected at our shareholders’ general meeting. Our directors shall be elected for a term of three years and may serve consecutive terms upon
re-election,
except that independent directors may only serve a maximum of two terms. Our directors are not required to hold any shares in us, and there is no age limit requirement for the retirement or
non-retirement
of our directors.
Where a director is in any way, directly or indirectly, materially interested in a proposal, arrangement or contract (other than his contract of service with the Company), he shall declare the nature and extent of his
 
98

Table of Contents
interests to the board of directors at the earliest opportunity, whether or not the proposal, arrangement or contract therefor is subject to the approval of the board of directors. Unless the interested director discloses his interests to the board of directors and the proposal, arrangement or contract is approved by the board of directors at a meeting in which the interested director, is not counted as part of the quorum and abstain from voting, the proposal, arrangement or contract in which that director is materially interested is voidable at the discretion of the Company except as against a bona fide party thereto who does not have knowledge of the breach of duty by the interested director. For this purpose, a director is deemed to be interested in a proposal, arrangement or contract in which his associate is interested. Where a director gives to the board of directors a notice in writing stating that, by reason of the facts specified in the notice, he is interested in a proposal, arrangement or contract which may subsequently be entered into by the Company, that notice shall be deemed to be a sufficient declaration of his interests so far as the content stated in such notice is concerned, provided that such notice shall have been given before the date on which the entering into the relevant contract or arrangement is first taken into consideration by the Company.
Matters relating to the remuneration of our directors shall be determined by the shareholders’ general meeting.
We shall not directly or indirectly make a loan to or provide any security for a director, unless the provision by the Company of a loan or a security or any other funds to a director to meet expenditure incurred or to be incurred by him for the sake of the Company or for the purpose of enabling him to perform his duties properly, in accordance with the terms of a service contract approved by the shareholders in a general meeting. If the ordinary business scope of the Company includes the provision of loans and security, the Company may make a loan to or provide a security to a director on normal commercial terms.
Dividends
Dividend shall be paid twice a year. The final dividends of the Company shall be decided by the shareholders by way of an ordinary resolution. The shareholders may by way of an ordinary resolution authorize the board of directors to decide on the interim dividends. The Company may pay any dividends in cash, shares or otherwise in such other way as permitted by laws and regulations. The Company will tend to pay any such dividends in cash over other methods of payment. The Company shall pay cash dividends for the year in which both the net profit attributable to the owners of the company and the cumulative undistributed profit are positive and so long as the cash flows of the Company may support its normal course of operation and sustainable development. Any such cash dividends shall not be less than 30% of the net profit attributable to the owners of the company for that year. If the shareholders’ general meeting passes motions in connection with the distribution of cash dividend, allotment of bonus shares, or conversion of capital common reserve fund into share capital, the Company shall implement detailed plans thereof within two months after the conclusion of such shareholders’ general meeting. If a shareholder has not claimed his dividends six years after such dividends has been declared in accordance with the Articles of Association, such shareholder is deemed to forfeit his right to claim such dividends.
When the Company distributes its
after-tax
profits for a given year, it shall allocate 10% of profits to its statutory common reserve fund. The Company shall no longer be required to make allocations to its statutory common reserve fund once the aggregate amount of such reserve reaches 50% or more of its registered capital. If the Company’s statutory common reserve fund is insufficient to make up its losses of the previous years, such losses shall be made up from the profit for the current year before the Company makes allocations to the statutory common reserve fund. The Company may, if so resolved by the shareholders’ meeting, make allocations to the discretionary common reserve fund from
after-tax
profits after making allocations to the statutory common reserve fund from the
after-tax
profits. The Company’s
after-tax
profits remaining after it has made up its losses and made allocations to its common reserve fund shall be distributed in proportion to the shareholdings of its shareholders. If the shareholders’ meeting distributes profits before the Company has made up its losses and made allocations to the statutory common reserve fund, the profits distributed must be returned to the Company.
 
99

Table of Contents
Shareholders’ Rights
A shareholder of the Company is a person who lawfully holds shares of the Company and whose name (title) is entered in the register of shareholders. Shareholders who hold shares of the same class shall enjoy the same rights. Article 49 set forth the rights of shareholders of ordinary shares such as the right to (i) receive dividends and other distributions in proportion to the number of shares held; (ii) propose, convene, preside over, attend or appoint a proxy to attend shareholders’ general meetings and to vote thereat in accordance with laws; (iii) supervise management over business operations and present proposals or to raise queries; (iv) transfer, donate or pledge shares; (v) obtain financial information and other company information; (vi) participate in the distribution of residual assets of the Company in proportion to the number of shares held, in the event of the termination or liquidation of the Company, etc.
If the content of a resolution of a shareholders’ general meeting or the board of directors violates any laws or administrative regulations, a shareholder has the right to file a petition with the court to invalidate the resolution. If the procedure for convening or the method of voting at a shareholders’ general meeting or a meeting of the board of directors violates any laws, administrative regulations or the Company’s Articles of Association, or if the contents of a resolution breaches the Company’s Articles of Association, a shareholder may file a petition with the court to revoke the resolution within 60 days from the date on which the resolution was passed. If a director or any other senior officers violated any laws, administrative regulations or the Company’s Articles of Association in the course of performing his or her duties to the Company, and thereby caused the Company to incur a loss, a shareholder or shareholders who individually or jointly hold one per cent (1%) or more of the Company’s shares for more than one hundred and eighty (180) consecutive days may request in writing the supervisory committee to initiate proceedings in the court. If the supervisory committee has violated the laws, administrative regulations or the Articles of Association in the course of performing its duties to the Company, and thereby caused the Company to incur a loss, shareholder(s) may request in writing the board of directors to initiate proceedings in the court in respect thereof. If the supervisory committee or the board of directors refuses to initiate proceedings after receipt of a written request from the shareholder(s) as mentioned in the preceding paragraph, or fails to initiate proceedings within 30 days of the date of receipt of the request, or under urgent circumstances where failure to promptly initiate proceedings would cause irreparable harm to the Company’s interests, the shareholders mentioned in the preceding paragraph are entitled to directly initiate proceedings in the court in their own name in the interests of the Company.
Shareholders’ General Meetings
Shareholders’ general meetings shall be convened by the board of directors. Annual general meetings are held once every year and within 6 months from the end of the preceding financial year. The board of directors shall convene an extraordinary general meeting within 2 months of the occurrence of any one of the events set forth in Article 63.
A
45-days
prior written notice should be given to all of the shareholders whose names appear in the share register. A shareholder who intends to attend the meeting shall deliver to the Company his written reply concerning his attendance at such meeting 20 days before the date of the meeting. Shareholder(s) holding 3% or more of the total voting shares of the Company shall have the right to propose motions in writing to the convener 10 days prior to the date of such meeting. Any shareholder who is entitled to attend and vote at a general meeting shall be entitled to appoint one or more persons as his proxies to attend and vote on his behalf.
A shareholder (including a proxy), when voting at a general meeting, may exercise such voting rights as are attached to the voting shares which he represents, except where the cumulative voting system is adopted for voting on the election of directors and supervisors, each share shall have one vote. The voting on the election of directors and supervisors at the general meeting shall apply the cumulative voting system, which means that each share held by a shareholder shall have the same number of voting rights as the number of directors and supervisors to be elected and the voting rights held by a shareholder can be collectively exercised. At any
 
100

Table of Contents
shareholders’ general meeting, a resolution shall be decided on a show of hands unless voting by way of a poll is required under the listing rules or demanded by the following persons before or after any vote by a show of hands: (i) the chairman of the meeting; (ii) at least two shareholders present in person or by proxy entitled to vote thereat; (iii) one or more shareholders present in person or by proxy who represent(s), individually or in aggregate, 10% or more of all shares carrying the right to vote at the meeting.
An ordinary resolution must be passed by votes
representing one-half or
more of the voting rights represented by the shareholders (including proxies) present at the general meeting. The following matters shall be resolved by an ordinary resolution: (i) work reports of the board of directors and the supervisory committee; (ii) annual profit distribution plans and loss recovery plans formulated by the board of directors; (iii) appointment or removal of members of the board of directors and members of the supervisory committee, their remuneration and manner of payment; (iv) annual budgets and final accounts, balance sheets and profit and loss accounts and other financial statements of the Company; (v) matters other than those which are required by the laws, administrative regulations or the Company’s Articles of Association to be adopted by a special resolution.
A special resolution must be passed by votes representing
two-thirds
or more of the voting rights represented by the shareholders (including proxies) present at the general meeting. The following matters shall be resolved by a special resolution: (i) increase or reduction in the share capital of the Company and the issue of shares of any class, warrants and other similar securities by the Company; (ii) issue of debentures of the Company; (iii) division, merger, dissolution and liquidation of the Company; (iv) amendment of the Company’s Articles of Association; (v) acquisition or disposal of major assets in one year or provision of securities for third parties which exceeds 30% of the latest audited total assets of the Company; (vi) stock incentive plans; (vii) any other matters considered by the shareholders at general meeting, and resolved by way of an ordinary resolution, to be of a nature which may have a material impact on the Company and should be adopted by a special resolution in accordance with the laws, administrative regulations and the Company’s Articles of Association.
Where any shareholders request for the convention of an extraordinary general meeting or a class meeting the following procedures shall be followed: (i) shareholders who individually or in aggregate hold not less than 10% of the Company’s shares with voting right shall have the right to request in writing the board of directors to convene an extraordinary general meeting or a class meeting. The board of directors shall, according to the laws, administrative regulations and the Company’s Articles of Association, give written feedback of consenting to or refusing the convening of such extraordinary shareholders’ general meeting within 10 days after it has received the request. If the board of directors consents to convene an extraordinary general meeting or a class meeting, it shall give notice for such shareholders’ general meeting within five days after it has so resolved. The consent of the concerned shareholders shall be obtained if any change is to be made to the request in the notice. If the board of directors refuses to convene an extraordinary general meeting or a class meeting, or it fails to give any feedback within 10 days after it has received the request, the shareholders who individually or in aggregate hold not less 10% of the Company’s shares shall have the right to request in writing the supervisory committee to convene the extraordinary general meeting or class meeting; and (ii) If the supervisory committee consents to convene the extraordinary general meeting or the class meeting, it shall give the notice for such shareholders’ general meeting within five days after it has received the request. The consent of the concerned shareholders shall be obtained if any change is to be made to the request in the notice. If the supervisory committee fails to give notice of convening the shareholders’ general meeting within the provided time limit, the supervisory committee shall be deemed to have failed to convene and preside the shareholders’ general meeting, and the shareholders who individually or in aggregate hold not less than 10% of the Company’s shares for more than 90 consecutive days may at their own discretion convene and preside such a meeting.
The general meeting may authorize the board of directors to carry out matters on their behalf, with clear and specific authorization. For authorization of a matter that requiring an ordinary resolution, an ordinary resolution of the shareholders’ general meeting shall be passed by affirmative votes representing at least 50% of the voting rights represented by the shareholders (including shareholders’ proxies) present at the meeting. For authorization of a matter that requiring a special resolution, a special resolution of the shareholders’ general meeting shall be
 
101

Table of Contents
passed by affirmative votes representing at least
two-thirds
of the voting rights represented by the shareholders (including shareholders’ proxies) present at the meeting.
Special Procedures for Voting by a Class of Shareholders and Modification of Rights
In addition to holders of other classes of shares, the holders of the domestic-invested shares and holders of overseas-listed foreign-invested shares shall be deemed to be holders of different classes of shares. Rights conferred on any class of shareholders (“class rights”) may not be varied or abrogated save with the approval of a special resolution of shareholders at a general meeting and by the class shareholders affected at a separate meeting. Article 96 set forth the circumstances which shall be deemed to be variation or abrogation of the rights attaching to a particular class of shares, including but not limited to increasing or decreasing the number of shares of that class, reducing or removing preferential rights attached to shares of that class to receive dividends or the distribution of assets in the event that the Company is liquidated, etc. Shareholders of the affected class, whether or not otherwise having the right to vote at shareholders’ general meetings, have the right to vote at class meetings in respect of certain matters listed in Article 96, but interested shareholder(s) shall not be entitled to vote at such class meetings. Resolutions of a class meeting shall be passed by votes
representing two-thirds or
more of the voting rights of shareholders of that class present at the relevant meeting who are entitled to vote. Written notice of a class meeting shall be given to all shareholders who are registered as holders of that class in the register of shareholders 45 days before the date of the class meeting. A shareholder who intends to attend the class meeting shall deliver his written reply in respect thereof to the Company 20 days before the date of the class meeting. The special procedures for approval by separate class shareholders shall not apply to the circumstances where the Company issues, upon the approval by a special resolution of its shareholders at a general meeting, either separately or concurrently once every 12 months, not more than 20% of each of its existing issued Domestic-Invested Shares and Overseas-Listed Foreign-Invested Shares.
Share Capital
The Company must have ordinary shares at all times. Subject to the applicable government approvals, the Company may create different classes of shares. Each share of the same class shall carry the same rights and the same benefits. The Company may, based on its operating and development needs, authorize the increase in its capital pursuant to the Articles of Association. The Company may increase its capital by public or
non-public
offering of shares; by allotting bonus shares to its existing shareholders; by converting common reserve fund into share capital; by any other means which is stipulated by law and administrative regulation and approved the relevant government authorities. Unless otherwise stipulated in the relevant laws or administrative regulations, shares of the Company shall be freely transferable and are not subject to any lien. Domestic-invested shares and overseas-listed foreign-invested shares shall be purchased, sold, donated, inherited and charged on in accordance with the PRC laws and the Company’s Articles of Association. The Company may not accept its own shares as the subject matter of a pledge. Subject to certain conditions, the Company has the power to sell the shares of a shareholder who is untraceable and retain the payment. According to the procedures provided in the Company’s Articles of Association, the Company may reduce its registered capital. The Company may, in accordance with the procedures set out in the Company’s Articles of Association and with the approval of the relevant governing authorities, repurchase its issued shares under certain circumstances. The repurchase may be made by a general offer, stock exchange,
off-market
agreement, etc. The Company must obtain prior approval of the shareholders in a general meeting (in the manner stipulated in the Company’s Articles of Association) before it can repurchase shares outside of the stock exchange by means of
an off-market agreement.
Material Contracts
In the two years proceeding the date of this report, we have not entered into any material contracts other than in the ordinary course of business and other than those described under “Item 4 — Information on the Company”, “Item 7 — Major Shareholders and Related Party Transactions” or elsewhere in this Form annual report.
 
102

Table of Contents
Foreign Exchange Regulation
Currently, the Renminbi is not a freely convertible currency. Exchange and remittance of foreign currencies in China are subject to the supervision of the PRC government’s foreign exchange administrative agencies, such as through filings and/or approval requirements. We maintain a portion of cash and cash equivalents in foreign currencies in the course of our international business, while we receive most of our revenues in Renminbi. We convert foreign currencies from time to time to meet our foreign currency obligations, including repayment of foreign currency denominated debt, payment of overseas capital expenditures and equity investment, import of oil, gas, equipment and materials, and payment of dividends declared with respect to the H Shares and ADSs. The requirements of the PRC government such as filings and approvals with respect to foreign exchange transactions may impose restrictions on our international business.
The PRC government has implemented a floating exchange rate system to allow the value of the Renminbi to fluctuate within a regulated band based on market supply and demand and by reference to a basket of foreign currencies. Because a substantial part of our imports and our outbound investments are settled in foreign currencies, the exchange rates between RMB and U.S. dollars and any other relevant foreign currencies may have an effect on our purchase costs and our investment costs.
We are not aware of any other PRC laws, decrees or regulations that restrict the export or import of capital or that affect the remittance of dividends, interest or other payments to
non-resident
holders.
Taxation
The following discussion addresses the main PRC and United States federal income tax consequences of the ownership of H Shares or ADSs purchased held by the investor as capital assets.
PRC Taxation
Dividends and Individual Investors
Pursuant to the Individual Income Tax Law of the PRC, all foreign individuals are subject to a 20% withholding tax on dividends paid by a PRC company on its shares listed overseas, or Overseas Shares, unless specifically exempt by the financial authority of the State Council of the PRC. However, pursuant to the
Notice on the Collection of Individual Income Tax after the Abolishment of Guoshuifa [1993] No.
 045
, or Circular 348, issued by the State General Administration of Taxation of the PRC on June 28, 2011, foreign individual shareholders holding H Shares, or individual H shareholders, in a PRC company listed in Hong Kong may be subject to different levels of withholding taxes on dividends based on the tax treaties of their home countries with China. Individual H shareholders, who are residents of Hong Kong or Macau or who enjoy a 10% tax rate on dividends based on the tax treaties of their home countries with China, are subject to a withholding tax rate of 10% with respect to the H Share dividends they receive. For those individual H shareholders whose home countries have tax treaties with China prescribing a tax rate on dividends lower than 10%, the PRC company, whose shares are held by such individual H shareholders, needs to make tax filings on behalf of the individual H shareholders in order for them to enjoy such tax treatment. For individual H shareholders whose home countries have tax treaties with China prescribing a tax rate on dividends between 10% and 20%, the PRC company, whose shares are held by such individual H shareholders, shall withhold the individual income tax at the
agreed-upon
tax rate. For individual H shareholders whose home countries have no tax treaties with China or whose home countries have tax treaties with China prescribing a tax rate on dividends higher than 20%, the PRC company shall withhold the tax at a rate of 20%.
Dividends and Foreign Enterprises
Pursuant to the
Enterprise Income Tax Law of the PRC
and the implementing rules thereunder, the
Circular on Issues Concerning the Withholding of Corporate Income Tax by PRC Resident Enterprises from Dividends
 
103

Table of Contents
Payable to H Share
Non-resident
Corporate Shareholders
, and the
Measures for the Administration of the Enjoyment by
Non-residents
of the Treatments under the Treaties
, when paying any of its H Share
non-resident
corporate shareholders any dividends, we withhold the corporate income tax from such dividends at a rate of 10%. For an H Share
non-resident
corporate shareholder whose home country has a tax treaty with China prescribing a tax rate on dividends lower than 10%, such H Share
non-resident
corporate shareholder may, by itself or through an agent or us, make filings with the competent taxation authority for the treatment under the applicable tax treaty and present the documents evidencing that such shareholder is qualified to be a beneficial owner as defined under the applicable tax treaty.
Tax Treaties
If you are a tax resident or citizen of a country that has entered into a
double-taxation
treaty with the PRC, you may be entitled to a reduction in the amount of tax withheld, if any, imposed on the payment of dividends. The PRC currently has such treaties with a number of countries, including, but not limited to, the United States, Australia, Canada, France, Germany, Japan, Malaysia, Singapore, the United Kingdom and the Netherlands.
Under certain treaties, the rate of withholding tax imposed by China’s taxation authorities may be reduced. Pursuant to the
Measures for the Administration of the Enjoyment by Non
-residents
of the Treatments under Applicable Treaties
promulgated by the State Administration of Taxation on October 14, 2019, a
non-PRC
resident may apply the applicable benefit under tax treaties to him/herself when he/she makes tax filings or upon withholding by third parties and no prior approvals of the taxation authorities are required, if such
non-PRC
resident decides based on his/her own judgement that he/she is entitled to such benefits.
Capital Gains
The
Individual Income Tax Law of the PRC,
provides for a capital gains tax of 20% on individuals. The
Provisions for Implementing the Individual Income Tax Law of the PRC
, provides that the measures to levy individual income tax on the gains realized on the sale of shares will be made in the future by the Ministry of Finance and subject to the approval of the State Council. However, the Ministry of Finance has not so far promulgated a specific taxation method to levy tax on the capital gains realized by individual holders of H Shares or ADSs from sale of shares. If in the future such specific taxation method is promulgated, an individual holder of H Shares or ADSs may be subject to a 20% tax on capital gains under the
Individual Income Tax Law of the PRC
as amended from time to time, unless exempted or reduced by an applicable double taxation treaty or relevant PRC law or regulation.
Under the
Enterprise Income Tax Law of the PRC
, capital gains realized by foreign enterprises which are
non-resident
enterprises in the PRC upon the sale of Overseas Shares by PRC companies are generally subject to a PRC withholding tax levied at a rate of 10%, unless exempted or reduced pursuant to an applicable
double-taxation
treaty or other exemptions.
Shanghai-Hong Kong Stock Connect
In April 2014, China launched the Shanghai-Hong Kong Stock Connect Program, which is a cross-boundary investment channel that connects the Shanghai Stock Exchange and the Hong Kong Stock Exchange. Under the program, investors in each market are able to trade shares on the other market using their local brokers and clearing agencies. In accordance with the current PRC tax policies, foreign investors are temporarily exempt from income tax on capital gains derived from the trading of A Shares under the program and will be subject to a 10% withholding tax on the dividends received under the program. For a shareholder whose home country has tax treaty with China prescribing a tax rate on dividends lower than 10%, such shareholder may by itself or through an agent or the withholding agent, apply to the competent taxation authority for the treatment under the applicable tax treaty and present the documents evidencing that such shareholder is qualified to be a beneficial owner as defined under the applicable tax treaty.
 
104

Table of Contents
Additional PRC Tax Considerations
Under the Provisional Regulations of the People’s Republic of China Concerning the Stamp Duty, a stamp duty is not imposed by the PRC on the transfer of shares, such as the H Shares or ADSs, of PRC publicly traded companies that take place outside of China.
United States Federal Income Taxation
The following is a general discussion of the material United States federal income tax consequences of purchasing, owning and disposing of the H Shares or ADSs if you are a U.S. holder, as defined below, and hold the H Shares or ADSs as capital assets within the meaning of Section 1221 of the Internal Revenue Code of 1986, as amended, or the Code. This discussion does not address all of the tax consequences relating to the purchase, ownership and disposition of the H Shares or ADSs, and does not take into account U.S. holders who may be subject to special rules including:
 
   
tax-exempt
entities;
 
   
certain insurance companies;
 
   
broker-dealers;
 
   
traders in securities that elect to mark to market;
 
   
U.S. expatriates;
 
   
U.S. holders liable for alternative minimum tax;
 
   
U.S. holders that own (directly, indirectly, or constructively) 10% or more of the voting power or value of our equity;
 
   
U.S. holders that hold as part of a straddle or a hedging or conversion transaction; or
 
   
U.S. holders whose functional currency is not the U.S. dollar.
This discussion is based on the Code, its legislative history, final, temporary and proposed United States Treasury regulations promulgated thereunder, published rulings and court decisions as in effect on the date hereof, all of which are subject to change, or changes in interpretation, possibly with retroactive effect. In addition, this discussion is based in part upon representations of the depositary and the assumption that each obligation in the deposit agreement and any related agreements will be performed according to its terms.
You are a “U.S. holder” if you are:
 
   
a citizen or resident of the United States for United States federal income tax purposes;
 
   
a corporation, or other entity treated as a corporation for United States federal income tax purposes, created or organized under the laws of the United States, or any state thereof or the District of Columbia;
 
   
an estate the income of which is subject to United States federal income tax without regard to its source; or
 
   
a trust:
 
   
subject to the primary supervision of a United States court and the control of one or more United States persons; or
 
   
that has elected to be treated as a United States person under applicable United States Treasury regulations.
 
105

Table of Contents
If a partnership (or other entity treated as a partnership for United States federal income tax purposes) holds the H Shares or ADSs, the tax treatment of a partner generally will depend on the status of the partner and the activities of the partnership. If you are a partner of a partnership that holds the H Shares or ADSs, we urge you to consult your tax advisors regarding the consequences of the purchase, ownership and disposition of the H Shares or ADSs.
This discussion does not address any aspects of United States taxation other than federal income taxation.
We urge you to consult your tax advisors regarding the United States federal, state, local and
non-United
States tax consequences of the purchase, ownership and disposition of the H Shares or ADSs.
In general, if you hold American depositary receipts evidencing ADSs, you will be treated as owner of the H Shares represented by the ADSs. The following discussion assumes that we are not a passive foreign investment company, or PFIC, as discussed under “PFIC Rules” below.
Distributions on the H Shares or ADSs
The gross amount of any distribution (without reduction for any PRC tax withheld) we make on the H Shares or ADSs out of our current or accumulated earnings and profits (as determined for United States federal income tax purposes) will be includible in your gross income as dividend income when the distribution is actually or constructively received by you, in the case of the H Shares, or by the depositary in the case of ADSs. Distributions that exceed our current and accumulated earnings and profits will be treated as a return of capital to you to the extent of your tax basis in the H Shares or ADSs and thereafter as capital gains. Because we do not intend to determine our earnings and profits on the basis of United States federal income tax principles, any distribution paid will generally be treated as a “dividend” for United States federal income tax purposes. Subject to certain limitations, dividends paid to
non-corporate
U.S. holders, including individuals, currently are eligible for a reduced rate of taxation if we are deemed to be a “qualified foreign corporation” for United States federal income tax purposes. A qualified foreign corporation includes:
 
   
a foreign corporation that is eligible for the benefits of a comprehensive income tax treaty with the United States that includes an exchange of information program; or
 
   
a foreign corporation if its stock with respect to which a dividend is paid (or ADSs backed by such stock) is readily tradable on an established securities market within the United States (as determined for United States federal income tax purposes),
but does not include an otherwise qualified foreign corporation that is a PFIC in the taxable year that the dividend is paid or in the prior taxable year. We believe that we will be a qualified foreign corporation so long as we are not a PFIC and we are considered eligible for the benefits of the Agreement between the Government of the United States of America and the Government of the People’s Republic of China for the Avoidance of Double Taxation and the Prevention of Tax Evasion with Respect to Taxes on Income, or the Treaty. Our status as a qualified foreign corporation, however, may change.
Any dividend will not be eligible for the
dividends-received
deduction generally allowed to United States corporations with respect to dividends received from United States corporations. The amount of any distribution of property other than cash will be the fair market value of such property on the date of such distribution.
If we make a distribution paid in HK dollars, you will be considered to receive the U.S. dollar value of the distribution determined at the spot HK dollar/ U.S. dollar rate on the date such distribution is received by you or by the depositary, regardless of whether you or the depositary convert the distribution into U.S. dollars. Any gain or loss resulting from currency exchange fluctuations during the period from the date the dividend payment is includible in your income to the date you or the depositary convert the distribution into U.S. dollars will be treated as United States source ordinary income or loss for foreign tax credit limitation purposes.
 
106

Table of Contents
Subject to various limitations, any PRC tax withheld from distributions in accordance with PRC law, as limited by the Treaty, as discussed under “—PRC Taxation,” will be deductible or creditable against your United States federal income tax liability. For foreign tax credit limitation purposes, dividends paid on the H Shares or ADSs will be foreign source income, and will be treated as “passive category income” or, in the case of some U.S. holders, “general category income.” You may not be able to claim a foreign tax credit (and instead may claim a deduction) for
non-United
States taxes imposed on dividends paid on the H Shares or ADSs if you (i) have held the H Shares or ADSs for less than a specified minimum period during which you are not protected from risk of loss with respect to such Shares, or (ii) are obligated to make payments related to the dividends (for example, pursuant to a short sale).
Sale, Exchange or Other Disposition
Upon a sale, exchange or other disposition of the H Shares or ADSs, you will recognize a capital gain or loss for United States federal income tax purposes in an amount equal to the difference between the U.S. dollar value of the amount realized and your tax basis, determined in U.S. dollars, in such H Shares or ADSs. Any gain or loss will generally be United States source gain or loss for foreign tax credit limitation purposes. Capital gain of certain
non-corporate
U.S. holders, including individuals, is generally taxed at a reduced rate where the property has been held more than one year. Your ability to deduct capital losses is subject to limitations. If any PRC tax is withheld from your gain on a sale, exchange or other disposition of H Shares or ADSs, as discussed under “ —PRC Taxation,” such tax would only be creditable against your United States federal income tax liability to the extent that you have foreign source income. However, in the event that such PRC tax is withheld, a U.S. holder that is eligible for the benefits of the Treaty may be able to treat the gain as foreign source income for foreign tax credit satisfaction purposes. Pursuant to recently issued United States Treasury regulations that apply to foreign income taxes paid or accrued in taxable years beginning on or after December 28, 2021, any such foreign income tax would generally not be eligible for a foreign tax credit unless there is a sufficient nexus between the foreign country imposing the tax and the U.S. holder’s activities. The United States Treasury regulations provide for an exception if the U.S. holder elected benefits under an applicable income tax treaty between the United States and the foreign country imposing the tax. Alternatively, the U.S. holder may take a deduction for foreign income taxes paid or accrued if the U.S. holder elects to deduct (rather than credit) all such taxes paid or accrued during the taxable year. You are urged to consult your tax advisors regarding the United States federal income tax consequences if PRC tax is withheld from your gain on the sale, exchange or other disposition of H Shares or ADSs, including the availability of a foreign tax credit under your particular circumstances.
If you are paid in a currency other than U.S. dollars, any gain or loss resulting from currency exchange fluctuations during the period from the date of the payment resulting from the sale, exchange or other disposition to the date you convert the payment into U.S. dollars will be treated as United States source ordinary income or loss for foreign tax credit limitation purposes.
PFIC Rules
In general, a foreign corporation is a PFIC for United States federal income tax purposes for any taxable year in which, after applying relevant
look-through
rules with respect to the income and assets of subsidiaries:
 
   
75% or more of its gross income consists of passive income, such as dividends, interest, rents and royalties; or
 
   
50% or more of the average quarterly value of its assets consists of assets that produce, or are held for the production of, passive income.
For this purpose, passive income generally includes dividends, interest, certain types of rents and royalties, annuities, net gains from the sale or exchange of property producing such income, net gains from commodity
 
107

Table of Contents
transactions, net foreign currency gains and net income from notional principal contracts. In addition, cash, cash equivalents, securities held for investment purposes, and certain other similar assets are generally categorized as passive assets.
We believe that we did not meet either of the PFIC tests in the taxable year that ended December 31, 2021 and believe that we will not meet either of the PFIC tests in the current or subsequent taxable years and therefore will not be treated as a PFIC for such periods. We must make a separate determination after the close of each taxable year as to whether we were a PFIC for that year. Accordingly, there can be no assurance that we will not be a PFIC in the current or subsequent taxable years.
If we were a PFIC in any taxable year that you held the H Shares or ADSs, you generally would be subject to special rules with respect to “excess distributions” made by us on the H Shares or ADSs and with respect to gain from your disposition of the H Shares or ADSs. An “excess distribution” generally is defined as the excess of the distributions you receive with respect to the H Shares or ADSs in any taxable year over 125% of the average annual distributions you have received from us during the shorter of the three preceding years or your holding period for the H Shares or ADSs. Generally, you would be required to allocate any excess distribution or gain from the disposition of the H Shares or ADSs ratably over your holding period for the H Shares or ADSs. The portion of the excess distribution or gain allocated to a prior taxable year, other than a year prior to the first year in which we became a PFIC, would be taxed at the highest United States federal income tax rate on ordinary income in effect for such taxable year, and you would be subject to an interest charge on the resulting tax liability, determined as if the tax liability had been due with respect to such particular taxable years. The portion of the excess distribution or gain that is not allocated to prior taxable years, together with the portion allocated to the years prior to the first year in which we became a PFIC, would be included in your gross income for the taxable year of the excess distribution or disposition and taxed as ordinary income.
The foregoing rules with respect to excess distributions and dispositions may be avoided or reduced if you are eligible for and timely make a valid
“mark-to-market”
election. If your H Shares or ADSs were treated as shares regularly traded on a “qualified exchange” for United States federal income tax purposes and a valid and timely
mark-to-market
election was made, in calculating your taxable income for each taxable year, you generally would be required to take into account as ordinary income or loss the difference, if any, between the fair market value and the adjusted tax basis of your H Shares or ADSs at the end of your taxable year. However, the amount of loss you would be allowed is limited to the extent of the net amount of previously included income as a result of the
mark-to–market
election. The New York Stock Exchange on which the ADSs are traded is a qualified exchange for United States federal income tax purposes.
Alternatively, a timely election to treat us as a qualified electing fund under Section 1295 of the Code could be made to avoid the foregoing rules with respect to excess distributions and dispositions. You should be aware, however, that if we become a PFIC, we do not intend to satisfy record keeping requirements that would permit you to make a qualified electing fund election.
If you own the H Shares or ADSs during any year that we are a PFIC, you must annually file Internal Revenue Service, or IRS, Form 8621(or any other form subsequently specified by the United States Treasury Department), subject to certain exceptions based on the value of PFIC stock held. We encourage you to consult your own tax advisor concerning the United States federal income tax consequences of holding the H Shares or ADSs that would arise if we were considered a PFIC.
Backup Withholding and Information Reporting
In general, information reporting requirements will apply to dividends with respect to the H Shares or ADSs or the proceeds of the sale, exchange or other disposition of the H Shares or ADSs paid within the United States, and in some cases, outside of the United States, other than to various exempt recipients, including corporations.
 
108

Table of Contents
In addition, you may, under some circumstances, be subject to “backup withholding” with respect to dividends paid on the H Shares or ADSs or the proceeds of any sale, exchange or other disposition of the H Shares or ADSs, unless you:
 
   
are a corporation or fall within various other exempt categories, and, when required, demonstrate this fact; or
 
   
provide a correct taxpayer identification number on a properly completed IRS Form
W-9
or a substitute form, certify that you are exempt from backup withholding and otherwise comply with applicable requirements of the backup withholding rules.
Backup withholding is not an additional tax. Any amount withheld under the backup withholding rules generally will be creditable against your United States federal income tax liability provided that you furnish the required information to the IRS in a timely manner and you may obtain a refund of any excess amounts withheld under the backup withholding rules by filing the appropriate claim for refund with the IRS in a timely manner and furnishing any required information. If you do not provide a correct taxpayer identification number you may be subject to penalties imposed by the IRS.
In addition, certain U.S. holders who are individuals that hold certain foreign financial assets (which may include the H Shares or ADSs) may be required to report information relating to such assets, subject to certain exceptions. You should consult your own tax advisors regarding the effect, if any, of this requirement on your ownership and disposition of the H Shares or ADSs.
Documents on Display
You may find our annual reports on Form
20-F,
the exhibits and other documents filed with the SEC on its website
www.sec.gov
and our website
www.petrochina.com.cn
. Upon request, we will provide hardcopies of our annual report on Form
20-F
to you free of charge.
The SEC allows us to “incorporate by reference” the information we file with the Commission. This means that we can disclose important information to you by referring you to another document filed separately with the Commission. The information incorporated by reference is considered to be part of this annual report on Form
20-F.
This annual report contains exhibits and schedules. Any statement in this annual report about any of our contracts or other documents is not necessarily complete. If the contract or document is filed or incorporated by reference as an exhibit to this annual report, the contract or document is deemed to modify the description contained in this annual report. You must review the exhibits themselves for a complete description of the contracts or documents.
As a foreign private issuer, we are exempt from the rules under the Exchange Act prescribing the furnishing and content of quarterly reports and proxy statements, and officers, directors and principal shareholders are exempt from the reporting and short-swing profit recovery provisions contained in Section 16 of the Exchange Act.
Item 11
— QUANTITATIVE AND QUALITATIVE DISCLOSURES ABOUT MARKET RISK
In the normal course of business, we hold or issue various financial instruments which expose us to interest rate and foreign exchange rate risks. We hedge part of the exchange rate risk through hedging instruments. Additionally, our operations are affected by certain commodity price movements. We use derivative instruments such as commodity futures, commodity swaps and commodity options for hedging some price risks efficiently. Substantially all of the financial instruments we hold are for purposes other than trading. We regard an effective market risk management system as an important element of our treasury function and are currently enhancing our systems. A primary objective of our market risk management is to implement certain methodologies to better measure and monitor risk exposures.
 
109

Table of Contents
The following discussions and tables, which constitute
“forward-looking
statements” that involve risks and uncertainties, summarize our
market-sensitive
financial instruments including fair value, maturity and contract terms. Such discussions address market risk only and do not present other risks which we face in the normal course of business.
Interest Rate Risk
Our interest risk exposure arises from changing interest rates. The tables below provide information about our financial instruments including various debt obligations that are sensitive to changes in interest rates. The tables present principal cash flows and related
weighted-average
interest rates at expected maturity dates.
Weighted-average
variable rates are based on effective rates as of December 31, 2019, 2020 and 2021. The information is presented in Renminbi equivalents, our reporting currency.
Foreign Exchange Rate Risk
We conduct our business primarily in Renminbi. However, a portion of our RMB revenues are converted into other currencies to be used in foreign investment and trading, to meet foreign currency financial instrument obligations and to pay for imported oil, gas, equipment and other materials. Foreign currency payments for imported oil and gas represented 23.6%, 21.6% and 22.1% of our total purchases, services and other expenses in 2019, 2020 and 2021, respectively. These are the main foreign exchange payments of the company.
The Renminbi is not a freely convertible currency. Limitation in foreign exchange transactions imposed by the PRC government could cause future exchange rates to vary significantly from current or historical exchange rates.
The tables below provide information about our financial instruments including foreign currency denominated debt instruments that are sensitive to foreign currency exchange rates. The tables below summarize such information by presenting principal cash flows and related
weighted-average
interest rates at expected maturity dates in RMB equivalents, using the exchange rates in effect on December 31, 2021.
December 31, 2021
 
   
Expected Maturity Date
   
Percentage
to Total
Long-Term

Borrowings
   
Fair
Value
 
   
2022
   
2023
   
2024
   
2025
   
2026
   
Thereafter
   
Total
 
   
(RMB equivalent in millions, except percentages)
 
Long term debt
                 
Loans in RMB
                 
Fixed Rate Loan Amount
    6,236       5,225       4,002       10,835       1,075       1,706       29,079       9.68     27,938  
Average Interest Rate
    3.09     3.29     2.86     4.20     3.77     4.07     —         —         —    
Variable Rate Loan Amount
    4,435       30,249       60,285       5,499       1,552       9,964       111,984       37.27     105,548  
Average Interest Rate
    3.84     2.55     3.04     3.62     3.37     3.94     —         —         —    
Loans in Euro
                 
Fixed Rate Loan Amount
    —         —         —         —         —         112       112       0.04     123  
Average Interest Rate
    —         —         —         —         —         3.88     —         —         —    
Variable Rate Loan Amount
    —         —         —         3,430       —         —         3,430       1.14     3,644  
Average Interest Rate
    —         —         —         1.18     —         —         —         —         —    
Loans in United States Dollar
                 
Fixed Rate Loan Amount
    15       9       9       9       9       3,264       3,315       1.10     3,729  
 
110

Table of Contents
   
Expected Maturity Date
   
Percentage
to Total
Long-Term

Borrowings
   
Fair
Value
 
   
2022
   
2023
   
2024
   
2025
   
2026
   
Thereafter
   
Total
 
   
(RMB equivalent in millions, except percentages)
 
Average Interest Rate
    1.00     0.55     0.55     0.55     0.55     1.11     —         —         —    
Variable Rate Loan Amount
    574       7,821       28,401       20,159       4,372       10       61,337       20.42     63,757  
Average Interest Rate
    3.77     1.16     1.29     1.19     4.91     5.41     —         —         —    
Loans in Japanese Yen
                 
Fixed Rate Loan Amount
    3       3       3       3       —         —         12       —         12  
Average Interest Rate
    2.30     2.30     2.30     3.25     —         —         —         —         —    
Variable Rate Loan Amount
    —         —         —         —         —         —         —         —         —    
Average Interest Rate
    —         —         —         —         —         —         —         —         —    
Loans in CFA Franc
                 
Fixed Rate Loan Amount
    —         —         —         —         —         —         —         —         —    
Average Interest Rate
    —         —         —         —         —         —         —         —         —    
Variable Rate Loan Amount
    1       —         —         —         —         —         1       —         1  
Average Interest Rate
    2     —         —         —         —         —         —         —         —    
Debentures in United States Dollar
                 
Fixed Rate Loan Amount
    —         —         —         3,170       —         —         3,170       1.06     3,017  
Average Interest Rate
    —         —         —         3.75       —         —         —         —    
Debentures in RMB
                 
Fixed Rate Loan Amount
    2,000       4,000       —         —         9,000       2,000       17,000       5.66     16,075  
Average Interest Rate
    4.90     3.09     —         —         3.60     3.84     —         —         —    
Medium Term Notes in RMB
                 
Fixed Rate Loan Amount
    —         21,000       50,000       —         —         —         71,000       23.63     67,093  
Average Interest Rate
    —         2.42     3.64     —         —         —         —         —         —    
Medium Term Notes in United State Dollar
    —         —         —         —           —         —         —         —    
Fixed Rate Loan Amount
    —         —         —         —           —         —         —         —    
Average Interest Rate
                —         —         —    
Total
    13,264       68,307       142,700       43,105       16,008       17,056       300,440       100     290,937  


See “Item 3 — Key Information — Risk Factors — Risks Related to Pricing and Exchange Rate”.
Commodity Price Risk
We are engaged in a wide range of
petroleum-related
activities and purchase certain quantity of oil from the international market to meet our demands. The prices of crude oil and refined products in the international market are affected by various factors such as changes in global and regional politics and economy, the demand and supply of crude oil and refined products, as well as unexpected events and disputes with international repercussions. The domestic crude oil price is determined with reference to the international price of crude oil whereby the domestic refined oil prices adjust with changes in crude oil prices in the international market. We use derivative instruments such as commodity futures, commodity swaps and commodity options to hedge some
 
111

Table of Contents
commodity price risks. We have strict internal control requirements with respect to the purpose, types, holding volumes of any derivative instruments as against the inventories, and the transaction process of the derivatives. Any derivative instruments we have are entered into solely for
non-trading
purposes. We do not expect any material market risks to our financial position, results of operations or liquidity exist as a result of entering into such derivatives. See “Item 3 — Key Information — Risk Factors — Risks Related to Pricing and Exchange Rate”.
 
Item 12 —
DESCRIPTION OF SECURITIES OTHER THAN EQUITY SECURITIES
Fees paid by our ADS holders
The Bank of New York Mellon, the depositary of our ADS program, collects its fees for delivery and surrender of ADSs directly from investors depositing shares or surrendering ADSs for the purpose of withdrawal or from intermediaries acting for them. The depositary collects fees for making distributions to investors by deducting those fees from the amounts distributed or by selling a portion of distributable property to pay the fees. The depositary may refuse to deliver ADSs or the deposited shares or provide any distributions until its fees for those services are paid.
 
Persons Depositing or Withdrawing Shares Must Pay:
  
For:
$5.00 (or less) per 100 ADSs (or portion thereof)    Issuance of ADSs, including issuances resulting from a distribution of shares or rights or other property
   Cancelation of ADSs for the purpose of withdrawal, including if the deposit agreement terminates
$0.05 (or less) per ADS (or portion thereof)    Any cash distribution to ADS holders
$0.05 (or less) per ADS per calendar year    Depositary services
A fee equivalent to the fee that would be payable if securities distributed to you had been shares and the shares had been deposited for issuance of ADSs    Distribution of securities distributed to holders of deposited securities which are distributed by the depositary to ADS holders
Registration or transfer fees    Transfer and registration of shares on our share register to or from the name of the depositary or its agent when you deposit or withdraw shares
Expenses of the depositary    Cable, telex and facsimile transmissions (when expressly provided in the deposit agreement)
   Converting foreign currency to U.S. dollars
Taxes and other governmental charges the depositary or the custodian have to pay on any ADS or share underlying an ADS, for example, stock transfer taxes, stamp duty or withholding taxes    As necessary
Any charges incurred by the depositary or its agents for servicing the deposited securities    As necessary
Fees and Payments from the Depositary to Us
In the year ended December 31, 2021, we received from the depositary a reimbursement of US$177,615.09, net of withholding tax, for our continuing annual stock exchange listing fees and our expenses incurred in connection with investor relationship programs. In addition, the depositary has agreed to reimburse us certain amount per year of the facility, including but not limited to, investor relations expenses or any other American depositary receipts program related expenses. The amount of such reimbursements is subject to certain limits.
 
112

Table of Contents
PART II
 
Item 13
 —
DEFAULTS, DIVIDENDS ARREARAGES AND DELINQUENCIES
None.
 
Item 14
 —
MATERIAL MODIFICATIONS TO THE RIGHTS TO SECURITY HOLDERS AND USE OF PROCEEDS
None.
 
Item 15
 —
CONTROLS AND PROCEDURES
Evaluation of the Management on Disclosure Controls and Procedures
Our chairman, president and CFO, after evaluating the effectiveness of our disclosure controls and procedures (as defined in the United States Exchange Act Rules
13a-15(e)
and 15d(e)) as of the end of the period covered by this annual report, have concluded that, as of such date, our disclosure controls and procedures were effective to ensure that material information required to be disclosed in the reports that we file and furnish under the Exchange Act is recorded, processed, summarized and reported, within the time periods specified in the SEC’s rules and regulations and that such information is accumulated and communicated to our management, including our chairman, president and CFO, as appropriate, to allow timely decisions regarding required disclosure.
Management’s Report on Internal Control over Financial Reporting
Our management is responsible for establishing and maintaining adequate internal control over financial reporting, as defined in Exchange Act Rules
13a-15(f).
Under the supervision and with the participation of our management, including our chairman, president and CFO, our company evaluated the effectiveness of its internal control over financial reporting based on criteria established in the framework in
Internal Control — Integrated Framework
(2013) issued by the Committee of Sponsoring Organizations of the Treadway Commission. Based on this evaluation, our management has concluded that our internal control over financial reporting was effective as of December 31, 2021.
Because of its inherent limitations, internal control over financial reporting may not prevent or detect misstatements. Also, projections of any evaluation of effectiveness to future periods are subject to the risk that controls may become inadequate because of changes in conditions, or that the degree of compliance with the policies and procedures may deteriorate.
The effectiveness of our internal control over financial reporting as of December 31, 2021 has been audited by PricewaterhouseCoopers Zhong Tian LLP (“PwC”), our independent registered public accountant, as stated in its report, which appears on page
F-3
of this annual report.
Changes in Internal Control over Financial Reporting
During the year ended December 31, 2021, there were no changes in our internal control over financial reporting that have materially affected, or are reasonably likely to materially affect, our internal control over financial reporting.
 
Item 16A
 —
AUDIT COMMITTEE FINANCIAL EXPERT
Our audit committee is composed of two independent
non-executive
directors, Cai Jinyong and Mr. Jiang, Simon X., and one
non-executive
director, Mr. Liu Yuezhen. See “Item 6 — Directors, Senior Management and
 
113

Table of Contents
Employees — Board Practices — Audit Committee”. Mr. Cai Jinyong, our independent
non-executive
director, has been confirmed as a “financial expert” as defined in Item 16A of
Form 20-F.
 
Item 16B
 —
CODE OF ETHICS
We adopted our code of business conduct and ethics for senior management on March 23, 2004 and our code of business conduct and ethics for employees on March 2, 2005 and have disclosed the content of both codes on our website.
These two Codes of Ethics may be accessed as follows:
 
  1.
From our main web page, first click on “Investor Relations”.
 
  2.
Next, click on “Corporate Governance Structure”.
 
  3.
Finally, click on “Code of Ethics for Senior Management” or “Code of Ethics for Employees of PetroChina Company Limited”.
This
20-F
also includes both of the codes as exhibit 11.1 and 11.2.
 
Item 16C
 —
PRINCIPAL ACCOUNTANT FEES AND SERVICES
KPMG Huazhen LLP (“KPMG Huazhen”) served as our independent accountant for the fiscal year of 2020. The office of KPMG Huazhen is located at 8th Floor, KPMG Tower, Oriental Plaza, 1 East Chang An Avenue, Beijing, China. PwC served as our independent accountant for the fiscal year of 2021. The office of PwC is located at 11/F, PricewaterhouseCoopers Center, 2 Corporate Avenue, 202 Hu Bin Road, Huangpu District, Shanghai 200021, China.
The following table presents the aggregate fees paid by us (not including our subsidiaries) for professional audit services, tax and other services rendered by KPMG Huazhen and PwC to us for each of the years ended December 31, 2020 and 2021, respectively.
 
    
December 31,
 
    
2020
    
2021
 
    
RMB in millions
 
Audit fees
     49        47  
Audit-related
fees
     —          —    
Tax fees
     —          —    
All other fees
     —          —    


Total
     49        47  


The remuneration above for 2020 did not include fees of RMB62 million paid by our subsidiaries to KPMG Huazhen and its network firms which primarily included audit fees of RMB52 million, audit-related fees of RMB6 million and tax fees of RMB3 million, and other service fees of RMB1 million, respectively.
The remuneration above for 2021 did not include fees of RMB41 million paid by our subsidiaries to PwC and its network firms which primarily included audit fees of RMB34 million, audit-related fees of RMB2 million and tax fees of RMB2 million, and other service fees of RMB3 million, respectively.
See Note 7 to our financial statements prepared in accordance with IFRS included elsewhere in this annual report for detailed information about auditor’s remuneration.
 
114

Table of Contents
Audit Committee
Pre-approved
Policies and Procedures
Currently, all services to be provided by our independent registered public accountant must be
pre-approved
by our audit committee.
During the year ended December 31, 2021, services relating to all non-audit related fees provided to us by PwC were approved by our audit committee in accordance with the de minimis exception to the pre-approval requirement provided by paragraph (c)(7)(i)(C) of Rule 2-01 of Regulation S-X.
Item 16D
— EXEMPTIONS FROM LISTING STANDARDS FOR AUDIT COMMITTEES
We rely on an exemption contained in paragraph (b)(1)(iv)(D) of Rule
10A-3
under the Securities and Exchange Act of 1934, as amended, from the New York Stock Exchange listing requirement that each member of the audit committee of a listed issuer must be independent. Our single
non-independent
audit committee member, who is a representative of CNPC, is not a voting member, nor the chairman of the audit committee of our board of directors, which qualifies us for the exemption from the independence requirements available under paragraph (b)(1)(iv)(D) of Rule
10A-3.
See “Item 6 — Directors, Senior Management and Employees — Board Practice — Audit Committee.” We believe our reliance on this exemption does not have any adverse effect on the ability of our audit committee to act independently.
Item 16E
— PURCHASES OF EQUITY SECURITIES BY THE ISSUER AND AFFILIATED PURCHASERS
None.
Item 16F
— CHANGE IN REGISTRANT
S CERTIFYING ACCOUNTANT
Pursuant to the applicable regulatory requirement of the PRC government in relation to mandatory auditor rotation, on March 25, 2021, our board of directors approved not to
re-appoint
KPMG Huazhen as our principal accountant, upon completion of their audits of our consolidated financial statements as of and for the year ended December 31, 2020 and the effectiveness of the internal control over financial reporting as of December 31, 2020, and the issuance of their reports thereon. Our board of directors, pursuant to an open selection process and as recommended by the audit committee, resolved to propose to appoint PricewaterhouseCoopers Zhong Tian LLP (“PwC”) as our principal accountant for the year ended December 31, 2021, and such proposal has been approved at the general meeting held on June 10, 2021.
The audit reports of KPMG Huazhen on our consolidated financial statements as of and for the years ended December 31, 2020 and 2019 did not contain any adverse opinion or disclaimer of opinion, nor was qualified or modified as to uncertainties, audit scope or accounting principles, except as follows: KPMG Huazhen’s report on the consolidated financial statements of the Company as of and for the years ended December 31, 2020 and 2019, which was included in the Form
20-F
of the Company for the year ended December 31, 2020, contained a separate paragraph stating that “As discussed in Note 3(ac)(ii) to the consolidated financial statements, the Company has changed its method of accounting for leases as of January 1, 2019 due to the adoption of International Financial Reporting Standard 16 “Leases”.”
During the fiscal years ended December 31, 2020 and 2019 and through April 29, 2021, there were no: (1) disagreements with KPMG Huazhen on any matter of accounting principles or practices, financial statements disclosure, or auditing scope or procedures, which disagreements, if not resolved to their satisfaction, would have caused them to make reference in connection with their opinion to the subject matter of the disagreements; or (2) reportable events (as defined in Item 16F(a)(1)(v) of Form
20-F).
During the fiscal years ended December 31, 2019 and 2020 and through April 29, 2021, neither we nor anyone on our behalf consulted PwC regarding either (i) the application of accounting principles to a specific
 
115

Table of Contents
completed or proposed transaction or regarding the type of audit opinion that might be rendered on our financial statements, or (ii) any matter that was either the subject of a disagreement (as defined in Item 16F(a)(1)(iv) of Form
20-F)
or a reportable event (as defined in Item 16F(a)(1)(v) of Form
20-F).
Also, during the two most recent fiscal years and through April 29, 2021, we have not obtained any written report or oral advice that PwC concluded was an important factor considered by us in reaching a decision as to the accounting, auditing or financial reporting issue.
Item 16G 
— CORPORATE GOVERNANCE
We are incorporated under the laws of the PRC, with A Shares publicly traded on the Shanghai Stock Exchange, or the SSE, and H Shares publicly traded on the Hong Kong Stock Exchange, or the HKSE, and American Deposit Shares representing H Shares on the NYSE. As a result, our corporate governance framework is subject to the mandatory provisions of the PRC Company Law and the Corporate Governance Rules as well as the securities laws, regulations and the listing rules of Hong Kong and the United States.
The following discussion summarizes the significant differences between our corporate governance practices and those that would apply to a U.S. domestic issuer under the NYSE corporate governance rules.
Director Independence
Under the NYSE corporate governance rule 303A.01, a listed company must have a majority of independent directors on its board of directors. A company of which more than 50% of the voting power is held by an individual, a group or another company, or a controlled company, is not required to comply with this requirement. We are not required under the PRC Company Law and the HKSE Listing Rules to have a majority of independent directors on our board of directors. As of the date of this report, five of our 12 directors were independent
non-executive
directors.
Under the NYSE corporate governance rule 303A.03, the
non-management
directors of a listed company must meet at regularly scheduled executive sessions without management. There are no mandatory requirements under the PRC Company Law and the HKSE Listing Rules that a listed company should hold, and we currently do not hold, such executive sessions.
Nominating/Corporate Governance Committee
Under the NYSE corporate governance rule 303A.04, a listed company must have a nominating/corporate governance committee composed entirely of independent directors, with a written charter that covers certain minimum specified duties, but a controlled company is not required to comply with this requirement. The Corporate Governance Code as amended by the Stock Exchange of Hong Kong provides that issuers shall establish a nominating committee, and a majority of which should be independent
non-executive
directors and the chairman shall be served by an independent
non-executive
director or the board chairman. We are not required under the PRC Company Law to have a nominating/corporate governance committee. We set up a nominating committee, which consists of the chairman of our board of directors and two independent
non-executive
directors.
Compensation Committee
Under the NYSE corporate governance rule 303A.05, a listed company must have a compensation committee composed entirely of independent directors, with a written charter that covers certain minimum specified duties. A controlled company is not required to comply with this requirement. We are not required under the PRC Company Law to have a compensation committee. Under the Corporate Governance Code of the HKSE Listing Rules, a listed company must have a remuneration committee composed of a majority of independent
non-executive
directors, with a written term of references that covers certain minimum specified duties.
 
116

Table of Contents
We currently do not have a compensation committee composed entirely of independent directors. However, we have an evaluation and remuneration committee including a majority of independent
non-executive
directors.
Corporate Governance Guidelines
Under the NYSE corporate governance rule 303A.09, a listed company must adopt and disclose corporate governance guidelines that cover certain minimum specified subjects. We are not required under the PRC Company Law and the HKSE Listing Rules to have, and we do not currently have, formal corporate governance guidelines. However, we have the Articles of Association, the Rules and Procedures of Board of Directors and the Implementation Rules for Compensation of Senior Management that address such matters as the director qualification standards and responsibilities, key board committee responsibilities, director compensation, and director orientation and continuing education.
In 2009, we formulated the Administrative Measures on Independent Directors, the Administrative Rules on Holding of Company Shares by Directors, Supervisors and Senior Management, the Administrative Measures on Investor’s Relationship and the rules and procedures of the Audit Committee, the Performance Review and Compensation Committee, the Investment and Development Committee, and the Safety and Environmental Protection Committee. All these policies have further enhanced our corporate governance system and can ensure the better performance of duties of directors, supervisors, senior managers and committee members. In 2015, we set up a nominating committee and formulated the Rules of Procedures of the Nominating Committee. In 2017, we added certain provisions to our Articles of Association, including cumulative voting provisions. Our
by-laws
with respect to general meeting, board of directors and supervisory committee were also amended in line with the amendment to the articles. In 2018, we formulated the Corporate Guarantee Management Measures and revised the Measures for Registration of Insiders of Insider Information. In 2019, we formulated the Procedures of Appointment of Directors. In 2021, our Safety and Environment Committee was renamed to Sustainable Development Committee and we formulated the rules for the committee.
Code of Business Conduct and Ethics
Under the NYSE corporate governance rule 303A.10, a listed company must adopt and disclose its code of business conduct and ethics for directors, officers and employees, and promptly disclose any waivers of the code for directors or executive officers. See “Item 16B – Code of Ethics”. We are not required under the PRC Company Law and the HKSE Listing Rules to have, and we do not currently have, a code of business conduct and ethics for directors. However, pursuant to the HKSE Listing Rules, all of our directors must comply with the Model Code for Securities Transactions by Directors of Listed Companies (the “Model Code”) as set out in the Listing Rules. The Model Code sets forth required standards with which the directors of a listed company must comply in securities transactions of the listed company.
CEO Certification Requirements
Under the NYSE corporate governance rule 303A.12(a), each listed company’s CEO must certify to the NYSE each year that he or she is not aware of any violation by the Company of NYSE corporate governance listing standards. The PRC Company Law and the HKSE Listing Rules do not have such requirements. Our chairman performs the certification under the rule 303A.12(a).
Item 16H
— MINE SAFETY DISCLOSURE
Not applicable.
Item 16I
— DISCLOSURE REGARDING FOREIGN JURISDICTIONS THAT PREVENT INSPECTIONS.
Not applicable.
 
117

Table of Contents
PART III
Item 17
— FINANCIAL STATEMENTS
We have elected to provide the financial statements and related information specified in Item 18 in lieu of Item 17.
Item 18
— FINANCIAL STATEMENTS
See page
F-pages
following Item 19.
Item 19
— EXHIBITS
 
  (a)
See Item 18 for a list of the financial statements as part of this annual report.
 
  (b)
Exhibits to this annual report.
 
Exhibit
Number
  
Description of
Exhibits
1.1    Articles of Association (as amended on June 11, 2020) (English translation)(4)
2.1    A description of rights of each class of securities registered under Section 12 of the Securities Exchange Act of 1934(3)
4.1   
Non-competition
Agreement between CNPC and PetroChina (English translation)
(1)
4.2    Trademark Licensing Contract between CNPC and PetroChina (English translation)
(1)
4.3    Patent and
Know-how
Licensing Contract between CNPC and PetroChina (English translation)
(1)
4.4    Computer Software Licensing Contract between CNPC and PetroChina (English translation)
(1)
4.5    Contract for Transfer of Rights under Production Sharing Contracts between CNPC and PetroChina (English translation)
(1)
4.6    Contract for the Supervision of Certain Sales Enterprises between CNPC and PetroChina (English translation)
(1)
4.7    Comprehensive Products and Services Agreement, dated August 27, 2020, between CNPC and PetroChina (English translation)(5)
4.8    Letter of Confirmation regarding the Land Use Rights Lease Agreement and Building Lease Agreement, dated August 27, 2020, between CNPC and PetroChina (English translation) (5)
4.9    Production and Operation Agreement between PipeChina and PetroChina (English Translation)(5)
8.1*    List of major subsidiaries
11.1    Code of Ethics for Senior Management (2)
11.2    Code of Ethics for Employees (2)
12.1*    Certification of Chairman required by Section 302 of the Sarbanes-Oxley Act of 2002
12.2*    Certification of President required by Section 302 of the Sarbanes-Oxley Act of 2002
12.3*    Certification of CFO required by Section 302 of the Sarbanes-Oxley Act of 2002
13.1**    Certification of Chairman required by 18 U.S.C. Section 1350, as adopted pursuant to Section 906 of the Sarbanes-Oxley Act of 2002
13.2**    Certification of President required by 18 U.S.C. Section 1350, as adopted pursuant to Section 906 of the Sarbanes-Oxley Act of 2002
13.3**    Certification of CFO required by 18 U.S.C. Section 1350, as adopted pursuant to Section 906 of the Sarbanes-Oxley Act of 2002
 
118

Table of Contents
Exhibit
Number
  
Description of
Exhibits
15.1*    Reserves Report for the year ended on December 31, 2021 prepared by DeGolyer and MacNaughton
15.2*    Reserves Audit Report for the year ended on December 31, 2021 prepared by DeGolyer and MacNaughton
15.3*    Reserves Report for the year ended on December 31, 2021 prepared by Ryder Scott
15.4*    Reserves Report for the year ended on December 31, 2021 prepared by GLJ Petroleum Consultants
15.5*    Reserves Report for the year ended on December 31, 2021 prepared by McDaniel & Associates Consultants, Ltd.
101.INS*   
Inline XBRL Instance Document - the instance document does not appear in the Interactive Data File because its XBRL tags are embedded within the Inline XBRL document
101.SCH*    Inline XBRL Taxonomy Extension Schema Document
101.CAL*    Inline XBRL Taxonomy Extension Calculation Linkbase Document
101.DEF*    Inline XBRL Taxonomy Extension Definition Linkbase Document
101.LAB*    Inline XBRL Taxonomy Extension Labels Linkbase Document
101.PRE*    Inline XBRL Taxonomy Extension Presentation Linkbase Document — the cover page XBRL tags are embedded within the Exhibit 101 Inline XBRL
104*    Cover Page Interactive Data File (embedded within the Inline XBRL document)
 
*
To be filed as exhibits to this Form
20-F.
**
To be furnished as exhibits to this Form
20-F.
 
(1)
Paper filing; incorporated into this annual report by reference to our Registration Statement on Form
F-1
(File
No. 333-11566)
filed with the Commission, as declared effective on March 29, 2000.
(2)
Incorporated into this annual report by reference to the exhibits to Form
20-F
for the fiscal year ended December 31, 2004 (File
No. 1-15006)
filed with the Commission.
(3)
Incorporated into this annual report by reference to the exhibits to Form
20-F
for the fiscal year ended December 31, 2019 (File
No. 1-15006)
filed with the Commission.
(4)
Incorporated into this annual report by reference to Exhibit 99.2 to Form
6-K
(File
No. 1-15006)
furnished to the Commission on June 12, 2020.
(5)
Incorporated into this annual report by reference to the exhibits to Form
20-F
for the fiscal year ended December 31, 2020 (File
No. 1-15006)
filed with the Commission.
 
119

Table of Contents
SIGNATURE
The registrant hereby certifies that it meets all of the requirements for filing on Form
20-F
and that it has duly caused and authorized the undersigned to sign this annual report on its behalf.
 
PETROCHINA COMPANY LIMITED
 
/s/ Chai Shouping
Name:  
Chai Shouping
Title:  
CFO and Secretary to Board of Directors
Date: April 29, 2022
 
120

Table of Contents
INDEX OF CONSOLIDATED FINANCIAL STATEMENTS


Page
 
PetroChina Company Limited and its Subsidiaries
  
     
Consolidated Financial Statements


F-2


F-3


F-6


F-7


F-8


F-10


F-11


F-70
 
 
F-1

Table of Contents
Report of Independent Registered Public Accounting Firm
To the Shareholders and Board of Directors
PetroChina Company Limited:
Opinion on the Consolidated Financial Statements
We have audited the accompanying consolidated statement of financial position of PetroChina Company Limited and subsidiaries (the “Company”) as of December 31, 2020, the related consolidated statements of comprehensive income, cash flows and changes in equity for each of the years in the two-year period ended December 31, 2020, and the related notes (collectively, the “consolidated financial statements”). In our opinion, the consolidated financial statements present fairly, in all material respects, the financial position of the Company as of December 31, 2020, and the results of its operations and its cash flows for each of the years in the two-year period ended December 31, 2020, in conformity with International Financial Reporting Standards as issued by International Accounting Standards Board.
Basis for Opinion
These consolidated financial statements are the responsibility of the Company’s management. Our responsibility is to express an opinion on these consolidated financial statements based on our audits. We are a public accounting firm registered with the Public Company Accounting Oversight Board (United States) (PCAOB) and are required to be independent with respect to the Company in accordance with the U.S. federal securities laws and the applicable rules and regulations of the Securities and Exchange Commission and the PCAOB.
We conducted our audits in accordance with the standards of the PCAOB. Those standards require that we plan and perform the audit to obtain reasonable assurance about whether the consolidated financial statements are free of material misstatement, whether due to error or fraud. Our audits included performing procedures to assess the risks of material misstatement of the consolidated financial statements, whether due to error or fraud, and performing procedures that respond to those risks. Such procedures included examining, on a test basis, evidence regarding the amounts and disclosures in the consolidated financial statements. Our audits also included evaluating the accounting principles used and significant estimates made by management, as well as evaluating the overall presentation of the consolidated financial statements. We believe that our audits provide a reasonable basis for our opinion.
/s/ KPMG Huazhen LLP
We served as the Company’s auditor from 2013 to 2021.
Beijing, China
April 29, 2021
 
F-2

Table of Contents
Report of Independent Registered Public Accounting Firm
To the Board of Directors and Shareholders of PetroChina Company Limited
Opinions on the Financial Statements and Internal Control over Financial Reporting
We have audited the accompanying consolidated statement of financial position of PetroChina Company Limited and its subsidiaries (the “Company”) as of December 31, 2021, and the related consolidated statements of comprehensive income, changes in equity and cash flows for the year ended December 31, 2021, including the related notes (collectively referred to as the “consolidated financial statements”). We also have audited the Company’s internal control over financial reporting as of December 31, 2021, based on criteria established in
 
Internal Control — Integrated Framework
 
(2013) issued by the Committee of Sponsoring Organizations of the Treadway Commission (COSO).
In our opinion, the consolidated
 
financial statement referred to above present fairly, in all material respects, the financial position of the Company as of December 31, 2021, and the results of its operation and its cash flow for the year ended December 31, 2021 in conformity with International Financial Reporting Standards as issued by the International Accounting Standards Board. Also in our opinion, the Company maintained, in all material respects, effective internal control over financial reporting as of December 31, 2021, based on criteria established in
 
Internal Control — Integrated Framework
 
(2013) issued by the COSO.
Basis for Opinions
The Company’s management is responsible for these consolidated
 
financial statements, for maintaining effective internal control over financial reporting, and for its assessment of the effectiveness of internal control over financial reporting, included in the accompanying Management’s Report on Internal Control over Financial Reporting appearing under Item 15. Our responsibility is to express opinions on the Company’s consolidated
 
financial statements and on the Company’s internal control over financial reporting based on our audits. We are a public accounting firm registered with the Public Company Accounting Oversight Board (United States) (PCAOB) and are required to be independent with respect to the Company in accordance with the U.S. federal securities laws and the applicable rules and regulations of the Securities and Exchange Commission and the PCAOB.
We conducted our audits in accordance with the standards of the PCAOB. Those standards require that we plan and perform the audits to obtain reasonable assurance about whether the consolidated
 
financial statements are free of material misstatement, whether due to error or fraud, and whether effective internal control over financial reporting was maintained in all material respects.
Our audits of the consolidated financial statements included performing procedures to assess the risks of material misstatement of the consolidated
 
financial statements, whether due to error or fraud, and performing procedures that respond to those risks. Such procedures included examining, on a test basis, evidence regarding the amounts and disclosures in the consolidated
 
financial statements. Our audits also included evaluating the accounting principles used and significant estimates made by management, as well as evaluating the overall presentation of the consolidated financial statements. Our audit of internal control over financial reporting included obtaining an understanding of internal control over financial reporting, assessing the risk that a material weakness exists, and testing and evaluating the design and operating effectiveness of internal control based on the assessed risk. Our audits also included performing such other procedures as we considered necessary in the circumstances. We believe that our audits provide a reasonable basis for our opinions.
Definition and Limitations of Internal Control over Financial Reporting
A company’s internal control over financial reporting is a process designed to provide reasonable assurance regarding the reliability of financial reporting and the preparation of financial statements for external purposes in
 
F-3

Table of Contents
accordance with generally accepted accounting principles. A company’s internal control over financial reporting includes those policies and procedures that (i) pertain to the maintenance of records that, in reasonable detail, accurately and fairly reflect the transactions and dispositions of the assets of the company; (ii) provide reasonable assurance that transactions are recorded as necessary to permit preparation of financial statements in accordance with generally accepted accounting principles, and that receipts and expenditures of the company are being made only in accordance with authorizations of management and directors of the company; and (iii) provide reasonable assurance regarding prevention or timely detection of unauthorized acquisition, use, or disposition of the company’s assets that could have a material effect on the financial statements.
Because of its inherent limitations, internal control over financial reporting may not prevent or detect misstatements. Also, projections of any evaluation of effectiveness to future periods are subject to the risk that controls may become inadequate because of changes in conditions, or that the degree of compliance with the policies or procedures may deteriorate.
Critical Audit Matters
The critical audit matter communicated below is a matter arising from the current period audit of the consolidated
 
financial statements that was communicated or required to be communicated to the audit committee and that (i) relates to accounts or disclosures that are material to the
 
consolidated
 
financial statements and (ii) involved our especially challenging, subjective, or complex judgments. The communication of critical audit matter does not alter in any way our opinion on the consolidated
 
financial statements, taken as a whole, and we are not, by communicating the critical audit matter below, providing a separate opinion on the critical audit matter or on the accounts or disclosures to which it relates.
Recoverability of the carrying amount of oil and gas properties
As described in Note 5 and 15 to the consolidated financial statements, the net book value of oil and gas properties as included in property, plant and equipment amounted to RMB 816,788 million as at 31 December 2021, and impairment loss of RMB 19,463 million was recorded for the year ended 31 December 2021.
Uncertainty in future oil prices, future production costs, changes in operating conditions and the economic outlook gave rise to possible indicators that the carrying amount of the oil and gas properties as at 31 December 2021 might be impaired. An impairment loss is recognized for the amount by which the carrying amount of oil and gas properties exceeds the higher of its fair value less costs to sell and its value in use. Management’s determination of the recoverable amounts for oil and gas properties involved key estimates and assumptions, including future oil prices, future costs, future production volumes as well as discount rates.
The principal considerations for our determination that performing procedures relating to recoverability of the carrying amount of oil and gas properties as a critical audit matter are the significance of the carrying amount of oil and gas properties as at 31 December 2021, together with the significant estimates and judgements by management in the use of key estimates or assumptions in determining recoverable amounts for oil and gas properties. We had placed our audit emphasis on this matter.
Addressing the matter involved performing procedures and evaluating audit evidence in connection with forming our overall opinion on the consolidated financial statements. These procedures include obtaining an understanding of the management’s internal control and assessment process of impairment of oil and gas properties and evaluating and testing the key controls relating to the determination of recoverable amounts of oil and gas properties. These procedures also included, among others, for certain projects which management has decided not to further develop, corroborating evidence of future development plans and capital allocation decisions as well as assessing the appropriateness of the method used to determine recoverable amounts, including the methodology adopted in the discounted cash flow projections, testing mathematical accuracy of the projections, and the completeness, accuracy, and relevance of underlying data used in the projections.
 
F-4

Table of Contents
Evaluating the significant assumptions relating to the key assumptions in discounted cash flow projections will involve (i) comparing estimates of future crude oil prices adopted by the management against a range of published crude oil price forecasts, (ii) comparing the future cost profiles against historical costs or relevant budgets of the management or relevant external data, (iii) comparing the future production profiles against the oil and gas reserve estimation report approved by the management, evaluating the competence, capability and objectivity of the management’s experts engaged in estimating the oil and gas reserves, and assessing key estimations or assumptions used in the reserve estimation, by reference to historical data, management plans and/or relevant external data. Professionals with specialized skill and knowledge were used to assist in the evaluation of the appropriateness of discount rates adopted by the management.
 
 
/s/ PricewaterhouseCoopers Zhong Tian LLP
Shanghai, People’s Republic of China
April
29
, 2022
We have served as the Company’s auditor since 2021.
 
F-5

Table of Contents
PETROCHINA COMPANY LIMITED
CONSOLIDATED STATEMENTS OF COMPREHENSIVE INCOME
For the Years Ended December 31, 2021, 2020 and 2019
(Amounts in millions, except for the per share data)
 
    
Notes
    
2021
   
2020
   
2019
 
           
RMB
   
RMB
   
RMB
 
REVENUE
     6        2,614,349       1,933,836       2,516,810  


OPERATING EXPENSES
                                 
Purchases, services and other
              (1,770,019     (1,267,797     (1,697,834
Employee compensation costs
     8        (154,835     (147,604     (154,318
Exploration expenses, including exploratory dry holes
              (24,248     (19,333     (20,775
Depreciation, depletion and amortization
              (231,269     (213,875     (225,262
Selling, general and administrative expenses
              (57,802     (64,345     (68,596
Taxes other than income taxes
     9        (228,003     (195,850     (228,436
Other income, net
    
41
       12,980       50,905       173  


TOTAL OPERATING EXPENSES
              (2,453,196     (1,857,899     (2,395,048


PROFIT FROM OPERATIONS
              161,153       75,937       121,762  


FINANCE COSTS
                                 
Exchange gain
              13,377       14,387       10,017  
Exchange loss
              (12,839     (14,279     (10,016
Interest income
              2,984       3,023       3,631  
Interest expense
     10        (19,739     (26,528     (30,409


TOTAL NET FINANCE COSTS
              (16,217     (23,397     (26,777


SHARE OF PROFIT OF ASSOCIATES AND JOINT VENTURES
              13,267       3,533       8,229  


PROFIT BEFORE INCOME TAX EXPENSE
     7        158,203       56,073       103,214  
INCOME TAX EXPENSE
     12        (43,507     (22,588     (36,199


PROFIT FOR THE YEAR
              114,696       33,485       67,015  


OTHER COMPREHENSIVE INCOME
                                 
Item that will not be reclassified to profit or loss
                                 
Fair value changes in equity investment measured at fair value through other comprehensive income
              232       113       156  
Items that are or may be reclassified subsequently to profit or loss
                                 
Currency translation differences
              (4,729     (10,802     8,357  
Share of the other comprehensive income of associates and joint ventures accounted for using the equity method
              (4     (441     417  


OTHER COMPREHENSIVE INCOME, NET OF TAX
              (4,501     (11,130     8,930  


TOTAL COMPREHENSIVE INCOME FOR THE YEAR
              110,195       22,355       75,945  


PROFIT FOR THE YEAR ATTRIBUTABLE TO:
                                 
Owners of the Company
              92,170       19,006       45,682  
Non-controlling interests
              22,526       14,479       21,333  


                114,696       33,485       67,015  


TOTAL COMPREHENSIVE INCOME FOR THE YEAR ATTRIBUTABLE TO:
                                 
Owners of the Company
              89,561       14,634       50,323  
Non-controlling
interests
              20,634       7,721       25,622  


                110,195       22,355       75,945  


BASIC AND DILUTED EARNINGS PER SHARE ATTRIBUTABLE TO OWNERS OF THE COMPANY(RMB)
     13        0.50       0.10       0.25  


The accompanying notes are an integral part of these financial statements.
 
F-6

Table of Contents
PETROCHINA COMPANY LIMITED
CONSOLIDATED STATEMENTS OF FINANCIAL POSITION
As of December 31, 2021 and 2020
(Amounts in millions)
 
    
Notes
    
December 31,
2021
   
December 31,
2020
 
           
RMB
   
RMB
 
NON-CURRENT
ASSETS
                         
Property, plant and equipment
     15        1,459,296       1,452,091  
Investments in associates and joint ventures
     16        265,785       250,603  
Equity investments measured at fair value through other comprehensive income
     17        1,168       902  
Right-of-use
assets
    
19

       208,606       209,786  
Intangible and other
non-current
assets
    
20

       66,344       67,494  
Deferred tax assets
     3
2
       12,161       11,364  
Time deposits with maturities over one year
              8,064       9,119  


TOTAL
NON-CURRENT
ASSETS
              2,021,424       2,001,359  


CURRENT ASSETS
                         
Inventories
    
21

       143,848       128,539  
Accounts receivable
    
22

       56,659       52,325  
Prepayments and other current assets
    
23

       112,820       109,262  
Financial assets at fair value through other comprehensive income
    
24

       3,975       8,076  
Time deposits with maturities over three months but within one year
              26,747       27,319  
Cash and cash equivalents
     2
5
       136,789       118,631  
Assets held for sale
    
26

       —         42,615  


TOTAL CURRENT ASSETS
              480,838       486,767  


CURRENT LIABILITIES
                         
Accounts payable and accrued liabilities
     2
7
       303,002       316,140  
Contract liabilities
     2
8
       78,481       91,477  
Income taxes payable
              9,915       3,730  
Other taxes payable
              66,859       59,994  
Short-term borrowings
     2
9
       53,275       117,542  
Lease liabilities
    
19

       6,626       6,579  
Liabilities directly associated with the assets held for sale
    
26

       —         9,956  


TOTAL CURRENT LIABILITIES
              518,158       605,418  


NET CURRENT LIABILITIES
              (37,320     (118,651


TOTAL ASSETS LESS CURRENT LIABILITIES
              1,984,104       1,882,708  


EQUITY
                         
EQUITY ATTRIBUTABLE TO OWNERS OF THE COMPANY:
                         
Share capital
    
30
       183,021       183,021  
Retained earnings
              771,980       727,955  
Reserves
    
31
       308,560       304,182  


TOTAL EQUITY ATTRIBUTABLE TO OWNERS OF THE COMPANY
              1,263,561       1,215,158  
NON-CONTROLLING
INTERESTS
              145,308       151,463  


TOTAL EQUITY
              1,408,869       1,366,621  


NON-CURRENT LIABILITIES
                         
Long-term borrowings
    
29
       287,175       251,379  
Asset retirement obligations
    
33
       129,405       114,819  
Lease liabilities
    
19

       123,222       122,644  
Deferred tax liabilities
    
32
       26,638       16,380  
Other long-term obligations
              8,795       10,865  


TOTAL NON-CURRENT LIABILITIES
              575,235       516,087  


TOTAL EQUITY AND NON-CURRENT LIABILITIES
              1,984,104       1,882,708  


The accompanying notes are an integral part of these financial statements.
 
F-7

Table of Contents
PETROCHINA COMPANY LIMITED
CONSOLIDATED STATEMENTS OF CASH FLOWS
For the Years Ended December 31, 2021, 2020 and 2019
(Amounts in millions)
 
    
2021
   
2020
   
2019
 
    
RMB
   
RMB
   
RMB
 
CASH FLOWS FROM OPERATING ACTIVITIES
                        
Profit for the year
     114,696       33,485       67,015  
Adjustments for:
                        
Income tax expense
     43,507       22,588       36,199  
Depreciation, depletion and amortization
     231,269       213,875       225,262  
Capitalized exploratory costs charged to expense
     12,557       8,934       8,900  
Safety fund reserve
     (1,750     (1,505     (1,318
Share of profit of associates and joint ventures
     (13,267     (3,533     (8,229
Accrual/(reversal) of provision for impairment of receivables, net
     415       343       (1,367
Write down in inventories, net
     580       8,151       1,260  
Impairment of other
non-current
assets
     465       —         22  
Loss on disposal and scrap of property, plant and equipment
     18,959       5,398       9,809  
Loss/(gain) on disposal and scrap of other
non-current
assets
     587       (1,142     (501
Gain on disposal of subsidiaries
     (3,575     (1,242     (49
Gain on Pipeline restructuring
     (18,320     (46,946     —    
Dividend income
     (17     (25     (22
Interest income
     (2,984     (3,023     (3,631
Interest expense
     19,739       26,528       30,409  
Changes in working capital:
                        
Accounts receivable, prepayments and other current assets
     (8,265     14,751       (5,017
Inventories
     (15,889     43,645       (5,624
Accounts payable and accrued liabilities
     2,251       8,410       27,416  
Contract liabilities
     (12,996     8,987       14,346  


CASH FLOWS GENERATED FROM OPERATIONS
     367,962       337,679       394,880  
Income taxes paid
     (26,493     (19,104     (35,270


NET CASH FLOWS FROM OPERATING ACTIVITIES
     341,469       318,575       359,610  


The accompanying notes are an integral part of these financial statements.
 
F-8

Table of Contents
PETROCHINA COMPANY LIMITED
CONSOLIDATED STATEMENTS OF CASH FLOWS — (Continued)
For the Years Ended December 31, 2021, 2020 and 2019
(Amounts in millions)
 
    
2021
   
2020
   
2019
 
    
RMB
   
RMB
   
RMB
 
CASH FLOWS FROM INVESTING ACTIVITIES
                        
Capital expenditures
     (261,617     (248,376     (319,686
Acquisition of investments in associates and joint ventures
     (387     (2,599     (4,326
Prepayments on long-term leases
     —         (3,048     (3,820
Acquisition of intangible assets and other
non-current
assets
     (3,946     (5,303     (3,256
Acquisition of subsidiaries
     (1,822     (1,947     (183
Proceeds from disposal of property, plant and equipment
     2,746       1,195       1,830  
Proceeds from disposal of other
non-current
assets
     4,183       2,224       507  
Proceeds from Pipeline restructuring
     31,074       80,621       —    
Interest received
     2,836       2,532       2,860  
Dividends received
     12,274       4,778       4,865  
Decrease/(increase) in time deposits with maturities over three months
     1,627       (12,063     (11,739


NET CASH FLOWS USED FOR INVESTING ACTIVITIES
     (213,032     (181,986     (332,948


CASH FLOWS FROM FINANCING ACTIVITIES
                        
Repayments of short-term borrowings
     (758,307     (797,892     (614,525
Increase in short-term borrowings
     681,258       751,157       634,896  
Repayments of long-term borrowings
     (78,127     (219,770     (171,226
Increase in long-term borrowings
     128,834       238,335       201,562  
Repayments of lease liabilities
     (13,016     (12,794     (17,623
Interest paid
     (12,821     (16,700     (16,830
Dividends paid to
non-controlling
interests
     (16,508     (14,264     (14,245
Dividends paid to owners of the Company
     (39,866     (28,078     (30,684
Cash paid to acquire
non-controlling
interests
     (22     (2     (1,059
Cash contribution from
non-controlling
interests
     673       613       2,640  
Capital reduction in subsidiaries paid to
non-controlling
interests
     (69     (5     (182


NET CASH FLOWS USED FOR FINANCING ACTIVITIES
     (107,971     (99,400     (27,276


TRANSLATION OF FOREIGN CURRENCY
     (2,308     (4,967     1,069  


Increase in cash and cash equivalents
     18,158       32,222       455  
Cash and cash equivalents at beginning of the year
     118,631       86,409       85,954  


Cash and cash equivalents at end of the year
     136,789       118,631       86,409  


The accompanying notes are an integral part of these financial statements.
 
F-9

Table of Contents
PETROCHINA COMPANY LIMITED
CONSOLIDATED STATEMENTS OF CHANGES IN EQUITY
For the Years Ended December 31, 2021, 2020 and 2019
(Amounts in millions)
 
   
Attributable to owners of the Company
   
Non-

controlling
Interests
   
Total
Equity
 
   
Share

Capital
   
Retained

Earnings
   
Reserves
   
Subtotal
             
   
RMB
   
RMB
   
RMB
   
RMB
   
RMB
   
RMB
 
Balance at January 1, 2019 

    183,021       731,163       299,599       1,213,783       195,108       1,408,891  
Profit for the year ended December 31, 2019
    —         45,682       —         45,682       21,333       67,015  
Other comprehensive income for the year ended December 31, 2019
    —         —         4,641       4,641       4,289       8,930  
Special reserve-safety fund reserve
    —         —         (1,388     (1,388     70       (1,318
Transfer to reserves
    —         (3,037     3,037       —         —         —    
Dividends
    —         (30,684     —         (30,684     (14,279     (44,963
Transaction with
non-controlling
interests in subsidiaries
    —         —         (2,007     (2,007     938       (1,069
Capital contribution from
non-controlling
interests
    —         —         120       120       6,647       6,767  
Disposal of subsidiaries
    —         —         —         —         (50     (50
Other
    —         —         9       9       93       102  


Balance at December 31, 2019
    183,021       743,124       304,011       1,230,156       214,149       1,444,305  


Balance at January 1, 2020
    183,021       743,124       304,011       1,230,156       214,149       1,444,305  
Profit for the year ended December 31, 2020
    —         19,006       —         19,006       14,479       33,485  
Other comprehensive income for the year ended December 31, 2020
    —         —         (4,372     (4,372     (6,758     (11,130
Special reserve-safety fund reserve
    —         —         (1,633     (1,633     128       (1,505
Transfer to reserves
    —         (6,275     6,275       —         —         —    
Dividends
    —         (28,078     —         (28,078     (14,827     (42,905
Transaction with
non-controlling
interests in subsidiaries
    —         —         —         —         (2     (2
Capital contribution from
non-controlling
interests
    —         —         2       2       823       825  
Pipeline restructuring
    —         —         —         —         (57,425     (57,425
Acquisition of subsidiaries
    —         —         1       1       1,186       1,187  
Disposal of subsidiaries
    —         —         —         —         (489     (489
Other
    —         178       (102     76       199       275  


Balance at December 31, 2020
    183,021       727,955       304,182       1,215,158       151,463       1,366,621  


Balance at January 1, 2021
    183,021       727,955       304,182       1,215,158       151,463       1,366,621  


Profit for the year ended December 31, 2021
    —         92,170       —         92,170       22,526       114,696  
Other comprehensive income for the year ended December 31, 2021
    —         —         (2,609     (2,609     (1,892     (4,501
Special reserve-safety fund reserve
    —         —         (1,579     (1,579     (171     (1,750
Transfer to reserves
    —         (8,413     8,413       —         —         —    
Dividends
    —         (39,866     —         (39,866     (15,975     (55,841
Transaction with
non-controlling
interests in subsidiaries
    —         —         (15     (15     (19     (34
Capital contribution from
non-controlling
interests
    —         —         —         —         1,059       1,059  
Acquisition of subsidiaries
    —         —         —         —         769       769  
Disposal of subsidiaries
    —         —         —         —         (12,380     (12,380
Other
    —         134       168       302       (72     230  


Balance at December 31, 2021
    183,021       771,980       308,560       1,263,561       145,308       1,408,869  


The accompanying notes are an integral part of these financial statements.
 
F-10

Table of Contents
PETROCHINA COMPANY LIMITED
NOTES TO THE FINANCIAL STATEMENTS
(All amounts in millions, except for the per share data and otherwise stated)
 
1
ORGANIZATION AND PRINCIPAL ACTIVITIES
PetroChina Company Limited (the “Company”) was established as a joint stock company with limited liability on November 5, 1999 by
中国石油
天然气集团公司
(China National Petroleum Corporation (“CNPC”)) as the sole proprietor in accordance with the approval Guo Jing Mao Qi Gai [1999] No. 1024 “Reply on the approval of the establishment of PetroChina Company Limited” from the former State Economic and Trade Commission of the People’s Republic of China (“China” or “PRC”). CNPC restructured (“the Restructuring”) and injected its core business and the related assets and liabilities into the Company.
中国石油天然气集团公司
was renamed
中国石油天然气集团有限公司
(CNPC before and after the change of name) on December 19, 2017. CNPC is a wholly state-owned company registered in China. The Company and its subsidiaries are collectively referred to as the “Group”.
The Group is principally engaged in (i) the exploration, development, transportation and production and marketing of crude oil and natural gas; (ii) the refining of crude oil and petroleum products, production and marketing of primary petrochemical products, derivative petrochemical products and other chemical products; (iii) the marketing of refined products and non-oil products, and trading business; and (iv) the transportation and the sale of natural gas (Note 3
9
).
 
2
BASIS OF PREPARATION
The consolidated financial statements of the Group have been prepared in accordance with the International Financial Reporting Standards (“IFRSs”) as issued by the International Accounting Standards Board (“IASB”). These financial statements also comply with the disclosure requirements of the Hong Kong Companies Ordinance and the applicable disclosure provisions of the Rules Governing the Listing of Securities on The Stock Exchange of Hong Kong Limited. A number of new or amended standards became applicable for the current reporting period. The Group did not have to change its accounting policies or make retrospective adjustments as a result of adopting these new or amended standards. The consolidated financial statements and the statement of financial position of the Company have been prepared under the historical cost convention except as disclosed in the accounting policies below.
The preparation of financial statements in conformity with IFRSs requires the use of estimates and assumptions that affect the reported amounts of assets and liabilities and disclosure of contingent assets and liabilities at the date of the statement of financial position and the reported amounts of revenues and expenses during the reporting period. Although these estimates are based on management’s best knowledge of current events and actions, actual results may ultimately differ from those estimates. The areas involving a higher degree of judgement or complexity, or areas where assumptions and estimates are significant to the consolidated financial statements are disclosed in Note 5.
(a) New and amended standards and interpretations adopted by the Group
On August 27, 2020, the IASB published amendments to IFRS 9, IAS 39, IFRS 7, IFRS 4 and IFRS
16-Interest
rate benchmark (IBOR) reform-Phase 2. These amendments should be applied for annual periods beginning on or after January 1, 2021, which have no material impact on the Group for the December 31, 2021 reporting period.
(b) New and amended standards and interpretations not yet adopted by the Group
Certain new accounting standards, amendments to accounting standards and interpretations have been published that are not mandatory for the December 31, 2021 reporting period and have not been early adopted by the Group. These standards, amendments or interpretations are not expected to have a material impact on the Group in the current or future reporting periods and on foreseeable future transactions.
 
F-11

Table of Contents
PETROCHINA COMPANY LIMITED
NOTES TO THE FINANCIAL STATEMENTS — (Continued)
(All amounts in millions, except for the per share data and otherwise stated)
 
3
SUMMARY OF PRINCIPAL ACCOUNTING POLICIES
(a) Basis of consolidation
Subsidiaries are entities controlled by the Group. The Group controls an entity when it is exposed to, or has right to, variable returns from its involvement with the entity and has the ability to affect those returns through its power over the entity.
A subsidiary is consolidated from the date on which control is transferred to the Group and is no longer consolidated from the date that control ceases. The Group accounts for business combinations (except for business combination under common control) using the acquisition method when the acquired set of activities and assets meets the definition of a business and control is transferred to the Group. In determining whether a particular set of activities and assets is a business, the Group assesses whether the set of assets and activities acquired includes, at a minimum, an input and substantive process and whether the acquired set has the ability to produce outputs. The Group has an option to apply a ‘concentration test’ that permits a simplified assessment of whether an acquired set of activities and assets is not a business. The optional concentration test is met if substantially all of the fair value of the gross assets acquired is concentrated in a single identifiable asset or group of similar identifiable assets. The consideration transferred for the acquisition of a subsidiary is the fair values of the assets transferred, the liabilities incurred and the equity interests issued by the Group. The consideration transferred includes the fair value of any asset or liability resulting from a contingent consideration arrangement. Acquisition-related costs are expensed as incurred. Identifiable assets acquired and liabilities assumed in a business combination are measured initially at their fair values at the acquisition date. Contingent liabilities assumed in a business combination are recognized in the acquisition accounting if they are present obligations and their fair value can be measured reliably. On an
acquisition-by-acquisition
basis, the Group recognizes any
non-controlling
interests in the acquiree either at fair value or at the
non-controlling
interests’ proportionate share of the acquiree’s net assets.
The excess of the consideration transferred, the amount of any
non-controlling
interests in the acquiree and the acquisition-date fair value of any previous equity interest in the acquiree over the fair value of the identifiable net assets is recorded as goodwill. If this is less than the fair value of the net assets of the subsidiary acquired in the case of a bargain purchase, the difference is recognized directly in the consolidated statement of comprehensive income.
An acquisition of a business which is a business combination under common control is accounted for in a manner similar to a uniting of interests whereby the assets and liabilities acquired are accounted for at carryover predecessor values to the other party to the business combination with all periods presented as if the operations of the Group and the business acquired have always been combined. The difference between the consideration paid by the Group and the net assets or liabilities of the business acquired is adjusted against equity.
Intercompany transactions, balances and unrealized gains on transactions between group companies are eliminated. Unrealized losses are eliminated in the same way as unrealized gains, but only to the extent that there is no evidence of impairment. Where necessary, accounting policies of subsidiaries have been changed to ensure consistency with the policies adopted by the Group.
For purpose of the presentation of the Company’s statement of financial position, investments in subsidiaries are accounted for at cost less impairment.
A listing of the Group’s principal subsidiaries is set out in Note 18.
 
F-12

Table of Contents
PETROCHINA COMPANY LIMITED
NOTES TO THE FINANCIAL STATEMENTS — (Continued)
(All amounts in millions, except for the per share data and otherwise stated)
 
(b) Investments in associates
Associates are entities over which the Group has significant influence but not control, generally accompanying a shareholding of between 20% and 50% of the voting rights. Investments in associates are accounted for by the equity method of accounting in the consolidated financial statements of the Group and are initially recognized at cost.
Under this method of accounting, the Group’s share of the post-acquisition profits or losses of associates is recognized in profit or loss and its share of post-acquisition movements in other comprehensive income is recognized in other comprehensive income. The cumulative post-acquisition movements are adjusted against the carrying amounts of the investments. When the Group’s share of losses in an associate equals or exceeds its interest in the associate, including any other unsecured receivables, the Group does not recognize further losses, unless it has incurred obligations or made payments on behalf of the associate.
Unrealized gains on transactions between the Group and its associates are eliminated to the extent of the Group’s interest in the associates; unrealized losses are also eliminated unless the transaction provides evidence of an impairment of the asset transferred. The Group’s investment in associates includes goodwill identified on acquisition, net of any accumulated impairment loss and is tested for impairment as part of the overall balance. Goodwill represents the excess of the cost of an acquisition over the fair value of the Group’s share of the fair value of net identifiable assets of the acquired associate at the date of acquisition. Accounting policies of associates have been changed where necessary to ensure consistency with the policies adopted by the Group. The gain or loss resulting from a downstream transaction involving assets that constitute a business, as defined in IFRS 3, between the Group and its associate or joint veture is recognized in full in the consolidated financial statement.
A listing of the Group’s principal associates is shown in Note 16.
(c) Investments in joint ventures
Joint ventures are arrangements in which the Group with one or more parties have joint control, whereby the Group has rights to the net assets of the arrangements, rather than rights to their assets and obligations for their liabilities. The Group’s interests in joint ventures are accounted for by the equity method of accounting (Note 3(b)) in the consolidated financial statements.
A listing of the Group’s principal joint ventures is shown in Note 1
6
.
(d) Transactions with
non-controlling
interests
Transactions with
non-controlling
interests are treated as transactions with owners in their capacity as owners of the Group. Gains and losses resulting from disposals to
non-controlling
interests are recorded in equity. The differences between any consideration paid and the relevant share of the carrying value of net assets of the subsidiary acquired resulting from the purchase of
non-controlling
interests, are recorded in equity.
When the Group ceases to have control or significant influence, any retained interest in the entity is remeasured to its fair value, with the change in carrying amount recognized in profit or loss. The fair value is the initial carrying amount for the purposes of subsequently accounting for the retained interest as an associate, joint venture or financial asset. In addition, any amounts previously recognized in other comprehensive income in respect of that entity are accounted for as if the Group had directly disposed of the related assets or liabilities. The amounts previously recognized in other comprehensive income are reclassified to profit or loss.
 
F-13

Table of Contents
PETROCHINA COMPANY LIMITED
NOTES TO THE FINANCIAL STATEMENTS — (Continued)
(All amounts in millions, except for the per share data and otherwise stated)
 
If the ownership interest in an associate is reduced but significant influence is retained, only a proportionate share of the amounts previously recognized in other comprehensive income are reclassified to profit or loss where appropriate.
(e) Foreign currencies
Items included in the financial statements of each entity in the Group are measured using the currency of the primary economic environment in which the entity operates (“the functional currency”). Most assets and operations of the Group are located in the PRC (Note 3
9
), and the functional currency of the Company and most of the consolidated subsidiaries is the Renminbi (“RMB”). The consolidated financial statements are presented in the presentation currency of RMB.
Foreign currency transactions of the Group are accounted for at the exchange rates prevailing at the respective dates of the transactions; monetary assets and liabilities denominated in foreign currencies are translated at exchange rates at the date of the statement of financial position; gains and losses resulting from the settlement of such transactions and from the translation of monetary assets and liabilities are recognized in profit or loss.
For the Group entities that have a functional currency different from the Group’s presentation currency, assets and liabilities for each statement of financial position presented are translated at the closing rate at the date of the statement of financial position. Income and expenses for each statement of comprehensive income presented are translated at the average exchange rates for each period and the resulting exchange differences are recognized in other comprehensive income.
(f) Discontinued operation
A discontinued operation is a component of the Group’s business, the operation and cash flows of which can be clearly distinguished from the rest of the Group and which:
- represents a separate major line of business of geographic area of operations;
- is part of a single
co-ordinated
plan to dispose of a separate major line of business or geographic area of operations; or
- is a subsidiary acquired exclusively with a view to resale.
Classification as a discontinued operation occurs at the earlier of disposal or when the operation meets the criteria to be classified as
held-for-sale.
When an operation is classified as a discontinued operation, the comprehensive statement of profit or loss and other comprehensive income (“OCI”) is
re-presented
as if the operation had been discontinued from the start of the comparative year.
(g) Property, plant and equipment
Property, plant and equipment, including oil and gas properties (Note 3(h)), are initially recorded in the consolidated statement of financial position at cost if it is probable that they will generate future economic benefits. Cost represents the purchase price of the asset and other costs incurred to bring the asset into intended use. Subsequent to their initial recognition, property, plant and equipment are carried at cost less accumulated depreciation, depletion and amortization (including any impairment).
 
F-14

Table of Contents
PETROCHINA COMPANY LIMITED
NOTES TO THE FINANCIAL STATEMENTS — (Continued)
(All amounts in millions, except for the per share data and otherwise stated)
 
Depreciation, to write off the cost of each asset, other than oil and gas properties (Note 3(h)), to their residual values over their estimated useful lives is calculated using the straight-line method.
The Group uses the following estimated useful lives, estimated residual value ratios and annual depreciation rates for depreciation purposes:
 
    
Estimated useful lives
    
Estimated residual
value ratio %
    
Annual depreciation
rate %
 
Buildings
     8 to 40 years        5        2.4 to 11.9  
Equipment and Machinery
     4 to 30 years        3 to 5        3.2 to 24.3  
Motor Vehicles
     4 to 14 years        5        6.8 to 23.8  
Other
     5 to 12 years        5        7.9 to 19.0  
No depreciation is provided on construction in progress until the assets are completed and ready for use.
The assets’ residual values and useful lives are reviewed, and adjusted if appropriate, at the end of each reporting period.
Property, plant and equipment, including oil and gas properties (Note 3(h)) and
right-of-use
assets (Note 3(m)), are reviewed for possible impairment when events or changes in circumstances indicate that the carrying amount may not be recoverable. An impairment loss is recognized for the amount by which the carrying amount of a cash-generating unit exceeds the higher of its fair value less costs to sell and its value in use. Value in use is the estimated net present value of future cash flows to be derived from the cash-generating unit.
Gains and losses on disposals of property, plant and equipment are determined by reference to their carrying amounts and are recorded in profit or loss.
Interest and other costs on borrowings to finance the construction of property, plant and equipment, including oil and gas properties (Note 3(h)), are capitalized during the period of time that is required to complete and prepare the asset for its intended use. Costs for repairs and maintenance activities are expensed as incurred except for costs of components that result in improvements or betterments which are capitalized as part of property, plant and equipment and depreciated over their useful lives.
(h) Oil and gas properties
The successful efforts method of accounting is used for oil and gas exploration and production activities. Under this method, all costs for development wells, support equipment and facilities, and proved mineral interests in oil and gas properties are capitalized. Geological and geophysical costs are expensed when incurred. Costs of exploratory wells are capitalized pending determination of whether the wells find proved oil and gas reserves. Proved oil and gas reserves are the estimated quantities of crude oil and natural gas, which, by analysis of geoscience and engineering data, can be estimated with reasonable certainty to be economically producible from a given date forward, from known reservoirs, and under existing economic conditions, operating methods, and government regulation before the time at which contracts providing the right to operate expire, unless evidence indicates that renewal is reasonably certain, regardless of whether the estimate is a deterministic estimate or probabilistic estimate. Existing economic conditions include prices and costs at which economic producibility from a reservoir is to be determined. The price shall be the average price during the
12-month
period before the ending date of the period covered by the proved oil and gas reserve report, determined as an unweighted arithmetic average of the
first-day-of-the-month
price for each month within such period unless prices are defined by contractual arrangements, excluding escalations based upon future conditions. The costs shall be that prevailing at the end of the period. 

F-15

Table of Contents
PETROCHINA COMPANY LIMITED
NOTES TO THE FINANCIAL STATEMENTS — (Continued)
(All amounts in millions, except for the per share data and otherwise stated)
 
Exploratory wells in areas not requiring major capital expenditures are evaluated for economic viability within one year of completion of drilling. The related well costs are expensed as dry holes if it is determined that such economic viability is not attained. Otherwise, the related well costs are reclassified to oil and gas properties and are subject to impairment review (Note 3(g)). For exploratory wells that are found to have economically viable reserves in areas where major capital expenditure will be required before production can commence, the related well costs remain capitalized only if additional drilling is underway or firmly planned. Otherwise the related well costs are expensed as dry holes. The Group does not have any significant costs of unproved properties capitalized in oil and gas properties.
The Ministry of Natural Resources in China issues production licenses to applicants on the basis of the reserve reports approved by relevant authorities.
The cost of oil and gas properties is amortized at the field level based on the units of production method. Units of production rates are based on oil and gas reserves estimated to be recoverable from existing facilities based on the current terms of the Group’s production licenses.
(i) Intangible assets and goodwill
Expenditures on acquired patents, trademarks, technical
know-how
and licenses are capitalized at historical cost and amortized using the straight-line method over their estimated useful lives. Intangible assets are not subsequently revalued. The carrying amount of each intangible asset is reviewed and adjusted for impairment whenever events or changes in circumstances indicate that the carrying amount may not be recoverable. An impairment loss is recognized whenever the carrying amount of an intangible asset exceeds its recoverable amount and is recognized in profit or loss. The recoverable amount is measured as the higher of fair value less costs to sell and value in use. Value in use is the estimated net present value of future cash flows to be derived from the asset.
Goodwill arises on the acquisition of subsidiaries and represents the excess of the consideration transferred over the net fair value of identifiable assets, liabilities and contingent liabilities of the acquiree and the amount of any
non-controlling
interests in the acquiree.
Goodwill impairment reviews are undertaken annually or more frequently if events or changes in circumstances indicate a potential impairment. An impairment loss is recognized if the carrying amount of the cash-generating unit containing goodwill exceeds its recoverable amount. Impairment losses are allocated first to reduce the carrying amount of any goodwill allocated to the cash-generating unit, and then to reduce the carrying amounts of the other assets in the cash-generating unit on a pro rata basis. Any impairment is recognized immediately as an expense and is not subsequently reversed.
(j) Assets held for sale
Non-current
assets, or disposal groups comprising assets and liabilities, are classified as
held-for-sale
if it is highly probable that they will be recovered primarily through sale rather than through continuing use.
Such assets, or disposal groups, are generally measured at the lower of their carrying amount and fair value less costs to sell. Any impairment loss on a disposal group is allocated first to goodwill, and then to the remaining assets and liabilities on a pro rata basis, except that no loss is allocated to inventories, financial assets, deferred tax assets, employee benefit assets, investment property or biological assets, which continue to be measured in accordance with the Group’s other accounting policies. Impairment losses on initial classification as
held-for-sale
and subsequent gains and losses on remeasurement are recognized in profit or loss.

F-16

Table of Contents
PETROCHINA COMPANY LIMITED
NOTES TO THE FINANCIAL STATEMENTS — (Continued)
(All amounts in millions, except for the per share data and otherwise stated)
 
Once classified as
held-for-sale,
intangible assets and property, plant and equipment are no longer amortized or depreciated, and any equity-accounted investee is no longer equity accounted.
(k) Financial instruments
(a) Recognition and initial measurement
Accounts receivable and debt securities issued are initially recognized when they are originated. All other financial assets and financial liabilities are initially recognized when the Group becomes a party to the contractual provisions of the instrument.
A financial asset (unless it is an accounts receivable without a significant financing component) or financial liability is initially measured at fair value plus, for an item not at Fair value through profit or loss (“FVTPL”), transaction costs that are directly attributable to its acquisition or issue. An accounts receivable without a significant financing component is initially measured at the transaction price.
(b) Classification and subsequent measurement
On initial recognition, a financial asset is classified as measured at: amortized cost; Fair value through other comprehensive income (“FVOCI”) – debt investment; FVOCI – equity investment; or FVTPL.
Financial assets are not reclassified subsequent to their initial recognition unless the Group changes its business model for managing financial assets, in which case all affected financial assets are reclassified on the first day of the first reporting period following the change in the
 
business model.
A financial asset is measured at amortized cost if it meets both of the following conditions and is not designated as at FVTPL:
–it is held within a business model whose objective is to hold assets to collect contractual cashflows; and
–its contractual terms give rise on specified dates to cash flows that are solely payments of principal and interest on the principal amount outstanding.
A debt investment is measured at FVOCI if it meets both of the following conditions and is not designated as at FVTPL:
–it is held within a business model whose objective is achieved by both collecting contractual cash flows and selling financial assets; and
–its contractual terms give rise on specified dates to cash flows that are solely payments of principal and interest on the principal amount outstanding.
On initial recognition of an equity investment that is not held for trading, the Group may irrevocably elect to present subsequent changes in the investment’s fair value in OCI. This election is made on an
investment-by-investment
basis.
All financial assets not classified as measured at amortized cost or FVOCI as described above are measured at FVTPL. This includes all derivative financial assets.

F-17

Table of Contents
PETROCHINA COMPANY LIMITED
NOTES TO THE FINANCIAL STATEMENTS — (Continued)
(All amounts in millions, except for the per share data and otherwise stated)
 
The Group makes an assessment of the objective of the business model in which a financial asset is held at a portfolio level because this best reflects the way the business is managed and information is provided to management.
For the purposes of this assessment whether contractual cash flows are solely payments of principal and interest, “principal” is defined as the fair value of the financial asset on initial recognition. “Interest” is defined as consideration for the time value of money and for the credit risk associated with the principal amount outstanding during a particular period of time and for other basic lending risks and costs (e.g. liquidity risk and administrative costs), as well as a profit margin.
In assessing whether the contractual cash flows are solely payments of principal and interest, the Group considers the contractual terms of the instrument. This includes assessing whether the financial asset contains a contractual term that could change the timing or amount of contractual cash flows such that it would not meet this condition.
Detailed accounting policies for subsequent measurement of financial assets are set out below:
 
Financial assets at FVTPL
  These assets are subsequently measured at fair value. Net gains and losses, including any interest or dividend income, are recognized in profit or loss.
   
Financial assets at amortized cost
  These assets are subsequently measured at amortized cost using the effective interest method. The amortized cost is reduced by impairment losses. Interest income, foreign exchange gains and losses and impairment are recognized in profit or loss. Any gain or loss on derecognition is recognized in profit or loss.
   
Debt investments at FVOCI
  These assets are subsequently measured at fair value. Interest income calculated using the effective interest method, foreign exchange gains and losses and impairment are recognized in profit or loss. Other net gains and losses are recognized in OCI. On derecognition, gains and losses accumulated in OCI are reclassified to profit or loss.
   
Equity investments at FVOCI
  These assets are subsequently measured at fair value. Dividends are recognized as income in profit or loss unless the dividend clearly represents a recovery of part of the cost of the investment. Other net gains and losses are recognized in OCI and are never reclassified to profit or loss.
(c) Derecognition
Financial assets
The Group derecognizes a financial asset when the contractual rights to the cash flows from the financial asset expire, or it transfers the rights to receive the contractual cash flows in a transaction in which substantially all of the risks and rewards of ownership of the financial asset are transferred or in which the Group neither transfers nor retains substantially all of the risks and rewards of ownership and it does not retain control of the financial asset.
The Group enters into transactions whereby it transfers assets recognized in its consolidated statement of financial position, but retains either all or substantially all of the risks and rewards of the transferred assets. In these cases, the transferred assets are not derecognized. 

F-18

Table of Contents
PETROCHINA COMPANY LIMITED
NOTES TO THE FINANCIAL STATEMENTS — (Continued)
(All amounts in millions, except for the per share data and otherwise stated)
 
Financial liabilities
The Group derecognizes a financial liability when its contractual obligations are discharged or cancelled, or expire. The Group also derecognizes a financial liability when its terms are modified and the cash flows of the modified liability are substantially different, in which case a new financial liability based on the modified terms is recognized at fair value.
On derecognition of a financial liability, the difference between the carrying amount extinguished and the consideration paid (including any
non-cash
assets transferred or liabilities assumed) is recognized in profit or loss.
(d) Offsetting
Financial assets and financial liabilities are offset and the net amount presented in the consolidated statement of financial position when, and only when, the Group currently has a legally enforceable right to set off the amounts and it intends either to settle them on a net basis or to realize the asset and settle the liability simultaneously.
(l) Impairment for financial assets
The Group recognizes loss allowances for expected credit losses (“ECLs”) on:
 
 
financial assets measured at amortized cost;
 
 
debt investments measured at FVOCI; and
 
 
contract assets.
The Group measures loss allowances at an amount equal to lifetime ECLs, except for the financial assets for which credit risk (i.e. the risk of default occurring over the expected life of the financial instrument) has not increased significantly since initial recognition, which are measured as
12-month
ECLs. When determining whether the credit risk of a financial asset has increased significantly since initial recognition and when estimating ECLs, the Group considers reasonable and supportable information that is relevant and available without undue cost or effort.
Loss allowances for accounts receivable are always measured at an amount equal to lifetime ECLs. The maximum period considered when estimating ECLs is the maximum contractual period over which the Group is exposed to credit risk.
ECLs are a probability-weighted estimate of credit losses. Credit losses are measured as the present value of all cash shortfalls (i.e. the difference between the cash flows due to the Group in accordance with the contract and the cash flows that the Group expects to receive). ECLs are discounted at the effective interest rate of the financial asset.
At each reporting date, the Group assesses whether financial assets carried at amortized cost and debt securities at FVOCI are credit-impaired. A financial asset is ‘credit-impaired’ when one or more events that have a detrimental impact on the estimated future cash flows of the financial asset have occurred.
Loss allowances for financial assets measured at amortized cost are deducted from the gross carrying amount of the assets. Impairment losses on trade and other receivables are presented under ‘Selling, general and administrative expenses’, similar to the presentation under IAS 39. 

F-19

Table of Contents
PETROCHINA COMPANY LIMITED
NOTES TO THE FINANCIAL STATEMENTS — (Continued)
(All amounts in millions, except for the per share data and otherwise stated)
 
The gross carrying amount of a financial asset is written off when the Group has no reasonable expectations of recovering a financial asset in its entirety or a portion thereof. For customers, the Group individually makes an assessment with respect to the timing and amount of
write-off
based on whether there is a reasonable expectation of recovery. The Group expects no significant recovery from the amount written off. However, financial assets that are written off could still be subject to enforcement activities in order to comply with the Group’s procedures for recovery of amounts due.
(m) Leases
(a) As a lessee
At commencement or on modification of a contract that contains a lease component, the Group allocates the consideration in the contract to each lease component on the basis of its relative stand-alone prices.
The Group recognizes a
right-of-use
asset and a lease liability at the lease commencement date. The
right-of-use
asset is initially measured at cost, which comprises the initial amount of the lease liability adjusted for any lease payments made at or before the commencement date, plus any initial direct costs incurred and an estimate of costs to dismantle and remove the underlying asset or to restore the underlying asset or the site on which it is located, less any lease incentives received.
The
right-of-use
asset is subsequently depreciated using the straight-line method from the commencement date to the end of the lease term, unless the lease transfers ownership of the underlying asset to the Group by the end of the lease term or the cost of the
right-of-use
asset reflects that the Group will exercise a purchase option. In that case the
right-of-use
asset will be depreciated over the useful life of the underlying asset, which is determined on the same basis as those of property and equipment. In addition, the
right-of-use
asset is periodically reduced by impairment losses, if any, and adjusted for certain remeasurements of the lease liability.
The lease liability is initially measured at the present value of the lease payments that are not paid at the commencement date, discounted using the interest rate implicit in the lease or, if that rate cannot be readily determined, the Group’s incremental borrowing rate. Generally, the Group uses its incremental borrowing rate as the discount rate.
Lease payments included in the measurement of the lease liability comprise the following:
 
 
fixed payments, including
in-substance
fixed payments;
 
 
variable lease payments that depend on an index or a rate, initially measured using the index or rate as at the commencement date;
 
 
amounts expected to be payable under a residual value guarantee; and
 
 
the exercise price under a purchase option that the Group is reasonably certain to exercise, lease payments in an optional renewal period if the Group is reasonably certain to exercise an extension option, and penalties for early termination of a lease unless the Group is reasonably certain not to terminate early.
The lease liability is measured at amortized cost using the effective interest method. It is remeasured when there is a change in future lease payments arising from a change in an index or rate, if there is a change in the Group’s estimate of the amount expected to be payable under a residual value guarantee, if the Group changes its assessment of whether it will exercise a purchase, extension or termination option or if there is a revised
in-substance
fixed lease payment. 

F-20

Table of Contents
PETROCHINA COMPANY LIMITED
NOTES TO THE FINANCIAL STATEMENTS — (Continued)
(All amounts in millions, except for the per share data and otherwise stated)
 
When the lease liability is remeasured in this way, a corresponding adjustment is made to the carrying amount of the
right-of-use
asset, or is recorded in profit or loss if the carrying amount of the
right-of-use
asset has been reduced to zero.
The Group present
right-of-use
assets and lease liabilities separately in the statement of financial position.
The Group has elected not to recognize
right-of-use
assets and lease liabilities for leases of
low-value
assets and short-term leases. The Group recognizes the lease payments associated with these leases as an expense on a straight-line basis over the lease term.
Payments made to the Ministry of Natural Resources to secure land use rights (excluding mineral properties) are treated as leases.
(b) As a lessor
At inception or on modification of a contract that contains a lease component, the Group allocates the consideration in the contract to each lease component on the basis of their relative stand-alone prices.
When the Group acts as a lessor, it determines at lease inception whether each lease is a finance lease or an operating lease.
To classify each lease, the Group makes an overall assessment of whether the lease transfers substantially all of the risks and rewards incidental to ownership of the underlying asset. If this is the case, then the lease is a finance lease; if not, then it is an operating lease. As part of this assessment, the Group considers certain indicators such as whether the lease is for the major part of the economic life of the asset. There are no significant finance lease for the Group.
If an arrangement contains lease and
non-lease
components, then the Group applies IFRS 15 to allocate the consideration in the contract.
The Group recognizes lease payments received under operating leases as income on a straight-line basis over the lease term as part of “other revenue”.
(n) Inventories
Inventories include oil products, chemical products and crude oil and other raw materials and supplies which are stated at the lower of cost and net realizable value. Cost is primarily determined by the weighted average cost method. The cost of finished goods comprises raw materials, direct labor, other direct costs and related production overheads, but excludes borrowing costs. Net realizable value is the estimated selling price in the ordinary course of business, less the cost of completion and directly attributable marketing and distribution costs.
(o) Contract costs
Contract costs are either the incremental costs of obtaining a contract with a customer or the costs to fulfil a contract with a customer which are not capitalized as inventory (Note 3(n)), property, plant and equipment (Note 3(g)), oil and gas properties (Note 3(h)) or intangible assets (Note 3(i)).

F-21

Table of Contents
PETROCHINA COMPANY LIMITED
NOTES TO THE FINANCIAL STATEMENTS — (Continued)
(All amounts in millions, except for the per share data and otherwise stated)
 
Incremental costs of obtaining a contract are those costs that the Group incurs to obtain a contract with a customer that it would not have incurred if the contract had not been obtained. Incremental costs of obtaining a contract are capitalized when incurred if the costs relate to revenue which will be recognized in a future reporting period and the costs are expected to be recovered, unless the expected amortization period is one year or less from the date of initial recognition of the asset, in which case the costs are expensed when incurred. Other costs of obtaining a contract are expensed when incurred.
Costs to fulfil a contract are capitalized if the costs relate directly to an existing contract or to a specifically identifiable anticipated contract; generate or enhance resources that will be used to provide goods or services in the future; and are expected to be recovered.
Capitalized contract costs are stated at cost less accumulated amortization and impairment losses. Impairment losses are recognized to the extent that the carrying amount of the contract cost asset exceeds the net of (i) remaining amount of consideration that the Group expects to receive in exchange for the goods or services to which the asset relates, less (ii) any costs that relate directly to providing those goods or services that have not yet been recognized as expenses.
Amortization of capitalized contract costs is charged to profit or loss when the revenue to which the asset relates is recognized.
(p) Contract assets and contract liabilities
A contract asset is recognized when the Group recognizes revenue before being unconditionally entitled to the consideration under the payment terms set out in the contract. Contract assets are assessed for ECLs in accordance with the policy set out in Note 3(l) and are reclassified to receivables when the right to the consideration has become unconditional (Note 3(q)).
A contract liability is recognized when the customer pays consideration before the Group recognizes the related revenue. A contract liability would also be recognized if the Group has an unconditional right to receive consideration before the Group recognizes the related revenue. In such cases, a corresponding receivable would also be recognized (Note 3(q)).
When the contract includes a significant financing component, the contract balance includes interest accrued under the effective interest method (Note 3(v)).
(q) Accounts receivable
Accounts receivable are recognized when the Group has an unconditional right to receive consideration. A right to receive consideration is unconditional if only the passage of time is required before payment of that consideration is due (Note 3(p)).
Receivables are stated at amortized cost using the effective interest method less allowance for credit losses (Note 3(l)).
(r) Cash and cash equivalents
Cash and cash equivalents comprise cash in hand, deposits held with banks and highly liquid investments with original maturities of three months or less from the time of purchase.


F-22

Table of Contents
PETROCHINA COMPANY LIMITED
NOTES TO THE FINANCIAL STATEMENTS — (Continued)
(All amounts in millions, except for the per share data and otherwise stated)
 
 
(s) Accounts payable
Accounts payable are recognized initially at fair value and subsequently measured at amortized cost unless the effect of discounting would be immaterial, in which case they are stated at cost.
(t) Borrowings
Borrowings are recognized initially at fair value, net of transaction costs incurred. In subsequent periods, borrowings are stated at amortized cost using the effective interest method.
General and specific borrowing costs directly attributable to the acquisition, construction or production of qualifying assets, which are assets that necessarily take a substantial period of time to get ready for their intended use or sale, are added to the cost of those assets, until such time as the assets are substantially ready for their intended use or sale.
All other borrowing costs are recognized in profit or loss in the period in which they are incurred.
Borrowings are classified as current liabilities unless the Group has unconditional rights to defer settlements of the liabilities for at least 12 months after the reporting period.
(u) Share capital
Incremental costs directly attributable to the issue of ordinary shares are recognized as a deduction from equity. Income tax relating to transaction costs of an equity transaction is accounted for in accordance with IAS 12 “Income Taxes”.
(v) Interest income and interest expense
Interest income or expense is recognized using the effective interest method.
The “effective interest rate” is the rate that exactly discounts estimated future cash payments or receipts through the expected life of the financial instrument to:
 
   
the gross carrying amount of the financial asset; or
 
   
the amortized cost of the financial liability.
In calculating interest income and expense, the effective interest rate is applied to the gross carrying amount of the asset (when the asset is not credit-impaired) or to the amortized cost of the liability. However, for financial assets that have become credit-impaired subsequent to initial recognition, interest income is calculated by applying the effective interest rate to the amortized cost of the financial asset. If the asset is no longer credit-impaired, then the calculation of interest income reverts to the gross basis.
(w) Taxation
Income tax expense comprises current and deferred tax. It is recognized in profit or loss except to the extent that it relates to a business combination, or items recognized directly in equity or in other comprehensive income.
The Group has determined that interest and penalties related to income taxes, including uncertain tax treatments, do not meet the definition of income taxes, and therefore accounted for them under IAS 37 “Provisions, Contingent Liabilities and Contingent Assets”.


F-23

Table of Contents
PETROCHINA COMPANY LIMITED
NOTES TO THE FINANCIAL STATEMENTS — (Continued)
(All amounts in millions, except for the per share data and otherwise stated)
 
(a) Current tax
Current tax comprises the expected tax payable or receivable on the taxable income or loss for the year and any adjustment to the tax payable or receivable in respect of previous years. The amount of current tax payable or receivable is the best estimate of the tax amount expected to be paid or received that reflects uncertainty related to income taxes, if any. It is measured using tax rates enacted or substantively enacted at the reporting date. Current tax also includes any tax arising from dividends.
Current tax assets and liabilities are offset only if certain criteria are met.
(b) Deferred tax
Deferred tax is provided in full, using the liability method, for temporary differences arising between the tax bases of assets and liabilities and their carrying values in the financial statements. However, deferred tax is not accounted for if it arises from initial recognition of an asset or liability in a transaction other than a business combination that at the time of the transaction affects neither accounting nor taxable profit or loss. Deferred tax is determined using tax rates that have been enacted or substantively enacted by the date of the statement of financial position and are expected to apply to the period when the related deferred tax asset is realized or deferred tax liability is settled, and reflects uncertainty related to income taxes, if any.
The principal temporary differences arise from depreciation on oil and gas properties and equipment and provision for impairment of receivables, inventories, investments and property, plant and equipment. Deferred tax assets relating to the carry forward of unused tax losses and deductible temporary differences are
recognized
to the extent that it is probable that future taxable income will be available against which they can be used.
(c) Taxes other than income tax
The Group also incurs various other taxes and levies that are not income taxes. “Taxes other than income taxes”, which form part of operating expenses, primarily comprise consumption tax (Note 9), resource tax (Note 9), crude oil special gain levy (Note 9), urban construction tax and education surcharges.
(x) Revenue recognition
Income is classified by the Group as revenue when it arises from the the sale of crude oil, natural gas, refined products, chemical products
,
non-oil
products, etc., and the provision of services in the ordinary course of the Group’s business.
Revenue is recognized when control over a product or service is transferred to the customer at the amount of promised consideration to which the Group is expected to be entitled, excluding those amounts collected on behalf of third parties. Revenue excludes value added tax or other sales taxes and is after deduction of any trade discounts.
Where the contract contains a financing component more than 12 months, interest income is accrued or interest expense is accrued separately under the effective interest method. The Group does not adjust the consideration for any effects of a significant financing component if the period of financing is 12 months or less.
(y) Provisions
Provisions are recognized when the Group has present legal or constructive obligations as a result of past events, it is probable that an outflow of resources will be required to settle the obligations, and reliable estimates of the amounts can be made.
 

F-24

Table of Contents
PETROCHINA COMPANY LIMITED
NOTES TO THE FINANCIAL STATEMENTS — (Continued)
(All amounts in millions, except for the per share data and otherwise stated)
 
Provision for future decommissioning and restoration is recognized in full on the installation of oil and gas properties. The amount recognized is the present value of the estimated future expenditure determined in accordance with local conditions and requirements. A corresponding addition to the related oil and gas properties of an amount equivalent to the provision is also created. This is subsequently depreciated as part of the costs of the oil and gas properties. Any change in the present value of the estimated expenditure other than due to passage of time which is regarded as interest expense, is reflected as an adjustment to the provision and oil and gas properties. Due to technological progress, legal requirements or changes in the market environment, changes in the provisions caused by changes in the amount of expenditure, estimated time of retirement obligations, discount rate, etc., may occur in fulfilling the retirement obligation. For an increase in provisions, the cost of oil and gas properties will be increased accordingly; for a decrease in provisions, the cost of oil and gas properties will be deducted within the limit of the carrying amount of assets related to decommissioning expenses. If a decrease in the provision exceeds the carrying amount of the oil and gas properties recognized corresponding to the provision, the excess shall be recognized immediately in profit or loss.
Provision for onerous contracts is measured at the present value of the lower of the expected cost of terminating the contract and the expected net cost of continuing with the contract. Before a provision is established, the Group recognizes any impairment loss on the assets associated with that contract.
(z) Research and development
Research expenditure incurred is recognized as an expense. Costs incurred on development projects are recognized as intangible assets to the extent that such expenditure is expected to generate future economic benefits.
(aa) Retirement benefit plans
The Group contributes to various employee retirement benefit plans organized by PRC municipal and provincial governments under which it is required to make monthly contributions to these plans at prescribed rates for its employees in China. The relevant PRC municipal and provincial governments undertake to assume the retirement benefit obligations of existing and future retired employees of the Group in China. The Group has similar retirement benefit plans for its employees in its overseas operations. Contributions to these PRC and overseas plans (“defined contribution plan”) are charged to expense as incurred. In addition, the Group joined the corporate annuity plan approved by relevant PRC authorities. Contribution to the annuity plan is charged to expense as incurred. The Group currently has no additional material obligations outstanding for the payment of retirement and other post-retirement benefits of employees in the PRC or overseas other than what described above.
(ab) Related parties
 
  (a)
A person, or a close member of that person’s family, is related to the Group if that person:
 
  (i)
has control or joint control over the Group;
 
  (ii)
has significant influence over the Group; or
 
  (iii)
is a member of the key management personnel of the Group or the Group’s parent.
 
  (b)
An entity is related to the Group if any of the following conditions applies:
(i) The entity and the Group are members of the same group (which means that each parent, subsidiary and fellow subsidiary is related to the others).

F-25

Table of Contents
PETROCHINA COMPANY LIMITED
NOTES TO THE FINANCIAL STATEMENTS — (Continued)
(All amounts in millions, except for the per share data and otherwise stated)
 
(ii) One entity is an associate or joint venture of the other entity (or an associate or joint venture of a member of a group of which the other entity is a member).
(iii) Both entities are joint ventures of the same third party.
(iv) One entity is a joint venture of a third entity and the other entity is an associate of the third entity.
(v) The entity is a post-employment benefit plan for the benefit of employees of either the Group or an entity related to the Group.
(vi) The entity is controlled or jointly controlled by a person identified in (a).
(vii) A person identified in (a)(i) has significant influence over the entity or is a member of the key management personnel of the entity (or of a parent of the entity).
(viii)
 
The entity, or any member of a group of which it is a part, provides key management personnel services to the Group or to the Group’s parent.
Close members of the family of a person are those family members who may be expected to influence, or be influenced by, that person in their dealings with the entity.

 
4
FINANCIAL RISK AND CAPITAL MANAGEMENT
 
 
4.1
Financial risk factors
The Group’s activities expose it to a variety of financial risks, including market risk, credit risk and liquidity risk.
(a) Market risk
Market risk is the possibility that changes in foreign exchange rates, interest rates and the prices of oil and gas products will adversely affect the value of assets, liabilities and expected future cash flows.
(i) Foreign exchange risk
The Group conducts its domestic business primarily in RMB, but maintains a portion of its assets in other currencies to pay for imported crude oil, natural gas, imported equipment and other materials and to meet foreign currency financial liabilities. The Group is exposed to currency risks arising from fluctuations in various foreign currency exchange rates against the RMB. The RMB is not a freely convertible currency and is regulated by the PRC government. Limitations on foreign exchange transactions imposed by the PRC government could cause future exchange rates to vary significantly from current or historical exchange rates.

Additionally, the Group operates internationally and foreign exchange risk arises from future acquisitions and commercial transactions, recognized assets and liabilities and net investments in foreign operations. Certain entities in the Group might use currency derivatives to manage such foreign exchange risk.
(ii) Interest rate risk
The Group has no significant interest rate risk on interest-bearing assets. The Group’s exposure to interest rate risk arises from its borrowings. The Group’s borrowings at floating rates expose the Group to cash flow interest rate risk and its borrowings at fixed rates expose the Group to fair value interest rate risk. However, the exposure to interest rate risk is not material to the Group. A detailed analysis of the Group’s borrowings, together with their respective interest rates and maturity dates, is included in Note 2
9
.
 
F-26

Table of Contents
PETROCHINA COMPANY LIMITED
NOTES TO THE FINANCIAL STATEMENTS — (Continued)
(All amounts in millions, except for the per share data and otherwise stated)
 
(iii) Price risk
The Group is engaged in a wide range of oil and gas products-related activities. Prices of oil and gas products are affected by a wide range of global and domestic factors which are beyond the control of the Group. The fluctuations in such prices may have favorable or unfavorable impacts on the Group.
The Group uses derivative financial instruments, including commodity futures, commodity swaps and commodity options, to hedge some price risks efficiently.
As at 31 December 2021, the Group had certain commodity contracts of crude oil, refined oil products and chemical products designated as hedges. As at 31 December 2021, the fair value of such derivative hedging financial instruments is derivative financial assets of RMB 3,913 (2020: RMB 1,411) and derivative financial liabilities of RMB 3,881 (2020: RMB 3,709).
As at 31 December 2021, it is estimated that a general increase/decrease of USD 10 per barrel in basic price of derivative financial instruments, with all other variables held constant, would impact the fair value of derivative financial instruments, which would increase/decrease the Group’s profit for the year by approximately RMB 2,104 (2020: decrease/increase RMB 2,578), there is no effect on the Group’s other reserves (2020: Nil). This sensitivity analysis has been determined assuming that the change in prices had occurred at the balance sheet date and the change was applied to the Group’s derivative financial instruments at that date with exposure to commodity price risk.
(b) Credit risk
Credit risk arises from cash and cash equivalents, time deposits with banks, accounts receivable, prepayments and other current assets and intangible and other
non-current
assets.
A substantial portion of the Group’s cash at bank and time deposits are placed with the major state-owned banks and financial institutions in China and management believes that the credit risk is low.
The Group performs ongoing assessment of the credit quality of its customers and sets appropriate credit limits taking into account the financial position and past history of defaults of customers. The aging analysis of accounts receivable (net of impairment of accounts receivable) is presented in Note 22.
The carrying amounts of cash and cash equivalents, time deposits placed with banks, accounts receivable, prepayments and other current assets and financial assets at fair value through other comprehensive income included in the consolidated statement of financial position represent the Group’s maximum exposure to credit risk. No other financial assets carry a significant exposure to credit risk.
The Group has no significant concentration of credit risk.
(c) Liquidity risk
Liquidity risk is the risk that the Group will encounter difficulty in meeting obligations associated with financial liabilities.
In managing its liquidity risk, the Group has access to funding at market rates through equity and debt markets, including using undrawn committed borrowing facilities to meet foreseeable borrowing requirements.
Given the low level of gearing and continued access to funding, the Group believes that its liquidity risk is not material.
 
F-27

Table of Contents
PETROCHINA COMPANY LIMITED
NOTES TO THE FINANCIAL STATEMENTS — (Continued)
(All amounts in millions, except for the per share data and otherwise stated)
 
Analysis of the Group’s borrowings and lease liabilities based on the remaining period at the date of the statement of financial position to the contractual maturity dates is presented in Note 2
9
and Note 19.
 
 
4.2
Capital management
The Group’s objectives when managing capital are to safeguard its ability to continue as a going concern, optimize returns for owners and to minimize its cost of capital. In meeting its objectives of managing capital, the Group may issue new shares, adjust its debt levels or the mix between short-term and long-term borrowings.
The Group monitors capital on the basis of the gearing ratio which is calculated as interest-bearing borrowings / (interest-bearing borrowings + total equity), interest-bearing borrowings include short-term and long-term borrowings. The gearing ratio at December 31, 2021 is 19.5% (December 31, 2020: 21.3%).
 
 
4.3
Fair value estimation
The methods and assumptions applied in determining the fair value of each class of financial assets and financial liabilities of the Group at December 31, 2021 and 2020 are disclosed in the respective accounting policies.
The carrying amounts of the following financial assets and financial liabilities approximate their fair value as all of them are short-term in nature: cash and cash equivalents, time deposits with maturities over three months but within one year, accounts receivable, other receivables, trade payables, other payables and short-term borrowings. The fair values of fixed rate long-term borrowings are likely to be different from their respective carrying amounts. Analysis of the fair values and carrying amounts of long-term borrowings is presented in Note 2
9
.
The Group’s investments in derivative financial instruments and FVOCI are measured at fair value on the balance sheet date. The fair value of derivative financial instruments are mainly categorised into Level 1 and Level 2 of the fair value hierarchy, which are based on the unadjusted quoted prices in active markets for identical assets or liabilities as inputs used in the valuation techniques, or the inputs other than quoted prices included within Level 1 that are observable either directly or indirectly. Trade accounts receivable and bills receivable in FVOCI are mainly categorised into Level 3 of the fair value hierarchy, which are based on that trade accounts receivable and bills receivable are mainly short-term bills of acceptance issued by banks, their fair values approximate the face values of the bills. The equity investments in FVOCI that are not held for trading are measured at fair value at the end of the reporting period. The fair value of such equity investments are mainly categorised into Level 1 of the fair value hierarchy, which are based on the unadjusted quoted prices in active markets for identical assets or liabilities as inputs used in the valuation techniques.
 
F-28

Table of Contents
PETROCHINA COMPANY LIMITED
NOTES TO THE FINANCIAL STATEMENTS — (Continued)
(All amounts in millions, except for the per share data and otherwise stated)
 
As of December 31, 2021, financial assets and financial liabilities continuing to be measured at fair value are listed as follows in three levels:
 
    
Level 1
    
Level 2
    
Level 3
    
Total
 
    
RMB
    
RMB
    
RMB
    
RMB
 
Assets
                                   
Accounts receivable:
                                   
– Derivative financial assets
     2,625        1,288        —          3,913  
Financial assets at fair value through other comprehensive income:
                                   
– Bills receivable
     —          —          3,975        3,975  
– Other Investments
     905        —          263        1,168  


3,530


1,288


4,238


9,056


Liabilities
                                   
Accounts payable and accrued liabilities:
                                   
– Derivative financial liabilities
     726        3,155        —          3,881  


726


3,155


—  


3,881


As of December 31, 2020, financial assets and financial liabilities continuing to be measured at fair value are listed as follows in three levels:
 
    
Level 1
    
Level 2
    
Level 3
    
Total
 
    
RMB
    
RMB
    
RMB
    
RMB
 
Assets
                                   
Accounts receivable:
                                   
– Derivative financial assets
     238        1,173        —          1,411  
Financial assets at fair value through other comprehensive income:
                                   
– Bills receivable
     —          —          8,076        8,076  
– Other Investments
     653        —          249        902  


891


1,173


8,325


10,389


Liabilities
                                   
Accounts payable and accrued liabilities:
                                   
– Derivative financial liabilities
     2,813        896        —          3,709  


2,813


896


—  


3,709


The Group uses discounted cash flow model with inputted interest rate and commodity index, which were influenced by historical fluctuation and the probability of market fluctuation, to evaluate the fair value of the bills receivable classified as Level 3 financial assets.
 
5
CRITICAL ACCOUNTING ESTIMATES AND JUDGEMENTS
Estimates and judgments are regularly evaluated and are based on historical experience and other factors, including expectations of future events that are believed to be reasonable under the circumstances.
The matters described below are considered to be the most critical in understanding the estimates and judgments that are involved in preparing the Group’s consolidated financial statements.
 
F-29

Table of Contents
PETROCHINA COMPANY LIMITED
NOTES TO THE FINANCIAL STATEMENTS — (Continued)
(All amounts in millions, except for the per share data and otherwise stated)
 
(a) Estimation of oil and gas reserves
Estimates of oil and natural gas reserves are key elements in the Group’s investment decision-making process. They are also important elements in testing impairment of property, plant and equipment (Note 5(b)). Changes in proved oil and gas reserves, particularly proved developed reserves, will affect
unit-of-production
depreciation, depletion and amortization recorded in the consolidated financial statements for property, plant and equipment relating to oil and gas production activities. An increase/reduction in proved developed reserves will decrease/increase depreciation, depletion and amortization charges. Proved oil and gas reserves estimates are subject to revision, either upward or downward, based on new information, such as from development drilling and production activities or from changes in economic factors, including product prices, contract terms, evolution of technology or development plans, etc.
(b) Estimation of impairment of property, plant and equipment
Property, plant and equipment, including oil and gas properties, are reviewed for possible impairments when events or changes in circumstances indicate that the carrying amount may not be recoverable. Determination as to whether and how much an asset is impaired involves management estimates and judgments such as the future price of crude oil, natural gas, refined and chemical products, the operation costs, the product mix, production volumes, production profile and the oil and gas reserves. The impairment reviews and calculations are based on assumptions that are consistent with the Group’s business plans taking into account current economic conditions. Favorable changes to some assumptions, may allow the Group to avoid the need to impair any assets or make it necessary to reverse an impairment loss recognized in prior periods, whereas unfavorable changes may cause the assets to become impaired. For example, when the assumed future price and production profile of crude oil used for the expected future cash flows are different from the actual price and production profile of crude oil or respectively experienced in future, the Group may either over or under recognize the impairment losses for certain assets.
(c) Estimation of asset retirement obligations
Provision is recognized for the future decommissioning and restoration of oil and gas properties. The amount of the provision recognized is the present values of the estimated future expenditures. The estimation of the future expenditures is based on current local conditions and requirements, including legal requirements, technology, price levels, etc. In addition to these factors, the present values of these estimated future expenditures are also impacted by the management plan for the decommissioning of oil and gas properties, the estimation of the economic lives of oil and gas properties and estimates of discount rates. The estimations and underlying assumptions are reviewed on an ongoing basis. Revisions to accounting estimates are recognized in the period in which the estimate is revised if the revision affects only that period, or in the period of the revision and future periods if the revision affects both current and future period. Changes in any of these estimates will impact the operating results and the financial position of the Group over the remaining economic lives of the oil and gas properties.
According to changes in the internal and external environment, accounting standards and company asset retirement expense measures and other relevant regulations, oil and gas field companies recalculate their asset retirement obligations of oil and gas properties based on the latest parameters, to more objectively reflect the actual situation of the Company’s asset retirement obligation of oil and gas properties.
 
F-30

Table of Contents
PETROCHINA COMPANY LIMITED
NOTES TO THE FINANCIAL STATEMENTS — (Continued)
(All amounts in millions, except for the per share data and otherwise stated)

 
6
REVENUE
Revenue represents revenues from the sale of crude oil, natural gas, refined products, chemical products,
non-oil
products, etc., and from the transportation of crude oil, refined products and natural gas. Revenue from contracts with customers is mainly recogni
z
ed at a point in time. The revenue information for the year ended December 31, 2021, 2020 and 2019 are as follows:
 
2021 Type of contract
  
Exploration
and

Production
   
Refining
and
Chemicals
   
Marketing
   
Natural Gas
and Pipeline
   
Head

Office and
Other
   
Total
 
Type of goods and services
                                                
Crude oil
     464,298       —         685,743       —         —         1,150,041  
Natural gas
     133,148       —         344,196       381,370       —         858,714  
Refined products
     —         759,912       1,064,890       —         —         1,824,802  
Chemical products
     —         207,810       48,240       —         —         256,050  
Pipeline transportation business
     —         —         —         3,360       —         3,360  
Non-oil
sales in gas stations
     —         —         25,148       —         —         25,148  
Others
     90,539       7,072       1,272       32,208       3,871       134,962  
Intersegment elimination
     (571,705     (650,018     (397,485     (19,526     (1,201     (1,639,935


Revenue from contracts with customers
     116,280       324,776       1,772,004       397,412       2,670       2,613,142  


Other revenue
     349       178       573       84       23       1,207  


Total
     116,629       324,954       1,772,577       397,496       2,693       2,614,349  


Geographical Region
                                                
Mainland China
     68,327       324,776       832,229       397,412       2,670       1,625,414  
Others
     47,953       —         939,775       —         —         987,728  


Revenue from contracts with customers
     116,280       324,776       1,772,004       397,412       2,670       2,613,142  


Other revenue
     349       178       573       84       23       1,207  


Total
     116,629       324,954       1,772,577       397,496       2,693       2,614,349  


F-31

Table of Contents
PETROCHINA COMPANY LIMITED
NOTES TO THE FINANCIAL STATEMENTS — (Continued)
(All amounts in millions, except for the per share data and otherwise stated)
 
2020 Type of contract
  
Exploration
and

Production
   
Refining
and
Chemicals
   
Marketing
   
Natural Gas
and Pipeline
   
Head

Office and
Other
   
Total
 
Type of goods and services
                                                
Crude oil
     333,557       —         447,384       —         —         780,941  
Natural gas
     118,388       —         173,696       294,297       —         586,381  
Refined products
     —         616,063       822,192       —         —         1,438,255  
Chemical products
     —         150,296       30,344       —         —         180,640  
Pipeline transportation business
     —         —         —         52,273       —         52,273  
Non-oil
sales in gas stations
     —         —         22,360       —         —         22,360  
Others
     78,631       8,254       1,300       23,800       3,515       115,500  
Intersegment elimination
     (437,670     (492,667     (276,503     (35,437     (1,320     (1,243,597


Revenue from contracts with customers
     92,906       281,946       1,220,773       334,933       2,195       1,932,753  


Other revenue
     231       162       257       401       32       1,083  


Total
     93,137       282,108       1,221,030       335,334       2,227       1,933,836  


Geographical Region
                                                
Mainland China
     27,028       281,946       554,620       334,933       2,195       1,200,722  
Others
     65,878       —         666,153       —                  732,031  


Revenue from contracts with customers
     92,906       281,946       1,220,773       334,933       2,195       1,932,753  


Other revenue
     231       162       257       401       32       1,083  


Total
     93,137       282,108       1,221,030       335,334       2,227       1,933,836  


F-32

Table of Contents
PETROCHINA COMPANY LIMITED
NOTES TO THE FINANCIAL STATEMENTS — (Continued)
(All amounts in millions, except for the per share data and otherwise stated)
 
2019 Type of contract
  
Exploration
and

Production
   
Refining
and
Chemicals
   
Marketing
   
Natural Gas
and Pipeline
   
Head

Office and
Other
   
Total
 
Type of goods and services
                                                
Crude oil
     476,974       —         623,757       —         —         1,100,731  
Natural gas
     110,837       —         238,999       291,641       —         641,477  
Refined products
     —         834,879       1,161,054       —         —         1,995,933  
Chemical products
     —         156,938       28,348       —         —         185,286  
Pipeline transportation business
     —         —         —         70,568       —         70,568  
Non-oil
sales in gas stations
     —         —         21,146       —         —         21,146  
Others
     88,284       8,036       1,513       28,341       3,684       129,858  
Elimination
     (552,672     (702,207     (332,164     (40,652     (1,644     (1,629,339


Revenue from contracts with customers
     123,423       297,646       1,742,653       349,898       2,040       2,515,660  


Other revenue
     225       209       227       473       16       1,150  


Total
     123,648       297,855       1,742,880       350,371       2,056       2,516,810  


Geographical Region
                                                
Mainland China
     41,596       297,646       784,379       349,898       2,040       1,475,559  
Others
     81,827       —         958,274       —         —         1,040,101  


Revenue from contracts with customers
     123,423       297,646       1,742,653       349,898       2,040       2,515,660  


Other revenue
     225       209       227       473       16       1,150  


Total
     123,648       297,855       1,742,880       350,371       2,056       2,516,810  


F-33

Table of Contents
PETROCHINA COMPANY LIMITED
NOTES TO THE FINANCIAL STATEMENTS — (Continued)
(All amounts in millions, except for the per share data and otherwise stated)
 
7
PROFIT BEFORE INCOME TAX EXPENSE
 
    
2021
    
2020
    
2019
 
    
RMB
    
RMB
    
RMB
 
Items credited and charged in arriving at the profit before income tax expense include:
                          
Credited
                          
Dividend income from equity investments measured at fair value through other comprehensive income
(i)
     17        25        22  
Reversal of provision for impairment of receivables
     360        95        1,630  
Reversal of write down in inventories
     76        186        201  
Gain on disposal of investment in subsidiaries
(i)
     3,575        1,242        49  
Gain on Pipeline restructuring
(i)
     18,320        46,946        —    
Charged
                          
Amortization of intangible and other assets
     5,774        5,944        4,992  
Depreciation and impairment losses:
                          
Owned property, plant and equipment
     211,107        194,015        205,297  
Right-of-use
assets
     14,388        13,916        14,973  
Auditors’ remuneration
(ii)
     47        49        53  
Cost of inventories recognized as expense
     2,047,256        1,527,271        1,981,628  
Provision for impairment of receivables
     775        438        263  
Loss on disposal and scrap of property, plant and equipment
(i)
     18,959        5,398        9,809  
Variable lease payments,
low-value
and short-term lease payment not included in the measurement of lease liabilities
     2,645        3,362        3,514  
Research and development expenses
     16,729        15,746        15,666  
Write down in inventories
     656        8,337        1,461  
 
(i)
Other income, net primarily includes dividend income from equity investments measured at fair value through other comprehensive income, gain on Pipeline restructuring (Notes 26 and 41) and disposal of investment in subsidiaries, loss on disposal of property, plant and equipment and government grants.
(ii)
The auditors’ remuneration above represents the annual audit fees paid by the Company. This remuneration does not include fees of RMB 41 (2020: RMB 62, 2019: RMB 60) paid by subsidiaries to the Company’s current auditor and its network firms which primarily relates to audit, tax compliance and other advisory services.
 
8
EMPLOYEE COMPENSATION COSTS
 
    
2021
    
2020
    
2019
 
    
RMB
    
RMB
    
RMB
 
Wages, salaries and allowances
     100,971        98,832        101,815  
Social security costs
     53,864        48,772        52,503  


       154,835        147,604        154,318  


Social security costs mainly represent contributions to plans for staff welfare organized by the PRC municipal and provincial governments and others including contributions to the retirement benefit plans (Note 3
4
).
 
F-34

Table of Contents
PETROCHINA COMPANY LIMITED
NOTES TO THE FINANCIAL STATEMENTS — (Continued)
(All amounts in millions, except for the per share data and otherwise stated)
 
9
TAXES OTHER THAN INCOME TAXES
 
    
2021
    
2020
    
2019
 
    
RMB
    
RMB
    
RMB
 
Consumption tax
     161,623        145,525        164,973  
Resource tax
     23,723        18,468        24,388  
City maintenance and construction tax
     16,078        13,647        16,001  
Educational surcharge
     11,660        9,882        11,732  
Crude oil special gain levy
     4,655        178        771  
Urban and township land use tax
     3,572        3,588        3,529  
Other
     6,692        4,562        7,042  


       228,003        195,850        228,436  


10
INTEREST EXPENSE
 
    
2021
   
2020
   
2019
 
    
RMB
   
RMB
   
RMB
 
Interest on:
                        
Bank loans
     2,540
      1,677       3,094  
Other loans
     8,092
      14,342       15,476  
Lease liabilities
     5,419
      6,297       7,476  
Accretion expense (Note 3
3
)
     4,696
      5,107       5,525  
Less: Amounts capitalized
     (1,008     (895     (1,162


       19,739       26,528       30,409  


Amounts capitalized are borrowing costs that are attributable to the construction of qualifying assets. The average interest rate used to capitalize such general borrowing cost was 4.19% per annum for the year ended December 31, 2021 (2020: 4.23% per annum, 2019: 4.28% per annum).
 
F-35

Table of Contents
PETROCHINA COMPANY LIMITED
NOTES TO THE FINANCIAL STATEMENTS — (Continued)
(All amounts in millions, except for the per share data and otherwise stated)
 
11
EMOLUMENTS OF DIRECTORS AND SUPERVISORS
Details of the emoluments of directors and supervisors for the years ended December 31, 2021, 2020 and 2019 are as follows:
 
    
2021
    
2020
    
2019
 
Name
  
Fee for
directors and
supervisors
    
Salaries,
allowances
and other
benefits
    
Contribution
to retirement
benefit
scheme
    
Total
    
Total
    
Total
 
    
RMB’000
    
RMB’000
    
RMB’000
    
RMB’000
    
RMB’000
    
RMB’000
 
Chairmen:
                                                     
Mr. Dai Houliang
(i)
     —          —          —          —          —          —    
Mr. Wang Yilin
(i)
     —          —          —          —          —          —    
Vice chairmen:
                                                     
Mr. Hou Qijun
(ii)
     —          —          —          —          —          983  
Mr. Li Fanrong
(i)
     —          —          —          —          —          —    
Mr. Zhang Wei(vii)


Executive directors:
                                                     
Mr. Huang Yongzhang
(iii)
     —          505        124        629        —          —    
Mr. Ren Lixin
(ii)
     —          139        56        195        —           


       —          644        180        824                  983  


Non-executive
directors:
                                                     
Mr. Duan Liangwei
(iii)
     —          196        41        237        735        —    
Mr. Liu Yuezhen
     —          —          —          —          —          —    
Mr. Jiao Fangzheng(ix)

     —          —          —          —          —          —    
Mr. Liu Hongbin(viii)
 
 
—  


—  


—  


—  


—  


—  
 
Mr. Qin Weizhong(x)
 
 
—  


—  


—  


—  


—  


—  
 
Mr. Lin Boqiang
     —          —          —                    388        386  
Mr. Zhang Biyi
     —          —          —                    398        386  
Ms. Elsie Leung
Oi-sie
     556        —          —          556        331        319  
Mr. Tokuchi Tatsuhito
     527        —          —          527        331        351  
Mr. Simon Henry
     499        —          —          499        320        340  
Mr. Cai Jinyong
(iv)
     575        —          —          575        —          —    
Mr. Jiang Xiaoming
(iv)
     575        —          —          575        —          —    


       2,732        196        41        2,969        2,503        1,782  


Supervisors:
                                                     
Mr. Lv Bo
(v)
     —          —          —          —          —          —    
Mr. Xu Wenrong
(v)
     —          —          —          —          —          —    
Mr. Zhang Fengshan
     —          —          —          —          —          —    
Mr. Jiang Lifu
     —          —          —          —          —          —    
Mr. Lu Yaozhong
     —          —          —          —          —          —    
Mr. Wang Liang
     —          —          —          —          —          —    
Mr. Fu Suotang
     —          1,325        108        1,433        1,367        1,155  
Mr. Li Jiamin
     —          1,109        146        1,255        1,006        978  
Mr. Li Wendong
(vi)
     —          102        35        137        1,193        1,067  
Mr. Liu Xianhua
     —          847        98        945        1,011        845  


       —          3,383        387        3,770        4,577        4,045  


       2,732        4,223        608        7,563        7,080        6,810  


F-36

Table of Contents
PETROCHINA COMPANY LIMITED
NOTES TO THE FINANCIAL STATEMENTS — (Continued)
(All amounts in millions, except for the per share data and otherwise stated)
 
 
(i)
Mr. Wang Yilin ceased being the chairman from January 19, 2020. Mr. Dai Houliang was elected as the chairman and Mr. Li Fanrong was elected as the vice chairman from March 25, 2020. On May 10, 2021, Mr. Li Fanrong ceased being the vice chairman and the director.
(ii)
Mr. Hou Qijun and Mr. Ren Lixin was appointed as director from October 21, 2021; and Mr. Hou Qijun was appointed as Vice chairman from October 28, 2021.
(iii)
Mr. Duan Liangwei was appointed as the president and executive director from March 9, 2020; On March 25, 2021, Mr. Duan Liangwei resigned as the Company’s president and was transferred from an executive director to a
non-executive
director, and no longer received remuneration from the Company; Mr. Huang Yongzhang was appointed as the Company’s president and the executive director.
(iv)
Mr. Cai Jinyong and Mr. Jiang Xiaoming were elected as independent
non-executive
directors from June 11, 2020, and began to perform their duties. The remuneration had not been paid at the end of December 31, 2020. Mr. Zhang Biyi and Mr. Lin Boqiang ceased being the independent
non-executive
director from June 11, 2020.
(v)
Mr. Xu Wenrong ceased being the Chairman of the Supervisory Committee and supervisor and Mr. Lv Bo ceased being the
non-executive
director from October 20, 2020. Mr. Lv Bo was elected as the Chairman of the Supervisory Committee and supervisor from November 5, 2020.
(vi)
On May 28, 2021, Mr. Li Wendong resigned as the employee representative supervisor of the Company.
(vii)
Mr. Zhang Wei was elected as the non-executive director and vice chairman from June 13, 2019 and ceased being the non-executive director and vice chairman from December 9, 2019.
(viii)
Mr. Liu Hongbin ceased being the non-executive director from December 3, 2019.
(ix)
Mr. Jiao Fangzheng was elected as the non-executive director from June 13, 2019.
(x)
Mr. Qin Weizhong ceased being the non-executive director from April 15, 2019.
(xi)
The emoluments above are all pre-tax amounts.
None of the directors and supervisors has waived their remuneration during the year ended December 
31, 2021, 2020 and 2019.
The five highest paid individuals in the Company for the year ended December 31, 2021 include
d
one supervisor whose emolument
is
reflected in the analysis shown above and the note; and four senior management whose allowances and other benefits
were
RMB 1.533, RMB 1.310, RMB 1.308 and RMB 1.257, respectively, and whose contribution to retirement benefit scheme
were
RMB 0.164, RMB 0.164, RMB 0.164 and RMB 0.164, respectively.
The five highest paid individuals in the Company for the year ended December 31, 2020 include
d
one supervisor whose emolument
is
reflected in the analysis shown above and the note; and four senior management whose allowances and other benefits
were
RMB 1.550, RMB 1.310, RMB 1.292 and RMB 1.270, respectively, and whose contribution to retirement benefit scheme
were
RMB 0.116, RMB 0.116, RMB 0.116 and RMB 0.116, respectively.
The five highest paid individuals in the Company for the year ended December 31, 2019 include three supervisors and one director whose emoluments are reflected in the analysis shown above and the note; and one senior management whose allowances and other benefits was RMB 0.940, and whose contribution to retirement benefit scheme was RMB 0.161.
During the years ended December 31, 2021, 2020 and 2019, the Company did not incur any severance payment to any director for loss of office or any payment as inducement to any director to join the Company.
 
F-37

Table of Contents
PETROCHINA COMPANY LIMITED
NOTES TO THE FINANCIAL STATEMENTS — (Continued)
(All amounts in millions, except for the per share data and otherwise stated)
 
12
INCOME TAX EXPENSE
 
    
2021
    
2020
    
2019
 
    
RMB
    
RMB
    
RMB
 
Current taxes
     33,822        14,922        32,714  
Deferred taxes (Note 3
2
)
     9,685
       7,666        3,485  


       43,507        22,588        36,199  


In accordance with the relevant PRC income tax rules and regulations, the PRC corporate income tax rate applicable to the Group is principally 25%. In accordance with the Circular jointly issued by the Ministry
o
f Finance (“MOF”), the General Administration of Customs of the PRC and the State Administration of Taxation (“SAT”) on Issues Concerning Tax Policies for
In-depth
Implementation of Western Development Strategy (Cai Shui [2011] No.58) and the Notice on Continuing the Income Tax Policy for Western Development (Notice No.23 of 2020 of the MOF, the SAT, the NDRC), the corporate income tax for the enterprises engaging in the encouraged industries in the Western China Region is charged at a preferential corporate income tax rate of 15% from January 1, 2011 to December 31, 2030. Certain branches and subsidiaries of the Company in the Western China Region obtained the approval for the use of the preferential corporate income tax rate of 15%.
The tax on the Group’s profit before taxation differs from the theoretical amount that would arise using the corporate income tax rate in the PRC applicable to the Group as follows:
 
    
2021
   
2020
   
2019
 
    
RMB
   
RMB
   
RMB
 
Profit before income tax expense
     158,203       56,073       103,214  


Tax calculated at a tax rate of 25%
     39,551       14,018       25,804  
Tax return
true-up
     (256     256       691  
Effect of income taxes from international operations different from taxes at the PRC statutory tax rate
     2,692       1,522       6,112  
Effect of preferential tax rate
     (8,603     (1,312     (5,529
Tax effect of income not subject to tax
     (10,305     (3,612     (3,767
Tax effect of expenses not deductible for tax purposes
     15,789       5,455       4,479  
Tax effect of temporary differences and losses not recognized as deferred tax assets
     4,639       6,261       8,409  


Income tax expense
     43,507       22,588       36,199  


13
BASIC AND DILUTED EARNINGS PER SHARE
Basic and diluted earnings per share for the years ended December 31, 2021, 2020 and 2019 have been computed by dividing profit for the year attributable to owners of the Company by 183,021 million shares issued and outstanding for the year.
There are no potentially dilutive ordinary shares.
 
F-38

Table of Contents
PETROCHINA COMPANY LIMITED
NOTES TO THE FINANCIAL STATEMENTS — (Continued)
(All amounts in millions, except for the per share data and otherwise stated)
 
14
DIVIDENDS
 
    
2021
    
2020
    
2019
 
    
RMB
    
RMB
    
RMB
 
Interim dividends attributable to owners of the Company for 2021 (a)
     23,866        —          —    
Proposed final dividends attributable to owners of the Company for 2021 (b)
     17,610        —          —    
Interim dividends attributable to owners of the Company for 2020 (c)
     —          16,000        —    
Final dividends attributable to owners of the Company for 2020 (d)
     —          16,000        —    
Interim dividends attributable to owners of the Company for 2019 (e)
     —          —          14,212  
Final dividends attributable to owners of the Company for 2019 (f)
     —          —          12,081  


       41,476        32,000        26,293  


(a)
Interim dividends attributable to owners of the Company in respect of 2021 of RMB 0.13040 yuan
 
(inclusive of applicable tax)
per share
,
amounting to a total of RMB 23,866. The dividends were paid on September 17, 2021 (A shares) and October 29, 2021 (H shares).
(b)
At the 14
th
meeting of the 8
th
Board, the Board of Directors proposed final dividends attributable to owners of the Company in respect of 2021 of RMB 0.09622 yuan
(in
clusive of applicable tax)
 
p
er share
amounting to a total of RMB 17,610. These consolidated financial statements do not reflect this dividend payable as the final dividends were proposed after the reporting period and will be accounted for in equity as an appropriation of retained earnings during the year ended December 31, 2022 when approved at the forthcoming 2021 Annual General Meeting.
(c)
Interim dividends attributable to owners of the Company in respect of 2020 of RMB 0.08742 yuan
 
(inclusive of applicable tax)
per share amounting to a total of RMB 16,000. The dividends were paid on September 22, 2020 (A shares) and November 13, 2020 (H shares).
(d)
Final dividends attributable to owners of the Company in respect of 2020 of RMB 0.08742 yuan
 
(inclusive of applicable tax)
per share, amounting to a total of RMB 16,000. The dividends approved at the 2020 Annual General Meeting held on 10 June, 2021, and were paid on June 29, 2021 (A shares) and July 30, 2021 (H shares).
(e)
Interim dividends attributable to owners of the Company in respect of 2019 of RMB 0.07765 yuan
 
(inclusive of applicable tax)
per share amounting to a total of RMB 14,212. The dividends were paid on September 24, 2019 (A shares) and November 1, 2019 (H shares).
(f)
Final dividends attributable to owners of the Company in respect of 2019 of RMB 0.06601 yuan
(inclusive of applicable tax)
 
per share amounting to a total of RMB 12,081 and were paid on June 30, 2020 (A shares) and July 31, 2020 (H shares).
 
F-39

Table of Contents
PETROCHINA COMPANY LIMITED
NOTES TO THE FINANCIAL STATEMENTS — (Continued)
(All amounts in millions, except for the per share data and otherwise stated)
 
15
PROPERTY, PLANT AND EQUIPMENT
 
Year Ended
December 31, 2021
 
Buildings
   
Oil

and Gas
Properties
   
Equipment

and

Machinery
   
Motor
Vehicles
   
Other
   
Construction

in Progress
   
Total
 
   
RMB
   
RMB
   
RMB
   
RMB
   
RMB
   
RMB
   
RMB
 
Cost
                                                       
At beginning of the year
    248,948       2,355,925       746,404       22,857       45,014       228,882       3,648,030  
Additions
    1,561       18,556       5,305       645       1,880       241,843       269,790  
Transfers
    13,736       160,810       38,649       —         2,369       (215,564     —    
Disposals or write offs
    (5,101     (75,411     (12,010     (1,588     (1,675     (22,175     (117,960
Currency translation differences
    (286     (7,255     (345     (11     (313     (704     (8,914


At end of the year
    258,858       2,452,625       778,003       21,903       47,275       232,282       3,790,946  


Accumulated depreciation and impairment
                                                       
At beginning of the year
    (110,899     (1,542,037     (488,109     (17,431     (31,937     (5,526     (2,195,939
Charge for the year and others
    (11,057     (138,251     (33,404     (992     (2,485     —         (186,189
Impairment charge
    (516     (19,463     (2,723              (121     (3,648     (26,471
Disposals or write offs or transfers
    1,952       58,312       7,429       1,421       997       396       70,507  
Currency translation differences
    103       5,602       158       11       401       167       6,442  


At end of the year
    (120,417     (1,635,837     (516,649     (16,991     (33,145     (8,611     (2,331,650


Net book value
                                                       
At end of the year
    138,441       816,788       261,354       4,912       14,130       223,671       1,459,296  


F-40

Table of Contents
PETROCHINA COMPANY LIMITED
NOTES TO THE FINANCIAL STATEMENTS — (Continued)
(All amounts in millions, except for the per share data and otherwise stated)
 
Year Ended
December 31, 2020
 
Buildings
   
Oil

and Gas
Properties
   
Equipment

and

Machinery
   
Motor
Vehicles
   
Other
   
Construction

in Progress
   
Total
 
   
RMB
   
RMB
   
RMB
   
RMB
   
RMB
   
RMB
   
RMB
 
Cost
                                                       
At beginning of the year
    252,174       2,261,203       1,153,616       27,148       36,155       255,302       3,985,598  
Additions
    3,620       1,044       8,425       1,419       776       188,591       203,875  
Transfers
    16,827       152,389       23,618                12,169       (205,003     —    
Disposals or write offs
    (22,910     (39,497     (438,169     (5,661     (3,340     (8,934     (518,511
Currency translation differences
    (763     (19,214     (1,086     (49     (746     (1,074     (22,932


At end of the year
    248,948       2,355,925       746,404       22,857       45,014       228,882       3,648,030  


Accumulated depreciation and impairment
                                                       
At beginning of the year
    (107,943     (1,429,389     (615,770     (19,947     (23,092     (6,233     (2,202,374
Charge for the year and others
    (11,005     (136,433     (45,912     (1,260     (10,573     —         (205,183
Impairment charge
    (214     (13,908     (113              (837     (295     (15,367
Disposals or write offs or transfers
    7,948       24,234       173,196       3,739       2,031       1,012       212,160  
Currency translation differences
    315       13,459       490       37       534       (10     14,825  


At end of the year
    (110,899     (1,542,037     (488,109     (17,431     (31,937     (5,526     (2,195,939


Net book value
                                                       
At end of the year
    138,049       813,888       258,295       5,426       13,077       223,356       1,452,091  


The Group’s exploration and production segment determines whether there are any indicators of impairment for the oil fields or blocks and
performs the impairment tests on those oil fields or blocks with indications of impairment, and reports the results to the Group’s internal professional
team (including exploration and finance expert) for further overall assessment and evaluation. The final results of the impairment tests have been submitted to the Group’s management for review and approval. The Group recorded impairment losses amounting to
RMB 19,463 related to oil and gas properties under the exploration and production segment for the year ended December 31, 2021 (2020: RMB 13,908 related to oil and gas properties
 
under the exploration and production segment, 2019: RMB 11,562 related to oil and gas properties under the exploration and production segment) due
 
to the decline of oil and gas reserves in certain oilfield as well as no further deelopment plans for certain other projects. The carrying amount of those impaired oil and gas properties was written down to their respective recoverable amounts, which were primarily determined
using the discounted cash flow model.
The Group referred to the weighted average cost of capital of the oil and gas industry when determining discount rate, and made relevant adjustments according to specific risks in different countries or regions. In 2021, the
after-tax
discount rates adopted by most oil fields or blocks of the Group ranged 7.6% to 15.0% (2020: 5.9% to 12.0%, 2019: 6.4% to 15.4
%) per annum.
 
F-41

Table of Contents
PETROCHINA COMPANY LIMITED
NOTES TO THE FINANCIAL STATEMENTS — (Continued)
(All amounts in millions, except for the per share data and otherwise stated)
 
The following table indicates the changes to the Group’s exploratory well costs, which are included in construction in progress, for the years ended December 31, 2021, 2020 and 2019.
 
    
2021
   
2020
   
2019
 
    
RMB
   
RMB
   
RMB
 
At beginning of the year
     38,807       36,101       26,905  
Additions to capitalized exploratory well costs pending the determination of proved reserves
     30,338       30,104       35,098  
Reclassified to wells, facilities, and equipment based on the determination of proved reserves
     (27,201     (18,464     (17,002
Capitalized exploratory well costs charged to expense
     (12,557     (8,934     (8,900


At end of the year
     29,387       38,807       36,101  


The following table provides an aging of capitalized exploratory well costs based on the date the drilling was completed.
 
    
December 31,
2021
    
December 31,
2020
 
    
RMB
    
RMB
 
One year or less
     19,354        23,428  
Over one year
     10,033        15,379  


Balance at December 31
     29,387        38,807  


Capitalized exploratory well costs over one year are principally related to
 the
wells that are under further evaluation of drilling results or pending completion of development planning to ascertain economic viability.
 
F-42

Table of Contents
PETROCHINA COMPANY LIMITED
NOTES TO THE FINANCIAL STATEMENTS — (Continued)
(All amounts in millions, except for the per share data and otherwise stated)
 
16
INVESTMENTS IN ASSOCIATES AND JOINT VENTURES
The summarized financial information of the Group’s principal associates and joint ventures, including the aggregated amounts of assets, liabilities, revenue, profit or loss and the interest held by the Group were as follows:
 
Name
 
Country of

Incorporation
   
Registered
Capital
   
Principal Activities
 
Interest Held
 
 
Direct %
   
Indirect %
 
China Oil & Gas Piping Network Corporation (“PipeChina”)
    PRC       500,000     Pipeline transport, storage service, import of equipment, import and export of techniques, science and technology research, research and application of informatization, technology consulting, technology service, technology transfer, promotion of technology     29.90       —    
China Petroleum Finance Co., Ltd. (“CP Finance”)
    PRC       8,331     Deposits, loans, settlement, lending, bills acceptance discounting, guarantee and other banking business     32.00       —    
CNPC Captive Insurance Co., Ltd.
    PRC       5,000     Property loss insurance, liability insurance, credit insurance and deposit insurance; as well as the application of the above insurance reinsurance and insurance capital business     49.00       —    
China Marine Bunker (PetroChina) Co., Ltd.
    PRC       1,000     Oil import and export trade and transportation, sale and storage     —         50.00  
Mangistau Investment B.V.
    Netherlands       USD
131 million
 
 
  Engages in investing activities, the principle activities of its main subsidiaries are exploration, development and sale of oil and gas.     —         50.00  
Trans-Asia Gas Pipeline Co., Ltd.
    PRC       5,000     Main contractor, investment holding, investment management, investment consulting, enterprise management advisory, technology development, promotion and technology consulting     —         50.00  
 
F-43

Table of Contents
PETROCHINA COMPANY LIMITED
NOTES TO THE FINANCIAL STATEMENTS — (Continued)
(All amounts in millions, except for the per share data and otherwise stated)
 
Interest in Associates
Summarized financial information in respect of the Group’s principal associates and reconciliation to carrying amount is as follow
s
:
 
    
PipeChina
 
(Note 41)
    
CP Finance
    
CNPC Captive Insurance

Co., Ltd.
 
    
December 31,
2021
    
December 31,
2020
    
December 31,
2021
    
December 31,
2020
    
December 31,
2021
    
December 31,
2020
 
    
RMB
    
RMB
    
RMB
    
RMB
    
RMB
    
RMB
 
Percentage ownership interest (%)
     29.90        29.90        32.00        32.00        49.00        49.00  
Current assets
     86,335        74,012        415,139        313,741        9,100        11,267  
Non-current
assets
     768,161        655,982        116,765        177,344        2,618        2,956  
Current liabilities
     136,150        55,562        446,369        404,201        859        4,752  
Non-current
liabilities
     103,243        104,150        8,396        12,617        3,900        2,776  


Net assets
     615,103        570,282        77,139        74,267        6,959        6,695  
Group’s share of net assets
     157,346        151,135        24,684        23,765        3,410        3,281  
Goodwill
                         349        349                      


Carrying amount of interest in associates
     157,346        151,135        25,033        24,114        3,410        3,281  


Summarized statement of comprehensive income and dividends received by the Group are as follow:
 
    
PipeChina
 
(Note 41)
    
CP
Finance 
    
CNPC Captive

Insurance Co., Ltd.
 
    
Dec 31,
2021
    
From

Oct 01,
2020 to
Dec 31,
2020
    
Dec 31,
2021
   
Dec 31,
2020
   
Dec 31,
2019
    
Dec 31,
2021
    
Dec 31,
2020
    
Dec 31,
2019
 
    
RMB
    
RMB
   
RMB
   
RMB
    
RMB
    
RMB
    
RMB
 
Revenue
     101,572        22,766        12,691       7,954       9,672        1,510        735        712  
Profit for the year
     29,776        6,444        6,304       7,819       7,810        424        389        349  
Other comprehensive income/(loss)
     2                  (606     (1,603     1,356                            (1


Total comprehensive income
     29,778        6,444        5,698       6,216       9,166        424        389        348  


Group’s share of total comprehensive income
     6,846        1,532        1,823       1,989       2,933        207        191        170  


Dividends received by the Group
     943                  904       677       1,268        78        74        62  


F-44

Table of Contents
PETROCHINA COMPANY LIMITED
NOTES TO THE FINANCIAL STATEMENTS — (Continued)
(All amounts in millions, except for the per share data and otherwise stated)
 
Interest in Joint Ventures
Summarized statement of financial position as included in their own financial statements, adjusted for fair value adjustments and differences in accounting policies in respect of the Group’s principal joint ventures and reconciliation to carrying amount is as follows:
 
   
China Marine Bunker
(PetroChina) Co., Ltd.
   
Mangistau Investment B.V.
   
Trans-Asia Gas Pipeline

Co., Ltd.
 
   
December 31,
2021
   
December 31,
2020
   
December 31,
2021
   
December 31,
2020
   
December 31,
2021
   
December 31,
2020
 
   
RMB
   
RMB
   
RMB
   
RMB
   
RMB
   
RMB
 
Percentage ownership interest (%)
    50.00       50.00       50.00       50.00       50.00       50.00  
Non-current
assets
    1,571       1,685       9,927       10,586       44,011       39,809  
Current assets
    11,305       7,319       2,220       830       1,437       2,886  
Including: cash and cash equivalents
    2,292       1,343       1,631       74       1,411       739  
Non-current
liabilities
    540       158       2,033       3,008       2,147       2,330  
Including:
Non-current
financial liabilities
             1                848       2,101       2,330  
Current liabilities
    9,997       5,927       872       575       483       235  
Including: Current financial liabilities excluding trade and other payables
    5,810       3,267       —         —         —         —    


Net assets
    2,339       2,919       9,242       7,833       42,818       40,130  


Net assets attributable to owners of the Company
    1,952       2,672       9,242       7,833       42,818       40,130  
Group’s share of net assets
    976       1,336       4,621       3,917       21,409       20,065  


Carrying amount of interest in joint ventures
    976       1,336       4,621       3,917       21,409       20,065  


F-45

Table of Contents
PETROCHINA COMPANY LIMITED
NOTES TO THE FINANCIAL STATEMENTS — (Continued)
(All amounts in millions, except for the per share data and otherwise stated)
 
Summarized statement of comprehensive income as included in their own financial statements, adjusted for fair value adjustments and differences in accounting policies and dividends received by the Group is as follows:
 
    
China Marine Bunker
(PetroChina) Co., Ltd.
   
Mangistau Investment B.V.
   
Trans-Asia Gas Pipeline
Co., Ltd.
 
    
2021
   
2020
   
2019
   
2021
   
2020
   
2019
   
2021
   
2020
   
2019
 
    
RMB
   
RMB
   
RMB
   
RMB
   
RMB
   
RMB
   
RMB
   
RMB
   
RMB
 
Revenue
     58,210       36,695       42,116       11,543       8,152       15,104       17       18       23  
Depreciation, depletion
and amortization
     (190     (195     (81     (1,002     (1,048     (883     (57     (38     (37
Interest income
     11       16       23       3       4       2       31       42       51  
Interest expense
     (72     (60     (88     (141     (160     (158     (56     (58     (57
Income tax expense
     (56     (57     (92     (846     (293     (925              1           
Net (loss)/profit
     (610     185       142       2,114       362       2,818       4,067       3,060       4,070  
Total comprehensive
(
loss
)
/
income
     (691     140       169       1,874       (650     2,978       3,508       (3,007     7,940  


Group’s share of total comprehensive (loss)/ income
     (344     46       85       937       (325     1,489       1,754       (1,504     3,970  


Dividends received by
the Group
     29                         233       539       1,115       410                175  
                                                                          
Dividends received or receivable from associates and joint ventures were RMB 4,715 in 2021 (2020: RMB 4,517, 2019: RMB 4,432).
In 2021, investments in associates and joint ventures of RMB 489 (2020: RMB 1,687, 2019: RMB 119) were disposed of, resulting in a loss of RMB 4(2020: a loss of RMB 5, 2019: a gain of RMB 238
) which was included in other income.
In 2021, the share of profit and other comprehensive income in all individually immaterial associates and joint ventures accounted for using equity method in aggregate was loss of RMB 1
423(2020: loss of RMB 2,468, 2019: profit of RMB 2,207) and profit of RMB 622 (2020: profit of RMB 3,631, 2019: profit of RMB 2,098), respectively.
 
17
EQUITY INVESTMENTS MEASURED AT FAIR VALUE THROUGH OTHER COMPREHENSIVE INCOME
 
    
December 31,
2021
    
December 31,
2020
 
    
RMB
    
RMB
 
Chengdu Huaqi Houpu Holding Co., Ltd.
     534        228  
China Pacific Insurance (Group)Co., Ltd.
     133        188  
Other items
     501        486  


       1,168        902  


Dividends amounting to RMB 17 were received on these investments during the year ended December 31, 2021 (2020
RMB 25, 2019
RMB 22).
 
F-46

Table of Contents
PETROCHINA COMPANY LIMITED
NOTES TO THE FINANCIAL STATEMENTS — (Continued)
(All amounts in millions, except for the per share data and otherwise stated)
 
18
SUBSIDIARIES
The principal subsidiaries of the Group are:
 
Company Name
 
Country of
Incorporation
 
Registered
Capital
 
Type of
Legal
Entity
 
Attributable

Equity
Interest %
   
Voting
Rights
%
   
Principal Activities
Daqing Oilfield Company Limited
  PRC   47,500   Limited liability company     100.00       100.00     Exploration, production and sale of crude oil and natural gas
             
CNPC Exploration and Development Company Limited 
(i)
  PRC   16,100   Limited liability company     50.00       57.14     Exploration, production and sale of crude oil and natural gas outside the PRC
             
PetroChina Hong Kong Limited
  Hong Kong  
HKD
7,592
million
  Limited liability company     100.00       100.00     Investment holding. The principal activities of its subsidiaries, associates and joint ventures are the exploration, production and sale of crude oil in and outside the PRC as well as natural gas sale and transmission in the PRC
             
PetroChina International Investment Company Limited
  PRC   31,314   Limited liability company     100.00       100.00    
Investment holding. The
principal activities of its
subsidiaries, associates and joint ventures are the exploration, development
and production of crude
oil, natural gas, oil sands and coalbed methane outside the PRC
             
PetroChina International Company Limited
  PRC   18,096   Limited liability company     100.00       100.00     Marketing of refined products and trading of crude oil and petrochemical products, storage, investment in refining, chemical engineering, storage facilities, service station, and transportation facilities and related business in and outside the PRC
             
PetroChina Sichuan Petrochemical Company Limited
  PRC   10,000   Limited liability company     90.00       90.00     Engaged in oil refining, petrochemical, chemical products production, sales, chemical technology development, technical transfer and services
             
KunLun Energy Company Limited 
(ii)
  Bermuda  
HKD 160
million
  Limited liability company     54.38       54.38     Investment holding. The principal activities of its principal subsidiaries, associates and joint ventures are the sales of natural gas, sales of liquefied petroleum gas and liquefied natural gas processing and terminal business in the PRC and the exploration and production of crude oil and natural gas in the PRC, the Republic of Kazakhstan, the Sultanate of Oman, the Republic of Peru, the Kingdom of Thailand and the Republic of Azerbaijan.
 
(i)
The Company consolidated the financial statements of the entity because it is exposed to, or has rights to, variable returns from its involvement with the entity and has the ability to affect those returns through its power over the entity.
(ii)
Kunlun Energy Co., Ltd. is a company listed on The Stock Exchange of Hong Kong Limited.
 
F-47

Table of Contents
PETROCHINA COMPANY LIMITED
NOTES TO THE FINANCIAL STATEMENTS — (Continued)
(All amounts in millions, except for the per share data and otherwise stated)
 
Summarized financial information in respect of the Group’s principal subsidiaries with significant
non-controlling
interests is as follows:
 
    
CNPC Exploration and
Development
Company Limited
    
PetroChina Sichuan
Petrochemical
Company Limited
 
    
December 31,
2021
    
December 31,
2020
    
December 31,
2021
    
December 31,
2020
 
    
RMB
    
RMB
    
RMB
    
RMB
 
Percentage ownership interest (%)
     50.00        50.00        90.00        90.00  
Current assets
     15,596        16,046        3,973        4,278  
Non-current
assets
     184,486        182,392        25,317        26,371  
Current liabilities
     11,282        21,820        3,876        5,382  
Non-current
liabilities
     30,293        22,566        382        486  


Net assets
     158,507        154,052        25,032        24,781  


Summarized statement of comprehensive income is as follows:
 
    
CNPC Exploration and
Development
Company Limited
    
PetroChina Sichuan
Petrochemical
Company Limited


2021
    
2020
   
2019
    
2021
    
2020
    
2019
 
    
RMB
    
RMB
   
RMB
    
RMB
    
RMB
    
RMB
 
Revenue
     42,730        33,312       47,096        48,493        35,319        49,858  
Net profit
     8,413        6,006       14,126        3,383        520        544  
Total comprehensive income/(loss)
     5,231        (6,972     17,879        3,383        520        544  
Profit attributable to
non-controlling
interests
     4,837        3,311       8,274        338        52        54  
Dividends paid to
non-controlling
interests
     1,485        1,498       1,923        307        12        19  
Summarized statement of cash flows is as follows:
 
    
CNPC Exploration and
Development
Company Limited
   
PetroChina Sichuan
Petrochemical
Company Limited


2021
   
2020
   
2019
   
2021
   
2020
   
2019
 
    
RMB
   
RMB
   
RMB
   
RMB
   
RMB
   
RMB
 
Net cash inflow from operating activities
     13,320       5,681       17,780       2,666       5,119       3,413  
Net cash (outflow) / inflow from investing activities
     (5,191     (16,187     (17,306     (231     (380     537  
Net cash (outflow) / inflow from financing activities
     (8,531     7,410       (1,118     (3,995     (3,186     (4,035
Effect of foreign exchange rate changes on cash and cash equivalents
     (15     (776     220                             


Net (decrease) / increase in cash and cash equivalents
     (417     (3,872     (424     (1,560     1,553       (85
Cash and cash equivalents at the beginning of the year
     9,202       13,074       13,498       1,561       8       93  


Cash and cash equivalents at the end of the year
     8,785       9,202       13,074       1       1,561       8  


F-48

Table of Contents
PETROCHINA COMPANY LIMITED
NOTES TO THE FINANCIAL STATEMENTS — (Continued)
(All amounts in millions, except for the per share data and otherwise stated)
 
19
LEASES
The leases where the Group is a lessee.
(a) Right-of-use assets


December 31, 2020
 
 
Additions
 
 
Reduction
 
 
December 31, 2021
 
Cost


Land
  
 
171,941


9,331


(672
 
 
180,600
 
Buildings
  
 
57,337


5,120


(5,567
 
 
56,890
 
Equipment and Machinery
  
 
2,641


2,614


(781
 
 
4,474
 
Other
  
 
2,195


186


(563
 
 
1,818


Total
  
 
234,114


17,251


(7,583
 
 
243,782


Accumulated depreciation


Land
  
 
(11,611
 
 
(7,022
 
 
216


(18,417
Buildings
  
 
(10,839
 
 
(6,334
 
 
2,748


(14,425
Equipment and Machinery
  
 
(1,166
 
 
(1,096
 
 
685


(1,577
Other
  
 
(712
 
 
(313
 
 
268


(757


Total
  
 
(24,328
 
 
(14,765
 
 
3,917


(35,176


Net book value


Land
  
 
160,330


162,183
 
Buildings
  
 
46,498


42,465
 
Equipment and Machinery
  
 
1,475


2,897
 
Other
  
 
1,483


1,061


Total
  
 
209,786


208,606


December 31, 2019
 
 
Additions
 
 
Reduction
 
 
December 31, 2020
 
Cost


Land
  
 
172,897


19,547


(20,503
 
 
171,941
 
Buildings
  
 
91,920


6,020


(40,603
 
 
57,337
 
Equipment and Machinery
  
 
2,934


29


(322
 
 
2,641
 
Other
  
 
2,068


723


(596
 
 
2,195


Total
  
 
269,819


26,319


(62,024
 
 
234,114


Accumulated depreciation


Land
  
 
(6,595
 
 
(7,344
 
 
2,328


(11,611
Buildings
  
 
(7,369
 
 
(6,601
 
 
3,131


(10,839
Equipment and Machinery
  
 
(718
 
 
(703
 
 
255


(1,166
Other
  
 
(401
 
 
(426
 
 
115


(712


Total
  
 
(15,083
 
 
(15,074
 
 
5,829


(24,328


Net book value


Land
  
 
166,302


160,330
 
Buildings
  
 
84,551


46,498
 
Equipment and Machinery
  
 
2,216


1,475
 
Other
  
 
1,667


1,483


Total
  
 
254,736


209,786


F-49

Table of Contents
PETROCHINA COMPANY LIMITED
NOTES TO THE FINANCIAL STATEMENTS — (Continued)
(All amounts in millions, except for the per share data and otherwise stated)
 
The Group’s use of right assets mainly include leased land, buildings, equipment and machinery. The leases underlying assets classified as buildings are mainly the leased gas filling stations, oil storages and office buildings. The leases underlying assets classified as equipment and machinery are mainly drilling equipment, production equipment and other movable equipment.
(b) Lease liabilities


December 31, 2021
 
 
December 31, 2020


RMB
 
 
RMB
 
Lease liabilities
  
 
129,848


129,223
 
Less: Lease liabilities due within one year
  
 
(6,626
 
 
(6,579


123,222


122,644


Depreciation charged to profit or loss provided on right-of-use assets for the year ended December 31, 2021 was RMB 14,388 (2020:RMB 13,916).
Analysis of the undiscounted cash flow of the lease liabilities is as follows
:


December 31, 2021
 
  
December 31, 2020


RMB
 
  
RMB
 
Within 1 year
  
 
12,495


11,824
 
Between 1 and 2 years
  
 
11,181


10,236
 
Between 2 and 5 years
  
 
30,541


29,862
 
Over 5 years
  
 
154,636


153,967


208,853


205,889


20

INTANGIBLE AND OTHER
NON-CURRENT
ASSETS
 
    
December 31, 2021
    
December 31, 2020
 
    
Cost
    
Accumulated
amortization,
including
impairment losses
   
Net
    
Cost
    
Accumulated
amortization,
including
impairment losses
   
Net
 
    
RMB
    
RMB
   
RMB
    
RMB
    
RMB
   
RMB
 
Patents and technical
know-how
     8,213        (6,905     1,308        7,846        (6,657     1,189  
Computer software
     13,016        (9,751     3,265        12,517        (9,528     2,989  
Goodwill
(i)
     8,023        (36     7,987        8,161        (36     8,125  
Other
     27,335        (10,889     16,446        26,135        (9,797     16,338  


Intangible assets
     56,587        (27,581     29,006        54,659        (26,018     28,641  


Other assets
                      37,338                         38,853  


                        66,344                         67,494  


(i)
Goodwill primarily relates to the acquisition of Singapore Petroleum Company and PetroIneos Trading Limited, subsidiaries in the Marketing segment, completed in 2009 and 2011, respectively.
The impairment of goodwill shall be tested in combination with its related asset groups. The recoverable amount of all cash-generating units has been determined based on
value-in-use
calculations. These
F-50

Table of Contents
PETROCHINA COMPANY LIMITED
NOTES TO THE FINANCIAL STATEMENTS — (Continued)
(All amounts in millions, except for the per share data and otherwise stated)
 
calculations use
post-tax
cash flow projections based on financial budgets prepared by the management. The
post-tax
discount rates reflect specific risks relating to the cash-generating unit.
For impairment test of the goodwill, the
post-tax
discount rates ranged 8.5% to 14.7% (2020: 4.9% to 10.5%, 2019: 6.5% to 10.5%) were used by the management, and no impairment loss was charged for the goodwill for the year ended December 31, 2021 (2020: nil, 2019: nil).
 
In September 2020, the Group sold its major oil and gas pipelines to PipeChina, thus losing control of PetroChina United Pipelines Co., Ltd. (Note 41). The related goodwill generated from the acquisition of CNPC Pipeline United Co., Ltd. in 2015, with carrying amount of RMB 34,285 (including relevant impairment provision), was derecognized accordingly. 
 
2
1
INVENTORIES
 
    
December 31,
2021
    
December 31,
2020
 
    
RMB
    
RMB
 
Crude oil and other raw materials
     40,334        35,855  
Work in progress
     15,393        12,387  
Finished goods
     88,811        80,739  
Spare parts and consumables
     91        75  


       144,629        129,056  
Less: Write down in inventories
     (781      (517


       143,848        128,539  


2
2
ACCOUNTS RECEIVABLE
 
    
December 31,
2021
    
December 31,
2020
 
    
RMB
    
RMB
 
Accounts receivable
     58,073        53,465  
Less: Provision for impairment of receivables
     (1,414      (1,140


       56,659        52,325  


As of December 31, 2021, accounts receivable of the Group included derivative financial assets, which were generated by hedges, of RMB 3,913 (2020
:
 RMB 1,411).
The aging analysis of accounts receivable (net of impairment of accounts receivable) based on the invoice date (or date of revenue recognition, if earlier), at December 31, 2021 and 2020 is as follows:
 
    
December 31,
2021
    
December 31,
2020
 
    
RMB
    
RMB
 
Within 1 year
     55,446        51,641  
Between 1 and 2 years
     816        374  
Between 2 and 3 years
     194        209  
Over 3 years
     203        101  


     56,659      52,325  


The Group offers its customers credit terms up to 180
days.
 
F-51

Table of Contents
PETROCHINA COMPANY LIMITED
NOTES TO THE FINANCIAL STATEMENTS — (Continued)
(All amounts in millions, except for the per share data and otherwise stated)
Movements in the provision for impairment of accounts receivable are as follows:
 
    
2021
    
2020
    
2019
 
    
RMB
    
RMB
    
RMB
 
At beginning of the year
     1,140        2,431        4,053  
Provision for impairment of accounts receivable
     396        426        226  
Reversal of provision for impairment of accounts receivable
     (110      (76      (1,604
Receivables written off as uncollectible
     (12      (1,641      (244


At end of the year
     1,414        1,140        2,431  


The Group measures loss allowance for accounts receivable at an amount equal to lifetime ECLs. The ECLs were calculated by reference to the historical actual credit loss experience. The rates were considered the differences between economic conditions during the period over which the historical data has been collected, current conditions and the Group’s view of economic conditions over the expected lives of the receivables. The Group performed the calculation of ECL rates by the operating segment and geography.
 
    
Gross
carrying
amount
    
Impairment
provision on
individual
basis
    
Impairment provision on
provision matrix basis
    
Loss
allowance
 
    
Weighted-
average
loss rate
   
Impairment
provision
 
December 31, 2021
  
RMB
    
RMB
    
%
   
RMB
    
RMB
 
Current (not past due)
     53,098                  0.1     55        55  
Within 1 year past due
     3,153        26        1.6     50        76  
1 to 2 years past due
     648        153        25.5     126        279  
2 to 3 years past due
     329        67        45.0     118        185  
Over 3 years past due
     845        352        94.7     467        819  


Total
     58,073        598                816        1,414  


Gross
carrying
amount
    
Impairment
provision on
individual
basis
    
Impairment provision on
provision matrix basis
    
Loss
allowance
 
    
Weighted-
average

loss rate
   
Impairment
provision
 
December 31, 2020
  
RMB
    
RMB
    
%
   
RMB
    
RMB
 
Current (not past due)
     46,849                  0.1     34        34  
Within 1 year past due
     5,326        154        0.4     19        173  
1 to 2 years past due
     386        65        6.9     22        87  
2 to 3 years past due
     50        11        25.6     10        21  
Over 3 years past due
     854        342        94.3     483        825  


Total
     53,465        572                568        1,140  


F-52

Table of Contents
PETROCHINA COMPANY LIMITED
NOTES TO THE FINANCIAL STATEMENTS — (Continued)
(All amounts in millions, except for the per share data and otherwise stated)
 
2
3
PREPAYMENTS AND OTHER CURRENT ASSETS
 
    
December 31,
2021
   
December 31,
2020
 
    
RMB
   
RMB
 
Other receivables
(i)
     40,983       21,128  
Advances to suppliers
     14,900       22,330  


       55,883       43,458  
Less: Provision for impairment
     (2,986     (3,378


       52,897       40,080  
Value-added tax to recoverable
     42,644       44,514  
Prepaid expenses
     505       373  
Prepaid income taxes
     4,853       5,997  
Other current assets
(ii)
     11,921       18,298  


       112,820       109,262  


(i)
As of December 31, 2021 and December 31, 2020, the Group’s other receivables are mainly in the first stage.
(ii)
Other current assets consist primarily of receivables from associates, dividends receivables, interests receivables, etc.
 
2
4
FINANCIAL ASSETS AT FAIR VALUE THROUGH OTHER COMPREHENSIVE INCOME
Financial assets at fair value through other comprehensive income represent mainly bills of acceptance issued by banks. The Group’s business model of financial assets at fair value through other comprehensive income is achieved both by collecting contractual cash flows and selling of these assets. All financial assets at fair value through other comprehensive income are due within one year, and their fair values approximate the face values of the bills.
 
2
5
CASH AND CASH EQUIVALENTS
The weighted average effective interest rate on bank deposits was 1.68% per annum for the year ended December 31, 2021 (2020: 1.69% per annum, 2019: 1.69% per annum).
 
26
ASSETS AND LIABILITIES HELD FOR SALE

On December 22, 2020, a subsidiary of the Company, Kunlun Energy Company Limited (Kunlun Energy), and PipeChina entered into an agreement pursuant to which Kunlun Energy agreed to transfer the 60% equity interest in PetroChina Beijing Gas Pipeline Co., Ltd (“Beijing Pipeline”) and 75% equity interest in PetroChina Dalian LNG Company Limited (“Dalian LNG”) (Beijing Pipeline and Dalian LNG collectively refer as “Target Companies”) at a base consideration of approximately RMB 40,886 (subject to the adjustments according to the price adjustment mechanism as set out in the agreement), which all will be settled in cash by PipeChina. The transaction was completed in April 2021 and the Group ceased to hold any equity interests in the Target Companies, thus losing the control of these two companies. The assets and liabilities of Beijing Pipeline and Dalian LNG are presented as assets held for sale RMB 42,615 and liabilities held for sale RMB 9,956 respectively on December 31, 2020. The assets held for sale mainly included property, plant and equipment amounted to RMB 41,158, and the liabilities held for sale mainly included long-term and short-term borrowings amounted to RMB 6,500 and accounts payable and other payables amounted to RMB 3,291.

F-53

Table of Contents
 
 
PETROCHINA COMPANY LIMITED
NOTES TO THE FINANCIAL STATEMENTS — (Continued)
(All amounts in millions, except for the per share data and otherwise stated)

27
ACCOUNTS PAYABLE AND ACCRUED LIABILITIES

    
December 31,
2021
    
December 31,
2020
 
    
RMB
    
RMB
 
Trade payables
     144,419        113,119  
Salaries and welfare payable
     8,975        8,649  
Dividends payable by subsidiaries to
non-controlling
shareholders
     419        952  
Interests payable
     2,672        4,034  
Construction fee and equipment cost payables
     92,683        107,199  
Other
(i)
     53,834        82,187  


       303,002        316,140  


(i)
Other consists primarily of notes payables, insurance payable, etc.
 
As of December 31, 2021, trade payables included derivative financial liabilities, which were generated by hedges, of RMB
3,881 (2020: RMB
3,709).
The aging analysis of trade payables at December 31, 2021 and 2020 is as follows:
 
    
December 31, 2021
    
December 31, 2020
 
    
RMB
    
RMB
 
Within 1 year
     134,744        104,812  
Between 1 and 2 years
     2,767        1,696  
Between 2 and 3 years
     948        2,342  
Over 3 years
     5,960        4,269  


       144,419        113,119  


2
8
CONTRACT LIABILITIES
As of December 31, 2021 and December 31, 2020, contract liabilities mainly represented advances from customers related to the sales of crude oil, natural gas and refined oil, etc. The majority of related obligations were expected to be performed with corresponding revenue recognized within one year. Substantially all of contract liabilities at the beginning of the year has been recognized as revenue for the year ended December 31, 2021.
 
2
9
BORROWINGS
 
    
December 31, 2021
    
December 31, 2020
 
    
RMB
    
RMB
 
Short-term borrowings excluding current portion of long-term borrowings
     40,010        42,354  
Current portion of long-term borrowings
     13,265        75,188  


       53,275        117,542  
Long-term borrowings
     287,175        251,379  


       340,450        368,921  


F-54

Table of Contents
PETROCHINA COMPANY LIMITED
NOTES TO THE FINANCIAL STATEMENTS — (Continued)
(All amounts in millions, except for the per share data and otherwise stated)


December 31, 2021
    
December 31, 2020
 
    
RMB
    
RMB
 
Bank loans
     114,469        80,345  
Corporate debentures
     20,170        51,239  
Medium-term notes
     71,000        86,000  
Other loans
     134,811        151,337  


       340,450        368,921  


Borrowings of the Group of RMB 13,558 were guaranteed by CNPC and its fellow subsidiaries and non-controlling interests of the subsidiaries of the Group at December 31, 2021 (December 31, 2020: RMB13,726).
 

The Group’s borrowings include mortgage loans totaling RMB 1,185 at December 31,2021 (2020: RMB 3,486), which were secured by property, plant and equipment with net book value of RMB 1,287 and intangible and other
non-current
assets with net book value of RMB 117.
 
    
December 31, 2021
   
December 31, 2020
 
    
RMB
   
RMB
 
Total borrowings:
                
- interest free
     101       110  
- at fixed rates
     131,705       192,079  
- at floating rates
     208,644       176,732  


       340,450       368,921  


Weighted average effective interest rates:
                
- bank loans
     2.18     2.20
- corporate debentures
     4.14     3.49
- medium-term notes
     3.28     3.32
- other loans
     2.51     3.47
The borrowings by major currency at December 31, 2021 and 2020 are as follows:
 
    
December 31, 2021
    
December 31, 2020
 
    
RMB
    
RMB
 
RMB
     238,361        262,458  
US Dollar
     94,803        98,553  
Other currencies
     7,286        7,910  


       340,450        368,921  


The fair values of the Group’s long-term borrowings including the current portion of long-term borrowings are RMB 290,937 at December 31, 2021 (December 31, 2020: RMB 323,809). The carrying amounts of short-term borrowings approximate their fair values.The fair values are based on discounted cash flows using applicable discount rates based upon the prevailing market rates of interest available to the Group for financial instruments with substantially the same terms and characteristics at the dates of the consolidated statement of financial position. Such discount rates ranged from 0.10% to 5.14% per annum as of December 31, 2021 (December 31, 2020:
-0.49%
to 4.65% per annum) depending on the type of the borrowings.
 
F-55

Table of Contents
PETROCHINA COMPANY LIMITED
NOTES TO THE FINANCIAL STATEMENTS — (Continued)
(All amounts in millions, except for the per share data and otherwise stated)
 
The following table sets out the borrowings’ remaining contractual maturities at the date of the consolidated statement of financial position, which are based on contractual undiscounted cash flows including principal and interest, and the earliest contractual maturity date:
 
    
December 31, 2021
    
December 31, 2020
 
    
RMB
    
RMB
 
Within 1 year
     58,923        124,777  
Between 1 and 2 years
     53,250        53,526  
Between 2 and 5 years
     226,124        188,012  
After 5 years
     28,053        27,894  


       366,350        394,209  


Reconciliation of movements of borrowings to cash flows arising from financing activities:
 
    
2021
   
2020
 
    
RMB
   
RMB
 
At beginning of the year
     368,921       466,722  
Changes from financing cash flows
                
Increase in borrowings
     810,092       989,492  
Repayments of borrowings
     (836,434     (1,017,662


Total changes from financing cash flows
     (26,342     (28,170
Exchange adjustments
     (2,129     (6,282
Pipeline restructuring (Note 41)
     —         (56,849
Reclassified as liabilities held for sale (Note 2
6
)
     —         (6,500


At end of the year
     340,450       368,921  


30
SHARE CAPITAL


December 31, 2021
    
December 31, 2020
 
    
RMB
    
RMB
 
Registered, issued and fully paid:
                 
A shares
     161,922        161,922  
H shares
     21,099        21,099  


       183,021        183,021  


In accordance with the Restructuring Agreement between CNPC and the Company effective as of November 5, 1999, the Company issued
160
 billion state-owned shares in exchange for the assets and liabilities transferred to the Company by CNPC. The 160 billion state-owned shares were the initial registered capital of the Company with a par value of RMB
1.00
yuan per share.
On April 7, 2000, the Company issued 17,582,418,000 shares, represented by 13,447,897,000 H shares and 41,345,210 ADSs (each representing 100 H shares) in a global initial public offering (“Global Offering”) and the trading of the H shares and the ADSs on
T
he Stock Exchange of Hong Kong Limited and the New York Stock Exchange commenced on April 7, 2000 and April 6, 2000, respectively. Pursuant to the approval of the China Securities Regulatory Commission, 1,758,242,000 state-owned shares of the Company owned by CNPC were converted into H shares for sale in the Global Offering. The H shares and ADSs were issued at prices of


F-56

Table of Contents
PETROCHINA COMPANY LIMITED
NOTES TO THE FINANCIAL STATEMENTS — (Continued)
(All amounts in millions, except for the per share data and otherwise stated)
HK$ 1.28 per H share and US$ 16.44 per ADS respectively for which the net proceeds to the Company were approximately RMB 20 billion. The shares issued pursuant to the Global Offering rank equally with existing shares.
On September 1, 2005, the Company issued an additional 3,196,801,818 new H shares at HK$ 6.00 per share and net proceeds to the Company amounted to approximately RMB 19,692. CNPC also sold 319,680,182 state-owned shares it held concurrently with PetroChina’s sale of new H shares in September 2005.
On October 31, 2007, the Company issued 4,000,000,000 new A shares at RMB 16.70 yuan per share and net proceeds to the Company amounted to approximately RMB 66,243 and the listing and trading of the A shares on the Shanghai Stock Exchange commenced on November 5, 2007.

Following the issuance of the A shares, all the existing state-owned shares issued before November 5, 2007 held by CNPC have been registered with the China Securities Depository and Clearing Corporation Limited as A shares.
Shareholders’ rights are governed by the Company Law of the PRC that requires an increase in registered capital to be approved by the shareholders in shareholders’ general meetings and the relevant PRC regulatory authorities.


F-57

Table of Contents
PETROCHINA COMPANY LIMITED
NOTES TO THE FINANCIAL STATEMENTS — (Continued)
(All amounts in millions, except for the per share data and otherwise stated)
 
31
RESERVES

    
2021
   
2020
 
    
RMB
   
RMB
 
Capital Reserve
                
Beginning balance
     133,308       133,308  


Ending balance
     133,308       133,308  
     
Statutory Common Reserve Fund
(a)
                
Beginning balance
     203,557       197,282  
Transfer from retained earnings
     8,413       6,275  


Ending balance
     211,970       203,557  
     
Special Reserve-Safety Fund Reserve
                
Beginning balance
     10,810       12,443  
Safety fund reserve
     (1,579     (1,633


Ending balance
     9,231       10,810  
     
Currency Translation Differences
(b)
                
Beginning balance
     (32,848     (28,939
Currency translation differences
     (2,684     (3,909


Ending balance
     (35,532     (32,848
     
Other Reserves
                
Beginning balance
     (10,645     (10,083


Transaction with
non-controlling
interests
     (15     —    
Fair value changes in equity investments measured at fair value through other comprehensive income
     79       (22
Share of the other comprehensive income of associates and joint ventures accounted for using the equity method
     (4     (441
Other
     168       (99


Ending balance
     (10,417     (10,645


       308,560       304,182  


(a)
Pursuant to the PRC regulations and the Company’s Articles of Association, the Company is required to transfer 10% of its net profit, as determined under the PRC accounting regulations, to a Statutory Common Reserve Fund (“Reserve Fund”). Appropriation to the Reserve Fund may cease when the fund aggregates to 50% of the Company’s registered capital. The transfer to this reserve must be made before distribution of dividends to shareholders.

The Reserve Fund shall only be used to make good previous years’ losses, to expand the Company’s production operations, or to increase the capital of the Company. Upon approval of a resolution of shareholders’ in a general meeting, the Company may convert its Reserve Fund into share capital and issue bonus shares to existing shareholders in proportion to their original shareholdings or to increase the nominal value of each share currently held by them, provided that the balance of the Reserve Fund after such issuance is not less than 25% of the Company’s registered capital.
 
(b)
The translation reserve comprises all foreign currency differences arising from the translation of the financial statements of foreign operations.

F-58

Table of Contents
PETROCHINA COMPANY LIMITED
NOTES TO THE FINANCIAL STATEMENTS — (Continued)
(All amounts in millions, except for the per share data and otherwise stated)
 
32
DEFERRED TAXATION
The movements in the deferred taxation account are as follows:
 
    
2021
   
2020
   
2019
 
    
RMB
   
RMB
   
RMB
 
At beginning of the year
     (5,016     2,848       6,483  
Transfer to profit and loss (Note 12)
     (9,685     (7,666     (3,485
Credit / (debit) to other comprehensive income
     224       (198     (150


At end of the year
     (14,477     (5,016     2,848  


Deferred tax balances before offset are attributable to the following items:
 
    
December 31,
2021
   
December 31,
2020
 
    
RMB
   
RMB
 
Deferred tax assets:
                
Receivables and inventories
     9,124       4,740  
Tax losses
     1,892       24,646  
Impairment, depreciation and depletion of long-term assets
     8,250       6,309  
Other
     7,897       6,622  


Total deferred tax assets
     27,163       42,317  


Deferred tax liabilities:
                
Accelerated tax depreciation
     16,023       24,147  
Other
     25,617       23,186  


Total deferred tax liabilities
     41,640       47,333  


Net deferred tax liabilities
     (14,477     (5,016


Deferred tax balances after offset are listed as follows:
 
    
December 31,
2021
    
December 31,
2020
 
    
RMB
    
RMB
 
Deferred tax assets
     12,161        11,364  
Deferred tax liabilities
     26,638        16,380  

At December 31, 2021, certain subsidiaries of the Company did not
recognize
deferred tax asset of deductible tax losses carried forward of RMB 109,752, of which RMB 13,866 was incurred for the year ended December 31, 2021, because it was not probable that the related tax benefit will be realised. These deductible tax losses carried forward of RMB 525, RMB 400, RMB 585, RMB 3,669 and RMB 104,573 will expire in 2022, 2023, 2024, 2025, 2026 and thereafter, respectively.

F-59

Table of Contents
PETROCHINA COMPANY LIMITED
NOTES TO THE FINANCIAL STATEMENTS — (Continued)
(All amounts in millions, except for the per share data and otherwise stated)
 
33
ASSET RETIREMENT OBLIGATIONS
 
    
2021
   
2020
   
2019
 
    
RMB
   
RMB
   
RMB
 
At beginning of the year
     114,819       137,935       132,780  
Net liabilities incurred, including reassessment(i)

     16,057       (24,059     2,026  
Liabilities settled
     (5,969     (3,510     (2,427
Accretion expense (Note 10)
     4,696       5,107       5,525  
Currency translation differences
     (198     (654     31  


At end of the year
     129,405       114,819       137,935  


(i)
In 2020, domestic oil and gas field companies adjusted the discount period with reference to the remaining life corresponding to the proved developed reserves in each block, updated various oil and gas assets retirement standards based on the latest legal requirements, technology and price levels, reviewed the adopted discount rate, and then recalculate and adjust the provision for the asset retirement expense of oil and gas properties at the end of the year. The changes in related accounting estimates and new liabilities provided resulted in a reduction in estimated liabilities of RMB 24,059.
Asset retirement obligations relate to oil and gas properties (Note 15).
 
3
4
PENSIONS
The Group participates in various employee retirement benefit plans (Note 3(aa)). Expenses incurred by the Group in connection with the retirement benefit plans for the year ended December 31, 2021 amounted to RMB 19,939 (2020: RMB 16,833, 2019: RMB 20,196).
For the years ended December 31, 2021
,
the Group had no forfeited in the defined contribution plans available for the Group used to reduce the existing contribution level.
 
3
5
CONTINGENT LIABILITIES
(a) Bank and other guarantees
At December 31, 2021 and 2020, the Group did not guarantee related parties or third parties any significant borrowings or others.
(b) Environmental liabilities
The PRC has enacted comprehensive environmental laws and regulations that affect the operation of the oil and gas industry. Management believes that there are no probable liabilities under existing legislation, except for the amounts which have already been reflected in the consolidated financial statements, which may have a material adverse effect on the financial position of the Group.
As of December 31,2021, the amounts of asset retirement obligations which have already been reflected in the consolidated financial statements relating to environmental liability were RMB 129,405
(2020: 114,819)
 
(Note 3
3
).
 
F-60

Table of Contents
PETROCHINA COMPANY LIMITED
NOTES TO THE FINANCIAL STATEMENTS — (Continued)
(All amounts in millions, except for the per share data and otherwise stated)
 
(c) Legal contingencies
During the reporting period, the Group has complied with domestic and overseas laws and regulatory requirements. Notwithstanding certain insignificant lawsuits as well as other proceedings outstanding, management believes that any resulting liabilities will not have a material adverse effect on the financial position of the Group.

(d) Group insurance

The Group has insurance coverage for certain assets that are subject to significant operating risks, third-party liability insurance against claims relating to personal injury, property and environmental damages that result from accidents and employer liabilities insurance. The potential effect on the financial position of the Group of any liabilities resulting from future uninsured incidents cannot be estimated by the Group at present.
 
3
6
COMMITMENTS
(a) Capital commitments
At December 31, 2021, the Group’s capital commitments contracted but not provided for, mainly relating to property, plant and equipment were RMB 882 (December 31, 2020: RMB 714).
 
These capital commitments are transactions mainly with CNPC and its fellow subsidiaries.
(b) Exploration and production licenses
The Company is obligated to make annual payments with respect to its exploration and production licenses to the Ministry of Natural Resources. Payments incurred were RMB 744 for the year ended December 31, 2021 (2020: RMB 700, 2019: RMB 535).
According to the current policy, estimated annual payments for the next five years are as follows:
 
    
December 31,
2021
    
December 31,
2020
 
    
RMB
    
RMB
 
Within one year
     500        800  
Between one and two years
     500        800  
Between two and three years
     500        800  
Between three and four years
     500        800  
Between four and five years
     500        800  
 
3
7
MAJOR CUSTOMERS
The Group’s major customers are as follows:
 
    
2021
    
2020
    
2019
 
    
Revenue
    
Percentage
of
t
otal

revenue
    
Revenue
    
Percentage
of
t
otal

revenue
    
Revenue
    
Percentage
of
t
otal

revenue
 
    
RMB
    
%
    
RMB
    
%
    
RMB
    
%
 
China Petrochemical Corporation and its fellow subsidiaries
     136,500        5        98,636        5        105,855        4  
CNPC and its fellow subsidiaries
     69,058        3        63,623        3        99,279        4  


       205,558        8        162,259        8        205,134        8  


F-61

Table of Contents
PETROCHINA COMPANY LIMITED
NOTES TO THE FINANCIAL STATEMENTS — (Continued)
(All amounts in millions, except for the per share data and otherwise stated)
 
3
8
RELATED PARTY TRANSACTIONS
CNPC, the immediate parent of the Company, is a limited liability company incorporated in PRC and directly controlled by the PRC government. Equity interest and voting rights of CNPC in the Company in 2021 was 80.41% (Dec
e
mber 31, 2020: 80.41%)

Related parties include CNPC and its fellow subsidiaries, their associates and joint ventures, other state-owned enterprises and their subsidiaries which the PRC government has control, joint control or significant influence over
,
and enterprises which the Group is able to control, jointly control or exercise significant influence over, key management personnel of the Company and CNPC and their close family members.
(a) Transactions with CNPC and its fellow subsidiaries, associates and joint ventures
The Group has extensive transactions with other companies in CNPC and its fellow subsidiaries, associates and joint ventures. Due to these relationships, it is possible that the terms of the transactions between the Group and other members of CNPC and its fellow subsidiaries, associates and joint ventures are not the same as those that would result from transactions with other related parties or wholly unrelated parties.
The principal related party transactions with CNPC and its fellow subsidiaries, associates and joint ventures, which were carried out in the ordinary course of business, are as follows:
The Company and CNPC entered into a new Comprehensive Products and Services Agreement on August 27, 2020 for a period of three years effective from January 1, 2021. The Comprehensive Products and Services Agreement provides for a range of products and services which may be required and requested by either party. The products and services to be provided by CNPC and its fellow subsidiaries to the Group under the Comprehensive Products and Services Agreement include construction and technical services, production services, supply of material services, social services, ancillary services and financial services. The products and services required and requested by either party are provided in accordance with (1) government-prescribed prices; or (2) where there is no government-prescribed price, with reference to relevant market prices; or (3) where neither (1) nor (2) is applicable, then the actual cost incurred or the agreed contractual prices are used.
On August 25,
 
2011, based on the Land Use Rights Leasing Contract signed for a period of 50 years from 2000, the Company and CNPC entered into a supplemental agreement to the Land Use Rights Leasing Contract which took effect on January 1, 2012. The expiry date of the supplemental agreement is the same as the Land Use Rights Leasing Contract, which is in 2050. The Company and CNPC may adjust area and rental payable for the leased land parcels every three years taking into consideration of production and operations of the Company and the prevailing market price. On August 27, 2020, the Company and CNPC each issued a confirmation letter to the Land Use Rights Leasing Contract, which adjusted the rental payable and the area for the leased land parcels with effect from January 1, 2021. The Company agreed to rent from CNPC and its fellow subsidiaries parcels of land with an aggregate area of approximately 1,142 million square metres with annual rental payable (exclusive of tax and government charges) approximately RMB 5,673 based on the area of leased land parcels and the current market conditions. Apart from the annual rental payable and are for the leased parcels, the other terms in the Land Use Rights Leasing Contract and supplemental agreement remained.
On August 24, 2017, the Company entered into a new Buildings Leasing Contract with CNPC
,
 
which took effect on January 1, 2018 for a period of 20 years.
The Company and CNPC may adjust the area of buildings leased and the rental fees every three years as appropriate by reference to the production and operations of the Company and the prevailing market prices, but the adjusted rental shall not exceed the comparable fair market
 
F-62

Table of Contents
PETROCHINA COMPANY LIMITED
NOTES TO THE FINANCIAL STATEMENTS — (Continued)
(All amounts in millions, except for the per share data and otherwise stated)
prices. On August 27, 2020, the Company and CNPC issued a confirmation letter to the Buildings Leasing Contract,
 which adjusted the annual rental payable and the area for the leased which took effect on January 1, 2021. Buildings covering an aggregate area of 1,287,486 square meters were leased at annual rental payable approximately RMB 713 in accordance with the confirmed rental area and the current property market conditions. Apart from the annual rental payable and area of the leased building, the other terms in the Building Leasing Contract remains unchanged.


Transactions with CNPC and its fellow subsidiaries, associates and joint ventures are summarised as follows:
 
   
Sales of goods represent the sale of crude oil, refined products, chemical products and natural gas, etc. The total amount of these transactions amounted to RMB 115,587
 
for the year ended December 31, 2021 (2020: RMB 105,535, 2019: RMB 122,927).
 
   
Sales of services principally represent the provision of services in connection with the transportation of crude oil and natural gas, etc. The total amount of these transactions amounted to RMB 8,313 for the year ended December 31, 2021 (2020: RMB 8,593, 2019: RMB 10,055).
 
   
Purchases of goods and services principally represent construction and technical services, production services, social services, ancillary services and material supply services, etc. The total amount of these transactions amounted to RMB 416,561 for the year ended December 31, 2021 (2020: RMB 321,858, 2019: RMB 388,802).
 
   
Purchases of assets principally represent the purchases of manufacturing equipment, office equipment and transportation equipment, etc. The total amount of these transactions amounted to RMB 1,051 for the year ended December 31, 2021 (2020: RMB 767, 2019: RMB 1,701).
 
   
Interest income represents interests from deposits placed with CNPC and its fellow subsidiaries. The total interest income amounted to RMB 270 for the year ended December 31, 2021 (2020: RMB 381, 2019: RMB 460). The balance of deposits at December 31, 202
1
 was RMB 36,489 (December 31, 2020: RMB 40,377).
 
   
Interest expense and other financial service expense, principally represents interest charged on the loans from CNPC and its fellow subsidiaries, insurance fee charged on the insurance services from CNPC and its fellow subsidiaries, etc. The total amount of these transactions amounted to RMB 4,878 for the year ended December 31, 2021 (2020: RMB 8,051
,
 
2019: RMB8,759
)
.
 
   
The borrowings from CNPC and its fellow subsidiaries at December 31, 2021 were RMB 133,800 (December 31, 2020: RMB 96,298).
 
   
Rents and other payments paid to CNPC and its fellow subsidiaries
including
(1) the rental expense paid by the Group according to Land Use Rights Leasing Contract and Buildings Leasing Contract; (2) the payable by the Group (including all rents, leasing service fees and prices for exercising purchase options) for the period according to the leasing agreements entered into by the Group and CNPC and its fellow subsidiaries. The total rents and other payments amounted to RMB 6,797 for the year ended December 31, 2021. (2020: RMB 8,294, 2019: RMB 10,106).
 
F-63

Table of Contents
PETROCHINA COMPANY LIMITED
NOTES TO THE FINANCIAL STATEMENTS — (Continued)
(All amounts in millions, except for the per share data and otherwise stated)
 
Amounts due from and to CNPC and its fellow subsidiaries, associates and joint ventures included in the following accounts captions are summarized as follows:
 
    
December 31, 2021
    
December 31, 2020
 
    
RMB
    
RMB
 
Accounts receivable
     7,395        8,651  
Prepayments and other current assets
     24,925        35,063  
Financial assets at fair value through other comprehensive income
     1,850         
Intangible and other
non-current
assets
     15,696        15,251  
Accounts payable and accrued liabilities
     49,526        67,262  
Contract liabilities
     613        2,692  
Lease liabilities
     101,453        99,725  
(b) Key management compensation
 
    
Year End December 31,
 
    
2021
    
2020
    
2019
 
    
RMB’000
    
RMB’000
    
RMB’000
 
Emoluments and other benefits
     15,143        16,598        13,042  
Contribution to retirement benefit scheme
     1,568        1,338        1,796  


       16,711        17,936        14,838  


(c) Transactions with other state-controlled entities in the PRC
Apart from transactions with CNPC and its fellow subsidiaries, associates and joint ventures, the Group’s transactions with other state-controlled entities include but
are
not limited to the following:
 
   
Sales and purchases of goods and services,
 
   
Purchases of assets,
 
   
Lease of assets; and
 
   
Bank deposits and borrowings
These transactions are conducted in the ordinary course of the Group’s business.
 
3
9
SEGMENT INFORMATION
The Group is principally engaged in a broad range of petroleum related products, services and activities. The Group’s operating segments comprise: Exploration and Production, Refining and Chemicals, Marketing, and Natural Gas and Pipeline. On the basis of these operating segments, the management of the Company assesses the segmental operating results and allocates resources. Sales between operating segments are conducted principally at market prices. Additionally, the Group presents geographical information based on entities located in regions with a similar risk profile.
The Exploration and Production segment is engaged in the exploration, development, transportation, production and marketing of crude oil and natural gas.
The Refining and Chemicals segment is engaged in the refining of crude oil and petroleum products, production and marketing of primary petrochemical products, derivative petrochemical products and other chemical products.
 
F-64

Table of Contents
PETROCHINA COMPANY LIMITED
NOTES TO THE FINANCIAL STATEMENTS — (Continued)
(All amounts in millions, except for the per share data and otherwise stated)
 
The Marketing segment is engaged in the marketing of refined products and
non-oil
products, and the trading business.
The Natural Gas and Pipeline segment is engaged in the transportation and sale of natural gas.
The Head Office and Other segment relates to cash management and financing activities, the corporate center, research and development, and other business services supporting the other operating business segments of the Group.
In 2020, in order to promote the transformation and upgrading of refining and chemicals business, promote the quality-oriented business development of refined products and lubricating oil production and marketing, promote specialized operation, market-oriented operation, lean management and integrated coordination, the Group transferred PetroChina Fuel Oil Co., Ltd. and PetroChina Lubricant Company from Marking to Refining and Chemicals, and synchronize budget control and performance evaluation indicator accordingly. The comparative data regarding the Refining and Chemicals and the Marketing segment in the same period of 2019 is restated, and two companies above are as included in the Refining and Chemicals segment from the earliest reporting period as reported.
The accounting policies of the operating segments are the same as those described in Note 3—“Summary of Principal Accounting Policies”.
 

F-65

Table of Contents
PETROCHINA COMPANY LIMITED
NOTES TO THE FINANCIAL STATEMENTS — (Continued)
(All amounts in millions, except for the per share data and otherwise stated)
 
The segment information for the operating segments for the years ended December 31, 2021, 2020 and 2019 are as follows:
 
   
Year Ended December 31, 2021
 
   
Exploration

and

Production
   
Refining

and

Chemicals
   
Marketing
   
Natural
Gas and
Pipeline
   
Head

Office and

Other
   
Total
 
   
RMB
   
RMB
   
RMB
   
RMB
   
RMB
   
RMB
 
Revenue
    688,334       974,972       2,170,062       417,022       3,894       4,254,284  
Less: Intersegment sales
    (571,705     (650,018     (397,485     (19,526     (1,201     (1,639,935


Revenue from external customers
    116,629       324,954       1,772,577       397,496       2,693       2,614,349  


Depreciation, depletion and amortization
    (175,329     (28,466     (20,338     (5,288     (1,848     (231,269
Including: Impairment losses of property, plant and equipment
    (20,218     (4,681     (1,396     (176     —         (26,471
Profit / (loss) from operations
    68,452       49,740       13,277       43,965       (14,281     161,153  
Finance costs:
                                               
Exchange gain
                                            13,377  
Exchange loss
                                            (12,839
Interest income
                                            2,984  
Interest expense
                                            (19,739


Total net finance costs
                                            (16,217


Share of profit of associates and joint ventures
    2,633       68       680       7,570       2,316       13,267  


Profit before income tax
expense
                                            158,203  
Income tax expense
                                            (43,507


Profit for the year
                                            114,696  


Segment assets
    1,391,129       457,914       520,938       164,934       1,573,900       4,108,815  
Other assets
                                            17,014  
Investments in associates and joint ventures
    44,289       1,966       19,020       169,611       30,899       265,785  
Elimination of intersegment balances
(a)
                                            (1,889,352


Total assets
                                            2,502,262  


Capital expenditures
    178,259       54,487       10,982       6,750       700       251,178  
Segment liabilities
    550,365       199,159       349,609       128,490       566,602       1,794,225  
Other liabilities
                                            103,412  
Elimination of intersegment balances
(a)
                                            (804,244


Total liabilities
                                            1,093,393  


F-66

Table of Contents
PETROCHINA COMPANY LIMITED
NOTES TO THE FINANCIAL STATEMENTS — (Continued)
(All amounts in millions, except for the per share data and otherwise stated)
 
   
Year Ended December 31, 2020
 
   
Exploration

and

Production
   
Refining

and

Chemicals
   
Marketing
   
Natural
Gas and
Pipeline
   
Head

Office and

Other
   
Total
 
   
RMB
   
RMB
   
RMB
   
RMB
   
RMB
   
RMB
 
Revenue
    530,807       774,775       1,497,533       370,771       3,547       3,177,433  
Less: Intersegment sales
    (437,670     (492,667     (276,503     (35,437     (1,320     (1,243,597


Revenue from external customers
    93,137       282,108       1,221,030       335,334       2,227       1,933,836  


Depreciation, depletion and amortization
    (150,849     (23,893     (17,833     (19,475     (1,825     (213,875
Including: Impairment losses of property, plant and equipment
    (15,364     —         (3     —         —         (15,367
Profit / (loss) from operations
    23,092       (1,834     (2,906     72,410       (14,825     75,937  
Finance costs:
                                               
Exchange gain
                                            14,387  
Exchange loss
                                            (14,279
Interest income
                                            3,023  
Interest expense
                                            (26,528


Total net finance costs
                                            (23,397


Share of (loss)/profit of associates and joint ventures
    (616     (24     (728     2,128       2,773       3,533  


Profit before income tax expense
                                            56,073  
Income tax expense
                                            (22,588


Profit for the year
                                            33,485  


Segment assets
    1,452,554       432,022       489,984       195,353       1,631,577       4,201,490  
Other assets
                                            17,361  
Investments in associates and joint ventures
    41,461       1,289       18,239       160,730       28,884       250,603  
Elimination of intersegment balances
(a)
                                            (1,981,328


Total assets
                                            2,488,126  


Capital expenditures
    186,620       21,810       16,294       21,143       626       246,493  
Segment liabilities
    658,521       186,332       321,460       192,456       573,340       1,932,109  
Other liabilities
                                            80,104  
Elimination of intersegment balances
(a)
                                            (890,708


Total liabilities
                                            1,121,505  


F-67

Table of Contents
PETROCHINA COMPANY LIMITED
NOTES TO THE FINANCIAL STATEMENTS — (Continued)
(All amounts in millions, except for the per share data and otherwise stated)
 
   
Year Ended December 31, 2019
 
   
Exploration

and

Production
   
Refining

and

Chemicals
   
Marketing
   
Natural
Gas and
Pipeline
   
Head

Office and

Other
   
Total
 
   
RMB
   
RMB
   
RMB
   
RMB
   
RMB
   
RMB
 
Revenue
    676,320       1,000,062       2,075,044       391,023       3,700       4,146,149  
Less: intersegment sales
    (552,672     (702,207     (332,164     (40,652     (1,644     (1,629,339


Revenue from external customers
    123,648       297,855       1,742,880       350,371       2,056       2,516,810  


Depreciation, depletion and amortization
    (158,874     (25,469     (16,657     (22,375     (1,887     (225,262
Including: Impairment losses of property, plant and equipment
    (11,562     (1,444     (1     (412           (13,419
Profit / (loss) from operations
    96,097       16,077       (2,878     26,108       (13,642     121,762  
Finance costs:
                                               
Exchange gain
                                            10,017  
Exchange loss
                                            (10,016
Interest income
                                            3,631  
Interest expense
                                            (30,409


Total net finance costs
                                            (26,777


Share of profit of associates and joint ventures
    3,513       —         1,460       501       2,755       8,229  


Profit before income tax expense
                                            103,214  
Income tax expense
                                            (36,199


Profit for the year
                                            67,015  


Segment assets
    1,520,697       404,264       485,085       536,298       1,409,368       4,355,712  
Other assets
                                            29,908  
Investments in associates and joint ventures
    45,721       1,371       18,810       9,713       26,458       102,073  
Elimination of
 
intersegment balances
(a)
                                            (1,754,783


Total assets
                                            2,732,910  


Capital expenditures
    230,117       21,823       17,074       27,004       758       296,776  
Segment liabilities
    720,028       151,051       305,804       277,370       594,000       2,048,253  
Other liabilities
                                            88,793  
Elimination of intersegment balances
(a)
                                            (848,441


Total liabilities
                                            1,288,605  


Geographical information
 
    
Revenue
    
Non-current
assets
(b)
 
    
2021
    
2020
    
2019
    
December 31,
2021
    
December 31,
2020
 
    
RMB
    
RMB
    
RMB
    
RMB
    
RMB
 
Mainland China
     1,626,616        1,212,821        1,476,693        1,838,505        1,789,349  
Other
     987,733        721,015        1,040,117        165,117        190,625  


2,614,349


1,933,836


2,516,810


2,003,622


1,979,974


F-68

Table of Contents
PETROCHINA COMPANY LIMITED
NOTES TO THE FINANCIAL STATEMENTS — (Continued)
(All amounts in millions, except for the per share data and otherwise stated)
 
(a)
Elimination of intersegment balances represents elimination of intersegment accounts and investments.
(b)
Non-current
assets mainly include
non-current
assets other than financial instruments and deferred tax assets.
 
40
APPROVAL OF FINANCIAL STATEMENTS
The financial statements were approved by the Board of Directors on April 29, 2022.
 

41
TRANSACTION ON PIPELINE RESTRUCTURING
In 2020, the “Other income, net” mainly included the gain on Pipeline restructuring.
On July 23, 2020, the Company entered into the Framework Agreement on Transaction of Oil and Gas Pipeline Relevant Assets and 10 sub-agreements including the Equity Acquisition Agreement on PetroChina Pipeline Co., Ltd., and the Production and Operation Agreement with PipeChina (“Transaction Agreements”) which was approved at the sixth meeting of the Board of Directors of the Company in 2020 and forth meeting of the Supervisory Committee of the Company in 2020. The Company sold its major oil and gas pipelines, certain gas storages, LNG terminals and initial oil and gas (including its equity interests) (“Target Assets”) to PipeChina for 29.9% of its equity interests (RMB 149,500) and corresponding cash consideration (the “Pipeline restructuring”).
On September 28, 2020, the Pipeline restructuring was reviewed and approved by the second extraordinary general meeting of the Company in 2020.
On September 30, 2020, all of the conditions precedent set out in the Transaction Agreements have been satisfied. The ownership and risk of the Target Assets has been passed to PipeChina by 24:00 on September 30, 2020.
In this transaction, the equity consideration and cash consideration received by the Company amount to RMB 247,471, and the net assets attributable to the Company on the disposal date amount to RMB 200,525, and the corresponding gain on Pipeline restructuring was RMB 46,946.


September 30, 2020


RMB
 
Current assets
  
 
36,573
 
Non-current Assets
  
 
319,874


Total assets
  
 
356,447
 
Current liabilities
  
 
36,886
 
Non-current Liabilities
  
 
61,611


Total liabilities
  
 
98,497


Net assets
  
 
257,950


Net assets attributable to the Company
  
 
200,525
 
Consideration
  
 
247,471
 
Gain on Pipeline restructuring
  
 
46,946


F-69

Table of Contents
PETROCHINA COMPANY LIMITED
SUPPLEMENTARY INFORMATION ON OIL AND GAS EXPLORATION
AND PRODUCTION ACTIVITIES (UNAUDITED)
(All amounts in millions, except for the per share data and otherwise stated)
In
 
accordance with the Accounting Standards Update
2010-03
Extractive Activities – Oil and Gas (Topic 932): Oil and Gas Reserve Estimation and Disclosures (an update of Accounting Standards Codification Topic 932 Extractive Activities – Oil and Gas or “ASC 932”) issued by the Financial Accounting Standards Board and corresponding disclosure requirements of the U.S. Securities and Exchange Commission, this section provides supplemental information on oil and gas exploration and development; and results of operation related to oil and gas producing activities of the Company and its subsidiaries (the “Group”) and also the Group’s investments that are accounted for using the equity method of accounting.
The supplemental information presented below covers the Group’s proved oil and gas reserves estimates, historical cost information pertaining to capitalized costs, costs incurred for property acquisitions, exploration and development activities, result of operations for oil and gas producing activities, standardized measure of estimated discounted future net cash flows and changes in estimated discounted future net cash flows.
The “Other” geographic area includes oil and gas producing activities principally in countries such as Kazakhstan, Australia and Indonesia. As the Group does not have significant reserves held through its investments accounted for using the equity method, information presented in relation to these equity method investments is presented in the aggregate.

Proved Oil and Gas Reserve Estimates
Proved oil and gas reserves cannot be measured exactly. Reserve estimates are based on many factors related to reservoir performance that require evaluation by the engineers interpreting the available data, as well as price and other economic factors. The reliability of these estimates at any point in time depends on both the quality and quantity of the technical and economic data, and the production performance of the reservoirs as well as engineering judgment. Consequently, reserve estimates are subject to revision as additional data become available during the producing life of a reservoir. When a commercial reservoir is discovered, proved reserves are initially determined based on limited data from the first well or wells. Subsequent data may better define the extent of the reservoir and additional production performance, well tests and engineering studies will likely improve the reliability of the reserve estimate. The evolution of technology may also result in the application of improved recovery techniques such as supplemental or enhanced recovery projects, or both, which have the potential to increase reserves.
Proved oil and gas reserves are the estimated quantities of crude oil and natural gas, which, by analysis of geoscience and engineering data, can be estimated with reasonable certainty to be economically producible from a given date forward, from known reservoirs, and under existing economic conditions, operating methods, and government regulation before the time at which contracts providing the right to operate expire, unless evidence indicates that renewal is reasonably certain, regardless of whether the estimate is a deterministic estimate or probabilistic estimate.
Existing economic conditions include prices and costs at which economic producibility from a reservoir is to be determined. The price shall be the average price during the
12-month
period before the ending date of the period covered by this report, determined as an unweighted arithmetic average of the
first-day-of-the-month
price for each month within such period, unless prices are defined by contractual arrangements, excluding escalations based upon future conditions. The costs shall be that prevailing at the end of the period.
Proved developed oil and gas reserves are proved reserves that can be expected to be recovered:
a.    Through existing wells with existing equipment and operating methods or in which the cost of the required equipment is relatively minor compared with the cost of a new well.


F-70

Table of Contents
PETROCHINA COMPANY LIMITED
SUPPLEMENTARY INFORMATION ON OIL AND GAS EXPLORATION
AND PRODUCTION ACTIVITIES (UNAUDITED) — (Continued)
(All amounts in millions, except for the per share data and otherwise stated)
 
b.    Through installed extraction equipment and infrastructure operational at the time of the reserves estimate if the extraction is by means not involving a well.
Proved undeveloped oil and gas reserves are proved reserves that are expected to be recovered from new wells on undrilled acreage, or from existing wells where a relatively major expenditure is required for recompletion.
The taxes, fees and royalty in China are domestic tax schemes and are paid in cash to PRC authorities. The proved reserves includes quantities that are ultimately produced and sold to pay these taxes, fees and royalty.
Proved reserve estimates as of December 31, 2021, 2020 and 2019 were based on reports prepared by DeGolyer and MacNaughton, Gaffney, Cline & Associates, McDaniel & Associates, Ryder Scott and GLJ independent engineering consultants.
 
F-71

Table of Contents
PETROCHINA COMPANY LIMITED
SUPPLEMENTARY INFORMATION ON OIL AND GAS EXPLORATION
AND PRODUCTION ACTIVITIES (UNAUDITED) — (Continued)
(All amounts in millions, except for the per share data and otherwise stated)
 
Estimated quantities of net proved crude oil and condensate and natural gas reserves and of changes in net quantities of proved developed and undeveloped reserves for each of the periods indicated are as follows:
 
    
Crude Oil and
Condensate
   
Natural Gas
   
Total
– All products
 
    
(million barrels)
   
(billion
cubic feet)
   
(million barrels
of oil equivalent)
 
Proved developed and undeveloped reserves
                        
The Group
                        
Reserves at December 31, 2018
  
 
7,641


76,467


20,385
 
Changes resulting from:


Purchase


Revisions of previous estimates
  
 
(50
 
 
(766
 
 
(177
Improved recovery
  
 
91


91
 
Extensions and discoveries
  
 
480


4,443


1,221
 
Sales


Production
  
 
(909
 
 
(3,908
 
 
(1,561


Reserves at December 31, 2019
     7,253       76,236       19,959  


Changes resulting from:
                        
Purchase
     15       107       33  
Revisions of previous estimates
     (1,553     (595     (1,652
Improved recovery
     108             108  
Extensions and discoveries
     385       4,976       1,215  
Sales
     (80     (66     (91
Production
     (922     (4,221     (1,626


Reserves at December 31, 2020
     5,206       76,437       17,946  


Changes resulting from:
                        
Purchase
     —         —         —    
Revisions of previous estimates
     1,160       (2,011     825  
Improved recovery
     117       27       121  
Extensions and discoveries
     472       4,885       1,286  
Sales
     (3     (2     (3
Production
     (888     (4,420     (1,625


Reserves at December 31, 2021
     6,064       74,916       18,550  


Proved developed reserves at:
                        
December 31, 2019
     5,474       39,870       12,119  
December 31, 2020
     4,654       42,077       11,667  
December 31, 2021
     5,375       42,576       12,471  
Proved undeveloped reserves at:
                        
December 31, 2019
     1,779       36,366       7,840  
December 31, 2020
     552       34,360       6,279  
December 31, 2021
     689       32,340       6,079  
Equity method investments
                        
Share of proved developed and undeveloped reserves of associates and joint ventures
                        
December 31, 2019
     287       394       353  
December 31, 2020
     196       363       256  
December 31, 2021
     208       511       294  
 
F-72

Table of Contents
PETROCHINA COMPANY LIMITED
SUPPLEMENTARY INFORMATION ON OIL AND GAS EXPLORATION
AND PRODUCTION ACTIVITIES (UNAUDITED) — (Continued)
(All amounts in millions, except for the per share data and otherwise stated)
 
At December 31, 2021, total proved developed and undeveloped reserves of the Group and equity method investments is 18,844 million barrels of oil equivalent (December 31, 2020: 18,202 million barrels of oil equivalent, December 31, 2019: 20,312 million barrels of oil equivalent), comprising 6,272 million barrels of crude oil and condensate (December 31, 2020: 5,402 million barrels, December 31, 2019: 7,540 
million barrels) and 75,427 billion cubic feet of natural gas (December 31, 2020: 76,800 billion cubic feet, December 31, 2019: 76,630 billion cubic feet). 
At December 31, 2021, 5,286
 million barrels (December 31, 2020:
4,375
 million barrels, December 31, 2019:
6,500
 million barrels) of crude oil and condensate and
73,459
 billion cubic feet (December 31, 2020:
74,794
 billion cubic feet, December 31, 2019:
74,533
 billion cubic feet) of natural gas proved developed and undeveloped reserves of the Group are located within Mainland China, and
778
 million barrels (December 31, 2020:
831
 million barrels, December 31, 2019:
753
million barrels) of crude oil and condensate and
1,455
 billion cubic feet (December 31, 2020:
1,643
 billion cubic feet, December 31, 2019:
1,703
 billion cubic feet) of natural gas proved developed and undeveloped reserves of the Group are located overseas.
Capitalized Costs
 
    
December 31,
2021
   
December 31,
2020
 
    
RMB
   
RMB
 
The Group
                
Property costs and producing assets
     1,969,409       1,890,903  
Support facilities
     483,216       465,022  
Construction-in-progress
     119,583       150,535  


Total capitalized costs
     2,572,208       2,506,460  
Accumulated depreciation, depletion and amortization
     (1,635,837     (1,542,037


Net capitalized costs
     936,371       964,423  


Equity method investments
                
Share of net capitalized costs of associates and joint ventures
     19,056       20,465  


F-73

Table of Contents
PETROCHINA COMPANY LIMITED
SUPPLEMENTARY INFORMATION ON OIL AND GAS EXPLORATION
AND PRODUCTION ACTIVITIES (UNAUDITED) — (Continued)
(All amounts in millions, except for the per share data and otherwise stated)
 
Costs Incurred for Property Acquisitions, Exploration and Development Activities
 
    
2021
 
    
Mainland China
    
Other
    
Total
 
    
RMB
    
RMB
    
RMB
 
The Group
                          
Property acquisition costs
               7,610        7,610  
Exploration costs
     37,351        879        38,230  
Development costs
     132,829        12,084        144,913  


Total
     170,180        20,573        190,753  


Equity method investments
                          
Share of costs of property acquisition, exploration and development of associates and joint ventures
               2,110        2,110  


2020
 
    
Mainland China
    
Other
    
Total
 
    
RMB
    
RMB
    
RMB
 
The Group
                          
Property acquisition costs
            3,712        3,712  
Exploration costs
     35,862        1,051        36,913  
Development costs
     129,738        16,420        146,158  


Total
     165,600        21,183        186,783  


Equity method investments
                          
Share of costs of property acquisition, exploration and development of associates and joint ventures
     —          1,462        1,462  


2019
 
    
Mainland China
    
Other
    
Total
 
    
RMB
    
RMB
    
RMB
 
The Group
                          
Exploration costs
     41,687        1,972        43,659  
Development costs
     166,321        21,375        187,696  


Total
     208,008        23,347        231,355  


Equity method investments
                          
Share of costs of property acquisition, exploration and development of associates and joint ventures
     —          2,178        2,178  


Results of Operations for Oil and Gas Producing Activities
The results of operations for oil and gas producing activities for the years ended December 31, 2021, 2020 and 2019 are presented below. “Revenue” includes sales to third parties and inter-segment sales (at
arm’s-length
prices), net of value-added taxes. Resource tax, crude oil special gain levy and other taxes are included in “taxes
 
F-74

Table of Contents
PETROCHINA COMPANY LIMITED
SUPPLEMENTARY INFORMATION ON OIL AND GAS EXPLORATION
AND PRODUCTION ACTIVITIES (UNAUDITED) — (Continued)
(All amounts in millions, except for the per share data and otherwise stated)
 
other than income taxes”. Income taxes are computed using the applicable statutory tax rate, reflecting tax deductions and tax credits for the respective years ended.
 
    
2021
 
    
Mainland China
   
Other
   
Total
 
    
RMB
   
RMB
   
RMB
 
The Group
                        
Revenue
                        
Sales to third parties
     82,654       40,695       123,349  
Inter-segment sales
     388,611       25,149       413,760  


     471,265     65,844     537,109  
Production costs excluding taxes
     (126,916     (12,177     (139,093
Exploration expenses
     (23,418     (830     (24,248
Depreciation, depletion and amortization
     (128,297     (29,417     (157,714
Taxes other than income taxes
     (28,611     (5,810     (34,421
Accretion expense
     (4,557     (139     (4,696
Income taxes
     (22,084     (11,210     (33,294


Results of operations from producing activities
     137,382       6,261       143,643  


Equity method investments
                        
Share of profit for producing activities of associates and joint ventures
     —         1,904       1,904  


Total of the Group and equity method investments results of operations for producing activities
     137,382       8,165       145,547  


2020
 
    
Mainland China
   
Other
   
Total
 
    
RMB
   
RMB
   
RMB
 
The Group
                        
Revenue
                        
Sales to third parties
     32,662       30,855       63,517  
Inter-segment sales
     306,623       12,408       319,031  


       339,285       43,263       382,548  
Production costs excluding taxes
     (124,154     (9,605     (133,759
Exploration expenses
     (18,851     (482     (19,333
Depreciation, depletion and amortization
     (134,007     (15,953     (149,960
Taxes other than income taxes
     (18,865     (2,690     (21,555
Accretion expense
     (4,905     (202     (5,107
Income taxes
     (9,369     (5,340     (14,709


Results of operations from producing activities
     29,134       8,991       38,125  


Equity method investments
                        
Share of profit for producing activities of associates and joint ventures
     —         (76     (76


Total of the Group and equity method investments results of operations for producing activities
     29,134       8,915       38,049  


F-75

Table of Contents
PETROCHINA COMPANY LIMITED
SUPPLEMENTARY INFORMATION ON OIL AND GAS EXPLORATION
AND PRODUCTION ACTIVITIES (UNAUDITED) — (Continued)
(All amounts in millions, except for the per share data and otherwise stated)
 
    
2019
 
    
Mainland China
   
Other
   
Total
 
    
RMB
   
RMB
   
RMB
 
The Group
                        
Revenue
                        
Sales to third parties
     44,001       50,611       94,612  
Inter-segment sales
     379,968       14,956       394,924  


     423,969     65,567     489,536  
Production costs excluding taxes
     (127,900     (11,011     (138,911
Exploration expenses
     (19,821     (954     (20,775
Depreciation, depletion and amortization
     (115,648     (24,792     (140,440
Taxes other than income taxes
     (24,876     (5,853     (30,729
Accretion expense
     (5,294     (231     (5,525
Income taxes
     (24,085     (11,729     (35,814


Results of operations from producing activities
     106,345       10,997       117,342  


Equity method investments
                        
Share of profit for producing activities of associates and joint ventures
     —         3,253       3,253  


Total of the Group and equity method investments results of operations for producing activities
     106,345       14,250       120,595  


Standardized Measure of Discounted Future Net Cash Flows
The standardized measure of discounted future net cash flows related to proved oil and gas reserves at December 31, 2021, 2020 and 2019 is based on the prices used in estimating the Group’s proved oil and gas reserves,
year-end
costs, currently enacted tax rates related to existing proved oil and gas reserves and a 10% annual discount factor. “Future cash inflows” are net of value-added taxes. Corporate income taxes are included in “future income tax expense”. Other taxes are included in “future production costs” as production taxes.
The standardized measure of discounted future net cash flows related to proved oil and gas reserves at December 31, 2021, 2020 and 2019 is as follows:
 
    
RMB
 
The Group
        
At December 31, 2021
        
Future cash inflows
     5,244,811  
Future production costs
     (1,723,220
Future development costs
     (462,411
Future income tax expense
     (549,495


Future net cash flows
     2,509,685  
Discount at 10% for estimated timing of cash flows
     (1,108,580


Standardized measure of discounted future net cash flows
     1,401,105  


F-76

Table of Contents
PETROCHINA COMPANY LIMITED
SUPPLEMENTARY INFORMATION ON OIL AND GAS EXPLORATION
AND PRODUCTION ACTIVITIES (UNAUDITED) — (Continued)
(All amounts in millions, except for the per share data and otherwise stated)
 
    
RMB
 
The Group
        
At December 31, 2020
        
Future cash inflows
     4,366,906  
Future production costs
     (1,470,460
Future development costs
     (445,462
Future income tax expense
     (441,668


Future net cash flows
     2,009,316  
Discount at 10% for estimated timing of cash flows
     (947,035


Standardized measure of discounted future net cash flows
     1,062,281  


RMB
 
The Group
        
At December 31, 2019
        
Future cash inflows
     5,872,624  
Future production costs
     (1,947,039
Future development costs
     (640,281
Future income tax expense
     (746,506


Future net cash flows
     2,538,798  
Discount at 10% for estimated timing of cash flows
     (1,213,729


Standardized measure of discounted future net cash flows
     1,325,069  


At December 31, 2021, RMB 1,336,419 (December 31, 2020: RMB 1,028,640, December 31, 2019: RMB 1,278,180) of standardized measure of discounted future net cash flows related to proved oil and gas reserves located within mainland China and RMB 64,686 (December 31, 2020: RMB 33,641, December 31, 2019: RMB 46,889) of standardized measure of discounted future net cash flows related to proved oil and gas reserves located overseas.
Share of standardized measure of discounted future net cash flows of associates and joint ventures:
 
December 31, 2021
     14,788  
December 31, 2020
     8,573  
December 31, 2019
     20,356  
 
F-77

Table of Contents
PETROCHINA COMPANY LIMITED
SUPPLEMENTARY INFORMATION ON OIL AND GAS EXPLORATION
AND PRODUCTION ACTIVITIES (UNAUDITED) — (Continued)
(All amounts in millions, except for the per share data and otherwise stated)
 
Changes in Standardized Measure of Discounted Future Net Cash Flows
Changes in the standardized measure of discounted net cash flows for the Group for each of the years ended December 31, 2021, 2020 and 2019 are as follows:
 
    
Year Ended December 31,
 
    
2021
   
2020
   
2019
 
    
RMB
   
RMB
   
RMB
 
The Group
                        
Beginning of the year
     1,062,281       1,325,069       1,382,066  
Sales and transfers of oil and gas produced, net of production costs
     (344,643     (215,390     (303,222
Net changes in prices and production costs and other
     407,882       (358,008     (87,046
Extensions, discoveries and improved recovery
     150,979       112,834       134,631  
Development costs incurred
     23,675       39,238       53,450  
Revisions of previous quantity estimates
     88,332       (138,772     (17,380
Accretion of discount
     86,172       146,137       149,693  
Net change in income taxes
     (73,272     156,122       12,877  
Net change due to purchases and sales of minerals in place
     (301     (4,949         


End of the year
     1,401,105       1,062,281       1,325,069  


F-7
8