UNITED STATES SECURITIES AND EXCHANGE COMMISSION
Washington, D.C. 20549
Form
(Mark One)
|
|
ANNUAL REPORT PURSUANT TO SECTION 13 OR 15(d) OF THE SECURITIES EXCHANGE ACT OF 1934 |
|
|
|
|
|
For the fiscal year ended |
|
|
Or |
|
|
TRANSITION REPORT PURSUANT TO SECTION 13 OR 15(d) OF THE SECURITIES EXCHANGE ACT OF 1934 |
|
|
|
|
|
For the transition period from to |
Commission file number
(Exact name of registrant as specified in its charter)
|
|
|
|
(State or other jurisdiction of incorporation or organization) |
(IRS Employer Identification No.) |
|
|
|
|
|
|
|
(Address of principal executive offices) |
(Zip Code) |
Registrant’s telephone number, including area code:
(
Securities registered pursuant to Section 12(b) of the Act:
|
|
|
|
|
Title of Each Class |
Trading Symbol(s) |
Name of Each Exchange on Which Registered |
|
|
|
|
Securities registered pursuant to Section 12(g) of the Act: None
Indicate by check mark if the registrant is a well-known seasoned issuer, as defined in Rule 405 of the Securities Act.
Indicate by check mark if the registrant is not required to file reports pursuant to Section 13 or 15(d) of the Act. Yes ☐
Indicate by check mark whether the registrant (1) has filed all reports required to be filed by Section 13 or 15(d) of the Securities Exchange Act of 1934 during the preceding 12 months (or for such shorter period that the registrant was required to file such reports), and (2) has been subject to such filing requirements for the past 90 days.
Indicate by check mark whether the registrant has submitted electronically every Interactive Data File required to be submitted pursuant to Rule 405 of Regulation S-T (§ 232.405 of this chapter) during the preceding 12 months (or for such shorter period that the registrant was required to submit such files).
Indicate by check mark whether the registrant is a large accelerated filer, an accelerated filer, a non-accelerated filer, a smaller reporting company, or an emerging growth company. See the definitions of “large accelerated filer,” “accelerated filer,” “smaller reporting company” and “emerging growth company” in Rule 12b-2 of the Exchange Act:
|
|
|
|
|
|
|
|
Accelerated filer ☐ |
Smaller reporting company |
|
|
Non-accelerated filer ☐ |
Emerging growth company |
|
If an emerging growth company, indicate by check mark if the registrant has elected not to use the extended transition period for complying with any new or revised financial accounting standards provided pursuant to Section 13(a) of the Exchange Act. ☐
Indicate by check mark whether the registrant has filed a report on and attestation to its management’s assessment of the effectiveness of its internal control over financial reporting under Section 404(b) of the Sarbanes-Oxley Act (15 U.S.C. 7262(b)) by the registered public accounting firm that prepared or issued its audit report.
Indicate by check mark whether the registrant is a shell company (as defined in Rule 12b-2 of the Act). Yes
The aggregate market value of the voting stock held by non-affiliates of the Registrant was $
DOCUMENTS INCORPORATED BY REFERENCE
Certain information required for Part III of this annual report is incorporated by reference to portions of the Registrant’s definitive proxy statement for its 2022 annual meeting of stockholders to be filed with the Securities and Exchange Commission within 120 days after the end of the Registrant’s fiscal year ended December 31, 2021.
TABLE OF CONTENTS
COMMUNITY HEALTH SYSTEMS, INC.
Year ended December 31, 2021
|
|
|
|
Page |
|
|
PART I |
|
|
|
|
|
|
|
|
Item 1. |
|
1 |
|
|
Item 1A. |
|
24 |
|
|
Item 1B. |
|
43 |
|
|
Item 2. |
|
43 |
|
|
Item 3. |
|
46 |
|
|
Item 4. |
|
49 |
|
|
|
|
|
|
|
|
PART II |
|
|
|
|
|
|
|
|
Item 5. |
|
50 |
|
|
Item 6. |
|
51 |
|
|
Item 7. |
Management’s Discussion and Analysis of Financial Condition and Results of Operations |
|
52 |
|
|
|
|
|
|
Item 7A. |
|
75 |
|
|
Item 8. |
|
76 |
|
|
Item 9. |
Changes in and Disagreements with Accountants on Accounting and Financial Disclosure |
|
126 |
|
Item 9A. |
|
126 |
|
|
Item 9B. |
|
126 |
|
|
Item 9C. |
Disclosure Regarding Foreign Jurisdictions that Prevent Inspections |
|
126 |
|
|
|
|
|
|
|
PART III |
|
|
|
|
|
|
|
|
Item 10. |
|
129 |
|
|
Item 11. |
|
130 |
|
|
Item 12. |
Security Ownership of Certain Beneficial Owners and Management and Related Stockholder Matters |
|
130 |
|
Item 13. |
Certain Relationships and Related Transactions, and Director Independence |
|
130 |
|
Item 14. |
|
130 |
|
|
|
|
|
|
|
|
PART IV |
|
|
|
|
|
|
|
|
Item 15. |
|
131 |
|
|
Item 16. |
|
137 |
Item 1. Business of Community Health Systems, Inc.
Overview of Our Company
We are one of the largest publicly-traded providers of healthcare services in the United States and a leading operator of general acute care hospitals and outpatient facilities in communities across the country. We provide healthcare services through the hospitals and outpatient facilities that we own and operate in generally larger non-urban markets and selected urban markets throughout the United States. As of December 31, 2021, we owned or leased 83 hospitals with an aggregate of approximately 13,289 licensed beds, comprised of 81 general acute care hospitals and two stand-alone rehabilitation or psychiatric hospitals. Healthcare services are also provided in more than 1,000 outpatient facilities including affiliated physician practices, urgent care centers, freestanding emergency departments, occupational medicine clinics, imaging centers, cancer centers and ambulatory surgery centers. These hospitals and outpatient facilities are geographically diversified across 16 states, with the majority located in regional networks or in close geographic proximity to one or more of our other hospitals. We generate revenues by providing a broad range of general and specialized hospital healthcare services and outpatient services to patients in the communities in which we are located. Services provided through our hospitals and outpatient facilities include general acute care, emergency room, general and specialty surgery, critical care, internal medicine, obstetrics, diagnostic, psychiatric and rehabilitation services. An integral part of providing these services is our network of affiliated physicians at our hospitals and affiliated businesses. As of December 31, 2021, we employed approximately 1,500 physicians and an additional 900 licensed healthcare practitioners. Through our management and operation of these businesses, we provide standardization and centralization of operations across key business areas; strategic assistance to expand and improve services and facilities; implementation of patient safety and quality of care improvement programs and assistance in the recruitment of additional physicians and licensed healthcare practitioners to the markets in which our hospitals are located. In a number of our markets, we have partnered with local physicians, for-profit entities and/or not-for-profit providers in the ownership of our facilities.
Throughout this Form 10-K, we refer to Community Health Systems, Inc., or the Parent Company, and its consolidated subsidiaries in a simplified manner and on a collective basis, using words like “we,” “our,” “us” and the “Company.” This drafting style is suggested by the Securities and Exchange Commission, or SEC, and is not meant to indicate that the publicly-traded Parent Company or any particular subsidiary of the Parent Company owns or operates any asset, business or property. The hospitals, operations and businesses described in this filing are owned and operated, and management services provided, by distinct and indirect subsidiaries of Community Health Systems, Inc.
Available Information
Our website address is www.chs.net and the investor relations section of our website is located at www.chs.net/investor-relations. Notwithstanding the foregoing, the information contained on our website as noted above or elsewhere in this Form 10-K is not incorporated by reference into this Form 10-K. We make available free of charge, through the investor relations section of our website, annual reports on Form 10-K, quarterly reports on Form 10-Q and current reports on Form 8-K as well as amendments to those reports, as soon as reasonably practical after they are filed with, or furnished to, the SEC. The SEC maintains a website that contains our reports, proxy and information statements, and other information that we file electronically with the SEC at www.sec.gov.
We also make available free of charge, through the investor relations section of our website, our By-laws, our Governance Guidelines, our Code of Conduct and the charters of our Audit and Compliance Committee, Compensation Committee and Governance and Nominating Committee.
We have included the Chief Executive Officer and the Chief Financial Officer certifications regarding the public disclosure required by Sections 302 and 906 of the Sarbanes-Oxley Act of 2002 as Exhibits 31.1, 31.2, 32.1 and 32.2 to this Form 10-K.
Our Business Strategy
The key elements of our business strategy are to:
Become a market leader and increase market share in the communities we serve
We operate across diverse markets that range from sole community providers to large regional networks. We are able to leverage our significant scale and standardized systems to provide cost-effective services and best practices for our affiliate operations. Each of our markets develops and executes a strategic plan with short- and long-term goals, based on their unique opportunities and the needs of their respective communities. As an organization, we also have implemented a number of strategic initiatives designed to improve market position, expand services to our patients, and capture a greater share of healthcare spending in our markets. These include:
|
|
• |
Strengthening regional networks and local market operations; |
1
|
|
• |
Expanding patient access points, health services and infrastructure; |
|
|
• |
Recruiting and/or employing additional primary care physicians and specialists; and |
|
|
• |
Developing a more consumer-centric experience and facilitating connections between episodes of care. |
Strengthening Regional Networks and Local Market Operations. We believe opportunities exist in select markets to create healthcare networks consisting of multiple hospitals and corresponding outpatient services.
Regional networks are able to expand the breadth of services provided for our patients, develop centers of excellence for key services, deliver care in an organized and efficient way across the network, improve alignment with physicians and other providers, and make services more attractive to managed care and other payors. Currently, 48 of our hospitals operate in 13 unique regional networks.
We also operate healthcare systems that are built around a single acute-care hospital. In these markets, we are focused on supporting the hospital with physician practices, outpatient services, clinical collaborations and partnerships that offer our patients health services across the continuum of care. These hospitals and their related outpatient services may operate in competitive markets or as sole community providers.
Expanding Patient Access Points, Health Services and Infrastructure. When expanding services—in both the acute and non-acute care settings—our approach is data-driven and strategic to ensure our investments are responsive to community and patient needs and produce sound financial results. While we continue to provide health services across a broad spectrum, we have focused our attention and resources on service lines we believe have the greatest potential for growth, including primary care, emergency medicine, orthopedics, neuroscience, cardiovascular care, surgical services and behavioral health. Significant investments have been made in existing markets to expand the scale of inpatient offerings, including through increasing bed capacity and constructing new surgical and procedural suites. As the shift to delivering health services in outpatient settings accelerates, we continue to expand our care offerings beyond hospital walls to include more outpatient access through primary care practices, urgent care centers, free-standing emergency departments, ambulatory surgery centers, imaging and diagnostic centers, retail clinics and direct-to-consumer virtual health visits. We endeavor to advance the scale and breadth of inpatient and outpatient capabilities through both direct investments and strategic partnerships.
We believe expanding our patient access footprint can attract new patients and increase patient retention, as well as our ability to connect patients from one episode of care to the next appropriate care setting. We also believe our investments will enhance our long-term growth and generate increased revenue, earnings, and operating margins by providing a solid return on investment.
Recruiting and/or Employing Additional Primary Care Physicians and Specialists. The physician-patient relationship is the foundation on which healthcare services are built. Understanding this, we continuously assess our communities to identify service gaps and practice opportunities in order to recruit an optimal mix of primary care physicians and specialists. We analyze demographic data and referral trends and employ recruiters at the corporate level to support local hospital administrators in their physician recruitment efforts. In some markets, we employ physicians, often acquiring their practices at the onset of the arrangement. However, most physicians in our communities and on our medical staffs remain in private practice and are not our employees.
We work hard to develop positive, collaborative relationships with physicians. We currently participate in 15 Medicare Shared Savings Program Accountable Care Organizations which include approximately 4,000 employed and independent physicians in our communities. We look forward to realizing the benefits of these organizations, including opportunities to strengthen quality, deepen clinical collaboration and demonstrate performance under a reimbursement system moving toward more value-based incentives and payments.
Developing a More Consumer-Centric Experience and Facilitating Connections between Episodes of Care. Consumers continue to take a more active role in healthcare decision-making, especially as they assume increasing responsibility for the cost of their healthcare. The rise in consumerism is highlighting customer expectations that have not always been prioritized in the healthcare setting. We are working on ways to create more enduring relationships with our patients by providing services that help people navigate their healthcare journeys and enable more seamless connections across episodes of care in our healthcare systems, hospitals, and physician practices. Some of these initiatives include:
|
|
• |
A centralized and proprietary transfer center offering services to connect emergency department and hospitalized patients requiring transfer to facilities that can best meet their needs; |
|
|
• |
Centralized patient scheduling call centers and online scheduling to ease appointment scheduling; |
|
|
• |
Patient navigation and next appointment scheduling from existing points of care; |
|
|
• |
Availability of virtual health for certain services provided in the hospital and for direct-to-consumer, on-demand virtual visits with physicians and other healthcare practitioners; |
2
|
|
• |
Digital marketing and consumer engagement campaigns; and |
|
|
• |
Other technology enabled initiatives that support connected healthcare experiences, such as patient portals, text message appointment reminders, gaps-in-care campaigns and post-discharge surveys. |
Increase productivity and operating efficiencies to enhance profitability
Our hospital management teams are supported by experienced corporate leaders who have significant industry knowledge and a proven track record of success. Local hospitals benefit from centralized clinical, operational, financial and regulatory expertise that encompasses nearly every aspect of our business. Additionally, we are able to leverage deep and meaningful data sources to facilitate informed decision-making and drive operational improvements across the enterprise in areas such as drug and supply procurement, workforce optimization and staffing and emergency department and operating room performance.
Standard policies and procedures in areas ranging from physician practice management to patient accounting to construction and facilities management help to facilitate best practices, reduce variation and improve operating results. The following areas highlight some of our standardized and centralized platforms.
Billing and Collections. We have adopted standard policies and procedures with respect to billing and collections. We have automated various components of the collection cycle, including statements and collection letters, to help facilitate timely and accurate progression of our accounts through the collection cycle. We have consolidated local hospital billing and collection functions into five centralized business offices and have completed the transition of our hospital billing departments to this new infrastructure. We have been realizing the benefits of lower patient claim denials, higher underpayment recoveries and reduced operating costs.
Physician Support. We support newly recruited physicians to facilitate a smooth and effective transition into our communities. For employed physicians, we utilize software solutions that monitor and help optimize their practice performance against industry standard benchmarks and best practices. We also have implemented programs to improve physician workflow, reduce physician turnover, optimize staffing at physician clinics and standardize onboarding processes.
Procurement and Materials Management. We have standardized and centralized supply chain operations to improve procurement of the medical supplies, equipment and pharmaceuticals used in our hospitals. We have an ownership interest in and participation agreement with HealthTrust Purchasing Group, L.P., or HealthTrust, a group purchasing organization, or GPO, which benefits members through scaled pricing. HealthTrust contracts with certain vendors who supply a substantial portion of our medical supplies, equipment and pharmaceuticals.
Case and Resource Management. The primary goal of our case management program is to deliver safe, high-quality care in an efficient and cost effective manner. The program focuses on:
|
|
• |
Appropriate management of length of stay consistent with national standards and benchmarks; |
|
|
• |
Reducing unnecessary utilization; |
|
|
• |
Developing and implementing operational best practices; |
|
|
• |
Discharge planning; and |
|
|
• |
Compliance with applicable regulatory standards. |
Our case management program integrates the functions of utilization review, discharge planning, assessment of medical necessity and resource management. Patients are assessed upon presentation to the hospital and throughout their course of care with ongoing reviews. Industry-standard criteria are utilized in patient assessments and discharge plans are adjusted according to patient needs. Cases are monitored to prevent delays in service or unnecessary utilization of resources. When a patient is ready for discharge, a case manager works with the patient’s attending physician to evaluate and coordinate the patient’s needs for continued care in the post-acute setting. Hospitals have the support of a physician advisor to act as a liaison to the medical staff and assist with all the activities of the program.
Other Initiatives. Numerous other initiatives have been standardized or centralized and leverage data to reduce costs and increase productivity. For example, we have improved staff scheduling and efficiency by implementing standardized time keeping systems, and we have implemented initiatives to reduce unnecessary overtime and guide temporary staffing decisions that align with patient admissions and acuity. We have created a centralized team and implemented standard processes for payroll processing and management of accounts payable. Likewise, we have leveraged data and expertise to optimize our performance in clinical and operating areas such as emergency room, pharmacy, laboratory, imaging and skilled nursing services and health information management. Each time we implement a new process initiative, we work to identify and communicate best practices and we monitor progress and performance improvement throughout the organization.
3
Continuously improve patient safety and quality of care
We maintain quality assurance programs to monitor, support and advance quality of care standards and to meet Medicare and Medicaid accreditation and regulatory requirements. We maintain an emphasis on patient safety and clinical outcomes and we are continuously focused on ways to improve patient, physician and employee satisfaction. We believe that a focus on continuous improvement yields the best results for patients, reduces risk and liability, and creates value for the people and communities we serve.
We have developed and implemented programs to support and monitor patient safety and quality of care that include:
|
|
• |
Standardized data and benchmarks to monitor clinical outcomes, hospital performance and quality improvement efforts; |
|
|
• |
Recommended policies and procedures based on medical and scientific evidence; |
|
|
• |
Training with evidence-based tools for improving patient safety and quality of care and patient, physician and employee satisfaction; |
|
|
• |
Leveraging technology and information sharing around evidence-based clinical best practices; |
|
|
• |
Training programs for hospital management and clinical staff regarding regulatory and reporting requirements; and |
|
|
• |
Implementation of specific leadership methods and error-prevention tools to create safer care environments for patients and staff. |
We have also expanded our network of outpatient services to create greater access and more convenience for our patients. Moreover, as conditions arising from the pandemic accelerated the need for telehealth appointments, we have significantly expanded our ability to provide remote care.
We have operated a Patient Safety Organization, or PSO, since 2011. Our PSO is listed by the U.S. Department of Health and Human Services Agency, or HHS, for Healthcare Research and Quality. We believe our PSO has assisted, and will continue to assist us, in improving patient safety at our hospitals. The PSO has been recertified by the Agency for Healthcare Research and Quality through 2024.
Industry Overview
According to the Centers for Medicare & Medicaid Services, or CMS, national healthcare expenditures grew 9.7% in 2020 to $4.1 trillion, primarily due to a 36.0% increase in federal expenditures for healthcare that occurred largely in response to the COVID-19 pandemic. Much of the spending growth was driven by federal financial assistance to healthcare providers through the Public Health and Social Services Emergency Fund, or PHSSEF, and Paycheck Protection Program loans, increased federal public health activity, and increased federal Medicaid funding. When spending associated with federal public health and other federal programs (including the PHSSEF and Paycheck Protection Program loans) is excluded, total national health expenditures increased 1.9% in 2020, a smaller increase than the projected 5.2%, largely due to decreased use of medical goods and services. The CMS projections of healthcare spending are constructed using a current-law framework. The most recent projections were published in March 2020, and therefore do not take into account the impacts of COVID-19 or the actual expenditures in 2020 or 2021. These projections indicate that total U.S. healthcare spending is expected to grow at an average annual rate of 5.6% for 2022 through 2028. CMS anticipates that total U.S. healthcare annual expenditures will reach nearly $6.2 trillion by 2028, accounting for approximately 19.7% of the total U.S. gross domestic product.
Hospital services, the market within the healthcare industry in which we primarily operate, is the largest single category of healthcare expenditures. In 2020, hospital care expenditures increased 6.4%, similar to the growth rate of 6.3% in 2019, and totaled nearly $1.3 trillion. The growth in 2020 reflected a substantial amount of funding from federal programs (including COVID-19 relief) and larger increases in Medicaid spending compared to prior years. CMS projects that the hospital services category will grow at an average of 6.0% annually from 2022 through 2028, reaching nearly $2.1 trillion by 2028.
U.S. Hospital Industry. The U.S. hospital industry is broadly defined to include acute care, rehabilitation and psychiatric facilities that are either public (government owned and operated), not-for-profit private (religious or secular), or for-profit institutions (investor owned). According to the American Hospital Association, there are approximately 5,141 community hospitals in the U.S., which are not-for-profit owned, investor owned, or state or local government owned. Of these hospitals, approximately 35.1% are located in non-urban communities. We believe that a majority of these hospitals are owned by not-for-profit or governmental entities. These facilities offer a broad range of healthcare services, including internal medicine, general surgery, cardiology, oncology, orthopedics, OB/GYN and emergency services. In addition, hospitals offer other ancillary services, including psychiatric, diagnostic, rehabilitation, home care and outpatient surgery services.
4
Factors Affecting Performance. Among the many factors that can influence a hospital’s financial and operating performance are:
|
|
• |
facility size and location; |
|
|
• |
facility ownership structure (e.g., tax-exempt or investor owned); |
|
|
• |
a facility’s ability to participate in GPOs, such as HealthTrust; |
|
|
• |
facility payor mix; |
|
|
• |
the terms of contracts with third-party payors, including managed care plans; and |
|
|
• |
the extent of Medicaid expansion. |
Patients needing the most complex care are more often served by the larger and/or more specialized urban hospitals. We believe opportunities exist in selected urban markets to create networks between urban hospitals and non-urban hospitals in order to expand the breadth of services offered in the non-urban hospitals while improving physician alignment in those markets and making them more attractive to managed care organizations.
COVID-19 Pandemic
As a provider of healthcare services, we have been significantly affected by the public health and economic effects of the COVID-19 pandemic. Our hospitals, medical clinics, medical personnel and employees have been actively caring for COVID-19 patients, and we have been working with federal, state and local health authorities to respond to COVID-19 cases in the communities we serve, including taking or supporting measures intended to limit the spread of the virus, protect our employees, and mitigate the burden on the healthcare system. For additional information regarding the ongoing impact of the COVID-19 pandemic on the Company, as well as information regarding legislation enacted and other governmental actions taken by federal and state governments to assist healthcare providers in providing care during the pandemic and to provide financial relief to healthcare providers, see the discussion below under “COVID-19 Pandemic” and “Overview of Legislative Developments” included in “Management’s Discussion and Analysis of Financial Condition and Results of Operations” in Part II, Item 7 of this Form 10-K.
Hospital Industry Trends
Demographic Trends. According to the U.S. Census Bureau, in 2021, there were nearly 54 million Americans aged 65 or older in the U.S. comprising approximately 16.5% of the total U.S. population. By the year 2030, the number of Americans aged 65 or older is expected to climb to 73 million, or 20.6% of the total population. Due to the anticipated increasing life expectancy of Americans, the number of people aged 85 and older is also expected to increase from 6 million in 2016 to 9 million by the year 2030. This anticipated increase in life expectancy will increase demand for healthcare services and, as importantly, the demand for innovative, more sophisticated means of delivering those services. Hospitals, as the largest category of care in the healthcare market, will be among those impacted most directly by this increase in demand. Based on data compiled for us, the populations of the service areas where our hospitals are located grew 5.2% from 2016 to 2021 and are expected to grow by 4.0% from 2021 to 2026. The number of people aged 65 or older in these service areas grew by 19.8% from 2016 to 2021 and is expected to grow by 15.0% from 2021 to 2026. People aged 65 or older comprised 19.4% of the total population in our service areas in 2021, and they may comprise an estimated 21.5% of the total population in our service areas by 2026.
Consolidation. In addition to our own acquisitions and dispositions in recent years, consolidation activity in the hospital industry, primarily through mergers and acquisitions involving both for-profit and not-for-profit hospital systems, is continuing. Reasons for this activity include:
|
|
• |
ample supply of available capital; |
|
|
• |
valuation levels; |
|
|
• |
financial performance issues, including challenges associated with changes in reimbursement and collectability of self-pay revenue; |
|
|
• |
the desire to enhance the local availability of healthcare in the community; |
|
|
• |
the need and ability to recruit primary care physicians and specialists; |
|
|
• |
the need to achieve general economies of scale and to gain access to standardized and centralized functions, including favorable supply agreements and access to malpractice coverage; |
|
|
• |
changes to healthcare payment models that emphasize cost-effective delivery of service and quality of outcomes for the entire episode of care; and |
|
|
• |
regulatory changes. |
5
The payor industry is also consolidating and acquiring health services providers in an effort to offer more expansive, competitive programs.
Trends in Payment for Healthcare Services. As discussed in more detail in the Government Regulation section of this Form 10-K, growing financial and economic pressures on the healthcare industry have resulted in challenges to traditional reimbursement models. For example, value-based purchasing initiatives emphasize the cost-effective delivery of care and quality of outcomes. In addition, health insurance coverage models have evolved, with increased enrollment in Medicare and Medicaid managed care plans and in high-deductible health plans. We may face greater risk of write-offs of uncollectible amounts from patients enrolled in high-deductible health plans.
Shift to Outpatient Services. Because of the growing availability of stand-alone outpatient healthcare facilities, the increase in the services that can be provided at these locations, and payor policies requiring or promoting treatment in outpatient settings, many individuals are seeking a broader range of services at outpatient facilities. This trend has contributed to an increase in outpatient services while inhibiting the growth of inpatient admissions. Changes to Medicare policy affecting the reimbursement methodology for certain items and services provided by off-campus provider-based hospital departments have generally resulted in reduced payment rates for these hospital outpatient settings. In addition, CMS recently finalized a rule setting forth criteria for determining whether services or procedures should be removed from the Inpatient Only List, which is a list of procedures eligible to be reimbursed by Medicare only if performed in an inpatient setting. To the extent procedures become eligible to be reimbursed by Medicare if performed in outpatient settings, demand for outpatient services may increase in comparison to demand for inpatient services.
6
Selected Operating Data
The following table sets forth operating statistics for each of the years presented for our hospitals. Statistics for 2021 include a full year of operations for 83 hospitals, and partial periods for five hospitals that were divested reflecting the operations of these hospitals prior to divestiture and one hospital that ceased to operate as a stand-alone hospital and began operating as a campus of another hospital offering only emergency room and outpatient services (statistics for 2021 reflect the operations of that hospital prior to being consolidated into another hospital). Statistics for 2020 include a full year of operations for 88 hospitals and partial periods for 13 hospitals divested, one hospital that was closed and one hospital that was opened during the year reflecting the operations of these hospitals prior to divestiture or closure or after commencing operations, as applicable. Statistics for 2019 include a full year of operations for 101 hospitals and partial periods for 12 hospitals divested and one hospital that was acquired during the year, reflecting the operations of these hospitals prior to divestiture or after acquisition, as applicable.
|
|
|
Year Ended December 31, |
|
|||||||||
|
|
|
2021 |
|
|
2020 |
|
|
2019 |
|
|||
|
|
|
(Dollars in millions) |
|
|||||||||
|
Consolidated Data |
|
|
|
|
|
|
|
|
|
|
|
|
|
Number of hospitals (at end of period) |
|
|
83 |
|
|
|
89 |
|
|
|
102 |
|
|
Licensed beds (at end of period)(1) |
|
|
13,289 |
|
|
|
14,110 |
|
|
|
16,240 |
|
|
Beds in service (at end of period)(2) |
|
|
11,629 |
|
|
|
12,421 |
|
|
|
14,442 |
|
|
Admissions(3) |
|
|
442,445 |
|
|
|
470,325 |
|
|
|
557,959 |
|
|
Adjusted admissions(4) |
|
|
950,717 |
|
|
|
973,571 |
|
|
|
1,208,513 |
|
|
Patient days(5) |
|
|
2,190,405 |
|
|
|
2,190,939 |
|
|
|
2,474,569 |
|
|
Average length of stay (days)(6) |
|
|
5.0 |
|
|
|
4.7 |
|
|
|
4.4 |
|
|
Occupancy rate (beds in service)(7) |
|
|
51.1 |
% |
|
|
44.6 |
% |
|
|
45.1 |
% |
|
Net operating revenues |
|
$ |
12,368 |
|
|
$ |
11,789 |
|
|
$ |
13,210 |
|
|
Net inpatient revenues as a % of net operating revenues |
|
|
48.3 |
% |
|
|
49.1 |
% |
|
|
47.0 |
% |
|
Net outpatient revenues as a % of net operating revenues |
|
|
51.7 |
% |
|
|
50.9 |
% |
|
|
53.0 |
% |
|
Net income (loss) attributable to Community Health Systems, Inc. stockholders |
|
$ |
230 |
|
|
$ |
511 |
|
|
$ |
(675 |
) |
|
Net income (loss) attributable to Community Health Systems, Inc. stockholders as a % of net operating revenues |
|
|
1.9 |
% |
|
|
4.3 |
% |
|
|
(5.1 |
)% |
|
Adjusted EBITDA(8) |
|
$ |
1,969 |
|
|
$ |
1,809 |
|
|
$ |
1,628 |
|
|
Adjusted EBITDA as a % of net operating revenues(8) |
|
|
15.9 |
% |
|
|
15.3 |
% |
|
|
12.3 |
% |
|
|
|
|
|
|
|
|
|
|
|
|
|
|
|
Liquidity Data |
|
|
|
|
|
|
|
|
|
|
|
|
|
Net cash flows (used in) provided by operating activities |
|
$ |
(131 |
) |
|
$ |
2,178 |
|
|
$ |
385 |
|
|
Net cash flows (used in) provided by operating activities as a % of net operating revenues |
|
|
(1.1 |
)% |
|
|
18.5 |
% |
|
|
2.9 |
% |
|
Net cash flows (used in) provided by investing activities |
|
$ |
(524 |
) |
|
$ |
177 |
|
|
$ |
(2 |
) |
|
Net cash flows used in financing activities |
|
$ |
(514 |
) |
|
$ |
(895 |
) |
|
$ |
(363 |
) |
|
|
|
Year Ended December 31, |
|
|||||||||
|
|
|
2021 |
|
|
2020 |
|
|
Increase |
|
|||
|
|
|
(Dollars in millions) |
|
|||||||||
|
Same-Store Data(9) |
|
|
|
|
|
|
|
|
|
|
|
|
|
Admissions(3) |
|
|
440,563 |
|
|
|
431,230 |
|
|
|
2.2 |
% |
|
Adjusted admissions(4) |
|
|
946,762 |
|
|
|
894,197 |
|
|
|
5.9 |
% |
|
Patient days(5) |
|
|
2,181,070 |
|
|
|
2,015,522 |
|
|
|
|
|
|
Average length of stay (days)(6) |
|
|
5.0 |
|
|
|
4.7 |
|
|
|
|
|
|
Occupancy rate (beds in service)(7) |
|
|
51.2 |
% |
|
|
46.3 |
% |
|
|
|
|
|
Net operating revenues |
|
$ |
12,334 |
|
|
$ |
10,962 |
|
|
|
12.5 |
% |
|
Income from operations |
|
$ |
1,458 |
|
|
$ |
1,263 |
|
|
|
15.4 |
% |
|
Income from operations as a % of net operating revenues |
|
|
11.8 |
% |
|
|
11.5 |
% |
|
|
|
|
|
Depreciation and amortization |
|
$ |
536 |
|
|
$ |
505 |
|
|
|
|
|
|
Equity in earnings of unconsolidated affiliates |
|
$ |
(12 |
) |
|
$ |
(3 |
) |
|
|
|
|
|
(1) |
Licensed beds are the number of beds for which the appropriate state agency licenses a facility regardless of whether the beds are actually available for patient use. |
7
|
(2) |
Beds in service are the number of beds that are readily available for patient use. |
|
(3) |
Admissions represent the number of patients admitted for inpatient treatment. |
|
(4) |
Adjusted admissions is a general measure of combined inpatient and outpatient volume. We computed adjusted admissions by multiplying admissions by gross patient revenues and then dividing that number by gross inpatient revenues. |
|
(5) |
Patient days represent the total number of days of care provided to inpatients. |
|
(6) |
Average length of stay (days) represents the average number of days inpatients stay in our hospitals. |
|
(7) |
We calculated occupancy rate percentages by dividing the average daily number of inpatients by the weighted-average number of beds in service. |
|
(8) |
EBITDA is a non-GAAP financial measure which consists of net income (loss) attributable to Community Health Systems, Inc. before interest, income taxes, and depreciation and amortization. Adjusted EBITDA, also a non-GAAP financial measure, is EBITDA adjusted to add back net income attributable to noncontrolling interests and to exclude loss (gain) from early extinguishment of debt, impairment and (gain) loss on sale of businesses, gain on sale of equity interests in Macon Healthcare, LLC, (income) expense related to government and other legal settlements and related costs, expense incurred in the fourth quarter of 2020 related to the settlement of certain professional liability claims for which the third-party insurers’ obligation to insure the Company against the underlying loss was being litigated along with income during the fourth quarter of 2021 associated with the settlement of such litigation for the recovery of amounts covered by such third-party insurance policies, expense related to employee termination benefits and other restructuring charges, expense from settlement and fair value adjustments on the contingent value right agreement liability related to the Health Management Associates, Inc., legal proceedings and related legal expenses, the impact of changes in estimate to increase the professional liability claims accrual recorded during the second quarter of 2019 (which estimate was further revised in the third quarter of 2019 based on updated actuarial analysis) with respect to claims incurred in 2016 and prior years, and expense related to the valuation allowance recorded in the second quarter of 2019 to reserve the outstanding balance of a promissory note received from the buyer in connection with the sale of two of the Company’s hospitals in 2017, as well as income from a reduction of the valuation allowance on the outstanding balance of a promissory note from the buyer of another hospital. As previously disclosed, during the three months ended December 31, 2020, the Company incurred expenses in the amount of approximately $50 million related to the settlement of a professional liability claim for which the Company’s third-party insurer’s obligation to provide coverage to the Company in connection with the underlying loss was being litigated. Moreover, during the three months ended December 31, 2021, as referenced above, the Company recognized income in the amount of approximately $19 million, net of related legal fees, from the settlement of the aforementioned litigation with third-party insurers. The Company has included this adjustment in the calculation of Adjusted EBITDA during the year ended December 31, 2021, because the Company believes the income associated with such settlement is not reflective of the Company’s underlying results of operations in light of the intended purpose of Adjusted EBITDA in assessing the Company’s operational performance and comparing the Company’s performance between periods. The Company has from time to time sold noncontrolling interests in certain of its subsidiaries or acquired subsidiaries with existing noncontrolling interest ownership positions. The Company believes that it is useful to present Adjusted EBITDA because it adds back the portion of EBITDA attributable to these third-party interests. The Company reports Adjusted EBITDA as a measure of financial performance. Adjusted EBITDA is a key measure used by management to assess the operating performance of the Company’s hospital operations and to make decisions on the allocation of resources. Adjusted EBITDA is also used to evaluate the performance of the Company’s executive management team and is one of the primary metrics used in connection with determining short-term cash incentive compensation and the achievement of vesting criteria with respect to performance-based equity awards. In addition, management utilizes Adjusted EBITDA in assessing the Company’s consolidated results of operations and operational performance and in comparing the Company’s results of operations between periods. The Company believes it is useful to provide investors and other users of the Company’s financial statements this performance measure to align with how management assesses the Company’s results of operations. Adjusted EBITDA also is comparable to a similar metric called Consolidated EBITDA, as defined in the Company’s asset-based loan facility, or the ABL Facility, and the Company’s existing note indentures, which is a key component in the determination of the Company’s compliance with certain covenants under the ABL Facility and such note indentures (including the Company’s ability to service debt and incur capital expenditures), and is used to determine the interest rate and commitment fee payable under the ABL Facility (although Adjusted EBITDA does not include all of the adjustments described in the ABL Facility). Adjusted EBITDA includes the Adjusted EBITDA attributable to hospitals that were divested during the course of such year, but in each case solely to the extent relating to the period prior to the consummation of the applicable divestiture. For further discussion of Consolidated EBITDA and how that measure is utilized in the calculation of covenants in the ABL Facility, see the Capital Resources section of Part II, Item 7 of this Form 10-K. |
Adjusted EBITDA is not a measurement of financial performance under U.S. GAAP. It should not be considered in isolation or as a substitute for net income, operating income, or any other performance measure calculated in accordance with U.S. GAAP. The items excluded from Adjusted EBITDA are significant components in understanding and evaluating financial performance. The Company believes such adjustments are appropriate as the magnitude and frequency of such items can vary significantly
8
and are not related to the assessment of normal operating performance. Additionally, this calculation of Adjusted EBITDA may not be comparable to similarly titled measures disclosed by other companies.
The following table reflects the reconciliation of Adjusted EBITDA, as defined, to net income (loss) attributable to Community Health Systems, Inc. stockholders as derived directly from our Consolidated Financial Statements for the years ended December 31, 2021, 2020 and 2019 (in millions):
|
|
|
Year Ended December 31, |
|
|||||||||
|
|
|
2021 |
|
|
2020 |
|
|
2019 |
|
|||
|
Net income (loss) attributable to Community Health Systems, Inc. stockholders |
|
$ |
230 |
|
|
$ |
511 |
|
|
$ |
(675 |
) |
|
Adjustments: |
|
|
|
|
|
|
|
|
|
|
|
|
|
Provision for (benefit from) income taxes |
|
|
131 |
|
|
|
(185 |
) |
|
|
160 |
|
|
Depreciation and amortization |
|
|
540 |
|
|
|
558 |
|
|
|
608 |
|
|
Net income attributable to noncontrolling interests |
|
|
138 |
|
|
|
96 |
|
|
|
85 |
|
|
Interest expense, net |
|
|
885 |
|
|
|
1,031 |
|
|
|
1,041 |
|
|
Loss (gain) from early extinguishment of debt |
|
|
79 |
|
|
|
(317 |
) |
|
|
54 |
|
|
Impairment and (gain) loss on sale of businesses, net |
|
|
24 |
|
|
|
48 |
|
|
|
138 |
|
|
Expense from government and other legal settlements and related costs |
|
|
— |
|
|
|
— |
|
|
|
93 |
|
|
(Income) expense from the settlement of professional liability claims for which the third-party insurers' obligation to insure the Company for the underlying loss has been settled |
|
|
(19 |
) |
|
|
50 |
|
|
|
— |
|
|
Expense from settlement and legal expenses related to cases covered by the CVR |
|
|
— |
|
|
|
2 |
|
|
|
11 |
|
|
Expense related to employee termination benefits and other restructuring charges |
|
|
— |
|
|
|
15 |
|
|
|
2 |
|
|
Gain on sale of equity interests in Macon Healthcare, LLC |
|
|
(39 |
) |
|
|
— |
|
|
|
— |
|
|
Change in valuation allowances recorded for promissory notes |
|
|
— |
|
|
|
— |
|
|
|
21 |
|
|
Change in estimate for professional liability claims accrual |
|
|
— |
|
|
|
— |
|
|
|
90 |
|
|
Adjusted EBITDA |
|
$ |
1,969 |
|
|
$ |
1,809 |
|
|
$ |
1,628 |
|
|
(9) |
Same-store data excludes the results of a hospital acquired in 2019 and businesses divested or closed in the periods presented. For all hospitals owned throughout both periods, the same-store operating results and statistical data reflects the indicated periods. |
Sources of Revenue
The following table presents the approximate percentages of net operating revenues by payor source for the periods indicated. The data for the periods presented are not strictly comparable due to the effect that hospital acquisitions and divestitures have had on these statistics.
|
|
|
Year Ended December 31, |
|
|||||||||
|
|
|
2021 |
|
|
2020 |
|
|
2019 |
|
|||
|
Medicare |
|
|
21.4 |
% |
|
|
23.9 |
% |
|
|
25.2 |
% |
|
Medicaid |
|
|
13.5 |
|
|
|
13.4 |
|
|
|
13.2 |
|
|
Managed Care and other third-party payors |
|
|
64.2 |
|
|
|
62.9 |
|
|
|
60.6 |
|
|
Self-pay |
|
|
0.9 |
|
|
|
(0.2 |
) |
|
|
1.0 |
|
|
Total |
|
|
100.0 |
% |
|
|
100.0 |
% |
|
|
100.0 |
% |
As shown above, we receive a substantial portion of our revenues from the Medicare and Medicaid programs. Included in Managed Care and other third-party payors is operating revenues from insurance companies with which we have insurance provider contracts, Medicare managed care, insurance companies for which we do not have insurance provider contracts, workers’ compensation carriers and non-patient service revenue, such as rental income and cafeteria sales. In the future, we generally expect the portion of revenues received from the Medicare and Medicaid programs to increase over the long-term due to the general aging of the population and other factors, including health reform initiatives. There has been a trend toward increased enrollment in Medicare and Medicaid managed care, which may adversely affect our operating revenue. We may also be impacted by regulatory requirements imposed on
9
insurers, such as minimum medical-loss ratios and specific benefit requirements. Furthermore, in the normal course of business, managed care programs, insurance companies and employers actively negotiate the amounts paid to hospitals. Our relationships with payors may be impacted by price transparency initiatives and out-of-network billing restrictions, including those in the No Surprises Act, which took effect January 1, 2022 and is discussed further below. There can be no assurance that we will retain our existing reimbursement arrangements or that third-party payors will not attempt to further reduce the rates they pay for our services.
Net operating revenues include amounts estimated by management to be reimbursable by Medicare and Medicaid under prospective payment systems and provisions of cost-based reimbursement and other payment methods. In addition, we are reimbursed by non-governmental payors using a variety of payment methodologies. Amounts we receive for the treatment of patients covered by Medicare, Medicaid and non-governmental payors are generally less than our standard billing rates. We account for the differences between the estimated program reimbursement rates and our standard billing rates as contractual allowance adjustments, which we deduct from gross revenues to arrive at net operating revenues. Final settlements under some of these programs are subject to adjustment based on administrative review and audit by third parties. We account for adjustments to previous program reimbursement estimates as contractual allowance adjustments and report them in the periods that such adjustments become known. Contractual allowance adjustments related to final settlements and previous program reimbursement estimates impacted net operating revenues and net income (loss) by an insignificant amount in each of the years ended December 31, 2021, 2020 and 2019.
The payment rates under the Medicare program for hospital inpatient and outpatient acute care services are based on prospective payment systems, which depend upon a patient’s diagnosis or the clinical complexity of services provided to a patient, among other factors. These rates are indexed for inflation annually, although increases have historically been less than actual inflation.
Payment rates under the Medicaid program vary by state. In addition to the base payment rates for specific claims for services rendered to Medicaid enrollees, several states utilize supplemental reimbursement programs to make separate payments that are not specifically tied to an individual’s care, some of which offset a portion of the cost of providing care to Medicaid and indigent patients. These programs are designed with input from CMS and are funded with a combination of state and federal resources, including, in certain instances, fees or taxes levied on the providers. The programs are generally authorized for a specified period of time and require CMS’s approval to be extended. We are unable to predict whether or on what terms CMS will extend the supplemental programs in the states in which we operate. Under these supplemental programs, we recognize revenue and related expenses in the period in which amounts are estimable and payment is reasonably assured. Reimbursement under these programs is reflected in net operating revenues and included as Medicaid revenue in the table above, and fees, taxes or other program related costs are reflected in other operating expenses.
As of December 31, 2021, Indiana, Florida, Texas and Alabama represented our only areas of significant geographic concentration. Net operating revenues generated by our hospitals in Indiana, as a percentage of consolidated net operating revenues, were 16.4% in 2021, 15.0% in 2020 and 13.7% in 2019. Net operating revenues generated by our hospitals in Florida, as a percentage of consolidated net operating revenues, were 12.2% in 2021 and 13.0% in 2020 and 14.3% in 2019. Net operating revenues generated by our hospitals in Texas, as a percentage of consolidated net operating revenues, were 11.0% in 2021 and 12.2% in both 2020 and 2019. Net operating revenues generated by our hospitals in Alabama, as a percentage of consolidated net operating revenues, were 13.0% in 2021, 12.1% in 2020 and 10.6% in 2019.
Hospital revenues depend upon inpatient occupancy levels, the volume of outpatient procedures and the charges or negotiated payment rates for hospital services provided. Charges and payment rates for routine inpatient services vary significantly depending on the type of service performed and the geographic location of the hospital. In recent years, we have experienced a significant increase in revenue received from outpatient services. We attribute this increase to:
|
|
• |
advances in technology, which have permitted us to provide more services on an outpatient basis and |
|
|
• |
pressure from Medicare and Medicaid programs, insurance companies and managed care plans to reduce the length and number of inpatient hospital stays and to reduce costs by providing services on an outpatient rather than on an inpatient basis. |
Healthcare facility operations are also subject to certain seasonal fluctuations, including decreases in patient utilization during holiday periods and increases in colder weather months. However, the COVID-19 pandemic has had, and may continue to have, an impact on patient behaviors and patient volumes that has resulted in, and may continue to result in, temporary changes in typical seasonal fluctuations of our business.
10
Government Regulation
Overview. Participants in the healthcare industry are required to comply with extensive government regulation at the federal, state and local levels. If we fail to comply with applicable laws and regulations, we may be subject to criminal penalties and civil sanctions, our hospitals could lose their licenses and we could lose our ability to participate in Medicare, Medicaid and other government programs. These legal and regulatory standards address, among other issues, licensure, certification, and enrollment with government programs; the necessity and adequacy of medical care; quality of medical equipment and services; qualifications of medical and support personnel; operating policies and procedures; screening, stabilization and transfer of individuals who have emergency medical conditions; billing and coding for services; handling overpayments; classifications of levels of care provided; preparing and filing cost reports; relationships with referral sources and referral recipients; maintenance of adequate records; hospital use; rate-setting; building codes; environmental protection; privacy and security; interoperability and refraining from information blocking; debt collection; balance billing and billing for out-of-network services; and communications with patients and consumers.
Hospitals are subject to periodic inspection by federal, state and local authorities to determine their compliance with applicable regulations and requirements necessary for licensing and certification. All of our hospitals are licensed under appropriate state laws and are qualified to participate in Medicare and Medicaid programs. In addition, most of our hospitals are accredited by The Joint Commission. This accreditation indicates that a hospital satisfies the applicable health and administrative standards to participate in Medicare and Medicaid programs.
Government regulations may change. If that happens, we may have to make changes to our facilities, equipment, personnel and services so that our hospitals remain certified as hospitals and qualified to participate in these programs. We believe that our hospitals are in substantial compliance with current federal, state and local regulations and standards. We cannot be certain that governmental officials responsible for enforcing these laws or whistleblowers will not assert that we are in violation of them or that such statutes or regulations will be interpreted by the courts in a manner consistent with our interpretation.
Healthcare Reform. The U.S. Congress and certain state legislatures have introduced and passed a large number of proposals and legislation designed to make major changes in the healthcare system, including changes that have impacted access to health insurance. The most prominent of these efforts, the Patient Protection and Affordable Care Act, as amended by the Health Care and Education Reconciliation Act of 2010, or the Affordable Care Act, affects how healthcare services are covered, delivered and reimbursed. The Affordable Care Act increased health insurance coverage through a combination of public program expansion and private sector health insurance reforms. The Affordable Care Act also made a number of changes to Medicare and Medicaid reimbursement, such as a productivity offset to the Medicare market basket update and reductions to the Medicare and Medicaid disproportionate share hospital, or DSH, payments. However, reductions to Medicaid DSH payments have been delayed by the Consolidated Appropriations Act, 2021, or the CAA, through 2023 (to begin in federal fiscal year 2024).
The Affordable Care Act has been subject to legislative and regulatory changes. For example, effective January 1, 2019, the financial penalty associated with the Affordable Care Act’s mandate that most individuals enroll in a health insurance plan was effectively eliminated. This change resulted in legal challenges to the constitutionality of the individual mandate and validity of the Affordable Care Act as a whole. However, in June 2021, the U.S. Supreme Court determined that the plaintiffs lacked standing, allowing the law to remain in place. Nonetheless, the elimination of the individual mandate penalty and other changes may impact the number of individuals that elect to obtain public or private health insurance or the scope of such coverage, if purchased. Some states have imposed individual health insurance mandates, and other states have explored or offer public health insurance options.
The current presidential administration has indicated that it generally intends to protect and strengthen the Affordable Care Act and Medicaid programs. For example, in January 2021, President Biden issued an executive order that instructed certain governmental agencies to review and reconsider their existing policies and rules that limit access to health insurance coverage. In a final rule published in September 2021, HHS extended the annual open enrollment period for coverage through federal marketplaces and granted state exchanges flexibility to lengthen their open enrollment periods.
Of critical importance to us is the potential impact of any changes specific to the Medicaid program, including the funding and expansion provisions of the Affordable Care Act and subsequent legislation or agency initiatives. Historically, the states with the greatest reductions in the number of uninsured adult residents have expanded Medicaid. A number of states have opted out of the Medicaid coverage expansion provisions, but could ultimately decide to expand their programs at a later date. Of the 16 states in which we operated hospitals as of December 31, 2021, nine states have taken action to expand their Medicaid programs. At this time, the other seven states have not, including Florida, Alabama, Tennessee, Mississippi and Texas, where we operated a significant number of hospitals as of December 31, 2021. Some states use, or have applied to use, waivers granted by CMS to implement expansion, impose different eligibility or enrollment conditions, or otherwise implement programs that vary from federal standards.
There is uncertainty regarding the ongoing net effect of the Affordable Care Act due to the potential for continued changes to the law’s implementation and its interpretation by government agencies and courts. There is also uncertainty regarding the potential
11
impact of other health reform efforts at the federal and state levels. Some reforms may have a positive impact on our business, while others may increase our operating costs, adversely impact the reimbursement we receive, or require us to modify certain aspects of our operations. For example, some members of Congress have proposed measures that would expand government-sponsored health insurance coverage, including single-payor models, and some states have implemented or are considering public health insurance options. Legislative and executive branch efforts related to healthcare reform could result in increased prices for consumers purchasing health insurance coverage, or destabilize insurance markets, among other effects. Some current initiatives, requirements and proposals, including requirements aimed at price transparency and out-of-network charges, may impact prices, our competitive position, and our relationships with insurers and patients. For example, the No Surprises Act requires providers to send an insured patient’s health plan a good faith estimate of expected charges, including billing and diagnostic codes, prior to when the patient is scheduled to receive the item or service. HHS is deferring enforcement of this requirement until it issues additional regulations.
Fraud and Abuse Laws. Participation in the Medicare and Medicaid programs is heavily regulated by federal statute and regulation. If a hospital fails to comply substantially with the requirements for participating in the programs, the hospital’s participation may be terminated and/or civil or criminal penalties may be imposed. For example, a hospital may lose its ability to participate in the Medicare program if it engages in any of the following acts:
|
|
• |
making claims to Medicare for services not provided or misrepresenting actual services provided in order to obtain higher payments; |
|
|
• |
paying money to induce the referral of patients where services are reimbursable under a federal health program; or |
|
|
• |
paying money to limit or reduce the services provided to Medicare beneficiaries. |
Any person or entity that knowingly and willfully defrauds or attempts to defraud a healthcare benefit program, including private healthcare plans, may be subject to fines, imprisonment or both. Additionally, any person or entity that knowingly and willfully falsifies or conceals a material fact or makes any material false or fraudulent statements in connection with the delivery or payment of healthcare services by a healthcare benefit plan is subject to a fine, imprisonment or both.
A section of the Social Security Act known as the “Anti-Kickback Statute” prohibits some business practices and relationships under Medicare, Medicaid and other federal healthcare programs. These practices include the payment, receipt, offer, or solicitation of remuneration of any kind in exchange for items or services that are reimbursed under a federal healthcare program. Courts have interpreted this statute broadly and have held that there is a violation of the Anti-Kickback Statute if just one purpose of the remuneration is to generate referrals.
The Office of Inspector General of the Department of Health and Human Services, or OIG, is responsible for identifying and investigating fraud and abuse activities in federal healthcare programs. As part of its duties, the OIG provides guidance to healthcare providers by identifying types of activities that could violate the Anti-Kickback Statute. The OIG also publishes regulations outlining activities and business relationships that would be deemed not to violate the Anti-Kickback Statute. These regulations are known as “safe harbor” regulations. The failure of a particular activity to comply with the safe harbor regulations does not necessarily mean that the activity violates the Anti-Kickback Statute; however, such failure may lead to increased scrutiny by government enforcement authorities.
The OIG has identified the following incentive arrangements as potential violations of the Anti-Kickback Statute:
|
|
• |
payment of any incentive by the hospital when a physician refers a patient to the hospital; |
|
|
• |
use of free or significantly discounted office space or equipment for physicians in facilities usually located close to the hospital; |
|
|
• |
provision of free or significantly discounted billing, nursing, or other staff services; |
|
|
• |
free training for a physician’s office staff, including management and laboratory techniques (but excluding compliance training); |
|
|
• |
guarantees which provide that, if the physician’s income fails to reach a predetermined level, the hospital will pay any portion of the remainder; |
|
|
• |
low-interest or interest-free loans or loans which may be forgiven if a physician refers patients to the hospital; |
|
|
• |
payment of the costs of a physician’s travel and expenses for conferences or an honorarium for speaker events; |
|
|
• |
payment of services which require few, if any, substantive duties by the physician, or payment for services in excess of the fair market value of the services rendered; |
|
|
• |
coverage on the hospital’s group health insurance plans at an inappropriately low cost to the physician; |
|
|
• |
purchasing goods or services from physicians at prices in excess of their fair market value; |
|
|
• |
rental of space in physician offices, at other than fair market value; or |
12
|
|
• |
physician-owned entities (often referred to as physician-owned distributorships, or PODS) that derive revenue from selling, or arranging for the sale of, implantable medical devices ordered by their physician-owners for use on procedures that physician-owners perform on their own patients at hospitals or ASCs. |
We have a variety of financial relationships with physicians who refer patients to our hospitals. Physicians own interests in a number of our facilities. Physicians may also own our stock. We also have contracts with physicians providing for a variety of financial arrangements, including employment contracts, leases, management agreements and professional service agreements. We provide financial incentives to recruit physicians to relocate to communities served by our hospitals. These incentives include relocation, reimbursement for certain direct expenses, income guarantees and, in some cases, loans. Although we strive to comply with the Anti-Kickback Statute, taking into account available guidance including the “safe harbor” regulations, including revised regulations issued in November 2020, we cannot assure you that regulatory authorities will not determine otherwise. If that happens, we could be subject to criminal and civil penalties and/or exclusion from participating in Medicare, Medicaid, or other government healthcare programs. Civil monetary penalties increase annually based on updates to the consumer price index.
The Social Security Act also includes a provision commonly known as the “Stark Law.” This law prohibits physicians from referring Medicare and Medicaid patients to healthcare entities in which they or any of their immediate family members have ownership interests or other financial arrangements. These types of referrals are commonly known as “self referrals.” Sanctions for violating the Stark Law include denial of payment, civil monetary penalties that are increased annually based on updates to the consumer price index, and exclusion from federal healthcare programs.
There are ownership and compensation arrangement exceptions to the self-referral prohibition. One exception allows a physician to refer patients to a healthcare entity in which the physician has an ownership interest if the entity is located in a rural area, as defined in the statute. There are also exceptions for many of the customary financial arrangements between physicians and providers, including employment contracts, leases and recruitment agreements. From time to time, CMS has issued regulations that interpret the Stark Law. In November 2020 and November 2021, CMS finalized changes to the Stark Law implementing regulations intended to modernize and clarify the requirements for complying with the Stark Law.
Another exception to the Stark Law, known as the “whole hospital” exception, allows a physician to make a referral to a hospital if the physician owns an interest in the entire hospital, as opposed to an ownership interest in a department of the hospital, and the hospital meets certain “grandfathering” requirements imposed by the Affordable Care Act. These requirements prohibit physicians from increasing the aggregate percentage of their ownership in the hospital and restrict the ability of physician-owned hospitals from expanding the capacity of their aggregate licensed beds, operating rooms and procedure rooms, beyond the ownership percentage and capacities in place in 2010. The whole hospital exception also contains additional public disclosure requirements. A hospital is considered to be physician-owned if any physician, or an immediate family member of a physician, holds debt, stock or other types of investment in the hospital or in any owner of the hospital, excluding physician ownership through publicly-traded securities that meet certain conditions.
In addition to the restrictions and disclosure requirements applicable to physician-owned hospitals under the Stark Law, CMS regulations require physician-owned hospitals and their physician owners to disclose certain ownership information to patients. Physician-owned hospitals must disclose their physician ownership in writing to patients and must make a list of their physician owners available upon request. Additionally, each physician owner who is a member of a physician-owned hospital’s medical staff must agree, as a condition of continued medical staff membership or admitting privileges, to disclose in writing to all patients whom they refer to the hospital their (or an immediate family member’s) ownership interest in the hospital. If a hospital fails to comply with these regulations, the hospital could lose its Medicare provider agreement and be unable to participate in Medicare.
Evolving interpretations of current, or the adoption of new, federal or state laws or regulations could affect many of the arrangements entered into by each of our hospitals. In addition, law enforcement authorities, including the OIG, the courts and Congress have in recent years increased scrutiny of arrangements between healthcare providers and potential referral sources to ensure that the arrangements are not designed as a mechanism to improperly pay for patient referrals and/or other business. Investigators have demonstrated a willingness to look behind the formalities of a business transaction to determine the underlying purpose of payments between healthcare providers and potential referral sources.
Many states in which we operate have also adopted laws that prohibit payments to physicians in exchange for referrals, similar to the federal Anti-Kickback Statute, or that otherwise prohibit fraud and abuse activities. Many states have also passed self-referral legislation similar to the Stark Law, prohibiting the referral of patients to entities with which the physician has a financial relationship. Often these state laws are broad in scope and may apply regardless of the source of payment for care. These statutes typically provide for criminal and civil penalties, as well as loss of licensure. Little precedent exists for the interpretation or enforcement of these state laws.
13
Our operations could be adversely affected by the failure of our arrangements to comply with the Anti-Kickback Statute, the Stark Law, billing laws and regulations, current state laws or other legislation or regulations in these areas adopted in the future. We are unable to predict whether other legislation or regulations at the federal or state level in any of these areas will be adopted, what form such legislation or regulations may take or how they may affect our operations. We are continuing to enter into new financial arrangements with physicians and other providers in a manner structured to comply in all material respects with these laws. We strive to comply with applicable fraud and abuse laws. We cannot assure you, however, that governmental officials responsible for enforcing these laws or whistleblowers will not assert that we are in violation of them or that such statutes or regulations ultimately will be interpreted by the courts in a manner consistent with our interpretation.
Federal False Claims Act and Similar State Laws. Another significant enforcement mechanism used within the healthcare industry is the federal False Claims Act, or FCA, which can be used to prosecute Medicare and other government program fraud involving issues such as coding errors, billing for service not provided and submitting false cost reports. The FCA covers payments involving federal funds in connection with the health insurance exchanges created under the Affordable Care Act, if those payments involve any federal funds. Liability under the FCA often arises when an entity knowingly submits a false claim for reimbursement to the federal government. The FCA broadly defines the term “knowingly.” Although simple negligence will not give rise to liability under the FCA, submitting a claim with reckless disregard to its truth or falsity may constitute “knowingly” submitting a false claim and result in liability. Among the many other potential bases for liability under the FCA is the knowing and improper failure to report and refund amounts owed to the government within 60 days of identifying an overpayment. An overpayment is deemed to be identified when a person has, or should have through reasonable diligence, determined that an overpayment was received and quantified the overpayment. Submission of a claim for an item or service generated in violation of the Anti-Kickback Statute constitutes a false or fraudulent claim under the FCA. In some cases, whistleblowers, the federal government and courts have taken the position that providers who allegedly have violated other statutes, such as the Stark Law, have thereby submitted false claims under the FCA.
When a defendant is determined by a court of law to be liable under the FCA, the defendant must pay three times the actual damages sustained by the government, plus substantial civil penalties for each separate false claim. These civil monetary penalties are adjusted annually based on updates to the consumer price index. Settlements entered into prior to litigation usually involve a less severe calculation of damages. The FCA also contains “qui tam,” or whistleblower provisions, which allow private individuals to bring actions on behalf of the government alleging that the defendant has defrauded the federal government. If the government intervenes in the action and prevails, the party filing the initial complaint may share in any settlement or judgment. If the government does not intervene in the action, the whistleblower plaintiff may pursue the action independently and may receive a larger share of any settlement or judgment. When a private party brings a qui tam action under the FCA, the defendant generally will not be made aware of the lawsuit until the government commences its own investigation or determines whether it will intervene. Every entity that receives at least $5 million annually in Medicaid payments must have written policies for all employees, contractors and agents providing detailed information about false claims, false statements and whistleblower protections under certain federal laws, including the FCA, and similar state laws.
A number of states, including states in which we operate, have adopted their own false claims provisions as well as their own whistleblower provisions whereby a private party may file a civil lawsuit in state court. Federal law provides an incentive to states to enact false claims laws that are comparable to the FCA. From time to time, companies in the healthcare industry, including ours, may be subject to actions under the FCA or similar state laws.
Corporate Practice of Medicine; Fee-Splitting. Some states have laws that prohibit unlicensed persons or business entities, including corporations, from employing physicians. Some states also have adopted laws that prohibit direct or indirect payments to, or entering into fee-splitting arrangements with, physicians and unlicensed persons or business entities. Possible sanctions for violations of these restrictions include loss of a physician’s license, civil and criminal penalties and rescission of business arrangements. These laws vary from state to state, are often vague and have seldom been interpreted by the courts or regulatory agencies. We structure our arrangements with healthcare providers to comply with the relevant state law. However, we cannot provide assurance that governmental officials responsible for enforcing these laws will not assert that we, or transactions in which we are involved, are in violation of these laws. These laws may also be interpreted by the courts in a manner inconsistent with our interpretations.
Emergency Medical Treatment and Active Labor Act. The Emergency Medical Treatment and Active Labor Act, or EMTALA, imposes requirements as to the care that must be provided to anyone who comes to facilities providing emergency medical services seeking care before they may be transferred to another facility or otherwise denied care. Sanctions for failing to fulfill these requirements include exclusion from participation in Medicare and Medicaid programs and civil money penalties, which are increased annually based on updates to the consumer price index. In addition, the law creates private civil remedies that enable an individual who suffers personal harm as a direct result of a violation of the law to sue the offending hospital for damages and equitable relief. A medical facility that suffers a financial loss as a direct result of another participating hospital’s violation of the law also has a similar right. Although we believe that our practices are in compliance with the law, we can give no assurance that governmental officials responsible for enforcing the law will not assert we are in violation of this law.
14
Conversion Legislation. Many states, including some where we have hospitals and others where we may in the future acquire hospitals, have adopted legislation regarding the sale or other disposition of hospitals operated by not-for-profit entities. In other states that do not have specific legislation, the attorneys general have demonstrated an interest in these transactions under their general obligations to protect charitable assets from waste. These legislative and administrative efforts primarily focus on the appropriate valuation of the assets divested and the use of the proceeds of the sale by the not-for-profit seller. While these reviews and, in some instances, approval processes can add additional time to the closing of a hospital acquisition, we have not had any significant difficulties or delays in completing the acquisition process. There can be no assurance, however, that future actions on the state level will not seriously delay or even prevent our ability to acquire hospitals. If these activities are widespread, they could limit our ability to acquire hospitals.
Antitrust Laws. The federal government and most states have enacted antitrust laws that prohibit certain types of conduct deemed to be anti-competitive. These laws prohibit price fixing, market allocation, bid-rigging, concerted refusal to deal, market monopolization, price discrimination, tying arrangements, acquisitions of competitors and other practices that have, or may have, an adverse effect on competition. Violations of federal or state antitrust laws can result in various sanctions, including criminal and civil penalties. Antitrust enforcement in the healthcare industry is currently a priority of the Federal Trade Commission and the U.S. Department of Justice. We believe we are in compliance with such federal and state laws, but courts or regulatory authorities may reach a determination in the future that could adversely affect our operations.
Certificates of Need. The construction of new facilities, the acquisition of existing facilities, significant capital expenditures and the addition of new services at our facilities may be subject to state laws that require prior approval by state regulatory agencies. These certificate of need, or CON, laws generally require that a state agency determine the public need and give approval prior to the construction or acquisition of facilities, significant capital expenditure or the addition of new services. As of December 31, 2021, we operated 65 hospitals in 12 states that have adopted CON laws. If we fail to obtain necessary state approval, we will not be able to expand our facilities, complete acquisitions or significant capital expenditures or add new services in these states. Violation of these state laws may result in the imposition of civil sanctions or the revocation of a provider’s licenses.
HIPAA Administrative Simplification and Privacy and Security Requirements. The Health Insurance Portability and Accountability Act of 1996, or HIPAA, requires the use of uniform electronic data transmission standards for healthcare claims and payment transactions submitted or received electronically. These provisions are intended to encourage electronic commerce in the healthcare industry. HHS has established electronic data transmission standards and code sets that all healthcare providers must use when submitting or receiving certain healthcare transactions electronically and has issued operating rules to promote uniformity in the implementation of each standardized electronic transaction. HIPAA also requires that each provider use a National Provider Identifier.
As required by HIPAA, HHS has issued privacy and security regulations that extensively regulate the use and disclosure of individually identifiable health-related information and require covered entities, including health plans and most healthcare providers, to implement administrative, physical and technical practices to protect the security of individually identifiable health information that is electronically maintained or transmitted. Business associates (entities that handle identifiable health-related information on behalf of covered entities) are subject to direct liability for violation of applicable provisions of the regulations. In addition, a covered entity may be subject to penalties as a result of a business associate violating HIPAA, if the business associate is found to be an agent of the covered entity. We have developed and utilize a HIPAA compliance plan as part of our effort to comply with HIPAA privacy and security requirements. The privacy regulations and security regulations have and will continue to impose significant costs on us in order to comply with these standards.
Covered entities must report breaches of unsecured protected health information to affected individuals without unreasonable delay, but not to exceed 60 days of discovery of the breach by the covered entity or its agents. Notification must also be made to HHS and, in certain situations involving large breaches, to the media. HHS is required to publish on its website a list of all covered entities that report a breach involving more than 500 individuals. All non-permitted uses or disclosures of unsecured protected health information are presumed to be breaches unless the covered entity or business associate establishes that there is a low probability the information has been compromised. Various state laws and regulations may also require us to notify affected individuals in the event of a data breach involving individually identifiable information.
Violations of the HIPAA privacy and security regulations may result in criminal penalties and in substantial civil penalties per violation. The civil penalties are adjusted annually based on updates to the consumer price index. HHS is required to perform compliance audits. In addition to enforcement by HHS, state attorneys general are authorized to bring civil actions seeking either injunction or damages in response to violations of HIPAA privacy and security regulations that threaten the privacy of state residents. HHS may resolve HIPAA violations through informal means, such as allowing a covered entity to implement a corrective action plan, but HHS has the discretion to move directly to impose monetary penalties and is required to impose penalties for violations resulting from willful neglect. We are also subject to any federal or state privacy-related laws that are more restrictive than the privacy regulations issued under HIPAA. These laws vary and could impose additional penalties and subject us to additional privacy and security restrictions. For example, the Federal Trade Commission uses its consumer protection authority to initiate enforcement
15
actions in response to data breaches. In addition, various states have enacted, and other states are considering, new laws and regulations concerning the privacy and security of consumer and other personal information. To the extent we are subject to such requirements, these laws and regulations often have far-reaching effects, are subject to amendments and changing requirements and updates to regulators’ enforcement priorities, may require us to modify our data processing practices and policies, may require us to incur substantial costs and expenses to comply and may subject our business to a risk of increased potential liability. These laws and regulations often provide for civil penalties for violations, as well as a private right of action for data breaches, which may increase the likelihood or impact of data breach litigation.
Payment
Medicare. Medicare is a federal health insurance program that provides certain hospital and medical insurance benefits to persons age 65 and over, some disabled persons, and persons with end-stage renal disease.
Payments for inpatient acute hospital services are generally made pursuant to a prospective payment system, or PPS. Under the inpatient PPS, our hospitals are paid a predetermined amount for each hospital discharge based on the patient’s diagnosis. Specifically, each discharge is assigned to a Medicare severity diagnosis-related group, commonly known as an “MS-DRG,” based upon the patient’s condition and treatment during the relevant inpatient stay. The MS-DRGs are severity-adjusted to account for the severity of each patient’s condition and expected resource consumption. Each MS-DRG has a payment weight assigned to it that is based on the average resources used to treat Medicare patients in that MS-DRG. MS-DRG payments are based on national averages and not on charges or costs specific to a hospital. Medicare sets discharge base rates (standardization payment amounts), which are adjusted according to the MS-DRG relative weights and geographic factors. In addition, hospitals may qualify for an “outlier” payment when a patient’s treatment costs are extraordinarily high and exceed a specified regulatory threshold.
The MS-DRG payment rates for inpatient acute services are adjusted by an update factor on October 1 of each year, the beginning of the federal fiscal year. The index used to adjust the MS-DRG payment rates, known as the “market basket index,” gives consideration to the inflation experienced by hospitals in purchasing goods and services. MS-DRG payment rates were increased by the “market basket index” update of 2.4% and 2.7% for each of federal fiscal years 2021 and 2022, respectively, subject to certain adjustments. For federal fiscal year 2021, the market basket update was adjusted by the following percentage points: a positive 0.5 adjustment in accordance with the Medicare Access and CHIP Reauthorization Act of 2015, or MACRA, and a 0.0 productivity adjustment. For federal fiscal year 2022, the market basket was adjusted by the following percentage points: a positive 0.5 adjustment in accordance with MACRA and a 0.7 reduction for the productivity adjustment. A reduction of 25% of the market basket update occurs if patient quality data is not submitted, and a reduction of 75% of the market basket update occurs for hospitals that fail to demonstrate meaningful use of certified electronic health records, or EHR, technology without receiving a hardship exception. Additional adjustments may apply, depending on patient-specific or hospital-specific factors.
The MS-DRG payment rates are also adjusted to promote value-based purchasing, linking payments to quality and efficiency. First, hospitals that meet or exceed certain quality performance standards receive greater reimbursement under CMS’s Hospital Value-Based Purchasing Program, while hospitals that do not satisfy certain quality performance standards receive reduced Medicare inpatient hospital payments. CMS withholds 2% of participating hospitals’ Medicare payments and uses the total amount collected to fund payments that reward hospitals based on a set of quality and resource use measures. CMS scores each hospital on its achievement relative to other hospitals and improvement relative to that hospital’s own past performance. Second, hospitals experiencing “excess readmissions” within 30 days from the patient’s date of discharge following treatment for conditions or procedures designated by CMS receive reduced payments for all inpatient discharges, not just discharges relating to the conditions or procedures subject to the readmission standard. The payment reduction is determined by assessing that hospital’s readmissions relative to hospitals with similar proportions of dual-eligible patients. Third, the bottom quartile of hospitals based on the national risk-adjusted hospital acquired condition, or HAC, rates in the previous year have their total inpatient operating Medicare payments reduced by 1%. HHS has indicated that it will increase its efforts to promote, develop and use alternative payment models such as Accountable Care Organizations, or ACOs, and bundled payment arrangements.
In addition, hospitals may qualify for Medicare DSH payment adjustments when their percentage of low-income patients exceeds specified regulatory thresholds. A majority of our hospitals qualify to receive these adjustments. CMS also distributes an additional payment to each DSH hospital for its proportion of uncompensated care costs relative to the uncompensated care amount of other DSH hospitals. The uncompensated care amount is hospital-specific and generally includes charity care and non-Medicare and non-reimbursable Medicare bad debt. The Medicare DSH adjustments and uncompensated care payments as a percentage of net operating revenues were 0.91% and 1.11% for the years ended December 31, 2021 and 2020, respectively.
We also receive Medicare reimbursement for hospital outpatient services through a PPS. Services paid under the hospital outpatient PPS are grouped into ambulatory payment classifications, or APCs. Services for each APC are similar clinically and in terms of the resources they require. APC payment rates are generally determined by applying a conversion factor, which CMS updates annually using a market basket. For calendar year 2021, CMS estimated an increase in hospital outpatient PPS payments of 2.4%. This reflected
16
a market basket increase of 2.4%, with a 0.0 percentage point productivity adjustment. For calendar year 2022, CMS estimated an increase in hospital outpatient PPS payments of 2.0%, reflecting a market basket increase of 2.7%, with a negative 0.7 percentage point productivity adjustment. A 2.0 percentage point reduction to the market basket update applies to hospitals that do not submit required patient quality data. We are complying with this data submission requirement.
In calendar year 2019, CMS began a two-year phase-in of an expanded site-neutral payment policy for off-campus provider-based departments paid under the outpatient PPS. Under the policy, all off-campus provider-based departments are paid the Medicare Physician Fee Schedule, or MPFS, -equivalent rate for clinic visits, which is generally lower than the outpatient PPS rate. Before the expanded policy, the MPFS-equivalent rate did not apply to “excepted” provider-based departments. In September 2019, a federal judge invalidated the expansion of the site-neutral payment policy for calendar year 2019. CMS appealed this decision and prevailed. However, pending its appeal, CMS had begun reprocessing the 2019 claims paid at the lower rates. As a result of its successful appeal, CMS indicated it would begin, by November 1, 2021, to reprocess the 2019 claims provided at excepted provider-based departments so that they are paid at the same rate as non-excepted provider-based departments for those services under the MPFS. For calendar year 2020, CMS issued a final rule implementing year two of the policy phase-in. For calendar year 2021 and beyond, CMS is continuing the payment policy. The MPFS-equivalent rate for calendar year 2022 is approximately 40% of the outpatient PPS rate.
CMS uses fee schedules to pay for physician services, physical, occupational and speech therapies, durable medical equipment, clinical diagnostic laboratory services, freestanding surgery center services, and certain other items and services. Under the MPFS, CMS has assigned a national relative value unit, or RVU, to most medical procedures and services that reflects the resources required to provide the services relative to all other services. Each RVU is calculated based on a combination of the time and intensity of work required, overhead expense attributable to the service, and malpractice insurance expense. These elements are each modified by a geographic adjustment factor to account for local practice costs and are then aggregated. To determine the payment rate for a particular service, the sum of the geographically adjusted RVUs is multiplied by a conversion factor. For calendar year 2022, CMS decreased the conversion factor by approximately 3.71%, reflecting a budget neutrality adjustment to account for changes in RVUs and the expiration of a 3.75% temporary payment increase that Congress approved for calendar year 2021 through the CAA. However, Congress approved a 3.0% payment increase for calendar year 2022, which will partially offset this reduction.
CMS requires physicians and certain other healthcare clinicians to participate in one of two tracks under the Quality Payment Program, or QPP, which is a payment methodology intended to reward high-quality patient care. Under both tracks, performance data collected each performance year affects Medicare payments two years later. CMS expects to transition increasing financial risk to providers as QPP evolves. Under the Advanced Alternative Payment Model, or Advanced APM, track, incentive payments are available based on participation in specific innovative payment models approved by CMS. Providers may earn a Medicare incentive payment and will be exempt from the reporting requirements and payment adjustments imposed under the Merit-Based Incentive Payment System, or MIPS, if the provider has sufficient participation in an Advanced APM. Alternatively, providers may participate in the MIPS track, under which physicians will receive performance-based payment incentives or payment reductions based on their performance with respect to clinical quality, resource use, clinical improvement activities, and meaningful use of EHRs.
Medicaid. Medicaid is a program funded jointly by state and federal governments, and administered by the states, that provides hospital and medical benefits to qualifying low-income individuals. Medicaid enrollment has increased as a result of the COVID-19 pandemic, and the federal government has made available enhanced federal Medicaid funding in response to the pandemic.
Most state Medicaid payments are made under a PPS or under programs that negotiate payment levels with individual hospitals. In addition to the base payment rates for specific claims for services rendered to Medicaid enrollees, states utilize supplemental reimbursement programs to make separate payments that are not specifically tied to an individual’s care. Supplemental payments may be in the form of Medicaid DSH payments, which are intended to offset hospitals’ uncompensated care costs. Medicaid DSH payments as a percentage of our net operating revenues were 0.54% and 0.65% for the years ended December 31, 2021 and 2020, respectively. The Affordable Care Act and subsequent legislation provide for reductions to the Medicaid DSH program, but Congress has delayed the implementation of these reductions. Under current law, Medicaid DSH payments will be reduced by $8 billion per year in each of federal fiscal years 2024 through 2027. Supplemental payments may also be in the form of non-DSH payments, such as upper payment limit payments, which are intended to address the difference between Medicaid fee-for-service payments and Medicare reimbursement rates. These supplemental reimbursement programs are designed with input from CMS. The programs are generally authorized for a specified period of time and require CMS’s approval to be extended. CMS is considering changes to both types of programs, and we are unable to predict whether or on what terms CMS will extend the supplemental programs in the states in which we operate.
The federal government and many states are using or considering various strategies to reduce Medicaid expenditures, outside of the pandemic response. In response to budgetary pressures, certain states in which we operate have adopted broad taxes on healthcare providers to fund the non-federal share of Medicaid programs. In addition, many states currently operate, or have applied to CMS to operate, Medicaid programs under waivers to standard Medicaid program requirements. For example, the Texas Transformation and Quality Improvement Program, or the Texas Waiver Program, is operated under a waiver granted under Section 1115 of the Social
17
Security Act. The program provides funding for uncompensated care and supports several delivery system reform initiatives. However, there is currently uncertainty regarding the duration of the Texas Waiver Program. Although the previous presidential administration approved a 10-year extension of the program, through September 2030, CMS rescinded this extension in April 2021. The Texas Attorney General filed a lawsuit challenging the rescission and, in August 2021, a federal district judge granted a preliminary injunction temporarily reinstating the extension. While the lawsuit is pending, the Texas Health and Human Services Commission has re-submitted its application to extend the Texas Waiver Program.
There is uncertainty in other states as well. The prior presidential administration increased state flexibility in the administration of Medicaid programs, including by allowing states to condition enrollment on work or other community engagement or to use a block grant funding structure. However, the current presidential administration issued an executive order directing agencies to re-examine measures that reduce health insurance coverage or undermine Medicaid programs, and the administration has rescinded approvals of waivers for work and community engagement requirements.
TRICARE. TRICARE is the Department of Defense’s healthcare program for members of the armed forces. For inpatient services, TRICARE generally reimburses hospitals based on a DRG system modeled on the Medicare inpatient PPS. For outpatient services, TRICARE reimburses hospitals based on a PPS that is similar to that utilized for services furnished to Medicare beneficiaries.
Annual Cost Reports. Hospitals participating in the Medicare and some Medicaid programs, whether paid on a reasonable cost basis or under a PPS, are required to meet specified financial reporting requirements. Federal and, where applicable, state regulations require submission of annual cost reports identifying medical costs and expenses associated with the services provided by each hospital to Medicare beneficiaries and Medicaid recipients.
Annual cost reports required under the Medicare and some Medicaid programs are subject to routine governmental audits. These audits may result in adjustments to the amounts ultimately determined to be due to us under these reimbursement programs. Finalization of these audits often takes several years. Providers can appeal any final determination made in connection with an audit.
Commercial Insurance and Managed Care Companies. Our hospitals provide services to individuals covered by private healthcare insurance or by health plans administered by managed care companies. These payors pay our hospitals or in some cases reimburse their policyholders based upon the hospital’s established charges and the coverage provided in the insurance policy. Payors try to limit their costs by negotiating with hospitals and other healthcare providers for discounts to established charges. Commercial insurers and managed care companies also seek to reduce payments to hospitals by establishing payment rules that in effect re-characterize the services ordered by physicians. For example, some payors vigorously review each patient’s length of stay in the hospital and recharacterize as outpatient all inpatient stays of less than a particular duration (e.g., 24 hours). Similarly, some payors have prior authorization requirements designed to shift certain procedures to outpatient settings, where payment rates are typically lower. Reductions in payments for services provided by our hospitals to individuals covered by these payors could adversely affect us.
Under the Managed Medicare program, also known as Medicare Part C, or Medicare Advantage, the federal government contracts with private health plans to provide members with Medicare benefits. The plans may choose to offer supplemental benefits and impose higher premiums and cost-sharing obligations. Similarly, managed Medicaid programs enable states to contract with private entities to handle program responsibilities like care management and claims adjudication. Enrollment in Managed Medicare and managed Medicaid programs has increased in recent years as the federal and state governments seek to control healthcare costs.
Medicare Administrative Contractors. CMS competitively bids the Medicare fiscal intermediary and Medicare carrier functions to Medicare Administrative Contractors, or MACs, in 12 jurisdictions. Each MAC is geographically assigned and serves both Part A and Part B providers within a given jurisdiction. Chain providers had the option of having all hospitals use one home office MAC, and we chose to do so. However, CMS has not converted all of our hospitals to one MAC and currently does not have an established date to accomplish the conversion. CMS periodically re-solicits bids, and the MAC servicing a geographic area can change as a result of the bid competition. MAC transition periods can impact claims processing functions and the resulting cash flow.
Medicare and Medicaid Integrity. CMS contracts with third parties to promote the integrity of the Medicare program through review of quality concerns and detection of improper payments. Quality Improvement Organizations, or QIOs, for example, are groups of physicians and other healthcare quality experts that work on behalf of CMS to ensure that Medicare pays only for goods and services that are reasonable and necessary and that are provided in the most appropriate setting. Under the Recovery Audit Contractor, or RAC, program, CMS contracts with RACs nationwide to conduct post-payment reviews to detect and correct improper payments in the Medicare program, as required by statute. RACs review claims submitted to Medicare for billing compliance, including correct coding and medical necessity. Compensation for RACs is on a contingency basis and based upon the amount of overpayments and underpayments identified, if any. CMS limits the number of claims that RACs may audit by limiting the number of records that RACs may request from hospitals based on each provider’s claim denial rate for the previous year.
18
The RAC program’s scope also includes Medicaid claims. States may coordinate with Medicaid RACs regarding recoupment of overpayments and refer suspected fraud and abuse to appropriate law enforcement agencies. Under the Medicaid Integrity Program, CMS contracts with Unified Program Integrity Contractors, or UPICs, to perform audits, investigations and other integrity activities. Working across five geographic jurisdictions, UPICs collaborate with states and coordinate provider investigations across the Medicare and Medicaid programs.
We maintain policies and procedures to respond to the RAC requests and payment denials. Payment recoveries resulting from RAC reviews and denials are appealable, and we pursue reversal of adverse determinations at appropriate appeal levels. Currently, there are significant delays in the assignment of new Medicare appeals to Administrative Law Judges. According to the Office of Medicare Hearings and Appeals, the average processing time in fiscal year 2020 was nearly four years. To ease the backlog of appeals, HHS has taken steps to streamline the process and improve efficiency, such as offering various settlement initiatives. Nevertheless, we may experience significant delays in appealing any RAC payment denials. Depending upon the growth of RAC programs and our success in appealing claims in future periods, our cash flows and results of operations could be negatively impacted.
Accountable Care Organizations. With the aim of reducing healthcare costs by improving quality and operational efficiency, ACOs have gained traction in both the public and private sectors. An ACO is a network of providers and suppliers (including hospitals, physicians and other designated professionals) that work together to invest in infrastructure and redesign delivery processes to achieve high quality and efficient delivery of services. ACOs are intended to produce savings as a result of improved quality and operational efficiency. The Medicare Shared Savings Program seeks to promote accountability and coordination of care for Medicare fee-for-service beneficiaries through the creation of ACOs. Medicare-approved ACOs that achieve quality performance standards established by HHS are eligible to share in a portion of the amounts saved by the Medicare program. HHS has significant discretion to determine key elements of ACO programs. Certain waivers and exceptions are available from fraud and abuse laws for ACOs.
The Center for Medicare and Medicaid Innovation, or CMS Innovation Center, is responsible for establishing demonstration projects and other initiatives in order to identify, develop, test and encourage the adoption of new methods of delivering and paying for healthcare that create savings under the Medicare and Medicaid programs, while maintaining or improving quality of care. In October 2021, the CMS Innovation Center published an outline of its strategy for the next decade, noting the need to accelerate the movement to value-based care and drive broader system transformation. By 2030, the CMS Innovation Center aims to have all fee-for-service Medicare beneficiaries and most Medicaid beneficiaries in a care relationship with accountability for quality and total cost of care. CMS also indicated it will streamline its payment model portfolio and consider how to ensure broad provider participation, including by implementing more mandatory models.
Bundled Payment Initiatives. Providers participating in bundled payment initiatives accept accountability for costs and quality of care by agreeing to receive one payment for services provided to Medicare patients for certain medical conditions or episodes of care. By rewarding providers for increasing quality and reducing costs and penalizing providers if costs exceed a certain amount, bundled payment models are intended to lead to higher quality, more coordinated care at a lower cost to the Medicare program. The CMS Innovation Center has implemented bundled payment models, including the Bundled Payment for Care Improvement Advanced, or BPCI Advanced, initiative, which is expected to run through December 2023. We are participating in BPCI Advanced initiatives in five of our markets. Generally, participation in bundled payment programs is voluntary, but CMS currently requires hospitals in selected markets to participate in bundled payment initiatives for specific orthopedic procedures and end-stage renal disease treatment, and a mandatory radiation oncology bundled payment model is expected to begin January 1, 2023. In its 2021 strategy refresh, the CMS Innovation Center signaled its intent to increase provider participation through implementation of more mandatory models. We expect value-based purchasing programs, including models that condition reimbursement on patient outcome measures, to become more common with both governmental and non-governmental payors.
Supply Contracts
We purchase items, primarily medical supplies, medical equipment and pharmaceuticals, under an agreement with HealthTrust, a GPO in which we are a noncontrolling partner. The current term of this agreement expires in December 2022, with automatic renewal terms of one year unless either party terminates by giving notice of non-renewal. As of December 31, 2021, we had a 17.5% ownership interest in HealthTrust. By participating in this organization, we are able to procure items at competitively priced rates for our hospitals. There can be no assurance that our arrangement with HealthTrust will continue to provide the discounts that we have historically received.
Competition
The hospital industry is highly competitive. The competition among hospitals and other healthcare providers, including urgent care centers and other outpatient providers, for patients has intensified as patients have become more conscious of rising costs and quality of care in their healthcare decision-making process. The majority of our hospitals are located in generally larger non-urban service areas in which we believe we are the primary, if not the sole, provider of general acute care health services. Those hospitals in non-
19
urban service areas may face limited or no direct competition because there are no other hospitals in their primary service areas. However, these hospitals face competition from hospitals outside of their primary service area, including hospitals in urban areas that provide more complex services. Patients in those service areas may travel to these other hospitals for a variety of reasons, including the need for services we do not offer, payor networks that exclude our providers, or physician referrals. Patients who are required to seek services from these other hospitals may subsequently shift their preferences to those hospitals for services we do provide. Our other hospitals, in selected urban service areas, may face competition from hospitals that are more established than our hospitals. Some of our competitors offer services, including extensive medical research and medical education programs, that are not offered by our facilities. In addition, in certain markets where we operate, there are large teaching hospitals that provide highly specialized facilities, equipment and services that may not be available at our hospitals. We also face competition from other specialized care providers, including outpatient surgery, orthopedic, oncology and diagnostic centers. Some competitors are implementing physician alignment strategies, such as employing physicians, acquiring physician practice groups, and participating in ACOs, or other clinical integration models. Cost-reduction strategies by large employer groups and their affiliates may increase this competition. We believe that we will continue to face increased competition in outpatient service models that become more integrated through acquisitions or partnerships between physicians, specialized care providers, and managed care payors.
In most markets in which we are not the sole provider of general acute care health services, our primary competitor is a municipal or not-for-profit hospital. These hospitals are owned by tax-supported governmental agencies or not-for-profit entities supported by endowments and charitable contributions. These hospitals are exempt from sales, property and income taxes. Such exemptions and support are not available to our hospitals and may provide the tax-supported or not-for-profit entities an advantage in funding general and capital expenditures and offering services more specialized than those available at our hospitals.
The number and quality of the physicians on a hospital’s staff is an important factor in a hospital’s competitive position. Physicians decide whether a patient is admitted to the hospital and the procedures to be performed. Admitting physicians may be on the medical staffs of other hospitals in addition to those of our hospitals. We attempt to attract our physicians’ patients to our hospitals by offering quality services and facilities, convenient locations and state-of-the-art equipment.
Trends towards transparency and value-based purchasing may impact our competitive position and patient volumes. CMS publicizes on its Care Compare website data that hospitals submit in connection with Medicare reimbursement claims, including performance data related to quality measures and patient satisfaction surveys. The quality measures that must be reported by providers, some of which impact reimbursement under value-based purchasing initiatives, continue to evolve. In addition, hospitals are required to publish online a list of their standard charges for all items and services, including gross charges, discounted cash prices and payor-specific and de-identified negotiated charges, in a publicly accessible online file. Hospitals are also required to publish a consumer-friendly list of standard charges for certain “shoppable” services (i.e., services that can be scheduled by a patient in advance) and any associated ancillary services or, alternatively, maintain an online price estimator tool. In addition, the No Surprises Act, which took effect January 1, 2022, requires providers to send to an insured patient’s health plan good faith estimates of the expected charges for scheduled items or services, including billing and diagnostic codes, prior to the scheduled date of the items or services. The estimate must cover any item or service that is reasonably expected to be provided together with the primary items or services, including those that may be provided by other providers. If a patient is uninsured, the notice must go to the patient. If the actual charges to an uninsured (or self-pay) patient are substantially higher than the estimate, the patient may invoke a dispute resolution process established by regulation to challenge the higher amount. HHS is deferring enforcement of certain requirements of the No Surprises Act related to estimates for insured patients. Among other consumer protections, the No Surprises Act also prohibits providers from charging patients an amount beyond the in-network cost sharing amount for emergency services rendered by out-of-network providers and certain non-emergency services rendered by out-of-network providers at certain in-network facilities, including hospitals. HHS has established a dispute resolution process for out-of-network providers and health plans to resolve payment disagreements when surprise billing protections apply.
Compliance Program
We take an operations team approach to compliance and utilize corporate experts for program design efforts and facility leaders for employee-level implementation. We believe compliance is another area that demonstrates our utilization of standardization and centralization techniques and initiatives which yield efficiencies and consistency throughout our facilities. We recognize that our compliance with applicable laws and regulations depends on individual employee actions as well as company operations. Our approach focuses on integrating compliance responsibilities with operational functions. This approach is intended to reinforce our company-wide commitment to operate strictly in accordance with the laws and regulations that govern our business.
Our company-wide compliance program has been in place since 1997. Currently, the program’s elements include leadership, management and oversight at the highest levels, a Code of Conduct, risk area specific policies and procedures, employee education and training, an internal system for reporting concerns, auditing and monitoring programs and a means for enforcing the program’s policies.
20
The compliance program continues to be expanded and developed to meet the industry’s expectations and our needs. Specific written policies, procedures, training and educational materials and programs, as well as auditing and monitoring activities, have been prepared and implemented to address the functional and operational aspects of our business. Included within these functional areas are materials and activities for business sub-units, including laboratory, radiology, pharmacy, emergency, surgery, observation, home care, skilled nursing and clinics. Specific areas identified through regulatory interpretation and enforcement activities have also been addressed in our program. Claims preparation and submission, including coding, billing and cost reports, comprise the bulk of these areas. Financial arrangements with physicians and other referral sources, including compliance with the federal Anti-Kickback Statute and the Stark Law, emergency department treatment and transfer requirements and other patient disposition issues, are also the focus of policy and training, standardized documentation requirements and review and audit. Another focus of the program is the interpretation and implementation of the HIPAA standards for privacy and security.
We have a Code of Conduct which applies to all directors, officers, employees and consultants, and a confidential disclosure program to enhance the statement of ethical responsibility expected of our employees and business associates who work in the accounting, financial reporting and asset management areas of our Company. Our Code of Conduct is posted on our website at www.chs.net/company-overview/code-of-conduct.
Corporate Integrity Agreement
On August 4, 2014, we announced that we had entered into a civil settlement with the U.S. Department of Justice, other federal agencies and identified relators that concluded previously announced investigations and litigation related to short stay admissions through emergency departments at certain of our affiliated hospitals. In addition to the amounts paid in the settlement, we executed a five-year Corporate Integrity Agreement, or CIA, with the OIG that has been incorporated into our existing and comprehensive compliance program.
On September 25, 2018, we announced a global resolution and settlement agreements ending the U.S. Department of Justice investigation into certain conduct of Health Management Associates, Inc., or HMA, and its affiliated entities and settling certain qui tam lawsuits that were initiated and pending, and known to us, before our acquisition by merger of HMA in 2014. Under this settlement, we made payments totaling $266 million, including interest, in the fourth quarter of 2018. Additionally, under the terms of the global settlement, our existing CIA was amended and extended. The extension began immediately and effectively added two years to the existing CIA, with the amended CIA running through September 2021. For additional information regarding the terms of the CIA, as amended, see pages 20 through 21 of our Annual Report on Form 10-K for the year ended December 31, 2020, filed on February 18, 2021.
The amended CIA expired in September 2021. However, we are still subject to final audit and reporting requirements under the terms of the CIA. In connection with these final audit and reporting requirements, it remains possible that we will become subject to further action by the OIG which could include the imposition of civil monetary penalties and/or the extension of the term of the CIA.
Human Capital
Overview
At December 31, 2021, we had approximately 66,000 employees, including approximately 15,000 part-time employees. References herein to “employees” refer to employees of our affiliates. We are subject to various state and federal laws that regulate wages, hours, benefits and other terms and conditions relating to employment. At December 31, 2021, certain employees at six of our hospitals are represented by various labor unions. It is possible that union organizing efforts will take place at additional hospitals in the future. We consider our employee relations to be good and have not experienced work stoppages that have materially, adversely affected our business or results of operations.
Our industry is facing unprecedented workforce challenges and this has become a significant operating issue for healthcare providers. To address this challenge, we have implemented several initiatives to improve retention, recruiting, compensation programs and productivity. An area that has been particularly challenging for providers is registered nurse, or RN, recruitment and retention. We have had a centralized clinical recruiting function in place for a limited number of our markets since 2018. In early 2021, we made the decision to expand this focused recruiting resource and expect that this will be in place for all of our affiliated hospitals by early 2022. For those hospitals already supported by this internal centralized RN recruiting team, we have seen an increase in clinical position hires and a decreased time-to-fill for those key patient care roles. We have also engaged with a recruitment process outsource vendor in certain markets having additional staffing needs while we have been building our internal centralized RN recruiting team. In addition to these efforts, we have been working to bring international RNs through the visa process to our hospitals. We believe that these efforts will aid in our ability to take patient transfer requests, shorten emergency department wait times and lessen dependency on high cost contract labor.
21
Due to the challenges above and other factors, our hospitals and other healthcare facilities, like many other healthcare providers, have experienced rising labor costs. We may be required to continue to enhance wages and benefits to recruit and retain nurses and other medical support personnel or to hire more expensive temporary or contract personnel. We also depend on the available labor pool of semi-skilled and unskilled employees in each of the markets in which we operate. In some of our markets, employers across various industries have increased their minimum wage, which has created more competition for this sector of employees. As a result of these and other factors, our labor costs could continue to increase. Moreover, potential changes to federal labor laws and regulations, including those supported by the current presidential administration, could increase the likelihood of employee unionization activity and the ability of employees to unionize. The extent of unionization may affect labor costs in the future. In addition, the states in which we operate could adopt mandatory nurse-staffing ratios or could reduce mandatory nurse-staffing ratios already in place. State-mandated nurse-staffing ratios could significantly affect labor costs, and have an adverse impact on revenues if we are required to limit patient admissions in order to meet the required ratios.
Our hospitals are staffed by licensed physicians, including both employed physicians and physicians who are not employees of our hospitals. Some physicians provide services in our hospitals under contracts, which generally describe a term of service, provide and establish the duties and obligations of such physicians, require the maintenance of certain performance criteria and fix compensation for such services. Any licensed physician may apply to be accepted to the medical staff of any of our hospitals, but the hospital’s medical staff and the appropriate governing board of the hospital, in accordance with established credentialing criteria, must approve acceptance to the staff. Members of the medical staffs of our hospitals often also serve on the medical staffs of other hospitals and may terminate their affiliation with one of our hospitals at any time.
We believe that our employees are vital contributors to our success, and we devote significant resources to recruit, retain and develop our workforce. Certain areas of focus in this regard are summarized below.
Diversity, Equity and Inclusion
We believe that a diverse workforce is a catalyst for positive and consistent patient outcomes and high quality care. With inclusion as our strategy, diversity and equity are the outcomes we expect. Our objective is to recruit and retain a diverse population of employees with respect to their experiences, education, socioeconomic status, race, color, ethnicity, religion, national origin, disability, culture, sexual orientation and gender identity or expression that are reflective of the communities we serve. As of December 31, 2021, approximately 80% of our employees were women and approximately 25% were people of color.
As we strive to deepen our culture of inclusion, our goal is to strengthen our individual and collective cultural competence through both formal training and development programs and by informally sharing lived experiences and relating to one another. We are committed to building a diverse talent pipeline through a variety of venues and programs such as internships, residencies, mentorship programs and by partnering with diverse professional organizations. A Diversity Leadership Committee was formed in 2021 and various actions have been taken with respect to many diversity, equity and inclusion objectives such as retaining and developing high potential employees, improving patient experience and outcomes and increasing supplier diversity. We intend to leverage data to inform and measure the effectiveness of our diversity, equity and inclusion efforts over time.
Training and Talent Development
The delivery of high quality patient care is predicated on proper education and continued training. We provide a wide range of development programs and resources to support our employees, including temporary and contract personnel. In this regard, our talent development strategy is facilitated through our Advanced Learning Center platform, or ALC, a web-based portal, which provides employees and contractors access to computer based training courses as well as instructor-led classes. Our ALC provides training in many areas, including clinical, compliance, information technology, employee development, health information management, human resources, workplace safety and security, as well as hands-on resuscitation skills training. We offer continuing education credits for many of these disciplines. We are committed to continue to offer a quality library of training courses, which, at present, consists of approximately 2,700 courses published companywide, with a significant number of additional courses published at local facility levels.
The quality of our training is assured through a robust annual course review process. Each course is reviewed by the author or subject matter expert for current accuracy of content, relevancy and utilization. Updates are made based on current standards as well as feedback from individuals who complete the courses. Under the direction of our senior leadership, some courses are assigned to learners based on their role in our organization. The vast majority of the library is available for self-enrollment by our employees at no additional cost to the learner.
22
We also provide a wide range of other development programs and resources, including a tuition reimbursement program; nursing partnerships with education institutions which offer educational pathways to those desiring to become professional nurses; an executive development program, which identifies and develops qualified personnel for leadership-level positions at our healthcare facilities; our Community Leadership Excellence and Development Series, or LEADS, which is a proprietary training program for directors, managers and supervisors at our hospitals; and residency training programs. Moreover, we have provided mental health support for our personnel struggling with the significant emotional impact of caring for patients during the pandemic.
Employee Safety
The safety of our employees is of the utmost importance and is key to the continuous delivery of high quality patient care. We strive to protect our employees through continued communication, data analysis, equipment evaluation and education. Leadership methods which employ a “safety-first” mindset are practiced in our hospitals including in safety huddles performed regularly by personnel at our hospitals. Each huddle consists of a three-part agenda: (1) a look back at any significant safety or quality issues in the past 24 hours, (2) a look ahead to any anticipated safety or quality issues in the next 24 hours, and (3) a follow-up on safety critical issues requiring a rapid response.
Environmental Matters
We are subject to a number of federal, state and local environmental laws, rules and regulations that govern, among other things, our disposal of medical waste, as well as our use, storage, transportation and disposal of hazardous and toxic materials. In addition, we could be affected by climate change to the extent that climate change results in severe weather conditions or other disruptions impacting the communities in which our facilities are located or adversely impacts general economic conditions, including in communities in which our facilities are located. At the current time, our compliance with environmental legal requirements, including legal requirements relating to climate change, does not have a material effect on our capital expenditures, financial results or operations. However, it is possible that developments may arise in the future as a result of climate change or other environmental developments that we are unable to currently predict.
We recognize the environment is an exhaustible resource and the importance of using the environment and its resources responsibly. We have established goals and taken actions with respect to various sustainability matters with a focus on the reduction of our carbon footprint, water and energy usage and material waste. For additional information about our ongoing environmental sustainability actions and practices, refer to our 2021 Environmental Sustainability Report, which is available in the Company Overview-Sustainability section of our website. Notwithstanding the foregoing, the information on our website, including our 2021 Environmental Sustainability Report, is not incorporated by reference into this Form 10-K.
Professional Liability Claims
As part of our business of owning and operating hospitals, we are subject to legal actions alleging liability on our part. To cover claims arising out of the operations of hospitals, we maintain professional malpractice liability insurance and general liability insurance on a claims made basis in excess of those amounts for which we are self-insured, in amounts we believe to be sufficient for our operations. We also maintain umbrella liability coverage for claims which, due to their nature or amount, are not covered by our other insurance policies. However, our insurance coverage does not cover all claims against us or may not continue to be available at a reasonable cost for us to maintain adequate levels of insurance. For a further discussion of our insurance coverage, see our discussion of professional liability claims in “Management’s Discussion and Analysis of Financial Condition and Results of Operations” in Part II, Item 7 of this Form 10-K.
23
Item 1A. Risk Factors
Our business faces a variety of risks. If any of the events or circumstances described in any of the following risk factors occurs, our business, results of operations or financial condition could be materially and adversely affected, and our actual results may differ materially from those predicted in any forward-looking statements we make in any public disclosures. The considerations and risks that follow are organized within relevant headings but may be relevant to other headings as well. Additional factors that could affect our business, results of operations and financial condition are discussed elsewhere in this Report (including in “Management’s Discussion and Analysis of Financial Condition and Results of Operations” in Part II, Item 7 of this Form 10-K). Moreover, risks or uncertainties not presently known to us, or that we currently deem immaterial, also may adversely affect our business, results of operations and financial condition.
Summary of Risk Factors
The following is a summary of the risk factors set forth below.
Risks Related to Our Indebtedness
|
|
• |
Our indebtedness could adversely affect our ability to meet obligations under existing indebtedness or raise additional capital. |
|
|
• |
We may be able to incur substantially more debt. |
|
|
• |
We may not be able to generate sufficient cash to service all of our indebtedness. |
|
|
• |
We have a substantial amount of indebtedness with certain series of our outstanding notes and other debt scheduled to mature in close proximity to each other. |
|
|
• |
Restrictive covenants in the agreements governing our indebtedness may adversely affect us. |
|
|
• |
Our variable rate indebtedness subjects us to interest rate risk. |
|
|
• |
If we are unable to make payments on our indebtedness, we could be in default under the terms of our indebtedness agreements. |
Risks Related to the COVID-19 Pandemic
|
|
• |
We expect the COVID-19 pandemic to continue to affect our financial performance. |
|
|
• |
We are unable to predict the ultimate impact of the CARES Act and other stimulus legislation. |
Risks Related to Our Business
|
|
• |
If we are unable to complete divestitures as advisable, our financial performance could be adversely affected. |
|
|
• |
The impact of acquisitions could have a negative effect on our operations. |
|
|
• |
If we are unable to effectively compete, patients could use other hospitals and healthcare providers. |
|
|
• |
We may be adversely affected by consolidation among health insurers and other industry participants. |
|
|
• |
The failure to obtain our medical supplies at favorable prices could cause our operating results to decline. |
|
|
• |
Our revenues may decline if reimbursement rates are reduced or if we do not maintain favorable contract terms with payors. |
|
|
• |
Growth in self-pay volume or deterioration in collectability could adversely affect our financial performance. |
|
|
• |
Some of the non-urban communities in which we operate face challenging economic conditions. |
|
|
• |
The demand for our services can be impacted by factors beyond our control. |
|
|
• |
A future pandemic, epidemic or outbreak of an infectious disease could adversely impact our business. |
|
|
• |
Our performance depends on our ability to recruit and retain quality physicians. |
|
|
• |
Our labor costs have been, and may continue to be, adversely affected by competitive labor market conditions and the shortage of experienced nurses. |
|
|
• |
The industry trend towards value-based purchasing may negatively impact our business. |
|
|
• |
Our revenues are somewhat concentrated in a small number of states. |
Risks Related to Legal Proceedings
|
|
• |
We are the subject of various legal, regulatory and governmental proceedings. |
|
|
• |
We could be subject to substantial uninsured liabilities or increased insurance costs as a result of significant legal actions. |
24
|
|
• |
In connection with the final auditing and reporting requirements to which we are subject under the CIA, we could become subject to further action by the OIG. |
Risks Related to Government Regulation
|
|
• |
We are unable to predict the ultimate impact of health reform initiatives, including the Affordable Care Act. |
|
|
• |
If we fail to comply with laws and regulations, we could suffer penalties or be required to make changes to our operations. |
|
|
• |
If there are delays in regulatory updates by governmental entities, we may experience volatility in our operating results. |
|
|
• |
Any failure to comply with legal requirements governing the privacy and security of health information could adversely affect us. |
|
|
• |
If our adoption and utilization of EHR systems fails to satisfy HHS standards, our financial results could be adversely affected. |
|
|
• |
State efforts to regulate the construction, acquisition or expansion of healthcare facilities could adversely impact us. |
|
|
• |
State efforts to regulate the sale of municipal or not-for-profit hospitals could prevent our acquisition of such hospitals. |
|
|
• |
We may incur additional tax liabilities. |
Risks Related to Impairment
|
|
• |
If the fair value of our reporting unit declines, a material non-cash charge to earnings from impairment of our goodwill could result. |
|
|
• |
A significant decline in operating results at one or more of our facilities could result in an impairment in the fair value of our long-lived assets. |
Risks Related to Cybersecurity and Technology
|
|
• |
Our operations could be significantly impacted by interruptions or restrictions in access to our information systems. |
|
|
• |
A cyber-attack or security breach could harm our business and patients and expose us to liability. |
|
|
• |
If we fail to comply with technology agreements, we may be required to pay damages and could lose license rights. |
For a more complete discussion of these risk factors, see below.
Risks Related to Our Indebtedness
Our level of indebtedness could adversely affect our ability to refinance existing indebtedness or raise additional capital to fund our operations, limit our ability to react to changes in the economy or our industry and prevent us from meeting our obligations under the agreements related to our indebtedness.
We have a significant amount of indebtedness, which is more fully described in the Liquidity and Capital Resources section of “Management’s Discussion and Analysis of Financial Condition and Results of Operations” in Part II, Item 7 of this Form 10-K and Note 6 of the Notes to Consolidated Financial Statements included under Part II, Item 8 of this Form 10-K. As of December 31, 2021, we had approximately $11.3 billion aggregate principal amount of secured indebtedness outstanding and approximately $796 million of unsecured indebtedness outstanding, and an additional approximately $897 million of borrowing capacity under the ABL Facility (after taking into account approximately $103 million of outstanding letters of credit).
Our substantial leverage could have important consequences, including the following:
|
|
• |
it may limit our ability to refinance existing indebtedness or obtain additional debt or equity financing for working capital, capital expenditures, debt service requirements, acquisitions and general corporate or other purposes; |
|
|
• |
a substantial portion of our cash flows from operations will be dedicated to the payment of principal and interest on our indebtedness and will not be available for other purposes, including to fund our operations, capital expenditures, financial obligations and future business opportunities; |
|
|
• |
some of our borrowings, including borrowings under the ABL Facility, accrue interest at variable rates, exposing us to the risk of increased interest rates; |
|
|
• |
it may limit our ability to make strategic acquisitions or cause us to make nonstrategic divestitures; |
|
|
• |
it may limit our ability to adjust to changing market conditions and place us at a competitive disadvantage compared to our competitors that are less highly leveraged; and |
25
|
|
• |
it may increase our vulnerability in connection with adverse changes in general economic, industry or competitive conditions, or government regulations or other adverse developments. |
Despite current indebtedness levels, we may still be able to incur substantially more debt. This could further exacerbate the risks described in this section.
We and our subsidiaries have the ability to incur substantial additional indebtedness in the future, subject to restrictions contained in the ABL Facility and the indentures governing our outstanding notes. The ABL Facility provides for commitments and borrowings of up to approximately $1.0 billion in the aggregate, none of which was drawn on December 31, 2021 The aggregate amount we may draw under the ABL Facility may not exceed the “borrowing base” (as calculated thereunder) less outstanding letters of credit thereunder, which fluctuates from time to time. As of December 31, 2021, we had an additional approximately $897 million (after taking into account approximately $103 million of outstanding letters of credit) available for borrowing under the ABL Facility. Aside from the ABL Facility, our ability to incur other additional secured debt (other than secured debt used to refinance existing secured debt) is highly limited by certain of the indentures governing our outstanding notes. If additional indebtedness is added to our current debt levels, the related risks that we currently face related to indebtedness as noted in this section could increase.
We may not be able to generate sufficient cash to service all of our indebtedness, and we may be forced to take other actions to satisfy our obligations under our indebtedness, which may not be successful.
Our ability to make scheduled payments on or to refinance our indebtedness depends on our financial and operating performance, which is subject to prevailing economic and competitive conditions and to financial, business, regulatory and other factors beyond our control. We cannot assure you that we will maintain a level of cash flows from operating activities sufficient to permit us to pay the principal, premium, if any, and interest on our indebtedness.
In addition, the borrower under the ABL Facility and issuer of our outstanding notes is a holding company with no direct operations. Its principal assets are the equity interests we hold in our operating subsidiaries. As a result, we are dependent upon dividends and other payments from our subsidiaries to generate the funds necessary to meet our outstanding debt service and other obligations. Our subsidiaries may not generate sufficient cash from operations to enable us to make principal and interest payments on our indebtedness. In addition, any payments of dividends, distributions, loans or advances to us by our subsidiaries could be subject to legal and contractual restrictions.
Our subsidiaries are permitted under the terms of our indebtedness to incur additional indebtedness that may restrict payments from those subsidiaries to us. The agreements governing the current and future indebtedness of our subsidiaries may not permit those subsidiaries to provide us with sufficient cash to fund payments on our indebtedness when due. Our non-guarantor subsidiaries are separate and distinct legal entities, and they have no obligation, contingent or otherwise, to pay amounts due under the terms of our indebtedness or to make any funds available to pay those amounts, whether by dividend, distribution, loan or other payment. If our cash flows and capital resources are insufficient to fund our debt service obligations, we could face substantial liquidity problems and may be forced to reduce or delay capital expenditures, sell assets or operations, seek additional capital or restructure or refinance our indebtedness. Our ability to refinance our indebtedness on favorable terms, or at all, is directly affected by the then current general economic and financial conditions. In addition, our ability to incur additional secured indebtedness (which would generally enable us to achieve better pricing than the incurrence of unsecured indebtedness) depends in part on the value of our assets, which depends, in turn, on the strength of our cash flows and results of operations, and on economic and market conditions and other factors. We may find it necessary or prudent to refinance certain of our outstanding indebtedness, the terms of which may not be favorable to us.
We cannot assure you that we would be able to take any of these actions, that these actions would be successful and permit us to meet our scheduled debt service obligations or that these actions would be permitted under the terms of our existing or future debt agreements, including the ABL Facility and the indentures governing our outstanding notes. For example, the ABL Facility and the indentures governing our outstanding notes restrict our ability to dispose of certain assets and use the proceeds from any dispositions. We may not be able to consummate those dispositions and any proceeds we receive may not be adequate to meet any debt service obligations then due.
We have a substantial amount of indebtedness under certain series of our outstanding notes and other debt scheduled to mature in close proximity to each other.
As further described in the Liquidity and Capital Resources section of “Management’s Discussion and Analysis of Financial Condition and Results of Operations” in Part II, Item 7 of this Form 10-K and Note 6 of the Notes to Consolidated Financial Statements included under Part II, Item 8 of this Form 10-K, we have a substantial amount of indebtedness under certain series of our outstanding notes and other debt scheduled to mature in close proximity to each other. As a result, we may not have sufficient cash to repay all amounts owing under such indebtedness and there can be no assurance that we will have the ability to borrow or otherwise
26
raise the amounts necessary to repay all such amounts. Our ability to refinance our indebtedness on favorable terms, or at all, is dependent on (among other things) conditions in the credit and capital markets which are beyond our control.
Restrictive covenants in the agreements governing our indebtedness may adversely affect us.
The ABL Facility and the indentures governing our outstanding notes contain various covenants that limit our ability to take certain actions, including our ability to:
|
|
• |
incur, assume or guarantee additional indebtedness; |
|
|
• |
issue redeemable stock and preferred stock; |
|
|
• |
repurchase capital stock; |
|
|
• |
make restricted payments, including paying dividends and making certain loans, acquisitions and investments; |
|
|
• |
redeem subordinated debt; |
|
|
• |
create liens; |
|
|
• |
sell or otherwise dispose of assets, including capital stock of subsidiaries; |
|
|
• |
impair security interests; |
|
|
• |
enter into agreements that restrict dividends and certain other payments from subsidiaries; |
|
|
• |
merge, consolidate, sell or otherwise dispose of substantially all our assets; |
|
|
• |
enter into transactions with affiliates; and |
|
|
• |
guarantee certain obligations. |
In addition, the ABL Facility contains restrictive covenants and may, in certain circumstances, require us to maintain a specified financial ratio and satisfy other financial condition tests. Our ability to meet these restrictive covenants and financial ratio and tests (if applicable) may be affected by events beyond our control, and we cannot assure you that we will meet those tests.
In addition, our ability to incur additional secured debt (other than (i) secured debt to refinance existing secured debt and (ii) indebtedness incurred under our ABL Facility) is highly limited.
A breach of any of these covenants could result in a default under the ABL Facility and the indentures governing our outstanding notes. Upon the occurrence of an event of default under the ABL Facility or any of the indentures governing our outstanding notes, all amounts outstanding under the applicable indebtedness may become immediately due and payable and all commitments under the ABL Facility to extend further credit may be terminated. If we were unable to repay those amounts, the holders of such indebtedness could, subject to applicable intercreditor agreements, proceed against the collateral granted to them to secure that indebtedness.
Our variable rate indebtedness subjects us to interest rate risk, which could cause our debt service obligations to increase significantly.
Our borrowings under the ABL Facility are at variable rates of interest and expose us to interest rate risk. If interest rates increase, our debt service obligations on the variable rate indebtedness would increase even though the amount borrowed remained the same, and our net income would decrease. As of December 31, 2021, there were no borrowings under the ABL Facility.
If we default on our obligations to pay our indebtedness, or if we otherwise fail to comply with the various covenants in the instruments governing our indebtedness, we could be in default under the terms of the agreements governing our indebtedness.
If we are unable to generate sufficient cash flow and are otherwise unable to obtain funds necessary to meet required payments of principal, premium, if any, and interest on our indebtedness, or if we otherwise fail to comply with the various covenants, including financial and operating covenants, in the instruments governing our indebtedness, including covenants in the ABL Facility and the indentures governing our outstanding notes, we could be in default under the terms of the agreements governing such indebtedness. In the event of any default, the holders of such indebtedness could elect to declare all the funds borrowed to be immediately due and payable, together with accrued and unpaid interest; the lenders under the ABL Facility could elect to terminate their commitments thereunder, cease making further loans and direct the applicable collateral agents to institute foreclosure proceedings against our assets; and we could be forced into bankruptcy or liquidation. If our operating performance declines, we may in the future need to obtain waivers from the required lenders under the ABL Facility to avoid being in default. If we breach our covenants under the ABL Facility and seek a waiver, we may not be able to obtain a waiver from the required lenders. If this occurs, we would be in default under the ABL Facility, the lenders could exercise their rights, as described above, and we could be forced into bankruptcy or liquidation.
27
Risks Related to the COVID-19 Pandemic
We expect the COVID-19 pandemic to continue to affect our financial performance, and such pandemic could have material adverse effects on our results of operations, financial condition, and/or our cash flows if it causes public health and/or economic conditions in the United States to deteriorate.
As a provider of healthcare services, we have been and continue to be significantly affected by the public health and economic effects of the COVID-19 pandemic, which HHS first declared to be a public health emergency in January 2020. Although vaccines and booster shots for the COVID-19 virus have become widely available in the United States, COVID-19 has continued to result in a significant number of hospitalizations, and the future course of the pandemic remains uncertain.
We have been working with federal, state and local health authorities to respond to COVID-19 cases in the communities we serve, and our hospitals, medical clinics, medical personnel and employees have been actively caring for COVID-19 patients. Although we have implemented considerable safety measures, treatment of COVID-19 has associated risks, which may include the manner in which patients, physicians, nurses and other medical personnel perceive and respond to such risks. These risks may include reduced operating capacity, impaired employee morale, labor unrest and/or other workforce disruptions. Moreover, during the pandemic, we believe that some individuals have elected to postpone medical care for an undetermined period of time in a manner that has adversely impacted our patient volumes in comparison to pre-pandemic levels.
Although our hospitals have not generally experienced major capacity constraints to date arising from the treatment of COVID-19 patients, there are hospitals in the United States that have been overwhelmed in caring for COVID-19 patients, which has prevented such hospitals from treating all patients who seek care. In certain locations, government authorities and healthcare providers have re-imposed restrictions on elective medical procedures, have activated crisis standards of care, have deployed military medical personnel, and have taken other measures affecting treatment capacity and care in response to COVID-19 developments. These measures could affect one or more of our hospitals or outpatient or other facilities. Moreover, due to the concentration of our hospitals in certain states, we are particularly sensitive to the increase in COVID-19 cases in those states, where the pandemic could have a disproportionate effect on our business.
We have incurred, and may continue to incur, certain increased expenses arising from the COVID-19 pandemic, including additional labor, supply chain, capital and other expenditures. Moreover, in recent months, the U.S. economy has experienced general inflationary pressures and significant disruptions to global supply networks. In this regard, we have experienced disruptions in connection with the provision of equipment, pharmaceuticals and medical supplies, including protective personal equipment, to us, as well as inflationary pressures in connection with labor, supply chain, capital and other expenditures. While we have implemented cost containment and other measures to try to counteract these developments, we may be unable to fully offset these increases in our costs and otherwise effectively respond to supply disruptions. To the extent we continue to experience increased expenses and supply chain disruptions, our operations may be adversely impacted.
CMS issued an interim final rule in November 2021 that will require COVID-19 vaccinations for workers in most Medicare and Medicaid certified providers and suppliers, including our hospitals. The rule applies to all staff, including clinical staff, individuals providing services under arrangements, volunteers, and staff who are not involved in direct patient care, subject to approved religious and medical exemptions. On January 13, 2022, the U.S. Supreme Court granted the U.S. government’s request for a stay of lower court injunctions of the CMS regulation, finding that the CMS rule fell within the authority granted to the HHS Secretary by Congress with respect to imposing conditions on the receipt of Medicaid and Medicare funds. Additionally, some states have implemented, or may implement in the future, vaccine mandates with respect to healthcare personnel. Moreover, it is possible that the Occupational Safety and Health Administration will in the future adopt permanent safety standards requiring vaccines in certain employment-related settings after withdrawing an emergency temporary standard effective January 26, 2022 (following an earlier adverse ruling by the U.S. Supreme Court) that would have required all employers with 100 or more employees to require their workforce to be fully vaccinated (or provide negative COVID-19 test results on a weekly basis). It is currently not possible to predict the impact that these vaccine mandates may have on us. However, these vaccine mandates could result in employee attrition and the loss of personnel who are unvaccinated, which could adversely affect our business and results of operations.
Economic conditions and other factors resulting from the COVID-19 pandemic have affected, and may continue to affect, our service mix, revenue mix, payor mix and/or patient volumes, as well as our ability to collect outstanding receivables. These factors may continue to adversely affect demand for our services, as well as the ability of patients and other payors to pay for services rendered. We have observed deterioration in the collectability of patient accounts receivable from uninsured patients compared to pre-pandemic levels which, if sustained, may adversely affect our financial results and require an increased level of working capital. In addition, our financial performance may continue to be affected by federal or state laws, regulations, orders, or other governmental or regulatory actions addressing the current COVID-19 pandemic or otherwise affecting the U.S. healthcare system in connection with the pandemic. We may also be subject to lawsuits from patients, employees and others exposed to COVID-19 at our facilities. Such
28
actions may involve large demands, as well as substantial defense costs. Our professional and general liability insurance may not cover all claims against us.
While we are not able to fully quantify the impact that the COVID-19 pandemic will have on our future financial results, we expect developments related to COVID-19 to continue to affect our financial performance. Moreover, the COVID-19 pandemic may have material adverse effects on our results of operations, financial position, and/or our cash flows if economic and/or public health conditions in the United States deteriorate as a result of the pandemic. The ongoing impact of the pandemic on our financial results will depend on, among other factors, the duration and severity of the pandemic, the impact of the pandemic on economic conditions, the volume of canceled or rescheduled procedures at our facilities, the volume of COVID-19 patients cared for across our health systems, the timing, availability, and acceptance of effective medical treatments, the availability, acceptance of and need for vaccines (including additional dosages of vaccines), the spread of potentially more contagious and/or virulent forms of the virus, including any variants of the virus for which currently available vaccines, treatments, and tests may not be effective or authorized, the availability of and processing times for tests, and the impact of government actions on the hospital industry and broader economy, including through existing and any future stimulus efforts as well as vaccine and testing requirements. COVID-19 developments continue to evolve quickly, and additional developments may occur which we are unable to predict. Furthermore, the COVID-19 pandemic has resulted in, and may continue to result in, significant disruption of global financial markets, which could reduce our ability to access capital and negatively affect our liquidity in the future.
We are unable to predict the ultimate impact of the CARES Act and other stimulus legislation or the effect that such legislation and other governmental responses intended to assist providers in responding to COVID-19 may have on our business.
In response to the COVID-19 pandemic, federal and state governments have passed legislation, promulgated regulations and taken other administrative actions intended to assist healthcare providers in providing care to COVID-19 and other patients during the public health emergency and to provide financial relief. Together, the Coronavirus Aid, Relief and Economic Security Act, or the CARES Act, the Paycheck Protection Program and Health Care Enhancement Act, or the PPPHCE Act, the CAA, and the American Rescue Plan Act of 2021, or the ARPA, authorize over $186 billion in funding to be distributed to eligible healthcare providers. These funds are intended to reimburse eligible providers, including public entities and Medicare- and/or Medicaid-enrolled providers and suppliers, for lost revenues and healthcare related expenses attributable to COVID-19. Recipients are not required to repay these funds, provided that they attest to and comply with certain terms and conditions, including limitations on balance billing, not using funds received from the PHSSEF to reimburse expenses or losses that other sources are obligated to reimburse and audit and reporting requirements.
The CARES Act also makes other forms of financial assistance available to healthcare providers, including through Medicare and Medicaid payments adjustments, including a 20% add-on payment for hospital inpatient care provided to patients with COVID-19 and delays of Medicaid DSH reductions. It also expanded the Medicare Accelerated and Advance Payment Program, which makes available accelerated payments of Medicare funds in order to increase cash flow to providers. CMS is no longer accepting applications from hospitals and other Medicare Part A providers for accelerated payments, and it has suspended the advance payment program for physicians and other Medicare Part B healthcare providers. Providers are required to repay accelerated payments beginning one year after the payment was issued. After such one-year period, Medicare payments owed to providers will be recouped according to the repayment terms. We received accelerated payments under this program in April 2020, and by the end of 2021, all payments received by us had been recouped or repaid to CMS or assumed by buyers in connection with hospitals we have divested.
The CARES Act and related legislation suspended the Medicare sequestration payment adjustment from May 1, 2020 through March 31, 2022, which would have otherwise reduced payments to Medicare providers by 2% as required by the Budget Control Act of 2011, but extended sequestration through 2030. Congress reduced the sequestration adjustment to 1% from April 1 through June 30, 2022, and the adjustment will return to 2% on July 1, 2022. For the first six months of fiscal year 2030, the adjustment will increase to 2.25%, and for the last six months of fiscal year 2030, the adjustment will increase to 3%. The ARPA, in addition to providing funding for healthcare providers, increases the federal budget deficit in a manner that triggers an additional statutorily mandated sequestration under the Pay-As-You-Go Act of 2010, or the PAYGO Act. As a result, an additional payment reduction of up to 4% was required to take effect in January 2022. However, Congress has delayed implementation of this payment reduction until 2023.
Beyond financial assistance, federal and state governments have enacted legislation and established regulations intended to increase access to medical supplies and equipment and ease legal and regulatory burdens on healthcare providers. These efforts have included, for example, expanding access to and payment for telehealth services and prioritizing review of drug applications to help with shortages of emergency drugs.
There is still a high degree of uncertainty surrounding the implementation of the CARES Act and subsequent legislation passed in response to the COVID-19 pandemic. For example, PHSSEF payments to us are recognized as a reduction to operating costs and expenses only to the extent that we are reasonably assured that the underlying terms and conditions of such payments are met. HHS’ interpretation of such underlying terms and conditions, including auditing and reporting requirements, continues to evolve. In June 2021, HHS issued guidance that set forth deadlines for using and reporting on the use of PHSSEF funds, depending on the dates on
29
which the funds were received. Additional guidance or new or amended interpretations of existing guidance on such underlying terms and conditions may result in our inability to recognize additional PHSSEF payments or may result in the derecognition of amounts previously recognized, which (in any such case) may be material. To the extent that any unrecognized PHSSEF payments that have been or may be received by us do not qualify for reimbursement based on our future operations, we may be required to return such unrecognized payments to HHS following the end of the COVID-19 pandemic or other future time as may be determined by HHS guidance. Further, we may be subject to or incur costs from related government actions including payment recoupment, audits and inquiries by governmental authorities, and criminal, civil or administrative penalties.
Some of the federal and state legislative and regulatory measures allowing for flexibility in delivery of care and various financial supports for healthcare providers are available only for the duration of the COVID-19 public health emergency. Many states have ended their state-level emergency declarations, and it is unclear whether or for how long the HHS declaration will be extended. The current HHS declaration expires April 16, 2022. The HHS Secretary may choose to renew the declaration for successive 90-day periods for as long as the emergency continues to exist and may terminate the declaration whenever the Secretary determines that the public health emergency no longer exists. Additionally, the federal government may consider additional stimulus and relief efforts, but we are unable to predict whether any additional measures will be enacted or their impact. We are unable to assess the extent to which anticipated ongoing impacts on us arising from the COVID-19 pandemic will be offset by benefits which we may recognize or receive in the future under the CARES Act and other stimulus legislation or any future stimulus measures. Further, there can be no assurance that the terms of provider relief funding or other programs will not change in ways that affect our funding or eligibility to participate. We continue to assess the potential impact of the COVID-19 pandemic and government responses to the pandemic on our business, results of operations, financial position and cash flows.
Risks Related to Our Business
If we are unable to complete divestitures as we may deem advisable, our results of operations and financial condition could be adversely affected.
We previously implemented a portfolio rationalization and deleveraging strategy by divesting hospitals and non-hospital businesses. This program concluded at the end of 2020. Since the conclusion of this program, we have continued to receive interest from potential acquirers for certain of our hospitals, and may, from time to time, consider selling additional hospitals, or our unconsolidated equity interests in certain businesses, if we consider any such disposition to be in our best interests. However, there is no assurance that potential divestitures will be completed or, if they are completed, the aggregate amount of proceeds we will receive, that potential divestitures will be completed within our targeted timeframe, or that potential divestitures will be completed on terms favorable to us. Additionally, the results of operations for these hospitals and non-hospital businesses that we may divest and the potential gains or losses on the sales of those businesses may adversely affect our results of operations. Moreover, we may incur asset impairment charges related to potential or completed divestitures that reduce our profitability. In addition, after entering into a definitive agreement, we may be subject to the satisfaction of pre-closing conditions as well as necessary regulatory and governmental approvals, which, if not satisfied or obtained, may prevent us from completing the sale. Divestitures may also involve continued financial exposure related to the divested business, such as through indemnities or retained obligations, that present risk to us.
Any future divestiture activities may present financial, managerial, and operational risks. Those risks include diversion of management attention from improving existing operations; additional restructuring charges and the related impact from separating personnel, renegotiating contracts, and restructuring financial and other systems; adverse effects on existing business relationships with patients and third-party payors; and the potential that the collectability of any patient accounts receivable retained from any divested hospital may be adversely impacted. Any of these factors could adversely affect our financial condition and results of operations.
The impact of past acquisitions, as well as potential future acquisitions, could have a negative effect on our operations.
Our business strategy has historically included growth by acquisitions, and we may complete additional acquisitions in the future. However, not-for-profit hospital systems and other for-profit hospital companies generally attempt to acquire the same type of hospitals as we may desire to acquire. Some of the competitors for our acquisitions have greater financial resources than we have. Furthermore, some hospitals are sold through an auction process, which may result in higher purchase prices than we believe are reasonable. Therefore, we may not be able to acquire additional hospitals on terms favorable to us.
In addition, many of the hospitals we have previously acquired have had lower operating margins than we do and operating losses incurred prior to the time we acquired them. Hospitals acquired in the future may have similar financial performance issues. In the past, we have experienced delays in improving the operating margins or effectively integrating the operations of certain acquired hospitals. In the future, if we are unable to improve the operating margins of acquired hospitals, operate them profitably, or effectively integrate their operations, our results of operations and business may be adversely affected.
30
Moreover, hospitals that we have acquired, or in the future could acquire, may have unknown or contingent liabilities, including liabilities associated with ongoing legal proceedings or for failure to comply with healthcare laws and regulations. Although we generally seek indemnification from sellers covering these matters, we may nevertheless have material liabilities for past activities of acquired hospitals.
If we are unable to effectively compete, patients could use other hospitals and healthcare providers, and our business may otherwise be adversely impacted.
The healthcare industry is highly competitive among hospitals and other healthcare providers, such as urgent care centers and other outpatient providers and other industry participants, for patients, affiliations with physicians and acquisitions. Changes in licensure or other regulations, recognition of new provider types or payment models, and industry consolidation could negatively impact our competitive position. For example, in states with certificate of need or similar prior approval requirements, removal of these requirements could remove barriers to entry and increase competition in our service areas. Our hospitals, our competitors, and other healthcare industry participants are increasingly implementing physician alignment strategies, such as acquiring physician practice groups, employing physicians and participating in ACOs or other clinical integration models. Increasing consolidation within the payor industry, vertical integration efforts involving payors and healthcare providers, and cost-reduction strategies by payors, large employer groups and their affiliates may impact our ability to contract with payors on favorable terms, participate in favorable payment tiers or provider networks, and otherwise affect our competitive position.
The majority of our hospitals are located in generally larger non-urban service areas in which we believe we are the primary, if not the sole, provider of general acute care health services. As a result, the most significant competition for providers of general acute care services are hospitals outside of our primary service areas, typically hospitals in larger urban areas that provide more complex services. Patients in our primary service areas may travel to other hospitals because of physician referrals, payor networks that exclude our providers or the need for services we do not offer, among other reasons. Patients who receive services from these other hospitals may subsequently shift their preferences to those hospitals for the services we provide.
Our other hospitals, in selected urban service areas, may face competition from hospitals that are more established than our hospitals. Some of our competitors offer services, including extensive medical research and medical education programs, that are not offered by our facilities. In addition, in certain markets where we operate, there are large teaching hospitals that provide highly specialized facilities, equipment and services that may not be available at our hospitals. We also face competition from other specialized care providers, including outpatient surgery, orthopedic, oncology and diagnostic centers. Some competitors are implementing physician alignment strategies, such as employing physicians, acquiring physician practice groups, and participating in ACOs, or other clinical integration models. Cost-reduction strategies by large employer groups and their affiliates may increase this competition.
At December 31, 2021, 30 of our hospitals competed with more than one other non-affiliated hospital in their respective primary service areas. In most markets in which we are not the sole provider of general acute care health services, our primary competitor is a municipal or not-for-profit hospital. These hospitals are owned by tax-supported governmental agencies or not-for-profit entities supported by endowments and charitable contributions. These hospitals are exempt from sales, property and income taxes. Such exemptions and support are not available to our hospitals and may provide the tax-supported or not-for-profit entities an advantage in funding general and capital expenditures and offering services more specialized than those available at our hospitals. If our competitors are better able to attract patients with these offerings, we may experience an overall decline in patient volume.
Trends toward transparency and value-based purchasing may have an impact on our competitive position and patient volumes in ways that we are unable to predict. The CMS Care Compare website makes available to the public certain data that hospitals submit in connection with Medicare reimbursement claims, including performance data related to quality measures and patient satisfaction surveys. Further, every hospital must establish and update annually a public, online listing of the hospital’s standard charges for all items and services, including discounted cash prices and payor-specific charges, and must also publish a consumer-friendly list of standard charges for certain “shoppable” services or, alternatively, maintain an online price estimator tool for the shoppable services. If any of our hospitals achieve poor results (or results that are lower than our competitors) on the quality measures or on patient satisfaction surveys, or if our standard charges are higher than our competitors, we may attract fewer patients. The No Surprises Act, which took effect January 1, 2022, creates additional price transparency requirements, including requiring providers to send health plans of insured patients and uninsured patients a good faith estimate of the expected charges and diagnostic codes prior to the scheduled date of the service or item. HHS is deferring enforcement of certain requirements of the No Surprises Act applicable to providing estimates to insured individuals. It is unclear how price transparency requirements and similar initiatives will affect consumer behavior, our relationships with payors, or our ability to set and negotiate prices.
We expect these competitive trends to continue. If we are unable to compete effectively with other hospitals and other healthcare providers, patients may seek healthcare services at providers other than our hospitals and affiliated businesses.
31
We may be adversely affected by consolidation among health insurers and other industry participants.
In recent years, a number of health insurers have merged or increased efforts to consolidate with other non-governmental payors. Insurers are also increasingly pursuing alignment initiatives with healthcare providers. Consolidation within the health insurance industry may result in insurers having increased negotiating leverage and competitive advantages, such as greater access to performance and pricing data. Our ability to negotiate prices and favorable terms with health insurers in certain markets could be affected negatively as a result of this consolidation. Also, the shift toward value-based payment models could be accelerated if larger insurers, including those engaging in consolidation activities, find these models to be financially beneficial. We cannot predict whether we will be able to negotiate favorable terms with payors and otherwise respond effectively to the impact of increased consolidation in the payor industry or vertical integration efforts.
The failure to obtain our medical supplies at favorable prices could cause our operating results to decline.
We have a participation agreement with HealthTrust, a GPO. The current term of this agreement extends through December 2022, with automatic renewal terms of one year unless either party terminates by giving notice of non-renewal. GPOs attempt to obtain favorable pricing on medical supplies with manufacturers and vendors, sometimes by negotiating exclusive supply arrangements in exchange for discounts. To the extent these exclusive supply arrangements are challenged or deemed unenforceable, we could incur higher costs for our medical supplies obtained through HealthTrust. Further, costs of supplies and drugs may continue to increase due to market pressure from pharmaceutical companies and new product releases. The COVID-19 pandemic continues to cause increased demand for personal protective equipment and other medical supplies, which has resulted in, and may continue to result in, higher costs and supply shortages. Also, there can be no assurance that our arrangement with HealthTrust will provide the discounts we expect to achieve.
If reimbursement rates paid by federal or state healthcare programs or commercial payors are reduced, if we are unable to maintain favorable contract terms with payors or comply with our payor contract obligations, if insured individuals move to insurance plans with greater coverage exclusions or narrower networks, or if insurance coverage is otherwise restricted or reduced, our net operating revenues may decline.
During the year ended December 31, 2021, 34.9% of our net operating revenues came from the Medicare and Medicaid programs. However, as federal healthcare expenditures continue to increase and state governments continue to face budgetary shortfalls, federal and state governments have made, and continue to make, significant changes in the Medicare and Medicaid programs, including reductions in reimbursement levels. In addition, CMS may implement changes through new or modified demonstration projects authorized pursuant to Medicaid waivers. Some of these changes have decreased, or could decrease, the amount of money we receive for our services relating to these programs.
In addition, government and commercial payors as well as other third parties from whom we receive payment for our services attempt to control healthcare costs by, for example, requiring hospitals to discount payments for their services in exchange for exclusive or preferred participation in their benefit plans, restricting coverage through utilization review, reducing coverage of inpatient and emergency room services and shifting care to outpatient settings, requiring prior authorizations, and implementing alternative payment models. The ability of commercial payors to control healthcare costs using these measures may be enhanced by the increasing consolidation of insurance and managed care companies and vertical integration of health insurers with healthcare providers. Limitations on balance billing may also reduce the amount that hospitals and other providers are able to collect for out-of-network services. For example, the No Surprises Act, which took effect January 1, 2022, prohibits providers from charging patients an amount beyond the in-network cost sharing amount for services rendered by out-of-network providers, subject to limited exceptions. For services for which balance billing is prohibited, the No Surprises Act establishes an independent dispute resolution, or IDR, process for providers and payors to handle payment disputes that cannot be resolved through direct negotiation. On October 7, 2021, HHS, together with other government agencies, issued an interim final rule to implement the IDR provisions of the No Surprises Act. The interim final rule provides that, when making a payment determination, the IDR entity must begin with the presumption that the payor’s median contracted rate for the same or similar service in an area (the qualifying payment amount, or QPA) is the appropriate out-of-network rate for the service at issue. The IDR entity must select the offer closest to the QPA unless the provider or payor submits credible evidence that clearly demonstrates the QPA is materially different from the appropriate out-of-network rate. However, the additional factors that may be considered by the IDR entity are secondary to the QPA. The interim final rule is currently subject to several legal challenges, and it is difficult to predict the outcome of efforts to challenge or modify the rule.
In addition, price transparency initiatives may impact our ability to obtain or maintain favorable contract terms. For example, hospitals are required by federal regulation to publish online payor-specific negotiated charges and de-identified minimum and maximum charges. Further, the No Surprises Act requires providers to send an insured patient’s health plan a good faith estimate of expected charges, including billing and diagnostic codes, prior to when the patient is scheduled to receive the item or service. HHS is deferring enforcement of this requirement until it issues additional regulations.
32
During the year ended December 31, 2021, 64.2% of our net operating revenues came from commercial payors. Our contracts with payors require us to comply with a number of terms related to the provision of services and billing for services. If we are unable to negotiate increased reimbursement rates, maintain existing rates or other favorable contract terms, effectively respond to payor cost controls and reimbursement policies or comply with the terms of our payor contracts, the payments we receive for our services may be reduced. Also, we are increasingly involved in disputes with payors and experience payment denials, both prospectively and retroactively. In addition, enrollment of individuals in high-deductible health plans, sometimes referred to as consumer-directed plans, has increased over the last decade. In comparison to traditional health plans, these plans tend to have lower reimbursement rates for providers along with higher co-pays and deductibles due from the patient, which subjects us to increased collection cost and risk. Further, high-deductible health plans may exclude our hospitals and employed physicians from coverage.
If we experience continued growth in self-pay volume and revenues or if we experience continued deterioration in the collectability of patient responsibility accounts, our financial condition or results of operations could be adversely affected.
Our primary collection risks relate to uninsured patients and outstanding patient balances for which the primary insurance payor has paid some but not all of the outstanding balance, with the remaining outstanding balance (generally deductibles and co-payments) owed by the patient. Collections are impacted by the economic ability of patients to pay and the effectiveness of our collection efforts. Significant changes in payor mix, business office operations, economic conditions or trends in federal and state governmental healthcare coverage may affect our collection of accounts receivable and are considered in our estimates of accounts receivable collectability. Moreover, we have observed deterioration in the collectability of patient accounts receivable for uninsured patients in comparison to pre-pandemic levels as the result of adverse economic conditions arising from the COVID-19 pandemic, which deterioration, if sustained, may continue to adversely affect our financial results and require an increased level of working capital.
In recent years, federal and state legislatures have considered or passed various proposals impacting or potentially impacting the size of the uninsured population. The number and identity of states that choose to expand or otherwise modify Medicaid programs and the terms of expansion and other program modifications continue to evolve. The ARPA provides additional financial incentives to expand Medicaid for states that have not already done so, temporarily increases the value of premium tax credit subsidies for subsidy-eligible individuals purchasing health insurance coverage through the federal and state-run marketplaces and expands eligibility for the tax credit subsidies to more individuals. Although the federal financial penalty associated with the Affordable Care Act’s mandate that individuals enroll in an insurance plan has been effectively eliminated, some states have imposed individual health insurance mandates with financial penalties for noncompliance. Other states have explored or offer public health insurance options. These variables, among others, make it difficult to predict the number of uninsured individuals and what percentage of our total revenue will be comprised of self-pay revenues.
We may be adversely affected by the growth in patient responsibility accounts as a result of the adoption of plan structures, including health savings accounts, narrow networks and tiered networks, that shift greater responsibility for care to individuals through greater exclusions and copayment and deductible amounts. Further, our ability to collect patient responsibility accounts may be limited by statutory, regulatory and investigatory initiatives, including private lawsuits directed at hospital charges and collection practices for uninsured and underinsured patients and regulatory restrictions on charges for out-of-network services. For example, the No Surprises Act, which took effect January 1, 2022, requires providers to send uninsured and self-pay patients a good faith estimate of expected charges for items and services. The estimate must cover items and services that are reasonably expected to be provided together with the primary item or services, including those that may be provided by other providers. If the patient receives a bill that is substantially greater than the expected charges in the good faith estimate, they may initiate a dispute resolution process established by HHS. In addition, a deterioration of economic conditions in the United States could potentially lead to higher levels of uninsured patients, result in higher levels of patients covered by lower paying government programs, result in fiscal uncertainties at both government payors and private insurers and/or limit the economic ability of patients to make payments for which they are responsible. If we experience growth in self-pay volume or continued deterioration in collectability of patient responsibility accounts, our financial condition or results of operations could be adversely affected.
33
Some of the non-urban communities in which we operate face challenging economic conditions, and the failure of certain employers, or the closure of certain manufacturing and other facilities in our markets, could have a disproportionate impact on our hospitals.
Some of the non-urban communities in which we operate have been facing challenging economic conditions which predate, and extend beyond the macroeconomic challenges arising from, the COVID-19 pandemic. In addition, the economies in the non-urban communities in which our hospitals primarily operate are often dependent on a small number of large employers, especially manufacturing or similar facilities. These employers often provide income and health insurance for a disproportionately large number of community residents who may depend on our hospitals for care. The failure of one or more large employers, or the closure or substantial reduction in the number of individuals employed at manufacturing or other facilities located in or near many of the non-urban communities in which our hospitals primarily operate, could cause affected employees to move elsewhere for employment or lose insurance coverage that was otherwise available to them. When patients are experiencing personal financial difficulties or have concerns about general economic conditions, they may delay or forgo elective procedures, choose to seek care in emergency rooms and purchase high-deductible insurance plans or no insurance at all, which increases a hospital’s dependence on self-pay revenue and may adversely affect our results of operations.
The demand for services provided by our hospitals and affiliated providers can be impacted by factors beyond our control.
Our admissions and adjusted admissions as well as acuity trends may be impacted by factors beyond our control. For example, seasonal fluctuations in the severity of influenza and other critical illnesses, such as COVID-19, unplanned shutdowns or unavailability of our facilities due to weather or other unforeseen events, decreases in trends in high acuity service offerings, changes in competition from other service providers, turnover in physicians affiliated with our hospitals, or changes in medical technology can have an impact on the demand for services at our hospitals and affiliated providers.
In addition, certain of our facilities are located in hurricane-prone coastal regions in Florida and other states, and our operations may be adversely impacted by hurricanes, tornadoes, winter storms, and other severe weather conditions, which adverse weather conditions may be more frequent and/or severe as the result of climate change. Moreover, we could be affected by climate change and other environmental issues to the extent such issues adversely affect the general economy, adversely impact our supply chain or increase the costs of supplies needed for our operations, or otherwise result in disruptions impacting the communities in which our facilities are located. The impact of these or other factors beyond our control could have an adverse effect on our business, financial position and results of operations.
A future pandemic, epidemic or outbreak of an infectious disease in the markets in which we operate or that otherwise impacts our facilities could adversely impact our business.
If a future pandemic, epidemic, or outbreak of an infectious disease or other public health crisis were to affect our markets, our business could be adversely affected. Any such crisis could diminish the public trust in healthcare facilities, especially hospitals that fail to accurately or timely diagnose, or that are treating (or have treated) patients affected by contagious diseases. If any of our facilities were involved in treating patients for such a contagious disease, other patients might cancel elective procedures or fail to seek needed care at our facilities. Patient volumes may decline or volumes of uninsured and underinsured patients may increase, depending on the economic circumstances surrounding the pandemic, epidemic, or outbreak. Further, any such pandemic might adversely impact our business by causing a temporary shutdown or diversion of patients, by disrupting or delaying production and delivery of materials and products in the supply chain or by causing staffing shortages in our facilities. Although we have disaster plans in place and operate pursuant to infectious disease protocols, the potential impact, as well as the public’s and government’s response to, of any such future pandemic, epidemic or outbreak of an infectious disease with respect to our markets or our facilities is difficult to predict and could adversely impact our business.
Our performance depends on our ability to recruit and retain quality physicians.
The success of our healthcare facilities depends in part on the number and quality of the physicians on the medical staffs of our healthcare facilities, our ability to employ quality physicians, the admitting and utilization practices of employed and independent physicians, maintaining good relations with those physicians and controlling costs related to the employment of physicians. Although we employ some physicians, physicians are often not employees at our healthcare facilities at which they practice. In many of the markets we serve, many physicians have admitting privileges at other healthcare facilities in addition to our healthcare facilities. Such physicians may terminate their affiliation with or employment by our healthcare facilities at any time. Moreover, we expect to face increased competition from health insurers and private equity-back companies seeking to acquire or affiliate with physicians or physician practices.
In addition, we may face increased challenges recruiting and retaining quality physicians as the physician population reaches retirement age, especially if there is a shortage of physicians willing and able to provide comparable services. In some markets,
34
physician recruitment and retention may be affected by a shortage of physicians in certain specialties or the difficulties physicians may experience in obtaining malpractice insurance. The types, amount and duration of compensation and assistance we can provide when recruiting physicians are limited by the federal Physician Self-Referral Law (commonly known as the Stark Law), the federal Anti-Kickback Statute, similar state laws and implementing regulations. If we are unable to provide adequate support personnel or technologically advanced equipment and facilities that meet the needs of those physicians and their patients, our ability to recruit and retain quality physicians may be negatively impacted.
Our performance and labor costs have been, and may continue to be, adversely affected by competitive labor market conditions and the shortage of qualified nurses.
The operations of our healthcare facilities are dependent on the efforts, abilities and experience of our facility management, healthcare professionals, such as nurses, pharmacists, lab technicians, and medical support personnel. We compete with other healthcare providers in recruiting and retaining qualified facility management and personnel responsible for the daily operations of our healthcare facilities, including nurses, other non-physician healthcare professionals and medical support personnel.
The healthcare industry has been experiencing an extremely competitive labor market arising out of current economic conditions and the COVID-19 pandemic. In some markets in which we operate, the availability of nurses, other healthcare professionals and medical support personnel has been a significant operating issue for healthcare providers, which has been exacerbated by the current competitive labor market. These developments have compelled, and may continue to compel, us to enhance wages and benefits to recruit and retain nurses, other healthcare professions and medical support personnel, or to hire more expensive temporary or contract personnel. Moreover, labor shortages, including with respect to nurses, may be further exacerbated by the CMS rule regarding vaccine requirements as noted above. In addition, the states in which we operate could adopt mandatory nurse-staffing ratios or could reduce mandatory nurse-staffing ratios already in place. State-mandated nurse-staffing ratios could significantly affect labor costs and have an adverse impact on revenues if we are required to limit admissions in order to meet the required ratios.
At December 31, 2021, certain employees at six of our hospitals were represented by various labor unions. While we have not experienced work stoppages to date that have material and adversely affected our business or results of operations, increased or ongoing labor union activity could adversely affect our labor costs or otherwise adversely impact us. In addition, when negotiating collective bargaining agreements with unions, whether such agreements are renewals or first contracts, there is the possibility that strikes could occur during the negotiation process, and our continued operation during any strikes could increase our labor costs and otherwise adversely impact us. Finally, potential changes to federal labor laws and regulations, including those supported by the current presidential administration, could increase the likelihood of employee unionization activity and the ability of employees to unionize.
If our labor costs continue to increase, we may not be able to raise rates to offset these increased costs. Because a significant percentage of our revenues consists of fixed, prospective payments, our ability to pass along increased labor costs is constrained. In the event we are not entirely effective at recruiting and retaining qualified facility management, nurses and other medical support personnel, or in controlling labor costs, this could have an adverse effect on our results of operations.
The industry trend towards value-based purchasing may negatively impact our business.
There is a trend toward value-based purchasing of healthcare services across the healthcare industry among both government and commercial payors. Generally, value-based purchasing initiatives tie payment to the quality and efficiency of care. For example, hospital payments may be negatively impacted by the occurrence of HACs. Medicare does not reimburse for care related to HACs, and hospitals in the bottom quartile of HAC rates receive a 1% reduction in their total Medicare payments the following year. In addition, federal funds may not be used under the Medicaid program to reimburse providers for services provided to treat HACs. Hospitals that experience excess readmissions for designated conditions receive reduced payments for all inpatient discharges. HHS also reduces Medicare inpatient hospital payments for all discharges by a required percentage and pools the amount collected from these reductions to fund payments to reward hospitals that meet or exceed certain quality performance standards. Further, Medicare and Medicaid require hospitals to report certain quality data to receive full reimbursement updates.
HHS has focused on tying Medicare payments to quality or value through alternative payment models, which generally aim to make providers attentive to the quality and cost of care they deliver to patients. Examples of alternative payment models include ACOs and bundled payment arrangements. An ACO is a care coordination model intended to produce savings as a result of improved quality and operational efficiency. In bundled payment models, providers receive one payment for services provided to patients for certain medical conditions or episodes of care, accepting accountability for costs and quality of care. Providers may receive supplemental Medicare payments or owe repayments to CMS depending on whether spending exceeds or falls below a specified spending target and whether certain quality standards are met. Generally, participation in Medicare bundled payment programs is voluntary, but CMS currently requires hospitals in selected markets to participate in bundled payment initiatives for specific
35
orthopedic procedures and end-stage renal disease treatment, and a mandatory radiation oncology bundled payment model is expected to begin January 1, 2023.
In October 2021, the CMS Innovation Center released an outline of its strategy for the next decade, noting the need to accelerate the movement to value-based care and drive broader system transformation. By 2030, the CMS Innovation Center aims to have all fee-for-service Medicare beneficiaries and the vast majority of Medicaid beneficiaries in an accountable care relationship with providers who are responsible for quality and total medical costs. The CMS Innovation Center signaled its intent to streamline its payment models and to increase provider participation through implementation of more mandatory models.
There are also several state-driven value-based care initiatives. For example, some states have aligned quality metrics across payors through legislation or regulation. Commercial payors are transitioning toward value-based reimbursement arrangements as well. Further, many commercial payors require hospitals to report quality data and restrict reimbursement for certain preventable adverse events.
We expect value-based purchasing programs, including programs that condition reimbursement on patient outcome measures, to become more common and to involve a higher percentage of reimbursement amounts. It is unclear whether these and other alternative payment models will successfully coordinate care and reduce costs or whether they will decrease aggregate reimbursement. While we believe we are adapting our business strategies to compete in a value-based reimbursement environment, we are unable at this time to predict how this trend will affect our results of operations. If we perform at a level below the outcomes demonstrated by our competitors, are unable to meet or exceed the quality performance standards under any applicable value-based purchasing program, or otherwise fail to effectively provide or coordinate the efficient delivery of quality healthcare services, our reputation in the industry may be negatively impacted, we may receive reduced reimbursement amounts and we may owe repayments to payors, causing our revenues to decline.
Our revenues are somewhat concentrated in a small number of states which will make us particularly sensitive to regulatory and economic changes in those states.
Our revenues are particularly sensitive to regulatory and economic changes in states in which we generate a significant portion of our revenues, including Indiana, Florida, Texas and Alabama. Accordingly, any change in the current demographic, economic, competitive, or regulatory conditions in these states could have an adverse effect on our business, financial condition, or results of operations. Changes to the Medicaid programs in these states could also have an adverse effect on our business, financial condition, results of operations, or cash flows. For example, the Texas Waiver Program, which provides funding for uncompensated care and delivery system reform initiatives, is operated under a waiver granted pursuant to Section 1115 of the Social Security Act. The current waiver continues through September 30, 2022. Although the previous presidential administration approved a 10-year extension of the Texas Waiver Program, through September 2030, CMS rescinded this extension in April 2021. The Texas Attorney General filed a lawsuit challenging the rescission and, in August 2021, a federal district judge granted a preliminary injunction temporarily reinstating the extension. While the lawsuit is pending, the Texas Health and Human Services Commission has re-submitted its application to extend the waiver program. It is difficult to predict whether all or part of the Texas Waiver Program will be eliminated, further extended or changed, any of which could negatively impact our revenues.
Risks Related to Legal Proceedings
We are the subject of various legal, regulatory and governmental proceedings that, if resolved unfavorably, could have an adverse effect on us, and we may be subject to other loss contingencies, both known and unknown.
We are a party to various legal, regulatory and governmental proceedings and other related matters. Those proceedings include, among other things, government investigations. In addition, we are and may become subject to other loss contingencies, both known and unknown, which may relate to past, present and future facts, events, circumstances and occurrences. Should an unfavorable outcome occur in connection with our legal, regulatory or governmental proceedings or other loss contingencies, or if we become subject to any such loss contingencies in the future, there could be an adverse impact on our financial position, results of operations and liquidity.
In particular, government investigations, as well as qui tam lawsuits, may lead to significant fines, penalties, damages payments or other sanctions, including exclusion from government healthcare programs. Settlements of lawsuits involving Medicare and Medicaid issues routinely require both monetary payments and corporate integrity agreements, each of which could have an adverse effect on our business, financial condition, results of operations and/or cash flows.
36
We could be subject to substantial uninsured liabilities or increased insurance costs as a result of significant legal actions.
Physicians, hospitals and other healthcare providers have become subject to an increasing number of legal actions alleging malpractice, product liability, or related legal theories. Even in states that have imposed caps on damages, litigants are seeking recoveries under new theories of liability that might not be subject to the caps on damages. Many of these actions involve large claims and significant defense costs. To protect us from the cost of these claims, we maintain claims made professional malpractice liability insurance and general liability insurance coverage in excess of those amounts for which we are self-insured. This insurance coverage is in amounts that we believe to be sufficient for our operations; however, our insurance coverage may not continue to be available at a reasonable cost for us to maintain adequate levels of insurance. Additionally, our insurance coverage does not cover all claims against us, such as fines, penalties, or other damage and legal expense payments resulting from qui tam lawsuits. We cannot predict the outcome of current or future legal actions against us or the effect that judgments or settlements in such matters may have on us or on our insurance costs. Additionally, all professional and general liability insurance we purchase is subject to policy limitations. If the aggregate limit of any of our professional and general liability policies is exhausted, in whole or in part, it could deplete or reduce the limits available to pay any other material claims applicable to that policy period. Furthermore, one or more of our insurance carriers could become insolvent and unable to fulfill its or their obligations to defend, pay or reimburse us when those obligations become due. In that case, or if payments of claims exceed our estimates or are not covered by our insurance, it could have an adverse effect on our business, financial condition or results of operations.
In connection with the final auditing and reporting requirements to which we are subject under the terms of the CIA, we could become subject to further action by the OIG, which could include the imposition of civil monetary penalties and/or the extension of the term of the CIA.
On August 4, 2014, we announced that we had entered into a civil settlement with the U.S. Department of Justice, other federal agencies and identified relators that concluded previously announced investigations and litigation related to short stay admissions through emergency departments at certain of our affiliated hospitals. In addition to the amounts paid in the settlement, we executed the CIA with the OIG that has been incorporated into our existing and comprehensive compliance program, which CIA was subsequently amended in September 2018. Although the CIA expired in September 2021, we are still subject to final audit and reporting requirements under the terms of the CIA. In connection with these final audit and reporting requirements, it remains possible that we will become subject to further action by the OIG, which could include the imposition of civil monetary penalties and/or the extension of the term of the CIA.
Risks Related to Government Regulation
We are unable to predict the ultimate impact of health reform initiatives, including efforts to significantly change the Affordable Care Act, or the effect that health reform efforts may have on our business.
In recent years, the U.S. Congress and certain state legislatures have introduced, considered or passed a large number of proposals and legislation designed to make major changes in the healthcare system, including changes intended to increase access to health insurance.
The Affordable Care Act is the most prominent of these reform efforts. The law expanded health insurance coverage through a combination of public program expansion and private sector health insurance reforms, reduces growth in Medicare reimbursement to hospitals, and promotes value-based purchasing. However, the Affordable Care Act has been the subject of efforts by the previous presidential administration and certain members of Congress to repeal or make significant changes to its scope, its implementation and/or its interpretation. For example, effective January 2019, the financial penalty for individuals that fail to maintain insurance coverage associated with the individual mandate was effectively eliminated. This change resulted in legal challenges to the constitutionality of the individual mandate and validity of the Affordable Care Act as a whole. However, in June 2021, the U.S. Supreme Court determined that the plaintiffs lacked standing and dismissed the challenge to the Affordable Care Act without specifically ruling on the constitutionality of the Affordable Care Act, allowing the law to remain in place.
There is uncertainty regarding whether, when, and how the Affordable Care Act will be further changed and how the Affordable Care Act will be interpreted and implemented, although the Biden administration has generally indicated its intent to protect and strengthen the Affordable Care Act and Medicaid programs. Changes by Congress or government agencies to the interpretation or implementation of the Affordable Care Act could eliminate or alter provisions beneficial to us while leaving in place provisions reducing our reimbursement, and thereby have an adverse effect on our business.
There is also uncertainty regarding whether, when, and what other health reform measures will be adopted, the timing and implementation of alternative provisions, and the impact of alternative provisions on providers as well as other healthcare industry participants. For example, some members of Congress have proposed measures that would expand government-funded coverage, and some states are considering or have implemented public health insurance options. CMS administrators may grant states various
37
flexibilities in the administration of state Medicaid programs and make changes to Medicaid payment models, including adopting value-based care models. Other health reform initiatives and proposals, such as the limitations and prohibitions on surprise billing enacted under the No Surprises Act and price transparency requirements, may impact prices, our competitive position and our relationships with patients, insurers, and ancillary providers (such as anesthesiologists, radiologists, and pathologists). Other industry participants, such as private payors and large employer groups and their affiliates, may also introduce financial or delivery system reforms. We are unable to predict the nature and success of such initiatives. Healthcare reform initiatives, including changes to the Affordable Care Act, may have an adverse impact on our business.
If we fail to comply with extensive laws and government regulations, including fraud and abuse laws, we could suffer penalties or be required to make significant changes to our operations.
The healthcare industry is governed by laws and regulations at the federal, state and local government levels. These laws and regulations include standards addressing, among other issues, licensure, certification, and enrollment with government programs; the necessity and adequacy of medical care; quality of medical equipment and services; qualifications of medical and support personnel; operating policies and procedures; screening, stabilization and transfer of individuals who have emergency medical conditions; billing and coding for services; properly handling overpayments; classification of levels of care provided; preparing and filing cost reports; relationships with referral sources and referral recipients; maintenance of adequate records; hospital use; rate-setting; building codes; environmental protection; privacy and security; interoperability and refraining from information blocking; debt collection; limits or prohibitions on balance billing and billing for out-of-network services; and communications with patients and consumers. Examples of these laws include, but are not limited to, HIPAA, the Stark Law, the federal Anti-Kickback Statute, the FCA, EMTALA and similar state laws.
There are heightened coordinated civil and criminal enforcement efforts by both federal and state government agencies relating to the healthcare industry, including the hospital segment. Enforcement actions have focused on financial arrangements between hospitals and physicians, billing for services without adequately documenting medical necessity and billing for services outside the coverage guidelines for such services. Specific to our hospitals, we have received inquiries and subpoenas from various governmental agencies regarding these and other matters, and we are also subject to various claims and lawsuits relating to such matters. For a further discussion of certain legal matters, see “Legal Proceedings” in Part I, Item 3 of this Form 10-K.
If we fail to comply with applicable laws and regulations, which are subject to change, we could be subject to liabilities, including civil penalties, money damages, the loss of our licenses to operate one or more facilities, exclusion of one or more facilities from participation in the Medicare, Medicaid and other federal and state healthcare programs, civil lawsuits and criminal penalties. The costs of compliance with, and the other burdens imposed by, these and other laws or regulatory actions may increase our operational costs, result in interruptions or delays in the availability of systems and/or result in a patient volume decline. We may also face audits or investigations by government agencies relating to our compliance with these regulations. An adverse outcome under any such investigation or audit could result in liability, result in adverse publicity, and adversely affect our business. In the future, evolving interpretations or enforcement of applicable laws or regulations could subject our current practices to allegations of impropriety or illegality or could require us to make changes in our facilities or operations. In addition, other legislation or regulations may be adopted that could adversely affect our business.
If there are delays in regulatory updates by governmental entities to federal and state healthcare programs, we may experience increased volatility in our operating results as such delays may result in a timing difference between when such program revenues are earned and when they become known or estimable for purposes of accounting recognition.
We derive a significant amount of our net operating revenues from governmental healthcare programs, primarily Medicare and Medicaid. The reimbursements due to us from those programs are subject to legislative and regulatory changes that can have a significant impact on our operating results. When delays occur in the implementation of regulations or passage of legislation, there is the potential for material increases or decreases in operating revenues to be recognized in periods subsequent to when such related services were performed, resulting in the potential for an adverse effect on our consolidated financial position and consolidated results of operations.
Security breaches, loss of data, and actual or perceived failures to comply with legal requirements regarding the privacy and security of health information or other regulated, sensitive or confidential information, or legal requirements regarding data privacy or data protection, and other cybersecurity incidents, could adversely affect our business, results of operations and financial condition.
The data protection landscape is rapidly evolving, and we are or may become subject to numerous state and federal laws, requirements and regulations governing the collection, use, storage, processing, disclosure, retention, privacy and security of health-related and other regulated, sensitive or confidential information. For example, the Health Insurance Portability and Accountability
38
Act of 1996, the Health Information Technology for Economic and Clinical Health Act of 2009, each as amended, and the privacy and security regulations that implement these laws (collectively, “HIPAA”), establish national privacy and security standards for the protection of protected health information, or PHI, by health plans, healthcare clearinghouses and certain healthcare providers, referred to as covered entities, and the business associates with whom such covered entities contract for services. HIPAA requires covered entities like us to develop and maintain policies and procedures with respect to the privacy and security of PHI and to adopt administrative, physical and technical safeguards to protect such information. Covered entities must notify affected individuals without unreasonable delay of breaches of unsecured PHI, the HHS Office for Civil Rights, or OCR, which enforces HIPAA, and, in the case of larger breaches, the media. Failure to comply with the HIPAA privacy and security standards can result in civil monetary penalties, resolution agreements, monitoring agreements, and, in certain circumstances, criminal penalties including fines and/or imprisonment. A covered entity may be subject to penalties as a result of a business associate violating HIPAA. In addition, state attorneys general may enforce the HIPAA privacy and security regulations in response to violations that threaten the privacy of state residents. Although HIPAA does not create a private right of action allowing individuals to sue in civil court for violations, the laws and regulations have been used as the basis for duty of care in state civil suits such as those for negligence or recklessness in the misuse or breach of PHI.
There are numerous other laws and legislative and regulatory initiatives at the federal and state levels governing the confidentiality, privacy, availability, integrity and security of PHI and other types of personal information. Certain state laws may be more stringent, broader in scope or offer greater individual rights with respect to PHI than HIPAA, state laws may differ from each other, and the interplay of federal and state laws may be subject to varying interpretations by courts and government agencies, all of which may complicate compliance efforts. Where state laws are more protective than HIPAA, we have to comply with their stricter provisions. Not only do some of these state laws impose fines and other penalties upon violators, but some may afford private rights of action to individuals who believe their personal information has been misused. We may not remain in compliance with diverse privacy and security requirements in all of the jurisdictions in which we do business, particularly to the extent they are inconsistent, rapidly changing and/or ambiguous and uncertain as to their applicability to our business practices.
In addition, we are subject to more general consumer protection laws and regulations in connection with our business activities. For example, the Federal Trade Commission uses its consumer protection authority to initiate enforcement actions in response to data breaches. Our marketing and patient engagement activities are subject to communications laws such as the Telephone Consumer Protection Act, or the TCPA, and the Controlling the Assault of Non-Solicited Pornography and Marketing Act, or CAN-SPAM. Determination by a court or regulatory agency that our calling, texting or email practices violate the TCPA or CAN-SPAM could subject us to civil penalties and could require us to change some portions of our business. Even an unsuccessful challenge by patients or regulatory authorities of our activities could result in adverse publicity and could require a costly response from and defense by us.
Although we strive to comply with applicable laws and regulations, the requirements related to the collection, use, storage, processing, disclosure, retention, privacy and security of health and other regulated, sensitive or confidential information are evolving rapidly and may be interpreted or applied in an inconsistent manner across jurisdictions. The cost of compliance with these laws and regulations is high and is likely to increase in the future. Any failure or perceived failure by us to comply with applicable data privacy and security laws or regulations, our internal policies and procedures or our contracts governing our processing of health and other regulated, sensitive or confidential information, or to otherwise adequately address privacy and security concerns, could result in negative publicity, government investigations and enforcement actions, claims by third parties and damage to our reputation, any of which could have a material adverse effect on our operations, financial performance and business.
If our adoption and utilization of electronic health record systems fails to satisfy HHS standards, our consolidated results of operations could be adversely affected, and we may be adversely affected by changing and more burdensome interoperability requirements.
Under the Health Information Technology for Economic and Clinical Health Act, or HITECH, and other laws, eligible hospitals that fail to demonstrate meaningful use of certified EHR technology and have not applied and qualified for a hardship exception are subject to reduced reimbursement from Medicare. Eligible healthcare professionals are also subject to positive or negative payment adjustments based, in part, on their use of EHR technology. Thus, if our hospitals and employed professionals are unable to properly adopt, maintain, and utilize certified EHR systems, we could be subject to penalties and lawsuits that may have an adverse effect on our consolidated financial position and consolidated results of operations.
39
As EHR technologies have become widespread, the federal government is also promoting interoperability and increasing patient access to electronic health information. The 21st Century Cures Act and implementing regulations prohibit information blocking by healthcare providers and certain other entities. Information blocking is defined as engaging in activities that are likely to interfere with the access, exchange or use of electronic health information, subject to limited exceptions. We may be subject to penalties or other disincentives or experience reputational damage for failure to comply. Current and future initiatives related to healthcare technology and interoperability may require changes to our operations, impose new and complex obligations on us, affect our relationships with providers, vendors, healthcare information exchanges and other third parties and require investments in infrastructure. It is difficult to predict the impact of these initiatives.
State efforts to regulate the construction, acquisition or expansion of healthcare facilities could limit our ability to build or acquire additional healthcare facilities, renovate our facilities or expand the breadth of services we offer.
Some states in which we operate require a CON or other prior approval for the construction or acquisition of healthcare facilities, capital expenditures exceeding a prescribed amount, changes in bed capacity or services and some other matters. In evaluating a proposal, these states consider the need for additional or expanded healthcare facilities or services. If we are not able to obtain required CONs or other prior approvals, we will not be able to acquire, operate, replace or expand our facilities or expand the breadth of services we offer. Furthermore, if a CON or other prior approval upon which we relied to invest in construction of a replacement or expanded facility were to be lost through an appeal process or revoked, we may not be able to recover the value of our investment.
State efforts to regulate the sale of hospitals operated by municipal or not-for-profit entities could prevent us from acquiring these types of hospitals.
Many states have adopted legislation regarding the sale or other disposition of hospitals operated by municipal or not-for-profit entities. In some states that do not have specific legislation, the attorneys general have demonstrated an interest in these transactions under their general obligation to protect the use of charitable assets. These legislative and administrative efforts focus primarily on the appropriate valuation of the assets divested and the use of the proceeds of the sale by the non-profit seller. While these review and, in some instances, approval processes can add additional time to the closing of a hospital acquisition, we have not had any significant difficulties or delays in completing acquisitions. However, future state actions could delay or even prevent our ability to acquire hospitals once we return to our acquisition strategy.
We may incur additional tax liabilities.
We are subject to tax in the United States as well as those states in which we do business. Changes in tax laws, including increased rates, or interpretations of tax laws by taxing authorities or other standard setting bodies, could increase our tax obligations and materially and adversely impact our results of operations.
Risks Related to Impairment
If the fair value of our reporting unit declines, a material non-cash charge to earnings from impairment of our goodwill could result.
On an ongoing basis, under GAAP, we evaluate, based on the fair value of our reporting unit, whether the carrying value of our goodwill is impaired when events or changes in circumstances indicate that such carrying value may not be recoverable. GAAP requires us to test goodwill for impairment at least annually.
In assessing the fair value of this reporting unit, we consider, among other things, the most recent price of our common stock or fair value of our long-term debt, estimates of future revenue and expense growth, estimated market multiples, expected capital expenditures, income tax rates, and costs of invested capital. We recorded material non-cash impairment charges with respect to our hospital operations reporting unit in 2016 and 2017, and could record material impairment charges in the future if our estimates or assumptions with respect to such fair value determination change in the future.
A significant decline in operating results or other indicators of impairment at one or more of our facilities could result in a material, non-cash charge to earnings to impair the value of long-lived assets.
Our operations are capital intensive and require significant investment in long-lived assets, such as property, equipment and other long-lived intangible assets, including capitalized internal-use software. If one of our facilities experiences declining operating results or is adversely impacted by one or more of these risk factors, we may not be able to recover the carrying value of those assets through our future operating cash flows. On an ongoing basis, we evaluate whether changes in future undiscounted cash flows reflect an impairment in the fair value of our long-lived assets. Additionally, if we decide to sell a business, we evaluate whether a business or a group of businesses is impaired based on an analysis of the selling price from a definitive agreement compared to the carrying value of
40
the net assets being sold. If the carrying value of our long-lived assets is impaired, we may incur a material non-cash charge to earnings.
Risks Related to Cybersecurity and Technology
Our operations could be significantly impacted by interruptions or restrictions in access to our information systems.
Our operations depend heavily on the proper function, availability and security of our information systems, as well as those of our third-party providers, to collect, maintain, process and use sensitive data and other clinical, operational and financial information. Information systems require an ongoing commitment of significant resources to maintain and enhance existing systems and to develop new systems in order to keep pace with continual changes in information technology. We also rely on third-party providers of financial, clinical, patient accounting and network information services, including those that interface with our own systems, and, as a result, we face operational challenges in maintaining multiple provider platforms and facilitating the interface of such systems with one another. We rely on these third-party providers to have appropriate controls to protect confidential information and other sensitive or regulated data. We do not control the information systems of third-party providers, and in some cases we may have difficulty accessing information archived on third-party systems.
Our networks and information systems are also subject to disruption due to events such as a major earthquake, natural disaster, fire, telecommunications failure, power outages, new system implementations, computer viruses, ransomware or other malware, security breaches, cyber-attacks, employee usage errors, acts of war, terrorist or criminal activities or other catastrophic events. If the information systems on which we rely fail or are interrupted or if our access to these systems is limited in the future, or we experience data loss or manipulation, it could result in unauthorized disclosure, misuse, loss or alteration of such data, interruptions and delays in our normal business operations, potential liability under applicable laws, regulatory penalties, and damage to our reputation. Any of these could have an adverse effect on our business, financial condition or results of operations.
A cyber-attack or security breach could result in the compromise of our facilities, confidential data or critical data systems and give rise to potential harm to patients, remediation and other expenses, expose us to liability under HIPAA, privacy and data protection laws and regulations, consumer protection laws, common law or other theories, subject us to litigation and federal and state governmental inquiries, damage our reputation, and otherwise be disruptive to our business.
We rely extensively on information technology systems to manage clinical and financial data, to communicate with our patients, payors, vendors and other third parties, to summarize and analyze operating results, and for a number of other critical operational functions. We have made significant investments in technology to protect our systems, equipment and medical devices and information from cybersecurity risks. Although we monitor and routinely test our security systems and processes and have redundancies as well as other proactive measures designed to protect the integrity, security and availability of the systems and data we manage and control, there can be no assurance that we, or our third party vendors and providers, will not be subject to security breaches and other cybersecurity threats, including those related to the use of ransomware and other malicious software or other attempts by third parties to access, acquire, use, disclose, misappropriate or manipulate our information or disrupt our operations. In spite of our security measures, our information technology and infrastructure have been subject to cyber-attacks and security breaches from time to time. In particular, as previously disclosed, during the second quarter of 2014, our computer network was the target of an external, criminal cyber-attack in which the attacker successfully copied and transferred certain data outside the Company. Moreover, the volume and intensity of cyber-attacks on hospitals and health systems continues to increase. We are regularly the target of attempted cybersecurity and other threats that could have a security impact, and we expect to continue to experience an increase in cybersecurity threats in the future. The preventive actions we take to reduce the risk of such incidents and protect our systems and data may not be sufficient in the future. Furthermore, because the techniques used in cyber-attacks change frequently and may not be immediately recognized, we may experience security or data breaches that remain undetected for an extended time. Cybersecurity and the continued development and enhancement of our controls, process and practices designed to protect our information systems from attack, damage or unauthorized access, acquisition, use or disclosure remain a priority for us. Our ability to recover from a ransomware or other cyber-attack is dependent on these practices, including successful backup systems and other recovery procedures. As cybersecurity threats continue to evolve, we may be required to expend significant additional resources to continue to modify or enhance our protective measures or to investigate and remediate any information security vulnerabilities, but we still might not be able to anticipate or prevent certain attack methods.
Further, cybersecurity threats, including those that result in a data or security breach, could impact the integrity, availability or security of PHI and other data subject to privacy laws and regulations, disrupt our information technology systems, equipment, medical devices or business, and threaten the access and utilization of critical information technology and data. Our ability to provide various healthcare services could be affected, particularly given the increasing use of telehealth services. For example, medical devices that connect to hospital networks or the internet may be vulnerable to cybersecurity incidents, which may impact patient safety.
41
We may be at increased risk because we outsource certain services or functions to, or have systems that interface with, third parties. Some of these third parties’ information systems are also subject to the risks outlined above and may store or have access to our data and may not have effective controls, processes, or practices to protect our information from attack, damage, or unauthorized access, acquisition, use or disclosure. A breach or attack affecting any of these third parties could harm our business. In addition, the definitive agreements we enter into in connection with the divestiture of hospitals routinely obligate us to provide transition services to the buyer, including access to our legacy information systems, for a defined transition period. By providing access to our information systems to non-employees, we may be exposed to cyber-attacks, ransomware or security or data breaches that originate outside of our internal processes and practices designed to prevent such threats from occurring. Further, consumer confidence in the integrity, availability and confidentiality of information systems and information, including patient information and operations data, in the healthcare industry generally could be impacted to the extent there are successful cyber-attacks at other healthcare services companies, which could have a material adverse effect on our business, financial position, or results of operations.
If we or any of our third-party service providers or certain other third-parties are subject to cyber-attacks or security or data breaches in the future, this could result in harm to patients; business and operational interruptions and delays; the loss, misappropriation, corruption or unauthorized access, acquisition, use or disclosure of data or inability to access data; litigation and potential liability under privacy, security, breach notification and consumer protection laws or other applicable laws, including HIPAA; reputational damage, federal and state governmental inquiries, civil monetary penalties, settlement agreements, corrective action plans and monitoring requirements, any of which could have an adverse effect on our business, financial condition or results of operations.
Additionally, while we have insurance coverage designed to address certain aspects of cybersecurity risks in place, such insurance coverage may be insufficient to cover all losses or all types of claims that may arise.
If we fail to comply with our obligations under license or technology agreements with third parties, we may be required to pay damages and we could lose license rights that are critical to our business.
We license certain intellectual property, including technologies and software from third parties, that is important to our business, and in the future we may enter into additional agreements that provide us with licenses to valuable intellectual property or technology. If we fail to comply with any of the obligations under our license agreements, we may be required to pay damages and the licensor may have the right to terminate the license. Termination by the licensor would cause us to lose valuable rights, and could prevent us from selling our solutions and services, or adversely impact our ability to commercialize future solutions and services. Our business would suffer if any current or future licenses terminate, if the licensors fail to abide by the terms of the license agreement, if the licensors fail to enforce licensed intellectual property against infringing third parties, if the licensed intellectual property are found to be invalid or unenforceable, or if we are unable to enter into necessary license agreements on acceptable terms or at all. Any of the foregoing could have an adverse effect on our business, financial condition or results of operations.
42
Item 1B. Unresolved Staff Comments
None
Item 2. Properties
We own our corporate headquarters building located in Franklin, Tennessee. In addition to the headquarters in Franklin, we maintain regional service centers related to our shared services initiatives. Aside from one service center located in Antioch, Tennessee, these service centers are located in the markets in which we operate hospitals.
Most of our hospitals are general care hospitals offering a wide range of inpatient and outpatient medical services. These services generally include general acute care, emergency room, general and specialty surgery, critical care, internal medicine, obstetrics, diagnostic, psychiatric and rehabilitation services. In addition, some of our hospitals provide skilled nursing and home care services based on individual community needs.
43
For each of our hospitals owned or leased as of December 31, 2021, the following table shows its location, the date of its acquisition or lease inception and the number of licensed beds:
|
Hospital |
|
City |
|
Licensed Beds(1) |
|
|
Date of Acquisition/ Lease Inception |
|
Ownership Type |
|
|
Alabama |
|
|
|
|
|
|
|
|
|
|
|
South Baldwin Regional Medical Center |
|
Foley |
|
|
112 |
|
|
June, 2000 |
|
Leased |
|
Grandview Medical Center |
|
Birmingham |
|
|
434 |
|
|
July, 2007 |
|
Owned |
|
Flowers Hospital |
|
Dothan |
|
|
235 |
|
|
July, 2007 |
|
Owned |
|
Medical Center Enterprise |
|
Enterprise |
|
|
131 |
|
|
July, 2007 |
|
Owned |
|
Gadsden Regional Medical Center |
|
Gadsden |
|
|
346 |
|
|
July, 2007 |
|
Owned |
|
Crestwood Medical Center |
|
Huntsville |
|
|
180 |
|
|
July, 2007 |
|
Owned |
|
|
|
|
|
|
|
|
|
|
|
|
|
Alaska |
|
|
|
|
|
|
|
|
|
|
|
Mat-Su Regional Medical Center |
|
Palmer |
|
|
125 |
|
|
July, 2007 |
|
Owned |
|
|
|
|
|
|
|
|
|
|
|
|
|
Arizona |
|
|
|
|
|
|
|
|
|
|
|
Western Arizona Regional Medical Center |
|
Bullhead City |
|
|
139 |
|
|
July, 2000 |
|
Owned |
|
Northwest Medical Center |
|
Tucson |
|
|
287 |
|
|
July, 2007 |
|
Owned |
|
Oro Valley Hospital |
|
Oro Valley |
|
|
158 |
|
|
July, 2007 |
|
Owned |
|
Northwest Medical Center Sahuarita |
|
Sahuarita |
|
|
18 |
|
|
November, 2020 |
|
Owned |
|
|
|
|
|
|
|
|
|
|
|
|
|
Arkansas |
|
|
|
|
|
|
|
|
|
|
|
Northwest Health System |
|
|
|
|
|
|
|
|
|
|
|
Northwest Medical Center - Bentonville |
|
Bentonville |
|
|
128 |
|
|
July, 2007 |
|
Owned |
|
Northwest Medical Center - Springdale |
|
Springdale |
|
|
222 |
|
|
July, 2007 |
|
Owned |
|
Willow Creek Women’s Hospital |
|
Johnson |
|
|
64 |
|
|
July, 2007 |
|
Owned |
|
Northwest Health Physician’s Specialty Hospital |
|
Fayetteville |
|
|
20 |
|
|
April, 2016 |
|
Leased |
|
Siloam Springs Regional Hospital |
|
Siloam Springs |
|
|
73 |
|
|
February, 2009 |
|
Owned |
|
Medical Center of South Arkansas |
|
El Dorado |
|
|
166 |
|
|
April, 2009 |
|
Leased |
|
|
|
|
|
|
|
|
|
|
|
|
|
Florida |
|
|
|
|
|
|
|
|
|
|
|
North Okaloosa Medical Center |
|
Crestview |
|
|
110 |
|
|
March, 1996 |
|
Owned |
|
Bravera Health Brooksville (f/k/a Bayfront Health - Brooksville) |
|
Brooksville |
|
|
120 |
|
|
January, 2014 |
|
Leased |
|
Shorepoint Health Port Charlotte (f/k/a Bayfront Health - Port Charlotte) |
|
Port Charlotte |
|
|
254 |
|
|
January, 2014 |
|
Owned |
|
Shorepoint Health Punta Gorda (f/k/a Bayfront Health - Punta Gorda) |
|
Punta Gorda |
|
|
208 |
|
|
January, 2014 |
|
Owned |
|
Bravera Health Spring Hill (f/k/a Bayfront Health - Spring Hill) |
|
Spring Hill |
|
|
124 |
|
|
January, 2014 |
|
Leased |
|
Lower Keys Medical Center |
|
Key West |
|
|
167 |
|
|
January, 2014 |
|
Leased |
|
Physicians Regional Healthcare System - Collier |
|
Naples |
|
|
100 |
|
|
January, 2014 |
|
Owned |
|
Physicians Regional Healthcare System - Pine Ridge |
|
Naples |
|
|
175 |
|
|
January, 2014 |
|
Owned |
|
Santa Rosa Medical Center |
|
Milton |
|
|
129 |
|
|
January, 2014 |
|
Leased |
|
Bravera Health Crystal River Regional Medical Center (f/k/a Seven Rivers Regional Medical Center) |
|
Crystal River |
|
|
128 |
|
|
January, 2014 |
|
Owned |
|
Shorepoint Health Venice (f/k/a Bayfront Health - Venice) |
|
Venice |
|
|
312 |
|
|
January, 2014 |
|
Owned |
|
|
|
|
|
|
|
|
|
|
|
|
|
Georgia |
|
|
|
|
|
|
|
|
|
|
|
East Georgia Regional Medical Center |
|
Statesboro |
|
|
149 |
|
|
January, 2014 |
|
Owned |
|
|
|
|
|
|
|
|
|
|
|
|
44
|
Indiana |
|
|
|
|
|
|
|
|
|
|
|
Lutheran Health Network |
|
|
|
|
|
|
|
|
|
|
|
Bluffton Regional Medical Center |
|
Bluffton |
|
|
79 |
|
|
July, 2007 |
|
Owned |
|
Dupont Hospital |
|
Fort Wayne |
|
|
131 |
|
|
July, 2007 |
|
Owned |
|
Lutheran Hospital |
|
Fort Wayne |
|
|
396 |
|
|
July, 2007 |
|
Owned |
|
Lutheran Musculoskeletal Center |
|
Fort Wayne |
|
|
39 |
|
|
July, 2007 |
|
Owned |
|
Lutheran Rehabilitation Hospital (rehabilitation) |
|
Fort Wayne |
|
|
36 |
|
|
July, 2007 |
|
Owned |
|
Lutheran Downtown Hospital (f/k/a St. Joseph Hospital) |
|
Fort Wayne |
|
|
191 |
|
|
July, 2007 |
|
Owned |
|
Dukes Memorial Hospital |
|
Peru |
|
|
25 |
|
|
July, 2007 |
|
Owned |
|
Kosciusko Community Hospital |
|
Warsaw |
|
|
72 |
|
|
July, 2007 |
|
Owned |
|
Northwest Health - Porter Hospital |
|
Valparaiso |
|
|
301 |
|
|
May, 2007 |
|
Owned |
|
Northwest Health - La Porte Hospital |
|
La Porte |
|
|
227 |
|
|
March, 2016 |
|
Owned |
|
Northwest Health - Starke Hospital |
|
Knox |
|
|
53 |
|
|
March, 2016 |
|
Leased |
|
|
|
|
|
|
|
|
|
|
|
|
|
Mississippi |
|
|
|
|
|
|
|
|
|
|
|
Merit Health Wesley |
|
Hattiesburg |
|
|
211 |
|
|
July, 2007 |
|
Owned |
|
Merit Health River Region |
|
Vicksburg |
|
|
361 |
|
|
July, 2007 |
|
Owned |
|
Merit Health Biloxi |
|
Biloxi |
|
|
153 |
|
|
January, 2014 |
|
Leased |
|
Merit Health Central |
|
Jackson |
|
|
319 |
|
|
January, 2014 |
|
Leased |
|
Merit Health Rankin |
|
Brandon |
|
|
134 |
|
|
January, 2014 |
|
Leased |
|
Merit Health Madison |
|
Canton |
|
|
67 |
|
|
January, 2014 |
|
Owned |
|
Merit Health River Oaks |
|
Flowood |
|
|
160 |
|
|
January, 2014 |
|
Owned |
|
Merit Health Woman's Hospital |
|
Flowood |
|
|
109 |
|
|
January, 2014 |
|
Owned |
|
Merit Health Natchez |
|
Natchez |
|
|
179 |
|
|
October, 2014 |
|
Owned |
|
|
|
|
|
|
|
|
|
|
|
|
|
Missouri |
|
|
|
|
|
|
|
|
|
|
|
Moberly Regional Medical Center |
|
Moberly |
|
|
99 |
|
|
November, 1993 |
|
Owned |
|
Northeast Regional Medical Center |
|
Kirksville |
|
|
93 |
|
|
December, 2000 |
|
Leased |
|
Poplar Bluff Regional Medical Center |
|
Poplar Bluff |
|
|
410 |
|
|
January, 2014 |
|
Owned |
|
|
|
|
|
|
|
|
|
|
|
|
|
New Mexico |
|
|
|
|
|
|
|
|
|
|
|
Eastern New Mexico Medical Center |
|
Roswell |
|
|
162 |
|
|
April, 1998 |
|
Owned |
|
Carlsbad Medical Center |
|
Carlsbad |
|
|
99 |
|
|
July, 2007 |
|
Owned |
|
Mountain View Regional Medical Center |
|
Las Cruces |
|
|
168 |
|
|
July, 2007 |
|
Owned |
|
|
|
|
|
|
|
|
|
|
|
|
|
North Carolina |
|
|
|
|
|
|
|
|
|
|
|
Lake Norman Regional Medical Center |
|
Mooresville |
|
|
123 |
|
|
January, 2014 |
|
Owned |
|
Davis Regional Medical Center |
|
Statesville |
|
|
144 |
|
|
January, 2014 |
|
Owned |
|
|
|
|
|
|
|
|
|
|
|
|
|
Oklahoma |
|
|
|
|
|
|
|
|
|
|
|
AllianceHealth Ponca City |
|
Ponca City |
|
|
140 |
|
|
May, 2006 |
|
Owned |
|
AllianceHealth Woodward |
|
Woodward |
|
|
87 |
|
|
July, 2007 |
|
Leased |
|
AllianceHealth Clinton |
|
Clinton |
|
|
56 |
|
|
January, 2014 |
|
Leased |
|
AllianceHealth Madill |
|
Madill |
|
|
25 |
|
|
January, 2014 |
|
Leased |
|
AllianceHealth Durant |
|
Durant |
|
|
138 |
|
|
January, 2014 |
|
Owned |
|
AllianceHealth Seminole |
|
Seminole |
|
|
32 |
|
|
January, 2014 |
|
Leased |
|
|
|
|
|
|
|
|
|
|
|
|
|
Pennsylvania |
|
|
|
|
|
|
|
|
|
|
|
Commonwealth Health Network |
|
|
|
|
|
|
|
|
|
|
|
Wilkes-Barre General Hospital |
|
Wilkes-Barre |
|
|
412 |
|
|
April, 2009 |
|
Owned |
|
First Hospital Wyoming Valley (psychiatric) |
|
Wilkes-Barre |
|
|
149 |
|
|
April, 2009 |
|
Owned |
|
Regional Hospital of Scranton (2) |
|
Scranton |
|
|
186 |
|
|
May, 2011 |
|
Owned |
|
Moses Taylor Hospital |
|
Scranton |
|
|
122 |
|
|
January, 2012 |
|
Owned |
|
|
|
|
|
|
|
|
|
|
|
|
45
|
Tennessee |
|
|
|
|
|
|
|
|
|
|
|
Tennova Healthcare - Cleveland |
|
Cleveland |
|
|
351 |
|
|
October, 2005 |
|
Owned |
|
Tennova Healthcare - Clarksville |
|
Clarksville |
|
|
270 |
|
|
July, 2007 |
|
Owned |
|
Tennova - Jefferson Memorial Hospital |
|
Jefferson City |
|
|
58 |
|
|
January, 2014 |
|
Leased |
|
Tennova - LaFollette Medical Center |
|
LaFollette |
|
|
66 |
|
|
January, 2014 |
|
Owned (3) |
|
Tennova - Newport Medical Center |
|
Newport |
|
|
130 |
|
|
January, 2014 |
|
Owned |
|
Tennova - North Knoxville Medical Center |
|
Powell |
|
|
116 |
|
|
January, 2014 |
|
Owned |
|
Tennova - Turkey Creek Medical Center |
|
Knoxville |
|
|
111 |
|
|
January, 2014 |
|
Owned |
|
|
|
|
|
|
|
|
|
|
|
|
|
Texas |
|
|
|
|
|
|
|
|
|
|
|
Lake Granbury Medical Center |
|
Granbury |
|
|
73 |
|
|
January, 1997 |
|
Leased |
|
Laredo Medical Center |
|
Laredo |
|
|
326 |
|
|
October, 2003 |
|
Owned |
|
Navarro Regional Hospital |
|
Corsicana |
|
|
162 |
|
|
July, 2007 |
|
Owned |
|
Longview Regional Medical Center |
|
Longview |
|
|
224 |
|
|
July, 2007 |
|
Owned |
|
Woodland Heights Medical Center |
|
Lufkin |
|
|
149 |
|
|
July, 2007 |
|
Owned |
|
DeTar Healthcare System |
|
Victoria |
|
|
278 |
|
|
July, 2007 |
|
Owned |
|
Cedar Park Regional Medical Center |
|
Cedar Park |
|
|
126 |
|
|
December, 2007 |
|
Owned |
|
|
|
|
|
|
|
|
|
|
|
|
|
West Virginia |
|
|
|
|
|
|
|
|
|
|
|
Plateau Medical Center |
|
Oak Hill |
|
|
25 |
|
|
July, 2002 |
|
Owned |
|
Greenbrier Valley Medical Center |
|
Ronceverte |
|
|
122 |
|
|
July, 2007 |
|
Owned |
|
|
|
|
|
|
|
|
|
|
|
|
|
Total Licensed Beds at December 31, 2021 |
|
|
|
|
13,289 |
|
|
|
|
|
|
|
|
|
|
|
|
|
|
|
|
|
|
Total Hospitals at December 31, 2021 |
|
|
|
|
83 |
|
|
|
|
|
|
(1) |
Licensed beds are the number of beds for which the appropriate state agency licenses a facility regardless of whether the beds are actually available for patient use. |
|
(2) |
On October 1, 2021, Tyler Memorial Hospital in Tunkhannock, Pennsylvania, which previously offered inpatient care and surgical services as a stand-alone acute care hospital, began operating as a campus of Regional Hospital of Scranton, in Scranton, Pennsylvania, offering emergency room and outpatient services such as primary care, laboratory and imaging. |
|
(3) |
The purchase option included within the lease agreement for this facility was exercised in 2020 and closed on January 26, 2021. |
The real property of substantially all of our wholly-owned hospitals is also encumbered by mortgages to support obligations under the ABL Facility and outstanding senior secured notes.
Item 3. Legal Proceedings
From time to time, we receive inquiries or subpoenas from state regulators, state Medicaid Fraud Control units, fiscal intermediaries, CMS, the U.S. Department of Justice and other government entities regarding various Medicare and Medicaid issues. In addition, we are subject to other claims and lawsuits arising in the ordinary course of our business including lawsuits and claims related to billing practices and the administration of charity care policies at our hospitals. Based on current knowledge, management does not believe that loss contingencies arising from pending legal, regulatory and governmental matters, including the matters described herein, will have a material adverse effect on the consolidated financial position or liquidity of the Company. However, in light of the inherent uncertainties involved in pending legal, regulatory and governmental matters, some of which are beyond our control, and the very large or indeterminate damages sought in some of these matters, an adverse outcome in one or more of these matters could be material to our results of operations or cash flows for any particular reporting period. Settlements of suits involving Medicare and Medicaid issues routinely require both monetary payments as well as corporate integrity agreements. Additionally, qui tam or “whistleblower” actions initiated under the civil FCA may be pending but placed under seal by the court to comply with the FCA’s requirements for filing such suits. In September 2014, the Criminal Division of the U.S. Department of Justice announced that all qui tam cases will be shared with their Division to determine if a parallel criminal investigation should be opened. The Criminal Division has also frequently stated an intention to pursue corporations in criminal prosecutions. From time to time, we detect issues of non-compliance with Federal healthcare laws pertaining to claims submission and reimbursement practices and/or financial relationships with physicians. We avail ourselves of various mechanisms to address potential overpayments arising out of these issues, including repayment of claims, rebilling of claims, and participation in voluntary disclosure protocols offered by CMS and the OIG.
46
Participating in voluntary repayments and voluntary disclosure protocols can have the potential for significant settlement obligations or even enforcement action.
The following legal proceedings are described in detail because, although certain legal proceedings may not be required to be disclosed in this Part I, Item 3 under SEC rules, due to the nature of the business of the Company, we believe that the following discussion of these matters may provide useful information to security holders. This discussion does not include claims and lawsuits covered by medical malpractice, general liability or employment practices insurance and risk retention programs, none of which claims or lawsuits would in any event be required to be disclosed in this Part I, Item 3 under SEC rules.
Shareholder Litigation
Caleb Padilla, individually and on behalf of all others similarly situated v Community Health Systems, Inc., Wayne T. Smith, Larry Cash, and Thomas J. Aaron. This purported federal securities class action was filed in the United States District Court for the Middle District of Tennessee on May 30, 2019. It seeks class certification on behalf of purchasers of our common stock between February 20, 2017 and February 27, 2018 and alleges misleading statements resulted in artificially inflated prices for our common stock. On November 20, 2019, the District Court appointed Arun Bhattacharya and Michael Gaviria as lead plaintiffs in the case. The lead plaintiffs filed a consolidated class complaint on January 21, 2020. The Company filed a motion to dismiss the consolidated class complaint on March 23, 2020. That motion is pending. We believe this matter is without merit and are vigorously defending this case.
Padilla Derivative Litigation. Four purported shareholder derivative cases have been filed in two District Courts relating to the factual allegations in the Padilla litigation; three of these cases have been consolidated in In re Community Health Systems, Inc. Shareholder Derivative Litigation and are pending in the United States District Court for the District of Delaware; namely, Faisal Hussain v. Wayne T. Smith, et al, filed August 12, 2019; Susheel Tanjavoor v. Wayne T. Smith, et al., filed August 29, 2019; and Kevin Aronson v. Wayne T. Smith, et al, filed April 29, 2020. The fourth case, Roger Trombley v. Wayne T. Smith, et al, filed August 20, 2019, is pending in the United States District Court for the Middle District of Tennessee. All four cases seek relief derivatively and on behalf of Community Health Systems, Inc. against certain Company officers and directors based on alleged breaches of fiduciary duty, unjust enrichment, and other acts related to certain Company disclosures in 2017 and 2018 regarding the Company’s adoption of Accounting Standards Update 2014-09, which the Company adopted effective January 1, 2018. All four cases are stayed by court order until the United States District Court for the Middle District of Tennessee rules on the defendants’ motion to dismiss in the Padilla action.
Qui Tam Litigation
U.S. ex rel Larry Bomar v. Bayfront HMA Medical Center, LLC, et al – On September 14, 2017, our former hospital in St. Petersburg, Florida received a civil investigative demand, or CID, from the United States Department of Justice for information concerning its historic participation in the Florida Low Income Pool Program. The Low Income Pool Program, or LIP, is a funding pool to support healthcare providers that provide uncompensated care to Florida residents who are uninsured or underinsured. The CID sought documentation related to agreements between the hospital and Pinellas County. On June 13, 2019, an additional ten of our affiliated hospitals in Florida received CIDs related to the same subject matter, along with two CIDs addressed to our affiliated management company and the parent company. We cooperated fully with the investigation. On September 15, 2021, the United States District Court for the Middle District of Florida ordered the unsealing of this qui tam complaint, which contains allegations related to the information sought in the September 14, 2017 CID. Specifically, the relator claims our former hospital in St. Petersburg – Bayfront Medical Center St. Petersburg – along with other, unaffiliated hospitals violated the False Claims Act by allegedly making certain contributions to a non-profit entity for the purpose of receiving supplemental Medicaid funding. The United States has declined to intervene in the case. We filed a motion to dismiss on November 23, 2021. That motion is pending. We believe this matter is without merit and are vigorously defending this case.
Commercial Litigation and Other Lawsuits
Steadfast Insurance Company, et al v. Community Health Systems, Inc., CHS/Community Health Systems, Inc., CHSPSC, LLC and Pecos Valley of New Mexico, LLC; Community Health Systems, Inc., et al v. Steadfast Insurance Company, et al; Anne Sperling, et al v. Community Insurance Group SPC, Ltd. These cases are filed in the Superior Court for the State of Delaware, the Chancery Court for the State of Delaware, and the First Judicial District Court for the State of New Mexico, respectively, and involve insurance coverage disputes related to a $73 million judgment rendered against Pecos Valley of New Mexico, LLC in Anne Sperling, et al v. Pecos Valley of New Mexico, LLC (“Sperling I”). The first case was brought by Steadfast Insurance Company in Delaware Superior Court seeking a declaration that the Sperling I judgment is not a covered loss as defined by the insurance policies that are the subject of the case. The second case, filed by the Company in Delaware Chancery Court, seeks reformation of the subject policies. The third case (“Sperling II”), filed by the plaintiffs in Sperling I, seeks recovery from Pecos Valley of New Mexico, LLC’s insurers for the judgment awarded the plaintiffs in their separate, previous action against Pecos Valley of New Mexico, LLC. The Steadfast complaint was served on November 30, 2018. On December 13, 2018, Admiral Insurance Company, Endurance Specialty Insurance Ltd, and
47
Illinois Union Insurance Company moved to intervene in the suit as petitioners. The Company has initiated counterclaims against each insurer in that case, including for bad faith against Steadfast. The Company filed the Community Health Systems complaint on January 22, 2020. Sperling II was filed on July 24, 2019. Plaintiffs amended their complaint to add Pecos Valley of New Mexico, LLC as a defendant in that action on May 21, 2020, and Pecos Valley of New Mexico, LLC filed a third party action against certain insurer defendants in the case on July 6, 2020. On November 12, 2020, Pecos Valley and one of its insurers reached a settlement with the plaintiffs in Sperling I, and as a result the Sperling I case was dismissed with prejudice on November 19, 2020. In November 2021, we settled the remaining Steadfast and Community Health Systems cases with the defendant insurance carriers for a total payment of $22 million by the carriers to the Company, and those remaining cases have been dismissed with prejudice.
Thomas Mason, MD, Steven Folstad, MD and Mid-Atlantic Emergency Medical Associates, PA v Health Management Associates, LLC f/k/a Health Management Associates, Inc., Mooresville Hospital Management Associates d/b/a Lake Norman Regional Medical Center, Statesville HMA, LLC d/b/a Davis Regional Medical Center, Envision Healthcare Corporation f/k/a Emergency Medical Services Corporation, Emcare Holdings, Inc., and Emergency Medical Services, LP. This alleged wrongful retaliation case is filed in the United States District Court for the Western District of North Carolina. The plaintiffs allege their agreements with the defendants were terminated in retaliation for plaintiffs’ alleged refusal to admit patients unnecessarily to the defendant hospitals or otherwise perform unnecessary diagnostic testing. The allegations of the complaint relate to time periods prior to the hospitals’ affiliation with the Company. The plaintiffs filed a Third Amended Complaint on April 26, 2019. The defendants filed motions to dismiss, which were granted in part and denied in part on September 5, 2019. We believe these claims are without merit and are vigorously defending this case.
Tower Health, f/k/a Reading Health System, et al v CHS/Community Health Systems, Inc., et al. This breach of contract action is pending in the United States District Court for the Eastern District of Pennsylvania. The plaintiffs allege breaches of an asset purchase agreement in connection with the sale of Pottstown Memorial Medical Center. The alleged breaches regard plaintiffs’ contention that the defendants failed to disclose certain conditions related to the physical plant of the hospital, along with various other alleged breaches of the asset purchase agreement. The plaintiffs filed an amended complaint on July 22, 2019. Trial for this matter began May 3, 2021, and closed on October 5, 2021. The court has not issued a decision. We believe these claims are without merit and are vigorously defending this case.
Daniel H. Golden, as Litigation Trustee of the QHC Litigation Trust, and Wilmington Savings Fund Society, FSB, solely in its capacity as indenture trustee v Community Health Systems, Inc., et al. A complaint in this case was filed on October 25, 2021 in the United States Bankruptcy Court for the District of Delaware against various persons, including the Company, certain subsidiaries of the Company, certain former executive officers of the Company and Credit Suisse Securities (USA) LLC. Plaintiff Daniel H. Golden is the litigation trustee for a litigation trust which was formed under the plan of reorganization of Quorum Health Corporation, or QHC, and certain affiliated entities confirmed by order of the United States Bankruptcy Court for the District of Delaware wherein QHC and certain affiliated entities contributed various causes of action to such litigation trust. Plaintiff Wilmington Savings Fund Society is the indenture trustee for certain notes issued by QHC. The complaint seeks damages and other forms of recovery arising out of certain alleged actions taken by the Company and the other defendants in connection with the spin-off of QHC which was completed on April 29, 2016, and includes claims for unjust enrichment and for avoidance of certain transactions and payments by QHC to the Company connected with the spin-off, including the $1.21 billion special dividend paid by QHC to the Company as part of the spin-off transactions. We filed a motion to dismiss on January 14, 2022. We believe these claims are without merit and will vigorously defend this case.
Management of Significant Legal Proceedings
In accordance with our governance documents, including our Governance Guidelines and the charter of the Audit and Compliance Committee, our management of significant legal proceedings is overseen by the independent members of the Board of Directors and, in particular, the Audit and Compliance Committee. The Audit and Compliance Committee is charged with oversight of compliance, regulatory and litigation matters, and enterprise risk management. Management has been instructed to refer all significant legal proceedings and allegations of financial statement fraud, error, or misstatement to the Audit and Compliance Committee for its oversight and evaluation. Consistent with New York Stock Exchange and Sarbanes-Oxley independence requirements, the Audit and Compliance Committee is comprised entirely of individuals who are independent of our management, and all four members of the Audit and Compliance Committee are “audit committee financial experts” as defined in the Securities Exchange Act of 1934, as amended.
In addition, the Audit and Compliance Committee and the other independent members of the Board of Directors oversee the functions of the voluntary compliance program, including its auditing and monitoring functions and confidential disclosure program. In recent years, the voluntary compliance program has addressed the potential for a variety of billing errors that might be the subject of audits and payment denials by the CMS Recovery Audit Contractors’ permanent project, including MS-DRG coding, outpatient hospital and physician coding and billing, and medical necessity for services (including a focus on hospital stays of very short
48
duration). Efforts by management, through the voluntary compliance program, to identify and limit risk from these government audits have included significant policy and guidance revisions, training and education, and auditing.
Item 4. Mine Safety Disclosures
Not applicable.
49
PART II
Item 5. Market for Registrant’s Common Equity, Related Stockholder Matters and Issuer Purchases of Equity Securities
We completed an initial public offering of our common stock on June 14, 2000. Our common stock began trading on June 9, 2000 and is listed on the New York Stock Exchange under the symbol CYH. As of February 11, 2022, there were approximately 187 holders of record of our common stock.
Stock Performance Graph
The following graph sets forth the cumulative return of our common stock during the five year period ended December 31, 2021, as compared to the cumulative return of the Standard & Poor’s 500 Stock Index (S&P 500) and the cumulative return of the Dow Jones Healthcare Index. The graph assumes an initial investment of $100 in our common stock and in each of the foregoing indices and the reinvestment of dividends where applicable. The comparisons in the graph below are based on historical data and are not indicative of, or intended to forecast, future performance of our common stock. The market price of our common stock used to calculate the cumulative return has been adjusted in prior periods for the impact of the April 2016 QHC spin-off and related distribution of QHC common stock to our stockholders.
COMPARISON OF 5 YEAR CUMULATIVE TOTAL RETURN
Among Community Health Systems, Inc., the S&P 500 Index, and the Dow Jones US Health Care Index
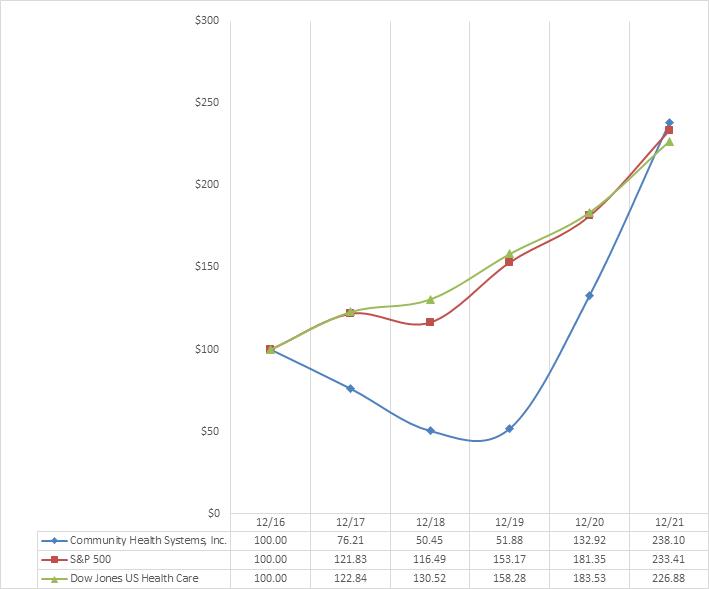
50
We are a holding company which operates through our subsidiaries. The ABL Facility and the indentures governing the senior and senior secured notes contain various covenants under which the assets of our subsidiaries are subject to certain restrictions relating to, among other matters, dividends and distributions, as referenced in the paragraph below.
The ABL Facility and the indentures governing each series of our outstanding notes restrict our subsidiaries from, among other matters, paying dividends and making distributions to us, which thereby limits our ability to pay dividends and/or repurchase stock. As of December 31, 2021, under the most restrictive test in these agreements (and subject to certain exceptions), we have approximately $300 million of capacity to pay permitted dividends and/or repurchase shares of stock or make other restricted payments.
The following table contains information about our purchases of common stock during the three months ended December 31, 2021.
|
Period |
|
Total Number of Shares Purchased (a) |
|
|
Average Price Paid per Share |
|
|
Total Number of Shares Purchased as Part of Publicly Announced Plans or Programs(b) |
|
|
Maximum Number of Shares That May Yet Be Purchased Under the Plans or Programs(b) |
|
||||
|
October 1, 2021 - |
|
|
|
|
|
|
|
|
|
|
|
|
|
|
|
|
|
October 31, 2021 |
|
|
3,186 |
|
|
$ |
12.18 |
|
|
|
— |
|
|
|
— |
|
|
November 1, 2021 - |
|
|
|
|
|
|
|
|
|
|
|
|
|
|
|
|
|
November 30, 2021 |
|
|
— |
|
|
|
— |
|
|
|
— |
|
|
|
— |
|
|
December 1, 2021 - |
|
|
|
|
|
|
|
|
|
|
|
|
|
|
|
|
|
December 31, 2021 |
|
|
7,608 |
|
|
|
12.67 |
|
|
|
— |
|
|
|
— |
|
|
|
|
|
|
|
|
|
|
|
|
|
|
|
|
|
|
|
|
Total |
|
|
10,794 |
|
|
$ |
12.53 |
|
|
|
— |
|
|
|
— |
|
|
(a) |
Includes 10,794 shares were withheld by us to satisfy the payment of tax obligations related to the vesting of restricted stock awards. |
|
(b) |
We had no publicly announced plans or open market repurchase programs for shares of our common stock during the three months ended December 31, 2021. |
Item 6. Reserved
Reserved.
51
Item 7. Management’s Discussion and Analysis of Financial Condition and Results of Operations
You should read this discussion together with our Consolidated Financial Statements and the accompanying Notes to Consolidated Financial Statements included elsewhere in this Form 10-K.
Executive Overview
We are one of the largest publicly traded providers of healthcare services in the United States and a leading operator of general acute care hospitals and outpatient facilities in communities across the country. We provide healthcare services through the hospitals and affiliated businesses that we own and operate in generally larger non-urban and selected urban markets throughout the United States. We generate revenues by providing a broad range of general and specialized hospital healthcare services and outpatient services to patients in the communities in which we are located. As of December 31, 2021, we owned or leased 83 hospitals, comprised of 81 general acute care hospitals and two stand-alone rehabilitation or psychiatric hospitals. For the hospitals that we own and operate, we are paid for our services by governmental agencies, private insurers and directly by the patients we serve.
COVID-19 Pandemic
A novel strain of coronavirus causing the disease known as COVID-19 was first identified in December 2019, and has spread throughout the world, including across the United States. The HHS Secretary has renewed the agency’s declaration of a national public health emergency, which was initially declared in January 2020, due to the continued consequences of the COVID-19 pandemic. While vaccines and booster shots for the COVID-19 virus became widely available in the United States during the year ended December 31, 2021, COVID-19 has continued to result in a significant number of hospitalizations. Moreover, various government authorities and private businesses have implemented or re-imposed restrictive measures, including mask and vaccine requirements.
As a provider of healthcare services, we have been and continue to be significantly affected by the public health and economic effects of the COVID-19 pandemic. The safety of our patients, physicians, nurses, and employees in the communities in which we serve remains our primary focus. Our hospitals, medical clinics, medical personnel, and employees have been actively caring for COVID-19 patients, and we have been working with federal, state and local health authorities to respond to COVID-19 cases in the communities we serve.
Although we have implemented considerable safety measures, treatment of COVID-19 patients has associated risks, which may include the manner in which patients, physicians, nurses and other medical personnel perceive and respond to such risks. While our hospitals have not generally experienced major capacity constraints to date arising from the treatment of COVID-19 patients, there are hospitals in the United States that have been overwhelmed in caring for COVID-19 patients, which has prevented such hospitals from treating all patients who seek care. In certain locations, government authorities and healthcare providers have re-imposed restrictions on elective medical procedures, have activated crisis standards of care, have deployed military personnel, and have taken other measures affecting treatment capacity and care in response to COVID-19 pandemic developments. One or more of our hospitals or other facilities could be affected by these measures in the future, particularly if a major COVID-19 outbreak occurs in a geographic region where any of our hospitals are located.
We have incurred, and may continue to incur, certain increased expenses arising from the COVID-19 pandemic, including additional labor, supply chain, capital and other expenditures. Moreover, in recent months, the COVID-19 pandemic has resulted in general inflationary pressures and has resulted in significant disruptions to global supply networks. In this regard, we have experienced disruptions in connection with the provision of equipment, pharmaceuticals and medical supplies to us, as well as inflationary pressures in connection with labor, supply chain, capital and other expenditures. While we have implemented cost containment and other measures to try to counteract these developments, we may be unable to fully offset these increases in our costs and otherwise effectively respond to supply disruptions.
Negative economic conditions and other factors resulting from the COVID-19 pandemic have affected, and may continue to affect, our service mix, revenue mix, payor mix and/or patient volumes, as well as our ability to collect outstanding receivables. Pandemic-related factors may continue to adversely affect demand for our services, as well as the ability of patients and other payors to pay for services rendered. We have observed deterioration in the collectability of patient accounts receivable from uninsured patients compared to pre-pandemic levels which, if sustained, may adversely affect our financial results and require an increased level of working capital.
While we are not able to fully quantify the impact that the COVID-19 pandemic will have on our future financial results, we expect developments related to COVID-19 to continue to affect our financial performance. Moreover, the COVID-19 pandemic may otherwise have material adverse effects on our results of operations, financial position, and/or our cash flows if economic and/or public health conditions in the United States deteriorate. The ongoing impact of the pandemic on our financial results will depend on,
52
among other factors, the duration and severity of the pandemic, the impact of the pandemic on economic conditions, the volume of canceled or rescheduled procedures at our facilities, the volume of COVID-19 patients cared for across our health systems, the timing, availability and acceptance of effective medical treatments, the availability, acceptance of and need for additional doses of vaccines, the spread of potentially more contagious and/or virulent forms of the virus, including any variants of the virus that may be resistant to currently available vaccines, and the impact of government actions and administrative regulation on the hospital industry and broader economy, including through existing and any future stimulus efforts as well as vaccine requirements. As discussed below under “Overview of Legislative Developments”, we have received, and may continue to receive, payments and advances made available under the CARES Act, the PPPHCE Act, the CAA, the ARPA, and other stimulus laws, which have been beneficial in partially mitigating the impact of the COVID-19 pandemic on our results of operation and financial position to date. The federal government may consider additional stimulus and relief efforts but we are unable to predict whether any additional stimulus measures will be enacted or their impact, if any. We are unable to assess the extent to which potential ongoing negative impacts on us arising from the COVID-19 pandemic will ultimately be offset by amounts received, and benefits which we may in the future receive, under the CARES Act, the PPPHCE Act, the CAA, the ARPA or any future stimulus measures.
Completed Divestiture and Acquisition Activity
Our portfolio rationalization and deleveraging strategy involving the divestiture of hospitals and non-hospital businesses concluded at the end of 2020. However, we continue to receive interest from potential acquirers for certain of our hospitals, and may, from time to time, consider selling additional hospitals or our unconsolidated equity interests in hospitals if we consider any such disposition to be in our best interests.
During 2021, we completed the divestiture of five hospitals, including three which closed effective January 1, 2021 (for these hospitals we received net proceeds at a preliminary closing on December 31, 2020). These five hospitals represented annual net operating revenues in 2020 of approximately $275 million and, including the net proceeds for the three hospital divestitures that preliminarily closed on December 31, 2020, we received total net proceeds of approximately $28 million in connection with the disposition of these hospitals.
During 2020, we completed the divestiture of 13 hospitals, including three which closed effective January 1, 2020 (for these hospitals, we received the net proceeds at a preliminary closing on December 31, 2019). These 13 hospitals represented annual net operating revenues in 2019 of approximately $1.2 billion and, including the net proceeds for the three hospitals that preliminarily closed on December 31, 2019, we received total net proceeds of approximately $845 million in connection with the disposition of these hospitals.
During 2019, we completed the divestiture of 12 hospitals, including two which closed effective January 1, 2019 (for these hospitals, we received the net proceeds at a preliminary closing on December 31, 2018), but not including the three hospitals noted above which closed on January 1, 2020. These 12 hospitals represented annual net operating revenues in 2018 of approximately $1.1 billion and, excluding the net proceeds for the two hospitals that preliminarily closed on December 31, 2018 and the three hospitals that preliminarily closed on December 31, 2019, we received total net proceeds of approximately $335 million in connection with the disposition of these hospitals.
53
The following table provides a summary of hospitals that we divested during the years ended December 31, 2021, 2020 and 2019:
|
Hospital |
|
Buyer |
|
City, State |
|
Licensed Beds |
|
|
Effective Date |
|
|
|
|
|
|
|
|
|
|
|
|
|
|
2021 Divestitures: |
|
|
|
|
|
|
|
|
|
|
|
|
|
|
|
|
|
|
|
|
|
|
|
Lea Regional Medical Center |
|
Covenant Health System |
|
Hobbs, NM |
|
84 |
|
|
January 1, 2021 |
|
|
Tennova Healthcare - Tullahoma |
|
Vanderbilt University Medical Center |
|
Tullahoma, TN |
|
135 |
|
|
January 1, 2021 |
|
|
Tennova Healthcare - Shelbyville |
|
Vanderbilt University Medical Center |
|
Shelbyville, TN |
|
60 |
|
|
January 1, 2021 |
|
|
Northwest Mississippi Medical Center |
|
Delta Health System |
|
Clarksdale, MS |
|
181 |
|
|
February 1, 2021 |
|
|
AllianceHealth Midwest |
|
SSM Health Care of Oklahoma, Inc. |
|
Midwest City, OK |
|
255 |
|
|
April 1, 2021 |
|
|
|
|
|
|
|
|
|
|
|
|
|
|
2020 Divestitures: |
|
|
|
|
|
|
|
|
|
|
|
|
|
|
|
|
|
|
|
|
|
|
|
Berwick Hospital Center |
|
Fayette Holdings, Inc. |
|
Berwick, PA |
|
|
90 |
|
|
December 1, 2020 |
|
Brownwood Regional Medical Center |
|
Hendrick Health System |
|
Brownwood, TX |
|
|
188 |
|
|
October 27, 2020 |
|
Abilene Regional Medical Center |
|
Hendrick Health System |
|
Abilene, TX |
|
|
231 |
|
|
October 27, 2020 |
|
San Angelo Community Medical Center |
|
Shannon Health System |
|
San Angelo, TX |
|
|
171 |
|
|
October 24, 2020 |
|
Bayfront Health St. Petersburg |
|
Orlando Health, Inc. |
|
St. Petersburg, FL |
|
|
480 |
|
|
October 1, 2020 |
|
Hill Regional Hospital |
|
AHRK Holdings, LLC |
|
Hillsboro, TX |
|
|
25 |
|
|
August 1, 2020 |
|
St. Cloud Regional Medical Center |
|
Orlando Health, Inc. |
|
St. Cloud, FL |
|
|
84 |
|
|
July 1, 2020 |
|
Northern Louisiana Medical Center |
|
Allegiance Health Management, Inc. |
|
Ruston, LA |
|
|
130 |
|
|
July 1, 2020 |
|
Shands Live Oak Regional Medical Center |
|
HCA |
|
Live Oak, FL |
|
|
25 |
|
|
May 1, 2020 |
|
Shands Starke Regional Medical Center |
|
HCA |
|
Starke, FL |
|
|
49 |
|
|
May 1, 2020 |
|
Southside Regional Medical Center |
|
Bon Secours Mercy Health System |
|
Petersburg, VA |
|
|
300 |
|
|
January 1, 2020 |
|
Southampton Memorial Hospital |
|
Bon Secours Mercy Health System |
|
Franklin, VA |
|
|
105 |
|
|
January 1, 2020 |
|
Southern Virginia Regional Medical Center |
|
Bon Secours Mercy Health System |
|
Emporia, VA |
|
|
80 |
|
|
January 1, 2020 |
|
|
|
|
|
|
|
|
|
|
|
|
|
2019 Divestitures: |
|
|
|
|
|
|
|
|
|
|
|
|
|
|
|
|
|
|
|
|
|
|
|
Bluefield Regional Medical Center |
|
Princeton Community Hospital Association |
|
Bluefield, WV |
|
|
92 |
|
|
October 1, 2019 |
|
Lake Wales Medical Center |
|
Adventist Health System |
|
Lake Wales, FL |
|
|
160 |
|
|
September 1, 2019 |
|
Heart of Florida Regional Medical Center |
|
Adventist Health System |
|
Davenport, FL |
|
|
193 |
|
|
September 1, 2019 |
|
College Station Medical Center |
|
St. Joseph Regional Health Center |
|
College Station, TX |
|
|
167 |
|
|
August 1, 2019 |
|
Tennova Healthcare - Lebanon |
|
Vanderbilt University Medical Center |
|
Lebanon, TN |
|
|
245 |
|
|
August 1, 2019 |
|
Chester Regional Medical Center |
|
Medical University Hospital Authority |
|
Chester, SC |
|
|
82 |
|
|
March 1, 2019 |
|
Carolinas Hospital System - Florence |
|
Medical University Hospital Authority |
|
Florence, SC |
|
|
396 |
|
|
March 1, 2019 |
|
Springs Memorial Hospital |
|
Medical University Hospital Authority |
|
Lancaster, SC |
|
|
225 |
|
|
March 1, 2019 |
|
Carolinas Hospital System - Marion |
|
Medical University Hospital Authority |
|
Mullins, SC |
|
|
124 |
|
|
March 1, 2019 |
|
Memorial Hospital of Salem County |
|
Community Healthcare Associates, LLC |
|
Salem, NJ |
|
|
126 |
|
|
January 31, 2019 |
|
Mary Black Health System - Spartanburg |
|
Spartanburg Regional Healthcare System |
|
Spartanburg, SC |
|
|
207 |
|
|
January 1, 2019 |
|
Mary Black Health System - Gaffney |
|
Spartanburg Regional Healthcare System |
|
Gaffney, SC |
|
|
125 |
|
|
January 1, 2019 |
On July 30, 2021, we sold our unconsolidated minority equity interests in Macon Healthcare, LLC, a joint venture with certain subsidiaries of HCA representing two hospitals in Macon, Georgia, in which we owned a 38% interest. We received $110 million in cash in connection with the sale of these equity interests and recognized a pre-tax gain of approximately $39 million on the sale of our investments in unconsolidated affiliates during the year ended December 31, 2021.
Effective September 30, 2020, one or more affiliates of the Company finalized an agreement to terminate the lease and cease operations of Shands Lake Shore Regional Medical Center (99 licensed beds) in Lake City, Florida, including transferring leased assets back to the landlord, the Lake Shore Hospital Authority. We recorded an impairment charge of approximately $3 million during the year ended December 31, 2020 in conjunction with exiting the lease to operate this hospital.
On November 30, 2020, we completed the sale of 50% ownership interest in Merit Health Biloxi (153 licensed beds) and its associated healthcare businesses in Biloxi, Mississippi to Memorial Properties, Inc., an affiliate of Memorial Hospital of Gulfport pursuant to the terms of a definitive agreement which was entered into October 12, 2020. Merit Health Biloxi and its associated healthcare businesses remain consolidated entities of the Company.
During the year ended December 31, 2021, we paid approximately $3 million to acquire the operating assets and related businesses of certain physician practices, clinics and other ancillary businesses that operate within the communities served by our hospitals. We allocated the purchase price to property and equipment, working capital and goodwill.
54
Overview of Operating Results
Our net operating revenues for the year ended December 31, 2021 increased $579 million to approximately $12.4 billion compared to approximately $11.8 billion for the year ended December 31, 2020. On a same-store basis, net operating revenues for the year ended December 31, 2021 increased $1.4 billion.
We had net income of $368 million during the year ended December 31, 2021, compared to net income of $607 million for the year ended December 31, 2020. Net income for the year ended December 31, 2021 included the following:
|
|
• |
an after-tax charge of $116 million for loss from early extinguishment of debt, |
|
|
• |
an after-tax charge of $19 million for the impairment of long-lived assets of divested businesses based on their estimated fair values, net of gains recognized upon the sale of certain businesses, |
|
|
• |
an after-tax benefit of $31 million for gain on the sale of investments in unconsolidated affiliates, and |
|
|
• |
an after-tax benefit of $15 million related to the settlement of professional liability claims for which the third-party insurer’s obligation to insure us for the underlying loss has been settled. |
Net income for the year ended December 31, 2020 included the following:
|
|
• |
an after-tax benefit of less than $1 million for government and other legal settlements and related costs, |
|
|
• |
an after-tax benefit of $352 million for gain from early extinguishment of debt, |
|
|
• |
an after-tax charge of $81 million for the impairment of goodwill and long-lived assets of hospitals sold or held for sale based on their estimated fair values, net of gains/losses recognized upon the sale of certain facilities, |
|
|
• |
an after-tax charge of $39 million for the settlement of professional liability claims for which the third-party insurers obligation to insure us for the underlying loss was being litigated, |
|
|
• |
an after-tax charge of $13 million for employee termination benefits and other restructuring costs, |
|
|
• |
an after-tax charge of $1 million for legal expenses related to the settlement of the HMA Legal Matters, and |
|
|
• |
income of approximately $240 million due to discrete tax benefits related to the release of federal and state valuation allowances on IRC Section 163(j) interest carryforwards as a result of an increase to the deductible interest expense allowed for 2019 and 2020 under the CARES Act that was enacted during the year ended December 31, 2020. |
Consolidated inpatient admissions for the year ended December 31, 2021, decreased 5.9%, compared to the year ended December 31, 2020, and consolidated adjusted admissions for the year ended December 31, 2021, decreased 2.3%, compared to the year ended December 31, 2020. Same-store inpatient admissions for the year ended December 31, 2021, increased 2.2%, compared to the year ended December 31, 2020, and same-store adjusted admissions for the year ended December 31, 2021, increased 5.9%, compared to the year ended December 31, 2020.
Self-pay revenues represented approximately 0.9% and (0.2)% of net operating revenues for the years ended December 31, 2021 and 2020, respectively. The amount of foregone revenue related to providing charity care services as a percentage of net operating revenues was approximately 8.9% for both years ended December 31, 2021 and 2020. Direct and indirect costs incurred in providing charity care services as a percentage of net operating revenues was approximately 1.0% for both years ended December 31, 2021 and 2020.
Overview of Legislative Developments
The U.S. Congress and certain state legislatures have introduced and passed a large number of proposals and legislation designed to make major changes in the healthcare system, including changes that have impacted access to health insurance. The most prominent of these efforts, the Affordable Care Act, affects how healthcare services are covered, delivered and reimbursed. The Affordable Care Act increased health insurance coverage through a combination of public program expansion and private sector health insurance reforms. The Affordable Care Act also made a number of changes to Medicare and Medicaid reimbursement, such as a productivity offset to the Medicare market basket update and reductions to the Medicare and Medicaid DSH payments. However, reductions to Medicaid DSH payments have been delayed by the CAA through 2023 (to begin in federal fiscal year 2024).
The Affordable Care Act has been subject to legislative and regulatory changes and court challenges. For example, effective January 1, 2019, the financial penalty associated with the mandate that most individuals enroll in a health insurance plan was effectively eliminated. This change resulted in legal challenges to the constitutionality of the individual mandate and validity of the Affordable Care Act as a whole. However, in June 2021, the U.S. Supreme Court determined that the plaintiffs lacked standing,
55
allowing the law to remain in place. Nonetheless, the elimination of the individual mandate penalty and other changes may impact the number of individuals that elect to obtain public or private health insurance or the scope of such coverage, if purchased. Some states have imposed individual health insurance mandates, and other states have explored or offer public health insurance options.
The current presidential administration has indicated that it generally intends to protect and strengthen the Affordable Care Act and Medicaid programs. For example, in January 2021, President Biden issued an executive order that instructed certain governmental agencies to review and reconsider their existing policies and rules that limit access to health insurance coverage. In a final rule published in September 2021, HHS extended the annual open enrollment period for coverage through federal marketplaces and granted state exchanges flexibility to lengthen their open enrollment periods.
Of critical importance to us is the potential impact of any changes specific to the Medicaid program, including the funding and expansion provisions of the Affordable Care Act and subsequent legislation or agency initiatives. Historically, the states with the greatest reductions in the number of uninsured adult residents have expanded Medicaid. A number of states have opted out of the Medicaid coverage expansion provisions, but could ultimately decide to expand their programs at a later date. Of the 16 states in which we operated hospitals as of December 31, 2021, nine states have taken action to expand their Medicaid programs. At this time, the other seven states have not, including Florida, Alabama, Tennessee, Mississippi and Texas, where we operated a significant number of hospitals as of December 31, 2021. Some states use, or have applied to use, waivers granted by CMS to implement expansion, impose different eligibility or enrollment conditions, or otherwise implement programs that vary from federal standards.
There is uncertainty regarding the ongoing net effect of the Affordable Care Act due to the potential for continued changes to the law’s implementation and its interpretation by government agencies and courts. There is also uncertainty regarding the potential impact of other health reform efforts at the federal and state levels. Some reforms may have a positive impact on our business, while others may increase our operating costs, adversely impact the reimbursement we receive, or require us to modify certain aspects of our operations. For example, some members of Congress have proposed measures that would expand government-sponsored health insurance coverage, including single-payor models, and some states have implemented or are considering public health insurance options. Legislative and executive branch efforts related to healthcare reform could result in increased prices for consumers purchasing health insurance coverage or destabilize insurance markets, among other effects. Some current initiatives, requirements and proposals, including those aimed at price transparency and out-of-network charges, may impact prices, our competitive position and the relationships between hospitals, insurers and patients. For example, the No Surprises Act requires providers to send an insured patient’s health plan a good faith estimate of expected charges, including billing and diagnostic codes, prior to when the patient is scheduled to receive the item or service. HHS is deferring enforcement of this requirement until it issues additional regulations.
In recent years, a number of laws, including the Affordable Care Act and MACRA, have promoted shifting from traditional fee-for-service reimbursement models to alternative payment models that tie reimbursement to quality and cost of care. For example, CMS currently administers various accountable care organizations and bundled payment demonstration projects. In October 2021, the CMS Innovation Center published an outline of its strategy for the next decade, noting the need to accelerate the movement to value-based care and drive broader system transformation. However, the COVID-19 pandemic may impact provider performance and data reporting under value-based care initiatives. CMS has temporarily modified requirements of certain programs by, for example, implementing special scoring and payment policies intended to mitigate negative impacts of the public health emergency on hospitals participating in the Hospital Value-Based Purchasing Program and similar programs.
In response to the COVID-19 pandemic, federal and state governments have passed legislation, promulgated regulations, and taken other administrative actions intended to assist healthcare providers in providing care to COVID-19 and other patients during the public health emergency and to provide financial relief. These measures include temporary relief from Medicare conditions of participation requirements for healthcare providers, temporary relaxation of licensure requirements for healthcare professionals, temporary relaxation of privacy restrictions for telehealth remote communications, promoting use of telehealth by temporarily expanding the scope of services for which Medicare reimbursement is available, and limited waivers of fraud and abuse laws for activities related to COVID-19 during the public health emergency period.
Primary legislative sources of COVID-19 relief include the CARES Act, the PPPHCE Act, the CAA, and the ARPA. Together, these stimulus laws authorize over $186 billion in funding to be distributed through the PHSSEF to eligible providers, including public entities and Medicare- and/or Medicaid-enrolled providers. PHSSEF payments are intended to compensate healthcare providers for lost revenues and incremental expenses incurred in response to the COVID-19 pandemic and are not required to be repaid, provided that recipients attest to and comply with certain terms and conditions, including limitations on balance billing, not using PHSSEF funds to reimburse expenses or losses that other sources have been or are obligated to reimburse and audit and reporting requirements.
In addition, the CARES Act expanded the Medicare Accelerated and Advance Payment Program to increase cash flow to providers impacted by the COVID-19 pandemic. Inpatient acute care hospitals were able to request accelerated payment of up to 100% of their Medicare payment amount for a six-month period. The Medicare Accelerated and Advanced Payment Program payments are advances
56
that providers must repay. Providers are required to repay accelerated payments beginning one year after the payment was issued. After such one-year period, Medicare payments owed to providers will be recouped according to the repayment terms.
The CARES Act and related legislation include other provisions offering financial relief, for example suspending the Medicare sequestration payment adjustment from May 1, 2020 through December 31, 2021, which would have otherwise reduced payments to Medicare providers by 2% as required by the Budget Control Act of 2011 (but also extending sequestration through 2030). Congress further delayed these sequestration cuts through March 31, 2022, and reduced the sequestration adjustment to 1% from April 1 through June 30, 2022, but increased the reductions set for 2030. The CARES Act and related legislation also delay scheduled reductions to Medicaid DSH payments, provide a 20% add-on to the inpatient PPS DRG rate for COVID-19 patients for the duration of the public health emergency, and permit the deferral of payment of the employer portion of social security taxes between March 27, 2020 and December 31, 2020, with 50% of the deferred amount due December 31, 2021 and the remaining 50% due December 31, 2022. However, in addition to providing funding for healthcare providers, the ARPA increased the federal budget deficit in a manner that triggers an additional statutorily mandated sequestration under the PAYGO Act. As a result, an additional Medicare spending reduction of up to 4% was required to take effect in January 2022. However, Congress has delayed implementation of this payment reduction until 2023.
Through December 31, 2021, net of amounts that have been repaid to the respective federal, state, and local agency, we received approximately $763 million in payments through the PHSSEF and various state and local programs on a cumulative basis since their enactment. Of the net amount received to-date, approximately $705 million was received during the year ended December 31, 2020 and the remainder was received during the year ended December 31, 2021.
The estimate of the amount of payments received through the PHSSEF or state and local programs for which we are reasonably assured of meeting the underlying terms and conditions is updated each reporting period and is based on, among other things, the CARES Act and subsequent relief legislation, various Post-Payment Notice of Reporting Requirements issued by HHS during the period, responses to all applicable frequently asked questions and other interpretative guidance as published by HHS, expenses incurred attributable to coronavirus, our results of operations during such period as compared to our 2020 budget and the allocation of general and targeted fund distribution payments among subsidiaries during such period. The PHSSEF and state and local program payments recognized to-date did not impact net operating revenues, and had a positive impact on net income attributable to Community Health Systems, Inc. stockholders during the year ended December 31, 2021, in the amount of $107 million. Amounts received through the PHSSEF or state and local programs that have not yet been recognized or otherwise have not been refunded to HHS are included within accrued liabilities-other in the consolidated balance sheets, and such unrecognized amounts may be returned to HHS or the respective state or local agency, as applicable, or may be recognized in future periods if the underlying conditions for recognition are reasonably assured of being met.
HHS’ interpretation of the underlying terms and conditions of such PHSSEF payments, including auditing and reporting requirements, continues to evolve. In June 2021, HHS issued guidance that set forth deadlines for using and reporting on the use of PHSSEF funds, depending on the dates on which the funds were received. Additional guidance or new and amended interpretations of existing guidance on the terms and conditions of such PHSSEF payments may result in changes in our estimate of amounts for which the terms and conditions are reasonably assured of being met, and any such changes may be material. Additionally, any such changes may result in our inability to recognize additional PHSSEF payments or may result in the derecognition of amounts previously recognized, which (in any such case) may be material. In addition, to the extent that any unrecognized PHSSEF payments that have been or may be received by us do not qualify for reimbursement based on future operations, we may be required to return such unrecognized payments to HHS.
With respect to the Medicare Accelerated and Advanced Payment Program, we received Medicare accelerated payments of approximately $1.2 billion in April 2020. No additional Medicare accelerated payments have been received by us since such time and because CMS is no longer accepting new applications for accelerated payments, we do not expect to receive additional Medicare accelerated payments. CMS began recouping Medicare accelerated payments in April 2021. As of December 31, 2021, all Medicare accelerated payments received by us have been recouped or repaid to CMS or assumed by buyers related to hospitals we divested. Approximately $1.1 billion and $77 million of Medicare accelerated payments were recouped or repaid to CMS or assumed by buyers related to hospitals we divested during the years ended December 31, 2021 and 2020, respectively.
There is still a high degree of uncertainty surrounding the implementation of the CARES Act and other stimulus legislation passed in response to the COVID-19 pandemic. In addition, the public health emergency continues to evolve. Some of the measures allowing for flexibility in delivery of care and various financial supports for healthcare providers are available only for the duration of the public health emergency, and it is unclear whether or for how long the public health emergency declaration will be extended. The current declaration expires April 16, 2022. The HHS Secretary may choose to renew the declaration for successive 90-day periods for as long as the emergency continues to exist and may terminate the declaration whenever he determines that the public health emergency no longer exists, but has indicated that HHS will provide states with 60 days’ notice prior to termination of the declaration. The federal government may consider additional stimulus and relief efforts, but we are unable to predict whether additional stimulus
57
measures will be enacted or their impact on us. There can be no assurance as to the total amount of financial and other types of assistance that we will receive under the CARES Act, other enacted stimulus legislation, or future measures, if any, and it is difficult to predict the impact of such measures on our operations or how they will affect operations of our competitors. Further, there can be no assurance that the terms of provider relief funding or other programs will not change or be interpreted in ways that affect our funding or eligibility to participate or our ability to comply with applicable requirements and retain amounts received. We continue to assess the potential impact of the CARES Act and other enacted stimulus legislation, the potential impact of future stimulus measures, if any, and the impact of other laws, regulations, and guidance related to COVID-19 on our business, results of operations, financial condition and cash flows.
CMS issued an interim final rule in November 2021 that will require COVID-19 vaccinations in most Medicare and Medicaid certified providers and suppliers, including our hospitals. The rule applies to all staff, including clinical staff, individuals providing services under arrangements, volunteers, and staff who are not involved in direct patient care, subject to approved religious and medical exemptions. On January 13, 2022, the U.S. Supreme Court granted the U.S. government’s request for a stay of lower court injunctions of the CMS regulation, finding that the CMS rule fell within the authority granted to the HHS Secretary by Congress with respect to imposing conditions on the receipt of Medicaid and Medicare funds. Additionally, some states have implemented, or may implement in the future, vaccine mandates with respect to healthcare personnel. It is currently not possible to predict the impact that vaccine mandates (including with respect to the CMS rule noted above) may have on us. However, these vaccine mandates could result in employee attrition and the loss of personnel who are unvaccinated, which could adversely affect our business and results of operations.
In June 2019, the U.S. Supreme Court ruled in Azar v. Allina Health Services that HHS failed to comply with statutory notice and comment rulemaking procedures before announcing an earlier policy related to DSH payments made under Medicare to hospitals. In response to this adverse ruling, CMS proposed a new rule in August 2020 in an attempt to retroactively cure the underlying procedural errors cited by the U.S. Supreme Court as the basis in their decision. CMS’s action has introduced uncertainty regarding the potential outcomes from the Supreme Court ruling, and the proposed rule has resulted in further litigation. If HHS or CMS are unsuccessful in their attempt to assert the proposed rule or another legal basis for their policy, one potential outcome is the federal government could be required to reimburse hospitals, including our affiliated hospitals, for Medicare DSH payments which otherwise would have been payable over certain prior time periods absent the enactment of this policy. While the ruling in Allina was specific to the DSH payments calculated for federal fiscal year 2012 for the plaintiff hospitals, we believe that, because of the precedent of this ruling, prior time periods with the potential for higher DSH payments, including federal fiscal years 2005 to 2013, could be impacted. There continues to be uncertainty regarding the extent to which, if any, Medicare DSH payments will be remitted to our affiliated hospitals as the result of Allina and subsequent litigation, and, if so, the timing of any such payments. Litigants in lawsuits challenging the proposed rule are seeking such relief. We anticipate that if it is ultimately determined that our affiliated hospitals are entitled to receive such Medicare DSH payments for these prior time periods, these payments could have a material positive impact on a non-recurring basis in any future period in which net income is recognized in respect thereof as well as on our cash flows from operations in any future period in which these payments are received.
As a result of our current levels of cash, funds we have received and may in the future receive under the CARES Act, other enacted stimulus legislation and any future stimulus measures, available borrowing capacity, long-term outlook on our debt repayments, the refinancing of certain of our notes, proceeds from the sale of hospitals and the continued projection of our ability to generate cash flows, we anticipate that we will be able to invest the necessary capital in our business over the next twelve months and for the foreseeable future thereafter. We believe there continues to be ample opportunity to strengthen our market share in substantially all of our markets by decreasing the need for patients to travel outside their communities for healthcare. Furthermore, we will continue to strive to improve operating efficiencies and procedures in order to improve the performance of our hospitals.
Sources of Revenue
The following table presents the approximate percentages of net operating revenues by payor source for the periods indicated. The data for the periods presented are not strictly comparable due to the effect that hospital acquisitions and divestitures have had on these statistics.
|
|
|
Year Ended December 31, |
|
|||||||||
|
|
|
2021 |
|
|
2020 |
|
|
2019 |
|
|||
|
Medicare |
|
|
21.4 |
% |
|
|
23.9 |
% |
|
|
25.2 |
% |
|
Medicaid |
|
|
13.5 |
|
|
|
13.4 |
|
|
|
13.2 |
|
|
Managed Care and other third-party payors |
|
|
64.2 |
|
|
|
62.9 |
|
|
|
60.6 |
|
|
Self-pay |
|
|
0.9 |
|
|
|
(0.2 |
) |
|
|
1.0 |
|
|
Total |
|
|
100.0 |
% |
|
|
100.0 |
% |
|
|
100.0 |
% |
58
As shown above, we receive a substantial portion of our revenues from the Medicare and Medicaid programs. Included in Managed Care and other third-party payors is operating revenues from insurance companies with which we have insurance provider contracts, Medicare managed care, insurance companies for which we do not have insurance provider contracts, workers’ compensation carriers and non-patient service revenue, such as rental income and cafeteria sales. In the future, we generally expect the portion of revenues received from the Medicare and Medicaid programs to increase over the long-term due to the general aging of the population and other factors, including health reform initiatives. There has been a trend toward increased enrollment in Medicare and Medicaid managed care, which may adversely affect our operating revenue. We may also be impacted by regulatory requirements imposed on insurers, such as minimum medical-loss ratios and specific benefit requirements. Furthermore, in the normal course of business, managed care programs, insurance companies and employers actively negotiate the amounts paid to hospitals. Our relationships with payors may be impacted by price transparency initiatives and out-of-network billing restrictions, including those in the No Surprises Act, which took effect January 1, 2022. There can be no assurance that we will retain our existing reimbursement arrangements or that third-party payors will not attempt to further reduce the rates they pay for our services.
Net operating revenues include amounts estimated by management to be reimbursable by Medicare and Medicaid under prospective payment systems and provisions of cost-based reimbursement and other payment methods. In addition, we are reimbursed by non-governmental payors using a variety of payment methodologies. Amounts we receive for the treatment of patients covered by Medicare, Medicaid and non-governmental payors are generally less than our standard billing rates. We account for the differences between the estimated program reimbursement rates and our standard billing rates as contractual allowance adjustments, which we deduct from gross revenues to arrive at net operating revenues. Final settlements under some of these programs are subject to adjustment based on administrative review and audit by third parties. We account for adjustments to previous program reimbursement estimates as contractual allowance adjustments and report them in the periods that such adjustments become known. Contractual allowance adjustments related to final settlements and previous program reimbursement estimates impacted net operating revenues and net income (loss) by an insignificant amount in each of the years ended December 31, 2021, 2020 and 2019.
The payment rates under the Medicare program for hospital inpatient and outpatient acute care services are based on prospective payment systems, which depend upon a patient’s diagnosis or the clinical complexity of services provided to a patient, among other factors. These rates are indexed for inflation annually, although increases have historically been less than actual inflation. On August 13, 2021, CMS published the final rule to increase this index by 2.7% for hospital inpatient acute care services that are reimbursed under the prospective payment system for federal fiscal year 2022 (which began October 1, 2021). Together with other changes to payment policies, payment rates for hospital inpatient acute care services are expected to increase approximately 2.5%. Hospitals that do not submit required patient quality data are subject to a reduction in payments. We are complying with this data submission requirement. Payments may also be affected by various other adjustments, including those that depend on patient-specific or hospital specific factors. For example, the “two midnight rule” establishes admission and medical review criteria for inpatient services limiting when services to Medicare beneficiaries are payable as inpatient hospital services. Reductions in the rate of increase or overall reductions in Medicare reimbursement may cause a decline in the growth of our net operating revenues.
Payment rates under the Medicaid program vary by state. In addition to the base payment rates for specific claims for services rendered to Medicaid enrollees, several states utilize supplemental reimbursement programs to make separate payments that are not specifically tied to an individual’s care, some of which offset a portion of the cost of providing care to Medicaid and indigent patients. These programs are designed with input from CMS and are funded with a combination of state and federal resources, including, in certain instances, fees or taxes levied on the providers. The programs are generally authorized for a specified period of time and require CMS’s approval to be extended. We are unable to predict whether or on what terms CMS will extend the supplemental programs in the states in which we operate. Under these supplemental programs, we recognize revenue and related expenses in the period in which amounts are estimable and payment is reasonably assured. Reimbursement under these programs is reflected in net operating revenues and included as Medicaid revenue in the table above, and fees, taxes or other program related costs are reflected in other operating expenses.
Results of Operations
Our hospitals offer a variety of services involving a broad range of inpatient and outpatient medical and surgical services. These include general acute care, emergency room, general and specialty surgery, critical care, internal medicine, obstetrics, diagnostic services, psychiatric and rehabilitation services. Historically, the strongest demand for hospital services generally occurs during January through April and the weakest demand for these services generally occurs during the summer months. Accordingly, eliminating the effects of new acquisitions and/or divestitures, our net operating revenues and earnings are historically highest during the first quarter and lowest during the third quarter. As previously noted, the COVID-19 pandemic has disrupted the pattern of demand for services we provide.
59
The following tables summarize, for the periods indicated, selected operating data.
|
|
|
Year Ended December 31, |
|
|||||||||
|
|
|
2021 |
|
|
2020 |
|
|
2019 |
|
|||
|
Operating results, as a percentage of net operating revenues: |
|
|
|
|
|
|
|
|
|
|
|
|
|
Net operating revenues |
|
|
100.0 |
% |
|
|
100.0 |
% |
|
|
100.0 |
% |
|
Operating expenses (a) |
|
|
(84.1 |
) |
|
|
(85.3 |
) |
|
|
(89.5 |
) |
|
Depreciation and amortization |
|
|
(4.4 |
) |
|
|
(4.7 |
) |
|
|
(4.6 |
) |
|
Impairment and gain (loss) on sale of businesses, net |
|
|
(0.2 |
) |
|
|
(0.4 |
) |
|
|
(1.0 |
) |
|
Income from operations |
|
|
11.3 |
|
|
|
9.6 |
|
|
|
4.9 |
|
|
Interest expense, net |
|
|
(7.2 |
) |
|
|
(8.7 |
) |
|
|
(7.9 |
) |
|
(Loss) gain from early extinguishment of debt |
|
|
(0.6 |
) |
|
|
2.6 |
|
|
|
(0.4 |
) |
|
Gain on sale of equity interests in Macon Healthcare, LLC |
|
|
0.3 |
|
|
|
— |
|
|
|
— |
|
|
Equity in earnings of unconsolidated affiliates |
|
|
0.2 |
|
|
|
0.1 |
|
|
|
0.1 |
|
|
Income (loss) before income taxes |
|
|
4.0 |
|
|
|
3.6 |
|
|
|
(3.3 |
) |
|
(Provision for) benefit from income taxes |
|
|
(1.0 |
) |
|
|
1.5 |
|
|
|
(1.2 |
) |
|
Net income (loss) |
|
|
3.0 |
|
|
|
5.1 |
|
|
|
(4.5 |
) |
|
Less: Net income attributable to noncontrolling interests |
|
|
(1.1 |
) |
|
|
(0.8 |
) |
|
|
(0.6 |
) |
|
Net income (loss) attributable to Community Health Systems, |
|
|
|
|
|
|
|
|
|
|
|
|
|
Inc. stockholders |
|
|
1.9 |
% |
|
|
4.3 |
% |
|
|
(5.1 |
)% |
|
|
|
Year Ended December 31, |
|
|||||
|
|
|
2021 |
|
|
2020 |
|
||
|
Percentage increase (decrease) from prior year: |
|
|
|
|
|
|
|
|
|
Net operating revenues |
|
|
4.9 |
% |
|
|
(10.8 |
)% |
|
Admissions (b) |
|
|
(5.9 |
) |
|
|
(15.7 |
) |
|
Adjusted admissions (c) |
|
|
(2.3 |
) |
|
|
(19.4 |
) |
|
Average length of stay (d) |
|
|
6.4 |
|
|
|
6.8 |
|
|
Net income (loss) attributable to Community Health Systems, Inc. stockholders |
|
|
(55.0 |
) |
|
|
175.7 |
|
|
Same-store percentage increase (decrease) from prior year (e): |
|
|
|
|
|
|
|
|
|
Net operating revenues |
|
|
12.5 |
% |
|
|
(3.4 |
)% |
|
Admissions (b) |
|
|
2.2 |
|
|
|
(8.0 |
) |
|
Adjusted admissions (c) |
|
|
5.9 |
|
|
|
(12.5 |
) |
|
(a) |
Operating expenses include salaries and benefits, supplies, other operating expenses, government and other legal settlements and related costs, lease cost and rent, net of the reduction in operating expenses in 2021 and 2020, resulting from the recognition of pandemic relief funds. |
|
(b) |
Admissions represents the number of patients admitted for inpatient treatment. |
|
(c) |
Adjusted admissions is a general measure of combined inpatient and outpatient volume. We computed adjusted admissions by multiplying admissions by gross patient revenues and then dividing that number by gross inpatient revenues. |
|
(d) |
Average length of stay represents the average number of days inpatients stay in our hospitals. |
|
(e) |
Includes acquired hospitals to the extent we operated them in both periods and excludes information for businesses sold or closed during the periods presented. |
Items (b) – (e) are metrics used to manage our performance. These metrics provide useful insight to investors about the volume and acuity of services we provide, which aid in evaluating our financial results.
Year Ended December 31, 2021 Compared to Year Ended December 31, 2020
Net operating revenues increased by 4.9% to approximately $12.4 billion for the year ended December 31, 2021, from approximately $11.8 billion for the year ended December 31, 2020. Net operating revenues on a same-store basis from hospitals that were operated throughout both periods increased $1.4 billion, or 12.5%, during the year ended December 31, 2021, as compared to the year ended December 31, 2020. The increase in same-store net operating revenues was primarily due to increased volumes and higher acuity during 2021. Non-same-store net operating revenues decreased $794 million during the year ended December 31, 2021, in
60
comparison to the prior year period, with the decrease attributable primarily to the divestiture of hospitals during 2020 and 2021. On a consolidated basis, inpatient admissions decreased by 5.9% during the year ended December 31, 2021 as compared to the year ended December 31, 2020. Also on a consolidated basis, adjusted admissions decreased by 2.3% during the year ended December 31, 2021 as compared to the year ended December 31, 2020. On a same-store basis, net operating revenues per adjusted admission increased 6.3%, while inpatient admissions increased by 2.2% and adjusted admissions increased by 5.9% for the year ended December 31, 2021, compared to the year ended December 31, 2020.
All operating expense calculations, as a percentage of net operating revenues, were impacted by the net effect of divestitures and the aforementioned increase in same-store net operating revenues. Operating costs and expenses, as a percentage of net operating revenues, decreased from 90.4% during the year ended December 31, 2020 to 88.7% during the year ended December 31, 2021. Operating costs and expenses, excluding depreciation and amortization and impairment and (gain) loss on sale of businesses, as a percentage of net operating revenues, decreased from 85.3% for the year ended December 31, 2020 to 84.1% for the year ended December 31, 2021. Salaries and benefits decreased as a percentage of net operating revenues from 45.9% for the year ended December 31, 2020 to 42.4% for the year ended December 31, 2021. Supplies, as a percentage of net operating revenues, decreased from 16.6% for the year ended December 31, 2020 to 16.5% for the year ended December 31, 2021. Other operating expenses, as a percentage of net operating revenues, decreased from 25.1% for the year ended December 31, 2020 to 23.9% for the year ended December 31, 2021. Lease cost and rent, as a percentage of net operating revenues, decreased from 2.8% for the year ended December 31, 2020 to 2.5% for the year ended December 31, 2021. Pandemic relief funds, as a percentage of net operating revenues, were (1.2)% for the year ended December 31, 2021, compared to (5.1)% for the year ended December 31, 2020. The decreases in salaries and benefits, supplies and lease cost and rent, as a percentage of net operating revenues, during the year ended December 31, 2021 compared to December 31, 2020 is primarily due to the impact of the COVID-19 pandemic on net operating revenues in 2020.
Depreciation and amortization, as a percentage of net operating revenues, decreased to 4.4% for the year ended December 31, 2021 from 4.7% for the year ended December 31, 2020, primarily due to a decrease in net operating revenues as a result of the COVID-19 pandemic in 2020.
Impairment and (gain) loss on sale of businesses was $24 million for the year ended December 31, 2021, compared to $48 million for the year ended December 31, 2020, related to impairment of the long-lived assets and reporting unit goodwill allocated to hospitals classified as held for sale or sold during the respective periods.
Interest expense, net, decreased by $146 million to $885 million for the year ended December 31, 2021 compared to $1.031 billion for the year ended December 31, 2020. This was primarily due to our debt refinancing activity during the years ended December 31, 2021 and 2020 as discussed further in Capital Resources.
Loss from early extinguishment of debt of $79 million was recognized during the year ended December 31, 2021, as a result of the refinancing of certain of our outstanding notes as discussed further in Capital Resources. Gain from early extinguishment of debt of $317 million was recognized during the year ended December 31, 2020, as a result of various financing activities.
Equity in earnings of unconsolidated affiliates, as a percentage of net operating revenues, increased to (0.2)% for the year ended December 31, 2021 from (0.1)% for the year ended December 31, 2020.
The net results of the above-mentioned changes resulted in income before income taxes increasing $77 million to $499 million for the year ended December 31, 2021 from $422 million for the year ended December 31, 2020.
Our provision for income taxes for the year ended December 31, 2021 was $131 million compared to a benefit from income taxes of $185 million for the year ended December 31, 2020. Our effective tax rates were 26.3% and (43.8)% for the years ended December 31, 2021 and 2020, respectively. The difference in our effective tax rate for the year ended December 31, 2021, when compared to the year ended December 31, 2020, was primarily due to a decrease in the valuation allowance in 2020 as a result of an increase to the deductible interest expense allowed for 2019 and 2020 under the CARES Act; the CARES Act related benefits for deductibility of interest recognized in 2020 did not reoccur in 2021.
Net income, as a percentage of net operating revenues, was 3.0% for the year ended December 31, 2021 compared to 5.1% for the year ended December 31, 2020.
Net income attributable to noncontrolling interests, as a percentage of net operating revenues, increased to 1.1% for the year ended December 31, 2021 from 0.8% for the year ended December 31, 2020.
Net income attributable to Community Health Systems, Inc. was $230 million for the year ended December 31, 2021, compared to $511 million for the year ended December 31, 2020.
61
Year Ended December 31, 2020 Compared to Year Ended December 31, 2019
Net operating revenues decreased by 10.8% to approximately $11.8 billion for the year ended December 31, 2020, from approximately $13.2 billion for the year ended December 31, 2019. Net operating revenues on a same-store basis from hospitals that were operated throughout both periods decreased $396 million, or 3.4%, during the year ended December 31, 2020, as compared to the year ended December 31, 2019. The decrease in same-store net operating revenues was primarily due to a decline in volumes resulting from the COVID-19 pandemic which was offset, in part, by COVID-19 induced changes in the mix of services provided and payor mix. Non-same-store net operating revenues decreased $1.0 billion during the year ended December 31, 2020, in comparison to the prior year period, with the decrease attributable primarily to the impact of the COVID-19 pandemic as well as the divestiture of hospitals during 2019 and 2020. On a consolidated basis, inpatient admissions decreased by 15.7% during the year ended December 31, 2020 as compared to the year ended December 31, 2019. Also on a consolidated basis, adjusted admissions decreased by 19.4% during the year ended December 31, 2020 as compared to the year ended December 31, 2019. On a same-store basis, net operating revenues per adjusted admission increased 10.4%, while inpatient admissions decreased by 8.0% and adjusted admissions decreased by 12.5% for the year ended December 31, 2020, compared to the year ended December 31, 2019.
Operating costs and expenses, as a percentage of net operating revenues, decreased from 95.1% during the year ended December 31, 2019 to 90.4% during the year ended December 31, 2020. Operating costs and expenses, excluding depreciation and amortization and impairment and (gain) loss on sale of businesses, as a percentage of net operating revenues, decreased from 89.5% for the year ended December 31, 2019 to 85.3% for the year ended December 31, 2020 due to the recognition of approximately $601 million of PHSSEF payments as a reduction of operating costs and expenses during the year ended December 31, 2020. Salaries and benefits increased as a percentage of net operating revenues from 45.0% for the year ended December 31, 2019 to 45.9% for the year ended December 31, 2020. Supplies, as a percentage of net operating revenues, increased from 16.3% for the year ended December 31, 2019 to 16.6% for the year ended December 31, 2020. Other operating expenses, as a percentage of net operating revenues, remained consistent at 25.1% for both of the years ended December 31, 2020 and 2019. Expense related to government and other legal settlements and related costs, as a percentage of net operating revenues, decreased from 0.7% for the year ended December 31, 2019 to income of less than 0.1% for the year ended December 31, 2020 primarily due to the net impact of several lawsuits settled in principle in 2019 and related legal expenses. Lease cost and rent, as a percentage of net operating revenues, increased from 2.4% for the year ended December 31, 2019 to 2.8% for the year ended December 31, 2020. The increases in salaries and benefits, supplies and lease cost and rent, as a percentage of net operating revenues, during the year ended December 31, 2020 compared to December 31, 2019 was primarily due to the impact of the COVID-19 pandemic.
Depreciation and amortization, as a percentage of net operating revenues, increased to 4.7% for the year ended December 31, 2020 from 4.6% for the year ended December 31, 2019, primarily due to a decrease in net operating revenues as a result of the COVID-19 pandemic in 2020.
Impairment and (gain) loss on sale of businesses was $48 million for the year ended December 31, 2020, compared to $138 million for the year ended December 31, 2019. For the year ended December 31, 2020, gains on facilities sold on January 1, 2020 and July 1, 2020 were offset by impairment of facilities held-for-sale or for which we were in discussions with potential buyers for the divestiture of a facility at a sales price that indicates a fair value below carrying value. The impairment and net loss on facilities during the year ended December 31, 2019 relates to impairment of the long-lived assets and reporting unit goodwill allocated to hospitals sold during the period partly offset by gains on the sale of facilities during the six months ended December 31, 2019.
Interest expense, net, decreased by $10 million to $1.031 billion for the year ended December 31, 2020 compared to $1.041 billion for the year ended December 31, 2019. This was primarily due to our debt refinancing activity during the year ended December 31, 2020 as discussed further in Capital Resources.
Gain from early extinguishment of debt of $317 million was recognized during the year ended December 31, 2020, as a result of various financing activities discussed below. Loss from early extinguishment of debt of $54 million was recognized during the year ended December 31, 2019, as a result of financing transactions during the period.
Equity in earnings of unconsolidated affiliates, as a percentage of net operating revenues, remained consistent at (0.1)% for both of the years ended December 31, 2020 and 2019.
The net results of the above-mentioned changes resulted in income (loss) before income taxes increasing $852 million to income of $422 million for the year ended December 31, 2020 from a loss of $430 million for the year ended December 31, 2019.
Our benefit from income taxes for the year ended December 31, 2020 was $185 million compared to a provision for income taxes of $160 million for the year ended December 31, 2019. Our effective tax rates were (43.8)% and (37.2)% for the years ended December 31, 2020 and 2019, respectively. The difference in our effective tax rate for the year ended December 31, 2020, when compared to the year ended December 31, 2019, was primarily due to a decrease in the valuation allowance recognized on IRC
62
Section 163(j) interest carryforwards and original issue discount deferred tax asset as a result of (i) an increase to the deductible interest expense allowed for 2019 and 2020 under the CARES Act that was enacted during the three months ended March 31, 2020 and (ii) tax impacts of 2020 financing activity.
Net income (loss), as a percentage of net operating revenues, was 5.1% for the year ended December 31, 2020 compared to (4.5)% for the year ended December 31, 2019.
Net income attributable to noncontrolling interests, as a percentage of net operating revenues, increased to 0.8% for the year ended December 31, 2020 from 0.6% for the year ended December 31, 2019.
Net income attributable to Community Health Systems, Inc. was $511 million for the year ended December 31, 2020, compared to a net loss attributable to Community Health Systems, Inc. of $675 million for the year ended December 31, 2019.
Liquidity and Capital Resources
2021 Compared to 2020
Net cash used in operating activities was approximately $131 million for the year ended December 31, 2021, compared to net cash provided by operating activities of $2.2 billion for the year ended December 31, 2020. The change was primarily attributable to the receipt of Medicare accelerated payments as well as PHSSEF funds under the CARES Act and PPPHCE Act during the year ended December 31, 2020 and the repayment of Medicare accelerated payments during the year ended December 31, 2021. Total cash paid for interest decreased to approximately $778 million for the year ended December 31, 2021 from approximately $1.0 billion for the year ended December 31, 2020. Cash paid for income taxes, net of refunds received, resulted in a net payment of $4 million and $2 million during the years ended December 31, 2021 and 2020, respectively.
Our net cash used in investing activities was approximately $524 million for the year ended December 31, 2021, compared to net cash provided by investing activities of approximately $177 million for the year ended December 31, 2020, a decrease of approximately $701 million. The cash used in investing activities during the year ended December 31, 2021 was primarily impacted by a decrease of $631 million in cash proceeds from dispositions of hospitals and other ancillary operations, an increase in cash used in the purchase of property and equipment of $29 million, an increase of $2 million in cash used for acquisition of facilities and other related businesses, a decrease in cash used in the net impact of the purchase and sale of available-for-sale and equity securities of $85 million, an increase in cash from proceeds from the sale of equity interests in Macon Healthcare, LLC of $110 million and an increase in cash used to purchase other investments of $64 million.
Our net cash used in financing activities was $514 million for the year ended December 31, 2021, compared to approximately $895 million for the year ended December 31, 2020, an increase of approximately $381 million. The increase in cash used in financing activities, in comparison to the prior year, was primarily due to the net effect of our debt repayments, refinancing activities, and cash paid for deferred financing costs and other debt-related costs as further described below.
2020 Compared to 2019
Net cash provided by operating activities increased $1.8 billion, from approximately $385 million for the year ended December 31, 2019, to approximately $2.2 billion for the year ended December 31, 2020. The increase in cash provided by operating activities was primarily the result of the receipt of PHSSEF funds as well as Medicare accelerated payments during the year ended December 31, 2020, which is discussed below. Total cash paid for interest during the year ended December 31, 2020 remained consistent at approximately $1.0 billion during both of the years ended December 31, 2020 and 2019. Cash paid for income taxes, net of refunds received, resulted in a net payment of $2 million and a net refund of $3 million during the year ended December 31, 2020 and 2019, respectively.
Our net cash provided by investing activities was approximately $177 million for the year ended December 31, 2020, compared to net cash used in investing activities of approximately $2 million for the year ended December 31, 2019, an increase of approximately $179 million. The cash provided by investing activities during the year ended December 31, 2020 was primarily impacted by a decrease in cash used for other investments (primarily from internal-use software expenditures and physician recruiting costs) of $120 million, an increase in proceeds provided by divestitures of hospitals and other ancillary operations of $44 million as a result of more hospital divestitures during 2020 (including the receipt of the net proceeds for three hospitals divested effective January 1, 2021 at a preliminary closing on December 31, 2020) compared to the same period in 2019 (including the receipt of the net proceeds for three hospitals divested effective January 1, 2020 at a preliminary closing on December 31, 2019), a decrease in the cash used in the acquisition of facilities and other related equipment of $12 million as a result of fewer physician practice, clinic and other ancillary business acquisitions during 2020 compared to the same period in 2019 and an increase to the net impact of the purchases and sales of available-for-sale securities and equity securities of $4 million, offset by an increase in cash provided by the proceeds from the sale of
63
property and equipment of approximately $1 million and an increase in cash used in the purchase of property and equipment of $2 million.
Our net cash used in financing activities was $895 million for the year ended December 31, 2020, compared to approximately $363 million for the year ended December 31, 2019, an increase of approximately $532 million. The increase in cash used in financing activities, in comparison to the prior year period, was primarily due to the net effect of our debt repayment, refinancing activity, and cash paid for deferred financing costs and other debt-related costs as further described below.
Liquidity
Net working capital was approximately $1.1 billion and $1.7 billion at December 31, 2021 and December 31, 2020, respectively. Net working capital decreased by approximately $580 million between December 31, 2020 and December 31, 2021. The decrease is primarily due to the decrease in cash, as a result of debt repayments, repayment of Medicare accelerated payments, refinancing activities and cash paid for deferred financing costs during the year ended December 31, 2021, partially offset by a decrease in current maturities of long-term debt.
In addition to cash flows from operations, available sources of capital include amounts available under the asset-based loan (ABL) credit agreement, or the ABL Credit Agreement, as amended and restated on November 22, 2021, as well as anticipated access to public and private debt markets.
Pursuant to the ABL Credit Agreement, the lenders have extended to CHS/Community Health Systems, Inc., or CHS, a revolving asset-based loan facility, or the ABL Facility, in the maximum aggregate principal amount of $1.0 billion, subject to borrowing base capacity. At December 31, 2021, the available borrowing base under the ABL Facility was $1.0 billion, of which $103 million was reserved for outstanding letters of credit and $897 million represented excess availability. We had no outstanding borrowings as of December 31, 2021. The issued letters of credit were primarily in support of potential insurance-related claims and certain bonds. Principal amounts outstanding under the ABL Facility, if any, will be due and payable in full on November 22, 2026.
2020 Financing Activity
On February 6, 2020, we completed a private offering of $1.462 billion aggregate principal amount of 6⅝% Senior Secured Notes due February 15, 2025, or the 6⅝% Senior Secured Notes due 2025. We used the net proceeds of the offering of the 6⅝% Senior Secured Notes due 2025 to (i) purchase any and all of the 5⅛% Senior Secured Notes due 2021 validly tendered and not validly withdrawn in the cash tender offer announced on January 23, 2020, (ii) redeem all of the 5⅛% Senior Secured Notes due 2021 that were not purchased pursuant to such tender offer, (iii) purchase in one or more privately negotiated transactions approximately $426 million aggregate principal amount of its 6¼% Senior Secured Notes due 2023 and (iv) pay related fees and expenses. The 6⅝% Senior Secured Notes due 2025 bear interest at a rate of 6.625% per annum, payable semi-annually in arrears on February 15 and August 15 of each year, commencing on August 15, 2020. The 6⅝% Senior Secured Notes are scheduled to mature on February 15, 2025. The 6⅝% Senior Secured Notes due 2025 are unconditionally guaranteed on a senior-priority secured basis by us and each of the CHS current and future domestic subsidiaries that provide guarantees under the ABL Facility, any capital market debt securities of CHS (including CHS’ outstanding senior notes) and certain other long-term debt of CHS. The 6⅝% Senior Secured Notes due 2025 and the related guarantees are secured by shared (i) first-priority liens on the Non-ABL Priority Collateral and (ii) second-priority liens on the ABL Priority Collateral that secures on a first-priority basis the ABL Facility, in each case subject to permitted liens described in the indenture governing the 6⅝% Senior Secured Notes due 2025.
As of August 30, 2020, we terminated our last interest rate swap agreement.
During August and September of 2020, we extinguished a portion of certain series of our outstanding notes through open market repurchases, as follows (in millions):
|
|
|
Principal Amount |
|
|
|
6⅞% Senior Notes due 2028 |
|
$ |
226 |
|
|
8⅛% Junior-Priority Secured Notes due 2024 |
|
|
1 |
|
|
6⅞% Senior Notes due 2022 |
|
|
34 |
|
|
Total principal amount of debt extinguished |
|
$ |
261 |
|
A gain from early extinguishment of debt of approximately $115 million was recognized associated with these open market repurchases.
On October 30, 2020, we commenced tender offers to purchase for cash a portion of our outstanding (i) 6⅞% Senior Notes due 2022, (ii) 8⅛% Junior-Priority Secured Notes due 2024, (iii) 9⅞% Junior-Priority Secured Notes due 2023, and (iv) 6⅞% Senior
64
Notes due 2028, up to an aggregate principal amount that would not have resulted in the aggregate purchase price (excluding accrued and unpaid interest) exceeding $400 million. The tender offers expired on November 30, 2020, and resulted in the extinguishment of approximately $87 million aggregate principal amount of indebtedness, as follows (in millions):
|
|
|
Principal Amount |
|
|
|
6⅞% Senior Notes due 2022 |
|
$ |
72 |
|
|
8⅛% Junior-Priority Secured Notes due 2024 |
|
|
6 |
|
|
9⅞% Junior-Priority Secured Notes due 2023 |
|
|
2 |
|
|
6⅞% Senior Notes due 2028 |
|
|
7 |
|
|
Total principal amount of debt extinguished |
|
$ |
87 |
|
A gain from early extinguishment of debt of approximately $8 million was recognized associated with these tender offers.
On December 7, 2020, we entered into a privately negotiated agreement with a multi-asset investment manager who has certain funds and accounts which are holders of the 6⅞% Senior Notes due 2028. Pursuant to the agreement, we exchanged $700 million aggregate principal amount of the 6⅞% Senior Notes due 2028 for an aggregate consideration of $400 million of cash and 10 million newly issued shares of the Company’s common stock. The exchange transaction was completed on December 9, 2020 and the shares of common stock issued in the exchange were not, and are not required to be, registered under the Securities Act of 1933 pursuant to an exemption from registration provisions via Section 3(a)(9) of the Securities Act of 1933. A gain from early extinguishment of debt of approximately $205 million was recognized associated with this exchange.
On December 28, 2020, we completed a private offering of $1.9 billion aggregate principal amount of 5⅝% Senior Secured Notes due 2027, or the 5⅝% Senior Secured Notes due 2027, and $900 million aggregate principal amount of 6% Senior Secured Notes due 2029, or the 6% Senior Secured Notes due 2029. The proceeds of the offering were used to repurchase approximately $2.579 billion of the outstanding principal amount of 6¼% Senior Secured Notes due 2023 that were validly tendered and accepted for purchase pursuant to the early tender deadline of a tender offer that launched on December 11, 2020, and to pay related fees. The remaining principal value of 6¼% Senior Secured Notes due 2023 that were not validly tendered as of the early tender deadline were redeemed or repurchased via the completion of the tender offer on January 11, 2021 or redemption on January, 28, 2021. The 5⅝% Senior Secured Notes due 2027, which mature on March 15, 2027, bear interest at a rate of 5⅝% per year payable semi-annually in arrears on March 15 and September 15 of each year, commencing on September 15, 2021. The 6% Senior Secured Notes due 2029, which mature on January 15, 2029, bear interest at a rate of 6% per year payable semi-annually in arrears on January 15 and July 15 of each year, commencing on July 15, 2021. The 5⅝% Senior Secured Notes due 2027 and 6% Senior Secured Notes due 2029 are unconditionally guaranteed on a senior-priority secured basis by us and each of CHS’ current and future domestic subsidiaries that provide guarantees under the ABL Facility, any capital market debt securities of CHS (including CHS’ outstanding senior notes) and certain other long-term debt of CHS. The 5⅝% Senior Secured Notes due 2027 and 6% Senior Secured Notes due 2029 and the related guarantees are secured by (i) first-priority liens on the Non-ABL Priority Collateral that also secures on a first-priority basis the Issuer’s existing senior-priority secured notes, and (ii) second-priority liens on the ABL-Priority Collateral that secures on a first-priority basis the ABL Facility, in each case subject to permitted liens described in the applicable indenture.
2021 Financing Activity
On January 28, 2021, the remaining principal amount of the 6¼% Senior Secured Notes due 2023 of approximately $95 million was redeemed using cash on hand.
On February 2, 2021, we completed a private offering of $1.775 billion aggregate principal amount of 6⅞% Junior-Priority Secured Notes due April 15, 2029, or the 6⅞% Junior-Priority Secured Notes due 2029. The proceeds of the offering were used, together with cash on hand, to redeem the 9⅞% Junior-Priority Secured Notes due 2023 via a tender offer which was funded on February 2, 2021, or to the extent not tendered, to fund the redemption of the remaining notes on February 4, 2021, and to pay related fees and expenses. The 6⅞% Junior-Priority Secured Notes due 2029 bear interest at a rate of 6.875% per year payable semi-annually in arrears on April 15 and October 15 of each year, commencing on October 15, 2021.
On February 9, 2021, we completed a private offering of $1.095 billion aggregate principal amount of 4¾% Senior Secured Notes due February 15, 2031, or the 4¾% Senior Secured Notes due 2031. The proceeds of the offering were used, together with cash on hand, to redeem the 8⅝% Senior Secured Notes due 2024 on February 9, 2021 and to pay related fees and expenses. The 4¾% Senior Secured Notes due 2031 bear interest at a rate of 4.750% per year payable semi-annually in arrears on February 15 and August 15, commencing on August 15, 2021.
On March 1, 2021, we redeemed the remaining principal amount of the 6⅞% Senior Notes due 2022 of approximately $126 million using cash on hand.
65
On May 19, 2021, we completed a private offering of $1.440 billion aggregate principal amount of 6⅛% Junior-Priority Secured Notes due April 1, 2030, or the 6⅛% Junior-Priority Secured Notes due 2030. The proceeds of the offering were used, together with cash on hand, to redeem the 8⅛% Junior-Priority Secured Notes due 2024 on May 19, 2021 and to pay related fees and expenses. The 6⅛% Junior-Priority Secured Notes due 2030 bear interest at a rate of 6.125% per year payable semi-annually in arrears on April 1 and October 1, commencing on October 1, 2021.
On November 22, 2021, we entered into an amendment and restatement agreement, or the Amendment, to refinance and replace the Credit Agreement, and, as amended by the Amendment, or the Amended and Restated ABL Credit Agreement, dated as of April 3, 2018 with JPMorgan Chase Bank, N.A., as administrative agent, and the lenders and other agents party thereto. Pursuant to the Amended and Restated ABL Credit Agreement, we have a revolving asset-based loan facility available to us in the maximum aggregate principal amount of $1.0 billion, subject to borrowing base capacity. The ABL Facility includes borrowing capacity available for letters of credit of $200 million. Refer to Note 6 of the Notes to Consolidated Financial Statements included under Part II, Item 8 of this Form 10-K for additional information about the ABL Facility.
On February 4, 2022, we completed a private offering of $1.535 billion aggregate principal amount of 5¼% Senior Secured Notes due May 15, 2030. For additional information regarding this financing, see Note 16 of the Notes to Consolidated Financial Statements included under Part II, Item 8 of this Form 10-K, which discussion is incorporated by reference herein.
Additional Liquidity Information
Our ability to meet the restricted covenants and financial ratios and tests in the ABL Facility and the indentures governing our outstanding notes can be affected by events beyond our control, and we cannot assure you that we will meet those tests. A breach of any of these covenants could result in a default under the ABL Facility and/or the indentures that govern our outstanding notes. Upon the occurrence of an event of default under the ABL Facility or indentures that govern our outstanding notes, all amounts outstanding under the ABL Facility and the indentures that govern our outstanding notes may become immediately due and payable and all commitments under the ABL Facility to extend further credit may be terminated.
As of December 31, 2021, approximately $31 million of our outstanding debt of approximately $12.1 billion is due within the next 12 months and approximately 100% of our outstanding debt has a fixed rate of interest. Our debt as a percentage of total capitalization decreased from 114% for the year ended December 31, 2020 to 112% for the year ended December 31, 2021, due to a decrease in accumulated deficit and an overall decrease in long-term debt.
Net proceeds from divestitures, if any, are expected to be used for general corporate purposes and capital expenditures.
Through December 31, 2021, we received approximately $763 million in payments through the PHSSEF and various state and local sources, net of amounts that have been or will be repaid to HHS and various state and local agencies either voluntarily or in relation to entities that were previously divested, and approximately $1.2 billion of accelerated payments pursuant to the Medicare Accelerated and Advance Payment Program, all of which has been repaid or recouped by CMS or assumed by buyers of divested hospitals as of December 31, 2021. As previously noted, PHSSEF payments are not required to be repaid, subject to certain terms and conditions, while payments received under the Medicare Accelerated and Advance Payment Program were required to be repaid. Amounts received through the PHSSEF or state and local programs that had not yet been recognized as a reduction in operating costs and expenses or otherwise refunded to HHS as of December 31, 2021 totaled approximately $14 million. Such amount is included within accrued liabilities-other in the consolidated balance sheets, and such unrecognized amounts may either be returned to HHS or the respective state or local agency or may be recognized in future periods if the underlying conditions for recognition are met.
The CARES Act provided for deferred payment of the employer portion of social security taxes between March 27, 2020 and December 31, 2020, with 50% of the deferred amount due December 31, 2021 and the remaining 50% due December 31, 2022. We deferred the employer portion of social security taxes from mid-April 2020 through December 2020. During the three months ended December 31, 2021, we paid $75 million of the employer portion of social security taxes that had been deferred. Approximately $71 million is included within accrued liabilities employee compensation in the consolidated balance sheets at December 31, 2021 and will be paid in 2022.
As previously discussed, we may require an increased level of working capital if we experience extended billing and collection cycles resulting from negative economic conditions (including high unemployment and underemployment levels) arising from the COVID-19 pandemic, which may impact service mix, revenue mix, payor mix and patient volumes, as well as our ability to collect outstanding receivables. A material increase in the amount or deterioration in the collectability of accounts receivable will adversely affect our cash flows and results of operations, requiring an increased level of working capital.
66
We believe that internally generated cash flows and current levels of availability for additional borrowing under the ABL Facility, as well as our continued access to the capital markets, will be sufficient to finance acquisitions, capital expenditures, working capital requirements, and any debt repurchases or other debt repayments we may elect to make or be required to make through the next 12 months, and for the foreseeable future thereafter. PHSSEF funds that we have received and may continue to receive under the CARES Act and related legislation have been and will be used according to applicable terms and conditions as reimbursement for lost revenues and incremental expenses attributable to COVID-19, including working capital requirements and capital expenditures. As noted above, the COVID-19 pandemic has resulted in, and may continue to result in, significant disruptions of financial and capital markets, which could reduce our ability to access capital and negatively affect our liquidity in the future. Additionally, while we have received PHSSEF payments and accelerated Medicare payments under the CARES Act and related legislation and may continue to receive and be able to utilize PHSSEF payments which have been received, as noted above, there is no assurance regarding the extent to which anticipated ongoing negative impacts on us arising from the COVID-19 pandemic will be offset by benefits which we may recognize or receive in the future under the CARES Act and related legislation or any future stimulus measures.
We may elect from time to time to purchase our outstanding debt in open market purchases, privately negotiated transactions or otherwise. Any such debt repurchases will depend upon prevailing market conditions, our liquidity requirements, contractual restrictions, applicable securities laws requirements, and other factors.
Capital Resources
Material cash requirements from known contractual and other obligations primarily consist of purchase obligations, long-term debt and related interest payments, operating leases, finance leasing and financing obligations, and capital expenditures related to routine capital, information systems infrastructure and applications, replacement or de novo construction projects and bed expansion projects, certain commitments and other investments. Refer to Notes 6, 9 and 15 of the Notes to Consolidated Financial Statements for amounts outstanding as of December 31, 2021 related to long-term debt, and related interest payments, operating leases, finance leasing and financing obligations, and certain commitments.
Purchase obligations include supplies and third-party services purchased in the normal course of business. Open purchase orders total $284 million as of December 31, 2021 and substantially all such amounts are due in the next 12 months. Other investments includes, among other things, purchases of investments in unconsolidated affiliates which are expected to be incurred within the next 24 months.
Cash expenditures for purchases of facilities and other related businesses were approximately $3 million in 2021, $1 million in 2020 and $13 million in 2019. Our expenditures for the years ended December 31, 2021 and 2020 were primarily related to physician practices and other ancillary services. Our expenditures for the year ended December 31, 2019 were primarily related to the purchase of one hospital in Mississippi, physician practices and other ancillary services.
Excluding the cost to construct replacement and de novo hospitals, our cash expenditures for routine capital for the year ended December 31, 2021 totaled $321 million, compared to $274 million in 2020 and $386 million in 2019. These capital expenditures related primarily to the purchase of additional equipment, minor renovations and information systems infrastructure. Cash expenditures to construct replacement hospitals totaled $63 million for the year ended December 31, 2021, compared to $117 million in 2020 and $36 million in 2019. The cash expenditures to construct replacement hospitals for the years ended December 31, 2021, 2020 and 2019 primarily represent construction costs for replacement facilities in La Porte, Indiana and Fort Wayne, Indiana. During the years ended December 31, 2021, 2020 and 2019, we had cash expenditures related to de novo hospitals of $85 million, $49 million and $6 million, respectively, that represent both planning and construction costs primarily for two de novo hospitals in the Tucson, Arizona market. In this regard, we commenced operations for an 18-bed micro-hospital in that market during the fourth quarter of 2020, while the other de novo hospital in that market is expected to be completed in the first half of 2022 and have 52 beds.
Pursuant to a hospital purchase agreement from our March 1, 2016 acquisition of Northwest Health - Starke, formerly known as Starke Hospital, we committed to build a replacement facility in Knox, Indiana. Construction of the replacement facility for Northwest Health - Starke is required to be completed within five years of the date we enter into a new lease with Starke County, Indiana, the hospital lessor, or in the event we do not enter into a new lease with Starke County, construction shall be completed by September 30, 2026. We have not entered into a new lease with the lessor for Northwest Health - Starke and currently anticipate completing construction of the Northwest Health - Starke replacement facility in 2026. The estimated construction costs, including equipment costs, for the construction of this replacement facility in Knox, Indiana are currently estimated to be approximately $15 million. We have incurred no cost to date for the construction of this replacement facility.
In addition to the commitment to build a replacement facility in Knox, Indiana, other off-balance sheet arrangements consist of letters of credit issued on the ABL Facility, primarily in support of potential insurance related claims and specified outstanding bonds
67
of approximately $103 million as well as approximately $10 million representing the maximum potential amount of future payments under physician recruiting guarantee commitments in excess of the liability recorded at December 31, 2021.
We expect total capital expenditures of approximately $500 million to $600 million in 2022, including approximately $53 million of construction costs primarily for the de novo hospital that is expected to be completed in 2022.
Noncontrolling Interests
We have sold noncontrolling interests in certain of our subsidiaries or acquired subsidiaries with existing noncontrolling interest ownership positions. As of December 31, 2021, we have 12 hospitals and outpatient facilities with noncontrolling physician ownership interests ranging from 1% to 40%. In addition, as of December 31, 2021 we have five hospitals with noncontrolling interests owned by non-profit entities or a for-profit subsidiary of a non-profit entity. Redeemable noncontrolling interests in equity of consolidated subsidiaries was $480 million and $484 million as of December 31, 2021 and 2020, respectively, and noncontrolling interests in equity of consolidated subsidiaries was $82 million and $87 million as of December 31, 2021 and 2020, respectively. The amount of net income attributable to noncontrolling interests was $138 million, $96 million and $85 million for the years ended December 31, 2021, 2020 and 2019, respectively. As a result of the change in the Stark Law “whole hospital” exception included in the Affordable Care Act, we are not permitted to introduce physician ownership at any of our hospital facilities that did not have physician ownership at the time of the adoption of the Affordable Care Act, or increase the aggregate percentage of physician ownership in any of our former or existing hospital joint ventures in excess of the aggregate physician ownership level held at the time of the adoption of the Affordable Care Act.
Reimbursement, Legislative and Regulatory Changes
Ongoing legislative and regulatory efforts could reduce or otherwise adversely affect the payments we receive from Medicare and Medicaid and other payors. Within the statutory framework of the Medicare and Medicaid programs, there are substantial areas subject to administrative rulings, interpretations and discretion which may further affect payments made under those programs, and the federal and state governments might, in the future, reduce the funds available under those programs or require more stringent utilization and quality reviews of hospital facilities. Additionally, there may be a continued rise in managed care programs and additional restructuring of the financing and delivery of healthcare in the United States. These events could cause our future financial results to be adversely impacted. It is difficult to estimate the impact of recent Medicare and Medicaid reimbursement changes and those that are under consideration. We cannot predict whether additional reimbursement reductions will be made or whether any such changes or other restructuring of the financing and delivery of healthcare would have a material adverse effect on our business, financial conditions, results of operations, cash flow, capital resources and liquidity.
Inflation
The healthcare industry is labor intensive. Wages and other expenses increase during periods of inflation and when labor shortages occur in the marketplace. In addition, our suppliers pass along rising costs to us in the form of higher prices. We have recently experienced higher prices in connection with supply chain, capital and other expenditures in the current inflationary environment, and have also experienced higher labor costs in connection with the current competitive labor market. While we have implemented cost containment and other measures to try to counteract these increases, we may be unable to fully offset these increases in our costs.
Critical Accounting Policies
The discussion and analysis of our financial condition and results of operations are based upon our consolidated financial statements, which have been prepared in accordance with U.S. GAAP. The preparation of these financial statements requires us to make estimates and judgments that affect the reported amount of assets and liabilities, revenues and expenses, and related disclosure of contingent assets and liabilities at the date of our consolidated financial statements. Actual results may differ from these estimates under different assumptions or conditions.
Critical accounting policies are defined as those policies that involve a significant level of estimation uncertainty and have had or are reasonably likely to have a material impact on the financial condition or results of operations of the registrant. We believe that our critical accounting policies are limited to those described below. The following information should be read in conjunction with our significant accounting policies included in Note 1 of the Notes to Consolidated Financial Statements included under Part II, Item 8 of this Form 10-K.
Revenue Recognition
Net operating revenues include amounts estimated by management to be reimbursable by Medicare and Medicaid under prospective payment systems and provisions of cost-reimbursement and other payment methods. In addition, we are reimbursed by non-governmental payors using a variety of payment methodologies. Amounts we receive for treatment of patients covered by these
68
programs are generally less than the standard billing rates. Explicit price concessions are recorded for contractual allowances that are calculated and recorded through internally-developed data collection and analysis tools to automate the monthly estimation of required contractual allowances. Within this automated system, payors’ historical paid claims data are utilized to calculate the contractual allowances. This data is automatically updated on a monthly basis. All hospital contractual allowance calculations are subjected to monthly review by management to ensure reasonableness and accuracy. We account for the differences between the estimated program reimbursement rates and the standard billing rates as contractual allowance adjustments, which is one component of the deductions from gross revenues to arrive at net operating revenues. The process of estimating contractual allowances requires us to estimate the amount expected to be received based on payor contract provisions. The key assumption in this process is the estimated contractual reimbursement percentage, which is based on payor classification, historical paid claims data and, when applicable, application of the expected managed care plan reimbursement based on contract terms.
Due to the complexities involved in these estimates, actual payments we receive could be different from the amounts we estimate and record. If the actual contractual reimbursement percentage under government programs and managed care contracts differed by 1% at December 31, 2021 from our estimated reimbursement percentage, net income for the year ended December 31, 2021 would have changed by approximately $85 million, and net accounts receivable at December 31, 2021 would have changed by $110 million. Final settlements under some of these programs are subject to adjustment based on administrative review and audit by third parties. We account for adjustments to previous program reimbursement estimates as contractual allowance adjustments and report them in the periods that such adjustments become known. Contractual allowance adjustments related to final settlements and previous program reimbursement estimates impacted net operating revenues and net income (loss) by an insignificant amount for each of the years ended December 31, 2021, 2020 and 2019.
Patient Accounts Receivable
Substantially all of our accounts receivable are related to providing healthcare services to patients at our hospitals and affiliated businesses. Collection of these accounts receivable is our primary source of cash and is critical to our operating performance. Our primary collection risks relate to uninsured patients and outstanding patient balances for which the primary insurance payor has paid some but not all of the outstanding balance, with the remaining outstanding balance (generally deductibles and co-payments) owed by the patient. For all procedures scheduled in advance, our policy is to verify insurance coverage prior to the date of the procedure. Insurance coverage is not verified in advance of procedures for walk-in and emergency room patients.
We estimate any adjustments to the transaction price for implicit price concessions by reserving a percentage of all self-pay accounts receivable without regard to aging category, based on collection history, adjusted for expected recoveries and any anticipated changes in trends. Our ability to estimate the transaction price and any implicit price concessions is not impacted by not utilizing an aging of our net accounts receivable as we believe that substantially all of the risk exists at the point in time such accounts are identified as self-pay. The percentage used to reserve for all self-pay accounts is based on our collection history. We believe that we collect substantially all of our third-party insured receivables, which include receivables from governmental agencies.
Patient accounts receivable can be impacted by the effectiveness of our collection efforts and, as described in our significant accounting policies included in Note 1 of the Notes to Consolidated Financial Statements included under Part II, Item 8 of this Form 10-K, numerous factors may affect the net realizable value of accounts receivable. If the actual collection percentage differed by 1% at December 31, 2021 from our estimated collection percentage as a result of a change in expected recoveries, net income for the year ended December 31, 2021 would have changed by $43 million, and net accounts receivable at December 31, 2021 would have changed by $55 million. We also continually review our overall reserve adequacy by monitoring historical cash collections as a percentage of trailing net operating revenues, as well as by analyzing current period net revenue and admissions by payor classification, days revenue outstanding, the composition of self-pay receivables between pure self-pay patients and the patient responsibility portion of third-party insured receivables and the impact of recent acquisitions and dispositions.
Our policy is to write-off gross accounts receivable if the balance is under $10.00 or when such amounts are placed with outside collection agencies. We believe this policy accurately reflects our ongoing collection efforts and is consistent with industry practices. We had approximately $2.2 billion at December 31, 2021 and $3.3 billion December 31, 2020, being pursued by various outside collection agencies. We expect to collect less than 3%, net of estimated collection fees, of the amounts being pursued by outside collection agencies. As these amounts have been written-off, they are not included in our accounts receivable. Collections on amounts previously written-off are recognized as a recovery of net operating revenues when received. However, we take into consideration estimated collections of these future amounts written-off in determining the implicit price concessions used to measure the transaction price for the applicable portfolio of patient accounts receivable.
All of the following information is derived from our hospitals, excluding clinics, unless otherwise noted. Patient accounts receivable from our hospitals represent approximately 98% of our total consolidated accounts receivable.
69
Days revenue outstanding, adjusted for the impact of receivables for state Medicaid supplemental payment programs and divested facilities, was 55 days and 52 days at December 31, 2021 and 2020, respectively.
Total gross accounts receivable (prior to allowance for contractual adjustments and implicit price concessions) was approximately $16.2 billion as of December 31, 2021 and approximately $14.8 billion as of December 31, 2020. The approximate percentage of total gross accounts receivable (prior to allowance for contractual adjustments and implicit price concessions) summarized by aging categories is as follows:
|
As of December 31, 2021: |
|
|
|
|
|
|
|
|
|
|
|
|
|
|
|
|
|
|
|
% of Gross Receivables |
|
|||||||||||||
|
Payor |
|
0 - 90 Days |
|
|
90 - 180 Days |
|
|
180 - 365 Days |
|
|
Over 365 Days |
|
||||
|
Medicare |
|
|
12 |
% |
|
|
1 |
% |
|
|
— |
% |
|
|
— |
% |
|
Medicaid |
|
|
7 |
% |
|
|
1 |
% |
|
|
1 |
% |
|
|
1 |
% |
|
Managed Care and Other |
|
|
33 |
% |
|
|
5 |
% |
|
|
3 |
% |
|
|
2 |
% |
|
Self-Pay |
|
|
8 |
% |
|
|
5 |
% |
|
|
9 |
% |
|
|
12 |
% |
|
As of December 31, 2020: |
|
|
|
|
|
|
|
|
|
|
|
|
|
|
|
|
|
|
|
% of Gross Receivables |
|
|||||||||||||
|
Payor |
|
0 - 90 Days |
|
|
90 - 180 Days |
|
|
180 - 365 Days |
|
|
Over 365 Days |
|
||||
|
Medicare |
|
|
13 |
% |
|
|
1 |
% |
|
|
— |
% |
|
|
— |
% |
|
Medicaid |
|
|
7 |
% |
|
|
1 |
% |
|
|
1 |
% |
|
|
1 |
% |
|
Managed Care and Other |
|
|
31 |
% |
|
|
4 |
% |
|
|
3 |
% |
|
|
3 |
% |
|
Self-Pay |
|
|
8 |
% |
|
|
6 |
% |
|
|
9 |
% |
|
|
12 |
% |
The approximate percentage of total gross accounts receivable (prior to allowances for contractual adjustments and implicit price concessions) summarized by payor is as follows:
|
|
|
December 31, |
|
|||||
|
|
|
2021 |
|
|
2020 |
|
||
|
Insured receivables |
|
|
66.3 |
% |
|
|
64.3 |
% |
|
Self-pay receivables |
|
|
33.7 |
|
|
|
35.7 |
|
|
Total |
|
|
100.0 |
% |
|
|
100.0 |
% |
The combined total at our hospitals and clinics for the estimated implicit price concessions for self-pay accounts receivable and allowances for other self-pay discounts and contractuals, as a percentage of gross self-pay receivables, was approximately 91% at both December 31, 2021 and December 31, 2020. If the receivables that have been written-off, but where collections are still being pursued by outside collection agencies, were included in both the allowances and gross self-pay receivables specified above, the percentage of combined allowances to total self-pay receivables would have been 93% at December 31, 2021 and 94% at December 31, 2020.
Professional Liability Claims
As part of our business of providing healthcare services, we are subject to legal actions alleging liability on our part. We accrue for losses resulting from such liability claims, as well as loss adjustment expenses that are out-of-pocket and directly related to such liability claims. These direct out-of-pocket expenses include fees of outside counsel and experts. We do not accrue for costs that are part of our corporate overhead, such as the costs of our in-house legal and risk management departments. The losses resulting from professional liability claims primarily consist of estimates for known claims, as well as estimates for incurred but not reported claims. The estimates are based on specific claim facts, our historical claim reporting and payment patterns, the nature and level of our hospital operations, and actuarially determined projections. The actuarially determined projections are based on our actual claim data, including historic reporting and payment patterns which have been gathered over an approximately 20-year period. As discussed below, since we purchase excess insurance on a claims-made basis that transfers risk to third-party insurers, the liability we accrue does include an amount for the losses covered by our excess insurance. We also record a receivable for the expected reimbursement of losses covered by our excess insurance. Since we believe that the amount and timing of our future claims payments are reliably determinable, we discount the amount we accrue for losses resulting from professional liability claims using the risk-free interest rate corresponding to the timing of our expected payments.
The net present value of the projected payments was discounted using a weighted-average risk-free rate of 1.8% in both 2021 and 2020 and 2.6% in 2019. This liability is adjusted for new claims information in the period such information becomes known to us. Professional malpractice expense includes the losses resulting from professional liability claims and loss adjustment expense, as well
70
as excess insurance premiums, and is presented within other operating expenses in the accompanying consolidated statements of income (loss).
Our processes for obtaining and analyzing claims and incident data are standardized across all of our businesses and have been consistent for many years. We monitor the outcomes of the medical care services that we provide and for each reported claim, we obtain various information concerning the facts and circumstances related to that claim. In addition, we routinely monitor current key statistics and volume indicators in our assessment of utilizing historical trends. The average lag period between claim occurrence and payment of a final settlement is between three and four years, although the facts and circumstances of individual claims could result in the timing of such payments being different from this average. Since claims are paid promptly after settlement with the claimant is reached, settled claims represent less than 1.0% of the total liability at the end of any period.
For purposes of estimating our individual claim accruals, we utilize specific claim information, including the nature of the claim, the expected claim amount, the year in which the claim occurred and the laws of the jurisdiction in which the claim occurred. Once the case accruals for known claims are determined, information is stratified by loss layers and retentions, accident years, reported years and geography. Several actuarial methods are used against this data to produce estimates of ultimate paid losses and reserves for incurred but not reported claims. Each of these methods uses our company-specific historical claims data and other information. Company-specific data includes information regarding our business, including historical paid losses and loss adjustment expenses, historical and current case loss reserves, actual and projected hospital statistical data, a variety of hospital census information, employed physician information, professional liability retentions for each policy year, geographic information and other data. Significant assumptions are made on the basis of the aforementioned information in estimating reserves for incurred but not reported claims. A 100 basis point change in assumptions for either severity or frequency as of December 31, 2021 would have increased or decreased the reserve between $10 million to $20 million.
Based on these analyses, we determine our estimate of the professional liability claims. The determination of management’s estimate, including the preparation of the reserve analysis that supports such estimate, involves subjective judgment of management. Changes in reserve data or the trends and factors that influence reserve data may signal fundamental shifts in our future claim development patterns or may simply reflect single-period anomalies. Even if a change reflects a fundamental shift, the full extent of the change may not become evident until years later. Moreover, since our methods and models use different types of data and we select our liability from the results of all of these methods, we typically cannot quantify the precise impact of such factors on our estimates of the liability. Due to our standardized and consistent processes for handling claims and the long history and depth of our company-specific data, our methodologies have historically produced reliably determinable estimates of ultimate paid losses. Management considers any changes in the amount and pattern of its historical paid losses up through the most recent reporting period to identify any fundamental shifts or trends in claim development experience in determining the estimate of professional liability claims. However, due to the subjective nature of this estimate and the impact that previously unforeseen shifts in actual claim experience can have, future estimates of professional liability could be adversely impacted when actual paid losses develop unexpectedly based on assumptions and settlement events that were not previously known or anticipated.
|
|
|
Year Ended December 31, |
|
|||||||||
|
|
|
2021 |
|
|
2020 |
|
|
2019 |
|
|||
|
Accrual for professional liability claims, beginning of year |
|
$ |
602 |
|
|
$ |
612 |
|
|
$ |
650 |
|
|
Liability for insured claims (1) |
|
|
(22 |
) |
|
|
17 |
|
|
|
(11 |
) |
|
Expense (income) related to: |
|
|
|
|
|
|
|
|
|
|
|
|
|
Current accident year |
|
|
108 |
|
|
|
102 |
|
|
|
115 |
|
|
Prior accident years |
|
|
(18 |
) |
|
|
56 |
|
|
|
136 |
|
|
(Income) expense from discounting |
|
|
(4 |
) |
|
|
10 |
|
|
|
12 |
|
|
Total incurred loss and loss expense (2) |
|
|
86 |
|
|
|
168 |
|
|
|
263 |
|
|
Paid claims and expenses related to: |
|
|
|
|
|
|
|
|
|
|
|
|
|
Current accident year |
|
|
(1 |
) |
|
|
— |
|
|
|
(1 |
) |
|
Prior accident years |
|
|
(132 |
) |
|
|
(195 |
) |
|
|
(289 |
) |
|
Total paid claims and expenses |
|
|
(133 |
) |
|
|
(195 |
) |
|
|
(290 |
) |
|
Accrual for professional liability claims, end of year |
|
$ |
533 |
|
|
$ |
602 |
|
|
$ |
612 |
|
|
(1) |
The liability for insured claims is recorded on the consolidated balance sheets with a corresponding insurance recovery receivable. |
|
(2) |
Total expense, including premiums for insured coverage, was $98 million in 2021, $203 million in 2020 and $298 million in 2019. |
71
In the ordinary course of business, our expense with respect to professional liability claims, which is actuarially determined, is limited to amounts not covered by third-party insurance policies, which typically provide coverage for professional liability claims. During the year ended December 31, 2020, we incurred expenses in the amount of approximately $50 million related to the settlement of a professional liability claim for which our third-party insurers’ obligation to provide coverage to us in connection with the underlying loss was being litigated. The subject of the litigation for the recovery of the full amount of the $50 million settlement was whether the claim was covered under the subject policies. This litigation was settled during the three months ended December 31, 2021, and in connection with this settlement, approximately $22 million was recovered from various third-party insurers related to their obligation to provide coverage for the professional liability claim. Aside from this matter, there were no significant changes in our estimate of the reserve for professional liability claims during the years ended December 31, 2021 and 2020.
We are primarily self-insured for professional liability claims; however, we obtain excess insurance that transfers the risk of loss to a third-party insurer for claims in excess of our self-insured retentions. Our excess insurance is underwritten on a claims-made basis. For claims reported prior to June 1, 2002, substantially all of our professional and general liability risks were subject to a less than $1 million per occurrence self-insured retention and for claims reported from June 1, 2002 through June 1, 2003, these self-insured retentions were $2 million per occurrence. Substantially all claims reported after June 1, 2003 and before June 1, 2005 are self-insured up to $4 million per claim. Substantially all claims reported on or after June 1, 2005 and before June 1, 2014 are self-insured up to $5 million per claim. Substantially all claims reported on or after June 1, 2014 and before June 1, 2018 are self-insured up to $10 million per claim. Substantially all claims reported on or after June 1, 2018 are self-insured up to $15 million per claim. Management, on occasion, has selectively increased the insured risk at certain hospitals based upon insurance pricing and other factors and may continue that practice in the future.
Excess insurance for all hospitals has been purchased through commercial insurance companies and generally covers us for liabilities in excess of the self-insured retentions. The excess coverage consists of multiple layers of insurance, the sum of which totals up to $95 million per occurrence and in the aggregate for claims reported on or after June 1, 2003, up to $145 million per occurrence and in the aggregate for claims reported on or after January 1, 2008, up to $195 million per occurrence and in the aggregate for claims reported on or after June 1, 2010, and up to at least $215 million per occurrence and in the aggregate for claims reported on or after June 1, 2015. In addition, for integrated occurrence malpractice claims, there is an additional $50 million of excess coverage for claims reported on or after June 1, 2014 and an additional $75 million of excess coverage for claims reported on or after June 1, 2015 through June 1, 2020. The $75 million in integrated occurrence coverage will also apply to claims reported between June 1, 2020 and June 1, 2022 for events that occurred prior to June 1, 2020 but which were not previously known or reported. For certain policy years prior to June 1, 2014, if the first aggregate layer of excess coverage becomes fully utilized, then the self-insured retention will increase to $10 million per claim for any subsequent claims in that policy year until our total aggregate coverage is met. Beginning June 1, 2018, this drop-down provision in the excess policies attaches over the $15 million per claim self-insured retention.
Effective June 1, 2014, the hospitals acquired from HMA were insured on a claims-made basis as described above and through commercial insurance companies as described above for substantially all claims reported on or after June 1, 2014 except for physician-related claims with an occurrence date prior to June 1, 2014. Prior to June 1, 2014, the former HMA hospitals obtained insurance coverage through a wholly-owned captive insurance subsidiary and a risk retention group subsidiary which are domiciled in the Cayman Islands and South Carolina, respectively. Those insurance subsidiaries, which are collectively referred to as the “Insurance Subsidiaries,” provided (i) claims-made coverage to all of the former HMA hospitals and (ii) occurrence-basis coverage to most of the physicians employed by the former HMA hospitals. The employed physicians not covered by the Insurance Subsidiaries generally maintained claims-made policies with unrelated third party insurance companies. To mitigate the exposure of the program covering the former HMA hospitals and other healthcare facilities, the Insurance Subsidiaries bought claims-made reinsurance policies from unrelated third parties for claims above self-retention levels of $10 million or $15 million per claim, depending on the policy year.
Income Taxes
We must make estimates in recording provision for income taxes, including determination of deferred tax assets and deferred tax liabilities and any valuation allowances that might be required against the deferred tax assets. We believe that future income will enable us to realize certain deferred tax assets, subject to the valuation allowance we have established.
The total amount of unrecognized benefit that would impact the effective tax rate, if recognized, was less than $1 million as of December 31, 2021. A total of less than $1 million of interest and penalties is included in the amount of liability for uncertain tax positions at December 31, 2021. It is our policy to recognize interest and penalties related to unrecognized benefits in our consolidated statements of income (loss) as income tax expense.
It is possible the amount of unrecognized tax benefit could change in the next 12 months as a result of a lapse of the statute of limitations and settlements with taxing authorities; however, we do not anticipate the change will have a material impact on our consolidated results of operations or consolidated financial position.
72
Our federal income tax return for the 2018 tax year remains under examination by the Internal Revenue Service. We believe the result of this examination will not be material to our consolidated results of operations or consolidated financial position. We have extended the federal statute of limitations through June 30, 2022 for Community Health Systems, Inc. for the tax periods ended December 31, 2014 and 2015. In addition, we have extended our federal statute of limitations through December 31, 2023 for the tax period ended December 31, 2018.
Recent Accounting Pronouncements
In November 2021, the Financial Accounting Standards Board issued Accounting Standards Update, or ASU, 2021-10, “Government Assistance (Topic 832), Disclosures by Business Entities about Government Assistance”. This ASU provides specific authoritative guidance for the disclosure of government assistance including the nature of assistance received, the accounting for and presentation of assistance received and the significant terms and conditions, including commitments and contingences. This ASU is effective for all entities for financial statements issued for annual periods beginning after December 15, 2021 and may be early adopted. We early adopted this ASU beginning with this Form 10-K for the year ended December 31, 2021.
We have evaluated all other recently issued, but not yet effective, ASUs and do not expect the eventual adoption of these ASUs to have a material impact our consolidated financial position or results of operations.
FORWARD-LOOKING STATEMENTS
This Form 10-K contains forward-looking statements within the meaning Section 27A of the Securities Act of 1933, as amended, Section 21E of the Securities Exchange Act of 1934, as amended, and the Private Securities Litigation Reform Act of 1995 that involve risk and uncertainties. Statements that are predictive in nature, that depend upon or refer to future events or conditions or that include words such as “expects,” “anticipates,” “intends,” “plans,” “believes,” “estimates,” “thinks,” and similar expressions are forward-looking statements. These statements involve known and unknown risks, uncertainties, and other factors that may cause our actual results and performance to be materially different from any future results or performance expressed or implied by these forward-looking statements. A number of factors could affect the future results of the Company or the healthcare industry generally and could cause the Company’s expected results to differ materially from those expressed in this Form 10-K. These factors include, among other things:
|
|
• |
developments related to COVID-19, including, without limitation, related to the length and severity of the pandemic; the volume of canceled or rescheduled procedures; the volume of COVID-19 patients cared for across our health systems; the timing, availability and acceptance of effective medical treatments, vaccines (including additional dosages of vaccines) and tests; the spread of potentially more contagious and/or virulent forms of the virus, including variants of the virus for which currently available vaccines, treatments and tests may not be effective or authorized; measures we are taking to respond to the COVID-19 pandemic; the impact of government actions on us, including with respect to vaccine mandates, testing requirements, travel restrictions and other virus containment measures; changes in net revenue due to patient volumes, payor mix and evolving macroeconomic conditions; inflationary conditions and increased expenses related to labor, supply chain, capital and other expenditures; workforce disruptions; and supply shortages and disruptions; |
|
|
• |
uncertainty regarding the implementation of the CARES Act, the PPPHCE Act, the CAA, the ARPA and any other future stimulus measures related to COVID-19, including the magnitude and timing of any future payments or benefits we may receive or realize thereunder; |
|
|
• |
general economic and business conditions, both nationally and in the regions in which we operate, including economic and business conditions resulting from the COVID-19 pandemic; |
|
|
• |
the impact of current or future federal and state health reform initiatives, including the Affordable Care Act, and the potential for changes to the Affordable Care Act, its implementation or its interpretation (including through executive orders and court challenges); |
|
|
• |
the extent to and manner in which states support increases, decreases or changes in Medicaid programs, implement health insurance exchanges or alter the provision of healthcare to state residents through legislation, regulation or otherwise; |
|
|
• |
the future and long-term viability of health insurance exchanges and potential changes to the beneficiary enrollment process; |
|
|
• |
risks associated with our substantial indebtedness, leverage and debt service obligations, including our ability to refinance such indebtedness on acceptable terms or to incur additional indebtedness, and our ability to remain in compliance with debt covenants; |
|
|
• |
demographic changes; |
|
|
• |
changes in, or the failure to comply with, federal, state or local laws or governmental regulations affecting our business, including any such laws or governmental regulations which are adopted in connection with the COVID-19 pandemic; |
73
|
|
• |
potential adverse impact of known and unknown legal, regulatory and governmental proceedings and other loss contingencies, including governmental investigations and audits, and federal and state false claims act litigation; |
|
|
• |
our ability, where appropriate, to enter into and maintain provider arrangements with payors and the terms of these arrangements, which may be further affected by the increasing consolidation of health insurers and managed care companies and vertical integration efforts involving payors and healthcare providers; |
|
|
• |
changes in, or the failure to comply with, contract terms with payors and changes in reimbursement policies or rates paid by federal or state healthcare programs or commercial payors; |
|
|
• |
any security breaches, loss of data, actual or perceived failures to comply with legal requirements governing the privacy and security of health information or other regulated, sensitive or confidential information, or legal requirements regarding data privacy or data protection, and other cybersecurity incidents; |
|
|
• |
any potential impairments in the carrying value of goodwill, other intangible assets, or other long-lived assets, or changes in the useful lives of other intangible assets; |
|
|
• |
changes in inpatient or outpatient Medicare and Medicaid payment levels and methodologies; |
|
|
• |
the effects related to the implementation of the sequestration spending reductions pursuant to both the Budget Control Act of 2011 and the Pay-As-You-Go Act of 2010 and the potential for future deficit reduction legislation; |
|
|
• |
increases in the amount and risk of collectability of patient accounts receivable, including decreases in collectability which may result from, among other things, self-pay growth and difficulties in recovering payments for which patients are responsible, including co-pays and deductibles; |
|
|
• |
the efforts of insurers, healthcare providers, large employer groups and others to contain healthcare costs, including the trend toward value-based purchasing; |
|
|
• |
the impact of competitive labor market conditions and the shortage of experienced nurses, including in connection with our ability to hire and retain qualified nurses, physicians, other medical personnel and key management, and increased labor expenses as a result of such competitive labor market conditions, inflation and competition for such positions; |
|
|
• |
any failure to obtain medical supplies or pharmaceuticals at favorable prices; |
|
|
• |
liabilities and other claims asserted against us, including self-insured malpractice claims; |
|
|
• |
competition; |
|
|
• |
trends toward treatment of patients in less acute or specialty healthcare settings, including ambulatory surgery centers or specialty hospitals or via telehealth; |
|
|
• |
changes in medical or other technology; |
|
|
• |
changes in U.S. GAAP; |
|
|
• |
the availability and terms of capital to fund any additional acquisitions or replacement facilities or other capital expenditures; |
|
|
• |
our ability to successfully make acquisitions or complete divestitures, our ability to complete any such acquisitions or divestitures on desired terms or at all, the timing of the completion of any such acquisitions or divestitures, and our ability to realize the intended benefits from any such acquisitions or divestitures; |
|
|
• |
the impact that changes in our relationships with joint venture or syndication partners could have on effectively operating our hospitals or ancillary services or in advancing strategic opportunities; |
|
|
• |
our ability to successfully integrate any acquired hospitals, or to recognize expected synergies from acquisitions; |
|
|
• |
the impact of seasonal severe weather conditions and climate change, as well as the timing and amount of insurance recoveries in relation to severe weather events; |
|
|
• |
our ability to obtain adequate levels of insurance, including general liability, professional liability, and directors and officers liability insurance; |
|
|
• |
timeliness of reimbursement payments received under government programs; |
|
|
• |
effects related to pandemics, epidemics, or outbreaks of infectious diseases, including the novel coronavirus causing the disease known as COVID-19; |
|
|
• |
the impact of cybersecurity threats, cyber-attacks or security breaches; |
|
|
• |
any failure to comply with our obligations under license or technology agreements; |
74
|
|
• |
challenging economic conditions in certain non-urban communities in which we operate; |
|
|
• |
any developments with respect to the final auditing and reporting requirements of, or other adverse developments with respect to, the Corporate Integrity Agreement to which we are subject; |
|
|
• |
the concentration of our revenue in a small number of states; |
|
|
• |
our ability to realize anticipated cost savings and other benefits from our current strategic and operational cost savings initiatives; |
|
|
• |
any changes in or interpretations of income tax laws and regulations; and |
|
|
• |
the risk factors set forth in this Form 10-K and our other public filings with the Securities and Exchange Commission. |
Although we believe that these forward-looking statements are based upon reasonable assumptions, these assumptions are inherently subject to significant regulatory, economic and competitive uncertainties and contingencies, which are difficult or impossible to predict accurately and may be beyond our control. Accordingly, we cannot give any assurance that our expectations will in fact occur, and we caution that actual results may differ materially from those in the forward-looking statements. Given these uncertainties, prospective investors are cautioned not to place undue reliance on these forward-looking statements. These forward-looking statements are made as of the date of this filing. We undertake no obligation to revise or update any forward-looking statements, or to make any other forward-looking statements, whether as a result of new information, future events or otherwise.
Item 7A. Quantitative and Qualitative Disclosures about Market Risk
We are exposed to market risk related to changes in market value of marketable securities including debt and equity securities held by our wholly-owned captive insurance subsidiaries as well as securities held for certain deferred compensation plans. Available-for-sale debt securities are reported at fair value as determined by quoted market prices, with unrealized gains and losses reported as a separate component of stockholders’ deficit. Trading securities are reported at fair value with unrealized gains and losses included in earnings. Other comprehensive loss, net of tax, included an unrealized loss of $5 million during the year ended December 31, 2021.
We are exposed to market risk related to market illiquidity. Investments in debt and equity securities of our insurance subsidiaries could be impaired by the inability to access the capital markets. Should the insurance subsidiaries require significant amounts of cash in excess of normal cash requirements to pay claims and other expenses on short notice, we may have difficulty selling these investments in a timely manner or be forced to sell them at a price less than what we might otherwise have been able to in a normal market environment. We may be required to recognize credit-related impairments on our investment securities in future periods should issuers default on interest payments or should the fair market valuations of the securities deteriorate due to ratings downgrades or other issue-specific factors.
We are also exposed to market risk related to changes in interest rates, primarily as a result of the ABL Facility which bears interest based on floating rates. No amounts were outstanding under the ABL Facility as of December 31, 2021.
The estimated fair value of our long-term debt was $12.6 billion at December 31, 2021. The estimates of fair value are based upon the quoted market prices for the same or similar issues of long-term debt with the same maturities. Based on a hypothetical 1% increase in interest rates, the potential annualized reduction to future pre-tax earnings would be approximately $125 million. To mitigate the impact of fluctuations in interest rates, we generally target a majority of our debt portfolio to be maintained at fixed rates.
75
Item 8. Financial Statements and Supplementary Data
Index to Financial Statements
|
|
|
Page |
|
Community Health Systems, Inc. Consolidated Financial Statements: |
|
|
|
Report of Independent Registered Public Accounting Firm (PCAOB ID No. |
|
77 |
|
Consolidated Statements of Income (Loss) for the Years Ended December 31, 2021, 2020 and 2019 |
|
79 |
|
|
80 |
|
|
Consolidated Balance Sheets as of December 31, 2021 and 2020 |
|
81 |
|
|
82 |
|
|
Consolidated Statements of Cash Flows for the Years Ended December 31, 2021, 2020 and 2019 |
|
83 |
|
|
84 |
76
REPORT OF INDEPENDENT REGISTERED PUBLIC ACCOUNTING FIRM
To the Stockholders and the Board of Directors of
Community Health Systems, Inc.
Franklin, Tennessee
Opinion on the Financial Statements
We have audited the accompanying consolidated balance sheets of Community Health Systems, Inc. and subsidiaries (the “Companyˮ) as of December 31, 2021 and 2020, the related consolidated statements of income (loss), comprehensive income (loss), stockholders’ deficit, and cash flows, for each of the three years in the period ended December 31, 2021, and the related notes (collectively referred to as the “financial statementsˮ). In our opinion, the financial statements present fairly, in all material respects, the financial position of the Company as of December 31, 2021 and 2020, and the results of its operations and its cash flows for each of the three years in the period ended December 31, 2021, in conformity with accounting principles generally accepted in the United States of America.
We have also audited, in accordance with the standards of the Public Company Accounting Oversight Board (United States) (PCAOB), the Company's internal control over financial reporting as of December 31, 2021, based on criteria established in Internal Control — Integrated Framework (2013) issued by the Committee of Sponsoring Organizations of the Treadway Commission and our report dated February 17, 2022, expressed an unqualified opinion on the Company's internal control over financial reporting.
Basis for Opinion
These financial statements are the responsibility of the Company's management. Our responsibility is to express an opinion on the Company's financial statements based on our audits. We are a public accounting firm registered with the PCAOB and are required to be independent with respect to the Company in accordance with the U.S. federal securities laws and the applicable rules and regulations of the Securities and Exchange Commission and the PCAOB.
We conducted our audits in accordance with the standards of the PCAOB. Those standards require that we plan and perform the audit to obtain reasonable assurance about whether the financial statements are free of material misstatement, whether due to error or fraud. Our audits included performing procedures to assess the risks of material misstatement of the financial statements, whether due to error or fraud, and performing procedures that respond to those risks. Such procedures included examining, on a test basis, evidence regarding the amounts and disclosures in the financial statements. Our audits also included evaluating the accounting principles used and significant estimates made by management, as well as evaluating the overall presentation of the financial statements. We believe that our audits provide a reasonable basis for our opinion.
Critical Audit Matters
The critical audit matters communicated below are matters arising from the current-period audit of the financial statements that were communicated or required to be communicated to the audit committee and that (1) relate to accounts or disclosures that are material to the financial statements and (2) involved our especially challenging, subjective, or complex judgments. The communication of critical audit matters does not alter in any way our opinion on the financial statements, taken as a whole, and we are not, by communicating the critical audit matters below, providing separate opinions on the critical audit matters or on the accounts or disclosures to which they relate.
Patient Accounts Receivable — Refer to Note 1 to the financial statements
Critical Audit Matter Description
Patient accounts receivable are recorded net of implicit price concessions for insured and self-pay patients. Implicit price concessions related to self-pay patients require more extensive judgment and subjective assumptions. Self-pay price concessions relate primarily to amounts due directly from patients and are based upon management’s assessment of historical write-offs and expected net collections, business and economic conditions, trends in federal, state, and private employer health care coverage, and other collection indicators.
Auditing management’s estimate of self-pay price concessions was complex and judgmental due to the significant data inputs and subjective assumptions utilized in determining related amounts.
77
How the Critical Audit Matter Was Addressed in the Audit
Our audit procedures related to the net realizable value of self-pay accounts receivable included the following, among others:
|
|
• |
We tested management’s internal controls that address the risks of material misstatement related to the Company’s estimation of implicit self-pay price concessions. |
|
|
• |
We evaluated management’s methodology and related assumptions, including cash collections, by comparing actual results to management’s historical estimates. |
|
|
• |
We tested the underlying data related to the recognition of patient level charges and the subsequent activities, including cash collections and non-cash adjustments. |
|
|
• |
We tested the mathematical accuracy of the estimates applied to period-end accounts receivable. |
|
|
• |
We evaluated the appropriateness of the industry, economic, and Company factors that were used in determining the net realizable value of self-pay accounts receivable. |
Professional Liability Claims — Refer to Note 15 to the financial statements
Critical Audit Matter Description
The Company is self-insured for professional liability claims up to certain self-insured retention limits based on the policy year. Professional liabilities consist of the projected settlement value of reported and unreported claims. The self-insurance reserves are estimated based on the Company’s historical claims experience, supplemented with industry experience, as necessary, and is established using actuarial methods followed in the insurance industry.
Auditing management’s professional liability reserves was complex and judgmental due to the significant estimations required in determining the projected settlement value of reported and unreported claims.
How the Critical Audit Matter Was Addressed in the Audit
Our audit procedures related to the self-insured professional liability claims included the following, among others:
|
|
• |
We tested management’s internal controls that address the risks of material misstatement related to professional liability claims, including those over the projection of the settlement value of reported and unreported claims. |
|
|
• |
We evaluated the assumptions used by management to estimate the self-insurance reserves by: |
|
|
- |
Testing the underlying data that served as the basis for the actuarial analysis, including historical claims, to test that the inputs to the actuarial estimate were reasonable. |
|
|
- |
Comparing management’s prior-year assumptions of expected development and ultimate loss to actual amounts incurred during the current year to identify potential bias in the determination of the self-insurance reserves. |
|
|
• |
With the assistance of our actuarial specialists, we developed independent estimates of the professional liability claims, including loss data and industry claim development factors, and compared our estimates to management’s estimates. |
/s/
February 17, 2022
We have served as the Company’s auditor since 1996.
78
COMMUNITY HEALTH SYSTEMS, INC. AND SUBSIDIARIES
CONSOLIDATED STATEMENTS OF INCOME (LOSS)
|
|
|
Year Ended December 31, |
|
|||||||||
|
|
|
2021 |
|
|
2020 |
|
|
2019 |
|
|||
|
|
|
(In millions, except share and per share data) |
|
|||||||||
|
Net operating revenues |
|
$ |
|
|
|
$ |
|
|
|
$ |
|
|
|
Operating costs and expenses: |
|
|
|
|
|
|
|
|
|
|
|
|
|
Salaries and benefits |
|
|
|
|
|
|
|
|
|
|
|
|
|
Supplies |
|
|
|
|
|
|
|
|
|
|
|
|
|
Other operating expenses |
|
|
|
|
|
|
|
|
|
|
|
|
|
Government and other legal settlements and related costs |
|
|
— |
|
|
|
— |
|
|
|
|
|
|
Electronic health records incentive reimbursement |
|
|
— |
|
|
|
— |
|
|
|
( |
) |
|
Lease cost and rent |
|
|
|
|
|
|
|
|
|
|
|
|
|
Pandemic relief funds |
|
|
( |
) |
|
|
( |
) |
|
|
— |
|
|
Depreciation and amortization |
|
|
|
|
|
|
|
|
|
|
|
|
|
Impairment and (gain) loss on sale of businesses, net |
|
|
|
|
|
|
|
|
|
|
|
|
|
Total operating costs and expenses |
|
|
|
|
|
|
|
|
|
|
|
|
|
Income from operations |
|
|
|
|
|
|
|
|
|
|
|
|
|
Interest expense, net of interest income of $ |
|
|
|
|
|
|
|
|
|
|
|
|
|
Loss (gain) from early extinguishment of debt |
|
|
|
|
|
|
( |
) |
|
|
|
|
|
Gain on sale of equity interests in Macon Healthcare, LLC |
|
|
( |
) |
|
|
— |
|
|
|
— |
|
|
Equity in earnings of unconsolidated affiliates |
|
|
( |
) |
|
|
( |
) |
|
|
( |
) |
|
Income (loss) before income taxes |
|
|
|
|
|
|
|
|
|
|
( |
) |
|
Provision for (benefit from) income taxes |
|
|
|
|
|
|
( |
) |
|
|
|
|
|
Net income (loss) |
|
|
|
|
|
|
|
|
|
|
( |
) |
|
Less: Net income attributable to noncontrolling interests |
|
|
|
|
|
|
|
|
|
|
|
|
|
Net income (loss) attributable to Community Health Systems, Inc. stockholders |
|
$ |
|
|
|
$ |
|
|
|
$ |
( |
) |
|
Earnings (loss) per share attributable to Community Health Systems, Inc. stockholders: |
|
|
|
|
|
|
|
|
|
|
|
|
|
Basic |
|
$ |
|
|
|
$ |
|
|
|
$ |
( |
) |
|
Diluted |
|
$ |
|
|
|
$ |
|
|
|
$ |
( |
) |
|
Weighted-average number of shares outstanding: |
|
|
|
|
|
|
|
|
|
|
|
|
|
Basic |
|
|
|
|
|
|
|
|
|
|
|
|
|
Diluted |
|
|
|
|
|
|
|
|
|
|
|
|
See accompanying notes to the consolidated financial statements.
79
COMMUNITY HEALTH SYSTEMS, INC. AND SUBSIDIARIES
CONSOLIDATED STATEMENTS OF COMPREHENSIVE INCOME (LOSS)
|
|
|
Year Ended December 31, |
|
|||||||||
|
|
|
2021 |
|
|
2020 |
|
|
2019 |
|
|||
|
|
|
|
|
|
|
(In millions) |
|
|
|
|
|
|
|
Net income (loss) |
|
$ |
|
|
|
$ |
|
|
|
$ |
( |
) |
|
Other comprehensive (loss) income, net of income taxes: |
|
|
|
|
|
|
|
|
|
|
|
|
|
Net change in fair value of interest rate swaps, net of tax of $ for the years ended December 31, 2021 and 2020 and $ ended December 31, 2019 |
|
|
— |
|
|
|
( |
) |
|
|
( |
) |
|
Net change in fair value of available-for-sale debt securities, net of tax |
|
|
( |
) |
|
|
|
|
|
|
|
|
|
Amortization and recognition of unrecognized pension cost components, net of tax of $ December 31, 2021, 2020 and 2019, respectively |
|
|
|
|
|
|
( |
) |
|
|
— |
|
|
Other comprehensive (loss) income |
|
|
( |
) |
|
|
( |
) |
|
|
|
|
|
Comprehensive income (loss) |
|
|
|
|
|
|
|
|
|
|
( |
) |
|
Less: Comprehensive income attributable to noncontrolling interests |
|
|
|
|
|
|
|
|
|
|
|
|
|
Comprehensive income (loss) attributable to Community Health Systems, Inc. stockholders |
|
$ |
|
|
|
$ |
|
|
|
$ |
( |
) |
See accompanying notes to the consolidated financial statements.
80
COMMUNITY HEALTH SYSTEMS, INC. AND SUBSIDIARIES
CONSOLIDATED BALANCE SHEETS
|
|
|
December 31, 2021 |
|
|
December 31, 2020 |
|
||
|
|
|
(In millions, except share data) |
|
|||||
|
ASSETS |
|
|
|
|
|
|
|
|
|
Current assets: |
|
|
|
|
|
|
|
|
|
Cash and cash equivalents |
|
$ |
|
|
|
$ |
|
|
|
Patient accounts receivable (see Note 1) |
|
|
|
|
|
|
|
|
|
Supplies |
|
|
|
|
|
|
|
|
|
Prepaid income taxes |
|
|
|
|
|
|
|
|
|
Prepaid expenses and taxes |
|
|
|
|
|
|
|
|
|
Other current assets |
|
|
|
|
|
|
|
|
|
Total current assets |
|
|
|
|
|
|
|
|
|
Property and equipment |
|
|
|
|
|
|
|
|
|
Land and improvements |
|
|
|
|
|
|
|
|
|
Buildings and improvements |
|
|
|
|
|
|
|
|
|
Equipment and fixtures |
|
|
|
|
|
|
|
|
|
Property and equipment |
|
|
|
|
|
|
|
|
|
Less accumulated depreciation and amortization |
|
|
( |
) |
|
|
( |
) |
|
Property and equipment, net |
|
|
|
|
|
|
|
|
|
Goodwill |
|
|
|
|
|
|
|
|
|
Deferred income taxes |
|
|
|
|
|
|
|
|
|
Other assets, net of accumulated amortization of $ and 2020, respectively |
|
|
|
|
|
|
|
|
|
Total assets |
|
$ |
|
|
|
$ |
|
|
|
LIABILITIES AND STOCKHOLDERS’ DEFICIT |
|
|
|
|
|
|
|
|
|
Current liabilities: |
|
|
|
|
|
|
|
|
|
Current maturities of long-term debt |
|
$ |
|
|
|
$ |
|
|
|
Current operating lease liabilities |
|
|
|
|
|
|
|
|
|
Accounts payable |
|
|
|
|
|
|
|
|
|
Accrued liabilities: |
|
|
|
|
|
|
|
|
|
Employee compensation |
|
|
|
|
|
|
|
|
|
Accrued interest |
|
|
|
|
|
|
|
|
|
Other |
|
|
|
|
|
|
|
|
|
Total current liabilities |
|
|
|
|
|
|
|
|
|
Long-term debt |
|
|
|
|
|
|
|
|
|
Deferred income taxes |
|
|
|
|
|
|
|
|
|
Long-term operating lease liabilities |
|
|
|
|
|
|
|
|
|
Other long-term liabilities |
|
|
|
|
|
|
|
|
|
Total liabilities |
|
|
|
|
|
|
|
|
|
Redeemable noncontrolling interests in equity of consolidated subsidiaries |
|
|
|
|
|
|
|
|
|
Commitments and contingencies (Note 15) |
|
|
|
|
|
|
|
|
|
STOCKHOLDERS’ DEFICIT |
|
|
|
|
|
|
|
|
|
Community Health Systems, Inc. stockholders’ deficit: |
|
|
|
|
|
|
|
|
|
Preferred stock, $ |
|
|
|
|
|
|
|
|
|
Common stock, $ |
|
|
|
|
|
|
|
|
|
Additional paid-in capital |
|
|
|
|
|
|
|
|
|
Accumulated other comprehensive loss |
|
|
( |
) |
|
|
( |
) |
|
Accumulated deficit |
|
|
( |
) |
|
|
( |
) |
|
Total Community Health Systems, Inc. stockholders’ deficit |
|
|
( |
) |
|
|
( |
) |
|
Noncontrolling interests in equity of consolidated subsidiaries |
|
|
|
|
|
|
|
|
|
Total stockholders’ deficit |
|
|
( |
) |
|
|
( |
) |
|
Total liabilities and stockholders’ deficit |
|
$ |
|
|
|
$ |
|
|
See accompanying notes to the consolidated financial statements.
81
COMMUNITY HEALTH SYSTEMS, INC. AND SUBSIDIARIES
CONSOLIDATED STATEMENTS OF STOCKHOLDERS’ DEFICIT
|
|
|
|
|
|
|
|
Community Health Systems, Inc. Stockholders |
|
|
|
|
|
|
|
|
|
|||||||||||||||||
|
|
|
Redeemable Noncontrolling |
|
|
|
Common Stock |
|
|
Additional Paid-in |
|
|
Accumulated Other Comprehensive |
|
|
Accumulated |
|
|
Noncontrolling |
|
|
Total Stockholders’ |
|
|||||||||||
|
|
|
Interests |
|
|
|
Shares |
|
|
Amount |
|
|
Capital |
|
|
Income (Loss) |
|
|
Deficit |
|
|
Interests |
|
|
Deficit |
|
||||||||
|
|
|
|
|
|
|
|
(In millions, except share data) |
|
|||||||||||||||||||||||||
|
Balance, December 31, 2018 |
|
$ |
|
|
|
|
|
|
|
|
$ |
|
|
|
$ |
|
|
|
$ |
( |
) |
|
$ |
( |
) |
|
$ |
|
|
|
$ |
( |
) |
|
Comprehensive income (loss) |
|
|
|
|
|
|
|
- |
|
|
|
- |
|
|
|
- |
|
|
|
|
|
|
|
( |
) |
|
|
|
|
|
|
( |
) |
|
Contributions from noncontrolling interests |
|
|
|
|
|
|
|
- |
|
|
|
- |
|
|
|
- |
|
|
|
- |
|
|
|
- |
|
|
|
|
|
|
|
|
|
|
Distributions to noncontrolling interests |
|
|
( |
) |
|
|
|
- |
|
|
|
- |
|
|
|
- |
|
|
|
- |
|
|
|
- |
|
|
|
( |
) |
|
|
( |
) |
|
Purchase of subsidiary shares from noncontrolling interests |
|
|
( |
) |
|
|
|
- |
|
|
|
- |
|
|
|
|
|
|
|
- |
|
|
|
- |
|
|
|
( |
) |
|
|
( |
) |
|
Other reclassifications of noncontrolling interests |
|
|
( |
) |
|
|
|
- |
|
|
|
- |
|
|
|
- |
|
|
|
- |
|
|
|
- |
|
|
|
|
|
|
|
|
|
|
Adjustment to redemption value of redeemable noncontrolling interests |
|
|
|
|
|
|
|
- |
|
|
|
- |
|
|
|
( |
) |
|
|
- |
|
|
|
- |
|
|
|
- |
|
|
|
( |
) |
|
Cancellation of restricted stock for tax withholdings on vested shares |
|
|
- |
|
|
|
|
( |
) |
|
|
- |
|
|
|
( |
) |
|
|
- |
|
|
|
- |
|
|
|
- |
|
|
|
( |
) |
|
Income tax payable increase from vesting of restricted shares |
|
|
- |
|
|
|
|
|
|
|
|
- |
|
|
|
- |
|
|
|
- |
|
|
|
- |
|
|
|
- |
|
|
|
- |
|
|
Stock-based compensation |
|
|
- |
|
|
|
|
|
|
|
|
- |
|
|
|
|
|
|
|
- |
|
|
|
- |
|
|
|
- |
|
|
|
|
|
|
Balance, December 31, 2019 |
|
|
|
|
|
|
|
|
|
|
|
|
|
|
|
|
|
|
|
( |
) |
|
|
( |
) |
|
|
|
|
|
|
( |
) |
|
Comprehensive income (loss) |
|
|
|
|
|
|
|
- |
|
|
|
- |
|
|
|
- |
|
|
|
( |
) |
|
|
|
|
|
|
|
|
|
|
|
|
|
Contributions from noncontrolling interests |
|
|
- |
|
|
|
|
- |
|
|
|
- |
|
|
|
- |
|
|
|
- |
|
|
|
- |
|
|
|
|
|
|
|
|
|
|
Distributions to noncontrolling interests |
|
|
( |
) |
|
|
|
- |
|
|
|
- |
|
|
|
- |
|
|
|
- |
|
|
|
- |
|
|
|
( |
) |
|
|
( |
) |
|
Purchase of subsidiary shares from noncontrolling interests |
|
|
( |
) |
|
|
|
- |
|
|
|
- |
|
|
|
|
|
|
|
- |
|
|
|
- |
|
|
|
- |
|
|
|
|
|
|
Other reclassifications of noncontrolling interests |
|
|
|
|
|
|
|
- |
|
|
|
- |
|
|
|
- |
|
|
|
- |
|
|
|
- |
|
|
|
( |
) |
|
|
( |
) |
|
Disposition of less-than-wholly owned hospital |
|
|
( |
) |
|
|
|
- |
|
|
|
- |
|
|
|
- |
|
|
|
- |
|
|
|
- |
|
|
|
|
|
|
|
- |
|
|
Adjustment to redemption value of redeemable noncontrolling interests |
|
|
|
|
|
|
|
- |
|
|
|
- |
|
|
|
( |
) |
|
|
- |
|
|
|
- |
|
|
|
- |
|
|
|
( |
) |
|
Cancellation of restricted stock for tax withholdings on vested shares |
|
|
- |
|
|
|
|
( |
) |
|
|
- |
|
|
|
( |
) |
|
|
- |
|
|
|
- |
|
|
|
- |
|
|
|
( |
) |
|
Issuance of common stock in connection with the exercise of stock options |
|
|
- |
|
|
|
|
|
|
|
|
- |
|
|
|
- |
|
|
|
- |
|
|
|
- |
|
|
|
- |
|
|
|
- |
|
|
Income tax payable increase from vesting of restricted shares |
|
|
- |
|
|
|
|
|
|
|
|
- |
|
|
|
- |
|
|
|
- |
|
|
|
- |
|
|
|
- |
|
|
|
- |
|
|
Section 3(a)(9) exchange |
|
|
- |
|
|
|
|
|
|
|
|
|
|
|
|
|
|
|
|
|
|
|
|
|
|
|
|
|
|
|
|
|
|
|
Stock-based compensation |
|
|
- |
|
|
|
|
|
|
|
|
- |
|
|
|
|
|
|
|
- |
|
|
|
- |
|
|
|
- |
|
|
|
|
|
|
Balance, December 31, 2020 |
|
|
|
|
|
|
|
|
|
|
|
|
|
|
|
|
|
|
|
( |
) |
|
|
( |
) |
|
|
|
|
|
|
( |
) |
|
Comprehensive income (loss) |
|
|
|
|
|
|
|
- |
|
|
|
- |
|
|
|
- |
|
|
|
( |
) |
|
|
|
|
|
|
|
|
|
|
|
|
|
Contributions from noncontrolling interests |
|
|
|
|
|
|
|
- |
|
|
|
- |
|
|
|
- |
|
|
|
- |
|
|
|
- |
|
|
|
- |
|
|
|
- |
|
|
Distributions to noncontrolling interests |
|
|
( |
) |
|
|
|
- |
|
|
|
- |
|
|
|
- |
|
|
|
- |
|
|
|
- |
|
|
|
( |
) |
|
|
( |
) |
|
Purchase of subsidiary shares from noncontrolling interests |
|
|
( |
) |
|
|
|
- |
|
|
|
- |
|
|
|
|
|
|
|
- |
|
|
|
- |
|
|
|
( |
) |
|
|
|
|
|
Other reclassifications of noncontrolling interests |
|
|
|
|
|
|
|
- |
|
|
|
- |
|
|
|
- |
|
|
|
|
|
|
|
- |
|
|
|
- |
|
|
|
|
|
|
Disposition of less-than-wholly owned hospital |
|
|
( |
) |
|
|
|
- |
|
|
|
- |
|
|
|
- |
|
|
|
- |
|
|
|
- |
|
|
|
- |
|
|
|
- |
|
|
Noncontrolling interests in acquired entity |
|
|
|
|
|
|
|
- |
|
|
|
- |
|
|
|
- |
|
|
|
- |
|
|
|
- |
|
|
|
- |
|
|
|
- |
|
|
Adjustment to redemption value of redeemable noncontrolling interests |
|
|
|
|
|
|
|
- |
|
|
|
- |
|
|
|
( |
) |
|
|
- |
|
|
|
- |
|
|
|
- |
|
|
|
( |
) |
|
Cancellation of restricted stock for tax withholdings on vested shares |
|
|
- |
|
|
|
|
( |
) |
|
|
- |
|
|
|
( |
) |
|
|
- |
|
|
|
- |
|
|
|
- |
|
|
|
( |
) |
|
Issuance of common stock in connection with the exercise of stock options |
|
|
- |
|
|
|
|
|
|
|
|
- |
|
|
|
- |
|
|
|
- |
|
|
|
- |
|
|
|
- |
|
|
|
- |
|
|
Stock-based compensation |
|
|
- |
|
|
|
|
|
|
|
|
- |
|
|
|
|
|
|
|
- |
|
|
|
- |
|
|
|
- |
|
|
|
|
|
|
Balance, December 31, 2021 |
|
$ |
|
|
|
|
|
|
|
|
$ |
|
|
|
$ |
|
|
|
$ |
( |
) |
|
$ |
( |
) |
|
$ |
|
|
|
$ |
( |
) |
See accompanying notes to the consolidated financial statements.
82
COMMUNITY HEALTH SYSTEMS, INC. AND SUBSIDIARIES
CONSOLIDATED STATEMENTS OF CASH FLOWS
|
|
|
Year Ended December 31, |
|
|||||||||
|
|
|
2021 |
|
|
2020 |
|
|
2019 |
|
|||
|
|
|
(In millions) |
|
|||||||||
|
Cash flows from operating activities: |
|
|
|
|
|
|
|
|
|
|
|
|
|
Net income (loss) |
|
$ |
|
|
|
$ |
|
|
|
$ |
( |
) |
|
Adjustments to reconcile net income (loss) to net cash (used in) provided by operating activities: |
|
|
|
|
|
|
|
|
|
|
|
|
|
Depreciation and amortization |
|
|
|
|
|
|
|
|
|
|
|
|
|
Deferred income taxes |
|
|
|
|
|
|
( |
) |
|
|
|
|
|
Government and other legal settlements and related costs |
|
|
— |
|
|
|
— |
|
|
|
|
|
|
Stock-based compensation expense |
|
|
|
|
|
|
|
|
|
|
|
|
|
Impairment and (gain) loss on sale of businesses, net |
|
|
|
|
|
|
|
|
|
|
|
|
|
Loss (gain) from early extinguishment of debt |
|
|
|
|
|
|
( |
) |
|
|
|
|
|
Gain on sale of equity interests in Macon Healthcare, LLC |
|
|
( |
) |
|
|
— |
|
|
|
— |
|
|
Other non-cash expenses, net |
|
|
|
|
|
|
|
|
|
|
|
|
|
Changes in operating assets and liabilities, net of effects of acquisitions and divestitures: |
|
|
|
|
|
|
|
|
|
|
|
|
|
Patient accounts receivable |
|
|
( |
) |
|
|
|
|
|
|
|
|
|
Supplies, prepaid expenses and other current assets |
|
|
|
|
|
|
( |
) |
|
|
|
|
|
Medicare accelerated payments |
|
|
— |
|
|
|
|
|
|
|
— |
|
|
Repayment/derecognition of Medicare accelerated payments |
|
|
( |
) |
|
|
( |
) |
|
|
— |
|
|
Pandemic relief funds |
|
|
— |
|
|
|
|
|
|
|
— |
|
|
Accounts payable, accrued liabilities and income taxes |
|
|
|
|
|
|
( |
) |
|
|
( |
) |
|
Other |
|
|
( |
) |
|
|
( |
) |
|
|
( |
) |
|
Net cash (used in) provided by operating activities |
|
|
( |
) |
|
|
|
|
|
|
|
|
|
Cash flows from investing activities: |
|
|
|
|
|
|
|
|
|
|
|
|
|
Acquisitions of facilities and other related businesses |
|
|
( |
) |
|
|
( |
) |
|
|
( |
) |
|
Purchases of property and equipment |
|
|
( |
) |
|
|
( |
) |
|
|
( |
) |
|
Proceeds from disposition of hospitals and other ancillary operations |
|
|
|
|
|
|
|
|
|
|
|
|
|
Proceeds from sale of property and equipment |
|
|
|
|
|
|
|
|
|
|
|
|
|
Purchases of available-for-sale debt securities and equity securities |
|
|
( |
) |
|
|
( |
) |
|
|
( |
) |
|
Proceeds from sales of available-for-sale debt securities and equity securities |
|
|
|
|
|
|
|
|
|
|
|
|
|
Purchases of investments in unconsolidated affiliates |
|
|
( |
) |
|
|
( |
) |
|
|
( |
) |
|
Proceeds from sale of equity interests in Macon Healthcare, LLC |
|
|
|
|
|
|
— |
|
|
|
— |
|
|
Increase in other investments |
|
|
( |
) |
|
|
( |
) |
|
|
( |
) |
|
Net cash (used in) provided by investing activities |
|
|
( |
) |
|
|
|
|
|
|
( |
) |
|
Cash flows from financing activities: |
|
|
|
|
|
|
|
|
|
|
|
|
|
Repurchase of restricted stock shares for payroll tax withholding requirements |
|
|
( |
) |
|
|
( |
) |
|
|
( |
) |
|
Deferred financing costs and other debt-related costs |
|
|
( |
) |
|
|
( |
) |
|
|
( |
) |
|
Proceeds from noncontrolling investors in joint ventures |
|
|
— |
|
|
|
|
|
|
|
|
|
|
Redemption of noncontrolling investments in joint ventures |
|
|
( |
) |
|
|
( |
) |
|
|
( |
) |
|
Distributions to noncontrolling investors in joint ventures |
|
|
( |
) |
|
|
( |
) |
|
|
( |
) |
|
Proceeds from sale-lease back |
|
|
— |
|
|
|
|
|
|
|
|
|
|
Other borrowings |
|
|
|
|
|
|
|
|
|
|
|
|
|
Issuance of long-term debt |
|
|
|
|
|
|
|
|
|
|
|
|
|
Proceeds from ABL Facility |
|
|
— |
|
|
|
|
|
|
|
|
|
|
Repayments of long-term indebtedness |
|
|
( |
) |
|
|
( |
) |
|
|
( |
) |
|
Net cash used in financing activities |
|
|
( |
) |
|
|
( |
) |
|
|
( |
) |
|
Net change in cash and cash equivalents |
|
|
( |
) |
|
|
|
|
|
|
|
|
|
Cash and cash equivalents at beginning of period |
|
|
|
|
|
|
|
|
|
|
|
|
|
Cash and cash equivalents at end of period |
|
$ |
|
|
|
$ |
|
|
|
$ |
|
|
|
Supplemental disclosure of cash flow information: |
|
|
|
|
|
|
|
|
|
|
|
|
|
Interest payments |
|
$ |
( |
) |
|
$ |
( |
) |
|
$ |
( |
) |
|
Income tax (payments) refunds, net |
|
$ |
( |
) |
|
$ |
( |
) |
|
$ |
|
|
See accompanying notes to the consolidated financial statements.
83
COMMUNITY HEALTH SYSTEMS, INC. AND SUBSIDIARIES
NOTES TO CONSOLIDATED FINANCIAL STATEMENTS
1. BASIS OF PRESENTATION AND SIGNIFICANT ACCOUNTING POLICIES
Business. Community Health Systems, Inc. is a holding company and operates no business in its own name. On a consolidated basis, Community Health Systems, Inc. and its subsidiaries (collectively the “Company”) own, lease and operate general acute care hospitals as well as outpatient facilities in communities across the country. As of December 31, 2021, the Company owned or leased
As of December 31, 2021, Indiana, Florida, Texas and Alabama represent the only areas of significant geographic concentration. Net operating revenues generated by the Company’s hospitals in Indiana, as a percentage of consolidated net operating revenues, were
Use of Estimates. The preparation of financial statements in conformity with U.S. generally accepted accounting principles (“GAAP”) requires management to make estimates and assumptions that affect the amounts reported in the consolidated financial statements. Actual results could differ from these estimates under different assumptions or conditions.
Principles of Consolidation. The consolidated financial statements include the accounts of the Parent, its subsidiaries, all of which are controlled by the Parent through majority voting control, and variable interest entities for which the Company is the primary beneficiary. All intercompany accounts, profits and transactions have been eliminated. Noncontrolling interests in less-than-wholly-owned consolidated subsidiaries of the Parent are presented as a component of total equity to distinguish between the interests of the Parent and the interests of the noncontrolling owners. Revenues, expenses and income from these subsidiaries are included in the consolidated amounts as presented on the consolidated statements of income (loss), along with a net income measure that separately presents the amounts attributable to the controlling interests and the amounts attributable to the noncontrolling interests for each of the periods presented. Noncontrolling interests that are redeemable or may become redeemable at a fixed or determinable price at the option of the holder or upon the occurrence of an event outside of the control of the Company are presented in mezzanine equity on the consolidated balance sheets.
Reclassifications. Certain prior period amounts have been reclassified to conform to the current period presentation within the consolidated statements of cash flows.
Cost of Revenue. Substantially all of the Company’s operating costs and expenses are “cost of revenue” items. Operating costs that could be classified as general and administrative by the Company would include the Company’s corporate office costs at its Franklin, Tennessee office which were collectively $
Cash Equivalents. The Company considers highly liquid investments with original maturities of three months or less to be cash equivalents.
Supplies. Supplies, principally medical supplies, are stated at the lower of cost (first-in, first-out basis) or market.
84
COMMUNITY HEALTH SYSTEMS, INC. AND SUBSIDIARIES
NOTES TO CONSOLIDATED FINANCIAL STATEMENTS – (Continued)
The Company also leases certain facilities and equipment under finance leases (see Note 9). Such assets are amortized on a straight-line basis over the lesser of the term of the lease or the remaining useful lives of the applicable assets. During the year ended December 31, 2021, the Company had non-cash investing activity of $
Revenue Recognition.
Net Operating Revenues
Net operating revenues are recorded at the transaction price estimated by the Company to reflect the total consideration due from patients and third-party payors in exchange for providing goods and services in patient care. These services are considered to be a single performance obligation and have a duration of less than one year. Revenues are recorded as these goods and services are provided. The transaction price, which involves significant estimates, is determined based on the Company’s standard charges for the goods and services provided, with a reduction recorded for price concessions related to third party contractual arrangements as well as patient discounts and other patient price concessions. During each of the years ended December 31, 2021, 2020 and 2019, the impact of changes to the inputs used to determine the transaction price was considered immaterial.
Currently, several states utilize supplemental reimbursement programs for the purpose of providing reimbursement to providers that is not specifically tied to an individual’s care, some of which offsets a portion of the cost of providing care to Medicaid and indigent patients. These programs are designed with input from the Centers for Medicare & Medicaid Services (“CMS”) and are funded with a combination of state and federal resources, including, in certain instances, fees or taxes levied on the providers. Under these supplemental programs, the Company recognizes revenue and related expenses in the period in which amounts are estimable and payment is reasonably assured. Reimbursement under these programs is reflected in net operating revenues and fees, taxes or other program-related costs are reflected in other operating expenses.
85
COMMUNITY HEALTH SYSTEMS, INC. AND SUBSIDIARIES
NOTES TO CONSOLIDATED FINANCIAL STATEMENTS – (Continued)
The Company’s net operating revenues during the years ended December 31, 2021, 2020 and 2019 have been presented in the following table based on an allocation of the estimated transaction price with the patient between the primary patient classification of insurance coverage (in millions):
|
|
|
Year Ended December 31, |
|
|||||||||
|
|
|
2021 |
|
|
2020 |
|
|
2019 |
|
|||
|
Medicare |
|
$ |
|
|
|
$ |
|
|
|
$ |
|
|
|
Medicaid |
|
|
|
|
|
|
|
|
|
|
|
|
|
Managed Care and other third-party payors |
|
|
|
|
|
|
|
|
|
|
|
|
|
Self-pay |
|
|
|
|
|
|
( |
) |
|
|
|
|
|
Total |
|
$ |
|
|
|
$ |
|
|
|
$ |
|
|
Patient Accounts Receivable
Patient accounts receivable are recorded at net realizable value based on certain assumptions determined by each payor. For third-party payors including Medicare, Medicaid, and Managed Care, the net realizable value is based on the estimated contractual reimbursement percentage, which is based on current contract prices or historical paid claims data by payor. For self-pay accounts receivable, which includes patients who are uninsured and the patient responsibility portion for patients with insurance, the net realizable value is determined using estimates of historical collection experience without regard to aging category. These estimates are adjusted for estimated conversions of patient responsibility portions, expected recoveries and any anticipated changes in trends.
Patient accounts receivable can be impacted by the effectiveness of the Company’s collection efforts. Additionally, significant changes in payor mix, business office operations, economic conditions or trends in federal and state governmental healthcare coverage could affect the net realizable value of accounts receivable. The Company also continually reviews the net realizable value of accounts receivable by monitoring historical cash collections as a percentage of trailing net operating revenues, as well as by analyzing current period net revenue and admissions by payor classification, days revenue outstanding, the composition of self-pay receivables between pure self-pay patients and the patient responsibility portion of third-party insured receivables, the impact of recent acquisitions and dispositions and the impact of current economic and other events.
Final settlements for some payors and programs are subject to adjustment based on administrative review and audit by third parties. As a result of these final settlements, the Company has recorded amounts due to third-party payors of $
Charity Care
In the ordinary course of business, the Company renders services to patients who are financially unable to pay for hospital care. The Company’s policy is to not pursue collections for such amounts; therefore, the related charges for those patients who are financially unable to pay and that otherwise do not qualify for reimbursement from a governmental program are not reported in net operating revenues, and are thus classified as charity care. The Company determines amounts that qualify for charity care based on the patient’s household income relative to the federal poverty level guidelines, as established by the federal government.
These charity care services are estimated to be $
86
COMMUNITY HEALTH SYSTEMS, INC. AND SUBSIDIARIES
NOTES TO CONSOLIDATED FINANCIAL STATEMENTS – (Continued)
Physician Income Guarantees. The Company enters into physician recruiting agreements under which it supplements physician income to a minimum amount over a period of time, typically
Concentrations of Credit Risk. The Company grants unsecured credit to its patients, most of whom reside in the service area of the Company’s facilities and are insured under third-party payor agreements. Because of the economic diversity of the Company’s facilities and non-governmental third-party payors, Medicare represents the only significant concentration of credit risk from payors. Accounts receivable, net of contractual allowances, from Medicare was $
Accounting for the Impairment or Disposal of Long-Lived Assets. During the year ended December 31, 2021, the Company recorded a net loss on disposal of approximately $
During the year ended December 31, 2020, the Company recorded a total combined net impairment charge and loss on disposal of approximately $
Income Taxes. The Company accounts for income taxes under the asset and liability method, in which deferred income tax assets and liabilities are recognized for the tax consequences of “temporary differences” by applying enacted statutory tax rates applicable to future years to differences between the financial statement carrying amounts and the tax bases of existing assets and liabilities. The effect on deferred taxes of a change in tax rates is recognized in the consolidated statements of income (loss) during the period in which the tax rate change becomes law.
Comprehensive Loss. Comprehensive loss is the change in equity of a business enterprise during a period from transactions and other events and circumstances from non-owner sources.
Segment Reporting. A public company is required to report annual and interim financial and descriptive information about its reportable operating segments. Operating segments, as defined, are components of an enterprise about which separate financial information is available that is evaluated regularly by the chief operating decision maker in deciding how to allocate resources and in assessing performance. Aggregation of similar operating segments into a single reportable operating segment is permitted if the businesses have similar economic characteristics and meet the criteria established by U.S. GAAP. The Company operates a single
87
COMMUNITY HEALTH SYSTEMS, INC. AND SUBSIDIARIES
NOTES TO CONSOLIDATED FINANCIAL STATEMENTS – (Continued)
operating segment represented by hospital operations (which includes the Company's acute care hospitals and related healthcare entities that provide inpatient and outpatient healthcare services).
COVID-19 Pandemic. COVID-19, a disease caused by a novel strain of coronavirus, materially affected the Company’s results of operations during 2020 and continued to affect the Company’s results of operations during the year ended December 31, 2021. Federal and state governments have passed legislation, promulgated regulations and taken other administrative actions intended to assist healthcare providers in providing care to COVID-19 and other patients during the public health emergency. Sources of relief include the Coronavirus Aid, Relief and Economic Security Act (the “CARES Act”), the Paycheck Protection Program and Health Care Enhancement Act (the “PPPHCE Act”), the Consolidated Appropriations Act, 2021 (the “CAA”), and the American Rescue Plan Act of 2021 (the “ARPA”). Together, these stimulus laws authorize over $
Pandemic Relief Funds
Through December 31, 2021, net of amounts that have been repaid to the respective federal, state, or local agency, the Company received approximately $
The recognition of amounts received is conditioned upon the provision of care for individuals with possible or actual cases of COVID-19 after January 31, 2020, certification that payment will be used to prevent, prepare for and respond to coronavirus (such amounts shall reimburse the recipient only for healthcare-related expenses or lost revenues, as defined by the U.S. Department of Health and Human Services Agency (“HHS”), that are attributable to coronavirus), and receipt of the funds. Amounts are recognized as a reduction to operating costs and expenses only to the extent the Company is reasonably assured that underlying conditions have been met. Amounts recognized are denoted by the caption “pandemic relief funds” within the consolidated statements of income (loss).
The Company’s assessment of whether the terms and conditions for amounts received are reasonably assured of having been met is updated each reporting period and considers, among other things, the requirements set forth in the CARES Act and subsequent relief legislation, responses to all applicable frequently asked questions and other interpretive guidance issued by HHS, including the various Post-Payment Notices of Reporting Requirements, the Company’s expenses incurred attributable to the coronavirus, the Company’s results of operations during such period as compared to the Company’s 2020 budget, and the allocation of general and targeted fund distribution payments among subsidiaries of the Company during such period. The HHS guidance, specifically the various Post-Payment Notices of Reporting Requirements and frequently asked questions, set forth the allowable methods for quantifying eligible healthcare related expenses and lost revenues. Only healthcare related expenses attributable to coronavirus that another source has not reimbursed and is not obligated to reimburse are eligible to be claimed. The use of funds calculation takes into account expenses attributable to each respective entity, which for the Company primarily relate to incremental labor and supply costs, as well as lost revenues. The deadlines for using and required timelines for reporting on the use of funds depend on the dates of receipt of the funds. Pandemic relief funds of approximately $
Amounts received through the PHSSEF or state and local programs that have not yet been recognized or otherwise have not been refunded to HHS or the various state and local agencies as of December 31, 2021, total approximately $
88
COMMUNITY HEALTH SYSTEMS, INC. AND SUBSIDIARIES
NOTES TO CONSOLIDATED FINANCIAL STATEMENTS – (Continued)
Medicare Accelerated Payments
With respect to the Medicare Accelerated and Advanced Payment Program, the Company received Medicare accelerated payments of approximately $
New Accounting Pronouncements. In November 2021, the Financial Accounting Standards Board issued Accounting Standards Update (“ASU”) 2021-10, “Government Assistance (Topic 832), Disclosures by Business Entities about Government Assistance.” This ASU provides specific authoritative guidance for the disclosure of government assistance including the nature of assistance received, the accounting for and presentation of assistance received and the significant terms and conditions, including commitments and contingences. This ASU is effective for all entities for financial statements issued for annual periods beginning after December 15, 2021 and may be early adopted. The Company early adopted this ASU beginning with this Annual Report on Form 10-K (“Form 10-K”) for the year ended December 31, 2021.
The Company has evaluated all other recently issued, but not yet effective, ASUs and does not expect the eventual adoption of these ASUs to have a material impact on its consolidated financial position or results of operations.
2. ACCOUNTING FOR STOCK-BASED COMPENSATION
Stock-based compensation awards have been granted under the Community Health Systems, Inc. Amended and Restated 2009 Stock Option and Award Plan, which was amended and restated as of March 17, 2021 and approved by the Company’s stockholders at the annual meeting of stockholders held on May 11, 2021 (the “2009 Plan”).
The 2009 Plan provides for the grant of incentive stock options intended to qualify under Section 422 of the Internal Revenue Code (“IRC”) and for the grant of stock options which do not so qualify, stock appreciation rights, restricted stock, restricted stock units, performance-based shares or units and other share awards. Persons eligible to receive grants under the 2009 Plan include the Company’s directors, officers, employees and consultants. To date, all options granted under the 2009 Plan have been “nonqualified” stock options for tax purposes. Generally, these options vest in
The exercise price of all options granted under the 2009 Plan is equal to the fair value of the Company’s common stock on the option grant date.
The following table reflects the impact of total compensation expense related to stock-based equity plans on the reported operating results for the respective periods (in millions):
|
|
|
Year Ended December 31, |
|
|||||||||
|
|
|
2021 |
|
|
2020 |
|
|
2019 |
|
|||
|
Effect on income (loss) before income taxes |
|
$ |
( |
) |
|
$ |
( |
) |
|
$ |
( |
) |
|
Effect on net income (loss) |
|
$ |
( |
) |
|
$ |
( |
) |
|
$ |
( |
) |
At December 31, 2021, $
89
COMMUNITY HEALTH SYSTEMS, INC. AND SUBSIDIARIES
NOTES TO CONSOLIDATED FINANCIAL STATEMENTS – (Continued)
The fair value of stock options was estimated using the Black Scholes option pricing model with the following assumptions and weighted-average fair values during the years ended December 31, 2021, 2020 and 2019:
|
|
|
Year Ended December 31, |
|
|||||||||
|
|
|
2021 |
|
|
2020 |
|
|
2019 |
|
|||
|
Expected volatility |
|
84.3% - 88.9% |
|
|
|
|
|
|
|
% |
||
|
Expected dividends |
|
|
— |
|
|
|
— |
|
|
|
— |
|
|
Expected term |
|
|
|
|
|
|
|
|
|
|||
|
Risk-free interest rate |
|
0.3% - 0.9% |
|
|
|
|
|
|
|
% |
||
In determining the expected term, the Company examined concentrations of option holdings and historical patterns of option exercises and forfeitures, as well as forward-looking factors, in an effort to determine if there were any discernable employee populations. From this analysis, the Company identified two primary employee populations, one consisting of certain senior executives and the other consisting of substantially all other recipients.
The expected volatility rate was estimated based on historical volatility. In determining expected volatility, the Company also reviewed the market-based implied volatility of actively traded options of its common stock and determined that historical volatility utilized to estimate the expected volatility rate did not differ significantly from the implied volatility.
The expected term computation is based on historical exercise and cancellation patterns and forward-looking factors, where present, for each population identified. The risk-free interest rate is based on the U.S. Treasury yield curve in effect at the time of the grant. The pre-vesting forfeiture rate is based on historical rates and forward-looking factors for each population identified. The Company adjusts the estimated forfeiture rate to its actual experience.
Options outstanding and exercisable under the 2009 Plan as of December 31, 2021, and changes during each of the years in the three-year period prior to December 31, 2021, were as follows (in millions, except share and per share data):
|
|
|
Shares |
|
|
Weighted- Average Exercise Price |
|
|
Weighted- Average Remaining Contractual Term |
|
Aggregate Intrinsic Value as of December 31, 2021 |
|
|||
|
Outstanding at December 31, 2018 |
|
|
|
|
|
$ |
|
|
|
|
|
|
|
|
|
Granted |
|
|
|
|
|
|
|
|
|
|
|
|
|
|
|
Exercised |
|
|
— |
|
|
|
— |
|
|
|
|
|
|
|
|
Forfeited and cancelled |
|
|
( |
) |
|
|
|
|
|
|
|
|
|
|
|
Outstanding at December 31, 2019 |
|
|
|
|
|
|
|
|
|
|
|
|
|
|
|
Granted |
|
|
|
|
|
|
|
|
|
|
|
|
|
|
|
Exercised |
|
|
( |
) |
|
|
|
|
|
|
|
|
|
|
|
Forfeited and cancelled |
|
|
( |
) |
|
|
|
|
|
|
|
|
|
|
|
Outstanding at December 31, 2020 |
|
|
|
|
|
|
|
|
|
|
|
|
|
|
|
Granted |
|
|
|
|
|
|
|
|
|
|
|
|
|
|
|
Exercised |
|
|
( |
) |
|
|
|
|
|
|
|
|
|
|
|
Forfeited and cancelled |
|
|
( |
) |
|
|
|
|
|
|
|
|
|
|
|
Outstanding at December 31, 2021 |
|
|
|
|
|
$ |
|
|
|
|
|
$ |
|
|
|
Exercisable at December 31, 2021 |
|
|
|
|
|
$ |
|
|
|
|
|
$ |
|
|
The weighted-average grant date fair value of stock options granted during the years ended December 31, 2021, 2020 and 2019, respectively, was $
90
COMMUNITY HEALTH SYSTEMS, INC. AND SUBSIDIARIES
NOTES TO CONSOLIDATED FINANCIAL STATEMENTS – (Continued)
The Company has also awarded restricted stock under the 2009 Plan to employees of certain subsidiaries. With respect to time-based vesting restricted stock that has been awarded under the 2009 Plan, the restrictions on these shares have generally lapsed in
Restricted stock outstanding under the 2009 Plan as of December 31, 2021, and changes during each of the years in the three-year period prior to December 31, 2021, were as follows:
|
|
|
Shares |
|
|
Weighted- Average Grant Date Fair Value |
|
||
|
Unvested at December 31, 2018 |
|
|
|
|
|
$ |
|
|
|
Granted |
|
|
|
|
|
|
|
|
|
Vested |
|
|
( |
) |
|
|
|
|
|
Forfeited |
|
|
( |
) |
|
|
|
|
|
Unvested at December 31, 2019 |
|
|
|
|
|
|
|
|
|
Granted |
|
|
|
|
|
|
|
|
|
Vested |
|
|
( |
) |
|
|
|
|
|
Forfeited |
|
|
( |
) |
|
|
|
|
|
Unvested at December 31, 2020 |
|
|
|
|
|
|
|
|
|
Granted |
|
|
|
|
|
|
|
|
|
Vested |
|
|
( |
) |
|
|
|
|
|
Forfeited |
|
|
( |
) |
|
|
|
|
|
Unvested at December 31, 2021 |
|
|
|
|
|
|
|
|
Restricted stock units (“RSUs”) have been granted to the Company’s non-management directors under the 2009 Plan. Each of the Company’s then serving non-management directors received grants under the 2009 Plan of
91
COMMUNITY HEALTH SYSTEMS, INC. AND SUBSIDIARIES
NOTES TO CONSOLIDATED FINANCIAL STATEMENTS – (Continued)
RSUs outstanding under the 2009 Plan as of December 31, 2021, and changes during each of the years in the three-year period prior to December 31, 2021, were as follows:
|
|
|
Shares |
|
|
Weighted- Average Grant Date Fair Value |
|
||
|
Unvested at December 31, 2018 |
|
|
|
|
|
$ |
|
|
|
Granted |
|
|
|
|
|
|
|
|
|
Vested |
|
|
( |
) |
|
|
|
|
|
Forfeited |
|
|
— |
|
|
|
— |
|
|
Unvested at December 31, 2019 |
|
|
|
|
|
|
|
|
|
Granted |
|
|
|
|
|
|
|
|
|
Vested |
|
|
( |
) |
|
|
|
|
|
Forfeited |
|
|
— |
|
|
|
— |
|
|
Unvested at December 31, 2020 |
|
|
|
|
|
|
|
|
|
Granted |
|
|
|
|
|
|
|
|
|
Vested |
|
|
( |
) |
|
|
|
|
|
Forfeited |
|
|
— |
|
|
|
— |
|
|
Unvested at December 31, 2021 |
|
|
|
|
|
|
|
|
3. ACQUISITIONS AND DIVESTITURES
Acquisitions
The Company accounts for all transactions that represent business combinations using the acquisition method of accounting, where the identifiable assets acquired, the liabilities assumed and any noncontrolling interest in the acquired entity are recognized and measured at their fair values on the date the Company obtains control in the acquiree. Such fair values that are not finalized for reporting periods following the acquisition date are estimated and recorded as provisional amounts. Adjustments to these provisional amounts during the measurement period (defined as the date through which all information required to identify and measure the consideration transferred, the assets acquired, the liabilities assumed and any noncontrolling interests has been obtained, limited to one year from the acquisition date) are recorded when identified. Goodwill is determined as the excess of the fair value of the consideration conveyed in the acquisition over the fair value of the net assets acquired.
Effective June 1, 2019, one or more subsidiaries of the Company completed the acquisition of Northwest Mississippi Medical Center in Clarksdale, Mississippi. This healthcare system includes
Other Acquisitions
During the years ended December 31, 2021, 2020 and 2019, one or more subsidiaries of the Company paid approximately $
92
COMMUNITY HEALTH SYSTEMS, INC. AND SUBSIDIARIES
NOTES TO CONSOLIDATED FINANCIAL STATEMENTS – (Continued)
Divestitures
|
Hospital |
|
Buyer |
|
City, State |
|
Licensed Beds |
|
|
Effective Date |
|
|
2021 Divestitures: |
|
|
|
|
|
|
|
|
|
|
|
Lea Regional Medical Center |
|
Covenant Health System |
|
Hobbs, NM |
|
|
|
|
|
|
|
Tennova Healthcare - Tullahoma |
|
Vanderbilt University Medical Center |
|
Tullahoma, TN |
|
|
|
|
|
|
|
Tennova Healthcare - Shelbyville |
|
Vanderbilt University Medical Center |
|
Shelbyville, TN |
|
|
|
|
|
|
|
Northwest Mississippi Medical Center |
|
Delta Health System |
|
Clarksdale, MS |
|
|
|
|
|
|
|
AllianceHealth Midwest |
|
SSM Health Care of Oklahoma, Inc. |
|
Midwest City, OK |
|
|
|
|
|
|
|
|
|
|
|
|
|
|
|
|
|
|
|
2020 Divestitures: |
|
|
|
|
|
|
|
|
|
|
|
Berwick Hospital Center |
|
Fayette Holdings, Inc. |
|
Berwick, PA |
|
|
|
|
|
|
|
Brownwood Regional Medical Center |
|
Hendrick Health System |
|
Brownwood, TX |
|
|
|
|
|
|
|
Abilene Regional Medical Center |
|
Hendrick Health System |
|
Abilene, TX |
|
|
|
|
|
|
|
San Angelo Community Medical Center |
|
Shannon Health System |
|
San Angelo, TX |
|
|
|
|
|
|
|
Bayfront Health St. Petersburg |
|
Orlando Health, Inc. |
|
St. Petersburg, FL |
|
|
|
|
|
|
|
Hill Regional Hospital |
|
AHRK Holdings, LLC |
|
Hillsboro, TX |
|
|
|
|
|
|
|
St. Cloud Regional Medical Center |
|
Orlando Health, Inc. |
|
St. Cloud, FL |
|
|
|
|
|
|
|
Northern Louisiana Medical Center |
|
Allegiance Health Management, Inc. |
|
Ruston, LA |
|
|
|
|
|
|
|
Shands Live Oak Regional Medical Center |
|
HCA |
|
Live Oak, FL |
|
|
|
|
|
|
|
Shands Starke Regional Medical Center |
|
HCA |
|
Starke, FL |
|
|
|
|
|
|
|
Southside Regional Medical Center |
|
Bon Secours Mercy Health System |
|
Petersburg, VA |
|
|
|
|
|
|
|
Southampton Memorial Hospital |
|
Bon Secours Mercy Health System |
|
Franklin, VA |
|
|
|
|
|
|
|
Southern Virginia Regional Medical Center |
|
Bon Secours Mercy Health System |
|
Emporia, VA |
|
|
|
|
|
|
|
|
|
|
|
|
|
|
|
|
|
|
|
2019 Divestitures: |
|
|
|
|
|
|
|
|
|
|
|
Bluefield Regional Medical Center |
|
Princeton Community Hospital Association |
|
Bluefield, WV |
|
|
|
|
|
|
|
Lake Wales Medical Center |
|
Adventist Health System |
|
Lake Wales, FL |
|
|
|
|
|
|
|
Heart of Florida Regional Medical Center |
|
Adventist Health System |
|
Davenport, FL |
|
|
|
|
|
|
|
College Station Medical Center |
|
St. Joseph Regional Health Center |
|
College Station, TX |
|
|
|
|
|
|
|
Tennova Healthcare - Lebanon |
|
Vanderbilt University Medical Center |
|
Lebanon, TN |
|
|
|
|
|
|
|
Chester Regional Medical Center |
|
Medical University Hospital Authority |
|
Chester, SC |
|
|
|
|
|
|
|
Carolinas Hospital System - Florence |
|
Medical University Hospital Authority |
|
Florence, SC |
|
|
|
|
|
|
|
Springs Memorial Hospital |
|
Medical University Hospital Authority |
|
Lancaster, SC |
|
|
|
|
|
|
|
Carolinas Hospital System - Marion |
|
Medical University Hospital Authority |
|
Mullins, SC |
|
|
|
|
|
|
|
Memorial Hospital of Salem County |
|
Community Healthcare Associates, LLC |
|
Salem, NJ |
|
|
|
|
|
|
|
Mary Black Health System - Spartanburg |
|
Spartanburg Regional Healthcare System |
|
Spartanburg, SC |
|
|
|
|
|
|
|
Mary Black Health System - Gaffney |
|
Spartanburg Regional Healthcare System |
|
Gaffney, SC |
|
|
|
|
|
|
The following table discloses amounts included in the consolidated balance sheets for the hospitals classified as held for sale as of December 31, 2020 (in millions). Other assets, net primarily includes the net property and equipment for hospitals held for sale. No hospitals were classified as held for sale as of December 31, 2021 and no divestitures or potential divestitures meet the criteria for reporting as a discontinued operation as of December 31, 2021, 2020, or 2019.
|
|
|
December 31, |
|
||
|
|
|
2020 |
|
||
|
Other current assets |
|
|
$ |
|
|
|
Other assets, net |
|
|
|
|
|
|
Accrued liabilities |
|
|
|
|
|
93
COMMUNITY HEALTH SYSTEMS, INC. AND SUBSIDIARIES
NOTES TO CONSOLIDATED FINANCIAL STATEMENTS – (Continued)
Financial and statistical data reported in this Form 10-K includes operating results for the hospitals that were divested during 2021, 2020 and 2019 through the effective date of each respective transaction.
|
|
|
Year Ended December 31, |
|
|||||||||
|
|
|
2021 |
|
|
2020 |
|
|
2019 |
|
|||
|
(Loss) income before income taxes |
|
$ |
( |
) |
|
$ |
|
|
|
$ |
( |
) |
|
Less: Loss attributable to noncontrolling interests |
|
|
— |
|
|
|
( |
) |
|
|
( |
) |
|
(Loss) income from operations before income taxes attributable |
|
|
|
|
|
|
|
|
|
|
|
|
|
to Community Health Systems, Inc. stockholders |
|
$ |
( |
) |
|
$ |
|
|
|
$ |
( |
) |
The operating results for these divested hospitals included net impairment charges and (gain) loss on disposal of approximately $
On November 30, 2020, one or more subsidiaries of the Company completed the sale of
Other Hospital Closures
Effective September 30, 2020, one or more affiliates of the Company finalized an agreement to terminate the lease and cease operations of Shands Lake Shore Regional Medical Center (
4. GOODWILL AND OTHER INTANGIBLE ASSETS
Goodwill
The changes in the carrying amount of goodwill for the years ended December 31, 2021 and 2020 are as follows (in millions):
|
Balance, beginning balance |
|
2021 |
|
|
2020 |
|
||
|
Goodwill |
|
$ |
|
|
|
$ |
|
|
|
Accumulated impairment losses |
|
|
( |
) |
|
|
( |
) |
|
|
|
|
|
|
|
|
|
|
|
Goodwill acquired as part of acquisitions during current year |
|
|
|
|
|
|
|
|
|
Goodwill allocated to hospitals divested or held for sale |
|
|
( |
) |
|
|
( |
) |
|
|
|
|
|
|
|
|
|
|
|
Balance, end of year |
|
|
|
|
|
|
|
|
|
Goodwill |
|
|
|
|
|
|
|
|
|
Accumulated impairment losses |
|
|
( |
) |
|
|
( |
) |
|
|
|
$ |
|
|
|
$ |
|
|
Goodwill is allocated to each identified reporting unit, which is defined as an operating segment or one level below the operating segment (referred to as a component of the entity). Management has determined that the Company’s operating segment meets the criteria to be classified as a reporting unit. At December 31, 2021, after giving effect to 2021 acquisition and divestiture activity, the Company had approximately $
Goodwill is evaluated for impairment annually and when an event occurs or circumstances change that, more likely than not, reduce the fair value of the reporting unit below its carrying value. The Company performed its last annual goodwill impairment evaluation during the fourth quarter of 2021 using an October 31, 2021 measurement date, which indicated
The Company estimates the fair value of the reporting unit using both a discounted cash flow model as well as a market multiple model. The cash flow forecasts are adjusted by an appropriate discount rate based on the Company’s estimate of a market participant’s weighted-average cost of capital. These models are both based on the Company’s best estimate of future revenues and operating costs
94
COMMUNITY HEALTH SYSTEMS, INC. AND SUBSIDIARIES
NOTES TO CONSOLIDATED FINANCIAL STATEMENTS – (Continued)
and are reconciled to the Company’s consolidated market capitalization, with consideration of the amount a potential acquirer would be required to pay, in the form of a control premium, in order to gain sufficient ownership to set policies, direct operations and control management decisions.
The determination of fair value in the Company’s goodwill impairment analysis is based on an estimate of fair value for the reporting unit utilizing known and estimated inputs at the evaluation date. Some of those inputs include, but are not limited to, the most recent price of the Company’s common stock and fair value of long-term debt, estimates of future revenue and expense growth, estimated market multiples, expected capital expenditures, income tax rates, and costs of invested capital. A detailed evaluation of potential impairment indicators was performed as of December 31, 2021, which specifically considered the volatility of the fair market value of the Company’s outstanding senior secured and unsecured notes and common stock during the year ended December 31, 2021. On the basis of available evidence as of December 31, 2021,
Future estimates of fair value could be adversely affected if the actual outcome of one or more of the assumptions described above changes materially in the future, including a decline in the Company’s stock price and the fair value of its long-term debt, an increase in the volatility of the Company’s stock price and the fair value of its long-term debt, lower than expected hospital volumes and/or net operating revenues, higher market interest rates or increased operating costs. Such changes impacting the calculation of fair value, the risks of which may be amplified by the COVID-19 pandemic, could result in a material impairment charge in the future.
The determination of fair value of the Company’s hospital operations reporting unit as part of its goodwill impairment measurement represents a Level 3 fair value measurement in the fair value hierarchy due to its use of internal projections and unobservable measurement inputs.
Intangible Assets
The weighted-average remaining amortization period for the intangible assets subject to amortization is approximately three years. There are no expected residual values related to these intangible assets. Amortization expense on these intangible assets was less than $
The gross carrying amount of capitalized software for internal use was approximately $
95
COMMUNITY HEALTH SYSTEMS, INC. AND SUBSIDIARIES
NOTES TO CONSOLIDATED FINANCIAL STATEMENTS – (Continued)
5. INCOME TAXES
The provision for (benefit from) income taxes consists of the following (in millions):
|
|
|
Year Ended December 31, |
|
|||||||||
|
|
|
2021 |
|
|
2020 |
|
|
2019 |
|
|||
|
Current: |
|
|
|
|
|
|
|
|
|
|
|
|
|
Federal |
|
$ |
( |
) |
|
$ |
( |
) |
|
$ |
( |
) |
|
State |
|
|
|
|
|
|
|
|
|
|
( |
) |
|
|
|
|
( |
) |
|
|
|
|
|
|
( |
) |
|
Deferred: |
|
|
|
|
|
|
|
|
|
|
|
|
|
Federal |
|
|
|
|
|
|
( |
) |
|
|
|
|
|
State |
|
|
|
|
|
|
( |
) |
|
|
|
|
|
|
|
|
|
|
|
|
( |
) |
|
|
|
|
|
Total provision for (benefit from) income taxes for income (loss) |
|
$ |
|
|
|
$ |
( |
) |
|
$ |
|
|
The following table reconciles the differences between the statutory federal income tax rate and the effective tax rate (dollars in millions):
|
|
|
Year Ended December 31, |
|
|||||||||||||||||||||
|
|
|
2021 |
|
|
2020 |
|
|
2019 |
|
|||||||||||||||
|
|
|
Amount |
|
|
% |
|
|
Amount |
|
|
% |
|
|
Amount |
|
|
% |
|
||||||
|
Provision for (benefit from) income taxes at statutory federal rate |
|
$ |
|
|
|
|
|
% |
|
$ |
|
|
|
|
|
% |
|
$ |
( |
) |
|
|
|
% |
|
State income taxes, net of federal income tax benefit |
|
|
|
|
|
|
|
|
|
|
( |
) |
|
|
( |
) |
|
|
( |
) |
|
|
|
|
|
Net income attributable to noncontrolling interests |
|
|
( |
) |
|
|
( |
) |
|
|
( |
) |
|
|
( |
) |
|
|
( |
) |
|
|
|
|
|
Change in valuation allowance |
|
|
|
|
|
|
|
|
|
|
( |
) |
|
|
( |
) |
|
|
|
|
|
|
( |
) |
|
Nondeductible goodwill |
|
|
— |
|
|
|
— |
|
|
|
|
|
|
|
|
|
|
|
|
|
|
|
( |
) |
|
Amended return adjustments |
|
|
( |
) |
|
|
( |
) |
|
|
— |
|
|
|
— |
|
|
|
— |
|
|
|
— |
|
|
Nondeductible loss on divestiture |
|
|
— |
|
|
|
— |
|
|
|
( |
) |
|
|
( |
) |
|
|
|
|
|
|
( |
) |
|
Other |
|
|
— |
|
|
|
— |
|
|
|
|
|
|
|
|
|
|
|
|
|
|
|
( |
) |
|
Provision for (benefit from) income taxes and effective tax rate for income (loss) |
|
$ |
|
|
|
|
|
% |
|
$ |
( |
) |
|
|
( |
)% |
|
$ |
|
|
|
|
( |
)% |
The Company’s effective tax rates were
96
COMMUNITY HEALTH SYSTEMS, INC. AND SUBSIDIARIES
NOTES TO CONSOLIDATED FINANCIAL STATEMENTS – (Continued)
Deferred income taxes are based on the estimated future tax effects of differences between the financial statement and tax bases of assets and liabilities under the provisions of the enacted tax laws. Deferred income taxes as of December 31, 2021 and 2020 consist of (in millions):
|
|
|
December 31, |
|
|||||||||||||
|
|
|
2021 |
|
|
2020 |
|
||||||||||
|
|
|
Assets |
|
|
Liabilities |
|
|
Assets |
|
|
Liabilities |
|
||||
|
Net operating loss and credit carryforwards |
|
$ |
|
|
|
$ |
— |
|
|
$ |
|
|
|
$ |
— |
|
|
Property and equipment |
|
|
— |
|
|
|
|
|
|
|
— |
|
|
|
|
|
|
Self-insurance liabilities |
|
|
|
|
|
|
— |
|
|
|
|
|
|
|
— |
|
|
Prepaid expenses |
|
|
— |
|
|
|
|
|
|
|
— |
|
|
|
|
|
|
Intangibles |
|
|
— |
|
|
|
|
|
|
|
— |
|
|
|
|
|
|
Investments in unconsolidated affiliates |
|
|
— |
|
|
|
|
|
|
|
— |
|
|
|
|
|
|
Other liabilities |
|
|
— |
|
|
|
|
|
|
|
— |
|
|
|
|
|
|
IRC Section 481(a) - mixed service cost |
|
|
— |
|
|
|
— |
|
|
|
— |
|
|
|
|
|
|
Long-term debt and interest |
|
|
|
|
|
|
— |
|
|
|
|
|
|
|
— |
|
|
Accounts receivable |
|
|
|
|
|
|
— |
|
|
|
|
|
|
|
— |
|
|
IRC Section 163(j) interest limitation |
|
|
|
|
|
|
— |
|
|
|
|
|
|
|
— |
|
|
Accrued vacation |
|
|
|
|
|
|
— |
|
|
|
|
|
|
|
— |
|
|
Accrued bonus |
|
|
|
|
|
|
— |
|
|
|
|
|
|
|
— |
|
|
Other comprehensive income |
|
|
|
|
|
|
— |
|
|
|
|
|
|
|
— |
|
|
Right-of-use assets |
|
|
— |
|
|
|
|
|
|
|
— |
|
|
|
|
|
|
Right-of-use liability |
|
|
|
|
|
|
— |
|
|
|
|
|
|
|
— |
|
|
Stock-based compensation |
|
|
|
|
|
|
— |
|
|
|
|
|
|
|
— |
|
|
Deferred compensation |
|
|
|
|
|
|
— |
|
|
|
|
|
|
|
— |
|
|
IRC Section 481(a) Adjustments |
|
|
— |
|
|
|
|
|
|
|
— |
|
|
|
— |
|
|
Other |
|
|
38 |
|
|
|
— |
|
|
|
|
|
|
|
— |
|
|
Total |
|
|
|
|
|
|
912 |
|
|
|
|
|
|
|
778 |
|
|
Valuation allowance |
|
|
( |
) |
|
|
— |
|
|
|
( |
) |
|
|
— |
|
|
Total deferred income taxes |
|
$ |
|
|
|
$ |
|
|
|
$ |
|
|
|
$ |
|
|
The Company believes that the net deferred tax assets will ultimately be realized, except as noted below. Its conclusion is based on its estimate of future taxable income and the expected timing of temporary difference reversals. The Company has gross federal net operating loss carryforwards of approximately $
The valuation allowance for federal and state jurisdictions where the Company concluded that the associated deferred tax assets would not be realized increased by $
The total amount of unrecognized benefit that would affect the effective tax rate, if recognized, was less than $
It is possible the amount of unrecognized tax benefit could change in the next 12 months as a result of a lapse of the statute of limitations and settlements with taxing authorities; however, the Company does not anticipate the change will have a material impact on the Company’s consolidated results of operations or consolidated financial position.
97
COMMUNITY HEALTH SYSTEMS, INC. AND SUBSIDIARIES
NOTES TO CONSOLIDATED FINANCIAL STATEMENTS – (Continued)
The following is a tabular reconciliation of the total amount of unrecognized tax benefit for the years ended December 31, 2021, 2020 and 2019 (in millions):
|
|
|
Year Ended December 31, |
|
|||||||||
|
|
|
2021 |
|
|
2020 |
|
|
2019 |
|
|||
|
Unrecognized tax benefit, beginning of year |
|
$ |
|
|
|
$ |
|
|
|
$ |
|
|
|
Gross increases — tax positions in current period |
|
|
|
|
|
|
|
|
|
|
|
|
|
Reductions — tax positions in prior period |
|
|
( |
) |
|
|
— |
|
|
|
— |
|
|
Settlements |
|
|
— |
|
|
|
— |
|
|
|
( |
) |
|
Unrecognized tax benefit, end of year |
|
$ |
|
|
|
$ |
|
|
|
$ |
|
|
The Company’s income tax return for the
Cash paid for income taxes, net of refunds received, resulted in net cash paid of $
6. LONG-TERM DEBT
Long-term debt, net of unamortized debt issuance costs and discounts or premiums, consists of the following (in millions):
|
|
|
December 31, |
|
|||||
|
|
|
2021 |
|
|
2020 |
|
||
|
% Senior Notes due |
|
$ |
— |
|
|
$ |
|
|
|
% Senior Secured Notes due |
|
|
— |
|
|
|
|
|
|
% Senior Secured Notes due |
|
|
— |
|
|
|
|
|
|
% Senior Secured Notes due |
|
|
|
|
|
|
|
|
|
|
|
|
|
|
|
|
|
|
|
|
|
|
|
|
|
|
|
|
|
% Senior Secured Notes due |
|
|
|
|
|
|
|
|
|
% Senior Notes due |
|
|
|
|
|
|
|
|
|
|
|
|
|
|
|
|
|
|
|
% Senior Secured Notes due |
|
|
|
|
|
|
— |
|
|
% Junior-Priority Secured Notes due |
|
|
— |
|
|
|
|
|
|
% Junior-Priority Secured Notes due |
|
|
— |
|
|
|
|
|
|
% Junior-Priority Secured Notes due |
|
|
|
|
|
|
— |
|
|
% Junior-Priority Secured Notes due |
|
|
|
|
|
|
— |
|
|
ABL Facility |
|
|
— |
|
|
|
— |
|
|
Finance lease and financing obligations |
|
|
|
|
|
|
|
|
|
Other |
|
|
|
|
|
|
|
|
|
Less: Unamortized deferred debt issuance costs and note premium |
|
|
( |
) |
|
|
( |
) |
|
Total debt |
|
|
|
|
|
|
|
|
|
Less: Current maturities |
|
|
( |
) |
|
|
( |
) |
|
Total long-term debt |
|
$ |
|
|
|
$ |
|
|
6⅞% Senior Notes due 2022
On
98
COMMUNITY HEALTH SYSTEMS, INC. AND SUBSIDIARIES
NOTES TO CONSOLIDATED FINANCIAL STATEMENTS – (Continued)
of a 360-day year comprised of twelve 30-day months. The 6⅞% Senior Notes due 2022 were unconditionally guaranteed on a senior-priority unsecured basis by the Company and each of the CHS current and future domestic subsidiaries that provide guarantees under the revolving asset-based loan facility (the “ABL Facility”), any capital market debt securities of CHS (including CHS᾿ outstanding senior notes) and certain other long-term debt of CHS.
CHS was entitled, at its option, to redeem all or a portion of the 6⅞% Senior Notes due 2022 upon not less than 30 nor more than
Pursuant to a registration rights agreement entered into at the time of the issuance of the 6⅞% Senior Notes due 2022, as a result of an exchange offer made by CHS, all of the 6⅞% Senior Notes due 2022 issued in January 2014 were exchanged in October 2014 for new notes (the “6⅞% Exchange Notes”) having terms substantially identical in all material respects to the 6⅞% Senior Notes due 2022 (except that the exchange notes were issued under a registration statement pursuant to the 1933 Act). References to the 6⅞% Senior Notes due 2022 shall be deemed to be the 6⅞% Exchange Notes unless the context provides otherwise.
On June 22, 2018, CHS issued approximately $
On November 19, 2019, CHS issued approximately $
During the year ended December 31, 2020, the Company extinguished $
6¼% Senior Secured Notes due 2023
On
The 6¼% Senior Secured Notes due 2023 and the related guarantees were secured by shared (i) first-priority liens on the collateral (the “Non-ABL Priority Collateral”) that also secures on a first-priority basis CHS’s senior-priority secured notes and (ii) second-priority liens on the collateral (the “ABL-Priority Collateral”), in each case subject to permitted liens described in the indenture governing the 6¼% Senior Secured Notes due 2023.
CHS was entitled, at its option, to redeem all or a portion of the 6¼% Senior Secured Notes due 2023 at any time prior to March 31, 2020, upon not less than 30 nor more than
99
COMMUNITY HEALTH SYSTEMS, INC. AND SUBSIDIARIES
NOTES TO CONSOLIDATED FINANCIAL STATEMENTS – (Continued)
equity offerings at the redemption price of
CHS had the option to redeem some or all of the 6¼% Senior Secured Notes due 2023 at any time on or after March 31, 2020 upon not less than 30 nor more than 60 days’ notice, at the following redemption prices (expressed as a percentage of principal amount on the redemption date), plus accrued and unpaid interest, if any, to the redemption date (subject to the right of holders of record on the relevant record date to receive interest due on the relevant interest payment date), if redeemed during the periods set forth below:
|
Period |
|
Redemption Price |
|
|
|
March 31, 2020 to March 30, 2021 |
|
|
|
% |
|
March 31, 2021 to March 30, 2022 |
|
|
|
% |
|
March 31, 2022 to March 30, 2023 |
|
|
|
% |
Approximately $
On December 28, 2020, the Company redeemed approximately $
9⅞% Junior-Priority Secured Notes due 2023
On
The 9⅞% Junior-Priority Secured Notes due 2023 and the related guarantees were secured by shared (i) second-priority liens on the Non-ABL Priority Collateral that secures on a first-priority basis the CHS’s senior-priority secured notes and (ii) third-priority liens on the ABL-Priority Collateral that secures on a first-priority basis the ABL Facility (and also secures on a second-priority basis CHS’s senior-priority secured notes), in each case subject to permitted liens described in the indenture governing the 9⅞% Junior-Priority Secured Notes due 2023.
Prior to June 30, 2020, CHS may redeem some or all of the 9⅞% Junior-Priority Secured Notes due 2023 at a redemption price equal to
After June 30, 2020, CHS was entitled, at its option, to redeem all or a portion of the 9⅞% Junior-Priority Secured Notes due 2023 upon not less than 15 nor more than
|
Period |
|
Redemption Price |
|
|
|
June 30, 2020 to June 29, 2021 |
|
|
|
% |
|
June 30, 2021 to June 29, 2022 |
|
|
|
% |
|
June 30, 2022 to June 29, 2023 |
|
|
|
% |
100
COMMUNITY HEALTH SYSTEMS, INC. AND SUBSIDIARIES
NOTES TO CONSOLIDATED FINANCIAL STATEMENTS – (Continued)
The Company redeemed approximately $
In conjunction with the issuance of $
8⅛% Junior-Priority Secured Notes due 2024
On
The 8⅛% Junior-Priority Secured Notes due 2024 and the related guarantees were secured by shared (i) second-priority liens on the Non-ABL Priority Collateral that secures on a first-priority basis the CHS’s senior-priority secured notes and (ii) third-priority liens on the ABL-Priority Collateral that secures on a first-priority basis the ABL Facility (and also secures on a second-priority basis CHS’s senior-priority secured notes), in each case subject to permitted liens described in the indenture governing the 8⅛% Junior-Priority Secured Notes due 2024.
Prior to June 30, 2021, CHS had the option to redeem some or all of the 8⅛% Junior-Priority Secured Notes due 2024 at a redemption price equal to
After June 30, 2021, CHS was entitled, at its option, to redeem all or a portion of the 8⅛% Junior-Priority Secured Notes due 2024 upon not less than 15 nor more than
|
Period |
|
Redemption Price |
|
|
|
June 30, 2021 to June 29, 2022 |
|
|
|
% |
|
June 30, 2022 to June 29, 2023 |
|
|
|
% |
|
June 30, 2023 to June 29, 2024 |
|
|
|
% |
The indentures governing each of the 9⅞% Junior-Priority Secured Notes due 2023 and 8⅛% Junior-Priority Secured Notes due 2024 also prohibited CHS from purchasing, repurchasing, redeeming, defeasing or otherwise acquiring or retiring any outstanding 7⅛% Senior Notes due 2020 with: (a) cash or cash equivalents on hand as of the consummation of such 2018 exchange offers; (b) cash generated from operations; (c) proceeds from assets sales; or (d) proceeds from the issuance of, or in exchange for, secured debt, in each case, prior to May 15, 2020. CHS received a waiver from requisite holders of each series of the 9⅞% Junior-Priority Secured Notes due 2023 and 8⅛% Junior-Priority Secured Notes due 2024 waiving these restrictions prior to consummating the 2019 Exchange Offer.
During the year ended December 31, 2020, the Company extinguished $
On
101
COMMUNITY HEALTH SYSTEMS, INC. AND SUBSIDIARIES
NOTES TO CONSOLIDATED FINANCIAL STATEMENTS – (Continued)
8⅝% Senior Secured Notes due 2024
On
The 8⅝% Senior Secured Notes due 2024 and the related guarantees were secured by shared (i) first-priority liens on the Non-ABL Priority Collateral and (ii) second-priority liens on the ABL Priority Collateral that secures on a first-priority basis the ABL Facility, in each case subject to permitted liens described in the indenture governing the 8⅝% Senior Secured Notes due 2024.
Prior to January 15, 2021, CHS had the option to redeem some or all of the 8⅝% Senior Secured Notes due 2024 at a redemption price equal to
After January 15, 2021, CHS was entitled, at its option, to redeem all or a portion of the 8⅝% Senior Secured Notes due 2024 upon not less than 15 nor more than
|
Period |
|
Redemption Price |
|
|
|
January 15, 2021 to January 14, 2022 |
|
|
|
% |
|
January 15, 2022 to January 14, 2023 |
|
|
|
% |
|
January 15, 2023 to January 14, 2024 |
|
|
|
% |
In conjunction with the issuance of $
6⅝% Senior Secured Notes due 2025
On
The 6⅝% Senior Secured Notes due 2025 bear interest at a rate of
At any time prior to February 15, 2022, CHS may redeem some or all of the 6⅝% Senior Secured Notes due 2025 at a price equal to
102
COMMUNITY HEALTH SYSTEMS, INC. AND SUBSIDIARIES
NOTES TO CONSOLIDATED FINANCIAL STATEMENTS – (Continued)
|
Period |
|
Redemption Price |
|
|
|
February 15, 2022 to February 14, 2023 |
|
|
|
% |
|
February 15, 2023 to February 14, 2024 |
|
|
|
% |
|
February 15, 2024 to February 14, 2025 |
|
|
|
% |
As further described in Note 16 and in conjunction with the issuance of $
8% Senior Secured Notes due 2026
On
The 8% Senior Secured Notes due 2026 are unconditionally guaranteed on a senior-priority secured basis by the Company and each of the CHS current and future domestic subsidiaries that provide guarantees under the ABL Facility, any capital market debt securities of CHS (including CHS᾿ outstanding senior notes) and certain other long-term debt of CHS.
The 8% Senior Secured Notes due 2026 and the related guarantees are secured by shared (i) first-priority liens on the Non-ABL Priority Collateral and (ii) second-priority liens on the ABL Priority Collateral that secures on a first-priority basis the ABL Facility, in each case subject to permitted liens described in the indenture governing the 8% Senior Secured Notes due 2026.
Prior to March 15, 2022, CHS may redeem some or all of the 8% Senior Secured Notes due 2026 at a redemption price equal to 100% of the principal amount of the notes redeemed plus accrued and unpaid interest, if any,
After March 15, 2022, CHS is entitled, at its option, to redeem all or a portion of the 8% Senior Secured Notes due 2026 upon not less than 15 nor more than 60 days’ notice, at the following redemption prices (expressed as a percentage of principal amount on the redemption date), plus accrued and unpaid interest, if any, to the redemption date (subject to the right of holders of record on the relevant record date to receive interest due on the relevant interest payment date), if redeemed during the periods set forth below:
|
Period |
|
Redemption Price |
|
|
|
March 15, 2022 to March 14, 2023 |
|
|
|
% |
|
March 15, 2023 to March 14, 2024 |
|
|
|
% |
|
March 15, 2024 to March 14, 2026 |
|
|
|
% |
8% Senior Secured Notes due 2027
On November 19, 2019, CHS issued approximately $
103
COMMUNITY HEALTH SYSTEMS, INC. AND SUBSIDIARIES
NOTES TO CONSOLIDATED FINANCIAL STATEMENTS – (Continued)
semi-annually in arrears on June 15 and December 15 of each year. Interest on the 8% Senior Secured Notes due 2027 accrues from the initial issuance date of the 8% Senior Secured Notes due 2027. Interest is calculated on the basis of a 360-day year comprised of twelve 30-day months. The 8% Senior Secured Notes due 2027 are scheduled to mature on December 15, 2027. The 8% Senior Secured Notes due 2027 are unconditionally guaranteed on a senior-priority secured basis by the Company and each of CHS’ current and future domestic subsidiaries that provide guarantees under the ABL Facility, any capital market debt securities of CHS (including CHS᾿outstanding senior notes) and certain other long-term debt of CHS.
The 8% Senior Secured Notes due 2027 and the related guarantees are secured by shared (i) first-priority liens on the Non-ABL Priority Collateral and (ii) second-priority liens on the ABL Priority Collateral that secures on a first-priority basis the ABL Facility, in each case subject to permitted liens described in the indenture governing the 8% Senior Secured Notes due 2027.
CHS is entitled, at its option, to redeem all or a portion of the 8% Senior Secured Notes due 2027 at any time prior to December 15, 2022, upon not less than 15 nor more than 60 days’ notice, at a price equal to
CHS may redeem some or all of the 8% Senior Secured Notes due 2027 at any time on or after December 15, 2022 upon not less than 15 nor more than
|
Period |
|
Redemption Price |
|
|
|
December 15, 2022 to December 14, 2023 |
|
|
|
% |
|
December 15, 2023 to December 14, 2024 |
|
|
|
% |
|
December 15, 2024 to December 14, 2027 |
|
|
|
% |
5⅝% Senior Secured Notes due 2027
On
The 5⅝% Senior Secured Notes due 2027 and the related guarantees are secured by shared (i) first-priority liens on the Non-ABL Priority Collateral and (ii) second-priority liens on the ABL Priority Collateral that secures on a first-priority basis the ABL Facility, in each case subject to permitted liens described in the indenture governing the 5⅝% Senior Secured Notes due 2027.
CHS is entitled, at its option, to redeem all or a portion of the 5⅝% Senior Secured Notes due 2027 at any time prior to December 15, 2023, upon not less than 15 nor more than
At any time and from time to time on or after December 15, 2023, CHS may redeem the 5⅝% Senior Secured Notes due 2027 in whole or in part, upon not less than 15 no more than 60 days’ prior written notice at a redemption price equal to the percentage of principal amount set forth below plus accrued and unpaid interest, if any, on the 5⅝% Senior Secured Notes due 2027 redeemed, to,
104
COMMUNITY HEALTH SYSTEMS, INC. AND SUBSIDIARIES
NOTES TO CONSOLIDATED FINANCIAL STATEMENTS – (Continued)
but excluding, the applicable date of redemption, if redeemed during the twelve-month period beginning on December 15 of the years indicated below:
|
Period |
|
Redemption Price |
|
|
|
December 15, 2023 to December 14, 2024 |
|
|
|
% |
|
December 15, 2024 to December 14, 2025 |
|
|
|
% |
|
December 15, 2025 to December 14, 2027 |
|
|
|
% |
6⅞% Senior Notes due 2028
On November 19, 2019, CHS issued approximately $
The 6⅞% Senior Notes due 2028 are unconditionally guaranteed on a senior-priority unsecured basis by the Company and each of the CHS current and future domestic subsidiaries that provide guarantees under the ABL Facility, any capital market debt securities of CHS (including CHS᾿ outstanding senior notes) and certain other long-term debt of CHS.
CHS is entitled, at its option, to redeem all or a portion of the 6⅞% Senior Notes due 2028 at any time prior to April 1, 2023, upon not less than 15 nor more than
CHS may redeem some or all of the 6⅞% Senior Notes due 2028 at any time on or after April 1, 2023 upon not less than 15 nor more than 60 days’ notice, at the following redemption prices (expressed as a percentage of principal amount on the redemption date), plus accrued and unpaid interest, if any, to the redemption date (subject to the right of holders of record on the relevant record date to receive interest due on the relevant interest payment date), if redeemed during the periods set forth below:
|
Period |
|
Redemption Price |
|
|
|
April 1, 2023 to March 31, 2024 |
|
|
|
% |
|
April 1, 2024 to March 31, 2025 |
|
|
|
% |
|
April 1, 2025 to March 31, 2028 |
|
|
|
% |
On December 7, 2020, CHS entered into a privately negotiated agreement with a multi-asset investment manager who has certain funds and accounts which are holders (the “Holders”) of the 6⅞% Senior Notes due 2028. Pursuant to the agreement, the Company exchanged $
During the year ended December 31, 2020, the Company extinguished $
6% Senior Secured Notes due 2029
On December 28, 2020, CHS completed a private offering of $
105
COMMUNITY HEALTH SYSTEMS, INC. AND SUBSIDIARIES
NOTES TO CONSOLIDATED FINANCIAL STATEMENTS – (Continued)
Secured Notes due 2023 that were not validly tendered as of the early tender deadline were redeemed or repurchased via the completion of the tender offer on January 11, 2021 or redemption on January, 28, 2021. The 6% Senior Secured Notes due 2029, which mature on
The 6% Senior Secured Notes due 2029 and the related guarantees are secured by shared (i) first-priority liens on the Non-ABL Priority Collateral and (ii) second-priority liens on the ABL Priority Collateral that secures on a first-priority basis the ABL Facility, in each case subject to permitted liens described in the indenture governing the 6% Senior Secured Notes due 2029.
CHS is entitled, at its option, to redeem all or a portion of the 6% Senior Secured Notes due 2029 at any time prior to January 15, 2024, upon not less than 15 nor more than
At any time and from time to time on or after January 15, 2024, CHS may redeem the 6% Senior Secured Notes due 2029 in whole or in part, upon not less than 15 nor more than 60 days’ prior written notice at a redemption price equal to the percentage of principal amount set forth below plus accrued and unpaid interest, if any, on the 6% Senior Secured Notes due 2029 redeemed, to, but excluding, the applicable date of redemption, if redeemed during the twelve-month period beginning on January 15 of the years indicated below:
|
Period |
|
Redemption Price |
|
|
|
January 15, 2024 to January 14, 2025 |
|
|
|
% |
|
January 15, 2025 to January 14, 2026 |
|
|
|
% |
|
January 15, 2026 to January14, 2029 |
|
|
|
% |
4¾% Senior Secured Notes due 2031
On
The 4¾% Senior Secured Notes due 2031 and the related guarantees are secured by shared (i) first-priority liens on the Non-ABL Priority Collateral and (ii) second-priority liens on the ABL Priority Collateral that secures on a first-priority basis the ABL Facility, in each case subject to permitted liens described in the indenture governing the 4¾% Senior Secured Notes due 2031.
CHS is entitled, at its option, to redeem all or a portion of the % Senior Secured Notes due
CHS may redeem up to
106
COMMUNITY HEALTH SYSTEMS, INC. AND SUBSIDIARIES
NOTES TO CONSOLIDATED FINANCIAL STATEMENTS – (Continued)
At any time and from time to time on or after
|
Period |
|
Redemption Price |
|
|
|
February 15, 2026 to February 14, 2027 |
|
|
|
% |
|
February 15, 2027 to February 14, 2028 |
|
|
|
% |
|
February 15, 2028 to February 14, 2029 |
|
|
|
% |
|
February 15, 2029 to February 14, 2031 |
|
|
|
% |
6⅞% Junior-Priority Secured Notes due 2029
On
The % Junior-Priority Secured Notes due
At any time and from time to time prior to
At any time and from time to time on or after
|
Period |
|
Redemption Price |
|
|
|
April 15, 2024 to April 14, 2025 |
|
|
|
% |
|
April 15, 2025 to April 14, 2026 |
|
|
|
% |
|
April 15, 2026 to April 14, 2029 |
|
|
|
% |
6⅛% Junior-Priority Secured Notes due 2030
On
107
COMMUNITY HEALTH SYSTEMS, INC. AND SUBSIDIARIES
NOTES TO CONSOLIDATED FINANCIAL STATEMENTS – (Continued)
Facility, any capital market debt securities of CHS (including CHS’ outstanding senior notes) and certain other long-term debt of CHS.
The 6⅛% Junior-Priority Secured Notes due 2030 and the related guarantees are secured by shared (i) second-priority liens on the Non-ABL Priority Collateral and (ii) third-priority liens on the ABL Priority Collateral that secures on a first-priority basis the ABL Facility, in each case subject to permitted liens described in the indenture governing the 6⅛% Junior-Priority Secured Notes due 2030.
CHS is entitled, at its option, to redeem all or a portion of the 6⅛% Junior-Priority Secured Notes due 2030 at any time prior to
CHS may redeem up to
At any time and from time to time on or after
|
Period |
|
Redemption Price |
|
|
|
April 1, 2025 to March 31, 2026 |
|
|
|
% |
|
April 1, 2026 to March 31, 2027 |
|
|
|
% |
|
April 1, 2027 to March 31, 2030 |
|
|
|
% |
ABL Facility
On November 22, 2021, the Company and CHS entered into an amendment and restatement agreement (the “Amendment”) to refinance and replace the asset-based loan (ABL) credit agreement (the “ABL Credit Agreement” and, as amended by the Amendment, the “Amended and Restated ABL Credit Agreement”), dated as of April 3, 2018, with JPMorgan Chase Bank, N.A., as administrative agent, and the lenders and other agents party thereto. Pursuant to the Amended and Restated ABL Credit Agreement, the lenders have extended to CHS a revolving asset-based loan facility in the maximum aggregate principal amount of $
Borrowings under the ABL Facility bear interest at a rate per annum equal to an applicable percentage, plus, at the Borrower’s option, either (a) a base rate or (b) the Federal Reserve’s secured overnight financing rate (the “SOFR” rate). The applicable margin under the ABL Facility is determined based on excess availability as a percentage of the maximum commitment amount under the ABL Facility at a rate per annum of
Principal amounts outstanding under the ABL Facility will be due and payable in full on November 22, 2026. The ABL Facility includes a 91-day springing maturity applicable if more than $
108
COMMUNITY HEALTH SYSTEMS, INC. AND SUBSIDIARIES
NOTES TO CONSOLIDATED FINANCIAL STATEMENTS – (Continued)
refinance the foregoing are scheduled to mature or similarly become due on a date prior to November 22, 2026. In such event, principal amounts outstanding under the ABL Facility will be accelerated and all amounts outstanding under the ABL Facility will become immediately due and payable.
The ABL Facility contains customary representations and warranties, subject to limitations and exceptions, and customary covenants restricting the Company’s ability, subject to certain exceptions, to, among other things (1) declare dividends, make distributions or redeem or repurchase capital stock, (2) prepay, redeem or repurchase other debt, (3) incur liens or grant negative pledges, (4) make loans and investments and enter into acquisitions and joint ventures, (5) incur additional indebtedness or provide certain guarantees, (6) engage in mergers, acquisitions and asset sales, (7) conduct transactions with affiliates, (8) alter the nature of the Company’s, CHS’ or the guarantors’ businesses, (9) grant certain guarantees with respect to physician practices, (10) engage in sale and leaseback transactions or (11) change the Company’s fiscal year. The Company is also required to comply with a consolidated fixed coverage ratio, upon certain triggering events described below, and various affirmative covenants. The consolidated fixed coverage ratio is calculated as the ratio of (x) consolidated EBITDA (as defined in the ABL Facility) less capital expenditures to (y) the sum of consolidated interest expense (as defined in the ABL Facility), scheduled principal payments, income taxes and restricted payments made in cash or in permitted investments. For purposes of calculating the consolidated fixed charge coverage ratio, the calculation of consolidated EBITDA as defined in the ABL Facility is a trailing 12-month calculation that begins with the Company’s consolidated net income, with certain adjustments for interest, taxes, depreciation and amortization, net income attributable to noncontrolling interests, stock compensation expense, restructuring costs, and the financial impact of other non-cash or non-recurring items recorded during any such 12-month period. The consolidated fixed charge coverage ratio is a required covenant only in periods where the total borrowings outstanding under the ABL Facility reduce the amount available in the facility to less than the greater of (i) $
In addition, in the event the amount of borrowings and letters of credit outstanding at any time under the ABL Facility exceeds the borrowing base at such time, the Company will be required to, first, repay outstanding borrowings and, second, replace or cash collateralize outstanding letters of credit, in an aggregate amount sufficient to eliminate such excess.
Events of default under the ABL Facility include, but are not limited to, (1) CHS’ failure to pay principal, interest, fees or other amounts under the ABL Facility Agreement when due (taking into account any applicable grace period), (2) any representation or warranty proving to have been materially incorrect when made, (3) covenant defaults subject, with respect to certain covenants, to an available cure and applicable grace periods, (4) bankruptcy and insolvency events, (5) a cross default to certain other debt, (6) certain undischarged judgments (not paid within an applicable grace period), (7) a change of control (as defined), (8) certain ERISA-related defaults and (9) the invalidity or impairment of specified security interests, guarantees or subordination provisions in favor of the ABL Agent or lenders under the ABL Facility.
Financing and repayment transactions discussed above resulted in a pre-tax and after-tax loss from early extinguishment of debt of $
As of December 31, 2021, the scheduled maturities of long-term debt outstanding, including finance lease and financing obligations for each of the next four years and thereafter are as follows (in millions):
|
Year Ending December 31, |
|
Amount |
|
|
|
2022 |
|
$ |
|
|
|
2023 |
|
|
|
|
|
2024 |
|
|
|
|
|
2025 |
|
|
|
|
|
2026 |
|
|
|
|
|
Thereafter |
|
|
|
|
|
Total maturities |
|
|
|
|
|
Less: Deferred debt issuance costs |
|
|
( |
) |
|
Plus: Unamortized note premium |
|
|
( |
) |
|
Total long-term debt |
|
$ |
|
|
109
COMMUNITY HEALTH SYSTEMS, INC. AND SUBSIDIARIES
NOTES TO CONSOLIDATED FINANCIAL STATEMENTS – (Continued)
The Company paid interest of $
Various financing transactions were completed subsequent to December 31, 2021 which are set forth in Note 16.
7. FAIR VALUE OF FINANCIAL INSTRUMENTS
The fair value of financial instruments has been estimated by the Company using available market information as of December 31, 2021 and 2020, and valuation methodologies considered appropriate. The estimates presented in the table below are not necessarily indicative of amounts the Company could realize in a current market exchange (in millions):
|
|
|
December 31, 2021 |
|
|
December 31, 2020 |
|
||||||||||
|
|
|
Carrying |
|
|
Estimated Fair |
|
|
Carrying |
|
|
Estimated Fair |
|
||||
|
|
|
Amount |
|
|
Value |
|
|
Amount |
|
|
Value |
|
||||
|
Assets: |
|
|
|
|
|
|
|
|
|
|
|
|
|
|
|
|
|
Cash and cash equivalents |
|
$ |
|
|
|
$ |
|
|
|
$ |
|
|
|
$ |
|
|
|
Investments in equity securities |
|
|
|
|
|
|
|
|
|
|
|
|
|
|
|
|
|
Available-for-sale debt securities |
|
|
|
|
|
|
|
|
|
|
|
|
|
|
|
|
|
Trading securities |
|
|
|
|
|
|
|
|
|
|
|
|
|
|
|
|
|
Liabilities: |
|
|
|
|
|
|
|
|
|
|
|
|
|
|
|
|
|
6⅞% Senior Notes due |
|
|
— |
|
|
|
— |
|
|
|
|
|
|
|
|
|
|
6¼% Senior Secured Notes due |
|
|
— |
|
|
|
— |
|
|
|
|
|
|
|
|
|
|
8⅝% Senior Secured Notes due |
|
|
— |
|
|
|
— |
|
|
|
|
|
|
|
|
|
|
Senior Secured Notes due |
|
|
|
|
|
|
|
|
|
|
|
|
|
|
|
|
|
|
|
|
|
|
|
|
|
|
|
|
|
|
|
|
|
|
|
|
|
|
|
|
|
|
|
|
|
|
|
|
|
|
|
|
|
Senior Secured Notes due |
|
|
|
|
|
|
|
|
|
|
|
|
|
|
|
|
|
Senior Notes due |
|
|
|
|
|
|
|
|
|
|
|
|
|
|
|
|
|
|
|
|
|
|
|
|
|
|
|
|
|
|
|
|
|
|
|
Senior Secured Notes due |
|
|
|
|
|
|
|
|
|
|
— |
|
|
|
— |
|
|
9⅞% Junior-Priority Secured Notes due |
|
|
— |
|
|
|
— |
|
|
|
|
|
|
|
|
|
|
8⅛% Junior-Priority Secured Notes due |
|
|
— |
|
|
|
— |
|
|
|
|
|
|
|
|
|
|
Junior-Priority Secured Notes due |
|
|
|
|
|
|
|
|
|
|
— |
|
|
|
— |
|
|
Junior-Priority Secured Notes due |
|
|
|
|
|
|
|
|
|
|
— |
|
|
|
— |
|
|
ABL Facility and other debt |
|
|
|
|
|
|
|
|
|
|
|
|
|
|
|
|
The carrying value of the Company’s long-term debt in the above table is presented net of unamortized deferred debt issuance costs. The estimated fair value is determined using the methodologies discussed below in accordance with accounting standards related to the determination of fair value based on the U.S. GAAP fair value hierarchy as discussed in Note 8. The estimated fair value for financial instruments with a fair value that does not equal its carrying value is considered a Level 1 valuation. The Company utilizes the market approach and obtains indicative pricing through publicly available subscription services such as Bloomberg to determine fair values where relevant.
Cash and cash equivalents. The carrying amount approximates fair value due to the short-term maturity of these instruments (less than three months).
Investments in equity securities. Estimated fair value is based on closing price as quoted in public markets.
Available-for-sale debt securities. Estimated fair value is based on closing price as quoted in public markets or other various valuation techniques.
Trading securities. Estimated fair value is based on closing price as quoted in public markets.
Senior Notes, Senior Secured Notes and Junior-Priority Secured Notes. Estimated fair value is based on the closing market price for these notes.
110
COMMUNITY HEALTH SYSTEMS, INC. AND SUBSIDIARIES
NOTES TO CONSOLIDATED FINANCIAL STATEMENTS – (Continued)
ABL Facility and other debt. The carrying amount of the ABL Facility and all other debt approximates fair value due to the nature of these obligations.
8. FAIR VALUE
Fair Value Hierarchy
Fair value is a market-based measurement, not an entity-specific measurement. Therefore, a fair value measurement should be determined based on the assumptions that market participants would use in pricing the asset or liability. As a basis for considering market participant assumptions in fair value measurements, the Company utilizes the U.S. GAAP fair value hierarchy that distinguishes between market participant assumptions based on market data obtained from sources independent of the reporting entity (observable inputs that are classified within Levels 1 and 2 of the hierarchy) and the reporting entity’s own assumption about market participant assumptions (unobservable inputs classified within Level 3 of the hierarchy).
The inputs used to measure fair value are classified into the following fair value hierarchy:
Level 1: Quoted market prices in active markets for identical assets or liabilities.
Level 2: Observable market-based inputs or unobservable inputs that are corroborated by market data.
Level 3: Unobservable inputs that are supported by little or no market activity and are significant to the fair value of the assets or liabilities. Level 3 includes values determined using pricing models, discounted cash flow methodologies, or similar techniques reflecting the Company’s own assumptions.
In instances where the determination of the fair value hierarchy measurement is based on inputs from different levels of the fair value hierarchy, the level in the fair value hierarchy within which the entire fair value measurement falls is based on the lowest level input that is significant to the fair value measurement in its entirety. The Company’s assessment of the significance of a particular input to the fair value measurement in its entirety requires judgment of factors specific to the asset or liability. Transfers between levels within the fair value hierarchy are recognized by the Company on the date of the change in circumstances that requires such transfer. There were
The following table sets forth, by level within the fair value hierarchy, the financial assets recorded at fair value on a recurring basis as of December 31, 2021 and 2020 (in millions):
|
|
|
December 31, 2021 |
|
|
Level 1 |
|
|
Level 2 |
|
|
Level 3 |
|
||||
|
Investments in equity securities |
|
$ |
|
|
|
$ |
|
|
|
$ |
— |
|
|
$ |
— |
|
|
Available-for-sale debt securities |
|
|
|
|
|
|
— |
|
|
|
|
|
|
|
— |
|
|
Trading securities |
|
|
|
|
|
|
— |
|
|
|
|
|
|
|
— |
|
|
Total assets |
|
$ |
|
|
|
$ |
|
|
|
$ |
|
|
|
$ |
— |
|
|
|
|
December 31, 2020 |
|
|
Level 1 |
|
|
Level 2 |
|
|
Level 3 |
|
||||
|
Investments in equity securities |
|
$ |
|
|
|
$ |
|
|
|
$ |
— |
|
|
$ |
— |
|
|
Available-for-sale debt securities |
|
|
|
|
|
|
— |
|
|
|
|
|
|
|
— |
|
|
Trading securities |
|
|
|
|
|
|
— |
|
|
|
|
|
|
|
— |
|
|
Total assets |
|
$ |
|
|
|
$ |
|
|
|
$ |
|
|
|
$ |
— |
|
Investments in Equity Securities, Available-for-Sale Debt Securities and Trading Securities
Investments in equity securities and trading securities classified as Level 1 are measured using quoted market prices. Level 2 available-for-sale debt securities and trading securities primarily consisted of bonds and notes issued by the United States government and its agencies and domestic and foreign corporations. The estimated fair values of these securities are determined using various valuation techniques, including a multi-dimensional relational model that incorporates standard observable inputs and assumptions such as benchmark yields, reported trades, broker/dealer quotes, issuer spreads, benchmark securities, bids/offers and other pertinent reference data.
111
COMMUNITY HEALTH SYSTEMS, INC. AND SUBSIDIARIES
NOTES TO CONSOLIDATED FINANCIAL STATEMENTS – (Continued)
Supplemental information regarding the Company’s available-for-sale debt securities (all of which had no withdrawal restrictions) is set forth in the table below (in millions):
|
|
|
|
|
|
|
Gross |
|
|
Gross |
|
|
Estimated |
|
|||
|
|
|
Amortized |
|
|
Unrealized |
|
|
Unrealized |
|
|
Fair |
|
||||
|
|
|
Cost |
|
|
Gains |
|
|
Losses |
|
|
Values |
|
||||
|
As of December 31, 2021: |
|
|
|
|
|
|
|
|
|
|
|
|
|
|
|
|
|
Government |
|
$ |
|
|
|
$ |
|
|
|
$ |
( |
) |
|
$ |
|
|
|
Corporate |
|
|
|
|
|
|
— |
|
|
|
( |
) |
|
|
|
|
|
Mortgage and asset-backed securities |
|
|
|
|
|
|
— |
|
|
|
— |
|
|
|
|
|
|
Total available-for-sale debt securities |
|
$ |
|
|
|
$ |
|
|
|
$ |
( |
) |
|
$ |
|
|
|
|
|
|
|
|
|
Gross |
|
|
Gross |
|
|
Estimated |
|
|||
|
|
|
Amortized |
|
|
Unrealized |
|
|
Unrealized |
|
|
Fair |
|
||||
|
|
|
Cost |
|
|
Gains |
|
|
Losses |
|
|
Values |
|
||||
|
As of December 31, 2020: |
|
|
|
|
|
|
|
|
|
|
|
|
|
|
|
|
|
Government |
|
$ |
|
|
|
$ |
|
|
|
$ |
— |
|
|
$ |
|
|
|
Corporate |
|
|
|
|
|
|
|
|
|
|
— |
|
|
|
|
|
|
Mortgage and asset-backed securities |
|
|
|
|
|
|
|
|
|
|
— |
|
|
|
|
|
|
Total available-for-sale debt securities |
|
$ |
|
|
|
$ |
|
|
|
$ |
— |
|
|
$ |
|
|
As of December 31, 2021 and 2020, investments with aggregate estimated fair values of approximately $
The contractual maturities of debt-based securities held by the Company as of December 31, 2021 and 2020, excluding mutual fund holdings, are set forth in the table below (in millions). Expected maturities will differ from contractual maturities because the issuers of the debt securities may have the right to prepay their obligations without prepayment penalties.
|
|
|
December 31, 2021 |
|
|
December 31, 2020 |
|
||||||||||
|
|
|
Amortized |
|
|
Estimated |
|
|
Amortized |
|
|
Estimated |
|
||||
|
|
|
Cost |
|
|
Fair Values |
|
|
Cost |
|
|
Fair Values |
|
||||
|
Within 1 year |
|
$ |
|
|
|
$ |
|
|
|
$ |
|
|
|
$ |
|
|
|
After 1 year and through year 5 |
|
|
|
|
|
|
|
|
|
|
|
|
|
|
|
|
|
After 5 years and through year 10 |
|
|
|
|
|
|
|
|
|
|
|
|
|
|
|
|
|
After 10 years |
|
|
|
|
|
|
|
|
|
|
|
|
|
|
|
|
Gross realized gains and losses on sales of available-for-sale debt securities are summarized in the table below (in millions):
|
|
|
Year Ended December 31, |
|
|||||||||
|
|
|
2021 |
|
|
2020 |
|
|
2019 |
|
|||
|
Realized gains |
|
$ |
|
|
|
$ |
|
|
|
$ |
— |
|
|
Realized losses |
|
|
( |
) |
|
|
( |
) |
|
|
— |
|
Other investment income, which includes interest and dividends, related to all investment securities were $
112
COMMUNITY HEALTH SYSTEMS, INC. AND SUBSIDIARIES
NOTES TO CONSOLIDATED FINANCIAL STATEMENTS – (Continued)
Net gains and losses recognized during the years ended December 31, 2021, 2020 and 2019 for investments in equity securities, which are broken out between investments sold during the year and investments held at the end of the year, are summarized in the table below (in millions):
|
|
|
Year Ended December 31, |
|
|||||||||
|
|
|
2021 |
|
|
2020 |
|
|
2019 |
|
|||
|
Net gains and (losses), beginning of year |
|
$ |
|
|
|
$ |
|
|
|
$ |
|
|
|
Less: Net gains and (losses) recognized during the year on equity securities sold during the year |
|
|
|
|
|
|
|
|
|
|
|
|
|
Unrealized gains and (losses) recognized during the year on equity securities held, end of year |
|
$ |
|
|
|
$ |
( |
) |
|
$ |
|
|
9. LEASES
The Company utilizes operating and finance leases for the use of certain hospitals, medical office buildings, and medical equipment. All lease agreements generally require the Company to pay maintenance, repairs, property taxes and insurance costs, which are variable amounts based on actual costs incurred during each applicable period. Such costs are not included in the determination of the ROU asset or lease liability. Variable lease cost also includes escalating rent payments that are not fixed at commencement but are based on an index that is determined in future periods over the lease term based on changes in the Consumer Price Index or other measures of cost inflation. Most leases include one or more options to renew the lease at the end of the initial term, with renewal terms that generally extend the lease at the then market rate of rental payment. Certain leases also include an option to buy the underlying asset at or a short time prior to the termination of the lease. All such options are at the Company’s discretion and are evaluated at the commencement of the lease, with only those that are reasonably certain of exercise included in determining the appropriate lease term.
The components of lease cost and rent expense for the years ended December 31, 2021, 2020 and 2019 are as follows (in millions):
|
|
|
Year Ended December 31, |
|
|||||||||
|
Lease Cost |
|
2021 |
|
|
2020 |
|
|
2019 |
|
|||
|
Operating lease cost: |
|
|
|
|
|
|
|
|
|
|
|
|
|
Operating lease cost |
|
$ |
|
|
|
$ |
|
|
|
$ |
|
|
|
Short-term rent expense |
|
|
|
|
|
|
|
|
|
|
|
|
|
Variable lease cost |
|
|
|
|
|
|
|
|
|
|
|
|
|
Sublease income |
|
|
( |
) |
|
|
( |
) |
|
|
( |
) |
|
Total operating lease cost |
|
$ |
|
|
|
$ |
|
|
|
$ |
|
|
|
Finance lease cost: |
|
|
|
|
|
|
|
|
|
|
|
|
|
Amortization of ROU assets |
|
$ |
|
|
|
$ |
|
|
|
$ |
|
|
|
Interest on finance lease liabilities |
|
|
|
|
|
|
|
|
|
|
|
|
|
Total finance lease cost |
|
$ |
|
|
|
$ |
|
|
|
$ |
|
|
113
COMMUNITY HEALTH SYSTEMS, INC. AND SUBSIDIARIES
NOTES TO CONSOLIDATED FINANCIAL STATEMENTS – (Continued)
Supplemental balance sheet information related to leases was as follows (in millions):
|
|
|
Balance Sheet Classification |
|
December 31, 2021 |
|
|
December 31, 2020 |
|
||
|
Operating Leases: |
|
|
|
|
|
|
|
|
|
|
|
Operating Lease ROU Assets |
|
Other assets, net |
|
$ |
|
|
|
$ |
|
|
|
|
|
|
|
|
|
|
|
|
|
|
|
Finance Leases: |
|
|
|
|
|
|
|
|
|
|
|
Finance Lease ROU Assets |
|
Property and equipment |
|
|
|
|
|
|
|
|
|
|
|
Land and improvements |
|
$ |
|
|
|
$ |
|
|
|
|
|
Buildings and improvements |
|
|
|
|
|
|
|
|
|
|
|
Equipment and fixtures |
|
|
|
|
|
|
|
|
|
|
|
Property and equipment |
|
|
|
|
|
|
|
|
|
|
|
Less accumulated depreciation and amortization |
|
|
( |
) |
|
|
( |
) |
|
|
|
Property and equipment, net |
|
$ |
|
|
|
$ |
|
|
|
|
|
|
|
|
|
|
|
|
|
|
|
Current finance lease liabilities |
|
Current maturities of long-term debt |
|
$ |
|
|
|
$ |
|
|
|
Long-term finance lease liabilities |
|
Long-term debt |
|
|
|
|
|
|
|
|
Supplemental cash flow information related to leases for the years ended December 31, 2021, 2020 and 2019 are as follows (in millions):
|
|
|
Year Ended December 31, |
|
|||||||||
|
Cash flow information |
|
2021 |
|
|
2020 |
|
|
2019 |
|
|||
|
Cash paid for amounts included in the measurement of lease liabilities: |
|
|
|
|
|
|
|
|
|
|
|
|
|
Operating cash flows from operating leases (1) |
|
$ |
|
|
|
$ |
|
|
|
$ |
|
|
|
Operating cash flows from finance leases |
|
|
|
|
|
|
|
|
|
|
|
|
|
Financing cash flows from finance leases |
|
|
|
|
|
|
|
|
|
|
|
|
|
ROU assets obtained in exchange for new finance lease liabilities |
|
|
|
|
|
|
|
|
|
|
|
|
|
ROU assets obtained in exchange for new operating lease liabilities |
|
|
|
|
|
|
|
|
|
|
|
|
|
Weighted-average remaining lease term: |
|
|
|
|
|
|
|
|
|
|
|
|
|
Operating leases |
|
|
|
|
|
|
|
|
|
|||
|
Finance leases |
|
|
|
|
|
|
|
|
|
|||
|
Weighted-average discount rate: |
|
|
|
|
|
|
|
|
|
|
|
|
|
Operating leases |
|
|
|
% |
|
|
|
% |
|
|
|
% |
|
Finance leases |
|
|
|
% |
|
|
|
% |
|
|
|
% |
|
(1) |
Included in the change in other operating assets and liabilities in the consolidated statements of cash flows. |
114
COMMUNITY HEALTH SYSTEMS, INC. AND SUBSIDIARIES
NOTES TO CONSOLIDATED FINANCIAL STATEMENTS – (Continued)
Commitments relating to noncancellable operating and finance leases and financing obligations for each of the next five years and thereafter are as follows (in millions):
|
|
|
|
|
|
|
|
|
|
|
Financing |
|
|
|
Year Ending December 31, |
|
Operating |
|
|
Finance |
|
|
Obligations |
|
|||
|
2022 |
|
$ |
|
|
|
$ |
|
|
|
$ |
|
|
|
2023 |
|
|
|
|
|
|
|
|
|
|
|
|
|
2024 |
|
|
|
|
|
|
|
|
|
|
|
|
|
2025 |
|
|
|
|
|
|
|
|
|
|
|
|
|
2026 |
|
|
|
|
|
|
|
|
|
|
|
|
|
Thereafter |
|
|
|
|
|
|
|
|
|
|
|
|
|
Total minimum future payments |
|
|
|
|
|
|
|
|
|
|
|
|
|
Less: Imputed interest |
|
|
( |
) |
|
|
( |
) |
|
|
|
|
|
Total liabilities |
|
|
|
|
|
|
|
|
|
|
|
|
|
Less: Current portion |
|
|
( |
) |
|
|
( |
) |
|
|
( |
) |
|
Long-term liabilities |
|
$ |
|
|
|
$ |
|
|
|
$ |
|
|
As of December 31, 2021, there were approximately $
10. EMPLOYEE BENEFIT PLANS
The Company maintains various benefit plans, including defined contribution plans, defined benefit plans and deferred compensation plans, for which certain of the Company’s subsidiaries are the plan sponsors. The CHS/Community Health Systems, Inc. Retirement Savings Plan is a defined contribution plan which covers the majority of the Company’s employees. Employees at locations whose employment is covered by collective bargaining agreements are generally eligible to participate in the CHS/Community Health Systems, Inc. Standard 401(k) Plan. Total expense to the Company under the 401(k) plans was $
The Company maintains unfunded deferred compensation plans that allow participants to defer receipt of a portion of their compensation. The liability for the deferred compensation plans was $
The Company provides an unfunded Supplemental Executive Retirement Plan (“SERP”) for certain members of its executive management. The Company uses a December 31 measurement date for the benefit obligations and a January 1 measurement date for its net periodic costs for the SERP. Variances from actuarially assumed rates will result in increases or decreases in benefit obligations and net periodic cost in future periods. Benefits expense under the SERP was $
During 2021, certain members of executive management of the Company that were participants in the SERP retired and met the requirements for payout of their SERP retirement benefit. The SERP payout provisions require payment to the participant in an actuarially determined lump sum amount six months after the participant retires from the Company. There were
The Company had assets of $
115
COMMUNITY HEALTH SYSTEMS, INC. AND SUBSIDIARIES
NOTES TO CONSOLIDATED FINANCIAL STATEMENTS – (Continued)
The Company maintains the CHS/Community Health Systems, Inc. Retirement Income Plan (“Pension Plan”), which is a defined benefit, non-contributory pension plan that covers certain employees at three of its formerly owned hospitals. The Pension Plan provides benefits to covered individuals satisfying certain age and service requirements. Employer contributions to the Pension Plan are in accordance with the minimum funding requirements of the Employee Retirement Income Security Act of 1974, as amended. The Company does not expect to make contributions to the Pension Plan in 2022.
In September 2021, the lifetime obligation of the Pension Plan with respect to certain participants was transferred to a third-party insurer via an irrevocable annuity contract. The third-party insurer began paying benefits to the participants as of November 1, 2021. This action resulted in a partial plan settlement and recognition of a less than $
The Company uses a December 31 measurement date for the benefit obligations and a January 1 measurement date for its net periodic costs for the Pension Plan. Variances from actuarially assumed rates will result in increases or decreases in benefit obligations, net periodic cost and funding requirements in future periods. Benefits expense under the Pension Plan was less than $1 million during the year ended December 31, 2021, inclusive of the aforementioned partial plan settlement, and less than $
11. STOCKHOLDERS’ DEFICIT
Authorized capital shares of the Company include
The Company is a holding company which operates through its subsidiaries. The Company’s ABL Facility and the indentures governing each series of the Company’s outstanding notes contain various covenants under which the assets of the subsidiaries of the Company are subject to certain restrictions relating to, among other matters, dividends and distributions, as referenced in the paragraph below.
The ABL Facility and the indentures governing each series of the Company’s outstanding notes restrict the Company’s subsidiaries from, among other matters, paying dividends and making distributions to the Company, which thereby limits the Company’s ability to pay dividends and/or repurchase stock. As of December 31, 2021, under the most restrictive test in these agreements (and subject to certain exceptions), the Company has approximately $
The following schedule discloses the effects of changes in the Company’s ownership interest in its less-than-wholly-owned subsidiaries on Community Health Systems, Inc. stockholders’ deficit (in millions):
|
|
|
Year Ended December 31, |
|
|||||||||
|
|
|
2021 |
|
|
2020 |
|
|
2019 |
|
|||
|
Net income (loss) attributable to Community Health Systems, |
|
|
|
|
|
|
|
|
|
|
|
|
|
Inc. stockholders |
|
$ |
|
|
|
$ |
|
|
|
$ |
( |
) |
|
Transfers to the noncontrolling interests: |
|
|
|
|
|
|
|
|
|
|
|
|
|
Net increase in Community Health |
|
|
|
|
|
|
|
|
|
|
|
|
|
Systems, Inc. paid-in-capital for |
|
|
|
|
|
|
|
|
|
|
|
|
|
purchase of subsidiary partnership interests |
|
|
|
|
|
|
|
|
|
|
|
|
|
Net transfers to the noncontrolling interests |
|
|
|
|
|
|
|
|
|
|
|
|
|
Change to Community Health Systems, Inc. |
|
|
|
|
|
|
|
|
|
|
|
|
|
stockholders’ deficit from net income (loss) attributable to |
|
|
|
|
|
|
|
|
|
|
|
|
|
Community Health Systems, Inc. stockholders |
|
|
|
|
|
|
|
|
|
|
|
|
|
and transfers to noncontrolling interests |
|
$ |
|
|
|
$ |
|
|
|
$ |
( |
) |
116
COMMUNITY HEALTH SYSTEMS, INC. AND SUBSIDIARIES
NOTES TO CONSOLIDATED FINANCIAL STATEMENTS – (Continued)
12. EARNINGS PER SHARE
The following table sets forth the components of the denominator for the computation of basic and diluted earnings per share for net income (loss) attributable to Community Health Systems, Inc. stockholders:
|
|
|
Year Ended December 31, |
|
|||||||||
|
|
|
2021 |
|
|
2020 |
|
|
2019 |
|
|||
|
Weighted-average number of shares outstanding — basic |
|
|
|
|
|
|
|
|
|
|
|
|
|
Effect of dilutive securities: |
|
|
|
|
|
|
|
|
|
|
|
|
|
Restricted stock awards |
|
|
|
|
|
|
|
|
|
|
— |
|
|
Employee stock options |
|
|
|
|
|
|
|
|
|
|
— |
|
|
Other equity-based awards |
|
|
|
|
|
|
|
|
|
|
— |
|
|
Weighted-average number of shares outstanding — diluted |
|
|
|
|
|
|
|
|
|
|
|
|
|
|
|
Year Ended December 31, |
|
|||||||||
|
|
|
2021 |
|
|
2020 |
|
|
2019 |
|
|||
|
Dilutive securities outstanding not included in the computation of earnings per share because their effect is antidilutive: |
|
|
|
|
|
|
|
|
|
|
|
|
|
Employee stock options and restricted stock awards |
|
|
|
|
|
|
|
|
|
|
|
|
13. EQUITY INVESTMENTS
On
On
In March 2005, the Company began purchasing items, primarily medical supplies, medical equipment and pharmaceuticals, under an agreement with HealthTrust Purchasing Group, L.P. (“HealthTrust”), a group purchasing organization in which the Company is a noncontrolling partner. As of December 31, 2021, the Company had a
The Company’s investment in all of its unconsolidated affiliates was $
117
COMMUNITY HEALTH SYSTEMS, INC. AND SUBSIDIARIES
NOTES TO CONSOLIDATED FINANCIAL STATEMENTS – (Continued)
14. COMPREHENSIVE LOSS
The following tables present information about items reclassified out of accumulated other comprehensive loss (“AOCL”) by component for the years ended December 31, 2021 and 2020 (in millions, net of tax):
|
|
|
|
Change in |
|
|
|
|
|
|
|
|
|
|
|
|
|
|
Fair Value of |
|
|
Change in |
|
|
|
|
|
||
|
|
|
|
Available-for-Sale |
|
|
Unrecognized |
|
|
|
|
|
||
|
|
|
|
Debt |
|
|
Pension Cost |
|
|
|
|
|
||
|
|
|
|
Securities (1) |
|
|
Components |
|
|
AOCL (1) |
|
|||
|
Balance as of December 31, 2020 |
|
|
$ |
|
|
|
$ |
( |
) |
|
$ |
( |
) |
|
Other comprehensive (loss) |
|
|
|
|
|
|
|
|
|
|
|
|
|
|
income before reclassifications |
|
|
|
( |
) |
|
|
|
|
|
|
— |
|
|
Amounts reclassified from |
|
|
|
|
|
|
|
|
|
|
|
|
|
|
AOCL |
|
|
|
( |
) |
|
|
|
|
|
|
( |
) |
|
Net current-period other |
|
|
|
|
|
|
|
|
|
|
|
|
|
|
comprehensive (loss) income |
|
|
|
( |
) |
|
|
|
|
|
|
( |
) |
|
Balance as of December 31, 2021 |
|
|
$ |
( |
) |
|
$ |
( |
) |
|
$ |
( |
) |
__________________________
(1) Totals may not add due to rounding.
|
|
|
|
|
|
|
Change in |
|
|
|
|
|
|
|
|
|
|
|
|
|
|
|
|
|
Fair Value of |
|
|
Change in |
|
|
|
|
|
||
|
|
|
Change in Fair |
|
|
Available-for-Sale |
|
|
Unrecognized |
|
|
|
|
|
|||
|
|
|
Value of Interest |
|
|
Debt |
|
|
Pension Cost |
|
|
|
|
|
|||
|
|
|
Rate Swaps (1) |
|
|
Securities (1) |
|
|
Components |
|
|
AOCL |
|
||||
|
Balance as of December 31, 2019 |
|
$ |
|
|
|
$ |
( |
) |
|
$ |
( |
) |
|
$ |
( |
) |
|
Other comprehensive (loss) |
|
|
|
|
|
|
|
|
|
|
|
|
|
|
|
|
|
income before reclassifications |
|
|
( |
) |
|
|
|
|
|
|
( |
) |
|
|
|
|
|
Amounts reclassified from |
|
|
|
|
|
|
|
|
|
|
|
|
|
|
|
|
|
AOCL |
|
|
— |
|
|
|
|
|
|
|
( |
) |
|
|
( |
) |
|
Net current-period other |
|
|
|
|
|
|
|
|
|
|
|
|
|
|
|
|
|
comprehensive (loss) income |
|
|
( |
) |
|
|
|
|
|
|
( |
) |
|
|
( |
) |
|
Balance as of December 31, 2020 |
|
$ |
— |
|
|
$ |
|
|
|
$ |
( |
) |
|
$ |
( |
) |
__________________________
(1) Totals may not add due to rounding.
The following tables present a subtotal for each significant reclassification to net income (loss) out of AOCL and the line item affected in the accompanying consolidated statements of income (loss) for the years ended December 31, 2021 and 2020 (in millions):
|
|
|
Amount reclassified |
|
|
|
|
|
|
|
from AOCL |
|
|
Affected line item in the |
|
|
|
|
Year Ended |
|
|
statement where net |
|
|
Details about AOCL components |
|
December 31, 2021 |
|
|
(loss) income is presented |
|
|
Amortization of defined benefit pension items |
|
|
|
|
|
|
|
Prior service costs |
|
$ |
( |
) |
|
Salaries and benefits |
|
|
|
|
( |
) |
|
Total before tax |
|
|
|
|
— |
|
|
Tax benefit |
|
|
|
$ |
( |
) |
|
Net of tax |
118
COMMUNITY HEALTH SYSTEMS, INC. AND SUBSIDIARIES
NOTES TO CONSOLIDATED FINANCIAL STATEMENTS – (Continued)
|
|
|
Amount reclassified |
|
|
|
|
|
|
|
from AOCL |
|
|
Affected line item in the |
|
|
|
|
Year Ended |
|
|
statement where net |
|
|
Details about AOCL components |
|
December 31, 2020 |
|
|
income (loss) is presented |
|
|
Amortization of defined benefit pension items |
|
|
|
|
|
|
|
Prior service costs |
|
$ |
( |
) |
|
Salaries and benefits |
|
Settlement losses recognized |
|
|
( |
) |
|
Salaries and benefits |
|
|
|
|
( |
) |
|
Total before tax |
|
|
|
|
|
|
|
Tax benefit |
|
|
|
$ |
|
|
|
Net of tax |
15. COMMITMENTS AND CONTINGENCIES
Construction and Other Capital Commitments. Pursuant to a hospital purchase agreement from the Company’s March 1, 2016 acquisition of Northwest Health – Starke, formerly known as Starke Hospital, the Company is committed to build a replacement facility in Knox, Indiana. Under the terms of such agreement, the construction of the replacement facility for Northwest Health - Starke is required to be completed within
Physician Recruiting Commitments. As part of its physician recruitment strategy, the Company provides income guarantee agreements to certain physicians who agree to relocate to its communities and commit to remain in practice there. Under such agreements, the Company is required to make payments to the physicians in excess of the amounts they earned in their practice up to the amount of the income guarantee. These income guarantee periods are typically for
Professional Liability Claims. As part of the Company’s business of providing healthcare services, it is subject to legal actions alleging liability on its part. The Company accrues for losses resulting from such liability claims, as well as loss adjustment expenses that are out-of-pocket and directly related to such liability claims. These direct out-of-pocket expenses include fees of outside counsel and experts. The Company does not accrue for costs that are part of corporate overhead, such as the costs of in-house legal and risk management departments. The losses resulting from professional liability claims primarily consist of estimates for known claims, as well as estimates for incurred but not reported claims. The estimates are based on specific claim facts, historical claim reporting and payment patterns, the nature and level of hospital operations and actuarially determined projections. The actuarially determined projections are based on the Company’s actual claim data, including historic reporting and payment patterns which have been gathered over an approximate
The net present value of the projected payments was discounted using a weighted-average risk-free rate of
119
COMMUNITY HEALTH SYSTEMS, INC. AND SUBSIDIARIES
NOTES TO CONSOLIDATED FINANCIAL STATEMENTS – (Continued)
The Company’s processes for obtaining and analyzing claims and incident data are standardized across all of its businesses and have been consistent for many years. The Company monitors the outcomes of the medical care services that it provides and for each reported claim, the Company obtains various information concerning the facts and circumstances related to that claim. In addition, the Company routinely monitors current key statistics and volume indicators in its assessment of utilizing historical trends. The average lag period between claim occurrence and payment of a final settlement is between
For purposes of estimating its individual claim accruals, the Company utilizes specific claim information, including the nature of the claim, the expected claim amount, the year in which the claim occurred and the laws of the jurisdiction in which the claim occurred. Once the case accruals for known claims are determined, information is stratified by loss layers and retentions, accident years, reported years and geography. Several actuarial methods are used against this data to produce estimates of ultimate paid losses and reserves for incurred but not reported claims. Each of these methods uses company-specific historical claims data and other information. This company-specific data includes information regarding the Company’s business, including historical paid losses and loss adjustment expenses, historical and current case loss reserves, actual and projected hospital statistical data, a variety of hospital census information, employed physician information, professional liability retentions for each policy year, geographic information and other data.
Based on these analyses the Company determines its estimate of the professional liability claims. The determination of management’s estimate, including the preparation of the reserve analysis that supports such estimate, involves subjective judgment of management. Changes in reserve data or the trends and factors that influence reserve data may signal fundamental shifts in the Company’s future claim development patterns or may simply reflect single-period anomalies. Even if a change reflects a fundamental shift, the full extent of the change may not become evident until years later. Moreover, since the Company’s methods and models use different types of data and the Company selects its liability from the results of all of these methods, it typically cannot quantify the precise impact of such factors on its estimates of the liability. Due to the Company’s standardized and consistent processes for handling claims and the long history and depth of company-specific data, the Company’s methodologies have produced reliably determinable estimates of ultimate paid losses. Management considers any changes in the amount and pattern of its historical paid losses up through the most recent reporting period to identify any fundamental shifts or trends in claim development experience in determining the estimate of professional liability claims. However, due to the subjective nature of this estimate and the impact that previously unforeseen shifts in actual claim experience can have, future estimates of professional liability could be adversely impacted when actual paid losses develop unexpectedly based on assumptions and settlement events that were not previously known or anticipated.
During the year ended December 31, 2020, the Company incurred expenses in the amount of approximately $
The Company is primarily self-insured for professional liability claims; however, the Company obtains excess insurance that transfers the risk of loss to a third-party insurer for claims in excess of the Company’s self-insured retentions. The Company’s excess insurance is underwritten on a claims-made basis. For claims reported prior to June 1, 2002, substantially all of the Company’s professional and general liability risks were subject to a less than $
Excess insurance for all hospitals has been purchased through commercial insurance companies and generally covers the Company for liabilities in excess of the self-insured retentions. The excess coverage consists of multiple layers of insurance, the sum of which
120
COMMUNITY HEALTH SYSTEMS, INC. AND SUBSIDIARIES
NOTES TO CONSOLIDATED FINANCIAL STATEMENTS – (Continued)
totals up to $
Effective June 1, 2014, the hospitals acquired from HMA were insured on a claims-made basis as described above and through commercial insurance companies as described above for substantially all claims reported on or after June 1, 2014 except for physician-related claims with an occurrence date prior to June 1, 2014. Prior to June 1, 2014, the former HMA hospitals obtained insurance coverage through a wholly-owned captive insurance subsidiary and a risk retention group subsidiary which are domiciled in the Cayman Islands and South Carolina, respectively. Those insurance subsidiaries, which are collectively referred to as the “Insurance Subsidiaries,” provided (i) claims-made coverage to all of the former HMA hospitals and (ii) occurrence-basis coverage to most of the physicians employed by the former HMA hospitals. The employed physicians not covered by the Insurance Subsidiaries generally maintained claims-made policies with unrelated third party insurance companies. To mitigate the exposure of the program covering the former HMA hospitals and other healthcare facilities, the Insurance Subsidiaries bought claims-made reinsurance policies from unrelated third parties for claims above self-retention levels of $
Legal Matters. The Company is a party to various legal, regulatory and governmental proceedings incidental to its business. Based on current knowledge, management does not believe that loss contingencies arising from pending legal, regulatory and governmental matters, including the matters described herein, will have a material adverse effect on the consolidated financial position or liquidity of the Company. However, in light of the inherent uncertainties involved in pending legal, regulatory and governmental matters, some of which are beyond the Company’s control, and the very large or indeterminate damages sought in some of these matters, an adverse outcome in one or more of these matters could be material to the Company’s results of operations or cash flows for any particular reporting period.
With respect to all legal, regulatory and governmental proceedings, the Company considers the likelihood of a negative outcome. If the Company determines the likelihood of a negative outcome with respect to any such matter is probable and the amount of the loss can be reasonably estimated, the Company records an accrual for the estimated loss for the expected outcome of the matter. If the likelihood of a negative outcome with respect to material matters is reasonably possible and the Company is able to determine an estimate of the possible loss or a range of loss, whether in excess of a related accrued liability or where there is no accrued liability, the Company discloses the estimate of the possible loss or range of loss. However, the Company is unable to estimate a possible loss or range of loss in some instances based on the significant uncertainties involved in, and/or the preliminary nature of, certain legal, regulatory and governmental matters.
In connection with the spin-off of Quorum Health Corporation (“QHC”), the Company agreed to indemnify QHC for certain liabilities relating to outcomes or events occurring prior to April 29, 2016, the closing date of the spin-off, including (i) certain claims and proceedings that were known to be outstanding at or prior to the consummation of the spin-off and involved multiple facilities and (ii) certain claims, proceedings and investigations by governmental authorities or private plaintiffs related to activities occurring at or related to QHC’s healthcare facilities prior to the closing date of the spin-off, but only to the extent, in the case of clause (ii), that such claims are covered by insurance policies maintained by the Company, including professional liability and employer practices. Notwithstanding the foregoing, the Company is not required to indemnify QHC in respect of any claims or proceedings arising out of or related to the business operations of Quorum Health Resources, LLC at any time or QHC’s compliance with the corporate integrity agreement. Subsequent to the spin-off of QHC, the Office of the Inspector General provided the Company with written assurance that it would look solely at QHC for compliance for its facilities under the Company’s corporate integrity agreement; however, the Office of the Inspector General declined to enter into a separate corporate integrity agreement with QHC.
Summary of Recorded Amounts
The table below presents a reconciliation of the beginning and ending liability balances (in millions) during the years ended December 31, 2021 and 2020, with respect to the Company’s determination of the contingencies of the Company in respect of which
121
COMMUNITY HEALTH SYSTEMS, INC. AND SUBSIDIARIES
NOTES TO CONSOLIDATED FINANCIAL STATEMENTS – (Continued)
an accrual has been recorded. The liability as of December 31, 2021 is comprised of individually insignificant amounts for various matters.
|
|
|
Probable |
|
|
|
|
|
Contingencies |
|
|
|
Balance as of December 31, 2019 |
|
$ |
|
|
|
Expense |
|
|
|
|
|
Reserve for insured claim |
|
|
|
|
|
Cash payments |
|
|
( |
) |
|
Balance as of December 31, 2020 |
|
|
|
|
|
Expense |
|
|
|
|
|
Reserve for insured claim |
|
|
( |
) |
|
Cash payments |
|
|
( |
) |
|
Balance as of December 31, 2021 |
|
$ |
|
|
In accordance with applicable accounting guidance, the Company establishes a liability for litigation, regulatory and governmental matters for which, based on information currently available, the Company believes that a negative outcome is known or is probable and the amount of the loss is reasonably estimable. For all such matters (whether or not discussed in this contingencies footnote), such amounts have been recorded in other accrued liabilities on the consolidated balance sheets and are included in the table above. Due to the uncertainties and difficulty in predicting the ultimate resolution of these contingencies, the actual amount could differ from the estimated amount reflected as a liability on the consolidated balance sheets.
In the aggregate, attorneys’ fees and other costs incurred but not included in the table above related to probable contingencies totaled less than $
16. SUBSEQUENT EVENTS
The Company has evaluated all material events occurring subsequent to the balance sheet date for events requiring disclosure or recognition in the consolidated financial statements. On
The 5¼% Senior Secured Notes due 2030 and the related guarantees are secured by shared (i) first-priority liens on the Non-ABL Priority Collateral and (ii) second-priority liens on the ABL Priority Collateral that secures on a first-priority basis the ABL Facility, in each case subject to permitted liens described in the indenture governing the 5¼% Senior Secured Notes due 2030.
CHS is entitled, at its option, to redeem all or a portion of the 5¼% Senior Secured Notes due 2030 at any time prior to May 15, 2025, upon not less than 10 nor more than
CHS may redeem up to
At any time and from time to time on or after
122
COMMUNITY HEALTH SYSTEMS, INC. AND SUBSIDIARIES
NOTES TO CONSOLIDATED FINANCIAL STATEMENTS – (Continued)
amount set forth below
|
Period |
|
Redemption Price |
|
|
|
May 15, 2025 to May 14, 2026 |
|
|
|
% |
|
May 15, 2026 to May 14, 2027 |
|
|
|
% |
|
May 15, 2027 to May 14, 2030 |
|
|
|
% |
17. CONDENSED FINANCIAL INFORMATION OF PARENT
|
Parent Company Only |
|
|
|
|
|
|
|
|
|
Condensed Balance Sheets |
|
|
|
|
|
|
|
|
|
(In millions) |
|
|
|
|
|
|
|
|
|
|
|
December 31, |
|
|||||
|
|
|
2021 |
|
|
2020 |
|
||
|
ASSETS |
|
|
|
|
|
|
|
|
|
Prepaid income taxes |
|
$ |
|
|
|
$ |
|
|
|
Total current assets |
|
|
|
|
|
|
|
|
|
Deferred income taxes |
|
|
|
|
|
|
|
|
|
Other assets, net |
|
|
— |
|
|
|
( |
) |
|
Total assets |
|
$ |
|
|
|
$ |
|
|
|
LIABILITIES AND STOCKHOLDERS' DEFICIT |
|
|
|
|
|
|
|
|
|
Intercompany payable |
|
$ |
|
|
|
$ |
|
|
|
Deferred income taxes |
|
|
|
|
|
|
|
|
|
Other long-term liabilities |
|
|
|
|
|
|
|
|
|
Total liabilities |
|
|
|
|
|
|
|
|
|
Community Health Systems, Inc. stockholders’ deficit: |
|
|
|
|
|
|
|
|
|
Preferred stock |
|
|
|
|
|
|
|
|
|
Common stock |
|
|
|
|
|
|
|
|
|
Additional paid-in capital |
|
|
|
|
|
|
|
|
|
Accumulated other comprehensive loss |
|
|
( |
) |
|
|
( |
) |
|
Accumulated deficit |
|
|
( |
) |
|
|
( |
) |
|
Total Community Health Systems, Inc. stockholders’ deficit |
|
|
( |
) |
|
|
( |
) |
|
Total liabilities and stockholders' deficit |
|
$ |
|
|
|
$ |
|
|
|
|
|
|
|
|
|
|
|
|
|
See note to condensed financial statements of Parent. |
|
|
|
|
|
|
|
|
123
COMMUNITY HEALTH SYSTEMS, INC. AND SUBSIDIARIES
NOTES TO CONSOLIDATED FINANCIAL STATEMENTS – (Continued)
|
Parent Company Only |
|
|
|
|
|
|
|
|
|
|
|
|
|
Condensed Statements of Income (Loss) |
|
|
|
|
|
|
|
|
|
|
|
|
|
(In millions) |
|
|
|
|
|
|
|
|
|
|
|
|
|
|
|
Year Ended December 31, |
|
|||||||||
|
|
|
2021 |
|
|
2020 |
|
|
2019 |
|
|||
|
Net operating revenues |
|
$ |
— |
|
|
$ |
— |
|
|
$ |
— |
|
|
Operating costs and expenses: |
|
|
|
|
|
|
|
|
|
|
|
|
|
Salaries and benefits |
|
|
— |
|
|
|
— |
|
|
|
— |
|
|
Supplies |
|
|
— |
|
|
|
— |
|
|
|
— |
|
|
Other operating expenses |
|
|
— |
|
|
|
— |
|
|
|
— |
|
|
Government and other legal settlements and related costs |
|
|
— |
|
|
|
— |
|
|
|
— |
|
|
Electronic health records incentive reimbursement |
|
|
— |
|
|
|
— |
|
|
|
— |
|
|
Lease cost and rent |
|
|
— |
|
|
|
— |
|
|
|
— |
|
|
Pandemic relief funds |
|
|
— |
|
|
|
— |
|
|
|
— |
|
|
Depreciation and amortization |
|
|
— |
|
|
|
— |
|
|
|
— |
|
|
Impairment and (gain) loss on sale of businesses, net |
|
|
— |
|
|
|
— |
|
|
|
— |
|
|
Total operating costs and expenses |
|
|
— |
|
|
|
— |
|
|
|
— |
|
|
Income from operations |
|
|
— |
|
|
|
— |
|
|
|
— |
|
|
Interest expense, net |
|
|
— |
|
|
|
— |
|
|
|
— |
|
|
Loss (gain) from early extinguishment of debt |
|
|
— |
|
|
|
— |
|
|
|
— |
|
|
Equity in earnings of unconsolidated affiliates |
|
|
( |
) |
|
|
( |
) |
|
|
|
|
|
Income (loss) before income taxes |
|
|
|
|
|
|
|
|
|
|
( |
) |
|
(Benefit from) provision for income taxes |
|
|
— |
|
|
|
— |
|
|
|
— |
|
|
Net income (loss) |
|
|
|
|
|
|
|
|
|
|
( |
) |
|
Less: Net income attributable to noncontrolling interests |
|
|
— |
|
|
|
— |
|
|
|
— |
|
|
Net income (loss) attributable to Community Health Systems, Inc. stockholders |
|
$ |
|
|
|
$ |
|
|
|
$ |
( |
) |
|
|
|
|
|
|
|
|
|
|
|
|
|
|
|
See note to condensed financial statements of Parent. |
|
|
|
|
|
|
|
|
|
|
|
|
124
COMMUNITY HEALTH SYSTEMS, INC. AND SUBSIDIARIES
NOTES TO CONSOLIDATED FINANCIAL STATEMENTS – (Continued)
|
Parent Company Only |
|
|
|
|
|
|
|
|
|
|
|
|
|
Condensed Statements of Comprehensive Income (Loss) |
|
|
|
|
|
|
|
|
|
|
|
|
|
(In millions) |
|
|
|
|
|
|
|
|
|
|
|
|
|
|
|
Year Ended December 31, |
|
|||||||||
|
|
|
2021 |
|
|
2020 |
|
|
2019 |
|
|||
|
|
|
|
|
|
|
(In millions) |
|
|
|
|
|
|
|
Net income (loss) |
|
$ |
|
|
|
$ |
|
|
|
$ |
( |
) |
|
Equity in other comprehensive (loss) income of affiliates, net of income taxes: |
|
|
|
|
|
|
|
|
|
|
|
|
|
Net change in fair value of interest rate swaps, net of tax |
|
|
— |
|
|
|
( |
) |
|
|
( |
) |
|
Net change in fair value of available-for-sale debt securities, net of tax |
|
|
( |
) |
|
|
|
|
|
|
|
|
|
Amortization and recognition of unrecognized pension cost components, net of tax |
|
|
|
|
|
|
( |
) |
|
|
— |
|
|
Other comprehensive (loss) income |
|
|
( |
) |
|
|
( |
) |
|
|
|
|
|
Comprehensive income (loss) |
|
|
|
|
|
|
|
|
|
|
( |
) |
|
Less: Comprehensive income attributable to noncontrolling interests |
|
|
— |
|
|
|
— |
|
|
|
— |
|
|
Comprehensive income (loss) attributable to Community Health Systems, Inc. stockholders |
|
$ |
|
|
|
$ |
|
|
|
$ |
( |
) |
|
|
|
|
|
|
|
|
|
|
|
|
|
|
|
See note to condensed financial statements of Parent. |
|
|
|
|
|
|
|
|
|
|
|
|
|
Parent Company Only |
|
|
|
|
|
|
|
|
|
|
|
|
|
Condensed Statements of Cash Flows |
|
|
|
|
|
|
|
|
|
|
|
|
|
(In millions) |
|
|
|
|
|
|
|
|
|
|
|
|
|
|
|
Year Ended December 31, |
|
|||||||||
|
|
|
2021 |
|
|
2020 |
|
|
2019 |
|
|||
|
Cash flows from operating activities: |
|
|
|
|
|
|
|
|
|
|
|
|
|
Net cash used in operating activities |
|
$ |
( |
) |
|
$ |
( |
) |
|
$ |
( |
) |
|
Cash flows from investing activities: |
|
|
|
|
|
|
|
|
|
|
|
|
|
Net cash provided by (used in) investing activities |
|
|
— |
|
|
|
— |
|
|
|
— |
|
|
Cash flows from financing activities: |
|
|
|
|
|
|
|
|
|
|
|
|
|
Repurchase of restricted stock shares for payroll tax withholding requirements |
|
|
( |
) |
|
|
( |
) |
|
|
( |
) |
|
Changes in intercompany balances with affiliates, net |
|
|
|
|
|
|
|
|
|
|
|
|
|
Net cash provided by financing activities |
|
|
|
|
|
|
|
|
|
|
|
|
|
Net change in cash and cash equivalents |
|
|
— |
|
|
|
— |
|
|
|
— |
|
|
Cash and cash equivalents at beginning of period |
|
|
— |
|
|
|
— |
|
|
|
— |
|
|
Cash and cash equivalents at end of period |
|
$ |
— |
|
|
$ |
— |
|
|
$ |
— |
|
|
|
|
|
|
|
|
|
|
|
|
|
|
|
|
See note to condensed financial statements of Parent. |
|
|
|
|
|
|
|
|
|
|
|
|
|
|
1. |
Basis of Presentation |
The Parent is a holding company and operates no business in its own name; all of the Company’s business operations are conducted through subsidiaries of the Parent. The Company’s outstanding indebtedness restricts the ability of subsidiaries to dividend or otherwise provide funds to the Parent. Accordingly, these financial statements have been presented on a “parent-only” basis. Under parent-only presentation, the Parent’s investments in its consolidated subsidiaries are presented under the equity method of accounting. These parent-only financial statements should be read in conjunction with consolidated financial statements of Community Health Systems, Inc.
125
Item 9. Changes in and Disagreements with Accountants on Accounting and Financial Disclosure
None.
Item 9A. Controls and Procedures
Evaluation of Disclosure Controls and Procedures
Our Chief Executive Officer and Chief Financial Officer, with the participation of other members of management, have evaluated the effectiveness of our disclosure controls and procedures (as defined in Rules 13a-15(e) and 15d-15(e)) under the Securities and Exchange Act of 1934, as amended, as of the end of the period covered by this report. Based on such evaluations, our Chief Executive Officer and Chief Financial Officer concluded that, as of such date, our disclosure controls and procedures were effective (at the reasonable assurance level) to ensure that the information required to be included in this report has been recorded, processed, summarized and reported within the time periods specified in the SEC’s rules and forms and to ensure that the information required to be included in this report was accumulated and communicated to management, including our Chief Executive Officer and Chief Financial Officer, to allow timely decisions regarding required disclosure.
Changes in Internal Control Over Financial Reporting
There have been no changes in internal control over financial reporting that occurred during the period that have materially affected or are reasonably likely to materially affect our internal controls over financial reporting.
Management’s report on internal control over financial reporting is included herein at page 127.
The attestation report from Deloitte & Touche LLP, our independent registered public accounting firm, on our internal control over financial reporting is included herein at page 128.
Item 9B. Other Information
None.
Item 9C. Disclosure Regarding Foreign Jurisdictions that Prevent Inspections.
None.
126
Management’s Report on Internal Control over Financial Reporting
We are responsible for the preparation and integrity of the consolidated financial statements appearing in our Annual Report on Form 10-K. The consolidated financial statements were prepared in conformity with accounting principles generally accepted in the United States of America and include amounts based on management’s estimates and judgments. All other financial information in this report has been presented on a basis consistent with the information included in the consolidated financial statements.
We are also responsible for establishing and maintaining adequate internal controls over financial reporting (as defined in Rule 13a-15(f) under the Securities and Exchange Act of 1934, as amended). We maintain a system of internal controls that is designed to provide reasonable assurance as to the fair and reliable preparation and presentation of the consolidated financial statements, as well as to safeguard assets from unauthorized use or disposition.
Our control environment is the foundation for our system of internal control over financial reporting and is embodied in our Code of Conduct. It sets the tone of our organization and includes factors such as integrity and ethical values. Our internal control over financial reporting is supported by formal policies and procedures which are reviewed, modified and improved as changes occur in business conditions and operations.
The Audit and Compliance Committee of the Board of Directors, which is composed solely of outside directors, meets periodically with members of management, the internal auditors and the independent registered public accounting firm to review and discuss internal control over financial reporting and accounting and financial reporting matters. The independent registered public accounting firm and internal auditors report to the Audit and Compliance Committee and have full and free access to the Audit and Compliance Committee at any time.
We conducted an evaluation of the effectiveness of our internal control over financial reporting based on the framework in Internal Control - Integrated Framework (2013) issued by the Committee of Sponsoring Organizations of the Treadway Commission. This evaluation included review of the documentation of controls, evaluation of the design effectiveness of controls, testing of the operating effectiveness of controls and a conclusion on this evaluation. We have concluded that our internal control over financial reporting was effective as of December 31, 2021, based on these criteria.
Deloitte & Touche LLP, an independent registered public accounting firm, has issued an attestation report on our internal control over financial reporting, which is included herein.
We do not expect that our disclosure controls and procedures or our internal controls will prevent all errors and all fraud. A control system, no matter how well conceived and operated, can provide only reasonable, not absolute, assurance that the objectives of the control system are met. Further, the design of a control system must reflect the fact there are resource constraints and the benefits of controls must be considered relative to their costs. Because of the inherent limitations in all control systems, no evaluation of controls can provide absolute assurance that all control issues and instances of fraud, if any, within the Company have been detected.
127
REPORT OF INDEPENDENT REGISTERED PUBLIC ACCOUNTING FIRM
To the Stockholders and the Board of Directors of
Community Health Systems, Inc.,
Franklin, Tennessee
Opinion on Internal Control over Financial Reporting
We have audited the internal control over financial reporting of Community Health Systems, Inc., and subsidiaries (the “Company”) as of December 31, 2021, based on criteria established in Internal Control — Integrated Framework (2013) issued by the Committee of Sponsoring Organizations of the Treadway Commission (COSO). In our opinion, the Company maintained, in all material respects, effective internal control over financial reporting as of December 31, 2021, based on criteria established in Internal Control — Integrated Framework (2013) issued by COSO.
We have also audited, in accordance with the standards of the Public Company Accounting Oversight Board (United States) (PCAOB), the consolidated financial statements as of and for the year ended December 31, 2021, of the Company and our report dated February 17, 2022, expressed an unqualified opinion on those financial statements.
Basis for Opinion
The Company’s management is responsible for maintaining effective internal control over financial reporting and for its assessment of the effectiveness of internal control over financial reporting, included in the accompanying Management’s report on Internal Control over Financial Reporting. Our responsibility is to express an opinion on the Company’s internal control over financial reporting based on our audit. We are a public accounting firm registered with the PCAOB and are required to be independent with respect to the Company in accordance with the U.S. federal securities laws and the applicable rules and regulations of the Securities and Exchange Commission and the PCAOB.
We conducted our audit in accordance with the standards of the PCAOB. Those standards require that we plan and perform the audit to obtain reasonable assurance about whether effective internal control over financial reporting was maintained in all material respects. Our audit included obtaining an understanding of internal control over financial reporting, assessing the risk that a material weakness exists, testing and evaluating the design and operating effectiveness of internal control based on the assessed risk, and performing such other procedures as we considered necessary in the circumstances. We believe that our audit provides a reasonable basis for our opinion.
Definition and Limitations of Internal Control over Financial Reporting
A company’s internal control over financial reporting is a process designed to provide reasonable assurance regarding the reliability of financial reporting and the preparation of financial statements for external purposes in accordance with generally accepted accounting principles. A company’s internal control over financial reporting includes those policies and procedures that (1) pertain to the maintenance of records that, in reasonable detail, accurately and fairly reflect the transactions and dispositions of the assets of the company; (2) provide reasonable assurance that transactions are recorded as necessary to permit preparation of financial statements in accordance with generally accepted accounting principles, and that receipts and expenditures of the company are being made only in accordance with authorizations of management and directors of the company; and (3) provide reasonable assurance regarding prevention or timely detection of unauthorized acquisition, use, or disposition of the company’s assets that could have a material effect on the financial statements.
Because of its inherent limitations, internal control over financial reporting may not prevent or detect misstatements. Also, projections of any evaluation of effectiveness to future periods are subject to the risk that controls may become inadequate because of changes in conditions, or that the degree of compliance with the policies or procedures may deteriorate.
/s/ Deloitte & Touche LLP
Nashville, Tennessee
February 17, 2022
128
PART III
Item 10. Directors, Executive Officers and Corporate Governance
The Company has adopted a Code of Conduct that is applicable to all members of the Board of Directors and our officers, as well as employees of our subsidiaries. A copy of the current version of our Code of Conduct is available in the Company-Overview — Corporate Governance section of our internet website at www.chs.net/company-overview/corporate-governance. A copy of the Code of Conduct is also available in print, free of charge, to any stockholder who requests it by writing to Community Health Systems, Inc., Investor Relations, at 4000 Meridian Boulevard, Franklin, TN 37067. The Company intends to post amendments to or waivers, if any, from its Code of Conduct at this location on its website, in each case to the extent such amendment or waiver would otherwise require the filing of a Current Report on Form 8-K pursuant to Item 5.05 thereof.
The committee report of the Audit and Compliance Committee of the Board of Directors is presented below. The other information required by this Item is incorporated herein by reference to the Company’s definitive proxy statement to be filed under Regulation 14A in connection with the Annual Meeting of the Stockholders of the Company scheduled to be held on May 10, 2022, under “General Information,” “Members of the Board of Directors,” “Information About Our Executive Officers,” and, if applicable, “Delinquent Section 16(a) Reports.”
AUDIT AND COMPLIANCE COMMITTEE REPORT
The Audit and Compliance Committee of the Board of Directors of the Company is composed of four directors, each of whom is “independent” as defined by the applicable listing standards of the New York Stock Exchange and Section 10A-3 of the Exchange Act. All of our Audit and Compliance Committee members meet the Securities and Exchange Commission definition of “audit committee financial expert.” The Audit and Compliance Committee operates under a written charter adopted by the Board of Directors, which is posted on our corporate website (www.chs.net) and which is reviewed by the Committee annually, in conjunction with the Committee’s annual self-evaluation. The Company’s management is responsible for its internal controls and the financial reporting process. Our independent registered public accounting firm, Deloitte & Touche LLP, is responsible for performing an independent audit of our consolidated financial statements in accordance with the standards of the Public Company Accounting Oversight Board (United States) and to issue its reports thereon. The Audit and Compliance Committee is responsible for, among other things, monitoring and overseeing these processes, and recommending to the Board of Directors: (i) that the audited consolidated financial statements be included in the Company’s Annual Report on Form 10-K; and (ii) the selection of the independent registered public accounting firm to audit the consolidated financial statements of the Company.
In keeping with that responsibility, the Audit and Compliance Committee has reviewed and discussed the Company’s audited consolidated financial statements with management and with the independent registered public accounting firm, reviewed internal controls and accounting procedures and provided oversight review of the Company’s corporate compliance program. In addition, the Audit and Compliance Committee has discussed with the Company’s independent registered public accounting firm the matters required to be discussed by the applicable requirements of the Public Company Accounting Oversight Board.
The Audit and Compliance Committee discussed with the Company’s internal auditors and independent registered public accounting firm the overall scope and plans for their respective audits. The Audit and Compliance Committee met with the internal auditors and the independent registered public accounting firm with and without management present to discuss the results of their examinations, their evaluations of the Company’s internal controls and the overall quality of the Company’s financial reporting.
The Audit and Compliance Committee has received the written disclosures and the letter from the independent registered public accounting firm required by applicable requirements of the Public Company Accounting Oversight Board regarding the independent accountant’s communications with the audit committee concerning independence. The Audit and Compliance Committee has discussed with the independent registered public accounting firm its independence and also has reviewed the amount of fees paid to the independent registered accounting firm for audit and non-audit services.
Based on the Audit and Compliance Committee’s discussions with management and the independent registered public accounting firm and the Audit and Compliance Committee’s review of the representations of management and the materials it received from the independent registered public accounting firm as described above, the Audit and Compliance Committee recommended to the Board of Directors that the audited consolidated financial statements be included in the Company’s Annual Report on Form 10-K for the year ended December 31, 2021 for filing with the SEC.
129
This report is respectfully submitted by the Audit and Compliance Committee of the Board of Directors.
|
|
THE AUDIT AND COMPLIANCE COMMITTEE |
|
|
John A. Clerico* |
|
|
Michael Dinkins, Chair* |
|
|
James S. Ely III |
|
|
Elizabeth T. Hirsch |
|
|
H. James Williams, Ph.D. |
*Mr. Clerico served on the Audit and Compliance Committee though February 16, 2022, and is listed above because he participated in the review, discussions and recommendation with respect to the audit and compliance committee report. Mr. Dinkins replaced Mr. Ely as Chair of the Audit and Compliance Committee effective as of February 16, 2022.
Item 11. Executive Compensation
The information required by this Item is incorporated herein by reference to the Company’s definitive proxy statement to be filed under Regulation 14A in connection with the Annual Meeting of the Stockholders of the Company scheduled to be held on May 10, 2022 under “Executive Compensation,” “Compensation Committee Interlocks and Insider Participation,” “Non-Management Director Compensation,” and “Compensation Committee Report.”
Item 12. Security Ownership of Certain Beneficial Owners and Management and Related Stockholder Matters
The information required by this Item is incorporated herein by reference to the Company’s definitive proxy statement to be filed under Regulation 14A in connection with the Annual Meeting of the Stockholders of the Company scheduled to be held on May 10, 2022 under “Security Ownership of Certain Beneficial Owners and Management” and “Equity Compensation Plan Information.”
Item 13. Certain Relationships and Related Transactions, and Director Independence
The information required by this Item is incorporated herein by reference to the Company’s definitive proxy statement to be filed under Regulation 14A in connection with the Annual Meeting of the Stockholders of the Company scheduled to be held on May 10, 2022 under “General Information” and “Relationships and Certain Transactions Between the Company and Its Officers, Directors and 5% Beneficial Owners and Their Family Members.”
Item 14. Principal Accounting Fees and Services
The information required by this Item is incorporated herein by reference to the Company’s definitive proxy statement to be filed under Regulation 14A in connection with the Annual Meeting of the Stockholders of the Company scheduled to be held on May 10, 2022 under “Fees Paid to Auditors” and “Pre-Approval of Audit and Non-Audit Services.”
130
PART IV
Item 15. Exhibits and Financial Statement Schedules
Item 15(a) 1. Financial Statements
Reference is made to the index of financial statements and supplementary data under Item 8 in Part II.
Item 15(a) 2. Financial Statement Schedules
The following financial statement schedule is included within the notes to the consolidated financial statements at page 123 hereof:
Schedule I – Condensed Financial Information of Registrant
All other schedules are omitted since the required information is not present or is not present in amounts sufficient to require submission of the schedule.
131
Item 15(a) 3. Exhibits
The following exhibits are either filed with this Report or incorporated herein by reference.
|
No. |
|
Description |
|
|
|
|
|
2.1 |
|
|
|
|
|
|
|
2.2 |
|
|
|
|
|
|
|
2.3 |
|
|
|
|
|
|
|
2.4 |
|
|
|
|
|
|
|
3.1 |
|
|
|
|
|
|
|
3.2 |
|
|
|
|
|
|
|
3.3 |
|
|
|
|
|
|
|
4.1 |
|
|
|
|
|
|
|
4.2 |
|
|
|
|
|
|
|
4.3 |
|
|
|
|
|
|
|
4.4 |
|
Form of 8.000% Senior Secured Note due 2026 (included in Exhibit 4.3) |
|
|
|
|
|
4.5 |
|
|
|
|
|
|
|
4.6 |
|
132
|
No. |
|
Description |
|
|
|
|
|
4.7 |
|
|
|
|
|
|
|
4.8 |
|
|
|
|
|
|
|
4.9 |
|
|
|
|
|
|
|
4.10 |
|
|
|
|
|
|
|
4.11 |
|
|
|
|
|
|
|
4.12 |
|
Form of 8.000% Senior Secured Note due 2027 (included in Exhibit 4.11) |
|
|
|
|
|
4.13 |
|
|
|
|
|
|
|
4.14 |
|
|
|
|
|
|
|
4.15 |
|
|
|
|
|
|
|
4.16 |
|
Form of 6.875% Senior Unsecured Note due 2028 (included in Exhibit 4.15) |
|
|
|
|
|
4.17 |
|
|
|
|
|
|
|
4.18 |
|
133
134
|
No. |
|
Description |
|
|
|
|
|
4.34 |
|
|
|
|
|
|
|
4.35 |
|
|
|
|
|
|
|
10.1 |
|
|
|
|
|
|
|
10.2 |
|
|
|
|
|
|
|
10.3 |
|
|
|
|
|
|
|
10.4† |
|
|
|
|
|
|
|
10.5† |
|
|
|
|
|
|
|
10.6† |
|
|
|
|
|
|
|
10.7† |
|
|
|
|
|
|
|
10.8† |
|
|
|
|
|
|
|
10.9† |
|
|
|
|
|
|
|
10.10† |
|
135
|
No. |
|
Description |
|
|
|
|
|
10.11† |
|
|
|
|
|
|
|
10.12† |
|
|
|
|
|
|
|
10.13† |
|
|
|
|
|
|
|
10.14† |
|
|
|
|
|
|
|
10.15† |
|
|
|
|
|
|
|
10.16† |
|
|
|
|
|
|
|
10.17† |
|
|
|
|
|
|
|
10.18† |
|
|
|
|
|
|
|
10.19† |
|
|
|
|
|
|
|
10.20† |
|
|
|
|
|
|
|
10.21† |
|
|
|
|
|
|
|
10.22† |
|
|
|
|
|
|
|
10.23† |
|
|
|
|
|
|
|
10.24† |
|
|
|
|
|
|
|
10.25† |
|
136
|
No. |
|
Description |
|
|
|
|
|
10.26† |
|
|
|
|
|
|
|
10.27 |
|
|
|
|
|
|
|
10.28 |
|
|
|
|
|
|
|
10.29† |
|
|
|
|
|
|
|
10.30† |
|
|
|
|
|
|
|
21* |
|
|
|
|
|
|
|
23.1* |
|
|
|
|
|
|
|
31.1* |
|
Certification of Chief Executive Officer pursuant to Section 302 of the Sarbanes-Oxley Act of 2002 |
|
|
|
|
|
31.2* |
|
Certification of Chief Financial Officer pursuant to Section 302 of the Sarbanes-Oxley Act of 2002 |
|
|
|
|
|
32.1** |
|
|
|
|
|
|
|
32.2** |
|
|
|
|
|
|
|
99.1 |
|
|
|
|
|
|
|
101* |
|
The following financial information from our annual report on Form 10-K for the year ended December 31, 2021, filed with the SEC on February 17, 2022, formatted in Inline Extensible Business Reporting Language: (i) the consolidated statements of income (loss) for the years ended December 31, 2021, 2020 and 2019, (ii) the consolidated statements of comprehensive income (loss) for the years ended December 31, 2021, 2020 and 2019, (iii) the consolidated balance sheets at December 31, 2021 and December 31, 2020, (iv) the consolidated statements of stockholders’ deficit for the years ended December 31, 2021, 2020 and 2019, (v) the consolidated statements of cash flows for the years ended December 31, 2021, 2020 and 2019, and (vi) the notes to the consolidated financial statements. The instance document does not appear in the Interactive Data File because its XBRL tags are embedded within the Inline XBRL document. |
|
|
|
|
|
104* |
|
Cover Page Interactive Data File (formatted as Inline XBRL and contained in Exhibit 101) |
|
|
|
|
|
* |
Filed herewith. |
|
** |
Furnished herewith. |
|
† |
Indicates a management contract or compensatory plan or arrangement. |
Item 16. Form 10-K Summary
None.
137
SIGNATURES
Pursuant to the requirements of section 13 or 15(d) of the Securities Exchange Act of 1934, the registrant has duly caused this report to be signed on its behalf by the undersigned, thereunto duly authorized.
|
|
|
Community Health Systems, Inc. |
|
|
|
|
|
|
By: |
/s/ Tim L. Hingtgen |
|
|
|
Tim L. Hingtgen |
|
|
|
Director and |
|
|
|
|
|
|
Date: |
February 17, 2022 |
Pursuant to the requirements of the Securities Exchange Act of 1934, this report has been signed below by the following persons on behalf of the Registrant and in the capacities and on the dates indicated.
|
Name |
Title |
Date |
|
/s/ Tim L. Hingtgen |
Director and |
February 17, 2022 |
|
Tim L. Hingtgen |
Chief Executive Officer |
|
|
|
|
|
|
/s/ Kevin J. Hammons |
President and |
February 17, 2022 |
|
Kevin J. Hammons |
Chief Financial Officer |
|
|
|
|
|
|
/s/ Jason K. Johnson |
Senior Vice President and |
February 17, 2022 |
|
Jason K. Johnson |
Chief Accounting Officer |
|
|
|
|
|
|
/s/ Wayne T. Smith |
Executive Chairman of the |
February 17, 2022 |
|
Wayne T. Smith |
Board of Directors |
|
|
|
|
|
|
/s/ John A. Clerico |
Director |
February 17, 2022 |
|
John A. Clerico |
|
|
|
|
|
|
|
/s/ Michael Dinkins |
Director |
February 17, 2022 |
|
Michael Dinkins |
|
|
|
|
|
|
|
/s/ James S. Ely III |
Director |
February 17, 2022 |
|
James S. Ely III |
|
|
|
|
|
|
|
/s/ John A. Fry |
Director |
February 17, 2022 |
|
John A. Fry |
|
|
|
|
|
|
|
/s/ Joseph A. Hastings, D.M.D |
Director |
February 17, 2022 |
|
Joseph A. Hastings, D.M.D |
|
|
|
|
|
|
|
/s/ Elizabeth T. Hirsch |
Director |
February 17, 2022 |
|
Elizabeth T. Hirsch |
|
|
|
|
|
|
|
/s/ William Norris Jennings, M.D. |
Director |
February 17, 2022 |
|
William Norris Jennings, M.D. |
|
|
|
|
|
|
|
/s/ K. Ranga Krishnan, MBBS |
Director |
February 17, 2022 |
|
K. Ranga Krishnan, MBBS |
|
|
|
|
|
|
|
/s/ H. James Williams, Ph.D. |
Director |
February 17, 2022 |
|
H. James Williams, Ph.D. |
|
|
138