STATE STREET INSTITUTIONAL INVESTMENT TRUST
UNITED STATES
SECURITIES AND EXCHANGE COMMISSION
Washington, D.C. 20549
FORM N-CSR
CERTIFIED
SHAREHOLDER REPORT OF REGISTERED
MANAGEMENT INVESTMENT COMPANIES
Investment Company Act file number: 811-09819
STATE STREET INSTITUTIONAL INVESTMENT TRUST
(Exact name of registrant as specified in charter)
One Iron
Street, Boston, Massachusetts 02210
(Address of principal executive offices)(Zip code)
|
|
|
| (Name and Address of Agent for Service) |
|
Copy to: |
| Sean O’Malley, Esq.
Senior Vice President and General Counsel
c/o SSGA Funds Management, Inc.
One Iron Street Boston,
Massachusetts 02210 |
|
Timothy W. Diggins, Esq.
Ropes & Gray LLP
Prudential Tower, 800 Boylston Street
Boston, Massachusetts 02199-3600 |
Registrant’s telephone number, including area code: (617) 664-1465
Date of fiscal year end: September 30
Date of reporting period: March 31, 2022
Item 1. Reports to Stockholders.
| |
(a) |
The Report to Shareholders is attached herewith. |
Semi-Annual Report
March 31, 2022
| State Street Institutional
Investment Trust |
| State Street
U.S. Core Equity Fund |
| State Street
Income Fund |
The information
contained in this report is intended for the general information of shareholders of the Trust. This report is not authorized for distribution to prospective investors unless preceded or accompanied by a current Trust prospectus which contains
important information concerning the Trust. You may obtain a current prospectus and SAI from the Distributor by calling 1-800-997-7327 or visiting www.ssga.com. Please read the prospectus carefully before you invest.
State Street Institutional Investment Trust
Semi-Annual Report
March 31, 2022 (Unaudited)
| |
Page
|
| Fund
Information, Understanding Your Fund’s Expenses and Schedule of Investments |
|
|
1
|
|
7
|
| Financial
Statements |
|
|
34
|
|
36
|
|
37
|
|
38
|
|
40
|
|
49
|
The information contained
in this report is intended for the general information of shareholders of the Trust. This report is not authorized for distribution to prospective investors unless preceded or accompanied by a current Trust prospectus which contains important
information concerning the Trust. You may obtain a current prospectus and SAI from the Distributor by calling 1-800-997-7327 or visiting www.ssga.com. Please read the prospectus carefully before you invest.
[This page
intentionally left blank]
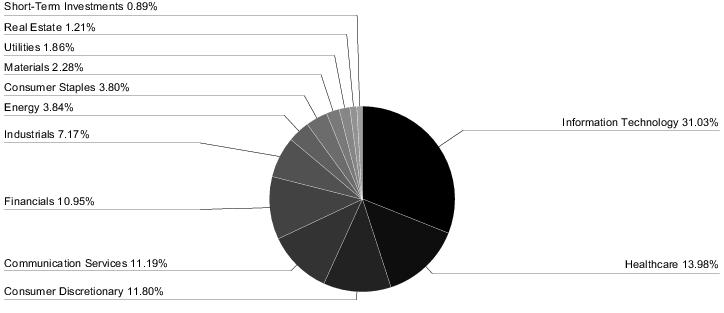
State Street U.S. Core Equity
Fund
Fund Information — March 31, 2022
(Unaudited)
| Sector
Allocation |
| Portfolio
composition as a % of Fair Value of $6,700,361 (in thousands) as of March 31, 2022 (a) |
| Top
Ten Largest Holdings |
| as
of March 31, 2022 (as a % of Fair Value) (a) |
| Microsoft
Corp. |
6.41%
|
| Apple
Inc. |
5.86%
|
| Amazon.com
Inc. |
5.02%
|
| Alphabet
Inc., Class A |
3.94%
|
| Visa
Inc., Class A |
2.36%
|
| Johnson
& Johnson |
2.23%
|
| UnitedHealth
Group Inc. |
2.11%
|
| Mastercard
Inc., Class A |
1.91%
|
| QUALCOMM
Inc. |
1.84%
|
| Meta
Platforms Inc., Class A |
1.78%
|
|
| (a)
|
The
securities information regarding holdings, allocations and other characteristics is presented to illustrate examples of securities that the Fund has bought and the diversity of areas in which the Fund may invest as of a particular date. It may not
be representative of the Fund’s current or future investments and should not be construed as a recommendation to purchase or sell a particular security. |
| State
Street U.S. Core Equity Fund |
1
|
State Street U.S. Core Equity
Fund
Understanding Your Fund’s Expenses —
March 31, 2022 (Unaudited)
As a shareholder of the Fund, you incur ongoing costs. Ongoing costs
include portfolio management fees, professional fees, administrative fees and other Fund expenses. The following example is intended to help you understand your ongoing costs (in dollars) of investing in the Fund and to compare these costs with the
ongoing costs of investing in other mutual funds.
To
illustrate these ongoing costs, we have provided an example and calculated the expenses paid by investors of the Fund during the period. The information in the following table is based on an investment of $1,000, which is invested at the beginning
of the period and held for the entire six-month period ended March 31, 2022.
Actual Expenses
The first section of the table provides information about
actual account values and actual expenses. You may use the information in this section, together with the amount you invested, to estimate the expenses that you paid over the period. To do so, simply divide your account value by $1,000 (for example,
an $8,600 account value divided by $1,000 = 8.6), then multiply the result by the number given under the heading “Expenses paid during the period” to estimate the expenses you paid on your account during the period.
Hypothetical Example for Comparison Purposes
The second section of the table provides information about
hypothetical account values and hypothetical expenses based on the Fund’s actual expense ratio and an assumed rate of return of 5% per year before expenses, which is not the Fund’s actual return. The hypothetical account values and
expenses may not be used to estimate the actual ending account balance or expenses you paid for the period. You may use this information to compare the ongoing costs of investing in the Fund and other funds. To do so, compare this 5% hypothetical
example with the 5% hypothetical examples that appear in the shareholders reports of other funds.
Please note that the expenses shown in the table are meant
to highlight and help you compare ongoing costs only and do not reflect transaction costs, such as sales charges or redemption fees, if any. Therefore, the second section of the table is useful in comparing ongoing costs only, and will not help you
determine the relative total costs of owning different funds.
| |
Actual
Fund Return |
|
Hypothetical
5% Return
(2.5% for
the period) |
Beginning
Account Value
October 1, 2021 |
$1,000.00
|
|
$1,000.00
|
Ending
Account value
March 31, 2022 |
$1,034.80
|
|
$1,024.20
|
| Expenses
Paid During Period* |
$
0.76 |
|
$
0.76 |
| *
|
Expenses
are equal to the Fund's annualized expense ratio of 0.15% (for the period October 1, 2021 - March 31, 2022), multiplied by the average account value over the period, multiplied by 182/365 (to reflect the one-half year period). |
| 2
|
State Street U.S. Core
Equity Fund |
State Street U.S. Core Equity
Fund
Schedule of Investments — March 31, 2022
(Unaudited)
| |
Number
of Shares |
Fair
Value |
| Common
Stock - 99.1% † |
| Aerospace
& Defense - 0.7% |
| Raytheon
Technologies Corp. |
438,295
|
$
43,421,886 |
| Apparel
Retail - 1.1% |
| Ross
Stores Inc. |
809,806
|
73,255,051
|
| Application
Software - 3.2% |
| Adobe
Inc. (a) |
77,439
|
35,282,757
|
| Intuit
Inc. |
27,895
|
13,413,032
|
| salesforce.com
Inc. (a) |
494,491
|
104,990,329
|
| Splunk
Inc. (a) |
428,046
|
63,611,916
|
| |
|
217,298,034
|
| Asset
Management & Custody Banks - 0.2% |
| Blackstone
Inc. |
78,202
|
9,926,962
|
| Auto
Parts & Equipment - 0.8% |
| Magna
International Inc. |
835,355
|
53,721,680
|
| Automobile
Manufacturers - 0.7% |
| Ford
Motor Co. |
2,731,214
|
46,184,829
|
| Automotive
Retail - 0.7% |
| O'Reilly
Automotive Inc. (a) |
64,785
|
44,375,134
|
| Biotechnology
- 1.3% |
| BioMarin
Pharmaceutical Inc. (a) |
336,225
|
25,922,947
|
| Vertex
Pharmaceuticals Inc. (a) |
245,713
|
64,123,722
|
| |
|
90,046,669
|
| Building
Products - 0.7% |
| Allegion
PLC |
143,566
|
15,760,675
|
| Trane
Technologies PLC |
213,281
|
32,568,009
|
| |
|
48,328,684
|
| Cable
& Satellite - 1.4% |
| Charter
Communications Inc., Class A (a) |
33,905
|
18,495,856
|
| Comcast
Corp., Class A |
1,658,955
|
77,672,273
|
| |
|
96,168,129
|
| Communications
Equipment - 0.2% |
| Cisco
Systems Inc. |
258,538
|
14,416,079
|
| Construction
Materials - 0.3% |
| Martin
Marietta Materials Inc. |
47,950
|
18,455,475
|
| |
Number
of Shares |
Fair
Value |
| Data
Processing & Outsourced Services - 5.9% |
| Fidelity
National Information Services Inc. |
775,389
|
$
77,864,564 |
| Mastercard
Inc., Class A |
358,658
|
128,177,196
|
| PayPal
Holdings Inc. (a) |
267,239
|
30,906,190
|
| Visa
Inc., Class A |
712,292
|
157,964,997
|
| |
|
394,912,947
|
| Diversified
Banks - 1.7% |
| JPMorgan
Chase & Co. |
822,343
|
112,101,798
|
| Diversified
Support Services - 0.4% |
| Cintas
Corp. |
65,017
|
27,657,582
|
| Electric
Utilities - 1.0% |
| NextEra
Energy Inc. |
803,127
|
68,032,888
|
| Electronic
Components - 1.3% |
| Amphenol
Corp., Class A |
807,109
|
60,815,663
|
| Corning
Inc. |
655,945
|
24,210,930
|
| |
|
85,026,593
|
| Environmental
& Facilities Services - 0.5% |
| Waste
Management Inc. |
208,142
|
32,990,507
|
| Financial
Exchanges & Data - 1.3% |
| CME
Group Inc. |
137,382
|
32,677,682
|
| S&P
Global Inc. |
125,055
|
51,295,060
|
| |
|
83,972,742
|
| Footwear
- 0.1% |
| NIKE
Inc., Class B |
51,096
|
6,875,478
|
| Healthcare
Equipment - 3.4% |
| Becton
Dickinson & Co. |
115,140
|
30,627,240
|
| Boston
Scientific Corp. (a) |
1,811,195
|
80,217,826
|
| Edwards
Lifesciences Corp. (a) |
192,712
|
22,686,057
|
| Medtronic
PLC |
503,401
|
55,852,341
|
| Zimmer
Biomet Holdings Inc. |
312,186
|
39,928,589
|
| |
|
229,312,053
|
| Healthcare
Services - 0.6% |
| Cigna
Corp. |
180,489
|
43,246,969
|
| Home
Improvement Retail - 1.7% |
| Lowe's
Companies Inc. |
472,796
|
95,594,623
|
| The
Home Depot Inc. |
64,500
|
19,306,785
|
| |
|
114,901,408
|
See Notes to Schedules of Investments and Notes to Financial
Statements.
| State
Street U.S. Core Equity Fund |
3
|
State Street U.S. Core Equity
Fund
Schedule of Investments, continued — March 31,
2022 (Unaudited)
| |
Number
of Shares |
Fair
Value |
| Hotels,
Resorts & Cruise Lines - 1.1% |
| Marriott
International Inc., Class A (a) |
420,455
|
$
73,894,966 |
| Household
Products - 1.3% |
| Colgate-Palmolive
Co. |
293,794
|
22,278,399
|
| The
Procter & Gamble Co. |
404,045
|
61,738,076
|
| |
|
84,016,475
|
| Hypermarkets
& Super Centers - 0.7% |
| Walmart
Inc. |
302,263
|
45,013,006
|
| Industrial
Conglomerates - 1.4% |
| Honeywell
International Inc. |
470,395
|
91,529,459
|
| Industrial
Gases - 1.3% |
| Air
Products & Chemicals Inc. (b) |
350,555
|
87,607,200
|
| Industrial
Machinery - 1.4% |
| Parker-Hannifin
Corp. |
265,720
|
75,400,707
|
| Xylem
Inc. |
191,391
|
16,317,997
|
| |
|
91,718,704
|
| Insurance
Brokers - 0.3% |
| Marsh
& McLennan Companies Inc. |
117,054
|
19,948,343
|
| Integrated
Oil & Gas - 0.9% |
| Chevron
Corp. |
350,467
|
57,066,542
|
| Interactive
Home Entertainment - 0.2% |
| Activision
Blizzard Inc. (b) |
203,529
|
16,304,708
|
| Interactive
Media & Services - 7.2% |
| Alphabet
Inc., Class C (a) |
34,304
|
95,810,729
|
| Alphabet
Inc., Class A (a) |
94,977
|
264,164,279
|
| Meta
Platforms Inc., Class A (a) |
535,217
|
119,010,852
|
| |
|
478,985,860
|
| Internet
& Direct Marketing Retail - 5.0% |
| Amazon.com
Inc. (a)(b) |
103,145
|
336,247,543
|
| Investment
Banking & Brokerage - 1.4% |
| The
Charles Schwab Corp. |
1,127,907
|
95,093,839
|
| IT
Consulting & Other Services - 0.4% |
| Accenture
PLC, Class A |
75,854
|
25,580,244
|
| |
Number
of Shares |
Fair
Value |
| Life
& Health Insurance - 0.1% |
| Lincoln
National Corp. |
147,409
|
$
9,634,652 |
| Life
Sciences Tools & Services - 0.8% |
| IQVIA
Holdings Inc. (a) |
239,900
|
55,467,279
|
| Managed
Healthcare - 2.7% |
| Humana
Inc. |
92,215
|
40,129,201
|
| UnitedHealth
Group Inc. |
276,705
|
141,111,249
|
| |
|
181,240,450
|
| Movies
& Entertainment - 2.1% |
| Netflix
Inc. (a) |
192,053
|
71,941,133
|
| The
Walt Disney Co. (a) |
498,405
|
68,361,230
|
| |
|
140,302,363
|
| Multi-Line
Insurance - 0.3% |
| American
International Group Inc. |
355,732
|
22,329,298
|
| Multi-Sector
Holdings - 1.4% |
| Berkshire
Hathaway Inc., Class B (a) |
269,278
|
95,030,899
|
| Multi-Utilities
- 0.8% |
| Sempra
Energy |
334,366
|
56,213,612
|
| Oil
& Gas Equipment & Services - 0.6% |
| Schlumberger
N.V. |
982,834
|
40,600,872
|
| Oil
& Gas Exploration & Production - 2.4% |
| ConocoPhillips
|
1,132,457
|
113,245,700
|
| Pioneer
Natural Resources Co. |
185,038
|
46,265,051
|
| |
|
159,510,751
|
| Packaged
Foods & Meats - 0.6% |
| Mondelez
International Inc., Class A |
663,533
|
41,656,602
|
| Personal
Products - 0.3% |
| The
Estee Lauder Companies Inc., Class A |
61,284
|
16,688,859
|
| Pharmaceuticals
- 5.0% |
| AstraZeneca
PLC ADR |
355,492
|
23,583,339
|
| Bristol-Myers
Squibb Co. |
545,617
|
39,846,410
|
| Elanco
Animal Health Inc. (a) |
641,878
|
16,746,597
|
| Johnson
& Johnson |
842,860
|
149,380,078
|
See Notes to Schedules of Investments and Notes to Financial
Statements.
| 4
|
State Street U.S. Core
Equity Fund |
State Street U.S. Core Equity
Fund
Schedule of Investments, continued — March 31,
2022 (Unaudited)
| |
Number
of Shares |
Fair
Value |
| Merck
& Company Inc. |
1,305,689
|
$
107,131,782 |
| |
|
336,688,206
|
| Property
& Casualty Insurance - 1.3% |
| Chubb
Ltd. |
398,784
|
85,299,898
|
| Railroads
- 0.7% |
| Union
Pacific Corp. |
181,054
|
49,465,763
|
| Regional
Banks - 3.0% |
| First
Republic Bank |
515,620
|
83,582,002
|
| Regions
Financial Corp. |
3,116,542
|
69,374,225
|
| SVB
Financial Group (a) |
86,126
|
48,183,191
|
| |
|
201,139,418
|
| Restaurants
- 0.6% |
| McDonald's
Corp. |
166,907
|
41,272,763
|
| Semiconductor
Equipment - 1.4% |
| Applied
Materials Inc. |
732,017
|
96,479,840
|
| Semiconductors
- 5.2% |
| Advanced
Micro Devices Inc. (a) |
503,342
|
55,035,414
|
| NVIDIA
Corp. |
304,866
|
83,185,737
|
| QUALCOMM
Inc. |
805,711
|
123,128,755
|
| Texas
Instruments Inc. |
482,873
|
88,597,538
|
| |
|
349,947,444
|
| Soft
Drinks - 1.0% |
| Monster
Beverage Corp. (a) |
205,776
|
16,441,502
|
| PepsiCo
Inc. |
307,557
|
51,478,891
|
| |
|
67,920,393
|
| Specialized
REITs - 1.2% |
| American
Tower Corp. |
323,562
|
81,285,246
|
| Specialty
Chemicals - 0.7% |
| DuPont
de Nemours Inc. |
240,867
|
17,722,994
|
| |
Number
of Shares |
Fair
Value |
| Ecolab
Inc. |
66,216
|
$
11,691,097 |
| PPG
Industries Inc. |
128,971
|
16,904,229
|
| |
|
46,318,320
|
| Systems
Software - 7.5% |
| Microsoft
Corp. |
1,391,952
|
429,152,721
|
| Oracle
Corp. |
286,808
|
23,727,626
|
| ServiceNow
Inc. (a) |
90,639
|
50,475,953
|
| |
|
503,356,300
|
| Technology
Hardware, Storage & Peripherals - 5.9% |
| Apple
Inc. |
2,250,080
|
392,886,469
|
| Trading
Companies & Distributors - 1.3% |
| United
Rentals Inc. (a) |
247,596
|
87,948,575
|
| Trucking
- 0.1% |
| Lyft
Inc., Class A (a) |
182,550
|
7,009,920
|
| Wireless
Telecommunication Services - 0.3% |
| T-Mobile
US Inc. (a) |
133,153
|
17,090,187
|
Total
Common Stock
(Cost $4,129,376,036) |
|
6,640,420,845
|
| Short-Term
Investments - 0.9% |
State
Street Institutional U.S. Government Money Market Fund - Class G Shares 0.29% (c)(d)
(Cost $59,940,166) |
59,940,166
|
59,940,166
|
Total
Investments
(Cost $4,189,316,202) |
|
6,700,361,011
|
| Other
Assets and Liabilities, net - 0.0%* |
|
2,607,730
|
| NET
ASSETS - 100.0% |
|
$
6,702,968,741 |
Other Information:
| The
Fund had the following short futures contracts open at March 31, 2022: |
| Description
|
Expiration
date |
Number
of
Contracts |
Notional
Amount |
Value
|
Unrealized
Appreciation
(Depreciation) |
| S&P
500 E-Mini Index Futures |
June
2022 |
1
|
$
(229,522) |
$
(226,537) |
$
2,985 |
During the period ended March 31, 2022, the average
notional value related to long and short futures contracts were $37,617,688 and $5,023,020, respectively.
See Notes to Schedules of Investments and Notes to Financial Statements.
| State
Street U.S. Core Equity Fund |
5
|
State Street U.S. Core Equity
Fund
Notes to Schedule of Investments — March
31, 2022 (Unaudited)
The views expressed in this document reflect our judgment as of the
publication date and are subject to change at any time without notice. The securities cited may not be representative of the Fund’s future investments and should not be construed as a recommendation to purchase or sell a particular security.
See the Fund’s summary prospectus and statutory prospectus for complete descriptions of investment objectives, policies, risks and permissible investments.
| (a)
|
Non-income
producing security. |
| (b)
|
At
March 31, 2022, all or a portion of this security was pledged to cover collateral requirements for futures, swaps and/or TBAs. |
| (c)
|
Sponsored
by SSGA Funds Management, Inc., the Fund’s investment adviser and administrator, and an affiliate of State Street Bank & Trust Co., the Fund’s sub-administrator, custodian and accounting agent. |
| (d)
|
Coupon
amount represents effective yield. |
| †
|
Percentages
are based on net assets as of March 31, 2022. |
| *
|
Less
than 0.05%. |
| Abbreviations:
|
| ADR -
American Depositary Receipt |
| REIT
- Real Estate Investment Trust |
The following table presents the Fund’s
investments measured at fair value on a recurring basis at March 31, 2022:
| Investments
|
Level
1 |
|
Level
2 |
|
Level
3 |
|
Total
|
| Investments
in Securities |
|
|
|
|
|
|
|
| Common
Stock |
$
6,640,420,845 |
|
$
— |
|
$
— |
|
$
6,640,420,845 |
| Short-Term
Investments |
59,940,166
|
|
—
|
|
—
|
|
59,940,166
|
| Total
Investments in Securities |
$
6,700,361,011 |
|
$
— |
|
$
— |
|
$
6,700,361,011 |
| Other
Financial Instruments |
|
|
|
|
|
|
|
| Short
Futures Contracts - Unrealized Appreciation |
$
2,985 |
|
$
— |
|
$
— |
|
$
2,985 |
| Total
Other Financial Instruments |
$
2,985 |
|
$
— |
|
$
— |
|
$
2,985 |
| |
Number
of Shares
Held at
9/30/21 |
Value
at
9/30/21 |
Cost
of
Purchases |
Proceeds
from
Shares
Sold |
Realized
Gain
(Loss) |
Change
in
Unrealized
Appreciation
(Depreciation) |
Number
of
Shares
Held at
3/31/22 |
Value
at
3/31/22 |
Dividend
Income |
| State
Street Institutional U.S. Government Money Market Fund - Class G Shares |
94,639,589
|
$94,639,589
|
$488,308,492
|
$523,007,915
|
$—
|
$—
|
59,940,166
|
$59,940,166
|
$17,898
|
See Notes to Schedules of Investments and Notes to Financial
Statements.
| 6
|
State Street U.S. Core
Equity Fund |
State Street Income Fund
Fund Information — March 31, 2022 (Unaudited)
| Sector
Allocation |
| Portfolio
composition as a % of Fair Value of $1,775,671 (in thousands) as of March 31, 2022 (a) |
| Quality
Ratings |
| as
of March 31, 2022 as a % of Fair Value (a)* |
| Moody’s
/ S&P / Rating |
|
Percentage
of
Fair Value |
| Aaa
/ AAA |
|
11.68%
|
| Aa
/ AA |
|
57.35%
|
| A
/ A |
|
6.23%
|
| Baa
/ BBB |
|
20.61%
|
| Ba
/ BB and lower |
|
2.69%
|
| NR
/ Other |
|
1.44%
|
| |
|
100.00%
|
|
| (a)
|
The
securities information regarding holdings, allocations and other characteristics is presented to illustrate examples of securities that the Fund has bought and the diversity of areas in which the Fund may invest as of a particular date. It may not
be representative of the Fund’s current or future investments and should not be construed as a recommendation to purchase or sell a particular security. |
| *
|
Moody’s
Investors Services, Inc. (“Moody’s”) and S&P Global Ratings (“S&P”) are nationally recognized statistical rating organizations. The quality ratings represent the lower of Moody’s or S&P credit
ratings. When a rating from only one of the rating agencies is available, that rating is used. Securities not rated by Moody’s or S&P are categorized as not rated. Credit quality measures a bond issuer’s ability to repay interest and
principal in a timely manner. Credit quality ratings assigned by a rating agency are subject to change periodically and are not absolute standard of quality. In formulating investment decisions for the Fund, SSGA Funds Management, Inc. (“SSGA
FM”) develops its own analysis of the credit quality and risks associated with individual debt instruments, rather than relying exclusively on rating agency ratings. |
| State
Street Income Fund |
7
|
State Street Income Fund
Understanding Your Fund’s Expenses — March 31, 2022
(Unaudited)
As a shareholder of the Fund, you incur ongoing costs. Ongoing costs
include portfolio management fees, professional fees, administrative fees and other Fund expenses. The following example is intended to help you understand your ongoing costs (in dollars) of investing in the Fund and to compare these costs with the
ongoing costs of investing in other mutual funds.
To
illustrate these ongoing costs, we have provided an example and calculated the expenses paid by investors of the Fund during the period. The information in the following table is based on an investment of $1,000, which is invested at the beginning
of the period and held for the entire six-month period ended March 31, 2022.
Actual Expenses
The first section of the table provides information about
actual account values and actual expenses. You may use the information in this section, together with the amount you invested, to estimate the expenses that you paid over the period. To do so, simply divide your account value by $1,000 (for example,
an $8,600 account value divided by $1,000 = 8.6), then multiply the result by the number given under the heading “Expenses paid during the period” to estimate the expenses you paid on your account during the period.
Hypothetical Example for Comparison Purposes
The second section of the table provides information about
hypothetical account values and hypothetical expenses based on the Fund’s actual expense ratio and an assumed rate of return of 5% per year before expenses, which is not the Fund’s actual return. The hypothetical account values and
expenses may not be used to estimate the actual ending account balance or expenses you paid for the period. You may use this information to compare the ongoing costs of investing in the Fund and other funds. To do so, compare this 5% hypothetical
example with the 5% hypothetical examples that appear in the shareholders reports of other funds.
Please note that the expenses shown in the table are meant
to highlight and help you compare ongoing costs only and do not reflect transaction costs, such as sales charges or redemption fees, if any. Therefore, the second section of the table is useful in comparing ongoing costs only, and will not help you
determine the relative total costs of owning different funds.
| |
Actual
Fund Return |
|
Hypothetical
5% Return
(2.5% for
the period) |
Beginning
Account Value
October 1, 2021 |
$1,000.00
|
|
$1,000.00
|
Ending
Account value
March 31, 2022 |
$
936.10 |
|
$1,024.00
|
| Expenses
Paid During Period* |
$
0.92 |
|
$
0.96 |
| *
|
Expenses
are equal to the Fund's annualized expense ratio of 0.19% (for the period October 1, 2021 - March 31, 2022), multiplied by the average account value over the period, multiplied by 182/365 (to reflect the one-half year period). |
| 8
|
State Street Income Fund
|
State Street Income Fund
Schedule of Investments — March 31, 2022 (Unaudited)
| |
Principal
Amount |
Fair
Value |
| Bonds
and Notes - 98.7% † |
| U.S.
Treasuries - 37.5% |
| U.S.
Treasury Bonds |
|
|
| 1.13%,
05/15/40 (a) |
$
27,489,000 |
$
21,651,883 |
| 1.88%,
02/15/41 - 02/15/51 |
44,509,000
|
39,368,766
|
| 2.25%,
08/15/46 (a) |
14,576,000
|
13,628,560
|
| 3.00%,
08/15/48 (a) |
31,799,000
|
34,665,878
|
| U.S.
Treasury Notes |
|
|
| 0.25%,
07/31/25 (a) |
57,304,000
|
53,122,599
|
| 0.63%,
10/15/24 |
22,613,000
|
21,586,582
|
| 0.75%,
12/31/23 |
59,055,000
|
57,525,568
|
| 0.75%,
01/31/28 (a) |
174,789,000
|
158,525,431
|
| 1.13%,
01/15/25 |
36,245,000
|
34,905,634
|
| 1.25%,
11/30/26 |
37,603,000
|
35,573,026
|
| 1.50%,
02/29/24 |
34,199,000
|
33,703,381
|
| 1.63%,
05/15/31 |
105,037,000
|
98,931,724
|
| 1.75%,
01/31/29 |
13,095,000
|
12,540,508
|
| 2.63%,
02/15/29 (a) |
11,059,000
|
11,192,054
|
| |
|
626,921,594
|
| Agency
Mortgage Backed - 21.5% |
| Federal
Home Loan Mortgage Corp. |
|
|
| 3.00%,
04/01/43 - 10/01/49 (a) |
43,740,404
|
43,253,777
|
| 4.50%,
06/01/33 - 02/01/35 (a) |
45,064
|
47,790
|
| 5.00%,
07/01/35 (a) |
386,349
|
415,881
|
| 5.50%,
01/01/38 - 04/01/39 (a) |
693,332
|
759,754
|
| 6.00%,
06/01/33 - 11/01/37 (a) |
1,367,639
|
1,500,691
|
| 6.50%,
07/01/29 (a) |
11,631
|
12,138
|
| 7.00%,
01/01/27 - 08/01/36 (a) |
327,707
|
360,792
|
| 7.50%,
01/01/28 - 09/01/33 (a) |
26,617
|
28,256
|
| 8.00%,
11/01/30 (a) |
2,075
|
2,258
|
| 8.50%,
04/01/30 (a) |
4,350
|
5,173
|
| Federal
National Mortgage Assoc. |
|
|
| 2.50%,
02/01/51 - 03/01/51 (a) |
76,293,847
|
73,038,305
|
| 3.00%,
03/01/50 (a) |
7,779,595
|
7,652,493
|
| 3.50%,
08/01/45 - 01/01/48 (a) |
17,598,548
|
17,793,093
|
| 4.00%,
01/01/41 - 01/01/50 (a) |
21,549,868
|
22,264,570
|
| 4.50%,
07/01/33 - 12/01/48 (a) |
10,720,192
|
11,288,024
|
| |
Principal
Amount |
Fair
Value |
| 5.00%,
03/01/34 - 05/01/39 (a) |
$
965,852 |
$
1,039,732 |
| 5.50%,
12/01/32 - 01/01/39 (a) |
3,410,739
|
3,710,997
|
| 6.00%,
02/01/33 - 05/01/41 (a) |
6,436,213
|
7,080,389
|
| 6.50%,
02/01/29 - 08/01/36 (a) |
204,547
|
219,747
|
| 7.00%,
10/01/32 - 02/01/34 (a) |
37,431
|
40,017
|
| 7.50%,
11/01/22 - 03/01/33 (a) |
116,122
|
126,439
|
| 8.00%,
06/01/24 - 10/01/31 (a) |
46,201
|
48,820
|
| 8.50%,
04/01/30 (a) |
9,750
|
11,100
|
| 9.00%,
12/01/22 (a) |
522
|
522
|
| Federal
National Mortgage Assoc. 1.60% + 12 month USD LIBOR |
|
|
| 1.85%,
04/01/37 (a)(b) |
13,753
|
14,111
|
| Federal
National Mortgage Assoc. TBA |
|
|
| 2.00%,
04/01/37 (c) |
10,581,237
|
10,272,149
|
| 3.00%,
04/01/52 (c) |
85,747,998
|
83,845,164
|
| 3.50%,
05/01/52 (c) |
14,000,000
|
13,967,674
|
| Government
National Mortgage Assoc. |
|
|
| 3.00%,
12/20/42 - 05/20/45 (a) |
44,570,070
|
44,694,677
|
| 3.50%,
08/20/48 (a) |
7,335,533
|
7,426,273
|
| 4.00%,
01/20/41 - 04/20/43 (a) |
5,494,825
|
5,755,830
|
| 4.50%,
08/15/33 - 03/20/41 (a) |
2,228,620
|
2,397,528
|
| 5.00%,
08/15/33 (a) |
122,262
|
129,770
|
| 6.00%,
04/15/27 - 04/15/35 (a) |
442,542
|
484,572
|
| 6.50%,
01/15/24 - 09/15/36 (a) |
310,706
|
335,593
|
| 7.00%,
03/15/26 - 10/15/36 (a) |
235,107
|
254,961
|
| 7.50%,
11/15/22 - 10/15/28 (a) |
71,114
|
73,409
|
| 8.00%,
12/15/29 - 05/15/30 (a) |
1,001
|
1,080
|
| Government
National Mortgage Assoc. 1.50% + 1 year CMT Rate |
|
|
| 1.63%,
08/20/23 - 09/20/24 (a)(b) |
701
|
699
|
| 1.75%,
10/20/24 - 10/20/25 (a)(b) |
706
|
704
|
See Notes to Schedules of Investments and Notes to Financial
Statements.
| State
Street Income Fund |
9
|
State Street Income Fund
Schedule of Investments, continued — March 31, 2022
(Unaudited)
| |
Principal
Amount |
Fair
Value |
| 1.88%,
04/20/24 (a)(b) |
$
311 |
$
312 |
| 2.00%,
01/20/24 - 03/20/24 (a)(b) |
417
|
419
|
| Lehman
TBA |
|
|
| 5.50%,
12/01/89 (d) |
1,140,372
|
29,308
|
| |
|
360,384,991
|
| Agency
Collateralized Mortgage Obligations - 0.7% |
| Federal
Home Loan Mortgage Corp. |
|
|
| 0.10%,
09/25/43 (a)(b)(e) |
3,882,830
|
11,005
|
| 2.51%,
07/25/29 |
6,504,000
|
6,376,606
|
| 4.05%,
09/25/28 (b) |
1,713,000
|
1,833,813
|
| Federal
Home Loan Mortgage Corp. REMIC |
|
|
| 3.50%,
11/15/30 (a)(e) |
245,280
|
4,776
|
| 5.50%,
06/15/33 (a)(e) |
115,637
|
19,382
|
| 7.50%,
07/15/27 (a)(e) |
4,479
|
550
|
| Federal
Home Loan Mortgage Corp. STRIPS |
|
|
| 0.00%,
08/01/27 (a)(f) |
3,208
|
3,013
|
| 8.00%,
02/01/23 - 07/01/24 (a)(e) |
4,831
|
307
|
| Federal
National Mortgage Assoc. REMIC |
|
|
| 1.12%,
12/25/42 (a)(b)(e) |
561,993
|
18,261
|
| 5.00%,
02/25/40 - 09/25/40 (a)(e) |
316,703
|
32,220
|
| Federal
National Mortgage Assoc. REMIC 6.00% - 1 month USD LIBOR |
|
|
| 5.54%,
07/25/38 (a)(b)(e) |
143,098
|
18,187
|
| Federal
National Mortgage Assoc. REMIC 6.55% - 1 month USD LIBOR |
|
|
| 6.09%,
11/25/41 (a)(b)(e) |
17,522,765
|
3,035,965
|
| Federal
National Mortgage Assoc. STRIPS |
|
|
| 0.00%,
12/25/34 (a)(f) |
112,832
|
95,785
|
| 4.50%,
08/25/35 - 01/25/36 (a)(e) |
253,166
|
35,847
|
| 5.00%,
03/25/38 - 05/25/38 (a)(e) |
156,906
|
29,179
|
| 5.50%,
12/25/33 (a)(e) |
44,406
|
8,509
|
| 6.00%,
01/25/35 (a)(e) |
182,564
|
32,214
|
| 7.50%,
11/25/23 (a)(e) |
10,377
|
379
|
| 8.00%,
08/25/23 - 07/25/24 (a)(e) |
9,310
|
616
|
| 8.50%,
07/25/22 (a)(e)** |
104
|
—
|
| |
|
11,556,614
|
| |
Principal
Amount |
Fair
Value |
| Asset
Backed - 0.6% |
| Chase
Funding Trust 2004-1 |
|
|
| 4.99%,
11/25/33 |
$
331,344 |
$
331,345 |
| Enterprise
Fleet Financing 2019-1 LLC |
|
|
| 3.07%,
10/20/24 (g) |
4,214,000
|
4,222,064
|
| Ford
Credit Auto Owner Trust 2020-B |
|
|
| 0.56%,
10/15/24 |
6,072,024
|
6,026,084
|
| |
|
10,579,493
|
| Corporate
Notes - 31.5% |
| 3M
Co. |
|
|
| 3.13%,
09/19/46 (a) |
422,000
|
380,184
|
| 7-Eleven
Inc. |
|
|
| 0.95%,
02/10/26 (a)(g) |
2,113,000
|
1,920,971
|
| Abbott
Laboratories |
|
|
| 3.75%,
11/30/26 (a) |
569,000
|
590,548
|
| 4.90%,
11/30/46 (a) |
463,000
|
565,179
|
| AbbVie
Inc. |
|
|
| 2.60%,
11/21/24 (a) |
861,000
|
855,025
|
| 2.95%,
11/21/26 (a) |
851,000
|
844,149
|
| 3.20%,
05/14/26 - 11/21/29 (a) |
1,245,000
|
1,237,346
|
| 3.25%,
10/01/22 (a) |
587,000
|
589,383
|
| 4.05%,
11/21/39 (a) |
355,000
|
366,207
|
| 4.25%,
11/21/49 (a) |
697,000
|
727,271
|
| 4.40%,
11/06/42 |
289,000
|
306,343
|
| 4.63%,
10/01/42 (a) |
68,000
|
72,694
|
| 4.70%,
05/14/45 (a) |
124,000
|
135,120
|
| 4.88%,
11/14/48 (a) |
117,000
|
132,769
|
| Advance
Auto Parts Inc. |
|
|
| 3.90%,
04/15/30 (a) |
1,424,000
|
1,422,718
|
| AEP
Texas Inc. |
|
|
| 3.45%,
05/15/51 |
919,000
|
821,200
|
| Aetna
Inc. |
|
|
| 3.50%,
11/15/24 (a) |
446,000
|
450,799
|
| Aircastle
Ltd. |
|
|
| 4.25%,
06/15/26 (a) |
627,000
|
618,310
|
| Alcoa
Nederland Holding BV |
|
|
| 5.50%,
12/15/27 (a)(g) |
1,047,000
|
1,084,336
|
| Alcon
Finance Corp. |
|
|
| 2.60%,
05/27/30 (a)(g) |
358,000
|
331,125
|
| 3.80%,
09/23/49 (a)(g) |
200,000
|
187,096
|
| Alexandria
Real Estate Equities Inc. |
|
|
| 1.88%,
02/01/33 (a) |
360,000
|
304,225
|
| 2.95%,
03/15/34 |
633,000
|
595,988
|
| 3.55%,
03/15/52 |
532,000
|
494,866
|
See Notes to Schedules of Investments and Notes to Financial
Statements.
| 10
|
State Street Income Fund
|
State Street Income Fund
Schedule of Investments, continued — March 31, 2022
(Unaudited)
| |
Principal
Amount |
Fair
Value |
| 4.70%,
07/01/30 (a) |
$
216,000 |
$
233,470 |
| Ally
Financial Inc. |
|
|
| 2.20%,
11/02/28 |
791,000
|
714,930
|
| 5.75%,
11/20/25 (a) |
426,000
|
448,574
|
| Altria
Group Inc. |
|
|
| 3.40%,
05/06/30 - 02/04/41 (a) |
468,000
|
403,007
|
| 4.00%,
02/04/61 (a) |
176,000
|
147,720
|
| 4.25%,
08/09/42 (a) |
50,000
|
45,088
|
| 4.45%,
05/06/50 (a) |
236,000
|
214,361
|
| 4.50%,
05/02/43 (a) |
163,000
|
150,234
|
| Amazon.com
Inc. |
|
|
| 1.50%,
06/03/30 (a) |
264,000
|
236,322
|
| 2.50%,
06/03/50 (a) |
327,000
|
273,889
|
| 2.70%,
06/03/60 (a) |
252,000
|
209,026
|
| 2.88%,
05/12/41 |
555,000
|
512,065
|
| 3.25%,
05/12/61 |
414,000
|
388,266
|
| 4.25%,
08/22/57 (a) |
109,000
|
123,688
|
| Ameren
Corp. |
|
|
| 2.50%,
09/15/24 (a) |
1,271,000
|
1,252,049
|
| 3.65%,
02/15/26 (a) |
277,000
|
280,244
|
| American
Campus Communities Operating Partnership LP |
|
|
| 4.13%,
07/01/24 (a) |
260,000
|
264,698
|
| American
Electric Power Company Inc. |
|
|
| 2.30%,
03/01/30 (a) |
303,000
|
275,369
|
| 3.25%,
03/01/50 (a) |
252,000
|
216,564
|
| American
International Group Inc. |
|
|
| 4.25%,
03/15/29 (a) |
426,000
|
446,989
|
| 4.50%,
07/16/44 (a) |
359,000
|
388,366
|
| American
International Group Inc. (5.75% fixed rate until 04/01/28; 2.87% + 3 month USD LIBOR thereafter) |
|
|
| 5.75%,
04/01/48 (a)(b) |
110,000
|
110,043
|
| American
Tower Corp. |
|
|
| 1.50%,
01/31/28 (a) |
1,027,000
|
907,858
|
| 2.90%,
01/15/30 (a) |
363,000
|
338,251
|
| 3.70%,
10/15/49 (a) |
212,000
|
189,454
|
| 3.80%,
08/15/29 (a) |
445,000
|
443,460
|
| American
Water Capital Corp. |
|
|
| 2.95%,
09/01/27 (a) |
328,000
|
325,127
|
| Amgen
Inc. |
|
|
| 2.00%,
01/15/32 |
999,000
|
886,912
|
| 2.45%,
02/21/30 (a) |
149,000
|
140,114
|
| 3.00%,
01/15/52 |
345,000
|
292,760
|
| |
Principal
Amount |
Fair
Value |
| 3.15%,
02/21/40 |
$
608,000 |
$
555,147 |
| 3.38%,
02/21/50 (a) |
164,000
|
148,441
|
| 4.20%,
02/22/52 |
350,000
|
362,485
|
| 4.66%,
06/15/51 (a) |
124,000
|
137,215
|
| AngloGold
Ashanti Holdings PLC |
|
|
| 3.38%,
11/01/28 |
1,145,000
|
1,067,976
|
| Anheuser-Busch
Companies LLC/Anheuser-Busch InBev Worldwide Inc. |
|
|
| 3.65%,
02/01/26 (a) |
735,000
|
751,743
|
| 4.70%,
02/01/36 (a) |
181,000
|
196,722
|
| 4.90%,
02/01/46 (a) |
400,000
|
444,432
|
| Anheuser-Busch
InBev Worldwide Inc. |
|
|
| 3.50%,
06/01/30 (a) |
406,000
|
412,232
|
| 4.00%,
04/13/28 (a) |
129,000
|
133,912
|
| 4.35%,
06/01/40 (a) |
395,000
|
411,756
|
| 4.38%,
04/15/38 (a) |
639,000
|
671,065
|
| 4.50%,
06/01/50 (a) |
313,000
|
335,990
|
| 4.60%,
04/15/48 (a) |
230,000
|
247,540
|
| 4.75%,
04/15/58 (a) |
178,000
|
192,753
|
| 5.55%,
01/23/49 (a) |
419,000
|
508,821
|
| Anthem
Inc. |
|
|
| 2.88%,
09/15/29 (a) |
202,000
|
195,391
|
| 3.30%,
01/15/23 (a) |
418,000
|
422,025
|
| 3.60%,
03/15/51 (a) |
221,000
|
212,832
|
| 3.70%,
09/15/49 (a) |
202,000
|
197,007
|
| ANZ
New Zealand International Ltd. |
|
|
| 3.45%,
01/21/28 (a)(g) |
887,000
|
889,093
|
| Aon
Corp./Aon Global Holdings PLC |
|
|
| 2.90%,
08/23/51 |
634,000
|
522,987
|
| Apollo
Management Holdings LP |
|
|
| 2.65%,
06/05/30 (a)(g) |
307,000
|
285,562
|
| Apollo
Management Holdings LP (4.95% fixed rate until 12/17/24; 3.27% + 5 year CMT Rate thereafter) |
|
|
| 4.95%,
01/14/50 (b)(g) |
374,000
|
363,199
|
| Apple
Inc. |
|
|
| 2.20%,
09/11/29 (a) |
404,000
|
385,000
|
| 2.65%,
02/08/51 (a) |
395,000
|
341,517
|
| 2.80%,
02/08/61 (a) |
442,000
|
378,684
|
| 2.95%,
09/11/49 (a) |
266,000
|
244,247
|
| 3.35%,
02/09/27 (a) |
194,000
|
198,144
|
| 3.45%,
02/09/45 (a) |
678,000
|
672,678
|
| 3.85%,
08/04/46 (a) |
611,000
|
647,593
|
See Notes to Schedules of Investments and Notes to Financial
Statements.
| State
Street Income Fund |
11
|
State Street Income Fund
Schedule of Investments, continued — March 31, 2022
(Unaudited)
| |
Principal
Amount |
Fair
Value |
| Applied
Materials Inc. |
|
|
| 4.35%,
04/01/47 (a) |
$
230,000 |
$
261,830 |
| Aptiv
PLC |
|
|
| 4.40%,
10/01/46 (a) |
277,000
|
268,654
|
| Archer-Daniels-Midland
Co. |
|
|
| 2.50%,
08/11/26 (a) |
239,000
|
234,846
|
| Ares
Capital Corp. |
|
|
| 2.88%,
06/15/28 |
1,384,000
|
1,227,137
|
| 3.25%,
07/15/25 (a) |
2,842,000
|
2,760,548
|
| Arthur
J Gallagher & Co. |
|
|
| 3.50%,
05/20/51 |
694,000
|
624,593
|
| Ascension
Health |
|
|
| 4.85%,
11/15/53 (a) |
450,000
|
560,795
|
| Ashtead
Capital Inc. |
|
|
| 1.50%,
08/12/26 (g) |
600,000
|
548,460
|
| Astrazeneca
Finance LLC |
|
|
| 1.75%,
05/28/28 |
890,000
|
822,004
|
| AstraZeneca
PLC |
|
|
| 3.00%,
05/28/51 |
420,000
|
388,361
|
| 4.00%,
01/17/29 (a) |
184,000
|
193,918
|
| 4.38%,
08/17/48 (a) |
102,000
|
116,063
|
| AT&T
Inc. |
|
|
| 1.70%,
03/25/26 (a) |
2,563,000
|
2,431,467
|
| 2.30%,
06/01/27 (a) |
638,000
|
608,875
|
| 2.75%,
06/01/31 (a) |
1,277,000
|
1,196,179
|
| 3.30%,
02/01/52 (a) |
1,381,000
|
1,180,120
|
| 3.85%,
06/01/60 (a) |
596,000
|
536,513
|
| 4.35%,
03/01/29 (a) |
613,000
|
647,420
|
| 4.50%,
05/15/35 (a) |
436,000
|
462,504
|
| 4.55%,
03/09/49 (a) |
237,000
|
249,232
|
| 4.75%,
05/15/46 (a) |
140,000
|
152,639
|
| 4.80%,
06/15/44 (a) |
297,000
|
315,542
|
| 4.85%,
03/01/39 (a) |
571,000
|
621,728
|
| 5.25%,
03/01/37 (a) |
297,000
|
338,126
|
| 5.35%,
12/15/43 (a) |
328,000
|
363,624
|
| 5.45%,
03/01/47 (a) |
285,000
|
340,130
|
| Athene
Holding Ltd. |
|
|
| 4.13%,
01/12/28 (a) |
313,000
|
315,141
|
| 6.15%,
04/03/30 (a) |
611,000
|
688,279
|
| Avangrid
Inc. |
|
|
| 3.15%,
12/01/24 (a) |
755,000
|
753,611
|
| Bain
Capital Specialty Finance Inc. |
|
|
| 2.95%,
03/10/26 (a) |
923,000
|
866,097
|
| Bank
of America Corp. |
|
|
| 3.25%,
10/21/27 (a) |
225,000
|
224,379
|
| 4.18%,
11/25/27 (a) |
768,000
|
783,660
|
| 4.25%,
10/22/26 (a) |
759,000
|
782,112
|
| |
Principal
Amount |
Fair
Value |
| Bank
of America Corp. (2.09% fixed rate until 06/14/28; 1.06% + SOFR thereafter) |
|
|
| 2.09%,
06/14/29 (b) |
$
1,384,000 |
$
1,264,727 |
| Bank
of America Corp. (2.59% fixed rate until 04/29/30; 2.15% + SOFR thereafter) |
|
|
| 2.59%,
04/29/31 (a)(b) |
2,544,000
|
2,350,045
|
| Bank
of America Corp. (2.97% fixed rate until 07/21/51; 1.56% + SOFR thereafter) |
|
|
| 2.97%,
07/21/52 (b) |
633,000
|
540,936
|
| Bank
of America Corp. (3.37% fixed rate until 01/23/25; 0.81% + 3 month USD LIBOR thereafter) |
|
|
| 3.37%,
01/23/26 (a)(b) |
328,000
|
327,954
|
| Bank
of America Corp. (3.42% fixed rate until 12/20/27; 1.04% + 3 month USD LIBOR thereafter) |
|
|
| 3.42%,
12/20/28 (a)(b) |
368,000
|
364,710
|
| Bank
of America Corp. (3.56% fixed rate until 04/23/26; 1.06% + 3 month USD LIBOR thereafter) |
|
|
| 3.56%,
04/23/27 (a)(b) |
604,000
|
606,180
|
| Bank
of America Corp. (3.71% fixed rate until 04/24/27; 1.51% + 3 month USD LIBOR thereafter) |
|
|
| 3.71%,
04/24/28 (a)(b) |
815,000
|
821,487
|
| Bank
of America Corp. (3.85% fixed rate until 03/08/32; 2.00% + 5 year CMT Rate thereafter) |
|
|
| 3.85%,
03/08/37 (b) |
857,000
|
821,117
|
| Bank
of America Corp. (3.95% fixed rate until 01/23/48; 1.19% + 3 month USD LIBOR thereafter) |
|
|
| 3.95%,
01/23/49 (a)(b) |
489,000
|
496,105
|
| Bank
of America Corp. (4.24% fixed rate until 04/24/37; 1.81% + 3 month USD LIBOR thereafter) |
|
|
| 4.24%,
04/24/38 (a)(b) |
509,000
|
531,605
|
| Bank
of America Corp. (4.27% fixed rate until 07/23/28; 1.31% + 3 month USD LIBOR thereafter) |
|
|
| 4.27%,
07/23/29 (a)(b) |
181,000
|
186,928
|
See Notes to Schedules of Investments and Notes to Financial
Statements.
| 12
|
State Street Income Fund
|
State Street Income Fund
Schedule of Investments, continued — March 31, 2022
(Unaudited)
| |
Principal
Amount |
Fair
Value |
| Bank
of America Corp. (4.30% fixed rate until 01/28/25; 2.66% + 3 month USD LIBOR thereafter) |
|
|
| 4.30%,
12/31/99 (a)(b) |
$
812,000 |
$
771,010 |
| Barclays
PLC |
|
|
| 4.38%,
01/12/26 (a) |
911,000
|
931,179
|
| 4.84%,
05/09/28 (a) |
276,000
|
282,022
|
| Barclays
PLC (2.65% fixed rate until 06/24/30; 1.90% + 1 year CMT Rate thereafter) |
|
|
| 2.65%,
06/24/31 (b) |
1,414,000
|
1,284,987
|
| Barclays
PLC (2.85% fixed rate until 05/07/25; 2.71% + SOFR thereafter) |
|
|
| 2.85%,
05/07/26 (a)(b) |
1,320,000
|
1,283,344
|
| Barclays
PLC (4.97% fixed rate until 05/16/28; 1.90% + 3 month USD LIBOR thereafter) |
|
|
| 4.97%,
05/16/29 (a)(b) |
507,000
|
532,309
|
| Barrick
North America Finance LLC |
|
|
| 5.70%,
05/30/41 (a) |
69,000
|
83,811
|
| BAT
Capital Corp. |
|
|
| 2.73%,
03/25/31 (a) |
616,000
|
543,472
|
| 4.39%,
08/15/37 (a) |
454,000
|
422,501
|
| 4.54%,
08/15/47 (a) |
204,000
|
182,103
|
| 4.70%,
04/02/27 (a) |
387,000
|
396,512
|
| 4.91%,
04/02/30 (a) |
406,000
|
417,729
|
| BAT
International Finance PLC |
|
|
| 1.67%,
03/25/26 (a) |
395,000
|
363,100
|
| Baxter
International Inc. |
|
|
| 1.92%,
02/01/27 (g) |
2,014,000
|
1,883,432
|
| 2.27%,
12/01/28 (g) |
1,214,000
|
1,124,698
|
| 2.54%,
02/01/32 (g) |
570,000
|
521,219
|
| 3.13%,
12/01/51 (g) |
264,000
|
226,728
|
| Bayer
US Finance II LLC |
|
|
| 3.88%,
12/15/23 (a)(g) |
608,000
|
615,655
|
| Baylor
Scott & White Holdings |
|
|
| 2.84%,
11/15/50 (a) |
97,000
|
81,688
|
| Becton
Dickinson & Co. |
|
|
| 3.70%,
06/06/27 (a) |
352,000
|
357,266
|
| 3.73%,
12/15/24 |
7,000
|
7,118
|
| 4.67%,
06/06/47 (a) |
46,000
|
50,296
|
| 4.69%,
12/15/44 (a) |
54,000
|
58,209
|
| Berkshire
Hathaway Energy Co. |
|
|
| 3.25%,
04/15/28 (a) |
200,000
|
199,876
|
| 3.70%,
07/15/30 (a) |
452,000
|
464,977
|
| |
Principal
Amount |
Fair
Value |
| 3.80%,
07/15/48 (a) |
$
176,000 |
$
173,496 |
| 4.25%,
10/15/50 (a) |
386,000
|
410,553
|
| 6.13%,
04/01/36 (a) |
178,000
|
219,588
|
| Berkshire
Hathaway Finance Corp. |
|
|
| 1.45%,
10/15/30 (a) |
410,000
|
358,963
|
| 2.85%,
10/15/50 (a) |
305,000
|
264,408
|
| 3.85%,
03/15/52 |
856,000
|
875,097
|
| 4.25%,
01/15/49 (a) |
260,000
|
283,221
|
| Berry
Global Inc. |
|
|
| 4.88%,
07/15/26 (a)(g) |
1,151,000
|
1,164,697
|
| BHP
Billiton Finance USA Ltd. |
|
|
| 5.00%,
09/30/43 (a) |
108,000
|
128,161
|
| Biogen
Inc. |
|
|
| 2.25%,
05/01/30 (a) |
191,000
|
171,149
|
| Block
Financial LLC |
|
|
| 2.50%,
07/15/28 |
591,000
|
541,362
|
| 3.88%,
08/15/30 (a) |
188,000
|
184,138
|
| BNP
Paribas S.A. (2.82% fixed rate until 11/19/24; 1.11% + 3 month USD LIBOR thereafter) |
|
|
| 2.82%,
11/19/25 (a)(b)(g) |
1,007,000
|
983,990
|
| BNP
Paribas S.A. (5.13% fixed rate until 11/15/27; 2.84% + USD 5 year Swap Rate thereafter) |
|
|
| 5.13%,
12/31/99 (a)(b)(g) |
600,000
|
565,602
|
| Boardwalk
Pipelines LP |
|
|
| 4.80%,
05/03/29 (a) |
399,000
|
414,908
|
| Boston
Scientific Corp. |
|
|
| 4.70%,
03/01/49 (a) |
57,000
|
63,550
|
| BP
Capital Markets America Inc. |
|
|
| 3.00%,
02/24/50 (a) |
488,000
|
422,603
|
| 3.02%,
01/16/27 (a) |
731,000
|
727,806
|
| 3.38%,
02/08/61 (a) |
561,000
|
499,161
|
| BP
Capital Markets PLC (4.38% fixed rate until 09/22/25; 4.04% + 5 year CMT Rate thereafter) |
|
|
| 4.38%,
12/31/99 (a)(b) |
855,000
|
859,395
|
| BP
Capital Markets PLC (4.88% fixed rate until 06/22/30; 4.40% + 5 year CMT Rate thereafter) |
|
|
| 4.88%,
12/31/99 (a)(b) |
610,000
|
611,318
|
| Bristol-Myers
Squibb Co. |
|
|
| 1.45%,
11/13/30 (a) |
438,000
|
382,624
|
| 2.35%,
11/13/40 (a) |
243,000
|
204,890
|
| 2.95%,
03/15/32 |
570,000
|
558,634
|
See Notes to Schedules of Investments and Notes to Financial
Statements.
| State
Street Income Fund |
13
|
State Street Income Fund
Schedule of Investments, continued — March 31, 2022
(Unaudited)
| |
Principal
Amount |
Fair
Value |
| 3.20%,
06/15/26 (a) |
$
214,000 |
$
217,214 |
| 3.40%,
07/26/29 (a) |
120,000
|
122,092
|
| 3.55%,
03/15/42 |
235,000
|
232,709
|
| 4.13%,
06/15/39 (a) |
317,000
|
339,631
|
| 4.25%,
10/26/49 (a) |
317,000
|
346,998
|
| 4.35%,
11/15/47 (a) |
43,000
|
47,455
|
| 4.55%,
02/20/48 (a) |
88,000
|
100,058
|
| Brixmor
Operating Partnership LP |
|
|
| 2.25%,
04/01/28 (a) |
829,000
|
758,087
|
| 3.90%,
03/15/27 (a) |
164,000
|
165,043
|
| Broadcom
Inc. |
|
|
| 3.14%,
11/15/35 (g) |
239,000
|
210,712
|
| 3.19%,
11/15/36 (g) |
31,000
|
27,241
|
| 3.42%,
04/15/33 (a)(g) |
576,000
|
537,529
|
| 3.47%,
04/15/34 (g) |
28,000
|
25,932
|
| 4.15%,
11/15/30 (a) |
581,000
|
588,570
|
| 4.30%,
11/15/32 (a) |
406,000
|
411,664
|
| Brown-Forman
Corp. |
|
|
| 4.00%,
04/15/38 (a) |
103,000
|
106,273
|
| Brunswick
Corp. |
|
|
| 2.40%,
08/18/31 |
1,952,000
|
1,656,155
|
| Bunge
Limited Finance Corp. |
|
|
| 3.75%,
09/25/27 (a) |
143,000
|
143,868
|
| Burlington
Northern Santa Fe LLC |
|
|
| 4.15%,
12/15/48 (a) |
359,000
|
388,197
|
| 4.55%,
09/01/44 (a) |
540,000
|
599,319
|
| Cameron
LNG LLC |
|
|
| 3.30%,
01/15/35 (a)(g) |
197,000
|
185,135
|
| Canadian
Natural Resources Ltd. |
|
|
| 3.85%,
06/01/27 (a) |
446,000
|
451,263
|
| 4.95%,
06/01/47 (a) |
269,000
|
298,289
|
| Canadian
Pacific Railway Co. |
|
|
| 1.75%,
12/02/26 |
843,000
|
795,750
|
| 2.45%,
12/02/31 |
721,000
|
668,663
|
| 3.00%,
12/02/41 |
310,000
|
279,822
|
| 3.10%,
12/02/51 |
278,000
|
247,212
|
| Cantor
Fitzgerald LP |
|
|
| 4.88%,
05/01/24 (a)(g) |
1,361,000
|
1,400,755
|
| Capital
One Financial Corp. |
|
|
| 3.75%,
07/28/26 (a) |
756,000
|
761,239
|
| Cardinal
Health Inc. |
|
|
| 3.08%,
06/15/24 (a) |
219,000
|
219,302
|
| Carlisle
Companies Inc. |
|
|
| 2.20%,
03/01/32 |
1,134,000
|
987,657
|
| Carrier
Global Corp. |
|
|
| 2.72%,
02/15/30 (a) |
385,000
|
361,881
|
| |
Principal
Amount |
Fair
Value |
| 3.58%,
04/05/50 (a) |
$
385,000 |
$
352,267 |
| Caterpillar
Inc. |
|
|
| 3.25%,
09/19/49 - 04/09/50 (a) |
587,000
|
569,802
|
| Cenovus
Energy Inc. |
|
|
| 2.65%,
01/15/32 |
421,000
|
381,098
|
| 3.75%,
02/15/52 |
488,000
|
438,736
|
| Centene
Corp. |
|
|
| 3.00%,
10/15/30 |
403,000
|
371,292
|
| 3.38%,
02/15/30 (a) |
1,902,000
|
1,791,532
|
| 4.25%,
12/15/27 (a) |
3,230,000
|
3,242,435
|
| CenterPoint
Energy Inc. |
|
|
| 2.65%,
06/01/31 |
638,000
|
590,960
|
| Charter
Communications Operating LLC/Charter Communications Operating Capital |
|
|
| 3.50%,
06/01/41 (a) |
555,000
|
464,191
|
| 3.70%,
04/01/51 (a) |
830,000
|
675,238
|
| 4.80%,
03/01/50 (a) |
837,000
|
797,577
|
| 4.91%,
07/23/25 (a) |
167,000
|
172,923
|
| 5.05%,
03/30/29 (a) |
707,000
|
748,706
|
| 5.75%,
04/01/48 (a) |
219,000
|
233,940
|
| Cheniere
Corpus Christi Holdings LLC |
|
|
| 5.88%,
03/31/25 (a) |
1,113,000
|
1,177,977
|
| 7.00%,
06/30/24 |
1,824,000
|
1,941,612
|
| Chevron
Corp. |
|
|
| 2.24%,
05/11/30 (a) |
210,000
|
198,568
|
| 3.08%,
05/11/50 (a) |
201,000
|
190,514
|
| Chevron
USA Inc. |
|
|
| 3.85%,
01/15/28 (a) |
737,000
|
767,269
|
| 3.90%,
11/15/24 (a) |
255,000
|
262,826
|
| Choice
Hotels International Inc. |
|
|
| 3.70%,
01/15/31 (a) |
447,000
|
433,657
|
| Chubb
INA Holdings Inc. |
|
|
| 4.35%,
11/03/45 (a) |
287,000
|
313,697
|
| Church
& Dwight Company Inc. |
|
|
| 2.30%,
12/15/31 |
452,000
|
412,780
|
| Cigna
Corp. |
|
|
| 2.40%,
03/15/30 (a) |
382,000
|
353,637
|
| 3.25%,
04/15/25 (a) |
345,000
|
346,401
|
| 3.40%,
03/01/27 - 03/15/51 (a) |
578,000
|
549,738
|
| 3.75%,
07/15/23 (a) |
145,000
|
147,159
|
| 3.88%,
10/15/47 (a) |
108,000
|
105,028
|
| 4.13%,
11/15/25 (a) |
615,000
|
634,305
|
| 4.38%,
10/15/28 (a) |
192,000
|
201,953
|
See Notes to Schedules of Investments and Notes to Financial
Statements.
| 14
|
State Street Income Fund
|
State Street Income Fund
Schedule of Investments, continued — March 31, 2022
(Unaudited)
| |
Principal
Amount |
Fair
Value |
| 4.80%,
08/15/38 (a) |
$
168,000 |
$
184,714 |
| 4.90%,
12/15/48 (a) |
87,000
|
97,945
|
| Cisco
Systems Inc. |
|
|
| 5.90%,
02/15/39 (a) |
211,000
|
275,910
|
| Citadel
Finance LLC |
|
|
| 3.38%,
03/09/26 (a)(g) |
3,500,000
|
3,332,210
|
| Citigroup
Inc. |
|
|
| 4.13%,
07/25/28 (a) |
1,818,000
|
1,846,688
|
| 4.45%,
09/29/27 (a) |
448,000
|
461,861
|
| 4.65%,
07/23/48 (a) |
537,000
|
607,309
|
| Citigroup
Inc. (0.98% fixed rate until 05/01/25; 0.67% + SOFR thereafter) |
|
|
| 0.98%,
05/01/25 (b) |
611,000
|
583,016
|
| Citigroup
Inc. (1.68% fixed rate until 05/15/23; 1.67% + SOFR thereafter) |
|
|
| 1.68%,
05/15/24 (a)(b) |
1,959,000
|
1,941,565
|
| Citigroup
Inc. (2.56% fixed rate until 05/01/31; 1.17% + SOFR thereafter) |
|
|
| 2.56%,
05/01/32 (b) |
614,000
|
556,088
|
| Citigroup
Inc. (2.88% fixed rate until 07/24/22; 0.95% + 3 month USD LIBOR thereafter) |
|
|
| 2.88%,
07/24/23 (a)(b) |
180,000
|
180,263
|
| Citigroup
Inc. (2.98% fixed rate until 11/05/29; 1.42% + SOFR thereafter) |
|
|
| 2.98%,
11/05/30 (a)(b) |
374,000
|
355,704
|
| Citigroup
Inc. (3.88% fixed rate until 01/24/38; 1.17% + 3 month USD LIBOR thereafter) |
|
|
| 3.88%,
01/24/39 (a)(b) |
176,000
|
176,581
|
| Citigroup
Inc. (4.70% fixed rate until 01/30/25; 3.23% + SOFR thereafter) |
|
|
| 4.70%,
12/31/99 (a)(b) |
856,000
|
818,790
|
| CME
Group Inc. |
|
|
| 2.65%,
03/15/32 |
460,000
|
440,169
|
| 3.75%,
06/15/28 (a) |
221,000
|
227,771
|
| CMS
Energy Corp. |
|
|
| 4.88%,
03/01/44 (a) |
600,000
|
660,900
|
| CNA
Financial Corp. |
|
|
| 3.45%,
08/15/27 (a) |
165,000
|
165,224
|
| 3.90%,
05/01/29 (a) |
395,000
|
403,560
|
| CNH
Industrial Capital LLC |
|
|
| 1.95%,
07/02/23 (a) |
919,000
|
910,058
|
| |
Principal
Amount |
Fair
Value |
| CNOOC
Finance 2014 ULC |
|
|
| 4.25%,
04/30/24 (a) |
$
2,095,000 |
$
2,140,105 |
| CNOOC
Petroleum North America ULC |
|
|
| 6.40%,
05/15/37 (a) |
540,000
|
632,599
|
| Comcast
Corp. |
|
|
| 2.65%,
08/15/62 (a) |
301,000
|
233,745
|
| 2.80%,
01/15/51 (a) |
341,000
|
286,863
|
| 2.89%,
11/01/51 (g) |
317,000
|
269,127
|
| 2.94%,
11/01/56 (g) |
266,000
|
221,839
|
| 2.99%,
11/01/63 (g) |
253,000
|
207,371
|
| 3.20%,
07/15/36 (a) |
370,000
|
354,075
|
| 3.25%,
11/01/39 (a) |
595,000
|
563,144
|
| 3.97%,
11/01/47 (a) |
411,000
|
420,013
|
| 4.15%,
10/15/28 (a) |
406,000
|
426,759
|
| CommonSpirit
Health |
|
|
| 4.35%,
11/01/42 |
1,029,000
|
1,039,630
|
| Commonwealth
Bank of Australia |
|
|
| 3.78%,
03/14/32 (g) |
800,000
|
773,656
|
| Conagra
Brands Inc. |
|
|
| 5.30%,
11/01/38 (a) |
184,000
|
202,008
|
| 5.40%,
11/01/48 (a) |
159,000
|
181,812
|
| ConocoPhillips
Co. |
|
|
| 4.30%,
11/15/44 (a) |
373,000
|
404,030
|
| Consolidated
Edison Company of New York Inc. |
|
|
| 2.90%,
12/01/26 (a) |
454,000
|
446,060
|
| 3.35%,
04/01/30 (a) |
174,000
|
173,356
|
| 3.88%,
06/15/47 (a) |
208,000
|
202,199
|
| 3.95%,
04/01/50 (a) |
291,000
|
300,833
|
| Constellation
Brands Inc. |
|
|
| 3.15%,
08/01/29 (a) |
834,000
|
805,219
|
| 3.70%,
12/06/26 (a) |
389,000
|
393,582
|
| 4.50%,
05/09/47 (a) |
301,000
|
308,013
|
| Continental
Resources Inc. |
|
|
| 2.88%,
04/01/32 (g) |
665,000
|
591,631
|
| 3.80%,
06/01/24 (a) |
3,189,000
|
3,209,346
|
| 4.50%,
04/15/23 (a) |
2,123,000
|
2,152,510
|
| Corebridge
Financial Inc. |
|
|
| 3.90%,
04/05/32 |
1,980,000
|
1,977,070
|
| Corning
Inc. |
|
|
| 4.38%,
11/15/57 (a) |
202,000
|
204,115
|
| Corporate
Office Properties LP |
|
|
| 2.00%,
01/15/29 |
677,000
|
597,676
|
| 2.25%,
03/15/26 (a) |
561,000
|
535,536
|
| 2.75%,
04/15/31 (a) |
349,000
|
314,278
|
| Credit
Suisse AG |
|
|
| 2.95%,
04/09/25 (a) |
1,080,000
|
1,068,725
|
See Notes to Schedules of Investments and Notes to Financial
Statements.
| State
Street Income Fund |
15
|
State Street Income Fund
Schedule of Investments, continued — March 31, 2022
(Unaudited)
| |
Principal
Amount |
Fair
Value |
| Credit
Suisse Group AG |
|
|
| 3.80%,
06/09/23 (a) |
$
937,000 |
$
945,948 |
| 4.28%,
01/09/28 (a)(g) |
593,000
|
593,006
|
| Crown
Castle International Corp. |
|
|
| 2.90%,
03/15/27 |
1,430,000
|
1,382,524
|
| 3.30%,
07/01/30 (a) |
1,118,000
|
1,070,116
|
| 4.15%,
07/01/50 (a) |
168,000
|
163,711
|
| 5.20%,
02/15/49 (a) |
262,000
|
292,211
|
| CSX
Corp. |
|
|
| 4.50%,
03/15/49 - 08/01/54 (a) |
595,000
|
654,874
|
| CubeSmart
LP |
|
|
| 2.50%,
02/15/32 |
807,000
|
722,709
|
| 4.38%,
02/15/29 (a) |
602,000
|
631,450
|
| Cummins
Inc. |
|
|
| 1.50%,
09/01/30 (a) |
412,000
|
356,899
|
| 2.60%,
09/01/50 (a) |
412,000
|
332,282
|
| CVS
Health Corp. |
|
|
| 3.00%,
08/15/26 (a) |
423,000
|
420,500
|
| 3.25%,
08/15/29 (a) |
350,000
|
346,175
|
| 3.63%,
04/01/27 (a) |
398,000
|
404,479
|
| 3.75%,
04/01/30 (a) |
290,000
|
295,026
|
| 3.88%,
07/20/25 (a) |
245,000
|
250,032
|
| 4.25%,
04/01/50 (a) |
211,000
|
219,662
|
| 4.30%,
03/25/28 (a) |
35,000
|
36,691
|
| 4.78%,
03/25/38 (a) |
260,000
|
283,832
|
| 5.00%,
12/01/24 (a) |
570,000
|
595,964
|
| 5.13%,
07/20/45 (a) |
252,000
|
285,168
|
| 5.30%,
12/05/43 (a) |
426,000
|
492,473
|
| Daimler
Trucks Finance North America LLC |
|
|
| 2.00%,
12/14/26 (g) |
1,580,000
|
1,471,865
|
| 2.38%,
12/14/28 (g) |
845,000
|
770,446
|
| 2.50%,
12/14/31 (g) |
845,000
|
740,862
|
| Danaher
Corp. |
|
|
| 2.80%,
12/10/51 |
1,084,000
|
921,367
|
| Dell
International LLC/EMC Corp. |
|
|
| 4.00%,
07/15/24 |
728,000
|
743,616
|
| 5.45%,
06/15/23 |
101,000
|
104,046
|
| 6.02%,
06/15/26 |
124,000
|
134,542
|
| 8.35%,
07/15/46 |
29,000
|
42,467
|
| Deutsche
Bank AG |
|
|
| 3.30%,
11/16/22 (a) |
772,000
|
777,280
|
| 3.70%,
05/30/24 (a) |
327,000
|
328,465
|
| Deutsche
Bank AG (2.31% fixed rate until 11/16/26; 1.22% + SOFR thereafter) |
|
|
| 2.31%,
11/16/27 (b) |
2,227,000
|
2,048,929
|
| |
Principal
Amount |
Fair
Value |
| Deutsche
Bank AG (3.74% fixed rate until 01/07/32; 2.26% + SOFR thereafter) |
|
|
| 3.74%,
01/07/33 (b) |
$
1,000,000 |
$
883,390 |
| Deutsche
Telekom AG |
|
|
| 3.63%,
01/21/50 (a)(g) |
309,000
|
286,706
|
| Deutsche
Telekom International Finance BV |
|
|
| 2.49%,
09/19/23 (a)(g) |
758,000
|
755,158
|
| Devon
Energy Corp. |
|
|
| 5.00%,
06/15/45 (a) |
133,000
|
144,870
|
| DH
Europe Finance II Sarl |
|
|
| 2.60%,
11/15/29 (a) |
363,000
|
345,834
|
| 3.25%,
11/15/39 (a) |
205,000
|
195,146
|
| 3.40%,
11/15/49 (a) |
106,000
|
100,083
|
| Diamondback
Energy Inc. |
|
|
| 3.13%,
03/24/31 (a) |
555,000
|
530,186
|
| 3.25%,
12/01/26 (a) |
347,000
|
346,618
|
| 3.50%,
12/01/29 (a) |
298,000
|
295,124
|
| 4.40%,
03/24/51 (a) |
275,000
|
278,814
|
| Digital
Realty Trust LP |
|
|
| 3.60%,
07/01/29 (a) |
649,000
|
644,587
|
| Discover
Bank |
|
|
| 2.70%,
02/06/30 (a) |
535,000
|
489,482
|
| Discovery
Communications LLC |
|
|
| 2.95%,
03/20/23 (a) |
746,000
|
748,536
|
| 3.95%,
03/20/28 (a) |
292,000
|
291,834
|
| 4.95%,
05/15/42 (a) |
106,000
|
105,617
|
| 5.00%,
09/20/37 (a) |
133,000
|
137,406
|
| Dollar
General Corp. |
|
|
| 3.50%,
04/03/30 (a) |
237,000
|
236,111
|
| 4.13%,
04/03/50 (a) |
352,000
|
351,250
|
| Dollar
Tree Inc. |
|
|
| 4.00%,
05/15/25 (a) |
468,000
|
479,377
|
| Dominion
Energy Inc. |
|
|
| 3.07%,
08/15/24 (a)(h) |
511,000
|
509,774
|
| 3.38%,
04/01/30 (a) |
597,000
|
588,063
|
| Dover
Corp. |
|
|
| 2.95%,
11/04/29 (a) |
407,000
|
396,048
|
| DTE
Energy Co. |
|
|
| 2.85%,
10/01/26 (a) |
190,000
|
185,883
|
| Duke
Energy Carolinas LLC |
|
|
| 3.95%,
03/15/48 (a) |
238,000
|
245,852
|
| Duke
Energy Corp. |
|
|
| 2.55%,
06/15/31 |
915,000
|
838,954
|
| 3.30%,
06/15/41 |
830,000
|
751,382
|
| 3.50%,
06/15/51 |
830,000
|
756,628
|
| 3.75%,
09/01/46 (a) |
1,269,000
|
1,196,236
|
See Notes to Schedules of Investments and Notes to Financial
Statements.
| 16
|
State Street Income Fund
|
State Street Income Fund
Schedule of Investments, continued — March 31, 2022
(Unaudited)
| |
Principal
Amount |
Fair
Value |
| Duke
Energy Corp. (4.88% fixed rate until 09/16/24; 3.39% + 5 year CMT Rate thereafter) |
|
|
| 4.88%,
12/31/99 (b) |
$
1,119,000 |
$
1,130,335 |
| Duke
Energy Progress LLC |
|
|
| 4.15%,
12/01/44 (a) |
226,000
|
233,788
|
| Duke
Realty LP |
|
|
| 3.05%,
03/01/50 (a) |
177,000
|
151,015
|
| 3.25%,
06/30/26 (a) |
237,000
|
235,839
|
| DuPont
de Nemours Inc. |
|
|
| 5.42%,
11/15/48 (a) |
147,000
|
177,926
|
| Duquesne
Light Holdings Inc. |
|
|
| 3.62%,
08/01/27 (a)(g) |
626,000
|
617,868
|
| Eastman
Chemical Co. |
|
|
| 4.65%,
10/15/44 (a) |
405,000
|
417,478
|
| Eaton
Corp. |
|
|
| 3.10%,
09/15/27 (a) |
251,000
|
251,281
|
| Ecolab
Inc. |
|
|
| 1.30%,
01/30/31 (a) |
414,000
|
356,744
|
| Edison
International |
|
|
| 4.95%,
04/15/25 (a) |
950,000
|
975,574
|
| 5.75%,
06/15/27 (a) |
119,000
|
127,694
|
| EI
du Pont de Nemours & Co. |
|
|
| 2.30%,
07/15/30 (a) |
307,000
|
285,796
|
| Electronic
Arts Inc. |
|
|
| 1.85%,
02/15/31 (a) |
513,000
|
451,620
|
| Emera
US Finance LP |
|
|
| 2.64%,
06/15/31 |
923,000
|
829,749
|
| Emerson
Electric Co. |
|
|
| 1.80%,
10/15/27 (a) |
266,000
|
249,378
|
| 2.75%,
10/15/50 (a) |
203,000
|
172,359
|
| Empower
Finance 2020 LP |
|
|
| 1.36%,
09/17/27 (a)(g) |
614,000
|
554,246
|
| 1.78%,
03/17/31 (a)(g) |
473,000
|
410,682
|
| Enbridge
Energy Partners LP |
|
|
| 5.50%,
09/15/40 (a) |
57,000
|
64,475
|
| Enbridge
Inc. |
|
|
| 1.60%,
10/04/26 |
1,704,000
|
1,577,495
|
| Enbridge
Inc. (5.75% fixed rate until 07/15/30; 5.31% + 5 year CMT Rate thereafter) |
|
|
| 5.75%,
07/15/80 (a)(b) |
1,031,000
|
1,067,405
|
| Energy
Transfer LP |
|
|
| 4.25%,
03/15/23 (a) |
549,000
|
555,006
|
| 4.50%,
04/15/24 (a) |
435,000
|
443,574
|
| 4.95%,
06/15/28 (a) |
132,000
|
138,559
|
| 5.30%,
04/01/44 - 04/15/47 (a) |
673,000
|
688,940
|
| 5.35%,
05/15/45 |
555,000
|
572,116
|
| |
Principal
Amount |
Fair
Value |
| 6.13%,
12/15/45 (a) |
$
110,000 |
$
121,397 |
| 6.50%,
02/01/42 (a) |
312,000
|
358,881
|
| Energy
Transfer LP (6.75% fixed rate until 05/15/25; 5.13% + 5 year CMT Rate thereafter) |
|
|
| 6.75%,
12/31/99 (b) |
2,488,000
|
2,419,928
|
| Energy
Transfer LP/Regency Energy Finance Corp. |
|
|
| 4.50%,
11/01/23 (a) |
279,000
|
283,369
|
| Enstar
Group Ltd. |
|
|
| 3.10%,
09/01/31 |
591,000
|
529,199
|
| Enterprise
Products Operating LLC |
|
|
| 4.25%,
02/15/48 (a) |
583,000
|
585,513
|
| Enterprise
Products Operating LLC (5.25% fixed rate until 08/16/27; 3.03% + 3 month USD LIBOR thereafter) |
|
|
| 5.25%,
08/16/77 (a)(b) |
190,000
|
178,114
|
| EOG
Resources Inc. |
|
|
| 4.15%,
01/15/26 (a) |
262,000
|
271,304
|
| 4.95%,
04/15/50 (a) |
204,000
|
250,532
|
| 5.10%,
01/15/36 (a) |
164,000
|
180,805
|
| Equinix
Inc. |
|
|
| 1.25%,
07/15/25 (a) |
767,000
|
715,442
|
| 2.15%,
07/15/30 (a) |
579,000
|
508,408
|
| Equinor
ASA |
|
|
| 3.25%,
11/18/49 (a) |
435,000
|
409,687
|
| ERP
Operating LP |
|
|
| 4.50%,
07/01/44 (a) |
136,000
|
149,082
|
| Everest
Reinsurance Holdings Inc. |
|
|
| 3.13%,
10/15/52 |
676,000
|
562,256
|
| Eversource
Energy |
|
|
| 3.45%,
01/15/50 (a) |
404,000
|
369,022
|
| Exelon
Corp. |
|
|
| 3.50%,
06/01/22 (a) |
451,000
|
451,550
|
| 4.05%,
04/15/30 (a) |
611,000
|
630,766
|
| 4.45%,
04/15/46 (a) |
380,000
|
397,138
|
| 4.70%,
04/15/50 |
406,000
|
446,831
|
| Extra
Space Storage LP |
|
|
| 3.90%,
04/01/29 |
375,000
|
376,335
|
| Exxon
Mobil Corp. |
|
|
| 2.61%,
10/15/30 (a) |
1,221,000
|
1,174,871
|
| 3.45%,
04/15/51 (a) |
634,000
|
613,179
|
| FedEx
Corp. |
|
|
| 4.10%,
02/01/45 (a) |
896,000
|
876,207
|
See Notes to Schedules of Investments and Notes to Financial
Statements.
| State
Street Income Fund |
17
|
State Street Income Fund
Schedule of Investments, continued — March 31, 2022
(Unaudited)
| |
Principal
Amount |
Fair
Value |
| Fidelity
National Financial Inc. |
|
|
| 3.20%,
09/17/51 |
$
633,000 |
$
503,001 |
| Fidelity
National Information Services Inc. |
|
|
| 1.15%,
03/01/26 |
517,000
|
475,082
|
| 1.65%,
03/01/28 (a) |
467,000
|
418,385
|
| 3.10%,
03/01/41 (a) |
110,000
|
95,445
|
| FirstEnergy
Transmission LLC |
|
|
| 4.55%,
04/01/49 (a)(g) |
741,000
|
712,271
|
| Fiserv
Inc. |
|
|
| 3.50%,
07/01/29 (a) |
272,000
|
267,667
|
| 4.40%,
07/01/49 (a) |
159,000
|
163,846
|
| Florida
Power & Light Co. |
|
|
| 2.85%,
04/01/25 (a) |
1,025,000
|
1,025,984
|
| 4.13%,
02/01/42 (a) |
222,000
|
234,923
|
| Flowers
Foods Inc. |
|
|
| 2.40%,
03/15/31 (a) |
496,000
|
444,803
|
| Flowserve
Corp. |
|
|
| 2.80%,
01/15/32 |
631,000
|
559,684
|
| Ford
Motor Co. |
|
|
| 4.35%,
12/08/26 (a) |
525,000
|
528,087
|
| Ford
Motor credit Company LLC |
|
|
| 2.90%,
02/10/29 |
1,600,000
|
1,425,488
|
| Ford
Motor Credit Company LLC |
|
|
| 3.10%,
05/04/23 (a) |
1,436,000
|
1,434,607
|
| 3.81%,
01/09/24 (a) |
945,000
|
943,497
|
| Fox
Corp. |
|
|
| 3.50%,
04/08/30 (a) |
411,000
|
407,465
|
| Freeport-McMoRan
Inc. |
|
|
| 4.25%,
03/01/30 |
721,000
|
725,910
|
| GA
Global Funding Trust |
|
|
| 1.63%,
01/15/26 (a)(g) |
747,000
|
697,302
|
| General
Dynamics Corp. |
|
|
| 4.25%,
04/01/50 (a) |
312,000
|
350,704
|
| General
Mills Inc. |
|
|
| 3.00%,
02/01/51 |
326,000
|
281,762
|
| General
Motors Co. |
|
|
| 5.20%,
04/01/45 (a) |
60,000
|
60,745
|
| 5.40%,
10/02/23 - 04/01/48 (a) |
296,000
|
308,359
|
| 6.13%,
10/01/25 (a) |
780,000
|
838,211
|
| 6.80%,
10/01/27 (a) |
328,000
|
370,230
|
| General
Motors Financial Company Inc. |
|
|
| 1.25%,
01/08/26 (a) |
926,000
|
846,086
|
| 2.35%,
01/08/31 (a) |
406,000
|
350,816
|
| 3.45%,
04/10/22 (a) |
846,000
|
846,152
|
| 5.25%,
03/01/26 (a) |
322,000
|
337,479
|
| |
Principal
Amount |
Fair
Value |
| Genuine
Parts Co. |
|
|
| 2.75%,
02/01/32 |
$
748,000 |
$
686,664 |
| Georgia-Pacific
LLC |
|
|
| 1.75%,
09/30/25 (a)(g) |
1,036,000
|
985,298
|
| 3.60%,
03/01/25 (a)(g) |
1,820,000
|
1,839,729
|
| Gilead
Sciences Inc. |
|
|
| 2.60%,
10/01/40 (a) |
311,000
|
261,346
|
| 2.80%,
10/01/50 (a) |
447,000
|
367,434
|
| 2.95%,
03/01/27 (a) |
69,000
|
68,374
|
| 3.50%,
02/01/25 (a) |
248,000
|
251,447
|
| 3.65%,
03/01/26 (a) |
226,000
|
230,195
|
| 4.15%,
03/01/47 (a) |
149,000
|
153,077
|
| GlaxoSmithKline
Capital Inc. |
|
|
| 3.38%,
05/15/23 (a) |
550,000
|
557,238
|
| 3.63%,
05/15/25 (a) |
520,000
|
531,180
|
| GlaxoSmithKline
Capital PLC |
|
|
| 3.38%,
06/01/29 (a) |
462,000
|
471,157
|
| Glencore
Finance Canada Ltd. |
|
|
| 4.25%,
10/25/22 (a)(g) |
1,103,000
|
1,113,909
|
| Glencore
Funding LLC |
|
|
| 3.88%,
04/27/51 (g) |
512,000
|
471,255
|
| Graphic
Packaging International LLC |
|
|
| 1.51%,
04/15/26 (a)(g) |
628,000
|
577,258
|
| Gray
Oak Pipeline LLC |
|
|
| 2.00%,
09/15/23 (a)(g) |
1,438,000
|
1,416,761
|
| 2.60%,
10/15/25 (a)(g) |
940,000
|
902,052
|
| GSK
Consumer Healthcare Capital US LLC |
|
|
| 3.38%,
03/24/27 |
1,465,000
|
1,465,703
|
| 3.63%,
03/24/32 |
610,000
|
610,250
|
| 4.00%,
03/24/52 |
250,000
|
250,648
|
| Halliburton
Co. |
|
|
| 3.80%,
11/15/25 (a) |
3,000
|
3,064
|
| 5.00%,
11/15/45 (a) |
177,000
|
192,098
|
| HCA
Inc. |
|
|
| 3.13%,
03/15/27 |
1,200,000
|
1,172,496
|
| 3.50%,
09/01/30 |
1,283,000
|
1,238,544
|
| 3.63%,
03/15/32 |
1,284,000
|
1,258,281
|
| 4.38%,
03/15/42 |
425,000
|
420,091
|
| 4.63%,
03/15/52 |
215,000
|
217,799
|
| 5.38%,
02/01/25 |
3,221,000
|
3,360,528
|
| Health
Care Service Corp. |
|
|
| 2.20%,
06/01/30 (a)(g) |
564,000
|
513,725
|
| 3.20%,
06/01/50 (a)(g) |
204,000
|
179,175
|
| Healthcare
Trust of America Holdings LP |
|
|
| 2.00%,
03/15/31 (a) |
335,000
|
290,177
|
See Notes to Schedules of Investments and Notes to Financial
Statements.
| 18
|
State Street Income Fund
|
State Street Income Fund
Schedule of Investments, continued — March 31, 2022
(Unaudited)
| |
Principal
Amount |
Fair
Value |
| Helmerich
& Payne Inc. |
|
|
| 2.90%,
09/29/31 (g) |
$
339,000 |
$
311,073 |
| Hess
Corp. |
|
|
| 5.60%,
02/15/41 (a) |
89,000
|
100,157
|
| 5.80%,
04/01/47 (a) |
56,000
|
66,360
|
| Hewlett
Packard Enterprise Co. |
|
|
| 6.35%,
10/15/45 (a) |
97,000
|
113,672
|
| Highwoods
Realty LP |
|
|
| 4.13%,
03/15/28 (a) |
244,000
|
247,738
|
| 4.20%,
04/15/29 (a) |
595,000
|
606,287
|
| Honeywell
International Inc. |
|
|
| 1.75%,
09/01/31 |
636,000
|
569,831
|
| 2.70%,
08/15/29 (a) |
463,000
|
454,597
|
| Hormel
Foods Corp. |
|
|
| 1.80%,
06/11/30 (a) |
826,000
|
740,038
|
| HSBC
Holdings PLC (2.01% fixed rate until 09/22/27; 1.73% + SOFR thereafter) |
|
|
| 2.01%,
09/22/28 (a)(b) |
1,527,000
|
1,385,966
|
| HSBC
Holdings PLC (2.25% fixed rate until 11/22/26; 1.10% + SOFR thereafter) |
|
|
| 2.25%,
11/22/27 (b) |
1,250,000
|
1,164,525
|
| HSBC
Holdings PLC (2.87% fixed rate until 11/22/31; 1.41% + SOFR thereafter) |
|
|
| 2.87%,
11/22/32 (b) |
520,000
|
473,398
|
| HSBC
Holdings PLC (3.00% fixed rate until 03/10/25; 1.43% + SOFR thereafter) |
|
|
| 3.00%,
03/10/26 (b) |
1,095,000
|
1,073,866
|
| HSBC
Holdings PLC (4.00% fixed rate until 09/09/26; 3.22% + 5 year CMT Rate thereafter) |
|
|
| 4.00%,
12/31/99 (a)(b) |
924,000
|
875,601
|
| HSBC
Holdings PLC (4.29% fixed rate until 09/12/25; 1.35% + 3 month USD LIBOR thereafter) |
|
|
| 4.29%,
09/12/26 (a)(b) |
1,372,000
|
1,391,208
|
| HSBC
Holdings PLC (6.00% fixed rate until 05/22/27; 3.75% + USD 5 year Mid-Market Swap Rate thereafter) |
|
|
| 6.00%,
12/31/99 (a)(b) |
801,000
|
812,054
|
| |
Principal
Amount |
Fair
Value |
| HSBC
Holdings PLC (6.50% fixed rate until 03/23/28; 3.61% + USD 5 year Mid-Market Swap Rate thereafter) |
|
|
| 6.50%,
12/31/99 (a)(b) |
$
1,024,000 |
$
1,044,480 |
| Humana
Inc. |
|
|
| 1.35%,
02/03/27 |
1,018,000
|
924,802
|
| 2.15%,
02/03/32 |
511,000
|
448,525
|
| Huntington
Bancshares Inc. |
|
|
| 2.55%,
02/04/30 (a) |
810,000
|
764,332
|
| Huntington
Ingalls Industries Inc. |
|
|
| 2.04%,
08/16/28 (g) |
1,107,000
|
1,000,595
|
| Hyundai
Capital America |
|
|
| 1.30%,
01/08/26 (a)(g) |
1,557,000
|
1,423,332
|
| 3.10%,
04/05/22 (a)(g) |
406,000
|
406,000
|
| Imperial
Brands Finance PLC |
|
|
| 3.13%,
07/26/24 (a)(g) |
844,000
|
836,632
|
| 3.50%,
02/11/23 - 07/26/26 (a)(g) |
2,068,000
|
2,066,869
|
| Indiana
Michigan Power Co. |
|
|
| 3.25%,
05/01/51 |
412,000
|
369,416
|
| ING
Groep N.V. |
|
|
| 4.10%,
10/02/23 (a) |
1,682,000
|
1,710,173
|
| ING
Groep N.V. (1.28% fixed rate until 04/01/27; 1.01% + SOFR thereafter) |
|
|
| 1.28%,
04/01/27 (b) |
836,000
|
824,973
|
| Ingredion
Inc. |
|
|
| 3.90%,
06/01/50 (a) |
205,000
|
199,535
|
| Intel
Corp. |
|
|
| 2.00%,
08/12/31 |
632,000
|
573,768
|
| 2.45%,
11/15/29 (a) |
781,000
|
745,269
|
| 2.60%,
05/19/26 (a) |
533,000
|
528,709
|
| 2.80%,
08/12/41 |
731,000
|
649,384
|
| 2.88%,
05/11/24 (a) |
334,000
|
336,659
|
| 3.10%,
02/15/60 (a) |
372,000
|
323,863
|
| Intercontinental
Exchange Inc. |
|
|
| 1.85%,
09/15/32 (a) |
205,000
|
177,633
|
| 2.65%,
09/15/40 (a) |
138,000
|
118,422
|
| International
Business Machines Corp. |
|
|
| 3.45%,
02/19/26 (a) |
704,000
|
715,201
|
| 4.15%,
05/15/39 (a) |
470,000
|
492,786
|
| 4.25%,
05/15/49 (a) |
227,000
|
241,977
|
| International
Paper Co. |
|
|
| 4.40%,
08/15/47 (a) |
301,000
|
315,887
|
| Interstate
Power & Light Co. |
|
|
| 3.40%,
08/15/25 (a) |
1,587,000
|
1,588,904
|
See Notes to Schedules of Investments and Notes to Financial
Statements.
| State
Street Income Fund |
19
|
State Street Income Fund
Schedule of Investments, continued — March 31, 2022
(Unaudited)
| |
Principal
Amount |
Fair
Value |
| ITC
Holdings Corp. |
|
|
| 2.95%,
05/14/30 (a)(g) |
$
1,018,000 |
$
967,517 |
| JAB
HOLDINGS BV |
|
|
| 2.20%,
11/23/30 (a)(g) |
498,000
|
444,375
|
| Jabil
Inc. |
|
|
| 3.95%,
01/12/28 (a) |
316,000
|
316,739
|
| John
Deere Capital Corp. |
|
|
| 2.45%,
01/09/30 (a) |
726,000
|
695,435
|
| Johnson
& Johnson |
|
|
| 3.63%,
03/03/37 (a) |
203,000
|
210,385
|
| Johnson
Controls International PLC |
|
|
| 4.50%,
02/15/47 (a) |
129,000
|
136,025
|
| JPMorgan
Chase & Co. (1.58% fixed rate until 04/22/26; 0.89% + SOFR thereafter) |
|
|
| 1.58%,
04/22/27 (b) |
1,149,000
|
1,070,339
|
| JPMorgan
Chase & Co. (2.96% fixed rate until 05/13/30; 2.52% + SOFR thereafter) |
|
|
| 2.96%,
05/13/31 (a)(b) |
665,000
|
623,471
|
| JPMorgan
Chase & Co. (3.11% fixed rate until 04/22/50; 2.44% + SOFR thereafter) |
|
|
| 3.11%,
04/22/51 (b) |
1,109,000
|
986,278
|
| JPMorgan
Chase & Co. (3.16% fixed rate until 04/22/41; 1.46% + SOFR thereafter) |
|
|
| 3.16%,
04/22/42 (b) |
555,000
|
503,030
|
| JPMorgan
Chase & Co. (3.88% fixed rate until 07/24/37; 1.36% + 3 month USD LIBOR thereafter) |
|
|
| 3.88%,
07/24/38 (a)(b) |
436,000
|
442,993
|
| JPMorgan
Chase & Co. (3.90% fixed rate until 01/23/48; 1.22% + 3 month USD LIBOR thereafter) |
|
|
| 3.90%,
01/23/49 (a)(b) |
443,000
|
448,520
|
| JPMorgan
Chase & Co. (3.96% fixed rate until 01/29/26; 1.25% + 3 month USD LIBOR thereafter) |
|
|
| 3.96%,
01/29/27 (a)(b) |
731,000
|
746,972
|
| |
Principal
Amount |
Fair
Value |
| JPMorgan
Chase & Co. (4.01% fixed rate until 04/23/28; 1.12% + 3 month USD LIBOR thereafter) |
|
|
| 4.01%,
04/23/29 (a)(b) |
$
301,000 |
$
307,327 |
| JPMorgan
Chase & Co. (4.03% fixed rate until 07/24/47; 1.46% + 3 month USD LIBOR thereafter) |
|
|
| 4.03%,
07/24/48 (a)(b) |
294,000
|
304,249
|
| JPMorgan
Chase & Co. (4.49% fixed rate until 03/24/30; 3.79% + SOFR thereafter) |
|
|
| 4.49%,
03/24/31 (a)(b) |
1,012,000
|
1,074,086
|
| JPMorgan
Chase & Co. (4.60% fixed rate until 02/01/25; 3.13% + SOFR thereafter) |
|
|
| 4.60%,
12/31/99 (a)(b) |
1,137,000
|
1,095,841
|
| JPMorgan
Chase & Co. (6.10% fixed rate until 10/01/24; 3.33% + 3 month USD LIBOR thereafter) |
|
|
| 6.10%,
10/29/49 (a)(b) |
968,000
|
992,190
|
| Kaiser
Foundation Hospitals |
|
|
| 3.00%,
06/01/51 |
568,000
|
500,828
|
| 3.27%,
11/01/49 (a) |
693,000
|
647,900
|
| Kansas
City Southern/old |
|
|
| 3.50%,
05/01/50 |
317,000
|
295,349
|
| Keurig
Dr Pepper Inc. |
|
|
| 3.20%,
05/01/30 (a) |
454,000
|
441,424
|
| 3.80%,
05/01/50 (a) |
344,000
|
326,081
|
| Kinder
Morgan Energy Partners LP |
|
|
| 4.70%,
11/01/42 (a) |
76,000
|
75,683
|
| 5.00%,
03/01/43 (a) |
156,000
|
160,585
|
| 6.38%,
03/01/41 (a) |
133,000
|
156,488
|
| Kinder
Morgan Inc. |
|
|
| 1.75%,
11/15/26 |
1,980,000
|
1,840,608
|
| 5.05%,
02/15/46 (a) |
125,000
|
132,585
|
| KLA
Corp. |
|
|
| 3.30%,
03/01/50 (a) |
405,000
|
381,425
|
| 4.65%,
11/01/24 (a) |
554,000
|
574,188
|
| Kohl's
Corp. |
|
|
| 3.38%,
05/01/31 |
188,000
|
180,369
|
| Kraft
Heinz Foods Co. |
|
|
| 5.20%,
07/15/45 |
643,000
|
695,694
|
| Kreditanstalt
fuer Wiederaufbau |
|
|
| 2.00%,
10/04/22 (a) |
1,948,000
|
1,955,617
|
See Notes to Schedules of Investments and Notes to Financial
Statements.
| 20
|
State Street Income Fund
|
State Street Income Fund
Schedule of Investments, continued — March 31, 2022
(Unaudited)
| |
Principal
Amount |
Fair
Value |
| Kyndryl
Holdings Inc. |
|
|
| 2.05%,
10/15/26 (g) |
$
791,000 |
$
710,737 |
| 2.70%,
10/15/28 (g) |
1,361,000
|
1,183,253
|
| L3Harris
Technologies Inc. |
|
|
| 3.85%,
12/15/26 (a) |
328,000
|
333,756
|
| Lear
Corp. |
|
|
| 4.25%,
05/15/29 (a) |
270,000
|
273,569
|
| Leidos
Inc. |
|
|
| 2.95%,
05/15/23 |
1,138,000
|
1,140,834
|
| 3.63%,
05/15/25 |
339,000
|
340,071
|
| 4.38%,
05/15/30 |
1,480,000
|
1,509,615
|
| Liberty
Mutual Group Inc. |
|
|
| 3.95%,
05/15/60 (a)(g) |
204,000
|
186,042
|
| Life
Storage LP |
|
|
| 2.20%,
10/15/30 (a) |
574,000
|
507,227
|
| Lincoln
National Corp. |
|
|
| 4.35%,
03/01/48 (a) |
220,000
|
222,222
|
| Lloyds
Banking Group PLC |
|
|
| 3.75%,
01/11/27 (a) |
372,000
|
372,897
|
| Lloyds
Banking Group PLC (2.44% fixed rate until 02/05/25; 1.00% + 1 year CMT Rate thereafter) |
|
|
| 2.44%,
02/05/26 (a)(b) |
800,000
|
772,528
|
| Lloyds
Banking Group PLC (2.91% fixed rate until 11/07/22; 0.81% + 3 month USD LIBOR thereafter) |
|
|
| 2.91%,
11/07/23 (a)(b) |
982,000
|
983,571
|
| Lockheed
Martin Corp. |
|
|
| 3.55%,
01/15/26 (a) |
293,000
|
300,269
|
| 3.80%,
03/01/45 (a) |
115,000
|
117,666
|
| 4.50%,
05/15/36 (a) |
372,000
|
410,569
|
| Lowe's
Companies Inc. |
|
|
| 1.30%,
04/15/28 (a) |
270,000
|
240,821
|
| 1.70%,
09/15/28 |
635,000
|
575,386
|
| 1.70%,
10/15/30 (a) |
205,000
|
179,086
|
| 3.00%,
10/15/50 (a) |
411,000
|
349,416
|
| 3.70%,
04/15/46 (a) |
145,000
|
138,436
|
| 4.05%,
05/03/47 (a) |
343,000
|
342,849
|
| LYB
International Finance III LLC |
|
|
| 1.25%,
10/01/25 (a) |
321,000
|
297,313
|
| 3.63%,
04/01/51 (a) |
205,000
|
184,840
|
| 3.80%,
10/01/60 (a) |
204,000
|
179,761
|
| Magallanes
Inc. |
|
|
| 5.05%,
03/15/42 (g) |
225,000
|
229,543
|
| 5.14%,
03/15/52 |
220,000
|
225,223
|
| 5.39%,
03/15/62 |
220,000
|
227,308
|
| |
Principal
Amount |
Fair
Value |
| Marsh
& McLennan Companies Inc. |
|
|
| 2.38%,
12/15/31 |
$
328,000 |
$
300,697 |
| 2.90%,
12/15/51 |
399,000
|
333,907
|
| Marvell
Technology Inc. |
|
|
| 1.65%,
04/15/26 |
1,219,000
|
1,133,914
|
| 2.45%,
04/15/28 |
926,000
|
854,031
|
| Masco
Corp. |
|
|
| 3.50%,
11/15/27 (a) |
117,000
|
116,291
|
| McCormick
& Company Inc. |
|
|
| 1.85%,
02/15/31 (a) |
294,000
|
256,139
|
| 3.25%,
11/15/25 (a) |
2,940,000
|
2,943,205
|
| McDonald's
Corp. |
|
|
| 3.60%,
07/01/30 (a) |
610,000
|
620,632
|
| 3.63%,
09/01/49 (a) |
247,000
|
236,315
|
| Medtronic
Inc. |
|
|
| 4.63%,
03/15/45 (a) |
49,000
|
56,962
|
| Memorial
Sloan-Kettering Cancer Center |
|
|
| 4.13%,
07/01/52 (a) |
646,000
|
687,292
|
| Merck
& Company Inc. |
|
|
| 1.70%,
06/10/27 |
1,081,000
|
1,024,139
|
| 1.90%,
12/10/28 |
1,081,000
|
1,018,280
|
| 2.15%,
12/10/31 |
685,000
|
634,721
|
| 2.45%,
06/24/50 (a) |
509,000
|
423,839
|
| 2.75%,
02/10/25 (a) |
647,000
|
648,993
|
| 2.75%,
12/10/51 |
360,000
|
313,765
|
| 2.90%,
12/10/61 |
201,000
|
172,060
|
| 4.00%,
03/07/49 (a) |
136,000
|
146,933
|
| MetLife
Inc. |
|
|
| 4.72%,
12/15/44 (a) |
234,000
|
256,597
|
| Microchip
Technology Inc. |
|
|
| 2.67%,
09/01/23 |
2,847,000
|
2,838,858
|
| Micron
Technology Inc. |
|
|
| 3.37%,
11/01/41 |
528,000
|
470,606
|
| 3.48%,
11/01/51 |
739,000
|
644,489
|
| Microsoft
Corp. |
|
|
| 2.40%,
08/08/26 (a) |
290,000
|
287,619
|
| 2.68%,
06/01/60 (a) |
165,000
|
142,537
|
| 2.92%,
03/17/52 (a) |
1,236,000
|
1,154,844
|
| 3.04%,
03/17/62 (a) |
312,000
|
291,864
|
| 3.45%,
08/08/36 (a) |
109,000
|
113,143
|
| 3.50%,
02/12/35 (a) |
295,000
|
308,585
|
| Mid-America
Apartments LP |
|
|
| 2.88%,
09/15/51 |
631,000
|
531,636
|
| Mitsubishi
UFJ Financial Group Inc. |
|
|
| 2.80%,
07/18/24 (a) |
1,396,000
|
1,387,233
|
See Notes to Schedules of Investments and Notes to Financial
Statements.
| State
Street Income Fund |
21
|
State Street Income Fund
Schedule of Investments, continued — March 31, 2022
(Unaudited)
| |
Principal
Amount |
Fair
Value |
| Mizuho
Financial Group Inc. (3.92% fixed rate until 09/11/23; 1.00% + 3 month USD LIBOR thereafter) |
|
|
| 3.92%,
09/11/24 (a)(b) |
$
1,310,000 |
$
1,325,026 |
| Molson
Coors Beverage Co. |
|
|
| 4.20%,
07/15/46 (a) |
130,000
|
125,627
|
| Morgan
Stanley |
|
|
| 3.63%,
01/20/27 (a) |
289,000
|
291,748
|
| 4.35%,
09/08/26 (a) |
816,000
|
841,761
|
| 4.38%,
01/22/47 (a) |
307,000
|
332,177
|
| Morgan
Stanley (1.51% fixed rate until 07/20/26; 0.86% + SOFR thereafter) |
|
|
| 1.51%,
07/20/27 (b) |
633,000
|
583,366
|
| Morgan
Stanley (2.48% fixed rate until 09/16/31; 1.36% + SOFR thereafter) |
|
|
| 2.48%,
09/16/36 (b) |
2,531,000
|
2,172,863
|
| Morgan
Stanley (2.80% fixed rate until 01/25/51; 1.43% + SOFR thereafter) |
|
|
| 2.80%,
01/25/52 (a)(b) |
546,000
|
456,554
|
| Morgan
Stanley (3.62% fixed rate until 04/01/30; 3.12% + SOFR thereafter) |
|
|
| 3.62%,
04/01/31 (a)(b) |
509,000
|
507,524
|
| Morgan
Stanley (3.97% fixed rate until 07/22/37; 1.46% + 3 month USD LIBOR thereafter) |
|
|
| 3.97%,
07/22/38 (a)(b) |
274,000
|
276,055
|
| MPLX
LP |
|
|
| 2.65%,
08/15/30 (a) |
470,000
|
431,629
|
| 3.38%,
03/15/23 (a) |
269,000
|
271,160
|
| 5.20%,
12/01/47 (a) |
143,000
|
152,183
|
| Mylan
Inc. |
|
|
| 5.20%,
04/15/48 (a) |
185,000
|
182,016
|
| National
Australia Bank Ltd. (3.35% fixed rate until 01/12/32; 1.70% + 5 year CMT Rate thereafter) |
|
|
| 3.35%,
01/12/37 (b)(g) |
1,246,000
|
1,145,859
|
| National
Retail Properties Inc. |
|
|
| 4.00%,
11/15/25 (a) |
381,000
|
389,873
|
| Natwest
Group PLC (3.75% fixed rate until 11/01/24; 2.10% + 5 year CMT Rate thereafter) |
|
|
| 3.75%,
11/01/29 (a)(b) |
575,000
|
569,923
|
| |
Principal
Amount |
Fair
Value |
| Natwest
Group PLC (4.52% fixed rate until 06/25/23; 1.55% + 3 month USD LIBOR thereafter) |
|
|
| 4.52%,
06/25/24 (a)(b) |
$
953,000 |
$
967,857 |
| NewMarket
Corp. |
|
|
| 2.70%,
03/18/31 (a) |
419,000
|
383,917
|
| Newmont
Corp. |
|
|
| 4.88%,
03/15/42 (a) |
236,000
|
266,390
|
| NextEra
Energy Capital Holdings Inc. (5.65% fixed rate until 05/01/29; 3.16% + 3 month USD LIBOR thereafter) |
|
|
| 5.65%,
05/01/79 (a)(b) |
371,000
|
382,520
|
| NGPL
PipeCo LLC |
|
|
| 3.25%,
07/15/31 (g) |
656,000
|
608,053
|
| NIKE
Inc. |
|
|
| 3.38%,
03/27/50 (a) |
200,000
|
198,630
|
| Nippon
Life Insurance Co. (3.40% fixed rate until 01/23/30; 2.61% + 5 year CMT Rate thereafter) |
|
|
| 3.40%,
01/23/50 (a)(b)(g) |
786,000
|
748,610
|
| NiSource
Inc. |
|
|
| 3.60%,
05/01/30 (a) |
415,000
|
411,809
|
| 3.95%,
03/30/48 (a) |
121,000
|
115,602
|
| Norfolk
Southern Corp. |
|
|
| 3.95%,
10/01/42 (a) |
256,000
|
258,463
|
| NOV
Inc. |
|
|
| 3.60%,
12/01/29 (a) |
608,000
|
597,865
|
| Novant
Health Inc. |
|
|
| 3.32%,
11/01/61 |
396,000
|
351,280
|
| Novartis
Capital Corp. |
|
|
| 2.20%,
08/14/30 (a) |
608,000
|
571,173
|
| 3.00%,
11/20/25 (a) |
52,000
|
52,293
|
| Nutrien
Ltd. |
|
|
| 4.90%,
06/01/43 (a) |
254,000
|
278,305
|
| NVIDIA
Corp. |
|
|
| 2.85%,
04/01/30 (a) |
204,000
|
200,797
|
| 3.50%,
04/01/50 (a) |
270,000
|
272,673
|
| NXP
BV/NXP Funding LLC/NXP USA Inc. |
|
|
| 3.25%,
11/30/51 (g) |
880,000
|
744,612
|
| Oklahoma
Gas & Electric Co. |
|
|
| 3.25%,
04/01/30 (a) |
341,000
|
336,454
|
| Oncor
Electric Delivery Company LLC |
|
|
| 3.80%,
09/30/47 (a) |
136,000
|
137,493
|
| ONEOK
Inc. |
|
|
| 4.35%,
03/15/29 (a) |
378,000
|
385,934
|
See Notes to Schedules of Investments and Notes to Financial
Statements.
| 22
|
State Street Income Fund
|
State Street Income Fund
Schedule of Investments, continued — March 31, 2022
(Unaudited)
| |
Principal
Amount |
Fair
Value |
| Oracle
Corp. |
|
|
| 1.65%,
03/25/26 (a) |
$
755,000 |
$
702,830 |
| 2.30%,
03/25/28 (a) |
279,000
|
255,472
|
| 2.40%,
09/15/23 (a) |
237,000
|
236,059
|
| 2.65%,
07/15/26 (a) |
423,000
|
406,668
|
| 2.88%,
03/25/31 (a) |
403,000
|
367,762
|
| 2.95%,
04/01/30 (a) |
611,000
|
565,474
|
| 3.60%,
04/01/50 (a) |
406,000
|
336,481
|
| 3.65%,
03/25/41 (a) |
444,000
|
386,879
|
| 3.80%,
11/15/37 (a) |
128,000
|
115,919
|
| 3.95%,
03/25/51 (a) |
447,000
|
391,232
|
| 4.00%,
07/15/46 - 11/15/47 (a) |
609,000
|
539,486
|
| 4.10%,
03/25/61 (a) |
527,000
|
453,489
|
| Otis
Worldwide Corp. |
|
|
| 2.06%,
04/05/25 (a) |
704,000
|
685,914
|
| 2.57%,
02/15/30 (a) |
251,000
|
234,570
|
| 3.36%,
02/15/50 (a) |
238,000
|
210,718
|
| Ovintiv
Exploration Inc. |
|
|
| 5.63%,
07/01/24 (a) |
3,151,000
|
3,312,174
|
| Owens
Corning |
|
|
| 4.40%,
01/30/48 (a) |
174,000
|
173,889
|
| Pacific
Gas & Electric Co. |
|
|
| 2.10%,
08/01/27 (a) |
341,000
|
306,579
|
| 2.50%,
02/01/31 (a) |
610,000
|
524,868
|
| 3.00%,
06/15/28 |
576,000
|
536,417
|
| 3.30%,
08/01/40 (a) |
610,000
|
500,170
|
| 3.50%,
08/01/50 (a) |
265,000
|
211,054
|
| 4.30%,
03/15/45 (a) |
406,000
|
347,836
|
| PacifiCorp
|
|
|
| 2.70%,
09/15/30 (a) |
370,000
|
354,079
|
| 2.90%,
06/15/52 |
919,000
|
806,707
|
| 6.25%,
10/15/37 (a) |
576,000
|
718,554
|
| Packaging
Corp. of America |
|
|
| 3.05%,
10/01/51 |
551,000
|
470,945
|
| Paramount
Global |
|
|
| 2.90%,
01/15/27 (a) |
190,000
|
185,541
|
| 3.70%,
06/01/28 (a) |
184,000
|
182,999
|
| 5.25%,
04/01/44 (a) |
69,000
|
71,919
|
| Parker-Hannifin
Corp. |
|
|
| 3.25%,
06/14/29 (a) |
365,000
|
360,135
|
| PartnerRe
Finance B LLC (4.50% fixed rate until 01/10/30; 3.82% + 5 year CMT Rate thereafter) |
|
|
| 4.50%,
10/01/50 (a)(b) |
328,000
|
315,405
|
| PayPal
Holdings Inc. |
|
|
| 2.65%,
10/01/26 (a) |
537,000
|
528,526
|
| 3.25%,
06/01/50 (a) |
308,000
|
282,957
|
| |
Principal
Amount |
Fair
Value |
| PepsiCo
Inc. |
|
|
| 1.63%,
05/01/30 (a) |
$
391,000 |
$
351,963 |
| 2.63%,
07/29/29 (a) |
525,000
|
514,721
|
| 2.75%,
10/21/51 |
972,000
|
869,240
|
| Petroleos
Mexicanos |
|
|
| 6.70%,
02/16/32 |
1,516,000
|
1,442,398
|
| 7.69%,
01/23/50 (a) |
879,000
|
768,413
|
| Pfizer
Inc. |
|
|
| 2.70%,
05/28/50 (a) |
721,000
|
639,188
|
| 3.45%,
03/15/29 (a) |
201,000
|
206,948
|
| 3.60%,
09/15/28 (a) |
463,000
|
481,974
|
| 3.90%,
03/15/39 (a) |
228,000
|
242,565
|
| 4.13%,
12/15/46 (a) |
155,000
|
173,202
|
| 4.40%,
05/15/44 (a) |
94,000
|
105,817
|
| Philip
Morris International Inc. |
|
|
| 1.50%,
05/01/25 (a) |
432,000
|
412,413
|
| 2.10%,
05/01/30 (a) |
206,000
|
185,482
|
| 3.38%,
08/15/29 (a) |
301,000
|
299,621
|
| 4.13%,
03/04/43 (a) |
117,000
|
111,318
|
| Phillips
66 |
|
|
| 2.15%,
12/15/30 (a) |
2,250,000
|
2,003,692
|
| 3.30%,
03/15/52 |
670,000
|
589,821
|
| Phillips
66 Partners LP |
|
|
| 3.15%,
12/15/29 (a) |
1,152,000
|
1,112,302
|
| 3.75%,
03/01/28 (a) |
155,000
|
154,972
|
| 4.68%,
02/15/45 (a) |
219,000
|
234,404
|
| Pioneer
Natural Resources Co. |
|
|
| 1.13%,
01/15/26 (a) |
1,216,000
|
1,128,545
|
| 2.15%,
01/15/31 (a) |
355,000
|
319,624
|
| Plains
All American Pipeline LP/PAA Finance Corp. |
|
|
| 3.55%,
12/15/29 (a) |
589,000
|
569,439
|
| PPL
Capital Funding Inc. |
|
|
| 3.10%,
05/15/26 (a) |
447,000
|
440,979
|
| Precision
Castparts Corp. |
|
|
| 4.38%,
06/15/45 (a) |
237,000
|
255,782
|
| Prospect
Capital Corp. |
|
|
| 3.36%,
11/15/26 |
741,000
|
678,949
|
| Prudential
Financial Inc. |
|
|
| 3.94%,
12/07/49 (a) |
411,000
|
417,062
|
| Prudential
Financial Inc. (5.70% fixed rate until 09/15/28; 2.67% + 3 month USD LIBOR thereafter) |
|
|
| 5.70%,
09/15/48 (a)(b) |
479,000
|
490,975
|
| Public
Service Company of Colorado |
|
|
| 3.70%,
06/15/28 (a) |
433,000
|
443,842
|
See Notes to Schedules of Investments and Notes to Financial
Statements.
| State
Street Income Fund |
23
|
State Street Income Fund
Schedule of Investments, continued — March 31, 2022
(Unaudited)
| |
Principal
Amount |
Fair
Value |
| Public
Service Electric & Gas Co. |
|
|
| 2.38%,
05/15/23 (a) |
$
909,000 |
$
910,954 |
| PVH
Corp. |
|
|
| 4.63%,
07/10/25 (a) |
1,179,000
|
1,202,380
|
| QUALCOMM
Inc. |
|
|
| 1.30%,
05/20/28 (a) |
159,000
|
143,704
|
| 4.30%,
05/20/47 (a) |
72,000
|
81,057
|
| Quanta
Services Inc. |
|
|
| 2.35%,
01/15/32 |
680,000
|
591,457
|
| 3.05%,
10/01/41 |
736,000
|
606,891
|
| Quest
Diagnostics Inc. |
|
|
| 2.95%,
06/30/30 (a) |
148,000
|
140,501
|
| Ralph
Lauren Corp. |
|
|
| 1.70%,
06/15/22 (a) |
202,000
|
202,236
|
| Raytheon
Technologies Corp. |
|
|
| 1.90%,
09/01/31 |
802,000
|
710,644
|
| 2.82%,
09/01/51 |
476,000
|
401,968
|
| 3.13%,
05/04/27 (a) |
613,000
|
614,661
|
| 3.50%,
03/15/27 (a) |
318,000
|
322,745
|
| 3.95%,
08/16/25 (a) |
260,000
|
268,317
|
| 4.15%,
05/15/45 (a) |
248,000
|
255,738
|
| 4.45%,
11/16/38 (a) |
206,000
|
223,541
|
| Realty
Income Corp. |
|
|
| 2.85%,
12/15/32 |
385,000
|
363,725
|
| 3.00%,
01/15/27 (a) |
117,000
|
115,382
|
| 3.25%,
01/15/31 (a) |
391,000
|
384,521
|
| Regeneron
Pharmaceuticals Inc. |
|
|
| 1.75%,
09/15/30 (a) |
722,000
|
625,411
|
| Regions
Financial Corp. |
|
|
| 1.80%,
08/12/28 |
1,585,000
|
1,422,411
|
| Reliance
Industries Ltd. |
|
|
| 3.63%,
01/12/52 (g) |
1,000,000
|
888,180
|
| Republic
Services Inc. |
|
|
| 2.38%,
03/15/33 |
1,111,000
|
994,767
|
| Reynolds
American Inc. |
|
|
| 4.45%,
06/12/25 (a) |
27,000
|
27,565
|
| Rio
Tinto Finance Ltd. |
|
|
| 2.75%,
11/02/51 |
1,455,000
|
1,260,248
|
| Rio
Tinto Finance USA PLC |
|
|
| 4.13%,
08/21/42 (a) |
150,000
|
161,067
|
| Rockwell
Automation Inc. |
|
|
| 2.80%,
08/15/61 |
219,000
|
176,352
|
| 4.20%,
03/01/49 (a) |
281,000
|
299,540
|
| Rogers
Communications Inc. |
|
|
| 5.00%,
03/15/44 (a) |
110,000
|
117,442
|
| Roper
Technologies Inc. |
|
|
| 2.95%,
09/15/29 (a) |
426,000
|
410,800
|
| |
Principal
Amount |
Fair
Value |
| Ross
Stores Inc. |
|
|
| 4.70%,
04/15/27 (a) |
$
155,000 |
$
163,513 |
| Royalty
Pharma PLC |
|
|
| 0.75%,
09/02/23 |
464,000
|
451,017
|
| 1.20%,
09/02/25 |
619,000
|
572,717
|
| 1.75%,
09/02/27 |
312,000
|
283,224
|
| 2.15%,
09/02/31 |
528,000
|
453,916
|
| 2.20%,
09/02/30 |
133,000
|
116,465
|
| 3.30%,
09/02/40 |
79,000
|
67,457
|
| RPM
International Inc. |
|
|
| 3.75%,
03/15/27 (a) |
224,000
|
227,521
|
| Ryder
System Inc. |
|
|
| 2.90%,
12/01/26 (a) |
1,038,000
|
1,009,912
|
| Sabine
Pass Liquefaction LLC |
|
|
| 4.20%,
03/15/28 (a) |
202,000
|
207,838
|
| 4.50%,
05/15/30 (a) |
232,000
|
243,122
|
| 5.00%,
03/15/27 (a) |
118,000
|
124,894
|
| 5.88%,
06/30/26 (a) |
770,000
|
833,125
|
| Salesforce.com
Inc. |
|
|
| 1.95%,
07/15/31 |
695,000
|
634,834
|
| 2.70%,
07/15/41 |
690,000
|
611,547
|
| Santander
UK Group Holdings PLC |
|
|
| 4.75%,
09/15/25 (a)(g) |
1,003,000
|
1,024,785
|
| Saudi
Arabian Oil Co. |
|
|
| 3.50%,
04/16/29 (a)(g) |
1,243,000
|
1,252,248
|
| 4.38%,
04/16/49 (a)(g) |
256,000
|
262,241
|
| Schlumberger
Holdings Corp. |
|
|
| 3.90%,
05/17/28 (a)(g) |
460,000
|
464,890
|
| Sealed
Air Corp. |
|
|
| 1.57%,
10/15/26 (g) |
2,504,000
|
2,283,848
|
| Selective
Insurance Group Inc. |
|
|
| 5.38%,
03/01/49 (a) |
176,000
|
193,783
|
| Sempra
Energy |
|
|
| 3.80%,
02/01/38 (a) |
153,000
|
150,589
|
| 4.00%,
02/01/48 (a) |
166,000
|
164,599
|
| Sempra
Energy (4.13% fixed rate until 01/04/27; 2.87% + 5 year CMT Rate thereafter) |
|
|
| 4.13%,
04/01/52 (b) |
1,014,000
|
944,287
|
| Shell
International Finance BV |
|
|
| 3.13%,
11/07/49 (a) |
684,000
|
623,808
|
| 3.75%,
09/12/46 (a) |
117,000
|
118,253
|
| 4.13%,
05/11/35 (a) |
164,000
|
173,376
|
| Shire
Acquisitions Investments Ireland DAC |
|
|
| 2.88%,
09/23/23 (a) |
133,000
|
133,507
|
| 3.20%,
09/23/26 (a) |
114,000
|
114,176
|
See Notes to Schedules of Investments and Notes to Financial
Statements.
| 24
|
State Street Income Fund
|
State Street Income Fund
Schedule of Investments, continued — March 31, 2022
(Unaudited)
| |
Principal
Amount |
Fair
Value |
| Simon
Property Group LP |
|
|
| 3.38%,
06/15/27 (a) |
$
281,000 |
$
281,489 |
| SLM
Corp. |
|
|
| 3.13%,
11/02/26 |
1,208,000
|
1,120,952
|
| Sonoco
Products Co. |
|
|
| 2.85%,
02/01/32 |
776,000
|
725,133
|
| Southern
California Edison Co. |
|
|
| 4.00%,
04/01/47 (a) |
732,000
|
705,384
|
| 4.20%,
03/01/29 (a) |
557,000
|
576,534
|
| Southern
Company Gas Capital Corp. |
|
|
| 3.95%,
10/01/46 (a) |
399,000
|
378,894
|
| 4.40%,
05/30/47 (a) |
65,000
|
65,467
|
| Southwest
Airlines Co. |
|
|
| 2.63%,
02/10/30 (a) |
611,000
|
562,187
|
| Southwestern
Electric Power Co. |
|
|
| 2.75%,
10/01/26 (a) |
318,000
|
311,036
|
| Spectra
Energy Partners LP |
|
|
| 3.38%,
10/15/26 (a) |
87,000
|
86,864
|
| 4.50%,
03/15/45 (a) |
66,000
|
67,370
|
| Spirit
Realty LP |
|
|
| 4.00%,
07/15/29 (a) |
473,000
|
478,227
|
| Standard
Chartered PLC (2.68% fixed rate until 06/29/31; 1.20% + 1 year CMT Rate thereafter) |
|
|
| 2.68%,
06/29/32 (b)(g) |
1,297,000
|
1,141,386
|
| Standard
Chartered PLC (2.82% fixed rate until 01/30/25; 1.21% + 3 month USD LIBOR thereafter) |
|
|
| 2.82%,
01/30/26 (a)(b)(g) |
1,304,000
|
1,267,788
|
| Stanley
Black & Decker Inc. |
|
|
| 3.00%,
05/15/32 |
916,000
|
884,810
|
| Starbucks
Corp. |
|
|
| 4.00%,
11/15/28 (a) |
243,000
|
251,226
|
| STERIS
Irish FinCo UnLtd Co. |
|
|
| 2.70%,
03/15/31 (a) |
1,474,000
|
1,353,766
|
| 3.75%,
03/15/51 (a) |
604,000
|
565,199
|
| Stryker
Corp. |
|
|
| 1.95%,
06/15/30 (a) |
851,000
|
763,441
|
| Sumitomo
Mitsui Financial Group Inc. |
|
|
| 4.44%,
04/02/24 (g) |
2,981,000
|
3,039,666
|
| Sumitomo
Mitsui Trust Bank Ltd. |
|
|
| 1.35%,
09/16/26 (g) |
3,099,000
|
2,841,442
|
| |
Principal
Amount |
Fair
Value |
| Suncor
Energy Inc. |
|
|
| 4.00%,
11/15/47 (a) |
$
94,000 |
$
93,846 |
| Svenska
Handelsbanken AB (1.42% fixed rate until 06/11/26; 0.63% + 1 year CMT Rate thereafter) |
|
|
| 1.42%,
06/11/27 (b)(g) |
1,744,000
|
1,610,863
|
| Sysco
Corp. |
|
|
| 3.25%,
07/15/27 (a) |
239,000
|
237,956
|
| 5.95%,
04/01/30 (a) |
80,000
|
92,910
|
| 6.60%,
04/01/50 (a) |
94,000
|
125,945
|
| Takeda
Pharmaceutical Company Ltd. |
|
|
| 2.05%,
03/31/30 (a) |
200,000
|
180,172
|
| 3.03%,
07/09/40 (a) |
300,000
|
268,185
|
| 3.18%,
07/09/50 (a) |
300,000
|
263,304
|
| 3.38%,
07/09/60 (a) |
300,000
|
262,287
|
| Tampa
Electric Co. |
|
|
| 2.40%,
03/15/31 (a) |
768,000
|
707,320
|
| 3.45%,
03/15/51 |
555,000
|
517,543
|
| 4.35%,
05/15/44 (a) |
479,000
|
496,761
|
| Tapestry
Inc. |
|
|
| 4.13%,
07/15/27 (a) |
69,000
|
70,018
|
| Targa
Resources Partners LP/Targa Resources Partners Finance Corp. |
|
|
| 5.00%,
01/15/28 |
1,940,000
|
1,967,800
|
| Target
Corp. |
|
|
| 2.50%,
04/15/26 (a) |
251,000
|
249,414
|
| Teck
Resources Ltd. |
|
|
| 5.40%,
02/01/43 (a) |
244,000
|
264,750
|
| Telefonica
Emisiones S.A. |
|
|
| 4.10%,
03/08/27 (a) |
639,000
|
655,103
|
| Texas
Instruments Inc. |
|
|
| 3.88%,
03/15/39 (a) |
315,000
|
334,177
|
| The
Allstate Corp. |
|
|
| 4.20%,
12/15/46 (a) |
142,000
|
151,308
|
| The
Allstate Corp. (5.75% fixed rate until 08/15/23; 2.94% + 3 month USD LIBOR thereafter) |
|
|
| 5.75%,
08/15/53 (a)(b) |
748,000
|
745,517
|
| The
Bank of New York Mellon Corp. (4.63% fixed rate until 09/20/26; 3.13% + 3 month USD LIBOR thereafter) |
|
|
| 4.63%,
12/29/49 (a)(b) |
659,000
|
650,552
|
See Notes to Schedules of Investments and Notes to Financial
Statements.
| State
Street Income Fund |
25
|
State Street Income Fund
Schedule of Investments, continued — March 31, 2022
(Unaudited)
| |
Principal
Amount |
Fair
Value |
| The
Bank of Nova Scotia (4.65% fixed rate until 10/12/22; 2.65% + 3 month USD LIBOR thereafter) |
|
|
| 4.65%,
12/31/99 (a)(b) |
$
724,000 |
$
700,774 |
| The
Boeing Co. |
|
|
| 2.20%,
02/04/26 (a) |
1,126,000
|
1,065,365
|
| 2.70%,
02/01/27 (a) |
966,000
|
927,746
|
| 2.95%,
02/01/30 (a) |
246,000
|
227,978
|
| 3.25%,
03/01/28 (a) |
124,000
|
119,284
|
| 3.55%,
03/01/38 (a) |
165,000
|
146,840
|
| 3.75%,
02/01/50 (a) |
218,000
|
195,021
|
| 5.04%,
05/01/27 (a) |
1,421,000
|
1,494,693
|
| 5.15%,
05/01/30 (a) |
801,000
|
853,113
|
| 5.81%,
05/01/50 (a) |
496,000
|
572,379
|
| The
Charles Schwab Corp. |
|
|
| 2.45%,
03/03/27 |
1,070,000
|
1,038,895
|
| 2.90%,
03/03/32 |
355,000
|
341,734
|
| The
Charles Schwab Corp. (4.00% fixed rate until 12/01/30; 3.08% + 10 year CMT Rate thereafter) |
|
|
| 4.00%,
12/31/99 (b) |
1,027,000
|
932,917
|
| The
Cleveland Electric Illuminating Co. |
|
|
| 4.55%,
11/15/30 (a)(g) |
982,000
|
1,038,023
|
| The
Clorox Co. |
|
|
| 1.80%,
05/15/30 (a) |
570,000
|
500,489
|
| The
Coca-Cola Co. |
|
|
| 2.60%,
06/01/50 (a) |
406,000
|
347,321
|
| 2.75%,
06/01/60 (a) |
314,000
|
266,577
|
| The
Dow Chemical Co. |
|
|
| 2.10%,
11/15/30 (a) |
312,000
|
280,937
|
| 3.60%,
11/15/50 (a) |
312,000
|
290,419
|
| 4.25%,
10/01/34 (a) |
193,000
|
199,525
|
| 5.55%,
11/30/48 (a) |
222,000
|
270,871
|
| The
Estee Lauder Companies Inc. |
|
|
| 2.38%,
12/01/29 (a) |
316,000
|
301,041
|
| The
George Washington University |
|
|
| 4.13%,
09/15/48 |
905,000
|
959,164
|
| The
Goldman Sachs Group Inc. |
|
|
| 3.50%,
04/01/25 - 11/16/26 (a) |
1,546,000
|
1,554,296
|
| 3.85%,
01/26/27 (a) |
2,007,000
|
2,030,522
|
| 4.25%,
10/21/25 (a) |
521,000
|
535,171
|
| 5.15%,
05/22/45 (a) |
157,000
|
176,173
|
| |
Principal
Amount |
Fair
Value |
| The
Goldman Sachs Group Inc. (1.54% fixed rate until 09/10/26; 0.82% + SOFR thereafter) |
|
|
| 1.54%,
09/10/27 (b) |
$
752,000 |
$
689,193 |
| The
Goldman Sachs Group Inc. (1.99% fixed rate until 01/27/31; 1.09% + SOFR thereafter) |
|
|
| 1.99%,
01/27/32 (a)(b) |
951,000
|
823,623
|
| The
Goldman Sachs Group Inc. (2.38% fixed rate until 07/21/31; 1.25% + SOFR thereafter) |
|
|
| 2.38%,
07/21/32 (b) |
410,000
|
364,338
|
| The
Goldman Sachs Group Inc. (2.91% fixed rate until 06/05/22; 1.05% + 3 month USD LIBOR thereafter) |
|
|
| 2.91%,
06/05/23 (a)(b) |
846,000
|
846,829
|
| The
Goldman Sachs Group Inc. (2.91% fixed rate until 07/21/41; 1.47% + SOFR thereafter) |
|
|
| 2.91%,
07/21/42 (b) |
334,000
|
287,380
|
| The
Goldman Sachs Group Inc. (3.21% fixed rate until 04/22/41; 1.51% + SOFR thereafter) |
|
|
| 3.21%,
04/22/42 (b) |
509,000
|
457,102
|
| The
Goldman Sachs Group Inc. (3.81% fixed rate until 04/23/28; 1.16% + 3 month USD LIBOR thereafter) |
|
|
| 3.81%,
04/23/29 (a)(b) |
236,000
|
237,612
|
| The
Goldman Sachs Group Inc. (4.02% fixed rate until 10/31/37; 1.37% + 3 month USD LIBOR thereafter) |
|
|
| 4.02%,
10/31/38 (a)(b) |
244,000
|
245,842
|
| The
Goldman Sachs Group Inc. (4.22% fixed rate until 05/01/28; 1.30% + 3 month USD LIBOR thereafter) |
|
|
| 4.22%,
05/01/29 (a)(b) |
389,000
|
398,468
|
| The
Hartford Financial Services Group Inc. |
|
|
| 2.80%,
08/19/29 (a) |
880,000
|
837,100
|
See Notes to Schedules of Investments and Notes to Financial
Statements.
| 26
|
State Street Income Fund
|
State Street Income Fund
Schedule of Investments, continued — March 31, 2022
(Unaudited)
| |
Principal
Amount |
Fair
Value |
| The
Hartford Financial Services Group Inc. (2.63% fixed rate until 05/02/22; 2.13% + 3 month USD LIBOR thereafter) |
|
|
| 2.63%,
02/12/47 (a)(b)(g) |
$
566,000 |
$
498,176 |
| The
Home Depot Inc. |
|
|
| 2.70%,
04/15/30 (a) |
234,000
|
226,671
|
| 3.35%,
04/15/50 (a) |
406,000
|
386,138
|
| 3.50%,
09/15/56 (a) |
222,000
|
216,563
|
| 3.90%,
12/06/28 - 06/15/47 (a) |
461,000
|
480,595
|
| 4.50%,
12/06/48 (a) |
179,000
|
202,036
|
| The
Kroger Co. |
|
|
| 2.20%,
05/01/30 (a) |
366,000
|
334,861
|
| 4.65%,
01/15/48 (a) |
153,000
|
166,850
|
| The
Northwestern Mutual Life Insurance Co. |
|
|
| 3.45%,
03/30/51 (a)(g) |
555,000
|
505,272
|
| The
Progressive Corp. |
|
|
| 2.50%,
03/15/27 |
1,080,000
|
1,057,417
|
| 3.00%,
03/15/32 |
425,000
|
413,466
|
| 3.70%,
03/15/52 |
145,000
|
145,958
|
| The
Southern Co. |
|
|
| 3.25%,
07/01/26 (a) |
142,000
|
142,065
|
| The
Toronto-Dominion Bank |
|
|
| 3.20%,
03/10/32 |
1,713,000
|
1,686,894
|
| The
Travelers Companies Inc. |
|
|
| 2.55%,
04/27/50 (a) |
730,000
|
592,045
|
| The
Walt Disney Co. |
|
|
| 2.65%,
01/13/31 (a) |
597,000
|
570,320
|
| 3.38%,
11/15/26 (a) |
94,000
|
95,263
|
| 3.60%,
01/13/51 (a) |
392,000
|
387,316
|
| 4.75%,
11/15/46 (a) |
61,000
|
69,985
|
| 6.65%,
11/15/37 (a) |
397,000
|
530,039
|
| The
Williams Companies Inc. |
|
|
| 3.75%,
06/15/27 (a) |
100,000
|
101,262
|
| 4.85%,
03/01/48 (a) |
202,000
|
215,641
|
| 4.90%,
01/15/45 (a) |
476,000
|
497,568
|
| 5.40%,
03/04/44 (a) |
69,000
|
75,955
|
| Thermo
Fisher Scientific Inc. |
|
|
| 2.80%,
10/15/41 |
447,000
|
399,426
|
| Time
Warner Cable LLC |
|
|
| 6.55%,
05/01/37 (a) |
177,000
|
203,794
|
| T-Mobile
USA Inc. |
|
|
| 3.50%,
04/15/25 |
735,000
|
739,454
|
| 3.75%,
04/15/27 |
916,000
|
922,623
|
| 3.88%,
04/15/30 |
251,000
|
252,054
|
| 4.50%,
04/15/50 |
119,000
|
120,852
|
| |
Principal
Amount |
Fair
Value |
| Total
Capital International S.A. |
|
|
| 3.46%,
02/19/29 (a) |
$
785,000 |
$
797,175 |
| Trane
Technologies Luxembourg Finance S.A. |
|
|
| 3.55%,
11/01/24 (a) |
423,000
|
427,590
|
| 3.80%,
03/21/29 (a) |
557,000
|
566,502
|
| TransCanada
PipeLines Ltd. |
|
|
| 4.25%,
05/15/28 (a) |
564,000
|
586,639
|
| 4.88%,
01/15/26 (a) |
128,000
|
134,390
|
| Transcanada
Trust (5.63% fixed rate until 05/20/25; 3.53% + 3 month USD LIBOR thereafter) |
|
|
| 5.63%,
05/20/75 (a)(b) |
1,115,000
|
1,120,575
|
| Transcontinental
Gas Pipe Line Company LLC |
|
|
| 4.00%,
03/15/28 (a) |
265,000
|
270,647
|
| Truist
Financial Corp. (4.80% fixed rate until 09/01/24; 3.00% + 5 year CMT Rate thereafter) |
|
|
| 4.80%,
12/31/99 (a)(b) |
1,539,000
|
1,511,452
|
| TWDC
Enterprises 18 Corp. |
|
|
| 4.13%,
06/01/44 (a) |
129,000
|
135,841
|
| Tyco
Electronics Group S.A. |
|
|
| 3.13%,
08/15/27 (a) |
270,000
|
269,139
|
| Tyson
Foods Inc. |
|
|
| 4.00%,
03/01/26 (a) |
999,000
|
1,022,496
|
| UBS
Group AG (2.86% fixed rate until 08/15/22; 0.95% + 3 month USD LIBOR thereafter) |
|
|
| 2.86%,
08/15/23 (a)(b)(g) |
890,000
|
891,379
|
| UBS
Group AG (3.13% fixed rate until 08/13/29; 1.47% + 3 month USD LIBOR thereafter) |
|
|
| 3.13%,
08/13/30 (a)(b)(g) |
1,015,000
|
976,927
|
| UDR
Inc. |
|
|
| 2.10%,
08/01/32 (a) |
515,000
|
445,434
|
| 3.00%,
08/15/31 (a) |
328,000
|
311,620
|
| UniCredit
S.p.A. (2.57% fixed rate until 09/22/25; 2.30% + 1 year CMT Rate thereafter) |
|
|
| 2.57%,
09/22/26 (a)(b)(g) |
1,783,000
|
1,652,663
|
| Union
Pacific Corp. |
|
|
| 3.55%,
05/20/61 |
475,000
|
451,844
|
| 3.60%,
09/15/37 (a) |
87,000
|
87,237
|
| 3.80%,
04/06/71 |
218,000
|
216,106
|
| 4.10%,
09/15/67 (a) |
149,000
|
155,140
|
See Notes to Schedules of Investments and Notes to Financial
Statements.
| State
Street Income Fund |
27
|
State Street Income Fund
Schedule of Investments, continued — March 31, 2022
(Unaudited)
| |
Principal
Amount |
Fair
Value |
| UnitedHealth
Group Inc. |
|
|
| 2.00%,
05/15/30 (a) |
$
641,000 |
$
591,739 |
| 4.45%,
12/15/48 (a) |
438,000
|
493,608
|
| 4.75%,
07/15/45 (a) |
379,000
|
439,314
|
| Utah
Acquisition Sub Inc. |
|
|
| 3.95%,
06/15/26 (a) |
83,000
|
82,472
|
| Valero
Energy Corp. |
|
|
| 2.85%,
04/15/25 (a) |
148,000
|
146,218
|
| 4.00%,
04/01/29 (a) |
540,000
|
551,696
|
| Ventas
Realty LP |
|
|
| 3.25%,
10/15/26 (a) |
307,000
|
304,513
|
| Verizon
Communications Inc. |
|
|
| 2.10%,
03/22/28 (a) |
829,000
|
773,872
|
| 2.36%,
03/15/32 (g) |
1,108,000
|
1,001,754
|
| 2.55%,
03/21/31 (a) |
768,000
|
713,564
|
| 3.00%,
03/22/27 (a) |
1,423,000
|
1,406,223
|
| 3.40%,
03/22/41 (a) |
555,000
|
522,338
|
| 3.55%,
03/22/51 (a) |
418,000
|
394,258
|
| 3.70%,
03/22/61 (a) |
523,000
|
490,616
|
| 4.40%,
11/01/34 (a) |
638,000
|
678,921
|
| 4.86%,
08/21/46 (a) |
834,000
|
958,975
|
| Virginia
Electric & Power Co. |
|
|
| 4.00%,
11/15/46 (a) |
406,000
|
417,526
|
| Visa
Inc. |
|
|
| 2.70%,
04/15/40 (a) |
421,000
|
382,074
|
| Vistra
Operations Company LLC |
|
|
| 3.55%,
07/15/24 (a)(g) |
1,428,000
|
1,415,277
|
| Viterra
Finance BV |
|
|
| 2.00%,
04/21/26 (g) |
712,000
|
656,806
|
| 3.20%,
04/21/31 (g) |
1,000,000
|
919,170
|
| Vodafone
Group PLC |
|
|
| 4.38%,
05/30/28 (a) |
281,000
|
294,575
|
| 5.25%,
05/30/48 (a) |
144,000
|
162,079
|
| Volkswagen
Group of America Finance LLC |
|
|
| 1.63%,
11/24/27 (a)(g) |
1,420,000
|
1,264,524
|
| Vontier
Corp. |
|
|
| 2.40%,
04/01/28 |
640,000
|
563,866
|
| 2.95%,
04/01/31 |
838,000
|
744,027
|
| Vornado
Realty LP |
|
|
| 2.15%,
06/01/26 |
984,000
|
921,516
|
| 3.40%,
06/01/31 |
368,000
|
344,695
|
| 3.50%,
01/15/25 (a) |
261,000
|
260,029
|
| Vulcan
Materials Co. |
|
|
| 3.90%,
04/01/27 (a) |
123,000
|
126,047
|
| Walgreens
Boots Alliance Inc. |
|
|
| 4.10%,
04/15/50 (a) |
45,000
|
43,551
|
| |
Principal
Amount |
Fair
Value |
| Walmart
Inc. |
|
|
| 1.80%,
09/22/31 |
$
528,000 |
$
480,612 |
| 2.50%,
09/22/41 |
528,000
|
470,279
|
| 2.65%,
09/22/51 |
248,000
|
220,784
|
| Waste
Connections Inc. |
|
|
| 2.20%,
01/15/32 |
723,000
|
647,165
|
| 2.95%,
01/15/52 |
723,000
|
618,910
|
| WEC
Energy Group Inc. |
|
|
| 3.55%,
06/15/25 (a) |
86,000
|
86,186
|
| Wells
Fargo & Co. |
|
|
| 4.15%,
01/24/29 (a) |
754,000
|
782,584
|
| 4.75%,
12/07/46 (a) |
850,000
|
928,778
|
| Wells
Fargo & Co. (1.65% fixed rate until 06/02/23; 1.60% + SOFR thereafter) |
|
|
| 1.65%,
06/02/24 (a)(b) |
741,000
|
732,175
|
| Wells
Fargo & Co. (2.19% fixed rate until 04/30/25; 2.00% + SOFR thereafter) |
|
|
| 2.19%,
04/30/26 (a)(b) |
889,000
|
858,312
|
| Wells
Fargo & Co. (2.39% fixed rate until 06/02/27; 2.10% + SOFR thereafter) |
|
|
| 2.39%,
06/02/28 (a)(b) |
3,422,000
|
3,238,204
|
| Wells
Fargo & Co. (3.07% fixed rate until 04/30/40; 2.53% + SOFR thereafter) |
|
|
| 3.07%,
04/30/41 (a)(b) |
850,000
|
766,088
|
| Wells
Fargo & Co. (3.20% fixed rate until 06/17/26; 1.17% + 3 month USD LIBOR thereafter) |
|
|
| 3.20%,
06/17/27 (a)(b) |
1,991,000
|
1,967,028
|
| Wells
Fargo & Co. (5.88% fixed rate until 06/15/25; 3.99% + 3 month USD LIBOR thereafter) |
|
|
| 5.88%,
12/29/49 (b) |
548,000
|
572,227
|
| Westlake
Corp. |
|
|
| 2.88%,
08/15/41 |
283,000
|
237,598
|
| 3.13%,
08/15/51 |
314,000
|
260,416
|
| 3.38%,
08/15/61 |
317,000
|
256,837
|
| Westpac
Banking Corp. (2.89% fixed rate until 02/04/25; 1.35% + 5 year CMT Rate thereafter) |
|
|
| 2.89%,
02/04/30 (a)(b) |
627,000
|
605,130
|
| Westpac
Banking Corp. (4.11% fixed rate until 07/24/29; 2.00% + 5 year CMT Rate thereafter) |
|
|
| 4.11%,
07/24/34 (a)(b) |
454,000
|
448,057
|
See Notes to Schedules of Investments and Notes to Financial
Statements.
| 28
|
State Street Income Fund
|
State Street Income Fund
Schedule of Investments, continued — March 31, 2022
(Unaudited)
| |
Principal
Amount |
Fair
Value |
| Weyerhaeuser
Co. |
|
|
| 4.00%,
03/09/52 |
$
565,000 |
$
562,463 |
| Willis
North America Inc. |
|
|
| 3.60%,
05/15/24 (a) |
419,000
|
421,196
|
| 3.88%,
09/15/49 (a) |
410,000
|
374,457
|
| Workday
Inc. |
|
|
| 3.50%,
04/01/27 |
715,000
|
716,459
|
| 3.70%,
04/01/29 |
1,430,000
|
1,432,317
|
| WPP
Finance 2010 |
|
|
| 3.75%,
09/19/24 (a) |
244,000
|
246,740
|
| Xcel
Energy Inc. |
|
|
| 3.40%,
06/01/30 (a) |
509,000
|
508,455
|
| Yamana
Gold Inc. |
|
|
| 2.63%,
08/15/31 |
832,000
|
744,041
|
| Zoetis
Inc. |
|
|
| 3.00%,
09/12/27 (a) |
117,000
|
116,051
|
| 3.90%,
08/20/28 (a) |
279,000
|
286,776
|
| |
|
528,052,353
|
| Non-Agency
Collateralized Mortgage Obligations - 5.4% |
| BANK
2017-BNK7 |
|
|
| 3.18%,
09/15/60 |
20,509,000
|
20,225,552
|
| BANK
2018-BNK15 |
|
|
| 4.41%,
11/15/61 (b) |
8,550,000
|
9,059,169
|
| Cantor
Commercial Real Estate Lending 2019-CF3 |
|
|
| 3.01%,
01/15/53 |
4,022,000
|
3,907,917
|
| CD
2019-CD8 Mortgage Trust |
|
|
| 2.91%,
08/15/57 |
7,323,000
|
7,075,231
|
| Citigroup
Commercial Mortgage Trust 2015-GC35 |
|
|
| 4.46%,
11/10/48 (b) |
4,118,000
|
3,869,238
|
| Citigroup
Commercial Mortgage Trust 2016-P6 |
|
|
| 4.03%,
12/10/49 (b) |
2,942,926
|
2,977,430
|
| COMM
2012-CCRE3 Mortgage Trust |
|
|
| 3.92%,
10/15/45 (g) |
1,602,000
|
1,559,588
|
| COMM
2013-LC13 Mortgage Trust |
|
|
| 4.56%,
08/10/46 (b)(g) |
1,375,000
|
1,407,165
|
| COMM
2014-CR14 Mortgage Trust |
|
|
| 4.53%,
02/10/47 (b) |
1,940,000
|
1,972,032
|
| GS
Mortgage Securities Trust 2012-GCJ9 |
|
|
| 1.91%,
11/10/45 (b)(e) |
5,132,172
|
16,253
|
| GS
Mortgage Securities Trust 2015-GS1 |
|
|
| 4.42%,
11/10/48 (b) |
3,270,000
|
2,771,356
|
| |
Principal
Amount |
Fair
Value |
| GS
Mortgage Securities Trust 2018-GS9 |
|
|
| 4.14%,
03/10/51 (b) |
$
2,609,000 |
$
2,654,908 |
| GS
Mortgage Securities Trust 2019-GC42 |
|
|
| 2.75%,
09/01/52 |
13,110,000
|
12,517,457
|
| GS
Mortgage Securities Trust 2019-GSA1 |
|
|
| 3.05%,
11/10/52 |
6,397,000
|
6,237,936
|
| Impac
CMB Trust 2004-5 (1.18% fixed rate until 04/25/22; 0.72% + 1 month USD LIBOR thereafter) |
|
|
| 1.18%,
10/25/34 (a)(b) |
176,509
|
172,200
|
| JP
Morgan Chase Commercial Mortgage Securities Trust 2012-LC9 |
|
|
| 1.39%,
12/15/47 (b)(e) |
3,644,594
|
12,778
|
| JPMBB
Commercial Mortgage Securities Trust 2013-C12 |
|
|
| 4.03%,
07/15/45 (b) |
1,010,000
|
1,018,585
|
| JPMBB
Commercial Mortgage Securities Trust 2015-C32 |
|
|
| 4.65%,
11/15/48 (b) |
2,174,000
|
1,706,299
|
| MASTR
Alternative Loan Trust 2003-5 |
|
|
| 5.00%,
08/25/18 (a)(e) |
9,316
|
98
|
| Morgan
Stanley Bank of America Merrill Lynch Trust 2015-C21 |
|
|
| 0.86%,
03/15/48 (b)(e) |
26,321,062
|
457,083
|
| Wells
Fargo Commercial Mortgage Trust 2014-LC16 |
|
|
| 4.32%,
08/15/50 |
4,152,195
|
3,776,757
|
| Wells
Fargo Commercial Mortgage Trust 2015-C26 |
|
|
| 1.20%,
02/15/48 (b)(e) |
20,752,172
|
560,710
|
| WFRBS
Commercial Mortgage Trust 2013-C17 |
|
|
| 4.26%,
12/15/46 |
1,880,000
|
1,911,143
|
| WFRBS
Commercial Mortgage Trust 2014-LC14 |
|
|
| 4.35%,
03/15/47 (b) |
4,333,000
|
4,395,080
|
| |
|
90,261,965
|
| Sovereign
Bonds - 1.1% |
| Government
of Chile |
|
|
| 2.55%,
01/27/32 (a) |
2,507,000
|
2,359,012
|
| 3.63%,
10/30/42 (a) |
150,000
|
140,169
|
| 3.86%,
06/21/47 (a) |
860,000
|
839,859
|
See Notes to Schedules of Investments and Notes to Financial
Statements.
| State
Street Income Fund |
29
|
State Street Income Fund
Schedule of Investments, continued — March 31, 2022
(Unaudited)
| |
Principal
Amount |
Fair
Value |
| Government
of Indonesia |
|
|
| 3.50%,
01/11/28 (a) |
$
578,000 |
$
591,716 |
| 4.35%,
01/11/48 (a) |
232,000
|
239,201
|
| Government
of Mexico |
|
|
| 3.60%,
01/30/25 (a) |
1,402,000
|
1,438,774
|
| 4.60%,
02/10/48 (a) |
972,000
|
927,842
|
| 4.75%,
03/08/44 (a) |
2,068,000
|
2,039,193
|
| Government
of Panama |
|
|
| 3.16%,
01/23/30 (a) |
1,217,000
|
1,191,187
|
| 3.87%,
07/23/60 (a) |
826,000
|
725,071
|
| 4.50%,
05/15/47 (a) |
530,000
|
528,977
|
| Government
of Peru |
|
|
| 1.86%,
12/01/32 (a) |
1,230,000
|
1,054,959
|
| 2.78%,
12/01/60 (a) |
2,055,000
|
1,613,196
|
| 5.63%,
11/18/50 (a) |
884,000
|
1,121,831
|
| Government
of Philippines |
|
|
| 3.95%,
01/20/40 (a) |
835,000
|
835,058
|
| Government
of Qatar |
|
|
| 3.38%,
03/14/24 (a)(g) |
1,045,000
|
1,060,999
|
| 4.82%,
03/14/49 (a)(g) |
275,000
|
326,263
|
| Government
of Uruguay |
|
|
| 5.10%,
06/18/50 (a) |
884,133
|
1,047,742
|
| |
|
18,081,049
|
| Municipal
Bonds and Notes - 0.4% |
| American
Municipal Power Inc. |
|
|
| 6.27%,
02/15/50 |
1,040,000
|
1,310,846
|
| Board
of Regents of the University of Texas System |
|
|
| 3.35%,
08/15/47 |
1,025,000
|
1,003,278
|
| Port
Authority of New York & New Jersey |
|
|
| 4.46%,
10/01/62 |
1,870,000
|
2,077,557
|
| |
Principal
Amount |
Fair
Value |
| State
of California |
|
|
| 4.60%,
04/01/38 |
$
1,840,000 |
$
2,012,964 |
| State
of Illinois |
|
|
| 5.10%,
06/01/33 |
745,000
|
792,239
|
| |
|
7,196,884
|
Total
Bonds and Notes
(Cost $1,720,569,585) |
|
1,653,034,943
|
| |
Number
of Shares |
|
| Domestic
Equity - 0.1% |
| Preferred
Stock - 0.1% |
Wells
Fargo & Co. 5.85%, (5.85% fixed rate until 09/15/23; 3.09% + 3 month USD LIBOR thereafter)
(Cost $1,375,850) (b) |
55,034
|
1,392,360
|
Total
Investments in Securities
(Cost $1,721,945,435) |
|
1,654,427,303
|
| Short-Term
Investments - 7.3% |
State
Street Institutional U.S. Government Money Market Fund - Class G Shares 0.29% (i)(j)
(Cost $121,244,155) |
121,244,155
|
121,244,155
|
Total
Investments
(Cost $1,843,189,590) |
|
1,775,671,458
|
| Liabilities
in Excess of Other Assets, net - (6.1)% |
|
(101,613,051)
|
| NET
ASSETS - 100.0% |
|
$
1,674,058,407 |
See Notes to Schedules of Investments and Notes to Financial
Statements.
| 30
|
State Street Income Fund
|
State Street Income Fund
Schedule of Investments, continued — March 31, 2022
(Unaudited)
Other Information:
| Centrally
Cleared Credit Default Swaps |
| Reference
Entity |
Counterparty
|
Notional
Amount
(000s
omitted) |
Contract
Annual
Fixed Rate/
Payment
Frequency |
Termination
Date |
Market
Value |
Unamortized
Upfront
Payments
Received (Paid) |
Unrealized
Appreciation
(Depreciation) |
| Sell
Protection |
|
|
|
|
|
|
|
| Markit
CDX North America High Yield Index |
Intercontinental
Exchange |
$20,695
|
1.00%/
Quarterly |
12/20/26
|
$
(357,172) |
$
(390,513) |
$
33,341 |
| Buy
Protection |
|
|
|
|
|
|
|
| Markit
CDX North America High Yield Index |
Intercontinental
Exchange |
36,609
|
5.00%/
Quarterly |
06/20/27
|
2,026,411
|
1,891,840
|
134,571
|
| |
|
|
|
|
|
|
$167,912
|
| The
Fund had the following long futures contracts open at March 31, 2022: |
| Description
|
Expiration
Date |
Number
of
Contracts |
Notional
Amount |
Value
|
Unrealized
Appreciation
(Depreciation) |
| 2
Yr. U.S. Treasury Notes Futures |
June
2022 |
769
|
165,112,131
|
162,967,922
|
$
(2,144,209) |
| Ultra
Long-Term U.S. Treasury Bond Futures |
June
2022 |
201
|
36,914,172
|
35,602,125
|
(1,312,047)
|
| U.S.
Long Bond Futures |
June
2022 |
176
|
27,186,500
|
26,411,000
|
(775,500)
|
| |
|
|
|
|
$
(4,231,756) |
| The
Fund had the following short futures contracts open at March 31, 2022: |
| Description
|
Expiration
date |
Number
of
Contracts |
Notional
Amount |
Value
|
Unrealized
Appreciation
(Depreciation) |
| 10
Yr. U.S. Treasury Notes Futures |
June
2022 |
447
|
(56,797,125)
|
(54,925,125)
|
$
1,872,000 |
| 10
Yr. U.S. Treasury Ultra Futures |
June
2022 |
714
|
(98,402,418)
|
(96,724,687)
|
1,677,731
|
| 5
Yr. U.S. Treasury Notes Futures |
June
2022 |
505
|
(59,531,832)
|
(57,917,188)
|
1,614,644
|
| |
|
|
|
|
$
5,164,375 |
| During
the period ended March 31, 2022, average notional values related to derivative contracts were as follows: |
| |
Long
Futures
Contracts |
Short
Futures
Contracts |
Credit
Default
Swap
Contracts |
| Average
Notional Value |
$331,593,642
|
$143,610,250
|
$51,194,513
|
See Notes to Schedules of Investments and Notes to Financial
Statements.
| State
Street Income Fund |
31
|
State Street Income Fund
Notes to Schedule of Investments — March 31, 2022
(Unaudited)
The views expressed in this document reflect our judgment as of the
publication date and are subject to change at any time without notice. The securities cited may not be representative of the Fund’s future investments and should not be construed as a recommendation to purchase or sell a particular security.
See the Fund’s summary prospectus and statutory prospectus for complete descriptions of investment objectives, policies, risks and permissible investments.
| (a)
|
At March
31, 2022, all or a portion of this security was pledged to cover collateral requirements for futures, swaps and/or TBAs. |
| (b)
|
Variable
Rate Security - Interest rate shown is rate in effect at March 31, 2022. For securities based on a published reference rate and spread, the reference rate and spread are indicated in the description above. |
| (c)
|
Settlement
is on a delayed delivery or when-issued basis with final maturity to be announced ("TBA") in the future. |
| (d)
|
Security
is fair valued by the Valuation Committee, in accordance with the procedures approved by the Fund's Board of Trustees. Security value is determined based on level 3 inputs. |
| (e)
|
Interest
only security. These securities represent the right to receive the monthly interest payments on an underlying pool of mortgages. Payments of principal on the pool reduce the value of the "interest only" holding. |
| (f)
|
Principal
only security. These securities represent the right to receive the monthly principal payments on an underlying pool of mortgages. No payments of interest on the pool are passed through to the "principal only" holder. |
| (g)
|
Pursuant
to Rule 144A of the Securities Act of 1933, as amended, these securities may be resold in transactions exempt from registration, normally to qualified institutional buyers. At March 31, 2022, these securities amounted to $84,575,064 or 5.05% of the
net assets of the State Street Income Fund. These securities have been determined to be liquid using procedures established by the Fund's Board of Trustees. |
| (h)
|
Step
coupon bond. |
| (i)
|
Sponsored
by SSGA Funds Management, Inc., the Fund’s investment adviser and administrator, and an affiliate of State Street Bank & Trust Co., the Fund’s sub-administrator, custodian and accounting agent. |
| (j)
|
Coupon
amount represents effective yield. |
| †
|
Percentages
are based on net assets as of March 31, 2022. |
| **
|
Amount
is less than $0.50. |
| Abbreviations:
|
| CMT -
Constant Maturity Treasury |
| LIBOR -
London Interbank Offered Rate |
| REMIC -
Real Estate Mortgage Investment Conduit |
| SOFR -
Secured Overnight Financing Rate |
| STRIPS -
Separate Trading of Registered Interest and Principal of Security |
| TBA
- To Be Announced |
See Notes to Schedules of Investments and Notes to Financial
Statements.
| 32
|
State Street Income Fund
|
State Street Income Fund
Notes to Schedule of Investments, continued — March
31, 2022 (Unaudited)
The following table presents the Fund’s investments
measured at fair value on a recurring basis at March 31, 2022:
| Investments
|
Level
1 |
|
Level
2 |
|
Level
3 |
|
Total
|
| Investments
in Securities |
|
|
|
|
|
|
|
| U.S.
Treasuries |
$
— |
|
$
626,921,594 |
|
$
— |
|
$
626,921,594 |
| Agency
Mortgage Backed |
—
|
|
360,355,683
|
|
29,308
|
|
360,384,991
|
| Agency
Collateralized Mortgage Obligations |
—
|
|
11,556,614
|
|
—
|
|
11,556,614
|
| Asset
Backed |
—
|
|
10,579,493
|
|
—
|
|
10,579,493
|
| Corporate
Notes |
—
|
|
528,052,353
|
|
—
|
|
528,052,353
|
| Non-Agency
Collateralized Mortgage Obligations |
—
|
|
90,261,965
|
|
—
|
|
90,261,965
|
| Sovereign
Bonds |
—
|
|
18,081,049
|
|
—
|
|
18,081,049
|
| Municipal
Bonds and Notes |
—
|
|
7,196,884
|
|
—
|
|
7,196,884
|
| Preferred
Stock |
1,392,360
|
|
—
|
|
—
|
|
1,392,360
|
| Short-Term
Investments |
121,244,155
|
|
—
|
|
—
|
|
121,244,155
|
| Total
Investments in Securities |
$
122,636,515 |
|
$
1,653,005,635 |
|
$
29,308 |
|
$
1,775,671,458 |
| Other
Financial Instruments |
|
|
|
|
|
|
|
| Credit
Default Swap Contracts - Unrealized Appreciation |
$
— |
|
$
167,912 |
|
$
— |
|
$
167,912 |
| Long
Futures Contracts - Unrealized Depreciation |
(4,231,756)
|
|
—
|
|
—
|
|
(4,231,756)
|
| Short
Futures Contracts - Unrealized Appreciation |
5,164,375
|
|
—
|
|
—
|
|
5,164,375
|
| Total
Other Financial Instruments |
$
932,619 |
|
$
167,912 |
|
$
— |
|
$
1,100,531 |
| |
Number
of Shares
Held at
9/30/21 |
Value
at
9/30/21 |
Cost
of
Purchases |
Proceeds
from
Shares
Sold |
Realized
Gain
(Loss) |
Change
in
Unrealized
Appreciation
(Depreciation) |
Number
of
Shares
Held at
3/31/22 |
Value
at
3/31/22 |
Dividend
Income |
| State
Street Institutional U.S. Government Money Market Fund - Class G Shares |
257,710,916
|
$257,710,916
|
$294,711,016
|
$431,177,777
|
$—
|
$—
|
121,244,155
|
$121,244,155
|
$48,775
|
See Notes to Schedules of Investments and Notes to Financial Statements.
| State
Street Income Fund |
33
|
State Street U.S. Core Equity
Fund
Financial Highlights
Selected data based on a share outstanding throughout the
periods indicated
| |
Six
Months
Ended
3/31/22 |
|
Period
Ended
9/30/21(a)(b) |
|
Year
Ended
12/31/20(a) |
|
Year
Ended
12/31/19(a) |
|
Year
Ended
12/31/18(a) |
|
Year
Ended
12/31/17(a) |
|
Year
Ended
12/31/16(a) |
| Net
asset value, beginning of period |
$
76.83 |
|
$
66.39 |
|
$
57.30 |
|
$
46.05 |
|
$
52.45 |
|
$
49.27 |
|
$
47.59 |
| Income/(loss)
from investment operations: |
|
|
|
|
|
|
|
|
|
|
|
|
|
| Net
investment income |
0.38
(c) |
|
0.54
(c) |
|
0.77
(c) |
|
0.78
(c) |
|
0.77
(c) |
|
0.76
(c) |
|
0.92
|
| Net
realized and unrealized gains/(losses) on investments |
(16.73)
|
|
9.90
|
|
12.86
|
|
14.07
|
|
(2.41)
|
|
9.35
|
|
3.92
|
| Total
income/(loss) from investment operations |
(16.35)
|
|
10.44
|
|
13.63
|
|
14.85
|
|
(1.64)
|
|
10.11
|
|
4.84
|
| Less
distributions from: |
|
|
|
|
|
|
|
|
|
|
|
|
|
| Net
investment income |
(0.77)
|
|
—
|
|
0.81
|
|
0.77
|
|
0.81
|
|
0.81
|
|
0.91
|
| Net
realized gains |
(9.03)
|
|
—
|
|
3.73
|
|
2.83
|
|
3.95
|
|
6.12
|
|
2.25
|
| Total
distributions |
(9.80)
|
|
—
|
|
4.54
|
|
3.60
|
|
4.76
|
|
6.93
|
|
3.16
|
| Net
asset value, end of period |
$
70.28 |
|
$
76.83 |
|
$
66.39 |
|
$
57.30 |
|
$
46.05 |
|
$
52.45 |
|
$
49.27 |
| Total
Return(d) |
3.48%
(e) |
|
15.73%
(e) |
|
23.82%
|
|
32.22%
|
|
(3.05)%
|
|
20.50%
|
|
10.13%
|
| Ratios/Supplemental
Data: |
|
|
|
|
|
|
|
|
|
|
|
|
|
| Net
assets, end of period (in thousands) |
$6,702,969
|
|
$6,795,684
|
|
$6,229,783
|
|
$5,541,415
|
|
$4,700,274
|
|
$5,435,513
|
|
$4,914,567
|
| Ratios
to average net assets: |
|
|
|
|
|
|
|
|
|
|
|
|
|
| Net
expenses |
0.15%
(f) |
|
0.15%
(f) |
|
0.14%
|
|
0.14%
|
|
0.14%
|
|
0.14%
|
|
0.16%
|
| Gross
expenses |
0.15%
(f) |
|
0.15%
(f) |
|
0.14%
|
|
0.14%
|
|
0.14%
|
|
0.14%
|
|
0.16%
|
| Net
investment income |
1.00%
(f) |
|
0.99%
(f) |
|
1.29%
|
|
1.44%
|
|
1.41%
|
|
1.39%
|
|
1.79%
|
| Portfolio
turnover rate |
14%
(e) |
|
27%
(e) |
|
37%
|
|
31%
|
|
40%
|
|
77%
|
|
38%
|
| Notes
to Financial Highlights |
| (a)
|
Financial
information from January 1, 2016 until May 24, 2021 is for the GE RSP U.S. Equity Fund, which was reorganized into the State Street U.S. Core Equity Fund effective May 24, 2021. See Note 1 in the accompanying Notes to Financial Statements.
|
| (b)
|
Effective
4/13/2021, the Board of Trustees approved a change in fiscal year end for the Fund from December 31 to September 30. |
| (c)
|
Per share
values have been calculated using the average shares method. |
| (d)
|
Total
returns are historical and assume changes in share price, reinvestment of dividends and capital gains distributions. Past performance does not guarantee future results. |
| (e)
|
Not
annualized. |
| (f)
|
Annualized
for periods less than one year. |
The accompanying Notes are an integral part of these
financial statements.
State Street Income Fund
Financial Highlights
Selected data based on a share outstanding throughout the
periods indicated
| |
Six
Months
Ended
3/31/22 |
|
Period
Ended
9/30/21(a)(b) |
|
Year
Ended
12/31/20(a) |
|
Year
Ended
12/31/19(a) |
|
Year
Ended
12/31/18(a) |
|
Year
Ended
12/31/17(a) |
|
Year
Ended
12/31/16(a) |
| Net
asset value, beginning of period |
$
12.08 |
|
$
12.42 |
|
$
11.85 |
|
$
11.14 |
|
$
11.55 |
|
$
11.38 |
|
$
11.36 |
| Income/(loss)
from investment operations: |
|
|
|
|
|
|
|
|
|
|
|
|
|
| Net
investment income |
0.10
(c) |
|
0.17
(c) |
|
0.26
(c) |
|
0.31
(c) |
|
0.32
(c) |
|
0.29
(c) |
|
0.31
|
| Net
realized and unrealized gains/(losses) on investments |
(1.75)
|
|
(0.29)
|
|
0.69
|
|
0.72
|
|
(0.40)
|
|
0.16
|
|
0.09
|
| Total
income/(loss) from investment operations |
(1.65)
|
|
(0.12)
|
|
0.95
|
|
1.03
|
|
(0.08)
|
|
0.45
|
|
0.40
|
| Less
distributions from: |
|
|
|
|
|
|
|
|
|
|
|
|
|
| Net
investment income |
(0.12)
|
|
0.22
|
|
0.34
|
|
0.32
|
|
0.33
|
|
0.28
|
|
0.29
|
| Net
realized gains |
(0.33)
|
|
—
|
|
0.04
|
|
—
|
|
—
|
|
—
|
|
0.09
|
| Total
distributions |
(0.45)
|
|
0.22
|
|
0.38
|
|
0.32
|
|
0.33
|
|
0.28
|
|
0.38
|
| Net
asset value, end of period |
$
10.88 |
|
$
12.08 |
|
$
12.42 |
|
$
11.85 |
|
$
11.14 |
|
$
11.55 |
|
$
11.38 |
| Total
Return(d) |
(6.39)%
(e) |
|
(0.93)%
(e) |
|
8.20%
|
|
9.38%
|
|
(0.75)%
|
|
3.99%
|
|
3.50%
|
| Ratios/Supplemental
Data: |
|
|
|
|
|
|
|
|
|
|
|
|
|
| Net
assets, end of period (in thousands) |
$1,674,058
|
|
$1,908,411
|
|
$2,084,815
|
|
$2,024,704
|
|
$1,992,169
|
|
$2,329,674
|
|
$2,427,975
|
| Ratios
to average net assets: |
|
|
|
|
|
|
|
|
|
|
|
|
|
| Net
expenses |
0.19%
(f) |
|
0.19%
(f) |
|
0.17%
|
|
0.17%
|
|
0.17%
|
|
0.16%
|
|
0.21%
|
| Gross
expenses |
0.19%
(f) |
|
0.19%
(f) |
|
0.17%
|
|
0.17%
|
|
0.17%
|
|
0.16%
|
|
0.21%
|
| Net
investment income |
1.77%
(f) |
|
1.85%
(f) |
|
2.16%
|
|
2.67%
|
|
2.86%
|
|
2.55%
|
|
2.66%
|
| Portfolio
turnover rate |
31%
(e)(g) |
|
59%
(e)(g) |
|
110%
(g) |
|
422%
|
|
223%
|
|
297%
|
|
242%
|
| Notes
to Financial Highlights |
| (a)
|
Financial
information from January 1, 2016 until May 24, 2021 is for the GE RSP U.S. Equity Fund, which was reorganized into the State Street Income Fund effective May 24, 2021. See Note 1 in the accompanying Notes to Financial Statements. |
| (b)
|
Effective
4/13/2021, the Board of Trustees approved a change in fiscal year end for the Fund from December 31 to September 30. |
| (c)
|
Per share
values have been calculated using the average shares method. |
| (d)
|
Total
returns are historical and assume changes in share price, reinvestment of dividends and capital gains distributions. Past performance does not guarantee future results. |
| (e)
|
Not
annualized. |
| (f)
|
Annualized
for periods less than one year. |
| (g)
|
The
portfolio turnover calculated for the periods ended 3/31/22, 9/30/21 and 12/31/20 did not include To-Be-Announced transactions and, if it had, the portfolio turnover would have been 93%, 134% and 304%, respectively. |
The accompanying
Notes are an integral part of these financial statements.
State Street Institutional
Investment Trust
Statements of Assets and Liabilities
— March 31, 2022 (Unaudited)
| |
State
Street
U.S. Core Equity Fund |
|
State
Street
Income Fund |
| Assets
|
|
|
|
| Investments
in securities, at fair value (cost $4,129,376,036 and $1,721,945,435, respectively) |
$
6,640,420,845 |
|
$
1,654,427,303 |
| Short-term
affiliated investments, at fair value (cost $59,940,166 and $121,244,155 respectively) |
59,940,166
|
|
121,244,155
|
| Net
cash collateral on deposit with broker for future contracts |
70,322
|
|
2,011,251
|
| Net
cash collateral on deposit with broker for swap contracts |
—
|
|
444,592
|
| Receivable
for investments sold |
20,204,925
|
|
59,824,983
|
| Income
receivables |
4,689,981
|
|
7,670,879
|
| Receivable
for fund shares sold |
—
|
|
2,187
|
| Income
receivable from affiliated investments |
8,635
|
|
25,150
|
| Receivable
for accumulated variation margin on swap contracts |
—
|
|
1,714,511
|
| Receivable
for accumulated variation margin on futures contracts |
2,988
|
|
1,016,966
|
| Other
assets |
5,996
|
|
1,667
|
| Total
assets |
6,725,343,858
|
|
1,848,383,644
|
| Liabilities
|
|
|
|
| Distribution
payable to shareholders |
8,694
|
|
101,146
|
| Due
to custodian |
—
|
|
1,045,448
|
| Payable
for investments purchased |
20,235,116
|
|
172,243,864
|
| Payable
for fund shares redeemed |
812,350
|
|
424,425
|
| Payable
to the Adviser |
666,403
|
|
187,473
|
| Payable
for custody, fund accounting and sub-administration fees |
222,915
|
|
96,191
|
| Accrued
other expenses |
429,639
|
|
226,690
|
| Total
liabilities |
22,375,117
|
|
174,325,237
|
| |
| Net
Assets |
$
6,702,968,741 |
|
$
1,674,058,407 |
| Net
Assets Consist of: |
|
|
|
| Capital
paid in |
$
3,886,485,152 |
|
$
1,771,156,968 |
| Total
distributable earnings (loss) |
2,816,483,589
|
|
(97,098,561)
|
| Net
Assets |
$
6,702,968,741 |
|
$
1,674,058,407 |
| Shares
outstanding ($25.00 and $10.00 par value, respectively; unlimited shares authorized) |
95,368,750
|
|
153,858,226
|
| Net
asset value per share |
$
70.28 |
|
$
10.88 |
The accompanying Notes are an integral part of these
financial statements.
| 36
|
Statements of Assets
and Liabilities |
State Street Institutional
Investment Trust
Statements of Operations — For the
period ended March 31, 2022 (Unaudited)
| |
State
Street
U.S. Core Equity Fund |
|
State
Street
Income Fund |
| Investment
Income |
|
|
|
| Income
|
|
|
|
| Dividend
|
$
39,985,032 |
|
$
35,792 |
| Interest
|
—
|
|
17,679,410
|
| Income
from affiliated investments |
17,898
|
|
48,775
|
| Less:
Foreign taxes withheld |
(116,377)
|
|
—
|
| Total
income |
39,886,553
|
|
17,763,977
|
| Expenses
|
|
|
|
| Advisory
and administration fees |
4,156,576
|
|
1,174,734
|
| Transfer
agent fees |
241,960
|
|
222,332
|
| Trustees'
fees |
23,927
|
|
13,628
|
| Custody,
fund accounting and sub-administration fees |
268,133
|
|
125,604
|
| Professional
fees |
68,156
|
|
32,402
|
| Registration
fees |
357,625
|
|
103,121
|
| Other
expenses |
187,994
|
|
68,732
|
| Total
expenses |
5,304,371
|
|
1,740,553
|
| Net
investment income |
$
34,582,182 |
|
$
16,023,424 |
| Net
Realized and Unrealized Gain (Loss) on Investments |
|
|
|
| Realized
gain (loss) on: |
|
|
|
| Unaffiliated
investments |
$
359,139,416 |
|
$
(6,070,247) |
| Futures
|
(5,376,703)
|
|
(7,391,472)
|
| Swap
contracts |
—
|
|
(1,000,017)
|
| Increase
(decrease) in unrealized appreciation/depreciation on: |
|
|
|
| Unaffiliated
investments |
(148,703,257)
|
|
(120,296,144)
|
| Futures
|
1,313,327
|
|
1,608,787
|
| Swap
contracts |
—
|
|
339,752
|
| Net
realized and unrealized gain (loss) on investments |
206,372,783
|
|
(132,809,341)
|
| Net
Increase (Decrease) in Net Assets Resulting from Operations |
$
240,954,965 |
|
$
(116,785,917) |
The accompanying Notes are an integral part of these
financial statements.
| Statements
of Operations |
37
|
State Street Institutional
Investment Trust
Statements of Changes in Net Assets
| |
State
Street U.S. Core Equity Fund |
| |
Six
Months
Ended
3/31/22 |
|
Period
Ended
9/30/21(a) |
|
Year
Ended
12/31/20 |
| Increase
(Decrease) in Net Assets |
|
|
|
|
|
| Operations:
|
|
|
|
|
|
| Net
investment income |
$
34,582,182 |
|
$
49,436,678 |
|
$
70,183,281 |
| Net
realized gain (loss) on investments and futures |
353,762,713
|
|
743,574,138
|
|
328,591,207
|
| Net
increase (decrease) in unrealized appreciation/depreciation on investments and futures |
(147,389,930)
|
|
167,123,754
|
|
799,903,293
|
| Net
increase (decrease) from operations |
240,954,965
|
|
960,134,570
|
|
1,198,677,781
|
| Distributions
to shareholders: |
|
|
|
|
|
| Total
distributions |
(848,288,634)
|
|
—
|
|
(400,316,279)
|
| Increase
(decrease) in assets from operations and distributions |
(607,333,669)
|
|
960,134,570
|
|
798,361,502
|
| Share
transactions: |
|
|
|
|
|
| Proceeds
from sale of shares |
23,615,969
|
|
15,549,302
|
|
55,418,614
|
| Value
of distributions reinvested |
805,553,445
|
|
—
|
|
379,700,260
|
| Cost
of shares redeemed |
(314,550,609)
|
|
(409,783,514)
|
|
(545,111,984)
|
| Net
increase (decrease) from share transactions |
514,618,805
|
|
(394,234,212)
|
|
(109,993,110)
|
| Total
increase (decrease) in net assets |
(92,714,864)
|
|
565,900,358
|
|
688,368,392
|
| Net
Assets |
|
|
|
|
|
| Beginning
of period |
6,795,683,605
|
|
6,229,783,247
|
|
5,541,414,855
|
| End
of period |
$
6,702,968,741 |
|
$
6,795,683,605 |
|
$
6,229,783,247 |
| Changes
in Fund Shares |
|
|
|
|
|
| Shares
sold |
321,758
|
|
216,103
|
|
914,306
|
| Issued
for distributions reinvested |
10,796,856
|
|
—
|
|
5,739,128
|
| Shares
redeemed |
(4,198,819)
|
|
(5,605,458)
|
|
(9,524,851)
|
| Net
increase (decrease) in fund shares |
6,919,795
|
|
(5,389,355)
|
|
(2,871,417)
|
| (a)
|
Effective
4/13/2021, the Board of Trustees approved a change in fiscal year end for the Fund from December 31 to September 30. |
The accompanying Notes are an integral part of these financial
statements.
| 38
|
Statements of Changes
in Net Assets |
State Street Institutional
Investment Trust
Statements of Changes in Net Assets
| |
State
Street
Income Fund |
| |
Six
Months
Ended
3/31/22 |
|
Period
Ended
9/30/21(a) |
|
Year
Ended
12/31/20 |
| Increase
(Decrease) in Net Assets |
|
|
|
|
|
| Operations:
|
|
|
|
|
|
| Net
investment income |
$
16,023,424 |
|
$
27,217,701 |
|
$
44,464,564 |
| Net
realized gain (loss) on investments, futures and swap contracts |
(14,461,736)
|
|
33,003,540
|
|
46,627,572
|
| Net
increase (decrease) in unrealized appreciation/depreciation on investments, futures and swap contracts |
(118,347,605)
|
|
(79,823,683)
|
|
68,420,358
|
| Net
increase (decrease) from operations |
(116,785,917)
|
|
(19,602,442)
|
|
159,512,494
|
| Distributions
to shareholders: |
|
|
|
|
|
| Total
distributions |
(69,888,397)
|
|
(36,235,960)
|
|
(64,080,587)
|
| Increase
(decrease) in assets from operations and distributions |
(186,674,314)
|
|
(55,838,402)
|
|
95,431,907
|
| Share
transactions: |
|
|
|
|
|
| Proceeds
from sale of shares |
7,656,166
|
|
14,393,778
|
|
48,154,654
|
| Value
of distributions reinvested |
67,983,467
|
|
32,110,035
|
|
61,957,884
|
| Cost
of shares redeemed |
(123,317,797)
|
|
(167,069,788)
|
|
(145,433,304)
|
| Net
increase (decrease) from share transactions |
(47,678,164)
|
|
(120,565,975)
|
|
(35,320,766)
|
| Total
increase (decrease) in net assets |
(234,352,478)
|
|
(176,404,377)
|
|
60,111,141
|
| Net
Assets |
|
|
|
|
|
| Beginning
of period |
1,908,410,885
|
|
2,084,815,262
|
|
2,024,704,121
|
| End
of period |
$
1,674,058,407 |
|
$
1,908,410,885 |
|
$
2,084,815,262 |
| Changes
in Fund Shares |
|
|
|
|
|
| Shares
sold |
668,138
|
|
1,431,692
|
|
3,948,098
|
| Issued
for distributions reinvested |
5,844,678
|
|
2,646,451
|
|
5,055,918
|
| Shares
redeemed |
(10,599,059)
|
|
(14,031,749)
|
|
(12,024,475)
|
| Net
decrease in fund shares |
(4,086,243)
|
|
(9,953,606)
|
|
(3,020,459)
|
| (a)
|
Effective
4/13/2021, the Board of Trustees approved a change in fiscal year end for the Fund from December 31 to September 30. |
The accompanying Notes are an integral part of these financial
statements.
| Statements
of Changes in Net Assets |
39
|
State Street Institutional
Investment Trust
Notes to Financial Statements —
March 31, 2022 (Unaudited)
1.
Organization of the Funds
State Street Institutional Investment Trust
(the “Trust”), a Massachusetts business trust registered under the Investment Company Act of 1940, as amended (“1940 Act”), is an open-end management investment company.
As of March 31, 2022, the Trust consists
of thirty-three (33) series (and corresponding classes, each of which have the same rights and privileges, including voting rights), each of which represents a separate series of beneficial interest in the Trust. The Declaration of Trust permits the
Board of Trustees of the Trust (the “Board” and each member thereof, a "Trustee") to authorize the issuance of an unlimited number of shares of beneficial interest with no par value. The financial statements herein relate to the State
Street U.S. Core Equity Fund and the State Street Income Fund (each, a "Fund" and collectively, the "Funds"). Shares of the Funds may be purchased only by Eligible Investors, as defined in the Fund's prospectus, through General Electric
Company’s defined contribution plan arrangement in a Fund.
Under the Trust’s organizational
documents, its officers and trustees are indemnified against certain liabilities arising out of the performance of their duties to the Trust. Additionally, in the normal course of business, the Trust enters into contracts with service providers that
contain general indemnification clauses. The Trust’s maximum exposure under these arrangements is unknown as this would involve future claims that may be made against the Trust that have not yet occurred.
Each Fund commenced operations on May
24, 2021, as a result of a Reorganization (Note 11) in which each Fund assumed all of the assets and liabilities of its respective Predecessor Fund, per the below table. Each Fund has substantially similar investment strategies as its Predecessor
Fund. Each Fund has adopted the historical performance of its respective Predecessor Fund.
| Fund
|
Predecessor
Fund |
| State
Street U.S. Core Equity Fund |
GE
RSP U.S. Equity Fund |
| State
Street Income Fund |
GE
RSP Income Fund |
Prior to May 24, 2021, the Predecessor
Funds operated as Employees’ Securities Companies (as defined in the 1940 Act) and as such were exempt from certain provisions of the 1940 Act.
2.Summary
of Significant Accounting Policies
The following is a summary of significant
accounting policies followed by the Funds in the preparation of their financial statements:
The preparation of financial statements
in accordance with U.S. generally accepted accounting principles (“U.S. GAAP”) requires management to make estimates and assumptions that affect the reported amounts and disclosures in the financial statements. Actual results could
differ from those estimates. Each Fund is an investment company under U.S. GAAP and follows the accounting and reporting guidance applicable to investment companies.
Security Valuation Each Fund’s investments are valued at fair value each day that the New York Stock Exchange (“NYSE”) is open and, for financial reporting purposes, as of the report date should the reporting period end
on a day that the NYSE is not open. Fair value is generally defined as the price a fund would receive to sell an asset or pay to transfer a liability in an orderly transaction between market participants at the measurement date. By its nature, a
fair value price is a good faith estimate of the valuation in a current sale and may not reflect an actual market price. The investments of each Fund are valued pursuant to the policy and procedures developed by the Oversight Committee (the
“Committee”) and approved by the Board. The Committee provides oversight of the valuation of investments for the Funds. The Board has responsibility for overseeing the determination of the fair value of investments.
Valuation techniques used to value each
Fund’s investments by major category are as follows:
| •
|
Equity investments
(including preferred stocks and registered investment companies that are exchange-traded funds) traded on a recognized securities exchange for which market quotations are readily available are valued |
| 40
|
Notes to Financial
Statements |
State Street Institutional
Investment Trust
Notes to Financial Statements, continued
— March 31, 2022 (Unaudited)
| |
at the last sale price or
official closing price, as applicable, on the primary market or exchange on which they trade. Equity investments traded on a recognized exchange for which there were no sales on that day are valued at the last published sale price or at fair value.
|
| •
|
Government and municipal
fixed income securities are generally valued using quotations from independent pricing services or brokers. Certain government inflation-indexed securities may require a calculated fair valuation as the cumulative inflation is contained within the
price provided by the pricing service or broker. For these securities, the inflation component of the price is “cleaned” from the pricing service or broker price utilizing the published inflation factors in order to ensure proper accrual
of income. |
| •
|
Debt obligations (including
short term investments and convertible debt securities) are valued using quotations from independent pricing services or brokers or are generally valued at the last reported evaluated prices. |
| •
|
Exchange-traded futures
contracts are valued at the closing settlement price on the primary market on which they are traded most extensively. Exchange-traded futures contracts traded on a recognized exchange for which there were no sales on that day are valued at the last
reported sale price obtained from independent pricing services or brokers or at fair value. |
| •
|
Swap agreements are
valued daily based upon prices supplied by Board approved pricing vendors or through brokers. Depending on the product and terms of the transaction, the value of agreements is determined using a series of techniques including valuation models that
incorporate a number of market data factors, such as discounted cash flows, yields, curves, trades and values of the underlying reference instruments. In the event SSGA Funds Management, Inc. (the “Adviser” or “SSGA FM”) is
unable to obtain an independent, third-party valuation the agreements will be fair valued. |
| •
|
Options on
futures are priced at their last sale price on the principal market on which they are traded on the valuation date. If there were no sales on that day, options on futures are valued at either the last reported sale or official closing price on
their primary exchange determined in accordance with the valuation policy and procedures approved by the Board. |
In the event prices or quotations are
not readily available or that the application of these valuation methods results in a price for an investment that is deemed to be not representative of the fair value of such investment, fair value will be determined in good faith by the Committee,
in accordance with the valuation policy and procedures approved by the Board.
The Funds value their assets and
liabilities at fair value using a fair value hierarchy consisting of three broad levels that prioritize the inputs to valuation techniques giving the highest priority to readily available unadjusted quoted prices in active markets for identical
assets or liabilities (Level 1 measurements) and the lowest priority to unobservable inputs (Level 3 measurements) when market prices are not readily available or reliable. The categorization of a value determined for an investment within the
hierarchy is based upon the pricing transparency of the investment and is not necessarily an indication of the risk associated with investing in it.
The three levels of the fair value
hierarchy are as follows:
| •
|
Level 1 — Unadjusted
quoted prices in active markets for an identical asset or liability; |
| •
|
Level 2 — Inputs
other than quoted prices included within Level 1 that are observable for the asset or liability either directly or indirectly, including quoted prices for similar assets or liabilities in active markets, quoted prices for identical or similar assets
or liabilities in markets that are not considered to be active, inputs other than quoted prices that are observable for the asset or liability (such as exchange rates, financing terms, interest rates, yield curves, volatilities, prepayment speeds,
loss severities, credit risks and default rates) or other market-corroborated inputs; and |
| •
|
Level 3
— Unobservable inputs for the asset or liability, including the Committee’s assumptions used in determining the fair value of investments. |
| Notes
to Financial Statements |
41
|
State Street Institutional
Investment Trust
Notes to Financial Statements, continued
— March 31, 2022 (Unaudited)
The value of each Fund’s investments
according to the fair value hierarchy as of March 31, 2022 is disclosed in each Fund’s Schedule of Investments.
Investment Transactions and Income
Recognition Investment transactions are accounted for on trade date for financial reporting purposes. Realized gains and losses from the sale or disposition of investments and foreign exchange transactions, if any,
are determined using the identified cost method.
Dividend income and capital gain
distributions, if any, are recognized on the ex-dividend date, net of any foreign taxes withheld at source, if any.
Interest income is recorded daily on an
accrual basis. All premiums and discounts are amortized/accreted for financial reporting purposes.
Non-cash dividends received in the form of
stock are recorded as dividend income at fair value.
The State Street U.S. Core Equity Fund
invests in real estate investments trusts ("REITs"). REITs determine the tax character of their distributions as a return of capital or capital gain. The Portfolio’s policy is to record all REIT distributions initially as dividend income and
re-designate the prior calendar year’s to return of capital gains distributions at year end based on information provided by the REIT and/or SSGA FM estimates of such redesignations for which actual information has not yet been reported.
Expenses
Certain expenses, which are directly identifiable to a specific Fund, are applied to the Fund that incurs such expenses. Other expenses which cannot be attributed to a specific Fund are allocated in such a manner as deemed equitable, taking into
consideration the nature and type of expense and the relative net assets of the Fund.
Distributions The State Street Income Fund declares investment income dividends daily and pays them monthly. The State Street U.S. Core Equity Fund declares and pays dividends from investment income annually.
Net realized capital gains, if any, are
distributed annually, unless additional distributions are required for compliance with applicable tax regulations. The amount and character of income and capital gains to be distributed are determined in accordance with applicable tax regulations
which may differ from net investment income and realized gains recognized for U.S. GAAP purposes.
3.Securities
and Other Investments
Delayed
Delivery Transactions and When-Issued Securities During the period ended March 31, 2022, the State Street Income Fund transacted in securities on a delayed delivery or when-issued basis. Payment and delivery may
take place after the customary settlement period for that security. The price of the underlying securities and the date when the securities will be delivered and paid for are fixed at the time the transaction is negotiated. The securities purchased
on a delayed delivery or when-issued basis are identified as such in the State Street Income Fund’s Schedule of Investments. The State Street Income Fund may receive compensation for interest forgone in the purchase of a delayed delivery or
when-issued security. With respect to such purchase commitments, the State Street Income Fund identifies securities as segregated in its records with a value at least equal to the amount of the commitment. Losses may arise due to changes in the
value of the underlying securities or if the counterparty does not perform under the contract’s terms, or if the issuer does not issue the securities due to political, economic or other factors.
To-Be-Announced Transactions The State Street Income Fund may seek to obtain exposure to U.S. agency mortgage pass-through securities through the use of “to-be-announced” or “TBA transactions.” “TBA” refers to a
commonly used mechanism for the forward settlement of U.S. agency mortgage pass-through securities. In a TBA transaction, the buyer and seller decide on general trade parameters, such as agency, settlement date, coupon, and price.
The State Street Income Fund may use TBA
transactions to “roll over” such agreements prior to the settlement date. This type of TBA transaction is sometimes known as a “TBA roll.” In a TBA roll, the State Street Income Fund generally will sell the obligation to
purchase the pools stipulated in the TBA agreement prior to the settlement date
| 42
|
Notes to Financial
Statements |
State Street Institutional
Investment Trust
Notes to Financial Statements, continued
— March 31, 2022 (Unaudited)
and will enter into a new TBA agreement for future
delivery of pools of mortgage pass-through securities. The State Street Income Fund may also enter into TBA agreements and settle such transactions on the stipulated settlement date by accepting actual receipt or delivery of the pools of mortgage
pass-through securities.
Default
by or bankruptcy of a counterparty to a TBA transaction would expose the State Street Income Fund to possible loss because of adverse market action, expenses or delays in connection with the purchase or sale of the pools of mortgage pass-through
securities specified in the TBA transaction. To minimize this risk, the State Street Income Fund will enter into TBA transactions only with established counterparties. The State Street Income Fund’s use of “TBA rolls” may impact
portfolio turnover, transaction costs and capital gain distributions to shareholders.
4.Derivative
Financial Instruments
Futures
Contracts The Funds may enter into futures contracts to meet a Fund’s objectives. A futures contract is a standardized, exchange-traded agreement to buy or sell a financial instrument at a set price on a
future date. Upon entering into a futures contract, a Fund is required to deposit with the broker, cash or securities in an amount equal to the minimum initial margin requirements of the clearing house. Securities deposited, if any, are designated
on the Funds' Schedule of Investments and cash deposited, if any, is included in Net cash collateral on deposit with broker for future contracts on the Statements of Assets and Liabilities. Subsequent payments are made or received by a Fund equal to
the daily change in the contract value, accumulated, exchange rates, and or other transactional fees. The accumulation of those payments are recorded as variation margin receivable or payable with a corresponding offset to unrealized gains or
losses. A Fund recognizes a realized gain or loss when the contract is closed.
Losses may arise if the value of a
futures contract decreases due to unfavorable changes in the market rates or values of the underlying instrument during the term of the contract or if the counterparty does not perform under the contract. The use of futures contracts also involves
the risk that the movements in the price of the futures contracts do not correlate the movement of the assets underlying such contracts.
For the period ended March 31, 2022, the
State Street U.S. Core Equity Fund and the State Street Income Fund entered into futures contracts in order to equitize cash and manage exposure to interest rates, respectively.
Options on Futures Contracts The Funds may purchase and write options, including options on futures contracts, subject to certain limitations. Writing puts and buying calls tend to increase a Fund’s exposure to the underlying instrument while
buying puts and writing calls tend to decrease a Fund’s exposure to the underlying instrument. The Funds will not enter into a transaction involving options for speculative purposes. A Fund’s risks in using these contracts include
changes in the value of the underlying instruments, non-performance of the counterparties under the contracts’ terms and changes in the liquidity of the secondary market for the contracts.
When a Fund writes an option, the amount
of the premium received is recorded as a liability and is subsequently adjusted to the current fair value of the option written. Premiums received from writing options that expire unexercised are treated by a Fund on the expiration date as realized
gain from investments. The difference between the premium and the amount paid on effecting a closing purchase transaction, including brokerage commissions, is also treated as a realized gain, or if the premium is less than the amount paid for the
closing purchase, as a realized loss. When an option is exercised, the proceeds from the sale of the underlying instrument or the cost basis of the securities purchased is adjusted by the original premium received or paid. In return for a premium
paid, call and put options on futures contracts give the holder the right, but not the obligation, to purchase or sell, respectively, a position in a particular futures contract at a specified exercise price.
| Notes
to Financial Statements |
43
|
State Street Institutional
Investment Trust
Notes to Financial Statements, continued
— March 31, 2022 (Unaudited)
Credit Default Swaps During the period ended March 31, 2022, the State Street Income Fund engaged in credit default swaps to manage credit risk. When the Fund is the buyer in a credit default swap contract, the Fund is entitled to receive
the par (or other agreed upon) value (full notional value) of a referenced debt obligation (or basket of debt obligations) from the counterparty (or central clearing party (“CCP”) in the case of a centrally cleared swap) to the contract
if a credit event by a third party, such as a U.S. or foreign corporate issuer or sovereign issuer, on the debt obligation occurs. In return, the Fund pays the counterparty a periodic stream of payments over the term of the contract provided that no
credit event has occurred. If no credit event occurs, the Fund loses its investment and recovers nothing. However, if a credit event occurs, the Fund receives full notional value for a referenced debt obligation that may have little or no value.
When the Fund is the seller of a credit default swap, it receives a fixed rate of income throughout the term of the contract, provided there is no credit event. If a credit event occurs, the Fund is obligated to pay the notional amount of the swap
and in certain instances take delivery of securities of the reference entity upon the occurrence of a credit event, as defined under the terms of that particular swap agreement. Credit events are contract specific but may include bankruptcy, failure
to pay, restructuring, obligation acceleration and repudiation/moratorium. If the Fund is a seller of protection and a credit event occurs, the maximum potential amount of future payments that the Fund could be required to make would be an amount
equal to the notional amount of the agreement. This potential amount would be partially offset by any recovery value of the respective referenced obligation, or net amount received from the settlement of a buy protection credit default swap
agreement entered into by the Fund for the same referenced obligation. As the seller, the Fund may create economic leverage to its portfolio because, in addition to its total net assets, the Fund is subject to investment exposure on the notional
amount of the swap. The interest fee paid or received on the swap, which is based on a specified interest rate on a fixed notional amount, is accrued daily as a component of unrealized appreciation (depreciation) and is recorded as realized gain
upon receipt or realized loss upon payment. The Fund also records an increase or decrease to unrealized appreciation (depreciation) in an amount equal to the daily valuation. For centrally cleared swaps, the daily change in valuation is recorded as
a receivable or payable for variation margin and settled in cash with the CCP daily. All upfront payments, if any, are amortized over the life of the swap as realized gains or losses. Those upfront payments that are paid or received, typically for
non-centrally cleared swaps, are recorded as other assets or other liabilities, respectively, net of amortization. For financial reporting purposes, unamortized upfront payments, if any, are netted with unrealized appreciation or depreciation on
swaps to determine the market value of swaps. The Fund segregates assets in the form of cash or liquid securities in an amount equal to the notional amount of the credit default swaps of which it is the seller. The Fund segregates assets in the form
of cash or liquid securities in an amount equal to any unrealized depreciation of the credit default swaps of which it is the buyer, marked to market on a daily basis. Credit default swaps involve greater risks than if the Fund had invested in the
referenced debt obligation directly. If the Fund is a buyer of a credit default swap and no credit event occurs, the Fund will not earn any return on its investment. If the Fund is a seller of a credit default swap, the Fund’s risk of loss may
be the entire notional amount of the swap. Swaps may also subject the Fund to the risk that the counterparty to the transaction may not fulfill its obligation. In the case of centrally cleared swaps, counterparty risk is minimal due to protections
provided by the CCP.
Interest
Rate Swaps Interest rate swaps involve the exchange by a Fund with another party of their respective commitments to pay or receive interest, such as an exchange of fixed rate payments for floating rate
payments.
The following
tables summarize the value of the Funds’ derivative instruments as of March 31, 2022 and the related location in the accompanying Statements of Assets and Liabilities and Statements of Operations, presented by primary underlying risk
exposure:
| Asset
Derivatives |
| |
Interest
Rate
Risk |
Foreign
Exchange
Risk |
Credit
Risk |
Equity
Risk |
Commodity
Risk |
Total
|
| State
Street U.S. Core Equity Fund |
|
|
|
|
|
|
| Futures
Contracts |
$
— |
$
— |
$
— |
$
2,988 |
$
— |
$
2,988 |
| 44
|
Notes to Financial
Statements |
State Street Institutional
Investment Trust
Notes to Financial Statements, continued
— March 31, 2022 (Unaudited)
| Asset
Derivatives |
| |
Interest
Rate
Risk |
Foreign
Exchange
Risk |
Credit
Risk |
Equity
Risk |
Commodity
Risk |
Total
|
| State
Street Income Fund |
|
|
|
|
|
|
| Futures
Contracts |
$
1,016,966 |
$
— |
$
— |
$
— |
$
— |
$
1,016,966 |
| Swap
Contracts |
—
|
—
|
1,714,511
|
—
|
—
|
1,714,511
|
| Realized
Gain/Loss |
| |
Interest
Rate
Risk |
Foreign
Exchange
Risk |
Credit
Risk |
Equity
Risk |
Commodity
Risk |
Total
|
| State
Street U.S. Core Equity Fund |
|
|
|
|
|
|
| Futures
Contracts |
$
— |
$
— |
$
— |
(5,376,703)
|
$
— |
$
(5,376,703) |
| State
Street Income Fund |
|
|
|
|
|
|
| Futures
Contracts |
$
(7,391,472) |
$
— |
$
— |
$
— |
$
— |
$
(7,391,472) |
| Swap
Contracts |
—
|
—
|
(1,000,017)
|
—
|
—
|
(1,000,017)
|
| Net
Change in Unrealized Appreciation (Depreciation) |
| |
Interest
Rate
Risk |
Foreign
Exchange
Risk |
Credit
Risk |
Equity
Risk |
Commodity
Risk |
Total
|
| State
Street U.S. Core Equity Fund |
|
|
|
|
|
|
| Futures
Contracts |
$
— |
$
— |
$
— |
1,313,327
|
$
— |
$
1,313,327 |
| State
Street Income Fund |
|
|
|
|
|
|
| Futures
Contracts |
$
1,608,787 |
$
— |
$
— |
$
— |
$
— |
$
1,608,787 |
| Swap
Contracts |
—
|
—
|
339,752
|
—
|
—
|
339,752
|
5.Fees and Transactions with Affiliates
Advisory Fee SSGA FM, a registered investment adviser, was retained by the Board to act as investment adviser and administrator of each Fund. SSGA FM’s compensation for investment advisory and administrative services
(“Management Fee”) is paid monthly based on the average daily net assets of each Fund. The Management Fee is stated in the following schedule:
| Fund
|
Average
Daily
Net Assets of the Fund |
Management
Fee |
| State
Street U.S. Core Equity Fund |
All
Assets |
0.12%
|
| State
Street Income Fund |
All
Assets |
0.13%
|
Custody, Fund
Accounting and Sub-Administration Fees State Street Bank and Trust Company (“State Street”) serves as the custodian, fund accountant and sub-administrator to the Funds. Amounts paid by the Funds to State
Street for performing such services are included as custody, fund accounting and subadministration fees in the Statements of Operations.
Due to Custodian In certain circumstances, the Funds may have cash overdrafts with the custodian due to expense payments, capital transactions, trading of securities, investment operations or derivative transactions. The Due to
Custodian amount, if any, reflects cash overdrawn with State Street as custodian, who is an affiliate of the Funds.
Other Transactions with Affiliates The Funds may invest in affiliated entities, including securities issued by State Street Corporation, affiliated funds, or entities deemed to be affiliates as a result of the Funds owning more than five percent of the
entity’s voting securities or outstanding shares. Amounts relating to these transactions during the period ended March 31, 2022 are disclosed in the Schedules of Investments.
| Notes
to Financial Statements |
45
|
State Street Institutional
Investment Trust
Notes to Financial Statements, continued
— March 31, 2022 (Unaudited)
6.Trustees'
Fees
The fees and expenses of the
Trustees who are not “interested persons” of the Trust, as defined in the 1940 Act, (“Independent Trustees”) are paid directly by the Funds. The Independent Trustees are reimbursed for travel and other out-of-pocket expenses
in connection with meeting attendance and industry seminars.
7.Investment
Transactions
Purchases and sales of
investments (excluding in-kind transactions, short term investments and derivative contracts) for the period ended March 31, 2022 were as follows:
| |
U.S.
Government
Obligations |
|
Other
Securities |
| Fund
|
Purchases
|
Sales
|
|
Purchases
|
Sales
|
| State
Street U.S. Core Equity Fund |
$
— |
$
— |
|
$968,810,753
|
$1,244,507,810
|
| State
Street Income Fund |
467,165,131
|
260,958,093
|
|
101,327,186
|
234,295,968
|
8.Income Tax Information
The Funds have qualified and intend to
continue to qualify as regulated investment companies under Subchapter M of the Internal Revenue Code of 1986, as amended. Each Fund will not be subject to the federal income taxes to the extent it distributes its taxable income, including any net
realized capital gains, for each fiscal year. Therefore, no provision for federal income tax is required.
The Funds file federal and various state
and local tax returns as required. No income tax returns are currently under examination. Generally, the federal returns are subject to examination by the Internal Revenue Service (the "IRS") for a period of three years from date of filing, while
the state returns may remain open for an additional year depending upon jurisdiction. SSGA FM has analyzed the Funds' tax positions and does not believe there are any uncertain tax positions that would require recognition of a tax liability.
Distributions to shareholders are
recorded on ex-dividend date. Income dividends and gain distributions are determined in accordance with income tax rules and regulations, which may differ from generally accepted accounting principles.
As of March 31, 2022, gross unrealized
appreciation and gross unrealized depreciation of investments and other financial instruments based on cost for federal income tax purposes were as follows:
| Fund
|
Tax
Cost |
Gross
Unrealized
Appreciation |
Gross
Unrealized
Depreciation |
Net
Unrealized
Appreciation
(Depreciation) |
| State
Street U.S. Core Equity Fund |
$4,212,177,950
|
$2,610,638,716
|
$122,452,670
|
$2,488,186,046
|
| State
Street Income Fund |
1,856,698,478
|
6,588,040
|
86,514,529
|
(79,926,489)
|
9.Line of Credit
The Funds and other affiliated funds
(each, a “Participant” and collectively, the “Participants”) have access to $200 million of a $1.1 billion revolving credit facility, provided by a syndication of banks under which the Participants may borrow to fund
shareholder redemptions. This agreement expires in October 2022 unless extended or renewed.
The Participants are charged an annual
commitment fee which is calculated based on the unused portion of the shared credit line. Commitment fees are allocated among each of the Participants based on relative net assets. Commitment fees are ordinary fund operation expenses. A Participant
incurs and pays the interest expense related to its borrowing. Interest is calculated at a rate per annum equal to the sum of 1% plus the greater of the New York Fed Bank Rate and the one-month SOFR Rate.
The Funds had no outstanding loans as of
March 31, 2022.
| 46
|
Notes to Financial
Statements |
State Street Institutional
Investment Trust
Notes to Financial Statements, continued
— March 31, 2022 (Unaudited)
Prior to October 7, 2021, the Funds had
access to $200 million of a $500 million revolving credit facility and interest was calculated at a rate per annum equal to the sum of 1.25% plus the New York Fed Bank Rate.
10.Risks
Concentration Risk As a result of a Fund's ability to invest a large percentage of its assets in obligations of issuers within the same country, state, region, currency or economic sector, an adverse economic, business or political
development may affect the value of a Fund's investments more than if a Fund was more broadly diversified.
Credit Risk
Each Fund may be exposed to credit risk in the event that an issuer or guarantor fails to perform or that an institution or entity with which the Fund has unsettled or open transactions defaults.
Market Risk Each Fund's investments are subject to changes in general economic conditions, general market fluctuations and the risks inherent in investment in securities markets. Investment markets can be volatile and prices of
investments can change substantially due to various factors including, but not limited to, economic growth or recession, changes in interest rates, changes in the actual or perceived creditworthiness of issuers, and general market liquidity. The
Funds are subject to the risk that geopolitical events will disrupt securities markets and adversely affect global economies and markets. Local, regional, or global events such as war, acts of terrorism, the spread of infectious illness or other
public health issues, or other events could have a significant impact on a Fund and its investments.
An outbreak of a respiratory disease
caused by a novel coronavirus first detected in China in December 2019 has spread globally. In an organized attempt to contain and mitigate the effects of the spread of the coronavirus known as COVID-19, governments and businesses world-wide have
taken aggressive measures, including closing borders, restricting international and domestic travel, and the imposition of prolonged quarantines of large populations. COVID-19 has resulted in the disruption of and delays in the delivery of
healthcare services and processes, the cancellation of organized events and educational institutions, the disruption of production and supply chains, a decline in consumer demand for certain goods and services, and general concern and uncertainty,
all of which have contributed to increased volatility in global markets. The effects of COVID-19 will likely affect certain sectors and industries more dramatically than others, which may adversely affect the value of a Fund’s investments in
those sectors or industries. COVID-19, and other epidemics and pandemics that may arise in the future, could adversely affect the economies of many nations, the global economy, individual companies and capital markets in ways that cannot be foreseen
at the present time. In addition, the impact of infectious diseases in developing or emerging market countries may be greater due to limited health care resources. Political, economic and social stresses caused by COVID-19 also may exacerbate other
pre-existing political, social and economic risks in certain countries. The duration of COVID-19 and its effects cannot be determined at this time, but the effects could be present for an extended period of time.
11.Reorganization
Effective May 24, 2021,
shareholders of each Predecessor Fund received shares of each respective Fund, per the table below, with an aggregate net asset value equal to shares in the Predecessor Fund immediately prior to the reorganization. Each Fund’s reorganization
was treated as a tax-free reorganization for federal income tax purposes and, accordingly, the basis of the assets of each Fund reflects the historical basis of the assets of the Predecessor Fund as of the date of the reorganization. For financial
reporting purposes, each Predecessor Fund’s operating history prior to the reorganization is reflected in each respective Fund’s financial statements and financial highlights.
| Fund
|
Predecessor
Name |
Aggregate
Net Asset Value |
Shares
|
| State
Street U.S. Core Equity Fund |
GE
RSP U.S. Equity Fund |
$6,729,291,756
|
90,684,798
|
| State
Street Income Fund |
GE
RSP Income Fund |
$1,938,602,965
|
161,204,455
|
| Notes
to Financial Statements |
47
|
State Street Institutional
Investment Trust
Notes to Financial Statements, continued
— March 31, 2022 (Unaudited)
12.Recent
Accounting Pronouncement
In March
2020, the Financial Accounting Standards Board (“FASB”) issued Accounting Standards Update No. 2020-04 (“ASU 2020-04”), “Reference Rate Reform (Topic 848)”. In response to concerns about structural risks of
interbank offered rates, and particularly the risk of cessation of LIBOR, regulators have undertaken reference rate reform initiatives to identify alternative reference rates that are more observable or transaction based and less susceptible to
manipulation. ASU 2020-04 provides optional guidance for a limited period of time to ease the potential burden in accounting for (or recognizing the effects of) reference rate reform on financial reporting. ASU 2020-04 is elective and applies to all
entities, subject to meeting certain criteria, that have contracts, hedging relationships, and other transactions that reference LIBOR or another reference rate expected to be discontinued because of reference rate reform. The amendments are
effective as of March 12, 2020 through December 31, 2022. Management is currently evaluating the impact of the guidance.
13.Change
in Audit Firm
On November 18,
2021, the Audit Committee (the “Committee”) of the Board of Trustees of the Trust dismissed BBD LLP (“BBD”), 1835 Market Street Philadelphia, Pennsylvania 19103, as the Funds’ independent registered public accounting
firm effective following the issuance by BBD of their report on the Funds’ September 30, 2021 financial statements.
The reports of BBD on the Funds’
financial statements for the fiscal period ended September 30, 2021, and fiscal years ended December 31 2020 and 2019 did not contain an adverse opinion or disclaimer of opinion and were not qualified or modified as to uncertainty, audit scope, or
accounting principles.
During the
fiscal period ended September 30, 2021 and fiscal years ended December 31, 2020 and 2019, and in the subsequent interim period through November 18, 2021, there were no disagreements between the Funds and BBD on any matter of accounting principles or
practices, financial statement disclosure or auditing scope or procedure which, if not resolved to the satisfaction of BBD, would have caused it to make reference to the disagreements in its report on the financial statements. In addition, during
the fiscal period ended September 30, 2021 and the fiscal years ended December 31, 2020 and 2019, and in the subsequent interim period through November 18, 2021, there were no reportable events of the kind described in Item 304(a)(1)(v) of
Regulation S-K under the Securities Exchange Act of 1934, as amended.
The Funds requested and BBD furnished a
letter addressed to the Securities and Exchange Commission stating whether or not BBD agreed with the above statements. A copy of such letter is filed as an Exhibit, under Item 13(a)(4), to Form N-CSR for the period ended March 31, 2022.
On November 18, 2021, the Committee also
approved the appointment of Ernst & Young LLP (“E&Y”), 200 Clarendon Street, Boston, MA 02116, as the Funds’ independent registered public accounting firm for the fiscal year ending September 30, 2022.
During the three most recent fiscal
periods and in the subsequent interim period through November 18, 2021, neither the Funds nor anyone on its behalf consulted EY concerning (i) the application of accounting principles to a specified transaction, either completed or proposed, or the
type of audit opinion that might be rendered on the Trust’s financial statements or (ii) the subject of a disagreement (as defined in paragraph (a)(1)(iv) of item 304 of Regulation S-K) or reportable events (as described in paragraph (a)(1)(v)
of said Item 304).
14.Subsequent Events
Management has evaluated the impact of
all subsequent events on the Funds through the date on which the financial statements were available to be issued and has determined that there were no subsequent events requiring adjustment or disclosure in the financial statements.
| 48
|
Notes to Financial
Statements |
State Street Institutional
Investment Trust
Other Information — March 31, 2022
(Unaudited)
Liquidity Risk Management Program
Pursuant to Rule 22e-4 under the 1940 Act, the Funds have
adopted and implemented a liquidity risk management program (the “Program”). SSGA FM has been designated by the Board to administer the Funds' Program. The Program's principal objectives include assessing, managing and periodically
reviewing each Fund's liquidity risk, based on factors specific to the circumstances of the Fund. Liquidity risk is defined as the risk that a Fund could not meet redemption requests without significant dilution of remaining investors' interests in
the Fund. Over the course of the prior year, SSGA FM provided the Board with reports addressing the operations of the Program and assessing its adequacy and the effectiveness of the Program’s implementation for periods ending June 2021 and
December 2021. As reported to the Board, the Program supported each Fund's ability to honor redemption requests timely and SSGA FM's management of each Fund's liquidity profile, including during periods of market volatility. SSGA FM reported that
the Program operated adequately to meet the requirements of Rule 22e-4 and that the implementation of the Program has been effective.
There can be no assurance that the Program will achieve its
objectives in the future. Please refer to your Fund's prospectus for more information regarding the Fund's exposure to liquidity risk and other principal risks to which an investment in the Fund may be subject.
Proxy Voting Policies and Procedures and Record
The Funds have adopted the proxy voting policies of the
Adviser. A description of the Funds' proxy voting policies and procedures that are used by the Funds' investment Adviser to vote proxies relating to Funds' portfolio of securities are available (i) without charge, upon request, by calling
1-800-242-0134 (toll free) and (ii) on the SEC’s website at www.sec.gov. Information regarding how the Funds voted for the prior 12-months period ended June 30 is available by August 31 of each year by
calling the same number and on the SEC's website, at www.sec.gov, and on the Funds' website at www.ssga.com.
Quarterly Portfolio Schedule
Following the Funds' first and third fiscal quarter-ends,
complete Schedules of Investments are filed with the SEC as exhibits on Form N-PORT, which can be found on the SEC’s website at www.sec.gov and on the Funds' website at
www.ssga.com. The Funds' Schedules of Investments are available upon request, without charge, by calling 1-800-242-0134 (toll free).
State Street Institutional
Investment Trust
Shareholder Services
INSIDE
THE RETIREMENT SAVINGS PLAN
Shares or units held inside the Plan have been credited to your account as a result of contributions and investment earnings. For a statement summarizing your account balance in the Plan, please refer to your GE RSP Retirement Savings
Statement, which is provided quarterly and is available online at any time or upon request. You may obtain additional information and process transactions on investments held inside the Plan by calling:
GE Retirement Savings Plan Service Center: 1-877-55-GERSP (1-877-554-3777)
or visit OneHR.ge.com > Retirement (or RSP) > My GE RSP
OUTSIDE THE RETIREMENT SAVINGS PLAN
If shares of the Funds have been distributed to you from the
Plan, information on these investments may be obtained by calling:
SSGA Funds Management, Inc.:
1-800-242-0134
or visit www.ssga.com
Trustees
Michael F. Holland, Co-Chairperson
Patrick J. Riley, Co-Chairperson
John R. Costantino
Donna M. Rapaccioli
Michael A. Jessee
Richard D. Shirk
Ellen M. Needham
Officers
Ellen M. Needham, President
Brian Harris, Chief Compliance Officer, Anti-Money Laundering Officer and Code of Ethics Compliance Officer
Bruce S. Rosenberg, Treasurer
Ann M. Carpenter, Vice President and Deputy Treasurer
Chad C. Hallett, Deputy Treasurer
Arthur A. Jensen, Deputy Treasurer
Darlene Anderson-Vasquez, Deputy Treasurer
David K. Lancaster, Assistant Treasurer
Sean O'Malley, Chief Legal Officer
David Barr, Secretary
Timothy Collins, Assistant Secretary
David Urman, Assistant Secretary
Investment Adviser and Administrator
SSGA Funds Management, Inc.
One Iron Street
Boston, Massachusetts 02210
Custodian and Sub-Administrator
State Street Bank and Trust Company
One Lincoln Street
Boston, Massachusetts 02111
Distributor
State Street Global Advisors Funds
Distributors, LLC
One Iron
Street
Boston, Massachusetts
02210
Independent Registered Public Accounting Firm
Ernst & Young LLP
200 Clarendon Street
Boston, Massachusetts 02116
Semi-Annual Report
March 31, 2022
State Street Institutional Investment Trust
| State
Street Diversified Income Fund |
The
information contained in this report is intended for the general information of shareholders of the Trust. This report is not authorized for distribution to prospective investors unless preceded or accompanied by a current Trust prospectus which
contains important information concerning the Trust. You may obtain a current prospectus and SAI from the Distributor by calling 1-800-997-7327 or visiting www.ssga.com. Please read the prospectus carefully before you invest.
TABLE OF CONTENTS (Unaudited)
The information contained in this report is intended
for the general information of shareholders of the Trust. This report is not authorized for distribution to prospective investors unless preceded or accompanied by a current Trust prospectus which contains important information concerning the Trust.
You may obtain a current prospectus and SAI from the Distributor by calling 1-800-997-7327 or visiting www.ssga.com. Please read the prospectus carefully before you invest.
State Street
Diversified Income Fund
Portfolio Statistics (Unaudited)
Top Five Holdings as of March 31, 2022
|
|
|
|
| |
Description
|
%
of Net Assets |
|
| |
SPDR
Bloomberg Convertible Securities ETF
|
3.1%
|
|
| |
Federal
National Mortgage Association TBA
2.00% 4/1/2052 |
3.0
|
|
| |
SPDR
Blackstone Senior Loan ETF
|
2.8
|
|
| |
SPDR
Bloomberg Emerging Markets Local Bond ETF
|
2.1
|
|
| |
SPDR
ICE Preferred Securities ETF
|
2.0
|
|
| |
TOTAL
|
13.0%
|
|
(The five largest holdings are subject to
change, and there are no guarantees the Fund will continue to remain invested in any particular company.)
Portfolio Composition as of March 31,
2022
|
|
|
|
| |
|
%
of Net Assets |
|
| |
Corporate
Bonds & Notes |
53.9%
|
|
| |
Foreign
Government Obligations |
20.6
|
|
| |
U.S.
Government Agency Obligations |
15.5
|
|
| |
Mutual
Funds and Exchange Traded Products |
10.0
|
|
| |
Asset-Backed
Securities |
2.8
|
|
| |
Commercial
Mortgage Backed Securities |
1.9
|
|
| |
Short-Term
Investment |
10.7
|
|
| |
Liabilities
in Excess of Other Assets |
(15.4)
|
|
| |
TOTAL
|
100.0%
|
|
(The composition is expressed as a
percentage of net assets as of the date indicated. The composition will vary over time.)
See accompanying notes to financial statements.
1
STATE STREET INSTITUTIONAL
INVESTMENT TRUST
STATE STREET DIVERSIFIED INCOME FUND
SCHEDULE OF INVESTMENTS
March 31, 2022 (Unaudited)
| Security
Description |
|
|
Principal
Amount |
|
Value
|
| CORPORATE
BONDS & NOTES — 53.9% |
|
|
|
|
|
| ADVERTISING
— 0.2% |
|
|
Clear Channel Outdoor Holdings, Inc.
5.13%, 8/15/2027
(a)
|
|
|
$
50,000 |
|
$
49,488 |
| AEROSPACE
& DEFENSE — 1.5% |
|
| Boeing
Co.: |
|
|
|
|
|
|
5.04%,
5/1/2027
|
|
|
75,000
|
|
78,889
|
|
5.71%,
5/1/2040
|
|
|
50,000
|
|
56,006
|
|
Bombardier, Inc.
7.50%, 3/15/2025
(a)
|
|
|
43,000
|
|
43,227
|
|
Howmet Aerospace, Inc.
3.00%,
1/15/2029
|
|
|
50,000
|
|
45,636
|
|
Spirit AeroSystems, Inc.
7.50%, 4/15/2025
(a)
|
|
|
50,000
|
|
51,820
|
|
TransDigm, Inc.
4.63%,
1/15/2029
|
|
|
50,000
|
|
46,781
|
| |
|
|
|
|
322,359
|
| AGRICULTURE
— 0.6% |
|
|
Altria Group, Inc.
3.40%,
2/4/2041
|
|
|
50,000
|
|
40,800
|
|
BAT Capital Corp.
3.73%,
9/25/2040
|
|
|
50,000
|
|
41,036
|
|
BAT International Finance PLC
1.67%,
3/25/2026
|
|
|
50,000
|
|
45,962
|
| |
|
|
|
|
127,798
|
| AIRLINES
— 0.9% |
|
| American
Airlines, Inc./AAdvantage Loyalty IP, Ltd.: |
|
|
|
|
|
|
5.50%, 4/20/2026
(a)
|
|
|
50,000
|
|
49,962
|
|
5.75%, 4/20/2029
(a)
|
|
|
50,000
|
|
49,829
|
|
Delta Air Lines, Inc.
2.90%,
10/28/2024
|
|
|
50,000
|
|
48,909
|
|
United Airlines, Inc.
4.38%, 4/15/2026
(a)
|
|
|
50,000
|
|
49,230
|
| |
|
|
|
|
197,930
|
| AUTO
MANUFACTURERS — 1.4% |
|
|
Ford Motor Co.
3.25%,
2/12/2032
|
|
|
100,000
|
|
89,301
|
|
Ford Motor Credit Co. LLC
2.70%,
8/10/2026
|
|
|
100,000
|
|
93,010
|
| General
Motors Financial Co., Inc.: |
|
|
|
|
|
|
1.25%,
1/8/2026
|
|
|
50,000
|
|
45,685
|
|
2.70%,
6/10/2031
|
|
|
50,000
|
|
44,028
|
|
Jaguar Land Rover Automotive PLC
5.63%, 2/1/2023
(a)
|
|
|
50,000
|
|
49,712
|
| |
|
|
|
|
321,736
|
| AUTO
PARTS & EQUIPMENT — 0.2% |
|
|
Goodyear Tire & Rubber Co.
5.00%, 7/15/2029
(a)
|
|
|
50,000
|
|
46,728
|
| Security
Description |
|
|
Principal
Amount |
|
Value
|
| BANKS
— 3.9% |
|
|
Bank of America Corp.
5 year CMT + 1.20%, 2.48%, 9/21/2036
(b)
|
|
|
$
100,000 |
|
$
86,115 |
|
Barclays PLC
5 year CMT + 2.90%, 3.56%, 9/23/2035
(b)
|
|
|
100,000
|
|
92,003
|
|
Citigroup, Inc.
4.40%,
6/10/2025
|
|
|
100,000
|
|
102,901
|
| Deutsche
Bank AG: |
|
|
|
|
|
|
SOFR + 2.58%, 3.96%, 11/26/2025
(b)
|
|
|
50,000
|
|
49,973
|
|
SOFR + 2.76%, 3.73%, 1/14/2032
(b)
|
|
|
50,000
|
|
44,689
|
|
First-Citizens Bank & Trust Co.
SOFR + 3.83%, 3.93%, 6/19/2024
(b)
|
|
|
50,000
|
|
50,488
|
|
Freedom Mortgage Corp.
6.63%, 1/15/2027
(a)
|
|
|
50,000
|
|
46,384
|
|
Goldman Sachs Group, Inc.
6.75%,
10/1/2037
|
|
|
50,000
|
|
63,161
|
|
HSBC Holdings PLC
6.50%,
9/15/2037
|
|
|
50,000
|
|
61,081
|
|
Intesa Sanpaolo SpA
1 year CMT + 2.60%, 4.20%, 6/1/2032
(a)
(b)
|
|
|
50,000
|
|
44,251
|
|
Morgan Stanley
SOFR + 1.36%, 2.48%, 9/16/2036
(b)
|
|
|
50,000
|
|
42,925
|
| Natwest
Group PLC: |
|
|
|
|
|
|
3.88%,
9/12/2023
|
|
|
50,000
|
|
50,496
|
|
5 year CMT + 2.35%, 3.03%, 11/28/2035
(b)
|
|
|
50,000
|
|
44,413
|
|
UniCredit SpA
5 year CMT + 4.75%, 5.46%, 6/30/2035
(a)
(b)
|
|
|
50,000
|
|
47,840
|
|
Westpac Banking Corp.
5 year CMT + 1.35%, 2.89%, 2/4/2030
(b)
|
|
|
50,000
|
|
48,256
|
| |
|
|
|
|
874,976
|
| BEVERAGES
— 0.7% |
|
|
Anheuser-Busch Cos. LLC/Anheuser-Busch InBev Worldwide, Inc.
4.70%,
2/1/2036
|
|
|
100,000
|
|
108,686
|
|
Constellation Brands, Inc.
2.25%,
8/1/2031
|
|
|
50,000
|
|
44,123
|
| |
|
|
|
|
152,809
|
| BIOTECHNOLOGY
— 0.2% |
|
|
Amgen, Inc.
1.65%,
8/15/2028
|
|
|
50,000
|
|
45,635
|
| BUILDING
MATERIALS — 0.4% |
|
|
Carrier Global Corp.
2.72%,
2/15/2030
|
|
|
50,000
|
|
46,997
|
See accompanying notes to financial statements.
2
STATE STREET INSTITUTIONAL
INVESTMENT TRUST
STATE STREET DIVERSIFIED INCOME FUND
SCHEDULE OF
INVESTMENTS (continued)
March 31, 2022 (Unaudited)
| Security
Description |
|
|
Principal
Amount |
|
Value
|
|
Standard Industries, Inc.
3.38%, 1/15/2031
(a)
|
|
|
$
50,000 |
|
$
43,908 |
| |
|
|
|
|
90,905
|
| CHEMICALS
— 1.3% |
|
|
Chemours Co.
4.63%, 11/15/2029
(a)
|
|
|
50,000
|
|
45,867
|
|
Dow Chemical Co.
3.60%,
11/15/2050
|
|
|
50,000
|
|
46,542
|
|
DuPont de Nemours, Inc.
5.32%,
11/15/2038
|
|
|
50,000
|
|
57,608
|
|
LYB International Finance III LLC
3.63%,
4/1/2051
|
|
|
50,000
|
|
45,083
|
|
Methanex Corp.
5.13%,
10/15/2027
|
|
|
50,000
|
|
50,257
|
|
WR Grace Holdings LLC
4.88%, 6/15/2027
(a)
|
|
|
50,000
|
|
48,905
|
| |
|
|
|
|
294,262
|
| COMMERCIAL
SERVICES — 1.9% |
|
|
ADT Security Corp.
4.13%, 8/1/2029
(a)
|
|
|
50,000
|
|
46,446
|
|
Allied Universal Holdco LLC/Allied Universal Finance Corp./Atlas Luxco 4 S.a.r.l
4.63%, 6/1/2028
(a)
|
|
|
50,000
|
|
47,221
|
|
Block, Inc.
2.75%, 6/1/2026
(a)
|
|
|
50,000
|
|
47,282
|
|
Gartner, Inc.
3.63%, 6/15/2029
(a)
|
|
|
50,000
|
|
47,323
|
|
MPH Acquisition Holdings LLC
5.50%, 9/1/2028
(a)
|
|
|
50,000
|
|
47,962
|
|
Nielsen Finance LLC/Nielsen Finance Co.
4.50%, 7/15/2029
(a)
|
|
|
50,000
|
|
49,857
|
|
Prime Security Services Borrower LLC/Prime Finance, Inc.
3.38%, 8/31/2027
(a)
|
|
|
50,000
|
|
45,849
|
|
Service Corp. International
3.38%,
8/15/2030
|
|
|
50,000
|
|
45,167
|
|
United Rentals North America, Inc.
3.75%,
1/15/2032
|
|
|
50,000
|
|
46,634
|
| |
|
|
|
|
423,741
|
| COMPUTERS
— 0.7% |
|
|
Dell International LLC/EMC Corp.
5.30%,
10/1/2029
|
|
|
50,000
|
|
54,463
|
|
NCR Corp.
5.13%, 4/15/2029
(a)
|
|
|
50,000
|
|
48,087
|
|
Seagate HDD Cayman
3.13%,
7/15/2029
|
|
|
50,000
|
|
44,884
|
| |
|
|
|
|
147,434
|
| COSMETICS/PERSONAL
CARE — 0.2% |
|
|
Coty, Inc.
5.00%, 4/15/2026
(a)
|
|
|
50,000
|
|
48,701
|
| Security
Description |
|
|
Principal
Amount |
|
Value
|
| DIVERSIFIED
FINANCIAL SERVICES — 1.9% |
|
|
AerCap Ireland Capital DAC/AerCap Global Aviation Trust
1.65%,
10/29/2024
|
|
|
$
50,000 |
|
$
47,236 |
|
Air Lease Corp.
1.88%,
8/15/2026
|
|
|
50,000
|
|
46,126
|
|
Capital One Financial Corp.
SOFR + 0.86%, 1.88%, 11/2/2027
(b)
|
|
|
50,000
|
|
46,309
|
|
Nationstar Mortgage Holdings, Inc.
5.75%, 11/15/2031
(a)
|
|
|
50,000
|
|
47,689
|
|
Navient Corp.
5.50%,
3/15/2029
|
|
|
50,000
|
|
46,727
|
|
NFP Corp.
4.88%, 8/15/2028
(a)
|
|
|
50,000
|
|
47,911
|
|
Nomura Holdings, Inc.
2.61%,
7/14/2031
|
|
|
50,000
|
|
44,905
|
|
OneMain Finance Corp.
3.50%,
1/15/2027
|
|
|
50,000
|
|
46,300
|
|
Rocket Mortgage LLC/Rocket Mortgage Co-Issuer, Inc.
2.88%, 10/15/2026
(a)
|
|
|
50,000
|
|
45,980
|
| |
|
|
|
|
419,183
|
| ELECTRIC
— 1.6% |
|
|
Calpine Corp.
5.13%, 3/15/2028
(a)
|
|
|
50,000
|
|
47,698
|
|
Dominion Energy, Inc.
Series C, 2.25%,
8/15/2031
|
|
|
50,000
|
|
45,073
|
|
Duke Energy Corp.
2.55%,
6/15/2031
|
|
|
50,000
|
|
45,845
|
|
FirstEnergy Corp.
Series B, 4.40%,
7/15/2027
|
|
|
75,000
|
|
75,497
|
|
NRG Energy, Inc.
3.88%, 2/15/2032
(a)
|
|
|
50,000
|
|
44,164
|
|
Pacific Gas & Electric Co.
2.50%,
2/1/2031
|
|
|
50,000
|
|
43,022
|
|
Vistra Operations Co. LLC
4.38%, 5/1/2029
(a)
|
|
|
50,000
|
|
47,243
|
| |
|
|
|
|
348,542
|
| ELECTRICAL
COMPONENTS & EQUIPMENT — 0.2% |
|
|
WESCO Distribution, Inc.
7.13%, 6/15/2025
(a)
|
|
|
50,000
|
|
51,995
|
| ELECTRONICS
— 0.2% |
|
|
Sensata Technologies, Inc.
3.75%, 2/15/2031
(a)
|
|
|
50,000
|
|
46,319
|
| ENTERTAINMENT
— 0.5% |
|
|
Caesars Entertainment, Inc.
6.25%, 7/1/2025
(a)
|
|
|
50,000
|
|
51,679
|
|
Live Nation Entertainment, Inc.
3.75%, 1/15/2028
(a)
|
|
|
50,000
|
|
47,092
|
| |
|
|
|
|
98,771
|
See accompanying notes to financial statements.
3
STATE STREET INSTITUTIONAL
INVESTMENT TRUST
STATE STREET DIVERSIFIED INCOME FUND
SCHEDULE OF
INVESTMENTS (continued)
March 31, 2022 (Unaudited)
| Security
Description |
|
|
Principal
Amount |
|
Value
|
| ENVIRONMENTAL
CONTROL — 0.2% |
|
|
GFL Environmental, Inc.
4.00%, 8/1/2028
(a)
|
|
|
$
50,000 |
|
$
45,984 |
| FOOD
— 1.1% |
|
|
Albertsons Cos., Inc./Safeway, Inc./New Albertsons L.P./Albertsons LLC
3.50%, 3/15/2029
(a)
|
|
|
50,000
|
|
45,136
|
|
Lamb Weston Holdings, Inc.
4.13%, 1/31/2030
(a)
|
|
|
50,000
|
|
46,698
|
|
Performance Food Group, Inc.
4.25%, 8/1/2029
(a)
|
|
|
50,000
|
|
45,529
|
|
Post Holdings, Inc.
4.50%, 9/15/2031
(a)
|
|
|
50,000
|
|
44,315
|
|
US Foods, Inc.
6.25%, 4/15/2025
(a)
|
|
|
50,000
|
|
51,460
|
| |
|
|
|
|
233,138
|
| FOOD
SERVICE — 0.2% |
|
|
Aramark Services, Inc.
5.00%, 2/1/2028
(a)
|
|
|
50,000
|
|
48,497
|
| FOREST
PRODUCTS & PAPER — 0.2% |
|
|
Suzano Austria GmbH
Series DM3N, 3.13%,
1/15/2032
|
|
|
50,000
|
|
44,588
|
| GAS
— 0.2% |
|
|
Southern Co. Gas Capital Corp.
Series 20-A, 1.75%,
1/15/2031
|
|
|
50,000
|
|
42,909
|
| HEALTH
CARE PRODUCTS — 0.4% |
|
|
Avantor Funding, Inc.
3.88%, 11/1/2029
(a)
|
|
|
50,000
|
|
47,274
|
|
Mozart Debt Merger Sub, Inc.
3.88%, 4/1/2029
(a)
|
|
|
50,000
|
|
46,248
|
| |
|
|
|
|
93,522
|
| HEALTH
CARE SERVICES — 2.1% |
|
|
Centene Corp.
2.50%,
3/1/2031
|
|
|
75,000
|
|
66,412
|
|
CHS/Community Health Systems, Inc.
4.75%, 2/15/2031
(a)
|
|
|
75,000
|
|
70,875
|
|
DaVita, Inc.
3.75%, 2/15/2031
(a)
|
|
|
50,000
|
|
43,858
|
|
Encompass Health Corp.
4.63%,
4/1/2031
|
|
|
50,000
|
|
46,904
|
|
HCA, Inc.
2.38%,
7/15/2031
|
|
|
50,000
|
|
44,651
|
|
IQVIA, Inc.
5.00%, 5/15/2027
(a)
|
|
|
50,000
|
|
50,581
|
|
Legacy LifePoint Health LLC
6.75%, 4/15/2025
(a)
|
|
|
50,000
|
|
51,682
|
| Tenet
Healthcare Corp.: |
|
|
|
|
|
|
4.38%, 1/15/2030
(a)
|
|
|
50,000
|
|
48,038
|
|
6.25%, 2/1/2027
(a)
|
|
|
50,000
|
|
51,353
|
| |
|
|
|
|
474,354
|
| Security
Description |
|
|
Principal
Amount |
|
Value
|
| HOUSEWARES
— 0.2% |
|
|
Newell Brands, Inc.
4.45%,
4/1/2026
|
|
|
$
50,000 |
|
$
50,313 |
| INSURANCE
— 0.7% |
|
|
Acrisure LLC/Acrisure Finance, Inc.
4.25%, 2/15/2029
(a)
|
|
|
50,000
|
|
45,450
|
|
American International Group, Inc.
3.88%,
1/15/2035
|
|
|
50,000
|
|
50,895
|
|
HUB International, Ltd.
5.63%, 12/1/2029
(a)
|
|
|
50,000
|
|
48,735
|
| |
|
|
|
|
145,080
|
| INTERNET
— 0.2% |
|
|
Uber Technologies, Inc.
7.50%, 9/15/2027
(a)
|
|
|
50,000
|
|
53,352
|
| INVESTMENT
COMPANY SECURITY — 0.4% |
|
|
Blackstone Secured Lending Fund
2.85%, 9/30/2028
(a)
|
|
|
50,000
|
|
43,388
|
|
Icahn Enterprises L.P./Icahn Enterprises Finance Corp.
4.75%,
9/15/2024
|
|
|
50,000
|
|
50,250
|
| |
|
|
|
|
93,638
|
| IRON/STEEL
— 0.5% |
|
|
Cleveland-Cliffs, Inc.
6.75%, 3/15/2026
(a)
|
|
|
50,000
|
|
52,665
|
|
Vale Overseas, Ltd.
3.75%,
7/8/2030
|
|
|
50,000
|
|
48,207
|
| |
|
|
|
|
100,872
|
| LEISURE
TIME — 1.0% |
|
|
Carnival Corp.
5.75%, 3/1/2027
(a)
|
|
|
75,000
|
|
71,488
|
|
NCL Corp., Ltd.
3.63%, 12/15/2024
(a)
|
|
|
50,000
|
|
47,122
|
|
Royal Caribbean Cruises, Ltd.
4.25%, 7/1/2026
(a)
|
|
|
50,000
|
|
46,548
|
|
Viking Cruises, Ltd.
6.25%, 5/15/2025
(a)
|
|
|
50,000
|
|
46,934
|
| |
|
|
|
|
212,092
|
| LODGING
— 1.2% |
|
|
Hilton Domestic Operating Co., Inc.
3.63%, 2/15/2032
(a)
|
|
|
50,000
|
|
45,209
|
|
Melco Resorts Finance, Ltd.
Series REGS, 4.88%,
6/6/2025
|
|
|
50,000
|
|
45,981
|
|
MGM China Holdings, Ltd.
5.38%, 5/15/2024
(a)
|
|
|
50,000
|
|
46,987
|
|
MGM Resorts International
4.75%,
10/15/2028
|
|
|
50,000
|
|
48,338
|
|
Travel + Leisure Co.
4.50%, 12/1/2029
(a)
|
|
|
50,000
|
|
46,444
|
See accompanying notes to financial statements.
4
STATE STREET INSTITUTIONAL
INVESTMENT TRUST
STATE STREET DIVERSIFIED INCOME FUND
SCHEDULE OF
INVESTMENTS (continued)
March 31, 2022 (Unaudited)
| Security
Description |
|
|
Principal
Amount |
|
Value
|
|
Wynn Macau, Ltd.
5.13%, 12/15/2029
(a)
|
|
|
$
50,000 |
|
$
42,390 |
| |
|
|
|
|
275,349
|
| MEDIA
— 3.3% |
|
|
CCO Holdings LLC/CCO Holdings Capital Corp.
4.25%, 1/15/2034
(a)
|
|
|
100,000
|
|
86,714
|
| Charter
Communications Operating LLC/Charter Communications Operating Capital: |
|
|
|
|
|
|
3.50%,
3/1/2042
|
|
|
50,000
|
|
41,540
|
|
3.85%,
4/1/2061
|
|
|
50,000
|
|
40,153
|
| CSC
Holdings LLC: |
|
|
|
|
|
|
3.38%, 2/15/2031
(a)
|
|
|
50,000
|
|
42,134
|
|
5.75%, 1/15/2030
(a)
|
|
|
50,000
|
|
44,535
|
|
Directv Financing LLC/Directv Financing Co-Obligor, Inc.
5.88%, 8/15/2027
(a)
|
|
|
50,000
|
|
49,291
|
| DISH
DBS Corp.: |
|
|
|
|
|
|
5.75%, 12/1/2028
(a)
|
|
|
50,000
|
|
47,468
|
|
5.88%,
11/15/2024
|
|
|
50,000
|
|
49,958
|
|
Gray Television, Inc.
4.75%, 10/15/2030
(a)
|
|
|
50,000
|
|
46,439
|
|
iHeartCommunications, Inc.
4.75%, 1/15/2028
(a)
|
|
|
50,000
|
|
47,857
|
|
Paramount Global
4.95%,
1/15/2031
|
|
|
50,000
|
|
53,149
|
|
Sirius XM Radio, Inc.
3.13%, 9/1/2026
(a)
|
|
|
50,000
|
|
47,291
|
|
Univision Communications, Inc.
5.13%, 2/15/2025
(a)
|
|
|
50,000
|
|
50,028
|
|
Virgin Media Finance PLC
5.00%, 7/15/2030
(a)
|
|
|
50,000
|
|
47,260
|
|
Ziggo B.V.
4.88%, 1/15/2030
(a)
|
|
|
50,000
|
|
47,068
|
| |
|
|
|
|
740,885
|
| MINING
— 1.3% |
|
|
Corp. Nacional del Cobre de Chile
3.70%, 1/30/2050
(a)
|
|
|
100,000
|
|
90,061
|
|
FMG Resources August 2006 Pty, Ltd.
4.38%, 4/1/2031
(a)
|
|
|
50,000
|
|
47,240
|
|
Freeport-McMoRan, Inc.
5.00%,
9/1/2027
|
|
|
50,000
|
|
51,439
|
|
Novelis Corp.
3.88%, 8/15/2031
(a)
|
|
|
50,000
|
|
45,722
|
|
Southern Copper Corp.
5.88%,
4/23/2045
|
|
|
50,000
|
|
61,421
|
| |
|
|
|
|
295,883
|
| MISCELLANEOUS
MANUFACTURER — 0.2% |
|
|
GE Capital International Funding Co. Unlimited Co.
4.42%,
11/15/2035
|
|
|
50,000
|
|
53,912
|
| Security
Description |
|
|
Principal
Amount |
|
Value
|
| OIL
& GAS — 2.7% |
|
|
KazMunayGas National Co. JSC
3.50%,
4/14/2033
|
|
|
$
200,000 |
|
$
166,162 |
|
Murphy Oil Corp.
6.38%,
12/1/2042
|
|
|
50,000
|
|
47,648
|
|
Occidental Petroleum Corp.
3.00%,
2/15/2027
|
|
|
50,000
|
|
48,852
|
|
Parkland Corp.
4.50%, 10/1/2029
(a)
|
|
|
50,000
|
|
46,362
|
| Petroleos
Mexicanos: |
|
|
|
|
|
|
6.50%,
3/13/2027
|
|
|
100,000
|
|
101,521
|
|
6.75%,
9/21/2047
|
|
|
50,000
|
|
40,660
|
|
Range Resources Corp.
4.88%,
5/15/2025
|
|
|
50,000
|
|
50,649
|
|
Southwestern Energy Co.
5.38%,
3/15/2030
|
|
|
50,000
|
|
50,825
|
|
Sunoco L.P./Sunoco Finance Corp.
4.50%,
5/15/2029
|
|
|
50,000
|
|
47,165
|
| |
|
|
|
|
599,844
|
| PACKAGING
& CONTAINERS — 1.3% |
|
|
Ardagh Packaging Finance PLC/Ardagh Holdings USA, Inc.
5.25%, 8/15/2027
(a)
|
|
|
50,000
|
|
46,323
|
|
Ball Corp.
2.88%,
8/15/2030
|
|
|
50,000
|
|
44,847
|
|
Graphic Packaging International LLC
3.75%, 2/1/2030
(a)
|
|
|
50,000
|
|
45,817
|
|
LABL, Inc.
6.75%, 7/15/2026
(a)
|
|
|
50,000
|
|
49,424
|
|
Mauser Packaging Solutions Holding Co.
5.50%, 4/15/2024
(a)
|
|
|
50,000
|
|
49,828
|
|
OI European Group B.V.
4.75%, 2/15/2030
(a)
|
|
|
50,000
|
|
46,187
|
| |
|
|
|
|
282,426
|
| PHARMACEUTICALS
— 2.7% |
|
|
AbbVie, Inc.
4.55%,
3/15/2035
|
|
|
100,000
|
|
107,770
|
|
Bausch Health Cos., Inc.
7.00%, 1/15/2028
(a)
|
|
|
100,000
|
|
89,602
|
|
CVS Health Corp.
4.78%,
3/25/2038
|
|
|
75,000
|
|
81,874
|
|
EMBECTA Corp.
6.75%, 2/15/2030
(a)
|
|
|
100,000
|
|
100,190
|
|
Endo Dac/Endo Finance LLC/Endo Finco, Inc.
5.88%, 10/15/2024
(a)
|
|
|
50,000
|
|
47,168
|
|
Organon & Co./Organon Foreign Debt Co-Issuer BV
4.13%, 4/30/2028
(a)
|
|
|
50,000
|
|
47,640
|
|
Perrigo Finance Unlimited Co.
3.90%,
6/15/2030
|
|
|
50,000
|
|
47,002
|
See accompanying notes to financial statements.
5
STATE STREET INSTITUTIONAL
INVESTMENT TRUST
STATE STREET DIVERSIFIED INCOME FUND
SCHEDULE OF
INVESTMENTS (continued)
March 31, 2022 (Unaudited)
| Security
Description |
|
|
Principal
Amount |
|
Value
|
|
Takeda Pharmaceutical Co., Ltd.
2.05%,
3/31/2030
|
|
|
$
50,000 |
|
$
45,043 |
|
Viatris, Inc.
2.70%,
6/22/2030
|
|
|
50,000
|
|
44,106
|
| |
|
|
|
|
610,395
|
| PIPELINES
— 4.7% |
|
|
Buckeye Partners L.P.
4.50%, 3/1/2028
(a)
|
|
|
50,000
|
|
47,939
|
|
Cheniere Energy Partners L.P.
3.25%, 1/31/2032
(a)
|
|
|
50,000
|
|
45,538
|
|
DCP Midstream Operating L.P.
5.38%,
7/15/2025
|
|
|
50,000
|
|
51,613
|
|
Enbridge, Inc.
2.50%,
8/1/2033
|
|
|
50,000
|
|
44,433
|
| Energy
Transfer L.P.: |
|
|
|
|
|
|
4.25%,
3/15/2023
|
|
|
50,000
|
|
50,547
|
|
5.00%,
5/15/2050
|
|
|
50,000
|
|
50,697
|
|
EnLink Midstream Partners L.P.
4.40%,
4/1/2024
|
|
|
50,000
|
|
50,685
|
|
Enterprise Products Operating LLC
3.20%,
2/15/2052
|
|
|
50,000
|
|
42,485
|
|
EQM Midstream Partners L.P.
4.75%, 1/15/2031
(a)
|
|
|
50,000
|
|
46,882
|
|
Genesis Energy L.P./Genesis Energy Finance Corp.
6.25%,
5/15/2026
|
|
|
50,000
|
|
48,383
|
|
Hess Midstream Operations L.P.
4.25%, 2/15/2030
(a)
|
|
|
50,000
|
|
47,178
|
| Kinder
Morgan, Inc.: |
|
|
|
|
|
|
1.75%,
11/15/2026
|
|
|
50,000
|
|
46,480
|
|
3.60%,
2/15/2051
|
|
|
50,000
|
|
44,287
|
|
MPLX L.P.
1.75%,
3/1/2026
|
|
|
50,000
|
|
46,923
|
|
New Fortress Energy, Inc.
6.75%, 9/15/2025
(a)
|
|
|
50,000
|
|
50,333
|
|
NGL Energy Operating LLC/NGL Energy Finance Corp.
7.50%, 2/1/2026
(a)
|
|
|
50,000
|
|
49,129
|
|
ONEOK, Inc.
5.20%,
7/15/2048
|
|
|
50,000
|
|
53,441
|
|
Tallgrass Energy Partners L.P./Tallgrass Energy Finance Corp.
6.00%, 12/31/2030
(a)
|
|
|
50,000
|
|
48,516
|
|
TransCanada PipeLines, Ltd.
2.50%,
10/12/2031
|
|
|
50,000
|
|
45,419
|
|
Venture Global Calcasieu Pass LLC
3.88%, 8/15/2029
(a)
|
|
|
50,000
|
|
48,632
|
|
Western Midstream Operating L.P.
3.60%,
2/1/2025
|
|
|
50,000
|
|
49,659
|
|
Williams Cos., Inc.
2.60%,
3/15/2031
|
|
|
50,000
|
|
45,997
|
| |
|
|
|
|
1,055,196
|
| Security
Description |
|
|
Principal
Amount |
|
Value
|
| REAL
ESTATE — 0.2% |
|
|
Realogy Group LLC/Realogy Co-Issuer Corp.
5.75%, 1/15/2029
(a)
|
|
|
$
50,000 |
|
$
47,105 |
| REAL
ESTATE INVESTMENT TRUSTS — 2.1% |
|
|
American Tower Corp.
3.38%,
10/15/2026
|
|
|
50,000
|
|
49,540
|
|
Boston Properties L.P.
2.45%,
10/1/2033
|
|
|
50,000
|
|
43,564
|
|
Crown Castle International Corp.
2.10%,
4/1/2031
|
|
|
50,000
|
|
43,312
|
|
Diversified Healthcare Trust
4.38%,
3/1/2031
|
|
|
50,000
|
|
42,858
|
|
Equinix, Inc.
2.15%,
7/15/2030
|
|
|
50,000
|
|
43,904
|
|
Iron Mountain, Inc.
REIT, 4.50%, 2/15/2031
(a)
|
|
|
50,000
|
|
46,127
|
|
Kimco Realty Corp.
3.70%,
10/1/2049
|
|
|
50,000
|
|
46,453
|
|
Omega Healthcare Investors, Inc.
3.25%,
4/15/2033
|
|
|
50,000
|
|
43,620
|
|
Service Properties Trust
4.35%,
10/1/2024
|
|
|
50,000
|
|
48,329
|
|
Uniti Group L.P./Uniti Fiber Holdings, Inc./CSL Capital LLC
7.88%, 2/15/2025
(a)
|
|
|
50,000
|
|
51,972
|
| |
|
|
|
|
459,679
|
| RETAIL
— 1.9% |
|
|
1011778 BC ULC/New Red Finance, Inc.
4.00%, 10/15/2030
(a)
|
|
|
50,000
|
|
45,079
|
|
Carvana Co.
4.88%, 9/1/2029
(a)
|
|
|
50,000
|
|
41,303
|
|
Lowe's Cos., Inc.
1.70%,
10/15/2030
|
|
|
50,000
|
|
43,680
|
|
McDonald's Corp.
Series MTN, 4.88%,
12/9/2045
|
|
|
50,000
|
|
55,907
|
|
Nordstrom, Inc.
2.30%,
4/8/2024
|
|
|
50,000
|
|
48,790
|
|
PetSmart, Inc./PetSmart Finance Corp.
4.75%, 2/15/2028
(a)
|
|
|
50,000
|
|
48,344
|
|
QVC, Inc.
4.38%,
9/1/2028
|
|
|
50,000
|
|
45,622
|
|
Staples, Inc.
7.50%, 4/15/2026
(a)
|
|
|
50,000
|
|
48,530
|
|
Yum! Brands, Inc.
3.63%,
3/15/2031
|
|
|
50,000
|
|
45,619
|
| |
|
|
|
|
422,874
|
| SEMICONDUCTORS
— 0.4% |
|
|
Broadcom Corp./Broadcom Cayman Finance, Ltd.
3.88%,
1/15/2027
|
|
|
50,000
|
|
50,337
|
See accompanying notes to financial statements.
6
STATE STREET INSTITUTIONAL
INVESTMENT TRUST
STATE STREET DIVERSIFIED INCOME FUND
SCHEDULE OF
INVESTMENTS (continued)
March 31, 2022 (Unaudited)
| Security
Description |
|
|
Principal
Amount |
|
Value
|
|
Broadcom, Inc.
3.19%, 11/15/2036
(a)
|
|
|
$
50,000 |
|
$
43,937 |
| |
|
|
|
|
94,274
|
| SOFTWARE
— 1.2% |
|
|
Clarivate Science Holdings Corp.
3.88%, 7/1/2028
(a)
|
|
|
50,000
|
|
47,596
|
|
Fiserv, Inc.
3.50%,
7/1/2029
|
|
|
50,000
|
|
49,203
|
|
Open Text Corp.
3.88%, 2/15/2028
(a)
|
|
|
50,000
|
|
47,893
|
| Oracle
Corp.: |
|
|
|
|
|
|
3.80%,
11/15/2037
|
|
|
50,000
|
|
45,281
|
|
3.85%,
4/1/2060
|
|
|
50,000
|
|
40,999
|
|
VMware, Inc.
2.20%,
8/15/2031
|
|
|
50,000
|
|
43,977
|
| |
|
|
|
|
274,949
|
| TELECOMMUNICATIONS
— 4.2% |
|
|
Altice France SA
5.50%, 1/15/2028
(a)
|
|
|
50,000
|
|
46,267
|
| AT&T,
Inc.: |
|
|
|
|
|
|
2.55%,
12/1/2033
|
|
|
100,000
|
|
88,956
|
|
3.55%,
9/15/2055
|
|
|
100,000
|
|
87,722
|
|
CommScope Technologies LLC
6.00%, 6/15/2025
(a)
|
|
|
50,000
|
|
47,339
|
|
Frontier Communications Holdings LLC
5.00%, 5/1/2028
(a)
|
|
|
50,000
|
|
48,117
|
|
Level 3 Financing, Inc.
4.25%, 7/1/2028
(a)
|
|
|
50,000
|
|
45,910
|
|
Lumen Technologies, Inc.
5.38%, 6/15/2029
(a)
|
|
|
50,000
|
|
44,553
|
|
Sprint Corp.
7.88%,
9/15/2023
|
|
|
75,000
|
|
79,730
|
|
Telecom Italia SpA
5.30%, 5/30/2024
(a)
|
|
|
50,000
|
|
50,396
|
| T-Mobile
USA, Inc.: |
|
|
|
|
|
|
2.25%, 2/15/2026
(a)
|
|
|
50,000
|
|
47,257
|
|
2.55%,
2/15/2031
|
|
|
100,000
|
|
90,684
|
|
VEON Holdings B.V.
3.38%, 11/25/2027
(a)
|
|
|
50,000
|
|
28,808
|
| Verizon
Communications, Inc.: |
|
|
|
|
|
|
2.65%,
11/20/2040
|
|
|
100,000
|
|
85,040
|
|
3.00%,
11/20/2060
|
|
|
50,000
|
|
40,989
|
| Vodafone
Group PLC: |
|
|
|
|
|
|
4.38%,
5/30/2028
|
|
|
50,000
|
|
52,415
|
|
5 year CMT + 2.77%, 4.13%, 6/4/2081
(b)
|
|
|
50,000
|
|
45,594
|
| |
|
|
|
|
929,777
|
| TRANSPORTATION
— 0.2% |
|
|
FedEx Corp.
3.25%,
5/15/2041
|
|
|
50,000
|
|
44,868
|
| Security
Description |
|
|
Principal
Amount |
|
Value
|
| TRUCKING
& LEASING — 0.2% |
|
|
Fortress Transportation and Infrastructure Investors LLC
5.50%, 5/1/2028
(a)
|
|
|
$
50,000 |
|
$
45,515 |
| WATER
— 0.2% |
|
|
American Water Capital Corp.
3.25%,
6/1/2051
|
|
|
50,000
|
|
45,616
|
|
TOTAL CORPORATE BONDS & NOTES
(Cost
$12,999,214)
|
|
|
|
|
12,026,198
|
| ASSET-BACKED
SECURITIES — 2.8% |
|
|
|
|
|
| AUTOMOBILE
— 2.1% |
|
|
|
|
|
|
Carmax Auto Owner Trust 2019-3
Series 2019-3, Class B, 2.50%,
4/15/2025
|
|
|
200,000
|
|
199,412
|
|
Foursight Capital Automobile Receivables Trust 2021-1
Series 2021-1, Class C, 1.02%, 9/15/2026
(a)
|
|
|
160,000
|
|
152,140
|
|
OneMain Direct Auto Receivables Trust 2018-1
Series 2018-1A, Class D, 4.40%, 1/14/2028
(a)
|
|
|
132,000
|
|
132,089
|
| |
|
|
|
|
483,641
|
| CREDIT
CARD — 0.7% |
|
|
|
|
|
|
Citibank Credit Card Issuance Trust
Series 2017-A6, Class A6, 1 month USD LIBOR + 0.77%, 1.16%, 5/14/2029
(b)
|
|
|
150,000
|
|
149,442
|
|
TOTAL ASSET-BACKED SECURITIES
(Cost
$647,054)
|
|
|
|
|
633,083
|
| FOREIGN
GOVERNMENT OBLIGATIONS — 20.6% |
|
|
|
|
|
| ANGOLA
— 0.4% |
|
|
|
|
|
|
Angolan Government International Bond
Series 144A, 8.00%, 11/26/2029
(a)
|
|
|
100,000
|
|
100,438
|
| ARGENTINA
— 0.3% |
|
|
|
|
|
|
Argentine Republic Government International Bond
1.13%, 7/9/2035
(c)
|
|
|
200,000
|
|
61,318
|
| BAHRAIN
— 0.8% |
|
|
|
|
|
|
Bahrain Government International Bond
Series 144A, 5.63%, 5/18/2034
(a)
|
|
|
200,000
|
|
188,678
|
See accompanying notes to financial statements.
7
STATE STREET INSTITUTIONAL
INVESTMENT TRUST
STATE STREET DIVERSIFIED INCOME FUND
SCHEDULE OF
INVESTMENTS (continued)
March 31, 2022 (Unaudited)
| Security
Description |
|
|
Principal
Amount |
|
Value
|
| BOLIVIA
— 0.2% |
|
|
|
|
|
|
Bolivian Government International Bond
Series REGS, 4.50%,
3/20/2028
|
|
|
$
50,000 |
|
$
43,537 |
| BRAZIL
— 1.0% |
|
|
|
|
|
| Brazilian
Government International Bond: |
|
|
|
|
|
|
3.75%,
09/12/2031
|
|
|
200,000
|
|
180,732
|
|
4.75%,
01/14/2050
|
|
|
50,000
|
|
41,900
|
| |
|
|
|
|
222,632
|
| CHILE
— 0.4% |
|
|
|
|
|
|
Chile Government International Bond
2.55%,
7/27/2033
|
|
|
100,000
|
|
91,188
|
| COLOMBIA
— 0.8% |
|
|
|
|
|
|
Colombia Government International Bond
3.25%,
4/22/2032
|
|
|
200,000
|
|
167,640
|
| COSTA
RICA — 0.5% |
|
|
|
|
|
|
Costa Rica Government International Bond
Series REGS, 6.13%,
2/19/2031
|
|
|
100,000
|
|
101,547
|
| DOMINICAN
REPUBLIC — 0.6% |
|
|
|
|
|
|
Dominican Republic International Bond
Series REGS, 5.30%,
1/21/2041
|
|
|
150,000
|
|
130,828
|
| ECUADOR
— 0.4% |
|
|
|
|
|
|
Ecuador Government International Bond
Series REGS, 1.00%, 7/31/2035
(c)
|
|
|
150,000
|
|
98,176
|
| EGYPT
— 0.8% |
|
|
|
|
|
|
Egypt Government International Bond
Series 144A, 5.88%, 2/16/2031
(a)
|
|
|
200,000
|
|
167,708
|
| EL
SALVADOR — 0.1% |
|
|
|
|
|
|
El Salvador Government International Bond
Series REGS, 5.88%,
1/30/2025
|
|
|
50,000
|
|
27,874
|
| GHANA
— 0.6% |
|
|
|
|
|
|
Ghana Government International Bond
Series REGS, Zero Coupon,
4/7/2025
|
|
|
200,000
|
|
130,270
|
| GUATEMALA
— 0.2% |
|
|
|
|
|
|
Guatemala Government Bond
Series 144A, 3.70%, 10/7/2033
(a)
|
|
|
50,000
|
|
46,267
|
| Security
Description |
|
|
Principal
Amount |
|
Value
|
| HUNGARY
— 0.3% |
|
|
|
|
|
|
Hungary Government International Bond
7.63%,
3/29/2041
|
|
|
$
50,000 |
|
$
72,771 |
| INDIA
— 0.4% |
|
|
|
|
|
|
Export-Import Bank of India
Series REGS, 2.25%,
1/13/2031
|
|
|
100,000
|
|
86,162
|
| INDONESIA
— 0.8% |
|
|
|
|
|
|
Indonesia Government International Bond
1.85%,
3/12/2031
|
|
|
200,000
|
|
180,742
|
| JAMAICA
— 0.2% |
|
|
|
|
|
|
Jamaica Government International Bond
6.75%,
4/28/2028
|
|
|
50,000
|
|
54,964
|
| JORDAN
— 0.4% |
|
|
|
|
|
|
Jordan Government International Bond
Series 144A, 5.85%, 7/7/2030
(a)
|
|
|
100,000
|
|
93,504
|
| KENYA
— 0.4% |
|
|
|
|
|
|
Republic of Kenya Government International Bond
Series 144A, 6.30%, 1/23/2034
(a)
|
|
|
100,000
|
|
86,057
|
| LEBANON
— 0.1% |
|
|
|
|
|
|
Lebanon Government International Bond
Series EMTN, 6.10%, 10/4/2022
(d)
|
|
|
100,000
|
|
11,805
|
| MEXICO
— 0.7% |
|
|
|
|
|
| Mexico
Government International Bond: |
|
|
|
|
|
|
3.50%,
02/12/2034
|
|
|
50,000
|
|
46,540
|
|
5.00%,
04/27/2051
|
|
|
100,000
|
|
101,369
|
| |
|
|
|
|
147,909
|
| MONGOLIA
— 0.2% |
|
|
|
|
|
|
Mongolia Government International Bond
Series REGS, 3.50%,
7/7/2027
|
|
|
50,000
|
|
45,480
|
| MOROCCO
— 0.4% |
|
|
|
|
|
|
Morocco Government International Bond
Series 144A, 3.00%, 12/15/2032
(a)
|
|
|
100,000
|
|
86,665
|
| NIGERIA
— 0.8% |
|
|
|
|
|
|
Nigeria Government International Bond
Series REGS, 6.13%,
9/28/2028
|
|
|
200,000
|
|
183,504
|
See accompanying notes to financial statements.
8
STATE STREET INSTITUTIONAL
INVESTMENT TRUST
STATE STREET DIVERSIFIED INCOME FUND
SCHEDULE OF
INVESTMENTS (continued)
March 31, 2022 (Unaudited)
| Security
Description |
|
|
Principal
Amount |
|
Value
|
| OMAN
— 0.9% |
|
|
|
|
|
|
Oman Government International Bond
Series REGS, 4.75%,
6/15/2026
|
|
|
$
200,000 |
|
$
200,918 |
| PAKISTAN
— 0.3% |
|
|
|
|
|
|
Pakistan Government International Bond
Series 144A, 6.00%, 4/8/2026
(a)
|
|
|
100,000
|
|
76,693
|
| PANAMA
— 0.7% |
|
|
|
|
|
| Panama
Government International Bond: |
|
|
|
|
|
|
3.87%,
07/23/2060
|
|
|
50,000
|
|
43,890
|
|
6.70%,
01/26/2036
|
|
|
100,000
|
|
123,637
|
| |
|
|
|
|
167,527
|
| PARAGUAY
— 0.5% |
|
|
|
|
|
|
Paraguay Government International Bond
Series 144A, 5.40%, 3/30/2050
(a)
|
|
|
100,000
|
|
100,912
|
| PERU
— 0.6% |
|
|
|
|
|
|
Peruvian Government International Bond
3.30%,
3/11/2041
|
|
|
150,000
|
|
136,921
|
| PHILIPPINES
— 0.2% |
|
|
|
|
|
|
Republic of Philippines
3.20%,
7/6/2046
|
|
|
50,000
|
|
44,962
|
| POLAND
— 0.2% |
|
|
|
|
|
|
Republic of Poland Government International Bond
3.25%,
4/6/2026
|
|
|
50,000
|
|
50,913
|
| ROMANIA
— 1.1% |
|
|
|
|
|
| Romanian
Government International Bond: |
|
|
|
|
|
|
Series 144A, 3.00%, 02/27/2027
(a)
|
|
|
200,000
|
|
194,244
|
|
Series REGS, 4.00%,
02/14/2051
|
|
|
50,000
|
|
43,522
|
| |
|
|
|
|
237,766
|
| SAUDI
ARABIA — 0.8% |
|
|
|
|
|
|
Saudi Government International Bond
Series REGS, 2.25%,
2/2/2033
|
|
|
200,000
|
|
184,104
|
| SOUTH
AFRICA — 0.8% |
|
|
|
|
|
|
Republic of South Africa Government International Bond
5.75%,
9/30/2049
|
|
|
200,000
|
|
174,884
|
| Security
Description |
|
|
Principal
Amount |
|
Value
|
| SRI
LANKA — 0.4% |
|
|
|
|
|
|
Sri Lanka Government International Bond
Series REGS, 7.55%,
3/28/2030
|
|
|
$
200,000 |
|
$
94,682 |
| TRINIDAD
AND TOBAGO — 0.2% |
|
|
|
|
|
|
Trinidad & Tobago Government International Bond
Series REGS, 4.50%,
8/4/2026
|
|
|
50,000
|
|
49,999
|
| TURKEY
— 1.2% |
|
|
|
|
|
| Turkey
Government International Bond: |
|
|
|
|
|
|
4.25%,
03/13/2025
|
|
|
200,000
|
|
186,610
|
|
4.88%,
04/16/2043
|
|
|
50,000
|
|
35,486
|
|
5.13%,
02/17/2028
|
|
|
50,000
|
|
43,899
|
| |
|
|
|
|
265,995
|
| UKRAINE
— 0.2% |
|
|
|
|
|
|
Ukraine Government International Bond
Series REGS, 7.75%,
9/1/2023
|
|
|
100,000
|
|
50,341
|
| URUGUAY
— 0.3% |
|
|
|
|
|
|
Uruguay Government International Bond
5.10%,
6/18/2050
|
|
|
50,000
|
|
59,253
|
| UZBEKISTAN
— 0.4% |
|
|
|
|
|
|
Republic of Uzbekistan International Bond
Series 144A, 3.90%, 10/19/2031
(a)
|
|
|
100,000
|
|
86,995
|
|
TOTAL FOREIGN GOVERNMENT OBLIGATIONS
(Cost
$4,880,750)
|
|
|
|
|
4,610,529
|
| U.S.
GOVERNMENT AGENCY OBLIGATIONS — 15.5% |
|
|
|
|
|
| Federal
National Mortgage Association: |
|
|
|
|
|
|
TBA, 2.00%, 4/1/2037
(e)
|
|
|
300,000
|
|
291,237
|
|
TBA, 2.00%, 4/1/2052
(e)
|
|
|
725,000
|
|
672,428
|
|
TBA, 2.50%, 4/1/2037
(e)
|
|
|
250,000
|
|
246,996
|
|
TBA, 2.50%, 4/1/2052
(e)
|
|
|
400,000
|
|
381,519
|
|
TBA, 3.00%, 4/1/2052
(e)
|
|
|
425,000
|
|
415,569
|
|
TBA, 3.50%, 4/1/2052
(e)
|
|
|
250,000
|
|
250,340
|
|
TBA, 4.00%, 4/1/2052
(e)
|
|
|
250,000
|
|
255,045
|
| Government
National Mortgage Association: |
|
|
|
|
|
|
TBA, 2.00%, 4/1/2052
(e)
|
|
|
325,000
|
|
309,051
|
|
TBA, 2.50%, 4/1/2052
(e)
|
|
|
300,000
|
|
290,731
|
See accompanying notes to financial statements.
9
STATE STREET INSTITUTIONAL
INVESTMENT TRUST
STATE STREET DIVERSIFIED INCOME FUND
SCHEDULE OF
INVESTMENTS (continued)
March 31, 2022 (Unaudited)
| Security
Description |
|
|
Principal
Amount |
|
Value
|
|
TBA, 3.00%, 4/1/2052
(e)
|
|
|
$
350,000 |
|
$
345,794 |
|
TOTAL U.S. GOVERNMENT AGENCY OBLIGATIONS
(Cost
$3,525,798)
|
|
|
|
|
3,458,710
|
| COMMERCIAL
MORTGAGE BACKED SECURITIES — 1.9% |
|
|
|
|
|
|
BANK 2021-BNK33 Series 2021-BN33, Class A5, 2.56%,
5/15/2064
|
|
|
75,000
|
|
70,360
|
|
Benchmark 2021-B31 Mortgage Trust Series 2021-B31, Class A5, 2.67%,
12/15/2054
|
|
|
100,000
|
|
94,549
|
|
GS Mortgage Securities Trust 2018-GS9 Series 2018-GS9, Class AS, 4.14%, 3/10/2051
(b)
|
|
|
99,000
|
|
100,742
|
|
JPMBB Commercial Mortgage Securities Trust 2013-C12 Series 2013-C12, Class AS, 4.03%, 7/15/2045
(b)
|
|
|
60,000
|
|
60,510
|
|
Morgan Stanley Capital I Trust 2016-UBS12 Series 2016-UB12, Class A3, 3.34%,
12/15/2049
|
|
|
98,350
|
|
97,405
|
|
TOTAL COMMERCIAL MORTGAGE BACKED SECURITIES
(Cost
$455,758)
|
|
|
|
|
423,566
|
| MUTUAL
FUNDS AND EXCHANGE TRADED PRODUCTS — 10.0% |
|
|
|
|
|
| DOMESTIC
EQUITY — 2.0% |
|
|
|
|
|
|
SPDR ICE Preferred Securities ETF
(f)
|
|
|
11,500
|
|
448,615
|
| DOMESTIC
FIXED INCOME — 5.9% |
|
|
|
|
|
|
SPDR Blackstone Senior Loan ETF
(f)
|
|
|
14,000
|
|
629,440
|
|
SPDR Bloomberg Convertible Securities ETF
(f)
|
|
|
9,000
|
|
692,550
|
| |
|
|
|
|
1,321,990
|
| INTERNATIONAL
FIXED INCOME — 2.1% |
|
|
|
|
|
|
SPDR Bloomberg Emerging Markets Local Bond ETF
(f)
|
|
|
20,000
|
|
454,600
|
|
TOTAL MUTUAL FUNDS AND EXCHANGE TRADED PRODUCTS
(Cost
$2,349,602)
|
|
|
|
|
2,225,205
|
| Security
Description |
|
|
Shares
|
|
Value
|
| SHORT-TERM
INVESTMENT — 10.7% |
|
|
|
|
State Street Institutional U.S. Government Money Market Fund, Class G Shares 0.29% (g) (h)
(Cost
$2,379,290)
|
|
2,379,290
|
|
$
2,379,290 |
|
TOTAL INVESTMENTS — 115.4%
(Cost
$27,237,466)
|
|
25,756,581
|
|
|
LIABILITIES IN EXCESS OF OTHER ASSETS — (15.4)%
|
|
(3,429,993)
|
|
|
NET ASSETS —
100.0%
|
|
$
22,326,588 |
|
| (a)
|
Securities
purchased pursuant to Rule 144A of the Securities Act of 1933, as amended. These securities, which represent 31.5% of net assets as of March 31, 2022, are considered liquid and may be resold in transactions exempt from registration, normally to
qualified institutional buyers. |
| (b)
|
Variable
Rate Security - Interest rate shown is rate in effect at March 31, 2022. For securities based on a published reference rate and spread, the reference rate and spread are indicated in the description above. |
| (c)
|
Step-up
bond - Coupon rate increases in increments to maturity. Rate shown as of March 31, 2022. Maturity date shown is the final maturity. |
| (d)
|
Security
is currently in default and/or issuer is in bankruptcy. |
| (e)
|
Security,
or a portion of the security has been designated as collateral for TBA securities. |
| (f)
|
Affiliated
fund managed by SSGA Funds Management, Inc. Amounts related to these transactions during the period ended March 31, 2022 are shown in the Affiliate Table below. |
| (g)
|
The
Fund invested in certain money market funds managed by SSGA Funds Management, Inc. Amounts related to these transactions during the period ended March 31, 2022 are shown in the Affiliate Table below. |
| (h)
|
The
rate shown is the annualized seven-day yield at March 31, 2022. |
| CMT
|
Constant
Maturity Treasury |
| EMTN
|
Euro
Medium Term Note |
| LIBOR
|
London
Interbank Offered Rate |
| MTN
|
Medium
Term Note |
| REIT
|
Real
Estate Investment Trust |
| SOFR
|
Secured
Overnight Financing Rate |
| TBA
|
To
Be Announced |
See accompanying notes to financial statements.
10
STATE STREET INSTITUTIONAL
INVESTMENT TRUST
STATE STREET DIVERSIFIED INCOME FUND
SCHEDULE OF
INVESTMENTS (continued)
March 31, 2022 (Unaudited)
At March 31, 2022, open futures contracts were as
follows:
| Description
|
|
Number
of
Contracts |
|
Expiration
Date |
|
Notional
Amount |
|
Value
|
|
Unrealized
Appreciation
(Depreciation) |
| Ultra
10 Yr. U.S. Treasury Futures (short) |
|
(16)
|
|
06/21/2022
|
|
$(2,174,344)
|
|
$(2,167,500)
|
|
$
6,844 |
| Ultra
U.S. Treasury Bond Futures (long) |
|
5
|
|
06/21/2022
|
|
908,969
|
|
885,625
|
|
(23,344)
|
| |
|
|
|
|
|
|
|
|
|
$(16,500)
|
During the period ended March 31, 2022, average notional
values related to long and short futures contracts were $727,086 and $309,643 respectively.
Centrally Cleared Credit Default Swap Contracts
| Reference
Entity |
|
Counterparty
|
|
Notional
Amount
(000s Omitted) |
|
Contract
Annual
Fixed Rate/
Payment
Frequency |
|
Termination
Date |
|
Market
Value |
|
Unamortized
Upfront
Payments
Received (Paid) |
|
Unrealized
Appreciation
(Depreciation) |
| Buy
Protection |
|
|
|
|
|
|
|
|
|
|
|
|
|
|
| Markit
CDX North America |
|
Morgan
Stanley Bank, N.A. |
|
950
|
|
1.00%/
Quarterly |
|
12/20/26
|
|
$(16,396)
|
|
$(21,150)
|
|
$
4,754 |
| Markit
CDX North America |
|
Morgan
Stanley Bank, N.A. |
|
240
|
|
5.00%/
Quarterly |
|
12/20/26
|
|
(15,210)
|
|
(13,258)
|
|
(1,951)
|
| |
|
|
|
|
|
|
|
|
|
|
|
|
|
$
2,803 |
During the period ended March 31, 2022, average notional
value related to centrally-cleared credit default swap contracts was $475,714.
The following table summarizes the value of the Fund's
investments according to the fair value hierarchy as of March 31, 2022.
| Description
|
|
Level
1 –
Quoted Prices |
|
Level
2 –
Other Significant
Observable Inputs |
|
Level
3 –
Significant
Unobservable Inputs |
|
Total
|
| ASSETS:
|
|
|
|
|
|
|
|
|
| INVESTMENTS:
|
|
|
|
|
|
|
|
|
|
Corporate Bonds &
Notes
|
|
$
— |
|
$12,026,198
|
|
$—
|
|
$12,026,198
|
|
Asset-Backed
Securities
|
|
—
|
|
633,083
|
|
—
|
|
633,083
|
|
Foreign Government
Obligations
|
|
—
|
|
4,610,529
|
|
—
|
|
4,610,529
|
|
U.S. Government Agency
Obligations
|
|
—
|
|
3,458,710
|
|
—
|
|
3,458,710
|
|
Commercial Mortgage Backed
Securities
|
|
—
|
|
423,566
|
|
—
|
|
423,566
|
|
Mutual Funds and Exchange Traded
Products
|
|
2,225,205
|
|
—
|
|
—
|
|
2,225,205
|
|
Short-Term
Investment
|
|
2,379,290
|
|
—
|
|
—
|
|
2,379,290
|
|
TOTAL
INVESTMENTS
|
|
$4,604,495
|
|
$21,152,086
|
|
$—
|
|
$25,756,581
|
| OTHER
FINANCIAL INSTRUMENTS: |
|
|
|
|
|
|
|
|
|
Credit Default
Swaps
|
|
—
|
|
4,754
|
|
—
|
|
4,754
|
|
Futures
Contracts(a)
|
|
6,844
|
|
—
|
|
—
|
|
6,844
|
|
TOTAL OTHER FINANCIAL
INSTRUMENTS:
|
|
$
6,844 |
|
$
4,754 |
|
$—
|
|
$
11,598 |
See accompanying notes to financial statements.
11
STATE STREET INSTITUTIONAL
INVESTMENT TRUST
STATE STREET DIVERSIFIED INCOME FUND
SCHEDULE OF
INVESTMENTS (continued)
March 31, 2022 (Unaudited)
| Description
|
|
Level
1 –
Quoted Prices |
|
Level
2 –
Other Significant
Observable Inputs |
|
Level
3 –
Significant
Unobservable Inputs |
|
Total
|
| LIABILITIES:
|
|
|
|
|
|
|
|
|
| OTHER
FINANCIAL INSTRUMENTS: |
|
|
|
|
|
|
|
|
|
Credit Default
Swaps
|
|
$
— |
|
$
(1,951) |
|
$—
|
|
$
(1,951) |
|
Futures
Contracts(a)
|
|
(23,344)
|
|
—
|
|
—
|
|
(23,344)
|
|
TOTAL OTHER FINANCIAL
INSTRUMENTS:
|
|
$
(23,344) |
|
$
(1,951) |
|
$—
|
|
$
(25,295) |
| (a)
|
Futures
Contracts are valued at unrealized appreciation (depreciation). |
Affiliate Table
| |
Number
of
Shares Held
at
12/23/2021* |
|
Value
at
12/23/2021* |
|
Cost
of
Purchases |
|
Proceeds
from
Shares Sold |
|
Realized
Gain (Loss) |
|
Change
in
Unrealized
Appreciation/
Depreciation |
|
Number
of
Shares Held
at
3/31/22 |
|
Value
at
3/31/22 |
|
Dividend
Income |
|
SPDR Blackstone Senior Loan
ETF
|
—
|
|
$—
|
|
$
696,620 |
|
$
58,553 |
|
$(762)
|
|
$
(7,865) |
|
14,000
|
|
$
629,440 |
|
$
5,203 |
|
SPDR Bloomberg Convertible Securities
ETF
|
—
|
|
—
|
|
737,476
|
|
—
|
|
—
|
|
(44,926)
|
|
9,000
|
|
692,550
|
|
1,469
|
|
SPDR Bloomberg Emerging Markets Local Bond
ETF
|
—
|
|
—
|
|
487,009
|
|
—
|
|
—
|
|
(32,409)
|
|
20,000
|
|
454,600
|
|
3,007
|
|
SPDR ICE Preferred Securities
ETF
|
—
|
|
—
|
|
487,812
|
|
—
|
|
—
|
|
(39,197)
|
|
11,500
|
|
448,615
|
|
4,077
|
|
State Street Institutional U.S. Government Money Market Fund, Class G
Shares
|
—
|
|
—
|
|
24,824,916
|
|
22,445,626
|
|
—
|
|
—
|
|
2,379,290
|
|
2,379,290
|
|
620
|
|
Total
|
|
|
$—
|
|
$27,233,833
|
|
$22,504,179
|
|
$(762)
|
|
$(124,397)
|
|
|
|
$4,604,495
|
|
$14,376
|
| *
|
Commencement
of operations. |
See accompanying notes to financial statements.
12
STATE STREET INSTITUTIONAL
INVESTMENT TRUST
STATE STREET DIVERSIFIED INCOME FUND
STATEMENT OF ASSETS AND LIABILITIES
March 31, 2022 (Unaudited)
| ASSETS
|
|
|
Investments in unaffiliated issuers, at
value
|
$21,152,086
|
|
Investments in affiliated issuers, at
value
|
4,604,495
|
|
Total
Investments
|
25,756,581
|
|
Net cash at
broker
|
98,019
|
|
Cash
|
770
|
|
Dividends receivable — affiliated
issuers
|
387
|
|
Interest receivable — unaffiliated
issuers
|
184,163
|
|
Receivable from
Adviser
|
3,314
|
|
Receivable for foreign taxes
recoverable
|
593
|
|
TOTAL ASSETS
|
26,043,827
|
| LIABILITIES
|
|
|
Payable for investments
purchased
|
3,628,121
|
|
Payable to broker – accumulated variation margin on open futures
contracts
|
16,500
|
|
Payable for accumulated variation margin on swap
contracts
|
32,262
|
|
Custodian fees
payable
|
11,411
|
|
Administration fees
payable
|
948
|
|
Trustees’ fees and expenses
payable
|
2,744
|
|
Transfer agent fees
payable
|
229
|
|
Registration and filing fees
payable
|
8,126
|
|
Professional fees
payable
|
15,105
|
|
Printing and postage fees
payable
|
1,793
|
|
TOTAL LIABILITIES
|
3,717,239
|
|
NET ASSETS
|
$22,326,588
|
| NET
ASSETS CONSIST OF: |
|
|
Paid-in
Capital
|
$24,000,000
|
|
Total distributable earnings
(loss)
|
(1,673,412)
|
|
NET ASSETS
|
$22,326,588
|
| Class
K |
|
|
Net
Assets
|
$22,326,588
|
|
Shares
Outstanding
|
2,400,000
|
|
Net asset value, offering and redemption price per
share
|
$
9.30 |
| COST
OF INVESTMENTS: |
|
|
Investments in unaffiliated
issuers
|
$22,508,574
|
|
Investments in affiliated
issuers
|
4,728,892
|
|
Total cost of
investments
|
$27,237,466
|
See accompanying notes to financial statements.
13
STATE STREET INSTITUTIONAL
INVESTMENT TRUST
STATE STREET DIVERSIFIED INCOME FUND
STATEMENT OF OPERATIONS
For the Period Ended March 31, 2022 (Unaudited) (a)
| INVESTMENT
INCOME |
|
|
Interest income — unaffiliated
issuers
|
$
208,635 |
|
Dividend income — affiliated
issuers
|
14,376
|
|
TOTAL INVESTMENT INCOME
(LOSS)
|
223,011
|
| EXPENSES
|
|
|
Advisory
fee
|
15,609
|
|
Administration
fees
|
3,122
|
|
Custodian
fees
|
13,019
|
|
Trustees’ fees and expenses
|
8,018
|
|
Transfer agent
fees
|
1,741
|
|
Registration and filing
fees
|
8,137
|
|
Professional fees and
expenses
|
15,116
|
|
Printing and postage
fees
|
1,982
|
|
Miscellaneous
expenses
|
43
|
|
TOTAL
EXPENSES
|
66,787
|
|
Expenses waived/reimbursed by the
Adviser
|
(23,082)
|
|
NET
EXPENSES
|
43,705
|
|
NET INVESTMENT INCOME
(LOSS)
|
$
179,306 |
| REALIZED
AND UNREALIZED GAIN (LOSS) |
|
| Net
realized gain (loss) on: |
|
|
Investments — unaffiliated
issuers
|
(124,024)
|
|
Investments — affiliated
issuers
|
(762)
|
|
Futures
contracts
|
(71,045)
|
|
Swaps
Contracts
|
(4,129)
|
|
Net realized gain
(loss)
|
(199,960)
|
| Net
change in unrealized appreciation/depreciation on: |
|
|
Investments — unaffiliated
issuers
|
(1,356,488)
|
|
Investments — affiliated
issuers
|
(124,397)
|
|
Futures
contracts
|
(16,516)
|
|
Swap
contracts
|
2,803
|
|
Net change in unrealized
appreciation/depreciation
|
(1,494,598)
|
|
NET REALIZED AND UNREALIZED GAIN
(LOSS)
|
(1,694,558)
|
|
NET INCREASE (DECREASE) IN NET ASSETS FROM
OPERATIONS
|
$(1,515,252)
|
(a) For the period December 23, 2021
(commencement of operations) through March 31, 2022.
See accompanying notes to financial statements.
14
STATE STREET INSTITUTIONAL
INVESTMENT TRUST
STATE STREET DIVERSIFIED INCOME FUND
STATEMENT OF CHANGES IN NET ASSETS
| |
For
the Period
12/23/21*-
3/31/22
(Unaudited) |
| INCREASE
(DECREASE) IN NET ASSETS FROM OPERATIONS: |
|
|
Net investment income
(loss)
|
$
179,306 |
|
Net realized gain
(loss)
|
(199,960)
|
|
Net change in unrealized
appreciation/depreciation
|
(1,494,598)
|
|
Net increase (decrease) in net assets resulting from
operations
|
(1,515,252)
|
| DISTRIBUTIONS
TO SHAREHOLDERS: |
|
|
Class
K
|
(158,160)
|
| FROM
BENEFICIAL INTEREST TRANSACTIONS: |
|
| Class
K |
|
|
Proceeds from sale of shares
sold
|
24,000,000
|
|
Net increase (decrease) in net assets from beneficial interest transactions
|
24,000,000
|
|
Net increase (decrease) in net assets during the
period
|
22,326,588
|
|
Net assets at beginning of
period
|
—
|
|
NET ASSETS AT END OF
PERIOD
|
$22,326,588
|
| SHARES
OF BENEFICIAL INTEREST: |
|
| Class
K |
|
|
Shares
sold
|
2,400,000
|
|
Net increase (decrease) from share
transactions
|
2,400,000
|
| *
|
Commencement of operations.
|
See accompanying notes to financial statements.
15
STATE STREET INSTITUTIONAL
INVESTMENT TRUST
STATE STREET DIVERSIFIED INCOME FUND
FINANCIAL HIGHLIGHTS
Selected data for a share outstanding throughout each period
| |
For
the
Period
12/23/21*-
3/31/22
(Unaudited) |
|
Net asset value, beginning of
period
|
$
10.00 |
| Income
(loss) from investment operations: |
|
|
Net investment income (loss)
(a)
|
0.07
|
|
Net realized and unrealized gain (loss)
(b)
|
(0.70)
|
|
Total from investment
operations
|
(0.63)
|
| Distributions
to shareholders from: |
|
|
Net investment
income
|
(0.07)
|
|
Net asset value, end of
period
|
$
9.30 |
|
Total return
(c)
|
(6.34)%
|
| Ratios
and Supplemental Data: |
|
|
Net assets, end of period (in
000s)
|
$22,327
|
| Ratios
to average net assets: |
|
|
Total
expenses
|
1.07%(d)
|
|
Net
expenses
|
0.70%(d)
|
|
Net investment income
(loss)
|
2.87%(d)
|
|
Portfolio turnover rate
(e)
|
1%(f)
|
| *
|
Commencement of operations.
|
| (a)
|
Per share
numbers have been calculated using average shares outstanding, which more appropriately presents the per share data for the period. |
| (b)
|
Amounts
shown in this caption for a share outstanding may not accord with the change in aggregate gains and losses in securities for the fiscal period because of the timing of sales and repurchases of Fund shares in relation to fluctuating market values for
the Fund. |
| (c)
|
Total
return is calculated assuming a purchase of shares at net asset value on the first day and a sale at net asset value on the last day of each period reported. Distributions are assumed, for the purpose of this calculation, to be reinvested at net
asset value per share on the respective payment dates of each distribution. Total returns for periods of less than one year are not annualized. Broker commission charges are not included in this calculation. |
| (d)
|
Annualized.
|
| (e)
|
Portfolio
turnover rate excludes securities received or delivered from in-kind processing of creations or redemptions. |
| (f)
|
Not
annualized. |
See accompanying notes to financial statements.
16
STATE STREET INSTITUTIONAL
INVESTMENT TRUST
STATE STREET DIVERSIFIED INCOME FUND
NOTES TO FINANCIAL STATEMENTS
March 31, 2022 (Unaudited)
1. Organization
State Street Institutional Investment Trust (the
“Trust”), a Massachusetts business trust registered under the Investment Company Act of 1940, as amended (“1940 Act”), is an open-end management investment company.
As of March 31, 2022, the Trust consists of thirty-three (33)
series (and corresponding classes, each of which have the same rights and privileges, including voting rights), each of which represents a separate series of beneficial interest in the Trust. The Declaration of Trust permits the Board of Trustees of
the Trust (the “Board" and each member thereof, a "Trustee") to authorize the issuance of an unlimited number of shares of beneficial interest with no par value. The financial statements herein relate only to the following series (the
“Fund”):
| Fund
|
Classes
|
Commencement
of Operations |
Diversification
Classification |
| State
Street Diversified Income Fund |
Class
K |
December
23, 2021 |
Diversified
|
The Fund was formed on December 22,
2021 and commenced operations on December 23, 2021.
Class K shares are sold without a sales charge and only to
certain eligible investors.
Under the Trust’s
organizational documents, its officers and trustees are indemnified against certain liabilities arising out of the performance of their duties to the Trust. Additionally, in the normal course of business, the Trust enters into contracts with service
providers that contain general indemnification clauses. The Trust’s maximum exposure under these arrangements is unknown as this would involve future claims that may be made against the Trust that have not yet occurred.
2. Summary of Significant Accounting
Policies
The following is a summary of significant
accounting policies followed by the Trust in the preparation of its financial statements:
The preparation of financial statements in accordance with
U.S. generally accepted accounting principles (“U.S. GAAP”) requires management to make estimates and assumptions that affect the reported amounts and disclosures in the financial statements. Actual results could differ from those
estimates. The Fund is an investment company under U.S. GAAP and follows the accounting and reporting guidance applicable to investment companies.
Security Valuation
The Fund's investments are valued at fair value each day that
the New York Stock Exchange (“NYSE”) is open and, for financial reporting purposes, as of the report date should the reporting period end on a day that the NYSE is not open. Fair value is generally defined as the price a fund would
receive to sell an asset or pay to transfer a liability in an orderly transaction between market participants at the measurement date. By its nature, a fair value price is a good faith estimate of the valuation in a current sale and may not reflect
an actual market price. The investments of the Fund are valued pursuant to the policy and procedures developed by the Oversight Committee (the “Committee”) and approved by the Board. The Committee provides oversight of the valuation of
investments for the Fund. The Board has responsibility for overseeing the determination of the fair value of investments.
Valuation techniques used to value the Fund's investments by
major category are as follows:
•
Equity investments (including preferred stocks and registered investment companies that are exchange-traded funds) traded on a recognized securities exchange for which market quotations are readily available are valued at the last sale price or
official closing price, as applicable, on the primary market or exchange on which they trade. Equity investments traded on a recognized exchange for which there were no sales on that day are valued at the last published sale price or at fair
value.
•
Investments in registered investment companies (including money market funds) or other unitized pooled investment vehicles that are not traded on an exchange are valued at that day’s published net asset value (“NAV”) per share
or unit.
• Government and municipal
fixed income securities are generally valued using quotations from independent
STATE STREET INSTITUTIONAL
INVESTMENT TRUST
STATE STREET DIVERSIFIED INCOME FUND
NOTES TO FINANCIAL STATEMENTS (continued)
March 31, 2022 (Unaudited)
pricing services or brokers. Certain government
inflation-indexed securities may require a calculated fair valuation as the cumulative inflation is contained within the price provided by the pricing service or broker. For these securities, the inflation component of the price is
“cleaned” from the pricing service or broker price utilizing the published inflation factors in order to ensure proper accrual of income.
•
Debt obligations (including short-term investments and convertible debt securities) are valued using quotations from independent pricing services or brokers or are generally valued at the last reported evaluated prices.
•
Exchange-traded futures contracts are valued at the closing settlement price on the primary market on which they are traded most extensively. Exchange-traded futures contracts traded on a recognized exchange for which there were no sales on
that day are valued at the last reported sale price obtained from independent pricing services or brokers or at fair value.
•
Swap agreements are valued daily based upon prices supplied by Board approved pricing vendors or through brokers. Depending on the product and terms of the transaction, the value of agreements is determined using a series of techniques
including valuation models that incorporate a number of market data factors, such as discounted cash flows, yields, curves, trades and values of the underlying reference instruments. In the event SSGA Funds Management, Inc. (the
“Adviser” or “SSGA FM”) is unable to obtain an independent, third-party valuation the agreements will be fair valued.
In the event prices or quotations are not readily available or
that the application of these valuation methods results in a price for an investment that is deemed to be not representative of the fair value of such investment, fair value will be determined in good faith by the Committee, in accordance with the
valuation policy and procedures approved by the Board.
Various inputs are used in determining the value of the
Fund’s investments.
The Fund values its assets and
liabilities at fair value using a fair value hierarchy consisting of three broad levels that prioritize the inputs to valuation techniques giving the highest priority to readily available unadjusted quoted prices in active markets for identical
assets or liabilities (Level 1 measurements) and the lowest priority to unobservable inputs (Level 3 measurements) when market prices are not readily available or reliable. The categorization of a value determined for an investment within the
hierarchy is based upon the pricing transparency of the investment and is not necessarily an indication of the risk associated with investing in it.
The three levels of the fair value hierarchy are as
follows:
• Level 1 – Unadjusted
quoted prices in active markets for an identical asset or liability;
•
Level 2 – Inputs other than quoted prices included within Level 1 that are observable for the asset or liability either directly or indirectly, including quoted prices for similar assets or liabilities in active markets, quoted prices for
identical or similar assets or liabilities in markets that are not considered to be active, inputs other than quoted prices that are observable for the asset or liability (such as exchange rates, financing terms, interest rates, yield curves,
volatilities, prepayment speeds, loss severities, credit risks and default rates) or other market-corroborated inputs; and
•
Level 3 – Unobservable inputs for the asset or liability, including the Committee’s assumptions used in determining the fair value of investments.
The value of the Fund’s investments according to the
fair value hierarchy as of March 31, 2022 is disclosed in the Fund’s Schedule of Investments.
Investment Transactions and Income Recognition
Investment transactions are accounted for on trade date for
financial reporting purposes. Realized gains and losses from the sale or disposition of investments and foreign exchange transactions, if any, are determined using the identified cost method.
STATE STREET INSTITUTIONAL
INVESTMENT TRUST
STATE STREET DIVERSIFIED INCOME FUND
NOTES TO FINANCIAL STATEMENTS (continued)
March 31, 2022 (Unaudited)
Dividend income and capital gain distributions, if any, are
recognized on the ex-dividend date, or when the information becomes available, net of any foreign taxes withheld at source, if any. Interest income is recorded daily on an accrual basis. All premiums and discounts are amortized/accreted for
financial reporting purposes.
Non-cash dividends
received in the form of stock, are recorded as dividend income at fair value. Distributions received by the Fund may include a return of capital that is estimated by management. Such amounts are recorded as a reduction of the cost of investments or
reclassified to capital gains.
Expenses
Certain expenses, which are directly identifiable to a
specific Fund, are applied to that Fund within the Trust. Other expenses which cannot be attributed to a specific Fund are allocated in such a manner as deemed equitable, taking into consideration the nature and type of expense and the relative net
assets of the Fund within the Trust.
Foreign Currency
Translation
The accounting records of the Fund are
maintained in U.S. dollars. Foreign currencies as well as investment securities and other assets and liabilities denominated in a foreign currency are translated to U.S. dollars using exchange rates at period end. Purchases and sales of securities,
income receipts and expense payments denominated in foreign currencies are translated into U.S. dollars at the prevailing exchange rate on the respective dates of the transactions.
The effects of exchange rate fluctuations on investments are
included with the net realized and unrealized gain (loss) on investment securities. Other foreign currency transactions resulting in realized and unrealized gain (loss) are disclosed separately.
Foreign Taxes
The Fund may be subject to foreign taxes (a portion of which
may be reclaimable) on income, stock dividends, realized and unrealized capital gains on investments or certain foreign currency transactions. Foreign taxes are recorded in accordance with SSGA Funds Management, Inc.'s (the “Adviser” or
“SSGA FM”) understanding of the applicable foreign tax regulations and rates that exist in the foreign jurisdictions in which the Fund invests. These foreign taxes, if any, are paid by the Fund and are reflected in the Statement of
Operations, if applicable. Foreign taxes payable or deferred as of March 31, 2022, if any, are disclosed in the Fund's Statement of Assets and Liabilities.
Distributions
Distributions from net investment income, if any, are declared
and paid annually. Net realized capital gains, if any, are distributed annually, unless additional distributions are required for compliance with applicable tax regulations. The amount and character of income and capital gains to be distributed are
determined in accordance with applicable tax regulations which may differ from net investment income and realized gains recognized for U.S. GAAP purposes.
3. Securities and Other Investments
Delayed Delivery Transactions and When-Issued Securities
During the period, certain Fund transacted in securities on a
delayed delivery or when-issued basis. Payment and delivery may take place after the customary settlement period for that security. The price of the underlying securities and the date when the securities will be delivered and paid for are fixed at
the time the transaction is negotiated. The securities purchased on a delayed delivery or when-issued basis are identified as such in each applicable Fund’s Schedule of Investments. The Fund may receive compensation for interest forgone in the
purchase of a delayed delivery or when-issued security. With respect to purchase commitments, the Fund identifies securities as segregated in its records with a value at least equal to the amount of the commitment. Losses may arise due to changes in
the value of the underlying securities or if the counterparty does not perform under the contract’s terms, or if the issuer does not issue the securities due to political, economic or other factors.
STATE STREET INSTITUTIONAL
INVESTMENT TRUST
STATE STREET DIVERSIFIED INCOME FUND
NOTES TO FINANCIAL STATEMENTS (continued)
March 31, 2022 (Unaudited)
To-Be-Announced Transactions
The Fund may seek to obtain exposure to U.S. agency mortgage
pass through securities through the use of “to-be-announced” or “TBA transactions.” “TBA” refers to a commonly used mechanism for the forward settlement of U.S. agency mortgage pass-through securities. In a TBA
transaction, the buyer and seller decide on general trade parameters, such as agency, settlement date, coupon, and price. The Fund may use TBA transactions to “roll over” such agreements prior to the settlement date. This type of TBA
transaction is sometimes known as a “TBA roll.” In a TBA roll, the Fund generally will sell the obligation to purchase the pools stipulated in the TBA agreement prior to the settlement date and will enter into a new TBA agreement for
future delivery of pools of mortgage pass-through securities. The Fund may also enter into TBA agreements and settle such transactions on the stipulated settlement date by accepting actual receipt or delivery of the pools of mortgage pass-through
securities.
Default by or bankruptcy of a counterparty
to a TBA transaction would expose the Fund to possible loss because of adverse market action, expenses or delays in connection with the purchase or sale of the pools of mortgage pass-through securities specified in the TBA transaction. To minimize
this risk, the Fund will enter into TBA transactions only with established counterparties. The Fund’s use of “TBA rolls” may impact portfolio turnover, transaction costs and capital gain distributions to shareholders.
4. Derivative Financial Instruments
Futures Contracts
The Fund may enter into futures contracts to meet its
objectives. A futures contract is a standardized, exchange-traded agreement to buy or sell a financial instrument at a set price on a future date. Upon entering into a futures contract, the Fund is required to deposit with the broker, cash or
securities in an amount equal to the minimum initial margin requirements of the clearing house. Securities deposited, if any, are designated on the Schedules of Investments and cash deposited, if any, is included in the Net cash collateral on
deposit with broker for future contracts on the Statement of Assets and Liabilities. Subsequent payments are made or received Fund equal to the daily change in the contract value, accumulated, exchange rates, and or other transactional fees. The
accumulation of those payments are recorded as variation margin receivable or payable with a corresponding offset to unrealized gains or losses. The Fund recognizes a realized gain or loss when the contract is closed.
Losses may arise if the value of a futures contract decreases
due to unfavorable changes in the market rates or values of the underlying instrument during the term of the contract or if the counterparty does not perform under the contract. The use of futures contracts also involves the risk that the movements
in the price of the futures contracts do not correlate with the movement of the assets underlying such contracts.
For the period ended March 31, 2022, the Fund entered into
treasury futures contracts in order to actively manage duration.
Credit Default Swaps
During the period ended March 31, 2022, the Fund engaged in
credit default swaps to manage credit risk. When the Fund is the buyer in a credit default swap contract, the Fund is entitled to receive the par (or other agreed upon) value (full notional value) of a referenced debt obligation (or basket of debt
obligations) from the counterparty (or central clearing party (“CCP”) in the case of a centrally cleared swap) to the contract if a credit event by a third party, such as a U.S. or foreign corporate issuer or sovereign issuer, on the
debt obligation occurs. In return, the Fund pays the counterparty a periodic stream of payments over the term of the contract provided that no credit event has occurred. If no credit event occurs, the Fund loses its investment and recovers nothing.
However, if a credit event occurs, the Fund receives full notional value for a referenced debt obligation that may have little or no value. When the Fund is the seller of a credit default swap, it receives a fixed rate of income throughout the term
of the contract, provided there is no credit event. If a credit event occurs, the Fund is obligated to pay the notional amount of the swap and in certain instances take delivery of securities of the reference entity upon the occurrence of a credit
event, as defined under the terms of that particular swap agreement. Credit events are contract specific but may include bankruptcy, failure to pay, restructuring, obligation acceleration and repudiation/moratorium. If the Fund is a seller of
protection and a credit event occurs, the maximum potential amount of future payments that the Fund could be required to make would be an amount equal to the notional amount of the agreement. This potential amount would be partially offset by any
recovery value of the respective referenced obligation, or net amount received from the settlement of a buy protection credit default swap agreement entered into by the Fund for the same referenced obligation. As the seller, the Fund may create
economic leverage to its portfolio because, in addition to its total net assets, the Fund is subject to investment exposure on the notional amount of the swap. The interest fee paid or received on the swap, which is based on a
STATE STREET INSTITUTIONAL
INVESTMENT TRUST
STATE STREET DIVERSIFIED INCOME FUND
NOTES TO FINANCIAL STATEMENTS (continued)
March 31, 2022 (Unaudited)
specified interest rate on a fixed notional amount, is accrued daily as a
component of unrealized appreciation (depreciation) and is recorded as realized gain upon receipt or realized loss upon payment. The Fund also records an increase or decrease to unrealized appreciation (depreciation) in an amount equal to the daily
valuation. For centrally cleared swaps, the daily change in valuation is recorded as a receivable or payable for variation margin and settled in cash with the CCP daily. All upfront payments, if any, are amortized over the life of the swap as
realized gains or losses. Those upfront payments that are paid or received, typically for non-centrally cleared swaps, are recorded as other assets or other liabilities, respectively, net of amortization. For financial reporting purposes,
unamortized upfront payments, if any, are netted with unrealized appreciation or depreciation on swaps to determine the market value of swaps. The Fund segregates assets in the form of cash or liquid securities in an amount equal to the notional
amount of the credit default swaps of which it is the seller. The Fund segregates assets in the form of cash or liquid securities in an amount equal to any unrealized depreciation of the credit default swaps of which it is the buyer, marked to
market on a daily basis. Credit default swaps involve greater risks than if the Fund had invested in the referenced debt obligation directly. If the Fund is a buyer of a credit default swap and no credit event occurs, the Fund will not earn any
return on its investment. If the Fund is a seller of a credit default swap, the Fund’s risk of loss may be the entire notional amount of the swap. Swaps may also subject the Fund to the risk that the counterparty to the transaction may not
fulfill its obligation. In the case of centrally cleared swaps, counterparty risk is minimal due to protections provided by the CCP.
The following tables summarize the value of the Fund's
derivative instruments as of March 31, 2022, and the related location in the accompanying Statement of Assets and Liabilities and Statement of Operations, presented by primary underlying risk exposure:
| |
Liability
Derivatives |
| |
Interest
Rate
Risk |
|
Foreign
Exchange
Risk |
|
Credit
Risk |
|
Equity
Risk |
|
Commodity
Risk |
|
Total
|
|
Futures
Contracts
|
$16,500
|
|
$—
|
|
$
— |
|
$—
|
|
$—
|
|
$16,500
|
|
Swap
Contracts
|
—
|
|
—
|
|
32,262
|
|
—
|
|
—
|
|
32,262
|
| |
Net
Realized Gain (Loss) |
| |
Interest
Rate
Risk |
|
Foreign
Exchange
Risk |
|
Credit
Risk |
|
Equity
Risk |
|
Commodity
Risk |
|
Total
|
|
Futures
Contracts
|
$(71,045)
|
|
$—
|
|
$
— |
|
$—
|
|
$—
|
|
$(71,045)
|
|
Swap
Contracts
|
—
|
|
—
|
|
(4,129)
|
|
—
|
|
—
|
|
(4,129)
|
| |
Net
Change in Unrealized Appreciation (Depreciation) |
| |
Interest
Rate
Risk |
|
Foreign
Exchange
Risk |
|
Credit
Risk |
|
Equity
Risk |
|
Commodity
Risk |
|
Total
|
|
Futures
Contracts
|
$(16,516)
|
|
$—
|
|
$
— |
|
$—
|
|
$—
|
|
$(16,516)
|
|
Swap
Contracts
|
—
|
|
—
|
|
2,803
|
|
—
|
|
—
|
|
2,803
|
5. Fees and
Transactions with Affiliates
Advisory Fee
The Trust, on behalf of the Fund, has entered into an
Investment Advisory Agreement with SSGA FM. For its advisory services, the Fund pays the Adviser a management fee at an annual rate of 0.25% of its average daily net assets. The fees are accrued daily and paid monthly.
The Adviser is contractually obligated, through January 31,
2023, (i) to waive up to the full amount of the advisory fee payable by the Fund, and/or (ii) to reimburse the Fund to the extent that total annual operating expenses (exclusive of non-recurring account fees, interest, taxes and extraordinary
expenses) exceed 0.70% of average daily net assets on an annual basis. This waiver and/or reimbursement arrangement may not be terminated prior to January 31, 2023 except with approval of the Board. For the period ended March 31, 2022, fees waived
and expenses reimbursed by the Adviser, pursuant to the agreement, were $23,082.
STATE STREET INSTITUTIONAL
INVESTMENT TRUST
STATE STREET DIVERSIFIED INCOME FUND
NOTES TO FINANCIAL STATEMENTS (continued)
March 31, 2022 (Unaudited)
Administrator, Custodian, Fund Accountant and Sub-Administrator
Fees
SSGA FM serves as administrator to the Fund. For
its administrative services, the Fund pays SSGA FM a fee at an annual rate of 0.05% of its average daily net assets of the Fund. The fees are accrued daily and paid monthly. State Street Bank and Trust Company (“State Street”), an
affiliate of the Adviser, serves as custodian, fund accountant and sub-administrator to the Fund. SSGA FM and the Fund each pay a portion of the fee to State Street for performing such services.
Distributor Fees
State Street Global Advisors Funds Distributors, LLC
(“SSGA FD” or the “Distributor”), an affiliate of the Adviser, serves as the distributor of the Trust.
Other Transactions with Affiliates
The Fund may invest in affiliated entities, including
securities issued by State Street Corporation, affiliated funds, or entities deemed to be affiliates as a result of the Fund owning more than five percent of the entity’s voting securities or outstanding shares. Amounts relating to these
transactions during the period ended March 31, 2022, are disclosed in the Schedule of Investments.
From time to time, the Fund may have a concentration of one or
more accounts constituting a significant percentage of shares outstanding. Investment activities by holders of such accounts could have material impacts on the Fund. As of March 31, 2022, based on management’s evaluation of the shareholder
account base, the Fund had accounts representing controlling ownership of more than 10% of the Fund’s total outstanding shares. The number of such accounts, based on accounts that represent more than 10% of the aggregate shares, and the
aggregate percentage of net assets represented by such holdings were as follows:
| Fund
|
|
Number
of 10%
Affiliated Account Holders |
|
Percentage
of
Affiliated Ownership |
|
State Street Diversified Income
Fund
|
|
1
|
|
100%
|
Due to Custodian
In certain circumstances, the Fund may have cash overdrafts
with the Custodian due to expense payments, capital transactions, trading of securities, investment operations or derivative transactions. The Due to Custodian amount, if any, reflects cash overdrawn with State Street, as custodian, who is an
affiliate of the Fund.
6. Trustees’ Fees
The fees and expenses of the Trustees who are not
“interested persons” of the Trust, as defined in the 1940 Act (“Independent Trustees”), are paid directly by the Fund. The Independent Trustees are reimbursed for travel and other out-of-pocket expenses in connection with
meeting attendance and industry seminars.
7. Investment Transactions
Purchases and sales of investments (excluding in-kind
transactions, derivative contracts and short term investments) for the period ended March 31, 2022 were as follows:
| |
Purchases
|
|
Sales
|
|
State Street Diversified Income
Fund
|
$21,577,536
|
|
$263,109
|
8. Income Tax
Information
The Fund has qualified and intends to
continue to qualify as a regulated investment company under Subchapter M of the Internal Revenue Code of 1986, as amended. The Fund will not be subject to federal income taxes to the extent it distributes its taxable income, including any net
realized capital gains, for each fiscal year. Therefore, no provision for federal income tax is required.
STATE STREET INSTITUTIONAL
INVESTMENT TRUST
STATE STREET DIVERSIFIED INCOME FUND
NOTES TO FINANCIAL STATEMENTS (continued)
March 31, 2022 (Unaudited)
The Fund files federal and various state and local tax returns
as required. No income tax returns are currently under examination. Generally, the federal returns are subject to examination by the Internal Revenue Service (the “IRS”) for a period of three years from date of filing, while the state
returns may remain open for an additional year depending upon jurisdiction.
Distributions to shareholders are recorded on ex-dividend
date. Income dividends and gain distributions are determined in accordance with income tax rules and regulations, which may differ from generally accepted accounting principles.
As of March 31, 2022, gross unrealized appreciation and gross
unrealized depreciation of investments based on cost for federal income tax purposes were as follows:
| |
Tax
Cost |
|
Gross
Unrealized
Appreciation |
|
Gross
Unrealized
Depreciation |
|
Net
Unrealized
Appreciation
(Depreciation) |
|
State Street Diversified Income
Fund
|
$27,237,466
|
|
$30,968
|
|
$1,525,550
|
|
$(1,494,582)
|
9. Risks
Credit Risk
The Fund may be exposed to credit risk in the event that an
issuer or guarantor fails to perform or that an institution or entity with which the Fund has unsettled or open transactions defaults.
Market Risk
The Fund’s investments are subject to changes in general
economic conditions, general market fluctuations and the risks inherent in investment in securities markets. Investment markets can be volatile and prices of investments can change substantially due to various factors including, but not limited to,
economic growth or recession, changes in interest rates, changes in the actual or perceived creditworthiness of issuers, and general market liquidity. The Fund is subject to the risk that geopolitical events will disrupt securities markets and
adversely affect global economies and markets. Local, regional or global events such as war, acts of terrorism, the spread of infectious illness or other public health issues, or other events could have a significant impact on the Fund and its
investments.
An outbreak of a respiratory disease caused
by a novel coronavirus first detected in China in December 2019 has spread globally. In an organized attempt to contain and mitigate the effects of the spread of the coronavirus known as COVID-19, governments and businesses world-wide have taken
aggressive measures, including closing borders, restricting international and domestic travel, and the imposition of prolonged quarantines of large populations. COVID-19 has resulted in the disruption of and delays in the delivery of healthcare
services and processes, the cancellation of organized events and educational institutions, the disruption of production and supply chains, a decline in consumer demand for certain goods and services, and general concern and uncertainty, all of which
have contributed to increased volatility in global markets. The effects of COVID-19 will likely affect certain sectors and industries more dramatically than others, which may adversely affect the value of a Fund’s investments in those sectors
or industries. COVID-19, and other epidemics and pandemics that may arise in the future, could adversely affect the economies of many nations, the global economy, individual companies and capital markets in ways that cannot be foreseen at the
present time. In addition, the impact of infectious diseases in developing or emerging market countries may be greater due to limited health care resources. Political, economic and social stresses caused by COVID-19 also may exacerbate other
pre-existing political, social and economic risks in certain countries. The duration of COVID-19 and its effects cannot be determined at this time, but the effects could be present for an extended period of time.
10. Recent Accounting Pronouncement
In March 2020, the Financial Accounting Standards Board
(“FASB”) issued Accounting Standards Update No. 2020-04 (“ASU 2020-04”), “Reference Rate Reform (Topic 848)”. In response to concerns about structural risks of interbank offered rates, and particularly the risk of
cessation of LIBOR, regulators have undertaken reference rate reform initiatives to identify alternative reference rates that are more observable or transaction based and less susceptible to manipulation. ASU 2020-04 provides optional guidance for a
limited period of time to ease the potential burden in accounting for (or recognizing the effects of) reference rate reform on financial reporting. ASU 2020-04 is elective and applies to all entities, subject to meeting certain criteria, that have
contracts, hedging relationships, and other transactions that reference LIBOR or another reference rate expected to be discontinued
STATE STREET INSTITUTIONAL
INVESTMENT TRUST
STATE STREET DIVERSIFIED INCOME FUND
NOTES TO FINANCIAL STATEMENTS (continued)
March 31, 2022 (Unaudited)
because of reference rate reform. The relief provided is temporary and
generally cannot be applied to contract modifications that occur after December 31, 2022, or hedging relationships entered into or evaluated after that date. However, the FASB has indicated that it will revisit the sunset date in Topic 848 after the
LIBOR administrator makes a final decision on a phaseout date. On November 30, 2020, the LIBOR administrator proposed extending the publication of the overnight and the one-, three-, six- and 12-month USD LIBOR settings through June 30, 2023, when
many existing contracts that reference LIBOR will have expired. Management is currently evaluating the impact of the guidance.
This change in accounting policy has been made to comply with
the newly issued accounting standard and had no impact on total accumulated earnings (loss) or the NAV of each Fund. With respect to each Fund’s results of operations, amortization of premium to first call date accelerates amortization with
the intent of more closely aligning the recognition of income on such bonds with the economics of the instrument.
11. Subsequent Events
Management has evaluated the impact of all subsequent events
on the Fund through the date the financial statements were issued and has determined that there were no subsequent events requiring adjustment or disclosure in the financial statements.
STATE STREET INSTITUTIONAL
INVESTMENT TRUST
STATE STREET DIVERSIFIED INCOME FUND
OTHER INFORMATION
March 31, 2022 (Unaudited)
Expense Example
As a shareholder of a Fund, you incur two types of costs: (1)
transaction costs, including sales charges (loads), if applicable, on purchase payments, reinvested dividends, or other distributions and (2) ongoing costs, including advisory fees and other Fund expenses. This example is intended to help you
understand your ongoing costs (in dollars) of investing in the Fund and to compare these costs with the ongoing costs of investing in other mutual funds. It is based on an investment of $1,000 made at the beginning of the period shown and held for
the entire period from October 1, 2021 to March 31, 2022.
The table below illustrates your Fund's cost in two
ways:
Based on actual fund return ——This section helps you to estimate the actual expenses that you paid over the period. The “Ending Account Value” shown is derived from each Fund's actual return, and the third column shows the
dollar amount that would have been paid by an investor who started with $1,000 in the Fund. You may use the information here, together with the amount you invested, to estimate the expenses that you paid over the period. To do so, simply divide your
account value by $1,000 (for example, an $8,600 account value divided by $1,000 = 8.6), then multiply the result by the number given for the Fund under the heading “Expenses Paid During Period”.
Based on hypothetical 5%
return ——This section is intended to help you compare your Fund's costs with those of other mutual funds. It assumes that the Fund had a yearly return of 5% before expenses, but that the expense ratio is
unchanged. In this case, because the return used is not the Fund's actual return, the results do not apply to your investment. The example is useful in making comparisons because the U.S. Securities and Exchange Commission (the “SEC”)
requires all mutual funds to calculate expenses based on a 5% return. You can assess your Fund's costs by comparing this hypothetical example with the hypothetical examples that appear in shareholder reports of other funds.
Please note that the expenses shown in the table are meant to
highlight your ongoing costs only and do not reflect any transaction costs, such as sales load charges (loads). Therefore, the hypothetical 5% return section of the table is useful in comparing ongoing costs only, and will not help you determine the
relative total costs of owning different funds. In addition, if these transaction costs were included, your costs would have been higher.
| |
|
|
Actual
|
|
Hypothetical
(assuming a 5%
return before expenses) |
| |
Annualized
Expense Ratio |
|
Ending
Account
Value |
|
Expenses
Paid
During Period(a) |
|
Ending
Account
Value |
|
Expenses
Paid
During Period(a) |
|
State Street Diversified Income
Fund
|
0.70%
|
|
$936.60
|
|
$1.84(b)
|
|
$1,021.40
|
|
$3.53
|
| (a)
|
Expenses are equal to the
Fund's annualized net expense ratio multiplied by the average account value of the period, multiplied by 182, then divided by 365. |
| (b)
|
Actual
period is from commencement of operations on 12/23/2021. |
STATE STREET INSTITUTIONAL
INVESTMENT TRUST
STATE STREET DIVERSIFIED INCOME FUND
OTHER
INFORMATION (continued)
March 31, 2022 (Unaudited)
Liquidity Risk Management Program
Pursuant to Rule 22e-4 under the 1940 Act, the Fund has
adopted and implemented a liquidity risk management program (the “Program”). SSGA FM has been designated by the Board to administer the Fund's Program. The Program’s principal objectives include assessing, managing and periodically
reviewing each Fund’s liquidity risk, based on factors specific to the circumstances of the Fund. Liquidity risk is defined as the risk that a Fund could not meet redemption requests without significant dilution of remaining investors’
interests in the Fund. SSGA FM provided the Board with a report addressing the operations of the Program and assessing its adequacy and the effectiveness of the Program’s implementation for the period ending December 2021. As reported to the
Board, the Program supported each Fund’s ability to honor redemption requests timely and SSGA FM’s management of each Fund’s liquidity profile, including during periods of market volatility. SSGA FM reported that the Program
operated adequately to meet the requirements of Rule 22e-4 and that the implementation of the Program has been effective.
There can be no assurance that the Program will achieve its
objectives in the future. Please refer to your Fund’s prospectus for more information regarding the Fund’s exposure to liquidity risk and other principal risks to which an investment in the Fund may be subject.
Proxy Voting Policies and Procedures and Records
The Fund has adopted the proxy voting policies of the Adviser.
A description of the Fund’s proxy voting policies and procedures that are used by the Fund's investment Adviser to vote proxies relating to the Fund's portfolio of securities are available (i) without charge, upon request by calling
1-800-997-7327 (toll free) and (ii) on the SEC's website at www.sec.gov.
Information regarding how the Fund voted for the prior
12-months period ended June 30 is available by August 31 of each year by calling the same number on the SEC’s website, at www.sec.gov, and on the Fund's website at
www.ssga.com.
Quarterly Portfolio Schedule
Following the Fund's first and third fiscal quarter-ends, a
complete Schedule of Investments is filed with the SEC as an exhibit on Form N-PORT, which can be found on the SEC's website at www.sec.gov, and on the Fund's website at
www.ssga.com. The Fund's Schedule of Investments is available upon request, without charge, by calling 1-800-997-7327 (toll free).
STATE STREET INSTITUTIONAL
INVESTMENT TRUST
STATE STREET DIVERSIFIED INCOME FUND
OTHER
INFORMATION (continued)
March 31, 2022 (Unaudited)
TRUSTEE CONSIDERATIONS IN APPROVAL OF INVESTMENT ADVISORY AGREEMENT
Overview of the Contract Approval Process
Under the Investment Company Act of 1940, as amended, an
investment advisory agreement between a mutual fund and its investment adviser must be approved by the fund’s board of trustees or its shareholders, and by a vote of a majority of those trustees who are not “interested persons” of
the fund (the “Independent Trustees”) cast in-person at a meeting called for the purpose of considering such approval.1
Consistent with these requirements, the Board of Trustees
(the “Board”) of State Street Institutional Investment Trust (the “Trust”), including a majority of the Independent Trustees, met telephonically or by videoconference (in reliance on the Orders) on November 17-18, 2021, to
consider a proposal to approve the investment advisory agreement (the “Advisory Agreement”) with SSGA Funds Management, Inc. (“SSGA FM” or the “Adviser”) on behalf of State Street Diversified Income Fund, a new
series of the Trust (the “New Fund”). Prior to voting on the proposal, the Independent Trustees, as well as the Trustee who is an “interested person” of the Adviser, reviewed information furnished by the Adviser and others
reasonably necessary to permit the Board to evaluate the proposal fully. The Independent Trustees were separately represented by counsel that is independent (“Independent Counsel”) of the Adviser in connection with their consideration of
approval of the Advisory Agreement. The Independent Trustees reviewed the proposed Advisory Agreement with respect to the New Fund in a private session with Independent Counsel at which no representatives of management were present. The Independent
Trustees also considered information provided with respect to the New Fund at the meeting of the Board held on September 15-16, 2021, and the Board took into account information regarding the Adviser and other service providers of the New Fund at
meetings of the Board and its committees held throughout the year. At the April 7, 2021 and May 24-25, 2021 Board meetings, the Independent Trustees also considered the renewal of the investment advisory agreement with the Adviser on behalf of
certain other funds in the fund complex (the “Other Funds”). The Independent Trustees considered, among other things, the following:
Information about
Comparable Fund Performance, Fees and Expenses
| •
|
Performance information
provided by the Adviser with respect to the proposed strategy for the New Fund. |
| •
|
A report
prepared by an independent third-party provider of investment company data, which included: |
o A comparison of the New Fund’s estimated expense ratio
(with detail of component expenses) to the expense ratios of a group of comparable mutual funds selected by the independent third-party data provider (the “Expense Group” and/or “Expense Universe”); and
o A comparison of the New Fund’s contractual and
estimated actual management fees to the contractual and actual management fees of the Expense Group and Expense Universe; and
| •
|
Profitability analyses for
(a) the Adviser with respect to Other Funds and (b) affiliates of the Adviser that provide services to the Other Funds. |
Information about
Portfolio Management
| •
|
Descriptions of the
investment management services to be provided by the Adviser to the New Fund as well as services provided to the Other Funds, including its investment strategies and processes; |
| •
|
A presentation provided by
the New Fund’s portfolio manager at the September 15-16, 2021 Board meeting regarding the New Fund’s proposed investment philosophy and approach; |
| •
|
Information concerning the
allocation of brokerage; and |
| •
|
Information regarding the procedures and processes to be used to value the assets of the New Fund. |
1 On March 25, 2020 and June 19, 2020, as a result of health and safety measures put in place to combat the global COVID-19 pandemic,
the Securities and Exchange Commission issued exemptive orders (the “Orders”) pursuant to Sections 6(c) and 38(a) of the 1940 Act, that temporarily exempt registered investment management companies from the in-person voting requirements
under the 1940 Act, subject to certain requirements, including that votes taken pursuant to the Orders are ratified at the next in-person meeting. The Board of the Trust determined that reliance on the Orders was necessary or appropriate due to the
circumstances related to current or potential effects of COVID-19 and therefore, the November 17-18, 2021 meeting was held telephonically in reliance on the Orders.
STATE STREET INSTITUTIONAL
INVESTMENT TRUST
STATE STREET DIVERSIFIED INCOME FUND
OTHER
INFORMATION (continued)
March 31, 2022 (Unaudited)
Information about the
Adviser
| •
|
Reports detailing the
financial results and condition of the Adviser and its affiliates; |
| •
|
Descriptions of the
qualifications, education and experience of the individual investment professionals who will be responsible for managing the New Fund; |
| •
|
Information relating to
compliance with and the administration of the Code of Ethics adopted by the Adviser; |
| •
|
Information about the
Adviser’s proxy voting policies and procedures and information regarding the Adviser’s practices for overseeing proxy vendors; |
| •
|
Information concerning
the resources to be devoted by the Adviser to overseeing compliance by the New Fund and its service providers, including the Adviser’s record of compliance with investment policies and restrictions and other operating policies of the Other
Funds; |
| •
|
A description of the
adequacy and sophistication of the Adviser’s technology and systems with respect to investment and administrative matters and a description of any material improvements or changes in technology or systems in the past year; |
| •
|
A description of the
business continuity and disaster recovery plans of the Adviser; and |
| •
|
Information regarding the Adviser’s cybersecurity and risk management processes. |
Other Relevant
Information
| •
|
Information concerning the
nature, extent, quality and cost of various services to be provided to the New Fund by SSGA FM in its capacity as administrator; |
| •
|
Information concerning
the nature, extent, quality and cost of various non-investment management services to be provided to the New Fund by affiliates of SSGA FM, including the custodian, sub-administrator and fund accountant of the New Fund, and the role of SSGA FM in
managing the New Fund’s relationships with these service providers; |
| •
|
Copies of the Advisory
Agreement and agreements with other service providers of the New Fund; |
| •
|
Responses to a request for information reviewed by the Board and Independent Counsel requesting specific information regarding the Other Funds, certain of which was applicable to the New Fund, from each of: |
o SSGA FM, in its capacity as the Other Funds’
Adviser and Administrator, with respect to its operations relating to the Other Funds and its approximate profit margins before taxes from such operations for the calendar year ended December 31, 2020; and the relevant operations of other affiliated
service providers to the Other Funds, together with their approximate profit margins from such relevant operations for the calendar year ended December 31, 2020;
o State Street Bank and Trust Company (“State
Street”), the sub-administrator, custodian, and fund accountant for the Other Funds with respect to its operations relating to the Other Funds; and
o State Street Global Advisors Funds Distributors, LLC, the
principal underwriter and distributor of the shares of the Other Funds (the “Distributor”), with respect to its operations relating to the Other Funds.
In addition to the information identified above, the Board
considered information provided from time to time by the Adviser and other service providers of the Other Funds throughout the year at meetings of the Board and its committees. At such meetings, the Board received, among other things, presentations
by the portfolio managers and other investment professionals of the Adviser relating to the performance of the Other Funds and the investment strategies used in pursuing the Other Funds’ investment objectives.
The Independent Trustees were assisted throughout the
contract approval process by their Independent Counsel. The Independent Trustees relied upon the advice of such counsel and their own business judgment in determining the material factors to be considered in evaluating the Advisory Agreement, and
the weight to be given to each such factor. The conclusions reached with respect to the Advisory Agreement were based on a comprehensive evaluation of all the information provided and not any single factor. Moreover, each Trustee may have placed
varying emphasis on particular factors in reaching conclusions with respect to the New Fund.
STATE STREET INSTITUTIONAL
INVESTMENT TRUST
STATE STREET DIVERSIFIED INCOME FUND
OTHER
INFORMATION (continued)
March 31, 2022 (Unaudited)
Results of the Process
Based on a consideration of the foregoing and such other
information as deemed relevant, including the factors and conclusions described below, on November 17-18, 2021, the Board, including a majority of the Independent Trustees, voted to approve the Advisory Agreement with respect to the New Fund.
Nature, Extent and
Quality of Services
In considering whether to
approve the Advisory Agreement, the Board evaluated the nature, extent and quality of services to be provided to the New Fund by the Adviser.
The Board considered the Adviser’s management
capabilities and investment process with respect to the types of investments to be held by the New Fund, including the education, experience and number of investment professionals and other personnel who will provide portfolio management, investment
research, and similar services to the New Fund. The Board evaluated, where relevant, the abilities and experience of such investment personnel in analyzing particular markets, industries and specific issuers of securities in these markets and
industries. The Board considered the extensive experience and resources committed by the Adviser to risk management, including with respect to investment risk, liquidity risk, operational risk, counterparty risk and model risk. The Trustees also
considered the significant risks assumed by the Adviser in connection with the services to be provided to the New Fund, including reputational and entrepreneurial risks. The Board also took into account the compensation paid to recruit and retain
investment personnel, and the time and attention to be devoted to the New Fund by senior management, as well as the Adviser’s succession planning process.
The Board had previously reviewed the compliance programs
of the Adviser and various affiliated service providers. Among other things, the Board considered compliance and reporting matters relating to personal trading by investment personnel, selective disclosure of portfolio holdings, late trading,
frequent trading, portfolio valuation, business continuity, the allocation of investment opportunities and the voting of proxies. The Board also considered the performance of certain portions of the business continuity plan which have been invoked
in response to the COVID-19 pandemic.
On the basis of
the foregoing and other relevant information, the Board concluded that the Adviser can be expected to provide high quality investment management and related services for the New Fund.
Fund
Performance
Because the New Fund had not yet
commenced operations, the Board noted that it could not draw any conclusions regarding the performance of the New Fund. The Board, however, considered back-tested performance information provided by the Adviser with respect to the proposed strategy
for the New Fund as compared to various benchmarks. The Board took into account that the back-tested performance information was hypothetical and noted its inherent limitations.
The Board also noted that it reviews at its regularly
scheduled meetings information about the performance of the Other Funds, and concluded that it was generally satisfied with the performance of these Other Funds.
Management Fees and
Expenses
The Board reviewed the contractual
management fee rate to be paid by the New Fund. As part of its review, the Board considered the New Fund’s contractual and actual management fee and total expense ratio, including the portion attributable to administrative services provided by
SSGA FM, as compared to New Fund’s Expense Group and Expense Universe. The Board considered that the proposed contractual management fee for the New Fund was below the median of the New Fund’s Expense Group. The Board also considered
that the New Fund’s estimated actual management fee was below the medians of the New Fund’s Expense Group and Expense Universe. The Board also considered that the New Fund’s estimated actual total expenses were above the medians of
its Expense Group and Expense Universe. The Board took into account that SSGA FM had agreed to contractually limit the New Fund’s expenses through at least April 30, 2023.
Profitability
Because the New Fund had not yet commenced operations, the
Board noted that it could not draw any conclusions regarding the profitability of the New Fund. The Board, however, reviewed the level of profits realized by the Adviser and its affiliates in providing investment advisory and other services to the
Other Funds. The Board considered other direct and indirect benefits received by the Adviser and the affiliated service providers in connection with their relationships with the Other Funds, together with the profitability of each of the affiliated
service providers with respect to their services to the Other Funds. The Board also considered the various risks borne by the Adviser and the affiliated
STATE STREET INSTITUTIONAL
INVESTMENT TRUST
STATE STREET DIVERSIFIED INCOME FUND
OTHER
INFORMATION (continued)
March 31, 2022 (Unaudited)
service providers in connection with their various roles in servicing the New
Fund and the Other Funds, including enterprise, litigation, business, operational and entrepreneurial risk.
Economies of
Scale
In reviewing expected management fees
and anticipated profitability, the Board also considered the extent to which the Adviser and its affiliates, on the one hand, and the New Fund and the fund complex, on the other hand, can expect to realize benefits from economies of scale as the
assets of the New Fund and fund complex increase. The Board acknowledged the difficulty in accurately measuring the expected benefits resulting from the economies of scale with respect to the management of the New Fund in view of the fact that the
New Fund had not yet commenced operations. The Board concluded that, in light of the fact that the New Fund had not yet commenced operations, and the comparative management fee and expense ratio of the New Fund, it did not appear that the Adviser or
its affiliates expected to realize benefits from economies of scale in managing the assets of the New Fund to such an extent that the proposed advisory fee should be reduced or that breakpoints in such fee should be implemented for the New Fund at
this time.
Conclusions
In reaching its decision to approve the Advisory
Agreement, the Board did not identify any single factor as being controlling, but based its recommendation on each of the factors it considered. Each Trustee may have contributed different weight to the various factors. Based upon the materials
reviewed, the representations made and the considerations described above, and as part of their deliberations, the Board, including the Independent Trustees, concluded that the Adviser possesses the capability and resources to perform the duties
required of it under the Advisory Agreement.
Further,
based upon its review of the Advisory Agreement, the materials provided, and the considerations described above, the Board, including the Independent Trustees, concluded that (1) the terms of the Advisory Agreement are reasonable, fair, and in the
best interests of the New Fund and its shareholders, and (2) the rates to be payable under the Advisory Agreement are fair and reasonable in light of the usual and customary charges made for services of the same nature and quality.
Trustees
John R. Costantino
Michael F. Holland
Michael A. Jessee
Ellen M. Needham
Donna M. Rapaccioli
Patrick J. Riley
Richard D. Shirk
Investment Adviser and Administrator
SSGA Funds Management, Inc.
One Iron Street
Boston, MA
02210
Custodian and Sub-Administrator
State Street Bank and Trust Company
State Street Financial
Center
One Lincoln Street
Boston, MA 02111
Independent Registered Public Accounting Firm
Ernst & Young LLP
200 Clarendon Street
Boston, MA
02116
Legal Counsel
Ropes & Gray LLP
800 Boylston Street
Boston, MA
02199
Transfer Agent
DST Asset Manager Solutions, Inc.
State Street Global
Advisors
P.O. Box 219737
Kansas City, MO 64121-9737
Distributor
State Street Global Advisors Funds Distributors, LLC
One
Iron Street
Boston, MA 02210
This report is for shareholder information. This is not a
prospectus intended for use in the purchase or sale of shares of beneficial interest.
State Street Institutional Investment Trust
State Street Bank and Trust Company
P.O. Box 5049
Boston, MA 02206
The information contained in this report is intended
for the general information of shareholders of the Trust. This report is not authorized for distribution to prospective investors unless preceded or accompanied by a current Trust prospectus which contains important information concerning the Trust.
You may obtain a current prospectus and SAI from the Distributor by calling 1-800-997-7327 or visiting www.ssga.com. Please read the prospectus carefully before you invest.
Item 2. Code of Ethics.
Not applicable to
this filing.
Item 3. Audit Committee Financial Expert.
Not applicable to this filing.
Item 4. Principal
Accountant Fees and Services.
Not applicable to this filing.
Item 5. Audit Committee of Listed Registrants.
Not applicable to the Registrant.
Item 6.
Investments.
(a) Schedules of Investments are included as part of the reports to shareholders filed under Item 1 of this Form N-CSR.
(b) Not applicable to the Registrant.
Item 7. Disclosure of Proxy Voting Policies and Procedures for Closed-End Management Investment Companies.
Not applicable to the Registrant.
Item 8. Portfolio Managers of Closed-End Management Investment Companies.
Not applicable to the Registrant.
Item 9. Purchases
of Equity Securities by Closed-End Management Investment Company and Affiliated Purchasers.
Not applicable
to the Registrant.
Item 10. Submission of Matters to a Vote of Security Holders.
There were no material changes to the procedures by which shareholders may recommend nominees to the Registrant’s Board of Trustees.
Item 11. Controls and Procedures.
(a) The Trust’s principal executive officer and principal financial officer have concluded that the Trust’s disclosure controls and procedures (as
defined in Rule 30a-3(c) under the Investment Company Act of 1940, as amended (the “1940 Act”)) are effective to provide reasonable assurance that information required to be disclosed by the
Registrant on Form N-CSR is recorded, processed, summarized and reported as of a date within 90 days of the filing date of this report, based on their evaluation of these controls and procedures required by Rule 30a-3(b) under the 1940 Act and Rules 13a-15(b) or 15d-15(b) under the Securities Exchange Act of 1934, as amended.
(b) There were no changes in the Trust’s internal control over financial reporting (as defined in
Rule 30a-3(d) under the 1940 Act) that occurred during the period covered by this report that have materially affected, or are reasonably likely to materially affect, the Trust’s internal control
over financial reporting.
Item 12. Disclosure of Securities Lending Activities for Closed-End
Management Investment Companies.
(a) Not applicable to the Registrant.
(b) Not applicable to the Registrant.
Item 13.
Exhibits.
SIGNATURES
Pursuant to the requirements of the Securities Exchange Act of 1934, as amended, and the Investment Company Act of 1940, as amended, the Registrant has duly
caused this report to be signed on its behalf by the undersigned, thereunto duly authorized.
|
|
|
| Registrant: |
|
STATE STREET INSTITUTIONAL INVESTMENT TRUST |
|
|
|
|
|
| By: |
|
/s/ Ellen M. Needham |
|
|
Ellen M. Needham |
|
|
President |
|
|
| Date: |
|
June 3, 2022 |
Pursuant to the requirements of the Securities Exchange Act of 1934, as amended, and the Investment Company Act of 1940, as
amended, this report has been signed below by the following persons on behalf of the Registrant and in the capacities and on the dates indicated.
|
|
|
| By: |
|
/s/ Ellen M. Needham |
|
|
Ellen M. Needham |
|
|
President (Principal Executive Officer) |
|
|
| Date: |
|
June 3, 2022 |
|
|
| By: |
|
/s/ Bruce S. Rosenberg |
|
|
Bruce S. Rosenberg |
|
|
Treasurer (Principal Financial and Accounting Officer) |
|
|
| Date: |
|
June 3, 2022 |