UNITED STATES
SECURITIES AND EXCHANGE COMMISSION
Washington, D.C. 20549
FORM N-CSR
CERTIFIED SHAREHOLDER REPORT OF REGISTERED
MANAGEMENT INVESTMENT COMPANIES
Investment Company Act file number: 811-09819
STATE STREET INSTITUTIONAL INVESTMENT TRUST
(Exact name of registrant as specified in charter)
One Iron Street, Boston, Massachusetts 02210
(Address of principal executive offices)(Zip code)
| (Name and Address of Agent for Service) | Copy to: | |
| Sean O’Malley, Esq. Senior Vice President and Deputy General Counsel c/o SSGA Funds Management, Inc. One Iron Street Boston, Massachusetts 02210 |
Timothy W. Diggins, Esq. Ropes & Gray LLP 800 Boylston Street Boston, Massachusetts 02199-3600 | |
Registrant’s telephone number, including area code: (617) 664-1465
Date of fiscal year end: December 31
Date of reporting period: June 30, 2019
| Item 1. | Reports to Stockholders. |
| State Street Defensive Global Equity Fund |

| ASSETS | |
|
Investment in affiliated State Street Defensive Global Equity
Portfolio |
$2,290,692 |
|
Receivable for investments
sold |
4,502 |
|
Receivable from
Adviser |
23,975 |
|
TOTAL ASSETS
|
2,319,169 |
| LIABILITIES | |
|
Advisory fee
payable |
1,407 |
|
Custodian fees
payable |
2,238 |
|
Administration fees
payable |
94 |
|
Trustees’ fees and expenses
payable |
879 |
|
Transfer agent fees
payable |
180 |
|
Registration and filing fees
payable |
560 |
|
Professional fees
payable |
10,456 |
|
Printing and postage fees
payable |
22,950 |
|
Accrued expenses and other
liabilities |
175 |
|
TOTAL LIABILITIES
|
38,939 |
|
NET ASSETS
|
$2,280,230 |
| NET ASSETS CONSIST OF: | |
|
Paid-in
Capital |
$1,759,106 |
|
Total distributable earnings
(loss) |
521,124 |
|
NET ASSETS
|
$2,280,230 |
| Class I | |
|
Net
Assets |
$2,280,230 |
|
Shares
Outstanding |
189,192 |
|
Net asset value, offering and redemption price per
share |
$ 12.05 |
| COST OF INVESTMENTS: | |
|
Investment in affiliated State Street Defensive Global Equity
Portfolio |
$2,399,708 |
|
Shares of affiliated State Street Defensive Global Equity
Portfolio |
208,245 |
| INVESTMENT INCOME | |
|
Dividend income from affiliated State Street Defensive Global Equity
Portfolio |
$ — |
| EXPENSES | |
|
Advisory
fee |
8,187 |
|
Administration
fees |
546 |
|
Custodian
fees |
18,528 |
|
Trustees’ fees and expenses
|
9,921 |
|
Transfer agent
fees |
653 |
|
Sub-transfer agent
fee |
447 |
|
Registration and filing
fees |
16,005 |
|
Professional fees and
expenses |
20,320 |
|
Printing and postage
fees |
10,649 |
|
Insurance
expense |
14 |
|
Miscellaneous
expenses |
3,911 |
|
TOTAL
EXPENSES |
89,181 |
|
Expenses waived/reimbursed by the
Adviser |
(80,533) |
|
NET
EXPENSES |
8,648 |
|
NET INVESTMENT INCOME
(LOSS) |
$ (8,648) |
| REALIZED AND UNREALIZED GAIN (LOSS) | |
| Net realized gain (loss) on: | |
|
Investment in affiliated State Street Defensive Global Equity
Portfolio |
(5,634) |
| Net change in unrealized appreciation/depreciation on: | |
|
Investment in affiliated State Street Defensive Global Equity
Portfolio |
268,401 |
|
NET REALIZED AND UNREALIZED GAIN
(LOSS) |
262,767 |
|
NET INCREASE (DECREASE) IN NET ASSETS FROM
OPERATIONS |
$254,119 |
| Six
Months Ended 6/30/19 (Unaudited) |
Year
Ended 12/31/18 | ||
| INCREASE (DECREASE) IN NET ASSETS FROM OPERATIONS: | |||
|
Net investment income
(loss) |
$ (8,648) | $ 91,782 | |
|
Net realized gain
(loss) |
(5,634) | 657,138 | |
|
Net change in unrealized
appreciation/depreciation |
268,401 | (1,144,102) | |
|
Net increase (decrease) in net assets resulting from
operations |
254,119 | (395,182) | |
| DISTRIBUTIONS TO SHAREHOLDERS: | |||
|
Class
I |
— | (169,911) | |
| FROM BENEFICIAL INTEREST TRANSACTIONS: | |||
| Class I | |||
|
Proceeds from sale of shares
sold |
65,801 | 589,000 | |
|
Reinvestment of
distributions |
— | 140,917 | |
|
Cost of shares
redeemed |
(40,352) | (3,117,534) | |
|
Net increase (decrease) in net assets from beneficial interest transactions
|
25,449 | (2,387,617) | |
|
Net increase (decrease) in net assets during the
period |
279,568 | (2,952,710) | |
|
Net assets at beginning of
period |
2,000,662 | 4,953,372 | |
|
NET ASSETS AT END OF
PERIOD |
$2,280,230 | $ 2,000,662 | |
| SHARES OF BENEFICIAL INTEREST: | |||
| Class I | |||
|
Shares
sold |
5,732 | 46,968 | |
|
Reinvestment of
distributions |
— | 13,295 | |
|
Shares
redeemed |
(3,390) | (270,385) | |
|
Net increase (decrease) from share
transactions |
2,342 | (210,122) |
| Class I | |||||||
| Six
Months Ended 6/30/19 (Unaudited) |
Year
Ended 12/31/18 |
Year
Ended 12/31/17 |
For
the Period 2/19/2016* - 12/31/16 | ||||
|
Net asset value, beginning of
period |
$10.71 | $12.48 | $10.65 | $10.00 | |||
| Income (loss) from investment operations: | |||||||
|
Net investment income (loss)
(a) |
(0.05) | 0.23 | 0.32 | 0.21 | |||
|
Net realized and unrealized gain
(loss) |
1.39 | (1.02) | 1.94 | 0.77 | |||
|
Total from investment
operations |
1.34 | (0.79) | 2.26 | 0.98 | |||
| Distributions to shareholders from: | |||||||
|
Net investment
income |
— | (0.50) | (0.39) | (0.31) | |||
|
Net realized
gains |
— | (0.48) | (0.04) | (0.02) | |||
|
Total
distributions |
— | (0.98) | (0.43) | (0.33) | |||
|
Net asset value, end of
period |
$12.05 | $10.71 | $12.48 | $10.65 | |||
|
Total return
(b) |
12.51% | (6.27)% | 21.26% | 9.85% | |||
| Ratios and Supplemental Data: | |||||||
|
Net assets, end of period (in
000s) |
$2,280 | $2,001 | $4,953 | $3,194 | |||
| Ratios to Average Net Assets: | |||||||
|
Total
expenses |
8.17%(c) | 3.43% | 4.48% | 5.37%(c) | |||
|
Net
expenses |
0.79%(c) | 0.76% | 0.76% | 0.75%(c) | |||
|
Net investment income
(loss) |
(0.79)%(c) | 1.80% | 2.72% | 2.26%(c) | |||
|
Portfolio turnover rate
(d) |
33%(e) | 64% | 39% | 38%(e) | |||
| * | Commencement of operations. |
| (a) | Per share numbers have been calculated using average shares outstanding, which more appropriately presents the per share data for the period. |
| (b) | Total return is calculated assuming a purchase of shares at net asset value on the first day and a sale at net asset value on the last day of each period reported. Distributions are assumed, for the purpose of this calculation, to be reinvested at net asset value per share on the respective payment dates of the Fund. Total return for periods less than one year are not annualized. Broker commission charges are not included in this calculation. |
| (c) | Annualized. |
| (d) | Portfolio turnover rate is from the State Street Defensive Global Equity Portfolio. |
| (e) | Not annualized. |
| Fund | Classes | Commencement
of Operations |
Diversification
Classification |
| State Street Defensive Global Equity Fund (formerly, State Street Disciplined Global Equity Fund) | Class
A Class I Class K |
Not
commenced February 19, 2016 Not commenced |
Diversified |
| Fund | Number of 10% Affiliated Account Holders | Percentage of Affiliated Ownership | ||
|
State Street Defensive Global Equity
Fund |
1 | 15.55% |
| Tax
Cost |
Gross
Unrealized Appreciation |
Gross
Unrealized Depreciation |
Net
Unrealized Appreciation (Depreciation) | ||||
|
State Street Defensive Global Equity
Fund |
$2,404,582 | $— | $113,890 | $(113,890) |
| Actual | Hypothetical
(assuming a 5% return before expenses) | ||||||||
| Annualized
Expense Ratio |
Ending
Account Value |
Expenses
Paid During Period(a) |
Ending
Account Value |
Expenses
Paid During Period(a) | |||||
|
State Street Defensive Global Equity
Fund |
|||||||||
|
Class
I(b) |
0.79% | $1,125.10 | $4.16 | $1,020.90 | $3.96 | ||||
| (a) | Expenses are equal to the Fund's annualized net expense ratio multiplied by the average account value of the period, multiplied by 181, then divided by 365. |
| (b) | Because the Fund invests all of its assets in the Portfolio, the expense example reflects the net expenses of both the Fund and the Portfolio. |
| • | A report prepared by an independent third-party provider of investment company data, which includes for the Fund: |
| • | Comparisons of the Fund’s performance over the past one-year period ended December 31, 2018, to the performance of an appropriate benchmark constructed by Broadridge Financial Solutions, Inc., the successor to Lipper, Inc. (“Broadridge”), for the Fund (the “Lipper Index”) and a universe of other mutual funds with similar investment objectives and policies (the “Performance Group” and/or the “Performance Universe”); |
| • | Comparisons of the Fund’s expense ratio (with detail of component expenses) to the expense ratios of a group of comparable mutual funds selected by the independent third-party data provider (the “Expense Group” and/or “Expense Universe”); |
| • | A chart showing the Fund’s historical average net assets relative to its total expenses, management fees, and non-management expenses over the past two calendar years; and |
| • | Comparisons of the Fund’s contractual management fee to the contractual management fees of comparable mutual funds at different asset levels. |
| • | Profitability analyses for (a) the Adviser with respect to the Fund and (b) affiliates of the Adviser that provide services to the Fund (“Affiliated Service Providers”). |
| • | Descriptions of the investment management services provided by the Adviser, including its investment strategies and processes; |
| • | Information concerning the allocation of brokerage; and |
| • | Information regarding the procedures and processes used to value the assets of the Fund. |
| • | Reports detailing the financial results and condition of the Adviser and its affiliates; |
| • | Descriptions of the qualifications, education and experience of the individual investment and other professionals responsible for managing the portfolio of the Fund and for Fund operations; |
| • | Information relating to compliance with and the administration of the Code of Ethics adopted by the Adviser; |
| • | A copy of the Adviser’s proxy voting policies and procedures and other information regarding the Adviser’s practices for overseeing proxy vendors; |
| • | Information concerning the resources devoted by the Adviser to overseeing compliance by the Fund and its service providers, including information concerning compliance with investment policies and restrictions and other operating policies of the Fund; |
| • | A description of the adequacy and sophistication of the Adviser’s technology and systems with respect to investment and administrative matters and a description of any material improvements or changes in technology or systems in the past year; |
| • | A description of the business continuity and disaster recovery plans of the Adviser; and |
| • | Information regarding the Adviser’s risk management processes. |
| • | Information concerning the nature, extent, quality and cost of services provided to the Fund by SSGA FM in its capacity as the Fund’s administrator (the “Administrator”); |
| • | Information concerning the nature, extent, quality and cost of various non-investment management services provided to the Fund by affiliates of the Adviser, including the custodian, sub-administrator, fund accountant and securities lending agent of the Fund, and the role of the Adviser in managing the Fund’s relationship with these service providers; |
| • | Copies of the Advisory Agreement and agreements with other service providers of the Fund; |
| • | Draft responses to a letter from independent legal counsel to the Independent Trustees ( “Independent Counsel”), reviewed prior to such date by Independent Counsel, requesting specific information from each of: |
| • | SSGA FM, in its capacity as the Fund’s Adviser and Administrator, with respect to its operations relating to the Fund and its approximate profit margins from such operations for the calendar year ended December 31, 2018; and the relevant operations of other affiliated service providers to the Fund, together with their approximate profit margins from such relevant operations for the calendar year ended December 31, 2018; |
| • | State Street Bank and Trust Company (“State Street”), the sub-administrator, custodian and securities lending agent for the Fund, with respect to its operations relating to the Fund; and |
| • | State Street Global Advisors Funds Distributors, LLC, the principal underwriter and distributor of the shares of the Fund (the “Distributor”), with respect to its operations relating to the Fund, together with the Fund’s related distribution plans and arrangements under Rule 12b-1 of the 1940 Act; |
| • | Information from SSGA FM, State Street and the Distributor with respect to the Trust providing any material changes to the previous information supplied in response to the letter from Independent Counsel prior to the executive session of the Board on May 15, 2019; |
| • | Materials provided by Broadridge, circulated to the Independent Trustees and to Independent Counsel, with respect to the Fund; and |
| • | A summary of the foregoing materials prepared by Independent Counsel. |
State Street Bank and Trust Company
P.O. Box 5049
Boston, MA 02206
| State Street Defensive Global Equity Portfolio |

|
|
1 |
|
|
2 |
|
|
5 |
|
|
7 |
|
|
8 |
|
|
9 |
|
|
10 |
|
|
11 |
|
|
17 |
|
|
18 |
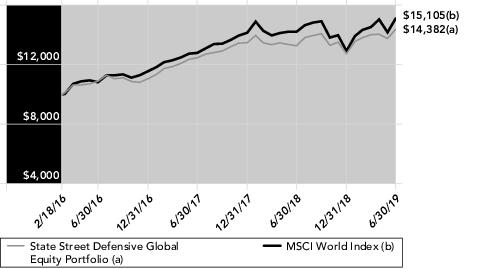
| Cumulative Total Return | Average Annual Total Return | ||||||||
| Net
Asset Value |
Market
Value |
MSCI World Index | Net
Asset Value |
Market
Value |
MSCI World Index | ||||
| ONE YEAR | 8.38% | N/A | 6.33% | 8.38% | N/A | 6.33% | |||
| SINCE INCEPTION(1) | 43.82% | N/A | 51.05% | 11.40% | N/A | 13.05% | |||
| (1) | For the period February 18, 2016 to June 30, 2019. |
(Based on Net Asset Value)
| Description | Market Value | % of Net Assets | ||
| Waste Management, Inc. | 35,649 | 1.6% | ||
| McDonald's Corp. | 34,679 | 1.5 | ||
| DTE Energy Co. | 34,144 | 1.5 | ||
| Merck & Co., Inc. | 34,127 | 1.5 | ||
| Baxter International, Inc. | 33,661 | 1.5 | ||
| TOTAL | 172,260 | 7.6% |
| % of Net Assets | |||
| Insurance | 11.8% | ||
| Pharmaceuticals | 11.8 | ||
| Electric Utilities | 7.1 | ||
| Diversified Telecommunication Services | 6.3 | ||
| Multi-Utilities | 4.9 | ||
| Banks | 4.9 | ||
| Food & Staples Retailing | 4.9 | ||
| Equity Real Estate Investment Trusts (REITs) | 3.8 | ||
| Specialty Retail | 3.7 | ||
| Food Products | 3.1 | ||
| Health Care Providers & Services | 3.0 | ||
| Hotels, Restaurants & Leisure | 2.8 | ||
| Health Care Equipment & Supplies | 2.7 | ||
| Household Products | 2.5 | ||
| Trading Companies & Distributors | 2.4 | ||
| Beverages | 2.2 | ||
| Automobiles | 2.2 | ||
| Communications Equipment | 2.0 | ||
| Aerospace & Defense | 2.0 | ||
| Commercial Services & Supplies | 2.0 | ||
| Oil, Gas & Consumable Fuels | 2.0 | ||
| Tobacco | 1.9 | ||
| Consumer Finance | 1.4 | ||
| Airlines | 1.3 | ||
| Gas Utilities | 1.2 | ||
| Metals & Mining | 1.2 | ||
| Multiline Retail | 1.2 | ||
| Construction & Engineering | 1.1 | ||
| Technology Hardware, Storage & Peripherals | 0.9 | ||
| Chemicals | 0.5 | ||
| Mortgage Real Estate Investment Trust (REITs) | 0.3 | ||
| Short-Term Investment | 0.5 | ||
| Other Assets in Excess of Liabilities | 0.4 | ||
| TOTAL | 100.0% |
| Description | Level
1 – Quoted Prices |
Level
2 – Other Significant Observable Inputs |
Level
3 – Significant Unobservable Inputs |
Total | ||||
| ASSETS: | ||||||||
| INVESTMENTS: | ||||||||
|
Common
Stocks |
$2,269,670 | $— | $— | $2,269,670 | ||||
|
Rights |
511 | — | — | 511 | ||||
|
Short-Term
Investment |
10,308 | — | — | 10,308 | ||||
|
TOTAL
INVESTMENTS |
$2,280,489 | $— | $— | $2,280,489 |
| Number
of Shares Held at 6/30/18 |
Value
at 6/30/18 |
Cost
of Purchases |
Proceeds
from Shares Sold |
Realized
Gain (Loss) |
Change
in Unrealized Appreciation/ Depreciation |
Number
of Shares Held at 6/30/19 |
Value
at 6/30/19 |
Dividend
Income | |||||||||
|
State Street Institutional U.S. Government Money Market Fund, Class G
Shares |
33,569 | $33,569 | $912,324 | $935,585 | $— | $— | 10,308 | $10,308 | $778 |
| ASSETS | |
|
Investments in unaffiliated issuers, at
value |
$2,270,181 |
|
Investments in affiliated issuers, at
value |
10,308 |
|
Total
Investments |
2,280,489 |
|
Foreign currency, at
value |
6,485 |
|
Dividends receivable — unaffiliated
issuers |
2,820 |
|
Dividends receivable — affiliated
issuers |
61 |
|
Receivable from
Adviser |
472 |
|
Receivable for foreign taxes
recoverable |
4,529 |
|
TOTAL ASSETS
|
2,294,856 |
| LIABILITIES | |
|
Payable for fund shares
repurchased |
4,503 |
|
Advisory fee
payable |
472 |
|
Trustees’ fees and expenses
payable |
7 |
|
TOTAL LIABILITIES
|
4,982 |
|
NET ASSETS
|
$2,289,874 |
| NET ASSETS CONSIST OF: | |
|
Paid-in
Capital |
$1,905,167 |
|
Total distributable earnings
(loss) |
384,707 |
|
NET ASSETS
|
$2,289,874 |
| NET ASSET VALUE PER SHARE | |
|
Net asset value per
share |
$ 11.00 |
|
Shares outstanding (unlimited amount authorized, no par
value) |
208,245 |
| COST OF INVESTMENTS: | |
|
Investments in unaffiliated
issuers |
$2,017,360 |
|
Investments in affiliated
issuers |
10,308 |
|
Total cost of
investments |
$2,027,668 |
|
Foreign currency, at
cost |
$ 6,458 |
| INVESTMENT INCOME | |
|
Dividend income — unaffiliated
issuers |
$ 105,980 |
|
Dividend income — affiliated
issuers |
778 |
|
Foreign taxes
withheld |
(5,288) |
|
TOTAL INVESTMENT INCOME
(LOSS) |
101,470 |
| EXPENSES | |
|
Advisory
fee |
9,302 |
|
Trustees’ fees and expenses
|
79 |
|
Miscellaneous
expenses |
700 |
|
TOTAL
EXPENSES |
10,081 |
|
Expenses waived/reimbursed by the
Adviser |
(10,081) |
|
NET
EXPENSES |
— |
|
NET INVESTMENT INCOME
(LOSS) |
$ 101,470 |
| REALIZED AND UNREALIZED GAIN (LOSS) | |
| Net realized gain (loss) on: | |
|
Investments — unaffiliated
issuers |
85,100 |
|
Foreign currency
transactions |
(1,558) |
|
Net realized gain
(loss) |
83,542 |
| Net change in unrealized appreciation/depreciation on: | |
|
Investments — unaffiliated
issuers |
(205,040) |
|
Foreign currency
translations |
337 |
|
Net change in unrealized
appreciation/depreciation |
(204,703) |
|
NET REALIZED AND UNREALIZED GAIN
(LOSS) |
(121,161) |
|
NET INCREASE (DECREASE) IN NET ASSETS FROM
OPERATIONS |
$ (19,691) |
| Year
Ended 6/30/19 |
Year
Ended 6/30/18 | ||
| INCREASE (DECREASE) IN NET ASSETS FROM OPERATIONS: | |||
|
Net investment income
(loss) |
$ 101,470 | $ 168,284 | |
|
Net realized gain
(loss) |
83,542 | 222,062 | |
|
Net change in unrealized
appreciation/depreciation |
(204,703) | (82,662) | |
|
Net increase (decrease) in net assets resulting from
operations |
(19,691) | 307,684 | |
|
Distributions to shareholders (Note
9) |
(351,241) | (211,763) | |
| FROM BENEFICIAL INTEREST TRANSACTIONS: | |||
|
Proceeds from sale of shares
sold |
631,379 | 348,917 | |
|
Reinvestment of
distributions |
351,241 | 211,763 | |
|
Cost of shares
redeemed |
(3,326,507) | (282,814) | |
|
Net increase (decrease) in net assets from beneficial interest transactions
|
(2,343,887) | 277,866 | |
|
Net increase (decrease) in net assets during the
period |
(2,714,819) | 373,787 | |
|
Net assets at beginning of
period |
5,004,693 | 4,630,906 | |
|
NET ASSETS AT END OF
PERIOD |
$ 2,289,874 | $5,004,693 | |
| SHARES OF BENEFICIAL INTEREST: | |||
|
Shares
sold |
51,951 | 27,995 | |
|
Reinvestment of
distributions |
36,856 | 17,050 | |
|
Shares
redeemed |
(288,025) | (22,549) | |
|
Net increase (decrease) from share
transactions |
(199,218) | 22,496 |
| State Street Defensive Global Equity Portfolio | |||||||
| Year
Ended 6/30/19 |
Year
Ended 6/30/18 |
Year
Ended 6/30/17 |
For
the Period 2/19/16* - 6/30/16 | ||||
|
Net asset value, beginning of
period |
$12.28 | $12.03 | $10.89 | $10.00 | |||
|
Net investment income (loss)
(a) |
0.33 | 0.42 | 0.31 | 0.15 | |||
|
Net realized and unrealized gain
(loss) |
0.39 | 0.36 | 1.21 | 0.74 | |||
|
Total from investment
operations |
0.72 | 0.78 | 1.52 | 0.89 | |||
| Distributions to shareholders from: | |||||||
|
Net investment
income |
(0.74) | (0.38) | (0.28) | — | |||
|
Net realized
gains |
(1.26) | (0.15) | (0.10) | — | |||
|
Total
distributions |
(2.00) | (0.53) | (0.38) | — | |||
|
Net asset value, end of
period |
$11.00 | $12.28 | $12.03 | $10.89 | |||
|
Total return
(b) |
8.38% | 6.48% | 14.43% | 8.90%(c) | |||
| Ratios and Supplemental Data: | |||||||
|
Net assets, end of period (in
000s) |
$2,290 | $5,005 | $4,631 | $3,270 | |||
| Ratios to average net assets: | |||||||
|
Total
expenses |
0.27% | 0.30% | 0.33% | 0.27%(d) | |||
|
Net
expenses |
—%(e) | —%(e) | —%(e) | —%(d)(e) | |||
|
Net investment income
(loss) |
2.73% | 3.37% | 2.75% | 4.00%(d) | |||
|
Portfolio turnover
rate |
72% | 47% | 30% | 21%(c) | |||
| * | Commencement of operations. |
| (a) | Per share numbers have been calculated using average shares outstanding, which more appropriately presents the per share data for the year. |
| (b) | Total return is calculated assuming a purchase of shares at net asset value on the first day and a sale at net asset value on the last day of each period reported. Distributions are assumed, for the purpose of this calculation, to be reinvested at net asset value per share on the respective payment dates. Total return for periods of less than one year is not annualized. Results represent past performance and are not indicative of future results. |
| (c) | Not annualized. |
| (d) | Annualized. |
| (e) | Amount is less than 0.005%. |
| Portfolio | Commencement of Operations | Diversification Classification |
| State Street Defensive Global Equity Portfolio | February 19, 2016 | Diversified |
| Purchases | Sales | ||
|
State Street Defensive Global Equity
Portfolio |
$2,613,446 | $5,111,777 |
| Ordinary
Income |
Long-Term
Capital Gains |
Total | |||
|
State Street Defensive Global Equity
Portfolio |
$165,202 | $186,039 | $351,241 |
| Ordinary
Income |
Long-Term
Capital Gains |
Total | |||
|
State Street Defensive Global Equity Portfolio
|
$ 186,089 | $ 25,674 | $ 211,763 |
| Undistributed
Ordinary Income |
Capital
Loss Carryforwards |
Undistributed
Long-Term Capital Gains |
Net
Unrealized Gains (Losses) |
Qualified
Late-Year Losses |
Total | ||||||
|
State Street Defensive Global Equity
Portfolio |
$56,472 | $— | $88,690 | $239,545 | $— | $384,707 |
| Tax
Cost |
Gross
Unrealized Appreciation |
Gross
Unrealized Depreciation |
Net
Unrealized Appreciation (Depreciation) | ||||
|
State Street Defensive Global Equity
Portfolio |
$2,041,022 | $273,004 | $33,537 | $239,467 |
| Net
Investment Income |
Net
Realized Capital Gains |
Total
Distributions |
Undistributed
Net Investment Income (Loss) | ||||
|
State Street Defensive Global Equity
Portfolio |
$151,316 | $60,447 | $211,763 | $77,508 |

August 26, 2019
| Actual | Hypothetical
(assuming a 5% return before expenses) | ||||||||
| Annualized
Expense Ratio |
Ending
Account Value |
Expenses
Paid During Period(a) |
Ending
Account Value |
Expenses
Paid During Period(a) | |||||
|
State Street Defensive Global Equity
Portfolio |
0.00% | $1,129.40 | $0.00 | $1,024.80 | $0.00 | ||||
| (a) | Expenses are equal to the Portfolio's annualized net expense ratio multiplied by the average account value of the period, multiplied by 181, then divided by 365. |
| Name,
Address and Year of Birth |
Position(s)
with Funds |
Term
of Office and Length of Time Served |
Principal
Occupation(s) During Past 5 Years |
Number
of Portfolios in Fund Complex Overseen by Trustee† |
Other
Directorships Held by Trustee During the Past 5 Years | |||||
| Trustees | ||||||||||
| Independent Trustees | ||||||||||
| FRANK
NESVET c/o SSGA Active Trust One Iron Street Boston, MA 02210 1943 |
Independent
Trustee, Chairman, Trustee Committee Chair |
Term:
Unlimited Served: since March 2011 |
Retired. | 128 | None. | |||||
| BONNY
EUGENIA BOATMAN c/o SSGA Active Trust One Iron Street Boston, MA 02210 1950 |
Independent
Trustee |
Term:
Unlimited Served: since March 2011 |
Retired. | 128 | None. | |||||
| DWIGHT
D. CHURCHILL c/o SSGA Active Trust One Iron Street Boston, MA 02210 1953 |
Independent
Trustee |
Term:
Unlimited Served: since March 2011 |
Self-employed
consultant since 2010; CEO and President, CFA Institute (June 2014-January 2015). |
128 | Affiliated
Managers Group, Inc. (Director). | |||||
| CARL
G. VERBONCOEUR c/o SSGA Active Trust One Iron Street Boston, MA 02210 1952 |
Independent
Trustee, Audit Committee Chair |
Term:
Unlimited Served: since March 2011 |
Self-employed
consultant since 2009. |
128 | The
Motley Fool Funds Trust (Trustee). | |||||
| CLARE
S. RICHER c/o SSGA Active Trust One Iron Street Boston, MA 02210 1958 |
Independent
Trustee |
Term:
Unlimited Served: since July 2018 |
Chief
Financial Officer, Putnam Investments LLC (December 2008 – May 2017). |
128 | Putnam
Acquisition Financing Inc. (Director); Putnam Acquisition Financing LLC (Director); Putnam GP Inc. (Director); Putnam Investor Services, Inc.(Director); Putnam Investments Limited (Director); University of Notre Dame (Trustee). | |||||
| SANDRA
G. SPONEM c/o SSGA Active Trust One Iron Street Boston, MA 02210 1958 |
Independent
Trustee |
Term:
Unlimited Served: since July 2018 |
Chief
Financial Officer, M.A. Mortenson Companies, Inc. (February 2007 – April 2017). |
128 | Guggenheim/Rydex
Funds (Trustee). |
| Name,
Address and Year of Birth |
Position(s)
with Funds |
Term
of Office and Length of Time Served |
Principal
Occupation(s) During Past 5 Years |
Number
of Portfolios in Fund Complex Overseen by Trustee† |
Other
Directorships Held by Trustee During the Past 5 Years | |||||
| Interested Trustee | ||||||||||
| JAMES
E. ROSS* SSGA Funds Management, Inc. One Iron Street Boston, MA 02210 1965 |
Interested
Trustee |
Term:
Unlimited Served as Trustee: since March 2011 |
Chairman
and Director, SSGA Funds Management, Inc. (2005-present); Executive Vice President and Principal, State Street Global Advisors (2006-present); Chief Executive Officer and Director, State Street Global Advisors Funds Distributors, LLC (May 2017- present); Director, State Street Global Markets, LLC (2013-April 2017); President, SSGA Funds Management, Inc. (2005-2012). |
189 | None. | |||||
| † For the purpose of determining the number of portfolios overseen by the Trustees, “Fund Complex” comprises registered investment companies for which SSGA Funds Management, Inc. serves as investment adviser. | ||||||||||
| * Mr. Ross is an Interested Trustee because of his employment with the Adviser and ownership interest in an affiliate of the Adviser. Mr. Ross previously served as an Interested Trustee from November 2005 to December 2009. | ||||||||||
| Name,
Address and Year of Birth |
Position(s)
with Funds |
Term
of Office and Length of Time Served |
Principal Occupation(s) During the Past 5 Years | |||
| Officers | ||||||
| ELLEN
M. NEEDHAM SSGA Funds Management, Inc. One Iron Street Boston, MA 02210 1967 |
President | Term:
Unlimited Served: since October 2012 |
President and Director, SSGA Funds Management, Inc. (2001 - present)*; Senior Managing Director, State Street Global Advisors (1992 - present)*; Director, State Street Global Advisors Funds Distributors, LLC (May 2017 - present). | |||
| BRUCE
S. ROSENBERG SSGA Funds Management, Inc. One Iron Street Boston, MA 02210 1961 |
Treasurer | Term:
Unlimited Served: since February 2016 |
Managing Director, State Street Global Advisors and SSGA Funds Management, Inc. (July 2015 - present); Director, Credit Suisse (April 2008 - July 2015). | |||
| ANN
M. CARPENTER SSGA Funds Management, Inc. One Iron Street Boston, MA 02210 1966 |
Vice
President; Deputy Treasurer |
Term:
Unlimited Served: since August 2012 |
Chief Operating Officer, SSGA Funds Management, Inc. (2005 - Present)*; Managing Director, State Street Global Advisors (2005 - present).* |
| Name,
Address and Year of Birth |
Position(s)
with Funds |
Term
of Office and Length of Time Served |
Principal Occupation(s) During the Past 5 Years | |||
| MICHAEL
P. RILEY SSGA Funds Management, Inc. One Iron Street Boston, MA 02210 1969 |
Vice
President |
Term:
Unlimited Served: since March 2011 |
Managing Director, State Street Global Advisors (2005 - present).* | |||
| SEAN
O’MALLEY SSGA Funds Management, Inc. One Iron Street Boston, MA 02210 1969 |
Chief
Legal Officer |
Term:
Unlimited Served: since August 2019 |
Senior Vice President and Deputy General Counsel, State Street Global Advisors (November 2013 -present). | |||
| ANDREW
DELORME SSGA Funds Management, Inc. One Iron Street Boston, MA 02210 1975 |
Secretary | Term:
Unlimited Served: since August 2019 |
Vice President and Senior Counsel, State Street Global Advisors (April 2016 - present); Vice President and Counsel, State Street Global Advisors (August 2014 - March 2016). | |||
| JAMES
GOUNDREY SSGA Funds Management, Inc. One Iron Street Boston, MA 02210 1977 |
Assistant
Secretary |
Term:
Unlimited Served: since August 2019 |
Vice President and Senior Counsel, State Street Global Advisors (April 2019 - present); Vice President and Counsel, State Street Global Advisors (August 2015 - April 2019); Attorney, MFS Investment Management (March 2012 - August 2015). | |||
| KEVIN
MORRIS SSGA Funds Management, Inc. One Iron Street Boston, MA 02210 1982 |
Assistant
Secretary |
Term:
Unlimited Served: since August 2019 |
Vice President and Senior Counsel, State Street Global Advisors (April 2019 - present); Vice President and Counsel, State Street Global Advisors (January 2016 -April 2019); Director, Asset Management Compliance, Fidelity Investments (June 2015 - January 2016); Senior Compliance Advisor, Asset Management Compliance, Fidelity Investments (June 2012 - June 2015). | |||
| DAVID
URMAN SSGA Funds Management, Inc. One Iron Street Boston, MA 02210 1985 |
Assistant
Secretary |
Term:
Unlimited Served: since August 2019 |
Vice President and Senior Counsel, State Street Global Advisors (April 2019 - present); Vice President and Counsel, State Street Global Advisors (August 2015 - April 2019); Associate, Ropes & Gray LLP (November 2012 - August 2015). | |||
| CHAD
C. HALLETT SSGA Funds Management, Inc. One Iron Street Boston, MA 02210 1969 |
Deputy
Treasurer |
Term:
Unlimited Served: since February 2016 |
Vice President, State Street Global Advisors and SSGA Funds Management, Inc. (November 2014 - present); Vice President, State Street Bank and Trust Company (2001 - November 2014).* | |||
| DARLENE
ANDERSON-VASQUEZ SSGA Funds Management, Inc. One Iron Street Boston, MA 02210 1968 |
Deputy
Treasurer |
Term:
Unlimited Served: since November 2016 |
Managing Director, State Street Global Advisors and SSGA Funds Management, Inc. (May 2016 - present); Senior Vice President, John Hancock Investments (September 2007 - May 2016). | |||
| ARTHUR
A. JENSEN SSGA Funds Management, Inc. 1600 Summer Street Stamford, CT 06905 1966 |
Deputy
Treasurer |
Term:
Unlimited Served: Since August 2017 |
Vice President at State Street Global Advisors (July 2016 – present); Mutual Funds Controller of GE Asset Management Incorporated (April 2011 - July 2016). | |||
| SUJATA
UPRETI SSGA Funds Management, Inc. One Iron Street Boston, MA 02210 1974 |
Assistant
Treasurer |
Term:
Unlimited Served: since February 2016 |
Vice President, State Street Global Advisors and SSGA Funds Management, Inc. (May 2015 - present); Assistant Director, Cambridge Associates, LLC (July 2014 - January 2015); Vice President, Bank of New York Mellon (July 2012 - August 2013); Manager, PricewaterhouseCoopers, LLP (September 2003 - July 2012). |
| Name,
Address and Year of Birth |
Position(s)
with Funds |
Term
of Office and Length of Time Served |
Principal Occupation(s) During the Past 5 Years | |||
| DANIEL
FOLEY SSGA Funds Management, Inc. One Iron Street Boston, MA 02210 1972 |
Assistant
Treasurer |
Term:
Unlimited Served: since February 2016 |
Vice President, State Street Global Advisors and SSGA Funds Management, Inc. (April 2007 - present).* | |||
| DANIEL
G. PLOURDE SSGA Funds Management, Inc. One Iron Street Boston, MA 02210 1980 |
Assistant
Treasurer |
Term:
Unlimited Served: since May 2017 |
Vice President, State Street Global Advisors and SSGA Funds Management, Inc. (May 2015 - present); Officer, State Street Bank and Trust Company (March 2009 - May 2015). | |||
| BRIAN
HARRIS SSGA Funds Management, Inc. One Iron Street Boston, MA 02210 1973 |
Chief
Compliance Officer; Anti-Money Laundering Officer; Code of Ethics Compliance Officer |
Term:
Unlimited Served: since November 2013 |
Managing Director, State Street Global Advisors and SSGA Funds Management, Inc. (June 2013 - present)*; Senior Vice President and Global Head of Investment Compliance, BofA Global Capital Management (2010 - 2013); Director of Compliance, AARP Financial Inc. (2008 - 2010). | |||
| * Served in various capacities and/or with various affiliated entities during noted time period. | ||||||
| The Statement of Additional Information (SAI) includes additional information about the Funds' directors and is available, without charge, upon request and by calling 1-866-787-2257. | ||||||
| State Street Equity 500 Index Fund |
| State Street Equity 500 Index II Portfolio |

| State Street Equity 500 Index Fund | |
|
|
1 |
|
|
2 |
|
|
3 |
|
|
5 |
| State Street Equity 500 Index II Portfolio | |
|
|
11 |
|
|
12 |
|
|
19 |
|
|
20 |
|
|
21 |
|
|
22 |
|
|
23 |
|
|
30 |
| ASSETS | |
|
Investment in affiliated State Street Equity 500 Index II
Portfolio |
$1,079,049,741 |
|
Receivable for fund shares
sold |
3,365,997 |
|
Receivable from
Adviser |
142,649 |
|
TOTAL ASSETS
|
1,082,558,387 |
| LIABILITIES | |
|
Payable for investments
purchased |
2,291,327 |
|
Payable for fund shares
repurchased |
1,068,073 |
|
Advisory fee
payable |
17,119 |
|
Custodian fees
payable |
3,319 |
|
Administration fees
payable |
37,214 |
|
Distribution fees
payable |
62,010 |
|
Trustees’ fees and expenses
payable |
1 |
|
Transfer agent fees
payable |
4,077 |
|
Registration and filing fees
payable |
1,551 |
|
Professional fees
payable |
13,791 |
|
Printing and postage fees
payable |
4,535 |
|
TOTAL LIABILITIES
|
3,503,017 |
|
NET ASSETS
|
$1,079,055,370 |
| NET ASSETS CONSIST OF: | |
|
Paid-in
Capital |
$ 822,964,609 |
|
Total distributable earnings
(loss) |
256,090,761 |
|
NET ASSETS
|
$1,079,055,370 |
| Administrative Shares | |
|
Net
Assets |
$ 249,533,158 |
|
Shares
Outstanding |
10,733,391 |
|
Net asset value, offering and redemption price per
share |
$ 23.25 |
| Service Shares | |
|
Net
Assets |
$ 24,159,836 |
|
Shares
Outstanding |
1,040,782 |
|
Net asset value, offering and redemption price per
share |
$ 23.21 |
| Class R Shares | |
|
Net
Assets |
$ 37,162,909 |
|
Shares
Outstanding |
1,603,220 |
|
Net asset value, offering and redemption price per
share |
$ 23.18 |
| Class A Shares | |
|
Net
Assets |
$ 44,755,878 |
|
Shares
Outstanding |
1,926,129 |
|
Net asset value, offering and redemption price per
share |
$ 23.24 |
|
Maximum sales
charge |
5.25% |
|
Maximum offering price per
share |
$ 24.53 |
| Class I Shares | |
|
Net
Assets |
$ 20,063,069 |
|
Shares
Outstanding |
862,166 |
|
Net asset value, offering and redemption price per
share |
$ 23.27 |
| Class K Shares | |
|
Net
Assets |
$ 703,380,520 |
|
Shares
Outstanding |
30,223,872 |
|
Net asset value, offering and redemption price per
share |
$ 23.27 |
| COST OF INVESTMENTS: | |
|
Investment in affiliated State Street Equity 500 Index II
Portfolio |
$ 844,573,337 |
|
Shares of affiliated State Street Equity 500 Index II
Portfolio |
77,351,236 |
| INVESTMENT INCOME | |
|
Dividend income from affiliated State Street Equity 500 Index II
Portfolio |
$ — |
| EXPENSES | |
|
Advisory
fee |
93,919 |
|
Administration
fees |
252,971 |
| Sub-transfer agent fee | |
|
Class A
Shares |
1,803 |
|
Class I
Shares |
6,681 |
| Distribution fees | |
|
Administrative
Shares |
176,823 |
|
Service
Shares |
29,638 |
|
Class R
Shares |
108,753 |
|
Class A
Shares |
47,700 |
|
Custodian
fees |
23,490 |
|
Trustees’ fees and expenses
|
9,001 |
|
Transfer agent
fees |
56,007 |
|
Registration and filing
fees |
83,912 |
|
Professional
fees |
20,459 |
|
Printing and postage
fees |
44,993 |
|
Insurance
expense |
2,236 |
|
TOTAL
EXPENSES |
958,386 |
|
Expenses waived/reimbursed by the
Adviser |
(493,199) |
|
NET
EXPENSES |
465,187 |
|
NET INVESTMENT INCOME
(LOSS) |
$ (465,187) |
| REALIZED AND UNREALIZED GAIN (LOSS) | |
| Net realized gain (loss) on: | |
|
Investment in affiliated State Street Equity 500 Index II
Portfolio |
(1,759,950) |
| Net change in unrealized appreciation/depreciation on: | |
|
Investment in affiliated State Street Equity 500 Index II
Portfolio |
156,070,850 |
|
NET REALIZED AND UNREALIZED GAIN
(LOSS) |
154,310,900 |
|
NET INCREASE (DECREASE) IN NET ASSETS FROM
OPERATIONS |
$153,845,713 |
| Six
Months Ended 6/30/19 (Unaudited) |
Year
Ended 12/31/18 | ||
| INCREASE (DECREASE) IN NET ASSETS FROM OPERATIONS: | |||
|
Net investment income
(loss) |
$ (465,187) | $ 15,536,242 | |
|
Net realized gain
(loss) |
(1,759,950) | 24,899,024 | |
|
Net change in unrealized
appreciation/depreciation |
156,070,850 | (81,450,733) | |
|
Net increase (decrease) in net assets resulting from
operations |
153,845,713 | (41,015,467) | |
| DISTRIBUTIONS TO SHAREHOLDERS: | |||
|
Administrative
Shares |
— | (10,174,158) | |
|
Service
Shares |
— | (978,293) | |
|
Class R
Shares |
— | (1,376,029) | |
|
Class A
Shares |
— | (1,405,739) | |
|
Class I
Shares |
— | (719,749) | |
|
Class K
Shares |
— | (23,877,315) | |
|
Total distributions to shareholders
|
— | (38,531,283) | |
| FROM BENEFICIAL INTEREST TRANSACTIONS: | |||
| Administrative Shares | |||
|
Proceeds from sale of shares
sold |
5,450,345 | 9,357,778 | |
|
Reinvestment of
distributions |
— | 10,174,158 | |
|
Cost of shares
redeemed |
(8,229,242) | (62,219,183) | |
|
Net increase (decrease) from capital share
transactions |
(2,778,897) | (42,687,247) | |
| Service Shares | |||
|
Proceeds from sale of shares
sold |
2,314,254 | 4,102,665 | |
|
Reinvestment of
distributions |
— | 978,293 | |
|
Cost of shares
redeemed |
(2,868,193) | (10,238,706) | |
|
Net increase (decrease) from capital share
transactions |
(553,939) | (5,157,748) | |
| Class R Shares | |||
|
Proceeds from sale of shares
sold |
5,511,391 | 4,648,251 | |
|
Reinvestment of
distributions |
— | 1,376,031 | |
|
Cost of shares
redeemed |
(6,386,320) | (13,452,753) | |
|
Net increase (decrease) from capital share
transactions |
(874,929) | (7,428,471) | |
| Class A Shares | |||
|
Proceeds from sale of shares
sold |
12,694,936 | 31,494,823 | |
|
Reinvestment of
distributions |
— | 1,402,869 | |
|
Cost of shares
redeemed |
(5,798,540) | (3,391,762) | |
|
Net increase (decrease) from capital share
transactions |
6,896,396 | 29,505,930 | |
| Class I Shares | |||
|
Proceeds from sale of shares
sold |
8,905,012 | 6,685,907 | |
|
Reinvestment of
distributions |
— | 719,747 | |
|
Cost of shares
redeemed |
(6,490,918) | (7,437,392) | |
|
Net increase (decrease) from capital share
transactions |
2,414,094 | (31,738) | |
| Class K Shares | |||
|
Proceeds from sale of shares
sold |
174,389,211 | 194,346,788 | |
|
Reinvestment of
distributions |
— | 23,710,448 | |
|
Cost of shares
redeemed |
(51,850,609) | (95,198,585) | |
|
Net increase (decrease) from capital share
transactions |
122,538,602 | 122,858,651 | |
|
Net increase (decrease) in net assets from beneficial interest transactions
|
127,641,327 | 97,059,377 | |
|
Net increase (decrease) in net assets during the
period |
281,487,040 | 17,512,627 | |
|
Net assets at beginning of
period |
797,568,330 | 780,055,703 | |
|
NET ASSETS AT END OF
PERIOD |
$1,079,055,370 | $797,568,330 | |
| SHARES OF BENEFICIAL INTEREST: | |||
| Administrative Shares | |||
|
Shares
sold |
246,362 | 419,401 | |
|
Reinvestment of
distributions |
— | 521,752 | |
|
Shares
redeemed |
(374,364) | (2,783,808) | |
|
Net increase (decrease) from share
transactions |
(128,002) | (1,842,655) | |
| Service Shares | |||
|
Shares
sold |
106,387 | 184,234 | |
|
Reinvestment of
distributions |
— | 50,220 | |
|
Shares
redeemed |
(130,952) | (459,714) | |
|
Net increase (decrease) from share
transactions |
(24,565) | (225,260) |
| Six
Months Ended 6/30/19 (Unaudited) |
Year
Ended 12/31/18 | ||
| Class R Shares | |||
|
Shares
sold |
$ 253,672 | $ 212,430 | |
|
Reinvestment of
distributions |
— | 70,602 | |
|
Shares
redeemed |
(286,333) | (602,656) | |
|
Net increase (decrease) from share
transactions |
(32,661) | (319,624) | |
| Class A Shares | |||
|
Shares
sold |
569,804 | 1,409,087 | |
|
Reinvestment of
distributions |
— | 71,942 | |
|
Shares
redeemed |
(261,478) | (154,202) | |
|
Net increase (decrease) from share
transactions |
308,326 | 1,326,827 | |
| Class I Shares | |||
|
Shares
sold |
414,853 | 299,239 | |
|
Reinvestment of
distributions |
— | 36,891 | |
|
Shares
redeemed |
(290,545) | (341,813) | |
|
Net increase (decrease) from share
transactions |
124,308 | (5,683) | |
| Class K Shares | |||
|
Shares
sold |
7,909,229 | 8,642,565 | |
|
Reinvestment of
distributions |
— | 1,215,297 | |
|
Shares
redeemed |
(2,380,147) | (4,257,351) | |
|
Net increase (decrease) from share
transactions |
5,529,082 | 5,600,511 |
| Administrative Shares | |||||||||||
| Six
Months Ended 06/30/19 (Unaudited) |
Year
Ended 12/31/18 |
Year
Ended 12/31/17 |
Year
Ended 12/31/16 |
Year
Ended 12/31/15 |
Year
Ended 12/31/14 | ||||||
|
Net asset value, beginning of
period |
$ 19.64 | $ 21.62 | $ 18.83 | $ 17.17 | $ 17.27 | $ 15.50 | |||||
| Income (loss) from investment operations: | |||||||||||
|
Net investment income (loss)
(a) |
(0.02) | 0.34 | 0.38 | 0.26 | 0.31 | 0.29 | |||||
|
Net realized and unrealized gain
(loss) |
3.63 | (1.33) | 3.66 | 1.76 | (0.12) | 1.79 | |||||
|
Total from investment
operations |
3.61 | (0.99) | 4.04 | 2.02 | 0.19 | 2.08 | |||||
| Distributions to shareholders from: | |||||||||||
|
Net investment
income |
— | (0.39) | (0.46) | (0.28) | (0.29) | (0.31) | |||||
|
Net realized
gains |
— | (0.60) | (0.79) | (0.08) | — | — | |||||
|
Total
distributions |
— | (0.99) | (1.25) | (0.36) | (0.29) | (0.31) | |||||
|
Net asset value, end of
period |
$ 23.25 | $ 19.64 | $ 21.62 | $ 18.83 | $ 17.17 | $ 17.27 | |||||
|
Total return
(b) |
18.38% | (4.56)% | 21.43% | 11.75% | 1.08% | 13.41% | |||||
| Ratios and Supplemental Data: | |||||||||||
|
Net assets, end of period (in
000s) |
$249,533 | $213,270 | $274,650 | $277,141 | $261,038 | $248,180 | |||||
| Ratios to Average Net Assets:(c) | |||||||||||
|
Total
expenses |
0.27%(d)(e) | 0.27%(e) | 0.26%(e) | 0.27%(e) | 0.31%(e) | 0.30%(f) | |||||
|
Net
expenses |
0.17%(d)(e) | 0.17%(e) | 0.18%(e) | 0.18%(e) | 0.18%(e) | 0.23%(f) | |||||
|
Net investment income
(loss) |
(0.17)%(d) | 1.51% | 1.83% | 1.48% | 1.76% | 1.78% | |||||
|
Portfolio turnover
rate |
3%(g)(h) | 8%(g) | 30%(g) | 5%(g) | 5%(g) | 4%(i) | |||||
| (a) | Net investment income per share is calculated using the average shares method. |
| (b) | Total return is calculated assuming a purchase of shares at net asset value on the first day and a sale at net asset value on the last day of each period reported. Distributions are assumed, for the purpose of this calculation, to be reinvested at net asset value per share on the respective payment dates. Total return for periods of less than one year is not annualized. Results represent past performance and are not indicative of future results. |
| (c) | Prior to August 11, 2014, the per shares amounts and percentages included the Fund’s proportionate share of income and expenses of the State Street Equity 500 Index Portfolio. |
| (d) | Annualized. |
| (e) | Ratio does not include the expenses of the State Street Equity 500 Index II Portfolio. |
| (f) | Ratio includes expenses allocated from the State Street Equity 500 Index Portfolio from 1/1/2014 through 8/10/2014, and does not include the expenses of the State Street Equity 500 Index II Portfolio from 8/11/2014 through 12/31/2014. |
| (g) | Portfolio turnover rate is from the State Street Equity 500 Index II Portfolio. |
| (h) | Not annualized. |
| (i) | Portfolio turnover rate is calculated from the State Street Equity 500 Index Portfolio (from 1/1/2014 to 8/10/2014) and the State Street Equity 500 Index II Portfolio (from 8/11/2014 to 12/31/2014). |
| Service Shares | |||||||||||
| Six
Months Ended 06/30/19 (Unaudited) |
Year
Ended 12/31/18 |
Year
Ended 12/31/17 |
Year
Ended 12/31/16 |
Year
Ended 12/31/15 |
Year
Ended 12/31/14 | ||||||
|
Net asset value, beginning of
period |
$ 19.62 | $ 21.60 | $ 18.81 | $ 17.15 | $ 17.25 | $ 15.49 | |||||
| Income (loss) from investment operations: | |||||||||||
|
Net investment income (loss)
(a) |
(0.03) | 0.32 | 0.15 | 0.26 | 0.22 | 0.28 | |||||
|
Net realized and unrealized gain
(loss) |
3.62 | (1.33) | 3.87 | 1.74 | (0.05) | 1.77 | |||||
|
Total from investment
operations |
3.59 | (1.01) | 4.02 | 2.00 | 0.17 | 2.05 | |||||
| Distributions to shareholders from: | |||||||||||
|
Net investment
income |
— | (0.37) | (0.44) | (0.26) | (0.27) | (0.29) | |||||
|
Net realized
gains |
— | (0.60) | (0.79) | (0.08) | — | — | |||||
|
Total
distributions |
— | (0.97) | (1.23) | (0.34) | (0.27) | (0.29) | |||||
|
Net asset value, end of
period |
$ 23.21 | $ 19.62 | $ 21.60 | $ 18.81 | $ 17.15 | $ 17.25 | |||||
|
Total return
(b) |
18.30% | (4.66)% | 21.33% | 11.65% | 0.98% | 13.24% | |||||
| Ratios and Supplemental Data: | |||||||||||
|
Net assets, end of period (in
000s) |
$24,160 | $20,897 | $27,876 | $124,591 | $104,730 | $126,412 | |||||
| Ratios to Average Net Assets:(c) | |||||||||||
|
Total
expenses |
0.37%(d)(e) | 0.37%(e) | 0.36%(e) | 0.37%(e) | 0.41%(e) | 0.40%(f) | |||||
|
Net
expenses |
0.27%(d)(e) | 0.27%(e) | 0.28%(e) | 0.27%(e) | 0.28%(e) | 0.33%(f) | |||||
|
Net investment income
(loss) |
(0.27)%(d) | 1.44% | 0.73% | 1.46% | 1.25% | 1.73% | |||||
|
Portfolio turnover
rate |
3%(g)(h) | 8%(g) | 30%(g) | 5%(g) | 5%(g) | 4%(i) | |||||
| (a) | Net investment income per share is calculated using the average shares method. |
| (b) | Total return is calculated assuming a purchase of shares at net asset value on the first day and a sale at net asset value on the last day of each period reported. Distributions are assumed, for the purpose of this calculation, to be reinvested at net asset value per share on the respective payment dates. Total return for periods of less than one year is not annualized. Results represent past performance and are not indicative of future results. |
| (c) | Prior to August 11, 2014, the per shares amounts and percentages included the Fund’s proportionate share of income and expenses of the State Street Equity 500 Index Portfolio. |
| (d) | Annualized. |
| (e) | Ratio does not include the expenses of the State Street Equity 500 Index II Portfolio. |
| (f) | Ratio includes expenses allocated from the State Street Equity 500 Index Portfolio from 1/1/2014 through 8/10/2014, and does not include the expenses of the State Street Equity 500 Index II Portfolio from 8/11/2014 through 12/31/2014. |
| (g) | Portfolio turnover rate is from the State Street Equity 500 Index II Portfolio. |
| (h) | Not annualized. |
| (i) | Portfolio turnover rate is calculated from the State Street Equity 500 Index Portfolio (from 1/1/2014 to 8/10/2014) and the State Street Equity 500 Index II Portfolio (from 8/11/2014 to 12/31/2014). |
| Class R Shares | |||||||||||
| Six
Months Ended 06/30/19 (Unaudited) |
Year
Ended 12/31/18 |
Year
Ended 12/31/17 |
Year
Ended 12/31/16 |
Year
Ended 12/31/15 |
Year
Ended 12/31/14 | ||||||
|
Net asset value, beginning of
period |
$ 19.62 | $ 21.61 | $ 18.81 | $ 17.15 | $ 17.26 | $ 15.49 | |||||
| Income (loss) from investment operations: | |||||||||||
|
Net investment income (loss)
(a) |
(0.07) | 0.24 | 0.29 | 0.18 | 0.19 | 0.22 | |||||
|
Net realized and unrealized gain
(loss) |
3.63 | (1.33) | 3.66 | 1.76 | (0.09) | 1.78 | |||||
|
Total from investment
operations |
3.56 | (1.09) | 3.95 | 1.94 | 0.10 | 2.00 | |||||
| Distributions to shareholders from: | |||||||||||
|
Net investment
income |
— | (0.30) | (0.36) | (0.20) | (0.21) | (0.23) | |||||
|
Net realized
gains |
— | (0.60) | (0.79) | (0.08) | — | — | |||||
|
Total
distributions |
— | (0.90) | (1.15) | (0.28) | (0.21) | (0.23) | |||||
|
Net asset value, end of
period |
$ 23.18 | $ 19.62 | $ 21.61 | $ 18.81 | $ 17.15 | $ 17.26 | |||||
|
Total return
(b) |
18.14% | (5.04)% | 20.96% | 11.26% | 0.58% | 12.91% | |||||
| Ratios and Supplemental Data: | |||||||||||
|
Net assets, end of period (in
000s) |
$37,163 | $32,099 | $42,249 | $39,086 | $37,845 | $41,148 | |||||
| Ratios to Average Net Assets:(c) | |||||||||||
|
Total
expenses |
0.72%(d)(e) | 0.72%(e) | 0.71%(e) | 0.72%(e) | 0.76%(e) | 0.75%(f) | |||||
|
Net
expenses |
0.62%(d)(e) | 0.62%(e) | 0.63%(e) | 0.63%(e) | 0.63%(e) | 0.68%(f) | |||||
|
Net investment income
(loss) |
(0.62)%(d) | 1.06% | 1.41% | 0.99% | 1.09% | 1.37% | |||||
|
Portfolio turnover
rate |
3%(g)(h) | 8%(g) | 30%(g) | 5%(g) | 5%(g) | 4%(i) | |||||
| (a) | Net investment income per share is calculated using the average shares method. |
| (b) | Total return is calculated assuming a purchase of shares at net asset value on the first day and a sale at net asset value on the last day of each period reported. Distributions are assumed, for the purpose of this calculation, to be reinvested at net asset value per share on the respective payment dates. Total return for periods of less than one year is not annualized. Results represent past performance and are not indicative of future results. |
| (c) | Prior to August 11, 2014, the per shares amounts and percentages included the Fund’s proportionate share of income and expenses of the State Street Equity 500 Index Portfolio. |
| (d) | Annualized. |
| (e) | Ratio does not include the expenses of the State Street Equity 500 Index II Portfolio. |
| (f) | Ratio includes expenses allocated from the State Street Equity 500 Index Portfolio from 1/1/2014 through 8/10/2014, and does not include the expenses of the State Street Equity 500 Index II Portfolio from 8/11/2014 through 12/31/2014. |
| (g) | Portfolio turnover rate is from the State Street Equity 500 Index II Portfolio. |
| (h) | Not annualized. |
| (i) | Portfolio turnover rate is calculated from the State Street Equity 500 Index Portfolio (from 1/1/2014 to 8/10/2014) and the State Street Equity 500 Index II Portfolio (from 8/11/2014 to 12/31/2014). |
| Class A Shares | |||||||||||
| Six
Months Ended 06/30/19 (Unaudited) |
Year
Ended 12/31/18 |
Year
Ended 12/31/17 |
Year
Ended 12/31/16 |
Year
Ended 12/31/15 |
For
the Period 9/17/14* - 12/31/14 | ||||||
|
Net asset value, beginning of
period |
$ 19.64 | $ 21.63 | $18.83 | $17.17 | $17.27 | $17.00 | |||||
| Income (loss) from investment operations: | |||||||||||
|
Net investment income (loss)
(a) |
(0.03) | 0.64 | 0.16 | 0.68 | 0.25 | 0.11 | |||||
|
Net realized and unrealized gain
(loss) |
3.63 | (1.66) | 3.82 | 0.29 | (0.11) | 0.45 | |||||
|
Total from investment
operations |
3.60 | (1.02) | 3.98 | 1.97 | 0.14 | 0.56 | |||||
| Distributions to shareholders from: | |||||||||||
|
Net investment
income |
— | (0.37) | (0.39) | (0.23) | (0.24) | (0.29) | |||||
|
Net realized
gains |
— | (0.60) | (0.79) | (0.08) | — | — | |||||
|
Total
distributions |
— | (0.97) | (1.18) | (0.31) | (0.24) | (0.29) | |||||
|
Net asset value, end of
period |
$ 23.24 | $ 19.64 | $21.63 | $18.83 | $17.17 | $17.27 | |||||
|
Total return
(b) |
18.33% | (4.72)% | 21.12% | 11.42% | 0.78% | 3.28% | |||||
| Ratios and Supplemental Data: | |||||||||||
|
Net assets, end of period (in
000s) |
$44,756 | $31,766 | $6,293 | $7,509 | $ 60 | $ 51 | |||||
| Ratios to Average Net Assets: | |||||||||||
|
Total
expenses |
0.38%(c)(d) | 0.38%(d) | 0.56%(d) | 0.57%(d) | 0.61%(d) | 0.70%(c)(d) | |||||
|
Net
expenses |
0.28%(c)(d) | 0.28%(d) | 0.48%(d) | 0.48%(d) | 0.48%(d) | 0.51%(c)(d) | |||||
|
Net investment income
(loss) |
(0.28)%(c) | 2.89% | 0.79% | 3.69% | 1.43% | 2.32%(c) | |||||
|
Portfolio turnover
rate |
3%(e)(f) | 8%(e) | 30%(e) | 5%(e) | 5%(e) | 4%(e)(f) | |||||
| * | Commencement of operations. |
| (a) | Net investment income per share is calculated using the average shares method. |
| (b) | Total return is calculated assuming a purchase of shares at net asset value on the first day and a sale at net asset value on the last day of each period reported. Distributions are assumed, for the purpose of this calculation, to be reinvested at net asset value per share on the respective payment dates. Total return for periods of less than one year is not annualized. Results represent past performance and are not indicative of future results. |
| (c) | Annualized. |
| (d) | Ratio does not include the expenses of the State Street Equity 500 Index II Portfolio. |
| (e) | Portfolio turnover rate is from the State Street Equity 500 Index II Portfolio. |
| (f) | Not annualized. |
| Class I Shares | |||||||||||
| Six
Months Ended 6/30/19 (Unaudited) |
Year
Ended 12/31/18 |
Year
Ended 12/31/17 |
Year
Ended 12/31/16 |
Year
Ended 12/31/15 |
For
the Period 9/17/14* - 12/31/14 | ||||||
|
Net asset value, beginning of
period |
$ 19.65 | $ 21.63 | $ 18.84 | $17.17 | $17.27 | $17.00 | |||||
| Income (loss) from investment operations: | |||||||||||
|
Net investment income (loss)
(a) |
(0.01) | 0.44 | 0.89 | 2.86 | 0.29 | 0.13 | |||||
|
Net realized and unrealized gain
(loss) |
3.63 | (1.41) | 3.14 | (0.84) | (0.11) | 0.44 | |||||
|
Total from investment
operations |
3.62 | (0.97) | 4.03 | 2.02 | 0.18 | 0.57 | |||||
| Distributions to shareholders from: | |||||||||||
|
Net investment
income |
— | (0.41) | (0.45) | (0.27) | (0.28) | (0.30) | |||||
|
Net realized
gains |
— | (0.60) | (0.79) | (0.08) | — | — | |||||
|
Total
distributions |
— | (1.01) | (1.24) | (0.35) | (0.28) | (0.30) | |||||
|
Net asset value, end of
period |
$ 23.27 | $ 19.65 | $ 21.63 | $18.84 | $17.17 | $17.27 | |||||
|
Total return
(b) |
18.42% | (4.45)% | 21.35% | 11.75% | 1.03% | 3.35% | |||||
| Ratios and Supplemental Data: | |||||||||||
|
Net assets, end of period (in
000s) |
$20,063 | $14,496 | $16,084 | $4,469 | $ 50 | $ 51 | |||||
| Ratios to Average Net Assets: | |||||||||||
|
Total
expenses |
0.19%(c)(d) | 0.15%(d) | 0.31%(d) | 0.32%(d) | 0.36%(d) | 0.45%(c)(d) | |||||
|
Net
expenses |
0.09%(c)(d) | 0.05%(d) | 0.23%(d) | 0.23%(d) | 0.23%(d) | 0.26%(c)(d) | |||||
|
Net investment income
(loss) |
(0.09)%(c) | 1.98% | 4.21% | 15.53%(e) | 1.66% | 2.57%(c) | |||||
|
Portfolio turnover
rate |
3%(f)(g) | 8%(f) | 30%(f) | 5%(f) | 5%(f) | 4%(f)(g) | |||||
| * | Commencement of operations. |
| (a) | Net investment income per share is calculated using the average shares method. |
| (b) | Total return is calculated assuming a purchase of shares at net asset value on the first day and a sale at net asset value on the last day of each period reported. Distributions are assumed, for the purpose of this calculation, to be reinvested at net asset value per share on the respective payment dates. Total return for periods of less than one year is not annualized. Results represent past performance and are not indicative of future results. |
| (c) | Annualized. |
| (d) | Ratio does not include the expenses of the State Street Equity 500 Index II Portfolio. |
| (e) | The calculation of the net investment income ratio is affected by the timing and relative size of a class’ shareholder activity during the period. As a result, the net investment income ratio may vary significantly from period to period. |
| (f) | Portfolio turnover rate is from the State Street Equity 500 Index II Portfolio. |
| (g) | Not annualized. |
| Class K Shares | |||||||||||
| Six
Months Ended 06/30/19 (Unaudited) |
Year
Ended 12/31/18 |
Year
Ended 12/31/17 |
Year
Ended 12/31/16 |
Year
Ended 12/31/15 |
For
the Period 9/17/14* - 12/31/14 | ||||||
|
Net asset value, beginning of
period |
$ 19.64 | $ 21.62 | $ 18.83 | $ 17.17 | $ 17.27 | $17.00 | |||||
| Income (loss) from investment operations: | |||||||||||
|
Net investment income (loss)
(a) |
(0.00)(b) | 0.47 | 0.44 | 0.44 | 1.45 | 0.14 | |||||
|
Net realized and unrealized gain
(loss) |
3.63 | (1.43) | 3.64 | 1.61 | (1.23) | 0.44 | |||||
|
Total from investment
operations |
3.63 | (0.96) | 4.08 | 2.05 | 0.22 | 0.58 | |||||
| Distributions to shareholders from: | |||||||||||
|
Net investment
income |
— | (0.42) | (0.50) | (0.31) | (0.32) | (0.31) | |||||
|
Net realized
gains |
— | (0.60) | (0.79) | (0.08) | — | — | |||||
|
Total
distributions |
— | (1.02) | (1.29) | (0.39) | (0.32) | (0.31) | |||||
|
Net asset value, end of
period |
$ 23.27 | $ 19.64 | $ 21.62 | $ 18.83 | $ 17.17 | $17.27 | |||||
|
Total return
(c) |
18.48% | (4.42)% | 21.61% | 11.92% | 1.23% | 3.41% | |||||
| Ratios and Supplemental Data: | |||||||||||
|
Net assets, end of period (in
000s) |
$703,381 | $485,040 | $412,903 | $369,915 | $62,064 | $ 51 | |||||
| Ratios to Average Net Assets: | |||||||||||
|
Total
expenses |
0.12%(d)(e) | 0.12%(e) | 0.11%(e) | 0.12%(e) | 0.16%(e) | 0.27%(d)(e) | |||||
|
Net
expenses |
0.02%(d)(e) | 0.02%(e) | 0.03%(e) | 0.03%(e) | 0.03%(e) | 0.06%(d)(e) | |||||
|
Net investment income
(loss) |
(0.02)%(d) | 2.08% | 2.14% | 2.42% | 8.45%(f) | 2.78%(d) | |||||
|
Portfolio turnover
rate |
3%(g)(h) | 8%(g) | 30%(g) | 5%(g) | 5%(g) | 4%(g)(h) | |||||
| * | Commencement of operations. |
| (a) | Net investment income per share is calculated using the average shares method. |
| (b) | Amount is less than $0.005 per share. |
| (c) | Total return is calculated assuming a purchase of shares at net asset value on the first day and a sale at net asset value on the last day of each period reported. Distributions are assumed, for the purpose of this calculation, to be reinvested at net asset value per share on the respective payment dates. Total return for periods of less than one year is not annualized. Results represent past performance and are not indicative of future results. |
| (d) | Annualized. |
| (e) | Ratio does not include the expenses of the State Street Equity 500 Index II Portfolio. |
| (f) | The calculation of the net investment income ratio is affected by the timing and relative size of a class’ shareholder activity during the period. As a result, the net investment income ratio may vary significantly from period to period. |
| (g) | Portfolio turnover rate is from the State Street Equity 500 Index II Portfolio. |
| (h) | Not annualized. |
| % of Net Assets | |||
| Common Stocks | 97.3% | ||
| Short-Term Investments | 3.5 | ||
| Liabilities in Excess of Other Assets | (0.8) | ||
| TOTAL | 100.0% |
| Description | % of Net Assets | ||
| Information Technology | 20.9% | ||
| Health Care | 13.8 | ||
| Financials | 12.8 | ||
| Communication Services | 9.9 | ||
| Consumer Discretionary | 9.9 | ||
| TOTAL | 67.3% |
| Description | Number
of Contracts |
Expiration
Date |
Notional
Amount |
Value | Unrealized
Appreciation/ Depreciation | |||||
| E-Mini S&P 500 Index (long) | 600 | 09/20/2019 | $86,879,750 | $88,326,000 | $1,446,250 |
| Description | Level
1 – Quoted Prices |
Level
2 – Other Significant Observable Inputs |
Level
3 – Significant Unobservable Inputs |
Total | ||||
| ASSETS: | ||||||||
| INVESTMENTS: | ||||||||
|
Common
Stocks |
$3,239,357,126 | $— | $— | $3,239,357,126 | ||||
|
Short-Term
Investments |
117,578,875 | — | — | 117,578,875 | ||||
|
TOTAL
INVESTMENTS |
$3,356,936,001 | $— | $— | $3,356,936,001 | ||||
| OTHER FINANCIAL INSTRUMENTS: | ||||||||
|
Futures
Contracts(a) |
1,446,250 | — | — | 1,446,250 | ||||
|
TOTAL OTHER FINANCIAL
INSTRUMENTS: |
$ 1,446,250 | $— | $— | $ 1,446,250 | ||||
|
TOTAL INVESTMENTS AND OTHER FINANCIAL
INSTRUMENTS |
$3,358,382,251 | $— | $— | $3,358,382,251 |
| (a) | Futures Contracts are valued at unrealized appreciation (depreciation). |
| Number
of Shares Held at 12/31/18 |
Value
at 12/31/18 |
Cost
of Purchases |
Proceeds
from Shares Sold |
Realized
Gain (Loss) |
Change
in Unrealized Appreciation/ Depreciation |
Number
of Shares Held at 6/30/19 |
Value
at 6/30/19 |
Dividend
Income | |||||||||
|
State Street
Corp. |
44,678 | $ 2,817,841 | $ 432,950 | $ — | $— | $(370,540) | 51,378 | $ 2,880,251 | $ 46,227 | ||||||||
|
State Street Institutional U.S. Government Money Market Fund, Class G
Shares |
81,722,543 | 81,722,543 | 436,289,144 | 415,107,257 | — | — | 102,904,430 | 102,904,430 | 887,454 | ||||||||
|
State Street Navigator Securities Lending Portfolio
II |
4,917,310 | 4,917,310 | 67,421,470 | 57,664,335 | — | — | 14,674,445 | 14,674,445 | 52,803 | ||||||||
|
Total |
$89,457,694 | $504,143,564 | $472,771,592 | $— | $(370,540) | $120,459,126 | $986,484 |
| ASSETS | |
|
Investments in unaffiliated issuers, at
value* |
$3,236,476,875 |
|
Investments in affiliated issuers, at
value |
120,459,126 |
|
Total
Investments |
3,356,936,001 |
|
Cash at
broker |
3,617,763 |
|
Cash |
12 |
|
Receivable from broker — accumulated variation margin on open futures
contracts |
1,447,617 |
|
Receivable for fund shares
sold |
2,346,146 |
|
Dividends receivable — unaffiliated
issuers |
2,628,242 |
|
Dividends receivable — affiliated
issuers |
216,012 |
|
Securities lending income receivable — unaffiliated
issuers |
932 |
|
Securities lending income receivable — affiliated issuers
|
2,098 |
|
Receivable from
Adviser |
25,857 |
|
TOTAL ASSETS
|
3,367,220,680 |
| LIABILITIES | |
|
Payable upon return of securities
loaned |
14,674,445 |
|
Payable for investments
purchased |
1,607,112 |
|
Payable for fund shares
repurchased |
21,088,000 |
|
Administration, custody, and transfer agent fees
payable |
33,262 |
|
Trustees’ fees and expenses
payable |
144 |
|
Professional fees
payable |
37,393 |
|
Printing and postage fees
payable |
9,435 |
|
Accrued expenses and other
liabilities |
1,762 |
|
TOTAL LIABILITIES
|
37,451,553 |
|
NET ASSETS
|
$3,329,769,127 |
| NET ASSETS CONSIST OF: | |
|
Paid-in
Capital |
$2,524,388,200 |
|
Total distributable earnings
(loss) |
805,380,927 |
|
NET ASSETS
|
$3,329,769,127 |
| NET ASSET VALUE PER SHARE | |
|
Net asset value per
share |
$ 13.95 |
|
Shares outstanding (unlimited amount authorized, no par
value) |
238,629,514 |
|
Net
Assets |
$3,329,769,127 |
| COST OF INVESTMENTS: | |
|
Investments in unaffiliated
issuers |
$2,451,651,154 |
|
Investments in affiliated
issuers |
121,318,934 |
|
Total cost of
investments |
$2,572,970,088 |
|
* Includes investments in securities on loan, at
value |
$ 26,648,598 |
| INVESTMENT INCOME | |
|
Interest income — unaffiliated
issuers |
$ 28,148 |
|
Dividend income — unaffiliated
issuers |
30,507,489 |
|
Dividend income — affiliated
issuers |
933,681 |
|
Unaffiliated securities lending
income |
8,563 |
|
Affiliated securities lending
income |
52,803 |
|
TOTAL INVESTMENT INCOME
(LOSS) |
31,530,684 |
| EXPENSES | |
|
Administration, custody, and transfer agent
fees |
203,167 |
|
Trustees’ fees and expenses
|
46,658 |
|
Professional
fees |
85,722 |
|
Printing and postage
fees |
10,144 |
|
Insurance
expense |
7,648 |
|
Miscellaneous
expenses |
12,146 |
|
TOTAL
EXPENSES |
365,485 |
|
Expenses waived/reimbursed by the
Adviser |
(62,615) |
|
NET
EXPENSES |
302,870 |
|
NET INVESTMENT INCOME
(LOSS) |
$ 31,227,814 |
| REALIZED AND UNREALIZED GAIN (LOSS) | |
| Net realized gain (loss) on: | |
|
Investments — unaffiliated
issuers |
(2,585,316) |
|
Futures
contracts |
7,897,288 |
|
Net realized gain
(loss) |
5,311,972 |
| Net change in unrealized appreciation/depreciation on: | |
|
Investments — unaffiliated
issuers |
460,481,874 |
|
Investments — affiliated
issuers |
(370,540) |
|
Futures
contracts |
3,427,903 |
|
Net change in unrealized
appreciation/depreciation |
463,539,237 |
|
NET REALIZED AND UNREALIZED GAIN
(LOSS) |
468,851,209 |
|
NET INCREASE (DECREASE) IN NET ASSETS FROM
OPERATIONS |
$500,079,023 |
| Six
Months Ended 6/30/19 (Unaudited) |
Year
Ended 12/31/18 | ||
| INCREASE (DECREASE) IN NET ASSETS FROM OPERATIONS: | |||
|
Net investment income
(loss) |
$ 31,227,814 | $ 51,751,798 | |
|
Net realized gain
(loss) |
5,311,972 | 35,216,548 | |
|
Net change in unrealized
appreciation/depreciation |
463,539,237 | (207,715,492) | |
|
Net increase (decrease) in net assets resulting from
operations |
500,079,023 | (120,747,146) | |
|
Distributions to
shareholders |
— | (138,945,426) | |
| FROM BENEFICIAL INTEREST TRANSACTIONS: | |||
|
Proceeds from sale of shares
sold |
415,275,524 | 937,119,662 | |
|
Reinvestment of
distributions |
— | 138,945,426 | |
|
Cost of shares
redeemed |
(220,118,261) | (381,020,586) | |
|
Net increase (decrease) in net assets from beneficial interest transactions
|
195,157,263 | 695,044,502 | |
|
Net increase (decrease) in net assets during the
period |
695,236,286 | 435,351,930 | |
|
Net assets at beginning of
period |
2,634,532,841 | 2,199,180,911 | |
|
NET ASSETS AT END OF
PERIOD |
$3,329,769,127 | $2,634,532,841 | |
| SHARES OF BENEFICIAL INTEREST: | |||
|
Shares
sold |
31,549,230 | 71,154,512 | |
|
Reinvestment of
distributions |
— | 12,252,683 | |
|
Shares
redeemed |
(16,707,375) | (27,824,760) | |
|
Net increase (decrease) from share
transactions |
14,841,855 | 55,582,435 |
| Six
Months Ended 6/30/19 (Unaudited) |
Year
Ended 12/31/18 |
Year
Ended 12/31/17 |
Year
Ended 12/31/16 |
Year
Ended 12/31/15 |
For
the Period 8/11/14* - 12/31/14 | ||||||
|
Net asset value, beginning of
period |
$ 11.77 | $ 13.07 | $ 11.31 | $ 10.32 | $ 10.55 | $ 10.00 | |||||
| Income (loss) from investment operations: | |||||||||||
|
Net investment income (loss)
(a) |
0.14 | 0.26 | 0.25 | 0.23 | 0.22 | 0.08 | |||||
|
Net realized and unrealized gain
(loss) |
2.04 | (0.86) | 2.21 | 1.02 | (0.09) | 0.63 | |||||
|
Total from investment
operations |
2.18 | (0.60) | 2.46 | 1.25 | 0.13 | 0.71 | |||||
| Distributions to shareholders from: | |||||||||||
|
Net investment
income |
— | (0.26) | (0.27) | (0.18) | (0.20) | (0.08) | |||||
|
Net realized
gains |
— | (0.44) | (0.43) | (0.08) | (0.16) | (0.08) | |||||
|
Total
distributions |
— | (0.70) | (0.70) | (0.26) | (0.36) | (0.16) | |||||
|
Net asset value, end of
period |
$ 13.95 | $ 11.77 | $ 13.07 | $ 11.31 | $ 10.32 | $ 10.55 | |||||
|
Total return
(b) |
18.52% | (4.42)% | 21.66% | 12.18% | 1.29% | 7.12% | |||||
| Ratios and Supplemental Data: | |||||||||||
|
Net assets, end of period (in
000s) |
$3,329,769 | $2,634,533 | $2,199,181 | $1,227,444 | $541,335 | $426,710 | |||||
| Ratios to average net assets: | |||||||||||
|
Total
expenses |
0.02%(c) | 0.03% | 0.03% | 0.04% | 0.04% | 0.04%(c) | |||||
|
Net
expenses |
0.02%(c) | 0.02% | 0.03% | 0.03% | 0.03% | 0.03%(c) | |||||
|
Net investment income
(loss) |
2.06%(c) | 1.93% | 1.98% | 2.15% | 2.05% | 2.06%(c) | |||||
|
Portfolio turnover
rate |
3%(d) | 8% | 30% | 5% | 5% | 4%(d)(e) |
| * | Commencement of operations. |
| (a) | Net investment income per share is calculated using the average shares method. |
| (b) | Total return is calculated assuming a purchase of shares at net asset value on the first day and a sale at net asset value on the last day of each period reported. Distributions are assumed, for the purpose of this calculation, to be reinvested at net asset value per share on the respective payment dates. Total return for periods of less than one year is not annualized. Results represent past performance and are not indicative of future results. |
| (c) | Annualized. |
| (d) | Not annualized. |
| (e) | Portfolio turnover rate excludes in-kind security transactions. |
| Fund | Classes | Commencement
of Operations |
Diversification
Classification |
| State Street Equity 500 Index Fund (the “Fund”) | Administrative
Shares Service Shares Class A Shares Class I Shares Class K Shares Class R Shares |
April
11, 2001 March 10, 2003 September 17, 2014 September 17, 2014 September 17, 2014 June 7, 2005 |
Diversified |
| State Street Equity 500 Index II Portfolio (the “Portfolio”) | N/A | August 11, 2014 | Diversified |
| Fund Name | Portfolio Name | Fund
Ownership Interest in Portfolio at June 30, 2019 | ||
| State Street Equity 500 Index Fund | State Street Equity 500 Index II Portfolio | 32.41% |
| Asset Derivatives | |||||||||||
| Interest
Rate Contracts Risk |
Foreign
Exchange Contracts Risk |
Credit
Contracts Risk |
Equity
Contracts Risk |
Commodity
Contracts Risk |
Total | ||||||
|
Futures
Contracts |
$— | $— | $— | $1,447,617 | $— | $1,447,617 | |||||
| Net Realized Gain (Loss) | |||||||||||
| Interest
Rate Contracts Risk |
Foreign
Exchange Contracts Risk |
Credit
Contracts Risk |
Equity
Contracts Risk |
Commodity
Contracts Risk |
Total | ||||||
|
Futures
Contracts |
$— | $— | $— | $7,897,288 | $— | $7,897,288 | |||||
| Net Change in Unrealized Appreciation (Depreciation) | |||||||||||
| Interest
Rate Contracts Risk |
Foreign
Exchange Contracts Risk |
Credit
Contracts Risk |
Equity
Contracts Risk |
Commodity
Contracts Risk |
Total | ||||||
|
Futures
Contracts |
$— | $— | $— | $3,427,903 | $— | $3,427,903 | |||||
| Purchases | Sales | ||
|
State Street Equity 500 Index II
Portfolio |
$399,977,120 | $90,733,102 |
| Tax
Cost |
Gross
Unrealized Appreciation |
Gross
Unrealized Depreciation |
Net
Unrealized Appreciation (Depreciation) | ||||
|
State Street Equity 500 Index
Fund |
$ 848,475,076 | $230,574,665 | $ — | $230,574,665 | |||
|
State Street Equity 500 Index II
Portfolio |
2,589,972,386 | 834,757,487 | 66,347,622 | 768,409,865 |
| Fund | Market
Value of Securities on Loan |
Cash
Collateral Received |
Non-Cash
Collateral Received* |
Total
Collateral Received | ||||
|
State Street Equity 500 Index II
Portfolio |
$ 26,648,598 | $ 14,674,445 | $ 12,377,822 | $ 27,052,267 |
| * | The non-cash collateral includes U.S. Treasuries and U.S. Government Agency securities. |
| Remaining
Contractual Maturity of the Agreements As of June 30, 2019 | ||||||||||||||
| Fund | Securities
Lending Transactions |
Overnight
and Continuous |
<30 Days | Between
30 & 90 Days |
>90 Days | Total
Borrowings |
Gross
Amount of Recognized Liabilities for Securities Lending Transactions | |||||||
|
State Street Equity 500 Index II
Portfolio |
Common Stocks | $14,674,445 | $— | $— | $— | $14,674,445 | $14,674,445 | |||||||
| Actual | Hypothetical
(assuming a 5% return before expenses) | ||||||||
| Annualized
Expense Ratio |
Ending
Account Value |
Expenses
Paid During Period(a) |
Ending
Account Value |
Expenses
Paid During Period(a) | |||||
|
State Street Equity 500 Index
Fund(b) |
|||||||||
|
Administrative
Shares |
0.17% | $1,183.80 | $0.92 | $1,024.00 | $0.85 | ||||
|
Service
Shares |
0.27 | 1,183.00 | 1.46 | 1,023.50 | 1.35 | ||||
|
Class R
Shares |
0.62 | 1,181.40 | 3.35 | 1,021.70 | 3.11 | ||||
|
Class A
Shares |
0.28 | 1,183.30 | 1.52 | 1,023.40 | 1.40 | ||||
|
Class I
Shares |
0.09 | 1,184.20 | 0.49 | 1,024.30 | 0.45 | ||||
|
Class K
Shares |
0.02 | 1,184.80 | 0.11 | 1,024.70 | 0.10 | ||||
|
State Street Equity 500 Index II
Portfolio |
0.02 | 1,185.20 | 0.11 | 1,024.70 | 0.10 | ||||
| (a) | Expenses are equal to the Fund’s/Portfolio’s annualized net expense ratio multiplied by the average account value of the period, multiplied by 181, then divided by 365. |
| (b) | Because the Fund invests all of its assets in the Portfolio, the expense example reflects the net expenses of both the Fund and the Portfolio. |
| • | A report prepared by an independent third-party provider of investment company data, which includes for the Fund, which is a feeder fund for which the Portfolio serves as the master fund in a master-feeder structure: |
| • | Comparisons of the Fund’s performance over the past one-, three-, five- and ten-year periods ended December 31, 2018, to the performance of an appropriate benchmark constructed by Broadridge Financial Solutions, Inc., the successor to Lipper, Inc. (“Broadridge”), for the Fund (the “Lipper Index”) and a universe of other mutual funds with similar investment objectives and policies (the “Performance Group” and/or the “Performance Universe”); |
| • | Comparisons of the Fund’s expense ratio (with detail of component expenses) to the expense ratios of a group of comparable mutual funds selected by the independent third-party data provider (the “Expense Group” and/or “Expense Universe”); |
| • | A chart showing the Fund’s historical average net assets relative to its total expenses, management fees, and non-management expenses over the past five calendar years, and |
| • | Comparisons of the Fund’s contractual management fee to the contractual management fees of comparable mutual funds at different asset levels. |
| • | Comparative information concerning fees charged by the Adviser for managing institutional accounts using investment strategies and techniques similar to those used in managing the Fund and Portfolio; and |
| • | Profitability analyses for (a) the Adviser with respect to the Fund and Portfolio and (b) affiliates of the Adviser that provide services to the Fund and Portfolio (“Affiliated Service Providers”). |
| • | Descriptions of the investment management services provided by the Adviser, including its investment strategies and processes; |
| • | Information concerning the allocation of brokerage; and |
| • | Information regarding the procedures and processes used to value the assets of the Fund and Portfolio. |
| • | Reports detailing the financial results and condition of the Adviser and its affiliates; |
| • | Descriptions of the qualifications, education and experience of the individual investment and other professionals responsible for managing the portfolios of the Fund and Portfolio and for Fund/Portfolio operations; |
| • | Information relating to compliance with and the administration of the Code of Ethics adopted by the Adviser; |
| • | A copy of the Adviser’s proxy voting policies and procedures and other information regarding the Adviser’s practices for overseeing proxy vendors; |
| • | Information concerning the resources devoted by the Adviser to overseeing compliance by the Fund and Portfolio, and their service providers, including information concerning compliance with investment policies and restrictions and other operating policies of the Fund and Portfolio; |
| • | A description of the adequacy and sophistication of the Adviser’s technology and systems with respect to investment and administrative matters and a description of any material improvements or changes in technology or systems in the past year; |
| • | A description of the business continuity and disaster recovery plans of the Adviser; and |
| • | Information regarding the Adviser’s risk management processes. |
| • | Information concerning the nature, extent, quality and cost of services provided to the Fund and Portfolio by SSGA FM in its capacity as the Fund’s administrator (the “Administrator”); |
| • | Information concerning the nature, extent, quality and cost of various non-investment management services provided to the Fund and Portfolio by affiliates of the Adviser, including the custodian, sub-administrator, fund accountant, and securities lending agent of the Fund and Portfolio, and transfer agent of the Portfolio, and the role of the Adviser in managing the Fund’s and the Portfolio’s relationship with these service providers; |
| • | Copies of the Advisory Agreement and agreements with other service providers of the Fund and Portfolio; |
| • | Draft responses to a letter from independent legal counsel to the Independent Trustees (“Independent Counsel”), reviewed prior to such date by Independent Counsel, requesting specific information from each of: |
| • | SSGA FM, in its capacity as the Fund’s and Portfolio’s Adviser and Administrator, with respect to its operations relating to the Fund and Portfolio and its approximate profit margins from such operations for the calendar year ended December 31, 2018; and the relevant operations of other affiliated service providers to the Fund and Portfolio, together with their approximate profit margins from such relevant operations for the calendar year ended December 31, 2018; |
| • | State Street Bank and Trust Company (“State Street”), the sub-administrator, custodian and securities lending agent for the Fund and Portfolio, and transfer agent for the Portfolio, with respect to its operations relating to the Fund and Portfolio; and |
| • | State Street Global Advisors Funds Distributors, LLC, the principal underwriter and distributor of the shares of the Fund and Portfolio (the “Distributor”), with respect to its operations relating to the Fund and Portfolio, together with the Fund’s related distribution plan and arrangement under Rule 12b-1 of the 1940 Act; |
| • | Information from SSGA FM, State Street and the Distributor with respect to the Trust providing any material changes to the previous information supplied in response to the letter from Independent Counsel prior to the executive session of the Board on May 15, 2019; |
| • | Materials provided by Broadridge, circulated to the Independent Trustees and to Independent Counsel, with respect to the Fund; and |
| • | A summary of the foregoing materials prepared by Independent Counsel. |
State Street Bank and Trust Company
P.O. Box 5049
Boston, MA 02206
| State Street Institutional Liquid Reserves Fund |

|
|
1 |
|
|
2 |
|
|
3 |
|
|
5 |
|
|
11 |
|
|
15 |
| ASSETS | |
|
Investment in corresponding affiliated Portfolio, at
value |
$15,657,957,505 |
|
Receivable for fund shares
sold |
200 |
|
Receivable from
Adviser |
48,481 |
|
TOTAL ASSETS
|
15,658,006,186 |
| LIABILITIES | |
|
Advisory fee
payable |
34 |
|
Administration fees
payable |
599,018 |
|
Shareholder servicing fee payable
|
145,746 |
|
Distribution fees
payable |
28,356 |
|
Transfer agent fees
payable |
50,879 |
|
Distribution
payable |
5,643,958 |
|
Registration and filing fees
payable |
104,831 |
|
Professional fees
payable |
12,414 |
|
Printing fees
payable |
50,014 |
|
Accrued expenses and other
liabilities |
223,322 |
|
TOTAL LIABILITIES
|
6,858,572 |
|
NET ASSETS
|
$15,651,147,614 |
| NET ASSETS CONSIST OF: | |
|
Paid-in
Capital |
$15,648,313,279 |
|
Total distributable earnings
(loss) |
2,834,335 |
|
NET ASSETS
|
$15,651,147,614 |
| Administration Class | |
|
Net
Assets |
$ 720,505,634 |
|
Shares
Outstanding |
720,397,721 |
|
Net asset value, offering and redemption price per
share |
$ 1.0001 |
| Institutional Class | |
|
Net
Assets |
$ 106,216,873 |
|
Shares
Outstanding |
106,181,985 |
|
Net asset value, offering and redemption price per
share |
$ 1.0003 |
| Investment Class | |
|
Net
Assets |
$ 18,139 |
|
Shares
Outstanding |
18,136 |
|
Net asset value, offering and redemption price per
share |
$ 1.0002 |
| Investor Class | |
|
Net
Assets |
$ 81,868,742 |
|
Shares
Outstanding |
81,859,154 |
|
Net asset value, offering and redemption price per
share |
$ 1.0001 |
| Premier Class | |
|
Net
Assets |
$13,980,782,982 |
|
Shares
Outstanding |
13,978,483,360 |
|
Net asset value, offering and redemption price per
share |
$ 1.0002 |
| Trust Class | |
|
Net
Assets |
$ 761,755,244 |
|
Shares
Outstanding |
761,608,833 |
|
Net asset value, offering and redemption price per
share |
$ 1.0002 |
| COST OF INVESTMENTS: | |
|
Investment in corresponding affiliated
Portfolio |
$15,655,297,295 |
| INCOME AND EXPENSES ALLOCATED FROM AFFILIATED PORTFOLIO | |
|
Interest income allocated from affiliated
Portfolio |
$189,339,379 |
|
Expenses allocated from affiliated
Portfolio |
(4,740,510) |
|
TOTAL INVESTMENT INCOME (LOSS) ALLOCATED FROM AFFILIATED
PORTFOLIO |
184,598,869 |
| EXPENSES | |
| Administration fees | |
|
Administration
Class |
207,184 |
|
Institutional
Class |
18,141 |
|
Investment
Class |
4 |
|
Investor
Class |
13,015 |
|
Premier
Class |
3,191,105 |
|
Trust
Class |
163,525 |
| Shareholder servicing fees | |
|
Administration
Class |
828,736 |
|
Institutional
Class |
10,884 |
|
Investment
Class |
23 |
|
Investor
Class |
20,825 |
|
Trust
Class |
189,689 |
| Distribution fees | |
|
Administration
Class |
207,184 |
|
Investment
Class |
9 |
|
Custodian
fees |
73,883 |
|
Trustees’ fees and expenses
|
9,034 |
|
Transfer agent
fees |
160,921 |
|
Registration and filing
fees |
111,080 |
|
Professional fees and
expenses |
19,695 |
|
Printing and postage
fees |
4,098 |
|
Insurance
expense |
35,614 |
|
Miscellaneous
expenses |
30,617 |
|
TOTAL
EXPENSES |
5,295,266 |
|
Expenses waived/reimbursed by the
Adviser |
(155,287) |
|
NET
EXPENSES |
5,139,979 |
|
NET INVESTMENT INCOME
(LOSS) |
$179,458,890 |
| REALIZED AND UNREALIZED GAIN (LOSS) | |
| Net realized gain (loss) on: | |
|
Investments allocated from affiliated
Portfolio |
41,961 |
| Net change in unrealized appreciation/depreciation on: | |
|
Investments allocated from affiliated
Portfolio |
2,794,456 |
|
NET REALIZED AND UNREALIZED GAIN
(LOSS) |
2,836,417 |
|
NET INCREASE (DECREASE) IN NET ASSETS FROM
OPERATIONS |
$182,295,307 |
| Six
Months Ended 6/30/19 (Unaudited) |
Year
Ended 12/31/18(a) | ||
| INCREASE (DECREASE) IN NET ASSETS FROM OPERATIONS: | |||
|
Net investment income
(loss) |
$ 179,458,890 | $ 238,279,241 | |
|
Net realized gain
(loss) |
41,961 | 99,187 | |
|
Net change in unrealized
appreciation/depreciation |
2,794,456 | 11,343 | |
|
Net increase (decrease) in net assets resulting from
operations |
182,295,307 | 238,389,771 | |
| DISTRIBUTIONS TO SHAREHOLDERS: | |||
|
Administration
Class |
(9,400,594) | (16,841,391) | |
|
Institutional
Class |
(898,207) | (522) | |
|
Investment
Class |
(206) | (12,458) | |
|
Investor
Class |
(634,196) | (1,303,641) | |
|
Premier
Class |
(160,467,793) | (207,278,397) | |
|
Trust
Class |
(8,057,804) | (12,837,558) | |
|
Total distributions to shareholders
|
(179,458,800) | (238,273,967) | |
| FROM BENEFICIAL INTEREST TRANSACTIONS: | |||
| Administration Class | |||
|
Shares
sold |
3,651,805,331 | 8,810,320,220 | |
|
Reinvestment of
distributions |
3,798,642 | 6,962,960 | |
|
Shares
redeemed |
(3,892,029,354) | (8,692,143,753) | |
|
Net increase (decrease) from capital share
transactions |
(236,425,381) | 125,139,427 | |
| Institutional Class | |||
|
Shares
sold |
105,503,158 | 55,086 | |
|
Reinvestment of
distributions |
646,068 | 54 | |
|
Shares
redeemed |
(1,518) | (13) | |
|
Net increase (decrease) from capital share
transactions |
106,147,708 | 55,127 | |
| Investment Class | |||
|
Reinvestment of
distributions |
65 | 96 | |
|
Shares
redeemed |
(5,307) | (5,524,389) | |
|
Net increase (decrease) from capital share
transactions |
(5,242) | (5,524,293) | |
| Investor Class | |||
|
Shares
sold |
345,770,733 | 507,867,839 | |
|
Reinvestment of
distributions |
614,890 | 1,228,213 | |
|
Shares
redeemed |
(305,406,405) | (502,571,336) | |
|
Net increase (decrease) from capital share
transactions |
40,979,218 | 6,524,716 | |
| Premier Class | |||
|
Shares
sold |
46,907,094,384 | 101,814,128,257 | |
|
Reinvestment of
distributions |
135,773,306 | 180,623,253 | |
|
Shares
redeemed |
(42,554,155,859) | (100,808,489,575) | |
|
Net increase (decrease) from capital share
transactions |
4,488,711,831 | 1,186,261,935 | |
| Trust Class | |||
|
Shares
sold |
3,573,286,774 | 6,721,774,753 | |
|
Reinvestment of
distributions |
6,067,950 | 9,824,200 | |
|
Shares
redeemed |
(3,521,876,326) | (6,791,873,011) | |
|
Net increase (decrease) from capital share
transactions |
57,478,398 | (60,274,058) | |
|
Net increase (decrease) in net assets from beneficial interest transactions
|
4,456,886,532 | 1,252,182,854 | |
|
Net increase (decrease) in net assets during the
period |
4,459,723,039 | 1,252,298,658 | |
|
Net assets at beginning of
period |
11,191,424,575 | 9,939,125,917 | |
|
NET ASSETS AT END OF
PERIOD |
$ 15,651,147,614 | $ 11,191,424,575 | |
| SHARES OF BENEFICIAL INTEREST: | |||
| Administration Class | |||
|
Shares
sold |
3,651,536,040 | 8,810,290,173 | |
|
Reinvestment of
distributions |
3,798,262 | 6,962,997 | |
|
Shares
redeemed |
(3,891,772,388) | (8,692,062,407) | |
|
Net increase (decrease) from share
transactions |
(236,438,086) | 125,190,763 | |
| Institutional Class | |||
|
Shares
sold |
105,482,513 | 55,075 | |
|
Reinvestment of
distributions |
645,874 | 54 | |
|
Shares
redeemed |
(1,518) | (13) | |
|
Net increase (decrease) from share
transactions |
106,126,869 | 55,116 |
| Six
Months Ended 6/30/19 (Unaudited) |
Year
Ended 12/31/18(a) | ||
| Investment Class | |||
|
Reinvestment of
distributions |
$ 65 | $ 96 | |
|
Shares
redeemed |
(5,307) | (5,524,483) | |
|
Net increase (decrease) from share
transactions |
(5,242) | (5,524,387) | |
| Investor Class | |||
|
Shares
sold |
345,729,463 | 507,868,109 | |
|
Reinvestment of
distributions |
614,817 | 1,228,236 | |
|
Shares
redeemed |
(305,368,658) | (502,578,153) | |
|
Net increase (decrease) from share
transactions |
40,975,622 | 6,518,192 | |
| Premier Class | |||
|
Shares
sold |
46,901,431,856 | 101,813,025,437 | |
|
Reinvestment of
distributions |
135,755,342 | 180,623,722 | |
|
Shares
redeemed |
(42,548,844,838) | (100,807,262,430) | |
|
Net increase (decrease) from share
transactions |
4,488,342,360 | 1,186,386,729 | |
| Trust Class | |||
|
Shares
sold |
3,572,759,230 | 6,721,631,079 | |
|
Reinvestment of
distributions |
6,067,020 | 9,824,002 | |
|
Shares
redeemed |
(3,521,369,867) | (6,791,750,606) | |
|
Net increase (decrease) from share
transactions |
57,456,383 | (60,295,525) |
| (a) | For Institutional Class shares, data is for the period July 5, 2018 (inception date) through December 31, 2018. |
| Administration Class(a) | |||||||
| Six
Months Ended 06/30/19 (Unaudited) |
Year
Ended 12/31/18 |
Year
Ended 12/31/17 |
For
the Period 8/29/16* - 12/31/16 | ||||
|
Net asset value, beginning of
period |
$ 0.9999 | $ 1.0000 | $ 1.0000 | $ 1.0000 | |||
| Income (loss) from investment operations: | |||||||
|
Net investment income
(loss) |
0.0112 | 0.0174 | 0.0080 | 0.0008 | |||
|
Net realized and unrealized gain
(loss) |
0.0002 | (0.0001) | 0.0000(b) | 0.0000(b) | |||
|
Total from investment
operations |
0.0114 | 0.0173 | 0.0080 | 0.0008 | |||
| Distributions to shareholders from: | |||||||
|
Net investment
income |
(0.0112) | (0.0174) | (0.0080) | (0.0008) | |||
|
Net realized
gains |
— | — | (0.0000)(b) | — | |||
|
Total
distributions |
(0.0112) | (0.0174) | (0.0080) | (0.0008) | |||
|
Net asset value, end of
period |
$ 1.0001 | $ 0.9999 | $ 1.0000 | $ 1.0000 | |||
|
Total return
(c) |
1.15% | 1.75% | 0.80% | 0.08% | |||
| Ratios and Supplemental Data: | |||||||
|
Net assets, end of period (in
000s) |
$720,506 | $956,750 | $831,606 | $798,447 | |||
| Ratios to Average Net Assets: | |||||||
|
Total
expenses |
0.37%(d) | 0.37% | 0.37% | 0.38%(d) | |||
|
Net
expenses |
0.37%(d) | 0.37% | 0.37% | 0.38%(d) | |||
|
Net investment income
(loss) |
2.27%(d) | 1.74% | 0.80% | 0.22%(d) | |||
| * | Commencement of operations. |
| (a) | The per share amounts and percentages include the Fund’s proportionate share of income and expenses of the affiliated Portfolio. |
| (b) | Amount is less than $0.00005 per share. |
| (c) | Total return is calculated assuming a purchase of shares at net asset value on the first day and a sale at net asset value on the last day of each period reported. Distributions are assumed, for the purpose of this calculation, to be reinvested at net asset value per share on the respective payment dates. Total return for periods of less than one year is not annualized. Results represent past performance and are not indicative of future results. |
| (d) | Annualized. |
| Institutional Class(a) | |||
| Six
Months Ended 6/30/19 (Unaudited) |
For
the Period 7/6/18* 12/31/18 | ||
|
Net asset value, beginning of
period |
$ 1.0001 | $ 1.0000 | |
| Income (loss) from investment operations: | |||
|
Net investment income
(loss) |
0.0123 | 0.0108 | |
|
Net realized and unrealized gain
(loss) |
0.0002 | 0.0001 | |
|
Total from investment
operations |
0.0125 | 0.0109 | |
| Distributions to shareholders from: | |||
|
Net investment
income |
(0.0123) | (0.0108) | |
|
Net asset value, end of
period |
$ 1.0003 | $ 1.0001 | |
|
Total return
(b) |
1.26% | 1.08% | |
| Ratios and Supplemental Data: | |||
|
Net assets, end of period (in
000s) |
$106,217 | $ 55 | |
| Ratios to Average Net Assets: | |||
|
Total
expenses |
0.15%(c) | 0.15%(c) | |
|
Net
expenses |
0.15%(c) | 0.15%(c) | |
|
Net investment income
(loss) |
2.48%(c) | 2.21%(c) | |
| * | Commencement of operations. |
| (a) | The per share amounts and percentages include the Fund’s proportionate share of income and expenses of the affiliated Portfolio. |
| (b) | Total return is calculated assuming a purchase of shares at net asset value on the first day and a sale at net asset value on the last day of each period reported. Distributions are assumed, for the purpose of this calculation, to be reinvested at net asset value per share on the respective payment dates. Total return for periods of less than one year is not annualized. Results represent past performance and are not indicative of future results. |
| (c) | Annualized. |
| Investment Class(a) | |||||||||||
| Six
Months Ended 06/30/19 (Unaudited) |
Year
Ended 12/31/18 |
Year
Ended 12/31/17 |
Year
Ended 12/31/16 |
Year
Ended 12/31/15 |
Year
Ended 12/31/14 | ||||||
|
Net asset value, beginning of
period |
$ 1.0000 | $ 0.9999 | $ 1.0000 | $ 1.0000 | $ 1.0000 | $ 1.0000 | |||||
| Income (loss) from investment operations: | |||||||||||
|
Net investment income
(loss) |
0.0109 | 0.0164 | 0.0070 | 0.0010 | 0.0000(b)(c) | 0.0000(b)(c) | |||||
|
Net realized and unrealized gain
(loss) |
0.0002 | 0.0001 | (0.0001) | 0.0000(b) | 0.0000(b) | 0.0000(b) | |||||
|
Total from investment
operations |
0.0111 | 0.0165 | 0.0069 | 0.0010 | 0.0000(b) | 0.0000(b) | |||||
| Distributions to shareholders from: | |||||||||||
|
Net investment
income |
(0.0109) | (0.0164) | (0.0070) | (0.0010) | — | — | |||||
|
Net realized
gains |
— | — | (0.0000)(b) | — | — | — | |||||
|
Total
distributions |
(0.0109) | (0.0164) | (0.0070) | (0.0010) | — | — | |||||
|
Net asset value, end of
period |
$ 1.0002 | $ 1.0000 | $ 0.9999 | $ 1.0000 | $ 1.0000 | $ 1.0000 | |||||
|
Total return
(d) |
1.11% | 1.67% | 0.69% | 0.10% | 0.00%(e) | 0.00%(e) | |||||
| Ratios and Supplemental Data: | |||||||||||
|
Net assets, end of period (in
000s) |
$ 18 | $ 23 | $ 5,547 | $ 5,582 | $485,292 | $726,910 | |||||
| Ratios to Average Net Assets: | |||||||||||
|
Total
expenses |
0.45%(f) | 0.47% | 0.47% | 0.47% | 0.47% | 0.47% | |||||
|
Net
expenses |
0.45%(f) | 0.47% | 0.47% | 0.46% | 0.24% | 0.19% | |||||
|
Net investment income
(loss) |
2.19%(f) | 1.18% | 0.70% | 0.08% | 0.00%(e) | 0.00%(e) | |||||
| (a) | The per share amounts and percentages include the Fund’s proportionate share of income and expenses of the affiliated Portfolio. |
| (b) | Amount is less than $0.00005 per share. |
| (c) | Per share numbers have been calculated using average shares outstanding, which more appropriately presents the per share data for the period. |
| (d) | Total return is calculated assuming a purchase of shares at net asset value on the first day and a sale at net asset value on the last day of each period reported. Distributions are assumed, for the purpose of this calculation, to be reinvested at net asset value per share on the respective payment dates. Total return for periods of less than one year is not annualized. Results represent past performance and are not indicative of future results. |
| (e) | Amount is less than 0.005%. |
| (f) | Annualized. |
| Investor Class(a) | |||||
| Six
Months Ended 06/30/19 (Unaudited) |
Year
Ended 12/31/18 |
For
the Period 7/13/17* - 12/31/17 | |||
|
Net asset value, beginning of
period |
$ 0.9999 | $ 0.9999 | $ 1.0000 | ||
| Income (loss) from investment operations: | |||||
|
Net investment income
(loss) |
0.0121 | 0.0191 | 0.0055 | ||
|
Net realized and unrealized gain
(loss) |
0.0002 | — | (0.0001) | ||
|
Total from investment
operations |
0.0123 | 0.0191 | 0.0054 | ||
|
Voluntary expense reimbursement from
Affiliate |
— | — | 0.0000(b) | ||
| Distributions to shareholders from: | |||||
|
Net investment
income |
(0.0121) | (0.0191) | (0.0055) | ||
|
Net realized
gains |
— | — | (0.0000)(b) | ||
|
Total
distributions |
(0.0121) | (0.0191) | (0.0055) | ||
|
Net asset value, end of
period |
$ 1.0001 | $ 0.9999 | $ 0.9999 | ||
|
Total return
(c) |
1.23% | 1.92% | 0.54% | ||
| Ratios and Supplemental Data: | |||||
|
Net assets, end of period (in
000s) |
$ 81,869 | $ 40,881 | $ 34,361 | ||
| Ratios to Average Net Assets: | |||||
|
Total
expenses |
0.20%(d) | 0.20% | 0.20%(d) | ||
|
Net
expenses |
0.20%(d) | 0.20% | 0.20%(d) | ||
|
Net investment income
(loss) |
2.44%(d) | 1.95% | 1.19%(d) | ||
| * | Commencement of operations. |
| (a) | The per share amounts and percentages include the Fund’s proportionate share of income and expenses of the affiliated Portfolio. |
| (b) | Amount is less than $0.00005 per share. |
| (c) | Total return is calculated assuming a purchase of shares at net asset value on the first day and a sale at net asset value on the last day of each period reported. Distributions are assumed, for the purpose of this calculation, to be reinvested at net asset value per share on the respective payment dates. Total return for periods of less than one year is not annualized. Results represent past performance and are not indicative of future results. |
| (d) | Annualized. |
| Premier Class(a) | |||||||||||
| Six
Months Ended 06/30/19 (Unaudited) |
Year
Ended 12/31/18 |
Year
Ended 12/31/17 |
Year
Ended 12/31/16 |
Year
Ended 12/31/15 |
Year
Ended 12/31/14 | ||||||
|
Net asset value, beginning of
period |
$ 0.9999 | $ 0.9999 | $ 1.0001 | $ 1.0000 | $ 1.0000 | $ 1.0000 | |||||
| Income (loss) from investment operations: | |||||||||||
|
Net investment income
(loss) |
0.0125 | 0.0199 | 0.0105 | 0.0045 | 0.0012(b) | 0.0008(b) | |||||
|
Net realized and unrealized gain
(loss) |
0.0003 | — | (0.0002) | 0.0001 | 0.0000(c) | (0.0001) | |||||
|
Total from investment
operations |
0.0128 | 0.0199 | 0.0103 | 0.0046 | 0.0012 | 0.0007 | |||||
| Distributions to shareholders from: | |||||||||||
|
Net investment
income |
(0.0125) | (0.0199) | (0.0105) | (0.0045) | (0.0012) | (0.0007) | |||||
|
Net realized
gains |
— | — | (0.0000)(c) | — | — | — | |||||
|
Total
distributions |
(0.0125) | (0.0199) | (0.0105) | (0.0045) | (0.0012) | (0.0007) | |||||
|
Net asset value, end of
period |
$ 1.0002 | $ 0.9999 | $ 0.9999 | $ 1.0001 | $ 1.0000 | $ 1.0000 | |||||
|
Total return
(d) |
1.28% | 2.00% | 1.05% | 0.45% | 0.12% | 0.07% | |||||
| Ratios and Supplemental Data: | |||||||||||
|
Net assets, end of period (in
000s) |
$13,980,783 | $9,489,591 | $8,303,222 | $6,255,384 | $45,207,442 | $37,932,781 | |||||
| Ratios to Average Net Assets: | |||||||||||
|
Total
expenses |
0.12%(e) | 0.12% | 0.12% | 0.12% | 0.12% | 0.12% | |||||
|
Net
expenses |
0.12%(e) | 0.12% | 0.12% | 0.12% | 0.12% | 0.12% | |||||
|
Net investment income
(loss) |
2.51%(e) | 2.00% | 1.06% | 0.43% | 0.12% | 0.07% | |||||
| (a) | The per share amounts and percentages include the Fund’s proportionate share of income and expenses of the affiliated Portfolio. |
| (b) | Per share numbers have been calculated using average shares outstanding, which more appropriately presents the per share data for the period. |
| (c) | Amount is less than $0.00005 per share. |
| (d) | Total return is calculated assuming a purchase of shares at net asset value on the first day and a sale at net asset value on the last day of each period reported. Distributions are assumed, for the purpose of this calculation, to be reinvested at net asset value per share on the respective payment dates. Total return for periods of less than one year is not annualized. Results represent past performance and are not indicative of future results. |
| (e) | Annualized. |
| Trust Class(a) | |||||||
| Six
Months Ended 06/30/19 (Unaudited) |
Year
Ended 12/31/18 |
Year
Ended 12/31/17 |
For
the Period 8/29/16* - 12/31/16 | ||||
|
Net asset value, beginning of
period |
$ 1.0000 | $ 0.9999 | $ 1.0000 | $ 1.0000 | |||
| Income (loss) from investment operations: | |||||||
|
Net investment income
(loss) |
0.0122 | 0.0193 | 0.0099 | 0.0015 | |||
|
Net realized and unrealized gain
(loss) |
0.0002 | 0.0001 | (0.0001) | 0.0000(b) | |||
|
Total from investment
operations |
0.0124 | 0.0194 | 0.0098 | 0.0015 | |||
| Distributions to shareholders from: | |||||||
|
Net investment
income |
(0.0122) | (0.0193) | (0.0099) | (0.0015) | |||
|
Net realized
gains |
— | — | (0.0000)(b) | — | |||
|
Total
distributions |
(0.0122) | (0.0193) | (0.0099) | (0.0015) | |||
|
Net asset value, end of
period |
$ 1.0002 | $ 1.0000 | $ 0.9999 | $ 1.0000 | |||
|
Total return
(c) |
1.25% | 1.96% | 0.99% | 0.15% | |||
| Ratios and Supplemental Data: | |||||||
|
Net assets, end of period (in
000s) |
$761,755 | $704,123 | $764,391 | $1,211,202 | |||
| Ratios to Average Net Assets: | |||||||
|
Total
expenses |
0.18%(d) | 0.18% | 0.18% | 0.19%(d) | |||
|
Net
expenses |
0.18%(d) | 0.18% | 0.18% | 0.19%(d) | |||
|
Net investment income
(loss) |
2.46%(d) | 1.91% | 0.97% | 0.39%(d) | |||
| * | Commencement of operations. |
| (a) | The per share amounts and percentages include the Fund’s proportionate share of income and expenses of the affiliated Portfolio. |
| (b) | Amount is less than $0.00005 per share. |
| (c) | Total return is calculated assuming a purchase of shares at net asset value on the first day and a sale at net asset value on the last day of each period reported. Distributions are assumed, for the purpose of this calculation, to be reinvested at net asset value per share on the respective payment dates. Total return for periods of less than one year is not annualized. Results represent past performance and are not indicative of future results. |
| (d) | Annualized. |
| Fund | Classes | Commencement
of Operations |
Diversification
Classification |
| State Street Institutional Liquid Reserves Fund | Premier
Class Institutional Class Investment Class Administration Class Investor Class Service Class Trust Class |
August
12, 2004 July 6, 2018 October 15, 2007 August 29, 2016 July 13, 2017 Not commenced August 29, 2016 |
Diversified |
| Tax
Cost |
Gross
Unrealized Appreciation |
Gross
Unrealized Depreciation |
Net
Unrealized Appreciation (Depreciation) | ||||
|
State Street Institutional Liquid Reserves
Fund |
$15,655,297,295 | $2,660,210 | $— | $2,660,210 |
| Actual | Hypothetical
(assuming a 5% return before expenses) | ||||||||
| Annualized
Expense Ratio |
Ending
Account Value |
Expenses
Paid During Period(a) |
Ending
Account Value |
Expenses
Paid During Period(a) | |||||
|
State Street Institutional Liquid Reserves
Fund |
|||||||||
|
Administration
Class |
0.37% | $1,011.50 | $1.85 | $1,023.00 | $1.86 | ||||
|
Institutional
Class |
0.15 | 1,012.60 | 0.75 | 1,024.10 | 0.75 | ||||
|
Investment
Class |
0.45 | 1,011.10 | 2.24 | 1,022.60 | 2.26 | ||||
|
Investor
Class |
0.20 | 1,012.30 | 1.00 | 1,023.80 | 1.00 | ||||
|
Premier
Class |
0.12 | 1,012.80 | 0.60 | 1,024.20 | 0.60 | ||||
|
Trust
Class |
0.18 | 1,012.50 | 0.90 | 1,023.90 | 0.90 | ||||
| (a) | Expenses are equal to the Fund’s annualized net expense ratio, which includes the Fund’s proportionate share of the expenses of the Portfolio, multiplied by the average account value of the period, multiplied by 181, then divided by 365. |
| • | A report prepared by an independent third-party provider of investment company data, which includes for the Fund: |
| • | Comparisons of the Fund’s performance over the past one-, three-, five- and ten-year periods ended December 31, 2018, to the performance of an appropriate benchmark constructed by Broadridge Financial Solutions, Inc., the successor to Lipper, Inc. (“Broadridge”), for the Fund (the “Lipper Index”) and a universe of other mutual funds with similar investment objectives and policies (the “Performance Group” and/or the “Performance Universe”); |
| • | Comparisons of the Fund’s expense ratio (with detail of component expenses) to the expense ratios of a group of comparable mutual funds selected by the independent third-party data provider (the “Expense Group” and/or “Expense Universe”); |
| • | A chart showing the Fund’s historical average net assets relative to its total expenses, management fees, and non-management expenses over the past five calendar years; and |
| • | Comparisons of the Fund’s contractual management fee to the contractual management fees of comparable mutual funds at different asset levels. |
| • | Comparative information concerning fees charged by the Adviser for managing institutional accounts using investment strategies and techniques similar to those used in managing the Fund; and |
| • | Profitability analyses for (a) the Adviser with respect to the Fund and (b) affiliates of the Adviser that provide services to the Fund (“Affiliated Service Providers”). |
| • | Descriptions of the investment management services provided by the Adviser, including its investment strategies and processes; |
| • | Information concerning the allocation of brokerage; and |
| • | Information regarding the procedures and processes used to value the assets of the Fund. |
| • | Reports detailing the financial results and condition of the Adviser and its affiliates; |
| • | Descriptions of the qualifications, education and experience of the individual investment and other professionals responsible for managing the portfolio of the Fund and for Fund operations; |
| • | Information relating to compliance with and the administration of the Code of Ethics adopted by the Adviser; |
| • | A copy of the Adviser’s proxy voting policies and procedures and other information regarding the Adviser’s practices for overseeing proxy vendors; |
| • | Information concerning the resources devoted by the Adviser to overseeing compliance by the Fund and its service providers, including information concerning compliance with investment policies and restrictions and other operating policies of the Fund; |
| • | A description of the adequacy and sophistication of the Adviser’s technology and systems with respect to investment and administrative matters and a description of any material improvements or changes in technology or systems in the past year; |
| • | A description of the business continuity and disaster recovery plans of the Adviser; and |
| • | Information regarding the Adviser’s risk management processes. |
| • | Information concerning the nature, extent, quality and cost of services provided to the Fund by SSGA FM in its capacity as the Fund’s administrator (the “Administrator”); |
| • | Information concerning the nature, extent, quality and cost of various non-investment management services provided to the Fund by affiliates of the Adviser, including the custodian, sub-administrator and fund accountant of the Fund, and the role of the Adviser in managing the Fund’s relationship with these service providers; |
| • | Copies of the Advisory Agreement and agreements with other service providers of the Fund; |
| • | Draft responses to a letter from independent legal counsel to the Independent Trustees (“Independent Counsel”), reviewed prior to such date by Independent Counsel, requesting specific information from each of: |
| • | SSGA FM, in its capacity as the Fund’s Adviser and Administrator, with respect to its operations relating to the Fund and its approximate profit margins from such operations for the calendar year ended December 31, 2018; and the relevant operations of other affiliated service providers to the Fund, together with their approximate profit margins from such relevant operations for the calendar year ended December 31, 2018; |
| • | State Street Bank and Trust Company (“State Street”), the sub-administrator, custodian and shareholder servicer for the Fund, with respect to its operations relating to the Fund; and |
| • | State Street Global Advisors Funds Distributors, LLC, the principal underwriter and distributor of the shares of the Fund (the “Distributor”), with respect to its operations relating to the Fund, together with the Fund’s related distribution plans and arrangements under Rule 12b-1 of the 1940 Act; |
| • | Information from SSGA FM, State Street and the Distributor with respect to the Trust providing any material changes to the previous information supplied in response to the letter from Independent Counsel prior to the executive session of the Board on May 15, 2019; |
| • | Materials provided by Broadridge, circulated to the Independent Trustees and to Independent Counsel, with respect to the Fund; and |
| • | A summary of the foregoing materials prepared by Independent Counsel. |
State Street Bank and Trust Company
P.O. Box 5049
Boston, MA 02206
| State Street Money Market Portfolio |
|
|
1 |
|
|
2 |
|
|
8 |
|
|
9 |
|
|
10 |
|
|
11 |
|
|
12 |
|
|
16 |
| % of Net Assets | |||
| Certificates of Deposit | 31.6% | ||
| Financial Company Commercial Paper | 20.2 | ||
| Other Notes | 19.6 | ||
| Other Repurchase Agreements | 8.9 | ||
| Asset Backed Commercial Paper | 7.0 | ||
| Government Agency Repurchase Agreements | 6.6 | ||
| Treasury Repurchase Agreements | 5.9 | ||
| Other Assets in Excess of Liabilities | 0.2 | ||
| TOTAL | 100.0% |
| % of Net Assets | |||
| Overnight (1 Day) | 34.3% | ||
| 2 to 30 Days | 15.3 | ||
| 31 to 60 Days | 11.9 | ||
| 61 to 90 Days | 8.2 | ||
| Over 90 Days | 30.1 | ||
| Total | 99.8% | ||
| Average days to maturity | 33 | ||
| Weighted average life | 66 |
| Name of Issuer and Title of Issue | Interest Rate | Next Rate Reset Date | Maturity Date | Principal Amount | Value | |||||
| ASSET BACKED COMMERCIAL PAPER—7.0% | ||||||||||
|
Alpine Securitization
LLC(a) |
2.540% | 07/31/2019 | 07/31/2019 | $ 40,000,000 | $ 39,911,817 | |||||
|
Antalis
SA(a) |
2.600% | 07/03/2019 | 07/03/2019 | 100,000,000 | 99,966,250 | |||||
|
Atlantic Asset Securitization
LLC(a) |
2.370% | 07/01/2019 | 07/01/2019 | 130,000,000 | 129,974,000 | |||||
|
Barton Capital
SA(a) |
2.470% | 07/29/2019 | 07/29/2019 | 48,400,000 | 48,302,891 | |||||
|
Barton Capital
SA(a) |
2.470% | 09/03/2019 | 09/03/2019 | 38,000,000 | 37,835,147 | |||||
|
Bedford Row Funding Corp., 1 Month USD LIBOR +
0.13%(b) |
2.524% | 07/16/2019 | 01/16/2020 | 50,000,000 | 50,002,636 | |||||
|
Cancara Asset Securitisation
LLC(a) |
2.250% | 10/25/2019 | 10/25/2019 | 50,000,000 | 49,605,482 | |||||
|
Collateralized Commercial Paper FLEX Co. LLC, 1 Month USD LIBOR +
0.25%(b) |
2.669% | 07/08/2019 | 08/07/2019 | 58,000,000 | 58,016,190 | |||||
|
Kells Funding
LLC(a) |
2.500% | 08/19/2019 | 08/19/2019 | 131,000,000 | 130,560,437 | |||||
|
Kells Funding
LLC(a) |
2.530% | 08/15/2019 | 08/15/2019 | 50,000,000 | 49,844,667 | |||||
|
Kells Funding
LLC(a) |
2.540% | 08/02/2019 | 08/02/2019 | 50,000,000 | 49,885,666 | |||||
|
Kells Funding
LLC(a) |
2.550% | 08/09/2019 | 08/09/2019 | 125,000,000 | 124,658,750 | |||||
|
LMA Americas
LLC(a) |
2.390% | 07/01/2019 | 07/01/2019 | 125,000,000 | 124,975,365 | |||||
|
LMA Americas
LLC(a) |
2.410% | 11/01/2019 | 11/01/2019 | 50,000,000 | 49,603,100 | |||||
|
Nieuw Amsterdam Receivables
Corp.(a) |
2.550% | 07/16/2019 | 07/16/2019 | 55,000,000 | 54,933,285 | |||||
|
TOTAL ASSET BACKED COMMERCIAL
PAPER |
1,098,075,683 | |||||||||
| CERTIFICATES OF DEPOSIT—31.6% | ||||||||||
|
Bank of Montreal, 3 Month USD LIBOR +
0.05%(b) |
2.570% | 09/03/2019 | 03/02/2020 | 100,000,000 | 100,006,257 | |||||
|
Bank of Montreal, 3 Month USD LIBOR +
0.22%(b) |
2.673% | 09/09/2019 | 12/09/2019 | 150,000,000 | 150,130,891 | |||||
|
Bank of Nova
Scotia(a) |
2.650% | 12/16/2019 | 12/16/2019 | 75,000,000 | 75,024,690 | |||||
|
Bank of Nova Scotia, 1 Month USD LIBOR +
0.30%(b) |
2.694% | 07/16/2019 | 01/16/2020 | 20,000,000 | 20,025,659 | |||||
|
Bank of Nova Scotia, 3 Month USD LIBOR +
0.14%(b) |
2.751% | 07/16/2019 | 01/16/2020 | 23,000,000 | 23,017,140 | |||||
|
BNP Paribas, 3 Month USD LIBOR +
0.07%(b) |
2.649% | 08/05/2019 | 11/05/2019 | 90,000,000 | 90,002,690 | |||||
|
Canadian Imperial Bank of Commerce, 1 Month USD LIBOR +
0.13%(b) |
2.551% | 07/08/2019 | 12/06/2019 | 125,000,000 | 125,042,010 | |||||
|
Canadian Imperial Bank of Commerce, 1 Month USD LIBOR +
0.33%(b) |
2.741% | 07/15/2019 | 08/13/2019 | 125,000,000 | 125,052,779 | |||||
|
Canadian Imperial Bank of Commerce, 3 Month USD LIBOR +
0.22%(b) |
2.550% | 09/30/2019 | 12/30/2019 | 35,000,000 | 35,032,902 | |||||
|
Canadian Imperial Bank of Commerce, 3 Month USD LIBOR +
0.32%(b) |
2.931% | 07/05/2019 | 07/05/2019 | 80,000,000 | 80,002,167 | |||||
|
China Construction
Bank(a) |
2.630% | 08/16/2019 | 08/16/2019 | 60,000,000 | 60,013,607 | |||||
|
China Construction
Bank(a) |
2.660% | 07/15/2019 | 07/15/2019 | 50,000,000 | 50,005,049 | |||||
|
Credit Industriel et
Commercial(a) |
2.260% | 03/11/2020 | 03/11/2020 | 100,000,000 | 100,141,278 | |||||
|
Credit Industriel et
Commercial(a) |
2.590% | 12/04/2019 | 12/04/2019 | 100,000,000 | 100,150,163 | |||||
|
Credit Industriel et Commercial, 1 Month USD LIBOR +
0.14%(b) |
2.580% | 07/01/2019 | 08/01/2019 | 120,000,000 | 120,016,138 | |||||
|
Credit Suisse
AG(a) |
2.620% | 09/27/2019 | 09/27/2019 | 100,000,000 | 100,063,812 | |||||
|
Credit Suisse
AG(a) |
2.620% | 10/10/2019 | 10/10/2019 | 100,000,000 | 100,070,998 | |||||
|
Credit Suisse AG, 1 Month USD LIBOR +
0.18%(b) |
2.592% | 07/11/2019 | 12/11/2019 | 100,000,000 | 100,048,494 | |||||
|
Credit Suisse AG, 3 Month USD LIBOR +
0.11%(b) |
2.711% | 07/18/2019 | 10/15/2019 | 50,000,000 | 50,008,569 | |||||
|
Industrial and Commercial Bank of China
Ltd.(a) |
2.490% | 07/09/2019 | 07/09/2019 | 49,000,000 | 49,003,434 | |||||
|
Industrial and Commercial Bank of China
Ltd.(a) |
2.630% | 08/26/2019 | 08/26/2019 | 61,000,000 | 61,009,585 | |||||
|
Industrial and Commercial Bank of China
Ltd.(a) |
2.660% | 07/15/2019 | 07/15/2019 | 110,000,000 | 110,009,523 | |||||
|
Industrial and Commercial Bank of China
Ltd.(a) |
2.660% | 08/02/2019 | 08/02/2019 | 125,000,000 | 125,019,582 | |||||
|
Industrial and Commercial Bank of China
Ltd.(a) |
2.700% | 07/02/2019 | 07/02/2019 | 135,000,000 | 135,003,584 | |||||
|
Lloyds Bank Corporate Markets PLC, 3 Month USD LIBOR +
0.18%(b) |
2.772% | 07/19/2019 | 07/19/2019 | 150,000,000 | 150,008,398 | |||||
|
Mizuho Bank
Ltd.(a) |
2.570% | 08/05/2019 | 08/05/2019 | 100,000,000 | 100,023,463 | |||||
|
Mizuho Bank Ltd., 3 Month USD LIBOR +
0.11%(b) |
2.721% | 07/02/2019 | 07/02/2019 | 150,000,000 | 150,000,000 | |||||
|
MUFG Bank
Ltd.(a) |
2.600% | 10/31/2019 | 10/31/2019 | 111,000,000 | 111,109,422 | |||||
|
Nordea Bank AB, 3 Month USD LIBOR -
0.01%(b) |
2.591% | 07/18/2019 | 10/18/2019 | 95,000,000 | 94,999,762 | |||||
|
Nordea Bank AB, 3 Month USD LIBOR -
0.01%(b) |
2.601% | 07/15/2019 | 10/15/2019 | 50,000,000 | 49,999,897 | |||||
|
Norinchukin
Bank(a) |
2.260% | 12/04/2019 | 12/04/2019 | 19,440,000 | 19,458,293 |
| Name of Issuer and Title of Issue | Interest Rate | Next Rate Reset Date | Maturity Date | Principal Amount | Value | |||||
|
Norinchukin
Bank(a) |
2.550% | 07/16/2019 | 07/16/2019 | $ 100,000,000 | $ 100,007,273 | |||||
|
Royal Bank of Canada, 3 Month USD LIBOR +
0.05%(b) |
2.661% | 07/02/2019 | 04/02/2020 | 150,000,000 | 149,999,940 | |||||
|
Skandinaviska Enskilda Banken
AB(a) |
2.600% | 10/04/2019 | 10/04/2019 | 106,000,000 | 106,097,862 | |||||
|
Skandinaviska Enskilda Banken AB, 3 Month USD LIBOR +
0.01%(b) |
2.533% | 08/22/2019 | 11/22/2019 | 104,000,000 | 103,999,524 | |||||
|
Skandinaviska Enskilda Banken AB, 3 Month USD LIBOR +
0.13%(b) |
2.581% | 09/11/2019 | 09/11/2019 | 140,000,000 | 140,032,067 | |||||
|
Societe Generale, 3 Month USD LIBOR +
0.07%(b) |
2.681% | 07/15/2019 | 07/15/2019 | 75,000,000 | 75,002,385 | |||||
|
Standard Chartered
Bank(a) |
2.600% | 07/22/2019 | 07/22/2019 | 75,000,000 | 75,010,334 | |||||
|
Sumitomo Mitsui Banking Corp., 1 Month USD LIBOR +
0.13%(b) |
2.551% | 07/08/2019 | 09/06/2019 | 50,000,000 | 50,011,647 | |||||
|
Sumitomo Mitsui Banking Corp., 1 Month USD LIBOR +
0.13%(b) |
2.559% | 07/05/2019 | 09/04/2019 | 74,000,000 | 74,017,027 | |||||
|
Sumitomo Mitsui Banking Corp., 1 Month USD LIBOR +
0.13%(b) |
2.569% | 07/31/2019 | 09/30/2019 | 55,000,000 | 55,012,164 | |||||
|
Sumitomo Mitsui Banking Corp., 1 Month USD LIBOR +
0.16%(b) |
2.564% | 07/22/2019 | 08/22/2019 | 113,000,000 | 113,027,548 | |||||
|
Sumitomo Mitsui Trust
Bank(a) |
2.400% | 07/02/2019 | 07/02/2019 | 100,000,000 | 100,000,117 | |||||
|
Sumitomo Mitsui Trust
Bank(a) |
2.580% | 07/11/2019 | 07/11/2019 | 42,000,000 | 42,002,995 | |||||
|
Sumitomo Mitsui Trust Bank, 1 Month USD LIBOR +
0.17%(b) |
2.600% | 07/05/2019 | 08/05/2019 | 40,000,000 | 40,007,267 | |||||
|
Svenska Handelsbanken AB, 3 Month USD LIBOR +
0.02%(b) |
2.612% | 07/19/2019 | 07/19/2019 | 130,000,000 | 130,002,427 | |||||
|
Svenska Handelsbanken AB, 3 Month USD LIBOR +
0.21%(b) |
2.629% | 09/19/2019 | 12/19/2019 | 127,000,000 | 127,111,989 | |||||
|
Toronto-Dominion
Bank(a) |
2.400% | 12/04/2019 | 12/04/2019 | 73,000,000 | 73,042,258 | |||||
|
Toronto-Dominion
Bank(a) |
2.600% | 10/15/2019 | 10/15/2019 | 100,000,000 | 100,090,095 | |||||
|
Toronto-Dominion Bank, 1 Month USD LIBOR +
0.33%(b) |
2.770% | 07/02/2019 | 08/02/2019 | 100,000,000 | 100,020,622 | |||||
|
Toronto-Dominion Bank, 3 Month USD LIBOR +
0.03%(b) |
2.373% | 09/24/2019 | 03/24/2020 | 125,000,000 | 124,999,777 | |||||
|
Wells Fargo Bank NA, 1 Month USD LIBOR +
0.18%(b) |
2.592% | 07/08/2019 | 04/08/2020 | 100,000,000 | 100,043,343 | |||||
|
Wells Fargo Bank NA, 3 Month USD LIBOR +
0.17%(b) |
2.781% | 07/15/2019 | 01/15/2020 | 75,000,000 | 75,063,577 | |||||
|
Wells Fargo Bank NA, 3 Month USD LIBOR +
0.23%(b) |
2.841% | 07/03/2019 | 01/06/2020 | 50,000,000 | 50,055,746 | |||||
|
Wells Fargo Bank NA, 3 Month USD LIBOR +
0.24%(b) |
2.851% | 07/03/2019 | 02/03/2020 | 75,000,000 | 75,096,517 | |||||
|
TOTAL CERTIFICATES OF
DEPOSIT |
4,939,254,737 | |||||||||
| FINANCIAL COMPANY COMMERCIAL PAPER—20.2% | ||||||||||
|
Bank of Nova Scotia, 1 Month USD LIBOR +
0.14%(b) |
2.580% | 07/03/2019 | 02/03/2020 | 90,000,000 | 90,029,369 | |||||
|
Bank of Nova Scotia, 3 Month USD LIBOR +
0.06%(b) |
2.539% | 09/05/2019 | 06/05/2020 | 100,000,000 | 99,999,590 | |||||
|
BPCE(a) |
2.270% | 02/18/2020 | 02/18/2020 | 125,000,000 | 123,230,972 | |||||
|
BPCE(a) |
2.410% | 10/04/2019 | 10/04/2019 | 50,000,000 | 49,698,106 | |||||
|
Caisse des Depots et
Consignations(a) |
2.485% | 08/16/2019 | 08/16/2019 | 100,000,000 | 99,696,608 | |||||
|
CDP Financial,
Inc.(a) |
2.500% | 11/14/2019 | 11/14/2019 | 74,000,000 | 73,326,553 | |||||
|
CDP Financial,
Inc.(a) |
2.555% | 10/15/2019 | 10/15/2019 | 150,000,000 | 148,926,804 | |||||
|
Commonwealth Bank of Australia, 3 Month USD LIBOR +
0.04%(b) |
2.619% | 08/05/2019 | 02/03/2020 | 50,000,000 | 50,005,655 | |||||
|
DBS Bank
Ltd.(a) |
2.250% | 12/03/2019 | 12/03/2019 | 30,000,000 | 29,711,650 | |||||
|
DBS Bank
Ltd.(a) |
2.260% | 10/18/2019 | 10/18/2019 | 200,000,000 | 198,598,134 | |||||
|
DnB Bank
ASA(a) |
2.465% | 09/30/2019 | 09/30/2019 | 150,000,000 | 149,114,050 | |||||
|
Erste
Abwicklungsanstalt(a) |
2.490% | 09/16/2019 | 09/16/2019 | 50,000,000 | 49,743,667 | |||||
|
HSBC Bank PLC, 1 Month USD LIBOR +
0.30%(b) |
2.704% | 07/22/2019 | 07/22/2019 | 100,000,000 | 100,020,138 | |||||
|
HSBC Bank PLC, 3 Month USD LIBOR +
0.01%(b) |
2.575% | 08/07/2019 | 08/07/2019 | 100,000,000 | 100,000,159 | |||||
|
ING US Funding LLC, 1 Month USD LIBOR +
0.16%(b) |
2.600% | 07/03/2019 | 12/03/2019 | 125,000,000 | 125,056,254 | |||||
|
ING US Funding LLC, 1 Month USD LIBOR +
0.29%(b) |
2.702% | 07/08/2019 | 07/08/2019 | 90,000,000 | 90,007,446 | |||||
|
Lloyds Bank PLC, 1 Month USD LIBOR +
0.09%(b) |
2.635% | 08/05/2019 | 02/04/2020 | 115,000,000 | 114,999,540 | |||||
|
Lloyds Bank PLC, 1 Month USD LIBOR +
0.26%(b) |
2.650% | 07/19/2019 | 08/19/2019 | 120,000,000 | 120,043,950 | |||||
|
National Australia Bank Ltd., 1 Month USD LIBOR +
0.22%(b) |
2.660% | 07/01/2019 | 08/01/2019 | 56,000,000 | 56,011,911 | |||||
|
Nordea Bank
AB(a) |
2.485% | 09/20/2019 | 09/20/2019 | 100,000,000 | 99,471,733 | |||||
|
Skandinaviska Enskilda Banken
AB(a) |
2.560% | 12/11/2019 | 12/11/2019 | 125,000,000 | 123,749,812 | |||||
|
Swedbank
AB(a) |
2.600% | 09/11/2019 | 09/11/2019 | 125,000,000 | 124,398,437 |
| Name of Issuer and Title of Issue | Interest Rate | Next Rate Reset Date | Maturity Date | Principal Amount | Value | |||||
|
Toronto-Dominion
Bank(a) |
2.440% | 07/03/2019 | 07/03/2019 | $ 125,000,000 | $ 124,958,541 | |||||
|
Toronto-Dominion Bank, 1 Month USD LIBOR +
0.37%(b) |
2.789% | 07/08/2019 | 11/07/2019 | 125,000,000 | 125,139,995 | |||||
|
Toyota Motor Credit Corp., 1 Month USD LIBOR +
0.14%(b) |
2.580% | 07/03/2019 | 01/23/2020 | 130,000,000 | 130,044,095 | |||||
|
Toyota Motor Credit Corp., 1 Month USD LIBOR +
0.15%(b) |
2.590% | 07/02/2019 | 12/23/2019 | 70,000,000 | 70,020,910 | |||||
|
Toyota Motor Credit Corp., 3 Month USD
LIBOR%(b) |
2.521% | 08/28/2019 | 11/21/2019 | 100,000,000 | 99,995,734 | |||||
|
Toyota Motor Finance Netherlands B.V., 3 Month USD LIBOR +
0.13%(b) |
2.741% | 07/15/2019 | 10/11/2019 | 153,000,000 | 153,063,714 | |||||
|
UBS AG, 3 Month USD LIBOR +
0.05%(b) |
2.629% | 08/01/2019 | 02/03/2020 | 50,000,000 | 49,999,750 | |||||
|
Westpac Banking Corp., 3 Month USD LIBOR +
0.07%(b) |
2.595% | 08/16/2019 | 08/16/2019 | 72,500,000 | 72,504,765 | |||||
|
Westpac Banking Corp., 3 Month USD LIBOR +
0.07%(b) |
2.632% | 08/09/2019 | 08/12/2019 | 50,000,000 | 50,004,338 | |||||
|
Westpac Banking Corp., 3 Month USD LIBOR +
0.18%(b) |
2.701% | 08/27/2019 | 11/27/2019 | 75,000,000 | 75,053,999 | |||||
|
TOTAL FINANCIAL COMPANY COMMERCIAL
PAPER |
3,166,626,379 | |||||||||
| OTHER NOTES—19.6% | ||||||||||
|
ABN Amro Bank
NV(a) |
2.420% | 07/02/2019 | 07/02/2019 | 150,000,000 | 150,000,000 | |||||
|
Australia & New Zealand Banking Group
Ltd.(a) |
2.390% | 07/01/2019 | 07/01/2019 | 280,000,000 | 280,000,000 | |||||
|
Bank of America NA, 1 Month USD LIBOR +
0.14%(b) |
2.580% | 07/03/2019 | 09/03/2019 | 46,000,000 | 46,008,545 | |||||
|
Bank of America NA, 1 Month USD LIBOR +
0.30%(b) |
2.740% | 07/02/2019 | 08/02/2019 | 68,000,000 | 68,016,361 | |||||
|
Bank of Nova
Scotia(a) |
2.410% | 07/01/2019 | 07/01/2019 | 250,000,000 | 250,000,000 | |||||
|
Citibank
NA(a) |
2.500% | 07/01/2019 | 07/01/2019 | 200,000,000 | 200,000,000 | |||||
|
Cooperatieve Rabobank
UA(a) |
2.350% | 07/01/2019 | 07/01/2019 | 175,537,000 | 175,537,000 | |||||
|
Lloyds Bank Corporate Markets
PLC(a) |
2.350% | 07/01/2019 | 07/01/2019 | 150,000,000 | 150,000,000 | |||||
|
Mizuho Bank
Ltd.(a) |
2.400% | 07/01/2019 | 07/01/2019 | 200,000,000 | 200,000,000 | |||||
|
Mizuho Bank
Ltd.(a) |
2.430% | 07/03/2019 | 07/03/2019 | 100,000,000 | 100,000,000 | |||||
|
Mizuho Bank
Ltd.(a) |
2.440% | 07/02/2019 | 07/02/2019 | 125,000,000 | 125,000,000 | |||||
|
National Australia Bank
Ltd.(a) |
2.350% | 07/01/2019 | 07/01/2019 | 200,000,000 | 200,000,000 | |||||
|
National Bank of
Canada(a) |
2.420% | 07/03/2019 | 07/03/2019 | 100,000,000 | 100,000,000 | |||||
|
National Bank of
Canada(a) |
2.440% | 07/02/2019 | 07/02/2019 | 110,000,000 | 110,000,000 | |||||
|
Royal Bank of
Canada(a) |
2.500% | 07/01/2019 | 07/01/2019 | 325,000,000 | 325,000,000 | |||||
|
Standard Chartered
Bank(a) |
2.380% | 07/01/2019 | 07/01/2019 | 300,000,000 | 300,000,000 | |||||
|
Svenska Handelsbanken
AB(a) |
2.330% | 07/01/2019 | 07/01/2019 | 294,165,000 | 294,165,000 | |||||
|
TOTAL OTHER
NOTES |
3,073,726,906 | |||||||||
| GOVERNMENT AGENCY REPURCHASE AGREEMENTS—6.6% | ||||||||||
|
Agreement with Bank of America and Bank of New York Mellon (Tri-Party), dated 06/28/2019 (collateralized by Government National Mortgage Associations, 4.000% – 4.500% due 04/20/2047 – 10/20/2048, valued at
$80,580,000); expected proceeds
$79,016,458 |
2.500% | 07/01/2019 | 07/01/2019 | 79,000,000 | 79,000,000 | |||||
|
Agreement with Bank of Nova Scotia and Bank of New York Mellon (Tri-Party), dated 06/28/2019 (collateralized by a Federal Home Loan Mortgage Corporation, 4.500% due 11/01/2048, and Government National Mortgage Associations,
3.000% – 4.500% due 05/15/2040 – 08/15/2047, valued at $154,052,088); expected proceeds
$151,031,458 |
2.500% | 07/01/2019 | 07/01/2019 | 151,000,000 | 151,000,000 | |||||
|
Agreement with Citigroup Global Markets, Inc. and Bank of New York Mellon (Tri-Party), dated 06/28/2019 (collateralized by a Federal Home Loan Mortgage Corporations, 0.000% – 7.000% due 02/15/2022 – 08/15/2034,
Federal Home Loan Mortgage Corporation Strip, 5.500% due 08/01/2035, Federal National Mortgage Associations, 0.000% – 6.000% due 11/25/2027 – 06/25/2040, Federal National Mortgage Associations Strips, 0.000% – 7.000% due 09/25/2023
– 05/01/2044, and U.S. Treasury Notes, 2.000% – 2.235% due 10/31/2019 – 05/15/2022, valued at $51,335,749); expected proceeds
$50,010,458 |
2.510% | 07/01/2019 | 07/01/2019 | 50,000,000 | 50,000,000 |
| Name of Issuer and Title of Issue | Interest Rate | Next Rate Reset Date | Maturity Date | Principal Amount | Value | |||||
|
Agreement with Citigroup Global Markets, Inc. and Bank of New York Mellon (Tri-Party), dated 06/28/2019 (collateralized by a Government National Mortgage Association, 0.403% due 12/16/2039, a U.S. Treasury Bond, 7.625% due
02/15/2025, a U.S. Treasury Inflation Index Note, 0.250% due 01/15/2025, and U.S. Treasury Notes, 2.000% – 2.750% due 01/31/2025 – 02/28/2025, valued at $48,960,878); expected proceeds
$48,010,000 |
2.500% | 07/01/2019 | 07/01/2019 | $ 48,000,000 | $ 48,000,000 | |||||
|
Agreement with Goldman Sachs & Co. and Bank of New York Mellon (Tri-Party), dated 06/28/2019 (collateralized by a Federal National Mortgage Association, 4.000% due 06/01/2049, and a Government National Mortgage
Association, 4.000% due 11/20/2048, valued at $94,860,001); expected proceeds
$93,019,530 |
2.520% | 07/01/2019 | 07/01/2019 | 93,000,000 | 93,000,000 | |||||
|
Agreement with HSBC Securities USA, Inc. and Bank of New York Mellon (Tri-Party), dated 06/28/2019 (collateralized by a Federal Home Loan Mortgage Corporation, 4.000% due 09/01/2047, and Federal National Mortgage
Associations, 2.000% – 4.500% due 02/01/2032 – 02/01/2049, valued at $29,580,000); expected proceeds
$29,006,090 |
2.520% | 07/01/2019 | 07/01/2019 | 29,000,000 | 29,000,000 | |||||
|
Agreement with JP Morgan Securities, Inc. and Bank of New York Mellon (Tri-Party), dated 06/28/2019 (collateralized by Federal Home Loan Mortgage Corporations, 2.564% – 4.785% due 10/01/2026 – 11/01/2045, and
Federal National Mortgage Associations, 3.000% – 5.500% due 06/01/2033 – 07/01/2049, valued at $117,300,000); expected proceeds
$115,024,438 |
2.550% | 07/01/2019 | 07/01/2019 | 115,000,000 | 115,000,000 | |||||
|
Agreement with JP Morgan Securities, Inc. and Bank of New York Mellon (Tri-Party), dated 06/28/2019 (collateralized by Government National Mortgage Associations, 2.500% – 6.000% due 02/20/2023 – 01/15/2060,
valued at $479,400,000); expected proceeds
$470,099,483 |
2.540% | 07/01/2019 | 07/01/2019 | 470,000,000 | 470,000,000 | |||||
|
TOTAL GOVERNMENT AGENCY REPURCHASE
AGREEMENTS |
1,035,000,000 | |||||||||
| TREASURY REPURCHASE AGREEMENTS—5.9% | ||||||||||
|
Agreement with Bank of America and Bank of New York Mellon (Tri-Party), dated 06/28/2019 (collateralized by a U.S. Treasury Inflation Index Bond, 2.000% due 01/15/2026, and a U.S. Treasury Note, 2.000% due 12/31/2021, valued
at $102,000,021); expected proceeds
$100,019,583 |
2.350% | 07/01/2019 | 07/01/2019 | 100,000,000 | 100,000,000 | |||||
|
Agreement with Citigroup Global Markets, Inc. and Bank of New York Mellon (Tri-Party), dated 06/28/2019 (collateralized by a U.S. Treasury Bill, 0.000% due 07/16/2019, valued at $20,400,068); expected proceeds
$20,004,183 |
2.510% | 07/01/2019 | 07/01/2019 | 20,000,000 | 20,000,000 | |||||
|
Agreement with Fixed Income Clearing Corp., and Bank of New York Mellon (Tri-Party), dated 06/28/2019 (collateralized by a U.S. Treasury Bill, 0.000% due 06/18/2020, a U.S. Treasury Bond, 2.750% due 11/15/2047, and U.S.
Treasury Notes, 1.250% – 2.500% due 02/28/2021 – 03/31/2024, valued at $510,000,002); expected proceeds
$500,104,167 |
2.500% | 07/01/2019 | 07/01/2019 | 500,000,000 | 500,000,000 | |||||
|
Agreement with Fixed Income Clearing Corp., and Bank of New York Mellon (Tri-Party), dated 06/28/2019 (collateralized by a U.S. Treasury Bill, 0.000% due 06/18/2020, valued at $102,000,091); expected proceeds
$100,020,000 |
2.400% | 07/01/2019 | 07/01/2019 | 100,000,000 | 100,000,000 |
| Name of Issuer and Title of Issue | Interest Rate | Next Rate Reset Date | Maturity Date | Principal Amount | Value | |||||
|
Agreement with HSBC Securities USA, Inc. and Bank of New York Mellon (Tri-Party), dated 06/28/2019 (collateralized by a U.S. Treasury Bill, 0.000% due 07/18/2019, a U.S. Treasury Inflation Index Note, 0.875% due 01/15/2029,
a U.S. Treasury Note, 2.750% due 07/31/2023, and a U.S. Treasury Strip, 0.000% due 05/15/2026, valued at $40,800,005); expected proceeds
$40,008,333 |
2.500% | 07/01/2019 | 07/01/2019 | $ 40,000,000 | $ 40,000,000 | |||||
|
Agreement with JP Morgan Securities, Inc. and Bank of New York Mellon (Tri-Party), dated 06/28/2019 (collateralized by a U.S. Treasury Note, 1.750% due 11/30/2021, valued at $122,400,057); expected proceeds
$120,025,300 |
2.530% | 07/01/2019 | 07/01/2019 | 120,000,000 | 120,000,000 | |||||
|
Agreement with Mitsubishi UFJ Securities, Inc. and Bank of New York Mellon (Tri-Party), dated 06/28/2019 (collateralized by a U.S. Treasury Bill, 0.000% due 06/18/2020, and U.S. Treasury Notes, 1.000% – 2.875% due
10/15/2019 – 11/15/2024, valued at $51,000,017); expected proceeds
$50,010,417 |
2.500% | 07/01/2019 | 07/01/2019 | 50,000,000 | 50,000,000 | |||||
|
TOTAL TREASURY REPURCHASE
AGREEMENTS |
930,000,000 | |||||||||
| OTHER REPURCHASE AGREEMENTS—8.9% | ||||||||||
|
Agreement with Bank of America and Bank of New York Mellon (Tri-Party), dated 06/14/2019 (collateralized by various Corporate Bonds, 0.000% – 6.380% due 02/06/2020 – 10/15/2075, valued at $89,250,000); expected
proceeds
$85,607,750(c) |
2.860% | 07/01/2019 | 09/12/2019 | 85,000,000 | 85,000,000 | |||||
|
Agreement with Bank of Nova Scotia and Bank of New York Mellon (Tri-Party), dated 06/28/2019 (collateralized by various Corporate Bonds, 2.600% – 8.250% due 01/15/2020 – 06/15/2049, valued at $106,554,961);
expected proceeds
$100,020,917 |
2.510% | 07/01/2019 | 07/01/2019 | 100,000,000 | 100,000,000 | |||||
|
Agreement with BNP Paribas Securities Corp. and Bank of New York Mellon (Tri-Party), dated 06/26/2019 (collateralized by various Common Stocks, valued at $189,029,610); expected proceeds $176,233,750(c) |
2.810% | 07/01/2019 | 09/24/2019 | 175,000,000 | 175,000,000 | |||||
|
Agreement with BNP Paribas Securities Corp. and Bank of New York Mellon (Tri-Party), dated 06/28/2019 (collateralized by various Common Stocks, valued at $356,400,000); expected proceeds
$330,069,025 |
2.510% | 07/01/2019 | 07/01/2019 | 330,000,000 | 330,000,000 | |||||
|
Agreement with Citigroup Global Markets, Inc. and Bank of New York Mellon (Tri-Party), dated 06/21/2019 (collateralized by a U.S. Treasury Inflation Index Note, 1.250% due 07/15/2020, and various Corporate Bonds, 0.000%
– 9.625% due 07/19/2019 – 01/01/2999, valued at $113,296,422); expected proceeds
$100,702,500(c) |
2.810% | 07/01/2019 | 09/19/2019 | 100,000,000 | 100,000,000 | |||||
|
Agreement with Citigroup Global Markets, Inc. and Bank of New York Mellon (Tri-Party), dated 06/28/2019 (collateralized by various Corporate Bonds, 0.000% – 6.380% due 04/28/2025 – 02/17/2061, valued at
$210,003,916); expected proceeds
$201,380,000(c) |
2.760% | 07/01/2019 | 09/26/2019 | 200,000,000 | 200,000,000 | |||||
|
Agreement with UBS Securities LLC and Bank of New York Mellon (Tri-Party), dated 06/24/2019 (collateralized by a Federal Farm Credit Bank, 0.000% due 05/20/2020, a U.S. Treasury Bill, 0.000% due 07/05/2019, U.S. Treasury
Inflation Index Bonds, 1.000% – 2.375% due 01/15/2025 – 02/15/2049, a U.S. Treasury Inflation Index Note, 0.125% due 04/15/2022, a U.S. Treasury Strip, 0.000% due 05/15/2029, and various Corporate Bonds, 2.890% – 7.875% due
02/19/2021 – 06/22/2047, valued at $55,925,760); expected proceeds
$50,050,332(c) |
2.589% | 07/08/2019 | 07/08/2019 | 50,000,000 | 50,000,000 |
| Name of Issuer and Title of Issue | Interest Rate | Next Rate Reset Date | Maturity Date | Principal Amount | Value | |||||
|
Agreement with Wells Fargo Bank and Bank of New York Mellon (Tri-Party), dated 06/24/2019 (collateralized by various Corporate Bonds, 0.875% – 2.125% due 08/15/2019 – 06/19/2023, valued at $102,050,660); expected
proceeds
$100,049,000 |
2.520% | 07/01/2019 | 07/01/2019 | $ 100,000,000 | $ 100,000,000 | |||||
|
Agreement with Wells Fargo Bank and Bank of New York Mellon (Tri-Party), dated 06/28/2019 (collateralized by various Corporate Bonds, 0.000% – 7.625% due 07/15/2019 – 10/25/2042, valued at $256,865,376); expected
proceeds
$250,051,250 |
2.460% | 07/01/2019 | 07/01/2019 | 250,000,000 | 250,000,000 | |||||
|
TOTAL OTHER REPURCHASE
AGREEMENTS |
1,390,000,000 | |||||||||
|
TOTAL INVESTMENTS –99.8%(d) (Cost
$15,630,023,494) |
15,632,683,705 | |||||||||
|
Other Assets in Excess of Liabilities
—0.2% |
25,279,889 | |||||||||
|
NET ASSETS
–100.0% |
$ 15,657,963,594 |
| (a) | Rate represents annualized yield at date of purchase. |
| (b) | Variable Rate Security - Interest rate shown is rate in effect at June 30, 2019. For securities based on a published reference rate and spread, the reference rate and spread are indicated in the description above. |
| (c) | Illiquid security. These securities represent $610,000,000 or 3.9% of net assets as of June 30, 2019. |
| (d) | Also represents the cost for federal tax purposes. |
| Description | Level
1 – Quoted Prices |
Level
2 – Other Significant Observable Inputs |
Level
3 – Significant Unobservable Inputs |
Total | ||||
| Assets: | ||||||||
| Investments: | ||||||||
|
Asset Backed Commercial
Paper |
$— | $ 1,098,075,683 | $— | $ 1,098,075,683 | ||||
|
Certificates of
Deposit |
— | 4,939,254,737 | — | 4,939,254,737 | ||||
|
Financial Company Commercial
Paper |
— | 3,166,626,379 | — | 3,166,626,379 | ||||
|
Other
Notes |
— | 3,073,726,906 | — | 3,073,726,906 | ||||
|
Government Agency Repurchase
Agreements |
— | 1,035,000,000 | — | 1,035,000,000 | ||||
|
Treasury Repurchase
Agreements |
— | 930,000,000 | — | 930,000,000 | ||||
|
Other Repurchase
Agreements |
— | 1,390,000,000 | — | 1,390,000,000 | ||||
|
Total
Investments |
$— | $15,632,683,705 | $— | $15,632,683,705 |
| ASSETS | |
|
Investments in unaffiliated issuers, at
value |
$12,277,683,705 |
|
Repurchase agreements, at
value |
3,355,000,000 |
|
Total
Investments |
15,632,683,705 |
|
Cash |
5,403 |
|
Interest receivable — unaffiliated
issuers |
26,098,507 |
|
TOTAL ASSETS
|
15,658,787,615 |
| LIABILITIES | |
|
Advisory and administrator fee
payable |
591,437 |
|
Custody, sub-administration and transfer agent fees
payable |
170,296 |
|
Trustees’ fees and expenses
payable |
200 |
|
Professional fees
payable |
32,891 |
|
Printing fees
payable |
1,473 |
|
Accrued expenses and other
liabilities |
27,724 |
|
TOTAL LIABILITIES
|
824,021 |
|
NET ASSETS
|
$15,657,963,594 |
| COST OF INVESTMENTS: | |
|
Investments in unaffiliated
issuers |
$12,275,023,494 |
|
Repurchase
agreements |
3,355,000,000 |
|
Total cost of
investments |
$15,630,023,494 |
| INVESTMENT INCOME | |
|
Interest income — unaffiliated
issuers |
$189,343,566 |
| EXPENSES | |
|
Advisory and administrator
fee |
3,592,975 |
|
Custodian, sub-administrator and transfer agent
fees |
940,678 |
|
Trustees’ fees and expenses
|
156,501 |
|
Professional fees and
expenses |
82,658 |
|
Printing and postage
fees |
919 |
|
Insurance
expense |
2,977 |
|
Miscellaneous
expenses |
6,236 |
|
TOTAL
EXPENSES |
4,782,944 |
|
NET INVESTMENT INCOME
(LOSS) |
$184,560,622 |
| REALIZED AND UNREALIZED GAIN (LOSS) | |
| Net realized gain (loss) on: | |
|
Investments — unaffiliated
issuers |
41,957 |
| Net change in unrealized appreciation/depreciation on: | |
|
Investments — unaffiliated
issuers |
2,794,457 |
|
NET REALIZED AND UNREALIZED GAIN
(LOSS) |
2,836,414 |
|
NET INCREASE (DECREASE) IN NET ASSETS FROM
OPERATIONS |
$187,397,036 |
| Six
Months Ended 6/30/19 (Unaudited) |
Year
Ended 12/31/18 | ||
| INCREASE (DECREASE) IN NET ASSETS FROM OPERATIONS: | |||
|
Net investment income
(loss) |
$ 184,560,622 | $ 247,714,372 | |
|
Net realized gain
(loss) |
41,957 | 99,189 | |
|
Net change in unrealized
appreciation/depreciation |
2,794,457 | 11,343 | |
|
Net increase (decrease) in net assets resulting from
operations |
187,397,036 | 247,824,904 | |
| CAPITAL TRANSACTIONS | |||
|
Contributions |
13,667,238,042 | 38,864,723,746 | |
|
Withdrawals |
(9,393,056,151) | (37,857,969,929) | |
|
Net increase (decrease) in net assets from capital transactions
|
4,274,181,891 | 1,006,753,817 | |
|
Net increase (decrease) in net assets during the
period |
4,461,578,927 | 1,254,578,721 | |
|
Net assets at beginning of
period |
11,196,384,667 | 9,941,805,946 | |
|
NET ASSETS AT END OF
PERIOD |
$15,657,963,594 | $ 11,196,384,667 |
| Six
Months Ended 6/30/19 (Unaudited) |
Year
Ended 12/31/18 |
Year
Ended 12/31/17 |
Year
Ended 12/31/16 |
Year
Ended 12/31/15 |
Year
Ended 12/31/14 | ||||||
|
Total return
(a) |
1.31% | 2.06% | 0.96% | 0.51% | 0.17% | 0.13% | |||||
| Ratios and Supplemental Data: | |||||||||||
|
Net assets, end of period (in
000s) |
$15,657,964 | $11,196,385 | $9,941,806 | $8,272,653 | $47,683,856 | $40,704,468 | |||||
| Ratios to average net assets: | |||||||||||
|
Total
expenses |
0.07%(b) | 0.07% | 0.06% | 0.07% | 0.07% | 0.07% | |||||
|
Net investment income
(loss) |
2.57%(b) | 2.05% | 1.11% | 0.49% | 0.17% | 0.13% |
| (a) | Results represent past performance and are not indicative of future results. Total return for periods of less than one year are not annualized. |
| (b) | Annualized. |
| Tax
Cost |
Gross
Unrealized Appreciation |
Gross
Unrealized Depreciation |
Net
Unrealized Appreciation (Depreciation) | ||||
|
State Street Money Market
Portfolio |
$15,630,023,494 | $2,849,705 | $189,494 | $2,660,211 |
| Actual | Hypothetical
(assuming a 5% return before expenses) | ||||||||
| Annualized
Expense Ratio |
Ending
Account Value |
Expenses
Paid During Period(a) |
Ending
Account Value |
Expenses
Paid During Period(a) | |||||
|
State Street Money Market
Portfolio |
0.07% | $1,013.10 | $0.35 | $1,024.40 | $0.35 | ||||
| (a) | Expenses are equal to the Portfolio’s annualized net expense ratio multiplied by the average account value of the period, multiplied by 181, then divided by 365. |
| • | A report prepared by an independent third-party provider of investment company data, which includes for the feeder fund for which the Portfolio serves as the master fund in a master-feeder structure (the “Fund”): |
| ○ | Comparisons of the Fund’s performance over the past one-, three-, five- and ten-year periods ended December 31, 2018, to the performance of an appropriate benchmark constructed by Broadridge Financial Solutions, Inc., the successor to Lipper, Inc. (“Broadridge”), for the Fund (the “Lipper Index”) and a universe of other mutual funds with similar investment objectives and policies (the “Performance Group” and/or the “Performance Universe”); |
| ○ | Comparisons of the Fund’s expense ratio (with detail of component expenses) to the expense ratios of a group of comparable mutual funds selected by the independent third-party data provider (the “Expense Group” and/or “Expense Universe”); |
| ○ | A chart showing the Fund’s historical average net assets relative to its total expenses, management fees, and non-management expenses over the past five calendar years; and |
| ○ | Comparisons of the Fund’s contractual management fee to the contractual management fees of comparable mutual funds at different asset levels. |
| • | Comparative information concerning fees charged by the Adviser for managing institutional accounts using investment strategies and techniques similar to those used in managing the Fund; and |
| • | Profitability analyses for (a) the Adviser with respect to the Portfolio and (b) affiliates of the Adviser that provide services to the Portfolio (“Affiliated Service Providers”). |
| • | Descriptions of the investment management services provided by the Adviser, including its investment strategies and processes; |
| • | Information concerning the allocation of brokerage; and |
| • | Information regarding the procedures and processes used to value the assets of the Portfolio. |
| • | Reports detailing the financial results and condition of the Adviser and its affiliates; |
| • | Descriptions of the qualifications, education and experience of the individual investment and other professionals responsible for managing the portfolio of the Portfolio and for Portfolio operations; |
| • | Information relating to compliance with and the administration of the Code of Ethics adopted by the Adviser; |
| • | A copy of the Adviser’s proxy voting policies and procedures and other information regarding the Adviser’s practices for overseeing proxy vendors; |
| • | Information concerning the resources devoted by the Adviser to overseeing compliance by the Portfolio and its service providers, including information concerning compliance with investment policies and restrictions and other operating policies of the Portfolio; |
| • | A description of the adequacy and sophistication of the Adviser’s technology and systems with respect to investment and administrative matters and a description of any material improvements or changes in technology or systems in the past year; |
| • | A description of the business continuity and disaster recovery plans of the Adviser; and |
| • | Information regarding the Adviser’s risk management processes. |
| • | Information concerning the nature, extent, quality and cost of services provided to the Portfolio by SSGA FM in its capacity as the Portfolio’s administrator (the “Administrator”); |
| • | Information concerning the nature, extent, quality and cost of various non-investment management services provided to the Portfolio by affiliates of the Adviser, including the custodian, sub-administrator, transfer agent and fund accountant of the Portfolio, and the role of the Adviser in managing the Portfolio’s relationship with these service providers; |
| • | Copies of the Advisory Agreement and agreements with other service providers of the Portfolio; |
| • | Draft responses to a letter from independent legal counsel to the Independent Trustees (“Independent Counsel”), reviewed prior to such date by Independent Counsel, requesting specific information from each of: |
| ○ | SSGA FM, in its capacity as the Portfolio’s Adviser and Administrator, with respect to its operations relating to the Portfolio and its approximate profit margins from such operations for the calendar year ended December 31, 2018; and the relevant operations of other affiliated service providers to the Portfolio, together with their approximate profit margins from such relevant operations for the calendar year ended December 31, 2018; |
| ○ | State Street Bank and Trust Company (“State Street”), the sub-administrator, custodian and transfer agent for the Portfolio, with respect to its operations relating to the Portfolio; and |
| ○ | State Street Global Advisors Funds Distributors, LLC, the principal underwriter and distributor of the shares of the Portfolio (the “Distributor”), with respect to its operations relating to the Portfolio; |
| • | Information from SSGA FM, State Street and the Distributor with respect to the Trust providing any material changes to the previous information supplied in response to the letter from Independent Counsel prior to the executive session of the Board on May 15, 2019; |
| • | Materials provided by Broadridge, circulated to the Independent Trustees and to Independent Counsel, with respect to the Fund; and |
| • | A summary of the foregoing materials prepared by Independent Counsel. |
State Street Bank and Trust Company
P.O. Box 5049
Boston, MA 02206
| State Street Institutional U.S. Government Money Market Fund |

|
|
1 |
|
|
2 |
|
|
3 |
|
|
5 |
|
|
11 |
|
|
15 |
| ASSETS | |
|
Investment in corresponding affiliated Portfolio, at value and
cost |
$47,798,589,198 |
|
Receivable for fund shares
sold |
3,792,353 |
|
Receivable from
Adviser |
4,086 |
|
TOTAL ASSETS
|
47,802,385,637 |
| LIABILITIES | |
|
Payable for fund shares
repurchased |
2,151,575 |
|
Advisory fee
payable |
34 |
|
Administration fees
payable |
1,696,635 |
|
Shareholder servicing fee payable
|
490,448 |
|
Distribution fees
payable |
109,253 |
|
Transfer agent fees
payable |
9,931 |
|
Distribution
payable |
16,460,233 |
|
Registration and filing fees
payable |
963,007 |
|
Professional fees
payable |
12,393 |
|
Printing fees
payable |
11,108 |
|
Accrued expenses and other
liabilities |
205,556 |
|
TOTAL LIABILITIES
|
22,110,173 |
|
NET ASSETS
|
$47,780,275,464 |
| NET ASSETS CONSIST OF: | |
|
Paid-in
Capital |
$47,780,244,394 |
|
Total distributable earnings
(loss) |
31,070 |
|
NET ASSETS
|
$47,780,275,464 |
| Administration Class | |
|
Net
Assets |
$ 1,979,345,887 |
|
Shares
Outstanding |
1,979,477,733 |
|
Net asset value, offering and redemption price per
share |
$ 1.00 |
| Institutional Class | |
|
Net
Assets |
$ 980,157,742 |
|
Shares
Outstanding |
980,157,135 |
|
Net asset value, offering and redemption price per
share |
$ 1.00 |
| Investment Class | |
|
Net
Assets |
$ 404,959,030 |
|
Shares
Outstanding |
404,966,084 |
|
Net asset value, offering and redemption price per
share |
$ 1.00 |
| Investor Class | |
|
Net
Assets |
$ 1,440,406,939 |
|
Shares
Outstanding |
1,440,408,781 |
|
Net asset value, offering and redemption price per
share |
$ 1.00 |
| Premier Class | |
|
Net
Assets |
$39,560,879,535 |
|
Shares
Outstanding |
39,561,144,626 |
|
Net asset value, offering and redemption price per
share |
$ 1.00 |
| Class G | |
|
Net
Assets |
$ 3,414,526,331 |
|
Shares
Outstanding |
3,414,544,379 |
|
Net asset value, offering and redemption price per
share |
$ 1.00 |
| INCOME AND EXPENSES ALLOCATED FROM AFFILIATED PORTFOLIO | |
|
Interest income allocated from affiliated
Portfolio |
$556,141,118 |
|
Expenses allocated from affiliated
Portfolio |
(14,814,775) |
|
TOTAL INVESTMENT INCOME (LOSS) ALLOCATED FROM AFFILIATED
PORTFOLIO |
541,326,343 |
| EXPENSES | |
| Administration fees | |
|
Administration
Class |
456,989 |
|
Institutional
Class |
175,606 |
|
Investment
Class |
104,904 |
|
Investor
Class |
333,691 |
|
Premier
Class |
9,552,517 |
|
Class
G |
141,933 |
| Shareholder servicing fees | |
|
Administration
Class |
1,827,957 |
|
Institutional
Class |
105,363 |
|
Investment
Class |
524,522 |
|
Investor
Class |
533,906 |
| Distribution fees | |
|
Administration
Class |
456,989 |
|
Investment
Class |
209,809 |
|
Custodian
fees |
96,514 |
|
Trustees’ fees and expenses
|
9,034 |
|
Transfer agent
fees |
43,215 |
|
Registration and filing
fees |
56,760 |
|
Professional fees and
expenses |
19,714 |
|
Printing and postage
fees |
52,115 |
|
Insurance
expense |
148,168 |
|
Miscellaneous
expenses |
163,838 |
|
TOTAL
EXPENSES |
15,013,544 |
|
NET INVESTMENT INCOME
(LOSS) |
$526,312,799 |
| REALIZED GAIN (LOSS) | |
| Net realized gain (loss) on: | |
|
Investments allocated from affiliated
Portfolio |
47,332 |
|
NET INCREASE (DECREASE) IN NET ASSETS FROM
OPERATIONS |
$526,360,131 |
| Six
Months Ended 6/30/19 (Unaudited) |
Year
Ended 12/31/18(a) | ||
| INCREASE (DECREASE) IN NET ASSETS FROM OPERATIONS: | |||
|
Net investment income
(loss) |
$ 526,312,799 | $ 839,026,742 | |
|
Net realized gain
(loss) |
47,332 | 20,493 | |
|
Net increase (decrease) in net assets resulting from
operations |
526,360,131 | 839,047,235 | |
| DISTRIBUTIONS TO SHAREHOLDERS: | |||
|
Administration
Class |
(19,055,112) | (28,998,475) | |
|
Institutional
Class |
(8,092,300) | (2,300,785) | |
|
Investment
Class |
(4,170,813) | (6,662,497) | |
|
Investor
Class |
(15,036,329) | (20,723,110) | |
|
Premier
Class |
(446,285,868) | (708,700,364) | |
|
Class
G |
(33,672,377) | (60,072,493) | |
|
Class
M(b) |
— | (11,595,054) | |
|
Total distributions to shareholders
|
(526,312,799) | (839,052,778) | |
| FROM BENEFICIAL INTEREST TRANSACTIONS: | |||
| Administration Class | |||
|
Shares
sold |
12,441,616,717 | 27,627,501,125 | |
|
Reinvestment of
distributions |
6,707,862 | 9,687,462 | |
|
Shares
redeemed |
(12,155,085,653) | (27,860,753,519) | |
|
Net increase (decrease) from capital share
transactions |
293,238,926 | (223,564,932) | |
| Institutional Class | |||
|
Shares
sold |
5,812,319,587 | 3,275,238,137 | |
|
Reinvestment of
distributions |
279,638 | 990 | |
|
Shares
redeemed |
(5,472,175,011) | (2,635,506,206) | |
|
Net increase (decrease) from capital share
transactions |
340,424,214 | 639,732,921 | |
| Investment Class | |||
|
Shares
sold |
1,127,000,520 | 1,992,798,373 | |
|
Reinvestment of
distributions |
424,325 | 634,854 | |
|
Shares
redeemed |
(1,102,551,492) | (2,045,835,395) | |
|
Net increase (decrease) from capital share
transactions |
24,873,353 | (52,402,168) | |
| Investor Class | |||
|
Shares
sold |
5,675,378,730 | 5,437,824,232 | |
|
Reinvestment of
distributions |
5,711,893 | 8,244,393 | |
|
Shares
redeemed |
(6,115,781,636) | (4,816,176,114) | |
|
Net increase (decrease) from capital share
transactions |
(434,691,013) | 629,892,511 | |
| Premier Class | |||
|
Shares
sold |
333,512,303,594 | 417,552,603,900 | |
|
Reinvestment of
distributions |
378,247,934 | 595,511,561 | |
|
Shares
redeemed |
(327,269,639,030) | (424,129,684,801) | |
|
Net increase (decrease) from capital share
transactions |
6,620,912,498 | (5,981,569,340) | |
| Class G | |||
|
Shares
sold |
18,296,148,040 | 19,289,084,679 | |
|
Reinvestment of
distributions |
33,673,466 | 60,074,427 | |
|
Shares
redeemed |
(17,981,132,020) | (20,633,167,734) | |
|
Net increase (decrease) from capital share
transactions |
348,689,486 | (1,284,008,628) | |
| Class M(b) | |||
|
Shares
sold |
— | 5,960,061,317 | |
|
Reinvestment of
distributions |
— | 10,544,078 | |
|
Shares
redeemed |
— | (7,061,984,937) | |
|
Net increase (decrease) from capital share
transactions |
— | (1,091,379,542) | |
|
Net increase (decrease) in net assets from beneficial interest transactions
|
7,193,447,464 | (7,363,299,178) | |
|
Net increase (decrease) in net assets during the
period |
7,193,494,796 | (7,363,304,721) | |
|
Net assets at beginning of
period |
40,586,780,668 | 47,950,085,389 | |
|
NET ASSETS AT END OF
PERIOD |
$ 47,780,275,464 | $ 40,586,780,668 | |
| SHARES OF BENEFICIAL INTEREST: | |||
| Administration Class | |||
|
Shares
sold |
12,441,616,717 | 27,627,501,125 | |
|
Reinvestment of
distributions |
6,707,862 | 9,687,462 | |
|
Shares
redeemed |
(12,155,085,653) | (27,860,753,519) | |
|
Net increase (decrease) from share
transactions |
293,238,926 | (223,564,932) |
| Six
Months Ended 6/30/19 (Unaudited) |
Year
Ended 12/31/18(a) | ||
| Institutional Class | |||
|
Shares
sold |
5,812,319,587 | $ 3,275,238,137 | |
|
Reinvestment of
distributions |
279,638 | 990 | |
|
Shares
redeemed |
(5,472,175,011) | (2,635,506,206) | |
|
Net increase (decrease) from share
transactions |
340,424,214 | 639,732,921 | |
| Investment Class | |||
|
Shares
sold |
1,127,000,520 | 1,992,798,372 | |
|
Reinvestment of
distributions |
424,325 | 634,854 | |
|
Shares
redeemed |
(1,102,551,492) | (2,045,835,394) | |
|
Net increase (decrease) from share
transactions |
24,873,353 | (52,402,168) | |
| Investor Class | |||
|
Shares
sold |
5,675,378,730 | 5,437,824,232 | |
|
Reinvestment of
distributions |
5,711,893 | 8,244,393 | |
|
Shares
redeemed |
(6,115,781,636) | (4,816,176,114) | |
|
Net increase (decrease) from share
transactions |
(434,691,013) | 629,892,511 | |
| Premier Class | |||
|
Shares
sold |
333,512,303,594 | 417,552,603,900 | |
|
Reinvestment of
distributions |
378,247,934 | 595,511,561 | |
|
Shares
redeemed |
(327,269,639,030) | (424,129,684,801) | |
|
Net increase (decrease) from share
transactions |
6,620,912,498 | (5,981,569,340) | |
| Class G | |||
|
Shares
sold |
18,296,148,040 | 19,289,084,679 | |
|
Reinvestment of
distributions |
33,673,466 | 60,074,427 | |
|
Shares
redeemed |
(17,981,132,020) | (20,633,167,734) | |
|
Net increase (decrease) from share
transactions |
348,689,486 | (1,284,008,628) | |
| Class M(b) | |||
|
Shares
sold |
— | 5,960,061,317 | |
|
Reinvestment of
distributions |
— | 10,544,078 | |
|
Shares
redeemed |
— | (7,061,984,937) | |
|
Net increase (decrease) from share
transactions |
— | (1,091,379,542) |
| (a) | For Institutional Class shares, data is for the period January 18, 2018 (inception date) through December 31, 2018. |
| (b) | Class M Shares liquidated on September 28, 2018. |
| Administration Class(a) | |||||||
| Six
Months Ended 06/30/19 (Unaudited) |
Year
Ended 12/31/18 |
Year
Ended 12/31/17 |
For
the Period 8/23/16* - 12/31/16 | ||||
|
Net asset value, beginning of
period |
$ 1.0000 | $ 1.0000 | $ 1.0000 | $ 1.0000 | |||
| Income (loss) from investment operations: | |||||||
|
Net investment income
(loss) |
0.0103 | 0.0150 | 0.0054 | 0.0001 | |||
|
Net realized gain
(loss) |
0.0000(b) | — | 0.0000(b) | (0.0000)(b) | |||
|
Total from investment
operations |
0.0103 | 0.0150 | 0.0054 | 0.0001 | |||
| Distributions to shareholders from: | |||||||
|
Net investment
income |
(0.0103) | (0.0150) | (0.0054) | (0.0001) | |||
|
Net realized
gains |
— | — | (0.0000)(b) | — | |||
|
Total
distributions |
(0.0103) | (0.0150) | (0.0054) | (0.0001) | |||
|
Net asset value, end of
period |
$ 1.0000 | $ 1.0000 | $ 1.0000 | $ 1.0000 | |||
|
Total return
(c) |
1.04% | 1.51% | 0.54% | 0.01% | |||
| Ratios and Supplemental Data: | |||||||
|
Net assets, end of period (in
000s) |
$1,979,346 | $1,686,105 | $1,909,670 | $3,423,655 | |||
| Ratios to Average Net Assets: | |||||||
|
Total
expenses |
0.37%(d) | 0.37% | 0.37% | 0.37%(d) | |||
|
Net investment income
(loss) |
2.09%(d) | 1.47% | 0.50% | 0.04%(d) | |||
| * | Commencement of operations. |
| (a) | The per share amounts and percentages include the Fund’s proportionate share of income and expenses of the affiliated Portfolio. |
| (b) | Amount is less than $0.00005 per share. |
| (c) | Total return is calculated assuming a purchase of shares at net asset value on the first day and a sale at net asset value on the last day of each period reported. Distributions are assumed, for the purpose of this calculation, to be reinvested at net asset value per share on the respective payment dates. Total return for periods of less than one year is not annualized. Results represent past performance and are not indicative of future results. |
| (d) | Annualized. |
| Institutional Class(a) | |||
| Six
Months Ended 6/30/19 (Unaudited) |
For
the Period 1/18/18* 12/31/18 | ||
|
Net asset value, beginning of
period |
$ 1.0000 | $ 1.0000 | |
| Income (loss) from investment operations: | |||
|
Net investment income
(loss) |
0.0114 | 0.0170 | |
|
Net realized gain
(loss) |
0.0000(b) | — | |
|
Total from investment
operations |
0.0114 | 0.0170 | |
| Distributions to shareholders from: | |||
|
Net investment
income |
(0.0114) | (0.0170) | |
|
Net asset value, end of
period |
$ 1.0000 | $ 1.0000 | |
|
Total return
(c) |
1.15% | 1.67% | |
| Ratios and Supplemental Data: | |||
|
Net assets, end of period (in
000s) |
$980,158 | $639,733 | |
| Ratios to Average Net Assets: | |||
|
Total
expenses |
0.15%(d) | 0.15%(d) | |
|
Net investment income
(loss) |
2.31%(d) | 1.71%(d) | |
| * | Commencement of operations. |
| (a) | The per share amounts and percentages include the Fund’s proportionate share of income and expenses of the affiliated Portfolio. |
| (b) | Amount is less than $0.00005 per share. |
| (c) | Total return is calculated assuming a purchase of shares at net asset value on the first day and a sale at net asset value on the last day of each period reported. Distributions are assumed, for the purpose of this calculation, to be reinvested at net asset value per share on the respective payment dates. Total return for periods of less than one year is not annualized. Results represent past performance and are not indicative of future results. |
| (d) | Annualized. |
| Investment Class(a) | |||||||||||
| Six
Months Ended 06/30/19 (Unaudited) |
Year
Ended 12/31/18 |
Year
Ended 12/31/17 |
Year
Ended 12/31/16 |
Year
Ended 12/31/15 |
Year
Ended 12/31/14 | ||||||
|
Net asset value, beginning of
period |
$ 1.0000 | $ 1.0000 | $ 1.0000 | $ 1.0000 | $ 1.0000 | $ 1.0000 | |||||
| Income (loss) from investment operations: | |||||||||||
|
Net investment income
(loss) |
0.0098 | 0.0140 | 0.0044 | 0.0000(b) | 0.0000(b)(c) | (0.0000)(b)(c) | |||||
|
Net realized gain
(loss) |
0.0000(b) | — | 0.0000(b) | 0.0000(b) | — | — | |||||
|
Total from investment
operations |
0.0098 | 0.0140 | 0.0044 | 0.0000(b) | 0.0000(b) | (0.0000)(b) | |||||
| Distributions to shareholders from: | |||||||||||
|
Net investment
income |
(0.0098) | (0.0140) | (0.0044) | (0.0000)(b) | — | — | |||||
|
Net realized
gains |
— | — | (0.0000)(b) | — | — | — | |||||
|
Total
distributions |
(0.0098) | (0.0140) | (0.0044) | (0.0000)(b) | — | — | |||||
|
Net asset value, end of
period |
$ 1.0000 | $ 1.0000 | $ 1.0000 | $ 1.0000 | $ 1.0000 | $ 1.0000 | |||||
|
Total return
(d) |
0.99% | 1.40% | 0.44% | 0.00%(e) | 0.00%(e) | 0.00%(e) | |||||
| Ratios and Supplemental Data: | |||||||||||
|
Net assets, end of period (in
000s) |
$404,959 | $380,085 | $432,488 | $903,050 | $971,551 | $615,706 | |||||
| Ratios to Average Net Assets: | |||||||||||
|
Total
expenses |
0.47%(f) | 0.47% | 0.47% | 0.47% | 0.47% | 0.47% | |||||
|
Net
expenses |
0.47%(f) | 0.47% | 0.47% | 0.37% | 0.10% | 0.07% | |||||
|
Net investment income
(loss) |
1.99%(f) | 1.42% | 0.40% | 0.00%(e) | 0.00%(e) | 0.00%(e) | |||||
| (a) | The per share amounts and percentages include the Fund’s proportionate share of income and expenses of the affiliated Portfolio. |
| (b) | Amount is less than $0.00005 per share. |
| (c) | Per share numbers have been calculated using average shares outstanding, which more appropriately presents the per share data for the period. |
| (d) | Total return is calculated assuming a purchase of shares at net asset value on the first day and a sale at net asset value on the last day of each period reported. Distributions are assumed, for the purpose of this calculation, to be reinvested at net asset value per share on the respective payment dates. Total return for periods of less than one year is not annualized. Results represent past performance and are not indicative of future results. |
| (e) | Amount is less than 0.005%. |
| (f) | Annualized. |
| Investor Class(a) | |||||||
| Six
Months Ended 06/30/19 (Unaudited) |
Year
Ended 12/31/18 |
Year
Ended 12/31/17 |
For
the Period 3/21/16* - 12/31/16 | ||||
|
Net asset value, beginning of
period |
$ 1.0000 | $ 1.0000 | $ 1.0000 | $ 1.0000 | |||
| Income (loss) from investment operations: | |||||||
|
Net investment income
(loss) |
0.0112 | 0.0170 | 0.0071 | 0.0014 | |||
|
Net realized gain
(loss) |
0.0000(b) | — | 0.0000(b) | (0.0000)(b) | |||
|
Total from investment
operations |
0.0112 | 0.0170 | 0.0071 | 0.0014 | |||
| Distributions to shareholders from: | |||||||
|
Net investment
income |
(0.0112) | (0.0170) | (0.0071) | (0.0014) | |||
|
Net realized
gains |
— | — | (0.0000)(b) | — | |||
|
Total
distributions |
(0.0112) | (0.0170) | (0.0071) | (0.0014) | |||
|
Net asset value, end of
period |
$ 1.0000 | $ 1.0000 | $ 1.0000 | $ 1.0000 | |||
|
Total return
(c) |
1.12% | 1.68% | 0.71% | 0.14% | |||
| Ratios and Supplemental Data: | |||||||
|
Net assets, end of period (in
000s) |
$1,440,407 | $1,875,096 | $1,245,204 | $230,156 | |||
| Ratios to Average Net Assets: | |||||||
|
Total
expenses |
0.20%(d) | 0.20% | 0.20% | 0.20%(d) | |||
|
Net investment income
(loss) |
2.26%(d) | 1.68% | 0.83% | 0.21%(d) | |||
| * | Commencement of operations. |
| (a) | The per share amounts and percentages include the Fund’s proportionate share of income and expenses of the affiliated Portfolio. |
| (b) | Amount is less than $0.00005 per share. |
| (c) | Total return is calculated assuming a purchase of shares at net asset value on the first day and a sale at net asset value on the last day of each period reported. Distributions are assumed, for the purpose of this calculation, to be reinvested at net asset value per share on the respective payment dates. Total return for periods of less than one year is not annualized. Results represent past performance and are not indicative of future results. |
| (d) | Annualized. |
| Premier Class(a) | |||||||||||
| Six
Months Ended 06/30/19 (Unaudited) |
Year
Ended 12/31/18 |
Year
Ended 12/31/17 |
Year
Ended 12/31/16 |
Year
Ended 12/31/15 |
Year
Ended 12/31/14 | ||||||
|
Net asset value, beginning of
period |
$ 1.0000 | $ 1.0000 | $ 1.0000 | $ 1.0000 | $ 1.0000 | $ 1.0000 | |||||
| Income (loss) from investment operations: | |||||||||||
|
Net investment income
(loss) |
0.0116 | 0.0170 | 0.0079 | 0.0025 | 0.0000(b)(c) | (0.0000)(b)(c) | |||||
|
Net realized gain
(loss) |
0.0000(b) | — | 0.0000(b) | (0.0000)(b) | 0.0000(b) | — | |||||
|
Total from investment
operations |
0.0116 | 0.0170 | 0.0079 | 0.0025 | 0.0000(b) | (0.0000)(b) | |||||
| Distributions to shareholders from: | |||||||||||
|
Net investment
income |
(0.0116) | (0.0170) | (0.0079) | (0.0025) | (0.0000)(b) | — | |||||
|
Net realized
gains |
— | — | (0.0000)(b) | — | — | — | |||||
|
Total
distributions |
(0.0116) | (0.0170) | (0.0079) | (0.0025) | (0.0000)(b) | — | |||||
|
Net asset value, end of
period |
$ 1.0000 | $ 1.0000 | $ 1.0000 | $ 1.0000 | $ 1.0000 | $ 1.0000 | |||||
|
Total return
(d) |
1.16% | 1.76% | 0.79% | 0.25% | 0.00%(e) | 0.00%(e) | |||||
| Ratios and Supplemental Data: | |||||||||||
|
Net assets, end of period (in
000s) |
$39,560,880 | $32,939,927 | $38,921,503 | $43,302,733 | $13,516,264 | $10,962,800 | |||||
| Ratios to Average Net Assets: | |||||||||||
|
Total
expenses |
0.12%(f) | 0.12% | 0.12% | 0.12% | 0.12% | 0.12% | |||||
|
Net
expenses |
0.12%(f) | 0.12% | 0.12% | 0.12% | 0.09% | 0.07% | |||||
|
Net investment income
(loss) |
2.34%(f) | 1.74% | 0.78% | 0.27% | 0.00%(e) | 0.00%(e) | |||||
| (a) | The per share amounts and percentages include the Fund’s proportionate share of income and expenses of the affiliated Portfolio. |
| (b) | Amount is less than $0.00005 per share. |
| (c) | Per share numbers have been calculated using average shares outstanding, which more appropriately presents the per share data for the period. |
| (d) | Total return is calculated assuming a purchase of shares at net asset value on the first day and a sale at net asset value on the last day of each period reported. Distributions are assumed, for the purpose of this calculation, to be reinvested at net asset value per share on the respective payment dates. Total return for periods of less than one year is not annualized. Results represent past performance and are not indicative of future results. |
| (e) | Amount is less than 0.005%. |
| (f) | Annualized. |
| Class G(a) | |||||||||||
| Six
Months Ended 06/30/19 (Unaudited) |
Year
Ended 12/31/18 |
Year
Ended 12/31/17 |
Year
Ended 12/31/16 |
Year
Ended 12/31/15 |
For
the Period 10/5/14* - 12/31/14 | ||||||
|
Net asset value, beginning of
period |
$ 1.0000 | $ 1.0000 | $ 1.0000 | $ 1.0000 | $ 1.0000 | $ 1.0000 | |||||
| Income (loss) from investment operations: | |||||||||||
|
Net investment income
(loss) |
0.0118 | 0.0180 | 0.0082 | 0.0029 | 0.0002(b) | 0.0000(b)(c) | |||||
|
Net realized gain
(loss) |
0.0000(c) | — | 0.0001 | 0.0000(c) | 0.0000(c) | 0.0000(c) | |||||
|
Total from investment
operations |
0.0118 | 0.0180 | 0.0083 | 0.0029 | 0.0002 | 0.0000(c) | |||||
| Distributions to shareholders from: | |||||||||||
|
Net investment
income |
(0.0118) | (0.0180) | (0.0083) | (0.0029) | (0.0002) | (0.0000)(c) | |||||
|
Net realized
gains |
— | — | (0.0000)(c) | — | — | — | |||||
|
Total
distributions |
(0.0118) | (0.0180) | (0.0083) | (0.0029) | (0.0002) | (0.0000)(c) | |||||
|
Net asset value, end of
period |
$ 1.0000 | $ 1.0000 | $ 1.0000 | $ 1.0000 | $ 1.0000 | $ 1.0000 | |||||
|
Total return
(d) |
1.18% | 1.80% | 0.83% | 0.29% | 0.02% | 0.00%(e) | |||||
| Ratios and Supplemental Data: | |||||||||||
|
Net assets, end of period (in
000s) |
$3,414,526 | $3,065,834 | $4,349,842 | $581,991 | $732,938 | $872,335 | |||||
| Ratios to Average Net Assets: | |||||||||||
|
Total
expenses |
0.08%(f) | 0.08% | 0.08% | 0.08% | 0.08% | 0.09%(f) | |||||
|
Net
expenses |
0.08%(f) | 0.08% | 0.08% | 0.08% | 0.08% | 0.08%(f) | |||||
|
Net investment income
(loss) |
2.37%(f) | 1.74% | 0.95% | 0.29% | 0.02% | 0.00%(e)(f) | |||||
| * | Commencement of operations. |
| (a) | The per share amounts and percentages include the Fund’s proportionate share of income and expenses of the affiliated Portfolio. |
| (b) | Per share numbers have been calculated using average shares outstanding, which more appropriately presents the per share data for the period. |
| (c) | Amount is less than $0.00005 per share. |
| (d) | Total return is calculated assuming a purchase of shares at net asset value on the first day and a sale at net asset value on the last day of each period reported. Distributions are assumed, for the purpose of this calculation, to be reinvested at net asset value per share on the respective payment dates. Total return for periods of less than one year is not annualized. Results represent past performance and are not indicative of future results. |
| (e) | Amount is less than 0.005%. |
| (f) | Annualized. |
| Fund | Classes | Commencement
of Operations |
Diversification
Classification |
| State Street Institutional U.S. Government Money Market Fund | Administration
Class Investment Class Investor Class Institutional Class Premier Class Service Class Class G |
August
23, 2016 October 17, 2007 March 21, 2016 January 18, 2018 October 25, 2007 Not commenced October 5, 2014 |
Diversified |
| Actual | Hypothetical
(assuming a 5% return before expenses) | ||||||||
| Annualized
Expense Ratio |
Ending
Account Value |
Expenses
Paid During Period(a) |
Ending
Account Value |
Expenses
Paid During Period(a) | |||||
|
State Street Institutional U.S. Government Money Market
Fund |
|||||||||
|
Administration
Class |
0.37% | $1,010.40 | $1.84 | $1,023.00 | $1.86 | ||||
|
Institutional
Class |
0.15 | 1,011.50 | 0.75 | 1,024.10 | 0.75 | ||||
|
Investment
Class |
0.47 | 1,009.90 | 2.34 | 1,022.50 | 2.36 | ||||
|
Investor
Class |
0.20 | 1,011.20 | 1.00 | 1,023.80 | 1.00 | ||||
|
Premier
Class |
0.12 | 1,011.60 | 0.60 | 1,024.20 | 0.60 | ||||
|
Class
G |
0.08 | 1,011.80 | 0.40 | 1,024.40 | 0.40 | ||||
| (a) | Expenses are equal to the Fund’s annualized net expense ratio, which includes the Fund’s proportionate share of the expenses of the Portfolio, multiplied by the average account value of the period, multiplied by 181, then divided by 365. |
| • | A report prepared by an independent third-party provider of investment company data, which includes for the Fund: |
| • | Comparisons of the Fund’s performance over the past one-, three-, five- and ten-year periods ended December 31, 2018, to the performance of an appropriate benchmark constructed by Broadridge Financial Solutions, Inc., the successor to Lipper, Inc. (“Broadridge”), for the Fund (the “Lipper Index”) and a universe of other mutual funds with similar investment objectives and policies (the “Performance Group” and/or the “Performance Universe”); |
| • | Comparisons of the Fund’s expense ratio (with detail of component expenses) to the expense ratios of a group of comparable mutual funds selected by the independent third-party data provider (the “Expense Group” and/or “Expense Universe”); |
| • | A chart showing the Fund’s historical average net assets relative to its total expenses, management fees, and non-management expenses over the past five calendar years; and |
| • | Comparisons of the Fund’s contractual management fee to the contractual management fees of comparable mutual funds at different asset levels. |
| • | Comparative information concerning fees charged by the Adviser for managing institutional accounts using investment strategies and techniques similar to those used in managing the Fund; and |
| • | Profitability analyses for (a) the Adviser with respect to the Fund and (b) affiliates of the Adviser that provide services to the Fund (“Affiliated Service Providers”). |
| • | Descriptions of the investment management services provided by the Adviser, including its investment strategies and processes; |
| • | Information concerning the allocation of brokerage; and |
| • | Information regarding the procedures and processes used to value the assets of the Fund. |
| • | Reports detailing the financial results and condition of the Adviser and its affiliates; |
| • | Descriptions of the qualifications, education and experience of the individual investment and other professionals responsible for managing the portfolio of the Fund and for Fund operations; |
| • | Information relating to compliance with and the administration of the Code of Ethics adopted by the Adviser; |
| • | A copy of the Adviser’s proxy voting policies and procedures and other information regarding the Adviser’s practices for overseeing proxy vendors; |
| • | Information concerning the resources devoted by the Adviser to overseeing compliance by the Fund and its service providers, including information concerning compliance with investment policies and restrictions and other operating policies of the Fund; |
| • | A description of the adequacy and sophistication of the Adviser’s technology and systems with respect to investment and administrative matters and a description of any material improvements or changes in technology or systems in the past year; |
| • | A description of the business continuity and disaster recovery plans of the Adviser; and |
| • | Information regarding the Adviser’s risk management processes. |
| • | Information concerning the nature, extent, quality and cost of services provided to the Fund by SSGA FM in its capacity as the Fund’s administrator (the “Administrator”); |
| • | Information concerning the nature, extent, quality and cost of various non-investment management services provided to the Fund by affiliates of the Adviser, including the custodian, sub-administrator and fund accountant of the Fund, and the role of the Adviser in managing the Fund’s relationship with these service providers; |
| • | Copies of the Advisory Agreement and agreements with other service providers of the Fund; |
| • | Draft responses to a letter from independent legal counsel to the Independent Trustees (“Independent Counsel”), reviewed prior to such date by Independent Counsel, requesting specific information from each of: |
| • | SSGA FM, in its capacity as the Fund’s Adviser and Administrator, with respect to its operations relating to the Fund and its approximate profit margins from such operations for the calendar year ended December 31, 2018; and the relevant operations of other affiliated service providers to the Fund, together with their approximate profit margins from such relevant operations for the calendar year ended December 31, 2018; |
| • | State Street Bank and Trust Company (“State Street”), the sub-administrator, custodian and shareholder servicer for the Fund, with respect to its operations relating to the Fund; and |
| • | State Street Global Advisors Funds Distributors, LLC, the principal underwriter and distributor of the shares of the Fund (the “Distributor”), with respect to its operations relating to the Fund, together with the Fund’s related distribution plans and arrangements under Rule 12b-1 of the 1940 Act; |
| • | Information from SSGA FM, State Street and the Distributor with respect to the Trust providing any material changes to the previous information supplied in response to the letter from Independent Counsel prior to the executive session of the Board on May 15, 2019; |
| • | Materials provided by Broadridge, circulated to the Independent Trustees and to Independent Counsel, with respect to the Fund; and |
| • | A summary of the foregoing materials prepared by Independent Counsel. |
State Street Bank and Trust Company
P.O. Box 5049
Boston, MA 02206
| State Street U.S. Government Money Market Portfolio |
|
|
1 |
|
|
2 |
|
|
10 |
|
|
11 |
|
|
12 |
|
|
13 |
|
|
14 |
|
|
17 |
| % of Net Assets | |||
| Government Agency Debt | 37.2% | ||
| Treasury Debt | 23.9 | ||
| Government Agency Repurchase Agreements | 17.0 | ||
| Treasury Repurchase Agreements | 16.1 | ||
| Other Assets in Excess of Liabilities | 5.8 | ||
| TOTAL | 100.0% |
| % of Net Assets | |||
| Overnight (1 Day) | 22.1% | ||
| 2 to 30 Days | 14.7 | ||
| 31 to 60 Days | 12.8 | ||
| 61 to 90 Days | 10.6 | ||
| Over 90 Days | 34.0 | ||
| Total | 94.2% | ||
| Average days to maturity | 34 | ||
| Weighted average life | 90 |
| Name of Issuer and Title of Issue | Interest Rate | Next Rate Reset Date | Maturity Date | Principal Amount | Value | |||||
| GOVERNMENT AGENCY DEBT—37.2% | ||||||||||
|
Federal Farm Credit Bank, 1 Month USD LIBOR -
0.15%(a) |
2.237% | 07/18/2019 | 07/18/2019 | $ 136,150,000 | $ 136,149,344 | |||||
|
Federal Farm Credit Bank, 1 Month USD LIBOR -
0.10%(a) |
2.288% | 07/20/2019 | 09/20/2019 | 227,000,000 | 226,997,481 | |||||
|
Federal Farm Credit Bank, 1 Month USD LIBOR -
0.14%(a) |
2.300% | 07/02/2019 | 07/02/2019 | 168,000,000 | 167,999,977 | |||||
|
Federal Farm Credit Bank, 1 Month USD LIBOR -
0.07%(a) |
2.329% | 07/17/2019 | 12/17/2019 | 275,000,000 | 274,996,270 | |||||
|
Federal Farm Credit Bank, 1 Month USD LIBOR -
0.06%(a) |
2.352% | 07/10/2019 | 12/10/2019 | 325,000,000 | 324,999,712 | |||||
|
Federal Farm Credit Bank, 1 Month USD LIBOR -
0.05%(a) |
2.354% | 07/25/2019 | 02/25/2020 | 150,000,000 | 149,991,413 | |||||
|
Federal Farm Credit Bank, 1 Month USD LIBOR -
0.05%(a) |
2.359% | 07/25/2019 | 02/25/2020 | 240,000,000 | 239,971,813 | |||||
|
Federal Farm Credit Bank, 1 Month USD LIBOR -
0.04%(a) |
2.372% | 07/10/2019 | 02/10/2020 | 200,000,000 | 199,986,730 | |||||
|
Federal Farm Credit Bank, 1 Month USD LIBOR -
0.06%(a) |
2.380% | 07/03/2019 | 12/03/2019 | 350,000,000 | 349,995,541 | |||||
|
Federal Farm Credit Bank, 1 Month USD LIBOR -
0.02%(a) |
2.384% | 07/22/2019 | 05/22/2020 | 179,600,000 | 179,594,167 | |||||
|
Federal Farm Credit Bank, 1 Month USD LIBOR -
0.02%(a) |
2.397% | 07/10/2019 | 06/10/2020 | 290,800,000 | 290,786,292 | |||||
|
Federal Farm Credit Bank, Secured Overnight Financing Rate +
0.03%(a) |
2.450% | 06/29/2019 | 02/06/2020 | 115,000,000 | 115,000,000 | |||||
|
Federal Farm Credit Bank, 3 Month USD LIBOR -
0.12%(a) |
2.462% | 07/27/2019 | 01/27/2020 | 25,000,000 | 25,003,979 | |||||
|
Federal Farm Credit Bank, 1 Month USD LIBOR +
0.18%(a) |
2.592% | 07/11/2019 | 10/11/2019 | 50,000,000 | 50,034,037 | |||||
|
Federal Home Loan Bank
(b) |
2.164% | 09/25/2019 | 09/25/2019 | 500,000,000 | 497,415,222 | |||||
|
Federal Home Loan Bank, 3 Month USD LIBOR -
0.26%(a) |
2.263% | 08/15/2019 | 08/15/2019 | 300,000,000 | 299,955,980 | |||||
|
Federal Home Loan Bank, 1 Month USD LIBOR -
0.13%(a) |
2.269% | 07/16/2019 | 07/16/2019 | 340,200,000 | 340,200,000 | |||||
|
Federal Home Loan Bank, 1 Month USD LIBOR -
0.13%(a) |
2.277% | 07/26/2019 | 07/26/2019 | 99,800,000 | 99,800,000 | |||||
|
Federal Home Loan Bank, 1 Month USD LIBOR -
0.13%(a) |
2.315% | 07/02/2019 | 08/02/2019 | 500,000,000 | 500,000,000 | |||||
|
Federal Home Loan Bank, 1 Month USD LIBOR -
0.07%(a) |
2.325% | 07/19/2019 | 09/19/2019 | 200,000,000 | 200,000,000 | |||||
|
Federal Home Loan Bank
(b) |
2.330% | 09/04/2019 | 09/04/2019 | 500,000,000 | 497,896,528 | |||||
|
Federal Home Loan Bank, 1 Month USD LIBOR -
0.03%(a) |
2.358% | 07/20/2019 | 04/20/2020 | 200,000,000 | 200,000,000 | |||||
|
Federal Home Loan Bank, 1 Month USD LIBOR -
0.04%(a) |
2.362% | 07/26/2019 | 08/26/2019 | 250,000,000 | 250,000,000 | |||||
|
Federal Home Loan Bank, 1 Month USD LIBOR -
0.04%(a) |
2.369% | 07/25/2019 | 11/25/2019 | 175,900,000 | 175,900,000 | |||||
|
Federal Home Loan Bank, 1 Month USD LIBOR -
0.06%(a) |
2.371% | 07/04/2019 | 12/04/2019 | 500,000,000 | 500,000,000 | |||||
|
Federal Home Loan Bank
(b) |
2.372% | 08/16/2019 | 08/16/2019 | 150,000,000 | 149,545,367 | |||||
|
Federal Home Loan Bank
(b) |
2.373% | 11/15/2019 | 11/15/2019 | 111,000,000 | 109,997,605 | |||||
|
Federal Home Loan Bank, 1 Month USD LIBOR -
0.03%(a) |
2.383% | 07/12/2019 | 11/12/2019 | 296,000,000 | 295,996,916 | |||||
|
Federal Home Loan Bank
(b) |
2.388% | 08/09/2019 | 08/09/2019 | 200,000,000 | 199,482,600 | |||||
|
Federal Home Loan Bank
(b) |
2.393% | 07/05/2019 | 07/05/2019 | 535,200,000 | 535,057,730 | |||||
|
Federal Home Loan Bank
(b) |
2.393% | 10/09/2019 | 10/09/2019 | 75,000,000 | 74,501,458 | |||||
|
Federal Home Loan Bank
(b) |
2.394% | 07/17/2019 | 07/17/2019 | 300,000,000 | 299,680,800 | |||||
|
Federal Home Loan Bank, 1 Month USD LIBOR -
0.01%(a) |
2.394% | 07/29/2019 | 03/27/2020 | 250,000,000 | 250,000,000 | |||||
|
Federal Home Loan Bank
(b) |
2.400% | 06/17/2020 | 06/17/2020 | 225,000,000 | 225,000,000 | |||||
|
Federal Home Loan Bank, 1 Month USD LIBOR -
0.04%(a) |
2.400% | 07/01/2019 | 08/30/2019 | 125,000,000 | 125,000,000 | |||||
|
Federal Home Loan Bank, 1 Month USD LIBOR -
0.02%(a) |
2.401% | 07/06/2019 | 01/06/2020 | 324,400,000 | 324,400,000 | |||||
|
Federal Home Loan Bank, 1 Month USD LIBOR -
0.04%(a) |
2.405% | 07/01/2019 | 11/29/2019 | 230,000,000 | 230,000,000 | |||||
|
Federal Home Loan Bank
(b) |
2.410% | 08/02/2019 | 08/02/2019 | 225,000,000 | 224,518,000 | |||||
|
Federal Home Loan Bank
(b) |
2.414% | 10/30/2019 | 10/30/2019 | 82,200,000 | 81,533,052 | |||||
|
Federal Home Loan Bank
(b) |
2.415% | 08/12/2019 | 08/12/2019 | 350,000,000 | 349,994,023 | |||||
|
Federal Home Loan Bank, Secured Overnight Financing
Rate(a) |
2.420% | 06/29/2019 | 12/11/2019 | 400,000,000 | 400,000,000 | |||||
|
Federal Home Loan Bank
(b) |
2.429% | 09/30/2019 | 09/30/2019 | 395,700,000 | 395,671,685 | |||||
|
Federal Home Loan Bank
(b) |
2.430% | 07/22/2019 | 07/22/2019 | 185,400,000 | 185,137,196 | |||||
|
Federal Home Loan Bank
(b) |
2.430% | 07/24/2019 | 07/24/2019 | 337,200,000 | 336,676,497 | |||||
|
Federal Home Loan Bank
(b) |
2.430% | 07/26/2019 | 07/26/2019 | 336,600,000 | 336,031,988 | |||||
|
Federal Home Loan Bank
(b) |
2.438% | 08/07/2019 | 08/07/2019 | 790,000,000 | 788,041,549 | |||||
|
Federal Home Loan Bank, Secured Overnight Financing Rate +
0.02%(a) |
2.440% | 06/29/2019 | 08/27/2019 | 347,100,000 | 347,100,000 | |||||
|
Federal Home Loan Bank, Secured Overnight Financing Rate +
0.02%(a) |
2.440% | 06/29/2019 | 02/21/2020 | 300,000,000 | 300,000,000 | |||||
|
Federal Home Loan Bank, 3 Month USD LIBOR -
0.14%(a) |
2.444% | 08/22/2019 | 11/22/2019 | 450,000,000 | 450,000,000 | |||||
|
Federal Home Loan Bank, Secured Overnight Financing Rate +
0.03%(a) |
2.450% | 06/29/2019 | 12/06/2019 | 341,500,000 | 341,500,000 |
| Name of Issuer and Title of Issue | Interest Rate | Next Rate Reset Date | Maturity Date | Principal Amount | Value | |||||
|
Federal Home Loan Bank, Secured Overnight Financing Rate +
0.04%(a) |
2.455% | 06/29/2019 | 02/21/2020 | $ 267,500,000 | $ 267,500,000 | |||||
|
Federal Home Loan Bank
(b) |
2.460% | 10/11/2019 | 10/11/2019 | 500,000,000 | 499,985,776 | |||||
|
Federal Home Loan Bank
(b) |
2.465% | 10/11/2019 | 10/11/2019 | 250,000,000 | 249,989,390 | |||||
|
Federal Home Loan Bank
(b) |
2.468% | 09/16/2019 | 09/16/2019 | 138,600,000 | 138,594,798 | |||||
|
Federal Home Loan Bank, Secured Overnight Financing Rate +
0.05%(a) |
2.470% | 06/29/2019 | 01/17/2020 | 54,700,000 | 54,700,000 | |||||
|
Federal Home Loan Bank, Secured Overnight Financing Rate +
0.07%(a) |
2.485% | 06/29/2019 | 11/15/2019 | 225,000,000 | 225,000,000 | |||||
|
Federal Home Loan Bank, Secured Overnight Financing Rate +
0.08%(a) |
2.495% | 06/29/2019 | 06/11/2021 | 145,000,000 | 145,000,000 | |||||
|
Federal Home Loan Bank
(b) |
2.510% | 05/28/2020 | 05/28/2020 | 300,000,000 | 300,000,000 | |||||
|
Federal Home Loan Mortgage Corp.
(b) |
2.160% | 11/13/2019 | 11/13/2019 | 183,000,000 | 181,517,700 | |||||
|
Federal Home Loan Mortgage Corp.
(b) |
2.390% | 10/01/2019 | 10/01/2019 | 252,500,000 | 250,957,786 | |||||
|
Federal Home Loan Mortgage Corp.
(b) |
2.423% | 07/17/2019 | 07/17/2019 | 443,000,000 | 442,522,938 | |||||
|
Federal Home Loan Mortgage Corp.
(b) |
2.440% | 06/09/2020 | 06/09/2020 | 215,000,000 | 215,000,000 | |||||
|
Federal Home Loan Mortgage Corp.
(b) |
2.453% | 09/09/2019 | 09/09/2019 | 139,100,000 | 138,436,532 | |||||
|
Federal Home Loan Mortgage Corp.
(b) |
2.540% | 04/22/2020 | 04/22/2020 | 175,000,000 | 175,000,000 | |||||
|
Federal National Mortgage Assoc., Secured Overnight Financing Rate +
0.07%(a) |
2.490% | 06/29/2019 | 10/30/2019 | 435,500,000 | 435,568,821 | |||||
|
Federal National Mortgage Assoc., Secured Overnight Financing Rate +
0.08%(a) |
2.495% | 06/29/2019 | 10/30/2020 | 181,100,000 | 181,100,000 | |||||
|
Federal National Mortgage Assoc., Secured Overnight Financing Rate +
0.10%(a) |
2.520% | 06/29/2019 | 04/30/2020 | 50,000,000 | 50,000,000 | |||||
|
Federal National Mortgage Assoc.
(b) |
2.661% | 08/02/2019 | 08/02/2019 | 400,000,000 | 399,382,338 | |||||
|
TOTAL GOVERNMENT AGENCY
DEBT |
17,997,797,031 | |||||||||
| TREASURY DEBT—23.9% | ||||||||||
|
U.S. Treasury Bill
(b) |
2.030% | 12/26/2019 | 12/26/2019 | 500,000,000 | 494,981,389 | |||||
|
U.S. Treasury Bill
(b) |
2.133% | 12/19/2019 | 12/19/2019 | 200,000,000 | 197,974,125 | |||||
|
U.S. Treasury Bill
(b) |
2.140% | 12/12/2019 | 12/12/2019 | 477,900,000 | 473,241,006 | |||||
|
U.S. Treasury Bill
(b) |
2.355% | 11/14/2019 | 11/14/2019 | 200,010,000 | 198,230,059 | |||||
|
U.S. Treasury Bill
(b) |
2.373% | 08/15/2019 | 08/15/2019 | 400,000,000 | 398,816,308 | |||||
|
U.S. Treasury Bill
(b) |
2.380% | 10/03/2019 | 10/03/2019 | 200,000,000 | 198,757,111 | |||||
|
U.S. Treasury Bill
(b) |
2.385% | 11/07/2019 | 11/07/2019 | 300,000,000 | 297,436,420 | |||||
|
U.S. Treasury Bill
(b) |
2.390% | 10/17/2019 | 10/17/2019 | 300,000,000 | 297,849,000 | |||||
|
U.S. Treasury Bill
(b) |
2.393% | 10/10/2019 | 10/10/2019 | 683,600,000 | 679,009,187 | |||||
|
U.S. Treasury Bill
(b) |
2.415% | 09/26/2019 | 09/26/2019 | 300,000,000 | 298,249,125 | |||||
|
U.S. Treasury Bill
(b) |
2.440% | 08/08/2019 | 08/08/2019 | 175,000,000 | 174,549,278 | |||||
|
U.S. Treasury Bill
(b) |
2.445% | 09/19/2019 | 09/19/2019 | 700,000,000 | 696,191,811 | |||||
|
U.S. Treasury Bill
(b) |
2.450% | 08/01/2019 | 08/01/2019 | 195,000,000 | 194,588,604 | |||||
|
U.S. Treasury Bill
(b) |
2.453% | 09/12/2019 | 09/12/2019 | 850,000,000 | 845,769,458 | |||||
|
U.S. Treasury Bill
(b) |
2.455% | 09/05/2019 | 09/05/2019 | 800,000,000 | 796,397,525 | |||||
|
U.S. Treasury Bill
(b) |
2.805% | 07/02/2019 | 07/02/2019 | 199,500,000 | 199,484,455 | |||||
|
U.S. Treasury Note, 3 Month USD
MMY(a) |
2.096% | 06/29/2019 | 01/31/2020 | 541,400,000 | 541,355,159 | |||||
|
U.S. Treasury Note, 3 Month USD MMY +
0.03%(a) |
2.129% | 06/29/2019 | 04/30/2020 | 1,338,922,000 | 1,338,878,460 | |||||
|
U.S. Treasury Note, 3 Month USD MMY +
0.04%(a) |
2.139% | 06/29/2019 | 07/31/2020 | 89,400,000 | 89,345,148 | |||||
|
U.S. Treasury Note, 3 Month USD MMY +
0.05%(a) |
2.141% | 06/29/2019 | 10/31/2020 | 124,100,000 | 124,005,647 | |||||
|
U.S. Treasury Note, 3 Month USD MMY +
0.05%(a) |
2.144% | 06/29/2019 | 10/31/2019 | 530,000,000 | 530,061,914 | |||||
|
U.S. Treasury Note, 3 Month USD MMY +
0.06%(a) |
2.156% | 06/29/2019 | 07/31/2019 | 1,168,400,000 | 1,168,461,796 | |||||
|
U.S. Treasury Note, 3 Month USD MMY +
0.14%(a) |
2.235% | 06/29/2019 | 04/30/2021 | 700,000,000 | 699,076,838 | |||||
|
U.S. Treasury Note
(b) |
2.469% | 07/31/2019 | 07/31/2019 | 120,000,000 | 119,892,039 | |||||
|
U.S. Treasury Note
(b) |
2.609% | 07/31/2019 | 07/31/2019 | 499,100,000 | 498,420,056 | |||||
|
TOTAL TREASURY
DEBT |
11,551,021,918 |
| Name of Issuer and Title of Issue | Interest Rate | Next Rate Reset Date | Maturity Date | Principal Amount | Value | |||||
| GOVERNMENT AGENCY REPURCHASE AGREEMENTS—17.0% | ||||||||||
|
Agreement with Bank of America and Bank of New York Mellon (Tri-Party), dated 06/28/2019 (collateralized by a Government National Mortgage Association, 4.000% due 06/20/2047, valued at $154,020,001); expected proceeds
$151,031,458
|
2.500% | 07/01/2019 | 07/01/2019 | $ 151,000,000 | $ 151,000,000 | |||||
|
Agreement with Bank of Nova Scotia and Bank of New York Mellon (Tri-Party), dated 06/28/2019 (collateralized by Federal Home Loan Mortgage Corporations, 3.000% – 5.000% due 06/01/2043 – 06/01/2049, and Federal
National Mortgage Associations, 3.500% – 5.000% due 12/01/2023 – 06/01/2049, valued at $906,968,913); expected proceeds $889,185,208
|
2.500% | 07/01/2019 | 07/01/2019 | 889,000,000 | 889,000,000 | |||||
|
Agreement with BNP Paribas Securities Corp. and Bank of New York Mellon (Tri-Party), dated 06/28/2019 (collateralized by Federal Home Loan Mortgage Corporations, 2.894% – 6.500% due 12/01/2023 – 04/01/2049,
Federal Home Loan Mortgage Corporation Strips, 2.852% – 6.500% due 06/01/2031 – 02/15/2038, Federal National Mortgage Associations, 1.775% – 6.000% due 09/01/2020 – 06/25/2059, a Federal National Mortgage Association Strip,
5.500% due 03/01/2042, Government National Mortgage Associations, 1.517% – 6.000% due 05/15/2025 – 06/20/2049, a U.S. Treasury Bill, 0.000% due 07/18/2019, a U.S. Treasury Bond, 4.375% due 05/15/2041, and a U.S. Treasury Strip, 0.000%
due 08/15/2036, valued at $133,116,274); expected proceeds $129,026,875
|
2.500% | 07/01/2019 | 07/01/2019 | 129,000,000 | 129,000,000 | |||||
|
Agreement with Canadian Imperial Bank of Commerce and Bank of New York Mellon (Tri-Party), dated 05/09/2019 (collateralized by a Government National Mortgage Association, 4.500% due 09/20/2048, a U.S. Treasury Bond, 3.000%
due 05/15/2047, U.S. Treasury Inflation Index Notes, 0.375% – 0.750% due 04/15/2023 – 07/15/2028, and U.S. Treasury Notes, 2.125% due 05/15/2022 – 12/31/2022, valued at $372,300,050); expected proceeds $366,466,083
|
2.410% | 07/05/2019 | 07/08/2019 | 365,000,000 | 365,000,000 | |||||
|
Agreement with Canadian Imperial Bank of Commerce and Bank of New York Mellon (Tri-Party), dated 06/28/2019 (collateralized by Federal Home Loan Mortgage Corporations, 3.000% – 4.500% due 03/01/2030 – 05/01/2049,
Federal National Mortgage Associations, 3.500% – 4.500% due 05/01/2034 – 04/01/2049, and a Government National Mortgage Association, 4.500% due 09/20/2048, valued at $204,000,000); expected proceeds $200,042,000
|
2.520% | 07/01/2019 | 07/01/2019 | 200,000,000 | 200,000,000 | |||||
|
Agreement with Citigroup Global Markets, Inc. and Bank of New York Mellon (Tri-Party), dated 06/28/2019 (collateralized by a Federal Home Loan Mortgage Corporation, 3.500% due 05/01/2049, and a Federal National Mortgage
Association, 2.500% due 06/01/2032, valued at $99,960,001); expected proceeds $98,020,498
|
2.510% | 07/01/2019 | 07/01/2019 | 98,000,000 | 98,000,000 | |||||
|
Agreement with Citigroup Global Markets, Inc. and Bank of New York Mellon (Tri-Party), dated 06/28/2019 (collateralized by a Government National Mortgage Association, 0.403% due 12/16/2039, Resolution Funding Strips, 0.000%
– 8.875% due 07/15/2020 – 04/15/2030, U.S. Treasury Inflation Index Notes, 0.500% – 0.625% due 01/15/2024 – 04/15/2024, U.S. Treasury Notes, 2.000% – 2.750% due 01/31/2024 – 04/30/2024, and U.S. Treasury Strips,
0.000% due 08/15/2019 – 11/15/2019, valued at $184,620,128); expected proceeds $181,037,708
|
2.500% | 07/01/2019 | 07/01/2019 | 181,000,000 | 181,000,000 |
| Name of Issuer and Title of Issue | Interest Rate | Next Rate Reset Date | Maturity Date | Principal Amount | Value | |||||
| Agreement with Citigroup Global Markets, Inc. and Bank of New York Mellon (Tri-Party), dated 06/28/2019 (collateralized by Federal Home Loan Mortgage Corporations, 0.000% – 24.935% due 10/15/2020 – 05/15/2053, Federal Home Loan Mortgage Corporation Strips, 1.567% - 4.500% due 09/15/2040 - 12/15/2042, Federal National Mortgage Associations, 0.000% – 18.413% due 12/25/2019 – 09/25/2057, Federal National Mortgage Associations Strips, 0.000% – 10.000% due 03/01/2020 – 07/01/2042, Government National Mortgage Associations, 0.000% – 56.123% due 04/20/2034 – 09/20/2068, U.S. Treasury Notes, 2.000% – 2.096% due 01/31/2020 – 07/31/2020, and U.S. Treasury Strips, 0.000% due 08/15/2026 – 11/15/2028, valued at $1,028,917,982); expected proceeds $1,000,476,389 | 2.450% | 07/05/2019 | 07/05/2019 | $ 1,000,000,000 | $ 1,000,000,000 | |||||
|
Agreement with Goldman Sachs & Co. and Bank of New York Mellon (Tri-Party), dated 06/27/2019 (collateralized by Federal Home Loan Mortgage Corporations, 1.820% – 4.060% due 05/25/2023 – 11/25/2051, Federal
National Mortgage Associations, 0.000% – 4.617% due 12/25/2027 – 12/25/2057, and Government National Mortgage Associations, 2.000% – 5.000% due 01/16/2027 – 09/16/2059, valued at $612,000,000); expected proceeds $600,252,000
|
2.520% | 07/03/2019 | 07/03/2019 | 600,000,000 | 600,000,000 | |||||
|
Agreement with Goldman Sachs & Co. and Bank of New York Mellon (Tri-Party), dated 06/28/2019 (collateralized by Federal Home Loan Mortgage Corporations, 2.500% – 3.926% due 09/25/2021 – 09/15/2043, a Federal
Home Loan Mortgage Corporation Strip, 2.894% due 01/15/2043, Federal National Mortgage Associations, 2.704% – 5.349% due 06/25/2025 – 12/25/2048, and Government National Mortgage Associations, 3.000% due 12/20/2047 – 04/20/2049,
valued at $212,160,000); expected proceeds $208,043,680
|
2.520% | 07/01/2019 | 07/01/2019 | 208,000,000 | 208,000,000 | |||||
|
Agreement with HSBC Securities USA, Inc. and Bank of New York Mellon (Tri-Party), dated 06/28/2019 (collateralized by Federal National Mortgage Associations, 3.500% – 5.500% due 10/01/2023 – 12/01/2048, valued at
$97,920,000); expected proceeds $96,020,160
|
2.520% | 07/01/2019 | 07/01/2019 | 96,000,000 | 96,000,000 | |||||
|
Agreement with JP Morgan Securities, Inc. and Bank of New York Mellon (Tri-Party), dated 06/28/2019 (collateralized by a Federal Home Loan Mortgage Corporation, 5.000% due 10/01/2033, and Federal National Mortgage
Associations, 3.500% – 6.000% due 11/01/2030 – 06/01/2052, valued at $350,880,000); expected proceeds $344,073,100
|
2.550% | 07/01/2019 | 07/01/2019 | 344,000,000 | 344,000,000 | |||||
|
Agreement with JP Morgan Securities, Inc. and Bank of New York Mellon (Tri-Party), dated 06/28/2019 (collateralized by a Government National Mortgage Association, 3.887% due 06/20/2040, valued at $144,840,000); expected
proceeds $142,030,057
|
2.540% | 07/01/2019 | 07/01/2019 | 142,000,000 | 142,000,000 | |||||
|
Agreement with Mitsubishi UFJ Securities, Inc. and Bank of New York Mellon (Tri-Party), dated 06/10/2019 (collateralized by Federal Home Loan Mortgage Corporations, 1.932% – 5.000% due 10/01/2025 – 07/01/2049,
and Federal National Mortgage Associations, 2.480% – 5.500% due 09/01/2027 – 07/01/2049, valued at $255,354,025); expected proceeds $251,454,444
(c) |
2.380% | 09/06/2019 | 09/06/2019 | 250,000,000 | 250,000,000 |
| Name of Issuer and Title of Issue | Interest Rate | Next Rate Reset Date | Maturity Date | Principal Amount | Value | |||||
|
Agreement with Morgan Stanley and Co., Inc. and Bank of New York Mellon (Tri-Party), dated 06/28/2019 (collateralized by Federal Home Loan Mortgage Corporations, 2.500% – 4.500% due 06/01/2033 – 07/01/2049,
Federal National Mortgage Associations, 2.500% – 4.500% due 07/01/2026 – 06/01/2049, and Government National Mortgage Associations, 2.500% – 8.500% due 06/20/2022 – 06/20/2049, valued at $1,020,000,000); expected proceeds
$1,000,210,000
|
2.520% | 07/01/2019 | 07/01/2019 | $ 1,000,000,000 | $ 1,000,000,000 | |||||
|
Agreement with Royal Bank of Canada and Bank of New York Mellon (Tri-Party), dated 06/28/2019 (collateralized by a Federal National Mortgage Association, 4.500% due 09/01/2041, Government National Mortgage Associations,
3.500% – 4.500% due 03/20/2041 – 09/20/2048, U.S. Treasury Bonds, 2.875% – 3.000% due 08/15/2045 – 11/15/2045, a U.S. Treasury Inflation Index Note, 0.125% due 04/15/2021, and U.S. Treasury Notes, 2.000% – 2.875% due
01/31/2021 – 12/31/2023, valued at $275,400,041); expected proceeds $270,056,700
|
2.520% | 07/01/2019 | 07/01/2019 | 270,000,000 | 270,000,000 | |||||
|
Agreement with Societe Generale and Bank of New York Mellon (Tri-Party), dated 06/26/2019 (collateralized by a Federal Home Loan Bank, 1.500% due 07/03/2019, Federal Home Loan Mortgage Corporations, 1.550% – 5.504% due
09/30/2021 – 04/01/2049, Federal National Mortgage Associations, 1.750% – 4.500% due 09/12/2019 – 05/01/2058, Government National Mortgage Associations, 3.000% – 4.500% due 11/20/2027 – 04/20/2049, and Resolution
Funding Strips, 0.000% due 01/15/2026 – 10/15/2029, valued at $510,000,567); expected proceeds $500,247,917
|
2.550% | 07/03/2019 | 07/03/2019 | 500,000,000 | 500,000,000 | |||||
|
Agreement with Societe Generale and Bank of New York Mellon (Tri-Party), dated 06/28/2019 (collateralized by Federal Home Loan Mortgage Corporations, 2.844% – 4.500% due 05/15/2022 – 09/01/2048, Federal National
Mortgage Associations, 2.500% – 5.500% due 06/25/2022 – 04/01/2049, Government National Mortgage Associations, 2.683% – 2.694% due 01/20/2034 – 08/16/2034, and a U.S. Treasury Inflation Index Note, 0.375% due 07/15/2023,
valued at $321,300,544); expected proceeds $315,065,625
|
2.500% | 07/01/2019 | 07/01/2019 | 315,000,000 | 315,000,000 | |||||
|
Agreement with TD Securities (USA) LLC and Bank of New York Mellon (Tri-Party), dated 06/28/2019 (collateralized by a Federal Home Loan Mortgage Corporation, 2.750% due 06/19/2023, a Federal National Mortgage Association,
2.375% due 01/19/2023, Tennessee Valley Authorities, 0.000% – 7.125% due 05/01/2030 – 09/15/2065, and a U.S. Treasury Inflation Index Note, 1.875% due 07/15/2019, valued at $132,600,233); expected proceeds $130,027,300
|
2.520% | 07/01/2019 | 07/01/2019 | 130,000,000 | 130,000,000 | |||||
|
Agreement with Wells Fargo Bank and Bank of New York Mellon (Tri-Party), dated 06/28/2019 (collateralized by Federal Home Loan Mortgage Corporations, 3.000% – 4.500% due 10/01/2033 – 04/01/2049, and Federal
National Mortgage Associations, 2.000% – 5.000% due 01/01/2032 – 06/01/2049, valued at $1,383,410,455); expected proceeds $1,356,284,760
|
2.520% | 07/01/2019 | 07/01/2019 | 1,356,000,000 | 1,356,000,000 | |||||
|
TOTAL GOVERNMENT AGENCY REPURCHASE
AGREEMENTS |
8,224,000,000 |
| Name of Issuer and Title of Issue | Interest Rate | Next Rate Reset Date | Maturity Date | Principal Amount | Value | |||||
| TREASURY REPURCHASE AGREEMENTS—16.1% | ||||||||||
|
Agreement with Barclays Capital, Inc. and Bank of New York Mellon (Tri-Party), dated 06/28/2019 (collateralized by a U.S. Treasury Inflation Index Bond, 1.000% due 02/15/2048, and U.S. Treasury Inflation Index Notes, 0.125%
– 0.625% due 01/15/2023 – 07/15/2026, valued at $408,000,006); expected proceeds $400,083,333
|
2.500% | 07/01/2019 | 07/01/2019 | $ 400,000,000 | $ 400,000,000 | |||||
|
Agreement with Citigroup Global Markets, Inc. and Bank of New York Mellon (Tri-Party), dated 06/28/2019 (collateralized by U.S. Treasury Inflation Index Notes, 0.125% – 0.250% due 07/15/2024 – 01/15/2025, and
U.S. Treasury Notes, 2.000% – 2.750% due 06/30/2024 – 02/28/2025, valued at $510,002,110); expected proceeds $500,237,222
|
2.440% | 07/05/2019 | 07/05/2019 | 500,000,000 | 500,000,000 | |||||
|
Agreement with Credit Agricole Corporate and Investment Bank and Bank of New York Mellon (Tri-Party), dated 06/06/2019 (collateralized by U.S. Treasury Notes, 1.750% – 2.375% due 11/30/2020 – 05/15/2027, valued
at $341,700,052); expected proceeds $335,708,711
|
2.380% | 07/05/2019 | 07/05/2019 | 335,000,000 | 335,000,000 | |||||
|
Agreement with Fixed Income Clearing Corp., and Bank of New York Mellon (Tri-Party), dated 06/28/2019 (collateralized by a U.S. Treasury Bill, 0.000% due 06/18/2020, and U.S. Treasury Inflation Index Notes, 0.375% –
0.875% due 04/15/2024 – 01/15/2029, valued at $1,836,000,008); expected proceeds $1,800,375,000
|
2.500% | 07/01/2019 | 07/01/2019 | 1,800,000,000 | 1,800,000,000 | |||||
|
Agreement with Goldman Sachs & Co. and Bank of New York Mellon (Tri-Party), dated 06/24/2019 (collateralized by U.S. Treasury Bonds, 2.750% – 6.625% due 02/15/2027 – 08/15/2042, U.S. Treasury Notes, 1.500%
– 1.750% due 09/30/2019 – 09/30/2022, and U.S. Treasury Strips, 0.000% due 11/15/2020 – 02/15/2027, valued at $816,000,064); expected proceeds $800,382,667
|
2.460% | 07/01/2019 | 07/01/2019 | 800,000,000 | 800,000,000 | |||||
|
Agreement with Goldman Sachs & Co. and Bank of New York Mellon (Tri-Party), dated 06/25/2019 (collateralized by U.S. Treasury Strips, 0.000% due 11/15/2021 – 05/15/2028, valued at $255,000,000); expected proceeds
$250,120,069
|
2.470% | 07/02/2019 | 07/02/2019 | 250,000,000 | 250,000,000 | |||||
|
Agreement with HSBC Securities USA, Inc. and Bank of New York Mellon (Tri-Party), dated 06/28/2019 (collateralized by a U.S. Treasury Bill, 0.000% due 07/18/2019, a U.S. Treasury Inflation Index Note, 0.875% due 01/15/2029,
and a U.S. Treasury Note, 3.500% due 05/15/2020, valued at $23,460,067); expected proceeds $23,004,792
|
2.500% | 07/01/2019 | 07/01/2019 | 23,000,000 | 23,000,000 | |||||
|
Agreement with JP Morgan Securities, Inc. and Bank of New York Mellon (Tri-Party), dated 06/11/2019 (collateralized by a U.S. Treasury Bill, 0.000% due 01/30/2020, and U.S. Treasury Notes, 2.000% – 2.750% due
10/31/2021 – 07/31/2023, valued at $484,500,071); expected proceeds $478,879,167
(c) |
2.450% | 07/01/2019 | 10/09/2019 | 475,000,000 | 475,000,000 | |||||
|
Agreement with JP Morgan Securities, Inc. and Bank of New York Mellon (Tri-Party), dated 06/28/2019 (collateralized by a U.S. Treasury Note, 2.875% due 10/31/2023, valued at $204,000,040); expected proceeds $200,042,167
|
2.530% | 07/01/2019 | 07/01/2019 | 200,000,000 | 200,000,000 | |||||
|
Agreement with LLOYDS Bank PLC and Clearstream (Tri-Party), and dated 04/26/2019 (collateralized by a U.S. Treasury Inflation Index Note, 0.500% due 04/15/2024, and U.S. Treasury Notes, 1.875% – 2.875% due 07/31/2021
– 11/15/2027, valued at $190,752,145); expected proceeds $186,066,114
(c) |
2.530% | 07/01/2019 | 07/17/2019 | 185,000,000 | 185,000,000 |
| Name of Issuer and Title of Issue | Interest Rate | Next Rate Reset Date | Maturity Date | Principal Amount | Value | |||||
|
Agreement with LLOYDS Bank PLC and Clearstream (Tri-Party), and dated 04/26/2019 (collateralized by a U.S. Treasury Inflation Index Note, 0.750% due 07/15/2028, and U.S. Treasury Notes, 1.875% – 2.250% due 07/31/2021
– 11/15/2027, valued at $92,333,885); expected proceeds $90,594,550
(c) |
2.530% | 07/01/2019 | 07/29/2019 | $ 90,000,000 | $ 90,000,000 | |||||
|
Agreement with Mitsubishi UFJ Securities, Inc. and Bank of New York Mellon (Tri-Party), dated 06/28/2019 (collateralized by a U.S. Treasury Inflation Index Note, 0.125% due 01/15/2023, and a U.S. Treasury Note, 2.000% due
06/30/2024, valued at $40,808,523); expected proceeds $40,008,333
|
2.500% | 07/01/2019 | 07/01/2019 | 40,000,000 | 40,000,000 | |||||
|
Agreement with MUFG Securities, dated 06/27/2019 (collateralized by U.S. Treasury Bonds, 2.250% - 3.000% due 02/15/2045 – 05/15/2047, valued at $203,965,450); expected proceeds $200,113,333
|
2.550% | 07/05/2019 | 07/05/2019 | 200,000,000 | 200,000,000 | |||||
|
Agreement with Norinchukin Bank and Bank of New York Mellon (Tri-Party), dated 05/09/2019 (collateralized by U.S. Treasury Inflation Index Notes, 0.375% – 1.125% due 01/15/2021 – 01/15/2027, and a U.S. Treasury
Note, 2.000% due 11/15/2026, valued at $183,600,028); expected proceeds $181,190,400
(c) |
2.480% | 08/13/2019 | 08/13/2019 | 180,000,000 | 180,000,000 | |||||
|
Agreement with Norinchukin Bank and Bank of New York Mellon (Tri-Party), dated 06/12/2019 (collateralized by U.S. Treasury Inflation Index Notes, 0.375% – 1.125% due 01/15/2021 – 01/15/2027, and a U.S. Treasury
Note, 3.375% due 11/15/2019, valued at $204,000,010); expected proceeds $201,214,167
(c) |
2.350% | 09/13/2019 | 09/13/2019 | 200,000,000 | 200,000,000 | |||||
|
Agreement with Norinchukin Bank and Bank of New York Mellon (Tri-Party), dated 06/24/2019 (collateralized by U.S. Treasury Inflation Index Notes, 0.375% – 1.125% due 01/15/2021 – 01/15/2027, and U.S. Treasury
Notes, 2.000% – 3.375% due 11/15/2019 – 11/15/2026, valued at $183,600,005); expected proceeds $181,067,200
(c) |
2.320% | 09/24/2019 | 09/24/2019 | 180,000,000 | 180,000,000 | |||||
|
Agreement with Prudential Insurance Co., dated 06/28/2019 (collateralized by U.S. Treasury Bonds, 2.875% - 3.125% due 05/15/2043 – 05/15/2048, valued at $136,710,258); expected proceeds $134,059,397
|
2.520% | 07/01/2019 | 07/01/2019 | 134,031,250 | 134,031,250 | |||||
|
Agreement with Prudential Insurance Co., dated 06/28/2019 (collateralized by U.S. Treasury Strips, 0.000% due 11/15/2026 – 05/15/2029, valued at $104,874,925); expected proceeds $102,896,604
|
2.520% | 07/01/2019 | 07/01/2019 | 102,875,000 | 102,875,000 | |||||
| Agreement with Royal Bank of Canada and Bank of New York Mellon (Tri-Party), dated 06/28/2019 (collateralized by U.S. Treasury Bonds, 2.875% – 4.375% due 05/15/2039 – 11/15/2045, U.S. Treasury Inflation Index Notes, 0.125% – 1.125% due 04/15/2020 – 01/15/2028, and U.S. Treasury Notes, 1.125% – 2.875% due 03/31/2020 – 08/15/2025, valued at $1,106,700,081); expected proceeds $1,085,226,042 | 2.500% | 07/01/2019 | 07/01/2019 | 1,085,000,000 | 1,085,000,000 | |||||
|
Agreement with Societe Generale and Bank of New York Mellon (Tri-Party), dated 06/28/2019 (collateralized by a U.S. Treasury Bond, 2.750% due 08/15/2047, and U.S. Treasury Notes, 2.375% – 2.625% due 07/31/2020 –
05/15/2024, valued at $102,000,060); expected proceeds $100,020,667
|
2.480% | 07/01/2019 | 07/01/2019 | 100,000,000 | 100,000,000 |
| Name of Issuer and Title of Issue | Interest Rate | Next Rate Reset Date | Maturity Date | Principal Amount | Value | |||||
|
Agreement with Societe Generale and Bank of New York Mellon (Tri-Party), dated 06/28/2019 (collateralized by a U.S. Treasury Bond, 3.125% due 08/15/2044, and U.S. Treasury Notes, 2.000% – 2.500% due 08/31/2021 –
01/31/2025, valued at $181,560,069); expected proceeds $178,036,787
|
2.480% | 07/01/2019 | 07/01/2019 | $ 178,000,000 | $ 178,000,000 | |||||
|
Agreement with UBS Securities LLC and Bank of New York Mellon (Tri-Party), dated 06/28/2019 (collateralized by U.S. Treasury Bills, 0.000% due 07/05/2019 – 01/30/2020, U.S. Treasury Bonds, 2.250% – 8.750% due
08/15/2019 – 05/15/2048, U.S. Treasury Inflation Index Bonds, 0.750% – 2.500% due 01/15/2025 – 02/15/2047, U.S. Treasury Inflation Index Notes, 0.625% – 0.875% due 07/15/2021 – 01/15/2029, U.S. Treasury Notes, 0.875%
– 3.625% due 07/31/2019 – 08/15/2028, and U.S. Treasury Strips, 0.000% due 05/15/2022 – 05/15/2029, valued at $153,000,046); expected proceeds $150,031,250
|
2.500% | 07/01/2019 | 07/01/2019 | 150,000,000 | 150,000,000 | |||||
|
Agreement with Wells Fargo Bank and Bank of New York Mellon (Tri-Party), dated 06/28/2019 (collateralized by U.S. Treasury Notes, 1.750% due 05/31/2022 – 06/15/2022, valued at $205,062,784); expected proceeds
$201,041,875
|
2.500% | 07/01/2019 | 07/01/2019 | 201,000,000 | 201,000,000 | |||||
|
TOTAL TREASURY REPURCHASE
AGREEMENTS |
7,808,906,250 | |||||||||
|
TOTAL INVESTMENTS –94.2%
(d)(e) |
45,581,725,199 | |||||||||
|
Other Assets in Excess of Liabilities —5.8%
|
2,820,386,150 | |||||||||
|
NET ASSETS –100.0%
|
$ 48,402,111,349 |
| (a) | Variable Rate Security - Interest rate shown is rate in effect at June 30, 2019. For securities based on a published reference rate and spread, the reference rate and spread are indicated in the description above. |
| (b) | Rate shown is the discount rate at time of purchase. |
| (c) | Illiquid security. These securities represent $1,560,000,000 or 3.2% of net assets as of June 30, 2019. |
| (d) | Also represents the cost for federal tax purposes. |
| (e) | Unless otherwise indicated, the values of the securities of the Portfolio are determined based on Level 2 inputs (Note 2). |
| ASSETS | |
|
Investments in unaffiliated issuers, at value and
cost |
$29,548,818,949 |
|
Repurchase agreements, at value and amortized
cost |
16,032,906,250 |
|
Total
Investments |
45,581,725,199 |
|
Cash |
2,757,769,742 |
|
Interest receivable — unaffiliated
issuers |
59,231,322 |
|
Other
Receivable |
5,633,781 |
|
TOTAL ASSETS
|
48,404,360,044 |
| LIABILITIES | |
|
Advisory and administrator fee
payable |
1,899,061 |
|
Custody, sub-administration and transfer agent fees
payable |
299,251 |
|
Trustees’ fees and expenses
payable |
599 |
|
Professional fees
payable |
32,869 |
|
Printing fees
payable |
7,582 |
|
Accrued expenses and other
liabilities |
9,333 |
|
TOTAL LIABILITIES
|
2,248,695 |
|
NET ASSETS
|
$48,402,111,349 |
| INVESTMENT INCOME | |
|
Interest income — unaffiliated
issuers |
$569,132,596 |
| EXPENSES | |
|
Advisory and administrator
fee |
11,483,515 |
|
Custodian, sub-administrator and transfer agent
fees |
2,944,710 |
|
Trustees’ fees and expenses
|
533,772 |
|
Professional fees and
expenses |
82,677 |
|
Printing and postage
fees |
8,234 |
|
Insurance
expense |
12,521 |
|
Miscellaneous
expenses |
19,223 |
|
TOTAL
EXPENSES |
15,084,652 |
|
NET INVESTMENT INCOME
(LOSS) |
$554,047,944 |
| REALIZED GAIN (LOSS) | |
| Net realized gain (loss) on: | |
|
Investments — unaffiliated
issuers |
47,985 |
|
NET INCREASE (DECREASE) IN NET ASSETS FROM
OPERATIONS |
$554,095,929 |
| Six
Months Ended 6/30/19 (Unaudited) |
Year
Ended 12/31/18 | ||
| INCREASE (DECREASE) IN NET ASSETS FROM OPERATIONS: | |||
|
Net investment income
(loss) |
$ 554,047,944 | $ 882,055,252 | |
|
Net realized gain
(loss) |
47,985 | 20,763 | |
|
Net increase (decrease) in net assets resulting from
operations |
554,095,929 | 882,076,015 | |
| CAPITAL TRANSACTIONS | |||
|
Contributions |
72,221,030,888 | 142,050,377,534 | |
|
Withdrawals |
(65,594,797,713) | (150,375,688,545) | |
|
Net increase (decrease) in net assets from capital transactions
|
6,626,233,175 | (8,325,311,011) | |
|
Net increase (decrease) in net assets during the
period |
7,180,329,104 | (7,443,234,996) | |
|
Net assets at beginning of
period |
41,221,782,245 | 48,665,017,241 | |
|
NET ASSETS AT END OF
PERIOD |
$ 48,402,111,349 | $ 41,221,782,245 |
| Six
Months Ended 6/30/19 (Unaudited) |
Year
Ended 12/31/18 |
Year
Ended 12/31/17 |
Year
Ended 12/31/16 |
Year
Ended 12/31/15 |
Year
Ended 12/31/14 | ||||||
|
Total return
(a) |
1.20% | 1.81% | 0.74% | 0.31% | 0.03% | 0.01% | |||||
| Ratios and Supplemental Data: | |||||||||||
|
Net assets, end of period (in
000s) |
$48,402,111 | $41,221,782 | $48,665,017 | $50,925,227 | $16,023,491 | $13,207,868 | |||||
| Ratios to average net assets: | |||||||||||
|
Total
expenses |
0.07%(b) | 0.07% | 0.06% | 0.07% | 0.07% | 0.07% | |||||
|
Net investment income
(loss) |
2.41%(b) | 1.78% | 0.85% | 0.32% | 0.03% | 0.01% |
| (a) | Results represent past performance and are not indicative of future results. Total return for periods of less than one year are not annualized. |
| (b) | Annualized. |
| Actual | Hypothetical
(assuming a 5% return before expenses) | ||||||||
| Annualized
Expense Ratio |
Ending
Account Value |
Expenses
Paid During Period(a) |
Ending
Account Value |
Expenses
Paid During Period(a) | |||||
|
State Street U.S. Government Money Market
Portfolio |
0.07% | $1,012.00 | $0.35 | $1,024.40 | $0.35 | ||||
| (a) | Expenses are equal to the Portfolio’s annualized net expense ratio multiplied by the average account value of the period, multiplied by 181, then divided by 365. |
| • | A report prepared by an independent third-party provider of investment company data, which includes for the feeder fund for which the Portfolio serves as the master fund in a master-feeder structure (the “Fund”): |
| • | Comparisons of the Fund’s performance over the past one-, three-, five- and ten-year periods ended December 31, 2018, to the performance of an appropriate benchmark constructed by Broadridge Financial Solutions, Inc., the successor to Lipper, Inc. (“Broadridge”), for the Fund (the “Lipper Index”) and a universe of other mutual funds with similar investment objectives and policies (the “Performance Group” and/or the “Performance Universe”); |
| • | Comparisons of the Fund’s expense ratio (with detail of component expenses) to the expense ratios of a group of comparable mutual funds selected by the independent third-party data provider (the “Expense Group” and/or “Expense Universe”); |
| • | A chart showing the Fund’s historical average net assets relative to its total expenses, management fees, and non-management expenses over the past five calendar years; and |
| • | Comparisons of the Fund’s contractual management fee to the contractual management fees of comparable mutual funds at different asset levels. |
| • | Comparative information concerning fees charged by the Adviser for managing institutional accounts using investment strategies and techniques similar to those used in managing the Fund; and |
| • | Profitability analyses for (a) the Adviser with respect to the Portfolio and (b) affiliates of the Adviser that provide services to the Portfolio (“Affiliated Service Providers”). |
| • | Descriptions of the investment management services provided by the Adviser, including its investment strategies and processes; |
| • | Information concerning the allocation of brokerage; and |
| • | Information regarding the procedures and processes used to value the assets of the Portfolio. |
| • | Reports detailing the financial results and condition of the Adviser and its affiliates; |
| • | Descriptions of the qualifications, education and experience of the individual investment and other professionals responsible for managing the portfolio of the Portfolio and for Portfolio operations; |
| • | Information relating to compliance with and the administration of the Code of Ethics adopted by the Adviser; |
| • | A copy of the Adviser’s proxy voting policies and procedures and other information regarding the Adviser’s practices for overseeing proxy vendors; |
| • | Information concerning the resources devoted by the Adviser to overseeing compliance by the Portfolio and its service providers, including information concerning compliance with investment policies and restrictions and other operating policies of the Portfolio; |
| • | A description of the adequacy and sophistication of the Adviser’s technology and systems with respect to investment and administrative matters and a description of any material improvements or changes in technology or systems in the past year; |
| • | A description of the business continuity and disaster recovery plans of the Adviser; and |
| • | Information regarding the Adviser’s risk management processes. |
| • | Information concerning the nature, extent, quality and cost of services provided to the Portfolio by SSGA FM in its capacity as the Portfolio’s administrator (the “Administrator”); |
| • | Information concerning the nature, extent, quality and cost of various non-investment management services provided to the Portfolio by affiliates of the Adviser, including the custodian, sub-administrator, transfer agent and fund accountant of the Portfolio, and the role of the Adviser in managing the Portfolio’s relationship with these service providers; |
| • | Copies of the Advisory Agreement and agreements with other service providers of the Portfolio; |
| • | Draft responses to a letter from independent legal counsel to the Independent Trustees (“Independent Counsel”), reviewed prior to such date by Independent Counsel, requesting specific information from each of: |
| • | SSGA FM, in its capacity as the Portfolio’s Adviser and Administrator, with respect to its operations relating to the Portfolio and its approximate profit margins from such operations for the calendar year ended December 31, 2018; and the relevant operations of other affiliated service providers to the Portfolio, together with their approximate profit margins from such relevant operations for the calendar year ended December 31, 2018; |
| • | State Street Bank and Trust Company (“State Street”), the sub-administrator, custodian and transfer agent for the Portfolio, with respect to its operations relating to the Portfolio; and |
| • | State Street Global Advisors Funds Distributors, LLC, the principal underwriter and distributor of the shares of the Portfolio (the “Distributor”), with respect to its operations relating to the Portfolio; |
| • | Information from SSGA FM, State Street and the Distributor with respect to the Trust providing any material changes to the previous information supplied in response to the letter from Independent Counsel prior to the executive session of the Board on May 15, 2019; |
| • | Materials provided by Broadridge, circulated to the Independent Trustees and to Independent Counsel, with respect to the Fund; and |
| • | A summary of the foregoing materials prepared by Independent Counsel. |
State Street Bank and Trust Company
P.O. Box 5049
Boston, MA 02206
| State Street Institutional Treasury Money Market Fund |

|
|
1 |
|
|
2 |
|
|
3 |
|
|
5 |
|
|
10 |
|
|
14 |
| ASSETS | |
|
Investment in corresponding affiliated Portfolio, at value and
cost |
$11,943,713,138 |
|
Receivable for fund shares
sold |
54,669 |
|
TOTAL ASSETS
|
11,943,767,807 |
| LIABILITIES | |
|
Administration fees
payable |
387,934 |
|
Shareholder servicing fee payable
|
72,550 |
|
Distribution fees
payable |
24,614 |
|
Transfer agent fees
payable |
1,562 |
|
Distribution
payable |
1,030,702 |
|
Registration and filing fees
payable |
6,398 |
|
Professional fees
payable |
12,415 |
|
Printing fees
payable |
666 |
|
Accrued expenses and other
liabilities |
29,466 |
|
TOTAL LIABILITIES
|
1,566,307 |
|
NET ASSETS
|
$11,942,201,500 |
| NET ASSETS CONSIST OF: | |
|
Paid-in
Capital |
$11,942,126,549 |
|
Total distributable earnings
(loss) |
74,951 |
|
NET ASSETS
|
$11,942,201,500 |
| Administration Class | |
|
Net
Assets |
$ 50,000 |
|
Shares
Outstanding |
50,000 |
|
Net asset value, offering and redemption price per
share |
$ 1.00 |
| Institutional Class | |
|
Net
Assets |
$ 52,742,788 |
|
Shares
Outstanding |
52,742,804 |
|
Net asset value, offering and redemption price per
share |
$ 1.00 |
| Investment Class | |
|
Net
Assets |
$ 326,406,431 |
|
Shares
Outstanding |
326,401,163 |
|
Net asset value, offering and redemption price per
share |
$ 1.00 |
| Investor Class | |
|
Net
Assets |
$ 172,427,823 |
|
Shares
Outstanding |
172,429,909 |
|
Net asset value, offering and redemption price per
share |
$ 1.00 |
| Premier Class | |
|
Net
Assets |
$11,390,574,458 |
|
Shares
Outstanding |
11,390,603,436 |
|
Net asset value, offering and redemption price per
share |
$ 1.00 |
| INCOME AND EXPENSES ALLOCATED FROM AFFILIATED PORTFOLIO | |
|
Interest income allocated from affiliated
Portfolio |
$124,686,949 |
|
Expenses allocated from affiliated
Portfolio |
(3,424,531) |
|
TOTAL INVESTMENT INCOME (LOSS) ALLOCATED FROM AFFILIATED
PORTFOLIO |
121,262,418 |
| EXPENSES | |
|
Administration
fees |
2,567,559 |
| Shareholder servicing fees | |
|
Administration
Class |
49 |
|
Institutional
Class |
322 |
|
Investment
Class |
427,426 |
|
Investor
Class |
49,132 |
| Distribution fees | |
|
Administration
Class |
13 |
|
Investment
Class |
170,970 |
|
Custodian
fees |
20,090 |
|
Trustees’ fees and expenses
|
9,034 |
|
Transfer agent
fees |
3,141 |
|
Registration and filing
fees |
43,418 |
|
Professional
fees |
19,694 |
|
Printing and postage
fees |
23,258 |
|
Insurance
expense |
32,470 |
|
Miscellaneous
expenses |
47,606 |
|
TOTAL
EXPENSES |
3,414,182 |
|
NET INVESTMENT INCOME
(LOSS) |
$117,848,236 |
| REALIZED GAIN (LOSS) | |
| Net realized gain (loss) on: | |
|
Investments allocated from affiliated
Portfolio |
109,392 |
|
NET INCREASE (DECREASE) IN NET ASSETS FROM
OPERATIONS |
$117,957,628 |
| Six
Months Ended 6/30/19 (Unaudited) |
Year
Ended 12/31/18(a) | ||
| INCREASE (DECREASE) IN NET ASSETS FROM OPERATIONS: | |||
|
Net investment income
(loss) |
$ 117,848,236 | $ 185,945,905 | |
|
Net realized gain
(loss) |
109,392 | (86,235) | |
|
Net increase (decrease) in net assets resulting from
operations |
117,957,628 | 185,859,670 | |
| DISTRIBUTIONS TO SHAREHOLDERS: | |||
|
Administration
Class |
(511) | (425) | |
|
Institutional
Class |
(23,058) | (378) | |
|
Investment
Class |
(3,349,691) | (4,676,000) | |
|
Investor
Class |
(1,365,235) | (1,954,141) | |
|
Premier
Class |
(113,109,766) | (179,417,982) | |
|
Total distributions to shareholders
|
(117,848,261) | (186,048,926) | |
| FROM BENEFICIAL INTEREST TRANSACTIONS: | |||
| Administration Class | |||
|
Shares
sold |
— | 50,000 | |
|
Net increase (decrease) from capital share
transactions |
— | 50,000 | |
| Institutional Class | |||
|
Shares
sold |
81,695,189 | 50,000 | |
|
Reinvestment of
distributions |
17,300 | — | |
|
Shares
redeemed |
(29,019,684) | — | |
|
Net increase (decrease) from capital share
transactions |
52,692,805 | 50,000 | |
| Investment Class | |||
|
Shares
sold |
258,008,854 | 1,273,209,693 | |
|
Shares
redeemed |
(322,341,258) | (1,248,831,235) | |
|
Net increase (decrease) from capital share
transactions |
(64,332,404) | 24,378,458 | |
| Investor Class | |||
|
Shares
sold |
675,988,772 | 1,775,696,873 | |
|
Reinvestment of
distributions |
1,365,283 | 1,953,184 | |
|
Shares
redeemed |
(602,168,654) | (1,709,988,753) | |
|
Net increase (decrease) from capital share
transactions |
75,185,401 | 67,661,304 | |
| Premier Class | |||
|
Shares
sold |
38,249,187,642 | 26,594,663,424 | |
|
Reinvestment of
distributions |
107,404,082 | 169,379,668 | |
|
Shares
redeemed |
(36,390,628,506) | (29,462,984,221) | |
|
Net increase (decrease) from capital share
transactions |
1,965,963,218 | (2,698,941,129) | |
|
Net increase (decrease) in net assets from beneficial interest transactions
|
2,029,509,020 | (2,606,801,367) | |
|
Net increase (decrease) in net assets during the
period |
2,029,618,387 | (2,606,990,623) | |
|
Net assets at beginning of
period |
9,912,583,113 | 12,519,573,736 | |
|
NET ASSETS AT END OF
PERIOD |
$ 11,942,201,500 | $ 9,912,583,113 | |
| SHARES OF BENEFICIAL INTEREST: | |||
| Administration Class | |||
|
Shares
sold |
— | 50,000 | |
|
Net increase (decrease) from share
transactions |
— | 50,000 | |
| Institutional Class | |||
|
Shares
sold |
81,695,188 | 50,000 | |
|
Reinvestment of
distributions |
17,300 | — | |
|
Shares
redeemed |
(29,019,684) | — | |
|
Net increase (decrease) from share
transactions |
52,692,804 | 50,000 | |
| Investment Class | |||
|
Shares
sold |
258,008,855 | 1,273,209,693 | |
|
Shares
redeemed |
(322,341,258) | (1,248,831,235) | |
|
Net increase (decrease) from share
transactions |
(64,332,403) | 24,378,458 | |
| Investor Class | |||
|
Shares
sold |
675,988,771 | 1,775,696,873 | |
|
Reinvestment of
distributions |
1,365,283 | 1,953,184 | |
|
Shares
redeemed |
(602,168,654) | (1,709,988,753) | |
|
Net increase (decrease) from share
transactions |
75,185,400 | 67,661,304 |
| Six
Months Ended 6/30/19 (Unaudited) |
Year
Ended 12/31/18(a) | ||
| Premier Class | |||
|
Shares
sold |
38,249,187,643 | $ 26,594,663,424 | |
|
Reinvestment of
distributions |
107,404,082 | 169,379,668 | |
|
Shares
redeemed |
(36,390,628,506) | (29,462,984,221) | |
|
Net increase (decrease) from share
transactions |
1,965,963,219 | (2,698,941,129) |
| (a) | For Administration Class shares and Institutional Class shares, data is for the period July 30, 2018 (inception date) through December 31, 2018. |
| Administration Class(a) | |||
| Six
Months Ended 06/30/19 (Unaudited) |
For
the Period 07/31/18*- 12/31/18 | ||
|
Net asset value, beginning of
period |
$ 1.0000 | $ 1.0000 | |
| Income (loss) from investment operations: | |||
|
Net investment income
(loss) |
0.0102 | 0.0076 | |
|
Net realized gain
(loss) |
0.0000(b) | (0.0000)(b) | |
|
Total from investment
operations |
0.0102 | 0.0076 | |
| Distributions to shareholders from: | |||
|
Net investment
income |
(0.0102) | (0.0076) | |
|
Total
distributions |
(0.0102) | (0.0076) | |
|
Net asset value, end of
period |
$ 1.0000 | $ 1.0000 | |
|
Total return
(c) |
1.03% | 0.76% | |
| Ratios and Supplemental Data: | |||
|
Net assets, end of period (in
000s) |
$ 50 | $ 50 | |
| Ratios to Average Net Assets: | |||
|
Total
expenses |
0.37%(d) | 0.37%(d) | |
|
Net investment income
(loss) |
2.06%(d) | 1.79%(d) | |
| * | Commencement of operations. |
| (a) | The per share amounts and percentages include the Fund’s proportionate share of income and expenses of the affiliated Portfolio. |
| (b) | Amount is less than $0.00005 per share. |
| (c) | Total return is calculated assuming a purchase of shares at net asset value on the first day and a sale at net asset value on the last day of each period reported. Distributions are assumed, for the purpose of this calculation, to be reinvested at net asset value per share on the respective payment dates. Total return for periods of less than one year is not annualized. Results represent past performance and are not indicative of future results. |
| (d) | Annualized. |
| Institutional Class(a) | |||
| Six
Months Ended 6/30/19 (Unaudited) |
For
the Period 7/31/18* 12/31/18 | ||
|
Net asset value, beginning of
period |
$ 1.0000 | $ 1.0000 | |
| Income (loss) from investment operations: | |||
|
Net investment income
(loss) |
0.0113 | 0.0085 | |
|
Net realized gain
(loss) |
0.0000(b) | (0.0000)(b) | |
|
Total from investment
operations |
0.0113 | 0.0085 | |
| Distributions to shareholders from: | |||
|
Net investment
income |
(0.0113) | (0.0085) | |
|
Net asset value, end of
period |
$ 1.0000 | $ 1.0000 | |
|
Total return
(c) |
1.14% | 0.85% | |
| Ratios and Supplemental Data: | |||
|
Net assets, end of period (in
000s) |
$ 52,743 | $ 50 | |
| Ratios to Average Net Assets: | |||
|
Total
expenses |
0.15%(d) | 0.15%(d) | |
|
Net investment income
(loss) |
2.15%(d) | 2.01%(d) | |
| * | Commencement of operations. |
| (a) | The per share amounts and percentages include the Fund’s proportionate share of income and expenses of the affiliated Portfolio. |
| (b) | Amount is less than $0.00005 per share. |
| (c) | Total return is calculated assuming a purchase of shares at net asset value on the first day and a sale at net asset value on the last day of each period reported. Distributions are assumed, for the purpose of this calculation, to be reinvested at net asset value per share on the respective payment dates. Total return for periods of less than one year is not annualized. Results represent past performance and are not indicative of future results. |
| (d) | Annualized. |
| Investment Class(a) | |||||||||||
| Six
Months Ended 06/30/19 (Unaudited) |
Year
Ended 12/31/18 |
Year
Ended 12/31/17 |
Year
Ended 12/31/16 |
Year
Ended 12/31/15 |
Year
Ended 12/31/14 | ||||||
|
Net asset value, beginning of
period |
$ 1.0000 | $ 1.0000 | $ 1.0000 | $ 1.0000 | $ 1.0000 | $ 1.0000 | |||||
| Income (loss) from investment operations: | |||||||||||
|
Net investment income
(loss) |
0.0097 | 0.0138 | 0.0041 | 0.0000(b) | 0.0000(b)(c) | (0.0010)(c) | |||||
|
Net realized gain
(loss) |
0.0000(b) | (0.0000)(b) | 0.0000(b) | 0.0000(b) | 0.0000(b) | 0.0010 | |||||
|
Total from investment
operations |
0.0097 | 0.0138 | 0.0041 | 0.0000(b) | 0.0000(b) | 0.0000(b) | |||||
| Distributions to shareholders from: | |||||||||||
|
Net investment
income |
(0.0097) | (0.0138) | (0.0041) | (0.0000)(b) | — | — | |||||
|
Net realized
gains |
— | — | (0.0000)(b) | — | — | (0.0000)(b) | |||||
|
Total
distributions |
(0.0097) | (0.0138) | (0.0041) | (0.0000)(b) | — | (0.0000)(b) | |||||
|
Net asset value, end of
period |
$ 1.0000 | $ 1.0000 | $ 1.0000 | $ 1.0000 | $ 1.0000 | $ 1.0000 | |||||
|
Total return
(d) |
0.98% | 1.39% | 0.41% | 0.00%(e) | 0.00%(e) | 0.00%(e) | |||||
| Ratios and Supplemental Data: | |||||||||||
|
Net assets, end of period (in
000s) |
$326,406 | $390,735 | $366,364 | $609,545 | $724,683 | $741,248 | |||||
| Ratios to Average Net Assets: | |||||||||||
|
Total
expenses |
0.47%(f) | 0.47% | 0.47% | 0.47% | 0.47% | 0.47% | |||||
|
Net expenses
(f) |
0.47%(f) | 0.47% | 0.47% | 0.31% | 0.04% | 0.05% | |||||
|
Net investment income
(loss) |
1.96%(f) | 1.37% | 0.38% | 0.00%(e) | 0.00%(e) | 0.00%(e) | |||||
| (a) | The per share amounts and percentages include the Fund’s proportionate share of income and expenses of the affiliated Portfolio. |
| (b) | Amount is less than $0.00005 per share. |
| (c) | Per share numbers have been calculated using average shares outstanding, which more appropriately presents the per share data for the period. |
| (d) | Total return is calculated assuming a purchase of shares at net asset value on the first day and a sale at net asset value on the last day of each period reported. Distributions are assumed, for the purpose of this calculation, to be reinvested at net asset value per share on the respective payment dates. Total return for periods of less than one year is not annualized. Results represent past performance and are not indicative of future results. |
| (e) | Amount is less than 0.005%. |
| (f) | Annualized. |
| Investor Class(a) | |||||||
| Six
Months Ended 06/30/19 (Unaudited) |
Year
Ended 12/31/18 |
Year
Ended 12/31/17 |
For
the Period 12/22/16* - 12/31/16 | ||||
|
Net asset value, beginning of
period |
$ 1.0000 | $ 1.0000 | $ 1.0000 | $ 1.0000 | |||
| Income (loss) from investment operations: | |||||||
|
Net investment income
(loss) |
0.0110 | 0.0165 | 0.0068 | 0.0001 | |||
|
Net realized gain
(loss) |
0.0000(b) | (0.0000)(b) | 0.0000(b) | (0.0000)(b) | |||
|
Total from investment
operations |
0.0110 | 0.0165 | 0.0068 | 0.0001 | |||
| Distributions to shareholders from: | |||||||
|
Net investment
income |
(0.0110) | (0.0165) | (0.0068) | (0.0001) | |||
|
Net realized
gains |
— | — | (0.0000) | — | |||
|
Total
distributions |
(0.0110) | (0.0165) | (0.0068) | (0.0001) | |||
|
Net asset value, end of
period |
$ 1.0000 | $ 1.0000 | $ 1.0000 | $ 1.0000 | |||
|
Total return
(c) |
1.11% | 1.66% | 0.68% | 0.00%(d) | |||
| Ratios and Supplemental Data: | |||||||
|
Net assets, end of period (in
000s) |
$172,428 | $ 97,241 | $ 29,583 | $ 27,402 | |||
| Ratios to Average Net Assets: | |||||||
|
Total
expenses |
0.20%(e) | 0.20% | 0.20% | 0.18%(e) | |||
|
Net investment income
(loss) |
2.22%(e) | 1.70% | 0.71% | 0.31%(e) | |||
| * | Commencement of operations. |
| (a) | The per share amounts and percentages include the Fund’s proportionate share of income and expenses of the affiliated Portfolio. |
| (b) | Amount is less than $0.00005 per share. |
| (c) | Total return is calculated assuming a purchase of shares at net asset value on the first day and a sale at net asset value on the last day of each period reported. Distributions are assumed, for the purpose of this calculation, to be reinvested at net asset value per share on the respective payment dates. Total return for periods of less than one year is not annualized. Results represent past performance and are not indicative of future results. |
| (d) | Amount is less than 0.005%. |
| (e) | Annualized. |
| Premier Class(a) | |||||||||||
| Six
Months Ended 06/30/19 (Unaudited) |
Year
Ended 12/31/18 |
Year
Ended 12/31/17 |
Year
Ended 12/31/16 |
Year
Ended 12/31/15 |
Year
Ended 12/31/14 | ||||||
|
Net asset value, beginning of
period |
$ 1.0000 | $ 1.0000 | $ 1.0000 | $ 1.0000 | $ 1.0000 | $ 1.0000 | |||||
| Income (loss) from investment operations: | |||||||||||
|
Net investment income
(loss) |
0.0114 | 0.0173 | 0.0076 | 0.0019 | 0.0000(b)(c) | —(c) | |||||
|
Net realized gain
(loss) |
0.0000(b) | (0.0000)(b) | 0.0000(b) | 0.0000(b) | 0.0000(b) | 0.0000(b) | |||||
|
Total from investment
operations |
0.0114 | 0.0173 | 0.0076 | 0.0019 | 0.0000(b) | 0.0000(b) | |||||
| Distributions to shareholders from: | |||||||||||
|
Net investment
income |
(0.0114) | (0.0173) | (0.0076) | (0.0019) | (0.0000)(b) | — | |||||
|
Net realized
gains |
— | — | (0.0000)(b) | — | — | (0.0000)(b) | |||||
|
Total
distributions |
(0.0114) | (0.0173) | (0.0076) | (0.0019) | (0.0000)(b) | (0.0000)(b) | |||||
|
Net asset value, end of
period |
$ 1.0000 | $ 1.0000 | $ 1.0000 | $ 1.0000 | $ 1.0000 | $ 1.0000 | |||||
|
Total return
(d) |
1.15% | 1.74% | 0.76% | 0.19% | 0.00%(e) | 0.00%(e) | |||||
| Ratios and Supplemental Data: | |||||||||||
|
Net assets, end of period (in
000s) |
$11,390,574 | $9,424,507 | $12,123,627 | $12,651,785 | $10,412,966 | $8,338,818 | |||||
| Ratios to Average Net Assets: | |||||||||||
|
Total
expenses |
0.12%(f) | 0.12% | 0.12% | 0.12% | 0.12% | 0.12% | |||||
|
Net expenses
(f) |
0.12% | 0.12% | 0.12% | 0.12% | 0.04% | 0.04% | |||||
|
Net investment income
(loss) |
2.31%(f) | 1.71% | 0.76% | 0.19% | 0.00%(e) | 0.00%(e) | |||||
| (a) | The per share amounts and percentages include the Fund’s proportionate share of income and expenses of the affiliated Portfolio. |
| (b) | Amount is less than $0.00005 per share. |
| (c) | Per share numbers have been calculated using average shares outstanding, which more appropriately presents the per share data for the period. |
| (d) | Total return is calculated assuming a purchase of shares at net asset value on the first day and a sale at net asset value on the last day of each period reported. Distributions are assumed, for the purpose of this calculation, to be reinvested at net asset value per share on the respective payment dates. Total return for periods of less than one year is not annualized. Results represent past performance and are not indicative of future results. |
| (e) | Amount is less than 0.005%. |
| (f) | Annualized. |
| Fund | Classes | Commencement
of Operations |
Diversification
Classification |
| State Street Institutional Treasury Money Market Fund | Administration
Class Institutional Class Investment Class Investor Class Premier Class Service Class |
July
31, 2018 July 31, 2018 October 25, 2007 December 22, 2016 October 25, 2007 Not commenced |
Diversified |
| Actual | Hypothetical
(assuming a 5% return before expenses) | ||||||||
| Annualized
Expense Ratio |
Ending
Account Value |
Expenses
Paid During Period(a) |
Ending
Account Value |
Expenses
Paid During Period(a) | |||||
|
State Street Institutional Treasury Money Market
Fund |
|||||||||
|
Administration
Class |
0.37% | $1,010.30 | $1.84 | $1,023.00 | $1.86 | ||||
|
Institutional
Class |
0.15 | 1,011.40 | 0.75 | 1,024.10 | 0.75 | ||||
|
Investment
Class |
0.47 | 1,009.80 | 2.34 | 1,022.50 | 2.36 | ||||
|
Investor
Class |
0.20 | 1,011.10 | 1.00 | 1,023.80 | 1.00 | ||||
|
Premier
Class |
0.12 | 1,011.50 | 0.60 | 1,024.20 | 0.60 | ||||
| (a) | Expenses are equal to the Fund’s annualized net expense ratio, which includes the Fund’s proportionate share of the expenses of the Portfolio, multiplied by the average account value of the period, multiplied by 181, then divided by 365. |
| • | A report prepared by an independent third-party provider of investment company data, which includes for the Fund: |
| • | Comparisons of the Fund’s performance over the past one-, three-, five- and ten-year periods ended December 31, 2018, to the performance of an appropriate benchmark constructed by Broadridge Financial Solutions, Inc., the successor to Lipper, Inc. (“Broadridge”), for the Fund (the “Lipper Index”) and a universe of other mutual funds with similar investment objectives and policies (the “Performance Group” and/or the “Performance Universe”); |
| • | Comparisons of the Fund’s expense ratio (with detail of component expenses) to the expense ratios of a group of comparable mutual funds selected by the independent third-party data provider (the “Expense Group” and/or “Expense Universe”); |
| • | A chart showing the Fund’s historical average net assets relative to its total expenses, management fees, and non-management expenses over the past five calendar years; and |
| • | Comparisons of the Fund’s contractual management fee to the contractual management fees of comparable mutual funds at different asset levels. |
| • | Comparative information concerning fees charged by the Adviser for managing institutional accounts using investment strategies and techniques similar to those used in managing the Fund; and |
| • | Profitability analyses for (a) the Adviser with respect to the Fund and (b) affiliates of the Adviser that provide services to the Fund (“Affiliated Service Providers”). |
| • | Descriptions of the investment management services provided by the Adviser, including its investment strategies and processes; |
| • | Information concerning the allocation of brokerage; and |
| • | Information regarding the procedures and processes used to value the assets of the Fund. |
| • | Reports detailing the financial results and condition of the Adviser and its affiliates; |
| • | Descriptions of the qualifications, education and experience of the individual investment and other professionals responsible for managing the portfolio of the Fund and for Fund operations; |
| • | Information relating to compliance with and the administration of the Code of Ethics adopted by the Adviser; |
| • | A copy of the Adviser’s proxy voting policies and procedures and other information regarding the Adviser’s practices for overseeing proxy vendors; |
| • | Information concerning the resources devoted by the Adviser to overseeing compliance by the Fund and its service providers, including information concerning compliance with investment policies and restrictions and other operating policies of the Fund; |
| • | A description of the adequacy and sophistication of the Adviser’s technology and systems with respect to investment and administrative matters and a description of any material improvements or changes in technology or systems in the past year; |
| • | A description of the business continuity and disaster recovery plans of the Adviser; and |
| • | Information regarding the Adviser’s risk management processes. |
| • | Information concerning the nature, extent, quality and cost of services provided to the Fund by SSGA FM in its capacity as the Fund’s administrator (the “Administrator”); |
| • | Information concerning the nature, extent, quality and cost of various non-investment management services provided to the Fund by affiliates of the Adviser, including the custodian, sub-administrator and fund accountant of the Fund, and the role of the Adviser in managing the Fund’s relationship with these service providers; |
| • | Copies of the Advisory Agreement and agreements with other service providers of the Fund; |
| • | Draft responses to a letter from independent legal counsel to the Independent Trustees (“Independent Counsel”), reviewed prior to such date by Independent Counsel, requesting specific information from each of: |
| • | SSGA FM, in its capacity as the Fund’s Adviser and Administrator, with respect to its operations relating to the Fund and its approximate profit margins from such operations for the calendar year ended December 31, 2018; and the relevant operations of other affiliated service providers to the Fund, together with their approximate profit margins from such relevant operations for the calendar year ended December 31, 2018; |
| • | State Street Bank and Trust Company (“State Street”), the sub-administrator, custodian and shareholder servicer for the Fund, with respect to its operations relating to the Fund; and |
| • | State Street Global Advisors Funds Distributors, LLC, the principal underwriter and distributor of the shares of the Fund (the “Distributor”), with respect to its operations relating to the Fund, together with the Fund’s related distribution plans and arrangements under Rule 12b-1 of the 1940 Act; |
| • | Information from SSGA FM, State Street and the Distributor with respect to the Trust providing any material changes to the previous information supplied in response to the letter from Independent Counsel prior to the executive session of the Board on May 15, 2019; |
| • | Materials provided by Broadridge, circulated to the Independent Trustees and to Independent Counsel, with respect to the Fund; and |
| • | A summary of the foregoing materials prepared by Independent Counsel. |
State Street Bank and Trust Company
P.O. Box 5049
Boston, MA 02206
| State Street Treasury Money Market Portfolio |
|
|
1 |
|
|
2 |
|
|
3 |
|
|
4 |
|
|
5 |
|
|
6 |
|
|
7 |
|
|
10 |
| % of Net Assets | |||
| Treasury Debt | 101.2% | ||
| Liabilities in Excess of Other Assets | (1.2) | ||
| TOTAL | 100.0% |
| % of Net Assets | |||
| 2 to 30 Days | 30.4% | ||
| 31 to 60 Days | 26.6 | ||
| 61 to 90 Days | 7.9 | ||
| Over 90 Days | 36.3 | ||
| Total | 101.2% | ||
| Average days to maturity | 40 | ||
| Weighted average life | 98 |
| Name of Issuer and Title of Issue | Interest Rate | Next Rate Reset Date | Maturity Date | Principal Amount | Value | |||||
| TREASURY DEBT—101.2% | ||||||||||
|
U.S. Treasury Bill
(a) |
2.030% | 12/26/2019 | 12/26/2019 | $ 211,950,000 | $ 209,813,711 | |||||
|
U.S. Treasury Bill
(a) |
2.105% | 08/20/2019 | 08/20/2019 | 550,600,000 | 548,998,593 | |||||
|
U.S. Treasury Bill
(a) |
2.120% | 08/27/2019 | 08/27/2019 | 300,400,000 | 299,409,348 | |||||
|
U.S. Treasury Bill
(a) |
2.133% | 12/19/2019 | 12/19/2019 | 130,500,000 | 129,179,072 | |||||
|
U.S. Treasury Bill
(a) |
2.195% | 08/13/2019 | 08/13/2019 | 373,750,000 | 372,769,660 | |||||
|
U.S. Treasury Bill
(a) |
2.300% | 08/06/2019 | 08/06/2019 | 251,600,000 | 251,021,320 | |||||
|
U.S. Treasury Bill
(a) |
2.330% | 07/23/2019 | 07/23/2019 | 739,439,000 | 738,418,728 | |||||
|
U.S. Treasury Bill
(a) |
2.330% | 07/30/2019 | 07/30/2019 | 492,541,000 | 491,669,260 | |||||
|
U.S. Treasury Bill
(a) |
2.340% | 07/16/2019 | 07/16/2019 | 420,537,000 | 420,137,724 | |||||
|
U.S. Treasury Bill
(a) |
2.355% | 11/14/2019 | 11/14/2019 | 201,730,000 | 199,934,752 | |||||
|
U.S. Treasury Bill
(a) |
2.373% | 08/15/2019 | 08/15/2019 | 145,743,000 | 145,352,895 | |||||
|
U.S. Treasury Bill
(a) |
2.380% | 07/09/2019 | 07/09/2019 | 500,600,000 | 500,340,250 | |||||
|
U.S. Treasury Bill
(a) |
2.380% | 10/03/2019 | 10/03/2019 | 294,700,000 | 292,943,372 | |||||
|
U.S. Treasury Bill
(a) |
2.385% | 11/07/2019 | 11/07/2019 | 234,000,000 | 232,000,482 | |||||
|
U.S. Treasury Bill
(a) |
2.390% | 10/17/2019 | 10/17/2019 | 177,550,000 | 176,276,966 | |||||
|
U.S. Treasury Bill
(a) |
2.393% | 10/10/2019 | 10/10/2019 | 220,200,000 | 218,721,219 | |||||
|
U.S. Treasury Bill
(a) |
2.395% | 10/31/2019 | 10/31/2019 | 207,050,000 | 205,369,502 | |||||
|
U.S. Treasury Bill
(a) |
2.415% | 09/26/2019 | 09/26/2019 | 316,950,000 | 315,266,482 | |||||
|
U.S. Treasury Bill
(a) |
2.440% | 08/08/2019 | 08/08/2019 | 50,625,000 | 50,494,613 | |||||
|
U.S. Treasury Bill
(a) |
2.445% | 09/19/2019 | 09/19/2019 | 324,042,000 | 322,445,149 | |||||
|
U.S. Treasury Bill
(a) |
2.450% | 07/25/2019 | 07/25/2019 | 52,250,000 | 52,164,658 | |||||
|
U.S. Treasury Bill
(a) |
2.450% | 08/01/2019 | 08/01/2019 | 259,711,000 | 259,175,043 | |||||
|
U.S. Treasury Bill
(a) |
2.453% | 09/12/2019 | 09/12/2019 | 198,950,000 | 198,037,658 | |||||
|
U.S. Treasury Bill
(a) |
2.455% | 08/22/2019 | 08/22/2019 | 287,820,000 | 286,842,707 | |||||
|
U.S. Treasury Bill
(a) |
2.455% | 08/29/2019 | 08/29/2019 | 203,550,000 | 202,792,481 | |||||
|
U.S. Treasury Bill
(a) |
2.455% | 09/05/2019 | 09/05/2019 | 150,000,000 | 149,390,487 | |||||
|
U.S. Treasury Bill
(a) |
2.460% | 07/18/2019 | 07/18/2019 | 304,400,000 | 304,053,166 | |||||
|
U.S. Treasury Bill
(a) |
2.470% | 07/11/2019 | 07/11/2019 | 343,211,000 | 342,983,707 | |||||
|
U.S. Treasury Bill
(a) |
2.505% | 07/05/2019 | 07/05/2019 | 307,875,000 | 307,792,075 | |||||
|
U.S. Treasury Bill
(a) |
2.805% | 07/02/2019 | 07/02/2019 | 606,884,000 | 606,846,149 | |||||
|
U.S. Treasury Note, 3 Month USD
MMY(b) |
2.096% | 06/29/2019 | 01/31/2020 | 647,000,000 | 646,908,654 | |||||
|
U.S. Treasury Note, 3 Month USD MMY +
0.03%(b) |
2.129% | 06/29/2019 | 04/30/2020 | 506,400,000 | 506,383,796 | |||||
|
U.S. Treasury Note, 3 Month USD MMY +
0.04%(b) |
2.139% | 06/29/2019 | 07/31/2020 | 341,700,000 | 341,599,966 | |||||
|
U.S. Treasury Note, 3 Month USD MMY +
0.05%(b) |
2.141% | 06/29/2019 | 10/31/2020 | 198,955,000 | 198,810,969 | |||||
|
U.S. Treasury Note, 3 Month USD MMY +
0.05%(b) |
2.144% | 06/29/2019 | 10/31/2019 | 619,175,000 | 619,218,878 | |||||
|
U.S. Treasury Note, 3 Month USD MMY +
0.06%(b) |
2.156% | 06/29/2019 | 07/31/2019 | 738,800,000 | 738,836,469 | |||||
|
U.S. Treasury Note, 3 Month USD MMY +
0.12%(b) |
2.211% | 06/29/2019 | 01/31/2021 | 100,000,000 | 99,898,640 | |||||
|
U.S. Treasury Note, 3 Month USD MMY +
0.14%(b) |
2.235% | 06/29/2019 | 04/30/2021 | 103,900,000 | 103,761,780 | |||||
|
U.S. Treasury Note
(a) |
2.403% | 07/31/2019 | 07/31/2019 | 99,500,000 | 99,435,793 | |||||
|
U.S. Treasury Note
(a) |
2.412% | 10/31/2019 | 10/31/2019 | 193,000,000 | 192,262,301 | |||||
|
U.S. Treasury Note
(a) |
2.440% | 09/30/2019 | 09/30/2019 | 85,500,000 | 85,308,859 | |||||
|
U.S. Treasury Note
(a) |
2.452% | 10/31/2019 | 10/31/2019 | 33,600,000 | 33,495,038 | |||||
|
U.S. Treasury Note
(a) |
2.469% | 07/31/2019 | 07/31/2019 | 25,000,000 | 24,977,508 | |||||
|
U.S. Treasury Note
(a) |
2.609% | 07/31/2019 | 07/31/2019 | 25,600,000 | 25,566,616 | |||||
|
TOTAL INVESTMENTS –101.2%
(c)(d) |
12,547,106,496 | |||||||||
|
Liabilities in Excess of Other Assets —(1.2)%
|
(149,368,439) | |||||||||
|
NET ASSETS –100.0%
|
$ 12,397,738,057 |
| (a) | Rate shown is the discount rate at time of purchase. |
| (b) | Variable Rate Security - Interest rate shown is rate in effect at June 30, 2019. For securities based on a published reference rate and spread, the reference rate and spread are indicated in the description above. |
| (c) | Also represents the cost for federal tax purposes. |
| (d) | Unless otherwise indicated, the values of the securities of the Portfolio are determined based on Level 2 inputs (Note 2). |
| ASSETS | |
|
Investments in unaffiliated issuers, at value and
cost |
$12,547,106,496 |
|
Cash |
482,336,468 |
|
Receivable for investments
sold |
99,745,000 |
|
Interest receivable — unaffiliated
issuers |
18,738,998 |
|
TOTAL ASSETS
|
13,147,926,962 |
| LIABILITIES | |
|
Payable for investments
purchased |
749,549,535 |
|
Advisory and administrator fee
payable |
421,246 |
|
Custody, sub-administration and transfer agent fees
payable |
173,157 |
|
Trustees’ fees and expenses
payable |
146 |
|
Professional fees
payable |
32,891 |
|
Printing fees
payable |
8,753 |
|
Accrued expenses and other
liabilities |
3,177 |
|
TOTAL LIABILITIES
|
750,188,905 |
|
NET ASSETS
|
$12,397,738,057 |
| INVESTMENT INCOME | |
|
Interest income — unaffiliated
issuers |
$130,066,241 |
| EXPENSES | |
|
Advisory and administrator
fee |
2,678,334 |
|
Custodian, sub-administrator and transfer agent
fees |
673,279 |
|
Trustees’ fees and expenses
|
131,121 |
|
Professional
fees |
82,656 |
|
Printing and postage
fees |
2,546 |
|
Insurance
expense |
2,829 |
|
Miscellaneous
expenses |
5,140 |
|
TOTAL
EXPENSES |
3,575,905 |
|
NET INVESTMENT INCOME
(LOSS) |
$126,490,336 |
| REALIZED GAIN (LOSS) | |
| Net realized gain (loss) on: | |
|
Investments — unaffiliated
issuers |
114,132 |
|
NET INCREASE (DECREASE) IN NET ASSETS FROM
OPERATIONS |
$126,604,468 |
| Six
Months Ended 6/30/19 (Unaudited) |
Year
Ended 12/31/18 | ||
| INCREASE (DECREASE) IN NET ASSETS FROM OPERATIONS: | |||
|
Net investment income
(loss) |
$ 126,490,336 | $ 201,067,470 | |
|
Net realized gain
(loss) |
114,132 | (90,111) | |
|
Net increase (decrease) in net assets resulting from
operations |
126,604,468 | 200,977,359 | |
| CAPITAL TRANSACTIONS | |||
|
Contributions |
10,664,192,110 | 23,045,517,549 | |
|
Withdrawals |
(8,766,027,234) | (25,879,128,300) | |
|
Net increase (decrease) in net assets from capital transactions
|
1,898,164,876 | (2,833,610,751) | |
|
Net increase (decrease) in net assets during the
period |
2,024,769,344 | (2,632,633,392) | |
|
Net assets at beginning of
period |
10,372,968,713 | 13,005,602,105 | |
|
NET ASSETS AT END OF
PERIOD |
$12,397,738,057 | $ 10,372,968,713 |
| Six
Months Ended 6/30/19 (Unaudited) |
Year
Ended 12/31/18 |
Year
Ended 12/31/17 |
Year
Ended 12/31/16 |
Year
Ended 12/31/15 |
Year
Ended 12/31/14 | ||||||
|
Total return
(a) |
1.19% | 1.80% | 0.73% | 0.25% | (0.04)% | (0.02)% | |||||
| Ratios and Supplemental Data: | |||||||||||
|
Net assets, end of period (in
000s) |
$12,397,738 | $10,372,969 | $13,005,602 | $14,004,301 | $11,837,128 | $10,247,460 | |||||
| Ratios to average net assets: | |||||||||||
|
Total
expenses |
0.07%(b) | 0.07% | 0.07% | 0.07% | 0.07% | 0.07% | |||||
|
Net investment income
(loss) |
2.36%(b) | 1.76% | 0.81% | 0.25% | (0.03)% | (0.02)% |
| (a) | Results represent past performance and are not indicative of future results. Total return for periods of less than one year are not annualized. |
| (b) | Annualized. |
| Actual | Hypothetical
(assuming a 5% return before expenses) | ||||||||
| Annualized
Expense Ratio |
Ending
Account Value |
Expenses
Paid During Period(a) |
Ending
Account Value |
Expenses
Paid During Period(a) | |||||
|
State Street Treasury Money Market
Portfolio |
0.07% | $1,011.90 | $0.35 | $1,024.40 | $0.35 | ||||
| (a) | Expenses are equal to the Portfolio’s annualized net expense ratio multiplied by the average account value of the period, multiplied by 181, then divided by 365. |
| • | A report prepared by an independent third-party provider of investment company data, which includes for the feeder fund for which the Portfolio serves as the master fund in a master-feeder structure (the “Fund”): |
| • | Comparisons of the Fund’s performance over the past one-, three-, five- and ten-year periods ended December 31, 2018, to the performance of an appropriate benchmark constructed by Broadridge Financial Solutions, Inc., the successor to Lipper, Inc. (“Broadridge”), for the Fund (the “Lipper Index”) and a universe of other mutual funds with similar investment objectives and policies (the “Performance Group” and/or the “Performance Universe”); |
| • | Comparisons of the Fund’s expense ratio (with detail of component expenses) to the expense ratios of a group of comparable mutual funds selected by the independent third-party data provider (the “Expense Group” and/or “Expense Universe”); |
| • | A chart showing the Fund’s historical average net assets relative to its total expenses, management fees, and non-management expenses over the past five calendar years; and |
| • | Comparisons of the Fund’s contractual management fee to the contractual management fees of comparable mutual funds at different asset levels. |
| • | Comparative information concerning fees charged by the Adviser for managing institutional accounts using investment strategies and techniques similar to those used in managing the Fund; and |
| • | Profitability analyses for (a) the Adviser with respect to the Portfolio and (b) affiliates of the Adviser that provide services to the Portfolio (“Affiliated Service Providers”). |
| • | Descriptions of the investment management services provided by the Adviser, including its investment strategies and processes; |
| • | Information concerning the allocation of brokerage; and |
| • | Information regarding the procedures and processes used to value the assets of the Portfolio. |
| • | Reports detailing the financial results and condition of the Adviser and its affiliates; |
| • | Descriptions of the qualifications, education and experience of the individual investment and other professionals responsible for managing the portfolio of the Portfolio and for Portfolio operations; |
| • | Information relating to compliance with and the administration of the Code of Ethics adopted by the Adviser; |
| • | A copy of the Adviser’s proxy voting policies and procedures and other information regarding the Adviser’s practices for overseeing proxy vendors; |
| • | Information concerning the resources devoted by the Adviser to overseeing compliance by the Portfolio and its service providers, including information concerning compliance with investment policies and restrictions and other operating policies of the Portfolio; |
| • | A description of the adequacy and sophistication of the Adviser’s technology and systems with respect to investment and administrative matters and a description of any material improvements or changes in technology or systems in the past year; |
| • | A description of the business continuity and disaster recovery plans of the Adviser; and |
| • | Information regarding the Adviser’s risk management processes. |
| • | Information concerning the nature, extent, quality and cost of services provided to the Portfolio by SSGA FM in its capacity as the Portfolio’s administrator (the “Administrator”); |
| • | Information concerning the nature, extent, quality and cost of various non-investment management services provided to the Portfolio by affiliates of the Adviser, including the custodian, sub-administrator, transfer agent and fund accountant of the Portfolio, and the role of the Adviser in managing the Portfolio’s relationship with these service providers; |
| • | Copies of the Advisory Agreement and agreements with other service providers of the Portfolio; |
| • | Draft responses to a letter from independent legal counsel to the Independent Trustees (“Independent Counsel”), reviewed prior to such date by Independent Counsel, requesting specific information from each of: |
| • | SSGA FM, in its capacity as the Portfolio’s Adviser and Administrator, with respect to its operations relating to the Portfolio and its approximate profit margins from such operations for the calendar year ended December 31, 2018; and the relevant operations of other affiliated service providers to the Portfolio, together with their approximate profit margins from such relevant operations for the calendar year ended December 31, 2018; |
| • | State Street Bank and Trust Company (“State Street”), the sub-administrator, custodian and transfer agent for the Portfolio, with respect to its operations relating to the Portfolio; and |
| • | State Street Global Advisors Funds Distributors, LLC, the principal underwriter and distributor of the shares of the Portfolio (the “Distributor”), with respect to its operations relating to the Portfolio; |
| • | Information from SSGA FM, State Street and the Distributor with respect to the Trust providing any material changes to the previous information supplied in response to the letter from Independent Counsel prior to the executive session of the Board on May 15, 2019; |
| • | Materials provided by Broadridge, circulated to the Independent Trustees and to Independent Counsel, with respect to the Fund; and |
| • | A summary of the foregoing materials prepared by Independent Counsel. |
State Street Bank and Trust Company
P.O. Box 5049
Boston, MA 02206
| State Street Institutional Treasury Plus Money Market Fund |

|
|
1 |
|
|
2 |
|
|
3 |
|
|
5 |
|
|
11 |
|
|
15 |
| ASSETS | |
|
Investment in corresponding affiliated Portfolio, at value and
cost |
$15,325,719,092 |
|
Receivable for fund shares
sold |
346 |
|
Receivable from
Adviser |
745 |
|
TOTAL ASSETS
|
15,325,720,183 |
| LIABILITIES | |
|
Payable for fund shares
repurchased |
5,125,645 |
|
Administration fees
payable |
549,074 |
|
Shareholder servicing fee payable
|
211,988 |
|
Distribution fees
payable |
4,028 |
|
Transfer agent fees
payable |
1,753 |
|
Distribution
payable |
3,067,304 |
|
Registration and filing fees
payable |
186,980 |
|
Professional fees
payable |
12,414 |
|
Printing fees
payable |
13,231 |
|
Accrued expenses and other
liabilities |
35,351 |
|
TOTAL LIABILITIES
|
9,207,768 |
|
NET ASSETS
|
$15,316,512,415 |
| NET ASSETS CONSIST OF: | |
|
Paid-in
Capital |
$15,316,499,570 |
|
Total distributable earnings
(loss) |
12,845 |
|
NET ASSETS
|
$15,316,512,415 |
| Administration Class | |
|
Net
Assets |
$ 50,000 |
|
Shares
Outstanding |
50,000 |
|
Net asset value, offering and redemption price per
share |
$ 1.00 |
| Institutional Class | |
|
Net
Assets |
$ 228,729,141 |
|
Shares
Outstanding |
228,728,938 |
|
Net asset value, offering and redemption price per
share |
$ 1.00 |
| Investment Class | |
|
Net
Assets |
$ 53,271,235 |
|
Shares
Outstanding |
53,278,698 |
|
Net asset value, offering and redemption price per
share |
$ 1.00 |
| Investor Class | |
|
Net
Assets |
$ 758,479,151 |
|
Shares
Outstanding |
758,479,442 |
|
Net asset value, offering and redemption price per
share |
$ 1.00 |
| Premier Class | |
|
Net
Assets |
$ 9,649,779,679 |
|
Shares
Outstanding |
9,649,913,422 |
|
Net asset value, offering and redemption price per
share |
$ 1.00 |
| Trust Class | |
|
Net
Assets |
$ 4,626,203,209 |
|
Shares
Outstanding |
4,626,515,834 |
|
Net asset value, offering and redemption price per
share |
$ 1.00 |
| INCOME AND EXPENSES ALLOCATED FROM AFFILIATED PORTFOLIO | |
|
Interest income allocated from affiliated
Portfolio |
$170,284,715 |
|
Expenses allocated from affiliated
Portfolio |
(4,600,506) |
|
TOTAL INVESTMENT INCOME (LOSS) ALLOCATED FROM AFFILIATED
PORTFOLIO |
165,684,209 |
| EXPENSES | |
|
Administration
fees |
3,482,647 |
| Shareholder servicing fees | |
|
Administration
Class |
49 |
|
Institutional
Class |
40,067 |
|
Investment
Class |
69,105 |
|
Investor
Class |
121,892 |
|
Trust
Class |
1,218,493 |
| Distribution fees | |
|
Administration
Class |
13 |
|
Investment
Class |
27,642 |
|
Custodian
fees |
55,621 |
|
Trustees’ fees and expenses
|
9,034 |
|
Transfer agent
fees |
4,015 |
|
Registration and filing
fees |
59,807 |
|
Professional
fees |
19,694 |
|
Printing and postage
fees |
14,113 |
|
Insurance
expense |
29,925 |
|
Miscellaneous
expenses |
40,146 |
|
TOTAL
EXPENSES |
5,192,263 |
|
NET INVESTMENT INCOME
(LOSS) |
$160,491,946 |
| REALIZED GAIN (LOSS) | |
| Net realized gain (loss) on: | |
|
Investments allocated from affiliated
Portfolio |
17,095 |
|
NET INCREASE (DECREASE) IN NET ASSETS FROM
OPERATIONS |
$160,509,041 |
| Six
Months Ended 6/30/19 (Unaudited) |
Year
Ended 12/31/18(a) | ||
| INCREASE (DECREASE) IN NET ASSETS FROM OPERATIONS: | |||
|
Net investment income
(loss) |
$ 160,491,946 | $ 182,781,615 | |
|
Net realized gain
(loss) |
17,095 | 947 | |
|
Net increase (decrease) in net assets resulting from
operations |
160,509,041 | 182,782,562 | |
| DISTRIBUTIONS TO SHAREHOLDERS: | |||
|
Administration
Class |
(515) | (378) | |
|
Institutional
Class |
(3,061,595) | (1,201,954) | |
|
Investment
Class |
(545,512) | (534,006) | |
|
Investor
Class |
(3,414,869) | (4,282,357) | |
|
Premier
Class |
(104,066,090) | (92,650,963) | |
|
Trust
Class |
(49,403,364) | (84,114,314) | |
|
Total distributions to shareholders
|
(160,491,945) | (182,783,972) | |
| FROM BENEFICIAL INTEREST TRANSACTIONS: | |||
| Administration Class | |||
|
Shares
sold |
— | 50,000 | |
|
Net increase (decrease) from capital share
transactions |
— | 50,000 | |
| Institutional Class | |||
|
Shares
sold |
1,529,388,438 | 1,512,358,000 | |
|
Shares
redeemed |
(1,395,213,500) | (1,417,804,000) | |
|
Net increase (decrease) from capital share
transactions |
134,174,938 | 94,554,000 | |
| Investment Class | |||
|
Shares
sold |
44,333,699 | 101,688,338 | |
|
Reinvestment of
distributions |
111,093 | 139,542 | |
|
Shares
redeemed |
(60,986,113) | (51,257,110) | |
|
Net increase (decrease) from capital share
transactions |
(16,541,321) | 50,570,770 | |
| Investor Class | |||
|
Shares
sold |
2,630,498,054 | 3,566,333,132 | |
|
Reinvestment of
distributions |
3,414,869 | 4,277,715 | |
|
Shares
redeemed |
(2,650,319,270) | (3,124,489,496) | |
|
Net increase (decrease) from capital share
transactions |
(16,406,347) | 446,121,351 | |
| Premier Class | |||
|
Shares
sold |
38,940,376,775 | 61,825,178,064 | |
|
Reinvestment of
distributions |
92,964,201 | 83,017,919 | |
|
Shares
redeemed |
(37,785,621,219) | (57,506,625,170) | |
|
Net increase (decrease) from capital share
transactions |
1,247,719,757 | 4,401,570,813 | |
| Trust Class | |||
|
Shares
sold |
17,203,235,099 | 19,936,338,258 | |
|
Reinvestment of
distributions |
45,981,479 | 75,701,491 | |
|
Shares
redeemed |
(17,104,428,721) | (22,433,895,799) | |
|
Net increase (decrease) from capital share
transactions |
144,787,857 | (2,421,856,050) | |
|
Net increase (decrease) in net assets from beneficial interest transactions
|
1,493,734,884 | 2,571,010,884 | |
|
Net increase (decrease) in net assets during the
period |
1,493,751,980 | 2,571,009,474 | |
|
Net assets at beginning of
period |
13,822,760,435 | 11,251,750,961 | |
|
NET ASSETS AT END OF
PERIOD |
$ 15,316,512,415 | $ 13,822,760,435 | |
| SHARES OF BENEFICIAL INTEREST: | |||
| Administration Class | |||
|
Shares
sold |
— | 50,000 | |
|
Net increase (decrease) from share
transactions |
— | 50,000 | |
| Institutional Class | |||
|
Shares
sold |
1,529,388,438 | 1,512,358,000 | |
|
Shares
redeemed |
(1,395,213,500) | (1,417,804,000) | |
|
Net increase (decrease) from share
transactions |
134,174,938 | 94,554,000 | |
| Investment Class | |||
|
Shares
sold |
44,333,699 | 101,688,338 | |
|
Reinvestment of
distributions |
111,093 | 139,542 | |
|
Shares
redeemed |
(60,986,113) | (51,257,110) | |
|
Net increase (decrease) from share
transactions |
(16,541,321) | 50,570,770 |
| Six
Months Ended 6/30/19 (Unaudited) |
Year
Ended 12/31/18(a) | ||
| Investor Class | |||
|
Shares
sold |
2,630,498,054 | $ 3,566,333,132 | |
|
Reinvestment of
distributions |
3,414,869 | 4,277,715 | |
|
Shares
redeemed |
(2,650,319,270) | (3,124,489,496) | |
|
Net increase (decrease) from share
transactions |
(16,406,347) | 446,121,351 | |
| Premier Class | |||
|
Shares
sold |
38,940,376,775 | 61,825,178,064 | |
|
Reinvestment of
distributions |
92,964,201 | 83,017,919 | |
|
Shares
redeemed |
(37,785,621,219) | (57,506,625,170) | |
|
Net increase (decrease) from share
transactions |
1,247,719,757 | 4,401,570,813 | |
| Trust Class | |||
|
Shares
sold |
17,203,235,100 | 19,936,338,258 | |
|
Reinvestment of
distributions |
45,981,479 | 75,701,491 | |
|
Shares
redeemed |
(17,104,428,721) | (22,433,895,799) | |
|
Net increase (decrease) from share
transactions |
144,787,858 | (2,421,856,050) |
| (a) | For Administration Class shares and Institutional Class shares, data is for the period July 30, 2018 (inception date) through December 31, 2018. |
| Administration Class(a) | |||
| Six
Months Ended 06/30/19 (Unaudited) |
For
the Period 07/31/18*- 12/31/18 | ||
|
Net asset value, beginning of
period |
$ 1.0000 | $ 1.0000 | |
| Income (loss) from investment operations: | |||
|
Net investment income
(loss) |
0.0103 | 0.0076 | |
|
Net realized gain
(loss) |
0.0000(b) | — | |
|
Total from investment
operations |
0.0103 | 0.0076 | |
| Distributions to shareholders from: | |||
|
Net investment
income |
(0.0103) | (0.0076) | |
|
Total
distributions |
(0.0103) | (0.0076) | |
|
Net asset value, end of
period |
$ 1.0000 | $ 1.0000 | |
|
Total return
(c) |
1.03% | 0.76% | |
| Ratios and Supplemental Data: | |||
|
Net assets, end of period (in
000s) |
$ 50 | $ 50 | |
| Ratios to Average Net Assets: | |||
|
Total
expenses |
0.37%(d) | 0.37%(d) | |
|
Net
expenses |
0.37%(d) | 0.37%(d) | |
|
Net investment income
(loss) |
2.07%(d) | 1.78%(d) | |
| * | Commencement of operations. |
| (a) | The per share amounts and percentages include the Fund’s proportionate share of income and expenses of the affiliated Portfolio. |
| (b) | Amount is less than $0.00005 per share. |
| (c) | Total return is calculated assuming a purchase of shares at net asset value on the first day and a sale at net asset value on the last day of each period reported. Distributions are assumed, for the purpose of this calculation, to be reinvested at net asset value per share on the respective payment dates. Total return for periods of less than one year is not annualized. Results represent past performance and are not indicative of future results. |
| (d) | Annualized. |
| Institutional Class(a) | |||
| Six
Months Ended 6/30/19 (Unaudited) |
For
the Period 7/31/18* 12/31/18 | ||
|
Net asset value, beginning of
period |
$ 1.0000 | $ 1.0000 | |
| Income (loss) from investment operations: | |||
|
Net investment income
(loss) |
0.0114 | 0.0085 | |
|
Net realized gain
(loss) |
0.0000(b) | — | |
|
Total from investment
operations |
0.0114 | 0.0085 | |
| Distributions to shareholders from: | |||
|
Net investment
income |
(0.0114) | (0.0085) | |
|
Total
distributions |
(0.0114) | (0.0085) | |
|
Net asset value, end of
period |
$ 1.0000 | $ 1.0000 | |
|
Total return
(c) |
1.14% | 0.85% | |
| Ratios and Supplemental Data: | |||
|
Net assets, end of period (in
000s) |
$228,729 | $ 94,554 | |
| Ratios to Average Net Assets: | |||
|
Total
expenses |
0.15%(d) | 0.15%(d) | |
|
Net
expenses |
0.15%(d) | 0.15%(d) | |
|
Net investment income
(loss) |
2.29%(d) | 2.04%(d) | |
| * | Commencement of operations. |
| (a) | The per share amounts and percentages include the Fund’s proportionate share of income and expenses of the affiliated Portfolio. |
| (b) | Amount is less than $0.00005 per share. |
| (c) | Total return is calculated assuming a purchase of shares at net asset value on the first day and a sale at net asset value on the last day of each period reported. Distributions are assumed, for the purpose of this calculation, to be reinvested at net asset value per share on the respective payment dates. Total return for periods of less than one year is not annualized. Results represent past performance and are not indicative of future results. |
| (d) | Annualized. |
| Investment Class(a) | |||||||||||
| Six
Months Ended 06/30/19 (Unaudited) |
Year
Ended 12/31/18 |
Year
Ended 12/31/17 |
Year
Ended 12/31/16 |
Year
Ended 12/31/15 |
Year
Ended 12/31/14 | ||||||
|
Net asset value, beginning of
period |
$ 1.0000 | $ 1.0000 | $ 1.0000 | $ 1.0000 | $1.0000 | $1.0000 | |||||
| Income (loss) from investment operations: | |||||||||||
|
Net investment income
(loss) |
0.0102 | 0.0139 | 0.0042 | 0.0000(b) | 0.0000(b)(c) | 0.0000(b)(c) | |||||
|
Net realized gain
(loss) |
0.0000(b) | — | 0.0000(b) | 0.0000(b) | 0.0000(b) | 0.0000(b) | |||||
|
Total from investment
operations |
0.0102 | 0.0139 | 0.0042 | 0.0000(b) | 0.0000(b) | 0.0000(b) | |||||
| Distributions to shareholders from: | |||||||||||
|
Net investment
income |
(0.0102) | (0.0139) | (0.0042) | (0.0000)(b) | — | — | |||||
|
Net realized
gains |
— | — | (0.0000)(b) | — | — | — | |||||
|
Total
distributions |
(0.0102) | (0.0139) | (0.0042) | (0.0000)(b) | — | — | |||||
|
Net asset value, end of
period |
$ 1.0000 | $ 1.0000 | $ 1.0000 | $ 1.0000 | $1.0000 | $1.0000 | |||||
|
Total return
(d) |
1.02% | 1.40% | 0.42% | 0.00%(e) | 0.00%(e) | 0.00%(e) | |||||
| Ratios and Supplemental Data: | |||||||||||
|
Net assets, end of period (in
000s) |
$ 53,271 | $ 69,812 | $ 19,242 | $ 48,170 | $60,041 | $74,781 | |||||
| Ratios to Average Net Assets: | |||||||||||
|
Total
expenses |
0.47%(f) | 0.47% | 0.47% | 0.49% | 0.49% | 0.48% | |||||
|
Net
expenses |
0.47%(f) | 0.47% | 0.47% | 0.31% | 0.06% | 0.05% | |||||
|
Net investment income
(loss) |
1.98%(f) | 1.54% | 0.36% | 0.00%(e) | 0.00%(e) | 0.00%(e) | |||||
| (a) | The per share amounts and percentages include the Fund’s proportionate share of income and expenses of the affiliated Portfolio. |
| (b) | Amount is less than $0.00005 per share. |
| (c) | Per share numbers have been calculated using average shares outstanding, which more appropriately presents the per share data for the period. |
| (d) | Total return is calculated assuming a purchase of shares at net asset value on the first day and a sale at net asset value on the last day of each period reported. Distributions are assumed, for the purpose of this calculation, to be reinvested at net asset value per share on the respective payment dates. Total return for periods of less than one year is not annualized. Results represent past performance and are not indicative of future results. |
| (e) | Amount is less than 0.005%. |
| (f) | Annualized. |
| Investor Class(a) | |||||||
| Six
Months Ended 06/30/19 (Unaudited) |
Year
Ended 12/31/18 |
Year
Ended 12/31/17 |
For
the Period 10/14/16* - 12/31/16 | ||||
|
Net asset value, beginning of
period |
$ 1.0000 | $ 1.0000 | $ 1.0000 | $ 1.0000 | |||
| Income (loss) from investment operations: | |||||||
|
Net investment income
(loss) |
0.0111 | 0.0166 | 0.0069 | 0.0004 | |||
|
Net realized gain
(loss) |
0.0000(b) | — | 0.0000(b) | 0.0000(b) | |||
|
Total from investment
operations |
0.0111 | 0.0166 | 0.0069 | 0.0004 | |||
| Distributions to shareholders from: | |||||||
|
Net investment
income |
(0.0111) | (0.0166) | (0.0069) | (0.0004) | |||
|
Net realized
gains |
— | — | (0.0000)(b) | — | |||
|
Total
distributions |
(0.0111) | (0.0166) | (0.0069) | (0.0004) | |||
|
Net asset value, end of
period |
$ 1.0000 | $ 1.0000 | $ 1.0000 | $ 1.0000 | |||
|
Total return
(c) |
1.12% | 1.67% | 0.69% | 0.04% | |||
| Ratios and Supplemental Data: | |||||||
|
Net assets, end of period (in
000s) |
$758,479 | $774,885 | $328,764 | $101,461 | |||
| Ratios to Average Net Assets: | |||||||
|
Total
expenses |
0.20%(d) | 0.20% | 0.20% | 0.20%(d) | |||
|
Net
expenses |
0.20%(d) | 0.20% | 0.20% | 0.20%(d) | |||
|
Net investment income
(loss) |
2.24%(d) | 1.67% | 0.70% | 0.19%(d) | |||
| * | Commencement of operations. |
| (a) | The per share amounts and percentages include the Fund’s proportionate share of income and expenses of the affiliated Portfolio. |
| (b) | Amount is less than $0.00005 per share. |
| (c) | Total return is calculated assuming a purchase of shares at net asset value on the first day and a sale at net asset value on the last day of each period reported. Distributions are assumed, for the purpose of this calculation, to be reinvested at net asset value per share on the respective payment dates. Total return for periods of less than one year is not annualized. Results represent past performance and are not indicative of future results. |
| (d) | Annualized. |
| Premier Class(a) | |||||||||||
| Six
Months Ended 06/30/19 (Unaudited) |
Year
Ended 12/31/18 |
Year
Ended 12/31/17 |
Year
Ended 12/31/16 |
Year
Ended 12/31/15 |
Year
Ended 12/31/14 | ||||||
|
Net asset value, beginning of
period |
$ 1.0000 | $ 1.0000 | $ 1.0000 | $ 1.0000 | $ 1.0000 | $ 1.0000 | |||||
| Income (loss) from investment operations: | |||||||||||
|
Net investment income
(loss) |
0.0115 | 0.0174 | 0.0077 | 0.0019 | 0.0000(b)(c) | 0.0000(b)(c) | |||||
|
Net realized gain
(loss) |
0.0000(b) | — | 0.0000(b) | 0.0000(b) | 0.0000(b) | 0.0000(b) | |||||
|
Total from investment
operations |
0.0115 | 0.0174 | 0.0077 | 0.0019 | 0.0000(b) | 0.0000(b) | |||||
| Distributions to shareholders from: | |||||||||||
|
Net investment
income |
(0.0115) | (0.0174) | (0.0077) | (0.0019) | (0.0000)(b) | — | |||||
|
Net realized
gains |
— | — | (0.0000)(b) | — | — | — | |||||
|
Total
distributions |
(0.0115) | (0.0174) | (0.0077) | (0.0019) | (0.0000)(b) | — | |||||
|
Net asset value, end of
period |
$ 1.0000 | $ 1.0000 | $ 1.0000 | $ 1.0000 | $ 1.0000 | $ 1.0000 | |||||
|
Total return
(d) |
1.16% | 1.75% | 0.77% | 0.19% | 0.00%(e) | 0.00%(e) | |||||
| Ratios and Supplemental Data: | |||||||||||
|
Net assets, end of period (in
000s) |
$9,649,780 | $8,402,049 | $4,000,478 | $2,515,246 | $1,684,652 | $2,690,959 | |||||
| Ratios to Average Net Assets: | |||||||||||
|
Total
expenses |
0.12%(f) | 0.12% | 0.12% | 0.14% | 0.14% | 0.13% | |||||
|
Net
expenses |
0.12%(f) | 0.12% | 0.12% | 0.12% | 0.06% | 0.05% | |||||
|
Net investment income
(loss) |
2.33%(f) | 1.80% | 0.81% | 0.20% | 0.00%(e) | 0.00%(e) | |||||
| (a) | The per share amounts and percentages include the Fund’s proportionate share of income and expenses of the affiliated Portfolio. |
| (b) | Amount is less than $0.00005 per share. |
| (c) | Per share numbers have been calculated using average shares outstanding, which more appropriately presents the per share data for the period. |
| (d) | Total return is calculated assuming a purchase of shares at net asset value on the first day and a sale at net asset value on the last day of each period reported. Distributions are assumed, for the purpose of this calculation, to be reinvested at net asset value per share on the respective payment dates. Total return for periods of less than one year is not annualized. Results represent past performance and are not indicative of future results. |
| (e) | Amount is less than 0.005%. |
| (f) | Annualized. |
| Trust Class(a) | |||||||
| Six
Months Ended 06/30/19 (Unaudited) |
Year
Ended 12/31/18 |
Year
Ended 12/31/17 |
For
the Period 8/29/16* - 12/31/16 | ||||
|
Net asset value, beginning of
period |
$ 1.0000 | $ 1.0000 | $ 1.0000 | $ 1.0000 | |||
| Income (loss) from investment operations: | |||||||
|
Net investment income
(loss) |
0.0112 | 0.0168 | 0.0071 | 0.0007 | |||
|
Net realized gain
(loss) |
0.0000(b) | — | 0.0000(b) | 0.0000(b) | |||
|
Total from investment
operations |
0.0112 | 0.0168 | 0.0071 | 0.0007 | |||
| Distributions to shareholders from: | |||||||
|
Net investment
income |
(0.0112) | (0.0168) | (0.0071) | (0.0007) | |||
|
Net realized
gains |
— | — | (0.0000)(b) | — | |||
|
Total
distributions |
(0.0112) | (0.0168) | (0.0071) | (0.0007) | |||
|
Net asset value, end of
period |
$ 1.0000 | $ 1.0000 | $ 1.0000 | $ 1.0000 | |||
|
Total return
(c) |
1.13% | 1.69% | 0.71% | 0.07% | |||
| Ratios and Supplemental Data: | |||||||
|
Net assets, end of period (in
000s) |
$4,626,203 | $4,481,410 | $6,903,267 | $7,962,822 | |||
| Ratios to Average Net Assets: | |||||||
|
Total
expenses |
0.18%(d) | 0.18% | 0.18% | 0.18%(d) | |||
|
Net
expenses |
0.18%(d) | 0.18% | 0.18% | 0.18%(d) | |||
|
Net investment income
(loss) |
2.27%(d) | 1.64% | 0.70% | 0.19%(d) | |||
| * | Commencement of operations. |
| (a) | The per share amounts and percentages include the Fund’s proportionate share of income and expenses of the affiliated Portfolio. |
| (b) | Amount is less than $0.00005 per share. |
| (c) | Total return is calculated assuming a purchase of shares at net asset value on the first day and a sale at net asset value on the last day of each period reported. Distributions are assumed, for the purpose of this calculation, to be reinvested at net asset value per share on the respective payment dates. Total return for periods of less than one year is not annualized. Results represent past performance and are not indicative of future results. |
| (d) | Annualized. |
| Fund | Classes | Commencement
of Operations |
Diversification
Classification |
| State Street Institutional Treasury Plus Money Market Fund | Administration
Class Institutional Class Investment Class Investor Class Premier Class Service Class Trust Class |
July
31, 2018 July 31, 2018 October 24, 2007 October 14, 2016 October 24, 2007 Not commenced August 29, 2016 |
Diversified |
| Expiration Date | Amount | |
|
12/31/2020 |
$229,096 | |
|
12/31/2019 |
$366,047 |
| Actual | Hypothetical
(assuming a 5% return before expenses) | ||||||||
| Annualized
Expense Ratio |
Ending
Account Value |
Expenses
Paid During Period(a) |
Ending
Account Value |
Expenses
Paid During Period(a) | |||||
|
State Street Institutional Treasury Plus Money Market
Fund |
|||||||||
|
Administration
Class |
0.37% | $1,010.30 | $1.84 | $1,023.00 | $1.86 | ||||
|
Institutional
Class |
0.15 | 1,011.40 | 0.75 | 1,024.10 | 0.75 | ||||
|
Investment
Class |
0.47 | 1,010.20 | 2.34 | 1,022.50 | 2.36 | ||||
|
Investor
Class |
0.20 | 1,011.20 | 1.00 | 1,023.80 | 1.00 | ||||
|
Premier
Class |
0.12 | 1,011.60 | 0.60 | 1,024.20 | 0.60 | ||||
|
Trust
Class |
0.18 | 1,011.30 | 0.90 | 1,023.90 | 0.90 | ||||
| (a) | Expenses are equal to the Fund’s annualized net expense ratio, which includes the Fund’s proportionate share of the expenses of the Portfolio, multiplied by the average account value of the period, multiplied by 181, then divided by 365. |
| • | A report prepared by an independent third-party provider of investment company data, which includes for the Fund: |
| • | Comparisons of the Fund’s performance over the past one-, three-, five- and ten-year periods ended December 31, 2018, to the performance of an appropriate benchmark constructed by Broadridge Financial Solutions, Inc., the successor to Lipper, Inc. (“Broadridge”), for the Fund (the “Lipper Index”) and a universe of other mutual funds with similar investment objectives and policies (the “Performance Group” and/or the “Performance Universe”); |
| • | Comparisons of the Fund’s expense ratio (with detail of component expenses) to the expense ratios of a group of comparable mutual funds selected by the independent third-party data provider (the “Expense Group” and/or “Expense Universe”); |
| • | A chart showing the Fund’s historical average net assets relative to its total expenses, management fees, and non-management expenses over the past five calendar years; and |
| • | Comparisons of the Fund’s contractual management fee to the contractual management fees of comparable mutual funds at different asset levels. |
| • | Comparative information concerning fees charged by the Adviser for managing institutional accounts using investment strategies and techniques similar to those used in managing the Fund; and |
| • | Profitability analyses for (a) the Adviser with respect to the Fund and (b) affiliates of the Adviser that provide services to the Fund (“Affiliated Service Providers”). |
| • | Descriptions of the investment management services provided by the Adviser, including its investment strategies and processes; |
| • | Information concerning the allocation of brokerage; and |
| • | Information regarding the procedures and processes used to value the assets of the Fund. |
| • | Reports detailing the financial results and condition of the Adviser and its affiliates; |
| • | Descriptions of the qualifications, education and experience of the individual investment and other professionals responsible for managing the portfolio of the Fund and for Fund operations; |
| • | Information relating to compliance with and the administration of the Code of Ethics adopted by the Adviser; |
| • | A copy of the Adviser’s proxy voting policies and procedures and other information regarding the Adviser’s practices for overseeing proxy vendors; |
| • | Information concerning the resources devoted by the Adviser to overseeing compliance by the Fund and its service providers, including information concerning compliance with investment policies and restrictions and other operating policies of the Fund; |
| • | A description of the adequacy and sophistication of the Adviser’s technology and systems with respect to investment and administrative matters and a description of any material improvements or changes in technology or systems in the past year; |
| • | A description of the business continuity and disaster recovery plans of the Adviser; and |
| • | Information regarding the Adviser’s risk management processes. |
| • | Information concerning the nature, extent, quality and cost of services provided to the Fund by SSGA FM in its capacity as the Fund’s administrator (the “Administrator”); |
| • | Information concerning the nature, extent, quality and cost of various non-investment management services provided to the Fund by affiliates of the Adviser, including the custodian, sub-administrator and fund accountant of the Fund, and the role of the Adviser in managing the Fund’s relationship with these service providers; |
| • | Copies of the Advisory Agreement and agreements with other service providers of the Fund; |
| • | Draft responses to a letter from independent legal counsel to the Independent Trustees (“Independent Counsel”), reviewed prior to such date by Independent Counsel, requesting specific information from each of: |
| • | SSGA FM, in its capacity as the Fund’s Adviser and Administrator, with respect to its operations relating to the Fund and its approximate profit margins from such operations for the calendar year ended December 31, 2018; and the relevant operations of other affiliated service providers to the Fund, together with their approximate profit margins from such relevant operations for the calendar year ended December 31, 2018; |
| • | State Street Bank and Trust Company (“State Street”), the sub-administrator, custodian and shareholder servicer for the Fund, with respect to its operations relating to the Fund; and |
| • | State Street Global Advisors Funds Distributors, LLC, the principal underwriter and distributor of the shares of the Fund (the “Distributor”), with respect to its operations relating to the Fund, together with the Fund’s related distribution plans and arrangements under Rule 12b-1 of the 1940 Act; |
| • | Information from SSGA FM, State Street and the Distributor with respect to the Trust providing any material changes to the previous information supplied in response to the letter from Independent Counsel prior to the executive session of the Board on May 15, 2019; |
| • | Materials provided by Broadridge, circulated to the Independent Trustees and to Independent Counsel, with respect to the Fund ; and |
| • | A summary of the foregoing materials prepared by Independent Counsel. |
State Street Bank and Trust Company
P.O. Box 5049
Boston, MA 02206
| State Street Treasury Plus Money Market Portfolio |
|
|
1 |
|
|
2 |
|
|
6 |
|
|
7 |
|
|
8 |
|
|
9 |
|
|
10 |
|
|
13 |
| % of Net Assets | |||
| Treasury Debt | 56.1% | ||
| Treasury Repurchase Agreements | 35.1 | ||
| Other Assets in Excess of Liabilities | 8.8 | ||
| TOTAL | 100.0% |
| % of Net Assets | |||
| Overnight (1 Day) | 26.4% | ||
| 2 to 30 Days | 14.1 | ||
| 31 to 60 Days | 12.8 | ||
| 61 to 90 Days | 8.2 | ||
| Over 90 Days | 29.7 | ||
| Total | 91.2% | ||
| Average days to maturity | 27 | ||
| Weighted average life | 84 |
| Name of Issuer and Title of Issue | Interest Rate | Next Rate Reset Date | Maturity Date | Principal Amount | Value | |||||
| TREASURY DEBT—56.1% | ||||||||||
|
U.S. Treasury Bill
(a) |
2.030% | 12/26/2019 | 12/26/2019 | $ 300,000,000 | $ 296,988,833 | |||||
|
U.S. Treasury Bill
(a) |
2.133% | 12/19/2019 | 12/19/2019 | 175,500,000 | 173,722,894 | |||||
|
U.S. Treasury Bill
(a) |
2.140% | 12/12/2019 | 12/12/2019 | 150,000,000 | 148,537,667 | |||||
|
U.S. Treasury Bill
(a) |
2.355% | 11/14/2019 | 11/14/2019 | 175,000,000 | 173,442,630 | |||||
|
U.S. Treasury Bill
(a) |
2.373% | 08/15/2019 | 08/15/2019 | 450,000,000 | 448,668,346 | |||||
|
U.S. Treasury Bill
(a) |
2.380% | 07/09/2019 | 07/09/2019 | 353,350,000 | 353,163,117 | |||||
|
U.S. Treasury Bill
(a) |
2.380% | 10/03/2019 | 10/03/2019 | 225,000,000 | 223,601,750 | |||||
|
U.S. Treasury Bill
(a) |
2.385% | 11/07/2019 | 11/07/2019 | 150,000,000 | 148,718,358 | |||||
|
U.S. Treasury Bill
(a) |
2.390% | 10/17/2019 | 10/17/2019 | 175,000,000 | 173,745,250 | |||||
|
U.S. Treasury Bill
(a) |
2.393% | 10/10/2019 | 10/10/2019 | 332,900,000 | 330,664,395 | |||||
|
U.S. Treasury Bill
(a) |
2.415% | 09/26/2019 | 09/26/2019 | 425,000,000 | 422,758,844 | |||||
|
U.S. Treasury Bill
(a) |
2.440% | 08/08/2019 | 08/08/2019 | 500,000,000 | 498,740,113 | |||||
|
U.S. Treasury Bill
(a) |
2.445% | 09/19/2019 | 09/19/2019 | 300,000,000 | 298,367,922 | |||||
|
U.S. Treasury Bill
(a) |
2.450% | 08/01/2019 | 08/01/2019 | 81,000,000 | 80,829,113 | |||||
|
U.S. Treasury Bill
(a) |
2.453% | 09/12/2019 | 09/12/2019 | 350,000,000 | 348,257,976 | |||||
|
U.S. Treasury Bill
(a) |
2.455% | 09/05/2019 | 09/05/2019 | 277,380,000 | 276,130,932 | |||||
|
U.S. Treasury Bill
(a) |
2.460% | 07/18/2019 | 07/18/2019 | 325,000,000 | 324,630,958 | |||||
|
U.S. Treasury Bill
(a) |
2.470% | 07/11/2019 | 07/11/2019 | 400,000,000 | 399,731,085 | |||||
|
U.S. Treasury Bill
(a) |
2.505% | 07/05/2019 | 07/05/2019 | 250,000,000 | 249,933,194 | |||||
|
U.S. Treasury Bill
(a) |
2.805% | 07/02/2019 | 07/02/2019 | 71,000,000 | 70,994,468 | |||||
|
U.S. Treasury Note, 3 Month USD
MMY(b) |
2.096% | 06/29/2019 | 01/31/2020 | 965,200,000 | 965,129,442 | |||||
|
U.S. Treasury Note, 3 Month USD MMY +
0.03%(b) |
2.129% | 06/29/2019 | 04/30/2020 | 810,900,000 | 810,904,825 | |||||
|
U.S. Treasury Note, 3 Month USD MMY +
0.04%(b) |
2.139% | 06/29/2019 | 07/31/2020 | 470,550,000 | 470,454,184 | |||||
|
U.S. Treasury Note, 3 Month USD MMY +
0.05%(b) |
2.141% | 06/29/2019 | 10/31/2020 | 144,500,000 | 144,350,025 | |||||
|
U.S. Treasury Note, 3 Month USD MMY +
0.05%(b) |
2.144% | 06/29/2019 | 10/31/2019 | 696,600,000 | 696,690,353 | |||||
|
U.S. Treasury Note, 3 Month USD MMY +
0.06%(b) |
2.156% | 06/29/2019 | 07/31/2019 | 669,700,000 | 669,729,830 | |||||
|
U.S. Treasury Note, 3 Month USD MMY +
0.14%(b) |
2.235% | 06/29/2019 | 04/30/2021 | 300,000,000 | 299,605,772 | |||||
|
U.S. Treasury Note
(a) |
2.403% | 07/31/2019 | 07/31/2019 | 170,000,000 | 169,890,300 | |||||
|
U.S. Treasury Note
(a) |
2.440% | 09/30/2019 | 09/30/2019 | 141,000,000 | 140,668,626 | |||||
|
U.S. Treasury Note
(a) |
2.452% | 10/31/2019 | 10/31/2019 | 55,700,000 | 55,526,000 | |||||
|
U.S. Treasury Note
(a) |
2.469% | 07/31/2019 | 07/31/2019 | 45,000,000 | 44,959,515 | |||||
|
U.S. Treasury Note
(a) |
2.609% | 07/31/2019 | 07/31/2019 | 353,000,000 | 352,511,766 | |||||
|
TOTAL TREASURY
DEBT |
10,262,048,483 | |||||||||
| TREASURY REPURCHASE AGREEMENTS—35.1% | ||||||||||
|
Agreement with Bank of America and Bank of New York Mellon (Tri-Party), dated 06/28/2019 (collateralized by a U.S. Treasury Note, 1.500% due 05/31/2020, valued at $6,120,065); expected proceeds $6,001,240
|
2.350% | 07/01/2019 | 07/01/2019 | 6,000,000 | 6,000,000 | |||||
|
Agreement with Bank of Nova Scotia and Bank of New York Mellon (Tri-Party), dated 06/28/2019 (collateralized by U.S. Treasury Bonds, 3.000% – 3.875% due 08/15/2040 – 11/15/2048, U.S. Treasury Inflation Index
Notes, 0.125% – 0.625% due 04/15/2022 – 01/15/2024, and U.S. Treasury Notes, 2.750% – 3.125% due 07/31/2023 – 11/15/2028, valued at $76,515,834); expected proceeds $75,015,500
|
2.480% | 07/01/2019 | 07/01/2019 | 75,000,000 | 75,000,000 | |||||
|
Agreement with Barclays Capital, Inc. and Bank of New York Mellon (Tri-Party), dated 06/28/2019 (collateralized by a U.S. Treasury Inflation Index Bond, 3.375% due 04/15/2032, and a U.S. Treasury Inflation Index Note, 0.125%
due 07/15/2026, valued at $408,000,044); expected proceeds $400,083,333
|
2.500% | 07/01/2019 | 07/01/2019 | 400,000,000 | 400,000,000 |
| Name of Issuer and Title of Issue | Interest Rate | Next Rate Reset Date | Maturity Date | Principal Amount | Value | |||||
|
Agreement with BNP Paribas Securities Corp. and Bank of New York Mellon (Tri-Party), dated 06/28/2019 (collateralized by a U.S. Treasury Bond, 2.750% due 11/15/2042, a U.S. Treasury Note, 2.500% due 03/31/2023, and U.S.
Treasury Strips, 0.000% due 02/15/2021 – 02/15/2029, valued at $172,380,006); expected proceeds $169,034,927
|
2.480% | 07/01/2019 | 07/01/2019 | $ 169,000,000 | $ 169,000,000 | |||||
|
Agreement with Canadian Imperial Bank of Commerce and Bank of New York Mellon (Tri-Party), dated 05/09/2019 (collateralized by U.S. Treasury Bonds, 3.000% – 3.125% due 05/15/2047 – 08/15/2048, a U.S. Treasury
Inflation Index Bond, 1.000% due 02/15/2048, U.S. Treasury Inflation Index Notes, 0.125% – 0.875% due 04/15/2020 – 01/15/2029, and U.S. Treasury Notes, 1.750% – 2.375% due 05/15/2022 – 02/29/2024, valued at $137,700,064);
expected proceeds $135,542,250
|
2.410% | 07/08/2019 | 07/08/2019 | 135,000,000 | 135,000,000 | |||||
|
Agreement with Citigroup Global Markets, Inc. and Bank of New York Mellon (Tri-Party), dated 06/28/2019 (collateralized by U.S. Treasury Bills, 0.000% due 07/02/2019 – 07/09/2019, U.S. Treasury Bonds, 2.875% –
3.000% due 02/15/2049 – 05/15/2049, and a U.S. Treasury Inflation Index Bond, 1.000% due 02/15/2049, valued at $510,018,835); expected proceeds $500,236,250
|
2.430% | 07/05/2019 | 07/05/2019 | 500,000,000 | 500,000,000 | |||||
|
Agreement with Citigroup Global Markets, Inc. and Bank of New York Mellon (Tri-Party), dated 06/28/2019 (collateralized by U.S. Treasury Bonds, 2.750% – 3.625% due 02/15/2044 – 11/15/2047, and a U.S. Treasury
Inflation Index Bond, 1.000% due 02/15/2048, valued at $18,360,079); expected proceeds $18,003,735
|
2.490% | 07/01/2019 | 07/01/2019 | 18,000,000 | 18,000,000 | |||||
|
Agreement with Credit Agricole Corporate and Investment Bank and Bank of New York Mellon (Tri-Party), dated 06/06/2019 (collateralized by U.S. Treasury Notes, 2.125% – 2.625% due 07/15/2021 – 12/31/2022, valued
at $188,700,076); expected proceeds $185,391,378
|
2.380% | 07/08/2019 | 07/08/2019 | 185,000,000 | 185,000,000 | |||||
|
Agreement with Credit Agricole Corporate and Investment Bank and Bank of New York Mellon (Tri-Party), dated 06/28/2019 (collateralized by a U.S. Treasury Inflation Index Note, 0.125% due 07/15/2024, and U.S. Treasury Notes,
1.375% – 2.000% due 03/31/2020 – 03/31/2022, valued at $414,120,093); expected proceeds $406,083,907
|
2.480% | 07/01/2019 | 07/01/2019 | 406,000,000 | 406,000,000 | |||||
|
Agreement with Fixed Income Clearing Corp., and Bank of New York Mellon (Tri-Party), dated 06/28/2019 (collateralized by a U.S. Treasury Bill, 0.000% due 06/18/2020, valued at $714,000,048); expected proceeds $700,145,833
|
2.500% | 07/01/2019 | 07/01/2019 | 700,000,000 | 700,000,000 | |||||
|
Agreement with Goldman Sachs & Co. and Bank of New York Mellon (Tri-Party), dated 06/24/2019 (collateralized by U.S. Treasury Notes, 2.000% – 2.750% due 08/31/2023 – 04/30/2024, and U.S. Treasury Strips,
0.000% due 08/15/2019 – 02/15/2027, valued at $204,000,049); expected proceeds $200,095,667
|
2.460% | 07/01/2019 | 07/01/2019 | 200,000,000 | 200,000,000 | |||||
|
Agreement with Goldman Sachs & Co. and Bank of New York Mellon (Tri-Party), dated 06/25/2019 (collateralized by a U.S. Treasury Note, 2.125% due 08/15/2021, and U.S. Treasury Strips, 0.000% due 05/15/2021 –
08/15/2026, valued at $255,000,000); expected proceeds $250,120,069
|
2.470% | 07/02/2019 | 07/02/2019 | 250,000,000 | 250,000,000 |
| Name of Issuer and Title of Issue | Interest Rate | Next Rate Reset Date | Maturity Date | Principal Amount | Value | |||||
|
Agreement with HSBC Securities USA, Inc. and Bank of New York Mellon (Tri-Party), dated 06/28/2019 (collateralized by a U.S. Treasury Bond, 3.000% due 05/15/2045, U.S. Treasury Inflation Index Notes, 0.625% – 1.125%
due 01/15/2021 – 07/15/2021, and a U.S. Treasury Strip, 0.000% due 08/15/2027, valued at $232,560,027); expected proceeds $228,047,500
|
2.500% | 07/01/2019 | 07/01/2019 | $ 228,000,000 | $ 228,000,000 | |||||
|
Agreement with JP Morgan Securities, Inc. and Bank of New York Mellon (Tri-Party), dated 06/11/2019 (collateralized by a U.S. Treasury Note, 2.750% due 07/31/2023, valued at $178,500,096); expected proceeds $176,429,167 (c) |
2.450% | 07/01/2019 | 10/09/2019 | 175,000,000 | 175,000,000 | |||||
| Agreement with JP Morgan Securities, Inc. and Bank of New York Mellon (Tri-Party), dated 06/28/2019 (collateralized by a U.S. Treasury Bill, 0.000% due 05/21/2020, and U.S. Treasury Notes, 2.125% – 2.875% due 11/15/2021 – 12/31/2021, valued at $1,151,580,032); expected proceeds $1,129,238,031 | 2.530% | 07/01/2019 | 07/01/2019 | 1,129,000,000 | 1,129,000,000 | |||||
|
Agreement with LLOYDS Bank PLC and Clearstream (Tri-Party), and dated 04/26/2019 (collateralized by a U.S. Treasury Inflation Index Note, 0.750% due 07/15/2028, and U.S. Treasury Notes, 2.000% – 2.250% due 02/15/2023
– 11/15/2027, valued at $67,179,547); expected proceeds $65,374,581
(c) |
2.530% | 07/01/2019 | 07/17/2019 | 65,000,000 | 65,000,000 | |||||
|
Agreement with LLOYDS Bank PLC and Clearstream (Tri-Party), and dated 04/26/2019 (collateralized by U.S. Treasury Notes, 1.875% – 2.875% due 08/31/2022 – 11/15/2027, valued at $36,161,437); expected proceeds
$35,231,214
(c) |
2.530% | 07/01/2019 | 07/29/2019 | 35,000,000 | 35,000,000 | |||||
|
Agreement with Norinchukin Bank and Bank of New York Mellon (Tri-Party), dated 05/09/2019 (collateralized by U.S. Treasury Inflation Index Notes, 0.375% – 1.125% due 01/15/2021 – 01/15/2027, and a U.S. Treasury
Note, 2.000% due 11/15/2026, valued at $71,400,058); expected proceeds $70,462,933
(c) |
2.480% | 08/13/2019 | 08/13/2019 | 70,000,000 | 70,000,000 | |||||
|
Agreement with Norinchukin Bank and Bank of New York Mellon (Tri-Party), dated 06/12/2019 (collateralized by U.S. Treasury Inflation Index Notes, 0.375% – 1.125% due 01/15/2021 – 01/15/2027, and a U.S. Treasury
Note, 3.375% due 11/15/2019, valued at $102,000,005); expected proceeds $100,607,083
(c) |
2.350% | 09/13/2019 | 09/13/2019 | 100,000,000 | 100,000,000 | |||||
|
Agreement with Norinchukin Bank and Bank of New York Mellon (Tri-Party), dated 06/24/2019 (collateralized by U.S. Treasury Inflation Index Notes, 0.375% – 1.125% due 01/15/2021 – 01/15/2027, and a U.S. Treasury
Note, 2.000% due 11/15/2026, valued at $71,400,043); expected proceeds $70,415,022
(c) |
2.320% | 09/24/2019 | 09/24/2019 | 70,000,000 | 70,000,000 | |||||
|
Agreement with Prudential Insurance Co., dated 06/28/2019 (collateralized by a U.S. Treasury Bond, 3.375% due 11/15/2048, and U.S. Treasury Notes, 2.125% – 2.250% due 11/15/2024 – 11/15/2025, valued at
$113,088,995); expected proceeds $110,942,043
|
2.520% | 07/01/2019 | 07/01/2019 | 110,918,750 | 110,918,750 | |||||
|
Agreement with Prudential Insurance Co., dated 06/28/2019 (collateralized by U.S. Treasury Strips, 0.000% due 08/15/2025 – 11/15/2028, valued at $102,882,850); expected proceeds $100,871,179
|
2.520% | 07/01/2019 | 07/01/2019 | 100,850,000 | 100,850,000 |
| Name of Issuer and Title of Issue | Interest Rate | Next Rate Reset Date | Maturity Date | Principal Amount | Value | |||||
|
Agreement with Royal Bank of Canada and Bank of New York Mellon (Tri-Party), dated 06/28/2019 (collateralized by a U.S. Treasury Bill, 0.000% due 11/14/2019, U.S. Treasury Bonds, 2.750% – 4.375% due 11/15/2039 –
02/15/2048, a U.S. Treasury Inflation Index Bond, 0.750% due 02/15/2045, U.S. Treasury Inflation Index Notes, 1.125% – 1.250% due 07/15/2020 – 01/15/2021, and U.S. Treasury Notes, 2.125% – 2.875% due 05/31/2021 – 02/15/2024,
valued at $372,300,005); expected proceeds $365,076,042
|
2.500% | 07/01/2019 | 07/01/2019 | $ 365,000,000 | $ 365,000,000 | |||||
|
Agreement with Societe Generale and Bank of New York Mellon (Tri-Party), dated 06/28/2019 (collateralized by U.S. Treasury Bills, 0.000% due 07/25/2019 – 03/26/2020, U.S. Treasury Inflation Index Bonds, 1.000% –
3.875% due 01/15/2028 – 02/15/2048, a U.S. Treasury Inflation Index Note, 0.125% due 07/15/2024, U.S. Treasury Notes, 2.125% – 2.625% due 07/31/2020 – 05/15/2022, and U.S. Treasury Strips, 0.000% due 02/15/2023 – 11/15/2027,
valued at $181,560,000); expected proceeds $178,036,787
|
2.480% | 07/01/2019 | 07/01/2019 | 178,000,000 | 178,000,000 | |||||
|
Agreement with TD Securities (USA) LLC and Bank of New York Mellon (Tri-Party), dated 06/28/2019 (collateralized by U.S. Treasury Notes, 2.000% – 2.625% due 06/15/2021 – 05/31/2024, valued at $44,880,044);
expected proceeds $44,009,167
|
2.500% | 07/01/2019 | 07/01/2019 | 44,000,000 | 44,000,000 | |||||
|
Agreement with UBS Securities LLC and Bank of New York Mellon (Tri-Party), dated 06/28/2019 (collateralized by U.S. Treasury Bills, 0.000% due 07/05/2019 – 05/21/2020, U.S. Treasury Bonds, 2.750% – 6.375% due
02/15/2026 – 11/15/2047, U.S. Treasury Inflation Index Bonds, 0.625% – 3.875% due 01/15/2025 – 02/15/2046, U.S. Treasury Inflation Index Notes, 0.125% – 1.875% due 07/15/2019 – 01/15/2029, U.S. Treasury Notes, 0.875%
– 3.500% due 07/31/2019 – 02/15/2028, and U.S. Treasury Strips, 0.000% due 05/15/2022 – 05/15/2029, valued at $153,000,005); expected proceeds $150,031,250
|
2.500% | 07/01/2019 | 07/01/2019 | 150,000,000 | 150,000,000 | |||||
|
Agreement with Wells Fargo Bank and Bank of New York Mellon (Tri-Party), dated 06/28/2019 (collateralized by U.S. Treasury Bills, 0.000% due 11/07/2019 – 11/29/2019, and U.S. Treasury Notes, 1.125% – 1.625% due
02/28/2021 – 02/15/2026, valued at $560,096,722); expected proceeds $549,114,375
|
2.500% | 07/01/2019 | 07/01/2019 | 549,000,000 | 549,000,000 | |||||
|
TOTAL TREASURY REPURCHASE
AGREEMENTS |
6,413,768,750 | |||||||||
|
TOTAL INVESTMENTS –91.2%
(d)(e) |
16,675,817,233 | |||||||||
|
Other Assets in Excess of Liabilities —8.8%
|
1,608,308,909 | |||||||||
|
NET ASSETS –100.0%
|
$ 18,284,126,142 |
| (a) | Rate shown is the discount rate at time of purchase. |
| (b) | Variable Rate Security - Interest rate shown is rate in effect at June 30, 2019. For securities based on a published reference rate and spread, the reference rate and spread are indicated in the description above. |
| (c) | Illiquid security. These securities represent $515,000,000 or 2.9% of net assets as of June 30, 2019. |
| (d) | Also represents the cost for federal tax purposes. |
| (e) | Unless otherwise indicated, the values of the securities of the Portfolio are determined based on Level 2 inputs (Note 2). |
| ASSETS | |
|
Investments in unaffiliated issuers, at value and
cost |
$10,262,048,483 |
|
Repurchase agreements, at value and amortized
cost |
6,413,768,750 |
|
Total
Investments |
16,675,817,233 |
|
Cash |
1,582,964,521 |
|
Interest receivable — unaffiliated
issuers |
24,322,898 |
|
Other
Receivable |
1,797,087 |
|
TOTAL ASSETS
|
18,284,901,739 |
| LIABILITIES | |
|
Advisory and administrator fee
payable |
660,846 |
|
Custody, sub-administration and transfer agent fees
payable |
77,199 |
|
Trustees’ fees and expenses
payable |
289 |
|
Professional fees
payable |
32,889 |
|
Accrued expenses and other
liabilities |
4,374 |
|
TOTAL LIABILITIES
|
775,597 |
|
NET ASSETS
|
$18,284,126,142 |
| INVESTMENT INCOME | |
|
Interest income — unaffiliated
issuers |
$216,925,402 |
| EXPENSES | |
|
Advisory and administrator
fee |
4,399,968 |
|
Custodian, sub-administrator and transfer agent
fees |
1,146,952 |
|
Trustees’ fees and expenses
|
194,848 |
|
Professional
fees |
82,659 |
|
Printing and postage
fees |
22,661 |
|
Insurance
expense |
3,336 |
|
Miscellaneous
expenses |
5,818 |
|
TOTAL
EXPENSES |
5,856,242 |
|
NET INVESTMENT INCOME
(LOSS) |
$211,069,160 |
| REALIZED GAIN (LOSS) | |
| Net realized gain (loss) on: | |
|
Investments — unaffiliated
issuers |
21,451 |
|
NET INCREASE (DECREASE) IN NET ASSETS FROM
OPERATIONS |
$211,090,611 |
| Six
Months Ended 6/30/19 (Unaudited) |
Year
Ended 12/31/18 | ||
| INCREASE (DECREASE) IN NET ASSETS FROM OPERATIONS: | |||
|
Net investment income
(loss) |
$ 211,069,160 | $ 250,070,855 | |
|
Net realized gain
(loss) |
21,451 | 1,950 | |
|
Net increase (decrease) in net assets resulting from
operations |
211,090,611 | 250,072,805 | |
| CAPITAL TRANSACTIONS | |||
|
Contributions |
14,848,481,579 | 39,817,102,235 | |
|
Withdrawals |
(14,222,710,980) | (36,800,190,630) | |
|
Net increase (decrease) in net assets from capital transactions
|
625,770,599 | 3,016,911,605 | |
|
Net increase (decrease) in net assets during the
period |
836,861,210 | 3,266,984,410 | |
|
Net assets at beginning of
period |
17,447,264,932 | 14,180,280,522 | |
|
NET ASSETS AT END OF
PERIOD |
$ 18,284,126,142 | $ 17,447,264,932 |
| Six
Months Ended 6/30/19 (Unaudited) |
Year
Ended 12/31/18 |
Year
Ended 12/31/17 |
Year
Ended 12/31/16 |
Year
Ended 12/31/15 |
Year
Ended 12/31/14 | ||||||
|
Total return
(a) |
1.19% | 1.82% | 0.82% | 0.23% | (0.01)% | (0.02)% | |||||
| Ratios and Supplemental Data: | |||||||||||
|
Net assets, end of period (in
000s) |
$18,284,126 | $17,447,265 | $14,180,281 | $10,628,952 | $1,744,814 | $2,765,530 | |||||
| Ratios to average net assets: | |||||||||||
|
Total
expenses |
0.07%(b) | 0.07% | 0.07% | 0.07% | 0.07% | 0.07% | |||||
|
Net investment income
(loss) |
2.40%(b) | 1.79% | 0.84% | 0.27% | (0.01)% | (0.02)% |
| (a) | Results represent past performance and are not indicative of future results. Total return for periods of less than one year are not annualized. |
| (b) | Annualized. |
| Actual | Hypothetical
(assuming a 5% return before expenses) | ||||||||
| Annualized
Expense Ratio |
Ending
Account Value |
Expenses
Paid During Period(a) |
Ending
Account Value |
Expenses
Paid During Period(a) | |||||
|
State Street Treasury Plus Money Market
Portfolio |
0.07% | $1,011.90 | $0.35 | $1,024.40 | $0.35 | ||||
| (a) | Expenses are equal to the Portfolio’s annualized net expense ratio multiplied by the average account value of the period, multiplied by 181, then divided by 365. |
| • | A report prepared by an independent third-party provider of investment company data, which includes for the feeder fund for which the Portfolio serves as the master fund in a master-feeder structure (the “Fund”): |
| • | Comparisons of the Fund’s performance over the past one-, three-, five- and ten-year periods ended December 31, 2018, to the performance of an appropriate benchmark constructed by Broadridge Financial Solutions, Inc., the successor to Lipper, Inc. (“Broadridge”), for the Fund (the “Lipper Index”) and a universe of other mutual funds with similar investment objectives and policies (the “Performance Group” and/or the “Performance Universe”); |
| • | Comparisons of the Fund’s expense ratio (with detail of component expenses) to the expense ratios of a group of comparable mutual funds selected by the independent third-party data provider (the “Expense Group” and/or “Expense Universe”); |
| • | A chart showing the Fund’s historical average net assets relative to its total expenses, management fees, and non-management expenses over the past five calendar years; and |
| • | Comparisons of the Fund’s contractual management fee to the contractual management fees of comparable mutual funds at different asset levels. |
| • | Comparative information concerning fees charged by the Adviser for managing institutional accounts using investment strategies and techniques similar to those used in managing the Fund; and |
| • | Profitability analyses for (a) the Adviser with respect to the Portfolio and (b) affiliates of the Adviser that provide services to the Portfolio (“Affiliated Service Providers”). |
| • | Descriptions of the investment management services provided by the Adviser, including its investment strategies and processes; |
| • | Information concerning the allocation of brokerage; and |
| • | Information regarding the procedures and processes used to value the assets of the Portfolio. |
| • | Reports detailing the financial results and condition of the Adviser and its affiliates; |
| • | Descriptions of the qualifications, education and experience of the individual investment and other professionals responsible for managing the portfolio of the Portfolio and for Portfolio operations; |
| • | Information relating to compliance with and the administration of the Code of Ethics adopted by the Adviser; |
| • | A copy of the Adviser’s proxy voting policies and procedures and other information regarding the Adviser’s practices for overseeing proxy vendors; |
| • | Information concerning the resources devoted by the Adviser to overseeing compliance by the Portfolio and its service providers, including information concerning compliance with investment policies and restrictions and other operating policies of the Portfolio; |
| • | A description of the adequacy and sophistication of the Adviser’s technology and systems with respect to investment and administrative matters and a description of any material improvements or changes in technology or systems in the past year; |
| • | A description of the business continuity and disaster recovery plans of the Adviser; and |
| • | Information regarding the Adviser’s risk management processes. |
| • | Information concerning the nature, extent, quality and cost of services provided to the Portfolio by SSGA FM in its capacity as the Portfolio’s administrator (the “Administrator”); |
| • | Information concerning the nature, extent, quality and cost of various non-investment management services provided to the Portfolio by affiliates of the Adviser, including the custodian, sub-administrator, transfer agent and fund accountant of the Portfolio, and the role of the Adviser in managing the Portfolio’s relationship with these service providers; |
| • | Copies of the Advisory Agreement and agreements with other service providers of the Portfolio; |
| • | Draft responses to a letter from independent legal counsel to the Independent Trustees (“Independent Counsel”), reviewed prior to such date by Independent Counsel, requesting specific information from each of: |
| • | SSGA FM, in its capacity as the Portfolio’s Adviser and Administrator, with respect to its operations relating to the Portfolio and its approximate profit margins from such operations for the calendar year ended December 31, 2018; and the relevant operations of other affiliated service providers to the Portfolio, together with their approximate profit margins from such relevant operations for the calendar year ended December 31, 2018; |
| • | State Street Bank and Trust Company (“State Street”), the sub-administrator, custodian and transfer agent for the Portfolio, with respect to its operations relating to the Portfolio; and |
| • | State Street Global Advisors Funds Distributors, LLC, the principal underwriter and distributor of the shares of the Portfolio (the “Distributor”), with respect to its operations relating to the Portfolio; |
| • | Information from SSGA FM, State Street and the Distributor with respect to the Trust providing any material changes to the previous information supplied in response to the letter from Independent Counsel prior to the executive session of the Board on May 15, 2019; |
| • | Materials provided by Broadridge, circulated to the Independent Trustees and to Independent Counsel, with respect to the Fund; and |
| • | A summary of the foregoing materials prepared by Independent Counsel. |
State Street Bank and Trust Company
P.O. Box 5049
Boston, MA 02206
| State Street Treasury Obligations Money Market Fund |

|
|
1 |
|
|
2 |
|
|
3 |
|
|
4 |
|
|
5 |
|
|
8 |
| ASSETS | |
|
Investment in corresponding affiliated Portfolio, at value and
cost |
$2,956,618,283 |
|
Receivable from
Adviser |
105,077 |
|
TOTAL ASSETS
|
2,956,723,360 |
| LIABILITIES | |
|
Administration fees
payable |
124,796 |
|
Transfer agent fees
payable |
8,614 |
|
Distribution
payable |
26,362 |
|
Registration and filing fees
payable |
17,570 |
|
Professional fees
payable |
13,749 |
|
Printing fees
payable |
19,380 |
|
Accrued expenses and other
liabilities |
927 |
|
TOTAL LIABILITIES
|
211,398 |
|
NET ASSETS
|
$2,956,511,962 |
| NET ASSETS CONSIST OF: | |
|
Paid-in
Capital |
$2,956,506,605 |
|
Total distributable earnings
(loss) |
5,357 |
|
NET ASSETS
|
$2,956,511,962 |
| NET ASSET VALUE PER SHARE | |
|
Net asset value, offering and redemption price per
share |
$ 1.00 |
|
Shares
outstanding |
2,956,506,605 |
| INCOME AND EXPENSES ALLOCATED FROM AFFILIATED PORTFOLIO | |
|
Interest income allocated from affiliated
Portfolio |
44,852,977 |
|
Expenses allocated from affiliated
Portfolio |
(1,208,775) |
|
TOTAL INVESTMENT INCOME (LOSS) ALLOCATED FROM AFFILIATED
PORTFOLIO |
43,644,202 |
| EXPENSES | |
|
Administration
fees |
917,322 |
|
Custodian
fees |
22,163 |
|
Trustees’ fees and expenses
|
9,034 |
|
Transfer agent
fees |
584 |
|
Registration and filing
fees |
12,440 |
|
Professional fees and
expenses |
17,447 |
|
Printing and postage
fees |
15,089 |
|
Insurance
expense |
9,955 |
|
Miscellaneous
expenses |
7,434 |
|
TOTAL
EXPENSES |
1,011,468 |
|
Expenses waived/reimbursed by the
Adviser |
(752,528) |
|
NET
EXPENSES |
258,940 |
|
NET INVESTMENT INCOME
(LOSS) |
$43,385,262 |
| REALIZED GAIN (LOSS) | |
| Net realized gain (loss) on: | |
|
Investments allocated from affiliated
Portfolio |
4,354 |
|
NET INCREASE (DECREASE) IN NET ASSETS FROM
OPERATIONS |
$43,389,616 |
| Six
Months Ended 6/30/19 (Unaudited) |
Year
Ended 12/31/18 | ||
| INCREASE (DECREASE) IN NET ASSETS FROM OPERATIONS: | |||
|
Net investment income
(loss) |
$ 43,385,262 | $ 58,298,055 | |
|
Net realized gain
(loss) |
4,354 | 1,003 | |
|
Net increase (decrease) in net assets resulting from
operations |
43,389,616 | 58,299,058 | |
| DISTRIBUTIONS TO SHAREHOLDERS: | |||
|
Distributions to
shareholders |
(43,385,262) | (58,298,055) | |
| FROM BENEFICIAL INTEREST TRANSACTIONS: | |||
|
Proceeds from sale of shares
sold |
6,778,305,731 | 6,325,956,321 | |
|
Reinvestment of
distributions |
43,274,538 | 57,954,475 | |
|
Cost of shares
redeemed |
(7,485,641,932) | (5,689,704,933) | |
|
Net increase (decrease) from share transactions
|
(664,061,663) | 694,205,863 | |
|
Net increase (decrease) in net assets during the
period |
(664,057,309) | 694,206,866 | |
|
Net assets at beginning of
period |
3,620,569,271 | 2,926,362,405 | |
|
NET ASSETS AT END OF
PERIOD |
$ 2,956,511,962 | $ 3,620,569,271 | |
| SHARES OF BENEFICIAL INTEREST: | |||
|
Shares
sold |
6,778,305,731 | 6,325,956,321 | |
|
Reinvestment of
distributions |
43,274,538 | 57,954,475 | |
|
Shares
redeemed |
(7,485,641,932) | (5,689,704,933) | |
|
Net increase (decrease) from share
transactions |
(664,061,663) | 694,205,863 |
| Six
Months Ended 6/30/19(a) (Unaudited) |
Year
Ended 12/31/18(a) |
For
the Period 10/5/17* - 12/31/17(a) | |||
|
Net asset value, beginning of
period |
$ 1.0000 | $ 1.0000 | $ 1.0000 | ||
| Income (loss) from investment operations: | |||||
|
Net investment income
(loss) |
0.0117 | 0.0178 | 0.0025 | ||
|
Total from investment
operations |
0.0117 | 0.0178 | 0.0025 | ||
| Distributions to shareholders from: | |||||
|
Net investment
income |
(0.0117) | (0.0178) | (0.0025) | ||
|
Total
distributions |
(0.0117) | (0.0178) | (0.0025) | ||
|
Net asset value, end of
period |
$ 1.0000 | $ 1.0000 | $ 1.0000 | ||
|
Total return
(b) |
1.18% | 1.79% | 0.25% | ||
| Ratios and Supplemental Data: | |||||
|
Net assets, end of period (in
000s) |
$2,956,512 | $3,620,569 | $2,926,362 | ||
| Ratios to average net assets: | |||||
|
Total
expenses |
0.12%(c) | 0.13% | 0.16%(c) | ||
|
Net
expenses |
0.08%(c) | 0.08% | 0.08%(c) | ||
|
Net investment income
(loss) |
2.36%(c) | 1.77% | 1.08%(c) |
| * | Commencement of operations. |
| (a) | The per share amounts and percentages include the Fund’s proportionate share of income and expenses of the affiliated Portfolio. |
| (b) | Total return is calculated assuming a purchase of shares at net asset value on the first day and a sale at net asset value on the last day of each period reported. Distributions are assumed, for the purpose of this calculation, to be reinvested at net asset value per share on the respective payment dates. Total return for periods of less than one year is not annualized. Results represent past performance and are not indicative of future results. |
| (c) | Annualized. |
| Fund | Commencement of Operations | Diversification Classification |
| State Street Treasury Obligations Money Market Fund | October 5, 2017 | Diversified |
| Actual | Hypothetical
(assuming a 5% return before expenses) | ||||||||
| Annualized
Expense Ratio |
Ending
Account Value |
Expenses
Paid During Period(a) |
Ending
Account Value |
Expenses
Paid During Period(a) | |||||
|
State Street Treasury Obligations Money Market
Fund |
0.08% | $1,011.80 | $0.40 | $1,024.40 | $0.40 | ||||
| (a) | Expenses are equal to the Fund’s annualized net expense ratio, which includes the Fund’s proportionate share of the expenses of the Portfolio, multiplied by the average account value of the period, multiplied by 181, then divided by 365. |
| • | A report prepared by an independent third-party provider of investment company data, which includes for the Fund: |
| • | Comparisons of the Fund’s performance over the one-year period ended December 31, 2018, to the performance of an appropriate benchmark constructed by Broadridge Financial Solutions, Inc., the successor to Lipper, Inc. (“Broadridge”), for the Fund (the “Lipper Index”) and a universe of other mutual funds with similar investment objectives and policies (the “Performance Group” and/or the “Performance Universe”); |
| • | Comparisons of the Fund’s expense ratio (with detail of component expenses) to the expense ratios of a group of comparable mutual funds selected by the independent third-party data provider (the “Expense Group” and/or “Expense Universe”); |
| • | A chart showing the Fund’s historical average net assets relative to its total expenses, management fees, and non-management expenses over the past calendar year; and |
| • | Comparisons of the Fund’s contractual management fee to the contractual management fees of comparable mutual funds at different asset levels. |
| • | Comparative information concerning fees charged by the Adviser for managing institutional accounts using investment strategies and techniques similar to those used in managing the Fund; and |
| • | Profitability analyses for (a) the Adviser with respect to the Fund and (b) affiliates of the Adviser that provide services to the Fund (“Affiliated Service Providers”). |
| • | Descriptions of the investment management services provided by the Adviser, including its investment strategies and processes; |
| • | Information concerning the allocation of brokerage; and |
| • | Information regarding the procedures and processes used to value the assets of the Fund. |
| • | Reports detailing the financial results and condition of the Adviser and its affiliates; |
| • | Descriptions of the qualifications, education and experience of the individual investment and other professionals responsible for managing the portfolio of the Fund and for Fund operations; |
| • | Information relating to compliance with and the administration of the Code of Ethics adopted by the Adviser; |
| • | A copy of the Adviser’s proxy voting policies and procedures and other information regarding the Adviser’s practices for overseeing proxy vendors; |
| • | Information concerning the resources devoted by the Adviser to overseeing compliance by the Fund and its service providers, including information concerning compliance with investment policies and restrictions and other operating policies of the Fund; |
| • | A description of the adequacy and sophistication of the Adviser’s technology and systems with respect to investment and administrative matters and a description of any material improvements or changes in technology or systems in the past year; |
| • | A description of the business continuity and disaster recovery plans of the Adviser; and |
| • | Information regarding the Adviser’s risk management processes. |
| • | Information concerning the nature, extent, quality and cost of services provided to the Fund by SSGA FM in its capacity as the Fund’s administrator (the “Administrator”); |
| • | Information concerning the nature, extent, quality and cost of various non-investment management services provided to the Fund by affiliates of the Adviser, including the custodian, sub-administrator and fund accountant of the Fund, and the role of the Adviser in managing the Fund’s relationship with these service providers; |
| • | Copies of the Advisory Agreement and agreements with other service providers of the Fund; |
| • | Draft responses to a letter from independent legal counsel to the Independent Trustees (“Independent Counsel”), reviewed prior to such date by Independent Counsel, requesting specific information from each of: |
| • | SSGA FM, in its capacity as the Fund’s Adviser and Administrator, with respect to its operations relating to the Fund and its approximate profit margins from such operations for the calendar year ended December 31, 2018; and the relevant operations of other affiliated service providers to the Fund, together with their approximate profit margins from such relevant operations for the calendar year ended December 31, 2018; |
| • | State Street Bank and Trust Company (“State Street”), the sub-administrator, custodian and shareholder servicer for the Fund, with respect to its operations relating to the Fund; and |
| • | State Street Global Advisors Funds Distributors, LLC, the principal underwriter and distributor of the shares of the Fund (the “Distributor”), with respect to its operations relating to the Fund, together with the Fund’s related distribution plans and arrangements under Rule 12b-1 of the 1940 Act; |
| • | Information from SSGA FM, State Street and the Distributor with respect to the Trust providing any material changes to the previous information supplied in response to the letter from Independent Counsel prior to the executive session of the Board on May 15, 2019; |
| • | Materials provided by Broadridge, circulated to the Independent Trustees and to Independent Counsel, with respect to the Fund; and |
| • | A summary of the foregoing materials prepared by Independent Counsel. |
State Street Bank and Trust Company
P.O. Box 5049
Boston, MA 02206
| State Street Treasury Plus Money Market Portfolio |
|
|
1 |
|
|
2 |
|
|
6 |
|
|
7 |
|
|
8 |
|
|
9 |
|
|
10 |
|
|
13 |
| % of Net Assets | |||
| Treasury Debt | 56.1% | ||
| Treasury Repurchase Agreements | 35.1 | ||
| Other Assets in Excess of Liabilities | 8.8 | ||
| TOTAL | 100.0% |
| % of Net Assets | |||
| Overnight (1 Day) | 26.4% | ||
| 2 to 30 Days | 14.1 | ||
| 31 to 60 Days | 12.8 | ||
| 61 to 90 Days | 8.2 | ||
| Over 90 Days | 29.7 | ||
| Total | 91.2% | ||
| Average days to maturity | 27 | ||
| Weighted average life | 84 |
| Name of Issuer and Title of Issue | Interest Rate | Next Rate Reset Date | Maturity Date | Principal Amount | Value | |||||
| TREASURY DEBT—56.1% | ||||||||||
|
U.S. Treasury Bill
(a) |
2.030% | 12/26/2019 | 12/26/2019 | $ 300,000,000 | $ 296,988,833 | |||||
|
U.S. Treasury Bill
(a) |
2.133% | 12/19/2019 | 12/19/2019 | 175,500,000 | 173,722,894 | |||||
|
U.S. Treasury Bill
(a) |
2.140% | 12/12/2019 | 12/12/2019 | 150,000,000 | 148,537,667 | |||||
|
U.S. Treasury Bill
(a) |
2.355% | 11/14/2019 | 11/14/2019 | 175,000,000 | 173,442,630 | |||||
|
U.S. Treasury Bill
(a) |
2.373% | 08/15/2019 | 08/15/2019 | 450,000,000 | 448,668,346 | |||||
|
U.S. Treasury Bill
(a) |
2.380% | 07/09/2019 | 07/09/2019 | 353,350,000 | 353,163,117 | |||||
|
U.S. Treasury Bill
(a) |
2.380% | 10/03/2019 | 10/03/2019 | 225,000,000 | 223,601,750 | |||||
|
U.S. Treasury Bill
(a) |
2.385% | 11/07/2019 | 11/07/2019 | 150,000,000 | 148,718,358 | |||||
|
U.S. Treasury Bill
(a) |
2.390% | 10/17/2019 | 10/17/2019 | 175,000,000 | 173,745,250 | |||||
|
U.S. Treasury Bill
(a) |
2.393% | 10/10/2019 | 10/10/2019 | 332,900,000 | 330,664,395 | |||||
|
U.S. Treasury Bill
(a) |
2.415% | 09/26/2019 | 09/26/2019 | 425,000,000 | 422,758,844 | |||||
|
U.S. Treasury Bill
(a) |
2.440% | 08/08/2019 | 08/08/2019 | 500,000,000 | 498,740,113 | |||||
|
U.S. Treasury Bill
(a) |
2.445% | 09/19/2019 | 09/19/2019 | 300,000,000 | 298,367,922 | |||||
|
U.S. Treasury Bill
(a) |
2.450% | 08/01/2019 | 08/01/2019 | 81,000,000 | 80,829,113 | |||||
|
U.S. Treasury Bill
(a) |
2.453% | 09/12/2019 | 09/12/2019 | 350,000,000 | 348,257,976 | |||||
|
U.S. Treasury Bill
(a) |
2.455% | 09/05/2019 | 09/05/2019 | 277,380,000 | 276,130,932 | |||||
|
U.S. Treasury Bill
(a) |
2.460% | 07/18/2019 | 07/18/2019 | 325,000,000 | 324,630,958 | |||||
|
U.S. Treasury Bill
(a) |
2.470% | 07/11/2019 | 07/11/2019 | 400,000,000 | 399,731,085 | |||||
|
U.S. Treasury Bill
(a) |
2.505% | 07/05/2019 | 07/05/2019 | 250,000,000 | 249,933,194 | |||||
|
U.S. Treasury Bill
(a) |
2.805% | 07/02/2019 | 07/02/2019 | 71,000,000 | 70,994,468 | |||||
|
U.S. Treasury Note, 3 Month USD
MMY(b) |
2.096% | 06/29/2019 | 01/31/2020 | 965,200,000 | 965,129,442 | |||||
|
U.S. Treasury Note, 3 Month USD MMY +
0.03%(b) |
2.129% | 06/29/2019 | 04/30/2020 | 810,900,000 | 810,904,825 | |||||
|
U.S. Treasury Note, 3 Month USD MMY +
0.04%(b) |
2.139% | 06/29/2019 | 07/31/2020 | 470,550,000 | 470,454,184 | |||||
|
U.S. Treasury Note, 3 Month USD MMY +
0.05%(b) |
2.141% | 06/29/2019 | 10/31/2020 | 144,500,000 | 144,350,025 | |||||
|
U.S. Treasury Note, 3 Month USD MMY +
0.05%(b) |
2.144% | 06/29/2019 | 10/31/2019 | 696,600,000 | 696,690,353 | |||||
|
U.S. Treasury Note, 3 Month USD MMY +
0.06%(b) |
2.156% | 06/29/2019 | 07/31/2019 | 669,700,000 | 669,729,830 | |||||
|
U.S. Treasury Note, 3 Month USD MMY +
0.14%(b) |
2.235% | 06/29/2019 | 04/30/2021 | 300,000,000 | 299,605,772 | |||||
|
U.S. Treasury Note
(a) |
2.403% | 07/31/2019 | 07/31/2019 | 170,000,000 | 169,890,300 | |||||
|
U.S. Treasury Note
(a) |
2.440% | 09/30/2019 | 09/30/2019 | 141,000,000 | 140,668,626 | |||||
|
U.S. Treasury Note
(a) |
2.452% | 10/31/2019 | 10/31/2019 | 55,700,000 | 55,526,000 | |||||
|
U.S. Treasury Note
(a) |
2.469% | 07/31/2019 | 07/31/2019 | 45,000,000 | 44,959,515 | |||||
|
U.S. Treasury Note
(a) |
2.609% | 07/31/2019 | 07/31/2019 | 353,000,000 | 352,511,766 | |||||
|
TOTAL TREASURY
DEBT |
10,262,048,483 | |||||||||
| TREASURY REPURCHASE AGREEMENTS—35.1% | ||||||||||
|
Agreement with Bank of America and Bank of New York Mellon (Tri-Party), dated 06/28/2019 (collateralized by a U.S. Treasury Note, 1.500% due 05/31/2020, valued at $6,120,065); expected proceeds $6,001,240
|
2.350% | 07/01/2019 | 07/01/2019 | 6,000,000 | 6,000,000 | |||||
|
Agreement with Bank of Nova Scotia and Bank of New York Mellon (Tri-Party), dated 06/28/2019 (collateralized by U.S. Treasury Bonds, 3.000% – 3.875% due 08/15/2040 – 11/15/2048, U.S. Treasury Inflation Index
Notes, 0.125% – 0.625% due 04/15/2022 – 01/15/2024, and U.S. Treasury Notes, 2.750% – 3.125% due 07/31/2023 – 11/15/2028, valued at $76,515,834); expected proceeds $75,015,500
|
2.480% | 07/01/2019 | 07/01/2019 | 75,000,000 | 75,000,000 | |||||
|
Agreement with Barclays Capital, Inc. and Bank of New York Mellon (Tri-Party), dated 06/28/2019 (collateralized by a U.S. Treasury Inflation Index Bond, 3.375% due 04/15/2032, and a U.S. Treasury Inflation Index Note, 0.125%
due 07/15/2026, valued at $408,000,044); expected proceeds $400,083,333
|
2.500% | 07/01/2019 | 07/01/2019 | 400,000,000 | 400,000,000 |
| Name of Issuer and Title of Issue | Interest Rate | Next Rate Reset Date | Maturity Date | Principal Amount | Value | |||||
|
Agreement with BNP Paribas Securities Corp. and Bank of New York Mellon (Tri-Party), dated 06/28/2019 (collateralized by a U.S. Treasury Bond, 2.750% due 11/15/2042, a U.S. Treasury Note, 2.500% due 03/31/2023, and U.S.
Treasury Strips, 0.000% due 02/15/2021 – 02/15/2029, valued at $172,380,006); expected proceeds $169,034,927
|
2.480% | 07/01/2019 | 07/01/2019 | $ 169,000,000 | $ 169,000,000 | |||||
|
Agreement with Canadian Imperial Bank of Commerce and Bank of New York Mellon (Tri-Party), dated 05/09/2019 (collateralized by U.S. Treasury Bonds, 3.000% – 3.125% due 05/15/2047 – 08/15/2048, a U.S. Treasury
Inflation Index Bond, 1.000% due 02/15/2048, U.S. Treasury Inflation Index Notes, 0.125% – 0.875% due 04/15/2020 – 01/15/2029, and U.S. Treasury Notes, 1.750% – 2.375% due 05/15/2022 – 02/29/2024, valued at $137,700,064);
expected proceeds $135,542,250
|
2.410% | 07/08/2019 | 07/08/2019 | 135,000,000 | 135,000,000 | |||||
|
Agreement with Citigroup Global Markets, Inc. and Bank of New York Mellon (Tri-Party), dated 06/28/2019 (collateralized by U.S. Treasury Bills, 0.000% due 07/02/2019 – 07/09/2019, U.S. Treasury Bonds, 2.875% –
3.000% due 02/15/2049 – 05/15/2049, and a U.S. Treasury Inflation Index Bond, 1.000% due 02/15/2049, valued at $510,018,835); expected proceeds $500,236,250
|
2.430% | 07/05/2019 | 07/05/2019 | 500,000,000 | 500,000,000 | |||||
|
Agreement with Citigroup Global Markets, Inc. and Bank of New York Mellon (Tri-Party), dated 06/28/2019 (collateralized by U.S. Treasury Bonds, 2.750% – 3.625% due 02/15/2044 – 11/15/2047, and a U.S. Treasury
Inflation Index Bond, 1.000% due 02/15/2048, valued at $18,360,079); expected proceeds $18,003,735
|
2.490% | 07/01/2019 | 07/01/2019 | 18,000,000 | 18,000,000 | |||||
|
Agreement with Credit Agricole Corporate and Investment Bank and Bank of New York Mellon (Tri-Party), dated 06/06/2019 (collateralized by U.S. Treasury Notes, 2.125% – 2.625% due 07/15/2021 – 12/31/2022, valued
at $188,700,076); expected proceeds $185,391,378
|
2.380% | 07/08/2019 | 07/08/2019 | 185,000,000 | 185,000,000 | |||||
|
Agreement with Credit Agricole Corporate and Investment Bank and Bank of New York Mellon (Tri-Party), dated 06/28/2019 (collateralized by a U.S. Treasury Inflation Index Note, 0.125% due 07/15/2024, and U.S. Treasury Notes,
1.375% – 2.000% due 03/31/2020 – 03/31/2022, valued at $414,120,093); expected proceeds $406,083,907
|
2.480% | 07/01/2019 | 07/01/2019 | 406,000,000 | 406,000,000 | |||||
|
Agreement with Fixed Income Clearing Corp., and Bank of New York Mellon (Tri-Party), dated 06/28/2019 (collateralized by a U.S. Treasury Bill, 0.000% due 06/18/2020, valued at $714,000,048); expected proceeds $700,145,833
|
2.500% | 07/01/2019 | 07/01/2019 | 700,000,000 | 700,000,000 | |||||
|
Agreement with Goldman Sachs & Co. and Bank of New York Mellon (Tri-Party), dated 06/24/2019 (collateralized by U.S. Treasury Notes, 2.000% – 2.750% due 08/31/2023 – 04/30/2024, and U.S. Treasury Strips,
0.000% due 08/15/2019 – 02/15/2027, valued at $204,000,049); expected proceeds $200,095,667
|
2.460% | 07/01/2019 | 07/01/2019 | 200,000,000 | 200,000,000 | |||||
|
Agreement with Goldman Sachs & Co. and Bank of New York Mellon (Tri-Party), dated 06/25/2019 (collateralized by a U.S. Treasury Note, 2.125% due 08/15/2021, and U.S. Treasury Strips, 0.000% due 05/15/2021 –
08/15/2026, valued at $255,000,000); expected proceeds $250,120,069
|
2.470% | 07/02/2019 | 07/02/2019 | 250,000,000 | 250,000,000 |
| Name of Issuer and Title of Issue | Interest Rate | Next Rate Reset Date | Maturity Date | Principal Amount | Value | |||||
|
Agreement with HSBC Securities USA, Inc. and Bank of New York Mellon (Tri-Party), dated 06/28/2019 (collateralized by a U.S. Treasury Bond, 3.000% due 05/15/2045, U.S. Treasury Inflation Index Notes, 0.625% – 1.125%
due 01/15/2021 – 07/15/2021, and a U.S. Treasury Strip, 0.000% due 08/15/2027, valued at $232,560,027); expected proceeds $228,047,500
|
2.500% | 07/01/2019 | 07/01/2019 | $ 228,000,000 | $ 228,000,000 | |||||
|
Agreement with JP Morgan Securities, Inc. and Bank of New York Mellon (Tri-Party), dated 06/11/2019 (collateralized by a U.S. Treasury Note, 2.750% due 07/31/2023, valued at $178,500,096); expected proceeds $176,429,167 (c) |
2.450% | 07/01/2019 | 10/09/2019 | 175,000,000 | 175,000,000 | |||||
| Agreement with JP Morgan Securities, Inc. and Bank of New York Mellon (Tri-Party), dated 06/28/2019 (collateralized by a U.S. Treasury Bill, 0.000% due 05/21/2020, and U.S. Treasury Notes, 2.125% – 2.875% due 11/15/2021 – 12/31/2021, valued at $1,151,580,032); expected proceeds $1,129,238,031 | 2.530% | 07/01/2019 | 07/01/2019 | 1,129,000,000 | 1,129,000,000 | |||||
|
Agreement with LLOYDS Bank PLC and Clearstream (Tri-Party), and dated 04/26/2019 (collateralized by a U.S. Treasury Inflation Index Note, 0.750% due 07/15/2028, and U.S. Treasury Notes, 2.000% – 2.250% due 02/15/2023
– 11/15/2027, valued at $67,179,547); expected proceeds $65,374,581
(c) |
2.530% | 07/01/2019 | 07/17/2019 | 65,000,000 | 65,000,000 | |||||
|
Agreement with LLOYDS Bank PLC and Clearstream (Tri-Party), and dated 04/26/2019 (collateralized by U.S. Treasury Notes, 1.875% – 2.875% due 08/31/2022 – 11/15/2027, valued at $36,161,437); expected proceeds
$35,231,214
(c) |
2.530% | 07/01/2019 | 07/29/2019 | 35,000,000 | 35,000,000 | |||||
|
Agreement with Norinchukin Bank and Bank of New York Mellon (Tri-Party), dated 05/09/2019 (collateralized by U.S. Treasury Inflation Index Notes, 0.375% – 1.125% due 01/15/2021 – 01/15/2027, and a U.S. Treasury
Note, 2.000% due 11/15/2026, valued at $71,400,058); expected proceeds $70,462,933
(c) |
2.480% | 08/13/2019 | 08/13/2019 | 70,000,000 | 70,000,000 | |||||
|
Agreement with Norinchukin Bank and Bank of New York Mellon (Tri-Party), dated 06/12/2019 (collateralized by U.S. Treasury Inflation Index Notes, 0.375% – 1.125% due 01/15/2021 – 01/15/2027, and a U.S. Treasury
Note, 3.375% due 11/15/2019, valued at $102,000,005); expected proceeds $100,607,083
(c) |
2.350% | 09/13/2019 | 09/13/2019 | 100,000,000 | 100,000,000 | |||||
|
Agreement with Norinchukin Bank and Bank of New York Mellon (Tri-Party), dated 06/24/2019 (collateralized by U.S. Treasury Inflation Index Notes, 0.375% – 1.125% due 01/15/2021 – 01/15/2027, and a U.S. Treasury
Note, 2.000% due 11/15/2026, valued at $71,400,043); expected proceeds $70,415,022
(c) |
2.320% | 09/24/2019 | 09/24/2019 | 70,000,000 | 70,000,000 | |||||
|
Agreement with Prudential Insurance Co., dated 06/28/2019 (collateralized by a U.S. Treasury Bond, 3.375% due 11/15/2048, and U.S. Treasury Notes, 2.125% – 2.250% due 11/15/2024 – 11/15/2025, valued at
$113,088,995); expected proceeds $110,942,043
|
2.520% | 07/01/2019 | 07/01/2019 | 110,918,750 | 110,918,750 | |||||
|
Agreement with Prudential Insurance Co., dated 06/28/2019 (collateralized by U.S. Treasury Strips, 0.000% due 08/15/2025 – 11/15/2028, valued at $102,882,850); expected proceeds $100,871,179
|
2.520% | 07/01/2019 | 07/01/2019 | 100,850,000 | 100,850,000 |
| Name of Issuer and Title of Issue | Interest Rate | Next Rate Reset Date | Maturity Date | Principal Amount | Value | |||||
|
Agreement with Royal Bank of Canada and Bank of New York Mellon (Tri-Party), dated 06/28/2019 (collateralized by a U.S. Treasury Bill, 0.000% due 11/14/2019, U.S. Treasury Bonds, 2.750% – 4.375% due 11/15/2039 –
02/15/2048, a U.S. Treasury Inflation Index Bond, 0.750% due 02/15/2045, U.S. Treasury Inflation Index Notes, 1.125% – 1.250% due 07/15/2020 – 01/15/2021, and U.S. Treasury Notes, 2.125% – 2.875% due 05/31/2021 – 02/15/2024,
valued at $372,300,005); expected proceeds $365,076,042
|
2.500% | 07/01/2019 | 07/01/2019 | $ 365,000,000 | $ 365,000,000 | |||||
|
Agreement with Societe Generale and Bank of New York Mellon (Tri-Party), dated 06/28/2019 (collateralized by U.S. Treasury Bills, 0.000% due 07/25/2019 – 03/26/2020, U.S. Treasury Inflation Index Bonds, 1.000% –
3.875% due 01/15/2028 – 02/15/2048, a U.S. Treasury Inflation Index Note, 0.125% due 07/15/2024, U.S. Treasury Notes, 2.125% – 2.625% due 07/31/2020 – 05/15/2022, and U.S. Treasury Strips, 0.000% due 02/15/2023 – 11/15/2027,
valued at $181,560,000); expected proceeds $178,036,787
|
2.480% | 07/01/2019 | 07/01/2019 | 178,000,000 | 178,000,000 | |||||
|
Agreement with TD Securities (USA) LLC and Bank of New York Mellon (Tri-Party), dated 06/28/2019 (collateralized by U.S. Treasury Notes, 2.000% – 2.625% due 06/15/2021 – 05/31/2024, valued at $44,880,044);
expected proceeds $44,009,167
|
2.500% | 07/01/2019 | 07/01/2019 | 44,000,000 | 44,000,000 | |||||
|
Agreement with UBS Securities LLC and Bank of New York Mellon (Tri-Party), dated 06/28/2019 (collateralized by U.S. Treasury Bills, 0.000% due 07/05/2019 – 05/21/2020, U.S. Treasury Bonds, 2.750% – 6.375% due
02/15/2026 – 11/15/2047, U.S. Treasury Inflation Index Bonds, 0.625% – 3.875% due 01/15/2025 – 02/15/2046, U.S. Treasury Inflation Index Notes, 0.125% – 1.875% due 07/15/2019 – 01/15/2029, U.S. Treasury Notes, 0.875%
– 3.500% due 07/31/2019 – 02/15/2028, and U.S. Treasury Strips, 0.000% due 05/15/2022 – 05/15/2029, valued at $153,000,005); expected proceeds $150,031,250
|
2.500% | 07/01/2019 | 07/01/2019 | 150,000,000 | 150,000,000 | |||||
|
Agreement with Wells Fargo Bank and Bank of New York Mellon (Tri-Party), dated 06/28/2019 (collateralized by U.S. Treasury Bills, 0.000% due 11/07/2019 – 11/29/2019, and U.S. Treasury Notes, 1.125% – 1.625% due
02/28/2021 – 02/15/2026, valued at $560,096,722); expected proceeds $549,114,375
|
2.500% | 07/01/2019 | 07/01/2019 | 549,000,000 | 549,000,000 | |||||
|
TOTAL TREASURY REPURCHASE
AGREEMENTS |
6,413,768,750 | |||||||||
|
TOTAL INVESTMENTS –91.2%
(d)(e) |
16,675,817,233 | |||||||||
|
Other Assets in Excess of Liabilities —8.8%
|
1,608,308,909 | |||||||||
|
NET ASSETS –100.0%
|
$ 18,284,126,142 |
| (a) | Rate shown is the discount rate at time of purchase. |
| (b) | Variable Rate Security - Interest rate shown is rate in effect at June 30, 2019. For securities based on a published reference rate and spread, the reference rate and spread are indicated in the description above. |
| (c) | Illiquid security. These securities represent $515,000,000 or 2.9% of net assets as of June 30, 2019. |
| (d) | Also represents the cost for federal tax purposes. |
| (e) | Unless otherwise indicated, the values of the securities of the Portfolio are determined based on Level 2 inputs (Note 2). |
| ASSETS | |
|
Investments in unaffiliated issuers, at value and
cost |
$10,262,048,483 |
|
Repurchase agreements, at value and amortized
cost |
6,413,768,750 |
|
Total
Investments |
16,675,817,233 |
|
Cash |
1,582,964,521 |
|
Interest receivable — unaffiliated
issuers |
24,322,898 |
|
Other
Receivable |
1,797,087 |
|
TOTAL ASSETS
|
18,284,901,739 |
| LIABILITIES | |
|
Advisory and administrator fee
payable |
660,846 |
|
Custody, sub-administration and transfer agent fees
payable |
77,199 |
|
Trustees’ fees and expenses
payable |
289 |
|
Professional fees
payable |
32,889 |
|
Accrued expenses and other
liabilities |
4,374 |
|
TOTAL LIABILITIES
|
775,597 |
|
NET ASSETS
|
$18,284,126,142 |
| INVESTMENT INCOME | |
|
Interest income — unaffiliated
issuers |
$216,925,402 |
| EXPENSES | |
|
Advisory and administrator
fee |
4,399,968 |
|
Custodian, sub-administrator and transfer agent
fees |
1,146,952 |
|
Trustees’ fees and expenses
|
194,848 |
|
Professional
fees |
82,659 |
|
Printing and postage
fees |
22,661 |
|
Insurance
expense |
3,336 |
|
Miscellaneous
expenses |
5,818 |
|
TOTAL
EXPENSES |
5,856,242 |
|
NET INVESTMENT INCOME
(LOSS) |
$211,069,160 |
| REALIZED GAIN (LOSS) | |
| Net realized gain (loss) on: | |
|
Investments — unaffiliated
issuers |
21,451 |
|
NET INCREASE (DECREASE) IN NET ASSETS FROM
OPERATIONS |
$211,090,611 |
| Six
Months Ended 6/30/19 (Unaudited) |
Year
Ended 12/31/18 | ||
| INCREASE (DECREASE) IN NET ASSETS FROM OPERATIONS: | |||
|
Net investment income
(loss) |
$ 211,069,160 | $ 250,070,855 | |
|
Net realized gain
(loss) |
21,451 | 1,950 | |
|
Net increase (decrease) in net assets resulting from
operations |
211,090,611 | 250,072,805 | |
| CAPITAL TRANSACTIONS | |||
|
Contributions |
14,848,481,579 | 39,817,102,235 | |
|
Withdrawals |
(14,222,710,980) | (36,800,190,630) | |
|
Net increase (decrease) in net assets from capital transactions
|
625,770,599 | 3,016,911,605 | |
|
Net increase (decrease) in net assets during the
period |
836,861,210 | 3,266,984,410 | |
|
Net assets at beginning of
period |
17,447,264,932 | 14,180,280,522 | |
|
NET ASSETS AT END OF
PERIOD |
$ 18,284,126,142 | $ 17,447,264,932 |
| Six
Months Ended 6/30/19 (Unaudited) |
Year
Ended 12/31/18 |
Year
Ended 12/31/17 |
Year
Ended 12/31/16 |
Year
Ended 12/31/15 |
Year
Ended 12/31/14 | ||||||
|
Total return
(a) |
1.19% | 1.82% | 0.82% | 0.23% | (0.01)% | (0.02)% | |||||
| Ratios and Supplemental Data: | |||||||||||
|
Net assets, end of period (in
000s) |
$18,284,126 | $17,447,265 | $14,180,281 | $10,628,952 | $1,744,814 | $2,765,530 | |||||
| Ratios to average net assets: | |||||||||||
|
Total
expenses |
0.07%(b) | 0.07% | 0.07% | 0.07% | 0.07% | 0.07% | |||||
|
Net investment income
(loss) |
2.40%(b) | 1.79% | 0.84% | 0.27% | (0.01)% | (0.02)% |
| (a) | Results represent past performance and are not indicative of future results. Total return for periods of less than one year are not annualized. |
| (b) | Annualized. |
| Actual | Hypothetical
(assuming a 5% return before expenses) | ||||||||
| Annualized
Expense Ratio |
Ending
Account Value |
Expenses
Paid During Period(a) |
Ending
Account Value |
Expenses
Paid During Period(a) | |||||
|
State Street Treasury Plus Money Market
Portfolio |
0.07% | $1,011.90 | $0.35 | $1,024.40 | $0.35 | ||||
| (a) | Expenses are equal to the Portfolio’s annualized net expense ratio multiplied by the average account value of the period, multiplied by 181, then divided by 365. |
| • | A report prepared by an independent third-party provider of investment company data, which includes for the feeder fund for which the Portfolio serves as the master fund in a master-feeder structure (the “Fund”): |
| • | Comparisons of the Fund’s performance over the past one-, three-, five- and ten-year periods ended December 31, 2018, to the performance of an appropriate benchmark constructed by Broadridge Financial Solutions, Inc., the successor to Lipper, Inc. (“Broadridge”), for the Fund (the “Lipper Index”) and a universe of other mutual funds with similar investment objectives and policies (the “Performance Group” and/or the “Performance Universe”); |
| • | Comparisons of the Fund’s expense ratio (with detail of component expenses) to the expense ratios of a group of comparable mutual funds selected by the independent third-party data provider (the “Expense Group” and/or “Expense Universe”); |
| • | A chart showing the Fund’s historical average net assets relative to its total expenses, management fees, and non-management expenses over the past five calendar years; and |
| • | Comparative information concerning fees charged by the Adviser for managing institutional accounts using investment strategies and techniques similar to those used in managing the Fund; and |
| • | Profitability analyses for (a) the Adviser with respect to the Portfolio and (b) affiliates of the Adviser that provide services to the Portfolio (“Affiliated Service Providers”). |
| • | Descriptions of the investment management services provided by the Adviser, including its investment strategies and processes; |
| • | Information concerning the allocation of brokerage; and |
| • | Information regarding the procedures and processes used to value the assets of the Portfolio. |
| • | Reports detailing the financial results and condition of the Adviser and its affiliates; |
| • | Descriptions of the qualifications, education and experience of the individual investment and other professionals responsible for managing the portfolio of the Portfolio and for Portfolio operations; |
| • | Information relating to compliance with and the administration of the Code of Ethics adopted by the Adviser; |
| • | A copy of the Adviser’s proxy voting policies and procedures and other information regarding the Adviser’s practices for overseeing proxy vendors; |
| • | Information concerning the resources devoted by the Adviser to overseeing compliance by the Portfolio and its service providers, including information concerning compliance with investment policies and restrictions and other operating policies of the Portfolio; |
| • | A description of the adequacy and sophistication of the Adviser’s technology and systems with respect to investment and administrative matters and a description of any material improvements or changes in technology or systems in the past year; |
| • | A description of the business continuity and disaster recovery plans of the Adviser; and |
| • | Information regarding the Adviser’s risk management processes. |
| • | Information concerning the nature, extent, quality and cost of services provided to the Portfolio by SSGA FM in its capacity as the Portfolio’s administrator (the “Administrator”); |
| • | Information concerning the nature, extent, quality and cost of various non-investment management services provided to the Portfolio by affiliates of the Adviser, including the custodian, sub-administrator, transfer agent and fund accountant of the Portfolio, and the role of the Adviser in managing the Portfolio’s relationship with these service providers; |
| • | Copies of the Advisory Agreement and agreements with other service providers of the Portfolio; |
| • | Draft responses to a letter from independent legal counsel to the Independent Trustees (“Independent Counsel”), reviewed prior to such date by Independent Counsel, requesting specific information from each of: |
| • | SSGA FM, in its capacity as the Portfolio’s Adviser and Administrator, with respect to its operations relating to the Portfolio and its approximate profit margins from such operations for the calendar year ended December 31, 2018; and the relevant operations of other affiliated service providers to the Portfolio, together with their approximate profit margins from such relevant operations for the calendar year ended December 31, 2018; |
| • | State Street Bank and Trust Company (“State Street”), the sub-administrator, custodian and transfer agent for the Portfolio, with respect to its operations relating to the Portfolio; and |
| • | State Street Global Advisors Funds Distributors, LLC, the principal underwriter and distributor of the shares of the Portfolio (the “Distributor”), with respect to its operations relating to the Portfolio; |
| • | Information from SSGA FM, State Street and the Distributor with respect to the Trust providing any material changes to the previous information supplied in response to the letter from Independent Counsel prior to the executive session of the Board on May 15, 2019; |
| • | Materials provided by Broadridge, circulated to the Independent Trustees and to Independent Counsel, with respect to the Fund; and |
| • | A summary of the foregoing materials prepared by Independent Counsel. |
State Street Bank and Trust Company
P.O. Box 5049
Boston, MA 02206
| State Street Aggregate Bond Index Fund |
| State Street Global Equity ex-U.S. Index Fund |
| State Street Small/Mid Cap Equity Index Fund |
| State Street Aggregate Bond Index Portfolio |
| State Street Global Equity ex-U.S. Index Portfolio |
| State Street Small/Mid Cap Equity Index Portfolio |

|
|
1 |
|
|
5 |
| Portfolio Statistics (Unaudited) | |
|
|
14 |
|
|
15 |
|
|
16 |
| Schedules of Investments (Unaudited) | |
|
|
17 |
|
|
63 |
|
|
88 |
|
|
116 |
|
|
119 |
|
|
122 |
|
|
133 |
| State Street Aggregate Bond Index Fund | State Street Global Equity ex-U.S. Index Fund | State Street Small/Mid Cap Equity Index Fund | |||
| ASSETS | |||||
|
Investment in corresponding affiliated Portfolio, at
value* |
$163,392,789 | $326,785,122 | $95,227,022 | ||
|
Receivable for fund shares
sold |
1,009,999 | 1,383,465 | 1,281,002 | ||
|
Receivable from
Adviser |
49,207 | 71,500 | 33,935 | ||
|
TOTAL ASSETS
|
164,451,995 | 328,240,087 | 96,541,959 | ||
| LIABILITIES | |||||
|
Payable for investments
purchased |
988,148 | 514,733 | 1,265,511 | ||
|
Payable for fund shares
repurchased |
17,351 | 862,942 | 10,991 | ||
|
Advisory fee
payable |
3,307 | 15,508 | 2,213 | ||
|
Custodian fees
payable |
2,464 | 2,577 | 2,590 | ||
|
Administration fees
payable |
6,626 | 44,203 | 3,701 | ||
|
Distribution fees
payable |
441 | 1,055 | 3,279 | ||
|
Accrued Trustees' fees and
expenses |
— | — | 953 | ||
|
Transfer agent fees
payable |
2,356 | 3,291 | 309 | ||
|
Registration and filing fees
payable |
1,386 | 2,966 | — | ||
|
Professional fees
payable |
15,904 | 15,910 | 15,606 | ||
|
Printing and postage fees
payable |
2,422 | 1,962 | 2,468 | ||
|
TOTAL LIABILITIES
|
1,040,405 | 1,465,147 | 1,307,621 | ||
|
NET ASSETS
|
$163,411,590 | $326,774,940 | $95,234,338 | ||
| NET ASSETS CONSIST OF: | |||||
|
Paid-in
Capital |
$160,085,986 | $316,769,013 | $91,505,964 | ||
|
Total distributable earnings
(loss) |
3,325,604 | 10,005,927 | 3,728,374 | ||
|
NET ASSETS
|
$163,411,590 | $326,774,940 | $95,234,338 | ||
| Class A | |||||
|
Net
Assets |
$ 2,180,843 | $ 5,444,000 | $17,784,777 | ||
|
Shares
Outstanding |
217,263 | 567,266 | 1,422,406 | ||
|
Net asset value, offering and redemption price per
share |
$ 10.04 | $ 9.60 | $ 12.50 | ||
|
Maximum sales
charge |
3.75% | 5.25% | 5.25% | ||
|
Maximum offering price per
share |
$ 10.43 | $ 10.13 | $ 13.19 | ||
| Class I | |||||
|
Net
Assets |
$ 11,385,943 | $ 680,390 | $ 6,527,739 | ||
|
Shares
Outstanding |
1,136,730 | 70,768 | 521,292 | ||
|
Net asset value, offering and redemption price per
share |
$ 10.02 | $ 9.61 | $ 12.52 | ||
| Class K | |||||
|
Net
Assets |
$149,844,804 | $320,650,550 | $70,921,822 | ||
|
Shares
Outstanding |
14,970,671 | 33,300,821 | 5,661,520 | ||
|
Net asset value, offering and redemption price per
share |
$ 10.01 | $ 9.63 | $ 12.53 | ||
| COST OF INVESTMENTS: | |||||
|
*Investment in corresponding affiliated Portfolio, at
cost |
$159,236,560 | $321,712,936 | $94,283,203 |
| State Street Aggregate Bond Index Fund | State Street Global Equity ex-U.S. Index Fund | State Street Small/Mid Cap Equity Index Fund | |||
| INVESTMENT INCOME | |||||
|
Interest income — unaffiliated
issuers |
$ — | $ 76 | $ 28 | ||
|
Dividend income from corresponding affiliated
Portfolio |
1,807,518 | — | — | ||
|
TOTAL INVESTMENT INCOME
(LOSS) |
1,807,518 | 76 | 28 | ||
| EXPENSES | |||||
|
Advisory
fee |
18,519 | 134,212 | 10,354 | ||
|
Administration
fees |
42,230 | 148,395 | 22,419 | ||
| Sub-transfer agent fee | |||||
|
Class
A |
15 | 523 | 964 | ||
|
Class
I |
61 | 300 | 751 | ||
| Distribution fees | |||||
|
Class
A |
2,369 | 5,456 | 15,582 | ||
|
Custodian
fees |
18,755 | 18,745 | 18,744 | ||
|
Trustees’ fees and expenses
|
9,001 | 9,001 | 9,953 | ||
|
Transfer agent
fees |
35,970 | 35,900 | 11,137 | ||
|
Registration and filing
fees |
43,507 | 44,380 | 32,915 | ||
|
Professional fees and
expenses |
22,017 | 22,024 | 21,719 | ||
|
Printing and postage
fees |
6,210 | 9,080 | 4,683 | ||
|
Insurance
expense |
323 | 1,317 | 93 | ||
|
TOTAL
EXPENSES |
198,977 | 429,333 | 149,314 | ||
|
Expenses waived/reimbursed by the
Adviser |
(178,013) | (385,279) | (116,488) | ||
|
NET
EXPENSES |
20,964 | 44,054 | 32,826 | ||
|
NET INVESTMENT INCOME
(LOSS) |
$1,786,554 | $ (43,978) | $ (32,798) | ||
| REALIZED AND UNREALIZED GAIN (LOSS) | |||||
| Net realized gain (loss) on: | |||||
|
Investment in corresponding affiliated
Portfolio |
(26,580) | 7,069,202 | 403,113 | ||
| Net change in unrealized appreciation/depreciation on: | |||||
|
Investment in corresponding affiliated
Portfolio |
7,303,528 | 44,003,730 | 10,252,519 | ||
|
NET REALIZED AND UNREALIZED GAIN
(LOSS) |
7,276,948 | 51,072,932 | 10,655,632 | ||
|
NET INCREASE (DECREASE) IN NET ASSETS FROM
OPERATIONS |
$9,063,502 | $51,028,954 | $10,622,834 |
| State Street Aggregate Bond Index Fund | State Street Global Equity ex-U.S. Index Fund | State Street Small/Mid Cap Equity Index Fund | |||||||||
| Six
Months Ended 6/30/19 (Unaudited) |
Year
Ended 12/31/18 |
Six
Months Ended 6/30/19 (Unaudited) |
Year
Ended 12/31/18 |
Six
Months Ended 6/30/19 (Unaudited) |
Year
Ended 12/31/18 | ||||||
| INCREASE (DECREASE) IN NET ASSETS FROM OPERATIONS: | |||||||||||
|
Net investment income
(loss) |
$ 1,786,554 | $ 3,313,604 | $ (43,978) | $ 11,853,723 | $ (32,798) | $ 851,141 | |||||
|
Net realized gain
(loss) |
(26,580) | (716,389) | 7,069,202 | 7,670,457 | 403,113 | 2,964,458 | |||||
|
Net change in unrealized
appreciation/depreciation |
7,303,528 | (2,180,624) | 44,003,730 | (87,372,839) | 10,252,519 | (11,405,264) | |||||
|
Net increase (decrease) in net assets resulting from
operations |
9,063,502 | 416,591 | 51,028,954 | (67,848,659) | 10,622,834 | (7,589,665) | |||||
| DISTRIBUTIONS TO SHAREHOLDERS: | |||||||||||
|
Class
A |
(17,139) | (15,298) | — | (239,408) | — | (291,904) | |||||
|
Class
I |
(133,497) | (292,330) | — | (61,342) | — | (180,583) | |||||
|
Class
K |
(1,639,961) | (3,009,769) | — | (31,433,325) | — | (1,357,502) | |||||
|
Total distributions to shareholders
|
(1,790,597) | (3,317,397) | — | (31,734,075) | — | (1,829,989) | |||||
| FROM BENEFICIAL INTEREST TRANSACTIONS: | |||||||||||
| Class A | |||||||||||
|
Proceeds from sale of shares
sold |
1,990,485 | 956,614 | 1,821,622 | 3,431,591 | 9,264,985 | 11,154,832 | |||||
|
Reinvestment of
distributions |
17,139 | 15,113 | — | 239,408 | — | 291,840 | |||||
|
Cost of shares
redeemed |
(1,050,506) | (185,045) | (492,924) | (258,352) | (2,644,641) | (1,528,358) | |||||
|
Net increase (decrease) from capital share
transactions |
957,118 | 786,682 | 1,328,698 | 3,412,647 | 6,620,344 | 9,918,314 | |||||
| Class I | |||||||||||
|
Proceeds from sale of shares
sold |
417,518 | 1,295,351 | 101,530 | 27,666 | 979,027 | 1,881,040 | |||||
|
Reinvestment of
distributions |
47,359 | 102,198 | — | 61,342 | — | 180,583 | |||||
|
Cost of shares
redeemed |
(199,409) | (1,294,529) | (141,350) | (246,039) | (481,714) | (362,509) | |||||
|
Net increase (decrease) from capital share
transactions |
265,468 | 103,020 | (39,820) | (157,031) | 497,313 | 1,699,114 | |||||
| Class K | |||||||||||
|
Proceeds from sale of shares
sold |
21,458,004 | 46,337,876 | 56,613,930 | 97,730,912 | 27,692,053 | 28,553,804 | |||||
|
Reinvestment of
distributions |
1,639,961 | 3,009,769 | — | 31,214,470 | — | 1,332,147 | |||||
|
Cost of shares
redeemed |
(7,717,518) | (16,266,407) | (219,476,515) | (53,791,160) | (2,704,789) | (3,449,083) | |||||
|
Net increase (decrease) from capital share
transactions |
15,380,447 | 33,081,238 | (162,862,585) | 75,154,222 | 24,987,264 | 26,436,868 | |||||
|
Net increase (decrease) in net assets from beneficial interest transactions
|
16,603,033 | 33,970,940 | (161,573,707) | 78,409,838 | 32,104,921 | 38,054,296 | |||||
|
Net increase (decrease) in net assets during the
period |
23,875,938 | 31,070,134 | (110,544,753) | (21,172,896) | 42,727,755 | 28,634,642 | |||||
|
Net assets at beginning of
period |
139,535,652 | 108,465,518 | 437,319,693 | 458,492,589 | 52,506,583 | 23,871,941 | |||||
|
NET ASSETS AT END OF
PERIOD |
$163,411,590 | $139,535,652 | $ 326,774,940 | $437,319,693 | $95,234,338 | $ 52,506,583 | |||||
| SHARES OF BENEFICIAL INTEREST: | |||||||||||
| Class A | |||||||||||
|
Shares
sold |
205,899 | 100,646 | 194,961 | 336,001 | 755,355 | 897,673 | |||||
|
Reinvestment of
distributions |
1,756 | 1,594 | — | 28,604 | — | 28,251 | |||||
|
Shares
redeemed |
(107,766) | (19,456) | (53,246) | (25,912) | (218,548) | (123,003) | |||||
|
Net increase (decrease) from share
transactions |
99,889 | 82,784 | 141,715 | 338,693 | 536,807 | 802,921 | |||||
| Class I | |||||||||||
|
Shares
sold |
43,150 | 136,002 | 10,955 | 2,568 | 81,899 | 148,991 | |||||
|
Reinvestment of
distributions |
4,874 | 10,740 | — | 7,321 | — | 17,481 | |||||
|
Shares
redeemed |
(20,470) | (135,738) | (15,222) | (28,500) | (41,548) | (31,541) | |||||
|
Net increase (decrease) from share
transactions |
27,554 | 11,004 | (4,267) | (18,611) | 40,351 | 134,931 | |||||
| State Street Aggregate Bond Index Fund | State Street Global Equity ex-U.S. Index Fund | State Street Small/Mid Cap Equity Index Fund | |||||||||
| Six
Months Ended 6/30/19 (Unaudited) |
Year
Ended 12/31/18 |
Six
Months Ended 6/30/19 (Unaudited) |
Year
Ended 12/31/18 |
Six
Months Ended 6/30/19 (Unaudited) |
Year
Ended 12/31/18 | ||||||
| Class K | |||||||||||
|
Shares
sold |
$ 2,199,774 | $ 4,879,259 | $ 6,077,372 | $ 9,921,926 | $ 2,243,549 | $ 2,229,951 | |||||
|
Reinvestment of
distributions |
168,831 | 316,549 | — | 3,720,438 | — | 128,959 | |||||
|
Shares
redeemed |
(784,712) | (1,704,883) | (23,900,836) | (5,266,494) | (227,792) | (281,909) | |||||
|
Net increase (decrease) from share
transactions |
1,583,893 | 3,490,925 | (17,823,464) | 8,375,870 | 2,015,757 | 2,077,001 | |||||
| Class A | |||||||||||
| Six
Months Ended 6/30/19 (Unaudited) |
Year
Ended 12/31/18 |
Year
Ended 12/31/17 |
Year
Ended 12/31/16 |
Year
Ended 12/31/15 |
For
the Period 9/19/14* - 12/31/14 | ||||||
|
Net asset value, beginning of
period |
$ 9.55 | $ 9.82 | $ 9.75 | $ 9.75 | $10.14 | $10.00 | |||||
| Income (loss) from investment operations: | |||||||||||
|
Net investment income (loss)
(a) |
0.11 | 0.26 | 0.21 | 0.16 | 0.21 | 0.02 | |||||
|
Net realized and unrealized gain
(loss) |
0.46 | (0.30) | 0.08 | 0.03 | (0.18) | 0.16 | |||||
|
Total from investment
operations |
0.57 | (0.04) | 0.29 | 0.19 | 0.03 | 0.18 | |||||
| Distributions to shareholders from: | |||||||||||
|
Net investment
income |
(0.08) | (0.23) | (0.21) | (0.18) | (0.26) | (0.04) | |||||
|
Net realized
gains |
— | — | (0.01) | (0.01) | (0.14) | — | |||||
|
Return of
Capital |
— | — | — | — | (0.02) | — | |||||
|
Total
distributions |
(0.08) | (0.23) | (0.22) | (0.19) | (0.42) | (0.04) | |||||
|
Net asset value, end of
period |
$10.04 | $ 9.55 | $ 9.82 | $ 9.75 | $ 9.75 | $10.14 | |||||
|
Total return
(b) |
6.03% | (0.39)% | 2.93% | 1.91% | 0.35% | 1.85% | |||||
| Ratios and Supplemental Data: | |||||||||||
|
Net assets, end of period (in
000s) |
$2,181 | $1,121 | $ 340 | $ 211 | $ 184 | $ 51 | |||||
| Ratios to Average Net Assets: | |||||||||||
|
Total expenses
(c) |
0.52%(d) | 0.55% | 0.58% | 0.67% | 0.66% | 0.91%(d) | |||||
|
Net expenses
(c) |
0.28%(d) | 0.31% | 0.40% | 0.40% | 0.31% | 0.52%(d) | |||||
|
Net investment income
(loss) |
2.29%(d) | 2.74% | 2.11% | 1.65% | 2.11% | 0.58%(d) | |||||
|
Portfolio turnover rate
(e) |
26%(f) | 90% | 99% | 194% | 62%(g) | 16%(f)(g) | |||||
| * | Commencement of operations. |
| (a) | Net investment income per share is calculated using the average shares method. |
| (b) | Total return is calculated assuming a purchase of shares at net asset value on the first day and a sale at net asset value on the last day of each period reported. Distributions are assumed, for the purpose of this calculation, to be reinvested at net asset value per share on the respective payment dates of the Fund. Total return for periods less than one year are not annualized. Results represent past performance and are not indicative of future results. |
| (c) | Ratio does not include the expenses of the corresponding Portfolio. |
| (d) | Annualized. |
| (e) | Portfolio turnover rate is from the corresponding Portfolio. |
| (f) | Not annualized. |
| (g) | Portfolio turnover rate excludes to-be-announced (“TBA”) transactions. |
| Class I | |||||||||||
| Six
Months Ended 6/30/19 (Unaudited) |
Year
Ended 12/31/18 |
Year
Ended 12/31/17 |
Year
Ended 12/31/16 |
Year
Ended 12/31/15 |
For
the Period 9/19/14* - 12/31/14 | ||||||
|
Net asset value, beginning of
period |
$ 9.55 | $ 9.84 | $ 9.76 | $ 9.74 | $10.13 | $10.00 | |||||
| Income (loss) from investment operations: | |||||||||||
|
Net investment income (loss)
(a) |
0.12 | 0.27 | 0.23 | 0.18 | 0.20 | 0.08 | |||||
|
Net realized and unrealized gain
(loss) |
0.47 | (0.29) | 0.09 | 0.06 | (0.14) | 0.09 | |||||
|
Total from investment
operations |
0.59 | (0.02) | 0.32 | 0.24 | 0.06 | 0.17 | |||||
| Distributions to shareholders from: | |||||||||||
|
Net investment
income |
(0.12) | (0.27) | (0.23) | (0.21) | (0.29) | (0.04) | |||||
|
Net realized
gains |
— | — | (0.01) | (0.01) | (0.14) | — | |||||
|
Return of
Capital |
— | — | — | — | (0.02) | — | |||||
|
Total
distributions |
(0.12) | (0.27) | (0.24) | (0.22) | (0.45) | (0.04) | |||||
|
Net asset value, end of
period |
$ 10.02 | $ 9.55 | $ 9.84 | $ 9.76 | $ 9.74 | $10.13 | |||||
|
Total return
(b) |
6.20% | (0.20)% | 3.29% | 2.37% | 0.60% | 1.82% | |||||
| Ratios and Supplemental Data: | |||||||||||
|
Net assets, end of period (in
000s) |
$11,386 | $10,598 | $10,807 | $12,370 | $4,508 | $4,484 | |||||
| Ratios to Average Net Assets: | |||||||||||
|
Total expenses
(c) |
0.27%(d) | 0.27% | 0.26% | 0.33% | 0.41% | 0.88%(d) | |||||
|
Net expenses
(c) |
0.03%(d) | 0.04% | 0.08% | 0.06% | 0.06% | 0.28%(d) | |||||
|
Net investment income
(loss) |
2.44%(d) | 2.78% | 2.30% | 1.83% | 1.95% | 2.91%(d) | |||||
|
Portfolio turnover rate
(e) |
26%(f) | 90% | 99% | 194% | 62%(g) | 16%(f)(g) | |||||
| * | Commencement of operations. |
| (a) | Net investment income per share is calculated using the average shares method. |
| (b) | Total return is calculated assuming a purchase of shares at net asset value on the first day and a sale at net asset value on the last day of each period reported. Distributions are assumed, for the purpose of this calculation, to be reinvested at net asset value per share on the respective payment dates of the Fund. Total return for periods less than one year are not annualized. Results represent past performance and are not indicative of future results. |
| (c) | Ratio does not include the expenses of the corresponding Portfolio. |
| (d) | Annualized. |
| (e) | Portfolio turnover rate is from the corresponding Portfolio. |
| (f) | Not annualized. |
| (g) | Portfolio turnover rate excludes to-be-announced (“TBA”) transactions. |
| Class K | |||||||||||
| Six
Months Ended 6/30/19 (Unaudited) |
Year
Ended 12/31/18 |
Year
Ended 12/31/17 |
Year
Ended 12/31/16 |
Year
Ended 12/31/15 |
For
the Period 9/19/14* - 12/31/14 | ||||||
|
Net asset value, beginning of
period |
$ 9.55 | $ 9.83 | $ 9.75 | $ 9.74 | $ 10.14 | $ 10.00 | |||||
| Income (loss) from investment operations: | |||||||||||
|
Net investment income (loss)
(a) |
0.12 | 0.27 | 0.23 | 0.20 | 0.20 | 0.04 | |||||
|
Net realized and unrealized gain
(loss) |
0.46 | (0.28) | 0.09 | 0.03 | (0.15) | 0.15 | |||||
|
Total from investment
operations |
0.58 | (0.01) | 0.32 | 0.23 | 0.05 | 0.19 | |||||
| Distributions to shareholders from: | |||||||||||
|
Net investment
income |
(0.12) | (0.27) | (0.23) | (0.21) | (0.29) | (0.05) | |||||
|
Net realized
gains |
— | — | (0.01) | (0.01) | (0.14) | — | |||||
|
Return of
Capital |
— | — | — | — | (0.02) | — | |||||
|
Total
distributions |
(0.12) | (0.27) | (0.24) | (0.22) | (0.45) | (0.05) | |||||
|
Net asset value, end of
period |
$ 10.01 | $ 9.55 | $ 9.83 | $ 9.75 | $ 9.74 | $ 10.14 | |||||
|
Total return
(b) |
6.10% | (0.10)% | 3.30% | 2.27% | 0.54% | 1.97% | |||||
| Ratios and Supplemental Data: | |||||||||||
|
Net assets, end of period (in
000s) |
$149,845 | $127,817 | $97,318 | $76,429 | $49,641 | $70,950 | |||||
| Ratios to Average Net Assets: | |||||||||||
|
Total expenses
(c) |
0.27%(d) | 0.27% | 0.26% | 0.33% | 0.41% | 0.50%(d) | |||||
|
Net expenses
(c) |
0.03%(d) | 0.04% | 0.08% | 0.06% | 0.06% | 0.09%(d) | |||||
|
Net investment income
(loss) |
2.41%(d) | 2.83% | 2.37% | 1.98% | 1.88% | 1.33%(d) | |||||
|
Portfolio turnover rate
(e) |
26%(f) | 90% | 99% | 194% | 62%(g) | 16%(f)(g) | |||||
| * | Commencement of operations. |
| (a) | Net investment income per share is calculated using the average shares method. |
| (b) | Total return is calculated assuming a purchase of shares at net asset value on the first day and a sale at net asset value on the last day of each period reported. Distributions are assumed, for the purpose of this calculation, to be reinvested at net asset value per share on the respective payment dates of the Fund. Total return for periods less than one year are not annualized. Results represent past performance and are not indicative of future results. |
| (c) | Ratio does not include the expenses of the corresponding Portfolio. |
| (d) | Annualized. |
| (e) | Portfolio turnover rate is from the corresponding Portfolio. |
| (f) | Not annualized. |
| (g) | Portfolio turnover rate excludes to-be-announced (“TBA”) transactions. |
| Class A | |||||||||||
| Six
Months Ended 6/30/19 (Unaudited) |
Year
Ended 12/31/18 |
Year
Ended 12/31/17 |
Year
Ended 12/31/16 |
Year
Ended 12/31/15 |
For
the Period 9/17/14* - 12/31/14 | ||||||
|
Net asset value, beginning of
period |
$ 8.46 | $ 10.67 | $ 8.74 | $ 8.45 | $ 9.17 | $10.00 | |||||
| Income (loss) from investment operations: | |||||||||||
|
Net investment income (loss)
(a) |
(0.01) | 0.36 | 0.08 | 0.31 | 0.15 | 0.04 | |||||
|
Net realized and unrealized gain
(loss) |
1.15 | (1.90) | 2.25 | 0.09 | (0.71) | (0.83) | |||||
|
Total from investment
operations |
1.14 | (1.54) | 2.33 | 0.40 | (0.56) | (0.79) | |||||
| Distributions to shareholders from: | |||||||||||
|
Net investment
income |
— | (0.23) | (0.26) | (0.11) | (0.16) | (0.04) | |||||
|
Net realized
gains |
— | (0.44) | (0.14) | — | — | — | |||||
|
Total
distributions |
— | (0.67) | (0.40) | (0.11) | (0.16) | (0.04) | |||||
|
Net asset value, end of
period |
$ 9.60 | $ 8.46 | $10.67 | $ 8.74 | $ 8.45 | $ 9.17 | |||||
|
Total return
(b) |
13.48% | (14.38)% | 26.68% | 4.75% | (6.17)% | (7.88)% | |||||
| Ratios and Supplemental Data: | |||||||||||
|
Net assets, end of period (in
000s) |
$5,444 | $ 3,599 | $ 927 | $1,564 | $ 42 | $ 46 | |||||
| Ratios to Average Net Assets: | |||||||||||
|
Total expenses
(c) |
0.47%(d) | 0.57% | 0.53% | 0.58% | 0.70% | 1.17%(d) | |||||
|
Net expenses
(c) |
0.29%(d) | 0.42% | 0.44% | 0.42% | 0.32% | 0.60%(d) | |||||
|
Net investment income
(loss) |
(0.29)%(d) | 3.59% | 0.79% | 3.51% | 1.64% | 1.55%(d) | |||||
|
Portfolio turnover rate
(e) |
9%(f) | 4% | 2% | 8% | 3% | 0%(f) | |||||
| * | Commencement of operations. |
| (a) | Net investment income per share is calculated using the average shares method. |
| (b) | Total return is calculated assuming a purchase of shares at net asset value on the first day and a sale at net asset value on the last day of each period reported. Distributions are assumed, for the purpose of this calculation, to be reinvested at net asset value per share on the respective payment dates. Total return for periods of less than one year is not annualized. Results represent past performance and are not indicative of future results. |
| (c) | Ratio does not include the expenses of the corresponding Portfolio. |
| (d) | Annualized. |
| (e) | Portfolio turnover rate is from the corresponding Portfolio. |
| (f) | Not annualized. |
| Class I | |||||||||||
| Six
Months Ended 6/30/19 (Unaudited) |
Year
Ended 12/31/18 |
Year
Ended 12/31/17 |
Year
Ended 12/31/16 |
Year
Ended 12/31/15 |
For
the Period 9/17/14* - 12/31/14 | ||||||
|
Net asset value, beginning of
period |
$ 8.46 | $ 10.67 | $ 8.74 | $ 8.45 | $ 9.17 | $10.00 | |||||
| Income (loss) from investment operations: | |||||||||||
|
Net investment income (loss)
(a) |
(0.00)(b) | 0.23 | 0.21 | 0.17 | 0.18 | 0.05 | |||||
|
Net realized and unrealized gain
(loss) |
1.15 | (1.76) | 2.14 | 0.25 | (0.72) | (0.83) | |||||
|
Total from investment
operations |
1.15 | (1.53) | 2.35 | 0.42 | (0.54) | (0.78) | |||||
| Distributions to shareholders from: | |||||||||||
|
Net investment
income |
— | (0.24) | (0.28) | (0.13) | (0.18) | (0.05) | |||||
|
Net realized
gains |
— | (0.44) | (0.14) | — | — | — | |||||
|
Total
distributions |
— | (0.68) | (0.42) | (0.13) | (0.18) | (0.05) | |||||
|
Net asset value, end of
period |
$ 9.61 | $ 8.46 | $10.67 | $ 8.74 | $ 8.45 | $ 9.17 | |||||
|
Total return
(c) |
13.46% | (14.18)% | 27.00% | 5.02% | (5.94)% | (7.81)% | |||||
| Ratios and Supplemental Data: | |||||||||||
|
Net assets, end of period (in
000s) |
$ 680 | $ 635 | $ 999 | $ 501 | $ 42 | $ 46 | |||||
| Ratios to Average Net Assets: | |||||||||||
|
Total expenses
(d) |
0.28%(e) | 0.43% | 0.23% | 0.32% | 0.45% | 0.92%(e) | |||||
|
Net expenses
(d) |
0.10%(e) | 0.30% | 0.15% | 0.16% | 0.06% | 0.35%(e) | |||||
|
Net investment income
(loss) |
(0.10)%(e) | 2.27% | 2.12% | 2.01% | 1.89% | 1.81%(e) | |||||
|
Portfolio turnover rate
(f) |
9%(g) | 4% | 2% | 8% | 3% | 0%(g) | |||||
| * | Commencement of operations. |
| (a) | Net investment income per share is calculated using the average shares method. |
| (b) | Amount is less than $0.005 per share. |
| (c) | Total return is calculated assuming a purchase of shares at net asset value on the first day and a sale at net asset value on the last day of each period reported. Distributions are assumed, for the purpose of this calculation, to be reinvested at net asset value per share on the respective payment dates. Total return for periods of less than one year is not annualized. Results represent past performance and are not indicative of future results. |
| (d) | Ratio does not include the expenses of the corresponding Portfolio. |
| (e) | Annualized. |
| (f) | Portfolio turnover rate is from the corresponding Portfolio. |
| (g) | Not annualized. |
| Class K | |||||||||||
| Six
Months Ended 6/30/19 (Unaudited) |
Year
Ended 12/31/18 |
Year
Ended 12/31/17 |
Year
Ended 12/31/16 |
Year
Ended 12/31/15 |
For
the Period 9/17/14* - 12/31/14 | ||||||
|
Net asset value, beginning of
period |
$ 8.47 | $ 10.68 | $ 8.74 | $ 8.45 | $ 9.17 | $ 10.00 | |||||
| Income (loss) from investment operations: | |||||||||||
|
Net investment income (loss)
(a) |
(0.00)(b) | 0.26 | 0.32 | 0.20 | 0.24 | 0.05 | |||||
|
Net realized and unrealized gain
(loss) |
1.16 | (1.77) | 2.04 | 0.22 | (0.78) | (0.83) | |||||
|
Total from investment
operations |
1.16 | (1.51) | 2.36 | 0.42 | (0.54) | (0.78) | |||||
| Distributions to shareholders from: | |||||||||||
|
Net investment
income |
— | (0.26) | (0.28) | (0.13) | (0.18) | (0.05) | |||||
|
Net realized
gains |
— | (0.44) | (0.14) | — | — | — | |||||
|
Total
distributions |
— | (0.70) | (0.42) | (0.13) | (0.18) | (0.05) | |||||
|
Net asset value, end of
period |
$ 9.63 | $ 8.47 | $ 10.68 | $ 8.74 | $ 8.45 | $ 9.17 | |||||
|
Total return
(c) |
13.70% | (14.03)% | 27.11% | 5.02% | (5.94)% | (7.76)% | |||||
| Ratios and Supplemental Data: | |||||||||||
|
Net assets, end of period (in
000s) |
$320,651 | $433,086 | $456,567 | $222,297 | $57,219 | $40,800 | |||||
| Ratios to Average Net Assets: | |||||||||||
|
Total expenses
(d) |
0.19%(e) | 0.18% | 0.18% | 0.23% | 0.45% | 0.73%(e) | |||||
|
Net expenses
(d) |
0.02%(e) | 0.05% | 0.10% | 0.07% | 0.06% | 0.15%(e) | |||||
|
Net investment income
(loss) |
(0.02)%(e) | 2.57% | 3.16% | 2.28% | 2.59% | 2.00%(e) | |||||
|
Portfolio turnover rate
(f) |
9%(g) | 4% | 2% | 8% | 3% | 0%(g) | |||||
| * | Commencement of operations. |
| (a) | Net investment income per share is calculated using the average shares method. |
| (b) | Amount is less than $0.005 per share. |
| (c) | Total return is calculated assuming a purchase of shares at net asset value on the first day and a sale at net asset value on the last day of each period reported. Distributions are assumed, for the purpose of this calculation, to be reinvested at net asset value per share on the respective payment dates. Total return for periods of less than one year is not annualized. Results represent past performance and are not indicative of future results. |
| (d) | Ratio does not include the expenses of the corresponding Portfolio. |
| (e) | Annualized. |
| (f) | Portfolio turnover rate is from the corresponding Portfolio. |
| (g) | Not annualized. |
| Class A | |||||||||
| Six
Months Ended 6/30/19 (Unaudited) |
Year
Ended 12/31/18 |
Year
Ended 12/31/17 |
Year
Ended 12/31/16 |
For
the Period 10/16/15* - 12/31/15 | |||||
|
Net asset value, beginning of
period |
$ 10.47 | $11.95 | $10.67 | $ 9.30 | $10.00 | ||||
| Income (loss) from investment operations: | |||||||||
|
Net investment income (loss)
(a) |
(0.02) | 0.32 | 0.53 | 0.07 | 0.05 | ||||
|
Net realized and unrealized gain
(loss) |
2.05 | (1.45) | 1.37 | 1.41 | (0.69) | ||||
|
Total from investment
operations |
2.03 | (1.13) | 1.90 | 1.48 | (0.64) | ||||
| Distributions to shareholders from: | |||||||||
|
Net investment
income |
— | (0.15) | (0.25) | (0.11) | (0.06) | ||||
|
Net realized
gains |
— | (0.20) | (0.37) | (0.00)(b) | — | ||||
|
Total
distributions |
— | (0.35) | (0.62) | (0.11) | (0.06) | ||||
|
Net asset value, end of
period |
$ 12.50 | $10.47 | $11.95 | $10.67 | $ 9.30 | ||||
|
Total return
(c) |
19.39% | (9.35)% | 17.87% | 15.67% | (6.27)% | ||||
| Ratios and Supplemental Data: | |||||||||
|
Net assets, end of period (in
000s) |
$17,785 | $9,274 | $ 988 | $ 114 | $ 97 | ||||
| Ratios to Average Net Assets: | |||||||||
|
Total expenses
(d) |
0.65%(e) | 0.80% | 1.10% | 2.48% | 5.08%(e) | ||||
|
Net expenses
(d) |
0.31%(e) | 0.29% | 0.35% | 0.30% | 0.30%(e) | ||||
|
Net investment income
(loss) |
(0.31)%(e) | 2.65% | 4.60% | 0.69% | 2.55%(e) | ||||
|
Portfolio turnover rate
(f) |
13%(g) | 22% | 21% | 21% | 8%(g) | ||||
| * | Commencement of operations. |
| (a) | Net investment income per share is calculated using the average shares method. |
| (b) | Amount is less than $0.005 per share. |
| (c) | Total return is calculated assuming a purchase of shares at net asset value on the first day and a sale at net asset value on the last day of each period reported. Distributions are assumed, for the purpose of this calculation, to be reinvested at net asset value per share on the respective payment dates. Total return for periods of less than one year is not annualized. Results represent past performance and are not indicative of future results. |
| (d) | Ratio does not include the expenses of the corresponding Portfolio. |
| (e) | Annualized. |
| (f) | Portfolio turnover rate is from the corresponding Portfolio. |
| (g) | Not annualized. |
| Class I | |||||||||
| Six
Months Ended 6/30/19 (Unaudited) |
Year
Ended 12/31/18 |
Year
Ended 12/31/17 |
Year
Ended 12/31/16 |
For
the Period 10/16/15* - 12/31/15 | |||||
|
Net asset value, beginning of
period |
$10.48 | $11.95 | $10.67 | $ 9.30 | $10.00 | ||||
| Income (loss) from investment operations: | |||||||||
|
Net investment income (loss)
(a) |
(0.00)(b) | 0.20 | 0.40 | 0.14 | 0.06 | ||||
|
Net realized and unrealized gain
(loss) |
2.04 | (1.29) | 1.53 | 1.37 | (0.70) | ||||
|
Total from investment
operations |
2.04 | (1.09) | 1.93 | 1.51 | (0.64) | ||||
| Distributions to shareholders from: | |||||||||
|
Net investment
income |
— | (0.18) | (0.28) | (0.14) | (0.06) | ||||
|
Net realized
gains |
— | (0.20) | (0.37) | (0.00)(b) | — | ||||
|
Total
distributions |
— | (0.38) | (0.65) | (0.14) | (0.06) | ||||
|
Net asset value, end of
period |
$12.52 | $10.48 | $11.95 | $10.67 | $ 9.30 | ||||
|
Total return
(c) |
19.47% | (9.07)% | 18.16% | 15.96% | (6.18)% | ||||
| Ratios and Supplemental Data: | |||||||||
|
Net assets, end of period (in
000s) |
$6,528 | $5,038 | $4,135 | $ 297 | $ 97 | ||||
| Ratios to Average Net Assets: | |||||||||
|
Total expenses
(d) |
0.40%(e) | 0.61% | 0.90% | 2.22% | 4.83%(e) | ||||
|
Net expenses
(d) |
0.07%(e) | 0.07% | 0.11% | 0.05% | 0.05%(e) | ||||
|
Net investment income
(loss) |
(0.07)%(e) | 1.58% | 3.42% | 1.42% | 2.80%(e) | ||||
|
Portfolio turnover rate
(f) |
13%(g) | 22% | 21% | 21% | 8%(g) | ||||
| * | Commencement of operations. |
| (a) | Net investment income per share is calculated using the average shares method. |
| (b) | Amount is less than $0.005 per share. |
| (c) | Total return is calculated assuming a purchase of shares at net asset value on the first day and a sale at net asset value on the last day of each period reported. Distributions are assumed, for the purpose of this calculation, to be reinvested at net asset value per share on the respective payment dates. Total return for periods of less than one year is not annualized. Results represent past performance and are not indicative of future results. |
| (d) | Ratio does not include the expenses of the corresponding Portfolio. |
| (e) | Annualized. |
| (f) | Portfolio turnover rate is from the corresponding Portfolio. |
| (g) | Not annualized. |
| Class K | |||||||||
| Six
Months Ended 6/30/19 (Unaudited) |
Year
Ended 12/31/18 |
Year
Ended 12/31/17 |
Year
Ended 12/31/16 |
For
the Period 8/12/15* - 12/31/15 | |||||
|
Net asset value, beginning of
period |
$ 10.48 | $ 11.95 | $ 10.67 | $ 9.30 | $10.00 | ||||
| Income (loss) from investment operations: | |||||||||
|
Net investment income (loss)
(a) |
(0.00)(b) | 0.29 | 0.15 | 0.15 | 0.06 | ||||
|
Net realized and unrealized gain
(loss) |
2.05 | (1.38) | 1.78 | 1.36 | (0.70) | ||||
|
Total from investment
operations |
2.05 | (1.09) | 1.93 | 1.51 | (0.64) | ||||
| Distributions to shareholders from: | |||||||||
|
Net investment
income |
— | (0.18) | (0.28) | (0.14) | (0.06) | ||||
|
Net realized
gains |
— | (0.20) | (0.37) | (0.00)(b) | — | ||||
|
Total
distributions |
— | (0.38) | (0.65) | (0.14) | (0.06) | ||||
|
Net asset value, end of
period |
$ 12.53 | $ 10.48 | $ 11.95 | $ 10.67 | $ 9.30 | ||||
|
Total return
(c) |
19.56% | (9.03)% | 18.16% | 16.21% | (6.38)% | ||||
| Ratios and Supplemental Data: | |||||||||
|
Net assets, end of period (in
000s) |
$70,922 | $38,195 | $18,750 | $14,098 | $3,930 | ||||
| Ratios to Average Net Assets: | |||||||||
|
Total expenses
(d) |
0.38%(e) | 0.55% | 0.96% | 2.21% | 4.71%(e) | ||||
|
Net expenses
(d) |
0.05%(e) | 0.04% | 0.05% | 0.05% | 0.05%(e) | ||||
|
Net investment income
(loss) |
(0.04)%(e) | 2.37% | 1.29% | 1.51% | 1.49%(e) | ||||
|
Portfolio turnover rate
(f) |
13%(g) | 22% | 21% | 21% | 8%(g) | ||||
| * | Commencement of operations. |
| (a) | Net investment income per share is calculated using the average shares method. |
| (b) | Amount is less than $0.005 per share. |
| (c) | Total return is calculated assuming a purchase of shares at net asset value on the first day and a sale at net asset value on the last day of each period reported. Distributions are assumed, for the purpose of this calculation, to be reinvested at net asset value per share on the respective payment dates. Total return for periods of less than one year is not annualized. Results represent past performance and are not indicative of future results. |
| (d) | Ratio does not include the expenses of the corresponding Portfolio. |
| (e) | Annualized. |
| (f) | Portfolio turnover rate is from the corresponding Portfolio. |
| (g) | Not annualized. |
| % of Net Assets | |||
| U.S. Treasury Obligations | 38.9% | ||
| U.S. Government Agency Obligations | 29.0 | ||
| Corporate Bonds & Notes | 25.2 | ||
| Foreign Government Obligations | 3.7 | ||
| Mortgage-Backed Securities | 1.3 | ||
| Municipal Bonds & Notes | 0.5 | ||
| Asset-Backed Securities | 0.4 | ||
| Short-Term Investments | 5.5 | ||
| Liabilities in Excess of Other Assets | (4.5) | ||
| TOTAL | 100.0% |
| Description | % of Net Assets | ||
| Banks | 5.6% | ||
| Electric | 1.6 | ||
| Pharmaceuticals | 1.5 | ||
| Oil & Gas | 1.4 | ||
| Telecommunications | 1.2 | ||
| TOTAL | 11.3% |
| % of Net Assets | |||
| Common Stocks | 95.7% | ||
| Warrants | 0.0 * | ||
| Rights | 0.0 * | ||
| Short-Term Investments | 5.1 | ||
| Liabilities in Excess of Other Assets | (0.8) | ||
| TOTAL | 100.0% |
| * | Amount shown represents less than 0.05% of net assets. |
| Description | % of Net Assets | ||
| Banks | 13.8% | ||
| Oil & Gas | 6.3 | ||
| Pharmaceuticals | 5.5 | ||
| Insurance | 5.5 | ||
| Telecommunications | 4.4 | ||
| TOTAL | 35.5% |
| % of Net Assets | |||
| Common Stocks | 98.1% | ||
| Rights | 0.0 * | ||
| Short-Term Investments | 9.3 | ||
| Liabilities in Excess of Other Assets | (7.4) | ||
| TOTAL | 100.0% |
| * | Amount shown represents less than 0.05% of net assets. |
| Description | % of Net Assets | ||
| Real Estate Investment Trusts | 9.6% | ||
| Software | 8.8 | ||
| Commercial Services | 6.2 | ||
| Banks | 5.7 | ||
| Internet | 5.0 | ||
| TOTAL | 35.3% |
| Description | Level
1 – Quoted Prices |
Level
2 – Other Significant Observable Inputs |
Level
3 – Significant Unobservable Inputs |
Total | ||||
| ASSETS: | ||||||||
| INVESTMENTS: | ||||||||
|
Corporate Bonds &
Notes |
$ — | $ 266,761,485 | $— | $ 266,761,485 | ||||
|
Asset-Backed
Securities |
— | 3,851,519 | — | 3,851,519 | ||||
|
Foreign Government
Obligations |
— | 39,481,605 | — | 39,481,605 | ||||
|
U.S. Government Agency
Obligations |
— | 307,332,296 | — | 307,332,296 | ||||
|
U.S. Treasury
Obligations |
— | 411,789,957 | — | 411,789,957 | ||||
|
Municipal Bonds &
Notes |
— | 5,461,996 | — | 5,461,996 | ||||
|
Mortgage-Backed
Securities |
— | 13,163,346 | — | 13,163,346 | ||||
|
Short-Term
Investments |
58,838,746 | — | — | 58,838,746 | ||||
|
TOTAL
INVESTMENTS |
$58,838,746 | $1,047,842,204 | $— | $1,106,680,950 |
| Number
of Shares Held at 12/31/18 |
Value
at 12/31/18 |
Cost
of Purchases |
Proceeds
from Shares Sold |
Realized
Gain (Loss) |
Change
in Unrealized Appreciation/ Depreciation |
Number
of Shares Held at 6/30/19 |
Value
at 6/30/19 |
Dividend
Income | |||||||||
|
State Street Institutional U.S. Government Money Market Fund, Class G
Shares |
12,039,221 | $12,039,221 | $148,487,785 | $139,026,799 | $— | $— | 21,500,207 | $21,500,207 | $169,043 | ||||||||
|
State Street Navigator Securities Lending Portfolio
II |
— | — | 113,890,174 | 76,551,635 | — | — | 37,338,539 | 37,338,539 | 26,813 | ||||||||
|
Total |
$12,039,221 | $262,377,959 | $215,578,434 | $— | $— | $58,838,746 | $195,856 |
| Description | Number
of Contracts |
Expiration
Date |
Notional
Amount |
Value | Unrealized
Appreciation/ Depreciation | |||||
| Mini MSCI Emerging Markets (long) | 375 | 09/20/2019 | $19,056,420 | $19,751,250 | $ 694,830 | |||||
| Mini MSCI EAFE (long) | 712 | 09/20/2019 | 66,859,226 | 68,469,480 | 1,610,254 | |||||
| S&P/TSX 60 Index Future (long) | 47 | 09/19/2019 | 7,009,866 | 7,033,006 | 23,140 | |||||
| Total unrealized appreciation/depreciation on open futures contracts purchased | $2,328,224 |
| Description | Level
1 – Quoted Prices |
Level
2 – Other Significant Observable Inputs |
Level
3 – Significant Unobservable Inputs |
Total | ||||
| ASSETS: | ||||||||
| INVESTMENTS: | ||||||||
|
Common
Stocks |
$2,058,527,679 | $12,374,168 | $153,821 | $2,071,055,668 | ||||
|
Warrants |
2,139 | — | — | 2,139 | ||||
|
Rights |
127,463 | 2,823 | 0(a) | 130,286 | ||||
|
Short-Term
Investments |
111,092,722 | — | — | 111,092,722 | ||||
|
TOTAL
INVESTMENTS |
$2,169,750,003 | $12,376,991 | $153,821 | $2,182,280,815 | ||||
| OTHER FINANCIAL INSTRUMENTS: | ||||||||
|
Futures
Contracts(b) |
2,328,224 | — | — | 2,328,224 | ||||
|
TOTAL OTHER FINANCIAL
INSTRUMENTS: |
$ 2,328,224 | $ — | $ — | $ 2,328,224 | ||||
|
TOTAL INVESTMENTS AND OTHER FINANCIAL
INSTRUMENTS |
$2,172,078,227 | $12,376,991 | $153,821 | $2,184,609,039 |
| (a) | The Portfolio held a Level 3 security that was valued at $0 at June 30, 2019. |
| (b) | Futures Contracts are valued at unrealized appreciation (depreciation). |
| Number
of Shares Held at 12/31/18 |
Value
at 12/31/18 |
Cost
of Purchases |
Proceeds
from Shares Sold |
Realized
Gain (Loss) |
Change
in Unrealized Appreciation/ Depreciation |
Number
of Shares Held at 6/30/19 |
Value
at 6/30/19 |
Dividend
Income | |||||||||
|
State Street Institutional U.S. Government Money Market Fund, Class G
Shares |
60,832,438 | $ 60,832,438 | $320,884,106 | $310,391,975 | $— | $— | 71,324,569 | $ 71,324,569 | $ 890,370 | ||||||||
|
State Street Navigator Securities Lending Portfolio
II |
40,202,405 | 40,202,405 | 276,782,799 | 277,217,051 | — | — | 39,768,153 | 39,768,153 | 375,507 | ||||||||
|
Total |
$101,034,843 | $597,666,905 | $587,609,026 | $— | $— | $111,092,722 | $1,265,877 |
| Description | Number
of Contracts |
Expiration
Date |
Notional
Amount |
Value | Unrealized
Appreciation/ Depreciation | |||||
| E-Mini Russell 2000 Index (long) | 77 | 09/20/2019 | $5,907,896 | $6,033,347 | $125,451 | |||||
| E-Mini S&P MidCap 400 Index (long) | 39 | 09/20/2019 | 7,435,275 | 7,605,000 | 169,725 | |||||
| Total unrealized appreciation/depreciation on open futures contracts purchased | $295,176 |
| Description | Level
1 – Quoted Prices |
Level
2 – Other Significant Observable Inputs |
Level
3 – Significant Unobservable Inputs |
Total | ||||
| ASSETS: | ||||||||
| INVESTMENTS: | ||||||||
|
Common
Stocks |
$799,346,593 | $ — | $ 0(a) | $799,346,593 | ||||
|
Rights |
16,899 | 5,995 | — | 22,894 | ||||
|
Short-Term
Investments |
75,835,132 | — | — | 75,835,132 | ||||
|
TOTAL
INVESTMENTS |
$875,198,624 | $5,995 | $ 0 | $875,204,619 | ||||
| OTHER FINANCIAL INSTRUMENTS: | ||||||||
|
Futures
Contracts(b) |
295,176 | — | — | 295,176 | ||||
|
TOTAL OTHER FINANCIAL
INSTRUMENTS: |
$ 295,176 | $ — | $— | $ 295,176 | ||||
|
TOTAL INVESTMENTS AND OTHER FINANCIAL
INSTRUMENTS |
$875,493,800 | $5,995 | $— | $875,499,795 |
| (a) | The Portfolio held a Level 3 security that was valued at $0 at June 30, 2019. |
| (b) | Futures Contracts are valued at unrealized appreciation (depreciation). |
| Number
of Shares Held at 12/31/18 |
Value
at 12/31/18 |
Cost
of Purchases |
Proceeds
from Shares Sold |
Realized
Gain (Loss) |
Change
in Unrealized Appreciation/ Depreciation |
Number
of Shares Held at 6/30/19 |
Value
at 6/30/19 |
Dividend
Income | |||||||||
|
State Street Institutional U.S. Government Money Market Fund, Class G
Shares |
16,927,293 | $16,927,293 | $164,067,004 | $166,745,852 | $— | $— | 14,248,445 | $14,248,445 | $179,229 | ||||||||
|
State Street Navigator Securities Lending Portfolio
II |
24,606,690 | 24,606,690 | 129,068,326 | 92,088,329 | — | — | 61,586,687 | 61,586,687 | 173,556 | ||||||||
|
Total |
$41,533,983 | $293,135,330 | $258,834,181 | $— | $— | $75,835,132 | $352,785 |
| State Street Aggregate Bond Index Portfolio | State Street Global Equity ex-U.S. Index Portfolio | State Street Small/Mid Cap Equity Index Portfolio | |||
| ASSETS | |||||
|
Investments in unaffiliated issuers, at
value* |
$1,047,842,204 | $2,071,188,093 | $799,369,487 | ||
|
Investments in affiliated issuers, at
value |
58,838,746 | 111,092,722 | 75,835,132 | ||
|
Total
Investments |
1,106,680,950 | 2,182,280,815 | 875,204,619 | ||
|
Foreign currency, at
value |
— | 16,364,217 | — | ||
|
Cash at
broker |
— | 2,457,891 | 464,980 | ||
|
Cash |
— | 185 | 13 | ||
|
Receivable from broker — accumulated variation margin on open futures
contracts |
— | 2,331,439 | 295,429 | ||
|
Receivable for investments
sold |
4,765,606 | 16,227 | 22,649,659 | ||
|
Receivable for fund shares
sold |
11,768,148 | 1,477,733 | 10,398,511 | ||
|
Dividends receivable — unaffiliated
issuers |
— | 5,341,084 | 924,869 | ||
|
Dividends receivable — affiliated
issuers |
30,435 | 136,453 | 27,660 | ||
|
Interest receivable — unaffiliated
issuers |
6,500,175 | — | — | ||
|
Securities lending income receivable — unaffiliated
issuers |
2,261 | — | 5,725 | ||
|
Securities lending income receivable — affiliated issuers
|
7,961 | 87,286 | 26,063 | ||
|
Receivable from
Adviser |
30,946 | — | 16,745 | ||
|
Receivable for foreign taxes
recoverable |
262 | 2,960,913 | — | ||
|
TOTAL ASSETS
|
1,129,786,744 | 2,213,454,243 | 910,014,273 | ||
| LIABILITIES | |||||
|
Due to
custodian |
1,474 | — | — | ||
|
Payable upon return of securities
loaned |
37,338,539 | 39,768,153 | 61,586,687 | ||
|
Payable for investments
purchased |
31,538,512 | — | 31,902,471 | ||
|
Payable for fund shares
repurchased |
2,260,000 | 8,470,000 | 1,662,503 | ||
|
Deferred foreign taxes
payable |
— | 362,742 | — | ||
|
Custodian, sub-administration and transfer agent fees
payable |
15,357 | 21,078 | 10,647 | ||
|
Accrued Trustees' fees and
expenses |
89 | 118 | 62 | ||
|
Registration and filing fees
payable |
16,640 | 26,053 | 11,465 | ||
|
Professional fees
payable |
38,248 | 37,801 | 35,029 | ||
|
Printing and postage fees
payable |
2,265 | 5,608 | 1,101 | ||
|
Accrued expenses and other
liabilities |
269 | 9,696 | 234 | ||
|
TOTAL LIABILITIES
|
71,211,393 | 48,701,249 | 95,210,199 | ||
|
NET ASSETS
|
$1,058,575,351 | $2,164,752,994 | $814,804,074 | ||
| NET ASSETS CONSIST OF: | |||||
|
Paid-in
Capital |
$1,037,123,208 | $2,029,181,419 | $735,894,243 | ||
|
Total distributable earnings
(loss)** |
21,452,143 | 135,571,575 | 78,909,831 | ||
|
NET ASSETS
|
$1,058,575,351 | $2,164,752,994 | $814,804,074 | ||
| NET ASSET VALUE PER SHARE | |||||
|
Net asset value per
share |
$ 10.18 | $ 10.27 | $ 12.33 | ||
|
Shares of beneficial
interest |
103,939,135 | 210,861,043 | 66,104,022 | ||
| COST OF INVESTMENTS: | |||||
|
Investments in unaffiliated
issuers |
$1,022,311,898 | $1,924,610,539 | $722,267,111 | ||
|
Investments in affiliated
issuers |
58,838,746 | 111,092,722 | 75,835,132 | ||
|
Total cost of
investments |
$1,081,150,644 | $2,035,703,261 | $798,102,243 | ||
|
Foreign currency, at
cost |
$ — | $ 16,185,326 | $ — | ||
|
* Includes investments in securities on loan, at
value |
$ 66,388,762 | $ 52,412,072 | $ 96,686,419 | ||
|
** Includes deferred foreign
taxes |
$ — | $ 362,742 | $ — |
| State Street Aggregate Bond Index Portfolio | State Street Global Equity ex-U.S. Index Portfolio | State Street Small/Mid Cap Equity Index Portfolio | |||
| INVESTMENT INCOME | |||||
|
Interest income — unaffiliated
issuers |
$13,732,080 | $ 43,258 | $ 5,850 | ||
|
Dividend income — unaffiliated
issuers |
— | 45,614,945 | 5,587,706 | ||
|
Dividend income — affiliated
issuers |
169,043 | 890,370 | 179,229 | ||
|
Unaffiliated securities lending
income |
6,229 | 70,008 | 48,127 | ||
|
Affiliated securities lending
income |
26,813 | 375,507 | 173,556 | ||
|
Foreign taxes
withheld |
— | (4,436,719) | (5,687) | ||
|
TOTAL INVESTMENT INCOME
(LOSS) |
13,934,165 | 42,557,369 | 5,988,781 | ||
| EXPENSES | |||||
|
Custodian, sub-administration and transfer agent
fees |
81,049 | 386,412 | 57,797 | ||
|
Trustees’ fees and expenses
|
21,065 | 36,146 | 17,983 | ||
|
Professional fees and
expenses |
87,254 | 86,423 | 84,093 | ||
|
Printing and postage
fees |
6,276 | 15,579 | 4,640 | ||
|
Insurance
expense |
2,376 | 5,589 | 1,775 | ||
|
Miscellaneous
expenses |
3,803 | 17,202 | 2,984 | ||
|
TOTAL
EXPENSES |
201,823 | 547,351 | 169,272 | ||
|
Expenses waived/reimbursed by the
Adviser |
(83,186) | — | (58,953) | ||
|
NET
EXPENSES |
118,637 | 547,351 | 110,319 | ||
|
NET INVESTMENT INCOME
(LOSS) |
$13,815,528 | $ 42,010,018 | $ 5,878,462 | ||
| REALIZED AND UNREALIZED GAIN (LOSS) | |||||
| Net realized gain (loss) on: | |||||
|
Investments — unaffiliated
issuers |
(796,881) | (34,471,474) | (4,585,036) | ||
|
Foreign currency
transactions |
— | (221,226) | — | ||
|
Futures
contracts |
— | 6,706,541 | 930,589 | ||
|
Net realized gain
(loss) |
(796,881) | (27,986,159) | (3,654,447) | ||
| Net change in unrealized appreciation/depreciation on: | |||||
|
Investments—unaffiliated
issuers** |
45,482,047 | 242,978,921 | 120,455,068 | ||
|
Foreign currency
translations |
— | 230,391 | — | ||
|
Futures
contracts |
— | 4,272,478 | 962,544 | ||
|
Net change in unrealized
appreciation/depreciation |
45,482,047 | 247,481,790 | 121,417,612 | ||
|
NET REALIZED AND UNREALIZED GAIN
(LOSS) |
44,685,166 | 219,495,631 | 117,763,165 | ||
|
NET INCREASE (DECREASE) IN NET ASSETS FROM
OPERATIONS |
$58,500,694 | $261,505,649 | $123,641,627 | ||
|
* Includes foreign deferred
taxes |
$ — | $ (27,988) | $ — |
| State Street Aggregate Bond Index Portfolio | State Street Global Equity ex-U.S. Index Portfolio | State Street Small/Mid Cap Equity Index Portfolio | |||||||||
| Six
Months Ended 6/30/19 (Unaudited) |
Year
Ended 12/31/18 |
Six
Months Ended 6/30/19 (Unaudited) |
Year
Ended 12/31/18 |
Six
Months Ended 6/30/19 (Unaudited) |
Year
Ended 12/31/18 | ||||||
| INCREASE (DECREASE) IN NET ASSETS FROM OPERATIONS: | |||||||||||
|
Net investment income
(loss) |
$ 13,815,528 | $ 22,747,408 | $ 42,010,018 | $ 56,416,890 | $ 5,878,462 | $ 9,258,320 | |||||
|
Net realized gain
(loss) |
(796,881) | (3,210,271) | (27,986,159) | (20,725,327) | (3,654,447) | 23,638,032 | |||||
|
Net change in unrealized
appreciation/depreciation |
45,482,047 | (17,781,652) | 247,481,790 | (332,439,999) | 121,417,612 | (92,935,148) | |||||
|
Net increase (decrease) in net assets resulting from
operations |
58,500,694 | 1,755,485 | 261,505,649 | (296,748,436) | 123,641,627 | (60,038,796) | |||||
|
Distributions to
shareholders |
(11,712,187) | (23,874,830) | — | (54,663,652) | — | (33,894,404) | |||||
| FROM BENEFICIAL INTEREST TRANSACTIONS: | |||||||||||
|
Proceeds from sale of shares
sold |
187,998,949 | 316,690,779 | 296,329,662 | 722,635,717 | 129,772,414 | 309,094,040 | |||||
|
Reinvestment of
distributions |
11,712,187 | 23,874,830 | — | 54,663,652 | — | 33,894,404 | |||||
|
Cost of shares
redeemed |
(34,683,082) | (159,228,020) | (300,681,045) | (173,549,380) | (67,342,372) | (85,192,583) | |||||
|
Net increase (decrease) in net assets from capital transactions
|
165,028,054 | 181,337,589 | (4,351,383) | 603,749,989 | 62,430,042 | 257,795,861 | |||||
|
Net increase (decrease) in net assets during the
period |
211,816,561 | 159,218,244 | 257,154,266 | 252,337,901 | 186,071,669 | 163,862,661 | |||||
|
Net assets at beginning of
period |
846,758,790 | 687,540,546 | 1,907,598,728 | 1,655,260,827 | 628,732,405 | 464,869,744 | |||||
|
NET ASSETS AT END OF
PERIOD |
$1,058,575,351 | $ 846,758,790 | $2,164,752,994 | $1,907,598,728 | $814,804,074 | $628,732,405 | |||||
| SHARES OF BENEFICIAL INTEREST: | |||||||||||
|
Shares
sold |
19,024,245 | 32,365,364 | 30,091,671 | 68,580,109 | 10,837,148 | 25,863,265 | |||||
|
Reinvestment of
distributions |
1,184,473 | 2,467,864 | — | 6,176,684 | — | 3,434,084 | |||||
|
Shares
redeemed |
(3,495,164) | (16,375,548) | (30,623,347) | (16,515,326) | (5,706,301) | (6,729,051) | |||||
|
Net increase (decrease) from share
transactions |
16,713,554 | 18,457,680 | (531,676) | 58,241,467 | 5,130,847 | 22,568,298 | |||||
| Six
Months Ended 6/30/19 (Unaudited) |
Year
Ended 12/31/18 |
Year
Ended 12/31/17 |
Year
Ended 12/31/16 |
Year
Ended 12/31/15 |
For
the Period 9/19/14* - 12/31/14 | ||||||
|
Net asset value, beginning of
period |
$ 9.71 | $ 10.00 | $ 9.91 | $ 9.89 | $ 10.14 | $ 10.00 | |||||
| Income (loss) from investment operations: | |||||||||||
|
Net investment income (loss)
(a) |
0.14 | 0.26 | 0.23 | 0.23 | 0.20 | 0.04 | |||||
|
Net realized and unrealized gain
(loss) |
0.45 | (0.28) | 0.10 | 0.01 | (0.13) | 0.16 | |||||
|
Total from investment
operations |
0.59 | (0.02) | 0.33 | 0.24 | 0.07 | 0.20 | |||||
|
Voluntary contribution from
Adviser |
— | — | — | — | 0.00(b) | 0.00(b) | |||||
| Distributions to shareholders from: | |||||||||||
|
Net investment
income |
(0.12) | (0.27) | (0.24) | (0.21) | (0.19) | (0.04) | |||||
|
Net realized
gains |
— | — | — | (0.01) | (0.11) | (0.02) | |||||
|
Return of
Capital |
— | — | — | — | (0.02) | — | |||||
|
Total
distributions |
— | (0.27) | (0.24) | (0.22) | (0.32) | (0.06) | |||||
|
Net asset value, end of
period |
$ 10.18 | $ 9.71 | $ 10.00 | $ 9.91 | $ 9.89 | $ 10.14 | |||||
|
Total return
(c) |
6.13% | (0.12)% | 3.38% | 2.39% | 0.65%(d) | 2.00%(e) | |||||
| Ratios and Supplemental Data: | |||||||||||
|
Net assets, end of period (in
000s) |
$1,058,575 | $846,759 | $687,541 | $249,906 | $83,842 | $80,044 | |||||
| Ratios to average net assets: | |||||||||||
|
Total
expenses |
0.04%(f) | 0.04% | 0.06% | 0.14% | 0.17% | 0.25%(f) | |||||
|
Net
expenses |
0.03%(f) | 0.03% | 0.03% | 0.01% | 0.03% | 0.04%(f) | |||||
|
Net investment income
(loss) |
2.91%(f) | 2.73% | 2.31% | 2.24% | 2.00% | 1.52%(f) | |||||
|
Portfolio turnover
rate |
26%(g) | 90% | 99% | 194% | 62%(h) | 16%(g)(h) |
| * | Commencement of operations. |
| (a) | Net investment income per share is calculated using the average shares method. |
| (b) | Amount is less than $0.005 per share. |
| (c) | Total return is calculated assuming a purchase of shares at net asset value on the first day and a sale at net asset value on the last day of each period reported. Distributions are assumed, for the purpose of this calculation, to be reinvested at net asset value per share on the respective payment dates. Total return for periods of less than one year is not annualized. Results represent past performance and are not indicative of future results. |
| (d) | If the Adviser had not made a voluntary contribution during the year ended 12/31/15, the total return would have decreased by less than 0.005%. |
| (e) | If the Adviser had not made a voluntary contribution during the period ended 12/31/14, the total return would have decreased by less than 0.005%. |
| (f) | Annualized. |
| (g) | Not annualized. |
| (h) | Portfolio turnover rate excludes to-be-announced (“TBA”) transactions. |
| Six
Months Ended 6/30/19 (Unaudited) |
Year
Ended 12/31/18 |
Year
Ended 12/31/17 |
Year
Ended 12/31/16 |
Year
Ended 12/31/15 |
For
the Period 9/17/14* - 12/31/14 | ||||||
|
Net asset value, beginning of
period |
$ 9.02 | $ 10.81 | $ 8.73 | $ 8.45 | $ 9.17 | $ 10.00 | |||||
| Income (loss) from investment operations: | |||||||||||
|
Net investment income (loss)
(a) |
0.19 | 0.30 | 0.26 | 0.22 | 0.25 | 0.05 | |||||
|
Net realized and unrealized gain
(loss) |
1.06 | (1.82) | 2.12 | 0.20 | (0.79) | (0.82) | |||||
|
Total from investment
operations |
1.25 | (1.52) | 2.38 | 0.42 | (0.54) | (0.77) | |||||
|
Voluntary contribution from
Adviser |
— | — | — | — | 0.00(b) | 0.00(b) | |||||
| Distributions to shareholders from: | |||||||||||
|
Net investment
income |
— | (0.27) | (0.25) | (0.14) | (0.18) | (0.06) | |||||
|
Net realized
gains |
— | (0.00)(b) | (0.05) | — | — | — | |||||
|
Total
distributions |
— | (0.27) | (0.30) | (0.14) | (0.18) | (0.06) | |||||
|
Net asset value, end of
period |
$ 10.27 | $ 9.02 | $ 10.81 | $ 8.73 | $ 8.45 | $ 9.17 | |||||
|
Total return
(c) |
13.86% | (13.99)% | 27.20% | 5.06% | (5.84)%(d) | (7.72)%(e) | |||||
| Ratios and Supplemental Data: | |||||||||||
|
Net assets, end of period (in
000s) |
$2,164,753 | $1,907,599 | $1,655,261 | $552,700 | $117,461 | $49,460 | |||||
| Ratios to average net assets: | |||||||||||
|
Total
expenses |
0.05%(f) | 0.06% | 0.06% | 0.23% | 0.48% | 0.73%(f) | |||||
|
Net
expenses |
0.05%(f) | 0.06% | 0.06% | 0.08% | 0.08% | 0.31%(f) | |||||
|
Net investment income
(loss) |
3.92%(f) | 2.89% | 2.59% | 2.51% | 2.73% | 1.77%(f) | |||||
|
Portfolio turnover
rate |
9%(g) | 4% | 2% | 8% | 3% | 0%(g) |
| * | Commencement of operations. |
| (a) | Net investment income per share is calculated using the average shares method. |
| (b) | Amount is less than $0.005 per share. |
| (c) | Total return is calculated assuming a purchase of shares at net asset value on the first day and a sale at net asset value on the last day of each period reported. Distributions are assumed, for the purpose of this calculation, to be reinvested at net asset value per share on the respective payment dates. Total return for periods of less than one year is not annualized. Results represent past performance and are not indicative of future results. |
| (d) | If the Adviser had not made a voluntary contribution during the year ended 12/31/15, the total return would have decreased by less than 0.005%. |
| (e) | If the Adviser had not made a voluntary contribution during the period ended 12/31/14, the total return would have decreased by less than 0.005%. |
| (f) | Annualized. |
| (g) | Not annualized. |
| Six
Months Ended 6/30/19 (Unaudited) |
Year
Ended 12/31/18 |
Year
Ended 12/31/17 |
Year
Ended 12/31/16 |
For
the Period 8/12/15* - 12/31/15 | |||||
|
Net asset value, beginning of
period |
$ 10.31 | $ 12.10 | $ 10.65 | $ 9.30 | $ 10.00 | ||||
| Income (loss) from investment operations: | |||||||||
|
Net investment income (loss)
(a) |
0.09 | 0.19 | 0.17 | 0.15 | 0.06 | ||||
|
Net realized and unrealized gain
(loss) |
1.93 | (1.31) | 1.76 | 1.38 | (0.69) | ||||
|
Total from investment
operations |
2.02 | (1.12) | 1.93 | 1.53 | (0.63) | ||||
| Distributions to shareholders from: | |||||||||
|
Net investment
income |
— | (0.19) | (0.15) | (0.09) | (0.06) | ||||
|
Net realized
gains |
— | (0.48) | (0.33) | (0.09) | (0.01) | ||||
|
Total
distributions |
— | (0.67) | (0.48) | (0.18) | (0.07) | ||||
|
Net asset value, end of
period |
$ 12.33 | $ 10.31 | $ 12.10 | $ 10.65 | $ 9.30 | ||||
|
Total return
(b) |
19.59% | (9.07)% | 18.20% | 16.46% | 6.30% | ||||
| Ratios and Supplemental Data: | |||||||||
|
Net assets, end of period (in
000s) |
$814,804 | $628,732 | $464,870 | $142,269 | $28,151 | ||||
| Ratios to average net assets: | |||||||||
|
Total
expenses |
0.05%(c) | 0.05% | 0.07% | 0.22% | 0.41%(c) | ||||
|
Net
expenses |
0.03%(c) | 0.03% | 0.03% | 0.03% | 0.03%(c) | ||||
|
Net investment income
(loss) |
1.60%(c) | 1.52% | 1.46% | 1.55% | 1.61%(c) | ||||
|
Portfolio turnover
rate |
13%(d) | 22% | 21% | 21% | 8%(d) |
| * | Commencement of operations. |
| (a) | Net investment income per share is calculated using the average shares method. |
| (b) | Total return is calculated assuming a purchase of shares at net asset value on the first day and a sale at net asset value on the last day of each period reported. Distributions are assumed, for the purpose of this calculation, to be reinvested at net asset value per share on the respective payment dates. Total return for periods of less than one year is not annualized. Results represent past performance and are not indicative of future results. |
| (c) | Annualized. |
| (d) | Not annualized. |
| Fund | Classes | Commencement
of Operations |
Diversification
Classification |
| State Street Aggregate Bond Index Fund (the "Fund") | Class
A Class I Class K |
September
19, 2014 September 19, 2014 September 19, 2014 |
Diversified
Diversified Diversified |
| State Street Global Equity ex-U.S. Index Fund (the "Fund") | Class
A Class I Class K |
September
17, 2014 September 17, 2014 September 17, 2014 |
Diversified
Diversified Diversified |
| State Street Small/Mid Cap Equity Index Fund (the "Fund") | Class
A Class I Class K |
October
16, 2015 October 16, 2015 August 12, 2015 |
Diversified
Diversified Diversified |
| State Street Aggregate Bond Index Portfolio (the "Portfolio") | September 19, 2014 | Diversified | |
| State Street Global Equity ex-U.S. Index Portfolio (the "Portfolio") | September 17, 2014 | Diversified | |
| State Street Small/Mid Cap Equity Index Portfolio (the "Portfolio") | August 12, 2015 | Diversified |
| Fund Name | Portfolio Name | Fund
Ownership Interest in Portfolio at June 30, 2019 | ||
| State Street Aggregate Bond Index Fund | State Street Aggregate Bond Index Portfolio | 15.44% | ||
| State Street Global Equity ex-U.S. Index Fund | State Street Global Equity ex-U.S. Index Portfolio | 15.10% | ||
| State Street Small/Mid Cap Equity Index Fund | State Street Small/Mid Cap Equity Index Portfolio | 11.69% |
| Name | Frequency |
| State Street Aggregate Bond Index Fund | Monthly |
| State Street Global Equity ex-U.S. Index Fund | Annually |
| State Street Small/Mid Cap Equity Index Fund | Annually |
| State Street Aggregate Bond Index Portfolio | Monthly |
| State Street Global Equity ex-U.S. Index Portfolio | Annually |
| State Street Small/Mid Cap Equity Index Portfolio | Annually |
| Portfolios | Strategies |
| State Street Global Equity ex-U.S. Index Portfolio | Cash equitization, reduce tracking error and to facilitate daily liquidity |
| State Street Small/Mid Cap Equity Index Portfolio | Cash equitization, reduce tracking error and to facilitate daily liquidity |
| Asset Derivatives | |||||||||||
| Interest
Rate Contracts Risk |
Foreign
Exchange Contracts Risk |
Credit
Contracts Risk |
Equity
Contracts Risk |
Commodity
Contracts Risk |
Total | ||||||
| State Street Global Equity ex-U.S. Index Portfolio | |||||||||||
|
Futures
Contracts |
$— | $— | $— | $2,331,439 | $— | $2,331,439 | |||||
| Asset Derivatives | |||||||||||
| Interest
Rate Contracts Risk |
Foreign
Exchange Contracts Risk |
Credit
Contracts Risk |
Equity
Contracts Risk |
Commodity
Contracts Risk |
Total | ||||||
| State Street Small/Mid Cap Equity Index Portfolio | |||||||||||
|
Futures
Contracts |
$— | $— | $— | $295,429 | $— | $295,429 | |||||
| Net Realized Gain (Loss) | |||||||||||
| Interest
Rate Contracts Risk |
Foreign
Exchange Contracts Risk |
Credit
Contracts Risk |
Equity
Contracts Risk |
Commodity
Contracts Risk |
Total | ||||||
| State Street Global Equity ex-U.S. Index Portfolio | |||||||||||
|
Futures
Contracts |
$— | $— | $— | $6,706,541 | $— | $6,706,541 | |||||
| Net Realized Gain (Loss) | |||||||||||
| Interest
Rate Contracts Risk |
Foreign
Exchange Contracts Risk |
Credit
Contracts Risk |
Equity
Contracts Risk |
Commodity
Contracts Risk |
Total | ||||||
| State Street Small/Mid Cap Equity Index Portfolio | |||||||||||
|
Futures
Contracts |
$— | $— | $— | $930,589 | $— | $930,589 | |||||
| Net Change in Unrealized Appreciation (Depreciation) | |||||||||||
| Interest
Rate Contracts Risk |
Foreign
Exchange Contracts Risk |
Credit
Contracts Risk |
Equity
Contracts Risk |
Commodity
Contracts Risk |
Total | ||||||
| State Street Global Equity ex-U.S. Index Portfolio | |||||||||||
|
Futures
Contracts |
$— | $— | $— | $4,272,478 | $— | $4,272,478 | |||||
| Net Change in Unrealized Appreciation (Depreciation) | |||||||||||
| Interest
Rate Contracts Risk |
Foreign
Exchange Contracts Risk |
Credit
Contracts Risk |
Equity
Contracts Risk |
Commodity
Contracts Risk |
Total | ||||||
| State Street Small/Mid Cap Equity Index Portfolio | |||||||||||
|
Futures
Contracts |
$— | $— | $— | $962,544 | $— | $962,544 | |||||
| Annual Rate | |
|
State Street Aggregate Bond Index
Fund |
0.025% |
|
State Street Global Equity ex-U.S. Index
Fund |
0.06 |
|
State Street Small/Mid Cap Equity Index
Fund |
0.03 |
| U.S. Government Obligations | Other Securities | ||||||
| Purchases | Sales | Purchases | Sales | ||||
|
State Street Aggregate Bond Index
Portfolio |
$308,386,650 | $239,839,473 | $ 52,435,903 | $ 13,380,285 | |||
|
State Street Global Equity ex-U.S. Index
Portfolio |
— | — | 264,430,868 | 183,729,466 | |||
|
State Street Small/Mid Cap Equity Index
Portfolio |
— | — | 223,714,709 | 94,461,975 | |||
| Tax
Cost |
Gross
Unrealized Appreciation |
Gross
Unrealized Depreciation |
Net
Unrealized Appreciation (Depreciation) | ||||
|
State Street Aggregate Bond Index
Fund |
$ 159,830,824 | $ 3,561,965 | $ — | $ 3,561,965 | |||
|
State Street Global Equity ex-U.S. Index
Fund |
324,106,089 | 2,679,033 | — | 2,679,033 | |||
|
State Street Small/Mid Cap Equity Index
Fund |
94,283,795 | 943,227 | — | 943,227 | |||
|
State Street Aggregate Bond Index
Portfolio |
1,081,275,591 | 28,048,566 | 2,643,207 | 25,405,359 | |||
|
State Street Global Equity ex-U.S. Index
Portfolio |
2,041,527,082 | 280,890,171 | 137,808,214 | 143,081,957 | |||
|
State Street Small/Mid Cap Equity Index
Portfolio |
800,594,177 | 128,717,941 | 53,812,323 | 74,905,618 |
| Fund | Market
Value of Securities on Loan |
Cash
Collateral Received |
Non-Cash
Collateral Received* |
Total
Collateral Received | ||||
|
State Street Aggregate Bond Index
Portfolio |
$ 66,388,762 | $ 37,338,539 | $ 30,421,025 | $ 67,759,564 | ||||
|
State Street Global Equity ex-U.S. Index
Portfolio |
52,412,072 | 39,768,153 | 15,373,080 | 55,141,233 | ||||
|
State Street Small/Mid Cap Equity Index
Portfolio |
96,686,419 | 61,586,687 | 36,125,682 | 97,712,369 |
| * | The non-cash collateral includes U.S. Treasuries and U.S. Government Agency securities. |
| Remaining
Contractual Maturity of the Agreements As of June 30, 2019 | ||||||||||||||
| Fund | Securities
Lending Transactions |
Overnight
and Continuous |
<30 Days | Between
30 & 90 Days |
>90 Days | Total
Borrowings |
Gross
Amount of Recognized Liabilities for Securities Lending Transactions | |||||||
|
State Street Aggregate Bond Index
Portfolio |
Corporate Bonds & Notes | $21,747,315 | $— | $— | $— | $21,747,315 | $21,747,315 | |||||||
|
State Street Aggregate Bond Index
Portfolio |
Foreign Government Obligations | 5,965,443 | — | — | — | 5,965,443 | 5,965,443 | |||||||
|
State Street Aggregate Bond Index
Portfolio |
U.S. Treasury Obligations | 9,625,781 | — | — | — | 9,625,781 | 9,625,781 | |||||||
|
State Street Global Equity ex-U.S. Index
Portfolio |
Common Stocks | 39,768,153 | — | — | — | 39,768,153 | 39,768,153 | |||||||
|
State Street Small/Mid Cap Equity Index
Portfolio |
Common Stocks | 61,586,430 | — | — | — | 61,586,430 | 61,586,430 | |||||||
|
State Street Small/Mid Cap Equity Index
Portfolio |
Rights | 257 | — | — | — | 257 | 257 | |||||||
| Actual | Hypothetical
(assuming a 5% return before expenses) | ||||||||
| Annualized
Expense Ratio |
Ending
Account Value |
Expenses
Paid During Period |
Ending
Account Value |
Expenses
Paid During Period | |||||
|
State Street Aggregate Bond Index
Fund |
|||||||||
|
Class
A |
0.28% | $1,060.30 | $ 1.43(a) | $1,023.40 | $ 1.40(a) | ||||
|
Class
I |
0.03 | 1,062.00 | 0.15(a) | 1,024.60 | 0.15(a) | ||||
|
Class
K |
0.03 | 1,061.00 | 0.15(a) | 1,024.60 | 0.15(a) | ||||
| State Street Global Equity ex-U.S. Index Fund | |||||||||
|
Class
A |
0.29 | 1,134.80 | 1.54(a) | 1,023.40 | 1.45(a) | ||||
|
Class
I |
0.10 | 1,134.60 | 0.53(a) | 1,024.30 | 0.50(a) | ||||
|
Class
K |
0.02 | 1,137.00 | 0.11(a) | 1,024.70 | 0.10(a) | ||||
| State Street Small/Mid Cap Equity Index Fund | |||||||||
|
Class
A |
0.31 | 1,193.90 | 1.69(a) | 1,023.30 | 1.56(a) | ||||
|
Class
I |
0.07 | 1,194.70 | 0.38(a) | 1,024.40 | 0.35(a) | ||||
|
Class
K |
0.05 | 1,195.60 | 0.27(a) | 1,024.50 | 0.25(a) | ||||
|
State Street Aggregate Bond Index
Portfolio |
0.03 | 1,061.30 | 0.15(b) | 1,024.60 | 0.15(b) | ||||
|
State Street Global Equity ex-U.S. Index
Portfolio |
0.05 | 1,138.60 | 0.27(b) | 1,024.50 | 0.25(b) | ||||
|
State Street Small/Mid Cap Equity Index
Portfolio |
0.03 | 1,195.90 | 0.16(b) | 1,024.60 | 0.15(b) | ||||
| (a) | Expenses are equal to the Fund’s annualized net expense ratio, which includes the Fund’s proportionate share of the expenses of the Portfolio, multiplied by the average account value of the period, multiplied by 181, then divided by 365. |
| (b) | Expenses are equal to the Portfolio's annualized net expense ratio multiplied by the average account value of the period, multiplied by 181, then divided by 365. |
| • | A report prepared by an independent third-party provider of investment company data, which includes for each Fund, each of which is a feeder fund for which the corresponding Portfolio serve as the master fund in a master-feeder structure: |
| • | Comparative information concerning fees charged by the Adviser for managing institutional accounts using investment strategies and techniques similar to those used in managing the Funds; and |
| • | Profitability analyses for (a) the Adviser with respect to each Fund and Portfolio and (b) affiliates of the Adviser that provide services to the Funds and Portfolios (“Affiliated Service Providers”). |
| • | Descriptions of the investment management services provided by the Adviser, including its investment strategies and processes; |
| • | Information concerning the allocation of brokerage; and |
| • | Information regarding the procedures and processes used to value the assets of the Funds and Portfolios. |
| • | Reports detailing the financial results and condition of the Adviser and its affiliates; |
| • | Descriptions of the qualifications, education and experience of the individual investment and other professionals responsible for managing the portfolios of the Funds and Portfolios and for Fund/Portfolio operations; |
| • | Information relating to compliance with and the administration of the Code of Ethics adopted by the Adviser; |
| • | A copy of the Adviser’s proxy voting policies and procedures and other information regarding the Adviser’s practices for overseeing proxy vendors; |
| • | Information concerning the resources devoted by the Adviser to overseeing compliance by the Funds and Portfolios, and their service providers, including information concerning compliance with investment policies and restrictions and other operating policies of the Funds and Portfolios; |
| • | A description of the adequacy and sophistication of the Adviser’s technology and systems with respect to investment and administrative matters and a description of any material improvements or changes in technology or systems in the past year; |
| • | A description of the business continuity and disaster recovery plans of the Adviser; and |
| • | Information regarding the Adviser’s risk management processes. |
| • | Information concerning the nature, extent, quality and cost of services provided to the Funds and Portfolios by SSGA FM in its capacity as the Funds’ administrator (the “Administrator”); |
| • | Information concerning the nature, extent, quality and cost of various non-investment management services provided to the Funds and Portfolios by affiliates of the Adviser, including the custodian, sub-administrator, fund accountant and securities lending agent of the Funds and Portfolios, and transfer agent of the Portfolios, and the role of the Adviser in managing the Funds’ and the Portfolios’ relationship with these service providers; |
| • | Copies of the Advisory Agreement and agreements with other service providers of the Funds; |
| • | Draft responses to a letter from independent legal counsel to the Independent Trustees (“Independent Counsel”), reviewed prior to such date by Independent Counsel, requesting specific information from each of: |
| • | Information from SSGA FM, State Street and the Distributor with respect to the Trust providing any material changes to the previous information supplied in response to the letter from Independent Counsel prior to the executive session of the Board on May 15, 2019; |
| • | Materials provided by Broadridge, circulated to the Independent Trustees and to Independent Counsel, with respect to the Funds and Portfolios; and |
| • | A summary of the foregoing materials prepared by Independent Counsel. |
State Street Bank and Trust Company
P.O. Box 5049
Boston, MA 02206
| State Street Emerging Markets Equity Index Fund |

|
|
1 |
|
|
2 |
|
|
17 |
|
|
18 |
|
|
19 |
|
|
20 |
|
|
21 |
|
|
28 |
| % of Net Assets | |||
| Common Stocks | 95.7% | ||
| Warrants | 0.9 | ||
| Rights | 0.0 * | ||
| Short-Term Investments | 3.7 | ||
| Liabilities in Excess of Other Assets | (0.3) | ||
| TOTAL | 100.0% |
| Description | % of Net Assets | ||
| Financials | 25.1% | ||
| Information Technology | 13.3 | ||
| Consumer Discretionary | 13.4 | ||
| Communication Services | 11.3 | ||
| Energy | 7.5 | ||
| TOTAL | 70.6% |
| * | Amount shown represents less than 0.05% of net assets. |
| Description | Number
of Contracts |
Expiration
Date |
Notional
Amount |
Value | Unrealized
Appreciation/ Depreciation | |||||
| Mini MSCI Emerging Markets (long) | 418 | 09/20/2019 | $21,440,514 | $22,016,060 | $575,546 |
| Description | Level
1 – Quoted Prices |
Level
2 – Other Significant Observable Inputs |
Level
3 – Significant Unobservable Inputs |
Total | ||||
| ASSETS: | ||||||||
| INVESTMENTS: | ||||||||
|
Common
Stocks |
$645,063,858 | $13,349,797 | $167,696 | $658,581,351 | ||||
|
Rights |
17,156 | 3,106 | — | 20,262 | ||||
|
Warrants |
6,495,660 | — | — | 6,495,660 | ||||
|
Short-Term
Investments |
25,789,962 | — | — | 25,789,962 | ||||
|
TOTAL
INVESTMENTS |
$677,366,636 | $13,352,903 | $167,696 | $690,887,235 | ||||
| OTHER FINANCIAL INSTRUMENTS: | ||||||||
|
Futures
Contracts(a) |
575,546 | — | — | 575,546 | ||||
|
TOTAL OTHER FINANCIAL
INSTRUMENTS: |
$ 575,546 | $ — | $ — | $ 575,546 | ||||
|
TOTAL INVESTMENTS AND OTHER FINANCIAL
INSTRUMENTS |
$677,942,182 | $13,352,903 | $167,696 | $691,462,781 |
| (a) | Futures Contracts are valued at unrealized appreciation (depreciation). |
| Number
of Shares Held at 12/31/18 |
Value
at 12/31/18 |
Cost
of Purchases |
Proceeds
from Shares Sold |
Realized
Gain (Loss) |
Change
in Unrealized Appreciation/ Depreciation |
Number
of Shares Held at 6/30/19 |
Value
at 6/30/19 |
Dividend
Income | |||||||||
|
State Street Institutional U.S. Government Money Market Fund, Class G
Shares |
9,025,892 | $ 9,025,892 | $ 99,146,432 | $ 91,051,385 | $— | $— | 17,120,939 | $17,120,939 | $246,661 | ||||||||
|
State Street Navigator Securities Lending Portfolio
II |
5,297,343 | 5,297,343 | 34,017,063 | 30,645,383 | — | — | 8,669,023 | 8,669,023 | 49,538 | ||||||||
|
Total |
$14,323,235 | $133,163,495 | $121,696,768 | $— | $— | $25,789,962 | $296,199 |
| ASSETS | |
|
Investments in unaffiliated issuers, at
value* |
$665,097,273 |
|
Investments in affiliated issuers, at
value |
25,789,962 |
|
Total
Investments |
690,887,235 |
|
Foreign currency, at
value |
2,601,318 |
|
Cash at
broker |
453,741 |
|
Cash |
102 |
|
Receivable from broker — accumulated variation margin on open futures
contracts |
576,675 |
|
Receivable for investments
sold |
7,326 |
|
Receivable for fund shares
sold |
505,879 |
|
Dividends receivable — unaffiliated
issuers |
2,892,887 |
|
Dividends receivable — affiliated
issuers |
35,408 |
|
Securities lending income receivable — unaffiliated
issuers |
8,164 |
|
Securities lending income receivable — affiliated issuers
|
5,595 |
|
Receivable from
Adviser |
94,093 |
|
Receivable for foreign taxes
recoverable |
4,989 |
|
TOTAL ASSETS
|
698,073,412 |
| LIABILITIES | |
|
Payable upon return of securities
loaned |
8,669,023 |
|
Payable for investments
purchased |
7,330 |
|
Payable for fund shares
repurchased |
302,162 |
|
Deferred foreign taxes
payable |
419,490 |
|
Advisory fee
payable |
77,306 |
|
Custodian fees
payable |
3,708 |
|
Administration fees
payable |
27,611 |
|
Trustees’ fees and expenses
payable |
66 |
|
Transfer agent fees
payable |
287 |
|
Registration and filing fees
payable |
3,194 |
|
Professional fees
payable |
22,609 |
|
Printing and postage fees
payable |
5,929 |
|
Accrued expenses and other
liabilities |
53,141 |
|
TOTAL LIABILITIES
|
9,591,856 |
|
NET ASSETS
|
$688,481,556 |
| NET ASSETS CONSIST OF: | |
|
Paid-in
Capital |
$584,212,648 |
|
Total distributable earnings
(loss)** |
104,268,908 |
|
NET ASSETS
|
$688,481,556 |
| Class K | |
|
Net
Assets |
$688,481,556 |
|
Shares
Outstanding |
52,116,617 |
|
Net asset value, offering and redemption price per
share |
$ 13.21 |
| COST OF INVESTMENTS: | |
|
Investments in unaffiliated
issuers |
$554,056,727 |
|
Investments in affiliated
issuers |
25,789,962 |
|
Total cost of
investments |
$579,846,689 |
|
Foreign currency, at
cost |
$ 2,589,772 |
|
* Includes investments in securities on loan, at
value |
$ 18,332,759 |
|
** Includes deferred foreign
taxes |
$ 419,489 |
| INVESTMENT INCOME | |
|
Interest income — unaffiliated
issuers |
$ 12,743 |
|
Dividend income — unaffiliated
issuers |
8,668,577 |
|
Dividend income — affiliated
issuers |
246,661 |
|
Unaffiliated securities lending
income |
59,424 |
|
Affiliated securities lending
income |
49,538 |
|
Foreign taxes
withheld |
(952,575) |
|
TOTAL INVESTMENT INCOME
(LOSS) |
8,084,368 |
| EXPENSES | |
|
Advisory
fee |
454,108 |
|
Administration
fees |
162,181 |
|
License
fees |
47,121 |
|
Custodian
fees |
238,541 |
|
Trustees’ fees and expenses
|
17,169 |
|
Transfer agent
fees |
3,914 |
|
Registration and filing
fees |
20,618 |
|
Professional
fees |
28,398 |
|
Printing and postage
fees |
10,020 |
|
Insurance
expense |
1,718 |
|
Miscellaneous
expenses |
19,785 |
|
TOTAL
EXPENSES |
1,003,573 |
|
Expenses waived/reimbursed by the
Adviser |
(450,438) |
|
NET
EXPENSES |
553,135 |
|
NET INVESTMENT INCOME
(LOSS) |
$ 7,531,233 |
| REALIZED AND UNREALIZED GAIN (LOSS) | |
| Net realized gain (loss) on: | |
|
Investments — unaffiliated
issuers |
(6,831,400) |
|
Foreign currency
transactions |
(162,931) |
|
Futures
contracts |
(204,866) |
|
Net realized gain
(loss) |
(7,199,197) |
| Net change in unrealized appreciation/depreciation on: | |
|
Investments — unaffiliated
issuers** |
59,285,405 |
|
Foreign currency
translations |
8,740 |
|
Futures
contracts |
927,446 |
|
Net change in unrealized
appreciation/depreciation |
60,221,591 |
|
NET REALIZED AND UNREALIZED GAIN
(LOSS) |
53,022,394 |
|
NET INCREASE (DECREASE) IN NET ASSETS FROM
OPERATIONS |
$60,553,627 |
|
** Includes foreign deferred
taxes |
$ 39,210 |
| Six
Months Ended 6/30/19 (Unaudited) |
Year
Ended 12/31/18 | ||
| INCREASE (DECREASE) IN NET ASSETS FROM OPERATIONS: | |||
|
Net investment income
(loss) |
$ 7,531,233 | $ 14,391,895 | |
|
Net realized gain
(loss) |
(7,199,197) | (3,634,282) | |
|
Net change in unrealized
appreciation/depreciation |
60,221,591 | (106,456,557) | |
|
Net increase (decrease) in net assets resulting from
operations |
60,553,627 | (95,698,944) | |
| DISTRIBUTIONS TO SHAREHOLDERS: | |||
|
Class
K |
— | (16,909,652) | |
| FROM BENEFICIAL INTEREST TRANSACTIONS: | |||
| Class K | |||
|
Proceeds from sale of shares
sold |
106,879,048 | 272,145,135 | |
|
Reinvestment of
distributions |
— | 16,751,324 | |
|
Cost of shares
redeemed |
(59,381,406) | (203,804,151) | |
|
Net increase (decrease) in net assets from beneficial interest transactions
|
47,497,642 | 85,092,308 | |
|
Net increase (decrease) in net assets during the
period |
108,051,269 | (27,516,288) | |
|
Net assets at beginning of
period |
580,430,287 | 607,946,575 | |
|
NET ASSETS AT END OF
PERIOD |
$688,481,556 | $ 580,430,287 | |
| SHARES OF BENEFICIAL INTEREST: | |||
| Class K | |||
|
Shares
sold |
8,222,759 | 19,942,284 | |
|
Reinvestment of
distributions |
— | 1,413,614 | |
|
Shares
redeemed |
(4,636,423) | (14,873,414) | |
|
Net increase (decrease) from share
transactions |
3,586,336 | 6,482,484 |
| Class K | |||||||||
| Six
Months Ended 06/30/19 (Unaudited) |
Year
Ended 12/31/18 |
Year
Ended 12/31/17 |
Year
Ended 12/31/16 |
For
the Period 12/21/15* - 12/31/15 | |||||
|
Net asset value, beginning of
period |
$ 11.96 | $ 14.46 | $ 10.82 | $ 9.99 | $ 10.00 | ||||
| Income (loss) from investment operations: | |||||||||
|
Net investment income (loss)
(a) |
0.15 | 0.32 | 0.29 | 0.21 | 0.02 | ||||
|
Net realized and unrealized gain
(loss) |
1.10 | (2.46) | 3.72 | 0.87 | (0.01) | ||||
|
Total from investment
operations |
1.25 | (2.14) | 4.01 | 1.08 | 0.01 | ||||
| Distributions to shareholders from: | |||||||||
|
Net investment
income |
— | (0.27) | (0.30) | (0.22) | (0.02) | ||||
|
Net realized
gains |
— | (0.09) | (0.07) | (0.03) | — | ||||
|
Total
distributions |
— | (0.36) | (0.37) | (0.25) | (0.02) | ||||
|
Net asset value, end of
period |
$ 13.21 | $ 11.96 | $ 14.46 | $ 10.82 | $ 9.99 | ||||
|
Total return
(b) |
10.45% | (14.77)% | 37.19% | 10.81% | 0.14% | ||||
| Ratios and Supplemental Data: | |||||||||
|
Net assets, end of period (in
000s) |
$688,482 | $580,430 | $607,947 | $374,808 | $165,807 | ||||
| Ratios to Average Net Assets: | |||||||||
|
Total
expenses |
0.31%(c) | 0.33% | 0.34% | 0.56% | 0.83%(c) | ||||
|
Net
expenses |
0.17%(c) | 0.17% | 0.17% | 0.18% | 0.17%(c) | ||||
|
Net investment income
(loss) |
2.32%(c) | 2.36% | 2.23% | 1.98% | 8.03%(c) | ||||
|
Portfolio turnover
rate |
6%(d) | 7% | 6% | 14% | 0%(d)(e) | ||||
| * | Commencement of operations. |
| (a) | Per share numbers have been calculated using average shares outstanding, which more appropriately presents the per share data for the period. |
| (b) | Total return is calculated assuming a purchase of shares at net asset value on the first day and a sale at net asset value on the last day of each period reported. Distributions are assumed, for the purpose of this calculation, to be reinvested at net asset value per share on the respective payment dates. Total return for periods of less than one year is not annualized. Results represent past performance and are not indicative of future results. |
| (c) | Annualized. |
| (d) | Not annualized. |
| (e) | Amount shown represents less than 0.5%. |
| Fund | Classes | Commencement
of Operations |
Diversification
Classification |
| State Street Emerging Markets Equity Index Fund | Class
A Class I Class K |
Not
Commenced Not Commenced December 21, 2015 |
Diversified
Diversified Diversified |
| Asset Derivatives | |||||||||||
| Interest
Rate Contracts Risk |
Foreign
Exchange Contracts Risk |
Credit
Contracts Risk |
Equity
Contracts Risk |
Commodity
Contracts Risk |
Total | ||||||
|
Futures
Contracts |
$— | $— | $— | $576,675 | $— | $576,675 | |||||
| Net Realized Gain (Loss) | |||||||||||
| Interest
Rate Contracts Risk |
Foreign
Exchange Contracts Risk |
Credit
Contracts Risk |
Equity
Contracts Risk |
Commodity
Contracts Risk |
Total | ||||||
|
Futures
Contracts |
$— | $— | $— | $(204,866) | $— | $(204,866) | |||||
| Net Change in Unrealized Appreciation (Depreciation) | |||||||||||
| Interest
Rate Contracts Risk |
Foreign
Exchange Contracts Risk |
Credit
Contracts Risk |
Equity
Contracts Risk |
Commodity
Contracts Risk |
Total | ||||||
|
Futures
Contracts |
$— | $— | $— | $927,446 | $— | $927,446 | |||||
| Purchases | Sales | ||
|
State Street Emerging Markets Equity Index
Fund |
$80,563,048 | $34,923,796 |
| Tax
Cost |
Gross
Unrealized Appreciation |
Gross
Unrealized Depreciation |
Net
Unrealized Appreciation (Depreciation) | ||||
|
State Street Emerging Markets Equity Index
Fund |
$579,846,689 | $149,673,248 | $38,632,702 | $111,040,546 |
| Fund | Market
Value of Securities on Loan |
Cash
Collateral Received |
Non-Cash
Collateral Received* |
Total
Collateral Received | ||||
|
State Street Emerging Markets Equity Index
Fund |
$ 18,332,759 | $ 8,669,023 | $ 10,741,822 | $ 19,410,845 |
| * | The non-cash collateral includes U.S. Treasuries and U.S. Government Agency securities. |
| Remaining
Contractual Maturity of the Agreements As of June 30, 2019 | ||||||||||||||
| Fund | Securities
Lending Transactions |
Overnight
and Continuous |
<30 Days | Between
30 & 90 Days |
>90 Days | Total
Borrowings |
Gross
Amount of Recognized Liabilities for Securities Lending Transactions | |||||||
|
State Street Emerging Markets Equity Index
Fund |
Common Stocks | $8,669,023 | $— | $— | $— | $8,669,023 | $8,669,023 | |||||||
| Actual | Hypothetical
(assuming a 5% return before expenses) | ||||||||
| Annualized
Expense Ratio |
Ending
Account Value |
Expenses
Paid During Period(a) |
Ending
Account Value |
Expenses
Paid During Period(a) | |||||
|
State Street Emerging Markets Equity Index
Fund |
0.17% | $1,104.50 | $0.89 | $1,024.00 | $0.85 | ||||
| (a) | Expenses are equal to the Fund’s annualized net expense ratio multiplied by the average account value of the period, multiplied by 181, then divided by 365. |
| • | A report prepared by an independent third-party provider of investment company data, which includes for the Fund: |
| • | Profitability analyses for (a) the Adviser with respect to the Fund and (b) affiliates of the Adviser that provide services to the Fund (“Affiliated Service Providers”). |
| • | Descriptions of the investment management services provided by the Adviser, including its investment strategies and processes; |
| • | Information concerning the allocation of brokerage; and |
| • | Information regarding the procedures and processes used to value the assets of the Fund. |
| • | Reports detailing the financial results and condition of the Adviser and its affiliates; |
| • | Descriptions of the qualifications, education and experience of the individual investment and other professionals responsible for managing the portfolio of the Fund and for Fund operations; |
| • | Information relating to compliance with and the administration of the Code of Ethics adopted by the Adviser; |
| • | A copy of the Adviser’s proxy voting policies and procedures and other information regarding the Adviser’s practices for overseeing proxy vendors; |
| • | Information concerning the resources devoted by the Adviser to overseeing compliance by the Fund and its service providers, including information concerning compliance with investment policies and restrictions and other operating policies of the Fund; |
| • | A description of the adequacy and sophistication of the Adviser’s technology and systems with respect to investment and administrative matters and a description of any material improvements or changes in technology or systems in the past year; |
| • | A description of the business continuity and disaster recovery plans of the Adviser; and |
| • | Information regarding the Adviser’s risk management processes. |
| • | Information concerning the nature, extent, quality and cost of services provided to the Fund by SSGA FM in its capacity as the Fund’s administrator (the “Administrator”); |
| • | Information concerning the nature, extent, quality and cost of various non-investment management services provided to the Fund by affiliates of the Adviser, including the custodian, sub-administrator, fund accountant and securities lending agent of the Fund, and the role of the Adviser in managing the Fund’s relationship with these service providers; |
| • | Copies of the Advisory Agreement and agreements with other service providers of the Fund; |
| • | Draft responses to a letter from independent legal counsel to the Independent Trustees (“Independent Counsel”), reviewed prior to such date by Independent Counsel, requesting specific information from each of: |
| • | Information from SSGA FM, State Street and the Distributor with respect to the Trust providing any material changes to the previous information supplied in response to the letter from Independent Counsel prior to the executive session of the Board on May 15, 2019; |
| • | Materials provided by Broadridge, circulated to the Independent Trustees and to Independent Counsel, with respect to the Fund; and |
| • | A summary of the foregoing materials prepared by Independent Counsel. |
State Street Bank and Trust Company
P.O. Box 5049
Boston, MA 02206
| State Street International Value Spotlight Fund |

|
|
1 |
|
|
2 |
|
|
4 |
|
|
5 |
|
|
6 |
|
|
7 |
|
|
8 |
|
|
13 |
| % of Net Assets | |||
| Common Stocks | 95.5% | ||
| Short-Term Investment | 2.9 | ||
| Other Assets in Excess of Liabilities | 1.6 | ||
| TOTAL | 100.0% |
| % of Net Assets | |||
| Financials | 29.4% | ||
| Industrials | 19.1 | ||
| Materials | 9.4 | ||
| Information Technology | 8.9 | ||
| Energy | 8.5 | ||
| Health Care | 8.4 | ||
| Consumer Discretionary | 6.1 | ||
| Communication Services | 2.9 | ||
| Consumer Staples | 2.8 | ||
| Short-Term Investment | 2.9 | ||
| Other Assets in Excess of Liabilities | 1.6 | ||
| TOTAL | 100.0% |
| Description | Level
1 – Quoted Prices |
Level
2 – Other Significant Observable Inputs |
Level
3 – Significant Unobservable Inputs |
Total | ||||
| ASSETS: | ||||||||
| INVESTMENTS: | ||||||||
|
Common
Stocks |
$1,681,503 | $— | $— | $1,681,503 | ||||
|
Short-Term
Investment |
50,199 | — | — | 50,199 | ||||
|
TOTAL
INVESTMENTS |
$1,731,702 | $— | $— | $1,731,702 |
| Number
of Shares Held at 12/31/18 |
Value
at 12/31/18 |
Cost
of Purchases |
Proceeds
from Shares Sold |
Realized
Gain (Loss) |
Change
in Unrealized Appreciation/ Depreciation |
Number
of Shares Held at 6/30/19 |
Value
at 6/30/19 |
Dividend
Income | |||||||||
|
State Street Institutional U.S. Government Money Market Fund, Class G
Shares |
— | $— | $280,358 | $230,159 | $— | $— | 50,199 | $50,199 | $821 |
| ASSETS | |
|
Investments in unaffiliated issuers, at
value |
$1,681,503 |
|
Investments in affiliated issuers, at
value |
50,199 |
|
Total
Investments |
1,731,702 |
|
Foreign currency, at
value |
16,984 |
|
Dividends receivable — unaffiliated
issuers |
1,427 |
|
Dividends receivable — affiliated
issuers |
154 |
|
Receivable from
Adviser |
27,562 |
|
Receivable for foreign taxes
recoverable |
3,308 |
|
TOTAL ASSETS
|
1,781,137 |
| LIABILITIES | |
|
Advisory fee
payable |
1,051 |
|
Administration fees
payable |
70 |
|
Trustees’ fees and expenses
payable |
874 |
|
Transfer agent fees
payable |
168 |
|
Registration and filing fees
payable |
2,826 |
|
Professional fees
payable |
15,527 |
|
Accrued expenses and other
liabilities |
175 |
|
TOTAL LIABILITIES
|
20,691 |
|
NET ASSETS
|
$1,760,446 |
| NET ASSETS CONSIST OF: | |
|
Paid-in
Capital |
$2,000,000 |
|
Total distributable earnings
(loss) |
(239,554) |
|
NET ASSETS
|
$1,760,446 |
| NET
ASSET VALUE PER SHARE Class K |
|
|
Net
Assets |
$1,760,446 |
|
Shares
Outstanding |
200,000 |
|
Net asset value, offering and redemption price per
share |
$ 8.80 |
| COST OF INVESTMENTS: | |
|
Investments in unaffiliated
issuers |
$1,686,555 |
|
Investments in affiliated
issuers |
50,199 |
|
Total cost of
investments |
$1,736,754 |
|
Foreign currency, at
cost |
$ 16,850 |
| INVESTMENT INCOME (LOSS) | |
|
Dividend income — unaffiliated
issuers |
$ 29,736 |
|
Dividend income — affiliated
issuers |
821 |
|
Dividend income — non-cash
transactions |
3,581 |
|
Foreign taxes
withheld |
(3,915) |
|
TOTAL INVESTMENT INCOME
(LOSS) |
30,223 |
| EXPENSES | |
|
Advisory
fee |
6,465 |
|
Administration
fees |
431 |
|
Custodian
fees |
26,521 |
|
Trustees’ fees and expenses
|
9,900 |
|
Transfer agent
fees |
560 |
|
Registration and filing
fees |
13,286 |
|
Professional
fees |
28,513 |
|
Printing and postage
fees |
5,036 |
|
Miscellaneous
expenses |
3,924 |
|
TOTAL
EXPENSES |
94,636 |
|
Expenses waived/reimbursed by the
Adviser |
(88,171) |
|
NET
EXPENSES |
6,465 |
|
NET INVESTMENT INCOME
(LOSS) |
$ 23,758 |
| REALIZED AND UNREALIZED GAIN (LOSS) | |
| Net realized gain (loss) on: | |
|
Investments — unaffiliated
issuers |
(104,441) |
|
Foreign currency
transactions |
287 |
|
Net realized gain
(loss) |
(104,154) |
| Net change in unrealized appreciation/depreciation on: | |
|
Investments — unaffiliated
issuers |
224,251 |
|
Foreign currency
translations |
(251) |
|
Net change in unrealized
appreciation/depreciation |
224,000 |
|
NET REALIZED AND UNREALIZED GAIN
(LOSS) |
119,846 |
|
NET INCREASE (DECREASE) IN NET ASSETS FROM
OPERATIONS |
$ 143,604 |
| Six
Months Ended 6/30/19 (Unaudited) |
Year
Ended 12/31/18 | ||
| INCREASE (DECREASE) IN NET ASSETS FROM OPERATIONS: | |||
|
Net investment income
(loss) |
$ 23,758 | $ 42,474 | |
|
Net realized gain
(loss) |
(104,154) | 143,121 | |
|
Net change in unrealized
appreciation/depreciation |
224,000 | (675,620) | |
|
Net increase (decrease) in net assets resulting from
operations |
143,604 | (490,025) | |
|
Distributions to
shareholders |
— | (405,520) | |
|
Net increase (decrease) in net assets during the
period |
143,604 | (895,545) | |
|
Net assets at beginning of
period |
1,616,842 | 2,512,387 | |
|
NET ASSETS AT END OF
PERIOD |
$1,760,446 | $1,616,842 | |
| SHARES OF BENEFICIAL INTEREST: | |||
|
Shares
sold |
— | — | |
|
Shares
redeemed |
— | — | |
|
Net increase (decrease) from share
transactions |
— | — |
| Class K | |||||||
| Six
Months Ended 6/30/19 (Unaudited) |
Year
Ended 12/31/18 |
Year
Ended 12/31/17 |
For
the Period 7/14/16* - 12/31/16 | ||||
|
Net asset value, beginning of
period |
$ 8.08 | $ 12.56 | $11.25 | $10.00 | |||
| Income (loss) from investment operations: | |||||||
|
Net investment income (loss)
(a) |
0.12 | 0.21 | 0.24 | 0.02 | |||
|
Net realized and unrealized gain
(loss) |
0.60 | (2.66) | 2.56 | 1.44 | |||
|
Total from investment
operations |
0.72 | (2.45) | 2.80 | 1.46 | |||
| Distributions to shareholders from: | |||||||
|
Net investment
income |
— | (0.22) | (0.24) | (0.02) | |||
|
Net realized
gains |
— | (1.81) | (1.25) | (0.19) | |||
|
Total
distributions |
— | (2.03) | (1.49) | (0.21) | |||
|
Net asset value, end of
period |
$ 8.80 | $ 8.08 | $12.56 | $11.25 | |||
|
Total return
(b) |
8.91% | (19.32)% | 25.03% | 14.57% | |||
| Ratios and Supplemental Data: | |||||||
|
Net assets, end of period (in
000s) |
$1,760 | $ 1,617 | $2,512 | $2,250 | |||
| Ratios to average net assets: | |||||||
|
Total
expenses |
10.98%(c) | 7.58% | 7.26% | 7.76%(c) | |||
|
Net
expenses |
0.75%(c) | 0.75% | 0.75% | 0.75%(c) | |||
|
Net investment income
(loss) |
2.76%(c) | 1.76% | 1.86% | 0.44%(c) | |||
|
Portfolio turnover
rate |
23%(d) | 63% | 45% | 26%(d) | |||
| * | Commencement of operations. |
| (a) | Net investment income per share is calculated using the average shares method. |
| (b) | Total return is calculated assuming a purchase of shares at net asset value on the first day and a sale at net asset value on the last day of each period reported. Distributions are assumed, for the purpose of this calculation, to be reinvested at net asset value per share on the respective payment dates of the Fund. Total return for periods less than one year are not annualized. Results represent past performance and are not indicative of future results. |
| (c) | Annualized. |
| (d) | Not annualized. |
| Fund | Classes | Commencement
of Operations |
Diversification
Classification |
| State Street International Value Spotlight Fund | Class
A Class I Class K |
Not
commenced Not commenced July 14, 2016 |
Non-diversified |
| Fund | Number of 10% Affiliated Account Holders | Percentage of Affiliated Ownership | ||
|
State Street International Value Spotlight
Fund |
1 | 100.00% |
| Purchases | Sales | ||
|
State Street International Value Spotlight
Fund |
$378,540 | $440,740 |
| Tax
Cost |
Gross
Unrealized Appreciation |
Gross
Unrealized Depreciation |
Net
Unrealized Appreciation (Depreciation) | ||||
|
State Street International Value Spotlight
Fund |
$1,755,719 | $120,685 | $144,702 | $(24,017) |
| Actual | Hypothetical
(assuming a 5% return before expenses) | ||||||||
| Annualized
Expense Ratio |
Ending
Account Value |
Expenses
Paid During Period(a) |
Ending
Account Value |
Expenses
Paid During Period(a) | |||||
|
State Street International Value Spotlight
Fund |
0.75% | $1,089.10 | $3.88 | $1,021.10 | $3.76 | ||||
| (a) | Expenses are equal to the Fund’s annualized net expense ratio multiplied by the average account value of the period, multiplied by 181, then divided by 365. |
| • | A report prepared by an independent third-party provider of investment company data, which includes for the Fund: |
| • | Profitability analyses for (a) the Advisers with respect to the Fund and (b) affiliates of the Advisers that provide services to the Fund (“Affiliated Service Providers”). |
| • | Descriptions of the investment management services provided by the Advisers, including their investment strategies and processes; |
| • | Information concerning the allocation of brokerage; and |
| • | Information regarding the procedures and processes used to value the assets of the Fund. |
| • | Reports detailing the financial results and condition of the Advisers and their affiliates; |
| • | Descriptions of the qualifications, education and experience of the individual investment and other professionals responsible for managing the portfolio of the Fund and for Fund operations; |
| • | Information relating to compliance with and the administration of the Code of Ethics adopted by the Advisers; |
| • | A copy of the Adviser’s proxy voting policies and procedures and information regarding the Adviser’s practices for overseeing proxy vendors; |
| • | Information concerning the resources devoted by the Advisers to overseeing compliance by the Fund and its service providers, including information concerning compliance with investment policies and restrictions and other operating policies of the Fund; |
| • | A description of the adequacy and sophistication of the Advisers' technology and systems with respect to investment and administrative matters and a description of any material improvements or changes in technology or systems in the past year; |
| • | A description of the business continuity and disaster recovery plans of the Advisers; and |
| • | Information regarding the Advisers’ risk management processes. |
| • | Information concerning the nature, extent, quality and cost of services provided to the Fund by SSGA FM in its capacity as the Fund’s administrator (the “Administrator”); |
| • | Information concerning the nature, extent, quality and cost of various non-investment management services provided to the Fund by affiliates of the Adviser, including the custodian, sub-administrator, fund accountant and securities lending agent of the Fund, and the role of the Adviser in managing the Fund’s relationship with these service providers; |
| • | Copies of the Advisory Agreement and Sub-Advisory Agreement and agreements with other service providers of the Fund; |
| • | Draft responses to a letter from independent legal counsel to the Independent Trustees (“Independent Counsel”), reviewed prior to such date by Independent Counsel, requesting specific information from each of: |
| • | Information from the Advisers, State Street and the Distributor with respect to the Fund providing any material changes to the previous information supplied in response to the letter from Independent Counsel prior to the executive session of the Board on May 15, 2019; |
| • | Materials provided by Broadridge, circulated to the Independent Trustees and to Independent Counsel, with respect to the Fund; and |
| • | A summary of the foregoing materials prepared by Independent Counsel. |
State Street Bank and Trust Company
P.O. Box 5049
Boston, MA 02206
| State Street Target Retirement Fund |
| State Street Target Retirement 2015 Fund |
| State Street Target Retirement 2020 Fund |
| State Street Target Retirement 2025 Fund |
| State Street Target Retirement 2030 Fund |
| State Street Target Retirement 2035 Fund |
| State Street Target Retirement 2040 Fund |
| State Street Target Retirement 2045 Fund |
| State Street Target Retirement 2050 Fund |
| State Street Target Retirement 2055 Fund |
| State Street Target Retirement 2060 Fund |

| Portfolio Statistics (Unaudited) | |
|
|
1 |
|
|
2 |
|
|
3 |
|
|
4 |
|
|
5 |
|
|
6 |
|
|
7 |
|
|
8 |
|
|
9 |
|
|
10 |
|
|
11 |
| Schedules of Investments (Unaudited) | |
|
|
12 |
|
|
14 |
|
|
16 |
|
|
18 |
|
|
20 |
|
|
22 |
|
|
24 |
|
|
26 |
|
|
28 |
|
|
30 |
|
|
32 |
|
|
34 |
|
|
43 |
|
|
65 |
|
|
72 |
| % of Net Assets | |||
| Domestic Fixed Income | 46.7% | ||
| Domestic Equity | 20.0 | ||
| Inflation Linked | 18.0 | ||
| International Equity | 10.1 | ||
| Real Estate | 5.0 | ||
| Short Term Investments | 10.2 | ||
| Liabilities in Excess of Other Assets | (10.0) | ||
| TOTAL | 100.0% |
| % of Net Assets | |||
| Domestic Fixed Income | 44.7% | ||
| Domestic Equity | 20.8 | ||
| Inflation Linked | 18.7 | ||
| International Equity | 10.6 | ||
| Real Estate | 5.0 | ||
| Short Term Investments | 8.7 | ||
| Liabilities in Excess of Other Assets | (8.5) | ||
| TOTAL | 100.0% |
| % of Net Assets | |||
| Domestic Fixed Income | 33.2% | ||
| Domestic Equity | 28.4 | ||
| Inflation Linked | 17.7 | ||
| International Equity | 15.7 | ||
| Real Estate | 4.8 | ||
| Short Term Investments | 4.7 | ||
| Liabilities in Excess of Other Assets | (4.5) | ||
| TOTAL | 100.0% |
| % of Net Assets | |||
| Domestic Equity | 37.2% | ||
| Domestic Fixed Income | 29.1 | ||
| International Equity | 22.0 | ||
| Inflation Linked | 9.2 | ||
| Real Estate | 2.2 | ||
| Short Term Investments | 4.8 | ||
| Liabilities in Excess of Other Assets | (4.5) | ||
| TOTAL | 100.0% |
| % of Net Assets | |||
| Domestic Equity | 43.7% | ||
| Domestic Fixed Income | 26.7 | ||
| International Equity | 26.6 | ||
| Inflation Linked | 2.7 | ||
| Short Term Investments | 3.5 | ||
| Liabilities in Excess of Other Assets | (3.2) | ||
| TOTAL | 100.0% |
| % of Net Assets | |||
| Domestic Equity | 48.1% | ||
| International Equity | 29.6 | ||
| Domestic Fixed Income | 21.5 | ||
| Inflation Linked | 0.4 | ||
| Short Term Investments | 0.9 | ||
| Liabilities in Excess of Other Assets | (0.5) | ||
| TOTAL | 100.0% |
| % of Net Assets | |||
| Domestic Equity | 51.6% | ||
| International Equity | 31.8 | ||
| Domestic Fixed Income | 16.2 | ||
| Short Term Investments | 0.2 | ||
| Other Assets in Excess of Liabilities | 0.2 | ||
| TOTAL | 100.0% |
| % of Net Assets | |||
| Domestic Equity | 54.5% | ||
| International Equity | 33.8 | ||
| Domestic Fixed Income | 11.2 | ||
| Short Term Investments | 0.2 | ||
| Other Assets in Excess of Liabilities | 0.3 | ||
| TOTAL | 100.0% |
| % of Net Assets | |||
| Domestic Equity | 55.4% | ||
| International Equity | 34.3 | ||
| Domestic Fixed Income | 9.7 | ||
| Short Term Investments | 0.2 | ||
| Other Assets in Excess of Liabilities | 0.4 | ||
| TOTAL | 100.0% |
| % of Net Assets | |||
| Domestic Equity | 55.4% | ||
| International Equity | 34.3 | ||
| Domestic Fixed Income | 9.7 | ||
| Short Term Investments | 0.2 | ||
| Other Assets in Excess of Liabilities | 0.4 | ||
| TOTAL | 100.0% |
| % of Net Assets | |||
| Domestic Equity | 55.1% | ||
| International Equity | 34.2 | ||
| Domestic Fixed Income | 9.6 | ||
| Short Term Investments | 0.2 | ||
| Other Assets in Excess of Liabilities | 0.9 | ||
| TOTAL | 100.0% |
| Description | Level
1 – Quoted Prices |
Level
2 – Other Significant Observable Inputs |
Level
3 – Significant Unobservable Inputs |
Total | ||||
| ASSETS: | ||||||||
| INVESTMENTS: | ||||||||
|
Mutual Funds and Exchange Traded
Products |
$228,742,984 | $— | $— | $228,742,984 | ||||
|
Short-Term
Investments |
23,419,064 | — | — | 23,419,064 | ||||
|
TOTAL
INVESTMENTS |
$252,162,048 | $— | $— | $252,162,048 |
| Number
of Shares Held at 12/31/18 |
Value
at 12/31/18 |
Cost
of Purchases |
Proceeds
from Shares Sold |
Realized
Gain (Loss) |
Change
in Unrealized Appreciation/ Depreciation |
Number
of Shares Held at 6/30/19 |
Value
at 6/30/19 |
Dividend
Income | |||||||||
|
SPDR Bloomberg Barclays 1-10 Year TIPS
ETF |
1,874,241 | $ 35,366,928 | $ 5,678,846 | $ 1,344,291 | $ (16,810) | $ 1,440,400 | 2,099,825 | $ 41,125,073 | $ 470,050 | ||||||||
|
SPDR Bloomberg Barclays High Yield Bond
ETF |
408,730 | 13,729,241 | 4,642,061 | 3,487,210 | (189,334) | 1,322,690 | 147,030 | 16,017,448 | 361,691 | ||||||||
|
SPDR Dow Jones Global Real Estate
ETF |
222,345 | 9,840,990 | 1,851,371 | 1,431,273 | (12,816) | 1,272,890 | 230,885 | 11,521,162 | 160,012 | ||||||||
|
SPDR Portfolio Short Term Corporate Bond
ETF |
260,343 | 7,846,738 | 1,671,145 | 564,412 | (3,142) | 180,158 | 296,637 | 9,130,487 | 102,803 | ||||||||
|
SPDR Portfolio Short Term Treasury
ETF |
1,046,385 | 30,952,068 | 7,080,834 | 2,469,129 | (19,982) | 502,349 | 1,201,538 | 36,046,140 | 342,134 | ||||||||
|
State Street Aggregate Bond Index
Portfolio |
4,053,942 | 39,363,780 | 6,338,368 | 2,009,341 | (20,374) | 2,074,286 | 4,493,784 | 45,746,719 | 522,698 | ||||||||
|
State Street Equity 500 Index II
Portfolio |
2,948,627 | 34,705,348 | 3,547,634 | 5,916,098 | (90,233) | 6,295,155 | 2,762,854 | 38,541,806 | — | ||||||||
|
State Street Global Equity ex-U.S. Index
Portfolio |
2,272,730 | 20,500,023 | 2,400,196 | 2,486,003 | (206,031) | 3,019,293 | 2,261,682 | 23,227,478 | — | ||||||||
|
State Street Institutional U.S. Government Money Market Fund, Class G
Shares |
689,450 | 689,450 | 29,692,307 | 29,851,587 | — | — | 530,170 | 530,170 | 7,742 | ||||||||
|
State Street Navigator Securities Lending Portfolio
II |
15,212,002 | 15,212,002 | 144,587,025 | 136,910,133 | — | — | 22,888,894 | 22,888,894 | 62,267 | ||||||||
|
State Street Small/Mid Cap Equity Index
Portfolio |
638,270 | 6,580,561 | 700,001 | 1,135,000 | (43,662) | 1,284,771 | 599,081 | 7,386,671 | — | ||||||||
|
Total |
$214,787,129 | $208,189,788 | $187,604,477 | $(602,384) | $17,391,992 | $252,162,048 | $2,029,397 |
| Description | Level
1 – Quoted Prices |
Level
2 – Other Significant Observable Inputs |
Level
3 – Significant Unobservable Inputs |
Total | ||||
| ASSETS: | ||||||||
| INVESTMENTS: | ||||||||
|
Mutual Funds and Exchange Traded
Products |
$278,363,955 | $— | $— | $278,363,955 | ||||
|
Short-Term
Investments |
24,209,221 | — | — | 24,209,221 | ||||
|
TOTAL
INVESTMENTS |
$302,573,176 | $— | $— | $302,573,176 |
| Number
of Shares Held at 12/31/18 |
Value
at 12/31/18 |
Cost
of Purchases |
Proceeds
from Shares Sold |
Realized
Gain (Loss) |
Change
in Unrealized Appreciation/ Depreciation |
Number
of Shares Held at 6/30/19 |
Value
at 6/30/19 |
Dividend
Income | |||||||||
|
SPDR Bloomberg Barclays 1-10 Year TIPS
ETF |
2,595,101 | $ 48,969,556 | $ 5,645,505 | $ 4,394,425 | $ (70,639) | $ 1,978,183 | 2,661,638 | $ 52,128,180 | $ 613,264 | ||||||||
|
SPDR Bloomberg Barclays High Yield Bond
ETF |
522,395 | 17,547,248 | 2,978,030 | 2,481,162 | (82,658) | 1,526,383 | 178,886 | 19,487,841 | 453,042 | ||||||||
|
SPDR Dow Jones Global Real Estate
ETF |
283,875 | 12,564,308 | 1,824,344 | 2,003,658 | 44,923 | 1,580,257 | 280,765 | 14,010,174 | 195,999 | ||||||||
|
SPDR Portfolio Short Term Corporate Bond
ETF |
249,519 | 7,520,503 | 2,515,971 | 479,846 | (2,866) | 174,565 | 316,060 | 9,728,327 | 101,248 | ||||||||
|
SPDR Portfolio Short Term Treasury
ETF |
999,092 | 29,553,141 | 12,137,068 | 3,849,611 | (61,133) | 524,895 | 1,276,812 | 38,304,360 | 335,963 | ||||||||
|
State Street Aggregate Bond Index
Portfolio |
5,441,118 | 52,833,258 | 5,988,562 | 4,429,125 | 4,394 | 2,654,710 | 5,604,303 | 57,051,799 | 679,257 | ||||||||
|
State Street Equity 500 Index II
Portfolio |
4,104,579 | 48,310,895 | 2,699,063 | 10,597,871 | 906,096 | 7,593,842 | 3,506,238 | 48,912,025 | — | ||||||||
|
State Street Global Equity ex-U.S. Index
Portfolio |
3,193,822 | 28,808,277 | 2,009,881 | 5,060,526 | 499,117 | 3,388,339 | 2,886,571 | 29,645,088 | — | ||||||||
|
State Street Institutional U.S. Government Money Market Fund, Class G
Shares |
1,054,483 | 1,054,483 | 32,238,592 | 32,823,523 | — | — | 469,552 | 469,552 | 8,069 | ||||||||
|
State Street Navigator Securities Lending Portfolio
II |
16,185,625 | 16,185,625 | 202,059,222 | 194,505,178 | — | — | 23,739,669 | 23,739,669 | 78,513 | ||||||||
|
State Street Small/Mid Cap Equity Index
Portfolio |
834,650 | 8,605,234 | 430,000 | 1,560,000 | 117,155 | 1,503,772 | 737,726 | 9,096,161 | — | ||||||||
|
Total |
$271,952,528 | $270,526,238 | $262,184,925 | $1,354,389 | $20,924,946 | $302,573,176 | $2,465,355 |
| Description | Level
1 – Quoted Prices |
Level
2 – Other Significant Observable Inputs |
Level
3 – Significant Unobservable Inputs |
Total | ||||
| ASSETS: | ||||||||
| INVESTMENTS: | ||||||||
|
Mutual Funds and Exchange Traded
Products |
$ 974,060,688 | $— | $— | $ 974,060,688 | ||||
|
Short-Term
Investments |
46,121,472 | — | — | 46,121,472 | ||||
|
TOTAL
INVESTMENTS |
$1,020,182,160 | $— | $— | $1,020,182,160 |
| Number
of Shares Held at 12/31/18 |
Value
at 12/31/18 |
Cost
of Purchases |
Proceeds
from Shares Sold |
Realized
Gain (Loss) |
Change
in Unrealized Appreciation/ Depreciation |
Number
of Shares Held at 6/30/19 |
Value
at 6/30/19 |
Dividend
Income | |||||||||
|
SPDR Bloomberg Barclays 1-10 Year TIPS
ETF |
7,629,950 | $143,977,157 | $ 28,319,949 | $ 5,610,633 | $ (129,118) | $ 6,018,223 | 8,811,620 | $ 172,575,578 | $1,951,882 | ||||||||
|
SPDR Bloomberg Barclays High Yield Bond
ETF |
1,590,079 | 53,410,754 | 14,514,997 | 6,724,569 | (176,121) | 4,693,648 | 603,256 | 65,718,709 | 1,454,914 | ||||||||
|
SPDR Dow Jones Global Real Estate
ETF |
837,065 | 37,048,497 | 11,294,457 | 6,714,789 | 187,726 | 4,699,741 | 932,177 | 46,515,632 | 622,740 | ||||||||
|
SPDR Portfolio Long Term Treasury
ETF |
189,337 | 6,634,368 | 669,547 | 2,952,579 | (13,836) | 538,852 | 127,787 | 4,876,352 | 67,374 | ||||||||
|
SPDR Portfolio Short Term Corporate Bond
ETF |
— | — | 2,421,004 | — | — | 9,169 | 78,953 | 2,430,173 | 8,601 | ||||||||
|
SPDR Portfolio Short Term Treasury
ETF |
— | — | 7,770,029 | 40,019 | (48) | 36,018 | 258,866 | 7,765,980 | 29,062 | ||||||||
|
State Street Aggregate Bond Index
Portfolio |
21,231,286 | 206,155,787 | 34,521,068 | 8,262,945 | (54,746) | 10,965,968 | 23,902,272 | 243,325,132 | 2,788,832 | ||||||||
|
State Street Equity 500 Index II
Portfolio |
17,924,338 | 210,969,455 | 15,374,156 | 33,930,878 | 4,398,400 | 33,888,078 | 16,537,578 | 230,699,211 | — | ||||||||
|
State Street Global Equity ex-U.S. Index
Portfolio |
15,432,561 | 139,201,704 | 11,365,529 | 16,182,282 | 1,782,179 | 17,528,416 | 14,965,486 | 153,695,546 | — | ||||||||
|
State Street Institutional U.S. Government Money Market Fund, Class G
Shares |
3,856,701 | 3,856,701 | 92,429,069 | 95,052,253 | — | — | 1,233,517 | 1,233,517 | 27,943 | ||||||||
|
State Street Navigator Securities Lending Portfolio
II |
42,621,043 | 42,621,043 | 300,319,613 | 298,052,701 | — | — | 44,887,955 | 44,887,955 | 149,452 | ||||||||
|
State Street Small/Mid Cap Equity Index
Portfolio |
4,208,975 | 43,394,534 | 2,730,000 | 7,949,379 | 684,533 | 7,598,687 | 3,767,914 | 46,458,375 | — | ||||||||
|
Total |
$887,270,000 | $521,729,418 | $481,473,027 | $6,678,969 | $85,976,800 | $1,020,182,160 | $7,100,800 |
| Description | Level
1 – Quoted Prices |
Level
2 – Other Significant Observable Inputs |
Level
3 – Significant Unobservable Inputs |
Total | ||||
| ASSETS: | ||||||||
| INVESTMENTS: | ||||||||
|
Mutual Funds and Exchange Traded
Products |
$1,225,908,033 | $— | $— | $1,225,908,033 | ||||
|
Short-Term
Investments |
59,191,243 | — | — | 59,191,243 | ||||
|
TOTAL
INVESTMENTS |
$1,285,099,276 | $— | $— | $1,285,099,276 |
| Number
of Shares Held at 12/31/18 |
Value
at 12/31/18 |
Cost
of Purchases |
Proceeds
from Shares Sold |
Realized
Gain (Loss) |
Change
in Unrealized Appreciation/ Depreciation |
Number
of Shares Held at 6/30/19 |
Value
at 6/30/19 |
Dividend
Income | |||||||||
|
SPDR Bloomberg Barclays High Yield Bond
ETF |
1,726,491 | $ 57,992,833 | $ 15,919,102 | $ 5,500,760 | $ (145,818) | $ 5,135,474 | 673,773 | $ 73,400,831 | $1,621,712 | ||||||||
|
SPDR Bloomberg Barclays TIPS
ETF |
1,525,330 | 82,200,034 | 31,358,775 | 5,351,488 | (171,557) | 4,847,704 | 1,994,760 | 112,883,468 | 1,259,866 | ||||||||
|
SPDR Dow Jones Global Real Estate
ETF |
437,542 | 19,365,609 | 10,826,343 | 5,069,883 | 203,405 | 2,377,808 | 555,176 | 27,703,282 | 349,971 | ||||||||
|
SPDR Portfolio Long Term Treasury
ETF |
1,615,726 | 56,615,039 | 20,330,147 | 17,639,585 | 561,282 | 5,099,334 | 1,702,469 | 64,966,217 | 722,160 | ||||||||
|
State Street Aggregate Bond Index
Portfolio |
16,976,734 | 164,844,088 | 51,752,024 | 5,892,988 | (137,040) | 9,396,347 | 21,607,311 | 219,962,431 | 2,361,012 | ||||||||
|
State Street Equity 500 Index II
Portfolio |
26,638,196 | 313,531,564 | 36,470,904 | 40,561,349 | 5,567,661 | 52,597,786 | 26,351,725 | 367,606,566 | — | ||||||||
|
State Street Global Equity ex-U.S. Index
Portfolio |
25,109,397 | 226,486,759 | 29,981,918 | 18,675,738 | 2,367,314 | 29,814,438 | 26,287,701 | 269,974,691 | — | ||||||||
|
State Street Institutional U.S. Government Money Market Fund, Class G
Shares |
3,371,562 | 3,371,562 | 127,218,264 | 127,392,266 | — | — | 3,197,560 | 3,197,560 | 41,019 | ||||||||
|
State Street Navigator Securities Lending Portfolio
II |
37,759,701 | 37,759,701 | 324,409,369 | 306,175,387 | — | — | 55,993,683 | 55,993,683 | 186,417 | ||||||||
|
State Street Small/Mid Cap Equity Index
Portfolio |
7,387,038 | 76,160,363 | 9,387,860 | 10,900,000 | 1,081,118 | 13,681,206 | 7,251,464 | 89,410,547 | — | ||||||||
|
Total |
$1,038,327,552 | $657,654,706 | $543,159,444 | $9,326,365 | $122,950,097 | $1,285,099,276 | $6,542,157 |
| Description | Level
1 – Quoted Prices |
Level
2 – Other Significant Observable Inputs |
Level
3 – Significant Unobservable Inputs |
Total | ||||
| ASSETS: | ||||||||
| INVESTMENTS: | ||||||||
|
Mutual Funds and Exchange Traded
Products |
$1,196,446,954 | $— | $— | $1,196,446,954 | ||||
|
Short-Term
Investments |
41,951,527 | — | — | 41,951,527 | ||||
|
TOTAL
INVESTMENTS |
$1,238,398,481 | $— | $— | $1,238,398,481 |
| Number
of Shares Held at 12/31/18 |
Value
at 12/31/18 |
Cost
of Purchases |
Proceeds
from Shares Sold |
Realized
Gain (Loss) |
Change
in Unrealized Appreciation/ Depreciation |
Number
of Shares Held at 6/30/19 |
Value
at 6/30/19 |
Dividend
Income | |||||||||
|
SPDR Bloomberg Barclays High Yield Bond
ETF |
956,744 | $ 32,137,031 | $ 11,235,072 | $ 900,585 | $ (9,133) | $ 2,816,456 | 415,631 | $ 45,278,841 | $ 940,045 | ||||||||
|
SPDR Bloomberg Barclays TIPS
ETF |
426,260 | 22,971,151 | 8,486,012 | 600,277 | (29,843) | 1,355,633 | 568,699 | 32,182,676 | 359,724 | ||||||||
|
SPDR Portfolio Long Term Treasury
ETF |
2,593,665 | 90,882,022 | 46,336,411 | 29,646,732 | 566,679 | 8,980,689 | 3,069,158 | 117,119,069 | 1,216,694 | ||||||||
|
State Street Aggregate Bond Index
Portfolio |
12,335,296 | 119,775,729 | 35,116,109 | 3,730,000 | (122,407) | 6,917,224 | 15,516,371 | 157,956,655 | 1,729,130 | ||||||||
|
State Street Equity 500 Index II
Portfolio |
28,381,227 | 334,047,047 | 42,009,082 | 31,264,240 | 5,018,103 | 57,881,765 | 29,225,216 | 407,691,757 | — | ||||||||
|
State Street Global Equity ex-U.S. Index
Portfolio |
28,504,335 | 257,109,098 | 39,839,072 | 14,091,280 | 1,790,633 | 35,255,642 | 31,149,286 | 319,903,165 | — | ||||||||
|
State Street Institutional U.S. Government Money Market Fund, Class G
Shares |
3,882,987 | 3,882,987 | 119,395,615 | 121,248,966 | — | — | 2,029,636 | 2,029,636 | 41,638 | ||||||||
|
State Street Navigator Securities Lending Portfolio
II |
19,640,778 | 19,640,778 | 293,803,887 | 273,522,774 | — | — | 39,921,891 | 39,921,891 | 121,790 | ||||||||
|
State Street Small/Mid Cap Equity Index
Portfolio |
9,299,159 | 95,874,330 | 13,400,000 | 11,701,550 | 1,743,888 | 16,998,123 | 9,433,478 | 116,314,791 | — | ||||||||
|
Total |
$976,320,173 | $609,621,260 | $486,706,404 | $8,957,920 | $130,205,532 | $1,238,398,481 | $4,409,021 |
| Description | Level
1 – Quoted Prices |
Level
2 – Other Significant Observable Inputs |
Level
3 – Significant Unobservable Inputs |
Total | ||||
| ASSETS: | ||||||||
| INVESTMENTS: | ||||||||
|
Mutual Funds and Exchange Traded
Products |
$ 995,091,786 | $— | $— | $ 995,091,786 | ||||
|
Short-Term
Investments |
8,672,677 | — | — | 8,672,677 | ||||
|
TOTAL
INVESTMENTS |
$1,003,764,463 | $— | $— | $1,003,764,463 |
| Number
of Shares Held at 12/31/18 |
Value
at 12/31/18 |
Cost
of Purchases |
Proceeds
from Shares Sold |
Realized
Gain (Loss) |
Change
in Unrealized Appreciation/ Depreciation |
Number
of Shares Held at 6/30/19 |
Value
at 6/30/19 |
Dividend
Income | |||||||||
|
SPDR Bloomberg Barclays High Yield Bond
ETF |
113,039 | $ 3,796,980 | $ 4,142,020 | $ 110,053 | $ 92 | $ 342,224 | 75,007 | $ 8,171,263 | $ 130,170 | ||||||||
|
SPDR Bloomberg Barclays TIPS
ETF |
— | — | 4,168,509 | — | — | 36,298 | 74,303 | 4,204,807 | 24,463 | ||||||||
|
SPDR Portfolio Long Term Treasury
ETF |
2,142,736 | 75,081,469 | 36,969,646 | 22,702,208 | 213,811 | 7,683,157 | 2,548,372 | 97,245,875 | 1,005,399 | ||||||||
|
State Street Aggregate Bond Index
Portfolio |
8,623,437 | 83,733,570 | 23,391,113 | 2,920,000 | (10,620) | 4,740,630 | 10,700,854 | 108,934,693 | 1,202,755 | ||||||||
|
State Street Equity 500 Index II
Portfolio |
25,094,581 | 295,363,217 | 36,230,443 | 24,855,454 | 4,022,279 | 51,536,485 | 25,971,109 | 362,296,970 | — | ||||||||
|
State Street Global Equity ex-U.S. Index
Portfolio |
26,185,518 | 236,193,372 | 35,644,906 | 10,329,752 | 1,349,171 | 32,701,070 | 28,778,848 | 295,558,767 | — | ||||||||
|
State Street Institutional U.S. Government Money Market Fund, Class G
Shares |
3,267,995 | 3,267,995 | 102,762,796 | 104,022,657 | — | — | 2,008,134 | 2,008,134 | 30,754 | ||||||||
|
State Street Navigator Securities Lending Portfolio
II |
— | — | 32,124,228 | 25,459,685 | — | — | 6,664,543 | 6,664,543 | 8,060 | ||||||||
|
State Street Small/Mid Cap Equity Index
Portfolio |
9,409,735 | 97,014,373 | 13,060,000 | 10,380,000 | 1,525,414 | 17,459,624 | 9,625,256 | 118,679,411 | — | ||||||||
|
Total |
$794,450,976 | $288,493,661 | $200,779,809 | $7,100,147 | $114,499,488 | $1,003,764,463 | $2,401,601 |
| Description | Level
1 – Quoted Prices |
Level
2 – Other Significant Observable Inputs |
Level
3 – Significant Unobservable Inputs |
Total | ||||
| ASSETS: | ||||||||
| INVESTMENTS: | ||||||||
|
Mutual Funds and Exchange Traded
Products |
$813,176,954 | $— | $— | $813,176,954 | ||||
|
Short-Term
Investments |
1,640,408 | — | — | 1,640,408 | ||||
|
TOTAL
INVESTMENTS |
$814,817,362 | $— | $— | $814,817,362 |
| Number
of Shares Held at 12/31/18 |
Value
at 12/31/18 |
Cost
of Purchases |
Proceeds
from Shares Sold |
Realized
Gain (Loss) |
Change
in Unrealized Appreciation/ Depreciation |
Number
of Shares Held at 6/30/19 |
Value
at 6/30/19 |
Dividend
Income | |||||||||
|
SPDR Portfolio Long Term Treasury
ETF |
1,703,593 | $ 59,693,899 | $ 28,462,796 | $ 15,152,075 | $ 337,966 | $ 6,074,404 | 2,081,158 | $ 79,416,990 | $ 813,397 | ||||||||
|
State Street Aggregate Bond Index
Portfolio |
3,740,116 | 36,316,524 | 15,073,447 | 960,000 | (3,974) | 2,136,328 | 5,163,293 | 52,562,325 | 544,530 | ||||||||
|
State Street Equity 500 Index II
Portfolio |
20,572,466 | 242,137,916 | 33,150,645 | 15,688,895 | 2,513,386 | 43,533,048 | 21,910,115 | 305,646,100 | — | ||||||||
|
State Street Global Equity ex-U.S. Index
Portfolio |
22,354,298 | 201,635,770 | 34,618,316 | 5,639,591 | 787,272 | 28,641,423 | 25,320,661 | 260,043,190 | — | ||||||||
|
State Street Institutional U.S. Government Money Market Fund, Class G
Shares |
2,484,650 | 2,484,650 | 83,526,653 | 84,382,595 | — | — | 1,628,708 | 1,628,708 | 26,717 | ||||||||
|
State Street Navigator Securities Lending Portfolio
II |
— | — | 2,934,250 | 2,922,550 | — | — | 11,700 | 11,700 | 326 | ||||||||
|
State Street Small/Mid Cap Equity Index
Portfolio |
8,860,607 | 91,352,859 | 14,170,122 | 8,063,304 | 1,267,494 | 16,781,178 | 9,368,074 | 115,508,349 | — | ||||||||
|
Total |
$633,621,618 | $211,936,229 | $132,809,010 | $4,902,144 | $97,166,381 | $814,817,362 | $1,384,970 |
| Description | Level
1 – Quoted Prices |
Level
2 – Other Significant Observable Inputs |
Level
3 – Significant Unobservable Inputs |
Total | ||||
| ASSETS: | ||||||||
| INVESTMENTS: | ||||||||
|
Mutual Funds and Exchange Traded
Products |
$614,999,055 | $— | $— | $614,999,055 | ||||
|
Short-Term
Investments |
1,082,289 | — | — | 1,082,289 | ||||
|
TOTAL
INVESTMENTS |
$616,081,344 | $— | $— | $616,081,344 |
| Number
of Shares Held at 12/31/18 |
Value
at 12/31/18 |
Cost
of Purchases |
Proceeds
from Shares Sold |
Realized
Gain (Loss) |
Change
in Unrealized Appreciation/ Depreciation |
Number
of Shares Held at 6/30/19 |
Value
at 6/30/19 |
Dividend
Income | |||||||||
|
SPDR Portfolio Long Term Treasury
ETF |
1,242,947 | $ 43,552,863 | $ 22,108,930 | $ 10,467,348 | $ 99,620 | $ 4,739,018 | 1,573,194 | $ 60,033,083 | $606,727 | ||||||||
|
State Street Aggregate Bond Index
Portfolio |
454,389 | 4,412,120 | 4,561,457 | 100,000 | 910 | 293,369 | 900,575 | 9,167,856 | 76,457 | ||||||||
|
State Street Equity 500 Index II
Portfolio |
15,289,570 | 179,958,234 | 30,665,429 | 10,482,563 | 1,766,795 | 32,849,764 | 16,828,506 | 234,757,659 | — | ||||||||
|
State Street Global Equity ex-U.S. Index
Portfolio |
17,325,315 | 156,274,342 | 33,528,257 | 4,029,087 | 560,669 | 22,537,437 | 20,338,035 | 208,871,618 | — | ||||||||
|
State Street Institutional U.S. Government Money Market Fund, Class G
Shares |
2,500,610 | 2,500,610 | 71,086,440 | 72,528,161 | — | — | 1,058,889 | 1,058,889 | 21,012 | ||||||||
|
State Street Navigator Securities Lending Portfolio
II |
— | — | 8,157,675 | 8,134,275 | — | — | 23,400 | 23,400 | 1,023 | ||||||||
|
State Street Small/Mid Cap Equity Index
Portfolio |
7,565,066 | 77,995,834 | 14,886,788 | 6,262,530 | 902,724 | 14,646,023 | 8,286,200 | 102,168,839 | — | ||||||||
|
Total |
$464,694,003 | $184,994,976 | $112,003,964 | $3,330,718 | $75,065,611 | $616,081,344 | $705,219 |
| Description | Level
1 – Quoted Prices |
Level
2 – Other Significant Observable Inputs |
Level
3 – Significant Unobservable Inputs |
Total | ||||
| ASSETS: | ||||||||
| INVESTMENTS: | ||||||||
|
Mutual Funds and Exchange Traded
Products |
$413,567,626 | $— | $— | $413,567,626 | ||||
|
Short-Term
Investment |
654,946 | — | — | 654,946 | ||||
|
TOTAL
INVESTMENTS |
$414,222,572 | $— | $— | $414,222,572 |
| Number
of Shares Held at 12/31/18 |
Value
at 12/31/18 |
Cost
of Purchases |
Proceeds
from Shares Sold |
Realized
Gain (Loss) |
Change
in Unrealized Appreciation/ Depreciation |
Number
of Shares Held at 6/30/19 |
Value
at 6/30/19 |
Dividend
Income | |||||||||
|
SPDR Portfolio Long Term Treasury
ETF |
798,634 | $ 27,984,136 | $ 15,462,395 | $ 6,287,125 | $ 163,003 | $ 3,024,617 | 1,057,312 | $ 40,347,026 | $397,007 | ||||||||
|
State Street Equity 500 Index II
Portfolio |
9,869,800 | 116,167,543 | 25,395,492 | 5,595,118 | 930,350 | 21,664,077 | 11,366,476 | 158,562,344 | — | ||||||||
|
State Street Global Equity ex-U.S. Index
Portfolio |
11,275,750 | 101,707,269 | 28,108,613 | 2,133,678 | 282,111 | 14,972,791 | 13,917,926 | 142,937,106 | — | ||||||||
|
State Street Institutional U.S. Government Money Market Fund, Class G
Shares |
1,877,322 | 1,877,322 | 57,174,918 | 58,397,294 | — | — | 654,946 | 654,946 | 14,897 | ||||||||
|
State Street Navigator Securities Lending Portfolio
II |
— | — | 4,323,600 | 4,323,600 | — | — | — | — | 1,073 | ||||||||
|
State Street Small/Mid Cap Equity Index
Portfolio |
5,027,392 | 51,832,413 | 13,042,035 | 3,587,122 | 571,675 | 9,862,149 | 5,816,801 | 71,721,150 | — | ||||||||
|
Total |
$299,568,683 | $143,507,053 | $80,323,937 | $1,947,139 | $49,523,634 | $414,222,572 | $412,977 |
| Description | Level
1 – Quoted Prices |
Level
2 – Other Significant Observable Inputs |
Level
3 – Significant Unobservable Inputs |
Total | ||||
| ASSETS: | ||||||||
| INVESTMENTS: | ||||||||
|
Mutual Funds and Exchange Traded
Products |
$201,953,746 | $— | $— | $201,953,746 | ||||
|
Short-Term
Investment |
425,777 | — | — | 425,777 | ||||
|
TOTAL
INVESTMENTS |
$202,379,523 | $— | $— | $202,379,523 |
| Number
of Shares Held at 12/31/18 |
Value
at 12/31/18 |
Cost
of Purchases |
Proceeds
from Shares Sold |
Realized
Gain (Loss) |
Change
in Unrealized Appreciation/ Depreciation |
Number
of Shares Held at 6/30/19 |
Value
at 6/30/19 |
Dividend
Income | |||||||||
|
SPDR Portfolio Long Term Treasury
ETF |
352,151 | $ 12,339,371 | $ 8,712,258 | $ 2,886,612 | $ (34,658) | $ 1,581,647 | 516,562 | $ 19,712,006 | $186,177 | ||||||||
|
State Street Equity 500 Index II
Portfolio |
4,350,416 | 51,204,388 | 18,512,242 | 2,646,405 | 388,486 | 9,954,045 | 5,549,301 | 77,412,756 | — | ||||||||
|
State Street Global Equity ex-U.S. Index
Portfolio |
4,970,244 | 44,831,602 | 19,062,558 | 1,094,301 | 130,150 | 6,824,529 | 6,792,068 | 69,754,538 | — | ||||||||
|
State Street Institutional U.S. Government Money Market Fund, Class G
Shares |
991,215 | 991,215 | 38,748,884 | 39,314,322 | — | — | 425,777 | 425,777 | 8,436 | ||||||||
|
State Street Navigator Securities Lending Portfolio
II |
— | — | 447,350 | 447,350 | — | — | — | — | 41 | ||||||||
|
State Street Small/Mid Cap Equity Index
Portfolio |
2,215,930 | 22,846,240 | 9,070,001 | 1,540,000 | 177,783 | 4,520,422 | 2,844,643 | 35,074,446 | — | ||||||||
|
Total |
$132,212,816 | $94,553,293 | $47,928,990 | $661,761 | $22,880,643 | $202,379,523 | $194,654 |
| Description | Level
1 – Quoted Prices |
Level
2 – Other Significant Observable Inputs |
Level
3 – Significant Unobservable Inputs |
Total | ||||
| ASSETS: | ||||||||
| INVESTMENTS: | ||||||||
|
Mutual Funds and Exchange Traded
Products |
$46,190,024 | $— | $— | $46,190,024 | ||||
|
Short-Term
Investment |
76,329 | — | — | 76,329 | ||||
|
TOTAL
INVESTMENTS |
$46,266,353 | $— | $— | $46,266,353 |
| Number
of Shares Held at 12/31/18 |
Value
at 12/31/18 |
Cost
of Purchases |
Proceeds
from Shares Sold |
Realized
Gain (Loss) |
Change
in Unrealized Appreciation/ Depreciation |
Number
of Shares Held at 6/30/19 |
Value
at 6/30/19 |
Dividend
Income | |||||||||
|
SPDR Portfolio Long Term Treasury
ETF |
69,105 | $ 2,421,439 | $ 7,515,797 | $ 5,770,975 | $132,951 | $ 208,705 | 118,132 | $ 4,507,917 | $40,830 | ||||||||
|
State Street Equity 500 Index II
Portfolio |
852,220 | 10,030,631 | 7,911,325 | 2,454,614 | 90,397 | 2,127,047 | 1,269,160 | 17,704,786 | — | ||||||||
|
State Street Global Equity ex-U.S. Index
Portfolio |
974,192 | 8,787,215 | 7,725,400 | 2,045,741 | (48,726) | 1,542,335 | 1,554,088 | 15,960,483 | — | ||||||||
|
State Street Institutional U.S. Government Money Market Fund, Class G
Shares |
355,295 | 355,295 | 16,813,703 | 17,092,669 | — | — | 76,329 | 76,329 | 2,829 | ||||||||
|
State Street Navigator Securities Lending Portfolio
II |
— | — | 3,516,975 | 3,516,975 | — | — | — | — | 226 | ||||||||
|
State Street Small/Mid Cap Equity Index
Portfolio |
434,259 | 4,477,205 | 3,777,851 | 1,217,629 | 23,943 | 955,468 | 650,190 | 8,016,838 | — | ||||||||
|
Total |
$26,071,785 | $47,261,051 | $32,098,603 | $198,565 | $4,833,555 | $46,266,353 | $43,885 |
| State Street Target Retirement Fund | State Street Target Retirement 2015 Fund | State Street Target Retirement 2020 Fund | State Street Target Retirement 2025 Fund | ||||
| ASSETS | |||||||
|
Investments in affiliated issuers, at
value* |
$252,162,048 | $302,573,176 | $1,020,182,160 | $1,285,099,276 | |||
|
Cash |
13 | 13 | 506 | 51 | |||
|
Receivable for investments
sold |
630,039 | 4,231,192 | 10,211,889 | 13,216,855 | |||
|
Receivable for fund shares
sold |
137,844 | 234,492 | 260,133 | 1,220,928 | |||
|
Dividends receivable — affiliated
issuers |
937 | 1,175 | 4,891 | 8,054 | |||
|
Securities lending income receivable — unaffiliated
issuers |
— | — | — | 1,854 | |||
|
Securities lending income receivable — affiliated issuers
|
6,373 | 8,361 | 9,138 | 9,538 | |||
|
Receivable from
Adviser |
69,187 | 68,381 | 135,707 | 142,452 | |||
|
TOTAL ASSETS
|
253,006,441 | 307,116,790 | 1,030,804,424 | 1,299,699,008 | |||
| LIABILITIES | |||||||
|
Payable upon return of securities
loaned |
22,888,894 | 23,739,669 | 44,887,955 | 55,993,683 | |||
|
Payable for investments
purchased |
716,855 | 4,236,148 | 9,542,000 | 13,924,001 | |||
|
Payable for fund shares
repurchased |
30,153 | 208,077 | 429,457 | 43,981 | |||
|
Advisory fee
payable |
9,344 | 11,358 | 39,497 | 49,369 | |||
|
Custodian fees
payable |
3,818 | 4,857 | 5,009 | 5,221 | |||
|
Administration fees
payable |
9,517 | 11,596 | 39,885 | 49,693 | |||
|
Trustees’ fees and expenses
payable |
57 | 53 | 77 | 81 | |||
|
Transfer agent fees
payable |
5,577 | 4,590 | 6,612 | 7,565 | |||
|
Sub-transfer agent fee
payable |
242 | 143 | 83 | 232 | |||
|
Registration and filing fees
payable |
6,671 | 4,961 | 6,672 | 6,588 | |||
|
Professional fees
payable |
20,001 | 20,074 | 20,426 | 20,396 | |||
|
Printing and postage fees
payable |
1,693 | 3,199 | 8,116 | 7,860 | |||
|
Accrued expenses and other
liabilities |
106 | 233 | 232 | 340 | |||
|
TOTAL LIABILITIES
|
23,692,928 | 28,244,958 | 54,986,021 | 70,109,010 | |||
|
NET ASSETS
|
$229,313,513 | $278,871,832 | $ 975,818,403 | $1,229,589,998 | |||
| NET ASSETS CONSIST OF: | |||||||
|
Paid-in
Capital |
$223,408,259 | $267,431,972 | $ 915,218,216 | $1,141,634,921 | |||
|
Total distributable earnings
(loss) |
5,905,254 | 11,439,860 | 60,600,187 | 87,955,077 | |||
|
NET ASSETS
|
$229,313,513 | $278,871,832 | $ 975,818,403 | $1,229,589,998 | |||
| Class I | |||||||
|
Net
Assets |
$ 106,561 | $ 16,737 | $ 2,117,826 | $ 1,382,529 | |||
|
Shares
Outstanding |
9,733 | 1,524 | 184,578 | 115,814 | |||
|
Net asset value, offering and redemption price per
share |
$ 10.95 | $ 10.98 | $ 11.47 | $ 11.94 | |||
| Class K | |||||||
|
Net
Assets |
$229,206,952 | $278,855,095 | $ 973,700,577 | $1,228,207,469 | |||
|
Shares
Outstanding |
20,968,461 | 25,398,377 | 84,831,420 | 102,739,496 | |||
|
Net asset value, offering and redemption price per
share |
$ 10.93 | $ 10.98 | $ 11.48 | $ 11.95 | |||
| COST OF INVESTMENTS: | |||||||
|
Investments in affiliated
issuers |
246,860,926 | 295,229,747 | 977,447,153 | 1,222,114,544 | |||
|
* Includes investments in securities on loan, at
value |
$ 22,542,884 | $ 23,329,024 | $ 59,060,941 | $ 65,699,644 |
| State Street Target Retirement 2030 Fund | State Street Target Retirement 2035 Fund | State Street Target Retirement 2040 Fund | State Street Target Retirement 2045 Fund | State Street Target Retirement 2050 Fund | State Street Target Retirement 2055 Fund | State Street Target Retirement 2060 Fund | ||||||
| 1,238,398,481 | $1,003,764,463 | $814,817,362 | $616,081,344 | $414,222,572 | $202,379,523 | $46,266,353 | ||||||
| 27 | — | — | — | — | — | — | ||||||
| 6,881,458 | 5,148,640 | 3,716,734 | 2,928,057 | 1,920,822 | 905,586 | 127,083 | ||||||
| 1,586,101 | 2,026,282 | 1,603,791 | 1,678,100 | 1,548,588 | 880,829 | 432,087 | ||||||
| 6,251 | 4,619 | 4,115 | 3,590 | 2,806 | 1,310 | 405 | ||||||
| 469 | 955 | 3 | — | — | — | — | ||||||
| 9,630 | — | 29 | 39 | — | 4 | — | ||||||
| 112,758 | 94,270 | 86,598 | 77,622 | 68,415 | 57,445 | 49,818 | ||||||
| 1,246,995,175 | 1,011,039,229 | 820,228,632 | 620,768,752 | 417,763,203 | 204,224,697 | 46,875,746 | ||||||
| 39,921,891 | 6,664,543 | 11,700 | 23,400 | — | — | — | ||||||
| 6,533,460 | 5,281,150 | 3,870,000 | 2,770,000 | 1,750,000 | 954,819 | 126,000 | ||||||
| 33,618 | 17,665 | 87,298 | 41,857 | 30,626 | 11,959 | 9,954 | ||||||
| 48,182 | 39,973 | 32,576 | 24,660 | 16,422 | 8,019 | 1,813 | ||||||
| 3,493 | 5,775 | 3,450 | 3,513 | 3,588 | 3,594 | 3,618 | ||||||
| 48,476 | 40,198 | 32,779 | 24,787 | 16,486 | 8,082 | 1,877 | ||||||
| 88 | 85 | 69 | 67 | 66 | 48 | 790 | ||||||
| 8,275 | 8,839 | 9,692 | 9,519 | 8,317 | 6,529 | 5,337 | ||||||
| 245 | — | — | — | — | 87 | 136 | ||||||
| 6,388 | 6,460 | 6,781 | 7,088 | 7,054 | 7,399 | 6,388 | ||||||
| 20,397 | 20,235 | 20,191 | 20,087 | 20,080 | 19,999 | 19,972 | ||||||
| 6,969 | 5,224 | 3,143 | 3,999 | 6,178 | 3,689 | 175 | ||||||
| 258 | 56 | 46 | 42 | 68 | 56 | 73 | ||||||
| 46,631,740 | 12,090,203 | 4,077,725 | 2,929,019 | 1,858,885 | 1,024,280 | 176,133 | ||||||
| $1,200,363,435 | $ 998,949,026 | $816,150,907 | $617,839,733 | $415,904,318 | $203,200,417 | $46,699,613 | ||||||
| $1,100,334,353 | $ 918,301,599 | $745,878,459 | $570,101,033 | $381,447,593 | $190,049,804 | $44,381,158 | ||||||
| 100,029,082 | 80,647,427 | 70,272,448 | 47,738,700 | 34,456,725 | 13,150,613 | 2,318,455 | ||||||
| $1,200,363,435 | $ 998,949,026 | $816,150,907 | $617,839,733 | $415,904,318 | $203,200,417 | $46,699,613 | ||||||
| $ 1,945,508 | $ 984,699 | $ 1,265,926 | $ 917,022 | $ 402,517 | $ 196,345 | $ 148,858 | ||||||
| 159,450 | 79,283 | 101,538 | 73,325 | 32,361 | 15,794 | 12,443 | ||||||
| $ 12.20 | $ 12.42 | $ 12.47 | $ 12.51 | $ 12.44 | $ 12.43 | $ 11.96 | ||||||
| $1,198,417,927 | $ 997,964,327 | $814,884,981 | $616,922,711 | $415,501,801 | $203,004,072 | $46,550,755 | ||||||
| 98,080,498 | 80,149,793 | 65,314,012 | 49,329,490 | 33,392,815 | 16,357,696 | 3,892,407 | ||||||
| $ 12.22 | $ 12.45 | $ 12.48 | $ 12.51 | $ 12.44 | $ 12.41 | $ 11.96 | ||||||
| 1,161,851,537 | 943,213,352 | 760,163,852 | 580,310,845 | 387,396,872 | 192,484,364 | 44,585,059 | ||||||
| $ 39,093,912 | $ 6,526,160 | $ 11,448 | $ 22,896 | $ — | $ — | $ — |
| State Street Target Retirement Fund | State Street Target Retirement 2015 Fund | State Street Target Retirement 2020 Fund | State Street Target Retirement 2025 Fund | ||||
| INVESTMENT INCOME | |||||||
|
Dividend income — unaffiliated
issuers |
$ 201 | $ 144 | $ 1,974 | $ 513 | |||
|
Dividend income — affiliated
issuers |
1,967,130 | 2,386,842 | 6,951,348 | 6,355,740 | |||
|
Unaffiliated securities lending
income |
— | — | 6,978 | 5,624 | |||
|
Affiliated securities lending
income |
62,267 | 78,513 | 149,452 | 186,417 | |||
|
TOTAL INVESTMENT INCOME
(LOSS) |
2,029,598 | 2,465,499 | 7,109,752 | 6,548,294 | |||
| EXPENSES | |||||||
|
Advisory
fee |
53,793 | 67,232 | 230,755 | 283,020 | |||
|
Administration
fees |
53,793 | 67,232 | 230,755 | 283,020 | |||
| Sub-transfer agent fee | |||||||
|
Class
I |
— | 3 | 141 | 95 | |||
| Distribution fees | |||||||
|
Custodian
fees |
27,418 | 26,969 | 27,235 | 27,419 | |||
|
Trustees’ fees and expenses
|
12,039 | 12,554 | 20,843 | 23,244 | |||
|
Transfer agent
fees |
45,829 | 34,415 | 47,508 | 61,174 | |||
|
Registration and filing
fees |
36,956 | 35,035 | 37,627 | 37,585 | |||
|
Professional
fees |
26,138 | 26,166 | 26,384 | 26,404 | |||
|
Printing and postage
fees |
9,545 | 8,937 | 23,801 | 27,883 | |||
|
Insurance
expense |
552 | 799 | 2,502 | 2,873 | |||
|
Miscellaneous
expenses |
5,111 | 5,028 | 6,539 | 7,190 | |||
|
TOTAL
EXPENSES |
271,174 | 284,370 | 654,090 | 779,907 | |||
|
Expenses waived/reimbursed by the
Adviser |
(303,450) | (324,706) | (700,099) | (723,209) | |||
|
NET
EXPENSES |
(32,276) | (40,336) | (46,009) | 56,698 | |||
|
NET INVESTMENT INCOME
(LOSS) |
$ 2,061,874 | $ 2,505,835 | $ 7,155,761 | $ 6,491,596 | |||
| REALIZED AND UNREALIZED GAIN (LOSS) | |||||||
| Net realized gain (loss) on: | |||||||
|
Investments — affiliated
issuers |
(602,384) | 1,354,389 | 6,678,969 | 9,326,365 | |||
| Net change in unrealized appreciation/depreciation on: | |||||||
|
Investments — affiliated
issuers |
17,391,992 | 20,924,946 | 85,976,800 | 122,950,097 | |||
|
NET REALIZED AND UNREALIZED GAIN
(LOSS) |
16,789,608 | 22,279,335 | 92,655,769 | 132,276,462 | |||
|
NET INCREASE (DECREASE) IN NET ASSETS FROM
OPERATIONS |
$18,851,482 | $24,785,170 | $99,811,530 | $138,768,058 |
| State Street Target Retirement 2030 Fund | State Street Target Retirement 2035 Fund | State Street Target Retirement 2040 Fund | State Street Target Retirement 2045 Fund | State Street Target Retirement 2050 Fund | State Street Target Retirement 2055 Fund | State Street Target Retirement 2060 Fund | ||||||
| 238 | $ 84 | $ 53 | $ 61 | $ 34 | $ 19 | $ 17 | ||||||
| 4,287,231 | 2,393,541 | 1,384,644 | 704,196 | 411,904 | 194,613 | 43,659 | ||||||
| 3,733 | 88 | 34 | 8 | 1 | 19 | — | ||||||
| 121,790 | 8,060 | 326 | 1,023 | 1,073 | 41 | 226 | ||||||
| 4,412,992 | 2,401,773 | 1,385,057 | 705,288 | 413,012 | 194,692 | 43,902 | ||||||
| 274,643 | 227,701 | 184,497 | 137,926 | 90,292 | 42,513 | 9,267 | ||||||
| 274,643 | 227,701 | 184,497 | 137,926 | 90,292 | 42,513 | 9,267 | ||||||
| 87 | 49 | 126 | 157 | 90 | — | — | ||||||
| 25,823 | 27,026 | 25,417 | 25,470 | 25,438 | 25,583 | 25,892 | ||||||
| 22,693 | 20,401 | 18,153 | 15,758 | 13,399 | 10,979 | 10,178 | ||||||
| 67,356 | 70,458 | 74,222 | 76,704 | 75,142 | 69,504 | 62,981 | ||||||
| 37,326 | 37,376 | 37,156 | 37,135 | 36,929 | 35,750 | 35,161 | ||||||
| 26,398 | 26,319 | 26,274 | 26,208 | 26,174 | 26,116 | 26,088 | ||||||
| 30,502 | 28,894 | 28,915 | 26,622 | 28,419 | 23,994 | 8,748 | ||||||
| 2,785 | 2,290 | 1,849 | 1,307 | 845 | 344 | 55 | ||||||
| 7,038 | 6,642 | 6,221 | 5,505 | 5,111 | 4,813 | 4,591 | ||||||
| 769,294 | 674,857 | 587,327 | 490,718 | 392,131 | 282,109 | 192,228 | ||||||
| (549,493) | (447,109) | (402,704) | (352,635) | (301,749) | (239,595) | (186,668) | ||||||
| 219,801 | 227,748 | 184,623 | 138,083 | 90,382 | 42,514 | 5,560 | ||||||
| $ 4,193,191 | $ 2,174,025 | $ 1,200,434 | $ 567,205 | $ 322,630 | $ 152,178 | $ 38,342 | ||||||
| 8,957,920 | 7,100,147 | 4,902,144 | 3,330,718 | 1,947,139 | 661,761 | 198,565 | ||||||
| 130,205,532 | 114,499,488 | 97,166,381 | 75,065,611 | 49,523,634 | 22,880,643 | 4,833,555 | ||||||
| 139,163,452 | 121,599,635 | 102,068,525 | 78,396,329 | 51,470,773 | 23,542,404 | 5,032,120 | ||||||
| $143,356,643 | $123,773,660 | $103,268,959 | $78,963,534 | $51,793,403 | $23,694,582 | $5,070,462 |
| State Street Target Retirement Fund | State Street Target Retirement 2015 Fund | ||||||
| Six
Months Ended 6/30/19 (Unaudited) |
Year
Ended 12/31/18 |
Six
Months Ended 6/30/19 (Unaudited) |
Year
Ended 12/31/18 | ||||
| INCREASE (DECREASE) IN NET ASSETS FROM OPERATIONS: | |||||||
|
Net investment income
(loss) |
$ 2,061,874 | $ 5,554,077 | $ 2,505,835 | $ 7,028,635 | |||
|
Net realized gain
(loss) |
(602,384) | 1,472,783 | 1,354,389 | 4,543,556 | |||
|
Net change in unrealized
appreciation/depreciation |
17,391,992 | (14,733,528) | 20,924,946 | (19,021,436) | |||
|
Net increase (decrease) in net assets resulting from
operations |
18,851,482 | (7,706,668) | 24,785,170 | (7,449,245) | |||
| DISTRIBUTIONS TO SHAREHOLDERS (NOTE 10): | |||||||
|
Class
I |
— | (4,532) | — | (2,113) | |||
|
Class
K |
— | (8,399,460) | — | (12,790,575) | |||
|
Total distributions to shareholders
|
— | (8,403,992) | — | (12,792,688) | |||
| FROM BENEFICIAL INTEREST TRANSACTIONS: | |||||||
|
Contribution from Affiliates (Note
3) |
— | 1,415 | — | 13,859 | |||
| Class A(a) | |||||||
|
Proceeds from sale of shares
sold |
— | — | — | — | |||
|
Redemption of shares in connection with the conversion of assets from Class A to Class
I |
— | (21,234) | — | — | |||
|
Cost of shares
redeemed |
— | (77,394) | — | (99,541) | |||
|
Net increase (decrease) from capital share
transactions |
— | (98,628) | — | (99,541) | |||
| Class I | |||||||
|
Proceeds from sale of shares
sold |
25,515 | 981 | 2,898 | 5,030 | |||
|
Proceeds from shares issued in connection with the conversion of assets from Class A to Class
I |
— | 21,234 | — | — | |||
|
Reinvestment of
distributions |
— | 4,532 | — | 2,112 | |||
|
Cost of shares
redeemed |
(36,097) | (50,232) | (32,154) | (149,507) | |||
|
Net increase (decrease) from capital share
transactions |
(10,582) | (23,485) | (29,256) | (142,365) | |||
| Class K | |||||||
|
Proceeds from sale of shares
sold |
34,207,875 | 207,534,102 | 30,708,856 | 90,310,368 | |||
|
Reinvestment of
distributions |
— | 8,399,460 | — | 12,790,575 | |||
|
Cost of shares
redeemed |
(24,683,258) | (134,413,043) | (34,647,337) | (70,872,443) | |||
|
Net increase (decrease) from capital share
transactions |
9,524,617 | 81,520,519 | (3,938,481) | 32,228,500 | |||
|
Net increase (decrease) in net assets from beneficial interest transactions
|
9,514,035 | 81,398,406 | (3,967,737) | 31,986,594 | |||
|
Net increase (decrease) in net assets during the
period |
28,365,517 | 65,289,161 | 20,817,433 | 11,758,520 | |||
|
Net assets at beginning of
period |
200,947,996 | 135,658,835 | 258,054,399 | 246,295,879 | |||
|
NET ASSETS AT END OF
PERIOD |
$229,313,513 | $ 200,947,996 | $278,871,832 | $258,054,399 | |||
| SHARES OF BENEFICIAL INTEREST: | |||||||
| Class A(a) | |||||||
|
Shares
sold |
— | — | — | — | |||
|
Shares redeemed in connection with the conversion of assets from Class A to Class
I |
— | (1,998) | — | — | |||
|
Shares
redeemed |
— | (7,301) | — | (9,310) | |||
|
Net increase (decrease) from share
transactions |
— | (9,299) | — | (9,310) | |||
| Class I | |||||||
|
Shares
sold |
2,388 | 91 | 273 | 465 | |||
|
Shares issued in connection with the conversion of assets from Class A to Class
I |
— | 1,994 | — | — | |||
|
Reinvestment of
distributions |
— | 454 | — | 212 | |||
|
Shares
redeemed |
(3,400) | (4,709) | (2,982) | (13,867) | |||
|
Net increase (decrease) from share
transactions |
(1,012) | (2,170) | (2,709) | (13,190) | |||
| Class K | |||||||
|
Shares
sold |
3,245,293 | 19,214,623 | 2,901,020 | 8,351,447 | |||
|
Reinvestment of
distributions |
— | 842,474 | — | 1,281,621 | |||
|
Shares
redeemed |
(2,353,788) | (12,622,611) | (3,279,750) | (6,528,843) | |||
|
Net increase (decrease) from share
transactions |
891,505 | 7,434,486 | (378,730) | 3,104,225 | |||
| (a) | Effective October 12, 2018, Class A shares were converted to Class I shares. |
| State Street Target Retirement 2020 Fund | State Street Target Retirement 2025 Fund | State Street Target Retirement 2030 Fund | ||||||||
| Six
Months Ended 6/30/19 (Unaudited) |
Year
Ended 12/31/18 |
Six
Months Ended 6/30/19 (Unaudited) |
Year
Ended 12/31/18 |
Six
Months Ended 6/30/19 (Unaudited) |
Year
Ended 12/31/18 | |||||
| $ 7,155,761 | $ 22,627,658 | $ 6,491,596 | $ 26,121,798 | $ 4,193,191 | $ 23,384,322 | |||||
| 6,678,969 | 19,359,205 | 9,326,365 | 24,770,443 | 8,957,920 | 25,363,539 | |||||
| 85,976,800 | (78,525,638) | 122,950,097 | (110,013,265) | 130,205,532 | (112,579,713) | |||||
| 99,811,530 | (36,538,775) | 138,768,058 | (59,121,024) | 143,356,643 | (63,831,852) | |||||
| — | (94,975) | — | (59,153) | — | (88,182) | |||||
| — | (44,523,544) | — | (50,682,003) | — | (47,418,269) | |||||
| — | (44,618,519) | — | (50,741,156) | — | (47,506,451) | |||||
| — | 40,408 | — | 65,781 | — | — | |||||
| — | 490,000 | — | 186,928 | — | 83,298 | |||||
| — | (237,210) | — | (109,730) | — | (89,264) | |||||
| — | (373,913) | — | (187,108) | — | (97,013) | |||||
| — | (121,123) | — | (109,910) | — | (102,979) | |||||
| 122,326 | 1,153,163 | 181,104 | 270,622 | 86,443 | 196,592 | |||||
| — | 237,210 | — | 109,730 | — | 89,264 | |||||
| — | 94,975 | — | 59,153 | — | 88,182 | |||||
| (12,903) | (210,593) | (113,294) | (1,373,715) | (156,503) | (116,274) | |||||
| 109,423 | 1,274,755 | 67,810 | (934,210) | (70,060) | 257,764 | |||||
| 105,120,107 | 267,720,042 | 162,135,580 | 365,384,810 | 167,253,020 | 351,016,403 | |||||
| — | 44,523,405 | — | 50,682,003 | — | 47,418,269 | |||||
| (78,162,566) | (159,803,462) | (79,705,358) | (129,329,674) | (72,282,465) | (105,937,878) | |||||
| 26,957,541 | 152,439,985 | 82,430,222 | 286,737,139 | 94,970,555 | 292,496,794 | |||||
| 27,066,964 | 153,593,617 | 82,498,032 | 285,693,019 | 94,900,495 | 292,651,579 | |||||
| 126,878,494 | 72,476,731 | 221,266,090 | 175,896,620 | 238,257,138 | 181,313,276 | |||||
| 848,939,909 | 776,463,178 | 1,008,323,908 | 832,427,288 | 962,106,297 | 780,793,021 | |||||
| $975,818,403 | $ 848,939,909 | $1,229,589,998 | $1,008,323,908 | $1,200,363,435 | $ 962,106,297 | |||||
| — | 42,083 | — | 15,682 | — | 6,914 | |||||
| — | (21,161) | — | (9,484) | — | (7,571) | |||||
| — | (33,274) | — | (16,019) | — | (8,285) | |||||
| — | (12,352) | — | (9,821) | — | (8,942) | |||||
| 10,941 | 102,958 | 15,875 | 23,141 | 7,331 | 16,510 | |||||
| — | 21,161 | — | 9,476 | — | 7,571 | |||||
| — | 9,275 | — | 5,645 | — | 8,312 | |||||
| (1,179) | (18,601) | (9,735) | (118,722) | (13,527) | (9,969) | |||||
| 9,762 | 114,793 | 6,140 | (80,460) | (6,196) | 22,424 | |||||
| 9,558,985 | 23,681,680 | 14,177,477 | 31,044,743 | 14,380,942 | 29,309,128 | |||||
| — | 4,343,747 | — | 4,826,858 | — | 4,460,797 | |||||
| (7,069,202) | (14,078,169) | (6,940,249) | (10,992,359) | (6,174,565) | (8,812,232) | |||||
| 2,489,783 | 13,947,258 | 7,237,228 | 24,879,242 | 8,206,377 | 24,957,693 | |||||
| State Street Target Retirement 2035 Fund | State Street Target Retirement 2040 Fund | ||||||
| Six
Months Ended 6/30/19 (Unaudited) |
Year
Ended 12/31/18 |
Six
Months Ended 6/30/19 (Unaudited) |
Year
Ended 12/31/18 | ||||
| INCREASE (DECREASE) IN NET ASSETS FROM OPERATIONS: | |||||||
|
Net investment income
(loss) |
$ 2,174,025 | $ 18,209,865 | $ 1,200,434 | $ 14,376,335 | |||
|
Net realized gain
(loss) |
7,100,147 | 23,101,163 | 4,902,144 | 20,694,042 | |||
|
Net change in unrealized
appreciation/depreciation |
114,499,488 | (101,638,895) | 97,166,381 | (86,768,197) | |||
|
Net increase (decrease) in net assets resulting from
operations |
123,773,660 | (60,327,867) | 103,268,959 | (51,697,820) | |||
| DISTRIBUTIONS TO SHAREHOLDERS (NOTE 10): | |||||||
|
Class
I |
— | (20,901) | — | (60,520) | |||
|
Class
K |
— | (37,599,436) | — | (30,754,623) | |||
|
Total distributions to shareholders
|
— | (37,620,337) | — | (30,815,143) | |||
| FROM BENEFICIAL INTEREST TRANSACTIONS: | |||||||
|
Contribution from Affiliates (Note
3) |
— | 63,723 | — | 6,247 | |||
| Class A(a) | |||||||
|
Proceeds from sale of shares
sold |
— | 12,746 | — | 194,295 | |||
|
Redemption of shares in connection with the conversion of assets from Class A to Class
I |
— | (38,238) | — | (240,271) | |||
|
Cost of shares
redeemed |
— | (101,467) | — | (55,696) | |||
|
Net increase (decrease) from capital share
transactions |
— | (126,959) | — | (101,672) | |||
| Class I | |||||||
|
Proceeds from sale of shares
sold |
473,876 | 98,818 | 108,045 | 314,483 | |||
|
Proceeds from shares issued in connection with the conversion of assets from Class A to Class
I |
— | 38,238 | — | 240,271 | |||
|
Reinvestment of
distributions |
— | 20,901 | — | 60,520 | |||
|
Cost of shares
redeemed |
(17,916) | (34,846) | (279,697) | (120,037) | |||
|
Net increase (decrease) from capital share
transactions |
455,960 | 123,111 | (171,652) | 495,237 | |||
| Class K | |||||||
|
Proceeds from sale of shares
sold |
138,733,694 | 357,140,615 | 116,791,986 | 294,196,717 | |||
|
Reinvestment of
distributions |
— | 37,599,436 | — | 30,754,623 | |||
|
Cost of shares
redeemed |
(60,642,600) | (85,438,916) | (41,747,422) | (63,980,947) | |||
|
Net increase (decrease) from capital share
transactions |
78,091,094 | 309,301,135 | 75,044,564 | 260,970,393 | |||
|
Net increase (decrease) in net assets from beneficial interest transactions
|
78,547,054 | 309,297,287 | 74,872,912 | 261,363,958 | |||
|
Net increase (decrease) in net assets during the
period |
202,320,714 | 211,412,806 | 178,141,871 | 178,857,242 | |||
|
Net assets at beginning of
period |
796,628,312 | 585,215,506 | 638,009,036 | 459,151,794 | |||
|
NET ASSETS AT END OF
PERIOD |
$998,949,026 | $ 796,628,312 | $816,150,907 | $638,009,036 | |||
| SHARES OF BENEFICIAL INTEREST: | |||||||
| Class A(a) | |||||||
|
Shares
sold |
— | 1,044 | — | 15,781 | |||
|
Shares redeemed in connection with the conversion of assets from Class A to Class
I |
— | (3,195) | — | (19,973) | |||
|
Shares
redeemed |
— | (8,252) | — | (4,670) | |||
|
Net increase (decrease) from share
transactions |
— | (10,403) | — | (8,862) | |||
| Class I | |||||||
|
Shares
sold |
39,896 | 8,185 | 9,118 | 25,541 | |||
|
Shares issued in connection with the conversion of assets from Class A to Class
I |
— | 3,192 | — | 19,940 | |||
|
Reinvestment of
distributions |
— | 1,947 | — | 5,645 | |||
|
Shares
redeemed |
(1,515) | (2,910) | (23,165) | (9,906) | |||
|
Net increase (decrease) from share
transactions |
38,381 | 10,414 | (14,047) | 41,220 | |||
| Class K | |||||||
|
Shares
sold |
11,676,255 | 29,106,428 | 9,800,972 | 23,975,808 | |||
|
Reinvestment of
distributions |
— | 3,494,372 | — | 2,866,227 | |||
|
Shares
redeemed |
(5,073,221) | (6,958,752) | (3,483,706) | (5,191,478) | |||
|
Net increase (decrease) from share
transactions |
6,603,034 | 25,642,048 | 6,317,266 | 21,650,557 | |||
| (a) | Effective October 12, 2018, Class A shares were converted to Class I shares. |
| State Street Target Retirement 2045 Fund | State Street Target Retirement 2050 Fund | State Street Target Retirement 2055 Fund | ||||||||
| Six
Months Ended 6/30/19 (Unaudited) |
Year
Ended 12/31/18 |
Six
Months Ended 6/30/19 (Unaudited) |
Year
Ended 12/31/18 |
Six
Months Ended 6/30/19 (Unaudited) |
Year
Ended 12/31/18 | |||||
| $ 567,205 | $ 10,368,285 | $ 322,630 | $ 6,731,094 | $ 152,178 | $ 2,937,986 | |||||
| 3,330,718 | 15,851,276 | 1,947,139 | 10,110,405 | 661,761 | 5,118,694 | |||||
| 75,065,611 | (67,673,383) | 49,523,634 | (43,579,203) | 22,880,643 | (19,776,780) | |||||
| 78,963,534 | (41,453,822) | 51,793,403 | (26,737,704) | 23,694,582 | (11,720,100) | |||||
| — | (37,415) | — | (17,896) | — | (6,641) | |||||
| — | (22,018,119) | — | (14,299,282) | — | (6,678,653) | |||||
| — | (22,055,534) | — | (14,317,178) | — | (6,685,294) | |||||
| — | 4,604 | — | — | — | 333 | |||||
| — | 78,575 | — | 83,496 | — | 20,264 | |||||
| — | (160,336) | — | (141,455) | — | (14,984) | |||||
| — | (53,086) | — | (43,179) | — | (103,712) | |||||
| — | (134,847) | — | (101,138) | — | (98,432) | |||||
| 73,851 | 167,709 | 68,378 | 89,932 | 42,542 | 33,365 | |||||
| — | 160,336 | — | 141,455 | — | 14,984 | |||||
| — | 37,415 | — | 17,896 | — | 4,921 | |||||
| (70,852) | (245,626) | (100,096) | (66,301) | (752) | (10,358) | |||||
| 2,999 | 119,834 | (31,718) | 182,982 | 41,790 | 42,912 | |||||
| 104,965,424 | 257,738,573 | 82,465,919 | 147,982,505 | 56,591,173 | 82,947,912 | |||||
| — | 22,018,119 | — | 14,299,282 | — | 6,678,248 | |||||
| (32,304,307) | (51,371,565) | (19,127,913) | (33,069,527) | (9,776,893) | (20,251,677) | |||||
| 72,661,117 | 228,385,127 | 63,338,006 | 129,212,260 | 46,814,280 | 69,374,483 | |||||
| 72,664,116 | 228,370,114 | 63,306,288 | 129,294,104 | 46,856,070 | 69,318,963 | |||||
| 151,627,650 | 164,865,362 | 115,099,691 | 88,239,222 | 70,550,652 | 50,913,902 | |||||
| 466,212,083 | 301,346,721 | 300,804,627 | 212,565,405 | 132,649,765 | 81,735,863 | |||||
| $617,839,733 | $466,212,083 | $415,904,318 | $300,804,627 | $203,200,417 | $132,649,765 | |||||
| — | 6,238 | — | 6,517 | — | 1,614 | |||||
| — | (13,284) | — | (11,768) | — | (1,246) | |||||
| — | (4,396) | — | (3,620) | — | (8,687) | |||||
| — | (11,442) | — | (8,871) | — | (8,319) | |||||
| 6,220 | 13,747 | 5,722 | 7,431 | 3,727 | 2,739 | |||||
| — | 13,262 | — | 11,758 | — | 1,242 | |||||
| — | 3,497 | — | 1,682 | — | 463 | |||||
| (5,967) | (19,433) | (8,286) | (5,526) | (66) | (855) | |||||
| 253 | 11,073 | (2,564) | 15,345 | 3,661 | 3,589 | |||||
| 8,791,895 | 20,874,274 | 6,929,685 | 12,073,607 | 4,767,236 | 6,756,118 | |||||
| — | 2,057,769 | — | 1,343,918 | — | 629,430 | |||||
| (2,685,126) | (4,155,850) | (1,602,076) | (2,686,477) | (818,675) | (1,642,195) | |||||
| 6,106,769 | 18,776,193 | 5,327,609 | 10,731,048 | 3,948,561 | 5,743,353 | |||||
| State Street Target Retirement 2060 Fund | |||
| Six
Months Ended 6/30/19 (Unaudited) |
Year
Ended 12/31/18 | ||
| INCREASE (DECREASE) IN NET ASSETS FROM OPERATIONS: | |||
|
Net investment income
(loss) |
$ 38,342 | $ 554,332 | |
|
Net realized gain
(loss) |
198,565 | 1,238,113 | |
|
Net change in unrealized
appreciation/depreciation |
4,833,555 | (4,004,945) | |
|
Net increase (decrease) in net assets resulting from
operations |
5,070,462 | (2,212,500) | |
| DISTRIBUTIONS TO SHAREHOLDERS (NOTE 10): | |||
|
Class
I |
— | (7,584) | |
|
Class
K |
— | (1,525,276) | |
|
Total distributions to shareholders
|
— | (1,532,860) | |
| FROM BENEFICIAL INTEREST TRANSACTIONS: | |||
| Class A(a) | |||
|
Proceeds from sale of shares
sold |
— | 5,417 | |
|
Redemption of shares in connection with the conversion of assets from Class A to Class
I |
— | (26,017) | |
|
Cost of shares
redeemed |
— | (77,602) | |
|
Net increase (decrease) from capital share
transactions |
— | (98,202) | |
| Class I | |||
|
Proceeds from sale of shares
sold |
7,562 | 10,781 | |
|
Proceeds from shares issued in connection with the conversion of assets from Class A to Class
I |
— | 26,017 | |
|
Reinvestment of
distributions |
— | 2,166 | |
|
Cost of shares
redeemed |
(58) | (2,064) | |
|
Net increase (decrease) from capital share
transactions |
7,504 | 36,900 | |
| Class K | |||
|
Proceeds from sale of shares
sold |
25,122,078 | 23,719,397 | |
|
Reinvestment of
distributions |
— | 1,525,276 | |
|
Cost of shares
redeemed |
(9,450,462) | (7,832,210) | |
|
Net increase (decrease) from capital share
transactions |
15,671,616 | 17,412,463 | |
|
Net increase (decrease) in net assets from beneficial interest transactions
|
15,679,120 | 17,351,161 | |
|
Net increase (decrease) in net assets during the
period |
20,749,582 | 13,605,801 | |
|
Net assets at beginning of
period |
25,950,031 | 12,344,230 | |
|
NET ASSETS AT END OF
PERIOD |
$46,699,613 | $25,950,031 | |
| SHARES OF BENEFICIAL INTEREST: | |||
| Class A(a) | |||
|
Shares
sold |
— | 445 | |
|
Shares redeemed in connection with the conversion of assets from Class A to Class
I |
— | (2,226) | |
|
Shares
redeemed |
— | (6,628) | |
|
Net increase (decrease) from share
transactions |
— | (8,409) | |
| Class I | |||
|
Shares
sold |
664 | 916 | |
|
Shares issued in connection with the conversion of assets from Class A to Class
I |
— | 2,222 | |
|
Reinvestment of
distributions |
— | 212 | |
|
Shares
redeemed |
(5) | (171) | |
|
Net increase (decrease) from share
transactions |
659 | 3,179 | |
| Class K | |||
|
Shares
sold |
2,200,206 | 1,997,253 | |
|
Reinvestment of
distributions |
— | 149,245 | |
|
Shares
redeemed |
(820,381) | (653,396) | |
|
Net increase (decrease) from share
transactions |
1,379,825 | 1,493,102 | |
| (a) | Effective October 12, 2018, Class A shares were converted to Class I shares. |
| Class I | |||||||||||
| Six
Months Ended 6/30/19 (Unaudited) |
Year
Ended 12/31/18 |
Year
Ended 12/31/17 |
Year
Ended 12/31/16 |
Year
Ended 12/31/15 |
For
the Period 9/30/14* - 12/31/14* | ||||||
|
Net asset value, beginning of
period |
$10.02 | $10.73 | $10.12 | $ 9.79 | $10.03 | $10.00 | |||||
| Income (loss) from investment operations: | |||||||||||
|
Net investment income (loss)
(a) |
0.10 | 0.28 | 0.19 | 0.19 | 0.19 | 0.05 | |||||
|
Net realized and unrealized gain
(loss) |
0.83 | (0.55) | 0.71 | 0.32 | (0.23) | 0.02 | |||||
|
Total from investment
operations |
0.93 | (0.27) | 0.90 | 0.51 | (0.04) | 0.07 | |||||
| Distributions to shareholders from: | |||||||||||
|
Net investment
income |
— | (0.29) | (0.20) | (0.17) | (0.19) | (0.04) | |||||
|
Net realized
gains |
— | (0.15) | (0.09) | (0.01) | (0.01) | (0.00)(b) | |||||
|
Total
distributions |
— | (0.44) | (0.29) | (0.18) | (0.20) | (0.04) | |||||
|
Net asset value, end of
period |
$10.95 | $10.02 | $10.73 | $10.12 | $ 9.79 | $10.03 | |||||
|
Total return
(c) |
9.28% | (2.50)%(d) | 8.92% | 5.27% | (0.39)% | 0.70% | |||||
| Ratios and Supplemental Data: | |||||||||||
|
Net assets, end of period (in
000s) |
$ 107 | $ 108 | $ 139 | $ 612 | $ 653 | $ 418 | |||||
| Ratios to Average Net Assets: | |||||||||||
|
Total expenses
(e) |
0.25%(f) | 0.25% | 0.36% | 0.66% | 1.15% | 21.40%(f) | |||||
|
Net expenses
(e) |
(0.03)%(f)(g) | (0.03)%(g) | (0.05)%(g) | (0.03)%(g) | 0.01% | 0.37%(f) | |||||
|
Net investment income
(loss) |
1.84%(f) | 2.62% | 1.78% | 1.89% | 1.94% | 2.07%(f) | |||||
|
Portfolio turnover
rate |
10%(h) | 53% | 25% | 37% | 31% | 8%(h) | |||||
| * | Commencement of operations. |
| (a) | Net investment income per share is calculated using the average shares method. |
| (b) | Amount is less than $0.005 per share. |
| (c) | Total return is calculated assuming a purchase of shares at net asset value on the first day and a sale at net asset value on the last day of each period reported. Distributions are assumed, for the purpose of this calculation, to be reinvested at net asset value per share on the respective payment dates. Total return for periods of less than one year is not annualized. Results represent past performance and are not indicative of future results. |
| (d) | If the Affiliates had not made a contribution during the period ended December 31, 2018, total return would have remained (2.50)%. See Note 3. |
| (e) | Does not include expenses of the Underlying Funds in which the Fund invests. |
| (f) | Annualized. |
| (g) | Due to the Fund waiving acquired Fund fees, the waiver exceeded total fund expenses. |
| (h) | Not annualized. |
| Class K | |||||||||||
| Six
Months Ended 6/30/19 (Unaudited) |
Year
Ended 12/31/18 |
Year
Ended 12/31/17 |
Year
Ended 12/31/16 |
Year
Ended 12/31/15 |
For
the Period 9/30/14* - 12/31/14 | ||||||
|
Net asset value, beginning of
period |
$ 10.00 | $ 10.71 | $ 10.12 | $ 9.78 | $ 10.03 | $10.00 | |||||
| Income (loss) from investment operations: | |||||||||||
|
Net investment income (loss)
(a) |
0.10 | 0.29 | 0.28 | 0.23 | 0.20 | 0.06 | |||||
|
Net realized and unrealized gain
(loss) |
0.83 | (0.56) | 0.60 | 0.29 | (0.25) | 0.02 | |||||
|
Total from investment
operations |
0.93 | (0.27) | 0.88 | 0.52 | (0.05) | 0.08 | |||||
| Distributions to shareholders from: | |||||||||||
|
Net investment
income |
— | (0.29) | (0.20) | (0.17) | (0.19) | (0.05) | |||||
|
Net realized
gains |
— | (0.15) | (0.09) | (0.01) | (0.01) | (0.00)(b) | |||||
|
Total
distributions |
— | (0.44) | (0.29) | (0.18) | (0.20) | (0.05) | |||||
|
Net asset value, end of
period |
$ 10.93 | $ 10.00 | $ 10.71 | $ 10.12 | $ 9.78 | $10.03 | |||||
|
Total return
(c) |
9.30% | (2.50)%(d) | 8.83% | 5.28% | (0.49)% | 0.75% | |||||
| Ratios and Supplemental Data: | |||||||||||
|
Net assets, end of period (in
000s) |
$229,207 | $200,840 | $135,420 | $55,499 | $22,265 | $1,558 | |||||
| Ratios to Average Net Assets: | |||||||||||
|
Total expenses
(e) |
0.25%(f) | 0.24% | 0.36% | 0.66% | 1.15% | 25.06%(f) | |||||
|
Net expenses
(e) |
(0.03)%(f)(g) | (0.04)%(g) | (0.02)%(g) | (0.04)%(g) | 0.01% | 0.17%(f) | |||||
|
Net investment income
(loss) |
1.92%(f) | 2.69% | 2.61% | 2.23% | 1.99% | 2.59%(f) | |||||
|
Portfolio turnover
rate |
10%(h) | 53% | 25% | 37% | 31% | 8%(h) | |||||
| * | Commencement of operations. |
| (a) | Net investment income per share is calculated using the average shares method. |
| (b) | Amount is less than $0.005 per share. |
| (c) | Total return is calculated assuming a purchase of shares at net asset value on the first day and a sale at net asset value on the last day of each period reported. Distributions are assumed, for the purpose of this calculation, to be reinvested at net asset value per share on the respective payment dates. Total return for periods of less than one year is not annualized. Results represent past performance and are not indicative of future results. |
| (d) | If the Affiliates had not made a contribution during the period ended December 31, 2018, total return would have remained (2.50)%. See Note 3. |
| (e) | Does not include expenses of the Underlying Funds in which the Fund invests. |
| (f) | Annualized. |
| (g) | Due to the Fund waiving acquired Fund fees, the waiver exceeded total fund expenses. |
| (h) | Not annualized. |
| Class I | |||||||||||
| Six
Months Ended 6/30/19 (Unaudited) |
Year
Ended 12/31/18 |
Year
Ended 12/31/17 |
Year
Ended 12/31/16 |
Year
Ended 12/31/15 |
For
the Period 9/30/14* - 12/31/14 | ||||||
|
Net asset value, beginning of
period |
$10.01 | $10.85 | $10.09 | $ 9.72 | $10.03 | $10.00 | |||||
| Income (loss) from investment operations: | |||||||||||
|
Net investment income (loss)
(a) |
0.09 | 0.20 | 0.19 | 0.19 | 0.23 | 0.06 | |||||
|
Net realized and unrealized gain
(loss) |
0.88 | (0.52) | 0.86 | 0.41 | (0.31) | 0.03 | |||||
|
Total from investment
operations |
0.97 | (0.32) | 1.05 | 0.60 | (0.08) | 0.09 | |||||
| Distributions to shareholders from: | |||||||||||
|
Net investment
income |
— | (0.28) | (0.19) | (0.16) | (0.18) | (0.06) | |||||
|
Net realized
gains |
— | (0.24) | (0.10) | (0.07) | (0.05) | (0.00)(b) | |||||
|
Total
distributions |
— | (0.52) | (0.29) | (0.23) | (0.23) | (0.06) | |||||
|
Net asset value, end of
period |
$10.98 | $10.01 | $10.85 | $10.09 | $ 9.72 | $10.03 | |||||
|
Total return
(c) |
9.69% | (2.89)%(d) | 10.39% | 6.19% | (0.75)% | 0.87% | |||||
| Ratios and Supplemental Data: | |||||||||||
|
Net assets, end of period (in
000s) |
$ 17 | $ 42 | $ 189 | $ 819 | $1,030 | $ 585 | |||||
| Ratios to Average Net Assets: | |||||||||||
|
Total expenses
(e) |
0.23%(f) | 0.23% | 0.27% | 0.58% | 5.07% | 14.80%(f) | |||||
|
Net expenses
(e) |
(0.02)%(f)(g) | 0.03% | (0.05)%(g) | 0.01% | 0.02% | 0.37%(f) | |||||
|
Net investment income
(loss) |
1.77%(f) | 1.87% | 1.79% | 1.85% | 2.32% | 2.31%(f) | |||||
|
Portfolio turnover
rate |
13%(h) | 29% | 34% | 49% | 55% | 39%(h) | |||||
| * | Commencement of operations. |
| (a) | Net investment income per share is calculated using the average shares method. |
| (b) | Amount is less than $0.005 per share. |
| (c) | Total return is calculated assuming a purchase of shares at net asset value on the first day and a sale at net asset value on the last day of each period reported. Distributions are assumed, for the purpose of this calculation, to be reinvested at net asset value per share on the respective payment dates. Total return for periods of less than one year is not annualized. Results represent past performance and are not indicative of future results. |
| (d) | If the Affiliates had not made a contribution during the period ended December 31, 2018, total return would have remained (2.89)%. See Note 3. |
| (e) | Does not include expenses of the Underlying Funds in which the Fund invests. |
| (f) | Annualized. |
| (g) | Due to the Fund waiving acquired Fund fees, the waiver exceeded total fund expenses. |
| (h) | Not annualized. |
| Class K | |||||||||||
| Six
Months Ended 6/30/19 (Unaudited) |
Year
Ended 12/31/18 |
Year
Ended 12/31/17 |
Year
Ended 12/31/16 |
Year
Ended 12/31/15 |
For
the Period 9/30/14* - 12/31/14 | ||||||
|
Net asset value, beginning of
period |
$ 10.01 | $ 10.85 | $ 10.09 | $ 9.72 | $10.03 | $10.00 | |||||
| Income (loss) from investment operations: | |||||||||||
|
Net investment income (loss)
(a) |
0.10 | 0.28 | 0.29 | 0.28 | 0.22 | 0.06 | |||||
|
Net realized and unrealized gain
(loss) |
0.87 | (0.59) | 0.76 | 0.32 | (0.30) | 0.03 | |||||
|
Total from investment
operations |
0.97 | (0.31) | 1.05 | 0.60 | (0.08) | 0.09 | |||||
| Distributions to shareholders from: | |||||||||||
|
Net investment
income |
— | (0.29) | (0.19) | (0.16) | (0.18) | (0.06) | |||||
|
Net realized
gains |
— | (0.24) | (0.10) | (0.07) | (0.05) | (0.00)(b) | |||||
|
Total
distributions |
— | (0.53) | (0.29) | (0.23) | (0.23) | (0.06) | |||||
|
Net asset value, end of
period |
$ 10.98 | $ 10.01 | $ 10.85 | $ 10.09 | $ 9.72 | $10.03 | |||||
|
Total return
(c) |
9.69% | (2.86)%(d) | 10.39% | 6.19% | (0.74)% | 0.92% | |||||
| Ratios and Supplemental Data: | |||||||||||
|
Net assets, end of period (in
000s) |
$278,855 | $258,012 | $246,006 | $71,486 | $3,707 | $1,740 | |||||
| Ratios to Average Net Assets: | |||||||||||
|
Total expenses
(e) |
0.21%(f) | 0.21% | 0.26% | 0.58% | 5.07% | 18.68%(f) | |||||
|
Net expenses
(e) |
(0.03)%(f)(g) | (0.00)%(g)(h) | (0.02)%(g) | (0.01)%(g) | 0.02% | 0.17%(f) | |||||
|
Net investment income
(loss) |
1.86%(f) | 2.54% | 2.71% | 2.72% | 2.19% | 2.50%(f) | |||||
|
Portfolio turnover
rate |
13%(i) | 29% | 34% | 49% | 55% | 39%(i) | |||||
| * | Commencement of operations. |
| (a) | Net investment income per share is calculated using the average shares method. |
| (b) | Amount is less than $0.005 per share. |
| (c) | Total return is calculated assuming a purchase of shares at net asset value on the first day and a sale at net asset value on the last day of each period reported. Distributions are assumed, for the purpose of this calculation, to be reinvested at net asset value per share on the respective payment dates. Total return for periods of less than one year is not annualized. Results represent past performance and are not indicative of future results. |
| (d) | If the Affiliates had not made a contribution during the period ended December 31, 2018, total return would have remained (2.86)%. See Note 3. |
| (e) | Does not include expenses of the Underlying Funds in which the Fund invests. |
| (f) | Annualized. |
| (g) | Due to the Fund waiving acquired Fund fees, the waiver exceeded total fund expenses. |
| (h) | Ratio is less than 0.005% |
| (i) | Not annualized. |
| Class I | |||||||||||
| Six
Months Ended 6/30/19 (Unaudited) |
Year
Ended 12/31/18 |
Year
Ended 12/31/17 |
Year
Ended 12/31/16 |
Year
Ended 12/31/15 |
For
the Period 9/30/14* - 12/31/14 | ||||||
|
Net asset value, beginning of
period |
$10.29 | $11.34 | $10.27 | $ 9.75 | $10.14 | $10.00 | |||||
| Income (loss) from investment operations: | |||||||||||
|
Net investment income (loss)
(a) |
0.08 | 0.43 | 0.25 | 0.16 | 0.33 | 0.06 | |||||
|
Net realized and unrealized gain
(loss) |
1.10 | (0.90) | 1.13 | 0.54 | (0.49) | 0.11 | |||||
|
Total from investment
operations |
1.18 | (0.47) | 1.38 | 0.70 | (0.16) | 0.17 | |||||
| Distributions to shareholders from: | |||||||||||
|
Net investment
income |
— | (0.29) | (0.23) | (0.17) | (0.22) | (0.03) | |||||
|
Net realized
gains |
— | (0.29) | (0.08) | (0.01) | (0.01) | (0.00)(b) | |||||
|
Total
distributions |
— | (0.58) | (0.31) | (0.18) | (0.23) | (0.03) | |||||
|
Net asset value, end of
period |
$11.47 | $10.29 | $11.34 | $10.27 | $ 9.75 | $10.14 | |||||
|
Total return
(c) |
11.47% | (4.17)%(d) | 13.38% | 7.34% | (1.56)% | 1.72% | |||||
| Ratios and Supplemental Data: | |||||||||||
|
Net assets, end of period (in
000s) |
$2,118 | $1,798 | $ 680 | $ 797 | $1,811 | $ 845 | |||||
| Ratios to Average Net Assets: | |||||||||||
|
Total expenses
(e) |
0.16%(f) | 0.16% | 0.15% | 0.30% | 0.55% | 9.11%(f) | |||||
|
Net expenses
(e) |
0.01%(f)(g) | 0.02% | 0.01% | 0.07% | 0.01% | 0.37%(f) | |||||
|
Net investment income
(loss) |
1.53%(f) | 3.85% | 2.29% | 1.54% | 3.28% | 2.57%(f) | |||||
|
Portfolio turnover
rate |
10%(h) | 22% | 18% | 28% | 39% | 5%(h) | |||||
| * | Commencement of operations. |
| (a) | Net investment income per share is calculated using the average shares method. |
| (b) | Amount is less than $0.005 per share. |
| (c) | Total return is calculated assuming a purchase of shares at net asset value on the first day and a sale at net asset value on the last day of each period reported. Distributions are assumed, for the purpose of this calculation, to be reinvested at net asset value per share on the respective payment dates. Total return for periods of less than one year is not annualized. Results represent past performance and are not indicative of future results. |
| (d) | If the Affiliates had not made a contribution during the period ended December 31, 2018, total return would have remained (4.17)%. See Note 3. |
| (e) | Does not include expenses of the Underlying Funds in which the Fund invests. |
| (f) | Annualized. |
| (g) | Due to the Fund waiving acquired Fund fees, the waiver exceeded total fund expenses. |
| (h) | Not annualized. |
| Class K | |||||||||||
| Six
Months Ended 6/30/19 (Unaudited) |
Year
Ended 12/31/18 |
Year
Ended 12/31/17 |
Year
Ended 12/31/16 |
Year
Ended 12/31/15 |
For
the Period 9/30/14* - 12/31/14 | ||||||
|
Net asset value, beginning of
period |
$ 10.29 | $ 11.34 | $ 10.28 | $ 9.74 | $ 10.13 | $10.00 | |||||
| Income (loss) from investment operations: | |||||||||||
|
Net investment income (loss)
(a) |
0.08 | 0.29 | 0.29 | 0.27 | 0.23 | 0.04 | |||||
|
Net realized and unrealized gain
(loss) |
1.11 | (0.76) | 1.08 | 0.45 | (0.39) | 0.13 | |||||
|
Total from investment
operations |
1.19 | (0.47) | 1.37 | 0.72 | (0.16) | 0.17 | |||||
| Distributions to shareholders from: | |||||||||||
|
Net investment
income |
— | (0.29) | (0.23) | (0.17) | (0.22) | (0.04) | |||||
|
Net realized
gains |
— | (0.29) | (0.08) | (0.01) | (0.01) | (0.00)(b) | |||||
|
Total
distributions |
— | (0.58) | (0.31) | (0.18) | (0.23) | (0.04) | |||||
|
Net asset value, end of
period |
$ 11.48 | $ 10.29 | $ 11.34 | $ 10.28 | $ 9.74 | $10.13 | |||||
|
Total return
(c) |
11.56% | (4.16)%(d) | 13.38% | 7.45% | (1.57)% | 1.67% | |||||
| Ratios and Supplemental Data: | |||||||||||
|
Net assets, end of period (in
000s) |
$973,701 | $847,142 | $775,643 | $235,727 | $52,303 | $6,399 | |||||
| Ratios to Average Net Assets: | |||||||||||
|
Total expenses
(e) |
0.14%(f) | 0.15% | 0.15% | 0.24% | 0.55% | 11.13%(f) | |||||
|
Net expenses
(e) |
(0.01)%(f)(g) | 0.01% | 0.02% | 0.01% | 0.01% | 0.17%(f) | |||||
|
Net investment income
(loss) |
1.55%(f) | 2.60% | 2.67% | 2.60% | 2.29% | 1.62%(f) | |||||
|
Portfolio turnover
rate |
10%(h) | 22% | 18% | 28% | 39% | 5%(h) | |||||
| * | Commencement of operations. |
| (a) | Net investment income per share is calculated using the average shares method. |
| (b) | Amount is less than $0.005 per share. |
| (c) | Total return is calculated assuming a purchase of shares at net asset value on the first day and a sale at net asset value on the last day of each period reported. Distributions are assumed, for the purpose of this calculation, to be reinvested at net asset value per share on the respective payment dates. Total return for periods of less than one year is not annualized. Results represent past performance and are not indicative of future results. |
| (d) | If the Affiliates had not made a contribution during the period ended December 31, 2018, total return would have remained (4.16)%. See Note 3. |
| (e) | Does not include expenses of the Underlying Funds in which the Fund invests. |
| (f) | Annualized. |
| (g) | Due to the Fund waiving acquired Fund fees, the waiver exceeded total fund expenses. |
| (h) | Not annualized. |
| Class I | |||||||||||
| Six
Months Ended 6/30/19 (Unaudited) |
Year
Ended 12/31/18 |
Year
Ended 12/31/17 |
Year
Ended 12/31/16 |
Year
Ended 12/31/15 |
For
the Period 9/30/14* - 12/31/14 | ||||||
|
Net asset value, beginning of
period |
$10.53 | $11.74 | $10.33 | $ 9.74 | $10.16 | $10.00 | |||||
| Income (loss) from investment operations: | |||||||||||
|
Net investment income (loss)
(a) |
0.06 | 0.23 | 0.26 | 0.15 | 0.37 | 0.06 | |||||
|
Net realized and unrealized gain
(loss) |
1.35 | (0.87) | 1.45 | 0.63 | (0.56) | 0.14 | |||||
|
Total from investment
operations |
1.41 | (0.64) | 1.71 | 0.78 | (0.19) | 0.20 | |||||
| Distributions to shareholders from: | |||||||||||
|
Net investment
income |
— | (0.29) | (0.23) | (0.16) | (0.20) | (0.04) | |||||
|
Net realized
gains |
— | (0.28) | (0.07) | (0.03) | (0.03) | (0.00)(b) | |||||
|
Total
distributions |
— | (0.57) | (0.30) | (0.19) | (0.23) | (0.04) | |||||
|
Net asset value, end of
period |
$11.94 | $10.53 | $11.74 | $10.33 | $ 9.74 | $10.16 | |||||
|
Total return
(c) |
13.39% | (5.48)%(d) | 16.54% | 8.01% | (1.87)% | 1.99% | |||||
| Ratios and Supplemental Data: | |||||||||||
|
Net assets, end of period (in
000s) |
$1,383 | $1,155 | $2,232 | $2,110 | $3,293 | $ 677 | |||||
| Ratios to Average Net Assets: | |||||||||||
|
Total expenses
(e) |
0.15%(f) | 0.15% | 0.15% | 0.33% | 1.31% | 10.65%(f) | |||||
|
Net expenses
(e) |
0.03%(f) | 0.05% | 0.03% | 0.08% | 0.03% | 0.37%(f) | |||||
|
Net investment income
(loss) |
1.15%(f) | 1.98% | 2.36% | 1.53% | 3.71% | 5.10%(f) | |||||
|
Portfolio turnover
rate |
10%(g) | 15% | 10% | 21% | 51% | 13%(g) | |||||
| * | Commencement of operations. |
| (a) | Net investment income per share is calculated using the average shares method. |
| (b) | Amount is less than $0.005 per share. |
| (c) | Total return is calculated assuming a purchase of shares at net asset value on the first day and a sale at net asset value on the last day of each period reported. Distributions are assumed, for the purpose of this calculation, to be reinvested at net asset value per share on the respective payment dates. Total return for periods of less than one year is not annualized. Results represent past performance and are not indicative of future results. |
| (d) | If the Affiliates had not made a contribution during the period ended December 31, 2018, total return would have remained (5.48)%. See Note 3. |
| (e) | Does not include expenses of the Underlying Funds in which the Fund invests. |
| (f) | Annualized. |
| (g) | Not annualized. |
| Class K | |||||||||||
| Six
Months Ended 6/30/19 (Unaudited) |
Year
Ended 12/31/18 |
Year
Ended 12/31/17 |
Year
Ended 12/31/16 |
Year
Ended 12/31/15 |
For
the Period 9/30/14* - 12/31/14 | ||||||
|
Net asset value, beginning of
period |
$ 10.55 | $ 11.75 | $ 10.34 | $ 9.75 | $ 10.16 | $10.00 | |||||
| Income (loss) from investment operations: | |||||||||||
|
Net investment income (loss)
(a) |
0.07 | 0.31 | 0.30 | 0.29 | 0.29 | 0.05 | |||||
|
Net realized and unrealized gain
(loss) |
1.33 | (0.94) | 1.41 | 0.49 | (0.47) | 0.15 | |||||
|
Total from investment
operations |
1.40 | (0.63) | 1.71 | 0.78 | (0.18) | 0.20 | |||||
| Distributions to shareholders from: | |||||||||||
|
Net investment
income |
— | (0.29) | (0.23) | (0.16) | (0.20) | (0.04) | |||||
|
Net realized
gains |
— | (0.28) | (0.07) | (0.03) | (0.03) | (0.00)(b) | |||||
|
Total
distributions |
— | (0.57) | (0.30) | (0.19) | (0.23) | (0.04) | |||||
|
Net asset value, end of
period |
$ 11.95 | $ 10.55 | $ 11.75 | $ 10.34 | $ 9.75 | $10.16 | |||||
|
Total return
(c) |
13.36% | (5.38)%(d) | 16.52% | 8.00% | (1.77)% | 2.04% | |||||
| Ratios and Supplemental Data: | |||||||||||
|
Net assets, end of period (in
000s) |
$1,228,207 | $1,007,169 | $830,080 | $206,696 | $21,815 | $5,597 | |||||
| Ratios to Average Net Assets: | |||||||||||
|
Total expenses
(e) |
0.14%(f) | 0.14% | 0.15% | 0.28% | 1.31% | 11.75%(f) | |||||
|
Net expenses
(e) |
0.01%(f) | 0.04% | 0.04% | 0.04% | 0.03% | 0.17%(f) | |||||
|
Net investment income
(loss) |
1.15%(f) | 2.63% | 2.63% | 2.81% | 2.86% | 2.19%(f) | |||||
|
Portfolio turnover
rate |
10%(g) | 15% | 10% | 21% | 51% | 13%(g) | |||||
| * | Commencement of operations. |
| (a) | Net investment income per share is calculated using the average shares method. |
| (b) | Amount is less than $0.005 per share. |
| (c) | Total return is calculated assuming a purchase of shares at net asset value on the first day and a sale at net asset value on the last day of each period reported. Distributions are assumed, for the purpose of this calculation, to be reinvested at net asset value per share on the respective payment dates. Total return for periods of less than one year is not annualized. Results represent past performance and are not indicative of future results. |
| (d) | If the Affiliates had not made a contribution during the period ended December 31, 2018, total return would have remained (5.38)%. See Note 3. |
| (e) | Does not include expenses of the Underlying Funds in which the Fund invests. |
| (f) | Annualized. |
| (g) | Not annualized. |
| Class I | |||||||||||
| Six
Months Ended 6/30/19 (Unaudited) |
Year
Ended 12/31/18 |
Year
Ended 12/31/17 |
Year
Ended 12/31/16 |
Year
Ended 12/31/15 |
For
the Period 9/30/14* - 12/31/14 | ||||||
|
Net asset value, beginning of
period |
$10.67 | $11.98 | $10.37 | $ 9.76 | $10.15 | $10.00 | |||||
| Income (loss) from investment operations: | |||||||||||
|
Net investment income (loss)
(a) |
0.04 | 0.29 | 0.25 | 0.14 | 0.35 | 0.06 | |||||
|
Net realized and unrealized gain
(loss) |
1.49 | (1.05) | 1.64 | 0.65 | (0.54) | 0.16 | |||||
|
Total from investment
operations |
1.53 | (0.76) | 1.89 | 0.79 | (0.19) | 0.22 | |||||
| Distributions to shareholders from: | |||||||||||
|
Net investment
income |
— | (0.27) | (0.23) | (0.16) | (0.20) | (0.07) | |||||
|
Net realized
gains |
— | (0.28) | (0.05) | (0.02) | (0.00)(b) | (0.00)(b) | |||||
|
Total
distributions |
— | (0.55) | (0.28) | (0.18) | (0.20) | (0.07) | |||||
|
Net asset value, end of
period |
$12.20 | $10.67 | $11.98 | $10.37 | $ 9.76 | $10.15 | |||||
|
Total return
(c) |
14.34% | (6.24)% | 18.27% | 8.10% | (1.83)% | 2.18% | |||||
| Ratios and Supplemental Data: | |||||||||||
|
Net assets, end of period (in
000s) |
$1,946 | $1,768 | $1,716 | $1,522 | $2,066 | $ 676 | |||||
| Ratios to Average Net Assets: | |||||||||||
|
Total expenses
(d) |
0.15%(e) | 0.15% | 0.15% | 0.30% | 0.59% | 12.59%(e) | |||||
|
Net expenses
(d) |
0.05%(e) | 0.07% | 0.06% | 0.08% | 0.03% | 0.37%(e) | |||||
|
Net investment income
(loss) |
0.75%(e) | 2.44% | 2.25% | 1.39% | 3.52% | 2.30%(e) | |||||
|
Portfolio turnover
rate |
8%(f) | 12% | 7% | 18% | 33% | 18%(f) | |||||
| * | Commencement of operations. |
| (a) | Net investment income per share is calculated using the average shares method. |
| (b) | Amount is less than $0.005 per share. |
| (c) | Total return is calculated assuming a purchase of shares at net asset value on the first day and a sale at net asset value on the last day of each period reported. Distributions are assumed, for the purpose of this calculation, to be reinvested at net asset value per share on the respective payment dates. Total return for periods of less than one year is not annualized. Results represent past performance and are not indicative of future results. |
| (d) | Does not include expenses of the Underlying Funds in which the Fund invests. |
| (e) | Annualized. |
| (f) | Not annualized. |
| Class K | |||||||||||
| Six
Months Ended 6/30/19 (Unaudited) |
Year
Ended 12/31/18 |
Year
Ended 12/31/17 |
Year
Ended 12/31/16 |
Year
Ended 12/31/15 |
For
the Period 9/30/14* - 12/31/14 | ||||||
|
Net asset value, beginning of
period |
$ 10.69 | $ 12.00 | $ 10.38 | $ 9.76 | $ 10.15 | $10.00 | |||||
| Income (loss) from investment operations: | |||||||||||
|
Net investment income (loss)
(a) |
0.04 | 0.29 | 0.28 | 0.25 | 0.25 | 0.07 | |||||
|
Net realized and unrealized gain
(loss) |
1.49 | (1.04) | 1.62 | 0.55 | (0.44) | 0.15 | |||||
|
Total from investment
operations |
1.53 | (0.75) | 1.90 | 0.80 | (0.19) | 0.22 | |||||
| Distributions to shareholders from: | |||||||||||
|
Net investment
income |
— | (0.28) | (0.23) | (0.16) | (0.20) | (0.07) | |||||
|
Net realized
gains |
— | (0.28) | (0.05) | (0.02) | (0.00)(b) | (0.00)(b) | |||||
|
Total
distributions |
— | (0.56) | (0.28) | (0.18) | (0.20) | (0.07) | |||||
|
Net asset value, end of
period |
$ 12.22 | $ 10.69 | $ 12.00 | $ 10.38 | $ 9.76 | $10.15 | |||||
|
Total return
(c) |
14.31% | (6.22)% | 18.35% | 8.20% | (1.83)% | 2.23% | |||||
| Ratios and Supplemental Data: | |||||||||||
|
Net assets, end of period (in
000s) |
$1,198,418 | $960,339 | $778,969 | $225,549 | $48,114 | $3,243 | |||||
| Ratios to Average Net Assets: | |||||||||||
|
Total expenses
(d) |
0.14%(e) | 0.14% | 0.15% | 0.26% | 0.59% | 14.05%(e) | |||||
|
Net expenses
(d) |
0.04%(e) | 0.06% | 0.06% | 0.05% | 0.03% | 0.17%(e) | |||||
|
Net investment income
(loss) |
0.76%(e) | 2.43% | 2.46% | 2.48% | 2.42% | 2.64%(e) | |||||
|
Portfolio turnover
rate |
8%(f) | 12% | 7% | 18% | 33% | 18%(f) | |||||
| * | Commencement of operations. |
| (a) | Net investment income per share is calculated using the average shares method. |
| (b) | Amount is less than $0.005 per share. |
| (c) | Total return is calculated assuming a purchase of shares at net asset value on the first day and a sale at net asset value on the last day of each period reported. Distributions are assumed, for the purpose of this calculation, to be reinvested at net asset value per share on the respective payment dates. Total return for periods of less than one year is not annualized. Results represent past performance and are not indicative of future results. |
| (d) | Does not include expenses of the Underlying Funds in which the Fund invests. |
| (e) | Annualized. |
| (f) | Not annualized. |
| Class I | |||||||||||
| Six
Months Ended 6/30/19 (Unaudited) |
Year
Ended 12/31/18 |
Year
Ended 12/31/17 |
Year
Ended 12/31/16 |
Year
Ended 12/31/15 |
For
the Period 9/30/14* - 12/31/14 | ||||||
|
Net asset value, beginning of
period |
$10.80 | $12.18 | $10.43 | $ 9.77 | $10.17 | $10.00 | |||||
| Income (loss) from investment operations: | |||||||||||
|
Net investment income (loss)
(a) |
0.03 | 0.30 | 0.13 | 0.11 | 0.31 | 0.07 | |||||
|
Net realized and unrealized gain
(loss) |
1.59 | (1.14) | 1.91 | 0.74 | (0.51) | 0.15 | |||||
|
Total from investment
operations |
1.62 | (0.84) | 2.04 | 0.85 | (0.20) | 0.22 | |||||
| Distributions to shareholders from: | |||||||||||
|
Net investment
income |
— | (0.26) | (0.22) | (0.16) | (0.18) | (0.05) | |||||
|
Net realized
gains |
— | (0.28) | (0.07) | (0.03) | (0.02) | (0.00)(b) | |||||
|
Total
distributions |
— | (0.54) | (0.29) | (0.19) | (0.20) | (0.05) | |||||
|
Net asset value, end of
period |
$12.42 | $10.80 | $12.18 | $10.43 | $ 9.77 | $10.17 | |||||
|
Total return
(c) |
15.00% | (6.88)%(d) | 19.56% | 8.61% | (2.00)% | 2.20% | |||||
| Ratios and Supplemental Data: | |||||||||||
|
Net assets, end of period (in
000s) |
$ 985 | $ 442 | $ 371 | $ 840 | $1,416 | $ 508 | |||||
| Ratios to Average Net Assets: | |||||||||||
|
Total expenses
(e) |
0.17%(f) | 0.16% | 0.17% | 0.36% | 1.83% | 16.79%(f) | |||||
|
Net expenses
(e) |
0.07%(f) | 0.07% | 0.07% | 0.09% | 0.03% | 0.37%(f) | |||||
|
Net investment income
(loss) |
0.47%(f) | 2.49% | 1.10% | 1.08% | 3.07% | 2.78%(f) | |||||
|
Portfolio turnover
rate |
8%(g) | 13% | 6% | 18% | 38% | 7%(g) | |||||
| * | Commencement of operations. |
| (a) | Net investment income per share is calculated using the average shares method. |
| (b) | Amount is less than $0.005 per share. |
| (c) | Total return is calculated assuming a purchase of shares at net asset value on the first day and a sale at net asset value on the last day of each period reported. Distributions are assumed, for the purpose of this calculation, to be reinvested at net asset value per share on the respective payment dates. Total return for periods of less than one year is not annualized. Results represent past performance and are not indicative of future results. |
| (d) | If the Affiliates had not made a contribution during the period ended December 31, 2018, total return would have remained (6.88)%. See Note 3. |
| (e) | Does not include expenses of the Underlying Funds in which the Fund invests. |
| (f) | Annualized. |
| (g) | Not annualized. |
| Class K | |||||||||||
| Six
Months Ended 6/30/19 (Unaudited) |
Year
Ended 12/31/18 |
Year
Ended 12/31/17 |
Year
Ended 12/31/16 |
Year
Ended 12/31/15 |
For
the Period 9/30/14* - 12/31/14 | ||||||
|
Net asset value, beginning of
period |
$ 10.83 | $ 12.21 | $ 10.44 | $ 9.78 | $ 10.17 | $10.00 | |||||
| Income (loss) from investment operations: | |||||||||||
|
Net investment income (loss)
(a) |
0.03 | 0.28 | 0.27 | 0.27 | 0.32 | 0.03 | |||||
|
Net realized and unrealized gain
(loss) |
1.59 | (1.12) | 1.79 | 0.58 | (0.51) | 0.20 | |||||
|
Total from investment
operations |
1.62 | (0.84) | 2.06 | 0.85 | (0.19) | 0.23 | |||||
| Distributions to shareholders from: | |||||||||||
|
Net investment
income |
— | (0.26) | (0.22) | (0.16) | (0.18) | (0.06) | |||||
|
Net realized
gains |
— | (0.28) | (0.07) | (0.03) | (0.02) | (0.00)(b) | |||||
|
Total
distributions |
— | (0.54) | (0.29) | (0.19) | (0.20) | (0.06) | |||||
|
Net asset value, end of
period |
$ 12.45 | $ 10.83 | $ 12.21 | $ 10.44 | $ 9.78 | $10.17 | |||||
|
Total return
(c) |
14.96% | (6.85)%(d) | 19.73% | 8.60% | (1.90)% | 2.25% | |||||
| Ratios and Supplemental Data: | |||||||||||
|
Net assets, end of period (in
000s) |
$997,964 | $796,187 | $584,717 | $165,008 | $17,223 | $3,208 | |||||
| Ratios to Average Net Assets: | |||||||||||
|
Total expenses
(e) |
0.15%(f) | 0.15% | 0.17% | 0.33% | 1.83% | 17.89%(f) | |||||
|
Net expenses
(e) |
0.05%(f) | 0.07% | 0.08% | 0.06% | 0.03% | 0.17%(f) | |||||
|
Net investment income
(loss) |
0.48%(f) | 2.30% | 2.34% | 2.64% | 3.12% | 1.28%(f) | |||||
|
Portfolio turnover
rate |
8%(g) | 13% | 6% | 18% | 38% | 7%(g) | |||||
| * | Commencement of operations. |
| (a) | Net investment income per share is calculated using the average shares method. |
| (b) | Amount is less than $0.005 per share. |
| (c) | Total return is calculated assuming a purchase of shares at net asset value on the first day and a sale at net asset value on the last day of each period reported. Distributions are assumed, for the purpose of this calculation, to be reinvested at net asset value per share on the respective payment dates. Total return for periods of less than one year is not annualized. Results represent past performance and are not indicative of future results. |
| (d) | If the Affiliates had not made a contribution during the period ended December 31, 2018, total return would have remained (6.85)%. See Note 3. |
| (e) | Does not include expenses of the Underlying Funds in which the Fund invests. |
| (f) | Annualized. |
| (g) | Not annualized. |
| Class I | |||||||||||
| Six
Months Ended 6/30/19 (Unaudited) |
Year
Ended 12/31/18 |
Year
Ended 12/31/17 |
Year
Ended 12/31/16 |
Year
Ended 12/31/15 |
For
the Period 9/30/14* - 12/31/14 | ||||||
|
Net asset value, beginning of
period |
$10.79 | $12.26 | $10.39 | $ 9.71 | $10.13 | $10.00 | |||||
| Income (loss) from investment operations: | |||||||||||
|
Net investment income (loss)
(a) |
0.02 | 0.31 | 0.24 | 0.09 | 0.40 | 0.06 | |||||
|
Net realized and unrealized gain
(loss) |
1.66 | (1.23) | 1.91 | 0.78 | (0.63) | 0.16 | |||||
|
Total from investment
operations |
1.68 | (0.92) | 2.15 | 0.87 | (0.23) | 0.22 | |||||
| Distributions to shareholders from: | |||||||||||
|
Net investment
income |
— | (0.26) | (0.23) | (0.16) | (0.19) | (0.09) | |||||
|
Net realized
gains |
— | (0.29) | (0.05) | (0.03) | (0.00)(b) | (0.00)(b) | |||||
|
Total
distributions |
— | (0.55) | (0.28) | (0.19) | (0.19) | (0.09) | |||||
|
Net asset value, end of
period |
$12.47 | $10.79 | $12.26 | $10.39 | $ 9.71 | $10.13 | |||||
|
Total return
(c) |
15.57% | (7.46)%(d) | 20.59% | 9.00% | (2.28)% | 2.23% | |||||
| Ratios and Supplemental Data: | |||||||||||
|
Net assets, end of period (in
000s) |
$1,266 | $1,247 | $ 912 | $ 708 | $1,501 | $ 506 | |||||
| Ratios to Average Net Assets: | |||||||||||
|
Total expenses
(e) |
0.18%(f) | 0.19% | 0.17% | 0.38% | 0.79% | 18.04%(f) | |||||
|
Net expenses
(e) |
0.07%(f) | 0.09% | 0.07% | 0.10% | 0.02% | 0.37%(f) | |||||
|
Net investment income
(loss) |
0.31%(f) | 2.50% | 2.14% | 0.86% | 4.02% | 2.53%(f) | |||||
|
Portfolio turnover
rate |
6%(g) | 11% | 6% | 16% | 38% | 5%(g) | |||||
| * | Commencement of operations. |
| (a) | Net investment income per share is calculated using the average shares method. |
| (b) | Amount is less than $0.005 per share. |
| (c) | Total return is calculated assuming a purchase of shares at net asset value on the first day and a sale at net asset value on the last day of each period reported. Distributions are assumed, for the purpose of this calculation, to be reinvested at net asset value per share on the respective payment dates. Total return for periods of less than one year is not annualized. Results represent past performance and are not indicative of future results. |
| (d) | If the Affiliates had not made a contribution during the period ended December 31, 2018, total return would have remained (7.46)%. See Note 3. |
| (e) | Does not include expenses of the Underlying Funds in which the Fund invests. |
| (f) | Annualized. |
| (g) | Not annualized. |
| Class K | |||||||||||
| Six
Months Ended 6/30/19 (Unaudited) |
Year
Ended 12/31/18 |
Year
Ended 12/31/17 |
Year
Ended 12/31/16 |
Year
Ended 12/31/15 |
For
the Period 9/30/14* - 12/31/14 | ||||||
|
Net asset value, beginning of
period |
$ 10.79 | $ 12.27 | $ 10.40 | $ 9.72 | $ 10.13 | $10.00 | |||||
| Income (loss) from investment operations: | |||||||||||
|
Net investment income (loss)
(a) |
0.02 | 0.28 | 0.26 | 0.24 | 0.25 | 0.05 | |||||
|
Net realized and unrealized gain
(loss) |
1.67 | (1.21) | 1.89 | 0.63 | (0.47) | 0.18 | |||||
|
Total from investment
operations |
1.69 | (0.93) | 2.15 | 0.87 | (0.22) | 0.23 | |||||
| Distributions to shareholders from: | |||||||||||
|
Net investment
income |
— | (0.26) | (0.23) | (0.16) | (0.19) | (0.10) | |||||
|
Net realized
gains |
— | (0.29) | (0.05) | (0.03) | (0.00)(b) | (0.00)(b) | |||||
|
Total
distributions |
— | (0.55) | (0.28) | (0.19) | (0.19) | (0.10) | |||||
|
Net asset value, end of
period |
$ 12.48 | $ 10.79 | $ 12.27 | $ 10.40 | $ 9.72 | $10.13 | |||||
|
Total return
(c) |
15.66% | (7.52)%(d) | 20.69% | 8.89% | (2.18)% | 2.28% | |||||
| Ratios and Supplemental Data: | |||||||||||
|
Net assets, end of period (in
000s) |
$814,885 | $636,762 | $458,132 | $143,526 | $35,359 | $1,512 | |||||
| Ratios to Average Net Assets: | |||||||||||
|
Total expenses
(e) |
0.16%(f) | 0.16% | 0.17% | 0.32% | 0.79% | 20.53%(f) | |||||
|
Net expenses
(e) |
0.05%(f) | 0.07% | 0.07% | 0.05% | 0.02% | 0.17%(f) | |||||
|
Net investment income
(loss) |
0.33%(f) | 2.24% | 2.30% | 2.31% | 2.47% | 1.90%(f) | |||||
|
Portfolio turnover
rate |
6%(g) | 11% | 6% | 16% | 38% | 5%(g) | |||||
| * | Commencement of operations. |
| (a) | Net investment income per share is calculated using the average shares method. |
| (b) | Amount is less than $0.005 per share. |
| (c) | Total return is calculated assuming a purchase of shares at net asset value on the first day and a sale at net asset value on the last day of each period reported. Distributions are assumed, for the purpose of this calculation, to be reinvested at net asset value per share on the respective payment dates. Total return for periods of less than one year is not annualized. Results represent past performance and are not indicative of future results. |
| (d) | If the Affiliates had not made a contribution during the period ended December 31, 2018, total return would have remained (7.52)%. See Note 3. |
| (e) | Does not include expenses of the Underlying Funds in which the Fund invests. |
| (f) | Annualized. |
| (g) | Not annualized. |
| Class I | |||||||||||
| Six
Months Ended 6/30/19 (Unaudited) |
Year
Ended 12/31/18 |
Year
Ended 12/31/17 |
Year
Ended 12/31/16 |
Year
Ended 12/31/15 |
For
the Period 9/30/14* - 12/31/14 | ||||||
|
Net asset value, beginning of
period |
$10.77 | $12.29 | $10.36 | $ 9.64 | $10.06 | $10.00 | |||||
| Income (loss) from investment operations: | |||||||||||
|
Net investment income (loss)
(a) |
0.01 | 0.33 | 0.20 | 0.15 | 0.30 | 0.06 | |||||
|
Net realized and unrealized gain
(loss) |
1.73 | (1.31) | 2.02 | 0.75 | (0.54) | 0.16 | |||||
|
Total from investment
operations |
1.74 | (0.98) | 2.22 | 0.90 | (0.24) | 0.22 | |||||
| Distributions to shareholders from: | |||||||||||
|
Net investment
income |
— | (0.26) | (0.24) | (0.16) | (0.17) | (0.16) | |||||
|
Net realized
gains |
— | (0.28) | (0.05) | (0.02) | (0.01) | (0.00)(b) | |||||
|
Total
distributions |
— | (0.54) | (0.29) | (0.18) | (0.18) | (0.16) | |||||
|
Net asset value, end of
period |
$12.51 | $10.77 | $12.29 | $10.36 | $ 9.64 | $10.06 | |||||
|
Total return
(c) |
16.16% | (7.96)%(d) | 21.45% | 9.31% | (2.40)% | 2.20% | |||||
| Ratios and Supplemental Data: | |||||||||||
|
Net assets, end of period (in
000s) |
$ 917 | $ 787 | $ 762 | $ 853 | $ 782 | $ 335 | |||||
| Ratios to Average Net Assets: | |||||||||||
|
Total expenses
(e) |
0.21%(f) | 0.20% | 0.21% | 0.59% | 3.25% | 30.22%(f) | |||||
|
Net expenses
(e) |
0.09%(f) | 0.08% | 0.06% | 0.06% | 0.01% | 0.37%(f) | |||||
|
Net investment income
(loss) |
0.17%(f) | 2.68% | 1.73% | 1.46% | 2.97% | 2.32%(f) | |||||
|
Portfolio turnover
rate |
6%(g) | 11% | 5% | 17% | 35% | 5%(g) | |||||
| * | Commencement of operations. |
| (a) | Net investment income per share is calculated using the average shares method. |
| (b) | Amount is less than $0.005 per share. |
| (c) | Total return is calculated assuming a purchase of shares at net asset value on the first day and a sale at net asset value on the last day of each period reported. Distributions are assumed, for the purpose of this calculation, to be reinvested at net asset value per share on the respective payment dates. Total return for periods of less than one year is not annualized. Results represent past performance and are not indicative of future results. |
| (d) | If the Affiliates had not made a contribution during the period ended December 31, 2018, total return would have remained (7.96)%. See Note 3. |
| (e) | Does not include expenses of the Underlying Funds in which the Fund invests. |
| (f) | Annualized. |
| (g) | Not annualized. |
| Class K | |||||||||||
| Six
Months Ended 6/30/19 (Unaudited) |
Year
Ended 12/31/18 |
Year
Ended 12/31/17 |
Year
Ended 12/31/16 |
Year
Ended 12/31/15 |
For
the Period 9/30/14* - 12/31/14 | ||||||
|
Net asset value, beginning of
period |
$ 10.77 | $ 12.29 | $ 10.36 | $ 9.63 | $10.06 | $10.00 | |||||
| Income (loss) from investment operations: | |||||||||||
|
Net investment income (loss)
(a) |
0.01 | 0.28 | 0.28 | 0.27 | 0.30 | 0.06 | |||||
|
Net realized and unrealized gain
(loss) |
1.73 | (1.26) | 1.94 | 0.64 | (0.55) | 0.17 | |||||
|
Total from investment
operations |
1.74 | (0.98) | 2.22 | 0.91 | (0.25) | 0.23 | |||||
| Distributions to shareholders from: | |||||||||||
|
Net investment
income |
— | (0.26) | (0.24) | (0.16) | (0.17) | (0.17) | |||||
|
Net realized
gains |
— | (0.28) | (0.05) | (0.02) | (0.01) | (0.00)(b) | |||||
|
Total
distributions |
— | (0.54) | (0.29) | (0.18) | (0.18) | (0.17) | |||||
|
Net asset value, end of
period |
$ 12.51 | $ 10.77 | $ 12.29 | $ 10.36 | $ 9.63 | $10.06 | |||||
|
Total return
(c) |
16.16% | (7.94)%(d) | 21.45% | 9.31% | (2.40)% | 2.25% | |||||
| Ratios and Supplemental Data: | |||||||||||
|
Net assets, end of period (in
000s) |
$616,923 | $465,425 | $300,444 | $76,304 | $8,374 | $ 335 | |||||
| Ratios to Average Net Assets: | |||||||||||
|
Total expenses
(e) |
0.18%(f) | 0.19% | 0.21% | 0.57% | 3.25% | 30.02%(f) | |||||
|
Net expenses
(e) |
0.05%(f) | 0.07% | 0.07% | 0.05% | 0.01% | 0.17%(f) | |||||
|
Net investment income
(loss) |
0.21%(f) | 2.29% | 2.39% | 2.62% | 2.99% | 2.53%(f) | |||||
|
Portfolio turnover
rate |
6%(g) | 11% | 5% | 17% | 35% | 5%(g) | |||||
| * | Commencement of operations. |
| (a) | Net investment income per share is calculated using the average shares method. |
| (b) | Amount is less than $0.005 per share. |
| (c) | Total return is calculated assuming a purchase of shares at net asset value on the first day and a sale at net asset value on the last day of each period reported. Distributions are assumed, for the purpose of this calculation, to be reinvested at net asset value per share on the respective payment dates. Total return for periods of less than one year is not annualized. Results represent past performance and are not indicative of future results. |
| (d) | If the Affiliates had not made a contribution during the period ended December 31, 2018, total return would have remained (7.94)%. See Note 3. |
| (e) | Does not include expenses of the Underlying Funds in which the Fund invests. |
| (f) | Annualized. |
| (g) | Not annualized. |
| Class I | |||||||||||
| Six
Months Ended 6/30/19 (Unaudited) |
Year
Ended 12/31/18 |
Year
Ended 12/31/17 |
Year
Ended 12/31/16 |
Year
Ended 12/31/15 |
For
the Period 9/30/14* - 12/31/14 | ||||||
|
Net asset value, beginning of
period |
$10.70 | $12.24 | $10.33 | $ 9.62 | $10.06 | $10.00 | |||||
| Income (loss) from investment operations: | |||||||||||
|
Net investment income (loss)
(a) |
0.01 | 0.37 | 0.15 | 0.08 | 0.43 | 0.06 | |||||
|
Net realized and unrealized gain
(loss) |
1.73 | (1.37) | 2.06 | 0.80 | (0.69) | 0.16 | |||||
|
Total from investment
operations |
1.74 | (1.00) | 2.21 | 0.88 | (0.26) | 0.22 | |||||
| Distributions to shareholders from: | |||||||||||
|
Net investment
income |
— | (0.26) | (0.25) | (0.15) | (0.18) | (0.16) | |||||
|
Net realized
gains |
— | (0.28) | (0.05) | (0.02) | (0.00)(b) | (0.00)(b) | |||||
|
Total
distributions |
— | (0.54) | (0.30) | (0.17) | (0.18) | (0.16) | |||||
|
Net asset value, end of
period |
$12.44 | $10.70 | $12.24 | $10.33 | $ 9.62 | $10.06 | |||||
|
Total return
(c) |
16.26% | (8.14)% | 21.30% | 9.34% | (2.61)% | 2.20% | |||||
| Ratios and Supplemental Data: | |||||||||||
|
Net assets, end of period (in
000s) |
$ 403 | $ 374 | $ 240 | $ 366 | $ 795 | $ 168 | |||||
| Ratios to Average Net Assets: | |||||||||||
|
Total expenses
(d) |
0.26%(e) | 0.25% | 0.25% | 0.97% | 4.65% | 59.71%(e) | |||||
|
Net expenses
(d) |
0.09%(e) | 0.08% | 0.06% | 0.12% | 0.02% | 0.37%(e) | |||||
|
Net investment income
(loss) |
0.14%(e) | 3.05% | 1.34% | 0.76% | 4.40% | 2.28%(e) | |||||
|
Portfolio turnover
rate |
5%(f) | 11% | 5% | 16% | 35% | 7%(f) | |||||
| * | Commencement of operations. |
| (a) | Net investment income per share is calculated using the average shares method. |
| (b) | Amount is less than $0.005 per share. |
| (c) | Total return is calculated assuming a purchase of shares at net asset value on the first day and a sale at net asset value on the last day of each period reported. Distributions are assumed, for the purpose of this calculation, to be reinvested at net asset value per share on the respective payment dates. Total return for periods of less than one year is not annualized. Results represent past performance and are not indicative of future results. |
| (d) | Does not include expenses of the Underlying Funds in which the Fund invests. |
| (e) | Annualized. |
| (f) | Not annualized. |
| Class K | |||||||||||
| Six
Months Ended 6/30/19 (Unaudited) |
Year
Ended 12/31/18 |
Year
Ended 12/31/17 |
Year
Ended 12/31/16 |
Year
Ended 12/31/15 |
For
the Period 9/30/14* - 12/31/14 | ||||||
|
Net asset value, beginning of
period |
$ 10.70 | $ 12.24 | $ 10.33 | $ 9.61 | $10.06 | $10.00 | |||||
| Income (loss) from investment operations: | |||||||||||
|
Net investment income (loss)
(a) |
0.01 | 0.28 | 0.27 | 0.26 | 0.28 | 0.06 | |||||
|
Net realized and unrealized gain
(loss) |
1.73 | (1.28) | 1.94 | 0.63 | (0.55) | 0.16 | |||||
|
Total from investment
operations |
1.74 | (1.00) | 2.21 | 0.89 | (0.27) | 0.22 | |||||
| Distributions to shareholders from: | |||||||||||
|
Net investment
income |
— | (0.26) | (0.25) | (0.15) | (0.18) | (0.16) | |||||
|
Net realized
gains |
— | (0.28) | (0.05) | (0.02) | (0.00)(b) | (0.00)(b) | |||||
|
Total
distributions |
— | (0.54) | (0.30) | (0.17) | (0.18) | (0.16) | |||||
|
Net asset value, end of
period |
$ 12.44 | $ 10.70 | $ 12.24 | $ 10.33 | $ 9.61 | $10.06 | |||||
|
Total return
(c) |
16.26% | (8.13)% | 21.42% | 9.35% | (2.71)% | 2.25% | |||||
| Ratios and Supplemental Data: | |||||||||||
|
Net assets, end of period (in
000s) |
$415,502 | $300,431 | $212,217 | $48,016 | $5,736 | $ 168 | |||||
| Ratios to Average Net Assets: | |||||||||||
|
Total expenses
(d) |
0.22%(e) | 0.23% | 0.25% | 0.90% | 4.65% | 59.52%(e) | |||||
|
Net expenses
(d) |
0.05%(e) | 0.07% | 0.07% | 0.05% | 0.02% | 0.17%(e) | |||||
|
Net investment income
(loss) |
0.18%(e) | 2.30% | 2.37% | 2.61% | 2.82% | 2.48%(e) | |||||
|
Portfolio turnover
rate |
5%(f) | 11% | 5% | 16% | 35% | 7%(f) | |||||
| * | Commencement of operations. |
| (a) | Net investment income per share is calculated using the average shares method. |
| (b) | Amount is less than $0.005 per share. |
| (c) | Total return is calculated assuming a purchase of shares at net asset value on the first day and a sale at net asset value on the last day of each period reported. Distributions are assumed, for the purpose of this calculation, to be reinvested at net asset value per share on the respective payment dates. Total return for periods of less than one year is not annualized. Results represent past performance and are not indicative of future results. |
| (d) | Does not include expenses of the Underlying Funds in which the Fund invests. |
| (e) | Annualized. |
| (f) | Not annualized. |
| Class I | |||||||||||
| Six
Months Ended 6/30/19 (Unaudited) |
Year
Ended 12/31/18 |
Year
Ended 12/31/17 |
Year
Ended 12/31/16 |
Year
Ended 12/31/15 |
For
the Period 9/30/14* - 12/31/14 | ||||||
|
Net asset value, beginning of
period |
$10.70 | $12.25 | $10.32 | $ 9.60 | $10.06 | $10.00 | |||||
| Income (loss) from investment operations: | |||||||||||
|
Net investment income (loss)
(a) |
0.01 | 0.31 | 0.11 | 0.16 | 0.22 | 0.06 | |||||
|
Net realized and unrealized gain
(loss) |
1.72 | (1.29) | 2.11 | 0.73 | (0.49) | 0.16 | |||||
|
Total from investment
operations |
1.73 | (0.98) | 2.22 | 0.89 | (0.27) | 0.22 | |||||
| Distributions to shareholders from: | |||||||||||
|
Net investment
income |
— | (0.25) | (0.24) | (0.15) | (0.18) | (0.16) | |||||
|
Net realized
gains |
— | (0.32) | (0.05) | (0.02) | (0.01) | (0.00)(b) | |||||
|
Total
distributions |
— | (0.57) | (0.29) | (0.17) | (0.19) | (0.16) | |||||
|
Net asset value, end of
period |
$12.43 | $10.70 | $12.25 | $10.32 | $ 9.60 | $10.06 | |||||
|
Total return
(c) |
16.17% | (7.93)%(d) | 21.60% | 9.33% | (2.65)% | 2.20% | |||||
| Ratios and Supplemental Data: | |||||||||||
|
Net assets, end of period (in
000s) |
$ 196 | $ 130 | $ 105 | $ 271 | $ 222 | $ 168 | |||||
| Ratios to Average Net Assets: | |||||||||||
|
Total expenses
(e) |
0.33%(f) | 0.40% | 0.52% | 2.09% | 7.69% | 59.62%(f) | |||||
|
Net expenses
(e) |
0.05%(f) | 0.07% | 0.06% | 0.04% | 0.02% | 0.37%(f) | |||||
|
Net investment income
(loss) |
0.18%(f) | 2.53% | 0.95% | 1.58% | 2.20% | 2.28%(f) | |||||
|
Portfolio turnover
rate |
5%(g) | 16% | 7% | 14% | 40% | 7%(g) | |||||
| * | Commencement of operations. |
| (a) | Net investment income per share is calculated using the average shares method. |
| (b) | Amount is less than $0.005 per share. |
| (c) | Total return is calculated assuming a purchase of shares at net asset value on the first day and a sale at net asset value on the last day of each period reported. Distributions are assumed, for the purpose of this calculation, to be reinvested at net asset value per share on the respective payment dates. Total return for periods of less than one year is not annualized. Results represent past performance and are not indicative of future results. |
| (d) | If the Affiliates had not made a contribution during the period ended December 31, 2018, total return would have remained (7.93)%. See Note 3. |
| (e) | Does not include expenses of the Underlying Funds in which the Fund invests. |
| (f) | Annualized. |
| (g) | Not annualized. |
| Class K | |||||||||||
| Six
Months Ended 6/30/19 (Unaudited) |
Year
Ended 12/31/18 |
Year
Ended 12/31/17 |
Year
Ended 12/31/16 |
Year
Ended 12/31/15 |
For
the Period 9/30/14* - 12/31/14 | ||||||
|
Net asset value, beginning of
period |
$ 10.68 | $ 12.23 | $ 10.31 | $ 9.59 | $10.06 | $10.00 | |||||
| Income (loss) from investment operations: | |||||||||||
|
Net investment income (loss)
(a) |
0.01 | 0.30 | 0.31 | 0.26 | 0.27 | 0.06 | |||||
|
Net realized and unrealized gain
(loss) |
1.72 | (1.28) | 1.90 | 0.63 | (0.55) | 0.16 | |||||
|
Total from investment
operations |
1.73 | (0.98) | 2.21 | 0.89 | (0.28) | 0.22 | |||||
| Distributions to shareholders from: | |||||||||||
|
Net investment
income |
— | (0.25) | (0.24) | (0.15) | (0.18) | (0.16) | |||||
|
Net realized
gains |
— | (0.32) | (0.05) | (0.02) | (0.01) | (0.00)(b) | |||||
|
Total
distributions |
— | (0.57) | (0.29) | (0.17) | (0.19) | (0.16) | |||||
|
Net asset value, end of
period |
$ 12.41 | $ 10.68 | $ 12.23 | $ 10.31 | $ 9.59 | $10.06 | |||||
|
Total return
(c) |
16.20% | (7.94)%(d) | 21.53% | 9.34% | (2.75)% | 2.25% | |||||
| Ratios and Supplemental Data: | |||||||||||
|
Net assets, end of period (in
000s) |
$203,004 | $132,520 | $81,529 | $18,718 | $3,043 | $ 168 | |||||
| Ratios to Average Net Assets: | |||||||||||
|
Total expenses
(e) |
0.33%(f) | 0.40% | 0.51% | 2.09% | 7.69% | 59.42%(f) | |||||
|
Net expenses
(e) |
0.05%(f) | 0.07% | 0.07% | 0.05% | 0.02% | 0.17%(f) | |||||
|
Net investment income
(loss) |
0.18%(f) | 2.49% | 2.67% | 2.61% | 2.64% | 2.48%(f) | |||||
|
Portfolio turnover
rate |
5%(g) | 16% | 7% | 14% | 40% | 7%(g) | |||||
| * | Commencement of operations. |
| (a) | Net investment income per share is calculated using the average shares method. |
| (b) | Amount is less than $0.005 per share. |
| (c) | Total return is calculated assuming a purchase of shares at net asset value on the first day and a sale at net asset value on the last day of each period reported. Distributions are assumed, for the purpose of this calculation, to be reinvested at net asset value per share on the respective payment dates. Total return for periods of less than one year is not annualized. Results represent past performance and are not indicative of future results. |
| (d) | If the Affiliates had not made a contribution during the period ended December 31, 2018, total return would have remained (7.94)%. See Note 3. |
| (e) | Does not include expenses of the Underlying Funds in which the Fund invests. |
| (f) | Annualized. |
| (g) | Not annualized. |
| Class I | |||||||||||
| Six
Months Ended 6/30/19 (Unaudited) |
Year
Ended 12/31/18 |
Year
Ended 12/31/17 |
Year
Ended 12/31/16 |
Year
Ended 12/31/15 |
For
the Period 9/30/14* - 12/31/14 | ||||||
|
Net asset value, beginning of
period |
$10.28 | $11.91 | $10.09 | $ 9.50 | $10.06 | $10.00 | |||||
| Income (loss) from investment operations: | |||||||||||
|
Net investment income (loss)
(a) |
0.01 | 0.30 | 0.15 | 0.15 | 0.20 | 0.06 | |||||
|
Net realized and unrealized gain
(loss) |
1.67 | (1.27) | 2.01 | 0.71 | (0.46) | 0.16 | |||||
|
Total from investment
operations |
1.68 | (0.97) | 2.16 | 0.86 | (0.26) | 0.22 | |||||
| Distributions to shareholders from: | |||||||||||
|
Net investment
income |
— | (0.24) | (0.23) | (0.14) | (0.19) | (0.16) | |||||
|
Net realized
gains |
— | (0.42) | (0.11) | (0.13) | (0.11) | (0.00)(b) | |||||
|
Total
distributions |
— | (0.66) | (0.34) | (0.27) | (0.30) | (0.16) | |||||
|
Net asset value, end of
period |
$11.96 | $10.28 | $11.91 | $10.09 | $ 9.50 | $10.06 | |||||
|
Total return
(c) |
16.34% | (8.13)% | 21.45% | 9.09% | (2.53)% | 2.18% | |||||
| Ratios and Supplemental Data: | |||||||||||
|
Net assets, end of period (in
000s) |
$ 149 | $ 121 | $ 103 | $ 170 | $ 162 | $ 168 | |||||
| Ratios to Average Net Assets: | |||||||||||
|
Total expenses
(d) |
1.03%(e) | 1.56% | 3.13% | 11.36% | 29.76% | 59.48%(e) | |||||
|
Net expenses
(d) |
0.03%(e) | 0.06% | 0.06% | 0.05% | 0.02% | 0.37%(e) | |||||
|
Net investment income
(loss) |
0.21%(e) | 2.55% | 1.31% | 1.51% | 1.96% | 2.29%(e) | |||||
|
Portfolio turnover
rate |
31%(f) | 38% | 18% | 55% | 73% | 7%(f) | |||||
| * | Commencement of operations. |
| (a) | Net investment income per share is calculated using the average shares method. |
| (b) | Amount is less than $0.005 per share. |
| (c) | Total return is calculated assuming a purchase of shares at net asset value on the first day and a sale at net asset value on the last day of each period reported. Distributions are assumed, for the purpose of this calculation, to be reinvested at net asset value per share on the respective payment dates. Total return for periods of less than one year is not annualized. Results represent past performance and are not indicative of future results. |
| (d) | Does not include expenses of the Underlying Funds in which the Fund invests. |
| (e) | Annualized. |
| (f) | Not annualized. |
| Class K | |||||||||||
| Six
Months Ended 6/30/19 (Unaudited) |
Year
Ended 12/31/18 |
Year
Ended 12/31/17 |
Year
Ended 12/31/16 |
Year
Ended 12/31/15 |
For
the Period 9/30/14* - 12/31/14 | ||||||
|
Net asset value, beginning of
period |
$ 10.28 | $ 11.91 | $ 10.08 | $ 9.49 | $10.06 | $10.00 | |||||
| Income (loss) from investment operations: | |||||||||||
|
Net investment income (loss)
(a) |
0.01 | 0.34 | 0.33 | 0.29 | 0.19 | 0.06 | |||||
|
Net realized and unrealized gain
(loss) |
1.67 | (1.31) | 1.84 | 0.57 | (0.45) | 0.16 | |||||
|
Total from investment
operations |
1.68 | (0.97) | 2.17 | 0.86 | (0.26) | 0.22 | |||||
| Distributions to shareholders from: | |||||||||||
|
Net investment
income |
— | (0.24) | (0.23) | (0.14) | (0.20) | (0.16) | |||||
|
Net realized
gains |
— | (0.42) | (0.11) | (0.13) | (0.11) | (0.00)(b) | |||||
|
Total
distributions |
— | (0.66) | (0.34) | (0.27) | (0.31) | (0.16) | |||||
|
Net asset value, end of
period |
$ 11.96 | $ 10.28 | $ 11.91 | $10.08 | $ 9.49 | $10.06 | |||||
|
Total return
(c) |
16.34% | (8.13)% | 21.57% | 8.98% | (2.53)% | 2.24% | |||||
| Ratios and Supplemental Data: | |||||||||||
|
Net assets, end of period (in
000s) |
$46,551 | $25,829 | $12,141 | $3,344 | $ 269 | $ 168 | |||||
| Ratios to Average Net Assets: | |||||||||||
|
Total expenses
(d) |
1.04%(e) | 1.56% | 3.07% | 11.36% | 29.76% | 59.28%(e) | |||||
|
Net expenses
(d) |
0.03%(e) | 0.06% | 0.07% | 0.06% | 0.02% | 0.17%(e) | |||||
|
Net investment income
(loss) |
0.21%(e) | 2.87% | 2.94% | 2.91% | 1.88% | 2.49%(e) | |||||
|
Portfolio turnover
rate |
31%(f) | 38% | 18% | 55% | 73% | 7%(f) | |||||
| * | Commencement of operations. |
| (a) | Net investment income per share is calculated using the average shares method. |
| (b) | Amount is less than $0.005 per share. |
| (c) | Total return is calculated assuming a purchase of shares at net asset value on the first day and a sale at net asset value on the last day of each period reported. Distributions are assumed, for the purpose of this calculation, to be reinvested at net asset value per share on the respective payment dates. Total return for periods of less than one year is not annualized. Results represent past performance and are not indicative of future results. |
| (d) | Does not include expenses of the Underlying Funds in which the Fund invests. |
| (e) | Annualized. |
| (f) | Not annualized. |
| Fund | Classes | Commencement
of Operations |
Diversification
Classification |
| State Street Target Retirement Fund | Class
I Class K |
September
30, 2014 September 30, 2014 |
Diversified |
| State Street Target Retirement 2015 Fund | Class
I Class K |
September
30, 2014 September 30, 2014 |
Diversified |
| State Street Target Retirement 2020 Fund | Class
I Class K |
September
30, 2014 September 30, 2014 |
Diversified |
| State Street Target Retirement 2025 Fund | Class
I Class K |
September
30, 2014 September 30, 2014 |
Diversified |
| State Street Target Retirement 2030 Fund | Class
I Class K |
September
30, 2014 September 30, 2014 |
Diversified |
| State Street Target Retirement 2035 Fund | Class
I Class K |
September
30, 2014 September 30, 2014 |
Diversified |
| State Street Target Retirement 2040 Fund | Class
I Class K |
September
30, 2014 September 30, 2014 |
Diversified |
| State Street Target Retirement 2045 Fund | Class
I Class K |
September
30, 2014 September 30, 2014 |
Diversified |
| State Street Target Retirement 2050 Fund | Class
I Class K |
September
30, 2014 September 30, 2014 |
Diversified |
| State Street Target Retirement 2055 Fund | Class
I Class K |
September
30, 2014 September 30, 2014 |
Diversified |
| State Street Target Retirement 2060 Fund | Class
I Class K |
September
30, 2014 September 30, 2014 |
Diversified |
| Purchases | Sales | ||
|
State Street Target Retirement
Fund |
$ 33,910,456 | $ 20,842,757 | |
|
State Street Target Retirement 2015
Fund |
36,228,424 | 34,856,224 | |
|
State Street Target Retirement 2020
Fund |
128,980,736 | 88,368,074 | |
|
State Street Target Retirement 2025
Fund |
206,027,074 | 109,591,791 | |
|
State Street Target Retirement 2030
Fund |
196,421,757 | 91,934,664 | |
|
State Street Target Retirement 2035
Fund |
153,606,638 | 71,297,467 | |
|
State Street Target Retirement 2040
Fund |
125,475,324 | 45,503,864 | |
|
State Street Target Retirement 2045
Fund |
105,750,862 | 31,341,528 | |
|
State Street Target Retirement 2050
Fund |
82,008,536 | 17,603,043 | |
|
State Street Target Retirement 2055
Fund |
55,357,059 | 8,167,318 | |
|
State Street Target Retirement 2060
Fund |
26,930,372 | 11,488,958 |
| Tax
Cost |
Gross
Unrealized Appreciation |
Gross
Unrealized Depreciation |
Net
Unrealized Appreciation (Depreciation) | ||||
|
State Street Target Retirement
Fund |
$ 246,860,926 | $ 5,568,058 | $266,936 | $ 5,301,122 | |||
|
State Street Target Retirement 2015
Fund |
295,229,747 | 7,435,019 | 91,590 | 7,343,429 | |||
|
State Street Target Retirement 2020
Fund |
981,181,497 | 39,000,663 | — | 39,000,663 | |||
|
State Street Target Retirement 2025
Fund |
1,226,040,223 | 59,059,053 | — | 59,059,053 | |||
|
State Street Target Retirement 2030
Fund |
1,164,982,519 | 73,415,962 | — | 73,415,962 | |||
|
State Street Target Retirement 2035
Fund |
945,657,725 | 58,106,738 | — | 58,106,738 | |||
|
State Street Target Retirement 2040
Fund |
761,687,135 | 53,130,227 | — | 53,130,227 | |||
|
State Street Target Retirement 2045
Fund |
581,275,563 | 34,805,781 | — | 34,805,781 | |||
|
State Street Target Retirement 2050
Fund |
387,954,948 | 26,267,624 | — | 26,267,624 | |||
|
State Street Target Retirement 2055
Fund |
192,700,448 | 9,679,075 | — | 9,679,075 | |||
|
State Street Target Retirement 2060
Fund |
44,681,368 | 1,584,985 | — | 1,584,985 |
| Fund | Market
Value of Securities on Loan |
Cash
Collateral Received |
Non-Cash
Collateral Received* |
Total
Collateral Received | ||||
|
State Street Target Retirement
Fund |
$ 22,542,884 | $ 22,888,894 | $ 149,854 | $ 23,038,748 | ||||
|
State Street Target Retirement 2015
Fund |
23,329,024 | 23,739,669 | 94,674 | 23,834,343 | ||||
|
State Street Target Retirement 2020
Fund |
59,060,941 | 44,887,955 | 15,396,444 | 60,284,399 | ||||
|
State Street Target Retirement 2025
Fund |
65,699,644 | 55,993,683 | 11,091,069 | 67,084,752 |
| Fund | Market
Value of Securities on Loan |
Cash
Collateral Received |
Non-Cash
Collateral Received* |
Total
Collateral Received | ||||
|
State Street Target Retirement 2030
Fund |
$39,093,912 | $39,921,891 | $ — | $39,921,891 | ||||
|
State Street Target Retirement 2035
Fund |
6,526,160 | 6,664,543 | — | 6,664,543 | ||||
|
State Street Target Retirement 2040
Fund |
11,448 | 11,700 | — | 11,700 | ||||
|
State Street Target Retirement 2045
Fund |
22,896 | 23,400 | — | 23,400 |
| * | The non-cash collateral includes U.S. Treasuries and U.S. Government Agency securities. |
| Remaining
Contractual Maturity of the Agreements As of June 30, 2019 | ||||||||||||||
| Fund | Securities
Lending Transactions |
Overnight
and Continuous |
<30 Days | Between
30 & 90 Days |
>90 Days | Total
Borrowings |
Gross
Amount of Recognized Liabilities for Securities Lending Transactions | |||||||
|
State Street Target Retirement
Fund |
Mutual Funds and Exchange Traded Products | $22,888,894 | $— | $— | $— | $22,888,894 | $22,888,894 | |||||||
|
State Street Target Retirement 2015
Fund |
Mutual Funds and Exchange Traded Products | 23,769,669 | — | — | — | 23,769,669 | 23,769,669 | |||||||
|
State Street Target Retirement 2020
Fund |
Mutual Funds and Exchange Traded Products | 44,887,955 | — | — | — | 44,887,955 | 44,887,955 | |||||||
|
State Street Target Retirement 2025
Fund |
Mutual Funds and Exchange Traded Products | 55,993,683 | — | — | — | 55,993,683 | 55,993,683 | |||||||
|
State Street Target Retirement 2030
Fund |
Mutual Funds and Exchange Traded Products | 39,921,891 | — | — | — | 39,921,891 | 39,921,891 | |||||||
|
State Street Target Retirement 2035
Fund |
Mutual Funds and Exchange Traded Products | 6,664,543 | — | — | — | 6,664,543 | 6,664,543 | |||||||
|
State Street Target Retirement 2040
Fund |
Mutual Funds and Exchange Traded Products | 11,700 | — | — | — | 11,700 | 11,700 | |||||||
|
State Street Target Retirement 2045
Fund |
Mutual Funds and Exchange Traded Products | 23,400 | — | — | — | 23,400 | 23,400 | |||||||
| Actual | Hypothetical
(assuming a 5% return before expenses) | ||||||||
| Annualized
Expense Ratio(a) |
Ending
Account Value |
Expenses
Paid During Period(b) |
Ending
Account Value |
Expenses
Paid During Period(b) | |||||
|
State Street Target Retirement
Fund |
|||||||||
|
Class
I |
(0.03)% | $1,092.80 | $(0.16) | $1,024.90 | $(0.15) | ||||
|
Class
K |
(0.03) | 1,093.00 | (0.16) | 1,024.90 | (0.15) | ||||
| State Street Target Retirement 2015 Fund | |||||||||
|
Class
I |
(0.02) | 1,096.90 | (0.10) | 1,024.90 | (0.10) | ||||
|
Class
K |
(0.03) | 1,096.90 | (0.16) | 1,024.90 | (0.15) | ||||
| State Street Target Retirement 2020 Fund | |||||||||
|
Class
I |
0.01 | 1,114.70 | 0.05 | 1,024.70 | 0.05 | ||||
|
Class
K |
(0.01) | 1,115.60 | (0.05) | 1,024.80 | (0.05) | ||||
| State Street Target Retirement 2025 Fund | |||||||||
|
Class
I |
0.03 | 1,133.90 | 0.16 | 1,024.60 | 0.15 | ||||
|
Class
K |
0.01 | 1,133.60 | 0.05 | 1,024.70 | 0.05 | ||||
| State Street Target Retirement 2030 Fund | |||||||||
|
Class
I |
0.05 | 1,143.40 | 0.27 | 1,024.50 | 0.25 | ||||
|
Class
K |
0.04 | 1,143.10 | 0.21 | 1,024.60 | 0.20 | ||||
| State Street Target Retirement 2035 Fund | |||||||||
|
Class
I |
0.07 | 1,150.00 | 0.37 | 1,024.40 | 0.35 | ||||
|
Class
K |
0.05 | 1,149.60 | 0.27 | 1,024.50 | 0.25 | ||||
| State Street Target Retirement 2040 Fund | |||||||||
| Actual | Hypothetical
(assuming a 5% return before expenses) | ||||||||
| Annualized
Expense Ratio(a) |
Ending
Account Value |
Expenses
Paid During Period(b) |
Ending
Account Value |
Expenses
Paid During Period(b) | |||||
|
Class
I |
0.07% | $1,155.70 | $ 0.37 | $1,024.40 | $ 0.35 | ||||
|
Class
K |
0.05 | 1,156.60 | 0.27 | 1,024.50 | 0.25 | ||||
| State Street Target Retirement 2045 Fund | |||||||||
|
Class
I |
0.09 | 1,161.60 | 0.48 | 1,024.30 | 0.45 | ||||
|
Class
K |
0.05 | 1,161.60 | 0.27 | 1,024.50 | 0.25 | ||||
| State Street Target Retirement 2050 Fund | |||||||||
|
Class
I |
0.09 | 1,162.60 | 0.48 | 1,024.30 | 0.45 | ||||
|
Class
K |
0.05 | 1,162.60 | 0.27 | 1,024.50 | 0.25 | ||||
| State Street Target Retirement 2055 Fund | |||||||||
|
Class
I |
0.05 | 1,161.70 | 0.27 | 1,024.50 | 0.25 | ||||
|
Class
K |
0.05 | 1,162.00 | 0.27 | 1,024.50 | 0.25 | ||||
| State Street Target Retirement 2060 Fund | |||||||||
|
Class
I |
0.03 | 1,163.40 | 0.16 | 1,024.60 | 0.15 | ||||
|
Class
K |
0.03 | 1,163.40 | 0.16 | 1,024.60 | 0.15 | ||||
| (a) | The Annualized Expense Ratio does not reflect acquired fund fees and expenses. If acquired fund fees and expenses were included, expenses would be higher. |
| (b) | Expenses are equal to the Fund’s annualized net expense ratio multiplied by the average account value of the period, multiplied by 181, then divided by 365. Includes amounts waived, reimbursed and/or other credits. Without the waiver, reimbursement and/or other credits, expenses would have been higher. |
| • | A report prepared by an independent third-party provider of investment company data, which includes for each Fund: |
| • | Comparative information concerning fees charged by the Adviser for managing institutional accounts using investment strategies and techniques similar to those used in managing the Funds; and |
| • | Profitability analyses for (a) the Adviser with respect to each Fund and (b) affiliates of the Adviser that provide services to the Funds (“Affiliated Service Providers”). |
| • | Descriptions of the investment management services provided by the Adviser, including its investment strategies and processes; |
| • | Information concerning the allocation of brokerage; and |
| • | Information regarding the procedures and processes used to value the assets of the Funds. |
| • | Reports detailing the financial results and condition of the Adviser and its affiliates; |
| • | Descriptions of the qualifications, education and experience of the individual investment and other professionals responsible for managing the portfolios of the Funds and for Fund operations; |
| • | Information relating to compliance with and the administration of the Code of Ethics adopted by the Adviser; |
| • | A copy of the Adviser’s proxy voting policies and procedures and other information regarding the Adviser’s practices for overseeing proxy vendors; |
| • | Information concerning the resources devoted by the Adviser to overseeing compliance by the Funds and their service providers, including information concerning compliance with investment policies and restrictions and other operating policies of the Funds; |
| • | A description of the adequacy and sophistication of the Adviser’s technology and systems with respect to investment and administrative matters and a description of any material improvements or changes in technology or systems in the past year; |
| • | A description of the business continuity and disaster recovery plans of the Adviser; and |
| • | Information regarding the Adviser’s risk management processes. |
| • | Information concerning the nature, extent, quality and cost of services provided to the Funds by SSGA FM in its capacity as the Funds’ administrator (the “Administrator”); |
| • | Information concerning the nature, extent, quality and cost of various non-investment management services provided to the Funds by affiliates of the Adviser, including the custodian, sub-administrator, fund accountant and securities lending agent of the Funds, and the role of the Adviser in managing the Funds’ relationship with these service providers; |
| • | Copies of the Advisory Agreement and agreements with other service providers of the Funds; |
| • | Draft responses to a letter from independent legal counsel to the Independent Trustees (“Independent Counsel”), reviewed prior to such date by Independent Counsel, requesting specific information from each of: |
| • | Information from SSGA FM, State Street and the Distributor with respect to the Trust, providing any material changes to the previous information supplied in response to the letter from Independent Counsel prior to the executive session of the Board on May 15, 2019; |
| • | Materials provided by Broadridge, circulated to the Independent Trustees and to Independent Counsel, with respect to the Funds; and |
| • | A summary of the foregoing materials prepared by Independent Counsel. |
State Street Bank and Trust Company
P.O. Box 5049
Boston, MA 02206
| State Street Hedged International Developed Equity Index Fund |

|
|
1 |
|
|
2 |
|
|
5 |
|
|
6 |
|
|
7 |
|
|
8 |
|
|
9 |
|
|
16 |
| % of Net Assets | |||
| Mutual Funds and Exchange Traded Products | 96.6% | ||
| Short-Term Investment | 4.6 | ||
| Liabilities in Excess of Other Assets | (1.2) | ||
| TOTAL | 100.0% |
| Counterparty | Amount Sold | Amount Bought | Settlement
Date |
Net
Unrealized Appreciation/ (Depreciation) | ||||
| Barclays Capital | USD 3,513,717 | SGD 4,834,000 | 07/02/2019 | $ 59,216 | ||||
| BNP Paribas SA | HKD 22,523,000 | USD 2,883,226 | 08/02/2019 | (97) | ||||
| BNP Paribas SA | NOK 2,997,000 | USD 351,901 | 08/02/2019 | 19 | ||||
| BNP Paribas SA | SEK 30,056,000 | USD 3,246,807 | 08/02/2019 | (265) | ||||
| Citibank N.A. | AUD 341,729,050 | USD 236,960,049 | 07/02/2019 | (2,848,296) | ||||
| Citibank N.A. | DKK 400,974,566 | USD 59,986,172 | 07/02/2019 | (1,193,957) | ||||
| Citibank N.A. | ILS 36,463,174 | USD 10,067,277 | 07/02/2019 | (156,377) | ||||
| Citibank N.A. | JPY 45,975,924,805 | USD 424,408,170 | 07/02/2019 | (2,322,152) | ||||
| Citibank N.A. | USD 532,184,764 | EUR 467,320,657 | 07/02/2019 | 192 | ||||
| Citibank N.A. | USD 22,868,329 | NOK 194,976,520 | 07/02/2019 | — | ||||
| Citibank N.A. | EUR 467,320,657 | USD 533,540,929 | 08/02/2019 | (3,930) | ||||
| Citibank N.A. | NOK 194,976,520 | USD 22,891,688 | 08/02/2019 | (753) | ||||
| HSBC Bank USA | USD 285,335,871 | GBP 224,197,274 | 07/02/2019 | 45 | ||||
| HSBC Bank USA | USD 124,045,317 | HKD 969,104,035 | 07/02/2019 | — | ||||
| HSBC Bank USA | GBP 224,197,274 | USD 285,773,504 | 08/02/2019 | (6,322) | ||||
| HSBC Bank USA | HKD 969,104,035 | USD 124,058,020 | 08/02/2019 | (3,628) | ||||
| JP Morgan Chase Bank, N.A. | GBP 8,124,000 | USD 10,355,638 | 08/02/2019 | 136 | ||||
| Royal Bank of Canada | USD 8,730,903 | SEK 82,907,000 | 07/02/2019 | 204,775 | ||||
| Royal Bank of Canada | USD 29,613,358 | JPY 3,207,787,000 | 07/02/2019 | 160,051 | ||||
| Royal Bank of Canada | USD 2,062,496 | NOK 18,033,000 | 07/02/2019 | 52,552 | ||||
| Royal Bank of Canada | CHF 6,213,000 | USD 6,391,107 | 08/02/2019 | 118 | ||||
| Royal Bank of Canada | DKK 10,696,000 | USD 1,636,511 | 08/02/2019 | 51 | ||||
| Royal Bank of Canada | SGD 2,864,000 | USD 2,117,966 | 08/02/2019 | (49) | ||||
| Societe Generale | CHF 308,634,571 | USD 307,659,291 | 07/02/2019 | (8,888,987) | ||||
| Societe Generale | GBP 226,806,274 | USD 286,279,415 | 07/02/2019 | (2,376,975) |
| Counterparty | Amount Sold | Amount Bought | Settlement
Date |
Net
Unrealized Appreciation/ (Depreciation) | ||||
| Societe Generale | JPY 45,975,924,805 | USD 424,402,293 | 07/02/2019 | $ (2,328,028) | ||||
| Standard Chartered Bank | GBP 226,806,273 | USD 286,279,414 | 07/02/2019 | (2,376,975) | ||||
| Standard Chartered Bank | HKD 1,022,061,035 | USD 130,379,063 | 07/02/2019 | (444,749) | ||||
| Standard Chartered Bank | USD 44,111,238 | SGD 59,680,299 | 07/02/2019 | — | ||||
| Standard Chartered Bank | USD 88,211,456 | SEK 818,443,531 | 07/02/2019 | — | ||||
| Standard Chartered Bank | USD 8,328,178 | NZD 12,399,581 | 07/02/2019 | (2) | ||||
| Standard Chartered Bank | USD 532,184,764 | EUR 467,320,657 | 07/02/2019 | 192 | ||||
| Standard Chartered Bank | EUR 467,320,657 | USD 533,540,929 | 08/02/2019 | (3,930) | ||||
| Standard Chartered Bank | NZD 12,399,581 | USD 8,333,882 | 08/02/2019 | (246) | ||||
| Standard Chartered Bank | SEK 818,443,531 | USD 88,417,963 | 08/02/2019 | (1,815) | ||||
| Standard Chartered Bank | SGD 59,680,299 | USD 44,134,072 | 08/02/2019 | (1,306) | ||||
| Toronto Dominion Bank | USD 9,798,024 | JPY 1,053,026,000 | 08/02/2019 | (784) | ||||
| UBS AG | EUR 493,970,657 | USD 551,750,405 | 07/02/2019 | (10,783,582) | ||||
| UBS AG | ILS 3,581,000 | USD 988,673 | 07/02/2019 | (15,378) | ||||
| UBS AG | NZD 12,399,581 | USD 8,087,254 | 07/02/2019 | (240,922) | ||||
| UBS AG | SEK 901,350,531 | USD 94,908,975 | 07/02/2019 | (2,238,159) | ||||
| UBS AG | SGD 64,514,299 | USD 46,883,688 | 07/02/2019 | (800,483) | ||||
| UBS AG | USD 2,875,546 | DKK 19,219,000 | 07/02/2019 | 56,862 | ||||
| UBS AG | USD 2,070,616 | CHF 2,077,000 | 07/02/2019 | 59,640 | ||||
| UBS AG | USD 6,755,959 | HKD 52,957,000 | 07/02/2019 | 22,536 | ||||
| UBS AG | USD 314,418,022 | CHF 306,557,571 | 07/02/2019 | — | ||||
| UBS AG | USD 285,335,869 | GBP 224,197,273 | 07/02/2019 | 45 | ||||
| UBS AG | USD 411,843,617 | JPY 44,372,031,305 | 07/02/2019 | — | ||||
| UBS AG | CHF 306,557,571 | USD 315,326,810 | 08/02/2019 | (12,974) | ||||
| UBS AG | GBP 224,197,273 | USD 285,768,570 | 08/02/2019 | (11,254) | ||||
| UBS AG | JPY 44,372,031,305 | USD 412,816,844 | 08/02/2019 | (15,747) | ||||
| Westpac Banking Corp. | AUD 7,522,000 | USD 5,215,890 | 07/02/2019 | (62,673) | ||||
| Westpac Banking Corp. | EUR 493,970,657 | USD 551,767,200 | 07/02/2019 | (10,766,787) | ||||
| Westpac Banking Corp. | NOK 213,009,520 | USD 24,359,396 | 07/02/2019 | (623,981) | ||||
| Westpac Banking Corp. | USD 59,538,658 | EUR 53,300,000 | 07/02/2019 | 1,159,403 | ||||
| Westpac Banking Corp. | USD 6,586,280 | GBP 5,218,000 | 07/02/2019 | 54,670 | ||||
| Westpac Banking Corp. | USD 245,086,924 | AUD 349,251,050 | 07/02/2019 | (16) | ||||
| Westpac Banking Corp. | USD 11,227,706 | ILS 40,044,174 | 07/02/2019 | — | ||||
| Westpac Banking Corp. | USD 58,247,721 | DKK 381,755,566 | 07/02/2019 | — | ||||
| Westpac Banking Corp. | USD 411,843,617 | JPY 44,372,031,305 | 07/02/2019 | — | ||||
| Westpac Banking Corp. | AUD 2,359,000 | USD 1,657,183 | 08/02/2019 | (61) | ||||
| Westpac Banking Corp. | AUD 349,251,050 | USD 245,350,609 | 08/02/2019 | (5,223) | ||||
| Westpac Banking Corp. | DKK 381,755,566 | USD 58,404,560 | 08/02/2019 | (3,038) | ||||
| Westpac Banking Corp. | EUR 22,256,000 | USD 25,410,521 | 08/02/2019 | 614 | ||||
| Westpac Banking Corp. | ILS 40,044,174 | USD 11,248,759 | 08/02/2019 | (332) | ||||
| Westpac Banking Corp. | JPY 44,372,031,305 | USD 412,826,446 | 08/02/2019 | (6,146) | ||||
| Total | $(46,715,262) |
| AUD | =Australian Dollar |
| CHF | =Swiss Franc |
| DKK | =Danish Krone |
| EUR | =Euro |
| GBP | =British Pound |
| HKD | =Hong Kong Dollar |
| ILS | =Israeli New Shekel |
| JPY | =Japanese Yen |
| NOK | =Norwegian Krone |
| NZD | =New Zealand Dollar |
| SEK | =Swedish Krona |
| SGD | =Singapore Dollar |
| USD | =United States Dollar |
| Description | Number
of Contracts |
Expiration
Date |
Notional
Amount |
Value | Unrealized
Appreciation/ Depreciation | |||||
| Mini MSCI EAFE (long) | 1,220 | 09/20/2019 | $114,183,854 | $117,321,300 | $3,137,446 |
| Description | Level
1 – Quoted Prices |
Level
2 – Other Significant Observable Inputs |
Level
3 – Significant Unobservable Inputs |
Total | ||||
| ASSETS: | ||||||||
| INVESTMENTS: | ||||||||
|
Mutual Funds and Exchange Traded
Products |
$3,336,208,233 | $ — | $— | $3,336,208,233 | ||||
|
Short-Term
Investment |
157,334,566 | — | — | 157,334,566 | ||||
|
TOTAL
INVESTMENTS |
$3,493,542,799 | $ — | $— | $3,493,542,799 | ||||
| OTHER FINANCIAL INSTRUMENTS: | ||||||||
|
Foreign Currency Exchange
Contracts(a) |
— | 1,831,117 | — | 1,831,117 | ||||
|
Futures
Contracts(b) |
3,137,446 | — | — | 3,137,446 | ||||
|
TOTAL OTHER FINANCIAL
INSTRUMENTS |
$ 3,137,446 | $ 1,831,117 | $— | $ 4,968,563 | ||||
|
TOTAL INVESTMENTS AND OTHER FINANCIAL
INSTRUMENTS |
$3,496,680,245 | $ 1,831,117 | $— | $3,498,511,362 | ||||
|
LIABILITIES: |
||||||||
| OTHER FINANCIAL INSTRUMENTS: | ||||||||
|
Foreign Currency Exchange
Contracts(a) |
— | (48,546,379) | — | (48,546,379) | ||||
|
TOTAL OTHER FINANCIAL
INSTRUMENTS |
$ — | $(48,546,379) | $— | $ (48,546,379) |
| (a) | Forward Foreign Currency Exchange Contracts are valued at unrealized appreciation (depreciation). |
| (b) | Futures Contracts are valued at unrealized appreciation (depreciation). |
| Number
of Shares Held at 12/31/18 |
Value
at 12/31/18 |
Cost
of Purchases |
Proceeds
from Shares Sold |
Realized
Gain (Loss) |
Change
in Unrealized Appreciation/ Depreciation |
Number
of Shares Held at 6/30/19 |
Value
at 6/30/19 |
Dividend
Income | |||||||||
|
State Street Institutional U.S. Government Money Market Fund, Class G
Shares |
166,240,904 | $166,240,904 | $168,696,001 | $177,602,339 | $— | $— | 157,334,566 | $157,334,566 | $1,636,174 |
| ASSETS | |
|
Investment in corresponding affiliated Portfolio, at
value |
$3,336,208,233 |
|
Investment in affiliated issuers, at
value |
157,334,566 |
|
Total
Investments |
3,493,542,799 |
|
Foreign currency, at
value |
486,983 |
|
Cash at
broker |
5,615,567 |
|
Receivable from broker — accumulated variation margin on open futures
contracts |
3,140,960 |
|
Receivable for fund shares
sold |
795,593 |
|
Unrealized appreciation on forward foreign currency exchange
contracts |
1,831,117 |
|
Dividends receivable — affiliated
issuers |
297,409 |
|
Receivable from
Adviser |
143,809 |
|
Receivable for foreign taxes
recoverable |
233,343 |
|
Prepaid expenses and other
assets |
307,509 |
|
TOTAL ASSETS
|
3,506,395,089 |
| LIABILITIES | |
|
Payable for fund shares
repurchased |
3,235,637 |
|
Unrealized depreciation on forward foreign currency exchange
contracts |
48,546,379 |
|
Advisory fee
payable |
391,377 |
|
Custodian fees
payable |
25,674 |
|
Administration fees
payable |
139,787 |
|
Transfer agent fees
payable |
1,124 |
|
Registration and filing fees
payable |
511 |
|
Professional fees
payable |
21,529 |
|
Printing and postage fees
payable |
22,488 |
|
Accrued expenses and other
liabilities |
218,786 |
|
TOTAL LIABILITIES
|
52,603,292 |
|
NET ASSETS
|
$3,453,791,797 |
| NET ASSETS CONSIST OF: | |
|
Paid-in
Capital |
$3,145,719,116 |
|
Total distributable earnings
(loss) |
308,072,681 |
|
NET ASSETS
|
$3,453,791,797 |
| Class K | |
|
Net
Assets |
$3,453,791,797 |
|
Shares
Outstanding |
340,799,034 |
|
Net asset value, offering and redemption price per
share |
$ 10.13 |
| COST OF INVESTMENTS: | |
|
Investment in affiliated
Portfolio |
$3,061,767,400 |
|
Investment in affiliated
issuers |
157,334,566 |
|
Total cost of
investments |
$3,219,101,966 |
|
Foreign currency, at
cost |
$ 472,084 |
| INVESTMENT INCOME | |
|
Dividend income allocated from affiliated
Portfolio |
$ 79,584,507 |
|
Interest income — unaffiliated
issuers |
74,370 |
|
Dividend income — affiliated
issuers |
1,636,174 |
|
Expenses allocated from affiliated
Portfolio |
(2,259,428) |
|
Foreign taxes withheld allocated from affiliated
Portfolio |
(6,501,981) |
|
TOTAL INVESTMENT INCOME
(LOSS) |
72,533,642 |
| EXPENSES | |
|
Advisory
fee |
2,285,047 |
|
Administration
fees |
816,088 |
|
Custodian
fees |
76,884 |
|
Trustees’ fees and expenses
|
9,001 |
|
Transfer agent
fees |
5,582 |
|
Registration and filing
fees |
52,592 |
|
Professional fees and
expenses |
26,302 |
|
Printing and postage
fees |
9,550 |
|
Insurance
expense |
9,036 |
|
Miscellaneous
expenses |
236,338 |
|
TOTAL
EXPENSES |
3,526,420 |
|
Expenses waived/reimbursed by the
Adviser |
(2,520,822) |
|
NET
EXPENSES |
1,005,598 |
|
NET INVESTMENT INCOME
(LOSS) |
$ 71,528,044 |
| REALIZED AND UNREALIZED GAIN (LOSS) | |
| Net realized gain (loss) on: | |
|
Investments allocated from affiliated
Portfolio |
(10,893,866) |
|
Foreign currency transactions allocated from affiliated
Portfolio |
137,012 |
|
Futures contracts allocated from affiliated
Portfolio |
3,298,241 |
|
Forward foreign currency exchange
contracts |
51,124,660 |
|
Foreign currency
transactions |
(14,727) |
|
Futures
contracts |
11,403,847 |
|
Net realized gain
(loss) |
55,055,167 |
| Net change in unrealized appreciation/depreciation on: | |
|
Investments allocated from affiliated
Portfolio |
338,411,328 |
|
Foreign currency transactions allocated from affiliated
Portfolio |
150,854 |
|
Future contracts allocated from affiliated
Portfolio |
2,097,082 |
|
Forward foreign currency exchange
contracts |
(20,511,201) |
|
Foreign currency
translations |
20,483 |
|
Futures
contracts |
6,609,349 |
|
Net change in unrealized
appreciation/depreciation |
326,777,895 |
|
NET REALIZED AND UNREALIZED GAIN
(LOSS) |
381,833,062 |
|
NET INCREASE (DECREASE) IN NET ASSETS FROM
OPERATIONS |
$453,361,106 |
| Six
Months Ended 6/30/19 (Unaudited) |
Year
Ended 12/31/18 | ||
| INCREASE (DECREASE) IN NET ASSETS FROM OPERATIONS: | |||
|
Net investment income
(loss) |
$ 71,528,044 | $ 89,031,961 | |
|
Net realized gain
(loss) |
55,055,167 | 144,117,824 | |
|
Net change in unrealized
appreciation/depreciation |
326,777,895 | (520,332,594) | |
|
Net increase (decrease) in net assets resulting from
operations |
453,361,106 | (287,182,809) | |
| DISTRIBUTIONS TO SHAREHOLDERS: | |||
|
Class
K |
— | (203,340,267) | |
| FROM BENEFICIAL INTEREST TRANSACTIONS: | |||
| Class K | |||
|
Proceeds from sale of shares
sold |
311,509,386 | 1,113,683,573 | |
|
Reinvestment of
distributions |
— | 202,565,404 | |
|
Cost of shares
redeemed |
(233,922,929) | (797,282,077) | |
|
Net increase (decrease) in net assets from beneficial interest transactions
|
77,586,457 | 518,966,900 | |
|
Net increase (decrease) in net assets during the
period |
530,947,563 | 28,443,824 | |
|
Net assets at beginning of
period |
2,922,844,234 | 2,894,400,410 | |
|
NET ASSETS AT END OF
PERIOD |
$3,453,791,797 | $2,922,844,234 | |
| SHARES OF BENEFICIAL INTEREST: | |||
| Class K | |||
|
Shares
sold |
32,588,421 | 110,007,830 | |
|
Reinvestment of
distributions |
— | 23,176,820 | |
|
Shares
redeemed |
(24,173,050) | (79,182,431) | |
|
Net increase (decrease) from share
transactions |
8,415,371 | 54,002,219 |
| Class K | |||||||||
| Six
Months Ended 06/30/19 (Unaudited) |
Year
Ended 12/31/18 |
Year
Ended 12/31/17 |
Year
Ended(a) 12/31/16 |
For
the Period 5/29/15* - 12/31/15 | |||||
|
Net asset value, beginning of
period |
$ 8.79 | $ 10.40 | $ 9.18 | $ 9.00 | $ 10.00 | ||||
| Income (loss) from investment operations: | |||||||||
|
Net investment income (loss)
(b) |
0.21 | 0.29 | 0.27 | 0.24 | 0.09 | ||||
|
Net realized and unrealized gain
(loss) |
1.13 | (1.26) | 1.27 | 0.34 | (1.00) | ||||
|
Total from investment
operations |
1.34 | (0.97) | 1.54 | 0.58 | (0.91) | ||||
| Distributions to shareholders from: | |||||||||
|
Net investment
income |
— | (0.50) | — | (0.20) | (0.06) | ||||
|
Net realized
gains |
— | (0.14) | (0.32) | (0.20) | (0.03) | ||||
|
Total
distributions |
— | (0.64) | (0.32) | (0.40) | (0.09) | ||||
|
Net asset value, end of
period |
$ 10.13 | $ 8.79 | $ 10.40 | $ 9.18 | $ 9.00 | ||||
|
Total return
(c) |
15.24% | (9.25)% | 16.85% | 6.27% | (9.01)% | ||||
| Ratios and Supplemental Data: | |||||||||
|
Net assets, end of period (in
000s) |
$3,453,792 | $2,922,844 | $2,894,400 | $2,113,394 | $958,544 | ||||
| Ratios to Average Net Assets: | |||||||||
|
Total
expenses |
0.35%(d) | 0.36% | 0.35% | 0.34% | 0.38%(d) | ||||
|
Net
expenses |
0.20%(d) | 0.20% | 0.20% | 0.20% | 0.20%(d) | ||||
|
Net investment income
(loss) |
4.38%(d) | 2.85% | 2.69% | 2.79% | 1.60%(d) | ||||
|
Portfolio turnover rate
(e) |
2%(f) | 14% | 4% | 1% | 1%(f) | ||||
| * | Commencement of operations. |
| (a) | Prior to April 29, 2016, the per share amounts and ratios included the Fund’s standalone performance. Effective April 29, 2016, the per share amounts and ratios include the Fund’s proportionate share of the income and expenses of the affiliated Portfolio. |
| (b) | Net investment income per share is calculated using the average shares method. |
| (c) | Total return is calculated assuming a purchase of shares at net asset value on the first day and a sale at net asset value on the last day of each period reported. Distributions are assumed, for the purpose of this calculation, to be reinvested at net asset value per share on the respective payment dates. Total return for periods of less than one year is not annualized. Results represent past performance and are not indicative of future results. |
| (d) | Annualized. |
| (e) | Portfolio turnover rate is from the corresponding affiliated Portfolio. |
| (f) | Not annualized. |
| Fund | Classes | Commencement
of Operations: |
Diversification
Classification |
| State Street Hedged International Developed Equity Index Fund | Class K | May 29, 2015 | Diversified |
| Asset Derivatives | |||||||||||
| Interest
Rate Contracts Risk |
Foreign
Exchange Contracts Risk |
Credit
Contracts Risk |
Equity
Contracts Risk |
Commodity
Contracts Risk |
Total | ||||||
|
Forward Foreign Currency Exchange
Contracts |
$— | $1,831,117 | $— | $ — | $— | $1,831,117 | |||||
|
Futures
Contracts |
— | — | — | 3,140,960 | — | 3,140,960 | |||||
| Liability Derivatives | |||||||||||
| Interest
Rate Contracts Risk |
Foreign
Exchange Contracts Risk |
Credit
Contracts Risk |
Equity
Contracts Risk |
Commodity
Contracts Risk |
Total | ||||||
|
Forward Foreign Currency Exchange
Contracts |
$— | $(48,546,379) | $— | $— | $— | $(48,546,379) | |||||
| Net Realized Gain (Loss) | |||||||||||
| Interest
Rate Contracts Risk |
Foreign
Exchange Contracts Risk |
Credit
Contracts Risk |
Equity
Contracts Risk |
Commodity
Contracts Risk |
Total | ||||||
|
Forward Foreign Currency Exchange
Contracts |
$— | $51,124,660 | $— | $ — | $— | $51,124,660 | |||||
|
Futures
Contracts |
— | — | — | 11,403,847 | — | 11,403,847 | |||||
| Net Change in Unrealized Appreciation (Depreciation) | |||||||||||
| Interest
Rate Contracts Risk |
Foreign
Exchange Contracts Risk |
Credit
Contracts Risk |
Equity
Contracts Risk |
Commodity
Contracts Risk |
Total | ||||||
|
Forward Foreign Currency Exchange
Contracts |
$— | $(20,511,201) | $— | $ — | $— | $(20,511,201) | |||||
|
Futures
Contracts |
— | — | — | 6,609,349 | — | 6,609,349 | |||||
| Offsetting of Financial Assets and Derivative Assets | ||||||||
| Forward Foreign Currency Exchange Contracts | ||||||||
| Counterparty | Gross
Amounts of Assets |
Amount
Eligible to Offset |
Collateral
(Received) Pledged |
Net
Amount | ||||
|
Barclays
Capital |
$ 59,216 | $ — | $— | $ 59,216 | ||||
|
BNP Paribas
SA |
19 | (19) | — | — | ||||
|
Citibank
N.A. |
192 | (192) | — | — | ||||
|
HSBC Bank
USA |
45 | (45) | — | — | ||||
| Offsetting of Financial Assets and Derivative Assets | ||||||||
| Forward Foreign Currency Exchange Contracts | ||||||||
| Counterparty | Gross
Amounts of Assets |
Amount
Eligible to Offset |
Collateral
(Received) Pledged |
Net
Amount | ||||
|
JP Morgan Chase Bank,
N.A. |
$ 136 | $ — | $— | $ 136 | ||||
|
Royal Bank of
Canada |
417,547 | (49) | — | 417,498 | ||||
|
Standard Chartered
Bank |
192 | (192) | — | — | ||||
|
UBS
AG |
139,083 | (139,083) | — | — | ||||
|
Westpac Banking
Corp. |
1,214,687 | (1,214,687) | — | — | ||||
| $1,831,117 | $(1,354,267) | $— | $476,850 | |||||
| Offsetting of Financial Liabilities and Derivative Liabilities | ||||||||
| Forward Foreign Currency Exchange Contracts | ||||||||
| Counterparty | Gross
Amounts of Liabilities |
Amount
Eligible to Offset |
Collateral
(Received) Pledged |
Net
Amount | ||||
|
BNP Paribas
SA |
$ (362) | $ 19 | $— | $ (343) | ||||
|
Citibank
N.A. |
(6,525,465) | 192 | — | (6,525,273) | ||||
|
HSBC Bank
USA |
(9,950) | 45 | — | (9,905) | ||||
|
Royal Bank of
Canada |
(49) | 49 | — | — | ||||
|
Societe
Generale |
(13,593,990) | — | — | (13,593,990) | ||||
|
Standard Chartered
Bank |
(2,829,023) | 192 | — | (2,828,831) | ||||
|
Toronto Dominion
Bank |
(784) | — | — | (784) | ||||
|
UBS
AG |
(14,118,499) | 139,083 | — | (13,979,416) | ||||
|
Westpac Banking
Corp. |
(11,468,257) | 1,214,687 | — | (10,253,570) | ||||
| $(48,546,379) | $1,354,267 | $— | $(47,192,112) | |||||
| Tax
Cost |
Gross
Unrealized Appreciation |
Gross
Unrealized Depreciation |
Net
Unrealized Appreciation (Depreciation) | ||||
|
State Street Hedged International Developed Equity Index
Fund |
$3,219,101,966 | $277,578,279 | $46,715,262 | $230,863,017 |
| Actual | Hypothetical
(assuming a 5% return before expenses) | ||||||||
| Annualized
Expense Ratio |
Ending
Account Value |
Expenses
Paid During Period(a) |
Ending
Account Value |
Expenses
Paid During Period(a) | |||||
|
State Street Hedged International Developed Equity Index
Fund |
|||||||||
|
Class
K |
0.20% | $1,152.40 | $1.07 | $1,023.80 | $1.00 | ||||
| (a) | Expenses are equal to the Fund's annualized net expense ratio multiplied by the average account value of the period, multiplied by 181, then divided by 365. |
| • | A report prepared by an independent third-party provider of investment company data, which includes for the Fund: |
| • | Comparative information concerning fees charged by the Adviser for managing institutional accounts using investment strategies and techniques similar to those used in managing the Fund; and |
| • | Profitability analyses for (a) the Adviser with respect to the Fund and (b) affiliates of the Adviser that provide services to the Fund (“Affiliated Service Providers”). |
| • | Descriptions of the investment management services provided by the Adviser, including its investment strategies and processes; |
| • | Information concerning the allocation of brokerage; and |
| • | Information regarding the procedures and processes used to value the assets of the Fund. |
| • | Reports detailing the financial results and condition of the Adviser and its affiliates; |
| • | Descriptions of the qualifications, education and experience of the individual investment and other professionals responsible for managing the portfolio of the Fund and for Fund operations; |
| • | Information relating to compliance with and the administration of the Code of Ethics adopted by the Adviser; |
| • | A copy of the Adviser’s proxy voting policies and procedures and other information regarding the Adviser’s practices for overseeing proxy vendors; |
| • | Information concerning the resources devoted by the Adviser to overseeing compliance by the Fund and its service providers, including information concerning compliance with investment policies and restrictions and other operating policies of the Fund; |
| • | A description of the adequacy and sophistication of the Adviser’s technology and systems with respect to investment and administrative matters and a description of any material improvements or changes in technology or systems in the past year; |
| • | A description of the business continuity and disaster recovery plans of the Adviser; and |
| • | Information regarding the Adviser’s risk management processes. |
| • | Information concerning the nature, extent, quality and cost of services provided to the Fund by SSGA FM in its capacity as the Fund’s administrator (the “Administrator”); |
| • | Information concerning the nature, extent, quality and cost of various non-investment management services provided to the Fund by affiliates of the Adviser, including the custodian, sub-administrator, fund accountant and securities lending agent of the Fund, and the role of the Adviser in managing the Fund’s relationship with these service providers; |
| • | Copies of the Advisory Agreement and agreements with other service providers of the Fund; |
| • | Draft responses to a letter from independent legal counsel to the Independent Trustees (“Independent Counsel”), reviewed prior to such date by Independent Counsel, requesting specific information from each of: |
| • | Information from SSGA FM, State Street and the Distributor with respect to the Trust providing any material changes to the previous information supplied in response to the letter from Independent Counsel prior to the executive session of the Board on May 15, 2019; |
| • | Materials provided by Broadridge, circulated to the Independent Trustees and to Independent Counsel, with respect to the Fund; and |
| • | A summary of the foregoing materials prepared by Independent Counsel. |
State Street Bank and Trust Company
P.O. Box 5049
Boston, MA 02206
| State Street International Developed Equity Index Portfolio |
|
|
1 |
|
|
2 |
|
|
14 |
|
|
15 |
|
|
16 |
|
|
17 |
|
|
18 |
|
|
25 |
| Description | Market Value | % of Net Assets | ||
| Nestle SA | 74,475,726 | 2.2% | ||
| Novartis AG | 46,564,687 | 1.4 | ||
| Roche Holding AG | 46,462,611 | 1.4 | ||
| HSBC Holdings PLC | 39,282,700 | 1.2 | ||
| Royal Dutch Shell PLC Class A | 34,209,462 | 1.0 | ||
| TOTAL | 240,995,186 | 7.2% |
| Description | % of Net Assets | ||
| Banks | 10.7% | ||
| Pharmaceuticals | 7.8 | ||
| Insurance | 5.9 | ||
| Oil & Gas | 5.5 | ||
| Food | 5.2 | ||
| TOTAL | 35.1% |
| Description | Number
of Contracts |
Expiration
Date |
Notional
Amount |
Value | Unrealized
Appreciation/ Depreciation | |||||
| Mini MSCI EAFE (long) | 433 | 09/20/2019 | $40,653,052 | $41,639,445 | $986,393 |
| Description | Level
1 – Quoted Prices |
Level
2 – Other Significant Observable Inputs |
Level
3 – Significant Unobservable Inputs |
Total | ||||
| ASSETS: | ||||||||
| INVESTMENTS: | ||||||||
|
Common
Stocks |
$3,290,171,523 | $— | $— | $3,290,171,523 | ||||
|
Rights |
271,049 | — | — | 271,049 | ||||
|
Short-Term
Investments |
64,256,760 | — | — | 64,256,760 | ||||
|
TOTAL
INVESTMENTS |
$3,354,699,332 | $— | $— | $3,354,699,332 | ||||
| OTHER FINANCIAL INSTRUMENTS: | ||||||||
|
Futures
Contracts(a) |
986,393 | — | — | 986,393 | ||||
|
TOTAL OTHER FINANCIAL
INSTRUMENTS: |
$ 986,393 | $— | $— | $ 986,393 | ||||
|
TOTAL INVESTMENTS AND OTHER FINANCIAL
INSTRUMENTS |
$3,355,685,725 | $— | $— | $3,355,685,725 |
| (a) | Futures Contracts are valued at unrealized appreciation (depreciation). |
| Number
of Shares Held at 12/31/18 |
Value
at 12/31/18 |
Cost
of Purchases |
Proceeds
from Shares Sold |
Realized
Gain (Loss) |
Change
in Unrealized Appreciation/ Depreciation |
Number
of Shares Held at 6/30/19 |
Value
at 6/30/19 |
Dividend
Income | |||||||||
|
State Street Institutional U.S. Government Money Market Fund, Class G
Shares |
— | $ — | $279,620,852 | $263,738,639 | $— | $— | 15,882,213 | $15,882,213 | $258,527 | ||||||||
|
State Street Navigator Securities Lending Portfolio
II |
28,671,050 | 28,671,050 | 331,154,159 | 311,450,662 | — | — | 48,374,547 | 48,374,547 | 456,956 | ||||||||
|
Total |
$28,671,050 | $610,775,011 | $575,189,301 | $— | $— | $64,256,760 | $715,483 |
| ASSETS | |
|
Investments in unaffiliated issuers, at
value* |
$3,290,442,572 |
|
Investments in affiliated issuers, at
value |
64,256,760 |
|
Total
Investments |
3,354,699,332 |
|
Foreign currency, at
value |
12,785,766 |
|
Cash at
broker |
1,168,735 |
|
Cash |
179 |
|
Receivable from broker — accumulated variation margin on open futures
contracts |
987,640 |
|
Receivable for investments
sold |
34,896 |
|
Dividends receivable — unaffiliated
issuers |
6,384,771 |
|
Dividends receivable — affiliated
issuers |
34,430 |
|
Securities lending income receivable — unaffiliated
issuers |
9,859 |
|
Securities lending income receivable — affiliated issuers
|
132,024 |
|
Receivable for foreign taxes
recoverable |
8,758,606 |
|
TOTAL ASSETS
|
3,384,996,238 |
| LIABILITIES | |
|
Payable upon return of securities
loaned |
48,374,547 |
|
Advisory fee
payable |
337,963 |
|
Custodian fees
payable |
35,136 |
|
Trustees’ fees and expenses
payable |
145 |
|
Professional fees
payable |
27,099 |
|
Printing and postage fees
payable |
453 |
|
Accrued expenses and other
liabilities |
229 |
|
TOTAL LIABILITIES
|
48,775,572 |
|
NET ASSETS
|
$3,336,220,666 |
| COST OF INVESTMENTS: | |
|
Investments in unaffiliated
issuers |
$3,016,000,578 |
|
Investments in affiliated
issuers |
64,256,760 |
|
Total cost of
investments |
$3,080,257,338 |
|
Foreign currency, at
cost |
$ 12,741,460 |
|
* Includes investments in securities on loan, at
value |
$ 65,306,594 |
| INVESTMENT INCOME | |
|
Interest income — unaffiliated
issuers |
$ 27,041 |
|
Dividend income — unaffiliated
issuers |
78,745,142 |
|
Dividend income — affiliated
issuers |
258,527 |
|
Unaffiliated securities lending
income |
113,139 |
|
Affiliated securities lending
income |
456,956 |
|
Foreign taxes
withheld |
(6,502,005) |
|
TOTAL INVESTMENT INCOME
(LOSS) |
73,098,800 |
| EXPENSES | |
|
Advisory
fee |
1,904,948 |
|
Administration and custody
fees |
202,904 |
|
Trustees’ fees and expenses
|
49,297 |
|
Professional fees and
expenses |
82,928 |
|
Printing and postage
fees |
7,680 |
|
Insurance
expense |
8,584 |
|
Miscellaneous
expenses |
19,094 |
|
TOTAL
EXPENSES |
2,275,435 |
|
NET INVESTMENT INCOME
(LOSS) |
$ 70,823,365 |
| REALIZED AND UNREALIZED GAIN (LOSS) | |
| Net realized gain (loss) on: | |
|
Investments — unaffiliated
issuers |
(10,893,906) |
|
Foreign currency
transactions |
137,012 |
|
Futures
contracts |
3,298,255 |
|
Net realized gain
(loss) |
(7,458,639) |
| Net change in unrealized appreciation/depreciation on: | |
|
Investments — unaffiliated
issuers |
338,412,624 |
|
Foreign currency
translations |
150,854 |
|
Futures
contracts |
2,097,090 |
|
Net change in unrealized
appreciation/depreciation |
340,660,568 |
|
NET REALIZED AND UNREALIZED GAIN
(LOSS) |
333,201,929 |
|
NET INCREASE (DECREASE) IN NET ASSETS FROM
OPERATIONS |
$404,025,294 |
| Six
Months Ended 6/30/19 (Unaudited) |
Year
Ended 12/31/18 | ||
| INCREASE (DECREASE) IN NET ASSETS FROM OPERATIONS: | |||
|
Net investment income
(loss) |
$ 70,823,365 | $ 88,501,943 | |
|
Net realized gain
(loss) |
(7,458,639) | (25,894,912) | |
|
Net change in unrealized
appreciation/depreciation |
340,660,568 | (497,102,616) | |
|
Net increase (decrease) in net assets resulting from
operations |
404,025,294 | (434,495,585) | |
| FROM BENEFICIAL INTEREST TRANSACTIONS: | |||
|
Contributions |
263,601,817 | 960,880,616 | |
|
Withdrawals |
(140,916,730) | (572,543,741) | |
|
Net increase (decrease) in net assets from capital transactions
|
122,685,087 | 388,336,875 | |
|
Net increase (decrease) in net assets during the
period |
526,710,381 | (46,158,710) | |
|
Net assets at beginning of
period |
2,809,510,285 | 2,855,668,995 | |
|
NET ASSETS AT END OF
PERIOD |
$3,336,220,666 | $2,809,510,285 |
| Six
Months Ended 6/30/19 (Unaudited) |
Year
Ended 12/31/18 |
Year
Ended 12/31/17 |
For
the Period 4/29/16* - 12/31/16 | ||||
|
Total return
(a) |
14.22% | (13.83)% | 25.25% | 1.00% | |||
| Ratios and Supplemental Data: | |||||||
|
Net assets, end of period (in
000s) |
$3,336,221 | $2,809,510 | $2,855,669 | $1,981,065 | |||
| Ratios to average net assets: | |||||||
|
Total
expenses |
0.15%(b) | 0.15% | 0.14% | 0.15%(b) | |||
|
Net investment income
(loss) |
4.55%(b) | 2.96% | 2.80% | 2.57%(b) | |||
|
Portfolio turnover
rate |
2%(c) | 14% | 4% | 1%(c) |
| * | Commencement of operations. |
| (a) | Total return for periods of less than one year are not annualized. Results represent past performance and is not indicative of future results. |
| (b) | Annualized. |
| (c) | Not annualized. |
| Asset Derivatives | |||||||||||
| Interest
Rate Contracts Risk |
Foreign
Exchange Contracts Risk |
Credit
Contracts Risk |
Equity
Contracts Risk |
Commodity
Contracts Risk |
Total | ||||||
|
Futures
Contracts |
$— | $— | $— | $987,640 | $— | $987,640 | |||||
| Net Realized Gain (Loss) | |||||||||||
| Interest
Rate Contracts Risk |
Foreign
Exchange Contracts Risk |
Credit
Contracts Risk |
Equity
Contracts Risk |
Commodity
Contracts Risk |
Total | ||||||
|
Futures
Contracts |
$— | $— | $— | $3,298,255 | $— | $3,298,255 | |||||
| Net Change in Unrealized Appreciation (Depreciation) | |||||||||||
| Interest
Rate Contracts Risk |
Foreign
Exchange Contracts Risk |
Credit
Contracts Risk |
Equity
Contracts Risk |
Commodity
Contracts Risk |
Total | ||||||
|
Futures
Contracts |
$— | $— | $— | $2,097,090 | $— | $2,097,090 | |||||
| Purchases | Sales | ||
|
State Street International Developed Equity Index
Portfolio |
$282,418,778 | $53,807,437 |
| Tax
Cost |
Gross
Unrealized Appreciation |
Gross
Unrealized Depreciation |
Net
Unrealized Appreciation (Depreciation) | ||||
|
State Street International Developed Equity Index
Portfolio |
$3,080,257,338 | $492,218,467 | $216,790,080 | $275,428,387 |
| Fund | Market
Value of Securities on Loan |
Cash
Collateral Received |
Non-Cash
Collateral Received* |
Total
Collateral Received | ||||
|
State Street International Developed Equity Index
Portfolio |
$ 65,306,594 | $ 48,374,547 | $ 20,179,102 | $ 68,553,649 |
| * | The non-cash collateral includes U.S. Treasuries and U.S. Government Agency securities. |
| Remaining
Contractual Maturity of the Agreements As of June 30, 2019 | ||||||||||||||
| Fund | Securities
Lending Transactions |
Overnight
and Continuous |
<30 Days | Between
30 & 90 Days |
>90 Days | Total
Borrowings |
Gross
Amount of Recognized Liabilities for Securities Lending Transactions | |||||||
|
State Street International Developed Equity Index
Portfolio |
Common Stocks | $48,374,547 | $— | $— | $— | $48,374,547 | $48,374,547 | |||||||
| Actual | Hypothetical
(assuming a 5% return before expenses) | ||||||||
| Annualized
Expense Ratio |
Ending
Account Value |
Expenses
Paid During Period(a) |
Ending
Account Value |
Expenses
Paid During Period(a) | |||||
|
State Street International Developed Equity Index
Portfolio |
0.15% | $1,142.20 | $0.80 | $1,024.10 | $0.75 | ||||
| (a) | Expenses are equal to the Portfolio's annualized net expense ratio multiplied by the average account value of the period, multiplied by 181, then divided by 365. |
| • | A report prepared by an independent third-party provider of investment company data, which includes: |
| • | Comparative information concerning fees charged by the Adviser for managing institutional accounts using investment strategies and techniques similar to those used in managing the HIDE Fund; and |
| • | Profitability analyses for (a) the Adviser with respect to the Portfolio and (b) affiliates of the Adviser that provide services to the Portfolio (“Affiliated Service Providers”). |
| • | Descriptions of the investment management services provided by the Adviser, including its investment strategies and processes; |
| • | Information concerning the allocation of brokerage; and |
| • | Information regarding the procedures and processes used to value the assets of the Portfolio. |
| • | Reports detailing the financial results and condition of the Adviser and its affiliates; |
| • | Descriptions of the qualifications, education and experience of the individual investment and other professionals responsible for managing the portfolio of the Portfolio and for Portfolio operations; |
| • | Information relating to compliance with and the administration of the Code of Ethics adopted by the Adviser; |
| • | A copy of the Adviser’s proxy voting policies and procedures and other information regarding the Adviser’s practices for overseeing proxy vendors; |
| • | Information concerning the resources devoted by the Adviser to overseeing compliance by the Portfolio and its service providers, including information concerning compliance with investment policies and restrictions and other operating policies of the Portfolio; |
| • | A description of the adequacy and sophistication of the Adviser’s technology and systems with respect to investment and administrative matters and a description of any material improvements or changes in technology or systems in the past year; |
| • | A description of the business continuity and disaster recovery plans of the Adviser; and |
| • | Information regarding the Adviser’s risk management processes. |
| • | Information concerning the nature, extent, quality and cost of services provided to the Portfolio by SSGA FM in its capacity as the Portfolio’s administrator (the “Administrator”); |
| • | Information concerning the nature, extent, quality and cost of various non-investment management services provided to the Portfolio by affiliates of the Adviser, including the custodian, sub-administrator, fund accountant, transfer agent and securities lending agent of the Portfolio, and the role of the Adviser in managing the Portfolio’s relationship with these service providers; |
| • | Copies of the Advisory Agreement and agreements with other service providers of the Portfolio; |
| • | Draft responses to a letter from independent legal counsel to the Independent Trustees (“Independent Counsel”), reviewed prior to such date by Independent Counsel, requesting specific information from each of: |
| • | Information from SSGA FM, State Street and the Distributor with respect to the Trust providing any material changes to the previous information supplied in response to the letter from Independent Counsel prior to the executive session of the Board on May 15, 2019; |
| • | Materials provided by Broadridge, circulated to the Independent Trustees and to Independent Counsel, with respect to the Funds; and |
| • | A summary of the foregoing materials prepared by Independent Counsel. |
| State Street China Equity Select Fund |

|
|
1 |
|
|
2 |
|
|
4 |
|
|
5 |
|
|
6 |
|
|
7 |
|
|
8 |
|
|
13 |
| % of Net Assets | |||
| Common Stocks | 96.1% | ||
| Short-Term Investment | 3.1 | ||
| Other Assets in Excess of Liabilities | 0.8 | ||
| TOTAL | 100.0% |
| Description | % of Net Assets | ||
| Consumer Discretionary | 30.8% | ||
| Communication Services | 24.9 | ||
| Financials | 24.3 | ||
| Consumer Staples | 5.9 | ||
| Real Estate | 3.6 | ||
| TOTAL | 89.5% |
| Description | Level
1 – Quoted Prices |
Level
2 – Other Significant Observable Inputs |
Level
3 – Significant Unobservable Inputs |
Total | ||||
| ASSETS: | ||||||||
| INVESTMENTS: | ||||||||
|
Common
Stocks |
$5,194,733 | $— | $— | $5,194,733 | ||||
|
Short-Term
Investment |
168,645 | — | — | 168,645 | ||||
|
TOTAL
INVESTMENTS |
$5,363,378 | $— | $— | $5,363,378 |
| Number
of Shares Held at 5/30/19* |
Value
at 5/30/19* |
Cost
of Purchases |
Proceeds
from Shares Sold |
Realized
Gain (Loss) |
Change
in Unrealized Appreciation/ Depreciation |
Number
of Shares Held at 6/30/19 |
Value
at 6/30/19 |
Dividend
Income | |||||||||
|
State Street Institutional U.S. Government Money Market Fund, Class G
Shares |
— | $— | $353,109 | $184,464 | $— | $— | 168,645 | $168,645 | $270 |
| * | Commencement of operations. |
| ASSETS | |
|
Investments in unaffiliated issuers, at
value* |
$5,194,733 |
|
Investments in affiliated issuers, at
value |
168,645 |
|
Total
Investments |
5,363,378 |
|
Foreign currency, at
value |
56,491 |
|
Dividends receivable — unaffiliated
issuers |
15,393 |
|
Dividends receivable — affiliated
issuers |
270 |
|
Receivable from
Adviser |
8,008 |
|
TOTAL ASSETS
|
5,443,540 |
| LIABILITIES | |
|
Payable for investments
purchased |
26,504 |
|
Advisory fee
payable |
3,835 |
|
Administration fees
payable |
213 |
|
Trustees’ fees and expenses
payable |
1,528 |
|
Professional fees
payable |
5,758 |
|
Printing and postage fees
payable |
17 |
|
Accrued expenses and other
liabilities |
17 |
|
TOTAL LIABILITIES
|
37,872 |
|
NET ASSETS
|
$5,405,668 |
| NET ASSETS CONSIST OF: | |
|
Paid-in
Capital |
$5,000,000 |
|
Total distributable earnings
(loss) |
405,668 |
|
NET ASSETS
|
$5,405,668 |
| Class K | |
|
Net
Assets |
$5,405,668 |
|
Shares
Outstanding |
500,000 |
|
Net asset value, offering and redemption price per
share |
$ 10.81 |
| COST OF INVESTMENTS: | |
|
Investments in unaffiliated
issuers |
$4,809,322 |
|
Investments in affiliated
issuers |
168,645 |
|
Total cost of
investments |
$4,977,967 |
|
Foreign currency, at
cost |
$ 56,600 |
| INVESTMENT INCOME | |
|
Dividend income — unaffiliated
issuers |
26,815 |
|
Dividend income — affiliated
issuers |
270 |
|
Foreign taxes
withheld |
(2,327) |
|
TOTAL INVESTMENT INCOME
(LOSS) |
24,758 |
| EXPENSES | |
|
Advisory
fee |
3,959 |
|
Administration
fees |
220 |
|
Custodian
fees |
686 |
|
Trustees’ fees and expenses
|
1,529 |
|
Registration and filing
fees |
41 |
|
Professional fees and
expenses |
5,758 |
|
Printing and postage
fees |
17 |
|
Miscellaneous
expenses |
16 |
|
TOTAL
EXPENSES |
12,226 |
|
Expenses waived/reimbursed by the
Adviser |
(8,268) |
|
NET
EXPENSES |
3,958 |
|
NET INVESTMENT INCOME
(LOSS) |
$ 20,800 |
| REALIZED AND UNREALIZED GAIN (LOSS) | |
| Net realized gain (loss) on: | |
|
Investments — unaffiliated
issuers |
(899) |
|
Foreign currency
transactions |
452 |
|
Net realized gain
(loss) |
(447) |
| Net change in unrealized appreciation/depreciation on: | |
|
Investments — unaffiliated
issuers |
385,411 |
|
Foreign currency
translations |
(96) |
|
Net change in unrealized
appreciation/depreciation |
385,315 |
|
NET REALIZED AND UNREALIZED GAIN
(LOSS) |
384,868 |
|
NET INCREASE (DECREASE) IN NET ASSETS FROM
OPERATIONS |
$405,668 |
| For
the Period 5/29/19 * - 6/30/19 (Unaudited) | |
| INCREASE (DECREASE) IN NET ASSETS FROM OPERATIONS: | |
|
Net investment income
(loss) |
$ 20,800 |
|
Net realized gain
(loss) |
(447) |
|
Net change in unrealized
appreciation/depreciation |
385,315 |
|
Net increase (decrease) in net assets resulting from
operations |
405,668 |
| FROM BENEFICIAL INTEREST TRANSACTIONS: | |
|
Proceeds from sale of shares
sold |
5,000,000 |
|
Net increase (decrease) in net assets from beneficial interest transactions
|
5,000,000 |
|
Net increase (decrease) in net assets during the
period |
5,405,668 |
|
Net assets at beginning of
period |
— |
|
NET ASSETS AT END OF
PERIOD |
$5,405,668 |
| SHARES OF BENEFICIAL INTEREST: | |
|
Shares
sold |
500,000 |
|
Net increase (decrease) from share
transactions |
500,000 |
| * | Inception date. |
| Class K | |
| For
the Period 5/30/19* - 6/30/19 (Unaudited) | |
|
Net asset value, beginning of
period |
$10.00 |
| Income (loss) from investment operations: | |
|
Net investment income (loss)
(a) |
0.04 |
|
Net realized and unrealized gain
(loss) |
0.77 |
|
Total from investment
operations |
0.81 |
|
Net asset value, end of
period |
$10.81 |
|
Total return
(b) |
8.10% |
| Ratios and Supplemental Data: | |
|
Net assets, end of period (in
000s) |
$5,406 |
| Ratios to average net assets: | |
|
Total
expenses |
2.78%(c) |
|
Net
expenses |
0.90%(c) |
|
Net investment income
(loss) |
4.73%(c) |
|
Portfolio turnover
rate |
5%(d) |
| * | Commencement of operations. |
| (a) | Per share numbers have been calculated using average shares outstanding, which more appropriately presents the per share data for the period. |
| (b) | Total return is calculated assuming a purchase of shares at net asset value on the first day and a sale at net asset value on the last day of each period reported. Distributions are assumed, for the purpose of this calculation, to be reinvested at net asset value per share on the respective payment dates. Total return for periods of less than one year is not annualized. Results represent past performance and are not indicative of future results. |
| (c) | Annualized. |
| (d) | Not annualized. |
| Fund | Classes | Commencement
of Operations |
Diversification
Classification |
| State Street China Equity Select Fund | Class K | May 30, 2019 | Non-Diversified |
| Fund | Number of 10% Affiliated Account Holders | Percentage of Affiliated Ownership | ||
|
State Street China Equity Select
Fund |
1 | 100.00% |
| Purchases | Sales | ||
|
State Street China Equity Select
Fund |
$5,036,735 | $226,514 |
| Tax
Cost |
Gross
Unrealized Appreciation |
Gross
Unrealized Depreciation |
Net
Unrealized Appreciation (Depreciation) | ||||
|
State Street China Equity Select
Fund |
$4,977,967 | $394,352 | $8,941 | $385,411 |
| Actual | Hypothetical
(assuming a 5% return before expenses) | ||||||||
| Annualized
Expense Ratio |
Ending
Account Value |
Expenses
Paid During Period(a) |
Ending
Account Value |
Expenses
Paid During Period(a) | |||||
|
State Street China Equity Select
Fund |
0.90% | $1,081.00 | $0.80(b) | $1,020.30 | $4.51 | ||||
| (a) | Expenses are equal to the Fund's annualized net expense ratio multiplied by the average account value of the period, multiplied by 181, then divided by 365. |
| (b) | Actual period is from commencement of operations on 5/30/19. |
| • | A comparison of the New Fund’s estimated expense ratio (with detail of component expenses) to the expense ratios of a group of comparable mutual funds selected by the independent third-party data provider (the “Expense Group” and/or “Expense Universe”); |
| • | A comparison of the New Fund’s contractual and estimated actual management fees and estimated total expense ratio to the contractual and actual management fees and total expense ratios of the Expense Group and Expense Universe; |
| • | Comparative information concerning the fees charged by the Adviser for managing institutional accounts using investment strategies and techniques similar to those to be used in managing the New Fund; and |
| • | Profitability analyses for (a) the Adviser with respect to Other Funds and (b) affiliates of the Adviser that provide services to the Other Funds. The Independent Trustees also took into account management’s discussions of the anticipated profitability of the New Fund to the Adviser and its affiliates in the New Fund’s first year of operations. |
| • | Descriptions of the investment management services to be provided by the Adviser to the New Fund as well as services provided to the Other Funds, including its investment strategies and processes; |
| • | Information concerning the allocation of brokerage; and |
| • | Information regarding the procedures and processes to be used to value the assets of the New Fund. |
| • | Reports detailing the financial results and condition of the Adviser and its affiliates; |
| • | Descriptions of the qualifications, education and experience of the individual investment professionals who will be responsible for managing the portfolio of the New Fund; |
| • | Information relating to compliance with and the administration of the Code of Ethics adopted by the Adviser; |
| • | Information about the Adviser’s proxy voting policies and procedures and information regarding the Adviser’s practices for overseeing proxy vendors; |
| • | Information concerning the resources to be devoted by the Adviser to overseeing compliance by the New Fund and its service providers, including the Adviser’s record of compliance with investment policies and restrictions and other operating policies of the Other Funds; |
| • | A description of the adequacy and sophistication of the Adviser’s technology and systems with respect to investment and administrative matters and a description of any material improvements or changes in technology or systems in the past year; |
| • | A description of the business continuity and disaster recovery plans of the Adviser; and |
| • | Information regarding the Adviser’s risk management processes. |
| • | Information concerning the nature, extent, quality and cost of various services to be provided to the New Fund by SSGA FM in its capacity as administrator; |
| • | Information concerning the nature, extent, quality and cost of various non-investment management services to be provided to the New Fund by affiliates of SSGA FM, including the custodian, sub-administrator and fund accountant of the New Fund, and the role of SSGA FM in managing the New Fund’s relationships with these service providers; |
| • | Copies of the Advisory Agreement and agreements with other service providers of the New Fund; |
| • | Draft responses to a letter from Independent Counsel reviewed prior to such date by Independent Counsel, requesting specific information regarding the Other Funds, certain of which was applicable to the New Fund, from each of: |
State Street Bank and Trust Company
P.O. Box 5049
Boston, MA 02206
| Item 2. | Code of Ethics. |
Not applicable to this filing.
| Item 3. | Audit Committee Financial Expert. |
Not applicable to this filing.
| Item 4. | Principal Accountant Fees and Services. |
Not applicable to this filing.
| Item 5. | Audit Committee of Listed Registrants. |
Not applicable to the Registrant.
| Item 6. | Investments. |
(a) Schedules of Investments are included as part of the reports to shareholders filed under Item 1 of this Form N-CSR.
(b) Not applicable to the Registrant.
| Item 7. | Disclosure of Proxy Voting Policies and Procedures for Closed-End Management Investment Companies. |
Not applicable to the Registrant.
| Item 8. | Portfolio Managers of Closed-End Management Investment Companies. |
Not applicable to the Registrant.
| Item 9. | Purchases of Equity Securities by Closed-End Management Investment Company and Affiliated Purchasers. |
Not applicable to the Registrant.
| Item 10. | Submission of Matters to a Vote of Security Holders. |
There were no material changes to the procedures by which shareholders may recommend nominees to the Registrant’s Board of Trustees.
| Item 11. | Controls and Procedures. |
(a) The Trust’s principal executive officer and principal financial officer have concluded that the Trust’s disclosure controls and procedures (as defined in Rule 30a-3(c) under the Investment Company Act of 1940, as amended (the “1940 Act”)) are effective to provide reasonable
assurance that information required to be disclosed by the Registrant on Form N-CSR is recorded, processed, summarized and reported as of a date within 90 days of the filing date of this report, based on their evaluation of these controls and procedures required by Rule 30a-3(b) under the 1940 Act and Rules 13a-15(b) or 15d-15(b) under the Securities Exchange Act of 1934, as amended.
(b) There were no changes in the Trust’s internal control over financial reporting (as defined in Rule 30a-3(d) under the 1940 Act) that occurred during the period covered by this Form N-CSR filing that have materially affected, or are reasonably likely to materially affect, the Trust’s internal control over financial reporting.
| Item 12. | Disclosure of Securities Lending Activities for Closed-End Management Investment Companies. |
(a) Not applicable to the Registrant.
(b) Not applicable to the Registrant.
| Item 13. | Exhibits. |
| (a)(1) | Not applicable; this Form N-CSR is a Semi-Annual Report. |
| (a)(2) | Certifications of principal executive officer and principal financial and accounting officer of the Trust as required by Rule 30a-2(a) under the 1940 Act are attached hereto. |
| (a)(3) | Not applicable to the Registrant. |
| (a)(4) | Not applicable. |
| (b) | Certifications of principal executive officer and principal financial and accounting officer of the Trust as required by Rule 30a-2(b) under the 1940 Act and Section 906 of the Sarbanes-Oxley Act of 2002 are attached hereto. |
SIGNATURES
Pursuant to the requirements of the Securities Exchange Act of 1934 and the Investment Company Act of 1940, the Registrant has duly caused this report to be signed on its behalf by the undersigned, thereunto duly authorized.
| Registrant: | STATE STREET INSTITUTIONAL INVESTMENT TRUST | |
| By: | /s/ Ellen M. Needham | |
| Ellen M. Needham | ||
| President | ||
| Date: | September 5, 2019 | |
Pursuant to the requirements of the Securities Exchange Act of 1934 and the Investment Company Act of 1940, this report has been signed below by the following persons on behalf of the Registrant and in the capacities and on the dates indicated.
| By: | /s/ Ellen M. Needham | |
| Ellen M. Needham | ||
| President (Principal Executive Officer) | ||
| Date: | September 5, 2019 | |
| By: | /s/ Bruce S. Rosenberg | |
| Bruce S. Rosenberg | ||
| Treasurer (Principal Financial and Accounting Officer) | ||
| Date: | September 5, 2019 | |