UNITED STATES
SECURITIES AND EXCHANGE COMMISSION
Washington, D.C. 20549
SECURITIES AND EXCHANGE COMMISSION
Washington, D.C. 20549
FORM N-CSR
CERTIFIED SHAREHOLDER REPORT OF REGISTERED
MANAGEMENT INVESTMENT COMPANIES
Investment Company Act file number 811-09821
Allied Asset Advisors Funds
(Exact name of registrant as specified in charter)
(Exact name of registrant as specified in charter)
715 Enterprise Drive, Suite 100
Oak Brook, IL 60523
(Address of principal executive offices) (Zip code)
(Address of principal executive offices) (Zip code)
Bassam Osman
Allied Asset Advisors Funds
715 Enterprise Drive, Suite 100
Oak Brook, IL 60523
(Name and address of agent for service)
(Name and address of agent for service)
(877)-417-6161
Registrant's telephone number, including area code
Date of fiscal year end: May 31, 2019
Date of reporting period: May 31, 2019
Item 1. Reports to Stockholders.
Annual Report
May 31, 2019
Trading Symbol: IMANX
Beginning on January 1, 2021, as permitted by regulations adopted by the U.S. Securities and Exchange Commission, paper copies of the Fund’s shareholder reports will no longer be sent by
mail, unless you specifically request paper copies of the reports. Instead, the reports will be made available on the Fund’s website (www.investaaa.com), and you will be notified by mail each time a report is posted and provided with a website link
to access the report.
If you already elected to receive shareholder reports electronically, you will not be affected by this change and you need not take any action. You may elect to receive shareholder reports and
other communications from the Fund electronically anytime by contacting your financial intermediary (such as a broker-dealer or a bank) or, if you are a direct investor, by calling
1-888-FUNDS-85 (1-888-386-3785).
You may elect to receive all future reports in paper free of charge. If you invest through a financial intermediary, you can contact your financial intermediary to request that you continue to
receive paper copies of your shareholder reports. If you invest directly with the Fund, you can call 1-888-FUNDS-85 (1-888-386-3785) to let the Fund know you wish to continue receiving paper copies of your shareholder reports. Your election to
receive reports in paper will apply to all funds that you hold through the financial intermediary, or directly with the Iman Fund.
IMAN FUND
July 17,2019
Dear Shareholder,
Assalamu Alaykum (Greetings of Peace),
I am pleased to report that Iman Fund (the Fund) has done relatively well in the year ending on May 31 ,2019. The Fund returned 2.72% in that period. The Fund outperformed the Dow Jones Islamic Market World Index (DJIM) which returned 0.38%, and
the Fund also outperformed the Wilshire 5000 Index which returned 2.53%. For longer periods performance, the Fund outperformed the Dow Jones Islamic Market World Index (DJIM) for the 3-year, 5-year and 10-year periods returning annually 14.66%,
11.12% and 13.15% respectively as compared to the annual returns of 10.67%, 7.20%, and 10.74% respectively for the Dow Jones Islamic Market World Index (DJIM). Regulatory note: The Performance data quoted represents
past performance and does not guarantee future results. Investment return and principal value will vary, and shares may be worth more or less at redemption than at original purchase. Call 877-417-6161 or visit us at www.imanfund.com for the most recent month-end performance data. A more current performance may be lower or higher than the performance data quoted which is for periods ending on May 31,
2019. Gross Expense Ratio is 1.33%.
The year ending on May 31, 2019 was mildly profitable for the U.S. equity market. But the market went through periods of extremely volatility. Federal Reserve policy uncertainties, U.S. trade disputes especially with China, and growth concerns
caused sharp swings in investor sentiment. During the final months of 2018, markets sold off steeply. The S&P 500 Index returned -6.94% in October 2018, at the time its largest monthly drop in seven years. This was outdone by a decline of -9.18%
in December. The market improved with the reopening of the government shutdown, but it declined again in May 2019.
Investors worried that the Federal Reserve tightening of interest rates would affect U.S. economic growth and thus hinder global growth. Trade uncertainty and global economic data further unsettled market participants. However, U.S. economic data
continued to be healthy and financial conditions improved. The global growth outlook brightened, helped by a contained U.S. dollar, optimism about an eventual resolution to global trade disputes, and data supporting the view that China’s economy
could achieve a soft landing. Against this backdrop, stocks underwent a healthy recovery.
Among U.S. stocks, cyclical growth-oriented sectors tended to outperform the more defensive, value-oriented areas, while large-cap stocks generally outperformed their smaller-cap counterparts. The information technology sector led the market’s
advance which helped the Fund. It was followed by communication services, consumer discretionary and consumer staples and then industrials, utilities, materials, real estate and energy sectors. The health care sector did not perform as well, as
potential regulatory changes caused declines in health care services providers and, to a lesser extent, pharmaceutical manufacturers and biotechnology developers. This detracted from the Fund’s performance.
U.K. stocks lagged significantly, undermined by concerns related to Brexit, the impending British exit from the European Union. But international stocks generally mirrored U.S. market performance as monetary policy eased and hopes arose for a
resolution to trade tensions between the United States and China. Eurozone economic growth remained anemic, and European stock markets delivered less returns than U.S. equities. Gains in Asian equities also trailed behind those of the U.S., largely
due to muted returns from Japanese equities and evidence of slowing Chinese economic growth. The Fund is underweighted in international stocks which helped its performance as compared to the Dow Jones Islamic Market World Index but detracted from its
performance as compared to the Wilshire 5000 Index (the Fund still outperformed both indexes).
Outlook: Clearly, the U.S. economy contains real fundamental strengths. Unemployment is low, inflation is contained and corporate earnings are healthy. Consumer spending will probably continue to fuel
growth, as consumers benefit from wage growth. Economic data looks more encouraging than it did at the start of year 2019. The economy may well see a pickup in the second half of the year, with accommodative global monetary policy, a contained dollar
and U.S. growth providing tailwinds. However, the outcome of the U.S.-China trade dispute will influence what will happen next, but a resolution is reasonably within reach. Ongoing economic growth sets the stage for additional upside in stocks. Yet,
despite the favorable economic backdrop, we believe the Fund should be prepared for volatility and episodic selloffs, such as the downturn that occurred in May of 2019. A variety of political and geopolitical uncertainties—including tensions in the
Middle East, election unknowns, and trade—are likely to stoke turbulence. Nevertheless, the flipside of volatility is opportunity.
After God, we rely on our careful research and risk-management strategies. We believe Iman Fund offers a time-tested track record that follows an active approach, seeking companies with a sustained, underestimated earnings and reasonable or good
growth profile as well as value-added discipline and adherence to Islamic rules. We look forward to providing you, as an Iman Fund valuable shareholder, with sharply focused experienced and disciplined fund management that we believe underpins an
effective, long-term investment strategy.
2
IMAN FUND
At the Iman Fund we take our mission to give investors the best chance of investment success while adhering to Islamic principles seriously. Our work is grounded in maintaining perspective, long term discipline and vigilance. We thank you for
entrusting your assets to us and giving us the opportunity to help you reach your financial goals in the years to come.
Very Truly Yours,
Bassam Osman, President
Past performance does not guarantee future results.
The above discussion and analysis of the Fund reflect the opinions of the Adviser as of July 2019, are subject to change and any forecasts made cannot be guaranteed and should not be considered investment advice.
Mutual Fund investing involves risk; principal loss is possible. The Fund invests in foreign securities which involve greater volatility and political, economic and currency risks and differences in accounting methods.
Historically, the Adviser believes that the Islamic restrictions placed on the Fund have not adversely affected the Fund; however, it is possible that these restrictions may result in the Fund not performing as well as mutual funds not subject to
such restrictions. Investments in smaller companies involve additional risk, such as limited liquidity and greater volatility.
The Dow Jones Islamic Market USA Index is a diversified compilation of U.S. equity securities considered by Dow Jones to be in compliance with Islamic principles. The Dow Jones Islamic Market World Index measures the global universe of investable
equities considered by Dow Jones to be in compliance with Islamic principles. The benchmark for the Fund is a 50/50 blend of the Dow Jones Islamic Market USA Index and Dow Jones Islamic Market World Index. The S&P 500 Index is a broad based
unmanaged index of 500 stocks, which is widely recognized as representative of the equity market in general. The Wilshire 5000 Total Market Index is a market capitalization-weighted index composed of more than 6,700 publicly-traded companies that are
headquartered in the United States, are actively traded on an American stock exchange and have pricing information that is widely available to the public. You cannot invest directly in an index.
Growth stocks typically are more volatile than value stocks, however, value stocks have a lower expected growth rate in earnings and sales.
A Basis Point is equal to 1/100th of 1% (0.0001).
Fund holdings and sector allocations are subject to change and should not be considered a recommendation to buy or sell any security. For a complete list of Fund holdings, please refer to the Schedule of Investments included in this report.
3
IMAN FUND
EXPENSE EXAMPLE
May 31, 2019 (Unaudited)
As a shareholder of the Iman Fund (the “Fund”), you incur two types of costs: (1) transaction costs and (2) ongoing costs, including management fees and other Fund expenses. This Example is intended to help you understand your ongoing costs (in
dollars) of investing in the Fund and to compare these costs with the ongoing costs of investing in other mutual funds. The Example is based on an investment of $1,000 invested at the beginning of the period and held for the entire period (12/1/2018
- 5/31/2019).
Actual Expenses
The first line of the table below provides information about actual account values and actual expenses. Although the Fund charges no sales load or transaction fees, you will be assessed fees for outgoing wire transfers, returned checks and stop
payment orders at prevailing rates charged by U.S. Bancorp Fund Services, LLC, (doing business as U.S. Bank Global Fund Services), the Fund’s transfer agent. If you request a redemption be made by wire transfer, currently a $15.00 fee is charged by
the Fund’s transfer agent. IRA accounts will be charged a $15.00 annual maintenance fee. The example below includes, but is not limited to, management fees, fund accounting, custody and transfer agent fees. However, the example below does not
include portfolio trading commissions and related expenses, and other extraordinary expenses as determined under generally accepted accounting principles. You may use the information in this line, together with the amount you invested, to estimate
the expenses that you paid over the period. Simply divide your account value by $1,000 (for example, an $8,600 account value divided by $1,000 = 8.6), then multiply the result by the number in the first line under the heading entitled “Expenses Paid
During Period” to estimate the expenses you paid on your account during this period.
Hypothetical Example for Comparison Purposes
The second line of the table below provides information about hypothetical account values and hypothetical expenses based on the Fund’s actual expense ratio and an assumed rate of return of 5% per year before expenses, which is not the Fund’s
actual return. The hypothetical account values and expenses may not be used to estimate the actual ending account balance or expenses you paid for the period. You may use this information to compare the ongoing costs of investing in the Fund and
other funds. To do so, compare this 5% hypothetical example with the 5% hypothetical examples that appear in the shareholder reports of the other funds. Please note that the expenses shown in the table are meant to highlight your ongoing costs only
and do not reflect any transactional costs, such as sales charges (loads), redemption fees, or exchange fees. Therefore, the second line of the table is useful in comparing ongoing costs only, and will not help you determine the relative total costs
of owning different funds. In addition, if these transactional costs were included, your costs would have been higher. Please note that Iman Fund does not have any sales charge (loads), redemption fees, or exchange fees.
|
Beginning
|
Ending
|
Expenses Paid
|
|
|
Account Value
|
Account Value
|
During Period
|
|
|
12/1/18
|
5/31/19
|
12/1/18 - 5/31/19*
|
|
|
Actual
|
$1,000.00
|
$1,049.00
|
$7.15
|
|
Hypothetical (5% return before expenses)
|
1,000.00
|
1,017.95
|
7.04
|
|
*
|
Expenses are equal to the Fund’s annualized expense ratio of 1.40% multiplied by the average account value over the period multiplied by 182/365 (to reflect the one-half year period).
|
4
IMAN FUND
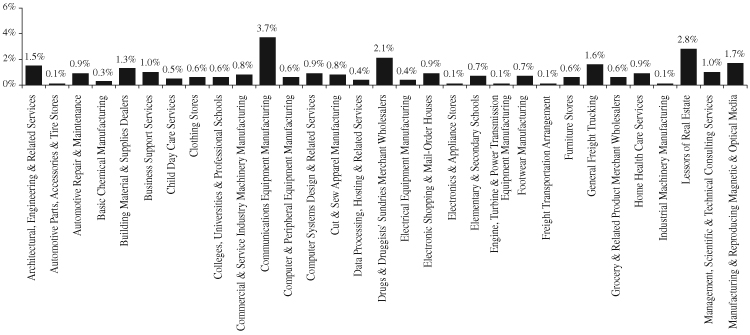
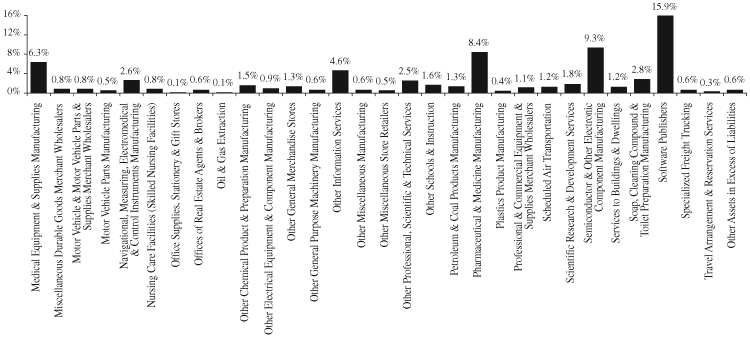
ALLOCATION OF PORTFOLIO ASSETS
(Calculated as a percentage of net assets)
May 31, 2019 (Unaudited)
5
IMAN FUND
Total Rate of Return
For the Period May 31, 2009 to May 31, 2019
(Unaudited)
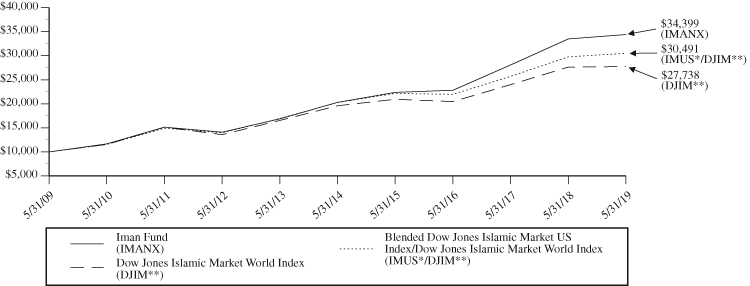
This chart assumes an initial investment of $10,000 made on May 31, 2009 and held through May 31, 2019.
Performance data quoted represents past performance and does not guarantee future results. The investment return and principal value of an investment will fluctuate so that an investor’s shares, when redeemed, may be
worth more or less than their original cost. Current performance of the Fund may be lower or higher than the performance quoted. Performance data current to the recent month end may be obtained by visiting www.investaaa.com.
Indices mentioned are unmanaged and used to measure stock markets. You cannot invest directly in an index.
The graph and table do not reflect the deduction of taxes that a shareholder would pay on Fund distributions or redemptions of Fund shares.
|
Six
|
One
|
Five
|
Ten
|
|
|
Average Annual Total Return as of May 31, 2019
|
Months
|
Year
|
Years
|
Years
|
|
Iman Fund
|
4.90%
|
2.72%
|
11.12%
|
13.15%
|
|
Dow Jones Islamic Market World Index**
|
2.66%
|
0.38%
|
7.20%
|
10.74%
|
|
Blended Dow Jones Islamic Market US Index*/
|
||||
|
Dow Jones Islamic Market World Index**
|
2.27%
|
2.43%
|
8.50%
|
11.78%
|
|
*
|
The Dow Jones Islamic Market US Index is a diversified compilation of U.S. equity securities considered by Dow Jones to be in compliance with Islamic principles. The index is
constructed from stocks in the Dow Jones Indexes (DJGI) family. Dow Jones believes that these stocks are accessible to investors and are well traded. The DJGI methodology removes issues that are not suitable for global investing. Prior to
July 31, 2013, the performance of the Dow Jones Islamic Market US Index does not include the reinvestment of dividends.
|
|
**
|
The Dow Jones Islamic Market World Index is a compilation of 56 country-level benchmark indexes considered by Dow Jones to be in compliance with Islamic principles. The index provides a
definitive standard for measuring stock market performance for Islamic investors on a global basis, in accordance with Dow Jones Indexes’ established index methodology.
|
6
IMAN FUND
SCHEDULE OF INVESTMENTS
May 31, 2019
(Classifications are based on the North American Industry Classification System)
|
Number of
|
|||||||
|
Shares
|
Value
|
||||||
|
COMMON STOCKS - 96.6%
|
|||||||
|
ARCHITECTURAL, ENGINEERING & RELATED SERVICES - 1.5%
|
|||||||
|
25,200
|
Tetra Tech, Inc.
|
$
|
1,701,504
|
||||
|
AUTOMOTIVE PARTS, ACCESSORIES & TIRE STORES - 0.1%
|
|||||||
|
380
|
O’Reilly Automotive, Inc. (a)
|
141,121
|
|||||
|
AUTOMOTIVE REPAIR & MAINTENANCE - 0.9%
|
|||||||
|
13,200
|
Monro, Inc.
|
1,052,172
|
|||||
|
BASIC CHEMICAL MANUFACTURING - 0.3%
|
|||||||
|
1,600
|
Air Products and Chemicals, Inc.
|
325,744
|
|||||
|
BUILDING MATERIAL & SUPPLIES DEALERS - 1.3%
|
|||||||
|
8,000
|
The Home Depot, Inc.
|
1,518,800
|
|||||
|
BUSINESS SUPPORT SERVICES - 1.0%
|
|||||||
|
8,900
|
Atlassian Corp. Plc - Class A (a)(b)
|
1,120,332
|
|||||
|
CHILD DAY CARE SERVICES - 0.5%
|
|||||||
|
4,600
|
Bright Horizons Family Solutions Inc. (a)
|
630,476
|
|||||
|
CLOTHING STORES - 0.6%
|
|||||||
|
6,800
|
Ross Stores, Inc.
|
632,332
|
|||||
|
COLLEGES, UNIVERSITIES & PROFESSIONAL SCHOOLS - 0.6%
|
|||||||
|
5,300
|
Grand Canyon Education, Inc. (a)
|
635,258
|
|||||
|
COMMERCIAL & SERVICE INDUSTRY MACHINERY MANUFACTURING - 0.8%
|
|||||||
|
20,300
|
Fabrinet (a)(b)
|
865,592
|
|||||
|
COMMUNICATIONS EQUIPMENT MANUFACTURING - 3.7%
|
|||||||
|
24,500
|
Apple Inc.
|
4,289,215
|
|||||
|
COMPUTER & PERIPHERAL EQUIPMENT MANUFACTURING - 0.6%
|
|||||||
|
19,400
|
Teradata Corp. (a)
|
666,196
|
|||||
|
COMPUTER SYSTEMS DESIGN & RELATED SERVICES - 0.9%
|
|||||||
|
2,300
|
Accenture PLC - Class A (b)
|
409,561
|
|||||
|
5,400
|
Okta, Inc. (a)
|
611,388
|
|||||
|
1,020,949
|
|||||||
|
CUT & SEW APPAREL MANUFACTURING - 0.8%
|
|||||||
|
329
|
Kontoor Brands, Inc. (a)
|
9,627
|
|||||
|
4,500
|
lululemon athletica Inc. (a)
|
745,155
|
|||||
|
2,300
|
VF Corp.
|
188,324
|
|||||
|
943,106
|
|||||||
|
DATA PROCESSING, HOSTING & RELATED SERVICES - 0.4%
|
|||||||
|
920
|
CoStar Group Inc. (a)
|
468,869
|
|||||
|
DRUGS & DRUGGISTS’ SUNDRIES MERCHANT WHOLESALERS - 2.1%
|
|||||||
|
16,500
|
Nu Skin Enterprises, Inc. - Class A
|
770,385
|
|||||
|
15,500
|
The Procter & Gamble Co.
|
1,595,105
|
|||||
|
2,365,490
|
|||||||
|
ELECTRICAL EQUIPMENT MANUFACTURING - 0.4%
|
|||||||
|
2,400
|
Littelfuse, Inc.
|
391,704
|
|||||
|
500
|
Rockwell Automation, Inc.
|
74,425
|
|||||
|
466,129
|
|||||||
The accompanying notes are an integral part of these financial statements.
7
IMAN FUND
SCHEDULE OF INVESTMENTS (Continued)
May 31, 2019
(Classifications are based on the North American Industry Classification System)
|
Number of
|
|||||||
|
Shares
|
Value
|
||||||
|
COMMON STOCKS - 96.6% (Continued)
|
|||||||
|
ELECTRONIC SHOPPING & MAIL-ORDER HOUSES - 0.9%
|
|||||||
|
23,800
|
Farfetch Ltd. - Class A (a)(b)
|
$
|
477,190
|
||||
|
55,600
|
Overstock.com, Inc. (a)
|
530,980
|
|||||
|
1,008,170
|
|||||||
|
ELECTRONICS & APPLIANCE STORES - 0.1%
|
|||||||
|
2,600
|
Best Buy Co., Inc.
|
162,942
|
|||||
|
ELEMENTARY & SECONDARY SCHOOLS - 0.7%
|
|||||||
|
4,300
|
Strategic Education, Inc.
|
756,757
|
|||||
|
ENGINE, TURBINE & POWER TRANSMISSION
|
|||||||
|
EQUIPMENT MANUFACTURING - 0.1%
|
|||||||
|
900
|
Cummins, Inc.
|
135,684
|
|||||
|
FOOTWEAR MANUFACTURING - 0.7%
|
|||||||
|
10,500
|
NIKE, Inc. - Class B
|
809,970
|
|||||
|
FREIGHT TRANSPORTATION ARRANGEMENT - 0.1%
|
|||||||
|
1,100
|
Expeditors International of Washington, Inc.
|
76,549
|
|||||
|
FURNITURE STORES - 0.6%
|
|||||||
|
18,200
|
The Lovesac Co. (a)
|
656,110
|
|||||
|
GENERAL FREIGHT TRUCKING - 1.6%
|
|||||||
|
54,500
|
Knight-Swift Transportation Holdings Inc.
|
1,506,380
|
|||||
|
2,400
|
Old Dominion Freight Line, Inc.
|
317,856
|
|||||
|
1,824,236
|
|||||||
|
GROCERY & RELATED PRODUCT MERCHANT WHOLESALERS - 0.6%
|
|||||||
|
8,600
|
Wingstop, Inc.
|
685,248
|
|||||
|
HOME HEALTH CARE SERVICES - 0.9%
|
|||||||
|
9,500
|
LHC Group, Inc. (a)
|
1,076,160
|
|||||
|
INDUSTRIAL MACHINERY MANUFACTURING - 0.1%
|
|||||||
|
2,600
|
Applied Materials, Inc.
|
100,594
|
|||||
|
MANAGEMENT, SCIENTIFIC & TECHNICAL CONSULTING SERVICES - 1.0%
|
|||||||
|
45,034
|
The Hackett Group, Inc.
|
724,597
|
|||||
|
2,800
|
salesforce.com, Inc. (a)
|
423,948
|
|||||
|
1,148,545
|
|||||||
|
MANUFACTURING & REPRODUCING MAGNETIC & OPTICAL MEDIA - 1.7%
|
|||||||
|
13,900
|
MongoDB, Inc. (a)
|
1,950,726
|
|||||
|
MEDICAL EQUIPMENT & SUPPLIES MANUFACTURING - 6.3%
|
|||||||
|
1,175
|
ABIOMED, Inc. (a)
|
307,756
|
|||||
|
570
|
Align Technology, Inc. (a)
|
162,079
|
|||||
|
20,800
|
Boston Scientific Corp. (a)
|
798,928
|
|||||
|
4,300
|
Edwards Lifesciences, Corp. (a)
|
734,010
|
|||||
|
21,000
|
Intersect ENT, Inc. (a)
|
495,180
|
|||||
|
4,000
|
Intuitive Surgical, Inc. (a)
|
1,859,400
|
|||||
|
12,300
|
Penumbra, Inc. (a)
|
1,755,210
|
|||||
|
6,100
|
Stryker Corp.
|
1,117,764
|
|||||
|
7,230,327
|
|||||||
The accompanying notes are an integral part of these financial statements.
8
IMAN FUND
SCHEDULE OF INVESTMENTS (Continued)
May 31, 2019
(Classifications are based on the North American Industry Classification System)
|
Number of
|
|||||||
|
Shares
|
Value
|
||||||
|
COMMON STOCKS - 96.6% (Continued)
|
|||||||
|
MISCELLANEOUS DURABLE GOODS MERCHANT WHOLESALERS - 0.8%
|
|||||||
|
2,800
|
3M Co.
|
$
|
447,300
|
||||
|
2,700
|
Honeywell International, Inc.
|
443,637
|
|||||
|
890,937
|
|||||||
|
MOTOR VEHICLE & MOTOR VEHICLE PARTS
|
|||||||
|
& SUPPLIES MERCHANT WHOLESALERS - 0.8%
|
|||||||
|
10,800
|
Dorman Products, Inc. (a)
|
881,928
|
|||||
|
MOTOR VEHICLE PARTS MANUFACTURING - 0.5%
|
|||||||
|
4,100
|
RBC Bearings Inc. (a)
|
583,430
|
|||||
|
NAVIGATIONAL, MEASURING, ELECTROMEDICAL
|
|||||||
|
& CONTROL INSTRUMENTS MANUFACTURING - 2.6%
|
|||||||
|
13,100
|
Bruker Corp.
|
547,187
|
|||||
|
1,700
|
Coherent, Inc. (a)
|
187,051
|
|||||
|
7,000
|
Danaher Corp.
|
924,070
|
|||||
|
8,300
|
LivaNova Plc (a)(b)
|
596,770
|
|||||
|
17,400
|
Teradyne, Inc.
|
733,236
|
|||||
|
2,988,314
|
|||||||
|
NURSING CARE FACILITIES (SKILLED NURSING FACILITIES) - 0.8%
|
|||||||
|
17,900
|
The Ensign Group, Inc.
|
953,354
|
|||||
|
OFFICE SUPPLIES, STATIONERY & GIFT STORES - 0.1%
|
|||||||
|
2,500
|
Etsy, Inc. (a)
|
155,775
|
|||||
|
OFFICES OF REAL ESTATE AGENTS & BROKERS - 0.6%
|
|||||||
|
7,600
|
FirstService Corp. (b)
|
686,736
|
|||||
|
OIL & GAS EXTRACTION - 0.1%
|
|||||||
|
2,000
|
EOG Resources, Inc.
|
163,760
|
|||||
|
OTHER CHEMICAL PRODUCT & PREPARATION MANUFACTURING - 1.5%
|
|||||||
|
13,900
|
Innospec Inc.
|
1,121,869
|
|||||
|
21,329
|
NanoString Technologies, Inc. (a)
|
606,597
|
|||||
|
1,728,466
|
|||||||
|
OTHER ELECTRICAL EQUIPMENT & COMPONENT MANUFACTURING - 0.9%
|
|||||||
|
16,700
|
Emerson Electric Co.
|
1,006,008
|
|||||
|
OTHER GENERAL MERCHANDISE STORES - 1.3%
|
|||||||
|
1,500
|
Burlington Stores, Inc. (a)
|
234,870
|
|||||
|
4,600
|
Dollar General Corp.
|
585,488
|
|||||
|
5,600
|
Five Below, Inc. (a)
|
720,888
|
|||||
|
1,541,246
|
|||||||
|
OTHER GENERAL PURPOSE MACHINERY MANUFACTURING - 0.6%
|
|||||||
|
15,700
|
Graco Inc.
|
741,354
|
|||||
|
OTHER INFORMATION SERVICES - 4.6%
|
|||||||
|
10,600
|
Alibaba Group Holding Ltd. - ADR (a)(b)
|
1,582,156
|
|||||
|
11,400
|
Facebook Inc. - Class A (a)
|
2,023,158
|
|||||
|
45,800
|
Twitter, Inc. (a)
|
1,668,952
|
|||||
|
5,274,266
|
|||||||
The accompanying notes are an integral part of these financial statements.
9
IMAN FUND
SCHEDULE OF INVESTMENTS (Continued)
May 31, 2019
(Classifications are based on the North American Industry Classification System)
|
Number of
|
|||||||
|
Shares
|
Value
|
||||||
|
COMMON STOCKS - 96.6% (Continued)
|
|||||||
|
OTHER MISCELLANEOUS MANUFACTURING - 0.6%
|
|||||||
|
3,600
|
Pool Corp.
|
$
|
647,208
|
||||
|
OTHER MISCELLANEOUS STORE RETAILERS - 0.5%
|
|||||||
|
6,000
|
Ollie’s Bargain Outlet Holdings, Inc. (a)
|
592,320
|
|||||
|
OTHER PROFESSIONAL, SCIENTIFIC & TECHNICAL SERVICES - 2.5%
|
|||||||
|
10,800
|
RealPage, Inc. (a)
|
629,856
|
|||||
|
8,400
|
ServiceNow, Inc. (a)
|
2,200,212
|
|||||
|
2,830,068
|
|||||||
|
OTHER SCHOOLS & INSTRUCTION - 1.6%
|
|||||||
|
54,100
|
TAL Education Group - ADR (a)(b)
|
1,861,581
|
|||||
|
PETROLEUM & COAL PRODUCTS MANUFACTURING - 1.3%
|
|||||||
|
20,500
|
Exxon Mobil Corp.
|
1,450,785
|
|||||
|
PHARMACEUTICAL & MEDICINE MANUFACTURING - 8.4%
|
|||||||
|
4,800
|
Alexion Pharmaceuticals, Inc. (a)
|
545,664
|
|||||
|
4,000
|
Bio-Techne Corp
|
792,200
|
|||||
|
11,700
|
Bristol-Myers Squibb Co.
|
530,829
|
|||||
|
2,900
|
Eli Lilly and Co.
|
336,226
|
|||||
|
32,100
|
Halozyme Therapeutics, Inc. (a)
|
473,475
|
|||||
|
2,300
|
IDEXX Laboratories, Inc. (a)
|
574,471
|
|||||
|
5,565
|
Illumina, Inc. (a)
|
1,707,954
|
|||||
|
10,200
|
Johnson & Johnson
|
1,337,730
|
|||||
|
14,800
|
Merck & Co., Inc.
|
1,172,308
|
|||||
|
28,900
|
Pfizer Inc.
|
1,199,928
|
|||||
|
2,500
|
Sage Therapeutics, Inc. (a)
|
429,675
|
|||||
|
3,300
|
Vertex Pharmaceuticals Inc. (a)
|
548,394
|
|||||
|
9,648,854
|
|||||||
|
PLASTICS PRODUCT MANUFACTURING - 0.4%
|
|||||||
|
68,900
|
ZAGG Inc. (a)
|
458,874
|
|||||
|
PROFESSIONAL & COMMERCIAL EQUIPMENT
|
|||||||
|
& SUPPLIES MERCHANT WHOLESALERS - 1.1%
|
|||||||
|
4,900
|
New Relic, Inc. (a)
|
491,568
|
|||||
|
1,800
|
Paycom Software, Inc. (a)
|
381,780
|
|||||
|
9,100
|
Tactile Systems Technology, Inc. (a)
|
437,073
|
|||||
|
1,310,421
|
|||||||
|
SCHEDULED AIR TRANSPORTATION - 1.2%
|
|||||||
|
29,500
|
Southwest Airlines Co.
|
1,404,200
|
|||||
|
SCIENTIFIC RESEARCH & DEVELOPMENT SERVICES - 1.8%
|
|||||||
|
700
|
Biogen Inc. (a)
|
153,503
|
|||||
|
4,600
|
Exact Sciences Corp. (a)
|
476,698
|
|||||
|
10,300
|
ICON Plc (a)(b)
|
1,458,068
|
|||||
|
2,088,269
|
|||||||
|
SEMICONDUCTOR & OTHER ELECTRONIC
|
|||||||
|
COMPONENT MANUFACTURING - 9.3%
|
|||||||
|
7,000
|
Advanced Micro Devices, Inc. (a)
|
191,870
|
|||||
|
4,075
|
Alphabet Inc. - Class A (a)
|
4,508,988
|
|||||
|
24,600
|
Intel Corp.
|
1,083,384
|
|||||
The accompanying notes are an integral part of these financial statements.
10
IMAN FUND
SCHEDULE OF INVESTMENTS (Continued)
May 31, 2019
(Classifications are based on the North American Industry Classification System)
|
Number of
|
|||||||
|
Shares
|
Value
|
||||||
|
COMMON STOCKS - 96.6% (Continued)
|
|||||||
|
SEMICONDUCTOR & OTHER ELECTRONIC
|
|||||||
|
COMPONENT MANUFACTURING - 9.3% (Continued)
|
|||||||
|
1,125
|
Lam Research Corp.
|
$
|
196,436
|
||||
|
64,400
|
Marvell Technology Group Ltd. (b)
|
1,436,120
|
|||||
|
3,000
|
Monolithic Power Systems, Inc.
|
349,350
|
|||||
|
4,300
|
NVIDIA Corp.
|
582,478
|
|||||
|
44,600
|
Taiwan Semiconductor Manufacturing Co. Ltd. - ADR (b)
|
1,710,410
|
|||||
|
3,400
|
Texas Instruments Inc.
|
354,654
|
|||||
|
3,100
|
Xilinx, Inc.
|
317,161
|
|||||
|
10,730,851
|
|||||||
|
SERVICES TO BUILDINGS & DWELLINGS - 1.2%
|
|||||||
|
4,000
|
Automatic Data Processing, Inc.
|
640,480
|
|||||
|
21,150
|
Rollins, Inc.
|
794,605
|
|||||
|
1,435,085
|
|||||||
|
SOAP, CLEANING COMPOUND & TOILET
|
|||||||
|
PREPARATION MANUFACTURING - 2.8%
|
|||||||
|
27,800
|
Colgate-Palmolive Co.
|
1,935,436
|
|||||
|
5,150
|
Ecolab, Inc.
|
948,064
|
|||||
|
3,000
|
West Pharmaceutical Services, Inc.
|
343,800
|
|||||
|
3,227,300
|
|||||||
|
SOFTWARE PUBLISHERS - 15.9%
|
|||||||
|
2,900
|
Adobe Inc. (a)
|
785,610
|
|||||
|
16,100
|
Akamai Technologies, Inc. (a)
|
1,213,296
|
|||||
|
19,000
|
Coupa Software, Inc. (a)
|
2,074,990
|
|||||
|
3,100
|
HubSpot, Inc. (a)
|
537,168
|
|||||
|
1,800
|
Intuit Inc.
|
440,730
|
|||||
|
2,000
|
MercadoLibre Inc. (a)
|
1,141,040
|
|||||
|
35,100
|
Microsoft Corp.
|
4,341,168
|
|||||
|
6,200
|
Shopify Inc. - Class A (a)(b)
|
1,704,380
|
|||||
|
2,800
|
Splunk Inc. (a)
|
319,172
|
|||||
|
4,600
|
Tableau Software, Inc. - Class A (a)
|
517,362
|
|||||
|
10,300
|
Twilio, Inc. - Class A (a)
|
1,359,497
|
|||||
|
2,000
|
Tyler Technologies, Inc. (a)
|
426,700
|
|||||
|
12,300
|
Veeva Systems, Inc. - Class A (a)
|
1,897,767
|
|||||
|
7,300
|
Workday, Inc. - Class A (a)
|
1,490,076
|
|||||
|
18,248,956
|
|||||||
|
SPECIALIZED FREIGHT TRUCKING - 0.6%
|
|||||||
|
10,800
|
Saia, Inc. (a)
|
637,200
|
|||||
|
TRAVEL ARRANGEMENT & RESERVATION SERVICES - 0.3%
|
|||||||
|
215
|
Booking Holdings Inc. (a)
|
356,087
|
|||||
|
TOTAL COMMON STOCKS (Cost $99,696,933)
|
110,988,936
|
||||||
The accompanying notes are an integral part of these financial statements.
11
IMAN FUND
SCHEDULE OF INVESTMENTS (Continued)
May 31, 2019
(Classifications are based on the North American Industry Classification System)
|
Number of
|
|||||||
|
Shares
|
Value
|
||||||
|
REAL ESTATE INVESTMENT TRUST (REIT) - 2.8%
|
|||||||
|
LESSORS OF REAL ESTATE - 2.8%
|
|||||||
|
13,400
|
Public Storage
|
$
|
3,187,592
|
||||
|
TOTAL REIT (Cost $2,929,379)
|
3,187,592
|
||||||
|
Total Investments (Cost $102,626,312) - 99.4%
|
114,176,528
|
||||||
|
Other Assets in Excess of Liabilities - 0.6%
|
684,259
|
||||||
|
TOTAL NET ASSETS - 100.0%
|
$
|
114,860,787
|
|||||
Percentages are stated as a percent of net assets.
ADR – American Depositary Receipt
|
(a)
|
Non Income Producing
|
|
(b)
|
Foreign Issued Security
|
The accompanying notes are an integral part of these financial statements.
12
IMAN FUND
STATEMENT OF ASSETS AND LIABILITIES
May 31, 2019
|
Assets:
|
||||
|
Investments, at value (cost $102,626,312)
|
$
|
114,176,528
|
||
|
Cash
|
593,318
|
|||
|
Receivable for capital shares sold
|
165,285
|
|||
|
Dividends receivable
|
126,841
|
|||
|
Other assets
|
25,921
|
|||
|
Total Assets
|
115,087,893
|
|||
|
Liabilities:
|
||||
|
Payable to Adviser (Note 3)
|
100,291
|
|||
|
Payable for professional fees
|
28,433
|
|||
|
Payable for Trustee fees
|
4,573
|
|||
|
Accrued expenses and other liabilities
|
93,809
|
|||
|
Total Liabilities
|
227,106
|
|||
|
Net Assets
|
$
|
114,860,787
|
||
|
Net assets consist of:
|
||||
|
Paid-in capital
|
$
|
92,778,021
|
||
|
Total distributable earnings
|
22,082,766
|
|||
|
Net Assets
|
$
|
114,860,787
|
||
|
Shares of beneficial interest outstanding
|
||||
|
(unlimited number of shares authorized, no par value)
|
8,998,223
|
|||
|
Net asset value, redemption price and offering price per share
|
$
|
12.76
|
||
The accompanying notes are an integral part of these financial statements.
13
IMAN FUND
STATEMENT OF OPERATIONS
For the Year Ended May 31, 2019
|
Investment income:
|
||||
|
Dividend income (Net of foreign withholding tax of $8,765)
|
$
|
962,939
|
||
|
Total investment income
|
962,939
|
|||
|
Expenses:
|
||||
|
Advisory fees (Note 3)
|
1,120,725
|
|||
|
Administration fees
|
116,304
|
|||
|
Transfer agent fees and expenses
|
83,922
|
|||
|
Legal fees
|
52,782
|
|||
|
Fund accounting fees
|
38,497
|
|||
|
Federal and state registration fees
|
30,787
|
|||
|
Trustees’ fees and related expenses
|
19,072
|
|||
|
Custody fees
|
14,230
|
|||
|
Audit fees
|
13,501
|
|||
|
Reports to shareholders
|
7,755
|
|||
|
Other expenses
|
3,488
|
|||
|
Total expenses
|
1,501,063
|
|||
|
Net investment loss
|
(538,124
|
)
|
||
|
Realized and unrealized gain (loss) on investments:
|
||||
|
Net realized gain from security transactions
|
14,083,786
|
|||
|
Change in net unrealized appreciation/depreciation on investments
|
(10,834,211
|
)
|
||
|
Realized and unrealized gain on investments
|
3,249,575
|
|||
|
Net increase in net assets from operations
|
$
|
2,711,451
|
||
The accompanying notes are an integral part of these financial statements.
14
IMAN FUND
STATEMENTS OF CHANGES IN NET ASSETS
|
Year Ended
|
Year Ended
|
|||||||
|
May 31, 2019
|
May 31, 2018
|
|||||||
|
From operations:
|
||||||||
|
Net investment loss
|
$
|
(538,124
|
)
|
$
|
(366,257
|
)
|
||
|
Net realized gain on investments
|
14,083,786
|
10,225,374
|
||||||
|
Change in net unrealized appreciation/depreciation on investments
|
(10,834,211
|
)
|
6,690,332
|
|||||
|
Net increase in net assets from operations
|
2,711,451
|
16,549,449
|
||||||
|
Net decrease in net assets resulting from distributions paid
|
(10,544,244
|
)
|
(7,791,415
|
)(1)
|
||||
|
From capital share transactions:
|
||||||||
|
Proceeds from sale of shares
|
18,456,922
|
22,863,035
|
||||||
|
Net asset value of shares issued in reinvestment of distributions to shareholders
|
10,415,127
|
7,727,484
|
||||||
|
Payments for shares redeemed
|
(15,064,066
|
)
|
(14,044,133
|
)
|
||||
|
Net increase in net assets from capital share transactions
|
13,807,983
|
16,546,386
|
||||||
|
Total increase in net assets
|
5,975,190
|
25,304,420
|
||||||
|
Net assets:
|
||||||||
|
Beginning of period
|
108,885,597
|
83,581,177
|
||||||
|
End of period
|
$
|
114,860,787
|
$
|
108,885,597
|
(2)
|
|||
|
(1)
|
Includes net investment income distributions of $240,556 and net realized capital gain distributions of $7,550,859.
|
|
(2)
|
Includes accumulated undistributed net investment income of $0.
|
The accompanying notes are an integral part of these financial statements.
15
IMAN FUND
FINANCIAL HIGHLIGHTS
Per Share Data for a Share Outstanding Throughout Each Period
|
Year Ended May 31,
|
||||||||||||||||||||
|
2019
|
2018
|
2017
|
2016
|
2015
|
||||||||||||||||
|
Net asset value, beginning of period
|
$
|
13.96
|
$
|
12.72
|
$
|
11.15
|
$
|
11.40
|
$
|
11.59
|
||||||||||
|
Income (loss) from investment operations:
|
||||||||||||||||||||
|
Net investment income (loss)(1)
|
(0.06
|
)
|
(0.05
|
)
|
0.03
|
0.00
|
(2)
|
(0.00
|
)(2)
|
|||||||||||
|
Net realized and unrealized gain on investments
|
0.21
|
2.44
|
2.42
|
0.22
|
1.13
|
|||||||||||||||
|
Total from investment operations
|
0.15
|
2.39
|
2.45
|
0.22
|
1.13
|
|||||||||||||||
|
Less distributions paid:
|
||||||||||||||||||||
|
From net investment income
|
—
|
(0.04
|
)
|
(0.00
|
)(2)
|
—
|
—
|
|||||||||||||
|
From net realized gain on investments
|
(1.35
|
)
|
(1.11
|
)
|
(0.88
|
)
|
(0.47
|
)
|
(1.32
|
)
|
||||||||||
|
Total distributions paid
|
(1.35
|
)
|
(1.15
|
)
|
(0.88
|
)
|
(0.47
|
)
|
(1.32
|
)
|
||||||||||
|
Net asset value, end of period
|
$
|
12.76
|
$
|
13.96
|
$
|
12.72
|
$
|
11.15
|
$
|
11.40
|
||||||||||
|
Total return
|
2.72
|
%
|
19.25
|
%
|
23.06
|
%
|
1.99
|
%
|
10.22
|
%
|
||||||||||
|
Net assets at end of period (000’s)
|
$
|
114,861
|
$
|
108,886
|
$
|
83,581
|
$
|
61,067
|
$
|
68,440
|
||||||||||
|
Ratio of expenses to average net assets
|
1.34
|
%
|
1.33
|
%
|
1.35
|
%
|
1.39
|
%
|
1.42
|
%
|
||||||||||
|
Ratio of net investment income (loss)
|
||||||||||||||||||||
|
to average net assets
|
(0.48
|
)%
|
(0.39
|
)%
|
0.33
|
%
|
0.03
|
%
|
(0.02
|
)%
|
||||||||||
|
Portfolio turnover rate
|
89.4
|
%
|
71.6
|
%
|
74.7
|
%
|
70.6
|
%
|
72.0
|
%
|
||||||||||
|
(1)
|
Net investment income (loss) per share is calculated using ending balances prior to consideration of adjustments for permanent book to tax differences.
|
|
(2)
|
Less than one cent per share.
|
The accompanying notes are an integral part of these financial statements.
16
IMAN FUND
NOTES TO THE FINANCIAL STATEMENTS
May 31, 2019
|
1.
|
Organization
|
Allied Asset Advisors Funds (the “Trust”), an open-end management investment company, was organized as a Delaware statutory trust on January 14, 2000. The Trust currently offers one series of shares to investors, the Iman Fund (the “Fund”), a
diversified series of the Trust. Allied Asset Advisors, Inc. (“AAA” or the “Adviser”), a Delaware corporation, serves as investment adviser to the Fund.
The Trust is authorized to issue an unlimited number of shares without par value, of each series. The Trust currently offers one class of shares of the Fund.
The investment objective of the Fund is to seek growth of capital while adhering to Islamic principles. To achieve its investment objective, the Fund seeks investments that meet Islamic principles whose prices the Fund’s Adviser anticipates will
increase over the long term. Under normal circumstances, the Fund invests its net assets in domestic and foreign securities chosen by the Adviser in accordance with Islamic principles. Islamic principles generally preclude investments in certain
businesses (e.g., alcohol, pornography and gambling) and investments in interest bearing debt obligations. Any uninvested cash will be held in non-interest bearing deposits or invested in a manner following Islamic principles.
The Fund is an investment company and, accordingly, follows the investment company accounting and reporting guidance of the Financial Accounting Standards Board (“FASB”) Accounting Standards Codification Topic 946, Financial Services – Investment Companies.
|
2.
|
Significant Accounting Policies
|
The following is a summary of significant accounting policies consistently followed by the Fund in the preparation of its financial statements. These policies are in conformity with accounting principles generally accepted in the United States of
America (“GAAP”).
Use of Estimates: In preparing the financial statements in conformity with GAAP, management is required to make estimates and assumptions that affect the reported amounts of assets and liabilities and
disclosure of contingent assets and liabilities as of the date of the financial statements and the reported amounts of increases and decreases in net assets from operations during the reporting period. Actual results could differ from these
estimates.
Security Valuation: Investment securities are carried at fair value determined using the following valuation methods:
|
•
|
Equity securities listed on a U.S. securities exchange or NASDAQ for which market quotations are readily available are valued at the last quoted sale price on the valuation date.
|
|
•
|
Options, futures, unlisted U.S. securities and listed U.S. securities not traded on the valuation date for which market quotations are readily available are valued at the most recent
quoted bid price. The Fund did not hold any such securities during the period ended May 31, 2019.
|
|
•
|
Securities or other assets for which market quotations are not readily available are valued at fair value as determined in good faith by the Adviser under direction of the Board of
Trustees. The Fund did not hold any such securities during the period ended May 31, 2019.
|
The Fund has adopted fair valuation accounting standards which establish an authoritative definition of fair value and a three-tier hierarchy to distinguish between (1) inputs that reflect the assumptions market participants would use in pricing
an asset or liability developed based on market data obtained from sources independent of the reporting entity (observable inputs) and (2) inputs that reflect the reporting entity’s own assumptions about the assumptions market participants would use
in pricing an asset or liability developed based on the best information available in the circumstances (unobservable inputs) and to establish classification of fair value measurements for disclosure purposes.
Summary of Fair Value Exposure at May 31, 2019
The Trust has performed an analysis of all existing investments to determine the significance and character of all inputs to their fair value determination. Various inputs are used in determining the value of the Fund’s investments. These inputs
are summarized in the three broad levels listed below:
|
Level 1 -
|
Unadjusted quoted prices in active markets for identical securities the Fund has the ability to access.
|
|
Level 2 -
|
Other significant observable inputs (including quoted prices for similar securities in active markets, quoted prices for identical or similar instruments in markets that are not active,
model-derived valuations in which all significant inputs and significant value drivers are observable in active markets, interest rates, prepayment speeds, credit risk, etc.)
|
|
Level 3 -
|
Significant unobservable inputs (including the Fund’s own assumptions in determining the fair value of investments)
|
17
IMAN FUND
NOTES TO THE FINANCIAL STATEMENTS (Continued)
May 31, 2019
Inputs that are used in determining a fair value of an investment may include price information, credit data, volatility statistics and other factors. These inputs can be either observable or unobservable. The availability of observable inputs can
vary between investments and is affected by various factors such as the type of investment or similar investments in the marketplace. The inputs will be considered by the Adviser, along with any other relevant factors in the calculation of an
investment’s fair value. The Fund uses prices and inputs that are current as of the measurement date, which may include periods of market dislocations. During these periods, the availability of prices and inputs may be reduced for many investments.
This condition could cause an investment to be reclassified between the various levels within the hierarchy.
Investments falling into the Level 3 category are primarily supported by quoted prices from brokers and dealers participating in the market for those investments. However, these may be classified as Level 3 investments due to lack of market
transparency and corroboration to support these quoted prices. Additionally, valuation models may be used as the pricing source for any remaining investments classified as Level 3. These models rely on one or more significant unobservable inputs
and/or significant assumptions by the Adviser. Inputs used in valuations may include, but are not limited to, financial statement analysis, capital account balances, discount rates and estimated cash flows, and comparable company data.
The inputs or methodology used for valuing securities are not an indication of the risk associated with investing in those securities.
The following is a summary of the inputs used to value the Fund’s net assets as of May 31, 2019:
|
Level 1
|
Level 2
|
Level 3
|
Total
|
|||||||||||||
|
Common Stocks
|
$
|
110,988,936
|
$
|
—
|
$
|
—
|
$
|
110,988,936
|
||||||||
|
REIT
|
3,187,592
|
—
|
—
|
3,187,592
|
||||||||||||
|
Total*
|
$
|
114,176,528
|
$
|
—
|
$
|
—
|
$
|
114,176,528
|
||||||||
|
*
|
Additional information regarding the industry and/or geographical classification of these investments is disclosed in the Schedule of Investments.
|
Foreign Securities: Investing in securities of foreign companies and foreign governments involves special risks and consideration not typically associated with investing in U.S. companies and the U.S.
government. These risks include revaluation of currencies and future adverse political and economic developments. Moreover, securities of many foreign companies and foreign governments and their markets may be less liquid and their prices more
volatile than those of securities of comparable U.S. companies and the U.S. government. The Fund does not invest in securities of U.S. or foreign governments.
Federal Income Taxes: It is the Fund’s policy to comply with the requirements of the Internal Revenue Code applicable to regulated investment companies, and the Fund intends to distribute all of its taxable
income and net capital gains to shareholders. Therefore, no federal income tax provision is required.
As of and during the year ended May 31, 2019, the Fund did not have a liability for any unrecognized tax benefits. The Fund recognizes interest and penalties, if any, related to unrecognized tax benefits as other expenses in the Statement of
Operations. During the year, the Fund did not incur any interest or penalties. The statute of limitations on the Fund’s tax returns remains open for the years ended May 31, 2016 through May 31, 2019.
As of May 31, 2019, the tax cost of investments and the components of distributable earnings on a tax basis were as follows:
|
Cost of investments
|
$
|
102,696,906
|
||
|
Gross tax unrealized appreciation
|
$
|
17,028,830
|
||
|
Gross tax unrealized depreciation
|
(5,549,208
|
)
|
||
|
Net tax unrealized appreciation
|
11,479,622
|
|||
|
Undistributed ordinary income
|
—
|
|||
|
Undistributed long-term capital gains
|
10,822,296
|
|||
|
Other accumulated losses
|
(219,152
|
)
|
||
|
Total distributable earnings
|
$
|
22,082,766
|
The difference between book basis and tax basis unrealized appreciation is attributable primarily to the tax deferral of losses relating to wash sale transactions.
A regulated investment company may elect for any taxable year to treat any portion of any qualified late year loss as arising on the first day of the next taxable year. Qualified late year losses are certain capital and ordinary losses which occur
during the portion of the Fund’s taxable year subsequent to October 31 and December 31, respectively. For the taxable year ended May 31, 2019, the Fund deferred, on a tax basis, ordinary late year losses of $219,152.
18
IMAN FUND
NOTES TO THE FINANCIAL STATEMENTS (Continued)
May 31, 2019
Distributions to Shareholders: The Fund will distribute substantially all of the net investment income and net realized gains that it has realized on the sale of securities. These income and gains
distributions will generally be paid once each year, on or before December 31. The character of distributions made during the year from net investment income or net realized gains may differ from the characterization for federal income tax purposes
due to differences in the recognition of income, expense or gain items for financial reporting and tax reporting purposes.
The tax character of distributions paid were as follows:
|
Year Ended
|
Year Ended
|
|||||||
|
May 31, 2019
|
May 31, 2018
|
|||||||
|
Ordinary Income
|
$
|
1,795,766
|
$
|
3,309,448
|
||||
|
Long-term capital gains
|
$
|
8,748,478
|
$
|
4,481,967
|
||||
Dividend income and distributions to shareholders are recorded on the ex-dividend date. The Fund may periodically make reclassifications among certain of its capital accounts to reflect the tax character of permanent book to tax differences
related to the components of the Fund’s net assets. These reclassifications have no impact on the net assets or net asset value of the Fund. For the fiscal year ended May 31, 2019, total distributable earnings was increased by $303,616 and paid-in
capital was decreased by $303,616 resulting from such reclassification. This reclassification was due to net operating losses.
Other: Investment transactions and shareholder transactions are accounted for on the trade date. Net realized gains and losses on securities are computed on the basis of specific security lot
identification. Withholding taxes on foreign dividends have been provided for in accordance with the Fund’s understanding of the applicable country’s tax rules and rates.
Recent Accounting Pronouncement: In August 2018, FASB issued Accounting Standards Update (“ASU”) 2018-13, Fair Value Measurement (Topic 820): Disclosure Framework—Changes to the Disclosure Requirements for Fair Value Measurement (“ASU 2018-13”). The primary focus of ASU 2018-13 is to improve the effectiveness of the disclosure requirements for fair
value measurements. The changes affect all companies that are required to include fair value measurement disclosures. In general, the amendments in ASU 2018-13 are effective for all entities for fiscal years and interim periods within those fiscal
years, beginning after December 15, 2019. An entity is permitted to early adopt the removed or modified disclosures upon the issuance of ASU 2018-13 and may delay adoption of the additional disclosures, which are required for public companies only,
until their effective date. Management has evaluated ASU 2018-13 and has early adopted the relevant provisions of the disclosure framework.
Subsequent Events: In preparing these financial statements, management has performed an evaluation of subsequent events after May 31, 2019, through the date the financial statements were issued and
determined that there were no significant subsequent events that would require adjustment to or additional disclosure in these financial statements.
|
3.
|
Investment Advisory and Other Agreements
|
The Trust has an Investment Advisory Agreement (the “Agreement”) with the Adviser, with whom certain officers and a Trustee of the Trust are affiliated, to furnish investment advisory services to the Fund. Under the terms of the Agreement, the
Trust, on behalf of the Fund, compensates the Adviser for its management services at the annual rate of 1.00% of the Fund’s daily average net assets.
For the year ended May 31, 2019, the Fund had advisory expenses of $1,120,725 and as of May 31, 2019, the Fund had $100,291 payable to the Adviser.
The Trust has a distribution agreement and a servicing agreement with Quasar Distributors, LLC (the “Distributor”). Fees for such distribution services are paid to the Distributor by the Adviser.
|
4.
|
Capital Share Transactions
|
Capital Share Transactions of the Fund for the year ended May 31, 2019, were as follows:
|
Amount
|
Shares
|
|||||||
|
Shares sold
|
$
|
18,456,922
|
1,388,921
|
|||||
|
Shares reinvested
|
10,415,127
|
958,153
|
||||||
|
Shares redeemed
|
(15,064,066
|
)
|
(1,146,273
|
)
|
||||
|
Net Increase
|
$
|
13,807,983
|
1,200,801
|
|||||
|
Shares Outstanding
|
||||||||
|
Beginning of period
|
7,797,422
|
|||||||
|
End of period
|
8,998,223
|
|||||||
19
IMAN FUND
NOTES TO THE FINANCIAL STATEMENTS (Continued)
May 31, 2019
Capital Share Transactions of the Fund for the year ended May 31, 2018, were as follows:
|
Amount
|
Shares
|
|||||||
|
Shares sold
|
$
|
22,863,035
|
1,695,863
|
|||||
|
Shares reinvested
|
7,727,484
|
583,647
|
||||||
|
Shares redeemed
|
(14,044,133
|
)
|
(1,051,339
|
)
|
||||
|
Net increase
|
$
|
16,546,386
|
1,228,171
|
|||||
|
Shares Outstanding
|
||||||||
|
Beginning of period
|
6,569,251
|
|||||||
|
End of period
|
7,797,422
|
|||||||
|
5.
|
Securities Transactions
|
During the year ended May 31, 2019, the cost of purchases and proceeds from sales of investment securities, other than short-term investments, were $102,355,885 and $99,784,331, respectively. There were no purchases or sales of U.S. government
securities for the Fund.
|
6.
|
Beneficial Ownership
|
The beneficial ownership, either directly or indirectly, of more than 25% of the voting securities of a fund creates a presumption of control of the fund, under Section 2(a)(9) of the Investment Company Act of 1940 (“1940 Act”). As of May 31,
2019, the North American Islamic Trust (“NAIT”) held 43.05% of the Fund. NAIT is the parent company of the Adviser.
20
IMAN FUND
REPORT OF INDEPENDENT REGISTERED PUBLIC ACCOUNTING FIRM
To the Shareholders Iman Fund and
Board of Trustees of Allied Asset Advisors Funds
Opinion on the Financial Statements
We have audited the accompanying statement of assets and liabilities, including the schedule of investments, of Allied Asset Advisors Funds comprising Iman Fund (the “Fund”) as of May 31, 2019, and the related statement of operations for the year
then ended, the statements of changes in net assets for each of the two years in the period then ended, including the related notes, and the financial highlights for each of the five years in the period then ended (collectively referred to as the
“financial statements”). In our opinion, the financial statements present fairly, in all material respects, the financial position of the Fund as of May 31, 2019, the results of its operations for the year then ended, the changes in its net assets
for each of the two years in the period then ended, and the financial highlights for each of the five years in the period then ended, in conformity with accounting principles generally accepted in the United States of America.
Basis for Opinion
These financial statements are the responsibility of the Fund’s management. Our responsibility is to express an opinion on the Fund’s financial statements based on our audits. We are a public accounting firm registered with the Public Company
Accounting Oversight Board (United States) (“PCAOB”) and are required to be independent with respect to the Fund in accordance with the U.S. federal securities laws and the applicable rules and regulations of the Securities and Exchange Commission
and the PCAOB.
We conducted our audits in accordance with the standards of the PCAOB. Those standards require that we plan and perform the audit to obtain reasonable assurance about whether the financial statements are free of material misstatement, whether due
to error or fraud.
Our audits included performing procedures to assess the risks of material misstatement of the financial statements, whether due to error or fraud, and performing procedures that respond to those risks. Such procedures included examining, on a test
basis, evidence regarding the amounts and disclosures in the financial statements. Our procedures included confirmation of securities owned as of May 31, 2019, by correspondence with the custodian. Our audits also included evaluating the accounting
principles used and significant estimates made by management, as well as evaluating the overall presentation of the financial statements. We believe that our audits provide a reasonable basis for our opinion.
We have served as the Fund’s auditor since 2006.
COHEN & COMPANY, LTD.
Chicago, Illinois
July 25, 2019
21
IMAN FUND
DISCLOSURE REGARDING THE BOARD OF TRUSTEES
APPROVAL OF THE INVESTMENT ADVISORY AGREEMENT (Unaudited)
In approving the continuance of the investment advisory contract between Allied Asset Advisors Inc. (the “Adviser”) and the Iman Fund (the “Fund”), the Board of Trustees of the Fund (the “Board”) was advised by, and the independent Trustees of the
Board met in executive session with, independent legal counsel to discuss the duties of the Trustees in consideration of the continuance of the agreement. The Board received and reviewed a substantial amount of information provided by the Adviser and
third parties in response to the Board’s requests. Based on its evaluation of the information provided, the Board, at a meeting held April 15, 2019, approved continuation of the investment advisory contract for a period through June 29, 2020.
The Board reviewed and analyzed various factors in considering the contract and reaching its conclusions, including each of the factors described below.
|
1.
|
Nature, Quality, and Extent of Services
|
The Board’s analysis of the nature, quality, and extent of the Adviser’s service to the Fund took into account the knowledge gained from the Board’s regular meetings with the Adviser throughout the prior year. In addition, the Board reviewed
information on the key personnel involved in providing investment management services to the Fund and the Adviser’s performance of services for the Fund, such as stock selection, adherence to the Fund’s investment restrictions, and monitoring
compliance with applicable Fund policies and procedures. The Board concluded that the nature, quality, and extent of the services provided by the Adviser to the Fund were appropriate and the Fund was likely to continue to benefit from services
provided under its contract with the Adviser.
|
2.
|
Investment Performance of the Fund and the Adviser
|
In considering the performance of the Fund and the Adviser, the Board compared the Fund’s performance with that of a universe of greater than 1,300 U.S. large cap growth mutual funds, as determined by Morningstar, an independent data service
provider. The performance data was for the one-, three-, five- and ten-year periods ended March 31, 2019. The Board also compared the Fund’s performance for the three-month, six-month and one-, three-, five- and ten-year periods ended March 31,
2019 with that of several benchmark indices: the Dow Jones Islamic Market US Index/Dow Jones Islamic Market World Index blended index (the “Blended Index”), the Dow Jones Islamic Market US Index (the “IMUS”), the Dow Jones Islamic Market World Index
(the “DJIM”) and the Russell 3000 Growth Index (the “RAG”). In addition, the Board also compared the Fund’s performance for the three-month and one-, three-, five- and ten-year periods ended March 31, 2019 with five other mutual funds that follow
Islamic principles.
The Board considered that the Fund had outperformed the Blended Index, the IMUS and the DJIM for the three-month, 3-year, 5-year and 10-year periods ended March 31, 2019. The Board also considered that the Fund had outperformed the RAG for the
three-month and three-year periods then ended.
The Board considered that the Fund had outperformed all of the Islamic principles peer funds for all but the six-month period ended March 31, 2019, with the exception of one of the funds for each the one-year, three-year, five-year and ten-year
period ended March 31, 2019.
The board also considered that the Fund had underperformed all of its benchmarks and peer funds for the six-month period ended March 31, 2019.
The Board also reviewed the Fund’s performance against its peer universe, noting that the Fund outperformed its peer universe median for the three-year and five-year periods, while underperforming its peer universe median for the one-year and
ten-year periods ended March 31, 2019. The Board then discussed the principal reasons for the Fund’s underperformance and outperformance in various periods.
After considering all the information, the Board concluded that, although past performance cannot be a guarantee of future performance, the Fund and its shareholders were benefiting from the Adviser’s investment management of the Fund.
|
3.
|
Costs of Services and Profits Realized by the Adviser
|
The Board examined the fee and expense information for the Fund as compared to that of other comparable funds and noted that the Adviser’s management fees, as a percentage of net assets, were in the fourth quartile of comparable funds and were
higher than the peer group median reported by Morningstar. The Board also noted that the Fund’s net expense ratio, as a percentage of net assets, was in the fourth quartile of comparable funds and was higher than the peer group median reported by
Morningstar. The Board noted, however, that the Fund’s special nature makes it distinct from most of the funds in its Morningstar peer group, which included many funds that are part of much larger families of funds and, therefore, realize economies
of scale that the Fund does not.
In addition, the Board considered the Adviser’s costs in serving as the Fund’s investment adviser and manager. The costs include those associated with the personnel and systems necessary to manage the Fund. The Board noted, also, that the costs
included those associated with Rule 12b-1 expenses that the Adviser had paid on behalf of the Fund, since the Fund did not have a Rule 12b-1 Plan.
22
IMAN FUND
DISCLOSURE REGARDING THE BOARD OF TRUSTEES
APPROVAL OF THE INVESTMENT ADVISORY AGREEMENT (Unaudited), (Continued)
The Board also considered the financial condition of the Adviser, which was operating at a loss. The Board concluded that the management fee and the total expenses of the Fund were reasonable in light of the services provided and the performance
the Fund achieved over various time periods, and that the other expenses of the Fund also were reasonable.
|
4.
|
Economies of Scale
|
The Board considered the extent to which the Fund’s management fee reflected economies of scale for the benefit of Fund shareholders. The Board noted that because the Adviser was operating at a loss, a discussion of economies of scale was not
applicable with respect to the management fee received by the Adviser.
|
5.
|
Other Benefits to the Adviser
|
The Board considered benefits that accrue to the Adviser from its relationship with the Fund. The Board noted that the Adviser did not employ soft-dollars and therefore did not derive research products or services from brokerage commissions paid
by the Fund on its brokerage transactions.
After full consideration of the above factors as well as other factors, the Board, including all independent trustees, unanimously concluded that approval of the Fund’s advisory contract was in the best interest of the Fund and its shareholders.
23
IMAN FUND
SUPPLEMENTAL INFORMATION (Unaudited)
Information pertaining to the Trustees and Officers of the Fund is set forth below. Each trustee will serve until the termination of the Trust or his earlier death, resignation, retirement, incapacity or removal. The
statement of additional information (SAI) includes additional information about the Trustees and is available without charge, upon request by calling (877) 417-6161 or writing to Iman Fund, c/o Allied Asset Advisors, Inc. 715 Enterprise Drive, Suite
100, Oak Brook, IL 60523.
|
Other
|
||||
|
Position/Term
|
Directorships
|
|||
|
of Office and
|
Held by Trustee
|
|||
|
Name, Year of
|
Length of Time
|
Principal Occupations
|
No. of Funds
|
During the Past
|
|
Birth and Address
|
Served Complex
|
During the Past Five Years
|
in Overseen
|
Five Years
|
|
Independent Trustees
|
||||
|
Abdalla Idris Ali
|
Independent Trustee,
|
2011 to present – Secretary General
|
1
|
None
|
|
Year of birth: 1949
|
indefinite term,
|
of “ISNA Canada.”
|
||
|
715 Enterprise Drive
|
since 2000
|
|||
|
Oak Brook, IL 60523
|
||||
|
Mohammed Kaiseruddin
|
Independent Trustee,
|
1973 to present –
|
1
|
None
|
|
Year of birth: 1944
|
indefinite term,
|
Nuclear Engineer,
|
||
|
715 Enterprise Drive
|
since 2000;
|
Sargent & Lundy.
|
||
|
Oak Brook, IL 60523
|
Chairperson since 2006
|
|
||
|
Muhammad M. Kudaimi
|
Independent Trustee,
|
1988 to present –
|
1
|
None
|
|
Year of birth: 1956
|
indefinite term,
|
Medical Doctor.
|
||
|
715 Enterprise Drive
|
since 2009
|
|||
|
Oak Brook, IL 60523
|
||||
|
Interested Trustee
|
||||
|
Bassam Osman(1)(2)
|
Trustee,
|
1980 to present – Medical Doctor;
|
1
|
None
|
|
Year of birth: 1950
|
indefinite term,
|
2000 to present – Portfolio
|
||
|
715 Enterprise Drive
|
since 2000
|
Manager to the Fund.
|
||
|
Oak Brook, IL 60523
|
||||
|
Officers
|
||||
|
Bassam Osman(1)(2)
|
President
|
(See Above.)
|
1
|
N/A
|
|
Year of birth: 1950
|
since 2000
|
|||
|
715 Enterprise Drive
|
||||
|
Oak Brook, IL 60523
|
||||
|
Mohammad Basheeruddin
|
Treasurer
|
2001 to present –
|
1
|
N/A
|
|
Year of birth: 1950
|
since 2003
|
Accounting Manager, North
|
||
|
715 Enterprise Drive
|
American Islamic Trust (NAIT).
|
|||
|
Oak Brook, IL 60523
|
||||
|
Azam Nizamuddin
|
Chief Compliance
|
General Counsel and Deputy
|
1
|
N/A
|
|
Year of birth: 1967
|
Officer
|
Executive Director of NAIT
|
||
|
715 Enterprise Drive
|
since 2015
|
since April, 2015; 1998 to 2015 –
|
||
|
Oak Brook, IL 60523
|
Attorney in Private Practice.
|
|||
|
Salah Obeidallah(2)
|
Secretary
|
Executive Director of NAIT
|
1
|
N/A
|
|
Year of birth: 1956
|
since 2015
|
since March, 2015;
|
||
|
715 Enterprise Drive
|
President of Allied Asset
|
|||
|
Oak Brook, IL 60523
|
Advisors since June, 2015;
|
|||
|
|
2000 to 2015 – Owner, Manager of
|
|||
|
Paulison Car Wash & Detailing Inc.
|
|
(1)
|
This Trustee is deemed to be an “interested person” of the Trust as that term is defined in Section 2(a)(19) of the 1940 Act because of his affiliation with the Advisor.
|
|
(2)
|
Dr. Osman serves on the Board of Trustees of NAIT, which is an affiliate of the Fund.
|
24
IMAN FUND
SUPPLEMENTAL INFORMATION (Unaudited), (Continued)
Tax Information
The Fund designates 32.93% of its ordinary income distribution for the year ended May 31, 2019 as qualified dividend income under the Jobs and Growth Tax Relief Reconciliation Act of 2003.
For the year ended May 31, 2019, 25.15% of the dividends paid from net ordinary income for the Fund qualifies for the dividends received deduction available to corporate shareholders.
For the year ended May 31, 2019, 100.00% of the percentage of taxable ordinary income distributions that are designated as short-term capital gain distributions under Internal Revenue Section 871(k)(2)(C).
25
IMAN FUND
ADDITIONAL INFORMATION
May 31, 2019
Proxy Voting Policies and Procedures (Unaudited)
A description of the policies and procedures that the Fund uses to determine how to vote proxies relating to portfolio securities is available without charge, upon request, by calling (877) 417-6161 or by accessing the Fund’s website at
http://www.investaaa.com. Furthermore, you can obtain the description on the SEC’s website at http://www.sec.gov.
Proxy Voting Record (Unaudited)
Information regarding how the Fund voted proxies relating to portfolio securities during the most recent 12-month period ended June 30 is available without charge, upon request, by calling (877) 417-6161. Furthermore, you can obtain the Fund’s
proxy voting records on the SEC’s website at http://www.sec.gov.
Availability of Quarterly Portfolio Schedule (Unaudited)
The Fund files its complete schedule of portfolio holdings with the SEC for the first and third quarters of each fiscal year on Form N-Q. The filing will be available, upon request, by calling (877) 417-6161. Furthermore, you will be able to
obtain a copy of the filing on the SEC’s website at http://www.sec.gov. The Fund’s Forms N-Q may also be reviewed and copied at the SEC’s Public Reference Room in Washington, DC, and information on the operation of the Public Reference Room may be
obtained by calling (800) SEC-0330.
PRIVACY POLICY
In the course of servicing your account, we collect the following nonpublic personal information about you:
|
•
|
Information we receive from you on or in applications or other forms, correspondence, or conversations, including, but not limited to, your name, address, phone number, social security
number, assets, income and date of birth; and
|
|
|
•
|
Information about your transactions with us, our affiliates, or others, including, but not limited to, your account number and balance, parties to transactions, cost basis information,
and other financial information.
|
|
|
•
|
Information collected from our website (including from the use of “cookies”)
|
We do not disclose any nonpublic personal information about our current or former shareholders to nonaffiliated third parties, except as permitted by law. For example, we are permitted by law to disclose all of the
information we collect, as described above, to our transfer agent to process your transactions. Furthermore, we restrict access to your nonpublic personal information to those persons who require such information to provide products or services to
you. We maintain physical, electronic, and procedural safeguards that comply with industry standards to guard your nonpublic personal information.
In the event that you hold shares of the Fund through a financial intermediary, including, but not limited to, a broker-dealer, bank, or trust company, the privacy policy of your financial intermediary would govern how
your financial intermediary shares nonpublic personal information with nonaffiliated third parties.
26
INVESTMENT ADVISER
Allied Asset Advisors, Inc.
Oak Brook, Illinois
DISTRIBUTOR
Quasar Distributors, LLC
Milwaukee, Wisconsin
INDEPENDENT REGISTERED
PUBLIC ACCOUNTING FIRM
Cohen & Company, Ltd.
Chicago, Illinois
ADMINISTRATOR, TRANSFER AGENT,
AND FUND ACCOUNTANT
U.S. Bank Global Fund Services
Milwaukee, Wisconsin
CUSTODIAN
U.S. Bank, N.A.
Milwaukee, Wisconsin
LEGAL COUNSEL
Latham & Watkins LLP
Chicago, Illinois
This report has been prepared for shareholders and may be distributed to others only if preceded or accompanied by a current prospectus. Quasar Distributors, LLC is the Distributor for the Fund.
AAA
Allied Asset Advisors, Inc.
715 Enterprise Drive
Oak Brook, IL 60523
(630) 789-0453
1-877-417-6161
www.investaaa.com
Item 2. Code of Ethics.
The registrant has adopted a code of ethics that applies to the registrant’s principal executive officer and principal financial officer. The registrant has not made any substantive amendments to its code of ethics during the period covered by
this report. The registrant has not granted any waivers from any provisions of the code of ethics during the period covered by this report. The Registrant’s code of ethics is incorporated herein by reference to
its form N-CSR filed on August 9, 2007.
Item 3. Audit Committee Financial Expert.
The Registrant’s board of trustees has determined that it does not have an audit committee financial expert serving on its audit committee. At this time, the Registrant believes that the experience provided by each member of the audit committee
together offers the Registrant adequate oversight for the Registrant’s level of financial complexity.
Item 4. Principal Accountant Fees and Services.
The Registrant has engaged its principal accountant to perform audit services, audit-related services, tax services and other services during the past two fiscal years. “Audit services” refer to performing an audit of the Registrant's annual
financial statements or services that are normally provided by the accountant in connection with statutory and regulatory filings or engagements for those fiscal years. “Audit-related services” refer to the assurance and related services by the
principal accountant that are reasonably related to the performance of the audit. “Tax services” refer to professional services rendered by the principal accountant for tax compliance, tax advice, and tax planning. The following table details the
aggregate fees billed or expected to be billed for each of the last two fiscal years for audit fees, audit-related fees, tax fees and other fees by the principal accountant.
|
FYE 5/31/2019
|
FYE 5/31/2018
|
|
|
Audit Fees
|
13,500
|
13,500
|
|
Audit-Related Fees
|
-
|
-
|
|
Tax Fees
|
-
|
-
|
|
All Other Fees
|
-
|
-
|
The audit committee has adopted pre-approval policies and procedures that require the audit committee to pre‑approve all audit and non‑audit services of the Registrant, including services provided to any entity affiliated with the Registrant.
The percentage of fees billed by Cohen & Company, Ltd. applicable to non-audit services pursuant to waiver of pre-approval requirement were as follows:
|
FYE 5/31/2019
|
FYE 5/31/2018
|
|
|
Audit-Related Fees
|
0%
|
0%
|
|
Tax Fees
|
0%
|
0%
|
|
All Other Fees
|
0%
|
0%
|
All of the principal accountant’s hours spent on auditing the Registrant’s financial statements were attributed to work performed by full‑time permanent employees of the principal accountant.
The following table indicates the non-audit fees billed or expected to be billed by the Registrant’s accountant for services to the Registrant and to the Registrant’s investment adviser (and any other
controlling entity, etc.—not sub-adviser) for the last two years. The audit committee of the board of trustees/directors has considered whether the provision of non-audit services that were rendered to the Registrant's investment adviser is
compatible with maintaining the principal accountant's independence and has concluded that the provision of such non-audit services by the accountant has not compromised the accountant’s independence.
|
Non-Audit Related Fees
|
FYE 5/31/2019
|
FYE 5/31/2018
|
|
Registrant
|
-
|
-
|
|
Registrant’s Investment Adviser
|
-
|
-
|
Item 5. Audit Committee of Listed Registrants.
Not applicable to registrants who are not listed issuers (as defined in Rule 10A-3 under the Securities Exchange Act of 1934).
Item 6. Investments.
|
(a)
|
Schedule of Investments is included as part of the report to shareholders filed under Item 1 of this Form.
|
|
(b)
|
Not Applicable
|
Item 7. Disclosure of Proxy Voting Policies and Procedures for Closed-End Management Investment Companies.
Not applicable to open-end investment companies.
Item 8. Portfolio Managers of Closed-End Management Investment Companies.
Not applicable to open-end investment companies.
Item 9. Purchases of Equity Securities by Closed‑End Management Investment Company and Affiliated Purchasers.
Not applicable to open-end investment companies.
Item 10. Submission of Matters to a Vote of Security Holders.
There have been no material changes to the procedures by which shareholders may recommend nominees to the Registrant’s board of trustees.
Item 11. Controls and Procedures.
|
(a)
|
The Registrant’s President/Chief Executive Officer and Treasurer/Chief Financial Officer have reviewed the Registrant's disclosure controls and procedures (as defined in Rule 30a-3(c) under the Investment Company Act of 1940 (the
“Act”)) as of a date within 90 days of the filing of this report, as required by Rule 30a-3(b) under the Act and Rules 13a-15(b) or 15d‑15(b) under the Securities Exchange Act of 1934. Based on their review, such officers have concluded
that the disclosure controls and procedures are effective in ensuring that information required to be disclosed in this report is appropriately recorded, processed, summarized and reported and made known to them by others within the
Registrant and by the Registrant’s service provider.
|
|
(b)
|
There were no changes in the Registrant's internal control over financial reporting (as defined in Rule 30a-3(d) under the Act) that occurred during the second fiscal quarter of the period covered by this report that have materially
affected, or are reasonably likely to materially affect, the Registrant's internal control over financial reporting.
|
Item 12. Disclosure of Securities Lending Activities for Closed-End Management Investment Companies
Not applicable to open-end investment companies.
Item 13. Exhibits.
|
(a)
|
(1) Any code of ethics or amendment thereto, that is the subject of the disclosure required by Item 2, to the extent that the registrant intends to satisfy Item 2 requirements through filing an
exhibit. Incorporated by reference to the Registrant’s Form N-CSR filed August 9, 2007.
|
(2) A separate certification for each principal executive officer and principal financial officer pursuant to Section 302 of the Sarbanes-Oxley Act of 2002. Filed herewith.
(3) Any written solicitation to purchase securities under Rule 23c‑1 under the Act sent or given during the period covered by the report by or on behalf of the registrant to 10 or
more persons. Not applicable to open-end investment companies.
(4) Change in the registrant’s independent public accountant. There was no change in the registrant’s independent public accountant for the period covered by this report.
|
(b)
|
Certifications pursuant to Section 906 of the Sarbanes‑Oxley Act of 2002. Furnished herewith.
|
SIGNATURES
Pursuant to the requirements of the Securities Exchange Act of 1934 and the Investment Company Act of 1940, the registrant has duly caused this report to be signed on its behalf by the undersigned, thereunto duly
authorized.
Allied Asset Advisors Funds
By /s/Bassam Osman
Bassam Osman, President
Date August 5, 2019
Pursuant to the requirements of the Securities Exchange Act of 1934 and the Investment Company Act of 1940, this report has been signed below by the following persons on behalf of the registrant and in the capacities
and on the dates indicated.
By /s/Bassam Osman
Bassam Osman, President
Date August 5, 2019
By /s/Mohammad Basheeruddin
Mohammad Basheeruddin, Treasurer
Date August 8, 2019