Exhibit 99.1
| October 19, 2022 |  |
PACWEST BANCORP ANNOUNCES RESULTS FOR THE THIRD QUARTER 2022
FOR IMMEDIATE RELEASE
THIRD QUARTER 2022 RESULTS
| $122.2M | $1.02 | 24.11% | 8.55% |
| Net Earnings Available to Common Stockholders | Diluted
Earnings per Common Share |
ROATCE | CET1 |
THIRD QUARTER 2022 HIGHLIGHTS
| · | All Regulatory Capital Ratios Increased from 2Q22, With CET1 Increasing from 8.24% to 8.55% |
| · | Total Deposits Up $228 Million or 0.7% from 2Q22; Venture Banking Deposits Grew $129 Million to $12.2 Billion |
| · | Credit Metrics Remain Steady with Nonperforming Assets Ratio of 34 Basis Points |
| · | Loan Growth of $1.2 Billion or 4.4% from 2Q22 |
| · | Net Interest Income (TE) of $338.6 Million in 3Q22 vs. $327.8 Million in 2Q22; Up 3.3% |
CEO COMMENTARY
Matt Wagner, CEO, commented, “We are pleased with the growth in our capital ratios during the third quarter of 2022. The increases in the ratios were due to strong earnings, the credit-linked notes transaction completed in late September, and slower growth in loans and loan commitments. Capital remains a primary focus area and we are targeting a CET1 ratio of 10% by the end of 2023.”
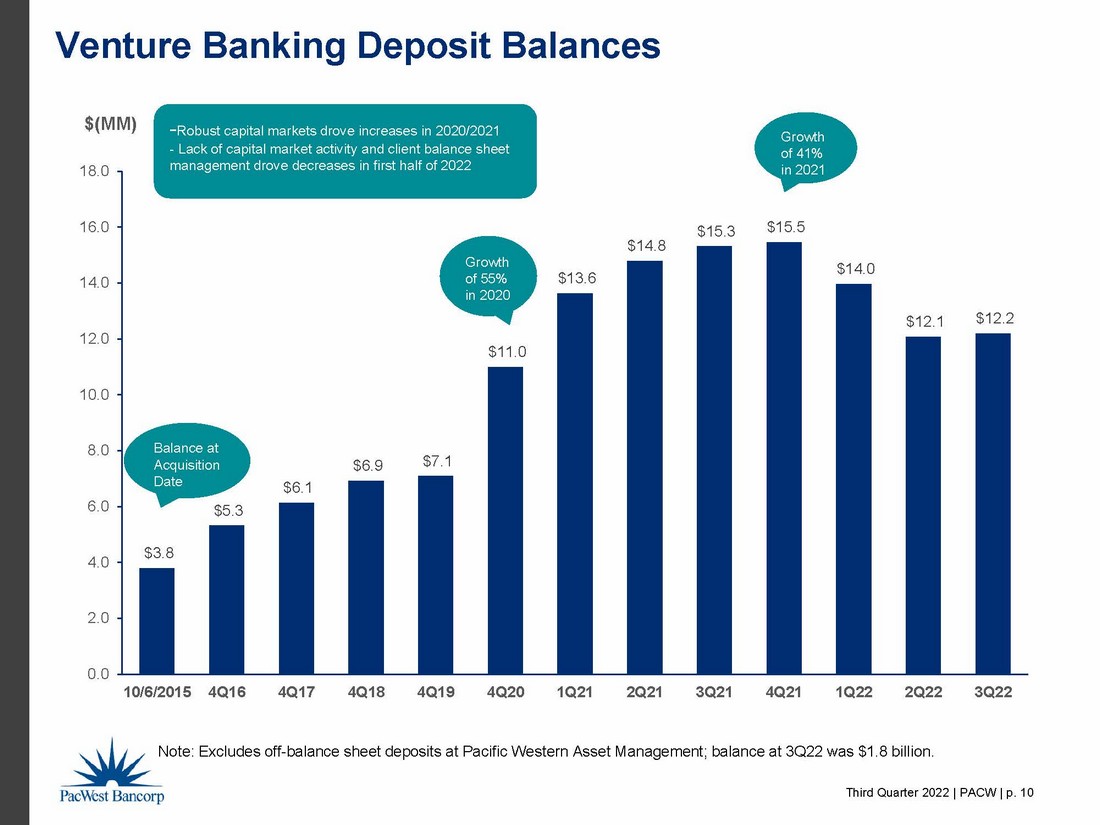
“We were also pleased with the stabilization in venture banking deposits, which grew by $129 million to $12.2 billion, contributing to total deposits growing by $228 million in the third quarter of 2022. After exceptionally strong loan growth in the first half of 2022, loan growth slowed in the third quarter of 2022 due to the expected impact from higher interest rates and our decision to slow loan growth as part of managing our balance sheet.”
“Credit quality remains strong as evidenced by credit metrics such as nonperforming assets of 34 basis points and net charge-offs of three basis points for the quarter and one basis point on a year-to-date basis.”
“Lastly, on a macroeconomic level as we assess the current state and direction of the economy we are thinking about and planning for a weaker economic outlook.”
Page 1
FINANCIAL HIGHLIGHTS
| At or For the | At or For the | |||||||||||||||||||||||
| Three Months Ended | Nine Months Ended | |||||||||||||||||||||||
| September 30, | June 30, | Increase | September 30, | Increase | ||||||||||||||||||||
| Financial Highlights (1) | 2022 | 2022 | (Decrease) | 2022 | 2021 | (Decrease) | ||||||||||||||||||
| (Dollars in thousands, except per share data) | ||||||||||||||||||||||||
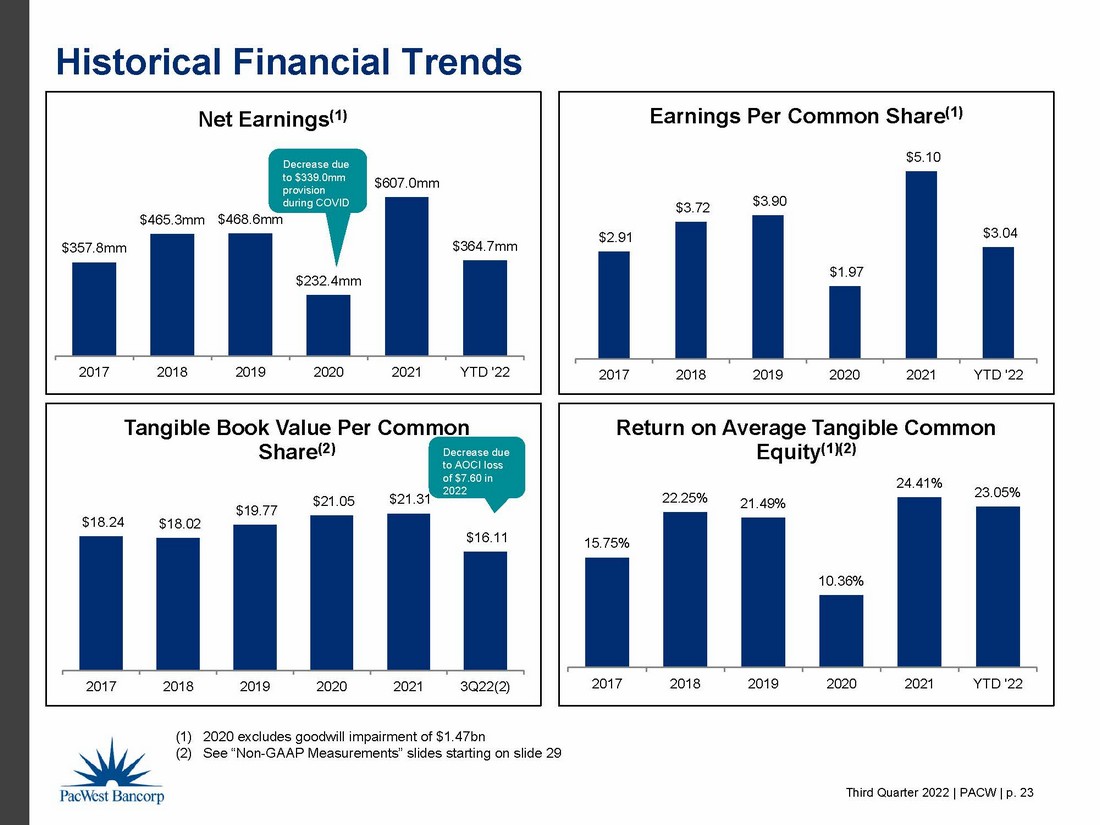
| Net earnings available to common stockholders | $ | 122,224 | $ | 122,360 | $ | (136 | ) | $ | 364,712 | $ | 470,914 | $ | (106,202 | ) | ||||||||||
| Diluted earnings per common share | $ | 1.02 | $ | 1.02 | $ | - | $ | 3.04 | $ | 3.96 | $ | (0.92 | ) | |||||||||||
| Pre-provision, pre-tax net revenue ("PPNR") (2) | $ | 178,182 | $ | 174,626 | $ | 3,556 | $ | 514,917 | $ | 478,657 | $ | 36,260 | ||||||||||||
| Return on average assets | 1.28 | % | 1.23 | % | 0.05 | 1.24 | % | 1.86 | % | (0.62 | ) | |||||||||||||
| PPNR return on average assets (2) | 1.73 | % | 1.75 | % | (0.02 | ) | 1.71 | % | 1.89 | % | (0.18 | ) | ||||||||||||
| Return on average tangible common equity (2) | 24.11 | % | 24.42 | % | (0.31 | ) | 23.05 | % | 25.20 | % | (2.15 | ) | ||||||||||||
| Yield on average loans and leases (tax equivalent) | 5.12 | % | 4.65 | % | 0.47 | 4.82 | % | 5.13 | % | (0.31 | ) | |||||||||||||
| Cost of average total deposits | 0.70 | % | 0.18 | % | 0.52 | 0.32 | % | 0.10 | % | 0.22 | ||||||||||||||
| Net interest margin ("NIM") (tax equivalent) | 3.57 | % | 3.56 | % | 0.01 | 3.52 | % | 3.46 | % | 0.06 | ||||||||||||||
| Efficiency ratio | 51.0 | % | 49.5 | % | 1.5 | 50.2 | % | 47.2 | % | 3.0 | ||||||||||||||
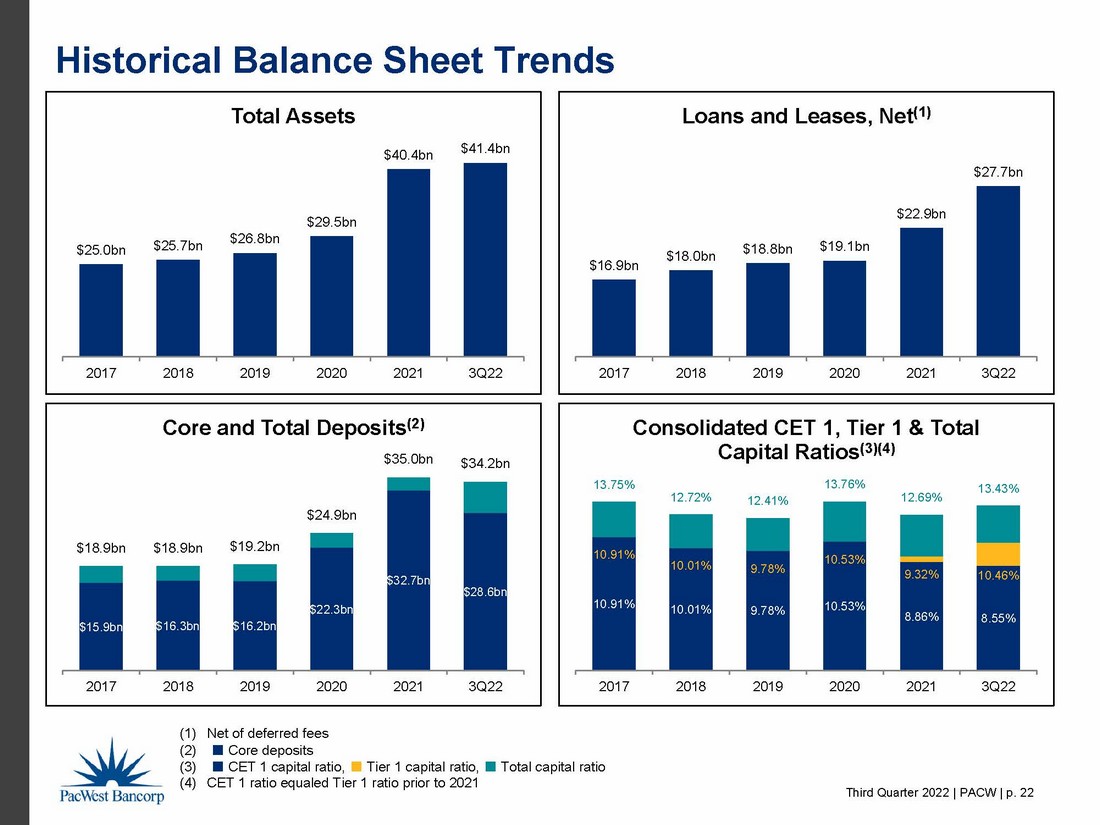
| Total assets | $ | 41,404,592 | $ | 40,950,723 | $ | 453,869 | $ | 41,404,592 | $ | 35,885,676 | $ | 5,518,916 | ||||||||||||
| Loans and leases held for investment, net of deferred fees | $ | 27,660,041 | $ | 26,501,137 | $ | 1,158,904 | $ | 27,660,041 | $ | 20,511,020 | $ | 7,149,021 | ||||||||||||
| Noninterest-bearing demand deposits | $ | 12,775,756 | $ | 13,338,029 | $ | (562,273 | ) | $ | 12,775,756 | $ | 12,881,806 | $ | (106,050 | ) | ||||||||||
| Core deposits | $ | 28,559,310 | $ | 29,218,646 | $ | (659,336 | ) | $ | 28,559,310 | $ | 28,140,708 | $ | 418,602 | |||||||||||
| Total deposits | $ | 34,195,872 | $ | 33,968,152 | $ | 227,720 | $ | 34,195,872 | $ | 30,559,745 | $ | 3,636,127 | ||||||||||||
| As percentage of total deposits: | ||||||||||||||||||||||||
| Noninterest-bearing demand deposits | 37 | % | 39 | % | (2 | ) | 37 | % | 42 | % | (5 | ) | ||||||||||||
| Core deposits | 83 | % | 86 | % | (3 | ) | 83 | % | 92 | % | (9 | ) | ||||||||||||
| Equity to assets ratio | 9.36 | % | 9.72 | % | (0.36 | ) | 9.36 | % | 10.92 | % | (1.56 | ) | ||||||||||||
| Common equity tier 1 capital ratio | 8.55 | % | 8.24 | % | 0.31 | 8.55 | % | 10.15 | % | (1.60 | ) | |||||||||||||
| Tier 1 capital ratio | 10.46 | % | 10.15 | % | 0.31 | 10.46 | % | 10.65 | % | (0.19 | ) | |||||||||||||
| Total capital ratio | 13.43 | % | 13.12 | % | 0.31 | 13.43 | % | 14.36 | % | (0.93 | ) | |||||||||||||
| Tangible common equity ratio (2) | 4.85 | % | 5.15 | % | (0.30 | ) | 4.85 | % | 7.79 | % | (2.94 | ) | ||||||||||||
| Tangible book value per common share (2) | $ | 16.11 | $ | 16.93 | $ | (0.82 | ) | $ | 16.11 | $ | 22.57 | $ | (6.46 | ) | ||||||||||
| (1) | The operations of the HOA Business are included from its October 8, 2021 acquisition date and the operations of Civic are included from its February 1, 2021 acquisition date. |
| (2) | Non-GAAP measure. |
Page 2
INCOME STATEMENT HIGHLIGHTS
NET INTEREST INCOME
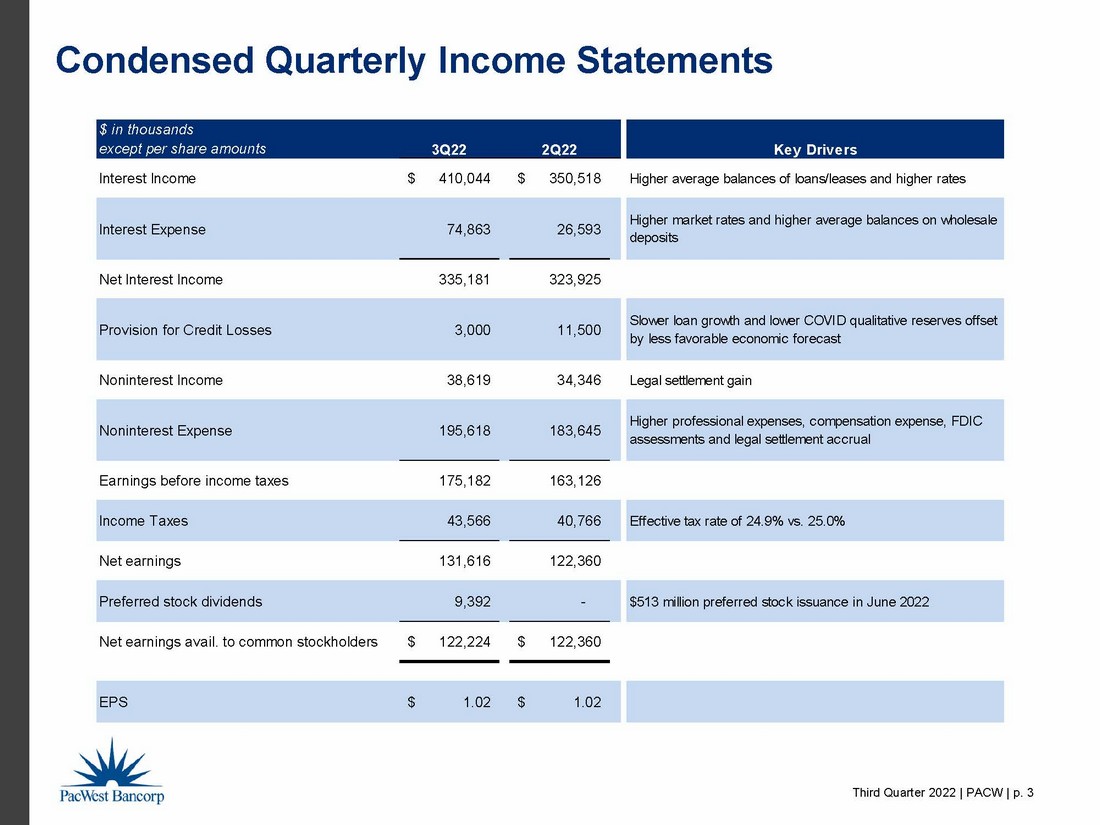
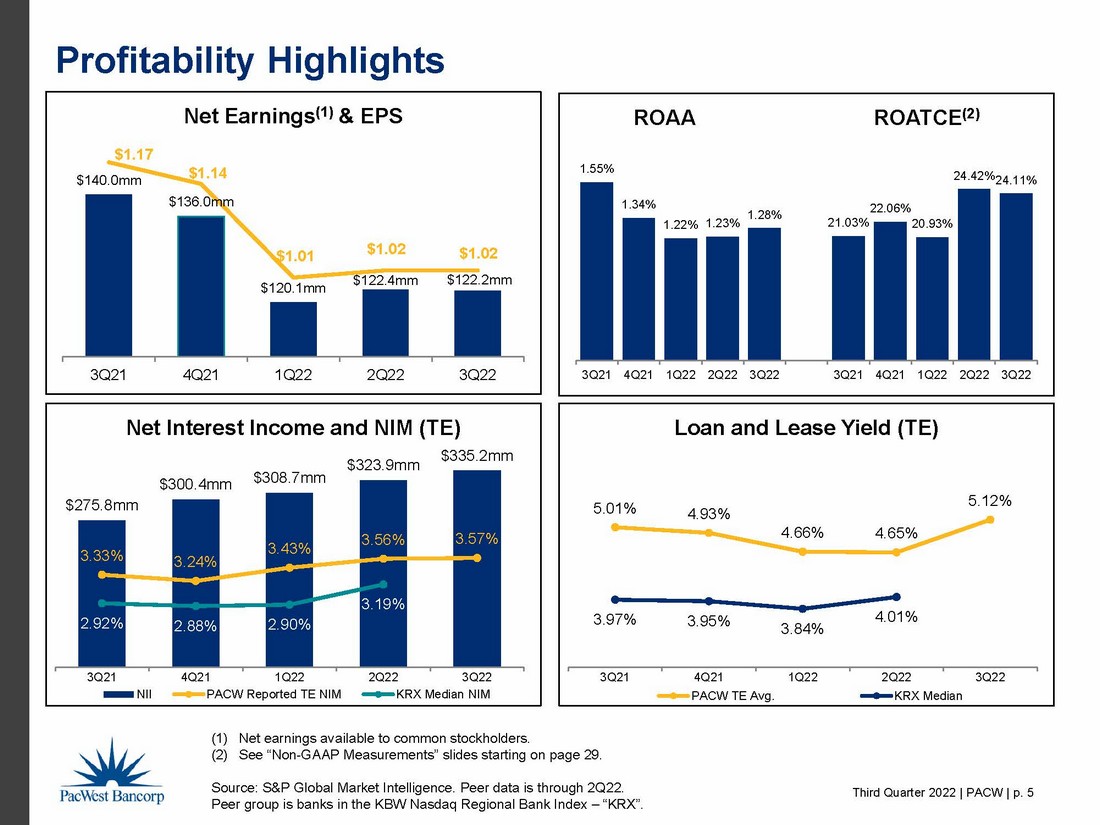
Net interest income increased by $11.3 million to $335.2 million for the third quarter of 2022 compared to $323.9 million for the second quarter of 2022. Interest income on loans and leases increased by $53.3 million in the third quarter of 2022 due to a $1.6 billion increase in the average balance of loans and leases and a 47 basis point increase in the tax equivalent yield on average loans and leases compared to the second quarter of 2022. Interest income on deposits in financial institutions increased by $6.0 million in the third quarter of 2022 due to a 139 basis point increase in the yield on average deposits in financial institutions, offset partially by a $175 million decrease in the average balance. The tax equivalent yield on average loans and leases was 5.12% for the third quarter of 2022 compared to 4.65% for the second quarter of 2022. The increase in the tax equivalent yield on average loans and leases was due primarily to higher coupon interest due to increased rates on new production and on existing variable rate loans. Interest expense on deposits increased by $45.9 million in the third quarter of 2022 due mainly to increased market rates and a higher level of wholesale deposits which contributed to a 52 basis point increase in the cost of average total deposits. Interest expense on borrowings and subordinated debt increased by $2.3 million due to a 190 basis points increase in the cost of average borrowings and subordinated debt, partially offset by an $851 million decrease in the average balance.
The tax equivalent NIM was 3.57% for the third quarter of 2022 compared to 3.56% for the second quarter of 2022. The slight increase in the NIM was due mainly to the change in the interest-earning assets mix driven by the increase in the balance of average loans and leases as a percentage of average interest-earning assets from 69% to 72%, the decrease in the balance of average investment securities as a percentage of average interest-earning assets from 26% to 23%, and the balance of average deposits in financial institutions as a percentage of average interest-earning assets remained unchanged at 5%. The balance of average loans and leases increased by $1.6 billion to $27.0 billion, the balance of average investment securities decreased by $685 million to $8.8 billion, and the balance of average deposits in financial institutions decreased by $175 million to $1.8 billion.
The cost of average total deposits was 0.70% for the third quarter of 2022 compared to 0.18% for the second quarter of 2022 due mainly to higher average balances and rates on higher-cost wholesale money market and brokered time deposits, as well as higher market rates on our deposit products.
PROVISION FOR CREDIT LOSSES
The following table presents details of the provision for credit losses for the periods indicated:
| Three Months Ended | ||||||||||||
| September 30, | June 30, | Increase | ||||||||||
| Provision for Credit Losses | 2022 | 2022 | (Decrease) | |||||||||
| (In thousands) | ||||||||||||
| Addition (reduction) in allowance for loan and lease losses | $ | 3,000 | $ | (10,000 | ) | $ | 13,000 | |||||
| Addition to reserve for unfunded loan commitments | - | 20,000 | (20,000 | ) | ||||||||
| Total loan-related provision | 3,000 | 10,000 | (7,000 | ) | ||||||||
| Addition to allowance for held-to-maturity securities | - | 1,500 | (1,500 | ) | ||||||||
| Total provision for credit losses | $ | 3,000 | $ | 11,500 | $ | (8,500 | ) | |||||
Page 3
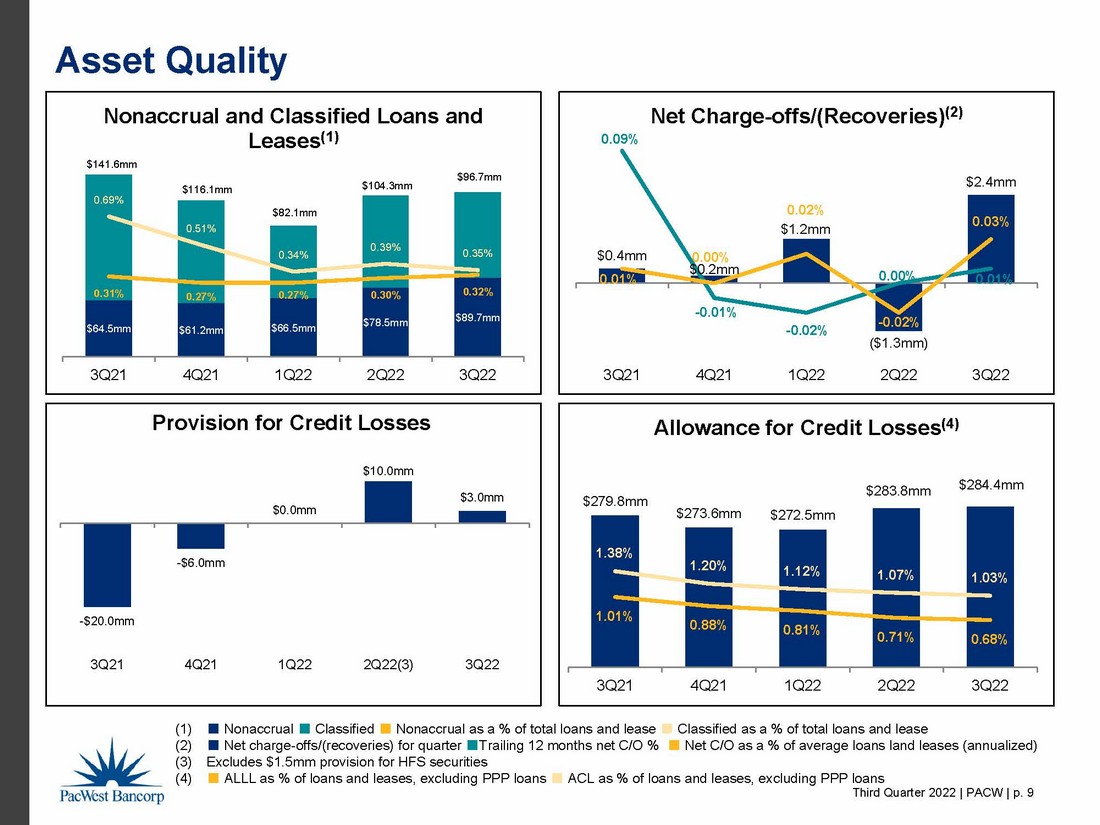
The provision for credit losses was $3.0 million for the third quarter of 2022 compared to $11.5 million for the second quarter of 2022. The $7.0 million decrease in the loan-related provision was due mainly to a lower level of growth in loans and leases and unfunded commitments in the third versus the second quarter of 2022 and a decrease in COVID-related qualitative reserves, partially offset by increased reserves needed due to a less favorable economic forecast in the third versus the second quarter of 2022.
Noninterest Income
The following table presents details of noninterest income for the periods indicated:
| Three Months Ended | ||||||||||||
| September 30, | June 30, | Increase | ||||||||||
| Noninterest Income | 2022 | 2022 | (Decrease) | |||||||||
| (In thousands) | ||||||||||||
| Service charges on deposit accounts | $ | 3,608 | $ | 3,634 | $ | (26 | ) | |||||
| Other commissions and fees | 10,034 | 10,813 | (779 | ) | ||||||||
| Leased equipment income | 12,835 | 12,335 | 500 | |||||||||
| Gain on sale of loans and leases | 58 | 12 | 46 | |||||||||
| Gain (loss) on sale of securities | 86 | (1,209 | ) | 1,295 | ||||||||
| Dividends and gains on equity investments | 3,228 | 4,097 | (869 | ) | ||||||||
| Warrant income | 292 | 1,615 | (1,323 | ) | ||||||||
| Other income | 8,478 | 3,049 | 5,429 | |||||||||
| Total noninterest income | $ | 38,619 | $ | 34,346 | $ | 4,273 | ||||||
Noninterest income increased by $4.3 million to $38.6 million for the third quarter of 2022 compared to $34.3 million for the second quarter of 2022 due primarily to increases of $5.4 million in other income and $1.3 million in gain on sale of securities, offset partially by a decrease of $1.3 million in warrant income and a decrease of $0.9 million in dividends and gains on equity investments. The increase in other income was due primarily to the receipt of a $5.5 million legal settlement, net of current year legal fees. The increase in gain on sale of securities resulted from the sale of $440.4 million of securities for a net gain of $86,000 compared to sales of $393.4 million of securities for a net loss of $1.2 million for the second quarter of 2022. Warrant income was lower due to a lack of capital market activities. The decrease in dividends and gains on equity investments was due to lower fair value gains on equity investments still held and SBIC investments, partially offset by lower losses on sales of equity investments and increased income distributions on SBIC investments.
Page 4
Noninterest Expense
The following table presents details of noninterest expense for the periods indicated:
| Three Months Ended | ||||||||||||
| September 30, | June 30, | Increase | ||||||||||
| Noninterest Expense | 2022 | 2022 | (Decrease) | |||||||||
| (In thousands) | ||||||||||||
| Compensation | $ | 105,933 | $ | 102,542 | $ | 3,391 | ||||||
| Occupancy | 15,574 | 15,268 | 306 | |||||||||
| Data processing | 9,568 | 9,258 | 310 | |||||||||
| Other professional services | 10,674 | 6,726 | 3,948 | |||||||||
| Insurance and assessments | 7,159 | 5,632 | 1,527 | |||||||||
| Intangible asset amortization | 3,649 | 3,649 | - | |||||||||
| Leased equipment depreciation | 8,908 | 8,934 | (26 | ) | ||||||||
| Foreclosed assets (income) expense, net | (248 | ) | (28 | ) | (220 | ) | ||||||
| Customer related expense | 12,673 | 11,748 | 925 | |||||||||
| Loan expense | 6,228 | 7,037 | (809 | ) | ||||||||
| Other | 15,500 | 12,879 | 2,621 | |||||||||
| Total noninterest expense | $ | 195,618 | $ | 183,645 | $ | 11,973 | ||||||
Noninterest expense increased by $12.0 million to $195.6 million for the third quarter of 2022 compared to $183.6 million for the second quarter of 2022 due primarily to increases of $3.9 million in other professional services, $3.4 million in compensation expense, $2.6 million in other expense, and $1.5 million in insurance and assessments expense. The increase in other professional services was due mostly to issuance costs of the credit-linked notes transaction. The increase in compensation expense was due mainly to an increase in our headcount by 68 FTEs during the third quarter primarily related to hiring at Civic and for our digital and innovation initiatives. The increase in other expense was due primarily to a legal settlement accrual. The increase in insurance and assessments expense was due to higher FDIC assessment expense due to downward trends in core deposits and capital levels in the first half of 2022. Noninterest expense includes $7.0 million of non-recurring expenses in the third quarter of 2022 related to the issuance costs of the credit-linked notes transaction and a legal settlement accrual.
Income Taxes
The effective income tax rate was 24.9% for the third quarter of 2022 compared to 25.0% for the second quarter of 2022. The effective tax rate for the full year 2022 is currently estimated to be in the range of 25% to 27%.
Page 5
BALANCE SHEET HIGHLIGHTS
Deposits and Client Investment Funds
The following table presents the composition of our deposit portfolio as of the dates indicated:
| September 30, 2022 | June 30, 2022 | September 30, 2021 | ||||||||||||||||||||||
| % of | % of | % of | ||||||||||||||||||||||
| Deposit Composition | Balance | Total | Balance | Total | Balance | Total | ||||||||||||||||||
| (Dollars in thousands) | ||||||||||||||||||||||||
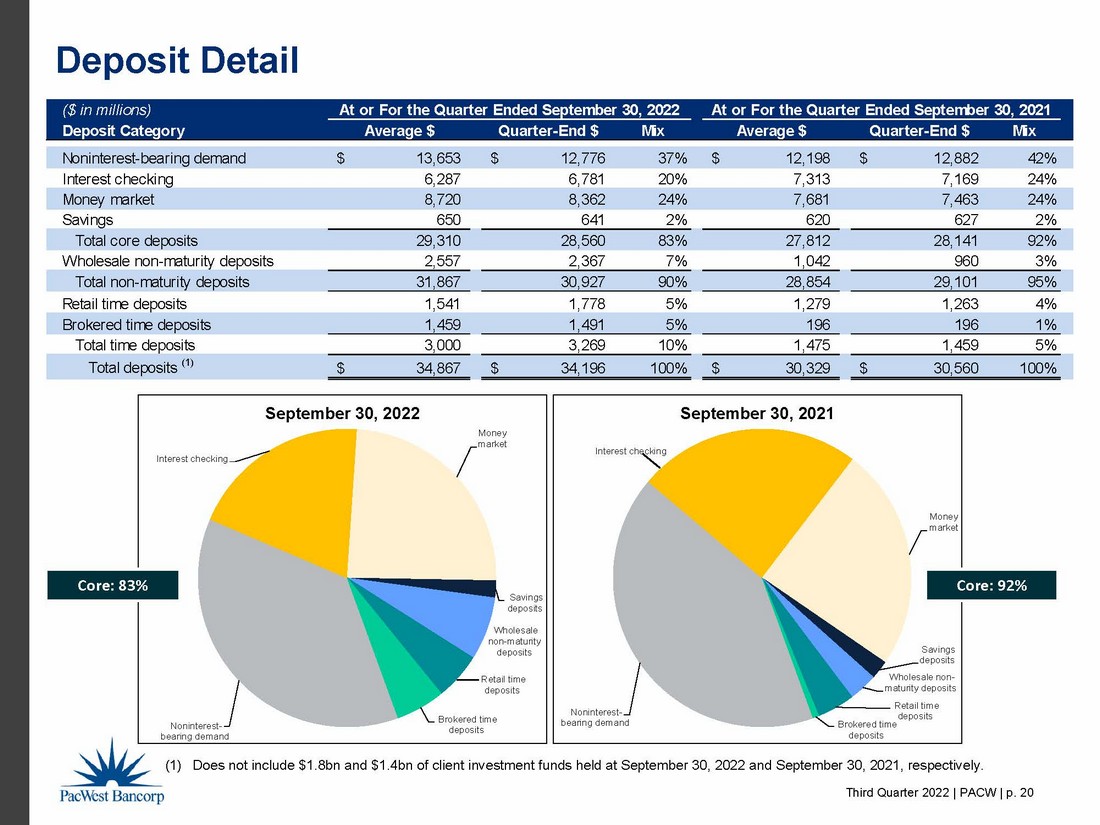
| Noninterest-bearing demand | $ | 12,775,756 | 37 | % | $ | 13,338,029 | 39 | % | $ | 12,881,806 | 42 | % | ||||||||||||
| Interest checking | 6,780,900 | 20 | % | 6,197,234 | 18 | % | 7,168,472 | 24 | % | |||||||||||||||
| Money market | 8,361,779 | 24 | % | 9,029,433 | 27 | % | 7,463,261 | 24 | % | |||||||||||||||
| Savings | 640,875 | 2 | % | 653,950 | 2 | % | 627,169 | 2 | % | |||||||||||||||
| Total core deposits | 28,559,310 | 83 | % | 29,218,646 | 86 | % | 28,140,708 | 92 | % | |||||||||||||||
| Wholesale non-maturity deposits | 2,367,544 | 7 | % | 2,185,248 | 6 | % | 960,438 | 3 | % | |||||||||||||||
| Total non-maturity deposits | 30,926,854 | 90 | % | 31,403,894 | 92 | % | 29,101,146 | 95 | % | |||||||||||||||
| Retail time deposits | 1,778,325 | 5 | % | 1,354,198 | 4 | % | 1,262,864 | 4 | % | |||||||||||||||
| Brokered time deposits | 1,490,693 | 5 | % | 1,210,060 | 4 | % | 195,735 | 1 | % | |||||||||||||||
| Total time deposits (1) | 3,269,018 | 10 | % | 2,564,258 | 8 | % | 1,458,599 | 5 | % | |||||||||||||||
| Total deposits | $ | 34,195,872 | 100 | % | $ | 33,968,152 | 100 | % | $ | 30,559,745 | 100 | % | ||||||||||||
| (1) | Includes time deposits over $250,000 of $1.0 billion, $665.9 million, and $576.0 million at September 30, 2022, June 30, 2022, and September 30, 2021, respectively. |
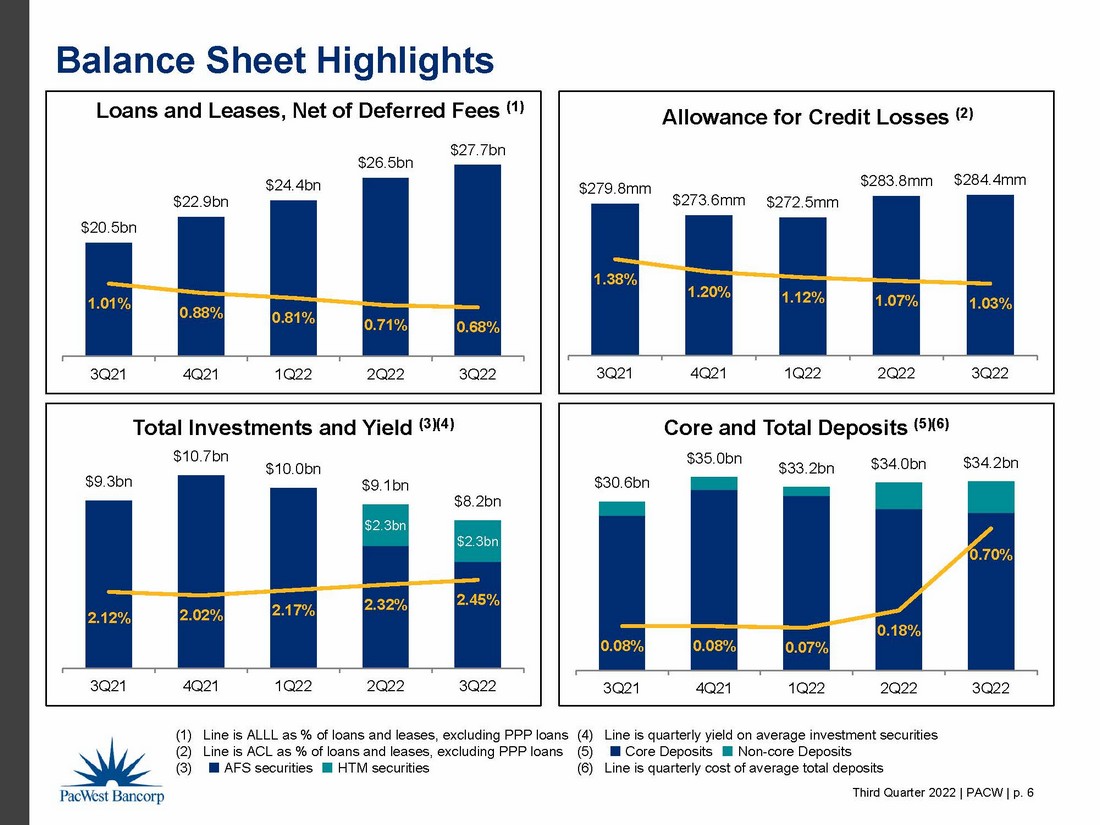
Total deposits increased by $228 million or 0.7% in the third quarter of 2022 due to a $705 million increase in time deposits and a $182 million increase in wholesale non-maturity deposits, offset partially by a decrease in core deposits. Total venture banking deposits increased from $12.1 billion as of June 30, 2022 to $12.2 billion as of September 30, 2022. At September 30, 2022, core deposits totaled $28.6 billion or 83% of total deposits, including $12.8 billion of noninterest-bearing demand deposits or 37% of total deposits. Core deposits decreased by $659 million or 2.3% in the third quarter of 2022 driven primarily by a $586 million decrease in balances from our community banking clients primarily in September due to client business activity.
In addition to deposit products, we also offer alternative, non-depository cash investment options for select clients. These alternative options include investments managed by Pacific Western Asset Management Inc. (“PWAM”), our registered investment advisor subsidiary, and third-party sweep products. Total off-balance sheet client investment funds decreased from $2.1 billion as of June 30, 2022 to $1.8 billion as of September 30, 2022, of which $1.1 billion was managed by PWAM. The decrease of $0.3 billion was primarily attributable to deposit transfers by venture banking clients back onto our balance sheet.
Page 6
Loans and Leases
The following table presents roll forwards of loans and leases held for investment, net of deferred fees, for the periods indicated:
| Three Months Ended | Nine Months Ended | |||||||||||
| Roll Forward of Loans and Leases Held for Investment, Net of Deferred Fees |
September 30, 2022 |
June 30, 2022 |
September 30, 2022 |
|||||||||
| (Dollars in thousands) | ||||||||||||
| Balance, beginning of period | $ | 26,501,137 | $ | 24,352,072 | $ | 22,941,548 | ||||||
| Additions: | ||||||||||||
| Production | 1,758,107 | 2,815,181 | 7,148,148 | |||||||||
| Disbursements | 1,677,795 | 1,871,627 | 5,138,574 | |||||||||
| Total production and disbursements | 3,435,902 | 4,686,808 | 12,286,722 | |||||||||
| Reductions: | ||||||||||||
| Payoffs | (977,654 | ) | (1,347,447 | ) | (3,773,781 | ) | ||||||
| Paydowns | (1,256,557 | ) | (1,183,178 | ) | (3,704,306 | ) | ||||||
| Total payoffs and paydowns | (2,234,211 | ) | (2,530,625 | ) | (7,478,087 | ) | ||||||
| Sales | (19,635 | ) | (4,319 | ) | (60,652 | ) | ||||||
| Transfers to foreclosed assets | (2,966 | ) | - | (3,271 | ) | |||||||
| Charge-offs | (4,652 | ) | (2,799 | ) | (10,685 | ) | ||||||
| Transfers to loans held for sale | (15,534 | ) | - | (15,534 | ) | |||||||
| Total reductions | (2,276,998 | ) | (2,537,743 | ) | (7,568,229 | ) | ||||||
| Net increase | 1,158,904 | 2,149,065 | 4,718,493 | |||||||||
| Balance, end of period | $ | 27,660,041 | $ | 26,501,137 | $ | 27,660,041 | ||||||
| Weighted average rate on production (1) | 5.92 | % | 4.61 | % | 4.82 | % | ||||||
| (1) | The weighted average rate on production presents contractual rates on a tax equivalent basis and excludes amortized fees. Amortized fees added approximately 22 basis points to loan yields in 2022. |
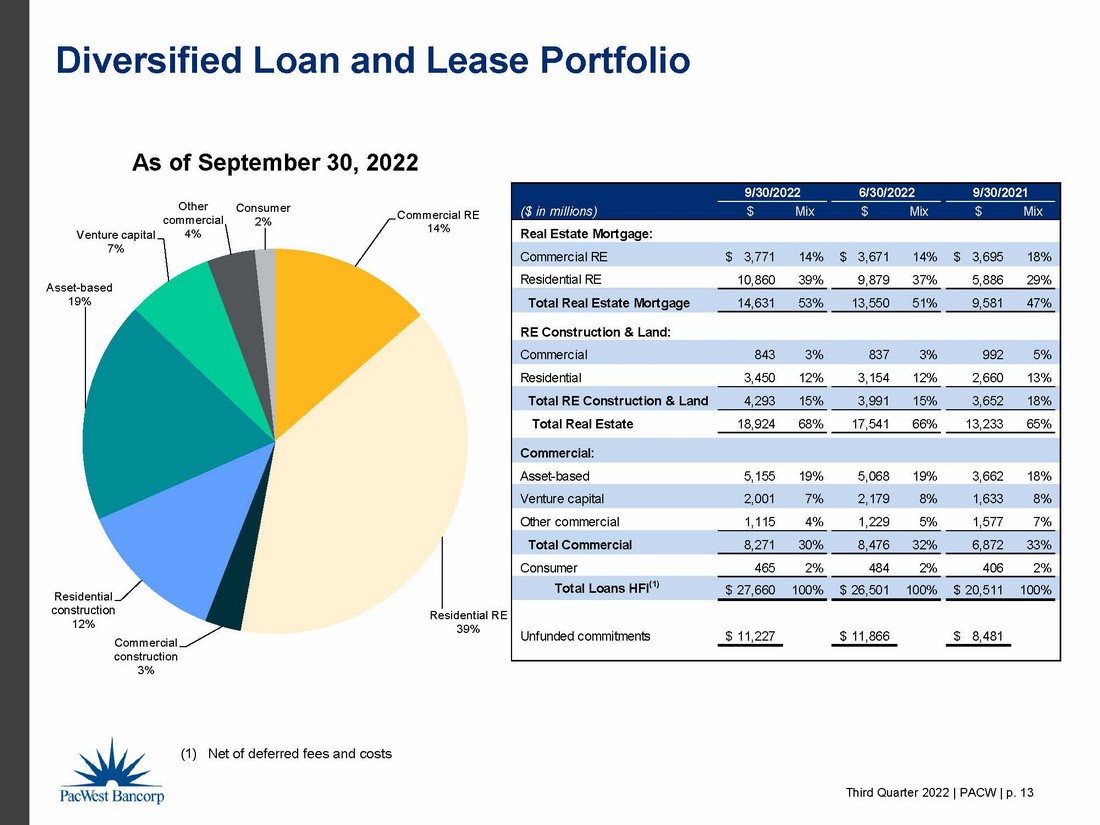
Loans and leases held for investment, net of deferred fees, increased by $1.2 billion or 4.4% in the third quarter of 2022 to $27.7 billion at September 30, 2022. The overall increase in the loans and leases balance for the third quarter of 2022 was due primarily to increases in the residential real estate mortgage and residential real estate construction portfolios.
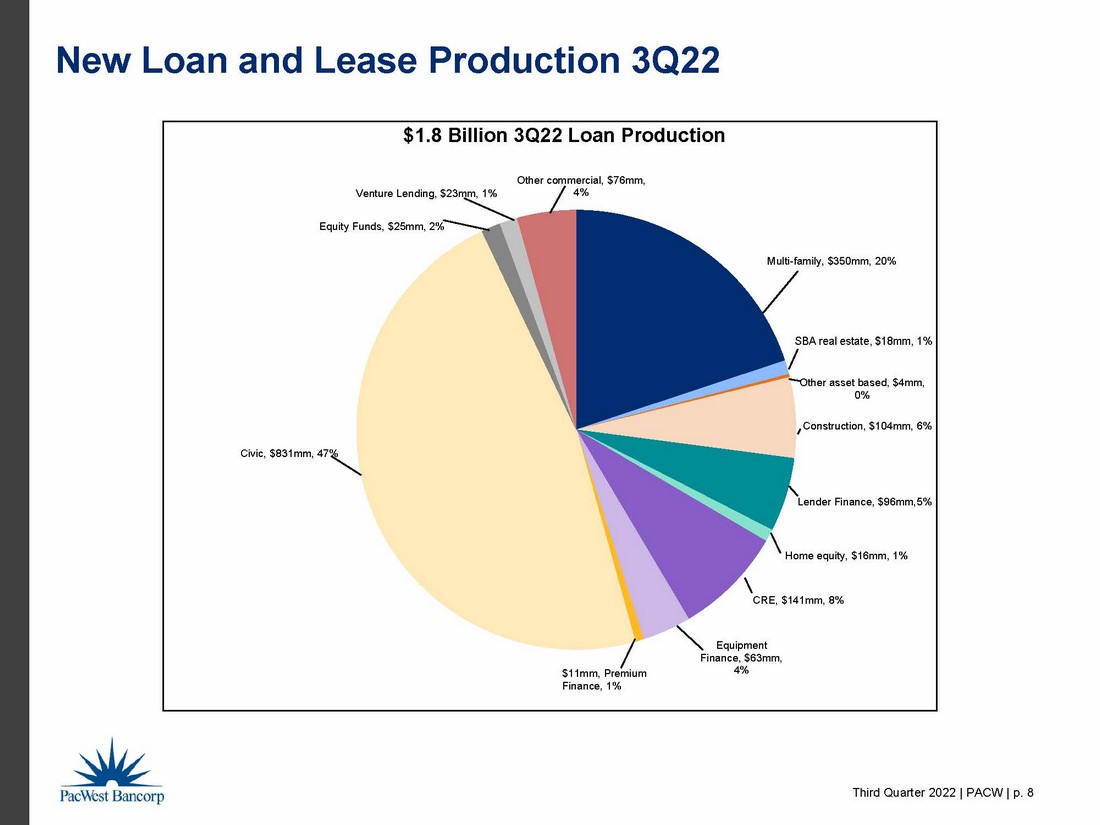
Civic loan production was $831 million for the third quarter of 2022 compared to $847 million for the second quarter of 2022. The Civic loan portfolio as of September 30, 2022 totaled $2.9 billion.
The weighted average rate on the $1.8 billion of production for the third quarter of 2022 increased to 5.92% from 4.61% for the second quarter of 2022 due primarily to the loan mix (lower percentage of multi-family production, no single-family loan pool purchases, and a higher percentage of Civic production) and the increase in market interest rates.
Page 7
The following table presents the composition of loans and leases held for investment by loan portfolio segment and class, net of deferred fees, as of the dates indicated:
| September 30, 2022 | June 30, 2022 | September 30, 2021 | ||||||||||||||||||||||
| % of | % of | % of | ||||||||||||||||||||||
| Loan and Lease Portfolio | Balance | Total | Balance | Total | Balance | Total | ||||||||||||||||||
| (Dollars in thousands) | ||||||||||||||||||||||||
| Real estate mortgage: | ||||||||||||||||||||||||
| Commercial | $ | 3,770,706 | 14 | % | $ | 3,670,515 | 14 | % | $ | 3,694,597 | 18 | % | ||||||||||||
| Residential | 10,860,043 | 39 | % | 9,879,131 | 37 | % | 5,886,360 | 29 | % | |||||||||||||||
| Total real estate mortgage | 14,630,749 | 53 | % | 13,549,646 | 51 | % | 9,580,957 | 47 | % | |||||||||||||||
| Real estate construction and land: | ||||||||||||||||||||||||
| Commercial | 843,086 | 3 | % | 837,423 | 3 | % | 992,003 | 5 | % | |||||||||||||||
| Residential | 3,450,430 | 12 | % | 3,153,616 | 12 | % | 2,659,870 | 13 | % | |||||||||||||||
| Total real estate construction and land | 4,293,516 | 15 | % | 3,991,039 | 15 | % | 3,651,873 | 18 | % | |||||||||||||||
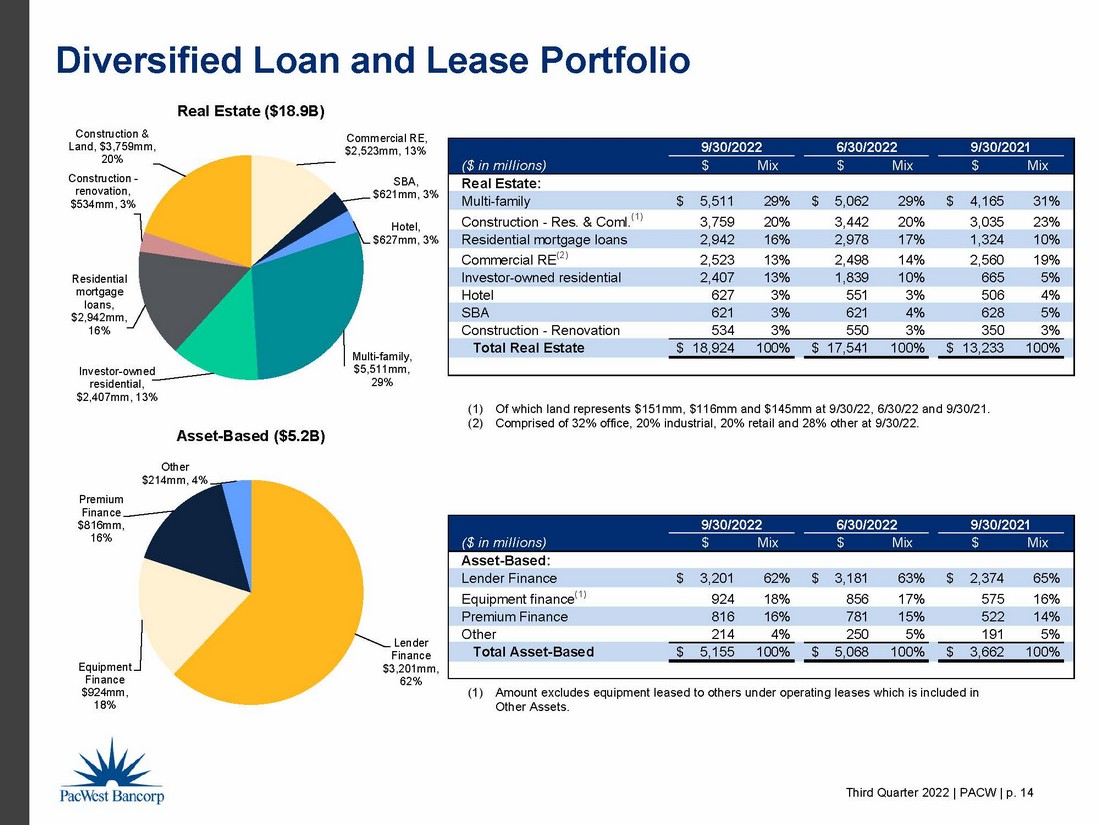
| Total real estate | 18,924,265 | 68 | % | 17,540,685 | 66 | % | 13,232,830 | 65 | % | |||||||||||||||
| Commercial: | ||||||||||||||||||||||||
| Asset-based | 5,154,654 | 19 | % | 5,068,112 | 19 | % | 3,661,769 | 18 | % | |||||||||||||||
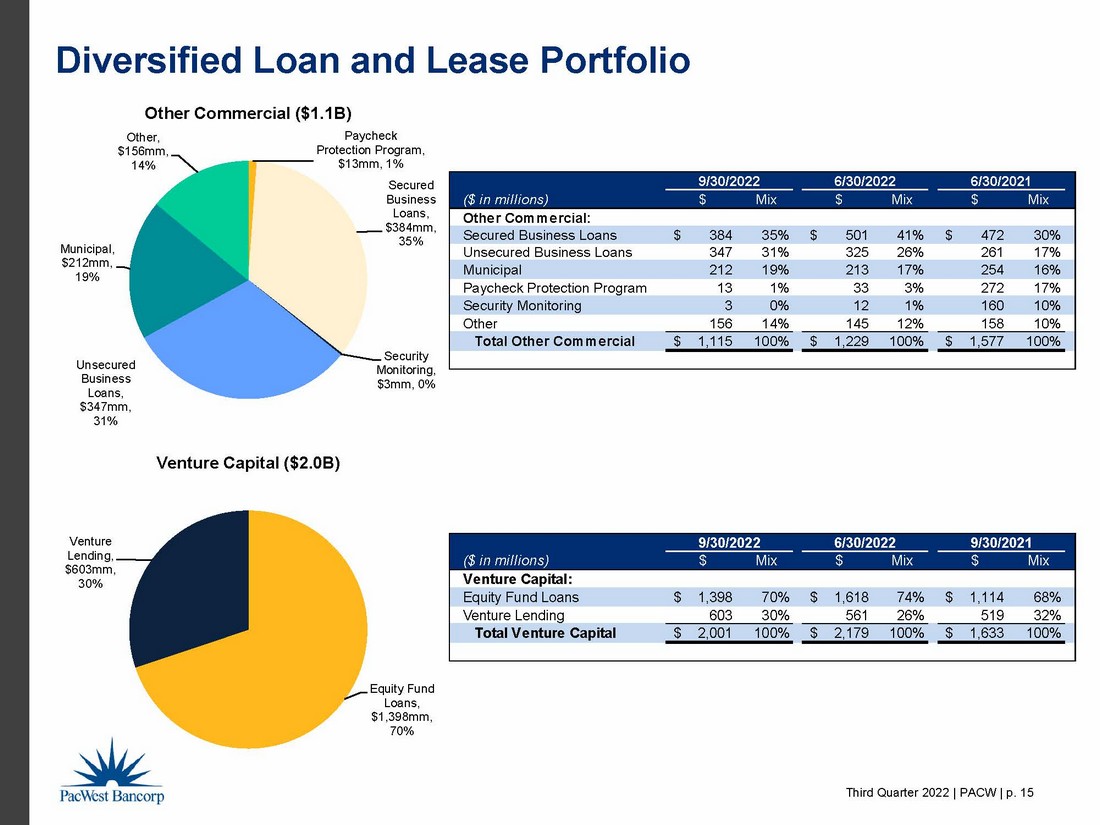
| Venture capital | 2,001,086 | 7 | % | 2,179,190 | 8 | % | 1,632,861 | 8 | % | |||||||||||||||
| Other commercial | 1,115,442 | 4 | % | 1,229,504 | 5 | % | 1,577,592 | 7 | % | |||||||||||||||
| Total commercial | 8,271,182 | 30 | % | 8,476,806 | 32 | % | 6,872,222 | 33 | % | |||||||||||||||
| Consumer | 464,594 | 2 | % | 483,646 | 2 | % | 405,968 | 2 | % | |||||||||||||||
| Total loans and leases held for | ||||||||||||||||||||||||
| investment, net of deferred fees | $ | 27,660,041 | 100 | % | $ | 26,501,137 | 100 | % | $ | 20,511,020 | 100 | % | ||||||||||||
| Total unfunded loan commitments | $ | 11,227,234 | $ | 11,866,437 | $ | 8,480,599 | ||||||||||||||||||
Allowance for Credit Losses ON LOANS AND LEASES
The following tables present roll forwards of the allowance for credit losses on loans and leases for the periods indicated:
| Three Months Ended September 30, 2022 | ||||||||||||
| Allowance for | Reserve for | Total | ||||||||||
| Loan and | Unfunded Loan | Allowance for | ||||||||||
| Allowance for Credit Losses on Loans and Leases Rollforward | Lease Losses | Commitments | Credit Losses | |||||||||
| (In thousands) | ||||||||||||
| Beginning balance | $ | 188,705 | $ | 95,071 | $ | 283,776 | ||||||
| Charge-offs | (4,652 | ) | - | (4,652 | ) | |||||||
| Recoveries | 2,274 | - | 2,274 | |||||||||
| Net charge-offs | (2,378 | ) | - | (2,378 | ) | |||||||
| Provision | 3,000 | - | 3,000 | |||||||||
| Ending balance | $ | 189,327 | $ | 95,071 | $ | 284,398 | ||||||
| Three Months Ended June 30, 2022 | ||||||||||||
| Allowance for | Reserve for | Total | ||||||||||
| Loan and | Unfunded Loan | Allowance for | ||||||||||
| Allowance for Credit Losses on Loans and Leases Rollforward | Lease Losses | Commitments | Credit Losses | |||||||||
| (In thousands) | ||||||||||||
| Beginning balance | $ | 197,398 | $ | 75,071 | $ | 272,469 | ||||||
| Charge-offs | (2,799 | ) | - | (2,799 | ) | |||||||
| Recoveries | 4,106 | - | 4,106 | |||||||||
| Net recoveries | 1,307 | - | 1,307 | |||||||||
| Provision | (10,000 | ) | 20,000 | 10,000 | ||||||||
| Ending balance | $ | 188,705 | $ | 95,071 | $ | 283,776 | ||||||
Page 8
The following table presents allowance for credit losses information on loans and leases as of and for the dates and periods indicated:
| September 30, | June 30, | Increase | ||||||||||
| Allowance for Credit Losses on Loans and Leases | 2022 | 2022 | (Decrease) | |||||||||
| (Dollars in thousands) | ||||||||||||
| Allowance for loan and lease losses | $ | 189,327 | $ | 188,705 | $ | 622 | ||||||
| Reserve for unfunded loan commitments | 95,071 | 95,071 | - | |||||||||
| Allowance for credit losses | $ | 284,398 | $ | 283,776 | $ | 622 | ||||||
| Provision for credit losses (for the quarter) | $ | 3,000 | $ | 10,000 | $ | (7,000 | ) | |||||
| Net charge-offs (recoveries) (for the quarter) | $ | 2,378 | $ | (1,307 | ) | $ | 3,685 | |||||
| Net charge-offs (recoveries) to average loans and leases (for the quarter) | 0.03 | % | (0.02 | )% | ||||||||
| Allowance for loan and lease losses to loans and leases held for investment | 0.68 | % | 0.71 | % | ||||||||
| Allowance for credit losses to loans and leases held for investment | 1.03 | % | 1.07 | % | ||||||||
The allowance for credit losses increased by $0.6 million in the third quarter of 2022 to $284.4 million at September 30, 2022. This increase was attributable mainly to a $3.0 million provision for credit losses, offset partially by $2.4 million in net charge-offs.
Net charge-offs over the trailing twelve months were $2.4 million, which results in net charge-offs to average loans and leases over the trailing twelve months of 0.1%.
Page 9
CREDIT QUALITY
The following table presents loan and lease credit quality metrics as of the dates indicated:
| September 30, | June 30, | Increase | ||||||||||
| Credit Quality Metrics | 2022 | 2022 | (Decrease) | |||||||||
| (Dollars in thousands) | ||||||||||||
| NPAs and Performing TDRs: | ||||||||||||
| Nonaccrual loans and leases held for investment (1) | $ | 89,742 | $ | 78,527 | $ | 11,215 | ||||||
| Accruing loans contractually past due 90 days or more | - | - | - | |||||||||
| Foreclosed assets, net | 2,967 | - | 2,967 | |||||||||
| Total nonperforming assets ("NPAs") | $ | 92,709 | $ | 78,527 | $ | 14,182 | ||||||
| Performing TDRs held for investment | $ | 8,106 | $ | 11,723 | $ | (3,617 | ) | |||||
| Nonaccrual loans and leases held for investment to loans and leases held for investment | 0.32 | % | 0.30 | % | ||||||||
| Nonperforming assets to loans and leases held for investment and foreclosed assets | 0.34 | % | 0.30 | % | ||||||||
| Allowance for credit losses to nonaccrual loans and leases held for investment | 316.9 | % | 361.4 | % | ||||||||
| (1) Nonaccrual loans include SBA guaranteed amounts of $17.2 million at September 30, 2022 and $13.8 million at June 30, 2022. |
Nonaccrual loans and leases increased by $11.2 million to $89.7 million in the third quarter of 2022 due primarily to a $15.5 million office building loan.
The following table presents nonaccrual loans and leases and accruing loans and leases past due between 30 and 89 days by loan portfolio segment and class as of the dates indicated:
| September 30, 2022 | June 30, 2022 | Increase (Decrease) | ||||||||||||||||||||||
| Accruing | Accruing | Accruing | ||||||||||||||||||||||
| and 30-89 | and 30-89 | and 30-89 | ||||||||||||||||||||||
| Days Past | Days Past | Days Past | ||||||||||||||||||||||
| Nonaccrual | Due | Nonaccrual | Due | Nonaccrual | Due | |||||||||||||||||||
| (In thousands) | ||||||||||||||||||||||||
| Real estate mortgage: | ||||||||||||||||||||||||
| Commercial | $ | 42,772 | $ | 14 | $ | 28,529 | $ | 14 | $ | 14,243 | $ | - | ||||||||||||
| Residential | 25,950 | 21,700 | 27,524 | 13,577 | (1,574 | ) | 8,123 | |||||||||||||||||
| Total real estate mortgage | 68,722 | 21,714 | 56,053 | 13,591 | 12,669 | 8,123 | ||||||||||||||||||
| Real estate construction and land: | ||||||||||||||||||||||||
| Commercial | - | - | - | - | - | - | ||||||||||||||||||
| Residential | 7,101 | 3,051 | 13,287 | 25,981 | (6,186 | ) | (22,930 | ) | ||||||||||||||||
| Total real estate construction and land | 7,101 | 3,051 | 13,287 | 25,981 | (6,186 | ) | (22,930 | ) | ||||||||||||||||
| Commercial: | ||||||||||||||||||||||||
| Asset-based | 2,127 | - | 1,189 | - | 938 | - | ||||||||||||||||||
| Venture capital | 3,809 | - | 3,120 | - | 689 | - | ||||||||||||||||||
| Other commercial | 7,616 | 265 | 4,655 | 9,503 | 2,961 | (9,238 | ) | |||||||||||||||||
| Total commercial | 13,552 | 265 | 8,964 | 9,503 | 4,588 | (9,238 | ) | |||||||||||||||||
| Consumer | 367 | 1,996 | 223 | 1,711 | 144 | 285 | ||||||||||||||||||
| Total held for investment | $ | 89,742 | $ | 27,026 | $ | 78,527 | $ | 50,786 | $ | 11,215 | $ | (23,760 | ) | |||||||||||
Loans and leases accruing and 30-89 days past due generally fluctuate from period to period. The $23.8 million decrease in the third quarter of 2022 was primarily in Civic residential construction loans and in the other commercial category, offset partially by an increase in the residential mortgage loans category.
Page 10
CAPITAL
Our CET1, Tier 1, Total capital, and Tier 1 leverage capital ratios increased during the third quarter of 2022 due mainly to strong earnings and the completion of the credit-linked notes transaction on September 29, 2022, which added approximately 20 basis points to the CET1 ratio. The notes sold had an aggregate principal amount of $132.8 million with net proceeds of approximately $128.7 million. The notes are linked to the credit risk of an approximately $2.66 billion reference pool of previously purchased single-family residential mortgage loans. The notes were issued in five classes with a blended interest rate of SOFR plus 11%. The transaction results in a lower risk-weighting on the reference pool of loans for regulatory capital purposes. The following table presents capital ratios as of the dates indicated:
| September 30, | June 30, | September 30, | ||||||||||
| 2022 | 2022 | 2021 | ||||||||||
| PacWest Bancorp Consolidated: | ||||||||||||
| Common equity tier 1 capital ratio (1) | 8.55 | % | 8.24 | % | 10.15 | % | ||||||
| Tier 1 capital ratio (1) | 10.46 | % | 10.15 | % | 10.65 | % | ||||||
| Total capital ratio (1) | 13.43 | % | 13.12 | % | 14.36 | % | ||||||
| Tier 1 leverage capital ratio (1) | 8.63 | % | 8.52 | % | 8.05 | % | ||||||
| Risk-weighted assets (1) (in thousands) | $ | 33,055,996 | $ | 33,009,455 | $ | 26,057,583 | ||||||
| Tangible common equity ratio (2) | 4.85 | % | 5.15 | % | 7.79 | % | ||||||
| Tangible common equity ratio excluding the impact of AOCI for securities (2) | 6.97 | % | 6.79 | % | 7.50 | % | ||||||
| (1) Capital information for September 30, 2022 is preliminary. | |||||
| (2) Non-GAAP measure. | |||||
CONFERENCE CALL
PacWest Bancorp (“PacWest”) will host a conference call at 8:00 AM PT/ 11:00 AM ET on Thursday, October 20, 2022 to discuss the Company’s performance for the third quarter of 2022.
Participants may access the conference call/webcast at:
Participant Dial-in: (800) 458-4121
Participant Webcast Link: https://event.webcasts.com/starthere.jsp?ei=1562576&tp_key=817f59ebeb
Confirmation Code: 8001555
The call will be recorded and made available for replay on October 20, 2022, after 12:00 PM PT. The recording may be accessed through the link above or at https://www.pacwestbancorp.com/news-market-data/presentations/default.aspx.
Page 11
ABOUT PACWEST BANCORP
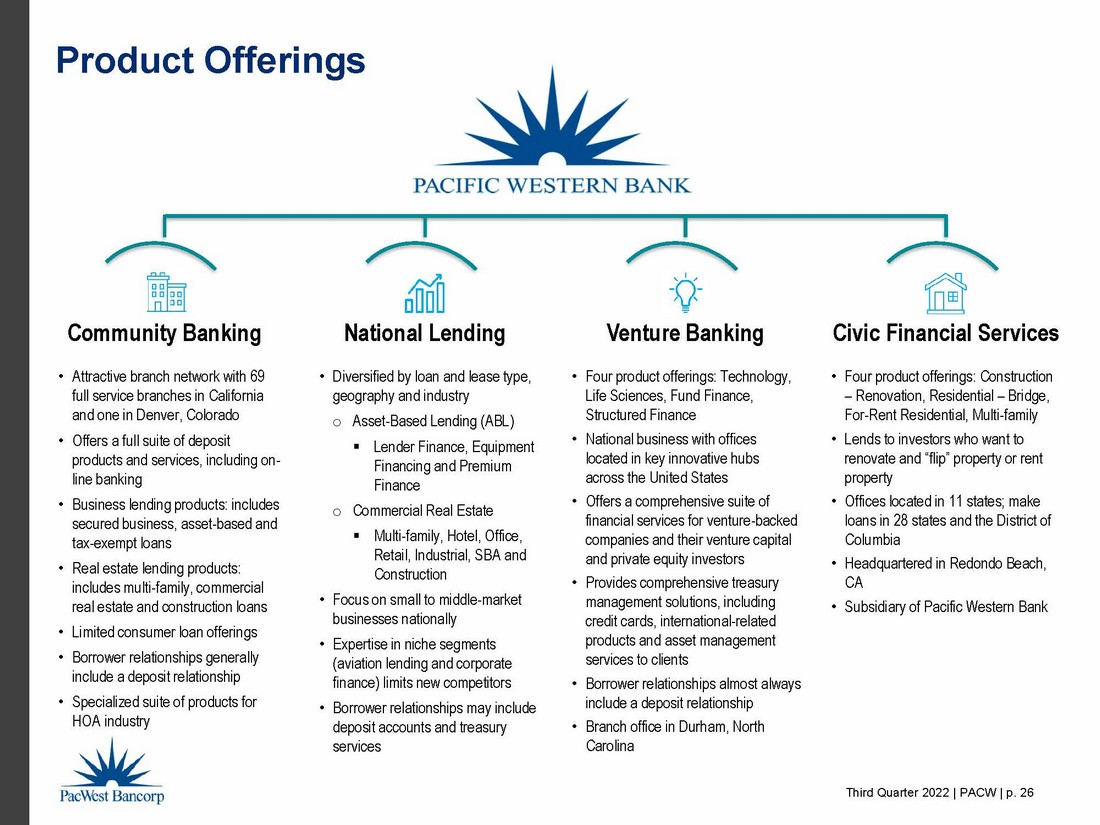
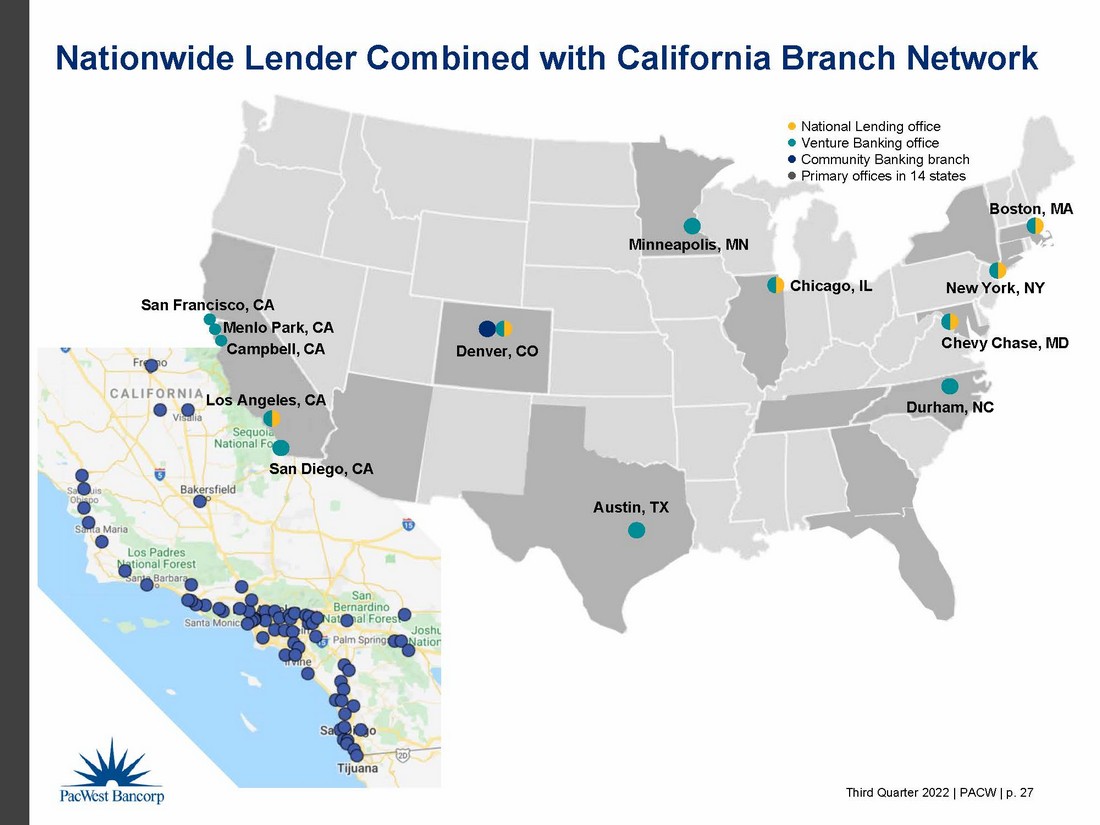
PacWest is a bank holding company with over $41 billion in assets headquartered in Los Angeles, California, with an executive office in Denver, Colorado, with one wholly-owned banking subsidiary, Pacific Western Bank (the “Bank”). The Bank is focused on relationship-based business banking to small, middle-market, and venture-backed businesses nationwide. The Bank offers a broad range of loan and lease and deposit products and services through 69 full-service branches located in California, one branch located in Durham, North Carolina, one branch located in Denver, Colorado, and numerous loan production offices across the country. The Bank provides community banking products including lending and comprehensive deposit and treasury management services to small and medium-sized businesses conducted primarily through our California-based branch offices and Denver, Colorado branch office. The Bank offers national lending products including asset-based, equipment, and real estate loans and treasury management services to established middle-market businesses on a national basis. The Bank provides venture banking products including a comprehensive suite of financial services focused on entrepreneurial and venture-backed businesses and their venture capital and private equity investors, with offices located in key innovation hubs across the United States. The Bank also offers financing of business-purpose, non-owner-occupied investor properties through Civic, a wholly-owned subsidiary. The Bank also provides a specialized suite of services for the HOA industry. For more information about PacWest Bancorp or Pacific Western Bank, visit www.pacwest.com.
FORWARD LOOKING STATEMENTS
This communication contains certain forward-looking information about PacWest that is intended to be covered by the safe harbor for “forward-looking statements” provided by the Private Securities Litigation Reform Act of 1995. Statements that are not historical or current facts, including statements about future financial and operational results, expectations, or intentions are forward-looking statements. Such statements often use words such as “anticipates,” “targets,” “expects,” “estimates,” “intends,” “plans,” “believes,” “continue” and other similar expressions or future or conditional verbs such as “will,” “may,” “might,” “should,” “would” and “could.” Such statements are based on information available at the time of the communication and are based on current beliefs and expectations of PacWest’s management and are subject to significant risks, uncertainties and contingencies, many of which are beyond our control, which may cause actual results, performance, or achievements to differ materially from those expressed in them. The risks and impacts of the COVID-19 pandemic appear to have largely subsided, however, new variants may continue to impact key macro-economic indicators such as unemployment and GDP and may have a material impact on our business, financial position, results of operations, liquidity, and our allowance for credit losses and the related provision for credit losses. Continued deterioration in general business and economic conditions, uncertainty in U.S. fiscal monetary policy, including the interest rate policies of the Federal Reserve Board, and volatility and disruptions in credit and capital markets could adversely affect PacWest’s revenues and the values of its assets, including goodwill, and liabilities, lead to a tightening of credit, and increase stock price volatility. In addition, PacWest’s results could be adversely affected by changes in interest rates, inflation, sustained high unemployment rates, deterioration in the credit quality of its loan portfolio or in the value of the collateral securing those loans, deterioration in the value of its investment securities, and legal and regulatory developments. Actual results may differ materially from those set forth or implied in the forward-looking statements due to a variety of factors, including the risk factors described in documents filed by PacWest with the U.S. Securities and Exchange Commission.
All forward-looking statements in this communication are based on information available at the time the statement is made. We are under no obligation (and expressly disclaim any such obligation) to update or alter our forward-looking statements, whether as a result of new information, future events or otherwise, except as required by law.
Page 12
PACWEST BANCORP AND SUBSIDIARIES
CONDENSED CONSOLIDATED BALANCE SHEET
| September 30, | June 30, | September 30, | ||||||||||
| 2022 | 2022 | 2021 | ||||||||||
| (Dollars in thousands, except per share data) | ||||||||||||
| ASSETS: | ||||||||||||
| Cash and due from banks | $ | 216,436 | $ | 197,027 | $ | 174,585 | ||||||
| Interest-earning deposits in financial institutions | 2,244,272 | 2,192,877 | 3,524,613 | |||||||||
| Total cash and cash equivalents | 2,460,708 | 2,389,904 | 3,699,198 | |||||||||
| Securities available-for-sale, at estimated fair value | 5,891,328 | 6,780,648 | 9,276,926 | |||||||||
| Securities held-to-maturity, at amortized cost, net of allowance for credit losses | 2,264,601 | 2,260,367 | - | |||||||||
| Federal Home Loan Bank stock, at cost | 36,990 | 33,210 | 17,250 | |||||||||
| Total investment securities | 8,192,919 | 9,074,225 | 9,294,176 | |||||||||
| Loans held for sale | 15,534 | - | - | |||||||||
| Gross loans and leases held for investment | 27,775,962 | 26,608,541 | 20,588,255 | |||||||||
| Deferred fees, net | (115,921 | ) | (107,404 | ) | (77,235 | ) | ||||||
| Total loans and leases held for investment, net of deferred fees | 27,660,041 | 26,501,137 | 20,511,020 | |||||||||
| Allowance for loan and lease losses | (189,327 | ) | (188,705 | ) | (203,733 | ) | ||||||
| Total loans and leases held for investment, net | 27,470,714 | 26,312,432 | 20,307,287 | |||||||||
| Equipment leased to others under operating leases | 338,691 | 324,233 | 334,275 | |||||||||
| Premises and equipment, net | 50,781 | 51,083 | 47,246 | |||||||||
| Foreclosed assets, net | 2,967 | - | 13,364 | |||||||||
| Goodwill | 1,405,736 | 1,405,736 | 1,204,118 | |||||||||
| Core deposit and customer relationship intangibles, net | 34,010 | 37,659 | 15,533 | |||||||||
| Other assets | 1,432,532 | 1,355,451 | 970,479 | |||||||||
| Total assets | $ | 41,404,592 | $ | 40,950,723 | $ | 35,885,676 | ||||||
| LIABILITIES: | ||||||||||||
| Noninterest-bearing deposits | $ | 12,775,756 | $ | 13,338,029 | $ | 12,881,806 | ||||||
| Interest-bearing deposits | 21,420,116 | 20,630,123 | 17,677,939 | |||||||||
| Total deposits | 34,195,872 | 33,968,152 | 30,559,745 | |||||||||
| Borrowings | 1,864,815 | 1,592,000 | - | |||||||||
| Subordinated debt | 863,379 | 863,756 | 862,447 | |||||||||
| Accrued interest payable and other liabilities | 604,581 | 548,412 | 545,050 | |||||||||
| Total liabilities | 37,528,647 | 36,972,320 | 31,967,242 | |||||||||
| STOCKHOLDERS' EQUITY (1) | 3,875,945 | 3,978,403 | 3,918,434 | |||||||||
| Total liabilities and stockholders’ equity | $ | 41,404,592 | $ | 40,950,723 | $ | 35,885,676 | ||||||
| Book value per common share | $ | 28.07 | $ | 28.93 | $ | 32.77 | ||||||
| Tangible book value per common share (2) | $ | 16.11 | $ | 16.93 | $ | 22.57 | ||||||
| Common shares outstanding | 120,314,023 | 120,288,024 | 119,579,566 | |||||||||
| (1) Includes net unrealized (loss) gain on: | ||||||||||||
| Securities available-for-sale, net | $ | (637,346 | ) | $ | (428,242 | ) | $ | 98,859 | ||||
| Securities held to maturity | (210,868 | ) | (216,508 | ) | - | |||||||
| Total | $ | (848,214 | ) | $ | (644,750 | ) | $ | 98,859 | ||||
| (2) Non-GAAP measure. | ||||||||||||
Page 13
PACWEST BANCORP AND SUBSIDIARIES
CONDENSED CONSOLIDATED STATEMENT OF EARNINGS
| Three Months Ended | Nine Months Ended | |||||||||||||||||||
| September 30, | June 30, | September 30, | September 30, | |||||||||||||||||
| 2022 | 2022 | 2021 | 2022 | 2021 | ||||||||||||||||
| (In thousands, except per share data) | ||||||||||||||||||||
| Interest income: | ||||||||||||||||||||
| Loans and leases | $ | 346,550 | $ | 293,286 | $ | 246,722 | $ | 907,595 | $ | 732,795 | ||||||||||
| Investment securities | 53,135 | 52,902 | 40,780 | 159,459 | 104,999 | |||||||||||||||
| Deposits in financial institutions | 10,359 | 4,330 | 2,580 | 16,412 | 6,130 | |||||||||||||||
| Total interest income | 410,044 | 350,518 | 290,082 | 1,083,466 | 843,924 | |||||||||||||||
| Interest expense: | ||||||||||||||||||||
| Deposits | 61,288 | 15,362 | 6,417 | 82,858 | 21,186 | |||||||||||||||
| Borrowings | 3,081 | 2,441 | 101 | 5,683 | 559 | |||||||||||||||
| Subordinated debt | 10,494 | 8,790 | 7,722 | 27,102 | 18,760 | |||||||||||||||
| Total interest expense | 74,863 | 26,593 | 14,240 | 115,643 | 40,505 | |||||||||||||||
| Net interest income | 335,181 | 323,925 | 275,842 | 967,823 | 803,419 | |||||||||||||||
| Provision for credit losses | 3,000 | 11,500 | (20,000 | ) | 14,500 | (156,000 | ) | |||||||||||||
| Net interest income after provision for credit losses | 332,181 | 312,425 | 295,842 | 953,323 | 959,419 | |||||||||||||||
| Noninterest income: | ||||||||||||||||||||
| Service charges on deposit accounts | 3,608 | 3,634 | 3,407 | 10,813 | 9,793 | |||||||||||||||
| Other commissions and fees | 10,034 | 10,813 | 11,792 | 32,427 | 31,654 | |||||||||||||||
| Leased equipment income | 12,835 | 12,335 | 10,943 | 38,264 | 33,144 | |||||||||||||||
| Gain on sale of loans and leases | 58 | 12 | - | 130 | 1,561 | |||||||||||||||
| Gain (loss) on sale of securities | 86 | (1,209 | ) | 515 | (1,019 | ) | 616 | |||||||||||||
| Dividends and gains (losses) on equity investments | 3,228 | 4,097 | 8,387 | (4,050 | ) | 24,685 | ||||||||||||||
| Warrant income | 292 | 1,615 | 13,578 | 2,536 | 25,351 | |||||||||||||||
| Other income | 8,478 | 3,049 | 2,723 | 14,682 | 9,741 | |||||||||||||||
| Total noninterest income | 38,619 | 34,346 | 51,345 | 93,783 | 136,545 | |||||||||||||||
| Noninterest expense: | ||||||||||||||||||||
| Compensation | 105,933 | 102,542 | 98,061 | 300,715 | 268,750 | |||||||||||||||
| Occupancy | 15,574 | 15,268 | 14,928 | 46,042 | 43,766 | |||||||||||||||
| Data processing | 9,568 | 9,258 | 7,391 | 28,455 | 22,106 | |||||||||||||||
| Other professional services | 10,674 | 6,726 | 5,164 | 23,354 | 15,546 | |||||||||||||||
| Insurance and assessments | 7,159 | 5,632 | 3,685 | 18,281 | 12,333 | |||||||||||||||
| Intangible asset amortization | 3,649 | 3,649 | 2,890 | 10,947 | 8,858 | |||||||||||||||
| Leased equipment depreciation | 8,908 | 8,934 | 8,603 | 27,031 | 26,186 | |||||||||||||||
| Foreclosed assets (income) expense, net | (248 | ) | (28 | ) | 165 | (3,629 | ) | 47 | ||||||||||||
| Acquisition, integration and reorganization costs | - | - | 200 | - | 3,825 | |||||||||||||||
| Customer related expense | 12,673 | 11,748 | 4,538 | 37,076 | 14,329 | |||||||||||||||
| Loan expense | 6,228 | 7,037 | 4,180 | 18,422 | 11,404 | |||||||||||||||
| Other expense | 15,500 | 12,879 | 9,616 | 39,995 | 34,157 | |||||||||||||||
| Total noninterest expense | 195,618 | 183,645 | 159,421 | 546,689 | 461,307 | |||||||||||||||
| Earnings before income taxes | 175,182 | 163,126 | 187,766 | 500,417 | 634,657 | |||||||||||||||
| Income tax expense | 43,566 | 40,766 | 47,770 | 126,313 | 163,743 | |||||||||||||||
| Net earnings | 131,616 | 122,360 | 139,996 | 374,104 | 470,914 | |||||||||||||||
| Preferred stock dividends | 9,392 | - | - | 9,392 | - | |||||||||||||||
| Net earnings available to common stockholders | $ | 122,224 | $ | 122,360 | $ | 139,996 | $ | 364,712 | $ | 470,914 | ||||||||||
| Basic and diluted earnings per common share | $ | 1.02 | $ | 1.02 | $ | 1.17 | $ | 3.04 | $ | 3.96 | ||||||||||
| Dividends declared and paid per common share | $ | 0.25 | $ | 0.25 | $ | 0.25 | $ | 0.75 | $ | 0.75 | ||||||||||
Page 14
PACWEST BANCORP AND SUBSIDIARIES
NET EARNINGS PER COMMON SHARE
| Three Months Ended | Nine Months Ended | |||||||||||||||||||
| September 30, | June 30, | September 30, | September 30, | |||||||||||||||||
| 2022 | 2022 | 2021 | 2022 | 2021 | ||||||||||||||||
| (Dollars in thousands, except per share data) | ||||||||||||||||||||
| Basic Earnings Per Common Share: | ||||||||||||||||||||
| Net earnings | $ | 131,616 | $ | 122,360 | $ | 139,996 | $ | 374,104 | $ | 470,914 | ||||||||||
| Less: Preferred stock dividends | (9,392 | ) | - | - | (9,392 | ) | - | |||||||||||||
| Net earnings available to common stockholders | 122,224 | 122,360 | 139,996 | 364,712 | 470,914 | |||||||||||||||
| Less: Earnings allocated to unvested restricted stock (1) | (2,331 | ) | (2,351 | ) | (2,417 | ) | (6,721 | ) | (7,930 | ) | ||||||||||
| Net earnings allocated to common shares | $ | 119,893 | $ | 120,009 | $ | 137,579 | $ | 357,991 | $ | 462,984 | ||||||||||
| Weighted average basic shares and unvested restricted stock outstanding | 120,342 | 120,022 | 119,569 | 119,989 | 119,272 | |||||||||||||||
| Less: weighted average unvested restricted stock outstanding | (2,556 | ) | (2,460 | ) | (2,340 | ) | (2,422 | ) | (2,235 | ) | ||||||||||
| Weighted average basic shares outstanding | 117,786 | 117,562 | 117,229 | 117,567 | 117,037 | |||||||||||||||
| Basic earnings per common share | $ | 1.02 | $ | 1.02 | $ | 1.17 | $ | 3.04 | $ | 3.96 | ||||||||||
| Diluted Earnings Per Common Share: | ||||||||||||||||||||
| Net earnings allocated to common shares | $ | 119,893 | $ | 120,009 | $ | 137,579 | $ | 357,991 | $ | 462,984 | ||||||||||
| Weighted average diluted shares outstanding | 117,786 | 117,562 | 117,229 | 117,567 | 117,037 | |||||||||||||||
| Diluted earnings per common share | $ | 1.02 | $ | 1.02 | $ | 1.17 | $ | 3.04 | $ | 3.96 | ||||||||||
| (1) | Represents cash dividends paid to holders of unvested stock, net of forfeitures, plus undistributed earnings amounts available to holders of unvested restricted stock, if any. |
Page 15
PACWEST BANCORP AND SUBSIDIARIES
AVERAGE BALANCE SHEET AND YIELD ANALYSIS
| Three Months Ended | ||||||||||||||||||||||||||||||||||||
| September 30, 2022 | June 30, 2022 | September 30, 2021 | ||||||||||||||||||||||||||||||||||
| Interest | Average | Interest | Average | Interest | Average | |||||||||||||||||||||||||||||||
| Average | Income/ | Yield/ | Average | Income/ | Yield/ | Average | Income/ | Yield/ | ||||||||||||||||||||||||||||
| Balance | Expense | Cost | Balance | Expense | Cost | Balance | Expense | Cost | ||||||||||||||||||||||||||||
| (Dollars in thousands) | ||||||||||||||||||||||||||||||||||||
| Assets: | ||||||||||||||||||||||||||||||||||||
| Loans and leases (1)(2) | $ | 27,038,873 | $ | 348,639 | 5.12 | % | $ | 25,449,773 | $ | 295,154 | 4.65 | % | $ | 19,670,671 | $ | 248,485 | 5.01 | % | ||||||||||||||||||
| Investment securities (3) | 8,803,349 | 54,423 | 2.45 | % | 9,488,653 | 54,910 | 2.32 | % | 8,047,098 | 42,952 | 2.12 | % | ||||||||||||||||||||||||
| Deposits in financial institutions | 1,809,809 | 10,359 | 2.27 | % | 1,984,751 | 4,330 | 0.88 | % | 5,657,768 | 2,580 | 0.18 | % | ||||||||||||||||||||||||
| Total interest-earning assets (1) | 37,652,031 | 413,421 | 4.36 | % | 36,923,177 | 354,394 | 3.85 | % | 33,375,537 | 294,017 | 3.50 | % | ||||||||||||||||||||||||
| Other assets | 3,189,241 | 3,108,714 | 2,496,127 | |||||||||||||||||||||||||||||||||
| Total assets | $ | 40,841,272 | $ | 40,031,891 | $ | 35,871,664 | ||||||||||||||||||||||||||||||
| Liabilities and Stockholders' Equity: | ||||||||||||||||||||||||||||||||||||
| Interest checking | $ | 6,650,477 | 19,475 | 1.16 | % | $ | 6,517,381 | 3,816 | 0.23 | % | $ | 7,372,859 | 2,042 | 0.11 | % | |||||||||||||||||||||
| Money market | 10,914,027 | 31,780 | 1.16 | % | 10,553,942 | 8,448 | 0.32 | % | 8,662,449 | 2,997 | 0.14 | % | ||||||||||||||||||||||||
| Savings | 649,574 | 42 | 0.03 | % | 650,479 | 41 | 0.03 | % | 620,079 | 38 | 0.02 | % | ||||||||||||||||||||||||
| Time | 3,000,187 | 9,991 | 1.32 | % | 1,939,816 | 3,057 | 0.63 | % | 1,475,307 | 1,340 | 0.36 | % | ||||||||||||||||||||||||
| Total interest-bearing deposits | 21,214,265 | 61,288 | 1.15 | % | 19,661,618 | 15,362 | 0.31 | % | 18,130,694 | 6,417 | 0.14 | % | ||||||||||||||||||||||||
| Borrowings | 505,482 | 3,081 | 2.42 | % | 1,356,616 | 2,441 | 0.72 | % | 238,335 | 101 | 0.17 | % | ||||||||||||||||||||||||
| Subordinated debt | 863,719 | 10,494 | 4.82 | % | 863,653 | 8,790 | 4.08 | % | 862,272 | 7,722 | 3.55 | % | ||||||||||||||||||||||||
| Total interest-bearing liabilities | 22,583,466 | 74,863 | 1.32 | % | 21,881,887 | 26,593 | 0.49 | % | 19,231,301 | 14,240 | 0.29 | % | ||||||||||||||||||||||||
| Noninterest-bearing demand deposits | 13,653,177 | 13,987,398 | 12,198,313 | |||||||||||||||||||||||||||||||||
| Other liabilities | 593,450 | 510,238 | 525,429 | |||||||||||||||||||||||||||||||||
| Total liabilities | 36,830,093 | 36,379,523 | 31,955,043 | |||||||||||||||||||||||||||||||||
| Stockholders' equity | 4,011,179 | 3,652,368 | 3,916,621 | |||||||||||||||||||||||||||||||||
| Total liabilities and stockholders' equity | $ | 40,841,272 | $ | 40,031,891 | $ | 35,871,664 | ||||||||||||||||||||||||||||||
| Net interest income (1) | $ | 338,558 | $ | 327,801 | $ | 279,777 | ||||||||||||||||||||||||||||||
| Net interest spread (1) | 3.04 | % | 3.36 | % | 3.21 | % | ||||||||||||||||||||||||||||||
| Net interest margin (1) | 3.57 | % | 3.56 | % | 3.33 | % | ||||||||||||||||||||||||||||||
| Total deposits (4) | $ | 34,867,442 | $ | 61,288 | 0.70 | % | $ | 33,649,016 | $ | 15,362 | 0.18 | % | $ | 30,329,007 | $ | 6,417 | 0.08 | % | ||||||||||||||||||
| (1) | Tax equivalent. |
| (2) | Includes net loan premium amortization of $3.8 million, $5.8 million, and $2.4 million for the three months ended September 30, 2022, June 30, 2022, and September 30, 2021, respectively. |
| (3) | Includes tax-equivalent adjustments of $1.3 million, $2.0 million, and $2.2 million for the three months ended September 30, 2022, June 30, 2022, and September 30, 2021 related to tax-exempt income on investment securities. |
| The federal statutory tax rate utilized was 21%. | |
| (4) | Total deposits is the sum of total interest-bearing deposits and noninterest-bearing demand deposits. The cost of total deposits is calculated as annualized interest expense on total deposits divided by average total deposits. |
Page 16
PACWEST BANCORP AND SUBSIDIARIES
FIVE QUARTER BALANCE SHEET
| September 30, | June 30, | March 31, | December 31, | September 30, | ||||||||||||||||
| 2022 | 2022 | 2022 | 2021 | 2021 | ||||||||||||||||
| (Dollars in thousands, except per share data) | ||||||||||||||||||||
| ASSETS: | ||||||||||||||||||||
| Cash and due from banks | $ | 216,436 | $ | 197,027 | $ | 205,446 | $ | 112,548 | $ | 174,585 | ||||||||||
| Interest-earning deposits in financial institutions | 2,244,272 | 2,192,877 | 1,865,235 | 3,944,686 | 3,524,613 | |||||||||||||||
| Total cash and cash equivalents | 2,460,708 | 2,389,904 | 2,070,681 | 4,057,234 | 3,699,198 | |||||||||||||||
| Securities available-for-sale | 5,891,328 | 6,780,648 | 9,975,109 | 10,694,458 | 9,276,926 | |||||||||||||||
| Securities held-to-maturity | 2,264,601 | 2,260,367 | - | - | - | |||||||||||||||
| Federal Home Loan Bank stock | 36,990 | 33,210 | 17,250 | 17,250 | 17,250 | |||||||||||||||
| Total investment securities | 8,192,919 | 9,074,225 | 9,992,359 | 10,711,708 | 9,294,176 | |||||||||||||||
| Loans held for sale | 15,534 | - | - | - | - | |||||||||||||||
| Gross loans and leases held for investment | 27,775,962 | 26,608,541 | 24,439,749 | 23,026,308 | 20,588,255 | |||||||||||||||
| Deferred fees, net | (115,921 | ) | (107,404 | ) | (87,677 | ) | (84,760 | ) | (77,235 | ) | ||||||||||
| Total loans and leases held for investment, net of deferred fees | 27,660,041 | 26,501,137 | 24,352,072 | 22,941,548 | 20,511,020 | |||||||||||||||
| Allowance for loan and lease losses | (189,327 | ) | (188,705 | ) | (197,398 | ) | (200,564 | ) | (203,733 | ) | ||||||||||
| Total loans and leases held for investment, net | 27,470,714 | 26,312,432 | 24,154,674 | 22,740,984 | 20,307,287 | |||||||||||||||
| Equipment leased to others under operating leases | 338,691 | 324,233 | 325,305 | 339,150 | 334,275 | |||||||||||||||
| Premises and equipment, net | 50,781 | 51,083 | 51,011 | 46,740 | 47,246 | |||||||||||||||
| Foreclosed assets, net | 2,967 | - | 304 | 12,843 | 13,364 | |||||||||||||||
| Goodwill | 1,405,736 | 1,405,736 | 1,405,736 | 1,405,736 | 1,204,118 | |||||||||||||||
| Core deposit and customer relationship intangibles, net | 34,010 | 37,659 | 41,308 | 44,957 | 15,533 | |||||||||||||||
| Other assets | 1,432,532 | 1,355,451 | 1,208,261 | 1,083,992 | 970,479 | |||||||||||||||
| Total assets | $ | 41,404,592 | $ | 40,950,723 | $ | 39,249,639 | $ | 40,443,344 | $ | 35,885,676 | ||||||||||
| LIABILITIES: | ||||||||||||||||||||
| Noninterest-bearing deposits | $ | 12,775,756 | $ | 13,338,029 | $ | 14,057,051 | $ | 14,543,133 | $ | 12,881,806 | ||||||||||
| Interest-bearing deposits | 21,420,116 | 20,630,123 | 19,167,844 | 20,454,624 | 17,677,939 | |||||||||||||||
| Total deposits | 34,195,872 | 33,968,152 | 33,224,895 | 34,997,757 | 30,559,745 | |||||||||||||||
| Borrowings | 1,864,815 | 1,592,000 | 991,000 | - | - | |||||||||||||||
| Subordinated debt | 863,379 | 863,756 | 863,880 | 863,283 | 862,447 | |||||||||||||||
| Accrued interest payable and other liabilities | 604,581 | 548,412 | 519,269 | 582,674 | 545,050 | |||||||||||||||
| Total liabilities | 37,528,647 | 36,972,320 | 35,599,044 | 36,443,714 | 31,967,242 | |||||||||||||||
| STOCKHOLDERS' EQUITY (1) | 3,875,945 | 3,978,403 | 3,650,595 | 3,999,630 | 3,918,434 | |||||||||||||||
| Total liabilities and stockholders’ equity | $ | 41,404,592 | $ | 40,950,723 | $ | 39,249,639 | $ | 40,443,344 | $ | 35,885,676 | ||||||||||
| Book value per common share | $ | 28.07 | $ | 28.93 | $ | 30.52 | $ | 33.45 | $ | 32.77 | ||||||||||
| Tangible book value per common share (2) | $ | 16.11 | $ | 16.93 | $ | 18.42 | $ | 21.31 | $ | 22.57 | ||||||||||
| Common shares outstanding | 120,314,023 | 120,288,024 | 119,601,766 | 119,584,854 | 119,579,566 | |||||||||||||||
| (1) Includes net unrealized (loss) gain on: | ||||||||||||||||||||
| Securities available-for-sale, net | $ | (637,346 | ) | $ | (428,242 | ) | $ | (376,475 | ) | $ | 65,968 | $ | 98,859 | |||||||
| Securities held to maturity | (210,868 | ) | (216,508 | ) | - | - | - | |||||||||||||
| Total | $ | (848,214 | ) | $ | (644,750 | ) | $ | (376,475 | ) | $ | 65,968 | $ | 98,859 | |||||||
| (2) Non-GAAP measure. | ||||||||||||||||||||
Page 17
| PACWEST BANCORP AND SUBSIDIARIES | |||||||||
| FIVE QUARTER STATEMENT OF EARNINGS |
| Three Months Ended | ||||||||||||||||||||
| September 30, | June 30, | March 31, | December 31, | September 30, | ||||||||||||||||
| 2022 | 2022 | 2022 | 2021 | 2021 | ||||||||||||||||
| (In thousands, except per share data) | ||||||||||||||||||||
| Interest income: | ||||||||||||||||||||
| Loans and leases | $ | 346,550 | $ | 293,286 | $ | 267,759 | $ | 263,662 | $ | 246,722 | ||||||||||
| Investment securities | 53,135 | 52,902 | 53,422 | 48,469 | 40,780 | |||||||||||||||
| Deposits in financial institutions | 10,359 | 4,330 | 1,723 | 2,674 | 2,580 | |||||||||||||||
| Total interest income | 410,044 | 350,518 | 322,904 | 314,805 | 290,082 | |||||||||||||||
| Interest expense: | ||||||||||||||||||||
| Deposits | 61,288 | 15,362 | 6,208 | 6,622 | 6,417 | |||||||||||||||
| Borrowings | 3,081 | 2,441 | 161 | 64 | 101 | |||||||||||||||
| Subordinated debt | 10,494 | 8,790 | 7,818 | 7,714 | 7,722 | |||||||||||||||
| Total interest expense | 74,863 | 26,593 | 14,187 | 14,400 | 14,240 | |||||||||||||||
| Net interest income | 335,181 | 323,925 | 308,717 | 300,405 | 275,842 | |||||||||||||||
| Provision for credit losses | 3,000 | 11,500 | - | (6,000 | ) | (20,000 | ) | |||||||||||||
| Net interest income after provision for credit losses | 332,181 | 312,425 | 308,717 | 306,405 | 295,842 | |||||||||||||||
| Noninterest income: | ||||||||||||||||||||
| Service charges on deposit accounts | 3,608 | 3,634 | 3,571 | 3,476 | 3,407 | |||||||||||||||
| Other commissions and fees | 10,034 | 10,813 | 11,580 | 10,633 | 11,792 | |||||||||||||||
| Leased equipment income | 12,835 | 12,335 | 13,094 | 12,602 | 10,943 | |||||||||||||||
| Gain on sale of loans and leases | 58 | 12 | 60 | 172 | - | |||||||||||||||
| Gain (loss) on sale of securities | 86 | (1,209 | ) | 104 | 999 | 515 | ||||||||||||||
| Dividends and gains (losses) on equity investments | 3,228 | 4,097 | (11,375 | ) | (1,570 | ) | 8,387 | |||||||||||||
| Warrant income | 292 | 1,615 | 629 | 23,990 | 13,578 | |||||||||||||||
| Other income | 8,478 | 3,049 | 3,155 | 7,080 | 2,723 | |||||||||||||||
| Total noninterest income | 38,619 | 34,346 | 20,818 | 57,382 | 51,345 | |||||||||||||||
| Noninterest expense: | ||||||||||||||||||||
| Compensation | 105,933 | 102,542 | 92,240 | 99,700 | 98,061 | |||||||||||||||
| Occupancy | 15,574 | 15,268 | 15,200 | 14,656 | 14,928 | |||||||||||||||
| Data processing | 9,568 | 9,258 | 9,629 | 8,171 | 7,391 | |||||||||||||||
| Other professional services | 10,674 | 6,726 | 5,954 | 5,946 | 5,164 | |||||||||||||||
| Insurance and assessments | 7,159 | 5,632 | 5,490 | 5,032 | 3,685 | |||||||||||||||
| Intangible asset amortization | 3,649 | 3,649 | 3,649 | 3,876 | 2,890 | |||||||||||||||
| Leased equipment depreciation | 8,908 | 8,934 | 9,189 | 9,569 | 8,603 | |||||||||||||||
| Foreclosed assets (income) expense, net | (248 | ) | (28 | ) | (3,353 | ) | (260 | ) | 165 | |||||||||||
| Acquisition, integration and reorganization costs | - | - | - | 5,590 | 200 | |||||||||||||||
| Customer related expense | 12,673 | 11,748 | 12,655 | 6,175 | 4,538 | |||||||||||||||
| Loan expense | 6,228 | 7,037 | 5,157 | 5,627 | 4,180 | |||||||||||||||
| Other expense | 15,500 | 12,879 | 11,616 | 12,028 | 9,616 | |||||||||||||||
| Total noninterest expense | 195,618 | 183,645 | 167,426 | 176,110 | 159,421 | |||||||||||||||
| Earnings before income taxes | 175,182 | 163,126 | 162,109 | 187,677 | 187,766 | |||||||||||||||
| Income tax expense | 43,566 | 40,766 | 41,981 | 51,632 | 47,770 | |||||||||||||||
| Net earnings | 131,616 | 122,360 | 120,128 | 136,045 | 139,996 | |||||||||||||||
| Preferred stock dividends | 9,392 | - | - | - | - | |||||||||||||||
| Net earnings available to common stockholders | $ | 122,224 | $ | 122,360 | $ | 120,128 | $ | 136,045 | $ | 139,996 | ||||||||||
| Basic and diluted earnings per common share | $ | 1.02 | $ | 1.02 | $ | 1.01 | $ | 1.14 | $ | 1.17 | ||||||||||
| Dividends declared and paid per common share | $ | 0.25 | $ | 0.25 | $ | 0.25 | $ | 0.25 | $ | 0.25 | ||||||||||
Page 18
| PACWEST BANCORP AND SUBSIDIARIES | |||||||||
| FIVE QUARTER SELECTED FINANCIAL DATA | |||||||||
| At or For the Three Months Ended | ||||||||||||||||||||
| September 30, | June 30, | March 31, | December 31, | September 30, | ||||||||||||||||
| 2022 | 2022 | 2022 | 2021 | 2021 | ||||||||||||||||
| (Dollars in thousands) | ||||||||||||||||||||
| Performance Ratios: | ||||||||||||||||||||
| Return on average assets (1) | 1.28 | % | 1.23 | % | 1.22 | % | 1.34 | % | 1.55 | % | ||||||||||
| Pre-provision, pre-tax net revenue ("PPNR") return | ||||||||||||||||||||
| on average assets (1)(2) | 1.73 | % | 1.75 | % | 1.65 | % | 1.79 | % | 1.86 | % | ||||||||||
| Return on average equity (1) | 13.02 | % | 13.44 | % | 12.66 | % | 13.65 | % | 14.18 | % | ||||||||||
| Return on average tangible common equity (1)(2) | 24.11 | % | 24.42 | % | 20.93 | % | 22.06 | % | 21.03 | % | ||||||||||
| Efficiency ratio | 51.0 | % | 49.5 | % | 50.1 | % | 46.2 | % | 47.2 | % | ||||||||||
| Noninterest expense as a percentage of average assets (1) | 1.90 | % | 1.84 | % | 1.70 | % | 1.73 | % | 1.76 | % | ||||||||||
| Average Yields/Costs (1): | ||||||||||||||||||||
| Yield on: | ||||||||||||||||||||
| Average loans and leases (3) | 5.12 | % | 4.65 | % | 4.66 | % | 4.93 | % | 5.01 | % | ||||||||||
| Average investment securities (3) | 2.45 | % | 2.32 | % | 2.17 | % | 2.02 | % | 2.12 | % | ||||||||||
| Average interest-earning assets (3) | 4.36 | % | 3.85 | % | 3.59 | % | 3.39 | % | 3.50 | % | ||||||||||
| Cost of: | ||||||||||||||||||||
| Average interest-bearing deposits | 1.15 | % | 0.31 | % | 0.13 | % | 0.13 | % | 0.14 | % | ||||||||||
| Average total deposits | 0.70 | % | 0.18 | % | 0.07 | % | 0.08 | % | 0.08 | % | ||||||||||
| Average interest-bearing liabilities | 1.32 | % | 0.49 | % | 0.27 | % | 0.27 | % | 0.29 | % | ||||||||||
| Net interest spread (3) | 3.04 | % | 3.36 | % | 3.32 | % | 3.12 | % | 3.21 | % | ||||||||||
| Net interest margin (3) | 3.57 | % | 3.56 | % | 3.43 | % | 3.24 | % | 3.33 | % | ||||||||||
| Average Balances: | ||||||||||||||||||||
| Assets: | ||||||||||||||||||||
| Loans and leases, net of deferred fees | $ | 27,038,873 | $ | 25,449,773 | $ | 23,433,019 | $ | 21,367,665 | $ | 19,670,671 | ||||||||||
| Investment securities | 8,803,349 | 9,488,653 | 10,397,709 | 9,964,568 | 8,047,098 | |||||||||||||||
| Deposits in financial institutions | 1,809,809 | 1,984,751 | 3,083,159 | 5,961,104 | 5,657,768 | |||||||||||||||
| Interest-earning assets | 37,652,031 | 36,923,177 | 36,913,887 | 37,293,337 | 33,375,537 | |||||||||||||||
| Total assets | 40,841,272 | 40,031,891 | 39,883,304 | 40,358,147 | 35,871,664 | |||||||||||||||
| Liabilities: | ||||||||||||||||||||
| Noninterest-bearing deposits | 13,653,177 | 13,987,398 | 14,463,667 | 14,713,385 | 12,198,313 | |||||||||||||||
| Interest-bearing deposits | 21,214,265 | 19,661,618 | 19,868,395 | 20,050,310 | 18,130,694 | |||||||||||||||
| Total deposits | 34,867,442 | 33,649,016 | 34,332,062 | 34,763,695 | 30,329,007 | |||||||||||||||
| Borrowings | 505,482 | 1,356,616 | 298,444 | 234,391 | 238,335 | |||||||||||||||
| Subordinated debt | 863,719 | 863,653 | 863,572 | 862,777 | 862,272 | |||||||||||||||
| Interest-bearing liabilities | 22,583,466 | 21,881,887 | 21,030,411 | 21,147,478 | 19,231,301 | |||||||||||||||
| Stockholders' equity | 4,011,179 | 3,652,368 | 3,847,481 | 3,954,267 | 3,916,621 | |||||||||||||||
| (1) Annualized. | |||||||||
| (2) Non-GAAP measure. | |||||||||
| (3) Tax equivalent. |
Page 19
| PACWEST BANCORP AND SUBSIDIARIES | ||||||
| FIVE QUARTER SELECTED FINANCIAL DATA | ||||||
| At or For the Three Months Ended | ||||||||||||||||||||
| September 30, | June 30, | March 31, | December 31, | September 30, | ||||||||||||||||
| 2022 | 2022 | 2022 | 2021 | 2021 | ||||||||||||||||
| (Dollars in thousands, except per share data) | ||||||||||||||||||||
| Credit Quality Metrics for Loans and Leases Held for Investment: | ||||||||||||||||||||
| Nonaccrual loans and leases | $ | 89,742 | $ | 78,527 | $ | 66,538 | $ | 61,174 | $ | 64,507 | ||||||||||
| Nonperforming assets | 92,709 | 78,527 | 66,842 | 74,017 | 77,871 | |||||||||||||||
| Special mention loans and leases | 463,994 | 480,261 | 377,315 | 391,611 | 496,366 | |||||||||||||||
| Classified loans and leases | 96,685 | 104,264 | 82,068 | 116,104 | 141,604 | |||||||||||||||
| Allowance for loan and lease losses | 189,327 | 188,705 | 197,398 | 200,564 | 203,733 | |||||||||||||||
| Allowance for credit losses | 284,398 | 283,776 | 272,469 | 273,635 | 279,804 | |||||||||||||||
| For the quarter: | ||||||||||||||||||||
| Provision for credit losses | 3,000 | 10,000 | - | (6,000 | ) | (20,000 | ) | |||||||||||||
| Net charge-offs (recoveries) | 2,378 | (1,307 | ) | 1,166 | 169 | 367 | ||||||||||||||
| Nonaccrual loans and leases to loans and leases | 0.32 | % | 0.30 | % | 0.27 | % | 0.27 | % | 0.31 | % | ||||||||||
| Nonperforming assets to loans and leases and foreclosed assets | 0.34 | % | 0.30 | % | 0.27 | % | 0.32 | % | 0.38 | % | ||||||||||
| Special mention loans and leases to loans and leases | 1.68 | % | 1.81 | % | 1.55 | % | 1.71 | % | 2.42 | % | ||||||||||
| Classified loans and leases to loans and leases | 0.35 | % | 0.39 | % | 0.34 | % | 0.51 | % | 0.69 | % | ||||||||||
| Allowance for loan and lease losses to loans and leases | 0.68 | % | 0.71 | % | 0.81 | % | 0.87 | % | 0.99 | % | ||||||||||
| Allowance for credit losses to loans and leases | 1.03 | % | 1.07 | % | 1.12 | % | 1.19 | % | 1.36 | % | ||||||||||
| Allowance for credit losses to nonaccrual loans and leases | 316.91 | % | 361.37 | % | 409.49 | % | 447.31 | % | 433.76 | % | ||||||||||
| Net charge-offs (recoveries) to average loans and leases | 0.03 | % | (0.02 | )% | 0.02 | % | 0.00 | % | 0.01 | % | ||||||||||
| Trailing 12 months net charge-offs (recoveries) to average loans and leases | 0.01 | % | 0.00 | % | (0.02 | )% | (0.01 | )% | 0.09 | % | ||||||||||
| PacWest Bancorp Consolidated: | ||||||||||||||||||||
| Common equity tier 1 capital ratio (1) | 8.55 | % | 8.24 | % | 8.64 | % | 8.86 | % | 10.15 | % | ||||||||||
| Tier 1 capital ratio (1) | 10.46 | % | 10.15 | % | 9.07 | % | 9.32 | % | 10.65 | % | ||||||||||
| Total capital ratio (1) | 13.43 | % | 13.12 | % | 12.27 | % | 12.69 | % | 14.36 | % | ||||||||||
| Tier 1 leverage capital ratio (1) | 8.63 | % | 8.52 | % | 7.11 | % | 6.84 | % | 8.05 | % | ||||||||||
| Risk-weighted assets (1) | $ | 33,055,996 | $ | 33,009,455 | $ | 30,297,312 | $ | 28,508,808 | $ | 26,057,583 | ||||||||||
| Equity to assets ratio | 9.36 | % | 9.72 | % | 9.30 | % | 9.89 | % | 10.92 | % | ||||||||||
| Tangible common equity ratio (2) | 4.85 | % | 5.15 | % | 5.83 | % | 6.54 | % | 7.79 | % | ||||||||||
| Book value per common share | $ | 28.07 | $ | 28.93 | $ | 30.52 | $ | 33.45 | $ | 32.77 | ||||||||||
| Tangible book value per common share (2) | $ | 16.11 | $ | 16.93 | $ | 18.42 | $ | 21.31 | $ | 22.57 | ||||||||||
| Pacific Western Bank: | ||||||||||||||||||||
| Common equity tier 1 capital ratio (1) | 10.17 | % | 9.78 | % | 9.32 | % | 9.56 | % | 11.12 | % | ||||||||||
| Tier 1 capital ratio (1) | 10.17 | % | 9.78 | % | 9.32 | % | 9.56 | % | 11.12 | % | ||||||||||
| Total capital ratio (1) | 12.16 | % | 11.77 | % | 11.45 | % | 11.80 | % | 13.59 | % | ||||||||||
| Tier 1 leverage capital ratio (1) | 8.39 | % | 8.21 | % | 7.31 | % | 7.00 | % | 8.40 | % | ||||||||||
| (1) Capital information for September 30, 2022 is preliminary. | |||||||||
| (2) Non-GAAP measure. | |||||||||
Page 20
GAAP TO NON-GAAP RECONCILIATIONS
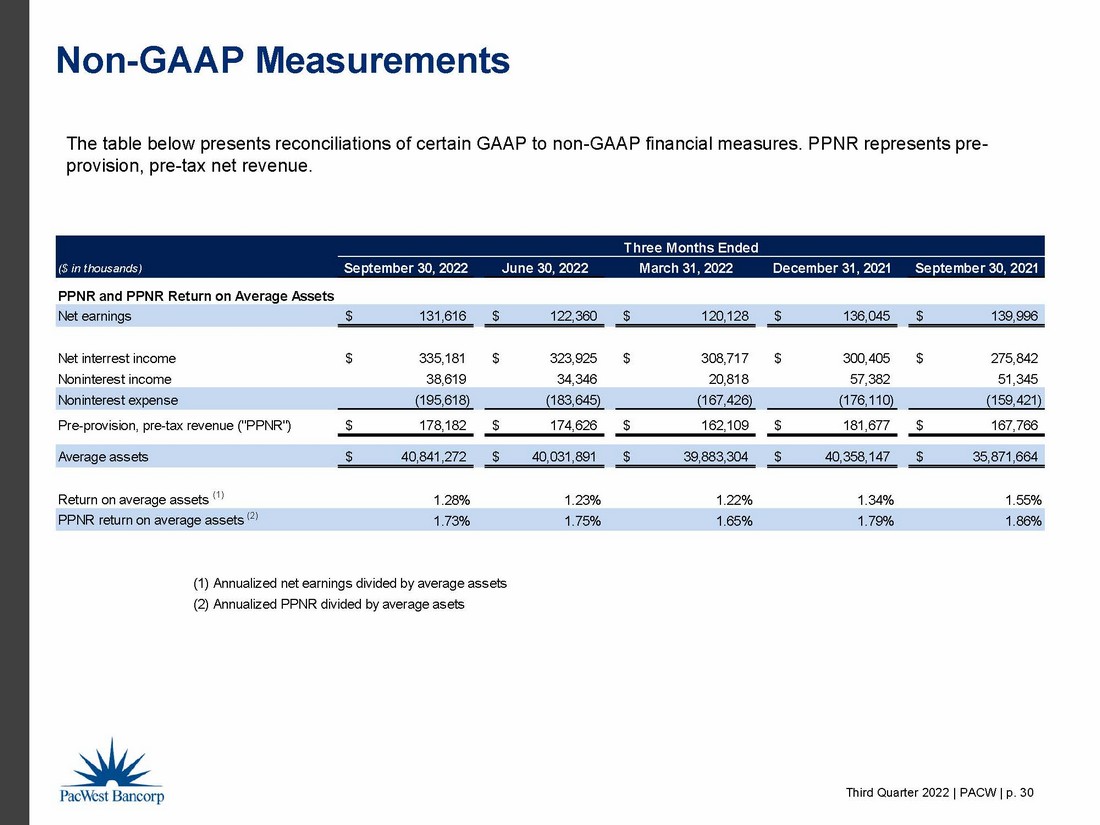
This press release contains certain non-GAAP financial disclosures for: (1) Pre-provision, pre-tax net revenue (“PPNR”), (2) PPNR return on average assets (3) return on average tangible common equity, (4) tangible common equity ratio, and (5) tangible book value per common share. The Company uses these non-GAAP financial measures to provide meaningful supplemental information regarding the Company’s operational performance and to enhance investors’ overall understanding of such financial performance. In particular, the use of PPNR, return on average tangible common equity, tangible common equity ratio, and tangible book value per common share is prevalent among banking regulators, investors, and analysts. Accordingly, we disclose the non-GAAP measures in addition to the related GAAP measures of: (1) net earnings, (2) return on average assets, (3) return on average equity, (4) equity to assets ratio, and (5) book value per common share.
The tables below present the reconciliations of these GAAP financial measures to the related non-GAAP financial measures:
| Three Months Ended | Nine Months Ended | |||||||||||||||||||
| September 30, | June 30, | September 30, | September 30, | |||||||||||||||||
| PPNR and PPNR Return on Average Assets | 2022 | 2022 | 2021 | 2022 | 2021 | |||||||||||||||
| (Dollars in thousands) | ||||||||||||||||||||
| Net earnings | $ | 131,616 | $ | 122,360 | $ | 139,996 | $ | 374,104 | $ | 470,914 | ||||||||||
| Net interest income | $ | 335,181 | $ | 323,925 | $ | 275,842 | $ | 967,823 | $ | 803,419 | ||||||||||
| Noninterest income | 38,619 | 34,346 | 51,345 | 93,783 | 136,545 | |||||||||||||||
| Noninterest expense | (195,618 | ) | (183,645 | ) | (159,421 | ) | (546,689 | ) | (461,307 | ) | ||||||||||
| Pre-provision, pre-tax net revenue ("PPNR") | $ | 178,182 | $ | 174,626 | $ | 167,766 | $ | 514,917 | $ | 478,657 | ||||||||||
| Average assets | $ | 40,841,272 | $ | 40,031,891 | $ | 35,871,664 | $ | 40,255,665 | $ | 33,887,541 | ||||||||||
| Return on average assets (1) | 1.28 | % | 1.23 | % | 1.55 | % | 1.24 | % | 1.86 | % | ||||||||||
| PPNR return on average assets (2) | 1.73 | % | 1.75 | % | 1.86 | % | 1.71 | % | 1.89 | % | ||||||||||
| (1) Annualized net earnings divided by average assets. |
| (2) Annualized PPNR divided by average assets. |
Page 21
| Three Months Ended | Nine Months Ended | |||||||||||||||||||
| September 30, | June 30, | September 30, | September 30, | |||||||||||||||||
| Return on Average Tangible Common Equity | 2022 | 2022 | 2021 | 2022 | 2021 | |||||||||||||||
| (Dollars in thousands) | ||||||||||||||||||||
| Net earnings | $ | 131,616 | $ | 122,360 | $ | 139,996 | $ | 374,104 | $ | 470,914 | ||||||||||
| Less: Preferred stock dividends | (9,392 | ) | - | - | (9,392 | ) | - | |||||||||||||
| Net earnings available to common stockholders | 122,224 | 122,360 | 139,996 | 364,712 | 470,914 | |||||||||||||||
| Add: Intangible asset amortization | 3,649 | 3,649 | 2,890 | 10,947 | 8,858 | |||||||||||||||
| Adjusted net earnings | $ | 125,873 | $ | 126,009 | $ | 142,886 | $ | 375,659 | $ | 479,772 | ||||||||||
| Average stockholders' equity | $ | 4,011,179 | $ | 3,652,368 | $ | 3,916,621 | $ | 3,837,609 | $ | 3,758,733 | ||||||||||
| Less: Average intangible assets | 1,441,689 | 1,445,333 | 1,221,253 | 1,445,332 | 1,212,851 | |||||||||||||||
| Less: Average preferred stock | 498,516 | 137,100 | - | 213,698 | - | |||||||||||||||
| Average tangible common equity | $ | 2,070,974 | $ | 2,069,935 | $ | 2,695,368 | $ | 2,178,579 | $ | 2,545,882 | ||||||||||
| Return on average equity (1) | 13.02 | % | 13.44 | % | 14.18 | % | 13.03 | % | 16.75 | % | ||||||||||
| Return on average tangible common equity (2) | 24.11 | % | 24.42 | % | 21.03 | % | 23.05 | % | 25.20 | % | ||||||||||
| (1) Annualized net earnings divided by average stockholders' equity. | |
| (2) Annualized adjusted net earnings divided by average tangible common equity. |
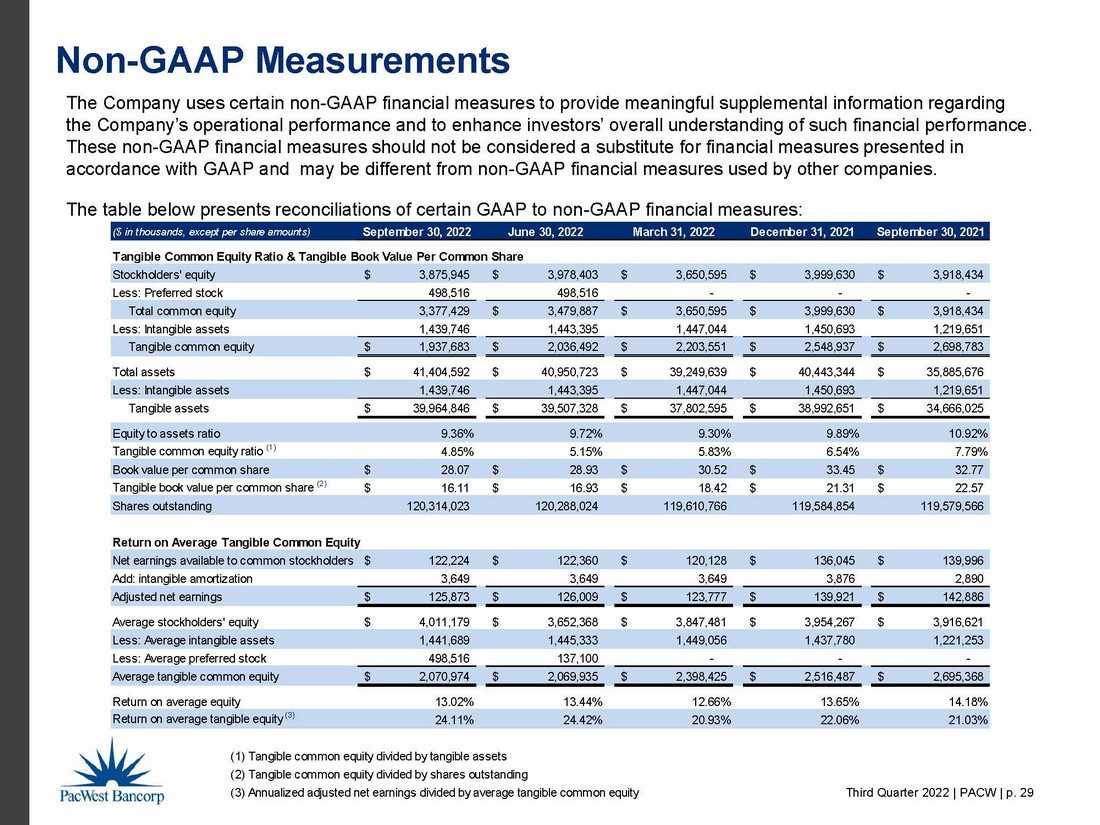
| Tangible Common Equity Ratio/ Tangible Book | September 30, | June 30, | March 31, | December 31, | September 30, | |||||||||||||||
| Value Per Common Share | 2022 | 2022 | 2022 | 2021 | 2021 | |||||||||||||||
| (Dollars in thousands, except per share data) | ||||||||||||||||||||
| Stockholders' equity | $ | 3,875,945 | $ | 3,978,403 | $ | 3,650,595 | $ | 3,999,630 | $ | 3,918,434 | ||||||||||
| Less: Preferred stock | 498,516 | 498,516 | - | - | - | |||||||||||||||
| Total common equity | 3,377,429 | 3,479,887 | 3,650,595 | 3,999,630 | 3,918,434 | |||||||||||||||
| Less: Intangible assets | 1,439,746 | 1,443,395 | 1,447,044 | 1,450,693 | 1,219,651 | |||||||||||||||
| Tangible common equity | $ | 1,937,683 | $ | 2,036,492 | $ | 2,203,551 | $ | 2,548,937 | $ | 2,698,783 | ||||||||||
| Total assets | $ | 41,404,592 | $ | 40,950,723 | $ | 39,249,639 | $ | 40,443,344 | $ | 35,885,676 | ||||||||||
| Less: Intangible assets | 1,439,746 | 1,443,395 | 1,447,044 | 1,450,693 | 1,219,651 | |||||||||||||||
| Tangible assets | $ | 39,964,846 | $ | 39,507,328 | $ | 37,802,595 | $ | 38,992,651 | $ | 34,666,025 | ||||||||||
| Equity to assets ratio | 9.36 | % | 9.72 | % | 9.30 | % | 9.89 | % | 10.92 | % | ||||||||||
| Tangible common equity ratio (1) | 4.85 | % | 5.15 | % | 5.83 | % | 6.54 | % | 7.79 | % | ||||||||||
| Book value per common share (2) | $ | 28.07 | $ | 28.93 | $ | 30.52 | $ | 33.45 | $ | 32.77 | ||||||||||
| Tangible book value per common share (3) | $ | 16.11 | $ | 16.93 | $ | 18.42 | $ | 21.31 | $ | 22.57 | ||||||||||
| Common shares outstanding | 120,314,023 | 120,288,024 | 119,601,766 | 119,584,854 | 119,579,566 | |||||||||||||||
| (1) Tangible common equity divided by tangible assets. | |||||
| (2) Total common equity divided by common shares outstanding. | |||||
| (3) Tangible common equity divided by common shares outstanding. | |||||
CONTACTS
|
Bart R. Olson EVP and CFO 714.989.4149 |
William J. Black EVP Strategy and Corporate Development 919.597.7466 |
Page 22